
“Topography as Epitaph or Epitaph as Topography: Wordsworth’s Excursion”
Upload
khangminh22Category
view
2download
0
INSTITUTO DE OFTALMOBIOLOGÍA APLICADA
TESIS DOCTORAL:
ANTERIOR SEGMENT
TOPOGRAPHY AND ABERRATIONS
FOR CLINICAL APPLICATIONS
Presentada por PABLO PÉREZ MERINO para optar al grado de doctor por la
Universidad de Valladolid
Dirigida por:
SUSANA MARCOS CELESTINO

ii

iii
Impreso 2T
AUTORIZACIÓN DEL DIRECTOR DE TESIS
(Art. 2.1. c de la Normativa para la presentación y defensa de la
Tesis Doctoral en la Uva)
Dña. SUSANA MARCOS CELESTINO con D.N.I. nº 07954600G, Profesora
de Investigación en el Instituto de Óptica “Daza de Valdés” del Consejo
Superior de Investigaciones Científicas (CSIC), [email protected],
como Directora de la Tesis Doctoral titulada “Anterior segment topography
and aberrations for clinical applications”, presentada por D. PABLO PEREZ
MERINO, alumno del programa de CIENCIAS DE LA VISIÓN impartido por el
departamento INSTITUTO UNIVERSITARIO DE OFTALMOBIOLOGÍA
APLICADA, FACULTAD DE MEDICINA, autoriza la presentación de la misma,
considerando que la tesis presenta resultados originales y novedosos
para la comprensión de las aplicaciones clínicas de las patologías del
segmento anterior más frecuentes del ojo, utilizando tecnologías estado-
del-arte (Trazado de Rayos Laser y Tomografía de Coherencia Óptica), con
impacto en la comunidad científica, clínica e industrial, a través de
publicaciones en revistas internacionales de alto impacto y
comunicaciones en congresos nacionales e internacionales.
Valladolid, 16 de septiembre de 2015
El Director de la Tesis,
Fdo.: Susana Marcos Celestino
SRA. PRESIDENTA DE LA COMISIÓN DE DOCTORADO

iv

v
a mis padres, Pablo y Ramoni
a Ana

vi

vii
Table of Contents
ANTERIOR SEGMENT TOPOGRAPHY and
ABERRATIONS for CLINICAL APPLICATIONS
Key words xi
List of commonly used abbreviations and variables xiii
Motivation xv
Chapter I. INTRODUCTION 1.1. The optics of the human eye 1
1.1.1. Historical introduction 1
1.1.2. Cornea 2
1.1.3. Crystalline lens 4
1.1.4. Pupil 6
1.1.5. Axes of the eye 6
1.2. Refractive errors 7
1.3. Optical aberrations 8
1.4. State-of-the art of aberrometers 11
1.5. State-of-the art of quantitative anterior segment imaging techniques 12
1.5.1. Elevation-based corneal topography 12
1.5.2. Optical Coherence Tomography (OCT) 14
1.6. Customized eye modeling: linking geometry and aberrations 18
1.7. Anterior segment conditions and clinical applications studied in this
thesis 20
1.7.1. Cornea (Keratoconus & Intracorneal Ring Segment (ICRS) treatment) 20
1.7.1.1. Keratoconus: topography and pachymetry 21
1.7.1.2. Keratoconus: aberrations 22
1.7.1.3. Keratoconus treatment: Intracorneal Ring Segments (ICRS) 22
1.7.2. Crystalline lens (Accommodation, Presbyopia, Cataract) 25
1.7.2.1. Accommodation 25
1.7.2.2. Presbyopia 27
1.7.2.2.1. Presbyopia solutions 27
1.7.2.3. Cataract (Intraocular lens) 30
1.8. Open questions addressed in this thesis 32
1.9. Goals of this thesis 33
1.10. Hypothesis 34
1.11. Structure of this thesis 34
Chapter II. MATERIAL AND METHODS 37
2.1. Laser Ray Tracing (LRT): ocular aberrations 38
2.1.1. LRT: basic concepts 38
2.1.2. LRT: setup 39

viii
2.1.3. LRT: control and analysis software 41
2.1.4. LRT: calibration 42
2.2. Spectral Domain Optical Coherence Tomography 43
2.2.2. SD-OCT: custom-setup 43
2.2.3. SD-OCT: distortion correction 46
2.2.4. SD-OCT: image processing 48
2.2.5. OCT-based corneal aberrometry 54
2.3. Optical quality metrics 56
2.4. Subjects and protocol in measurements (LRT and OCT) 58
Chapter III. KERATOCONUS AND ICRS (OCT-based Topography
and Aberrometry in keratoconus with Intracorneal Ring Segments) 61
Introduction 63
3.1. Material and methods 64
3.1.1. Patients 64
3.1.1.1. OCT-based Corneal Topography in keratoconus and ICRS 64
3.1.1.2. OCT-based Corneal Aberrometry in keratoconus and ICRS 65
3.1.2. Custom SD-OCT system 66
3.1.3. OCT image processing: corneal surface analysis & ICRS segmentation 67
3.1.4. OCT image processing: corneal aberration analysis 68
3.1.5. LRT: total aberration analysis 68
3.1.6. Optical quality metrics 69
3.1.7. Visual acuity measurements 69
3.1.8. Statistical analysis 69
3.2. Results 70
3.2.1. OCT-based corneal topography and geometry in keratoconus and ICRS 70
3.2.1.1. Longitudinal changes of anterior corneal geometry and topography 70
3.2.1.2. Longitudinal changes of poserior corneal geometry and topography 73
3.2.1.3. Longitudinal variation of corneal power 75
3.2.1.4. Corneal thickness: pre- and post-ICRS implantation 75
3.2.1.5. 3-D ICRS location 76
3.2.1.6. Correlation between surgical parameters and corneal geometry 78
3.2.2. OCT-based corneal aberrometry in keratoconus and ICRS 78
3.2.2.1. LRT vs OCT aberrometry 78
3.2.2.2. Pre- and post-ICRS aberrations 82
3.2.2.3. Visual acuity vs optical quality 84
3.2.2.4. Posterior corneal surface contribution 84
3.2.3. OCT-based aberrometry vs OCT-based geometry 85
3.3. Discussion 86
Chapter IV. ACCOMMODATION (OCT-based Crystalline Lens
Topography in Accommodating Eyes) 91
Introduction 93
4.1. Material and methods 93
4.1.1. Subjects 93
4.1.2. OCT system 94

ix
4.1.3. OCT: Experimental Procedure 94
4.1.4. OCT: Image Processing 95
4.1.5. OCT: Spatial resolution and Accuracy Considerations 96
4.1.6. Biometric, geometric and surface changes with accommodation 97
4.1.7. Accommodative response 98
4.1.8. Corneal and lens surface astigmatism axis 98
4.1.9. Statistics 98
4.2. Results 99
4.2.1. Anterior and posterior lens surface elevation (relaxed state) 99
4.2.2. Comparison of Zernike coefficients of ocular surfaces 100
4.2.3. Phenylephrine vs natural anterior lens surface topography 102
4.2.4. Changes in anterior segment biometry with accommodation 102
4.2.5. Changes in lens surface elevation with accommodation 103
4.2.6. Corneal and lens surface astigmatism with accommodation 105
4.3. Discussion 107
Chapter V. PRESBYOPIA-CATARACT AND IOL (Aberrometry and
OCT-based Geometrical Evaluation of Patients Implanted with
Accommodative IOLs) 111
Introduction 113
5.1. Material and methods 114
5.1.1. Patients, surgery and A-IOLs 114
5.1.2. Control groups: young and monofocal IOL 114
5.1.3. OCT: measurements 115
5.1.4. OCT: data analysis 116
5.1.5. LRT: measurements 117
5.1.6. LRT: data analysis 117
5.1.7. Statistical analysis 118
5.2. Results 119
5.2.1. Anterior chamber depth (ACD) 119
5.2.2. Changes in ACD with accommodative effort 120
5.2.3. Lens thickness 121
5.2.4. IOL tilt 122
5.2.5. Capsulorhexis and haptic axis 123
5.2.6. Individual aberrations: unaccommodative state 124
5.2.7. Individual aberrations: changes with accommodative stimulus 125
5.2.8. Wave aberrations with phenylephrine and natural viewing conditions 128
5.2.9. Change in accommodative response with accommodative demand 129
5.2.10. Depth-of-focus 130
5.3. Discussion 132
Chapter VI. CATARACT AND IOL (Chromatic aberration with
IOLs) 137
Introduction 139
6.1. Material and methods 140
6.1.1. Patients, surgery and IOLs 140

x
6.1.2. LRT: total aberration analysis 141
6.1.3. Data analysis 141
6.2. Results 142
6.2.1. Monochromatic aberrations 142
6.2.2. Chromatic difference of focus 144
6.2.3. Effect of chromatic difference of focus on retinal image quality 145
6.3. Discussion 147
Epilogue: CONCLUSIONS AND FUTURE WORK 149
Achievements 149
Conclusions 150
Clinical impact 151
Future work 151
RESÚMENES EN ESPAÑOL 153
List of PUBLICATIONS 165
Publications included in this thesis 165
Other publications 165
International congress contributions 166
Invited talks 169
Other information that might be relevant 170
Honors 170
BIBLIOGRAPHY 173
ACKNOWLEDGEMENTS 193

xi
Key words

xii

xiii
List of commonly used abbreviations and variables
Abbreviatons
Imaging Techniques
OCT = Optical Coherence Tomography
TD-OCT = Time-Domain OCT
SD-OCT = Spectral-Domain OCT
SS-OCT = Swept-Source OCT
LRT = Laser Ray Tracing
H-S = Hartmann-Shack
UBM = Ultrasound biomicroscopy
MRI = Magnetic Resonance Imaging
PCI = Partial Coherence Interferometry
Optical Terms
IR = Infrared
CCD = Charge Couple Device
LED = Light Emitting Diode
SLD = Superluminiscent Diode
DLP = Digital-Light-Processing
NA = Numerical Aperture
BS = Beam Splitter
FC = Fiber Coupler
OI = Optical Isolator
PC = Polarization Controller
M = Mirror
L = Lens
NDF = Neutral Density Filter
SNR = Signal-to-Noise Ratio
HOAs = High-Order Aberrations
LCA = Longitudinal Chromatic
Aberration
TCA = Transverse Chromatic Aberration
GRIN = Gradient Index
DoF = Depth-of-Focus
General
2-D = Two-dimensions
3-D = Three-dimensions
i.e. = id est, this is
e.g. = exempli gratia, for example
vs = versus, compared to
VA = Visual Acuity
BCVA = Best-Corrected VA
D = Diopters
N = Nasal
T = Temporal
S = Superior
I = Inferior
H = Horizontal
V = Vertical
OFZ = Organelle-Free Zone (crystalline
lens)
AL = Axial Length
ACD = Anterior Chamber Depth
LT = Lens Thickness
Clinical treatments
IOL = Intraocular Lens
A-IOL = Accommodating-IOL
ICRS = Intracorneal ring segment
CL = Contact Lens
PPMA = Polymethyl-methacrilate
Wavefront Analysis
FFT = Fast Fourier Transform
FWHM = full-width-half-minimum
RMS = Root Mean Square
PSF = Point Spread Function
SR = Strehl Ratio
MTF = Modulation Transfer Function
CSF = Contrast Sensitivity Function
OTF = Optical Transfer Function
VSOTF = Visual Strehl OTF

xiv
Variables
Coefficients and indices
n, m, j, … = index names
N, M = maximum index/number
General Optical Variables
λ = Wavelength
κ = Wavenumber (propagation constant)
ω = angular frequency
υ = frequency
R, r = Radius
C = Curvature (=1/R)
K = Conic constant
p = p-value, asphericity
Q = Q-value, asphericity
W(x,y) = Wave aberration in Cartesian
coordinates
𝑍𝑛𝑚 = Zernike polynomial in Cartesian
coordinates
𝑐𝑛𝑚 = Zernike coefficient (order, n;
frequency, m).
φ = phase (wavefront aberration)
A = Amplitude
I = Intensity
E = Electric field
d = Thickness of optical medium
f = Focal length
n = refractive index
DoF = Depth-of-focus
Units
s = seconds
mm = milimeters
µm = microns
nm = nanometers
deg = degrees
Coordinates
o = origin
X, Y, Z = Cartesian coordinates
ρ, θ = Polar coordinates

xv
Motivation
The eye is one of the most elegantly built organs of the human body playing a triple role in
gathering information of the external world, coding it and relying to the brain. It has a
relatively simple optical design with incredible functionality; only two lenses (cornea and
crystalline lens) set the physical rules for image-forming onto the retina. However, the eye is
far from a perfect optical system since imperfections in the cornea and in the crystalline lens
shape induce focusing errors and image degradation, known as optical aberrations.
State-of-the-art aberrometry provided a detailed analysis of the optical aberrations of the
whole eye in normal subjects and in certain ocular conditions such as accommodation, aging,
corneal degeneration and cataract surgery. Whereas different aberrometers allow measuring
the optics of the eye, the relative contribution of the corneal and crystalline lens surfaces
themselves to the optical quality of the eye is still poorly understood.
The aberrations of the cornea can be estimated from three-dimensional (3-D) measurements
of the corneal shape. However, due to limitations of the commercial available anterior
segment techniques (i.e., low resolution, high acquisition time, limited depth range and
inherent distortion of the imaging systems), knowledge of in vivo geometrical parameters of
the crystalline lens is only limited to 2-D measurements or axial distances. Hence, optical
coherence tomography (OCT) presents several advantages over other imaging techniques
(higher speed, resolution and depth range) for a 3-D accurate measurement of the anterior
segment geometry.
Understanding the link between optical aberrations and anterior segment geometry is key for
comprehending how the eye works and for modeling the optics of an individual eye. The eye
has many innate adaptations that minimize optical aberrations. In most normal young eyes,
the magnitude of aberrations of the cornea is larger than for the whole eye, indicating a
significant role of the crystalline lens in compensating corneal aberrations. But, due to
geometrical and structural changes this ocular compensation gets disturbed in different
anterior segment conditions, such as keratoconus, presbyopia and cataract. While
keratoconus degrades the corneal shape progressively and consequently vision in the
adolescence; presbyopia and cataract are conditions related to aging that affect the crystalline
lens and degrade vision.
With the advance in imaging techniques and new designs and materials, different solutions
appeared for improving the visual quality, proposing intracorneal ring segments (ICRS) in
keratoconus and accommodative intraocular lens (A-IOL) in presbyopia and cataract.
However, although these approaches are currently used in the clinical practice, the
mechanism of action and the benefit of these solutions are not yet fully understood. Thus, the
development of customized solutions and eye models using individual geometrical data, the
final 3-D location of the proposed solution (ICRS and IOL) and encompassing individual
ocular aberrations address a currently unmet need.

xvi
In this thesis we analyzed the geometrical properties of the anterior segment of the eye and
its link to the optical quality of the whole eye in different clinical situations. We use novel
and validated methodology, the laser ray tracing technique (LRT), for measuring the optical
quality of the whole eye, and the distortion-corrected OCT, for analyzing accurately and
three-dimensionally the geometrical properties of the anterior segment of the eye in different
clinical applications. We studied longitudinally the geometrical and optical properties of
keratoconus before and after ICRS surgery, and we quantified in 3-D the changes in ICRS
position inside the cornea with time and the effect of ICRS on the geometry and optics of the
cornea. Also, we evaluated in vivo the topographical changes of the crystalline lens surface
with accommodation. We analyzed the 3-D location and the optical impact of
accommodative IOLs after cataract surgery. And, finally, we analyzed in vivo the
longitudinal chromatic aberration in pseudophakic patients.

Chapter I. INTRODUCTION
1
Chapter I. INTRODUCTION
In this introductory chapter we present a description of the optics of the eye, with special
focus on the cornea and the crystalline lens. The refractive errors and ocular aberrations will
be pointed out; and an overview of quantitative anterior segment imaging systems and the
ocular aberrometry techniques will be described. We introduce some common pathologies
and conditions in the anterior segment of the eye and their treatment. We also present the
open questions, the goals and the hypothesis addressed in this thesis.
1.1. The optics of the human eye
“to be sought in the structure and functioning of the eye itself…”
J. Kepler. “Ad Vitellionem paralipomena”, 1604[Kepler, 1604]
Human vision is a complex process that involves numerous components of the eye and the
human brain. Briefly, in the eye, light from the visible spectrum is directed and refracted by
two optical and transparent elements, the cornea and the crystalline lens, which project the
images of the outside world on the retina. In the retina, cones and rods samples the light
distribution, and then the light is absorbed and converted into chemical and electrical signals
(visual signals) by the retinal layers. These visual signals are transmitted by the optic nerve
into the visual cortex for further processing and final perception of the visual information.
1.1.1. Historical introduction
From ancient time, Assyrian, Greek and Roman philosophers and physicists have tried to
explain the visual process. Aristotle was the first who tried to explain the optical defects of
vision questioning with his coetaneous why vision differs among individuals. In the 11th
century, Alhazen [Ibn al-Haytham, 1028-1038] adopted Aristotle´s theory of visual optics,
Ptolemy´s theory of optics and Galen´s ideas on visual anatomy and conducted several
experiments involving a dark room with a hole in it, proposing finally how the eye works by
comparing the eye to a “dark chamber”. Alhazen established the stage for subsequent
developments in physiological optics for future generations. However, before the 17th
century the mechanism of vision remained largerly unexplained, with first modern theories
appearing at Galileo´s time with the development of his telescope. In 1604, Johannes Kepler
[Kepler, 1604] proposed a full ray tracing model of the eye and described the use of spherical
lenses to correct myopic and hyperopic refractive errors. In 1619, Christoph Scheiner
experimentally verified Kepler´s theory and was the first to investigate the accommodation
eye at different distances. And, in 1623, Benito Daza de Valdés described a measuring unit
for grading lenses in his book (Uso de los anteojos); the unit was based on a Spanish
medieval linear unit (the vara), the vara (836 mm, in the metric scale) was equal to 1.1967
diopters. Daza de Valdés described precise measurements and prescriptions for myopia,
hyperopia and, also, presbyopia, being pioneer in quantifying the needed correction of
refractive errors. In the centuries that followed, different major scientists developed the
understanding in physiological optics. Thomas Young studied astigmatism, aberrations and
was the first to recognize loss of accommodation with age in his treatise “On the mechanism
of the eye”.

INTRODUCTION
2
Figure 1.1. Left: The eye in Opticae thesaurus Alhazeni Arabis (1572); Wellcome
Library, London. Right: Schema of the human eye adapted from an image of the
National Eye Institute Catalog (number NEA09).
1.1.2. Cornea
The majority of the refracting power of the eye is provided by the cornea, the transparent and
curved “window” at the front of the eye [Beems & Van Best, 1990; Benedek, 1971; Hart &
Farrell, 1968; Jakus, 1962; Jester, 2008; Maurice, 1957]. It fulfills a dual role, acting as both
the primary refractive element and as a physical barrier to maintain ocular integrity; the
cornea is a viscoelastic tissue that responds to the presence of external and internal forces
[Dupps Jr & Wilson, 2006; Elsheikh et al., 2008; Kling et al., 2009; Meek & Knupp, 2015;
Meek & Newton, 1999; Roberts, 2000].
Histologically, the cornea is an inhomogeneus cellular and fibrillar structure composed of
five layers: epithelium, Bowman´s layer, stroma, Descemet´s membrane and endothelium.
The cornea mainly contains water (78%), regularly arranged collagen fibrils, proteoglycans
and keratocytes. Each corneal layer has its own refractive index, but since the stroma is by
far the thickest layer, its refractive index dominates (1.376).
The epithelium protects the rest of the cornea providing a barrier against water, larger
molecules and toxic substances. It consists approximately of six layers of cells, and only the
innermost layer of these cells is able to show cell division. Once the cells are formed, they
move gradually towards the surface as the superficial cells are shed. Bowman´s layer is 8-14
µm thick, and consist mainly of randomly arranged collagen fibrils. The bulk of the cornea is
formed by the stroma, which in the human adult is approximately 450-550 µm thick
centrally (approximately 90% of corneal thickness) and consists predominantly of flattened
and stacked collagenous lamellae (200-250 layers). The stroma is considerably thicker in the
periphery (550-750 µm). This arrangement maintains an ordered transparent structure while
also enhances mechanical strength. Descemet´s membrane is the basement of the endothelial
cells. The endothelium consists of a single layer of cells, which are hexagonal and fit
together like a honeycomb. The endothelium regulates the fluid balance of the cornea in

Chapter I. INTRODUCTION
3
order to maintain the stroma hydration (at about 78%) and thus retain transparency [Atchison
& Smith, 2000; Knupp et al., 2009; Maurice, 1957; Meek & Knupp, 2015; Morishige et al.,
2007].
Stromal collagen assembles to form long fibrils that in the human cornea show a uniform
diameter of approximately 31-34 nm, and are separated by 20-50 nm. Collagen fibers are
approximately 1-2 µm thick, 10-200 µm wide and are thought to traverse the entire cornea
from limbus to limbus [Polack, 1961]. The fibrils within a layer run parallel to each other,
they are inclined at large angles to fibrils in adjacent lamellae and are uniform in size and
spacing. Collagen fibrils are generally organized into independent bundles or fibers,
lamellae. The regular arrangement of collagen fibrils in each stromal lamellae is the main
responsible for the transparency of the cornea and the alternating orientation provides its
shape and mechanical stability [Boote et al., 2005; Jester, 2008; Knupp et al., 2009; Meek &
Knupp, 2015; Morishige et al., 2011].
Due to the corneal shape and the difference of refractive index between the cornea (1.37) and
the air (1.0), the cornea contributes about two-thirds of the refractive power for the relaxed
eye, approximately 42 D, with anterior and posterior paraxial powers of about +48 D and -6
D, respectively. The adult human cornea is smaller in the vertical diameter (9-11 mm) than in
the horizontal diameter (11-12 mm). Both anterior and posterior corneal surfaces have a
regular and stable shape in normal population, presenting convex and aspheric surfaces
(flattening away from the corneal apex) [Atchison & Smith, 2000]. Corneal shape varies with
age and across individuals [Allison & Brennan, 1997; Dubbelman & Heijde, 2001; Guirao &
Artal, 1999a; Navarro et al., 2013].
Because of its accessibility, the anterior corneal surface has been widely studied. In a normal
population, the central radius (3-mm optical zone) is around 7.5 and 8.0 mm. Although the
posterior corneal surface is less accessible and represents a lower contribution to the ocular
optics (due to a smaller difference between corneal and aqueous humor), its contribution is
not negligible, as has been shown to compensate part of the irregularities of the anterior
cornea, in particular astigmatism (31% [Dubbelman et al., 2006b]), spherical aberration
(from 10% compensation to 26% addition [Sicam et al., 2006]) and vertical coma (from 3%
[Dubbelman et al., 2007b] to 20% [Barbero et al., 2002b] compensation). The posterior
corneal surface overall has a shorter radius of curvature, with a central radius between 5.9
and 6.7 mm. Neither the anterior nor the posterior surfaces are perfectly spherical due to the
presence of asphericity and toricity (since the corneal surfaces usually presents different
radius at vertical and horizontal meridians which produces astigmatism). Generally, in young
eyes, the vertical meridian is steeper than the horizontal meridian, although this tendency
reverses with age [Allison & Brennan, 1997; Baldwin & Mills, 1981; Dubbelman & Heijde,
2001; Lyle, 1971; Navarro et al., 2013].
It is commonly accepted that we can consider the equation of a conicoid for representing the
corneal shape [Perez-Escudero et al., 2010]. The equation 1 provides the analytical
expression of a conicoid, where ρ are the polar coordinates (ρ = X2+Y
2), z is the axial
coordinate, R is the radius of the surface and Q is the conic constant (Q<-1 hyperboloid, Q=-
1 paraboloid, -1<Q<0 ellipsoid (Z axis is the major axis), Q=0 sphere, Q>0 ellipsoid (X-Y
plane is the major axis).

INTRODUCTION
4
Equation 1.1: 𝜌 − 2𝑧𝑅 + (1 + 𝑄)𝑧2 = 0
The average anterior corneal radius R and asphericity Q are 7.7 mm and -0.25 in a normal
population, respectively, this shape corresponds to a prolate ellipsoid, i.e., the cornea flattens
towards the periphery. The average posterior corneal radius R and asphericity Q are 6.4 mm
and 0.3 in a normal population, respectively.
Corneal thickness has been widely studied, in the central cornea thickness is on average
523±39 µm, and it thickens towards the periphery (660±76 µm) [Atchison & Smith, 2000].
1.1.3. Crystalline lens
The crystalline lens is the responsible for the remaining refraction of the eye, i.e.
approximately one-third of the refractive power (on average, 14 D), and it has the capability
in young subjects of focusing objects at different distances, a mechanism known as
accommodation [Charman, 2009; Glasser & Campbell, 1998b].
Histologically, the crystalline lens is composed by the lens capsule, the lens epithelium and
the lens fibers. The lens consists largely of lens fiber cells forming the nucleus and cortex.
The crystalline lens is covered by an external capsule, located between the iris and the
vitreous humor and attached to the cilliary processes by thin filamentous zonules. The
crystalline lens is transparent due to its avascularity, lack of organelles, regular organization
of the cells, fibers and proteins and its narrow inter-fiber spaces [Atchison & Smith, 2000;
Bassnett et al., 2011; Beebe, 2003; Benedek, 1971; Mathias et al., 1997; Trokel, 1962].
The lens capsule is a multicellular organ surrounded by a basal lamina with an anterior layer
of cuboidal epithelium covering concentric layers of fibers. The lens capsule consists mostly
of a well-organized matrix of collagen IV, enactin and laminin. The capsule is produced
continuously during life by the lens epithelium, which growths in a lamellar fashion along
the lens. The anterior lens capsule is thicker than the posterior one. It is elastic in nature and
prevents high molecular-weight substances from entering the lens [Beebe, 2003].
The lens epithelium is a single layer of cuboidal cells located between the lens fibers and the
lens capsule on the anterior half of the lens. The epithelial cells contain different organelles
for both aerobic and anaerobic metabolic activity. At the cellular level, there is limited light-
scattering because of the organized distribution of the cellular organelles, which are
relatively sparse in the central epithelium.
At the equator, away from the light path, epithelial cells undergo mitotic division and
differentiate into lens fibers [Beebe, 2003]. Newly laid fibers crowd and compact previous
fibers, thus the oldest are the most central (nucleus) and are the outermost fibers the most
recently formed fibers (constituting the lens cortex) [Beebe, 2003; Wride, 2011]. High
concentrations of crystallin proteins in the lens fibres contribute to lens transparency
[Michael & Bron, 2011].
The crystalline lens has a higher refractive index than its surroundings, resulting from the
high concentration of α- β- and δ-crystallins in the lens fiber cytoplasm. The crystalline lens

Chapter I. INTRODUCTION
5
shows a gradient-index (GRIN) distribution. The nucleus of the lens shows the highest
refractive index, whereas the more peripheral fibers from the cortex present the smallest
refractive index in the lens [Atchison & Smith, 1995; de Castro et al., 2011; Goncharov &
Dainty, 2007; Siedlecki et al., 2012; Von Helmholtz, 1909]. Furthermore, the distinctive
concentration of different proteins produces changes in the refractive index across layers
[Beebe, 2003]. Recently, de Castro et al. [de Castro et al., 2010] reported index variation in
the nucleus with values ranging from 1.434 to 1.413 and in the lens cortex with values
ranging from 1.386 to 1.376, showing a monotonic decrease in young crystalline lens and a
plateau-like functioning in older crystalline lens. To date, most GRIN measurements (and all
through optical measurements) have been performed ex vivo [Birkenfeld et al., 2013; de
Castro et al., 2011; Jones et al., 2007], so for in vivo crystalline lens studies an equivalent
refractive index (Uhlhorn´s formulae) is commonly used [Uhlhorn et al., 2008].
Due to its inaccessibility, the in vivo geometrical parameters of the crystalline lens are
limited in the literature. Rosales et al. [Rosales et al., 2006; Rosales & Marcos, 2009] using
distortion-corrected Scheimpflug camera reported averaged values of the crystalline lens
radius for the anterior surface (11.1±1.1 mm) and for the posterior surface (6.1±0.5 mm).
Dubbelman et al. (Dubbelman & Heijde, 2001) described age-related expressions for the
anterior and posterior crystalline lens surfaces respectively (R=12.9-0.057*age, anterior;
R=6.2-0.012*age, posterior), and reported an average conic constant value of -4 and -3 for
the anterior and posterior lens, respectively. Average lens thickness values range between
3.06 mm to 4.19 mm at 30 years old of age with a mean increase of 24 µm/year [Dubbelman
& Heijde, 2001]. Recently, Ortiz et al. [Ortiz et al., 2012b] quantified the crystalline lens
geometrical properties with distortion-corrected Optical Coherence Tomography (OCT) and
reported the first in vivo report of 3-D surface elevation maps of the anterior and posterior
lens surfaces. Ortiz et al. [Ortiz et al., 2012b] described a perpendicular orientation of the
astigmatism vs the posterior lens surface in young subjects.
Figure 1.2. 3-D in vivo anterior segment volume and the corresponding crystalline
lens elevation maps (OCT-distorsion corrected, [Ortiz et al., 2012b]).
INTRODUCTION
6
Internal astigmatism may be produced by the toricity of the crystalline lens surfaces [Dunne
et al., 1996; Keller et al., 1996] or by a tilt of the lens [Rosales & Marcos, 2006]. Aberration
analysis between different ocular elements has shown compensation in corneal astigmatism
and high-order aberrations by the crystalline lens and a disruption in this balance as we age
[Artal & Guirao, 1998; Artal et al., 2001b; Kelly et al., 2004a; Marcos et al., 2008; Mclellan
et al., 2001; Tabernero et al., 2007]. Javal postulated a relationship between corneal and
refractive astigmatism and proposed a compensation of -0.5 D of against-the-rule
astigmatism by the internal optics. Elawad, in his PhD thesis [Elawad, 1995], and Dunne et
al. [Dunne et al., 1996] measured the contribution of the different ocular components to
residual astigmatism in human eyes, and found that whilst the astigmatic contributions of the
posterior corneal and posterior lens surfaces were found to be predominantly inverse (with
the steeper meridian in the horizontal axis), direct astigmatism came from the anterior lens
surface, although they recognized that the techniques used in their studies were subject to
cumulative errors. Artal et al. [Artal et al., 2001a] and Kelly et al. [Kelly et al., 2004a] found
significant negative correlation for corneal horizontal/vertical astigmatism, lateral coma and
spherical aberration and the internal optics, indicating a fine-tuned compensation process
between the cornea and the lens in the young unaccommodated state. The GRIN has been
shown experimentally to play a major role in the negative sign of the spherical aberration of
the young crystalline lens [Birkenfeld et al., 2014; de Castro et al., 2013; Smith & Atchison,
2001].
Accommodation, presbyopia and cataract will be treated in section 1.8.
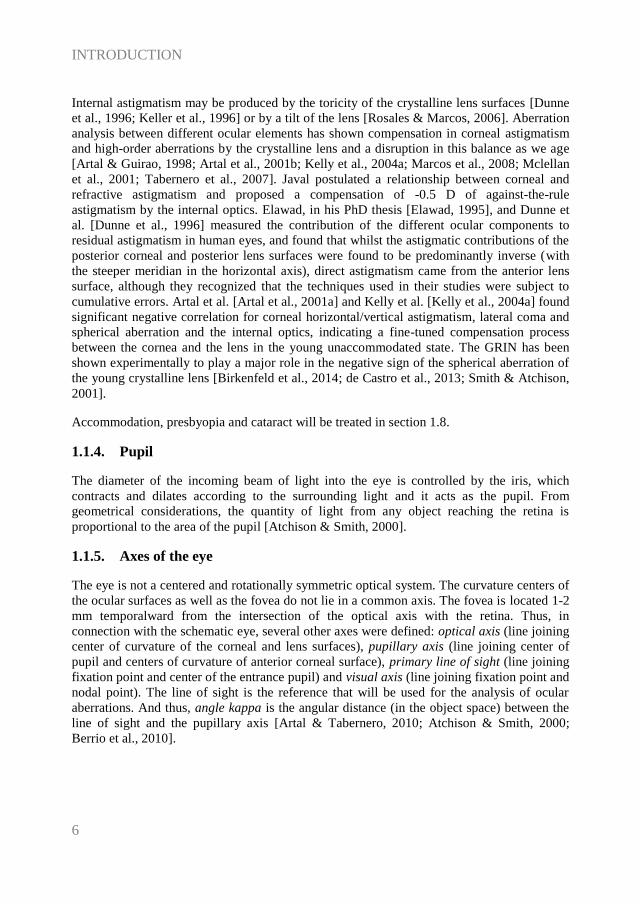
1.1.4. Pupil
The diameter of the incoming beam of light into the eye is controlled by the iris, which
contracts and dilates according to the surrounding light and it acts as the pupil. From
geometrical considerations, the quantity of light from any object reaching the retina is
proportional to the area of the pupil [Atchison & Smith, 2000].
1.1.5. Axes of the eye
The eye is not a centered and rotationally symmetric optical system. The curvature centers of
the ocular surfaces as well as the fovea do not lie in a common axis. The fovea is located 1-2
mm temporalward from the intersection of the optical axis with the retina. Thus, in
connection with the schematic eye, several other axes were defined: optical axis (line joining
center of curvature of the corneal and lens surfaces), pupillary axis (line joining center of
pupil and centers of curvature of anterior corneal surface), primary line of sight (line joining
fixation point and center of the entrance pupil) and visual axis (line joining fixation point and
nodal point). The line of sight is the reference that will be used for the analysis of ocular
aberrations. And thus, angle kappa is the angular distance (in the object space) between the
line of sight and the pupillary axis [Artal & Tabernero, 2010; Atchison & Smith, 2000;
Berrio et al., 2010].

Chapter I. INTRODUCTION
7
Figure 1.3. Illustration of the axis of the eye.
1.2. Refractive errors
“Los grados de los antojos, son vnas porciones o partes de esferas, q se van disminuyendo, desde vna
esfera de dos varas de diámetro, hasta otra tan pequeña, como el diámetro que tiene la redódez del
ojo; y los grados van creciendo según se va disminuyendo, ó achicando estas esferas y sus diámetros:
cuyas por porciones cóncavas o convexas, se van pasando a las formas donde se labran los antojos, de
tal manera que la diferencia de diámetro que tiene la mayor esfera á la menor, se divide en treynta
partes, a las quales llamamos grados, començando su numero desde la porción de la mayor esfera, y
feneciendo el numero treinta, en la porción de la menor que es la del ojo: Y estos treinta grados, son
bastantes para medir y ajustar qualquiera cortedad de vista por mucha q sea porque todas las vistas
que comiençan a usar antojos…”
B. Daza de Valdés. “Uso de los antojos”, 1623 [Daza de Valdés, 1623]
Refractive errors are the most common cause of reduced vision and normally are easily
corrected by adding lenses in front of the eye. Refractive errors can be defined from an
optical point of view as the refractive condition in which best focus for distant objects is not
located on the retina of the relaxed eye and refractive errors are generally divided into
defocus and astigmatism:
There are two types of defocus: myopia and hyperopia. Myopia, or nearsightedness, is
present when the focus of the eye falls in front of the retina causing a spherically defocused
image. By contrast, hyperopic eyes have difficulties to resolve close objects, because the
image falls behind the retina causing also a spherically defocused image and distant objects
can only be focused with accommodation. Defocus is sometimes accompanied by
astigmatism.
Figure 1.4. Illustration of myopia and hyperopia.

INTRODUCTION
8
Astigmatism is a symptom of asymmetry in the optics of the eye, where the refractive power
in one meridian is different in the power in the perpendicular meridian (this will result in two
lines of foci, and therefore an orientation dependent blur of the image).
Figure 1.5. (A) Series of “retinal” images of a circular spot captured in the CCD
camera at the focal plane of a lens acting as an artificial eye (Z22 = 0.92 µm, 6-mm
pupil diameter). (B) Illustration of the astigmatic foci in a myopic with the rule
astigmatism. (C) Illustration of the astigmatic foci in a myopic against the rule
astigmatism [Marcos et al., 2015].
1.3. Optical aberrations
“My eye, in a state of relaxation, collects to a focus on the retina, those rays diverge vertically from an
object at the distance of ten inches from the cornea, and the rays which diverge horizontally from an
object at seven inches distance…”
“When I look at a minute lucid point, such as the image of a candle in a small concave speculum, it
appears as a radiated star, as a cross, or as an unequal line, and never as a perfect point…”
T. Young. “On the mechanism of the eye”, 1801 [Young, 1801]
The image-forming properties of any optical system can be described in terms of wave
aberration. Light can be considered as a series of waves coming from a source. In
aberrations-free optical systems all the parallel rays will intersect the retina at the same point,
or equivalently, all the imaging wavefronts will be spherical and centered in the image point.
However, an imperfect lens will impose phase distortions on the plane waves, there is no
longer a point focus and the different rays will intersect the image plane at different points
(the wavefronts will no longer be spherical). The difference between the distorted waves and
the ideal waves is the wavefront aberration, representing the distortions of the wavefront
(surface containing points with the same phase and orthogonal to the propagation axis) in the
pupil plane as it goes through the optical system. Aberrations can be divided into chromatic
and monochromatic aberrations [Born & Wolf, 1993; Campbell & Gubisch, 1966].

Chapter I. INTRODUCTION
9
Figure 1.6. (A) Illustration of wavefront aberrations. (B) Schematic representation
of a non-aberrated eye. (C) Schematic representation of an aberrated eye.
Chromatic aberrations are a consequence of the dispersion (variation of refractive index
with wavelength) of the refractive media of an optical system. The average index of
refraction in the eye varies from 1.3404 for blue (450 nm) to 1.3302 for red (700 nm). This
means that the eye is about 1.5 D more myopic in blue light than in red.
There are two types of chromatic aberrations: longitudinal and transversal. Longitudinal
chromatic aberration (LCA) is produced because the different wavelengths are focused at
different image planes, and can be quantified as the variation in power with wavelength.
Whereas transverse chromatic aberration (TCA) is produced when obliquely incident rays
are focused at different transverse positions within the image plane (being critical the object
location in the visual field and the pupil position within the eye). LCA affects image contrast
through the mechanism of defocus and TCA affects image phase through the mechanism of
displacement [Bedford & Wyszecki, 1957; Bradley, 1992; Howarth, 1984; Howarth &
Bradley, 1986; Marcos et al., 1999; Marcos et al., 2001; Simonet & Campbell, 1990].
LCA has been measured by using psychophysical techniques (e.g., Badal optometer [Bobier
& Sivak, 1978a; Morrell et al., 1991], Spatially Resolved Refractometry [Marcos et al.,
1999]) and objective reflectometric techniques (e.g. Hartmann-Shack [Vinas et al., 2015] and
Laser Ray Tracing [Llorente et al., 2003]).
Monochromatic aberrations are those present when only one wavelength is considered, and
arise from the geometry, irregularities, tilts and decentrations of the components of the
optical system (cornea and crystalline lens). The magnitude of the monochromatic
aberrations in the eye depends on a variety of factors such as accommodation, pupil size,
aging, refractive state and retinal eccentricity [Applegate et al., 2000; Guirao & Artal, 1999b;
Howland & Howland, 1977; Marcos et al., 2001; Mclellan et al., 2001; Navarro et al., 1998;
Plainis & Pallikaris, 2006; Porter et al., 2001; Thibos & Hong, 1999].
Interestingly, in the young eye the magnitude of aberrations is larger in the cornea and the
internal optics separatley than in the complete eye as a result of compensatory effects in

INTRODUCTION
10
horizontal/vertical astigmatism, spherical aberration and lateral coma [Artal et al., 2001b;
Kelly et al., 2004a].
The wave aberration of a general optical system can be described mathematically by a
polynomial series. Zernike polynomial expansion has become the standard for representing
wave aberration data because they form an orthogonal set over a circle of unit radius, and
aberrations are usually referred to circular pupils [Mahajan, 1994; Malacara et al., 1990].
The Zernike polynomials (Znm, corresponding to the radial order n and the meridional
frequency m) were described by Frits Zernike in 1934 [Zernike, 1934]. An interesting feature
of the Zernike polynomials is that some terms are directly related to commonly known ocular
aberrations [Thibos et al., 2004a]. For example, structural abnormalities of the eye, such as
myopia, hyperopia and astigmatism, appear in the 2nd
order of this expansion. Further,
Zernike terms represent higher-order aberrations such as spherical aberration (arising from
the asphericity of the optical surfaces) and coma (mainly associated to local irregularities, tilt
and decentration of the surfaces of the optical system).
A wave aberration, W(x,y), can be described as a summation of Zernike polynomial functions
weighted by the Zernike coefficients, which indicate the magnitude of each particular
aberration present:
Equation 1.2: 𝑊(𝑥, 𝑦) = ∑ 𝑐𝑛𝑚𝑍𝑛
𝑚(𝑥, 𝑦)𝑛,𝑚
The deviation from a monochromatic perfect spherical wavefront can be denoted by W(x,y),
where W(x,y) is the wave aberration expressed in Cartesian coordinates, Znm (x,y) the Zernike
polynomial expressed in Cartesian coordinates, and cnm are the corresponding Zernike
coefficients for radial order “n” and meridional frequency “m”.
Figure 1.7. Representation of the Zernike base functions (15th coefficients) and
their corresponding point-spread functions (Taken from Vera-Díaz F and Doble N,
The human eye and adaptive optics, Topics in adaptive optics, 2012).

Chapter I. INTRODUCTION
11
From the wave aberration coefficients, different optical quality descriptors can be directly
derived after mathematical operations. The two classic descriptors are the Modulation
Transfer Function (MTF) and the Point Spread Function (PSF). The MTF quantifies the loss
in contrast associated to each spatial frequency, the higher the MTF the better the image
provided by the system. The PSF is the impulse response of the system, i.e., the degraded
image of an ideal point as imaged by the system. The Root Mean Square (RMS) is also a
common descriptor, it is defined as the root square of the variance of the wave aberration and
is typically used as the global metric for the optical quality [Applegate et al., 2003a;
Applegate et al., 2003b]. Furthermore, the retinal image associated with any observed image
can be simulated by convolving the ideal image with the PSF of the system [Cheng et al.,
2003b; Guirao & Williams, 2003].
In the Chapter II we will describe the optical quality metrics descriptors analyzed in this
thesis.
1.4. State-of-the art of aberrometers
Ocular aberrations are currently measured by using different techniques. Although
aberrometers measure ray aberrations as a function of pupil position, differences across
instruments arise from their psychophysical (requiring the participation of the subject) or
objective (based on the light reflected off the retina) nature of the technique, and the
“ingoing” (aberrations measured as the test beam goes into the eye) or “outgoing” (as the
wavefront emerges from the eye) direction of the measurement [Arnulf & Dupuy, 1956;
Burns & Marcos, 2001; Howland, 2000; Liang et al., 1994; Liang & Williams, 1997a;
Losada & Navarro, 1998; Marcos et al., 2002; Moreno-Barriuso & Navarro, 2000; Smirnov,
1961; Thibos et al., 1999]. The most relevant aberrometers are Hartmann-Shack (H-S) and
Laser Ray Tracing (LRT).
The H-S is an objective “outgoing” aberrometry technique [Hartmann, 1900, 1904; Shack,
1971]. It is based on the measurement of ray deviations at different pupil positions of a wave
reflected by the retina from a light point source. A microlens array, placed on a pupil
conjugate plane, focused multiple spots (one per lenslet) onto a CCD camera. Each lenslet
samples a small part of the wavefront corresponding to a certain pupil location. A regular
pattern of spots would be obtained for an ideal non-aberrated eye, while the presence of
aberrations produce an irregular pattern of spots. The deviations of each spot from the ideal
position are linearly proportional to the derivative of the wave aberration. An array of the
image shifts across the entire pupil is collected and a reconstruction algorithm is applied to
obtain the wavefront. H-S has two main advantages over sequential techniques such as LRT:
(1) it samples the pupil with a high fill factor, (2) high-speed (miliseconds).
The LRT is an objective “ingoing” technique and it is based on the light entering into the eye
through different pupil positions [Molebny et al., 1997; Navarro & Losada, 1997]. The
deviation of the test ray from the principal ray is detected by a CCD camera placed on a
plane conjugated to the retina. A galvanometer X-Y scanner allows to scan sequentially a
narrow light beam across the pupil in a brief period of time. As each ray goes through a
different optical path, the image on the retina suffers a shift that is linearly proportional to the
wavefront slope at the corresponding pupil position. From the sequence of the image shifts,

INTRODUCTION
12
the ocular wavefront can be reconstructed. Because the light source is projected sequentially,
LRT allows a very large dynamic range and the entire pupil can be used; however, the
sequential nature makes it slow (1.5 s vs 45 ms) in comparison with H-S.
Figure 1.8. (A) Scheme of H-S. (B) Scheme of LRT
A custom-developed LRT is the technique of choice to quantify the ocular aberrations in this
thesis, and the actual laboratory implementation will be described in Chapter II.
1.5. State-of-the art of quantitative anterior segment imaging
techniques
1.5.1. Elevation-based corneal topography
There are several techniques to measure the corneal topography: specular reflection,
scattered light and Scheimpflug imaging [Mejia-Barbosa & Malacara-Hernandez, 2001].
The specular reflection technique considers the anterior corneal surface as a convex mirror,
as in the Placido disk-based systems. This method uses the analysis of reflected images of
multiple concentric rings (alternating black and white rings) projected on the cornea. The
concentric rings target has a hole in its center through which the observer/camera can
visualize the reflected image from the cornea. The corneal shape is reconstructed in Placido
disk topography assuming reflection principles only valid for rotation-symmetric surfaces
[Massig et al., 2005; Rand et al., 1997]. However, the accuracy of this method has some
controversy since for non-rotation symmetric surfaces (as the cornea) skew-ray reflections

Chapter I. INTRODUCTION
13
produces crossing points, ambiguity and inaccuracy in corneal surface analysis [Klein, 1997;
Massig et al., 2005; Sicam & Van der Heijde, 2006]. In addition, Placido-disk topography
does not directly picture actual corneal shape or true elevation topography.
Figure 1.9. Geometry of the optical system for corneal topography in Placido-disk.
A light ray that emerges from a ring at P reflects off the cornea at Q and reaches the
image plane at S following the path QNS. The meridional plane is the plane that
contains the optical axis, so here the reflected ray QS is a meridional ray, whereas
the incident ray PQ is a skew ray (Taken from Mejía-Barbosa and Malacara-
Hernández).[Mejia-Barbosa & Malacara-Hernandez, 2001]
The scattered light technique uses the scattering phenomenon of the light when it is
transmitted in an optical medium. Part of this light emerged through ocular surfaces and it is
captured by an optical method. This technique is used in the slit-lamp systems (Orbscan,
Bausch and Lomb, Rochester, NY, USA). The Orbscan uses two slit-lamp projectors that are
calibrated at 45 deg to the right or left of the optical axis of the camera-eye system. Each slit
projects 20 slit beams across the whole width of the cornea, taking about 5000 points and
obtaining anterior and posterior corneal topography. However, the Orbscan is a time-
consuming technique (~2 seconds) and it is sensitive to motion artifacts.
The Scheimpflug imaging technique images the anterior segment of the eye using the
Scheimpflug principle. The principle is named due to Theodor Scheimpflug and explained a
method to increase the depth of focus. The Scheimpflug principle states that when the object
plane, the lens plane and the camera plane are all allowed to form converging lines, then
everything in the object plane will be in focus. The Pentacam (Oculus Inc., Lynnwood, Wash,
USA) is the commercial Scheimpflug camera. The Scheimpflug camera rotates 360 degrees
around a single fixation point as the patient focuses on a central light source, obtaining 50
images over a two-second period. The Pentacam generates 25000 true elevation points for
each surface, including the center of the cornea. However, Pentacam suffer optical and
geometrical distortion since it did not show a constant magnification and each surface is seen
through previous refractive surfaces. Distortion correction of the images allowed accurate
study of the posterior corneal surface and lens [Dubbelman et al., 2005; Rosales & Marcos,
2009].
INTRODUCTION
14
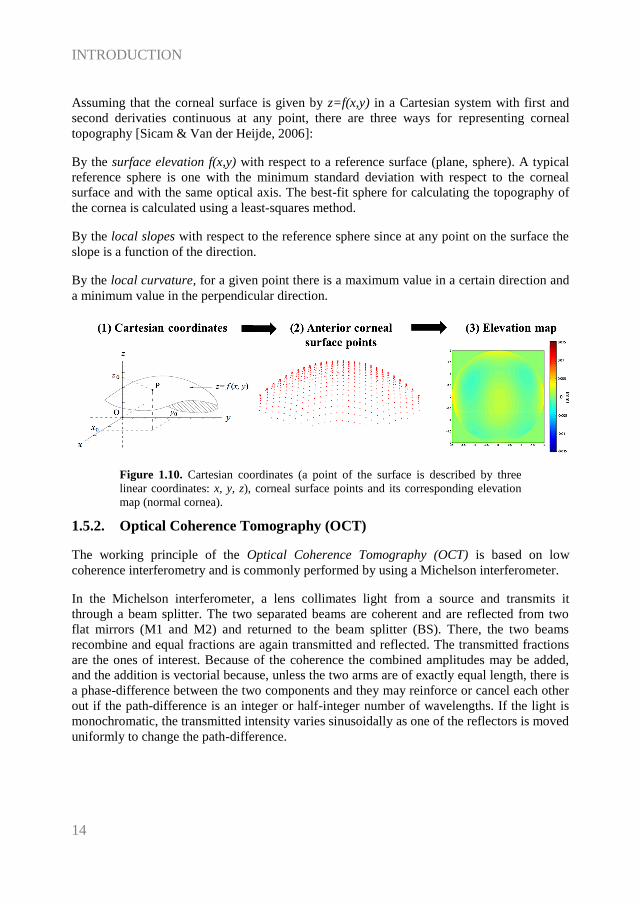
Assuming that the corneal surface is given by z=f(x,y) in a Cartesian system with first and
second derivaties continuous at any point, there are three ways for representing corneal
topography [Sicam & Van der Heijde, 2006]:
By the surface elevation f(x,y) with respect to a reference surface (plane, sphere). A typical
reference sphere is one with the minimum standard deviation with respect to the corneal
surface and with the same optical axis. The best-fit sphere for calculating the topography of
the cornea is calculated using a least-squares method.
By the local slopes with respect to the reference sphere since at any point on the surface the
slope is a function of the direction.
By the local curvature, for a given point there is a maximum value in a certain direction and
a minimum value in the perpendicular direction.
Figure 1.10. Cartesian coordinates (a point of the surface is described by three
linear coordinates: x, y, z), corneal surface points and its corresponding elevation
map (normal cornea).
1.5.2. Optical Coherence Tomography (OCT)
The working principle of the Optical Coherence Tomography (OCT) is based on low
coherence interferometry and is commonly performed by using a Michelson interferometer.
In the Michelson interferometer, a lens collimates light from a source and transmits it
through a beam splitter. The two separated beams are coherent and are reflected from two
flat mirrors (M1 and M2) and returned to the beam splitter (BS). There, the two beams
recombine and equal fractions are again transmitted and reflected. The transmitted fractions
are the ones of interest. Because of the coherence the combined amplitudes may be added,
and the addition is vectorial because, unless the two arms are of exactly equal length, there is
a phase-difference between the two components and they may reinforce or cancel each other
out if the path-difference is an integer or half-integer number of wavelengths. If the light is
monochromatic, the transmitted intensity varies sinusoidally as one of the reflectors is moved
uniformly to change the path-difference.

Chapter I. INTRODUCTION
15
Figure 1.11. Scheme of the Michelson intereferometer and the corresponding
electric field in the light wave.
The functional form of the electric field in a light wave is:
Equation 1.3: 𝐸𝑖𝑛 = 𝐸0 𝑒𝑖(𝜔𝑡−𝑘𝑧0)
𝐸1 = |𝐸1 |𝑒𝑖(𝜔𝑡−𝑘𝑧1) 𝑡𝑟𝑎𝑣𝑒𝑙𝑙𝑖𝑛𝑔 𝐵𝑆 − 𝑀1 − 𝐵𝑆− . ..
𝐸2 = |𝐸2 |𝑒𝑖(𝜔𝑡−𝑘𝑧2) 𝑡𝑟𝑎𝑣𝑒𝑙𝑙𝑖𝑛𝑔 𝐵𝑆 − 𝑀2 − 𝐵𝑆− . ..
where, ω=2πυ is the angular frequency (υ, frequency of the light wave), and κ=2π/λ is the
propagation constant (κ, it contains information regarding the wavelength).
Both reference and signal beams are combined at the beam splitter (BS). The output of the
interferometer is the sum of the electromagnetic fields from the reference beam and the
signal beam reflected from the tissue:
Equation 1.4: 𝐼 = |𝐸1 + 𝐸2|2 = 𝐼1 + 𝐼2 + √𝐼1𝐼2𝑒𝑖(−𝑘𝑧1+𝑘𝑧2) + √𝐼1𝐼2𝑒𝑖(𝑘𝑧1−𝑘𝑧2) =
𝐼1 + 𝐼2 + 2√𝐼1𝐼2 cos 𝑘𝑧
A detector (S) measures the field of the optical beam. The superimposed waves produce
interference fringes on the detector. These distinctive fringes enable the determination of the
location at which light is reflected back and the measurement of the depth profile of the
scattering amplitude. When several wavelengths are present, the output signal contains a
range of frequencies with amplitudes corresponding to the intensities of the various spectral
components. Fourier analysis of the signal can thus recover the spectrum of the source and
accurate measurements became possible with computing functions (e.g., Fast Fourier
Transform, FFT).
OCT is based on a classic optical technique known as low-coherence interferometry. Low-
coherence interferometry was used in photonics to measure optical echoes and backscattering
in optical fibers and its basic principle rely on the interferometric properties of a broadband
light source. The first biological application of low-coherence interferometry was reported
by Fercher et al. in 1988 [Fercher et al., 1988], for measuring the eye axial length.

INTRODUCTION
16
OCT is an important biomedical imaging technique being extensively developed since the
early 90s. The optical sectioning ability of the OCT was soon recognized and exploited to
image in vivo microscopic structures in tissue at depths beyond conventional confocal
microscopes. Compared with other imaging techniques, OCT has the following important
advantages: (1) the laser source is usually infrared, so, with controlled power, it is not
harmful to human tissue and comfortable for the patient; (2) the system is based on low-
coherence interferometer and the resolution is limited by the coherence length of the laser,
thus high resolution (1-10 µm) can be achieved; (3) the system can be fiber based, therefore
it could be easily made compact and low cost OCT; (4) real-time imaging can be achieved;
and (5) higher speed over other imaging technologies. Because of these advantages, OCT has
been established as an important tool in biomedical imaging area, especially in the
ophthalmology field (being now very common in the clinic).
OCT technology can be divided into two distinct groups: time-domain (TD) and spectral-
domain (SD) OCT. In TD-OCT, the autocorrelation of the light field is measured directly by
a mechanical axial movement of the reference mirror, which corresponds to the depth-
scanning signal of the sample [Fercher et al., 1993; Huang et al., 1991; Izatt et al., 1994;
Swanson et al., 1993].
Figure 1.12. Time-Domain OCT (adapted from T.E. Drew thesis)
In contrast, in SD-OCT, the autocorrelation is calculated by means of the Fourier transform
of the power spectral signal, which is measured directly. Modern OCT systems are usually
not based on time-domain principle but rather on SD-OCT shows higher speed (there is no
dependency of an axial movement of the reference mirror) and significant sensitivity
improvement for the same laser power. SD-OCT can be implemented by setting up a
spectrometer (SD) to detect the interference signal [Grulkowski et al., 2009; Wojtkowski et
al., 2003; Wojtkowski et al., 2002] or using a swept source (SS) to scan the frequency of the

Chapter I. INTRODUCTION
17
laser [Chinn et al., 1997; Choma et al., 2003; Yun et al., 2003]. Due to its higher speed (up to
1.68 MHZ) and depth range (up to 50 mm) SS-OCT is the latest milestone in ocular imaging
[Grulkowski et al., 2012].
Figure 1.13. (A) Spectral-Domain OCT. (B) Swept-Source OCT (adapted from
T.E. Drew thesis).
INTRODUCTION
18
OCT has been extensively used to study the retina, and less extent, in the last decade, to
image the anterior segment. However, as in all optical techniques aiming at direct imaging of
the posterior corneal surface and crystalline lens, images are distorted by the refraction of the
rays at the cornea and lens. Also, the scanning system induces distortion, fan distortion
(resulting in a combination of geometric aberrations, including field distortion, astigmatism,
and spherical aberration). Correction algorithms have been recently applied to extract
accurate information of the cornea [Ortiz et al., 2012a; Ortiz et al., 2010; Ortiz et al., 2009a,
2009b; Zhao et al., 2010] and the whole anterior segment [Ortiz et al., 2013; Ortiz et al.,
2012b].
A custom-developed SD-OCT is the technique of choice to quantify the geometry and
biometry of the anterior segment of the eye in this thesis, and the actual laboratory
implementation will be described in Chapter II. Pentacam and Placido disk-based corneal
topography were used in this thesis for validating OCT-based in vivo corneal topography.
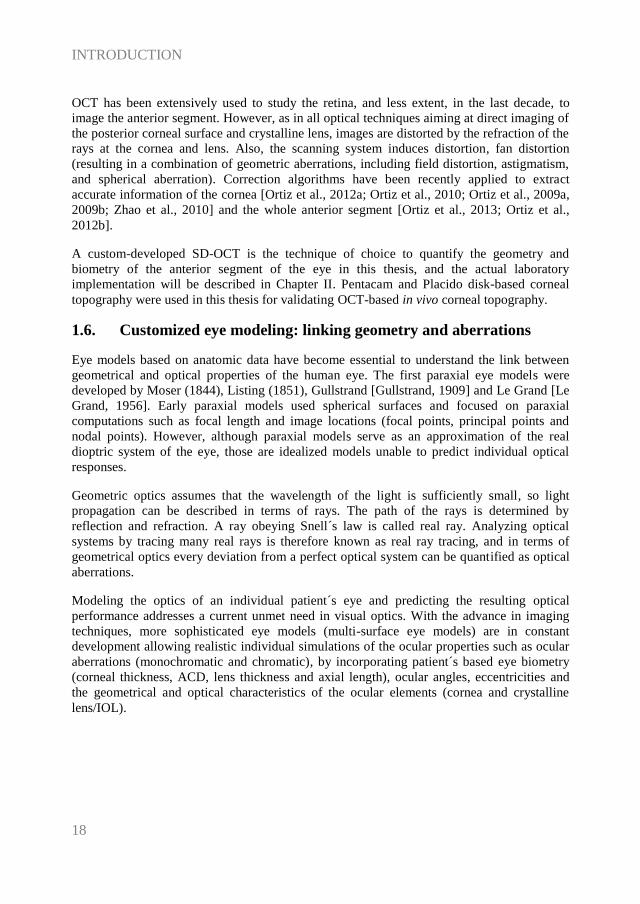
1.6. Customized eye modeling: linking geometry and aberrations
Eye models based on anatomic data have become essential to understand the link between
geometrical and optical properties of the human eye. The first paraxial eye models were
developed by Moser (1844), Listing (1851), Gullstrand [Gullstrand, 1909] and Le Grand [Le
Grand, 1956]. Early paraxial models used spherical surfaces and focused on paraxial
computations such as focal length and image locations (focal points, principal points and
nodal points). However, although paraxial models serve as an approximation of the real
dioptric system of the eye, those are idealized models unable to predict individual optical
responses.
Geometric optics assumes that the wavelength of the light is sufficiently small, so light
propagation can be described in terms of rays. The path of the rays is determined by
reflection and refraction. A ray obeying Snell´s law is called real ray. Analyzing optical
systems by tracing many real rays is therefore known as real ray tracing, and in terms of
geometrical optics every deviation from a perfect optical system can be quantified as optical
aberrations.
Modeling the optics of an individual patient´s eye and predicting the resulting optical
performance addresses a current unmet need in visual optics. With the advance in imaging
techniques, more sophisticated eye models (multi-surface eye models) are in constant
development allowing realistic individual simulations of the ocular properties such as ocular
aberrations (monochromatic and chromatic), by incorporating patient´s based eye biometry
(corneal thickness, ACD, lens thickness and axial length), ocular angles, eccentricities and
the geometrical and optical characteristics of the ocular elements (cornea and crystalline
lens/IOL).

Chapter I. INTRODUCTION
19
Table 1.1. Summary of the features eye-models based on average population data
(adapted from Sheehan thesis).
Surfaces
Lens Accomm
Domain
Model (Year) Sph Asph On-axis
Off-axis
Dispe_
rsion Age
Amet_
ropic
Gullstrand (1909) 6 - shell Yes Yes - - - -
Le Grand 4 - - Yes Yes - - - - Emsley (1952) 1 - - - Yes - - - -
Lotmar (1971) 3 1 - - Yes Yes - - -
Drasdo & Fowler (1974)
- 4 - - Yes Yes - - -
Kooijman (1983) - 4 GRIN - Yes Yes - - -
Pomerantzeff (1984)
- 2 shell - Yes Yes - - -
Navarro (1985) 1 3 - Yes Yes Yes Yes - -
Blaker (1991) - GRIN Yes Yes - - Yes - Smith (1992) 2 2 GRIN - Yes - - Yes -
Thibos - Indiana
(1992) - 1 - - Yes Yes Yes - -
Liou & Brennan
(1997) - 2 GRIN - Yes Yes Yes - -
Masajada & Kasprzak (2002)
4 GRIN Yes Yes - - - -
Siedlecki (2004) - 4 GRIN - Yes - - - -
Norrby (2005) - 4 - Yes Yes Yes - Yes - Atchison (2006) - 5 GRIN - Yes Yes Yes - Yes
Goncharov &
Dainty (2007) - 4 GRIN - Yes Yes - - -
Navarro (2007) - 4 GRIN Yes Yes Yes - Yes -
Campbell (2010) - 4 Shell Yes Yes Yes - Yes -
Rozema (2011) - 4 - - Yes - - - -
Chen (2012) 4 Shell Yes Yes - - - KC
Polans (2015) - 4 GRIN Yes Yes Yes Yes Yes -
Most of current generic eye modeling requires the assistance of ray tracing computational
programs (such as ASAP (Breault Research Organization, Inc., Tucson, AZ), ZEMAX
(Radiant ZEMAX; Focus software, Tucson, AZ), Code V (Optical Research Associates,
Pasadena, CA) or OSLO (Lambda Research Corporation, Littleton, MA)) and optical
optimization by integrating a merit function in order to approach the specific targets (e.g.
best focal position and optical quality metrics).
The incorporation of the geometry and aberrometry experimental data into computational
simulations has recently demonstrated fully customized procedures for ray-tracing IOL
power calculation [Rosales & Marcos, 2007; Tabernero et al., 2006].

INTRODUCTION
20
Table 1.2. Pseudophakic eye models based on ray-tracing IOL power calculation.
sph=spherical; asph=aspherical.
Model (Year) Cornea IOL
Rosales et al. (2007) Barbero & Marcos (2007)
Einighammer et al. (2009)
Canovas et al. (2011) Zhu et al. (2011)
Ribeiro et al. (2012)
Fernández et al. (2013)
Placido-disk (ant) Theoretical (ant and post)
Placido-disk (ant)
Placido-disk (ant) OCT
ORBSCAN (ant and post); post-LASIK
Theoretical (ant and post)
2 models (sph, asph) 2 models (sph, custom)
4 models (sph, asph, toric)
1 model Theoretical
1 model
1 model (multifocal) Zhang et al. (2015) Theoretical (Hwey-Lan Liou) 2 models (sphr, toric)
1.7. Anterior segment conditions and clinical applications studied in
this thesis
The measurement of the anterior segment geometry and aberrations in normal eyes is
important in understanding the contribution of every optical component to retinal image
quality. Still, the acquisition of accurate measurements in pathological eyes or in eyes treated
with different ocular procedures is critical for the evaluation of the geometry of the optical
components (cornea and implant, and crystalline lens and implant), the 3-D positioning of
the implant in the eye, and finally, the contribution of the clinical solution to ocular
aberrations.
1.7.1. Cornea (Keratoconus & Intracorneal Ring Segment (ICRS) treatment)
“I therefore held a candle at the distance of fifteen inches from the cornea, and
keeping my eye in the direction of the reflected rays, I observed the variations in the size and
form of the image of the candle. The reflected image regularly decreased when it passed over
the most convex parts of the cornea; but when it came to the part nearest the nose, it
alternately expanded and contracted, and suffered such derangements, as to indicate the
presence of a number of spherical eminences and depressions, which sufficiently accounted
for the broken and multiplied images of luminous objects…”
J. Wardrop. “Essays on the Morbid Anatomy of the Human Eye”, 1808 [Wardrop, 1808]
Keratoconus derives from the Greek words Kerato (cornea) and Konos (cone) and it is a
corneal condition affecting primarily young patients with a prevalence about 1 per 2000 in
the general population, being this prevalence 6 times greater in India [Gokhale, 2013]. It is
caused by the progressive and asymmetric weakening of corneal tissue, in which gradual
thinning lead to a cone-like appearance of the cornea, manifesting irregular astigmatism,
myopia and high levels of high-order aberrations.
Symptoms of keratoconus vary and depend on its stage [Nordan, 1997; Rabinowitz, 1998].
In early stages, it results difficult to differentiate keratoconus from other ocular refractive
conditions (such as astigmatism) in typical routine eye exams, so highly sensitive corneal
topography might be really helpful in its diagnosis. Furthermore, although the detection in
advanced stages is usually easier because of distorted vision and topographical signs, highly

Chapter I. INTRODUCTION
21
deformed corneas cannot be assessed precisely because of inherent limitations of the imaging
techniques (e.g., resolution or acquisition time) or aberrometers (e.g., dynamic range).
1.7.1.1. Keratoconus: topography and pachymetry
The characteristic changes in both anterior and posterior corneal surfaces leads to changes in
corneal thickness, which can be assessed by means of corneal topography and pachymetry.
In most keratoconic patients, the anterior corneal topographic map is characterized by focal
steepening with a dioptric power greater than 46 D, corneal thinning and astigmatism. The
cone vertex is typically displaced toward the lower mid-peripheral region in either the nasal
and temporal quadrant. There is usually a vertical asymmetry with a certain diagonal angle.
All of these topographic and pachymetric alterations in keratoconus appear as a consequence
of the biomechanical changes that occur in the corneal structure [Meek et al., 2005]. The
topographical pattern is usually similar in both eyes, although one of them may show a more
advanced state [Nordan, 1997; Rabinowitz, 1998].
For early keratoconus diagnosis, different descriptors based on anterior corneal topography
were developed during the 90s with the first videokeratographers: central corneal power
(central K: descriptive of central steepening), Inferior-Superior values (I-S dioptric
asymmetry), surface asymmetry index (SAI), specific index quantifying irregular astigmatism
(SRAX, skewed radial axis) and KISA% index [Li et al., 2009; Maeda et al., 1994;
Rabinowitz, 1995].
The development of new commercial imaging techniques (Orbscan II and Pentacam
Scheimpflug camera) and the advance in new surface detection algorithms has made possible
the topographic analysis of the posterior cornea. Tomidokoro et al. [Tomidokoro et al., 2000]
reported that irregular astigmatism of the posterior corneal surface is one of the first sign of
keratoconus; Chen and Yoon [Chen & Yoon, 2008] showed that the posterior corneal surface
was significantly more irregular than the anterior corneal surface in keratoconus. Regarding
corneal pachymetry, significant differences have been reported between normal subjects and
keratoconus, showing also differences across different keratoconus stages [Rabinowitz et al.,
1998]; and Saad and Gatinel [Saad & Gatinel, 2010] showed that corneal thickness and
curvature measurements over the entire cornea centered on the thinnest point are valid
metrics for diagnosing earlier keratoconus stages.
However, some studies reported poor repeatability and variability in the analysis of
keratoconus using Orbscan and Pentacam (especially in the posterior corneal surface), being
this variability possibly associated to interpolation errors attributable to meridional sampling
approaches, relatively long acquisition times, and errors in optical distortion correction,
particularly challenging with highly deformed corneas [Read et al., 2009; Shankar et al.,
2008].
Due to its higher speed, depth range and resolution, OCT has been positioned as a promising
technique for quantifying both corneal surfaces in keratoconus [Gorgun et al., 2012;
Karnowski et al., 2011; Li et al., 2008; Ortiz et al., 2011; Qin et al., 2013; Read et al., 2009].
Li et al. [Li et al., 2008; Li et al., 2006] reported for first time quantitative abnormal corneal
thinning in keratoconus based on OCT by analyzing only 8 cross-sectional OCT images and

INTRODUCTION
22
mapped the corneal epithelial thickness [Li et al., 2012]. Karnowski et al. [Karnowski et al.,
2011] showed 3-D quantitative corneal analysis in a keratoconic subject based on SS-OCT.
Nakagawa et al. [Nakagawa et al., 2011] measured forty keratoconic eyes and showed good
agreement between OCT and Pentacam. And, Szalai et al. [Szalai et al., 2012] compared
anterior segment measurements (anterior and posterior corneal radius, corneal thickness and
anterior chamber depth) between SS-OCT and Scheimpflug in normal and keratoconus and
found statistically significant differences between instruments in all parameters. As we
described in section 1.5.2., OCT images are generally subject to distortions. Because of these
distortions, OCT images need to be corrected for an accurate quantification. To date, the only
study showing 3-D quantitative keratoconus properties using OCT after full distortion
correction was performed in our group by Ortiz et al. [Ortiz et al., 2012a], on a single patient.
1.7.1.2. Keratoconus: aberrations
The progressive distortion of the cornea leads to abnormal corneal topography and results in
irregular astigmatism, progressive myopia and increased high-order aberrations, with
consequent loss of vision. Previous studies based on H-S [Maeda et al., 2002] and LRT
[Barbero et al., 2002a] ocular aberrometry showed differences between normal and
keratoconic eyes, being approximately 5.5 times higher in keratoconus. Both studies found
significant high values in astigmatism and coma (particularly, vertical coma). Maeda et al.
[Maeda et al., 2002] reported that coma-like aberrations were 2.32 times larger than
spherical-like aberrations in keratoconic eyes. Trefoil, tetrafoil and secondary astigmatism
terms were also higher and variable in keratoconus [Alio et al., 2011; Alio & Shabayek,
2006; Barbero et al., 2002a; Maeda et al., 2002].
Although the anterior corneal surface supposes the dominant factor to corneal aberrations,
posterior corneal aberrations have a remarkable implication in ocular aberrations, especially
in keratoconus. However, few studies measured the contribution of the anterior and posterior
corneal surfaces to total aberrations. Chen and Yoon [Chen & Yoon, 2008] (using Orbscan)
demonstrated stronger compensation effects of the posterior corneal surface in keratoconus
than in a normal population (around 20% of anterior corneal astigmatism and coma).
Nakagawa et al. (using Pentacam) showed that the axes for coma in the anterior (63.6 deg)
and posterior (241.9 deg) surfaces were in opposite directions. Piñero et al. [Pinero et al.,
2009a] (using Pentacam) showed higher levels of aberrations (particularly for coma-like
aberrations) in the posterior corneal surface when compared with the anterior corneal surface
in normal and keratoconus eyes.
1.7.1.3. Keratoconus treatment: Intracorneal Ring Segments (ICRS)
The hallmark of keratoconus is the presence of irregular corneal astigmatism and the increase
of high-order aberrations (particularly vertical coma, Z3-1
), making difficult its correction
with spectacles or contact lenses alone when the disease is in advanced stage. Managing
keratoconus would benefit from the reinforcement of the cornea using an additive technique.
Surgical treatments to stabilize or delay the progression of keratoconus before a corneal
transplant involve the implantation inside the cornea of intracorneal ring segments (ICRS)
[Colin et al., 2000] or the application of collagen cross-linking [Spoerl et al., 1998]. In this

Chapter I. INTRODUCTION
23
thesis we make use of our custom-developed LRT and OCT methodology to evaluate the
ICRS treatment (Chapter III).
ICRS are PMMA segments with variable form (triangular, hexagonal and oval), arc length
and width, and are inserted to the cornea through a manually [Colin et al., 2000] or
femtosecond laser [Shabayek & Alio, 2007] made channel in the corneal stroma according to
empirical nomograms, in one or two sides of the pupil.
ICRS act as spacer elements between the bundles of corneal lamellae, inducing shortening of
the central corneal arc length and, as consequence, producing a flattening of the anterior
cornea. Furthermore, ICRS are expected to increase the biomechanical stability and to
improve the optical quality of the cornea by increasing corneal symmetry [Colin et al., 2000;
Pinero et al., 2009b; Vega-Estrada et al., 2013].
Figure 1.14. (Top) OCT cross sectional image showing the ICRS inside the cornea.
(Bottom) 3-D illustration of ICRS inside the cornea (obtained with OCT and
illustrated with AMIRA software).
Assessment of ICRS implantation has been performed using different imaging techniques
including slit scanning corneal topography [Dauwe et al., 2009], Scheimpflug imaging
[Torquetti & Ferrara, 2010], ultrasound biomicroscopy [Reinstein et al., 2010; Reinstein et
al., 2001] and OCT [Gorgun et al., 2012; Ortiz et al., 2012a]. Additionally, few studies in the
literature have examined aberrations in keratoconic patients implanted with ICRS.
Most studies analyzed changes in the anterior cornea only, with only very few studies
addressing the posterior cornea. These studies reported a mean flattening of the anterior
cornea by 2.5 D, showing large variability in the corneal response across subjects (from an

INTRODUCTION
24
increase of 2.5% to a decrease of 18% in the topographic K-values after 90 days ICRS
implantation [Shabayek & Alio, 2007]). The only previous study investigating the posterior
corneal surface in corneas implanted with ICRS reported a significant flattening of
approximately 0.25 mm using Scheimpflug imaging [Sogutlu et al., 2007].
Dauwe et al. [Dauwe et al., 2009] suggested that thickness redistribution after ICRS
implantation might be a delay factor in keratoconus progression, since as the cornea thickens
in the weakened areas, the stress may be redistributed and the decompensatory keratoconus
cycle might be delayed. However, this hypothesis has not been yet demonstrated. In fact,
there is controversy on the long-term effects with some studies showing stabilization
[Torquetti et al., 2014; Vega-Estrada et al., 2013] and others regression [Alio et al., 2014;
Vega-Estrada et al., 2015] after ICRS surgery.
Potential changes in the expected ICRS depth have been associated to post-surgical
complications. Rotation or migration of the ICRS post-surgery has been described as
consequence of the physiological stress and the wound healing response [Perez-Merino et al.,
2010]. Naftali and Jabaly-Habib [Naftali & Jabaly-Habib, 2013] using commercial OCT
reported significant differences between the planned and measured ICRS depth (~120 µm),
although part of this discrepancy might be due to the inherent distortion associated to OCT.
Recently, Ortiz et al. [Ortiz et al., 2012a] measured accurately the location of ICRS in 3-D
using distortion-corrected OCT.
Figure 1.15. OCT 3-D in vivo positioning of the ICRS inside the cornea
(orientation and depth). [Ortiz et al., 2012a]
While the literature reporting clinical visual performance after ICRS implantation is
extensive, only two studies evaluate wavefront aberrations, showing contradictory results.
Piñero et al. [Pinero et al., 2010] reported a significant improvement in anterior corneal
astigmatism (3.21±2.16 µm preoperative, 2.50±1.73 µm post ICRS) and a reduction of
coma-like anterior corneal aberrations (3.46±1.86 µm preoperative, 2.94±1.45 µm post

Chapter I. INTRODUCTION
25
ICRS) and of anterior corneal HOAs (3.73±1.97 µm preoperative, 3.24±1.44 µm post ICRS)
3-months post ICRS implantation, for 6-mm pupils. In contrast, Chalita and Krueger [Chalita
& Krueger, 2004] reported an increase in ocular HOA in the ICRS-implanted eye, when
compared to the non-treated fellow eye.
Quantitative image-based and aberrometry techniques are helpful to evaluate objectively the
performance of ICRS, but different studies also proposed analytical or numerical methods to
model the response of the cornea to the ICRS and improve the implantation nomograms
[Dauwe et al., 2009; Kling & Marcos, 2013; Pinsky et al., 2005]. These studies suggested a
linear relationship between refractive change and ICRS height (the higher, the more
effective) and optical zone (the smaller, the more effective).
1.7.2. Crystalline lens (Accommodation, Presbyopia, Cataract)
With age, two crucial features of the crystalline lens decline due to biochemical and
biophysical changes. A progressive loss of transparency is accompanied by a fall in the rate
and amplitude of accommodation. The latter is the basis of presbyopia, which reaches its top
by the age of 50. The biochemical and cellular changes that result in the loss of transparency
are known as cataract.
1.7.2.1. Accommodation
Accommodation is the dioptric change in power of the eye to provide clear and sharp retinal
image for all distances, accommodation is also often described as being linked with
convergence and pupil constriction. The primary stimulus for accommodation is blur vision,
with lesser roles played by apparent perceived distance, chromatic aberration, non-symmetric
aberrations and spherical aberration [Atchison, 1995; Charman, 2008].
When the young eye is relaxed and focused for distance, the ciliary muscle is relaxed, resting
tension on the zonular fibers spanning the circumlental space and inserting around the lens
equator apply an outward directed tension around the lens equator through the lens capsule to
hold the lens in a relatively flattened and relaxed state. During accommodation, the ciliary
muscle contracts, the inner apex of the ciliary muscle moves forward and towards the axis of
the eye. This inward movement of the apex of the ciliary muscle stretches the posterior
attachment of the ciliary muscle relaxing the tension on the zonular fibers and changing the
crystalline lens geometrical properties (by increasing the convexity of its surfaces). The lens
capsule provides the force to cause the lens to become accommodated. During
accommodation, lens diameter decreases, lens thickness increases, anterior and posterior lens
radii become steeper and anterior chamber depth decreases. In addition to the dioptric
changes due to curvature and axial variations, a modification in the refractive index gradient
was also found [Garner & Smith, 1997]. These changes overall contribute to 10-15 D of
accommodative amplitude in the young adult eye, diminishing to <2 D by middle age [Ostrin
& Glasser, 2004].
The accommodative response is the actual amount of accommodation produced by the lens
for a given stimulus, i.e., the least accommodation required to obtain a sharp image. It is
normally limited by the depth-of-focus (which is dependent on pupil size, residual defocus,

INTRODUCTION
26
astigmatism and high-order aberrations) and the inability to detect small amounts of blur. At
distance, the eye usually overaccommodates, while at near underaccommodates, creating a
lag of accommodation [Charman, 2008].
Most of clinical evaluations assessing the amplitude of accommodation are primarily based
on the patient´s visual function: i.e. test of near visual acuity, reading test, through focus
curves, convergence or subjective measurements of accommodation (e.g., by adding plus or
minus lenses). However, these measurements do not differentiate the functional range of near
vision attributable to the depth-of-focus of the eye.
Several techniques have been used to assess accommodation objectively using ultrasound
biomicroscopy [Ramasubramanian & Glasser, 2015], low-coherence interferometry [Bolz et
al., 2007; Drexler et al., 1997; Drexler et al., 1998], magnetic resonance imaging [Jones et
al., 2007; Kasthurirangan et al., 2011], Purkinje imaging [Rosales et al., 2006], Scheimpflug
imaging [Dubbelman et al., 2005; Koretz et al., 1997] and OCT [Gambra et al., 2013; Leng
et al., 2014; Ruggeri et al., 2012; Shao et al., 2015]. Several of these techniques allowed
quantifying the geometrical properties of the crystalline lens and the changes with
accommodation. Alternatively, dynamic autorefraction and aberrometry [Gambra et al.,
2009] have proved also rapid and repeatable measurements to objectively assess the
accommodative response.
The changes in crystalline lens radius during accommodation in young subjects are greater
for the anterior surface than for the posterior lens surface. Dubbelman et al. [Dubbelman et
al., 2005] using 2-D cross-sectional Scheimpflug images reported rates of 0.61±0.15 mm/D
for the anterior and 0.13±0.06 mm/D for the posterior lens radius. Rosales et al. [Rosales et
al., 2006] measured the radius of the anterior and posterior lens surface with accommodation
using Scheimpflug and Purkinje imaging and found a decrease of 0.64 mm/D (Scheimplfug)
and 0.57 mm/D (Purkinje) for the anterior lens and 0.23 mm/D (Scheimplfug) and 0.57
mm/D (Purkinje) for the posterior lens, for an 8-D accommodative demand range. Gambra et
al. [Gambra et al., 2013] reported measurements in eyes as a function of accommodation
using distortion-corrected OCT and found a decrease of 0.73 mm/D and 0.20 mm/D for the
anterior and posterior lens radius, respectively. And, Shao et al. [Shao et al., 2015] using 2-D
OCT reported rates of 1.06 mm/D and 0.29 mm/D for the anterior and posterior lens radii.
Different studies also reported static (anterior chamber depth (ACD) and lens thickness) and
dynamic (fluctuations) changes with accommodation [Dubbelman et al., 2005; Gambra et al.,
2013; Kasthurirangan et al., 2011; Leng et al., 2014]. On average, ACD decreases 0.057
mm/D, lens thickness increases 0.081 mm/D and lens fluctuations changes 0.044 D/D of
accommodative demand (driven primarily by the posterior lens surface) [Gambra et al.,
2013].
Because of structural changes in the crystalline lens (shape, position and refractive index)
that occur during accommodation, wave aberrations are expected to change. Spherical
aberration has been reported to shift towards negative values, and different studies also
showed changes in coma, trefoil and astigmatism, but the direction of the change was
variable [Chen et al., 2006; Gambra et al., 2009; He et al., 2000b; Radhakrishnan &
Charman, 2007].

Chapter I. INTRODUCTION
27
Information on the crystalline lens provided by commercial or custom-developed instruments
is generally limited to axial properties or to measurements of the anterior and posterior lens
radius of curvature from single cross-sections, not revealing topographic features of the lens.
In this thesis we make use of our custom-developed OCT in the in vivo analysis of crystalline
lens topography with accommodation (Chapter IV).
1.7.2.2. Presbyopia
“It may be observed that old people hold objects that they wish to examine further from the
eye…If anyone examines letters or other minute objects through the medium of crystal or glass
or other transparent substance, if it be shaped like the lesser segment of a sphere, with the
convex side being towards the eye, and the eye being in the air, he will see the letters far better,
and they will seem larger to him…For this reason, such an instrument is useful to old persons…”
R. Bacon. “Opus Majus”, around 1250
The basis of presbyopia development is crystalline lens hardening. The lens becomes too
stiff to respond by bulging when tension is removed. The most likely cause for lens
hardening is changed of the highly concentrated proteins within the fiber cells, thus altering
the physical proteins of the cytosol [Truscott & Zhu, 2010].
Dubbelman and Van der Heijde [Dubbelman & Heijde, 2001] reported a slight decrease of
the anterior and the posterior lens radius of curvature with age (0.057 mm/age and 0.012
mm/age, respectively), using Scheimpflug imaging technique. Additionally, with age there is
also an increase of lens thickness and a decrease of the ACD. Birkenfeld et al. [Birkenfeld et
al., 2014] showed a decrease of the GRIN compensatory role on spherical aberration with
age.
The optical performance of the eye also changes with age. Due to the disruption of the
compensatory effect between the anterior cornea and the internal aberrations there is an
increase in high order aberrations [Glasser & Campbell, 1998a; McLellan et al., 1999]. In
particular, the spherical aberration and horizontal coma tend to increase in older eyes [Piers,
2002; Pierscionek, 1996]. Tabernero et al. [Tabernero et al., 2007] showed that the RMS of
the higher order ocular and corneal aberrations increased with age at a rate of 0.0032
µm/year and 0.0015 µm/year, respectively. In this study, the authors did not observed
changes in the optical alignment with age (i.e., the angle kappa remains stable), assuming
therefore that variations in the crystalline lens shape with age might explain most of the
increment of ocular aberrations.
1.7.2.2.1. Presbyopia solutions
Presbyopia becomes an apparent problem for most people in their forties when they can no
longer see clearly daily near tasks and need to seek a solution by using external (spectacles
or contact lenses) or internal (corneal refractive surgery or IOL) corrections.
The easiest solution is conventional single-vision reading spectacles, but this solution does
not allow sharp vision at intermediate or far vision. Different available solutions for
presbyopia are based on different principles: alternating vision (implying changes of gaze:

INTRODUCTION
28
bifocal lenses or progressive spectacles), monovision (one eye is corrected for distance vision
and the other for near vision: contact lenses, IOLs, corneal inlays or corneal laser refractive
surgery) and simultaneous vision (the eye is corrected for distance and near vision
simultaneously: contact lenses or IOLs) [Ahmad et al., 2014; Bennett, 2008; Brown et al.,
1987]. In addition, surgical options to restore or enhance the accommodative ability of a
presbyopic eye by mimicking the crystalline lens (accommodative IOLs) are currently under
development [Beiko, 2007; Glasser, 2008].
In this thesis we will focus on accommodative IOLs as a solution for presbyopia.
Accommodative IOLs
Accommodative IOLs (A-IOLs) that attempt at changing either their position and/or shape in
response to ciliary muscle contraction are at the forefront of much ongoing research to
restore true accommodative function to presbyopic eyes. Currently, there are multiple
strategies from laboratory-based to commercial models attempting functional
accommodative capacity in presbyopic/cataract patients, including flexible haptics, moldable
gels and fluid displacements, with either single monofocal IOLs, dual IOLs or gel-filled
lenses [Glasser, 2008]. Additionally, several studies have explored the concepts of lens
softening (reducing lens stiffening by photodisruption) and lens refilling of the capsular bag
with gel-like polymers that mimic the crystalline lens [Nishi et al., 2009]. However, to date,
most designs in practice rely on an axial shift of the IOL in response to an accommodative
stimulus:
(1) single optical element expected to move axially forward and backwards (BioCom Fold,
by Morcher GmbH; 1CU, by Human Optics AG; Crystalens A-IOL, by Bausch & Lomb;
Tetraflex, by Lenstec, Inc; OPAL, by Bausch & Lomb; C-Well, by Acuity Ltd; Quest Vision
lens, by AMO; TekClear, by Tekia) [Cumming et al., 2006].
(2) two optical elements expected to axially increase their separation (e.g., Synchrony, by
AMO; Sarfarazi dual-optic A-IOL, by Bausch & Lomb; Turtle A-IOL based on Alvarez´s
lens principle) [McLeod et al., 2007].
In the A-IOL, the degree of the accommodative effect is proportional to the dioptric power,
its mechanism of action and the lens and its movement. Ho et al. predicted with ray-tracing
that single optical A-IOL might provided up to 1.0 D of accommodation (axial shift 1.2
D/mm), whereas the range for two optical elements A-IOLs is up to 3.0 – 4.0 D (axial shift
3.0 D/mm). Also, for a maximum accommodation, the final position of the A-IOL should be
placed close to the posterior capsule.
However, to date, the in vivo efficacy of A-IOLs designs remains unclear. Different studies
have shown than the subjective accommodative response after Crystalens A-IOL
implantation ranged from 0.44 to 2.36 D, which was close to the magnitude of depth-of-
focus of standard monofocal IOLs (ranging from ±0.85 D to 1.82 D) [Beiko, 2013; Macsai et
al., 2006]. While subjective measurements assess visual performance at different distances,
the results provided by these tests cannot generally conclude whether the lenses are actually
working according to their functional mechanism, since these methods do not differentiate

Chapter I. INTRODUCTION
29
the functional range of near vision attributable to the depth-of-focus of the eye [Leydolt et
al., 2009; Marcos et al., 2005b; Tahir et al., 2010; Tucker & Rabie, 1980].
Alternatively, dynamic autorefraction demonstrated rapid, objective and repeatable
techniques to assess the accommodative response [Choi et al., 2000]. Langenbucher et al.
[Langenbucher et al., 2003] showed a mean accommodative response of 1.00±0.44 D using
photorefraction in patients implanted with the 1CU A-IOL (HumanOptics AG, Erlangen,
Germany); whereas, Zamora-Alejo et al. [Zamora-Alejo et al., 2013] showed no change with
accommodative effort in the spherical equivalent in patients implanted with the Crystalens
HD.
As described in the accommodation sub-section, different factors, such as pupil size, residual
defocus, astigmatism and high-order aberrations, may contribute to an expansion of the
ocular depth-of-focus. Aberrometry therefore appears as a highly suitable objective
technique to evaluate the optical performance of A-IOLs, including potential accommodative
responses and the factors that may result in a potential pseudoaccommodation [Marcos et al.,
2005a; Mclellan et al., 2001]. Static and dynamic aberrometry have been used in the past to
assess the change of aberrations with aging or accommodation, as well as the impact of
aberrations on the accommodative lag [Gambra et al., 2009; He et al., 2000b; Hofer et al.,
2001; Lopez-Gil et al., 2007]. In addition, aberrometry has been extensively used to evaluate
the optical performance in patients implanted with monofocal IOLs [Barbero, 2003].
However, whereas optical bench studies and ray-tracing simulations analyzed optical quality
in A-IOLs [Ho et al., 2006; Kim et al., 2011; Pepose et al., 2012; Zheleznyak et al., 2012],
there are few reports in the literature on the optical aberrations in eyes implanted with A-
IOLs. Using dynamic Hartmann-Shack aberrometry, Dick and Kaiser [Dick & Kaiser, 2002]
found small changes in defocus in patients implanted with the Crystalens AT-45
(Bauch&Lomb, Rochester, NY) and 1CU (HumanOptics AG, Erlangen, Germany) A-IOLs.
Ehmer et al. proved a low degree of accommodation of Synchrony dual-optic A-IOL, they
found amplitudes of accommodation of 1 D for an accommodative stimulus of 3 D.
Wolffsohn et al. [Wolffsohn et al., 2010] reported some changes in ocular aberrations
(defocus, astigmatism, coma and trefoil) with increased accommodative demand in patients
implanted with the Tetraflex A-IOL (model KH-3500; Lenstec, ST. Petersburg, FL).
In addition to objective visual function analysis, an objective way to evaluate whether A-
IOLs are operating as expected by design is its direct intraocular visualization. With the use
of ultrasound biomicroscopy (UBM), Marchini et al. [Marchini et al., 2004] reported a
forward mean shift of 0.32 mm at 1 month (with several eye showing backward shifts). With
low-coherence intereferometry (PCI), Stachs et al. [Stachs et al., 2006] reported a forward
mean shift of 0.24 mm under pilocarpine-induced accommodation and Koeppl et al. [Koeppl
et al., 2005] detected only negligible counterproductive backward movement of the
Crystalens AT-45. Also, apart from potential shifts of the A-IOLs in the axial direction,
observational studies have also reported cases of asymmetric vaulting of the IOL, known as
“Z syndrome” (the lens tilt is likely caused by capsular contraction or asymmetric fibrosis in
the haptic region).

INTRODUCTION
30
In this thesis we make use of our custom-developed LRT (objective accommodative
response and optical aberrations) and OCT (3-D positioning) methodology for evaluating the
efficacy of a single optical element A-IOL (Chapter V).
1.7.2.3. Cataract (Intraocular Lens)
“A new operation is described whereby an artificial lenticulus is inserted in the eye after
cataract extraction. Excellent function can be obtained, and a lens has been known to remain
in position without causing inflammation for at least two years…”
H. Ridley. “Intra-ocular acrylic lenses after: a recent development in the surgery of
cataract”, Brit J Ophthal, 1952
Age-related cataract is a cause of blindness on a global scale (43% of worldwide blindness)
due to biological aging, genetic and environmental factors of the crystalline lens, such as
protein aggregation, oxidative stress and increase in high molecular weight and increase in
water content. There are several distinct forms of age-related cataract, whose morphologies
imply different etiologies of different lens regions: nuclear and cortical cataracts [Michael &
Bron, 2011; Truscott & Zhu, 2010].
Cataract surgery is one of the oldest surgical procedures known, first documented in the 5th
century BC in Egypt. However, the substitution of the opacified crystalline lens by an
intraocular optical element it was not done until the mid of the 20th
century, when Sir H.
Ridley first introduced an artificial IOL [Ridley, 1952]. Since then, cataract surgery with
intraocular lens (IOL) implantation has become a routine surgical procedure.
A typical IOL structure is composed by two main parts: the body (the optic of the lens) and
the haptics (the struts). IOLs must satisfy specific requirements in terms of optical
performance, mechanical properties, biocompatibility, shelf-life and transportability. There
are several IOL designs and/or models available in the market: monofocal (spherical,
aspherical), multifocal (concentrical zones of differing refractive power, diffractive optics),
toric and accommodative (curvature changes of the lens surfaces and/or axial displacement
of the optical elements).
Traditional IOLs are monofocal and spherical, and only correct defocus for far vision,
achieving almost far-emmetropic distance refractions in the majority of cases. However, with
the current advances and the great variety in design, materials, imaging techniques,
femtosecond surgery and the patient´s demands, the concept of “premium IOLs” has been
coined [Atchison, 1989; Atchison, 1991; Glasser, 2008; Holladay et al., 2002; Norrby et al.,
2007; van der Mooren et al., 2015]. “Premium IOLs” include all toric, aspheric, multifocal
and accommodative designs.
State-of-the-art of toric [Novis, 2000] and aspheric IOL [Wang et al., 2012] designs aim at
compensating the astigmatism and spherical aberration of the cornea, respectively.
Furthermore, because of the replacement of the crystalline lens by an IOL modifies the
chromatic dispersion properties of the eye, new materials (with different Abbe number) and
designs aim also at correcting the chromatic aberration of the eye [Weeber & Piers, 2012].

Chapter I. INTRODUCTION
31
To date, there are different formulas for IOL power calculation [Fyodorov et al., 1975; Loyd
& Gills, 1986]. SRK [Sanders et al., 1981] and SRK-II [Sanders et al., 1988] are regression
formulas based on statistical retrospective analysis of post-operative data; and SRK-T
generally uses a thin lens approach and different approximations for the cornea and lens in
the paraxial regime [Sanders et al., 1990]. These formulas require pre-operative data of axial
length and corneal power. However, compared to the sophisticated technologies and surgical
skills involved in cataract surgery, more factors (e.g., corneal elevation, ACD, IOL model
and ocular alignment) can be included to predict with higher accuracy the estimated lens
position (ELP) and the final visual performance (especially in odd cases (keratoconus) or in
patients treated with refractive surgery) [Aramberri, 2003; Canovas & Artal, 2011; Hoffer,
1993; Hoffer et al., 2015; Holladay et al., 1988; Norrby et al., 2007; Ortiz et al., 2013;
Rosales & Marcos, 2007; Savini & Hoffer, 2011].
Improvements in aberrometry and in biometry imaging techniques has opened the possibility
of considering new factors for providing a better IOL power calculation and finding the
proper IOL placement. Ray-tracing allows for exact calculations, retaining only the errors
inherent to biometrical measurements, being a better competitor compared with paraxial
optical methods [Barbero & Marcos, 2007; Canovas & Artal, 2011; Einighammer et al.,
2009; Ortiz et al., 2013; Piers et al., 2004; Rosales & Marcos, 2007; Zhu et al., 2011].
Double-pass retinal image quality was first used to evaluate objectively optical quality after
cataract surgery. Barbero et al. [Barbero, 2003] and Guirao et al. [Guirao et al., 2002]
measured for first time in vivo corneal and total aberrations after cataract surgery, showing
the contribution of the IOL to total aberrations and the effect of the corneal incision. Piers et
al. [Piers et al., 2004; Piers et al., 2007] showed that correcting ocular spherical aberration
improved spatial vision in the best-focus position without compromising the subjective
tolerance to defocus. Recently, Barbero et al. [Barbero et al., 2011] designed isoplanatic
aspheric monofocal IOLs for compensating optical aberrations on- and off-axis. To date,
there is also ongoing research in compensating monochromatic and chromatic high order
aberrations; however, chromatic aberration correction might have an effect on depth of focus
and therefore in visual performance [Weeber & Piers, 2012]. In this thesis we make use of
our custom-developed LRT to evaluate in vivo the longitudinal chromatic aberration in
patient implanted with different IOL designs (Chapter VI).
Whereas the description of the optical performance of these patients is interesting, the
evaluation of the pre-operative biometrical parameters and the identification of the sources of
the aberrations (e.g., corneal incision, crystalline lens location and volume, capsule, IOL
location, tilt, decentration, IOL material) are essential for customizing cataract surgery
[Phillips et al., 1988; Rosales & Marcos, 2007]. Recently, Ortiz et al. [Ortiz et al., 2013] for
the first time showed with distortion-corrected OCT a full 3-D quantitative analysis of the
anterior segment geometry of patients before and after cataract surgery, describing with a
single instrument: corneal geometry, corneal thickness, anterior chamber depth/lens position,
lens thickness/IOL thickness, lens tilt and decentration, IOL tilt and decentration.

INTRODUCTION
32
Figure 1.16. OCT 3-D in vivo biometry before and after cataract surgery (left:
crystalline lens; right: IOL).
1.8. Open questions addressed in this thesis
Accurate optical and geometrical characterization of the anterior segment of the eye will not
only increase knowledge on the contribution of every optical element (cornea and crystalline
lens) to ocular optical quality, but will also have an impact on the understanding of the
mechanism of action of different clinical treatments (intracorneal ring segment and
intraocular lenses) for different conditions and/or pathologies of the eye (keratoconus,
presbyopia and cataract).
In this thesis we use novel technology to characterize optically and structurally the anterior
segment of the eye in a series of very prevalent conditions and their surgical corrections.
Keratoconus and ICRS treatment: ICRS is a well-tolerated and effective treatment for
keratoconus, offering in most cases long-term improvement in refractive and keratometric
measurements. However, to date, surgical ICRS nomograms are rather qualitative, based on
few input data and there is no a universal standard protocol for ICRS implantation.
Furthermore, there is little knowledge on the achieved optical quality and the mechanism of
action of the ICRS implanted in the cornea and its effect on both anterior and posterior
corneal surfaces. So, new objective methods for ICRS evaluation are needed in order to
improve the predictability of the surgical technique.
Some unsolved questions are: What is the longitudinal effect of the ICRS on both anterior
and posterior corneal surfaces? Are ICRS stable inside the cornea with time? Does a
redistribution of the corneal thickness occur after ICRS implantation? Does ICRS
implantation delay keratoconus progression? What is the optical quality of keratoconus
patients before and after ICRS implantation?
Accommodation: To date, most of in vivo biometric information in the accommodating
crystalline lens is limited to axial biometry (e.g., crystalline lens thickness) and radius of
curvature, however there is limited information on 3-D crystalline lens shape in the relaxed
and/or accommodated state.

Chapter I. INTRODUCTION
33
A deeper analysis of 3-D lens shape and geometry is crucial for understanding its optical
properties, and will help to understand (1) the compensatory role of the crystalline lens
aberrations to corneal aberrations (in particular, astigmatism and spherical aberration), (2)
the mechanisms of accommodation of the crystalline lens, (3) the role of the crystalline lens
in the development of refractive errors (e.g., myopia), (4) the age-related changes of the
crystalline lens optics and (5) will help to increase the predictability of intraocular lens
(IOL) implantation.
Presbyopia/Cataract and Intraocular lenses: Customized IOL designs are intended to
mimic the natural young crystalline lens properties. Currently, there are different IOL
designs aiming at correcting spherical aberration, compensating chromatic aberration,
providing multifocality and/or restoring accommodation. Thus, accurate biometric anterior
segment parameters and ocular aberrations are crucial for designing the optimum IOL and
for planning the cataract surgery.
However, there are still different open questions: What is the optical quality of IOL patients?
Do the accommodative IOLs perform as expected? Do the accommodative IOLs provide
objective accommodative range? What is the depth-of-focus of patients implanted with IOLs?
To what extent chromatic aberration changes with IOL implantation? What is the role of
chromatic aberration in pseudophakic patients?
1.9. Goals of this thesis
The main purpose of the thesis is the understanding of the relationship between the optical
quality and the geometrical properties in clinical applications for the anterior segment of the
eye.
The specific goals are:
1. To establish Laser Ray Tracing and OCT as validated imaging techniques for
objective measurements of ocular aberrations and the anterior segment geometry of
the eye. To design an external accommodative/fixation channel in both systems and to
establish the in vivo experimental protocols for measuring accommodation in young
subjects and for measuring clinical patients (keratoconus & ICRS, presbyopia and
cataract & A-IOL/IOL).
2. To develop an algorithm for the evaluation of OCT-based corneal aberrations.
Accuracy and possibilities of the methodology will be tested by comparing corneal to
total aberrations (Laser Ray Tracing) in keratoconus subjects (before and after ICRS
implantation).
3. To investigate longitudinally the effect of ICRS on keratoconic corneas by accurate
evaluation of corneal geometrical changes and ICRS monitoring using 3-D
quantitative OCT.
4. To study the optical performance of keratoconus before and after ICRS implantation.

INTRODUCTION
34
5. To study in vivo the topographical changes of the crystalline lens with
accommodation.
6. To evaluate the 3-D IOL position, objective accommodative response, optical
performance and depth of focus in eyes implanted with accommodative IOLs.
7. To measure in vivo and objectively chromatic aberrations in patients implanted with
IOLs.
1.10. Hypothesis
Combining technological advances in aberrometry and OCT imaging techniques with
dedicated processing tools will lead to understand the links between optical and structural
properties in the accommodating eye, as well as in clinical eyes before and after treatment.
These advances will contribute to customize diagnosis and correction.
1.11. Structure of this thesis
The body of this thesis is structured as follows:
The current introductory chapter (Chapter I) presents the background, state of the art and
motivation of the thesis.
Chapter II presents a description of the methods used throughout this thesis and common
to the different studies, including a description of the Laser Ray Tracing (for ocular
aberration measurements), a description of the SD-OCT (for geometrical and aberration
measurements of the anterior segment of the eye), and its calibrations, validation and
processing tools. Finally, a description of the optical quality metrics is also showed.
Chapter III validates the OCT as a corneal aberrometer by comparing corneal aberrations
(OCT) to total aberrations (LRT) on eyes with predominantly corneal aberrations
(keratoconus, before and after ICRS surgery). Also, this chapter presents longitudinal
measurements of keratoconic corneas upon ICRS implantation to characterize the
geometrical properties, anterior and posterior corneal surface shape and the 3-D positioning
of the ICRS with time.
Chapter IV presents in vivo OCT measurements of anterior and posterior crystalline lens
surface elevation in accommodating eyes and shows relationships between anterior segment
surfaces. These measurements allow a better understanding of the contribution of the
different ocular components to overall optical quality of the eye in the relaxed and
accommodated state.
Chapter V presents measurements in vivo of the optical aberrations (LRT) and geometrical
properties (OCT) in patients implanted with the accommodative IOL (Crystalens AO) for
different accommodative demands. Objective measurements of the accommodative response

Chapter I. INTRODUCTION
35
and direct 3-D intraocular visualization will shed light into the mechanism of action of the
accommodative IOLs.
Chapter VI explores the role of longitudinal chromatic aberration (LCA) in eyes implanted
with different IOL models. The impact of LCA on retinal image quality was analyzed to
better understand the optical implications of IOL.
Finally, the Epilogue enumerates the conclusions of the thesis and identifies the new open
questions arising from this work that can be addressed in future work


Chapter II. MATERIAL & METHODS
37
Chapter II. MATERIAL & METHODS
In this chapter we will describe the custom-developed experimental techniques and the
routines used in this thesis. Specifically, the custom-Laser Ray Tracing (LRT) technique
used to measure the ocular aberrations (in Chapters III, V and VI) and the custom SD-OCT
to measure the 3-D geometrical properties of the anterior segment of the eye (in Chapters III,
IV and V).
The author of this thesis has been the main contributor in redesign and modifying those
instruments, implementing fixation/accommodation external channels in the LRT and OCT,
developing specific algorithms for analyzing aberrations with OCT, designing the
experiments and developing the measurement protocols. He led, in collaboration with Carlos
Dorronsoro, Lourdes Llorente and Susana Marcos, the modification, adaptation and
calibration of the LRT system for measuring aberrations with accommodation and in
prevalent anterior segment conditions (such as keratoconus and IOL patients). He also
developed, calibrated and tested the custom-SD OCT system in collaboration with Ireneusz
Grulkowski, Michalina Gora and Maciej Wojtowski from Nicholaus Copernicus University
(Torun, Poland) and Sergio Ortiz, Damian Siedlecki, Enrique Gambra, Alberto de Castro and
Susana Marcos at the Visual Optics and Biophotonics Lab (Madrid, Spain).

MATERIAL & METHODS
38
2.1. Laser Ray Tracing (LRT): ocular aberrations
The experimental measurements of ocular aberrations in this thesis were performed using
Laser Ray Tracing (LRT) technique with new implementations (e.g., accommodation
channel, retinal camera, Badal system). The technique has been described in detail in
previous theses (Lourdes Llorente and Carlos Dorronsoro).
2.1.1. LRT: basic concepts
The LRT technique was first applied to measure ocular aberrations in human eyes in 1997
[Molebny et al., 1997; Navarro & Losada, 1997]. LRT is a double pass technique, since light
is delivered into the eye and the reflection from the retina is captured on a CCD camera.
In the first pass, the pupil of the eye is sequentially sampled with laser pencils parallel to the
optical axis. Each ray is deflected by a specific angle α depending on the slope of the
wavefront at a particular point on the pupil plane (defined by the optical characteristics of the
surfaces it goes through), and therefore will impact the retina at a specific point. In an
aberration-free system, all rays superimpose on the same retinal location. However, when
optical aberrations are present, the rays hit the retina at different positions.
In the second pass, the light is reflected off the retina, exiting the eye through the whole
pupil, and forming an aerial image of the double-pass (on one-and-a-half-pass) point spread
function (PSF) on a plane conjugated with the retina, but tilted an angle α from the chief ray
(entering the eye through the pupil center). Angle α is proportional to the slope of the
wavefront at the point where the incoming beam entered the eye. This image is collected by
a high-resolution cooled CCD camera. Although in this second pass the aberrations of the
eye affect the PSF, its position relative to the reference is not affected (as long as the PSF is
contained within the isoplanatic area of the retina). Therefore, the angles are preserved, and
the ray (transverse) aberration can be computed from the distance between the position
(centroid) of the aerial image corresponding to each pupil location, and that corresponding to
the aerial image for the reference ray (chief ray).
The sampled pupil size is defined by the diameter of the sampling pattern projected on the
pupil, and therefore, can be controlled by software (as long as the pupil is at least of the same
diameter to be programmed).
The reconstruction of the wavefront from the slopes of the wavefront, measured at each
point, is performed considering that the local slope of the wavefront (partial derivatives) is
proportional to the ray aberration.

Chapter II. MATERIAL & METHODS
39
Figure 2.1. Illustration of wavefront slope and image shift through a lens.
The image shift is linerarly proportional to the angle ϕ and the focal length f. With a
theoretical derivation, the image shifts in x and y directions are related to the average
wavefront slopes in x and y directions, respectively, as:
Equation 2.1: ∆𝑥′ =1
𝑅𝑝
𝜕𝑊(𝜉, 𝜂)
𝜕𝜉; ∆𝑦′ =
1
𝑅𝑝
𝜕𝑊(𝜉, 𝜂)
𝜕𝜂
where ξ=ξ/Rp and η=η/ Rp are dimensionless canonical pupil coordinates and Rp is the
pupil radius.
The wave aberrations are reconstructed by integrating the slopes of an array of beams
intersecting the eye´s entrance pupil. Usually, least-square estimation is used for phase
reconstruction. A modal reconstruction based on the expansion of the derivatives of the wave
aberration as a linear combination of a set of basic functions (the derivatives of Zernike
polynomial expansion) was used for analyzing wavefront aberrations.
2.1.2. LRT: setup
The LRT consist of three channels:
(1) Illumination channel (incoming rays), with two possible light sources (green: 532 nm;
infrared: 786 nm).
(2) Pupil and Retinal channel (outgoing). Pupil camera captures the corresponding image of
the eye´s pupil simultaneously with the retinal spots on the retinal CCD. Retinal camera
captures the light reflected back from the retina
(3) Accommodation/Fixation channel. An open-field external fixation channel was
incorporated to stimulate accommodation. The subjects viewed the stimulus monocularly
and the desired accommodative demand was produced by changing the fixation distance
(allowing static measurements of aberrations under steady accommodation).

MATERIAL & METHODS
40
Figure 2.2. Scheme of the custom-LRT at the VioBio lab (Instituto de Óptica
“Daza de Valdés”).
The light source can be selected between two diode lasers emitting in green (532 nm;
Brimrose, Baltimore, MA, USA) and infrared wavelengths (786 nm; Schäfter+Kirchhoff,
Hamburg, Germany). Both lasers are attenuated below safety limits using neutral density
filters: the maximum permitted exposure power thresholds for 532 nm and 786 nm are 6.9
µW and 7.6 µW respectively. Exposure times for a typical run with 37 samples were about
1.5 seconds, being controlled by an electronic shutter (Vincent Associates, Rochester, NY,
USA).
The XY scanner (mod. 6210, Cambridge Technologies, Lexington, USA) consists of two
rotating mirrors that deflect the incoming unexpanded laser pencil in such a way that in
combination with collimating lenses (L1 and L2, f’=50.8 mm) compose the sequential
sample pattern. Due to the distance between the two mirrors (~5 mm), some astigmatism is
induced in the system, and therefore a trial lens attached to the collimating lens (2.25 D at 90
deg) is used to compensate this astigmatism. Lens L1 (f’=50.8 mm) forms the image of the
laser waist on the scanner in order to obtain the smallest sampling aperture on the pupil plane
(~400 µm). Different sampling patterns can be configured in the scanner. In this thesis we
only uses the hexagonal pattern (37 rays).
Channels 1 and 2 share a Badal system for defocus compensation. The Badal system is
formed by lenses (L3 and L4; f’=100 mm; that form an afocal system of magnification x1)
and mirrors (M1, bends the optical path to obtain a more compact device, and M2 and M3,
compose the focusing block). The Badal system allows changing the vergence of the rays
(and hence defocus) without changing magnification (by moving the mirrors instead of the
lenses), ensuring therefore that the pupil magnification or the sampling density will not be
affected by defocus correction. Spherical error correction ranging from -12 D to +12 D can
be induced with this system to allow measurements on keratoconic eyes. P, marks the
position of a pupil conjugate planes; and R, marks the position of retinal conjugate planes.
The versatility of the LRT and its dynamic range allow us measurements on keratoconic
corneas

Chapter II. MATERIAL & METHODS
41
The light reflected off the retina is collected by a cooled highly sensitive CCD camera (12
bits, 30 frames per second with 2x2 binning, 1024x1024 pixels, pixel size: 14 µm x 14 µm,
nominal maximum quantum efficiency: 20% (700 nm). Model 1M15, Dalsa, Waterloo,
Canada), conjugate to the eye retinal plane (retinal channel). In addition to record aerial
images, this camera can display them in real time allowing to find objectively the best focus
position while assessing the aerial image for a centered ray. During the measurement, the
retinal camera is synchronized with the scanner and the pupil camera.
In the pupil channel, a CCD (8 bits, 60 Hz (video), 646 (horizontal) x 485 (vertical) pixels,
pixel size: 7.4 µm x 7.4 µm. Model XC-55, Sony Corp., Tokyo, Japan) continuously
monitors the pupil and records pupil images during the measurement. Pupil monitoring prior
to the measurement helps to verify that everything is ready for the measurement, assisted by
marks superimposed on the pupil image in the control program: pupil located on the
corresponding plane (pupil edges focused), alignment of the center of the pupil and the
optical system (centration cross), suitability of the sampling pattern to the pupil diameter
(small circumferences of different diameters to estimate pupil size). This pupil control
becomes critical for avoiding back-reflected light from the edges of the ICRS and the IOL.
Figure 2.3. Custom-LRT at the VioBio lab (Instituto de Óptica “Daza de Valdés”).
2.1.3. LRT: control and analysis software
The control and analysis software used in this thesis was developed previously in our group
by Lourdes Llorente and Carlos Dorronsoro theses. The control software development was
written in Visual Basic (Microsoft Corp., USA) combined with Matlab (Mathworks, Natik,
MA) scripts.
The system control software operates and synchronizes the different elements (scanner,
shutter and cameras) for the measurement, assisting in some other operations such as

MATERIAL & METHODS
42
alignment of the pupil and the optical system. Measurements, calibration parameters and
measurement conditions are saved in a structured way using excel files.
The software to estimate the ocular aberrations from the set of aerial images was developed
in Matlab (Mathworks, Natik, MA). In brief, raw images are processed in order to isolate
each aerial image and locate the corresponding centroid. Then, the relative distance of each
centroid to that of the central ray is calculated (transverse aberration), and the wave
aberration is then estimated by fitting the transverse aberration corresponding to each
sampled point to the derivatives of the Zernike polynomials, using a least squares method.
2.1.4. LRT: calibration
Two parameters (offset and slope) driving each scanner response to digital signals were set
up in order to use image plane coordinates instead of electrical voltages. The offset was
chosen to obtain a laser beam aligned with the optical axis of the setup when coordinates
(0,0) were selected. The slope, or ratio scanner_voltage / laser_displacement, it was selected
to obtain the displacement of the laser spot necessary to obtain the desired pattern. For this
purpose, a screen with a square grid pattern (1 mm squares) was placed at the pupil plane
with the shutter open to see both the spot and the grid. The ratio scanner_voltage /
laser_displacement was calculated as 1/10 of the voltage needed to move 10 mm the laser
spot impacting on the screen (as observed by the camera) and taking the grid as a reference.
The equivalence between pixels and deviation angles in the retinal camera images was
determined by imaging a metal caliper in a plane conjugate to the sensor, i.e. at the focal
point of lens L3. We estimated that each pixel in the image subtends 0.37 mrad. This value is
used in the processing program to compute transverse ray aberration from the deviations of
the spots in the CCD.
The pupil camera is used to ensure alignment of the eye pupil with the optical axis of the
system, to visualize the sampling pattern superimposed to the pupil, and to assess distances,
such as the pupil diameter or pupil misalignment. We ensured that the centration reference is
superimposed with the optical axis, by placing a screen at the pupil position and imaging a
laser beam with the scanner is in its centered position. The position of the spot in the image
is calibrated as the instrument axis. We calibrated the scale (equivalence between pixels and
millimeters at the pupil plane of the camera) by imaging a graph paper screen.
As previously mentioned, some astigmatism is induced by the scanner due to the distance
between its two rotating mirrors. The theoretical astigmatism induced due to the distance
between the mirrors of the scanner (d=4.9 mm) depends also on the focal length of the
collimated lens used (f’=50.8 mm).
Equation 2.2: 𝐴𝑠𝑡𝑖𝑔𝑚𝑎𝑡𝑖𝑠𝑚 𝑠𝑐𝑎𝑛𝑛𝑒𝑟 = 𝑑
(𝑓′+𝑑
2)(𝑓′−
𝑑
2)
= 1.88 𝐷
Some astigmatism can also be introduced by other elements of the setup, such as lenses not
completely perpendicular to the optical axis. We then estimated the residual astigmatism by
measuring the aberrations of a non-aberrated artificial eye. We computed the value of the

Chapter II. MATERIAL & METHODS
43
astigmatism from the coefficients Z2-2
and Z22 (oblique and perpendicular astigmatism
respectively) using the equation:
Equation 2.3: J0 =−2√6Z2
2
R2 ; J45 =−2√6Z2
−2
R2 ; C = −2√J02 + J45
2 ; α =1
2arctan
J45
J0
where R is the pupil radius, Z22 the H/V (horizontal/vertical) astigmatism (Zernike
coefficient) and Z2-2
the oblique astigmatism (Zernike coefficient).
A cylindrical trial lens of -2.25 D (axis at 90 deg), placed right after the collimation lens (L2)
of the scanner minimized the astigmatism.
We verified that the sampling pattern selected (37 spot positions) was precisely delivered, by
projecting the beams on a screen at the pupillary plane and analyzing the images captured by
the pupil camera. The mean deviation from the expected position across all 37 spot positions
was 0.05±0.04 mm (0.08±0.05 mm and 0.03±0.02 mm for X and Y coordinates
respectively). These differences are smaller than those typically resulting in real eye
measurements due to motion artifacts.
In addition, to make sure that the processing program was correct; we confirmed that when
computing transverse ray aberrations from the wave aberration (obtained after processing the
experimental data), the corresponding spot diagram position matched the spot diagram
obtained experimentally.
The Badal system included in the setup to compensate defocus was also calibrated. Moving
the translational stage with two mirrors (focusing block) introduces a change in vergence
that, for a focal length of 100 mm for each Badal lens, corresponds to 0.2 D/mm (1 D each 5
mm). The 0 D position in the focusing block scale was determined using a non-aberrated
emmetropic artificial eye. Trial lenses in front of the artificial eye were used to check the
compensation of defocus by the focusing block.
We also measured the aberrations of the nominally aberration-free artificial eye. For 3rd
and
higher-order aberrations we found that the RMS departure of the wavefront from the
reference sphere was much less than λ/14 (Marèchal criterion). For 2nd
order aberrations
(defocus and astigmatism), the residual values were subtracted from the measured values.
2.2. Spectral Domain Optical Coherence Tomography
2.2.1. SD-OCT: custom-setup
The SD-OCT system consist of roughly the same components: (1) light source, (2)
interferometer, (3) galvanic scanning mirrors, (4) digital capture system, (5) processing
system, and (6) focusing optics. A schematic diagram of the SD-OCT system used in this
thesis can be seen in Figure 2.4.

MATERIAL & METHODS
44
Figure 2.4. Experimental custom SD-OCT set-up, components: SLD
superluminiscent diode, OI-optical isolator, FC- 80:20 Fiber coupler, PC-
polarization controller, NDF-Neutral density filter, DC-dispersion compensator,
DM-Dichroic mirror, T-Target, HDG-holographic volume diffraction grating,
CMOS linescan camera, COMP computer.
The set-up is based on a fiber-optics Michelson interferometer configuration with a
superluminescent diode SLD (λ0 = 840 nm, ∆λ = 50 nm; Superlum, Ireland) as a light source,
followed by an optical isolator (OI) joined by a fiber mate to a 80:20 fiber coupler (FC) in
order to avoid the backreflected light from the reference and sample arms returning to the
SLD. The light is split by the fiber coupler in two arms (reference and sample arms).
The reference arm consists of a polarization controller (PC) to optimize detection
performance, a converging lens (L1) to produce a collimated beam, a neutral density filter
(NDF) to increase or decrease the power of light in the reference arm, and a converging lens
(L2) that focuses the light on the mirror (M).
The sample arm consists of a converging lens (L3) that collimates the light onto a XY
galvanometric optical scanner to produce the horizontal/vertical raster of the sample, and
finally a converging lens of 75 mm of focal length (L4) to collimate the chief rays of the
beams and to focus the irradiance impinging the sample.
The light backreflected from both reference and sample arms is then recombined by the fiber
coupler and it is led to the detection unit, which consists of a converging lens (L5, f’=XX
mm) to collimate the light.
Finally, the detection arm of the OCT is composed by a spectrometer consisting of
diffraction grating (plus two converging lenses, L6 and L7, to collimate the light) and a 12-
bit line-scan CMOS camera with 4096 pixels (Basler sprint spL4096-140k; Basler AG,
Germany).
The maximum effective acquisition speed of this system is up to 150000 A-Scans/s, although
the typical speed used for the experiments in this thesis was 25000 A-Scans/s, since this
configuration showed a very good balance between acquisition speed and resolution. The
axial range of the instrument is 7 mm, and the theoretical axial resolution 3.4 µm in air. The
signal to noise ratio (SNR) of the instrument was calibrated to be 97 dB.

Chapter II. MATERIAL & METHODS
45
Figure 2.5. Custom SD-OCT at the VioBio lab (Instituto de Óptica “Daza de
Valdés”).
By performing multiple low coherence interferometry measurements at different lateral
coordinates on a sample, a three-dimensional cross-sectional image of the scattering
amplitude can be constructed.
Figure 2.6. Left: 1-D, Axial (Z) scanning (Illustration of an A-Scan belonging to
the corneal surface). Centre: 2-D, Axial (Z) scanning and transverse (X) scanning
(Illustration of a B-Scan showing the cornea, iris and the anterior lens surface).
Right: 3-D, Axial (Z) scanning and XY scanning (Illustration of the corneal, iris
and anterior lens surface volume).
For measuring purposes, an additional beam splitter was placed in the sample arm in order to
incorporate the accommodation/fixation channel. In this channel, a Badal system mounted on
a motorized stage (VXM-1, Velmex) was used for compensating spherical refractive errors
and for inducing accommodative demands. The Badal system is composed by two
achromatic doublets of equal focal lengths (f´=150 mm), that form an afocal system of
magnification x1, and two flat mirrors, which can be moved to change the optical path
between the lenses. Vergence was changed with the Badal system from -10 D to 10 D and

MATERIAL & METHODS
46
compensated with trial lenses placed on a pupil plane. In all conditions, the image remained
in focus (in 1-D steps). A VisualBasic.Net software program wrote by Enrique Gambra to
control the diopter steps in the Badal system.
The visual fixation stimulus is presented on an external screen controlled by a picoprojector.
It consists of a white Snellen E (20/25 visual acuity) over a black background. Firstly, the
target is aligned with the OCT axis and, secondly, for measuring in the line of sight we
developed a script written in Matlab able to move the target each 0.5 pixels in the horizontal
and vertical meridians.
Figure 2.7. External accommodation and fixation channel implemented on the
OCT. Illustration of the moving stimulus for further eye alignment.
2.2.2. SD-OCT: distortion correction
OCT images are generally subject to distortions: (1) fan distortion, arising from the scanning
architecture, and resulting in a combination of geometrical aberrations, including field
distortion, astigmatism and spherical aberration and (2) optical distortion, arising from
refraction at the optical surfaces. Due to these distortions, OCT images need to be corrected
for quantification. Fan (following instrument calibration) and optical distortion (through
preceding surfaces) are corrected using 3-D ray tracing analysis. To correct the distortion in
the images acquired in this thesis we have used an algorithm developed previously in our
laboratory by Sergio Ortiz [Ortiz et al., 2010; Ortiz et al., 2011; Ortiz et al., 2009b] and
modified by Eduardo Martinez-Enriquez [Pérez-Merino et al., 2015].
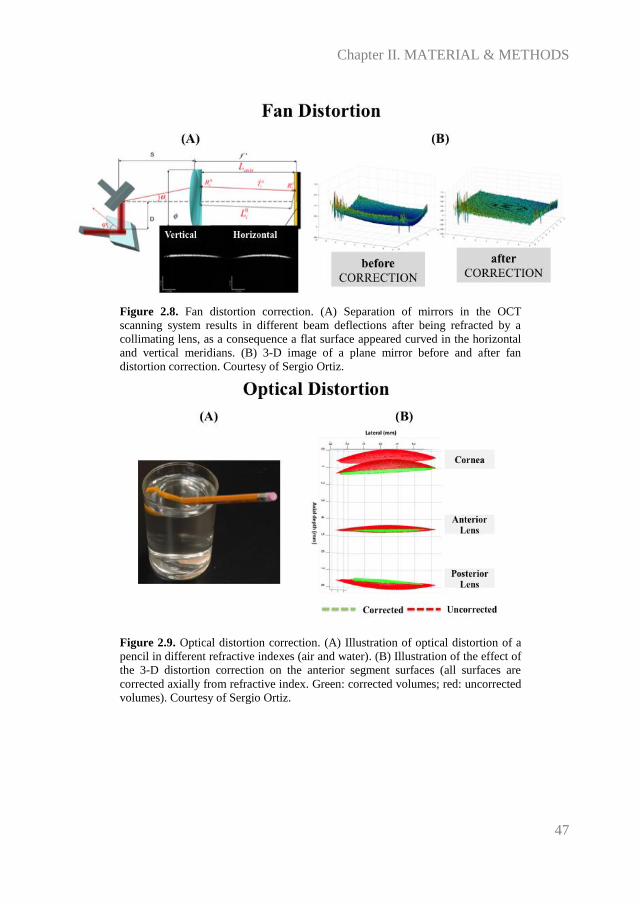
Chapter II. MATERIAL & METHODS
47
Figure 2.8. Fan distortion correction. (A) Separation of mirrors in the OCT
scanning system results in different beam deflections after being refracted by a
collimating lens, as a consequence a flat surface appeared curved in the horizontal
and vertical meridians. (B) 3-D image of a plane mirror before and after fan
distortion correction. Courtesy of Sergio Ortiz.
Figure 2.9. Optical distortion correction. (A) Illustration of optical distortion of a
pencil in different refractive indexes (air and water). (B) Illustration of the effect of
the 3-D distortion correction on the anterior segment surfaces (all surfaces are
corrected axially from refractive index. Green: corrected volumes; red: uncorrected
volumes). Courtesy of Sergio Ortiz.

MATERIAL & METHODS
48
Figure 2.10. Validation of fan distortion correction in a normal subjetc (anterior
corneal elevation map with OCT-distortion correction and Pentacam).
2.2.3. SD-OCT: image processing
The 3-D image processing tools developed to obtain quantitative information of the anterior
chamber structures have been described by Ortiz et al. in prior publications [Ortiz et al.,
2012a; Ortiz et al., 2013; Ortiz et al., 2012b; Ortiz et al., 2011]. Automatic image processing
analysis includes segmentation, data processing and quantification of the anterior segment
3-D volumes. The corneal refractive index was taken as 1.376, the aqueous humor refractive
index as 1.336, the crystalline lens refractive index was obtained from the age-dependent
average refractive index expression derived by Uhlhorn et al. [Uhlhorn et al., 2008], in
Chapter IV, and the clinical solutions refractive indices (ICRS, in Chapter III, and
accommodative IOL, in Chapter V) were obtained from manufacturers. The routines were
written in Matlab.
The algorithm is summarized in three different steps:
(1) 3-D image processing (Volume clustering and multilayer segmentation):
Volumes of connected points were identified as classes. The classes with a volume size
below a certain threshold were eliminated. The threshold was estimated as a certain
percentile within the range of 95-99% of the total number of connected points. After
application of volume clustering, the number of classes was further reduced and the larger
volumes (cornea, iris, crystalline lens, ICRS, IOL) were automatically classified. Once the
volumes were classified, an algorithm based on first derivative boundary region
identification extracted the position of the peaks of every A-scan and they were sorted by
position and intensity.

Chapter II. MATERIAL & METHODS
49
Figure 2.11. Illustration of the segmentation process.
(2). 3-D anterior segment data processing
Pupil center reference:
The pupil center was used to define the center of optical zone, and its center was considered
as a fixed reference instead the corneal apex across measurements (pre-op and post-op). The
pupil center was efficiently calculated from the clustered iris volume, by collapsing the cloud
of points onto a 2-D image. The pupil center (lateral coordinates, Xpc and Ypc) and radii (Rx
and Ry) were obtained from an ellipse fitting of the segmented edges using a Sobel edge
detector. The evaluation of the plane at the estimated pupil lateral coordinates provided the
axial component of the pupil center Zpc: Zpc=-(AXpc+ BYpc+D)/C. The coefficients A, B,
C and D allows the calculation of the normal vector to the pupil plane, which provided the
tilt angle of this plane with respect to the OCT coordinate system.
Specular reflection reference:
The specular reflection of corneal and lens/IOL images was also used as a fixed reference for
further merging 3-D volumes.
Merging 3-D volumes:
We used the pupil and specular reflection points for merging anterior segment volumes.
First, the corneal image was inverted, since for efficiency in the OCT focus range it was
obtained in the opposite side of the Fourier transform. Then, the 3-D volumes of cornea/iris
and posterior lens/iris were shifted to the pupil center reference with help of the specular
reflections and rotated to superimpose the characteristic vectors of the corresponding pupil
plane to those of the anterior lens-IOL/iris.

MATERIAL & METHODS
50
Figure 2.12. Illustration of the acquisition of an individual data collection of three
volume acquisitions and merging to obtain a 3-D full anterior segment volume.
Distortion corrections (fan and optical):
Fan distortion correction was applied for the anterior cornea, and both fan and optical
distortion corrections were applied for the multiple surfaces after the anterior corneal
surface.
Geometrical distances calculation:
The optical distances were calculated by direct subtraction of the coordinates of the different
surfaces.
(3) Surface analysis.
Surface fitting: sphere, ellipsoid, conicoid
Once the surfaces have been corrected from distortion, data were expressed in Euclidean
coordinates and they were fitted by standard functions.
Sphere: from the sphere we obtained the radius (a) and the center of the sphere (x0, y0, z0).
Equation 2.4: (𝑥 − 𝑥0)2 + (𝑦 − 𝑦0)2 + (𝑧 − 𝑧0)2 = 𝑎2

Chapter II. MATERIAL & METHODS
51
Ellipsoid: from the ellipsoid we obtained 3 radii of curvature (a, b, c) and the center of the
ellipsoid (x0, y0, z0).
Equation 2.5: (𝑥−𝑥0)2
𝑎2 +(𝑦−𝑦0)2
𝑏2 +(𝑧−𝑧0)2
𝑐2 = 1
Conicoid: we assumed the ellipsoid definition, with a=b,
Equation 2.6: (𝑥 − 𝑥0)2 + (𝑦 − 𝑦0)2 − 2(𝑧 − 𝑧0)𝑅 + (𝑄 + 1)(𝑧 − 𝑧0)2 = 0
where (x,y) is the horizontal and vertical coordinates relative to their origin (x0,y0), and z
and z0 are the axial and axial origin coordinates. The fitting parameters are R and Q. R is
the radius, R=a2/c; Q is the conic constant, Q=-(1-b
2/c
2).
Elevation and pachymetry maps
The maps were displayed in a square grid of 100x100 points in a 4 to 6-mm diameter, with
respect to the pupil center. This representation did not require interpolation of the data, as the
data were collected as a dense collection of B-scans, rather than across meridians.
The measured elevation was represented as the difference of corneal elevation from the
reference sphere, where warm colors represented points that are higher than the reference
surface and cool colors represented points below the reference. The pachymetry maps were
calculated from direct subtraction of the posterior surface from the anterior surface, after
distortion correction, and were represented using the HSV color map.
Figure 2.13. Illustration of the calculation of a topographic map as a direct
subtraction of the elevation data minus the best fitted sphere.

MATERIAL & METHODS
52
Figure 2.14. Illustration of the elevation map in the anterior and posterior corneal
surfaces and pachymetry in a keratoconic cornea before and after ICRS surgery.
Anterior segment biometry for clinical applications
The 3-D Euclidean distances were obtained by direct subtraction of the apices coordinates
obtained from the fittings of the surfaces to spheres after optical distortion correction.
Crystalline lens/IOL decentration was defined as the lateral Euclidean distance between the
crystalline lens/IOL center and the pupil center. Crystalline lens/IOL tilt was defined as the
angle between the axis of the crystalline lens/IOL and the pupillary axis. The crystalline
lens/IOL axis was defined as the vector that joins the apices of the anterior and posterior
crystalline lens/IOL surfaces. The pupillary axis was defined as the vector that joins the
center of curvature of the anterior cornea and the pupil center. The angle between axes was
obtained by the scalar product of both vectors.

Chapter II. MATERIAL & METHODS
53
Figure 2.15. Illustration of the lens tilt evaluation: Pre-cataract surgery (a), and
post-cataract surgery with IOL implantation (b). Vector P (in blue) is the pupillary
axis, and L (in purple) is the Lens/IOL axis.
3-D ICRS positioning was described by the following parameters: 3-D ICRS depth (defined
as the distance between the center of mass of the ICRS and the anterior corneal surface), and
ICRS tilt (defined as the angle between the ICRS axis, normal to the ICRS plane, and the
pupillary axis, normal to the pupil plane).
Figure 2.16. (A) Definition of the pupillary plane (and axis), ICRS plane (and axis)
and ICRS tilt. (B) Sign convention ICRS tilt around the y-axis, for OD and OS. (C)
Sign convention of ICRS tilt around the x-axis.

MATERIAL & METHODS
54
2.2.4. OCT-based corneal aberrometry
Corneal and ocular wave aberrations were computed directly from the ray tracing analysis.
The elevation data obtained from OCT distortion-corrected corneal surfaces were fitted by
Zernike polynomial expansion (up to 6th
order) and exported to ZEMAX (Radiant ZEMAX;
Focus software, Tucson, Arizona, USA) for virtual ray tracing analysis, by using a finite
difference method to evaluate the normals to the surface.
A complete ray tracing procedure provides a discrete set of local measurements of the wave
aberration. ZEMAX uses a modal reconstruction with a standard least squares algorithm
fitting to a Zernike expansion. Matlab was used to create a suitable input file into ZEMAX
for calculating corneal wavefront aberrations (ZEMAX DDE toolbox).
The object (light source) is set at infinity. The point source at infinity will be best focused on
the retinal surface after iteration (we use the best focus position as is the position that
minimizes the root-mean-square wavefront error). Refractive indices of 1.376 and 1.334
were used for the cornea and aqueous humor, respectively. Wave aberrations were calculated
for IR LRT-wavelength (786 nm) in the pupil plane, placed at 3.47 mm from the anterior
corneal surface (in keratoconic corneas), by tracing an array of 64x64 collimated through a
1-surface (anterior cornea only) or 2-surface (anterior and posterior cornea, separated by
corneal thickness) eye model. In the 1-surface model, the refractive index after the anterior
corneal surface was set to 1.334. The contribution of the posterior corneal surface was
obtained from direct subtraction of the anterior corneal surface aberrations from corneal
aberrations. Also, a 4-surface eye model (anterior and posterior cornea, anterior and posterior
lens/IOL, separated by corneal thickness, ACD and lens/IOL thickness) was developed.
The merit function is defined by the operand “ZERN”. The parameters are set as Term =
1,2,3… in the order of Zernike coefficients in ZEMAX (by previous conversion from OSA
to ZEMAX Zernike notation), Samp = 2 (pupil sampling = 64x64), field = 1 (only one field
is set in our calculations), Type = 1 (Zernike Standard Coefficient), and Zernike coefficients
of the wavefront aberrations are input at the column of the “target” values (the weight of
each coefficient is set equally). Once the merit functions were set, the optimization is
performed.
Figure 2.17. Illustration of the computation of corneal aberrations from OCT data.

Chapter II. MATERIAL & METHODS
55
Figure 2.18. Illustration of the computation of total aberrations, PSF and MTF
from OCT data (Zernike coefficients of the corneal and lens surfaces and axial
distance, left eye). Top: left eye of the author; Bottom: keratoconus eye with IOL.

MATERIAL & METHODS
56
2.3. Optical quality metrics
We specified the optical quality of the eye in two different reference planes, defining: pupil
plane metrics (e.g., Root Mean Square, RMS) and image plane metrics (e.g., Point Spread
Function (PSF), Optical Transfer Function (OTF), Modulation Transfer Function (MTF),
Strehl Ratio). Because of visual performance is a combined effect of retinal imaging and
visual perception, the image plane metrics are in general better than the pupil plane metrics
[Applegate et al., 2006; Cheng et al., 2003a; Cheng et al., 2004].
In this thesis we described the optical quality by using the following metrics: RMS, PSF,
OTF, MTF, Strehl Ratio and Visual Strehl.
Root Mean Square (RMS) measures the deviation of the wavefront from a perfect plane
wave. RMS is computed directly from the Zernike coefficients. The calculation of RMS
error can be done either individually or grouped arbitrarily (coma, trefoil and spherical,
among others). A flat wavefront has a RMS = 0, while an aberrated wavefront has a RMS >
0.
Equation 2.7: 𝑅𝑀𝑆 = √∑ 𝑐𝑛𝑚 2
𝑛,𝑚
where 𝑐𝑛𝑚 is the Zernike coefficient corresponding to the order n and frequency m.
Point Spread Function (PSF) is the two dimensional distribution of light in the image plane,
i.e. is the image of a point object through the optical system. The PSF for a perfect optical
system (only limited by diffraction) is the Airy disk. The presence of ocular aberrations
causes the light to spread out over an area and the corresponding PSF is considerably broader
than the aberration-free PSF for the same pupil size, particularly for pupils higher than 3
mm.
Basically, the PSF is calculated as the squared magnitude of the inverse Fourier transform of
the pupil function. The pupil function, g(x’,y’), defines how light passes through the pupil
(i.e. wavefront aberration and amplitude function weighted with the styles-Crawford effect)
and it may be defined as 1 within the pupil area and 0 elsewhere.
Equation 2.8: Pupil function: 𝑔(𝑥′, 𝑦′) = 𝑝(𝑥′, 𝑦′) exp(𝑖2𝜋
𝜆 𝑊(𝑥, 𝑦))
where p(x’,y’) is a circle that defines the aperture of the eye, w(x’,y’) is the wavefront
aberration of the subject and λ the wavelength used for calculations (550 nm)
Equation 2.9: 𝑃𝑆𝐹 = |𝐹𝑇(𝑔(𝑥′, 𝑦′))|2
Optical Transfer Function (OTF), is the frequency response of an optical system. OTF is the
autocorrelation of the pupil function, or equivalently, the Fourier transform of the PSF. The
OTF is a complex function that measures the loss in contrast in the image of a sinusoidal
target, as well as any phase shifts. The modulus of the OTF is the Modulation Transfer

Chapter II. MATERIAL & METHODS
57
Function (MTF), which represents the decrease in the contrast as a function of the spatial
frequency.
Equation 2.10: 𝑂𝑇𝐹 = 𝐹𝑇(𝑃𝑆𝐹)
Equation 2.11: MTF = |𝑂𝑇𝐹|
Strehl Ratio, is a scalar metric used to describe the quality of the PSF in an eye. Basically,
the Strehl ratio describes the reduction in the peak power of the point image.
In the spatial domain, it can be calculated directly from the PSF. It is defined as the
maximum value of the PSF in the presence of aberrations, normalized by the maximum of
the diffraction limited PSF for the same pupil size (i.e., is the ratio of the PSF irradiance
value at the ideal image point of an aberrated optical system to the PSF irradiance value at
the ideal image point for an equivalent diffraction-limited system). The Strehl Ratio ranges
from 0 to 1, with 1 defining a perfect optical system.
In the frequency domain, the Strehl Ratio is computed as the volume under the MTF of an
aberrated system normalized by the diffraction-limited MTF, for the same pupil diameter.
Equation 2.12: 𝑆𝑡𝑟𝑒ℎ𝑙 𝑅𝑎𝑡𝑖𝑜 = 𝑃𝑆𝐹𝑎𝑏𝑒𝑟𝑟𝑎𝑡𝑒𝑑(𝑥′,𝑦′)
𝑃𝑆𝐹𝑖𝑑𝑒𝑎𝑙(𝑥′,𝑦′)
As the Strehl Ratio includes in the calculation regions of the MTF with spatial frequencies
beyond those relevant to the visual system, a new metric was introduced to adapt the
definition to visual optics (Visual Strehl).
The Visual Strehl is computed as the volume under the visual MTF, obtained from the
overlapping of the MTF with the inverse of a general neural transfer function, normalized to
diffraction limit.
The neural sensitivity, function of the spatial frequency, is a common measurement of the
neural performance. In a similar way as the optical MTF, it is possible to define and measure
the neural MTF, and the product of the neural and optical MTFs gives the Contrast
Sensitivity Function (CSF) of the eye.
Equation 2.13: CSF = 𝑀𝑇𝐹𝑜𝑝𝑡𝑖𝑐𝑎𝑙 ∗ 𝑀𝑇𝐹𝑛𝑒𝑢𝑟𝑎𝑙
Equation 2.14: 𝑉𝑆𝑂𝑇𝐹 = ∫ ∫ 𝐶𝑆𝐹𝑁
∞−∞ (𝑓𝑥,𝑓𝑦)∗|𝑅𝑒{𝑂𝑇𝐹(𝑓𝑥,𝑓𝑦)}|𝑑𝑓𝑥𝑑𝑓𝑦
∞−∞
∫ ∫ 𝐶𝑆𝐹𝑁∞
−∞ (𝑓𝑥,𝑓𝑦)∗{𝑂𝑇𝐹(𝑓𝑥,𝑓𝑦)}𝑑𝑓𝑥𝑑𝑓𝑦∞−∞
where OTF(fx,fy) denotes the diffraction-limited OTF, CSFN(fx,fy) is the neural contrast
sensitivity function, and (fx,fy) are the spatial frequency coordinates. Here, the VSOTF
was based on calculated OTF across all spatial frequencies.
In several reports in this thesis, we have used Visual Strehl ratio as a metric, as it has been
shown to hold the highest correlation variance against subjective acuity [Cheng et al.,
2003b].

MATERIAL & METHODS
58
Finally, depth-of-focus was estimated from through-focus Visual Strehl (in 0.125 D defocus
steps). All computations considered high-order aberrations (HOAs) up to 6th
order.
2.4. Subjects and protocol in measurements (LRT and OCT)
The procedures involving subjects were reviewed and approved by Institutional Bioethical
Committees of the Consejo Superior de Investigaciones Científicas and the Fundación
Jiménez Díaz and met the tenets of the Declaration of Helsinki. All patients were fully
informed and understood and signed an informed consent before enrolment in the study.
Most of the LRT and OCT measurements were presented in this thesis were performed under
pupil dilation (with one drop of tropicamide 1% in Chapter III and VI, and with one drop of
phenylephrine in Chapter IV and V).
All subjects in the present thesis were selected patients from the Fundación Jiménez Díaz
(Madrid, Spain) or normal volunteers. All participating subjects had a previous eye
examination in the Fundación Jiménez Díaz. A total of 64 patients were measured in this
thesis, distributed as follows:
- Chapter III (LRT + OCT): Nineteen keratoconic patients (before and after ICRS
surgery) (19 eyes). OCT measurements were done in all subjects. LRT
measurements were done in 8 eyes.
- Chapter IV (OCT): Seven normal young subjects (9 eyes).
- Chapter V (LRT + OCT): Eleven cataract patients (22 eyes) and nine normal young
subjects (17 eyes). LRT and OCT measurements were done in all subjects.
- Chapter VI (LRT): Eighteen cataract patients (18 eyes).
In both LRT and OCT systems, measurements were acquired while the patient fixated at the
stimulus (Snellen E or Maltese cross) presented on the fixation/accommodation channel at
the best focus (the Badal system was first used to compensate the residual refractive error of
the subject). Patients were stabilized by means of a bite bar and asked to fixate their gaze on
the stimulus.
Set of images was captured approximately five seconds after blinking. And at least five
repeated measurements were collected in each condition, and processed independently.
OCT measurements were collected with two 3-D configurations:
(1) Chapter III and V: 10x12-mm area, and consisted of a collection of 50 B-Scans
composed by 360 A-Scans. The total acquisition time of a 3D data set was 0.72 s.
(2) Chapter IV: 10x10-mm area, and consisted of a collection of 50 B-Scans composed
by 300 A-Scans. The total acquisition time of a 3D data set was 0.6 s.
The images of the cornea were acquired centered at the specular reflection, which was used
as a reference in the image acquisition throughout the different sessions. And, additionally,
the position of the fixating letters was moved across the display until the cornea and iris was

Chapter II. MATERIAL & METHODS
59
aligned with the optical axis of the instrument, for ensuring a line-of-sight measurement
reference (as it was described in Figure 2.7).
In OCT, the specifications of the spectrometer and light source do not allow sufficient axial
range to capture all anterior segment surfaces in a single acquisition. To solve that, for IOL
(Chapter V): two sets of 3-D images were captured sequentially: (1) cornea and (2) IOL, and
for crystalline lens (Chapter IV): three sets of 3-D images were captured sequentially at 5
seconds after blinking: (1) cornea, (2) anterior lens and (3) posterior lens, rapidly shifting
axially the plane of focus; all 3D sets of data contained the iris (as it was described in Figure
2.12).
OCT images containing artifacts (i.e., eyelids), which precluded corneal and lens surface
analysis within the optical zone were excluded.
LRT measurements last approximately 1.5 s for an entire typical run. A sampling pattern
consisted of 37 entry positions arranged in a hexagonal configuration within the pupil. The
eye´s pupil was monitored during measurements with a CCD camera conjugate to the pupil,
in order to ensure the correct alignment between the pupil center and the optical axis of the
setup, and therefore a line-of-sight measurement reference. Pupil monitoring during the
measurement allows to verify that no abnormalities, such as blinking, motion artifacts or tear
problems occurred and to ensure the eye´s stability.
In addition to LRT and OCT other measurements were typically conducted on patients: axial
length and anterior chamber depth with an IOL Master (Carl Zeiss, Germany), corneal
topography with the Pentacam (Oculus, Germany) and autorefraction with an automatic
refractometer (Model 597, Humphrey-Zeiss).


Chapter III. OCT-based Topography and Aberrometry in Keratoconus with ICRS
61
Chapter III. KERATOCONUS AND ICRS
OCT-based Topography and Aberrometry in
Keratoconus with Intracorneal Ring Segments
This chapter is based on the following publications:
1. Quantitative OCT-based Longitudinal Evaluation of Intracorneal Ring Segment
Implantation in Keratoconus, by P. Pérez-Merino, S. Ortiz, N. Alejandre, I.
Jimenez-Alfaro and S. Marcos, in Investigative Ophthalmology and Visual Science
(2013).
2. Ocular and Optical Coherence Tomography-Based Corneal Aberrometry in
Keratoconic Eyes Treated by Intracorneal Ring Segments, by P. Pérez-Merino, S.
Ortiz, N. Alejandre, A. de Castro, I. Jimenez-Alfaro and S. Marcos, in American
Journal of Ophthalmology (2014).
The contribution of Pablo Pérez-Merino to the study, in collaboration with other coauthors,
was the literature search, the design of the experiments (in collaboration with Nicolás
Alejandre), the customization of the measuring instruments (in collaboration with Sergio
Ortiz), the data acquisition, the development of specific routines (in collaboration with
Sergio Ortiz and Alberto de Castro) and the analysis of the data.

KERATOCONUS & ICRS
62

Chapter III. OCT-based Topography and Aberrometry in Keratoconus with ICRS
63
Keratoconus is a progressive corneal disorder that affects the shape and structure of the
cornea. The distorted corneal geometry severely reduces the optical quality of the eye,
making difficult its correction with spectacles or contact lenses [Nordan, 1997; Rabinowitz,
1998]. To date, ICRS are an increasingly used surgical alternative to delay corneal transplant
and improve visual quality in keratoconus (by increasing corneal symmetry) [Pinero et al.,
2010; Shabayek & Alio, 2007; Torquetti et al., 2014]. Several studies using slit-scanning
corneal topography [Dauwe et al., 2009], Scheimpflug imaging [Torquetti & Ferrara, 2010]
or ultrasound biomicroscopy [Reinstein et al., 2001] have reported anterior and posterior
corneal geometry in keratoconus and its change upon ICRS implantation. However, these
techniques include some inherent limitations that makes particularly challenging an accurate
measurement in highly deformed corneas and in the presence of implants with a refractive
index different from that of the cornea: (1) optical and geometrical distortion in the acquired
images, (2) low resolution, (3) acquisition times exceeding typical eye motions, (4) poor
repeatability in irregular corneas and (5) interpolation errors [Shankar et al., 2008].
As we mentioned in Chapter I and II, an excellent imaging alternative with improved
acquisition time and resolution over other imaging techniques is OCT. OCT provides direct
measurement of corneal elevation, and therefore is free from the skew ray ambiguity present
in standard Placido disk topography. Besides, the rectangular and dense lateral scanning
provides higher lateral resolution than a typical radial sampling (standard Placido disk) or
meridional sampling (Scheimpflug imaging). Several OCT studies have reported thickness,
power, curvature and topography in keratoconus, as well as the implantation depth of ICRS
in keratoconic corneas [Gorgun et al., 2012; Karnowski et al., 2011; Lai et al., 2006; Li et al.,
2008; Naftali & Jabaly-Habib, 2013; Szalai et al., 2012]. However, for accurate
quantification, OCT images need to be distortion-corrected. Previous works of our group
validated the repeatability and accuracy of our OCT system in corneal geometric
measurements in normal [Ortiz et al., 2010; Ortiz et al., 2011] and in a keratoconic subject
[Ortiz et al., 2012a].
While evaluating corneal topography and geometry allows monitoring the progression of
keratoconus and the potential benefit of the treatment, a better understanding of the impact of
the changes of corneal shape (by disease or treatment) is obtained by studying its aberrations,
as these determine the optical quality. However, the evaluation of the optical performance in
patients implanted with ICRS has been addressed only in few studies, which analyzed total
[Chalita & Krueger, 2004] and anterior corneal aberrations [Pinero et al., 2009b; Pinero et
al., 2010] and showed opposite results.
The combined measurement of corneal topography, corneal thickness and corneal
aberrations with the same instrument will give insights on the performance of the ICRS
treatment and the potential reasons behind the limited success of some of the procedures in
some patients, as well as interactions between the aberrations produced by each optical
element. Also, the 3-D ICRS characterization will shed light into ongoing debates on the
stability of ICRS, and on reported complication such as ICRS rotation or migration. So, this
information will be extremely valuable to understand the mechanism of action of ICRS and
provide feedback to biomechanical models of the cornea and ICRS implants to increase the
predictability of this treatment and finally get insights on the potential optical and visual
benefits of the ICRS procedure.

KERATOCONUS & ICRS
64
In this chapter, we present, for the first time the longitudinal corneal quantification before
and after ICRS implantation of geometric, topographic, pachymetric and ICRS location
based on distortion-corrected OCT. Also, we demonstrated for the first time OCT-based
corneal aberrometry and its application in keratoconic patients with ICRS. Corneal
aberrations were compared with total aberrations measured with the LRT in the same
patients. These comparisons allowed evaluating interactive effects of anterior cornea,
posterior cornea and internal aberrations. In addition, the pre- and postoperative optical
quality estimated from the measured aberrations was correlated with visual performance.
3.1. Material and methods
3.1.1. Patients
Ferrara-like ICRS (FerraraRing ; AJL Ophthalmics, Vitoria, Spain) were implanted in 19
corneas of 17 patients (ages ranging from 23–41 years) with diagnosed keratoconus (by an
experienced corneal specialist, Dr. Nicolás Alejandre). The average age of the patients was
29.3±10.8 y.o. The study was revised and approved by the Institutional Review Boards of the
Fundación Jiménez-Díaz, Madrid, Spain and followed the tenets of the Declaration of
Helsinki. The subjects signed a consent form and they were aware of the nature of the study.
3.1.1.1. OCT-based Corneal Topography in Keratoconus and ICRS
10 eyes were analyzed pre- and postoperatively at 7, 30 and 90 days after ICRS implantation.
Manual and femtosecond laser-assisted techniques were performed for implanting ICRS.
Table 3.1 summarizes the clinical profile of the 10 patients and the specifications of the
surgical procedure for ICRS implantation in each patient. Depending on the pre-operative
corneal topography and refraction, one or two segments were implanted, equidistantly to the
incision site. If the corneal coma axis and the flattest meridian differed less than 60 deg the
incision was performed in the steepest meridian and a 160-deg segment was placed inferiorly
(S#3,9). If anterior corneal astigmatism was higher than 5 D, an additional 90-deg segment
was inserted superiorly (S#4,6,8 and 10). If the spherical equivalent was higher than 9 D a
120-deg segment was instead inserted superiorly (S#1). If anterior corneal astigmatism was
lower than 3 D, coma was higher than 2 μm (for 5-mm diameter), the corneal coma axis and
the flattest meridian differed more than 60 deg and BCVA was below 20/30, a 210-deg
segment was placed inferiorly with its center along the corneal coma axis (S#5 and 7). If the
patient showed a regular myopic astigmatism higher than 4 D, the incision was performed in
the steepest meridian, and two 120-deg segments were inserted (S#2).
All eyes were examined before and after ICRS implantation at 7, 30 and 90 days. The study
was approved by Institutional Review Boards and followed the tenets of the Declaration of
Helsinki. The patients signed a consent form and they were aware of the nature of the study.

Chapter III. OCT-based Topography and Aberrometry in Keratoconus with ICRS
65
Table 3.1. Descriptive preoperative keratoconic parameters and surgical specifications
for ICRS implantation (Part 1).
Cone
loc.*
VA
(Pre)**
VA
(Post) **
ICRS
Technique
Optical
zone (mm)
Seg_
ment
ICRS
thickness (µm)
ICRS arc
length
(deg)***
I_s
(deg) ****
Planned depth
(m)
S#1 I-T 0.1 0.4 Manual 5 2 a:250; b:200
a:160; b:120
140 380
S#2 I-T 0.1 0.4 Femto 6 2 a:200;
b:200
a:120;
b:120 100 380
S#3 I 0.3 0.8 Femto 6 1 250 160 110 353
S#4 C 0.2 0.4 Manual 5 2 a:250;
b:250
a:160;
b:90 120 370
S#5 I-T 0.5 1.0 Femto 6 1 200 210 70 380
S#6 C-T 0.4 0.6 Femto 6 2 a:200;
b:200
a:160;
b:90 30 430
S#7 I-N 0.4 0.4 Femto 6 1 300 210 135 440
S#8 I-T 0.8 0.8 Manual 5 2 a:250;
b:250
a:160;
b:90 60 380
S#9 I-C 0.3 0.8 Manual 5 1 200 160 50 350
S#10 I-C 0.4 0.6 Femto 6 2 a:200;
b:200
a:160;
b:90 35 360
*Cone location: S=superior, I=inferior, N=nasal, T=temporal, C=central;
**VA= best-corrected distance visual acuity;
***a= left/superior segment, b= right/inferior segment.
****I_s= Incision site.
3.1.1.2. OCT-based Corneal Aberrometry in Keratoconus and ICRS
19 eyes were measured pre- and 90 days after ICRS implantation. Table 3.2 includes selected
descriptive preoperative parameters and the specifications of the surgical procedure for ICRS
implantation in each all patients (19 eyes).

KERATOCONUS & ICRS
66
Table 3.2. Keratoconic parameters and surgical/ICRS specifications (Part 2).
Pre-op data ICRS parameters
KC
degree
Cone
location*
K max
(D)
ICRS
technique
Optical zone
(mm)
ICRS thickness
(µm)
ICRS arc length
(deg)**
Incision site
(deg)
Planned
depth
(m)
S#1 III I-T 52.00 Femto 6 200 210 70 380
S#2 III I-C 53.63 Femto 6 a:200;
b:200 a:160; b:90 35 360
S#3 III I-T 55.20 Femto 6 a:250;
b:200 a:120; b:90 100 380
S#4 III I-T 56.44 Manual 5 a:250; b:200
a:160; b:120
140 380
S#5 III I-T 57.86 Femto 6 a:200;
b:200
a:120;
b:120 100 380
S#6 II I-C 48.58 Femto 6 250 160 110 353
S#7 III-IV C 62.35 Manual 5 a:250;
b:250
a: 160;
b:90 120 370
S#8 III-IV I-N 58.93 Femto 6 300 210 135 440
S#9 III-IV I-C 63.37 Manual 5 a:250;
b:250 a:160; b:90 60 380
S#10 III I-C 56.15 Manual 5 200 160 50 350
S#11 III-IV I-T 59.04 Femto 6 a:250;
b:250
a:120;
b:120 115 380
S#12 III-IV I-C 64.16 Femto 5 300 210 165 380
S#13 II I-T 48.64 Femto 6 a:150;
b:150
a:120;
b:120 75 380
S#14 II-III C 56.25 Femto 6 300 150 10 380
S#15 II I-N 55.07 Femto 6 250 150 125 375
S#16 III C 51.56 Femto 6 300 150 0 380
S#17 II I-C 51.63 Femto 6 250 150 140 380
S#18 II I-T 52.29 Femto 6 a:300;
b:300
a:120;
b:120 75 347
S #19 II I-T 58.44 Femto 6 250 210 60 380
*Cone location: S=superior, I=inferior, N=nasal, T=temporal, C=central;
**a= left/superior segment; b= right/inferior segment.
3.1.2. Custom SD-OCT system
The OCT images were acquired using a custom developed SD-OCT system, previously
described in chapter II.
Images were acquired while patients fixated a Maltese cross fixation stimulus presented on a
mini-display (SVGA OLED LE 400; LiteEye Systems, Centennial, Colorado, USA)
implemented in a secondary channel. The images of the cornea were acquired with respect to
the anterior corneal specular reflection. Sets of 3-D images were captured approximately 5
seconds after blinking. Five repeated measurements were collected in each condition after
inducing mydriasis with 1 drop of tropicamide 1%.
Measurements were collected in a 10x12-mm area, using a horizontal raster scan. Each 3-D
data set consisted of a total of 50 B-scans composed by a collection of 360 A-scans. The total
acquisition time of a 3-D data set was 0.72 seconds.

Chapter III. OCT-based Topography and Aberrometry in Keratoconus with ICRS
67
3.1.3. OCT Image Processing: Corneal Surface Analysis and ICRS segmentation
OCT images were denoised, clustered (cornea, iris and ICRS), segmented and corrected for
fan and optical distortion. Figure 3.1 illustrates the image analysis in S#2.
Figure 3.1. Illustration of the OCT image analysis and quantification in S#2.
The pupil center (obtained from the automatically identified iris volume) was used as a
reference in the analysis of pre- and postoperative measurements. Corneal elevation maps
were reported within the optical zone defined by the ICRS and the natural pupil. The center
of the implanted ICRS was obtained from the automatically identified ICRS volume, and its
shift from the pupil center estimated for registration of pre- and postoperative measurements.
The optical zone is defined by the 4-mm diameter circular zone inside the circumference
defined by the ICRS radius, and centered at the pupil center.
Corneal shape was described in terms of the radii of curvature and asphericities from fittings
to a sphere and a ellipsoid (anterior cornea: R [sphere]; Rx and Ry, Qx and Qy [ellipsoid];
posterior surface: R [sphere]), and corneal elevation maps were also fitted to Zernike
polynomial expansions (6th
order) using the center of the optical ICRS zone described in the
previous paragraph as the reference. This way, the same optical zone was analyzed in the
pre- and postoperative conditions.
Topographic and thickness maps were displayed in a grid square of 100x100 points in the 4-
mm of diameter optical ICRS zone in order to ensure quantitative analysis of the optical zone
without the ICRS influence. Topographic maps were represented as the difference of corneal
elevation data from the reference sphere, in the so called ‘‘height representation,’’ with
warm colors representing points that are higher than the reference surface and cool colors
representing points below the reference. Both anterior and posterior corneal surfaces were

KERATOCONUS & ICRS
68
fitted by Zernike polynomial expansions (note that these are fits to surface elevations, not
corneal wave aberrations). The symmetry of the corneal elevation maps was obtained using
the Root Mean Square error (RMS) of the asymmetric terms of the corneal elevation Zernike
expansion (RMS_asym). RMS_asym was therefore defined as the RMS for astigmatism,
coma, trefoil, tetrafoil, pentafoil and hexafoil terms (Z2-2
, Z22, Z3
-3, Z3
-1, Z3
1, Z3
3, Z4
-4, Z4
-2,
Z42, Z4
4, Z5
-5, Z5
-3, Z5
-1, Z5
1, Z5
3, Z5
-5, Z6
-6, Z6
-4, Z6
-2 Z6
2, Z6
4, and Z6
6) of corneal height maps
(not to be confused with wave aberration maps). RMS_asym was evaluated both including
and excluding astigmatism coefficients.
Thickness maps were calculated from direct subtraction of the posterior corneal surface from
the anterior corneal surface. RMS thickness maps were used to assess the regularity of the
thickness distribution. RMS_thicknessmap is therefore defined as the deviation of the
thickness maps from a uniform pachymetry across the cornea.
Corneal power (diopters, D) was calculated by using the paraxial formula with both the
corneal (1.376) and the aqueous (1.336) refractive indices. All metrics were computed for a
4-mm optical ICRS zone.
3-D ICRS positioning was described by the following parameters: 3-D ICRS depth, defined
as the distance between the center of mass of the ICRS and the anterior corneal surface, and
ICRS tilt, defined as the angle between the ICRS axis (normal to the ICRS plane) and the
pupillary axis (normal to the pupil plane). Positive tilts around X-axis indicate a forward tilt
of the nasal part (OD) / temporal part (OS) of the ICRS plane with respect to the pupil plane.
Positive tilts around Y-axis indicate a forward shift of the inferior part of the ICRS plane
with respect to the pupil plane (Figure 2.16, Chapter II).
3.1.4. OCT Image Processing: Corneal Aberration Analysis
The elevation data from both corneal surfaces within a central 4-mm pupil diameter area (for
ensuring quantitative analysis within the optical zone without the influence of ICRS) were
fitted by Zernike polynomial expansions (up to sixth order) and exported to ZEMAX
(Radiant ZEMAX; Focus Software, Tucson, Arizona, USA) for ray tracing analysis as
described in Chapter II (Figure 2.17). Corneal aberrations were analyzed preoperatively and
3 months post ICRS implantation in 19 eyes.
3.1.5. Laser Ray Tracing: Total Aberration Analysis
Total wave aberrations were measured using custom LRT, which has been described in
Chapter II.
Measurements were done under mydriasis (1 drop 1% tropicamide). The sampling pattern
(37 rays in a hexagonal configuration) was adjusted by software to fit a 4-mm pupil centered
at the pupil center. The pupil center reference allowed pre- and post-op comparisons, and the
pupil diameter was selected to guarantee that post-op measurements fitted the optical zone
defined by the inner diameter of the ICRS. Maximum energy exposure was 6.8 µW.

Chapter III. OCT-based Topography and Aberrometry in Keratoconus with ICRS
69
Prior to the measurement, the patient adjusted his/her subjective refraction using a Badal
optometer. The Badal system had been modified for this study to allow correction of
spherical errors up to -12 D, frequent in moderate to advanced keratoconus. All
measurements were done under foveal fixation of a Maltese cross fixation stimulus. Total
wave aberrations were fitted with 6th order Zernike polynomial expansions following OSA
standards. Pre- and 3-month post-ICRS total aberrations were measured and analyzed in 8
patients.
3.1.6. Optical quality metrics
Wave aberrations were described in terms of individual Zernike coefficients or RMS. RMS
was used to report the magnitude of high order aberrations (HOAs) excluding tilt, defocus
and astigmatism, and of certain relevant aberrations (astigmatism, coma and trefoil). The
Point-Spread-Function (PSF) and the Modulation Transfer Function (MTF) were computed
from Zernike coefficients by means of Fourier optics using routines written in Matlab
(MathWorks, Natick, MA), for 4-mm pupils. Optical quality was described in terms of the
Visual Strehl Metric. Visual Strehl was computed as the volume under the Visual MTF
(obtained from the overlapping of the MTF with the inverse of a general Neural Transfer
Function), normalized to diffraction limit. Visual Strehl was evaluated through focus
(considering HOAs, and canceling the astigmatic terms). The maximum value of the
through-focus Visual Strehl curve was obtained as the best corrected optical quality metric.
Visual Strehl metric has been shown to correlate best with logMAR visual acuity.
3.1.7. Visual Acuity measurement
Visual acuity was measured using a high contrast Snellen visual acuity test. Patients were
tested at a distance of 4 m (13 feet) from the visual acuity chart. All measurements were
performed with natural pupils under photopic conditions. Best corrected Visual Acuity was
obtained for optimal spherical and cylindrical correction with spectacles, and given in
logMAR units.
3.1.8. Statistical analysis
The changes in corneal geometry and ICRS position were analyzed statistically using an
analysis of variance (ANOVA; general linear model for repeated measurements). Significant
levels (ANOVA and pair-wise two tailed comparison t-test) were set at p<0.05. The
statistical tests were performed using SPSS software (SPSS, Inc., Chicago, Illinois).
Univariate analysis (independent samples Student´s t-test) was used to evaluate differences
between pre-operative and post-operative measurements in corneal aberrometry. Correlations
(Pearson correlation coefficients) were assessed between OCT and Laser Ray Tracing
aberration measurements. A p-value less than 0.05 was considered statistically significant in
all comparisons.

KERATOCONUS & ICRS
70
3.2. Results
3.2.1. OCT-based Corneal Topography in Keratoconus & ICRS
3.2.1.1. Longitudinal changes of anterior corneal surface geometry and
topography
Radius of curvature and asphericity of the anterior corneal surface were obtained from
sphere (R) and biconicoid (Rx, Qx; Ry, Qy) fittings in a 4-mm optical ICRS zone.
Figure 3.2 (a) shows averaged horizontal and vertical anterior corneal radii of curvature (Rx
and Ry) in each eye before and at 7, 30, and 90 days after ICRS implantation. The
intrasubject repeatability in the estimated anterior radius of curvature across repeated
measurements is high, with average standard deviations of 0.07 mm (pre-op), and 0.08 mm,
0.09 mm and 0.08 mm (at 7, 30 and 90 days post-op, respectively). We found significant
overall flattening (p<0.05) of the anterior cornea one week following surgery in 8 out of 10
patients (all patients except for S#2 and S#3), with an average radius increase by 2.25%. In 6
of these patients there was further corneal flattening during the tested period, with an average
radius increase by 5.5% at 90 days. S#2 and S#3 experienced an initial corneal steepening,
followed by a corneal flattening, but the radius of curvature at 90 days was not statistically
significantly different from pre-operative values. Figure 3.2 (b) shows ratio Rx/Ry pre- and
post-operatively (7, 30, and 90 days). In 7 out of 10 patients (all except for S#2, S#7 and
S#10), the ratio Rx/Ry decreased after ICRS implant. Four patients (S#3, S#5, S#6 and S#9)
showed Rx/Ry ratios close to 1. On average, the difference in anterior curvature in the
horizontal and vertical meridians decreased significantly from a mean pre-op value of
4.52±2.62 D to a mean 90-days post-op value of 2.81±2.39 D (p<0.05).
The overall anterior corneal flattening ranged from 8.9% to 2.2% across patients. We found a
tendency for Rx to flatten more than Ry. Rx flattening ranged from 18.6% to 1.5% across
patients, and Ry from 0.8% to 9.1%. Flattening in Rx was statistically significant at 7, 30 and
90 days, whereas changes in Ry were not statistically overall.
Figure 3.2. (a) Anterior cornea mean radius of curvature and (b) Rx to Ry ratio at
various time points (pre- and 7, 30 and 90 days postoperatively).

Chapter III. OCT-based Topography and Aberrometry in Keratoconus with ICRS
71
Figure 3.3 shows the longitudinal variation of asphericity in the horizontal (Qx, Figure 3.3
(a)) and in the vertical (Qy, Figure 3.3 (b)). Pre-operatively, patients showed typically a
highly prolate horizontal meridian (Qx=-1.640.91) and much lower vertical negative
aphericity (or even positive asphericity values) in the vertical meridian (Qy=-0.110.72). In
general, keratoconic patients showed higher magnitudes of asphericity (Q ranging from -3.65
to 0.72) in comparison with a normal population. The ICRS implant produced significant
changes in Qx or Qy. On average, Qx shifted towards more negative values 7-days after the
procedure (from -1.64 to -2.25), but typically decreased to values not significantly different
from pre-operative values (Qx=-1.491.02) 90-days after the procedure. Qy did not follow a
systematic pattern immediately after surgery or longitudinally.
Figure 3.3. (a) Asphericity in the horizontal meridian (Qx) and (b) asphericity in
the vertical meridian (Qy) pre- and 7, 30 and 90 days postoperatively
Figure 3.4 shows anterior corneal elevation maps from two patients (S#5 and S#8), for 4-mm
diameters (i.e. within the optical zone defined by the ICRS), centered at the pupil center. The
radii of curvature of the best fitting spheres and the corneal elevation RMS for asymmetric
terms (excluding astigmatism) are also shown. These patients show corneal flattening after
surgery and during the follow-up, as well as a reduction of the asymmetry of the corneal
elevation map, with a decrease in the corneal elevation asymmetric RMS of 19.7% (S#5) and
14.6% (S#8), respectively.

KERATOCONUS & ICRS
72
Figure 3.4. Anterior corneal elevation maps pre- and postoperatively in two
patients of the study (S#5 and S#8). R stands for radius of curvature and RMS for
RMS_asym.
Figure 3.5 shows the anterior cornea RMS_asym, including astigmatism (a) and excluding
astigmatism (b). On average RMS_asym did not show significant differences between pre-op
and post-op measurements, primarily due to the high intersubject variability of the corneal
elevation asymmetry pre-operatively. S#5, S#6 and S#8 experienced a decrease in
asymmetry (with and without astigmatism) from pre-op to 90-days post-operatively
(p<0.05). S#3 and S#4 increased asymmetry significantly (p=0.05). Interestingly, the subject
with highest amount of pre-operative RMS_asym (S#8) improved symmetry significantly
(and progressively) both with and without astigmatism, whereas the subject with lowest pre-
operative RMS_asym (S#3) increased asymmetry significantly. As expected, we found in the
RMS_asym excluding astigmatism lower values (p<0.001) in comparison with RMS_asym
with astigmatism. However, the RMS (with and without astigmatism) show similar trends
during the follow-up.
Figure 3.5. Anterior corneal elevation RMS for asymmetric Zernike coefficients
(RMS_asym), (a) with astigmatism, and (b) without astigmatism.

Chapter III. OCT-based Topography and Aberrometry in Keratoconus with ICRS
73
3.2.1.2. Longitudinal changes of posterior corneal surface geometry and
topography
The radius of curvature of the posterior corneal surface was obtained from sphere fitting, in a
4-mm optical ICRS zone. Intrasubject repeatability in the estimated anterior radius of
curvature across repeated measurements is high, with average standard deviations of 0.08
mm (pre-op) and 0.09 mm (7, 30 and 90 days post-op). Figure 3.6 shows the longitudinal
variations in radius of curvature of the posterior corneal surface with surgery. Unlike for the
anterior surface, where most patients showed flattening, there was not a clear trend for the
posterior surface. Only 3 patients (S#1, S#4 and S#9) showed flattening of the posterior
cornea (average: 3.7% at 7 days, 6.4% at 30 days and 13.9% at 90 days), and S#2, S#5, S#6,
S#8 and S#10 showed steepening (average: 8.8% at 7 days, 6.7% at 30 days and 6.9% at 90
days).
Figure 3.6. Posterior corneal mean radius of curvature (pre- and postoperatively 7-
90 days).
Figure 3.7 shows posterior corneal elevation maps from two patients (S#1 and S#10), for 4-
mm diameters (i.e. within the optical zone defined by the ICRS), centered at the pupil center.
Maps are clearly dominated by astigmatism. Although the presence of ICRS induces marked
changes in the topographic pattern with time, the posterior surface did not show significant
decrease in astigmatism and asymmetric terms with surgery.

KERATOCONUS & ICRS
74
Figure 3.7. Posterior corneal elevation maps pre- and postoperatively in two
patients of the study (S#1 and S#10). R stands for radius of curvature and RMS for
RMS_asym.
Figure 3.8 shows the posterior cornea RMS_asym, including astigmatism (a) and excluding
astigmatism (b). ICRS produced significant changes although the longitudinal trends show
high intersubject variability. On average RMS_asym including astigmatism showed a slight
but not significant (p=0.4) decrease (from 58.5±8.8 to 54.1±6.8 µm, pre-op to 90 days post-
op). S#4, S#7 and S#8 experienced a decrease in RMS_asym (with and without astigmatism)
from pre-op to 90 days post-op (p<0.05). S#1, S#5 and S#9 increased asymmetry
significantly (p<0.05). Interestingly, the patients with highest amount of pre-operative
asymmetric RMS (S#7 and S#8) improved symmetry significantly (and progressively).
Figure 3.8. Posterior corneal elevation RMS for asymmetric Zernike coefficients
(RMS_asym), (a) with astigmatism, and (b) without astigmatism.

Chapter III. OCT-based Topography and Aberrometry in Keratoconus with ICRS
75
3.2.1.3. Longitudinal variations of corneal power
Refractive changes are associated with changes in curvature of both the anterior and
posterior corneal surfaces. Figure 3.9 shows the corneal power change during the follow-up
(a), and the pre-op versus post-op (90 days) corneal power (b). Corneal refractive power
changed significantly from a mean pre-op value of 46.2±3.2 D to a mean 90-day post-op
value of 44.4±3.5 D (p<0.05). On average, corneal power decreased 1.71 D (between -5.1 D
for S#8 to +1.1 D for S#4). Pre-op corneal power is highly correlated with post-operative
power (p<0.05; Figure 3.10 (b)).
Figure 3.9. (a) Corneal power change during the follow-up; (b) preoperative vs
postoperative (90 days) corneal power.
3.2.1.4. Corneal thickness: pre and post-ICRS implantation
Figure 3.10 (a) shows an example (S#2) of the corneal thickness map pre- and post-
operatively. Minimum corneal thickness did not change significantly with surgery (38460
µm pre-op to 39646 µm post-operatively). However, both the distribution of corneal
thickness and changes in the minimum thickness location did occur. Figure 3.10 (b) shows
the longitudinal variation of the RMS of the corneal thickness map (RMS_thicknessmap) for
all patients of the study as an estimation of the thickness distribution in the 4-mm optical
ICRS zone. Corneal thickness redistribution occurred in most patients with time.
RMS_thicknessmap decreased significantly (from pre-op to 90 days post-op, p<0.05) in 3
subjects (S#4, S#7 and S#9), and increased significantly (p<0.05) in 3 patients (S#2, S#8 and
S#10). Figure 3.10 (c) shows the displacement of the minimum corneal thickness location
across the optical zone, for all patients. Overall, there is an average displacement of the
location of minimum thickness from inferior pre-operatively (centroid coordinates: -0.01 (x-
axis) and -0.63 (y-axis)) towards more central post-operatively (centroid coordinates: -0.06
(x-axis) and -0.14 (y-axis) at 90-days). The largest shift occurred between pre-op and 7-days
post-op, with little changes during the follow up.
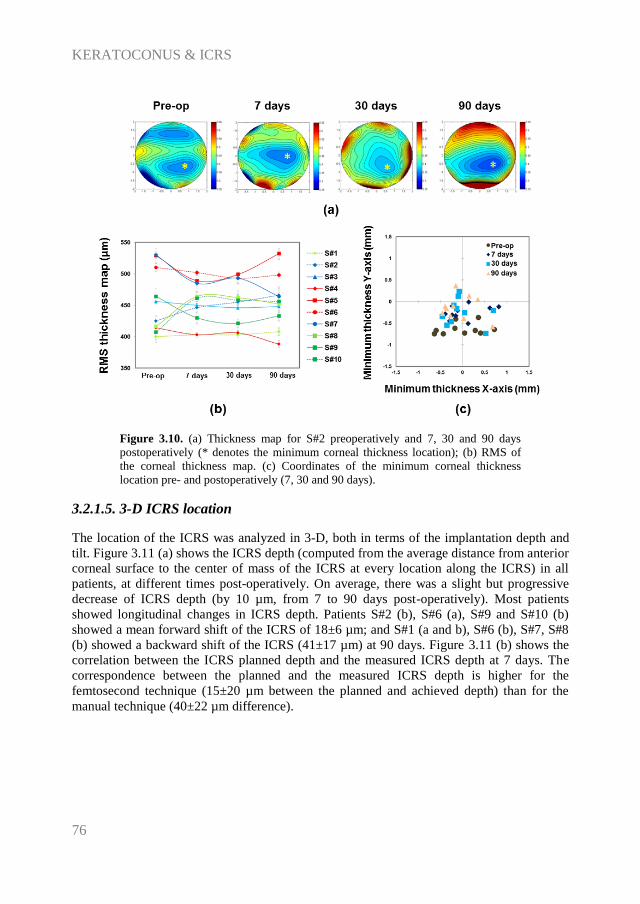
KERATOCONUS & ICRS
76
Figure 3.10. (a) Thickness map for S#2 preoperatively and 7, 30 and 90 days
postoperatively (* denotes the minimum corneal thickness location); (b) RMS of
the corneal thickness map. (c) Coordinates of the minimum corneal thickness
location pre- and postoperatively (7, 30 and 90 days).
3.2.1.5. 3-D ICRS location
The location of the ICRS was analyzed in 3-D, both in terms of the implantation depth and
tilt. Figure 3.11 (a) shows the ICRS depth (computed from the average distance from anterior
corneal surface to the center of mass of the ICRS at every location along the ICRS) in all
patients, at different times post-operatively. On average, there was a slight but progressive
decrease of ICRS depth (by 10 µm, from 7 to 90 days post-operatively). Most patients
showed longitudinal changes in ICRS depth. Patients S#2 (b), S#6 (a), S#9 and S#10 (b)
showed a mean forward shift of the ICRS of 18±6 µm; and S#1 (a and b), S#6 (b), S#7, S#8
(b) showed a backward shift of the ICRS (41±17 µm) at 90 days. Figure 3.11 (b) shows the
correlation between the ICRS planned depth and the measured ICRS depth at 7 days. The
correspondence between the planned and the measured ICRS depth is higher for the
femtosecond technique (15±20 µm between the planned and achieved depth) than for the
manual technique (40±22 µm difference).

Chapter III. OCT-based Topography and Aberrometry in Keratoconus with ICRS
77
Figure 3.11. (a) Average ICRS depth for all patients (7, 30 and 90 days
postoperatively). (b) Planned depth vs OCT measured depth.
Figure 3.12 shows the ICRS tilt angles around X and Y-axes in all patients and post-
operative time-points. The tilt angles of the left and right ICRS segments have been changed
in sign for the nasal/temporal coordinates, to allow appropriate averaging. On average, there
is a forward tilt of the temporal and superior part of the ring, with an overall tilt of -6.8±2.6
deg (temporal) and -2.1±0.8 deg (superior) at 7 days. Although there is intersubject
variability, there is small (<1 deg) but systematic tilt of the ICRS between 7 and 90 days
post-surgery.
Figure 3.12. (a) Average ICRS tilt for all patients at 7, 30 and 90 days. (b) ICRS
tilt for patients with two segments at 7, 30 and 90 days ([a] left/superior segment
and [b] right/inferior segment).

KERATOCONUS & ICRS
78
3.2.1.6. Correlation between surgical parameters and corneal geometrical
response
The effect of ICRS implantation on corneal curvature was highly dependent on ICRS
diameter. The ICRS with smaller diameters were more effective in flattening the anterior
corneal surface than larger diameters: 0.33±0.18 mm (5 mm optical zone) vs 0.17±0.14 mm
(6 mm optical zone), at 90-days post-op. As a result, the 5-mm ICRS produced the largest
changes in corneal power. For example, S#8, with a 5-mm optical zone, experienced a
decrease in total corneal power by 5.1 D (90-days post-op).
The optical zone diameter appeared also correlated, to a less extent, to the change of the
posterior corneal surface radius of curvature. A 5-mm optical zone diameter produced an
average posterior corneal flattening of 0.14±0.45 whereas a 6-mm optical zone diameter
produced an average steepening of 0.31±0.25 mm (90 days post-op). In addition, the effect
of ICRS on the posterior surface could be possibly associated to the ICRS arc length.
Previously, we described steepening on the posterior corneal surface with a 90-deg arc
length. A combination of 90-deg arc length ICRS and 160-deg arc-length (as in patients S#4,
S#6, S#8 and S#10) produced a significant steepening of the posterior corneal surface (by
0.41±0.24 mm). However, a combination of 160-deg and 120-deg arc length ICRS (as in
patients S#1, S#2, S#3 and S#9) tended to flatten the posterior corneal surface (by 0.15±0.35
mm). In addition, the ICRS arc length seems to be associated with the post-operative corneal
symmetry. Patients implanted with 90-deg arc length ICRS showed a significant decrease of
the corneal surface RMS for asymmetric terms of the posterior surface (from 63.4±8.8 µm
pre-op to 51.8±6.0 µm 90-days post-op) and a slight increase in the RMS of the thickness
map (from 436±8 µm pre-op to 448±9 µm 90 days post-op).
The position and rotation of the ICRS also seems to play a major role in the symmetry of the
post-operative cornea. A strong direct correlation was found between the change in the ICRS
tilt around X and change in anterior corneal RMS_assym, between 7 and 90-days (r=+0.83,
p<0.05 with astigmatism; r=+0.76, p<0.05 without astigmatism). No significant correlations
were noted among other parameters of the ICRS position and the corneal surface.
3.2.2. OCT-based Corneal Aberrometry in Keratoconus & ICRS
3.2.2.1. LRT vs OCT-aberrometry
Corneal and total aberrations were compared in 8 of the 19 eyes pre-operatively and 3-
months post-ICRS implantation. Figure 3.13 shows the average coefficients describing the
second and HOAs of the whole eye and of the cornea, as well as the corresponding wave
aberration maps (excluding tilt, defocus and astigmatism). The corresponding simulated
PSFs for all subjects (average) pre- and post-operatively are also shown. Both pre- and post-
operatively, total and corneal aberrations are dominated by astigmatism (eliminated in the
maps shown in Figure 3.13 to allow visualization of higher order aberrations), vertical coma
(Z3-1
), vertical trefoil (Z3-3
) and secondary astigmatism (Z44). Anterior corneal aberrations are
slightly higher than those of the whole cornea aberrations (including both anterior and
posterior surfaces), indicating a compensatory role of the posterior corneal surface. While

Chapter III. OCT-based Topography and Aberrometry in Keratoconus with ICRS
79
total and corneal aberrations show quite similar aberration patterns, several total aberration
terms tend to be lower than the corresponding corneal aberration terms.
Figure 3.13. Total and corneal Zernike coefficient values (average across 8 eyes),
wave aberration maps (calculated from average Zernike coefficients excluding tilt,
defocus and astigmatism) and the simulated point-spread-functions (PSFs) from the
wave aberrations (window size: 5 arc min) for keratoconic eyes pre-operatively and
3-months post-intracorneal ring segment (ICRS) implantation. Data are for 4-mm
pupils and referred to the pupil center. (Top) pre-operative data, and (Bottom) post-
operative data, 3 months post-intracorneal ring segment (ICRS) implantation in
keratoconus. OCT: Optical coherence Tomography. LRT: Laser Ray Tracing.
Figure 3.14 shows individual corneal and total wave aberration maps (excluding tilt, defocus
and astigmatism) for all eyes measured with OCT and with LRT, pre-operatively and 3-
months post-ICRS implantation. In most eyes, the high-order wave aberration maps are
dominated by coma and trefoil. Repeated measurements were highly reproducible within
each subject, with average (across all patients and conditions) standard deviations of 0.13 µm
(LRT), 0.17 µm (OCT anterior) and 0.19 µm (OCT corneal) for RMS astigmatism, and of

KERATOCONUS & ICRS
80
0.07 µm (LRT), 0.10 µm (OCT anterior) and 0.11 µm (OCT corneal) for RMS HOA. Total
and corneal aberrations show in general a good correspondence (except for eye#5). In most
cases total aberrations are lower than corneal aberrations, suggesting a compensatory effect
of the crystalline lens. On average, the RMS HOAs was 0.78±0.35 µm (OCT) and 0.57±0.39
µm (LRT) pre-operatively and 0.88±0.36 µm (OCT) and 0.53±0.24 µm (LRT) post-
operatively.
Figure 3.14. Total and corneal Zernike coefficient values (average across 8 eyes),
wave aberration maps (calculated from average Zernike coefficients excluding tilt,
defocus and astigmatism) and the simulated point-spread-functions (PSFs) from the
wave aberrations (window size: 5 arc min) for keratoconic eyes pre-operatively and
3-months post-intracorneal ring segment (ICRS) implantation. Data are for 4-mm
pupils and referred to the pupil center. (Top) pre-operative data, and (Bottom) post-
operative data, 3 months post-intracorneal ring segment (ICRS) implantation in
keratoconus. OCT: Optical coherence Tomography. LRT: Laser Ray Tracing.
Figure 3.15 shows the correlation between corneal and total Zernike coefficients (HOA,
astigmatism, coma, trefoil and spherical aberration) for all patients and conditions.

Chapter III. OCT-based Topography and Aberrometry in Keratoconus with ICRS
81
Figure 3.15. Correlation between corneal aberrations and total aberrations, in terms
of root-mean-square (RMS) high-order aberrations (top left), astigmatism (top
middle), coma (top right) and trefoil (bottom left), and spherical aberration (bottom
right). Open circles stand for pre-operative data (keratoconus) and closed squares
for post-operative data (3-months post-intracorneal ring segment (ICRS)
implantation). Lines are linear regressions to the data.
Table 3.3 shows the corresponding correlation coefficients and slopes. Correlations between
corneal and total data were statistically significant (p<0.05) for RMS HOAs (pre- and post-
operatively), RMS Astigmatism (pre- and post-operatively), RMS Trefoil (pre- and post-
operatively) and RMS Coma (post-operatively). The slopes ranged from 0.75 to 1.53 (1.07
on average). The highest dispersion (and least-significant correlation) was found for
spherical aberration, indicative of a patient-dependent compensation of the corneal spherical
aberration by the crystalline lens.

KERATOCONUS & ICRS
82
Table 3.3. Correlation parameters between corneal and total root-mean-square (RMS)
for high-order aberrations (HOAs), astigmatism, coma and trefoil, and for spherical
aberration pre-operatively (keratoconus) and post-operatively (3-months post-
intracorneal ring segment (ICRS) implantation). r: Pearson product-moment correlation
coefficient; slope: the slope of the regression line; p: p-value(*p<0.05).
r slope p
HOAs pre-op 0.87 0.80 0.012*
post-op 0.90 1.40 0.001*
Astigmatism (Z22 and Z2
-2) pre-op 0.71 1.53 0.036*
post-op 0.88 1.67 0.022*
Coma (Z31 and Z3
-1) pre-op 0.87 0.75 0.132
post-op 0.64 0.83 0.023*
Trefoil (Z33 and Z3
-3) pre-op 0.91 0.90 0.001*
post-op 0.88 0.96 0.003*
Spherical Aberration (Z40)
pre-op 0.66 0.97 0.197
post-op 0.44 0.86 0.691
3.2.2.2. Pre- and Post-ICRS aberrations
OCT-corneal aberrations were analyzed in 19 eyes pre-operatively and 3-months post-ICRS
implantation. Figure 3.16 shows corneal (anterior+posterior) aberrations (RMS for HOAs,
astigmatism, coma and trefoil terms) for all subjects. On average, ICRS implantation
decreased corneal astigmatism (27%), and produced slight decrease of HOAs (2%) and coma
(5%), and slight increase of trefoil (4%). We found slight but not significant correlations
between pre- and post-operative astigmatism (r=0.54, p=0.07), HOAs (r=0.55, p=0.89),
coma (r=0.36, p=0.84), trefoil (r=0.48, p=0.84). Besides astigmatism, Z3-3
, Z3-1
, Z31 and Z4
4
were the predominant corneal aberrations contributing 19%, 7%, 8%, 8% and 8% (pre-
operatively) and 19%, 7%, 9%, 8% and 5% (post-operatively) respectively to the overall
corneal HOAs.
At the individual level, astigmatism decreased significantly (p<0.006) 3-months post-ICRS
implantation in 14/19 eyes (eye#2-#4, #6, #7, #9-#16, #18 and #19). Coma decreased
significantly (p<0.03) in 11/19 eyes (eye#1, #3-#5, #9-#14, #16 and #19). Trefoil decreased
(p<0.07) in 7/19 eyes (eye#2-#4, #9, #11, #13 and #19). HOAs decreased significantly
(p<0.03) in 9/19 eyes (eye#2-#4, #9-#13 and #19). However, in 4/19 eyes (eye#1, #5, #8 and
#17) astigmatism and HOA increased significantly 3-months post-ICRS implantation.

Chapter III. OCT-based Topography and Aberrometry in Keratoconus with ICRS
83
Figure 3.16. RMS for high-order aberrations (HOAs), astigmatism (Z22 and Z2
-2),
coma (Z31 and Z3
-1) and trefoil (Z33 and Z3
-3). Data are for 4-mm pupils in
keratoconic corneas pre-operatively and 3-months post-ICRS implantation.

KERATOCONUS & ICRS
84
3.2.2.3. Visual acuity versus optical quality
Figure 3.17 shows best-corrected visual acuity (BCVA) as a function of best Visual Strehl,
for 4-mm pupil diameter. We found significant correlations between BVCA and Visual
Strehl both pre-operatively (r=-0.51, p=0.02) and 3-month post-ICRS implantation (r=-0.68,
p=0.001) values. On average, BCVA is slightly but significantly improved with ICRS
treatment (pre-operative BCVA 0.38±0.19; post-operative BCVA 0.51±0.16; p=0.002).
While there is a displacement of Visual Strehl towards higher post-operative values, the
change did not reach statistical significance (pre-operative Visual Strehl: 0.059±0.03; post-
operative Visual Strehl: 0.063±0.04; p=0.53).
Figure 3.17. Correlation between best-corrected visual acuity (BCVA) and Visual
Strehl ratio (computed from the visual Modulation Transfer Function for high order
aberrations at best focus, i.e. maximum Visual Strehl, for 4-mm pupils). Open
circles stand for pre-operative data (keratoconus) and closed squares for post-
operative data (3-months post- ICRS implantation).
3.2.2.4. Posterior corneal surface contribution
The posterior corneal surface provides consistent partial compensation of the anterior corneal
surface aberration. Figure 3.18 illustrates the contribution of the posterior corneal surface to
the corneal aberrations. On average, the posterior corneal surface compensates 13.9% of
astigmatism, 8.3% of HOAs, 16.1% of coma, and 7.7% of trefoil pre-operatively; and 9.1%
of astigmatism, 4.1% of HOAs, 20.1% of coma, and 3.1% of trefoil 3-months post-ICRS
implantation. The amount of compensation pre- or post-operatively did not differ
significantly.
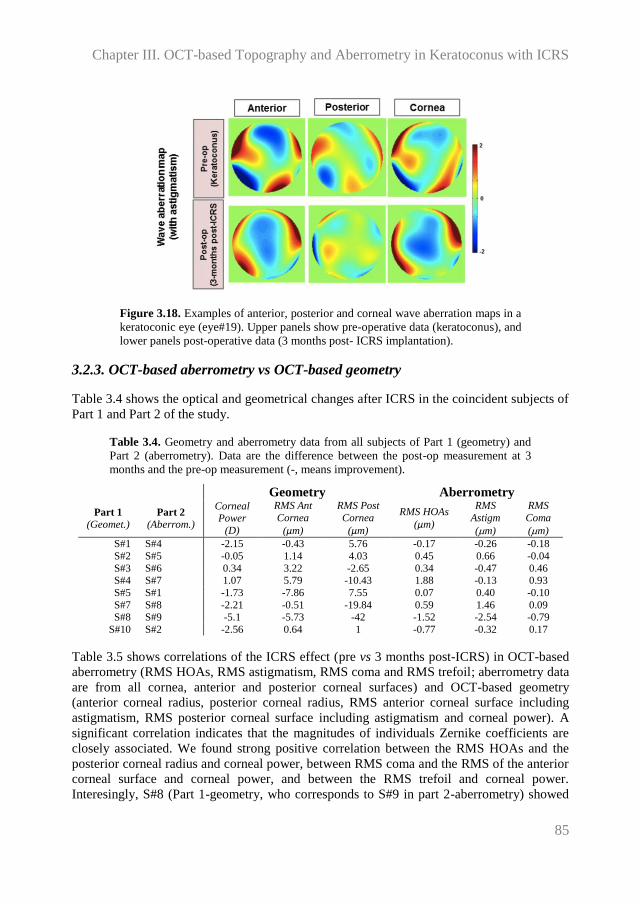
Chapter III. OCT-based Topography and Aberrometry in Keratoconus with ICRS
85
Figure 3.18. Examples of anterior, posterior and corneal wave aberration maps in a
keratoconic eye (eye#19). Upper panels show pre-operative data (keratoconus), and
lower panels post-operative data (3 months post- ICRS implantation).
3.2.3. OCT-based aberrometry vs OCT-based geometry
Table 3.4 shows the optical and geometrical changes after ICRS in the coincident subjects of
Part 1 and Part 2 of the study.
Table 3.4. Geometry and aberrometry data from all subjects of Part 1 (geometry) and
Part 2 (aberrometry). Data are the difference between the post-op measurement at 3
months and the pre-op measurement (-, means improvement).
Geometry Aberrometry
Part 1
(Geomet.) Part 2
(Aberrom.)
Corneal Power
(D)
RMS Ant
Cornea
(µm)
RMS Post
Cornea
(µm)
RMS HOAs
(µm)
RMS
Astigm
(m)
RMS
Coma
(m)
S#1 S#4 -2.15 -0.43 5.76 -0.17 -0.26 -0.18
S#2 S#5 -0.05 1.14 4.03 0.45 0.66 -0.04
S#3 S#6 0.34 3.22 -2.65 0.34 -0.47 0.46 S#4 S#7 1.07 5.79 -10.43 1.88 -0.13 0.93
S#5 S#1 -1.73 -7.86 7.55 0.07 0.40 -0.10
S#7 S#8 -2.21 -0.51 -19.84 0.59 1.46 0.09 S#8 S#9 -5.1 -5.73 -42 -1.52 -2.54 -0.79
S#10 S#2 -2.56 0.64 1 -0.77 -0.32 0.17
Table 3.5 shows correlations of the ICRS effect (pre vs 3 months post-ICRS) in OCT-based
aberrometry (RMS HOAs, RMS astigmatism, RMS coma and RMS trefoil; aberrometry data
are from all cornea, anterior and posterior corneal surfaces) and OCT-based geometry
(anterior corneal radius, posterior corneal radius, RMS anterior corneal surface including
astigmatism, RMS posterior corneal surface including astigmatism and corneal power). A
significant correlation indicates that the magnitudes of individuals Zernike coefficients are
closely associated. We found strong positive correlation between the RMS HOAs and the
posterior corneal radius and corneal power, between RMS coma and the RMS of the anterior
corneal surface and corneal power, and between the RMS trefoil and corneal power.
Interesingly, S#8 (Part 1-geometry, who corresponds to S#9 in part 2-aberrometry) showed

KERATOCONUS & ICRS
86
the highest geometrical improvement (-5.1 D of decrease in corneal power and -5.73 µm of
decrease in the RMS of the anterior corneal surface) manifested the highest decrease in the
RMS HOAs (-1.52 µm) and astigmatism (-2.54 µm); and S#2 (Part 1-geometry, who
corresponds to S#5 in part 2-aberrometry) showed worsening in the RMS of the anterior and
posterior surface, manifesting an increased in HOAs (+0.45 µm) and astigmatism (+0.66
µm).
Table 3.5. Pearson correlation coefficient and p-value between OCT-aberrometry and
OCT-geometrical changes pre- and 3 months post-ICRS.
R Anterior R Posterior Corneal Power RMS Anterior RMS Posterior
RMS HOAs r=-0.63; p=0.08 r=0.75; p=0.03* r=0.87; p=0.01* r=0.65; p=0.08 r=0.32; p=0.43
RMS
Astigmatism r=-0.55; p=0.15 r=0.13; p=0.74 r=0.51; p=0.19 r=0.23; p=0.57 r=0.55; p=0.15
RMS Coma r=-0.68; p=0.06 r=0.62; p=0.09 r=0.86; p=0.01* r=0.8; p=0.01* r=0.38; p=0.35
RMS Trefoil r=-0.6; p=0.11 r=0.7; p=0.06 r=0.82; p=0.01* r=0.45; p=0.25 r=0.37; p=0.36
3.3. Discussion
We have presented, to our knowledge, the first report of (1) full OCT-based quantification of
geometrical, topographical and pachymetrical corneal changes following ICRS surgery, (2)
3-D ICRS accurate location and (3) corneal aberrations based on quantitative OCT
measurements of corneal elevation maps of anterior and posterior surface.
(1) Full OCT-based corneal geometry, topography and pachymetry following ICRS surgery
Accurate measurements of anterior and posterior corneal topographies are essential to
understand the corneal response to ICRS implants. The higher speed and resolution, axial
and lateral, of OCT makes of this an ideal tool to evaluate the corneal geometry in
keratoconus and its ICRS treatment. Most OCT studies of keratoconus address only the
measurement of corneal thickness and corneal radii [Li et al., 2008; Tang et al., 2006], while
few attempt quantification of corneal topography [Karnowski et al., 2011; Szalai et al.,
2012]. In fact, reports comparing corneal shape (radii and pachymetry) measured with OCT
and other techniques are conflicting, with some of the studies showing significant differences
found across instruments [Szalai et al., 2012], and other reporting a good agreement between
OCT and Scheimpflug [Karnowski et al., 2011].
Due to the scanning configuration and the refraction effects (particularly relevant in this case
due to the ICRS inside the cornea with a higher index of refraction), fan and optical
distortion affect significantly the acquisition of accurate quantitative 3-D data from OCT
corneal surfaces. In a previous studies, Ortiz et al. [Ortiz et al., 2011] described the
application of custom algorithms for reconstructing accurately 3-D corneal elevation maps
after fan and optical distortion correction in a keratoconic cornea.
Previous studies after ICRS implantation reported a mean flattening of the anterior corneal
surface by 2.5 D [Pinero et al., 2010; Shabayek & Alio, 2007]. In this study we found a mean
decrease of corneal power (anterior + posterior corneal surfaces) of 1.71±1.83 D 90 days

Chapter III. OCT-based Topography and Aberrometry in Keratoconus with ICRS
87
post-operatively. Despite the overall decrease of corneal power, the response varied across
individuals (ranging from an increase of 1.07 D to a decrease of 5.10 D at 90 days). This
intersubject variability is consistent with a previous study using videokeratography, who
found an increase of 2.5% to a decrease of 18% in the topographic K-values, in 21 eyes 90-
days post implantation of ICRS [Shabayek & Alio, 2007]. As predicted by a recently
published Finite Element Model analysis of the corneal response to ICRS implants, we found
that the change in anterior corneal radius was highly dependent on the optical zone diameter
[Kling & Marcos, 2013].
Regarding the effect of ICRS on the posterior corneal surface, a previous study based on
Scheimpflug imaging reported a significant flattening of approximately 0.25 mm after ICRS
implantation [Sogutlu et al., 2012]. In the current study we found that the posterior corneal
radii flattened in 4 eyes (by 0.59±0.41 mm) but steepened in 6 eyes (by 0.32±0.22 mm) 90-
days post-operatively. This variable response appears to be associated with the arc length of
the ICRS, with the combination of 90-deg and 160-deg arc lengths ICRS producing a
significant steepening on the posterior corneal surface. The optical zone diameter appeared
to play also some role in the posterior corneal changes, as we showed in the results.
The regularity of both anterior and posterior corneal surfaces was analyzed by means of
RMS of the corneal elevation maps asymmetric terms. In agreement with Chen and Yoon
[Chen & Yoon, 2008], who had reported that the posterior corneal surface profile is more
irregular than that of the anterior corneal surface in keratoconus, we found much higher pre-
op RMS_assym in the posterior corneal surface than in the anterior corneal surface
(50.0±21.4 µm vs 10.6±5.3 µm). We found that the ICRS did not systematically reduced
RMS_assym in either surface. The thickness redistribution after ICRS implantation has been
suggested as a delay factor in keratoconus progression of the disease, since as cornea
thickens in the weakest areas, the stress may be redistributed and the decompensatory
biomechanical cycle might be delayed [Dauwe et al., 2009]. We did not find a systematic
increase in the minimum thickness or in the corneal thickness regularity, although the
location of minimum thickness tended to move more centrally post-surgery.
(2) 3-D ICRS location
Also, the automatic ICRS volume segmentation allowed a comprehensive characterization of
the implanted ICRS. Migration, rotation or extrusion of the ICRS has been related to surgical
complications. During the first month following ICRS, the wound healing response remains
active, and the increase of myofibroblasts in the ICRS edges may result in slight variations in
ICRS position with time [Perez-Merino et al., 2010]. Previous works have used OCT to
characterize ICRS depth, but did not correct for optical distortion, and the depth
quantification was typically done by analyzing only a few cross sectional OCT images
[Gorgun et al., 2012; Lai et al., 2006; Naftali & Jabaly-Habib, 2013]. Naftali et al. [Naftali &
Jabaly-Habib, 2013] reported significant differences between the planned and measured
ICRS depth (120 µm). In this study, we showed for the first time systematic measurements
of the position of the ICRS in 3-D. Our measurements showed a very good agreement
between the planned depth and the 3-D expected depth (24 µm, on average across all
patients of the study, 7-days post-op), with a higher difference for the manual than for the
femtosecond tunnel technique. The quantification of the ICRS in 3-D also allowed a

KERATOCONUS & ICRS
88
longitudinal analysis of the ICRS rotational angles. ICRS rotation appears to have a major
impact on anterior corneal symmetry, given the correlation between the ICRS tilt around X
and the change in RMS_assym for anterior cornea.
(3) OCT-based corneal aberrometry in keratoconus upon ICRS surgery
As in previous studies reporting the aberrations in keratoconic eyes [Barbero et al., 2002a;
Maeda et al., 2002; Schlegel et al., 2009], we found that the astigmatism and coma were the
dominant aberrations. We also found a high contribution of the trefoil vertical Z3-3
(19%) and
secondary astigmatism Z44 (8%). In general, total and corneal aberrations showed a good
correlation, with the corneal aberrations dominating the ocular wave aberration pattern.
These results are in good correspondence with previous reports of corneal and total
aberrations in keratoconic patients. Despite the high amount of corneal aberrations, total
aberrations are consistently lower than corneal aberrations, likely due to compensatory
effects of the crystalline lens, particularly for astigmatism and spherical aberration. Several
studies in keratoconic eyes have shown that total HOAs are lower than corneal HOAs (by
27.6% [Schlegel et al., 2009] to 34.2% [Barbero et al., 2002a]), in consistency with the
findings of the current study (33.3 %).
Several reports point to a compensatory role of the crystalline lens in astigmatism and coma,
Dubbelman et al. reported an average compensation of 31% [Dubbelman et al., 2006a] of the
anterior corneal astigmatism and 3.5% [Dubbelman et al., 2007a] of the anterior corneal
coma by the posterior corneal surface in a normal population. In keratoconus, Chen and
Yoon [Chen & Yoon, 2008] reported an average compensation of approximately 20% of the
anterior corneal astigmatism and coma by the posterior corneal surface. In this study, we
found a larger compensation of coma (16.1% pre-op and 20.1% post-op), but smaller
compensation of astigmatism (13.9% pre-op and 9.1% post-op). In addition some
compensation occurred for trefoil-terms (7.7% pre-op and 3.1% post-op). Overall, the
posterior cornea compensated, on average, 8.3% (pre-op) and 4.1% (post-op) of the
aberrations of the anterior cornea, with no significant differences in the amount of
compensation pre- and post-operatively. Differences with respect to the anterior/posterior
corneal balances reported in the literature on normal subjects may arise from the large
topographic differences (in anterior and posterior corneal surfaces) of keratoconic (both pre-
and post-operatively) with respect to normal eyes.
While the literature reporting clinical visual performance outcomes is relatively extensive
following ICRS treatment, few studies evaluate aberrations. Piñero et al. [Pinero et al., 2010]
reported a significant improvement in anterior corneal astigmatism (3.21±2.16 µm (pre-op),
2.50±1.73 µm (post-ICRS), a reduction of coma-like anterior corneal aberrations (3.46±1.86
µm (pre-op), 2.94±1.45 µm (post-ICRS), and of anterior corneal HOAs (3.73±1.97 µm (pre-
op), 3.24±1.44 µm (post-ICRS) 3-months post-ICRS implantation, for 6-mm pupils. In
contrast, Chalita and Krueger [Chalita & Krueger, 2004] reported an increase in ocular HOA
in the ICRS-implanted eye, when compared to the non-treated fellow eye. On average, 3-
months post-ICRS implantation we found very small changes (average values not
statistically significant) in HOAs (mean decrease of 2%), coma (mean decrease of 5%) and
trefoil (mean increase of 4%) after ICRS surgery. Furthermore, we found a larger decrease
(although it did not reach statistical significance, on average) of astigmatism (27%). At the

Chapter III. OCT-based Topography and Aberrometry in Keratoconus with ICRS
89
individual level, we have found a reduction of asymmetric aberration term and an overall
significant decrease of aberrations in several patients (up to a decrease of 2.63 µm in
astigmatism, 1.17 µm in coma or 1.63 µm for trefoil). Intersubject variability in the optical
response to ICRS may arise from differences in the corneal biomechanical properties across
patients, and from the difficulty of the treatment to control simultaneously the topographical
and refractive outcomes. In general, the aims of reducing astigmatism, reducing coma or
flattening the cornea (to improve contact lens fitting) were met, at least partially, in most
patients, although a full simultaneous reduction of both overall astigmatism and HOA was
not generally achieved.
The optical findings were in good agreement with visual performance measurements in this
group of patients. As found in previous studies in normal subjects [Cheng et al., 2004;
Schoneveld et al., 2009], we also found significant correlations between optical quality for
HOAs (described by the Visual Strehl optical quality metric at best focus) and visual quality
(Best Corrected Visual Acuity), supporting the value of aberration measurements in
predicting visual performance. The small overall improvement in visual acuity is consistent
with the small improvement in optical quality.
To sum up, this chapter presents:
(1) The first report of comprehensive longitudinal quantification of ICRS surgery based
on OCT, including anterior and posterior corneal geometrical, topographical and
pachymetric analysis, and 3-D location (depth and rotation) of the ICRS. We have
shown that ICRS produced a significant flattening of the anterior corneal surface,
particularly with a 5-mm optical zone diameter. There was a not a systematic
improvement in corneal symmetry, which was influenced by the arc length of the
ICRS, and by the ICRS rotation inside the cornea.
(2) The first report of 3-D OCT-based corneal aberrometry. The high correlation
between the measured corneal and total aberrations indicates that OCT alone could
be used to describe, to a large extent, the optical quality of keratoconic eyes pre- and
post-ICRS treatment, as a result of the predominance of the corneal optics in the
overall optical quality of these eyes. ICRS implantation produced a decrease in
astigmatism, but on average did not produce a consistent decrease of higher order
aberrations, which is consistent with the small increase of visual acuity following
treatment. The effect of the ICRS implantation on optical quality varied across
patients.


Chapter IV. OCT-based Crystalline lens topography in Accommodating Eyes
91
Chapter IV. ACCOMMODATION
OCT-based Crystalline Lens Topography in
Accommodating Eyes
This chapter is based on the following publication:
OCT-based Crystalline Lens Topography in Accommodating Eyes, by P. Pérez-Merino,
M. Velasco-Ocana, E. Martinez-Enriquez, S. Marcos in Biomedical Optics Express
(2015).
The contribution of Pablo Pérez-Merino to the study, in collaboration with other coauthors,
was the literature search, the design of the experiments, the data acquisition (in collaboration
with Miriam Velasco-Ocana), the development of specific routines (in collaboration with
Eduardo Martínez-Enriquez) and the analysis and processing of the data (in collaboration
with Miriam Velasco-Ocana and Eduardo Martínez-Enriquez).

ACCOMMODATION
92

Chapter IV. OCT-based Crystalline lens topography in Accommodating Eyes
93
The young crystalline lens is a unique transparent and biconvex lens with aspheric surfaces
and it shows the ability of focusing objects at different distances [Atchison, 1995; Glasser &
Campbell, 1998b]. However, due to its inaccessibility, knowledge of in vivo geometrical or
optical parameters of the crystalline lens (relaxed or accommodated) is limited. Information
on the crystalline lens provided by commercial or custom-developed instruments is generally
limited to axial properties (e.g., crystalline lens thickness). In particular, most of the data of
the anterior and posterior lens surfaces come from single cross-sections, not revealing
topographic features of the lens.
Different aberrometry studies have also reported the change in the optics of the crystalline
lens with accommodation, describing changes in spherical aberration (towards more negative
values), and an increase in astigmatism and coma [Gambra et al., 2010; He et al., 2000a;
Liang & Williams, 1997b; Lopez-Gil et al., 1998]. Lens aberrations have been measured
either ex vivo (using laser ray tracing [Birkenfeld et al., 2013] or Hartmann-Shack [Roorda &
Glasser, 2004]), or in vivo by subtracting corneal aberrations from total aberrations [Artal et
al., 2001a; Kelly et al., 2004b]. However, although aberrometers allow measuring the optics
of the eye, the relative contribution of the lens surfaces themselves to aberrations is still
poorly understood.
Due to its higher speed, depth range and resolution, OCT has been positioned as a promising
technique for imaging in 3-D the whole anterior segment of the eye [Grulkowski et al., 2009;
Grulkowski et al., 2013; Shen et al., 2010]. However, as we described in previous chapters
OCT images are subject to distortions; so, need to be corrected [Ortiz et al., 2010; Ortiz et
al., 2011; Ortiz et al., 2009a]. Using distortion-corrected OCT, Ortiz et al. [Ortiz et al.,
2012b], reported the first 3-D in vivo surface elevation maps of the human crystalline lens,
Gambra et al. [Gambra et al., 2013] analyzed static and dynamic changes of the crystalline
lens with accommodation, and Sun et al. [Sun et al., 2014] evaluated the surface elevation
maps of donor crystalline lenses of different ages.
In this chapter, we present, for the first time to our knowledge, 3-D surface elevation
crystalline lens changes with accommodation in vivo, and we specifically explored the role
of astigmatism and high-order irregularities of all anterior segment surfaces (cornea and lens)
and their relationship.
4.1. Material and methods
4.1.1. Subjects
Nine eyes from seven young subjects (mean age: 31±3.1 y.o) were studied. Refractive errors
ranged between -5.25 to +0.75 D sphere and -1.25 to 0 D cylinder (Table 4.1). Subjects
signed a consent form approved by the Institutional Review Boards after they had been
informed on the nature and possible consequences of the study, in accordance to the tenets of
the Declaration of Helsinki.

ACCOMMODATION
94
Table 4.1. Individual refractive profile (age and refractive error)
Age (y.o) Sphere (D) Cylinder (D) / axis (deg)
S#1 (OS) 29 -0.5 -0.5 / 20
S#2 (OD) 32 -1.5 -0.5 / 80 S#2 (OS) 32 -1.5 -0.25 / 110
S#3 (OD) 26 -2.5 -0.75 / 150
S#4 (OS) 30 -1.5 -0.25 / 50 S#5 (OS) 36 -5.25 -1.00 / 170
S#6 (OD) 31 -4.25 -1.25 / 175
S#6 (OS) 31 -4.25 -1.25 / 180 S#7 (OS) 33 +0.75 -0.5 / 80
4.1.2. OCT system
The SD-OCT instrument, image processing algorithms, and distortion correction (fan and
optical) to obtain anterior and posterior corneal and crystalline lens topographies from OCT
images was described in chapter II.
For the purposes of this study, an external accommodative channel was incorporated to the
OCT. A Badal system mounted on a motorized stage (VXM-1, Velmex) was used for
compensating defocus and for inducing accommodation. The fixation stimulus consists of a
20/25 white Snellen E-letter presented in a black background on a Digital-Light-Processing
(DLP) picoprojector (854x480 pixels, Philips NV, Amsterdam, Netherlands; 55 lum)
subtending a 5-arcmin visual angle. Two neutral filters (ND 16) were placed after the
picoprojector to produce an average luminance of ~30cd/m2 in an otherwise dark
environment. The OCT axis was aligned with the pupilary axis by moving the fixation
stimulus in 5 pixels-steps horizontally and vertically until the iris appeared flat in the
preview OCT horizontal and vertical cross-sections, so all measurements were acquired
when both OCT and pupilary axis were aligned (Figure 2.7 in Chapter II).
4.1.3. OCT: Experimental Procedure
The subjects viewed the stimulus monocularly, with the contralateral eye covered with a
patch during the measurements. Measurements were collected in 11x11 mm area and
consisted of a collection of 50 B-scans composed by 300 A-scans. The total acquisition time
of a 3-D data set was 0.6 seconds. These parameters showed a good balance between time
acquisition and resolution for further Zernike fit of the surfaces. The anterior segment of the
eye was imaged while stimulating accommodation from 0 to 6 D, in 1.5-D steps. Images
containing artifacts (i.e., eyelids) which precluded corneal and lens surface analysis within
the optical zone were excluded. Five repeated measurements were collected in each
condition after inducing mydriasis with one drop of phenylephrine, which allowed larger
pupils without paralyzing the ciliary muscle.
The specifications of the spectrometer and light source do not allow sufficient axial range to
capture all anterior segment surfaces in a single acquisition. To solve that, three sets of 3-D
images were captured sequentially at 5 seconds after blinking: (1) cornea, (2) anterior lens
and (3) posterior lens, rapidly shifting axially the plane of focus; all 3-D sets of data
contained the iris.

Chapter IV. OCT-based Crystalline lens topography in Accommodating Eyes
95
4.1.4. OCT: Image Processing
In previous studies, we described image-processing tools for distortion correction, denoising,
segmentation and merging of volumes [de Castro et al., 2010; Gambra et al., 2013; Ortiz et
al., 2013; Ortiz et al., 2012b; Ortiz et al., 2010; Ortiz et al., 2011; Ortiz et al., 2009a; Perez-
Merino et al., 2013]. The quantification capabilities of the OCT have been validated ex vivo
with artificial model eyes with known dimensions, and in vivo comparing with other imaging
techniques (videokeratography, Scheimpflug and non-contact profilometry). In this chapter
we incorporated improved signal processing algorithms, including a simpler and more robust
approach to automatic surface segmentation. For every B-scan, simple uni-modal
thresholding and morphological operations on the resulting binary image were used to
generate masks, which allowed identification of signal of interest in the different eye
structures. Segmentation algorithms use properties of these masks (i.e. centroid positions)
and a-priori knowledge on the measurements (i.e. relative position of iris and cornea).
Finally, an AND operation between labeled masks and edges (obtained using a Canny
detector) is performed in order to obtain the layers of interest.
The pupil center (obtained from the automatically identified iris volume) was used as fixed
reference for anterior segment images collected at different depths. Images of the cornea,
anterior lens and posterior lens were merged using this fixed reference for further
registration: (1) the corneal image was inverted (since, for efficiency in the focus range shift,
the cornea was acquired in the opposite side of the Fourier transform) and then (2) the 3-D
volumes of the anterior cornea/iris and posterior lens/iris were shifted to the fixed reference
in order to superimpose these volumes to the anterior lens/iris volume (Figure 2.12 in
Chapter II).
Distortion correction (fan and optical) algorithms were applied on the merged volumes for
quantification by using 3-D ray tracing routines [Ortiz et al., 2010; Ortiz et al., 2011; Ortiz et
al., 2009a, 2009b]. The corneal refractive index was taken as 1.376, the aqueous humor
refractive index as 1.336, and the crystalline lens refractive index was obtained from the age-
dependent average refractive index expression derived by Uhlhorn et al. [Uhlhorn et al.,
2008].
Figure 4.1 illustrates the change in anterior segment biometric and geometrical parameters
following transformation of optical paths to distances and distortion corrections. For
example, distortions produced errors of 38%-17% in the estimates of anterior and posterior
lens radii of curvature.
The beam diameter reduced across surfaces due to refraction. The mean diameters in the
different surfaces were 6.32±0.07 mm at the anterior cornea, 6.17±0.06 mm at the posterior
cornea, 5.47±0.11 mm at the anterior cornea, and 4.74±0.12 mm at the anterior cornea in the
relaxed state (mean±SD for all eyes). For comparison of the surface elevation maps, the
analysis was performed for a constant pupil diameter of 4-mm diameter (common to all
subjects and surfaces, and free of edge artifacts).

ACCOMMODATION
96
Figure 4.1. Illustration of the effect of distortion correction on the anterior segment
surfaces in S#1 (OS). Left data: from optical paths, without distortion correction;
right data: distortion correction.
All signal-processing algorithms run completely automatically with no need of user
interaction. Full computational processing time per eye was 14.6 s (Intel Xeon [email protected]
GHz processor, 8GB RAM).
4.1.5. OCT: Spatial Resolution and Accuracy Considerations
The effective actual resolution, the effect of lateral sampling, and the robustness of the
merging algorithm were investigated, as they all play a role in the accuracy of the lens
surface elevation estimates. A simulation on virtual surfaces with added white noise of
standard deviation equal to nominal axial resolution (1000 realizations), revealed differences
between the original-correct-surface and the noisy surfaces of 2.4 µm (RMS surface
elevation) and 0.28 µm (RMS of the Zernike coefficients). Therefore the error caused by the
axial resolution limit is around half to that given by the nominal OCT axial resolution. Also,
a simulation using 500 random realistic surfaces of 300 A-Scans x 300 B-Scans in a 5x5 mm
which were then subsampled by a sampling factor of 6 in the y-coordinate (as in our
measurement configuration, 50 B-Scans) showed that the RMS error between the generated
and the subsampled surfaces was below 0.3 µm, demonstrating a low impact of sampling in
the lateral resolution of our measurements. Finally, we evaluated the accuracy and robustness
of the merging methodology by removing a percentage of points of the iris (randomly taken
from a uniform distribution) and we compared the estimated center point of the complete and
the subsampled iris. The mean estimation error was below 2 µm for x0, y0 and z0 if we
removed 80% of the iris points.

Chapter IV. OCT-based Crystalline lens topography in Accommodating Eyes
97
4.1.6. Biometric, geometric and surface elevation changes with accommodation
The geometrical distances between ocular elements in the anterior segment were taken from
the apex positions: (1) anterior chamber depth (ACD), distance between the posterior corneal
apex and the anterior lens surface apex, and (2) lens thickness (LT), distance between the
anterior and posterior lens apex (Figure 4.2).
Corneal and lens segmented surfaces were first fitted by spheres, and their radii of curvature
estimated. Corneal and lens surface elevations were obtained by subtraction of the best
fitting spheres from the segmented surfaces. Both, corneal and lens surfaces were fitted by
Zernike polynomial expansions (6th
order; note that these Zernike coefficients describe
surface elevations, and not wave aberrations).
Descriptive parameters of the surface elevation maps include individual surface Zernike
coefficients, the Root Mean Square (RMS) for all high order coefficients (excluding tilt,
defocus and astigmatism) and the RMS of the combination of some terms (RMS
astigmatism, RMS trefoil and RMS coma).
For all computations, the central 4-mm area (with respect to the pupil center) of the cornea
and lens was evaluated, since after ray convergence (optical distortion compensation) this
area is common and free of edge artifacts in all surfaces and conditions, including the
posterior lens surface.
Figure 4.2. (a) Examples of 3-D images in S#2 relaxed (left) and for 6 D of
accommodative demand (right). (b) Corneal (up) and crystalline lens (down),
anterior (left) and posterior (right) surface elevation maps in S#2 (OD) relaxed
accommodation. Data are for 4 mm.

ACCOMMODATION
98
4.1.7. Accommodative response
The accommodative response was estimated from the changes in the anterior segment
biometry data (radii, ACD and LT) with accommodation. A schematic eye model in paraxial
approximation (considering all refractive indices of the eye) was used to analyze the
refractive change of the eye.
Equation 4.1: PC = nh−1
Rc ; PL = (𝑛𝑙 − 𝑛ℎ) (
1
Ra−
1
Rp) +
(nl− nh)2 LT
nl RaRp
Equation 4.2: P = PC + PL −ACD∗Pc∗PL
nh+
(nl− nh)∗ LT∗Pc
nl∗Rp
where P, PC and PL are the power of the eye, cornea and lens, nh and nl are the refractive
indexes of the aqueous humor and the lens, and Rc, Ra and Rp are the radii of curvature
of the cornea, anterior lens and posterior lens
4.1.8. Corneal and lens surface astigmatism axis
The corneal and lens surfaces astigmatism (C) and angle (α) were obtained from the surface
elevation astigmatism Zernike coefficients using equation 4.3:
Equation 4.3: J0 =−2√6C2
2
R2 ; J45 =−2√6C2
−2
R2 ; C = −2√J02 + J45
2 ; α =1
2arctan
J45
J0
If J0 < 0, then meridian = axis + 90 degrees
If J0 = 0, and if J45 < 0, then meridian = 135 degrees
If J0 = 0, and if J45 > 0, then meridian = 45 degrees
If J0 > 0, and if J45 ≤ 0, then meridian = axis + 180 degrees
If J0 > 0, and if J45 > 0, then meridian = axis [Salmon et al., 2003].
We represent anterior and posterior corneal and lens surface astigmatism data in a power
vector graph. The length of the vectors represents the calculated magnitude of surface
astigmatism (in diopters) and the direction of the vectors allows estimating the relative angle
between anterior and posterior corneal and lens astigmatism axis. All vectors were
represented in a polar coordinate system.
4.1.9. Statistics
The changes in lens surfaces with accommodation were analyzed using an analysis of
variance (ANOVA; general linear model for repeated measurements). Significant levels
(ANOVA and pair-wise two tailed comparison t-test) were set at p<0.05. The statistical
significant levels were adjusted by a Bonferroni correction. The statistical tests were
performed using SPSS software (SPSS, Inc., Chicago, Illinois).

Chapter IV. OCT-based Crystalline lens topography in Accommodating Eyes
99
4.2. Results
4.2.1. Anterior and posterior lens surface elevation (relaxed state)
Figure 4.3 shows anterior and posterior surface elevation maps (3rd
and higher-order terms)
and figure 4.4. the Zernike terms (also including astigmatism), in all eyes in the relaxed state.
The posterior lens shape generally shows higher magnitude than the anterior lens in some
higher order terms.
On average, for the unaccommodated state, the individual dominant high-order irregularities
of the anterior lens surface were horizontal/vertical (H/V) astigmatism (Z22), oblique trefoil
(Z3-3
), and spherical (Z40), accounting for 15%, 11% and 21% of the variance, respectively.
For the posterior lens surface, the individual dominant high-order irregularities were oblique
astigmatism (Z2-2
) and vertical quadrafoil (Z44), accounting for 48% and 32% of the variance,
respectively.
The RMS of high-order irregularities and astigmatism of the posterior lens surface was
statistically significantly higher than that of the anterior lens surface (high-order
irregularities: x2.02, p<0.0001; astigmatism: x1.58, p=0.01).
Figure 4.3. Anterior and posterior crystalline lens elevation surface maps in the
unaccommodated state (maps exclude tilt, defocus and astigmatism).

ACCOMMODATION
100
Figure 4.4. Anterior and posterior crystalline lens surface Zernike coefficient (plots
include astigmatism and high-order terms; pupil diameter is 4-mm).
4.2.2. Comparison of Zernike coefficients of ocular surfaces (cornea and
crystalline lens)
An analysis of repeatability showed highly reproducible Zernike coefficient across repetitive
measurements (average SD for all high-order Zernike coefficients) within each surface: 0.33
µm (anterior cornea), 0.57 µm (posterior cornea), 0.29 µm (anterior lens), 0.59 µm (posterior
lens), in the relaxed state.
Table 4.2 shows correlations of anterior and posterior corneal and anterior and posterior
crystalline lens Zernike coefficients in the relaxed state. A significant correlation indicates
that the magnitudes of individuals Zernike coefficients are closely associated. We found
strong positive correlation in H/V astigmatism (Z22), spherical (Z4
0), vertical coma (Z3
-1) and
secondary astigmatism (Z4-2
and Z42) between corneal surfaces, and strong negative
correlation in vertical coma (Z3-1
) and oblique trefoil (Z3-3
) between lens surfaces. We further
investigated the relationship between corneal and lens surfaces. There is significant positive
correlation in the spherical aberration (Z40) between anterior corneal and anterior lens
surfaces and significant negative correlation in lateral coma (Z31) and positive correlation in
vertical trefoil (Z3-3
) between anterior corneal and posterior lens surfaces.

Chapter IV. OCT-based Crystalline lens topography in Accommodating Eyes
101
Table 4.2. Pearson correlation coefficient and p-value for individual Zernike
coefficients in corneal and lens surfaces in the relaxed state.
Cornea Lens Cornea & Lens
Ant vs Post Ant vs Post Ant Cornea vs
Ant Lens
Ant Cornea vs
Post Lens
Astigmatism Z2
-2 r=0.55; p=0.15 r=-0.25; p=0.5 r=-0.57; p=0.1 r=-0.35; p=0.3
Z22 r=0.79; p=0.01* r=0.63; p=0.08 r=-0.37; p=0.3 r=-0.37; p=0.3
Spherical Z40 r=0.79; p=0.02* r=-0.34; p=0.41 r=0.83; p=0.01* r=-0.19; p=0.6
Coma Z3
-1 r=0.69; p=0.05* r=-0.74; p=0.03* r=-0.39; p=0.3 r=0.53; p=0.16
Z31 r=0.39; p=0.33 r=0.06; p=0.87 r=-0.03; p=0.9 r=-0.73; p=0.03*
Trefoil Z3
-3 r=0.42; p=0.28 r=-0.71; p=0.04* r=-0.33; p=0.4 r=0.82; p=0.01*
Z33 r=0.33; p=0.41 r=0.62; p=0.09 r=0.15; p=0.7 r=-0.26; p=0.5
Secondary Astigmatism
Z4-2 r=0.83; p=0.01* r=0.28; p=0.49 r=-0.25; p=0.5 r=-0.35; p=0.3
Z42 r=0.97; p=0.001* r=-0.33; p=0.38 r=0.42; p=0.3 r=-0.15; p=0.7
Figure 4.5 shows the average Zernike coefficients of all subjects (astigmatism and high-order
terms) of the corneal and lens surface elevation maps in the relaxed state. The higher corneal
coefficients were the horizontal astigmatic terms Z2-2
, followed by the spherical term Z40.
Corneal surface astigmatism was significantly higher in the posterior than in the anterior
cornea (p<0.001). The sign of the average Zernike surface coefficients in the anterior and
posterior crystalline lens surfaces is opposite in some coefficients (i.e. Z22, Z3
-1, Z3
-3 and Z4
4).
As shown in Figure 4.5, on average (all subjects) anterior and posterior corneal surfaces
Zernike terms are positively correlated (r=0.97, p<0.0001), while anterior and posterior lens
surfaces Zernike terms are negatively correlated (r=-0.43, p=0.04).
Figure 4.5. (a) Cornea and crystalline lens surface elevation Zernike terms
(astigmatism and high-order) in the relaxed state (average over all subjects). (b)
Cornea and crystalline lens individual Zernike coefficients (high-order) in the
relaxed state.

ACCOMMODATION
102
4.2.3. Phenylephrine vs natural anterior lens surface topography
Figure 4.6 compares the Zernike coefficients of the anterior crystalline lens surface between
phenylephrine and natural conditions, for different levels of accommodation. RMS
differences range between 0.41 µm and 0.81 µm. The correlation between Zernike
coefficients of the lens surface elevation in both conditions were high (r=0.85-0.97,
p<0.0001).
Fig. 4.6. Natural vs phenylephrine conditions in the anterior crystalline lens surface
(Zernike coefficients) for all accommodative demands.
4.2.4. Changes in anterior segment geometry and biometry with accommodation
For the relaxed state, the average ACD was 3.43±0.21 mm, central lens thickness was
3.88±0.19 mm, and the average anterior and posterior lens radii of curvature were
13.07±1.28 mm and -6.48±0.51 mm respectively. ACD decreased at a rate of 0.04±0.01
mm/D (Figure 4.7a) and lens thickness increased at 0.04±0.01 mm/D (Figure 4.7b) with
accommodative demand. Both anterior and posterior lens surfaces became steeper with
accommodation (particularly the anterior lens surface): anterior and posterior lens radii of
curvature changed at rates of 0.78±0.18 and 0.13±0.07 mm/D (Figure 4.7c and 4.7d). The
ranges of radii of curvature, ACD and lens thickness in the accommodated state, as well as
their change with accommodative demand, are consistent with those reported in the literature
[Gambra et al., 2013]. On average, the standard deviation across subjects and
accommodative states in axial distances were 0.028 mm in ACD and 0.027 mm in lens
thickness. The optical power of the lens was estimated for all subjects at all accommodative
demands (Figure 4.7e). It ranges from 17.5 to 22.7 D in the relaxed state and from 21.5 to
25.9 D for 6 D of accommodative demand. The average change was 0.81±0.19 D per D of
accommodative demand.

Chapter IV. OCT-based Crystalline lens topography in Accommodating Eyes
103
Figure 4.7. Biometric and geometrical changes with accommodation: (a) Anterior
Chamber Depth, (b) Lens Thickness, (c) Anterior Lens Radius and (d) Posterior Lens
Radius (e) Accommodative response vs Accommodative demand in all subjects.
4.2.5. Changes in anterior and posterior lens surface elevation with
accommodation
Figure 4.8 shows an example (S#2, OS) of the corneal and lens segmented surfaces from the
OCT image (left) and the corresponding anterior and posterior lens surface elevation maps
for different accommodative states (right).

ACCOMMODATION
104
Figure 4.8. Example of the anterior segment segmented surfaces (corneal and lens) with
accommodation (left) and the corresponding lens surface elevation maps for different
accommodative demands (right). Data are for subject S#3. Pupil diameter in maps is 4-
mm.
Figure 4.9 shows changes in RMS of high-order irregularities, astigmatism, coma, trefoil and
spherical as a function of accommodative demands. High-order irregularities, astigmatism,
coma and trefoil increased with accommodation by a factor of x1.44 (p<0.05), x1.95
(p<0.05), x1.95 and x1.28 in the anterior lens surface (between 0 and 6 D), respectively, and
changed by a factor of x1.04, x1.10, x1.39 and x1.33 in the posterior lens surface (between 0
and 6 D), respectively. Interestingly, we found a notch at 3 D for the RMS high-order
irregularities, RMS coma and RMS trefoil in 7/9 subjects in the posterior lens surface, but
this was not found to be statistically significant. As in previous studies reporting the wave
aberrations, we found that the spherical term changed towards negative values with
accommodation in the anterior lens surface but this tendency is not observed in the posterior
lens surface.

Chapter IV. OCT-based Crystalline lens topography in Accommodating Eyes
105
Figure 4.9. Average RMS of high-order irregularities, astigmatism, coma, trefoil
and spherical for different accommodative demands. Data are for 4-mm pupils.
Table 4.3 shows the average relative contribution (in terms of variance, RMS2) of the lower
and higher order Zernike terms (astigmatism, coma, trefoil, spherical term, 4th
order and of
5th
and higher-order coefficients). In the relaxed state, the spherical term accounts for most of
the surface irregularity in the anterior lens (47%). However, with accommodation, the
astigmatism is the predominant surface irregularity (accounting for 90% of the variance). In
contrast, the posterior lens surface astigmatism accounts for 70% of the variance in the
relaxed state, but with accommodation its contribution decreased.
Table 4.3. Relative contribution (in terms of %) of different Zernike terms to the
overall surface elevation maps (for 4-mm pupils).
Anterior Lens Surface Posterior Lens Surface
0 D 1.5 D 3 D 4.5 D 6 D 0D 1.5 D 3 D 4.5 D 6 D
Astigmatism 17.05 93.16 91.03 94.05 94.52 70.06 48.13 21.20 3.33 68.67
Coma 3.12 5.35 2.76 0.46 0.53 1.33 0.10 7.47 3.59 13.10 Trefoil 13.13 0.67 1.96 0.06 0.06 2.45 6.85 14.88 0.31 3.07
Spherical 47.32 0.03 2.87 4.44 4.44 1.73 26.17 34.21 54.87 6.24
4th order 19.06 0.74 1.34 0.97 0.97 23.31 18.14 21.69 36.36 7.98 Others 0.30 0.03 0.01 0.01 0.01 1.11 0.58 0.53 1.51 0.91
4.2.6. Corneal and lens surface astigmatism magnitude and axes with
accommodation
On average, the astigmatic axis of the anterior and posterior corneal surfaces tends to be
aligned (6.2±2.1 deg). In the relaxed state of accommodation, the astigmatic axis of the
anterior lens surface is moderately rotated with respect to the anterior cornea (27±25 deg, on
average). Furthermore, the anterior and posterior lens astigmatism axes differed by 80±42
deg.

ACCOMMODATION
106
Figure 4.10 shows a power vector analysis of surface astigmatism in anterior and posterior
lens surface in all eyes, for all accommodative demands. Individually, the relative angle
between corneal astigmatic axis and anterior lens astigmatic axis was <20 deg in 5/9 eyes
(S#1 (OS), S#2 (OS), S#3 (OD), S#6 (OD) and S#6 (OS)), >20 and <50 deg in 3/9 eyes
(S#2, S#6 and S#9) and > 80 deg in 1/9 eyes (S#4 (OS)). In contrast, the relative angle
between the anterior and posterior lens was around 90 deg in 7/9 eyes (S#1 (OS), S#3 (OS),
S#4 (OS), S#5 (OS), S#6 (OD), S#6 (OS) and S#7 (OS)), while was <10deg in 2/9 eyes (S#2
and S#3). At the maximum accommodative demand the relative angle between anterior and
posterior lens was on average 90±43 deg, around 40 deg in 3/9 eyes (S#2 (OD), S#2 (OS)
and S#4 (OS)), around 90 deg in 3/9 eyes (S#1 (OS), S#6 (OS) and S#6 (OS)) and >120 deg
in 3/9 eyes (S#3 (OD), S#5 (OS) and S#7 (OS)). The average change of the astigmatism
angle with accommodation was 15±11 deg and 21±18 deg in the anterior and in the posterior
lens surface, respectively.
Figure 4.10. Power vector polar plot of astigmatism in anterior and posterior
crystalline lens surfaces, for different accommodative demands. Each panel
represents a different eye. Red lines stand for anterior lens and blue lines for
posterior lens astigmatism. Each line type represents a different accommodative
demand. The angle represents the axis of astigmatism and the length of the vectors
represents the magnitude of the corresponding surface astigmatism.
Figure 4.11 shows the change in the magnitude of astigmatism with accommodative demand.
In the relaxed state, the magnitude of astigmatism was higher in the posterior lens surface but
this tendency reversed in most subjects with accommodation.
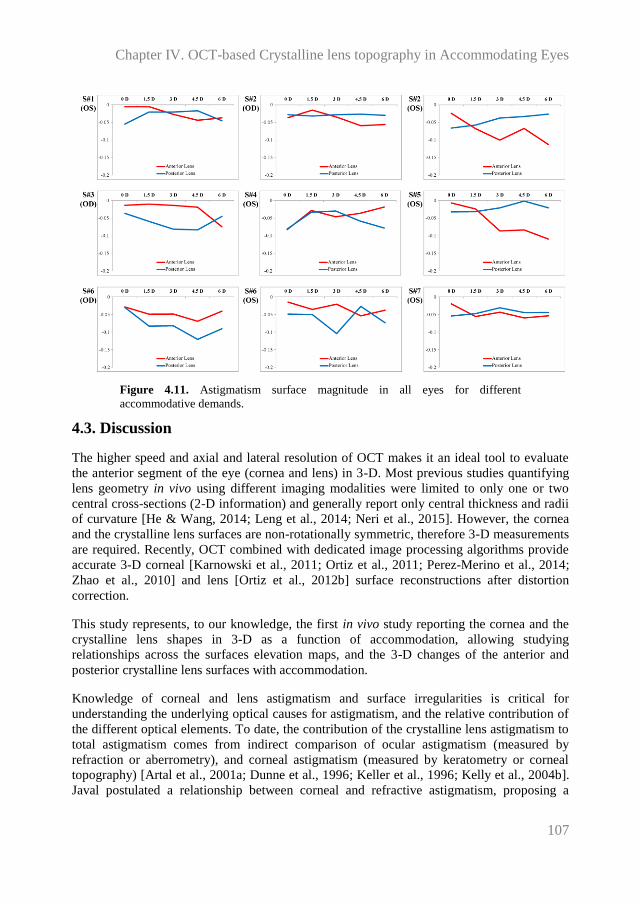
Chapter IV. OCT-based Crystalline lens topography in Accommodating Eyes
107
Figure 4.11. Astigmatism surface magnitude in all eyes for different
accommodative demands.
4.3. Discussion
The higher speed and axial and lateral resolution of OCT makes it an ideal tool to evaluate
the anterior segment of the eye (cornea and lens) in 3-D. Most previous studies quantifying
lens geometry in vivo using different imaging modalities were limited to only one or two
central cross-sections (2-D information) and generally report only central thickness and radii
of curvature [He & Wang, 2014; Leng et al., 2014; Neri et al., 2015]. However, the cornea
and the crystalline lens surfaces are non-rotationally symmetric, therefore 3-D measurements
are required. Recently, OCT combined with dedicated image processing algorithms provide
accurate 3-D corneal [Karnowski et al., 2011; Ortiz et al., 2011; Perez-Merino et al., 2014;
Zhao et al., 2010] and lens [Ortiz et al., 2012b] surface reconstructions after distortion
correction.
This study represents, to our knowledge, the first in vivo study reporting the cornea and the
crystalline lens shapes in 3-D as a function of accommodation, allowing studying
relationships across the surfaces elevation maps, and the 3-D changes of the anterior and
posterior crystalline lens surfaces with accommodation.
Knowledge of corneal and lens astigmatism and surface irregularities is critical for
understanding the underlying optical causes for astigmatism, and the relative contribution of
the different optical elements. To date, the contribution of the crystalline lens astigmatism to
total astigmatism comes from indirect comparison of ocular astigmatism (measured by
refraction or aberrometry), and corneal astigmatism (measured by keratometry or corneal
topography) [Artal et al., 2001a; Dunne et al., 1996; Keller et al., 1996; Kelly et al., 2004b].
Javal postulated a relationship between corneal and refractive astigmatism, proposing a

ACCOMMODATION
108
compensation of -0.5 D of against-the-rule corneal astigmatism by the internal optics.
However, the Javal rule has been adjusted over time, either based on theoretical
considerations or clinical data [Dunne et al., 1996; Grosvenor et al., 1988; Keller et al.,
1996]. Artal et al. [Artal et al., 2001a] and Kelly et al. [Kelly et al., 2004b] found significant
negative correlation for anterior corneal horizontal/vertical total and internal astigmatism of
the internal optics, suggesting at least a partial compensation for corneal astigmatism by the
lens in a relaxed state.
Our results suggest that compensation of astigmatism does not only happen between the
cornea and the crystalline lens but also between the lens surfaces of the ocular components.
In agreement with prior work by Dubbelman et al. [Dubbelman et al., 2006a; Dubbelman et
al., 2007a] we found that on average the posterior corneal surface compensated part of the
irregularities of the anterior cornea, in particular astigmatism (31% [Dubbelman et al.,
2006a] / 18% in the current study) and coma (from 3.5% [Dubbelman et al., 2007a] / 12% in
the current study). As in the cornea, our study also revealed a high correlation between the
magnitude of the irregularities of the anterior and posterior lens surfaces in coma and trefoil
terms, indicating coordinated development. Although we did not find correlations between
the magnitude of astigmatism of the anterior and posterior crystalline lens surfaces, the
tendency in many subjects for orthogonal astigmatic axis in anterior and posterior lens
(which we had also shown in vivo in a preliminary study on three young subjects) also
indicates compensatory processes accounted by lens geometry. Interestingly, this tendency
was also reported in some ex vivo eyes by Sun et al. [Sun et al., 2014] on isolated crystalline
lenses, more frequently in younger than older lenses.
Our study did not directly address the presence of Gradient Index (GRIN) distribution in the
lens, and its potential role in our findings. Siedlecki et al. [Siedlecki et al., 2012] found that a
homogeneous index could overestimate the posterior lens asphericity but not the posterior
lens radius of curvature. Previous work on isolated lenses shows that GRIN plays in fact a
major compensatory role for the spherical aberration in the young eye [Birkenfeld et al.,
2014; de Castro et al., 2013], by shifting lens spherical aberration towards more negative
values, and therefore compensating the spherical aberration of the cornea. With
accommodation, de Castro et al. [de Castro et al., 2012] found more negative aberration and
a larger shift toward more negative values. However, although posterior lens surface shape
estimation could have a benefit by increasing knowledge of the lens GRIN (especially in the
spherical Zernike terms), it should be noted that ex vivo GRIN distribution represent more
closely values the GRIN in a maximally accommodated state and it is unlikely that GRIN
plays a major role in non-rotationally symmetric aberrations. In fact, in a recent study on the
impact of shape and GRIN on the astigmatism of isolated lenses, Birkenfeld et al.
[Birkenfeld et al., 2013] found little influence of GRIN on the magnitude and axis of lens
astigmatism.
Overall, our results of the crystalline lens surface elevation in vivo hold similarities with
those that we recently reported on ex vivo human donor lenses [Sun et al., 2014]. As in this
study, we found significant correlations between anterior and posterior vertical coma and
vertical trefoil (ex vivo data showed correlations also in several other high order terms).
However, we found in vivo significantly higher astigmatism and high-order irregularities in
with the posterior lens surface than in the anterior lens surface, which was not reported ex

Chapter IV. OCT-based Crystalline lens topography in Accommodating Eyes
109
vivo. Differences between results in vivo and ex vivo may be associated to the lack of zonular
tension in the isolated lenses, which may be responsible for some of the irregularities in the
posterior lens in vivo. In fact isolated lenses adopt its more accommodated form, and
therefore, lens surface elevations from ex vivo data are more representative of
accommodating lenses.
As the lens accommodates, many studies have demonstrated accommodation-induced
changes in aberrations of the eye, which include changes in spherical aberrations, and to a
lesser extent in astigmatism, coma, and trefoil [Gambra et al., 2010; He et al., 2000a; Lopez-
Gil et al., 1998; Roorda & Glasser, 2004]. The most relevant high order aberration change in
the lens with accommodation is the negative shift of spherical aberration (due to changes in
radii of curvature and asphericity, and to a lesser extent GRIN). Although some of these
changes may be associated to some changes in lens tilt with accommodation [Rosales et al.,
2008], our results show that changes in lens surface astigmatism (including relative
anterior/posterior astigmatic angle shifts between 10 and 20 deg) can also occur. We also
found some systematic (not monotonic) changes in high order surface terms, coma and
trefoil in particular, with accommodation, both for anterior and posterior lens surfaces.
In summary, quantitative OCT imaging in accommodating eyes has allowed us to evaluate
changes in the anterior segment of the eye with accommodation, including 3-D corneal and
lens surface elevation maps, allowing us to gain insights on the geometrical changes
undergone by the eye with accommodation, and the relative contribution of the different lens
surfaces to the optics of the eye, including astigmatism and high-order aberrations. Further
studies on a larger population of different age and/or refractive profiles will allow gaining
insights on the role of the crystalline lens on the age-dependent changes of the eye’s optics.

110

Chapter V. OCT-based Geometry and Aberrometry in Patients with A-IOLs
111
Chapter V. PRESBYOPIA-CATARACT AND IOL
OCT-based Geometrical Evaluation and
Aberrometry of Patients Implanted with
Accommodative IOLs
This chapter is based on the following publications:
1. Three-Dimensional Evaluation of Accommodating Intraocular Lens Shift and
Alignment In Vivo, by S. Marcos, S. Ortiz, P. Pérez-Merino, J. Birkenfeld, S. Durán,
I. Jimenez-Alfaro, in Ophthalmology (2014).
2. Aberrometry in Patients Implanted with Accommodative Intraocular Lenses, by P.
Pérez-Merino, J. Birkenfeld, C. Dorronsoro, S. Ortiz, S. Durán, I. Jimenez-Alfaro
and S. Marcos, in American Journal of Ophthalmology (2014).
The contribution of Pablo Pérez-Merino to the study, in collaboration with other coauthors,
was the literature search, the design of the experiments, the customization of the measuring
instruments (in collaboration with Sergio Ortiz), the data acquisition, the development of
specific routines (in collaboration with Sergio Ortiz) and the analysis of the data (in
collaboration with Sergio Ortiz).

PRESBYOPIA-CATARACT & IOL
112

Chapter V. OCT-based Geometry and Aberrometry in Patients with A-IOLs
113
With aging, the crystalline lens first loses its capability to accommodate to near and far
objects (presbyopia), and later it loses transparency (cataract). An emerging solution for
presbyopia and cataract correction are accommodative intraocular lenses (A-IOLs), artificial
lenses that would replace the aged crystalline lens of the eye, ideally mimicking the dynamic
focusing capability of the young human crystalline lens in response to the ciliary muscle
contraction, and which would restore both lens transparency and accommodation [Glasser,
2008].
In the last years, A-IOLs have been proposed that aim at restoring accommodation, ranging
from FDA-approved A-IOLs to conceptual proposals, and relying on various principles of
operation (axial shifts, lateral shifts or curvature-changing surfaces) [Cumming et al., 2006;
McLeod et al., 2007]. Most studies on A-IOLs primarily report visual functional outcomes
based on the patient’s visual function, showing than the subjective accommodative response
after A-IOL implantation was close to the magnitude of standard monofocal IOLs [Beiko,
2013; Tahir et al., 2010]. Whereas subjective tests assess visual performance at different
distances, the results provided cannot generally conclude whether the A-IOLs are actually
working according to their functional mechanism [Leydolt et al., 2009; Macsai et al., 2006;
Tucker & Rabie, 1980].
Alternatively, aberrometry and biometry to evaluate whether A-IOLs are operating as
expected appear as highly suitable objective techniques to evaluate the optical performance
and to visualize the movement of A-IOLs with accommodation. With aberrometry, Dick and
Kaiser [Dick & Kaiser, 2002] found small changes in defocus in patients implanted with the
Crystalens AT-45 (Bausch&Lomb, Rochester, NY) and 1CU (HumanOptics AG, Erlangen,
Germany) A-IOLs; and Wolffsohn et al. [Wolffsohn et al., 2010] reported some changes in
ocular aberrations (defocus, astigmatism, coma and trefoil) with increased accommodative
demand in eyes implanted with the Tetraflex A-IOL (model KH-3500; Lenstec, St.
Petersburg, FL) [Wolffsohn et al., 2010]. Using high-frequency ultrasound biomicroscopy
(UBM) and partial coherence interferometry (PCI), Marchini et al. [Marchini et al., 2004]
reported a forward mean shift of 0.32 mm at 1-month after A-IOL implantation (with several
eyes showing backward shifts), Stachs et al. [Stachs et al., 2006] described a forward a mean
shift of 0.24 mm under pilocarpine treatment, and Koeppl et al. [Koeppl et al., 2005]
detected only negligible counterproductive backward movement of the AT-45 with
pilocarpine-induced accommodation. While there have been attempts for 3-D imaging with
UBM technology, most studies solely report the ACD based on cross-sectional images.
Apart from slight axial shifts of the Crystalens in the axial direction, observational studies
have also reported asymmetric vaulting in the IOL associated to IOL tilt (caused by capsular
contraction or by asymmetric fibrosis in the haptic region), known as Z syndrome [Yuen et
al., 2008]. So, measurement of tilt with this IOL is particularly relevant because the hinged
design of the haptic and the effect of accommodative forces onto the lens likely play a role in
IOL alignment.
Recently, Ortiz et al. [Ortiz et al., 2013] quantified full 3-D anterior segment geometry and
biometry in patients implanted with IOL with distortion-corrected OCT, reporting also IOL
tilt. While quantification of the 3-D position of the A-IOL with accommodation by using

PRESBYOPIA-CATARACT & IOL
114
OCT will assess whether the mechanism of operation of the A-IOL complies with the
expected design, aberrometry will be essential to understand the causes why eyes appear to
gain near vision functionality with these A-IOLs. In fact, a future link between geometrical
factors and optical outcomes may be established by means of customized eye models.
In this chapter we measured 3-D biometry (with distortion-corrected OCT) and ocular
aberrations (with LRT) and for different accommodative demands in 22 eyes implanted with
Crystalens AO A-IOL. These measurements will allow evaluating the objective
accommodative response, aberrations, depth-of-focus and 3-D the changes in IOL position in
Crystalens A-IOL eyes at different accommodative states.
5.1. Methods
5.1.1. Patients, surgery and A-IOLs
Twenty-two eyes from eleven patients were measured (age: 75±4 years old, ranging from 67
to 81 years old; spherical equivalent: -0.5±0.4 D, ranging from -1.25 D to 0.75 D) in this
prospective observational study. Consecutive patients scheduled for cataract surgery with
good general health and meeting the inclusion criteria (age > 50 years old; manifest
astigmatism < 1.5 D; and bilateral cataract considered as the sole cause of visual acuity
decrease) were invited to participate. All enrolled patients provided informed consent after
they have been informed on the nature and consequences of the study. The protocols had
been approved by the Institutional Review Boards (IRB) of the Fundación Jiménez-Díaz
(Madrid, Spain), and met the tenets of the Declaration of Helsinki.
Patients were implanted with the Crystalens AO A-IOL. This lens has a biconvex single-
optic design, with aspheric anterior and posterior surfaces (nominally aiming at zero IOL
aberration, according to the manufacturer). The IOL power (selected using the SRK/T and/or
the Holladay II formula) of the implanted IOLs ranged from 19.50 to 24.50 D.
All procedures were performed by the same surgeon (Dr. Sonia Durán) using standard
phacoemulsification under local anesthesia The IOLs were implanted using a purpose-
designed injector through a clear suture-less corneal incision created in superior/temporal
and superior/nasal locations in the right and left eyes respectively, and enlarged to
approximately 2.8 mm. Anterior curvilinear capsulorhexis (6.5-mm intended diameter) was
created manually. All surgeries were uneventful, and all IOLs were successfully implanted
intracapsulary.
5.1.2. Control groups: young control group and monofocal IOL group
In addition to the patients implanted with A-IOLs, we also measured wave aberrations in
young eyes (n=17; age: 28±4 years old, ranging from 21 to 34 years old; spherical
equivalent: -0.2±0.6 D, ranging from -1.0 D to +1.25 D) under natural conditions and similar
accommodative demands than in Crystalens patients. Subjects were recruited specifically for

Chapter V. OCT-based Geometry and Aberrometry in Patients with A-IOLs
115
this study among normal volunteers, following a standard ophthalmological exam, and
signed IRB-approved informed consents before undertaking the study.
An additional control group includes an aged-matched group of pseudophakic patients
implanted with monofocal IOLs (n=17; age: 74±9; patients implanted with Tecnis and
Acrysof aspheric IOLs).
5.1.3. OCT: measurements
The OCT images were acquired using a custom developed SD-OCT system (from a
collaborative effort with Copernicus University, Torun, Poland) previously described in
chapter II.
For the purposes of this study, a motorized Badal system to stimulate accommodation was
incorporated in the fixation channel. Fixation is provided by a mini-display, which allows
projection of accommodating targets. The desired accommodative demand was produced by
changing the distance between the two lenses of the Badal system, which allowed a change
in vergence while keeping constant retinal and pupil magnification. The motor was moved in
synchronization with the image acquisition program in the OCT system.
Images were acquired pre- and post-operatively (at 3 months). Pre-operative measurements
were conducted under natural conditions, for relaxed accommodation. Post-operative
measurements were typically conducted in two sessions. In a first session, measurements
were obtained under instillation of phenylephrine. In a second session, measurements were
obtained under natural conditions (which allowed monitoring of the natural pupil diameter),
and then 30 min after instillation of 1% pilocarpine, to pharmacologically stimulate
accommodation.
Patients were stabilized by means of a bite bar and ask to fixate text (20/25 Snellen E-letters)
in the fixation channel minidisplay (SVGA OLED LE400, LiteEye Systems). The position of
the fixating letters was moved across the display until the cornea was aligned with the optical
axis of the instrument. To achieve a full 3-D anterior segment image three images (50 B-
scans, composed by a collection for A-scans in a 7x15 mm lateral area), with the OCT beam
focused in the cornea, anterior and posterior lens were obtained sequentially. Three
accommodative demands (0, 1.25, and 2.5 D) were produced with the Badal optometer, and
the patient requested to focus the text on the display. Three full anterior segment images
were obtained per accommodation condition. Each image was obtained in 0.72 seconds.
Image collection protocols were similar in the natural viewing and phenylephrine conditions.
Collection of all images for each condition typically took around 30 minutes. The pilocarpine
condition only involved acquisition of one series of images, for a fixed position of the Badal
optometer.

PRESBYOPIA-CATARACT & IOL
116
5.1.4. OCT: data analysis
3-D Reconstructions of Full Anterior Segment
Full anterior segment images (from the anterior corneal surface to the posterior lens surface)
were obtained pre- and post- operatively. Automatic clustering analysis allowed automatic
identification of the cornea, iris and lens. The iris plane and 3-D coordinates of the pupil
center were used to register pre- and post-operative anterior segment images in the same eye,
as well post-operative anterior segment images in the same eye for different accommodative
demands. Due to the high accuracy of image registration, cornea and iris appear merged
across conditions.
Anterior Chamber Depth (ACD)
ACD was obtained from the OCT data as the distance between the posterior corneal apex
and the anterior lens surface apex. In contrast to ACD obtained from a single A-scan (as in
PCI), ACD is consistently measured along the same axis, independently on the fixation
stability of the subject.
Natural Lens Thickness
The crystalline lens thickness was obtained from OCT data as the distance between the
anterior and posterior lens vertex.
IOL tilt
Crystalline lens/IOL tilt was obtained from OCT data as the angle between the axis of the
lens and the pupillary axis. The Lens/IOL axis is defined as the vector that joins the apexes
of the anterior and posterior lens surfaces apexes. The pupillary axis is defined as the vector
that joins the center of curvature of the anterior cornea and the pupil center. Crystalline
lens/IOL tilt were computed for pre-operative and post-operative (all accommodative
demands) measurements under phenylephrine.
Capsulorhexis and haptic axis.
The margins of the capsulorhexis and the locations of the haptics were identified from en
face OCT images obtained under phenylephrine pupil dilation. The diameter and centration
(with respect to the lens optical zone) of the capsulorhexis were estimated, by circumference
fitting. Also the polar coordinates of the haptics were obtained by estimating the axes of the
visualized haptics (0º indicating a horizontal axis, 90º vertical axis, and 135º
temporal/superior and nasal/superior in the right and left eye, respectively).

Chapter V. OCT-based Geometry and Aberrometry in Patients with A-IOLs
117
5.1.5. Laser Ray Tracing: measurements
Total wave aberrations were measured in Crystalens AO A-IOL implanted patients 3 months
after surgery using a custom-developed LRT (described in Chapter II), for three different
accommodation stimuli.
Measurements were conducted in two sessions. In a first session, measurements were
performed under natural conditions. In a second session, measurements were obtained under
instillation of phenylephrine, which allowed larger pupils without paralyzing the ciliary
muscle.
The same instrument was used to measure aberrations under natural conditions and three
different accommodation stimuli in the young eyes, and under dilated pupils (tropicamide
1%) and relaxed accommodation in monofocal IOL eyes.
In Crystalens eyes, the pupil ranged from 4 to 6 mm after inducing mydriasis
(phenylephrine) and from 2 to 4 mm in natural conditions. In young control eyes, the natural
pupil ranged from 4 to 6.5 mm (natural conditions), and in the monofocal IOL eyes from the
pupil ranged from 4 to 6 mm (tropicamide 1%).
For the purposes of this study (static measurements of aberrations under steady
accommodation), an open-field external fixation channel was incorporated in the LRT setup
to stimulate accommodation. The subjects viewed the stimulus monocularly (the
contralateral eye was covered with a patch during the measurement). The desired
accommodative demand was produced by changing the fixation distance. The far fixation
target (4 m) was the middle letter in the last line seen by each patient in an ETDRS chart
(typically corresponding to a 20/25 visual acuity). The intermediate and near fixation targets
were the middle word of the last line read by each patient in ETDRS test intermediate vision
(80 cm, equivalent to 1.25 D) and near vision (40 cm, equivalent to 2.5 D) charts,
respectively. The size of the stimulus was therefore adjusted to the visual acuity of each
patient and condition. Each set of measurements consisted of 5 runs under the same
conditions for every fixation target (far, intermediate and near), and the results presented are
the average of 5 repeated measurements.
5.1.6. Laser Ray Tracing: data analysis
Wave aberrations were fitted by Zernike polynomials expansions up to the 6th
order. The
change of defocus (Z20), astigmatism (Z2
2 and Z2
-2), coma (Z3
1 and Z3
-1), trefoil (Z3
3 and Z3
-3)
and spherical aberration (Z40) with accommodative demand were specifically analyzed. Root
mean square (RMS) was also used to report the magnitude of high order aberrations
(excluding tilt, defocus and astigmatism) and of certain characteristic aberrations
(astigmatism, coma and trefoil). When averaging individual Zernike coefficients across eyes,
the mirror symmetry terms were flipped in right eyes to account for the enantiomorphism of
the right and left eyes.

PRESBYOPIA-CATARACT & IOL
118
The accommodative response was obtained as the difference between the accommodative
demand and the measured effective defocus. The effective defocus takes into account
potential interactions between 2nd
order Zernike defocus term and the 4th
order Zernike
spherical aberration, as well as potential changes in pupil diameter with accommodation, and
was defined as:
Equation 5.1: 𝑀 =−4√3𝐶2
0+12√5𝐶40−24√7𝐶6
0
𝑅2
Previous studies have shown that the spherical error computed using eq. 5.1 agrees well with
that computed from the best focus using retinal plane image quality metrics.
Unless otherwise noted, the analysis was done for a 4-mm pupil diameter for all eyes (under
dilated pupils) and for the natural pupil diameter in each eye and condition (under natural
viewing conditions).
Additionally, the astigmatism (C) and its angle (α) was analyzed from Zernike polynomials
expansion by using equation 2:
Equation 5.2: 𝐽0 =−2√6𝐶2
2
𝑅2 ; 𝐽45 =−2√6𝐶2
−2
𝑅2 ; 𝐶 = −2√𝐽02 + 𝐽45
2 ; 𝛼 = 𝑎𝑟𝑐𝑡𝑎𝑛
𝐽45
𝐽0
2
The point-spread-function (PSF), the modulation transfer function (MTF) and the Optical
Transfer Function (OTF) were computed using Fourier optics from Zernike coefficients
using routines written in Matlab (MathWorks, Natick, MA).
Depth of focus (DoF) was estimated from through-focus objective optical quality. The
optical quality metric used in the computations was Visual Strehl. Visual Strehl was
computed as the volume under the Visual MTF (MTF weighted by a general Neural Transfer
Function) normalized to diffraction limit. Visual Strehl was evaluated through-focus in 0.125
D defocus steps. All computations considered high-order aberrations (HOAs) up to 6th
order,
and cancelling the astigmatism terms. Computations were done for the natural pupil size, as
well as for a fixed 3-mm pupil diameter for comparison across subjects. Two standard
definitions of DoF were used, one based on a relative metric, and the other on an absolute
metric. DoF was defined as the dioptric range for which Visual Strehl was at least 50% the
maximum Visual Strehl value in the through-focus Strehl curve (relative definition) and as
the dioptric range for which Visual Strehl was above 0.12 (absolute definition).
5.1.7. Statistical analysis
Univariate analysis (independent samples Student´s t-test) was used to evaluate the
differences in the evaluated parameters across different accommodative demands.
Differences between aberrations and DoF in eyes implanted with A-IOLs, young subjects
and eyes implanted with monofocal IOLs were analyzed with one-way ANOVA.

Chapter V. OCT-based Geometry and Aberrometry in Patients with A-IOLs
119
5.2. Results
5.2.1. Anterior Chamber Depth (ACD)
Average ACD was 2.64±0.24 mm pre-operatively, and 3.65±0.35 mm post-operatively
(relaxed accommodation). Measurements of ACD were highly reproducible (average
standard deviation of repeated measurements of 0.015 mm pre-operatively and 0.035 mm
post-operatively). Independent measurements of ACD post-operatively with dilated pupils
under phenylephrine, and under natural conditions were not statistically significantly
different. There was a high statistical correlation of ACD between right and left eye pre-
operatively (Figure 5.1.A, r=0.9342, p=0.0001). The correlation was still significant post-
operatively (Figure 5.1.B, r=0.9276, p=0.0032 for measurements with phenylephrine;
r=0.8397, p=0.0123 for measurements under natural conditions), excluding S#3, which very
consistently showed high ACD post-operative values (4.46 mm) in the left eye. There was a
statistically significant correlation between pre-operative and post-operative ACD (Figure
5.1.C, r=0.438, p<0.0001 for measurements with phenylephrine; and r=0.399; p<0.0001 for
measurements under natural conditions). We found a highly significant correlation between
post-operative ACD and post-operative spherical equivalent (r=0.655; p=0.0017). Interocular
(right/left eye) differences in ACD are also significantly correlated with interocular
differences in spherical equivalent (r=0.713; p=0.02).
Figure 5.1.D shows the post-operative ACD measured (for all accommodative stimuli) under
phenylephrine versus natural accommodation. There is a highly statistical significant
correlation (r=0.99; p<0.0001) between the two types of data (obtained in different sessions).
Compared to intersubject differences, the relative shift of the A-IOL with stimulated
accommodation is almost negligible. We did not find significant correlations between the A-
IOL shifts under phenylephrine or natural accommodation. Similarly, we did not find overall
significant correlations between A-IOL shift under natural (or phenylephrine)
accommodation and pilocarpine-induced accommodation, very likely due to the small
amount of effective A-IOL shifts. In five eyes however, we found consistent shift signs in
both natural and pilocarpine-induced accommodation.
Figure 5.1.E represents a merged pre- and postoperative 3-D image showing both the
crystalline lens and the implanted A-IOL (relaxed accommodation) with phenylephrine in
patient S#8-OD. The relative position of the IOL with respect to the natural lens can be
observed. The anterior surface of the IOL sits 0.71 mm behind the anterior surface of the
preoperative natural crystalline lens and is more tilted superiorly.

PRESBYOPIA-CATARACT & IOL
120
Figure 5.1. (A) Pre-operative ACD in left versus right eye; (B) Post-operative
ACD in left versus right eye (both under natural and phenylephrine conditions); (C)
Pre-operative versus post-operative ACD (both under natural and phenylephrine
conditions); (D) Post-operative ACD under natural conditions (for different
accommodative demands) versus Post-operative ACD under phenylephrine
stimulation. (E) Three-dimensional (3-D) view of merged full anterior segment 3-D
OCT images in a same patient before and after Crystalens A-IOL implantation.
ACD stands for Anterior Chamber Depth. OD: right eye; OS: left eye.
5.2.2. Changes in ACD with Accommodative Effort
There was not a consistent shift of the A-IOL with accommodative effort. A-IOLs shifted on
average by +0.0050.025 mm for an accommodative effort of 1.25 D and +0.0080.03 mm
for an accommodative effort of 2.5 D, under phenylephrine, and -0.0060.036 mm and
+0.010.02 mm respectively under natural conditions. The average A-IOL shift under
stimulated accommodation with pilocarpine was -0.020.20 mm. The measured A-IOL shift
values are above the accuracy of the technique, but clinically not significant. Figure 5.10
shows the relative shifts of the A-IOL as a function of accommodative effort in right (solid
lines, solid diamonds) and left eyes (dashed lines, open circles) of all patients, both under
phenylephrine (Figure 5.2.A) and natural conditions (Figure 5.2.B). The post-operative ACD
measured under pilocarpine accommodation is also shown for reference (solid squares).
Some eyes (8 under phenylephrine and 9 under natural conditions) experienced a forward
move of the A-IOL with accommodative effort (1.25 D of accommodative stimulus), as
expected from design, while others moved backward. In general a larger shift (in absolute
values) was elicited by the 1.25 D accommodative stimulus than by a 2.5 D accommodative
stimulus (thus the V or inverted V-shape of the shift vs accommodative stimulus functions in
Figure 5.2). With pilocarpine, 8 A-IOLs moved forward (-0.190.22 mm, on average) and 12
moved backward (+0.090.22 mm, on average). We did not find a significant correlation

Chapter V. OCT-based Geometry and Aberrometry in Patients with A-IOLs
121
between the A-IOL shift in the right eye and left eye (under phenylephrine or under natural
conditions). The correlation between the pilocarpine-induced A-IOL shift in right and left
eye was statistically significant (r=0.843, p=0.0023). However, only in S#6 the A-IOL shift
was relevant in both eyes (-0.49 and -0.52 mm, in right and left eye respectively). Figure
5.2.C represents a merged postoperative 3-D image showing the implanted IOL for 3
accommodative demands (0, 1.25 D and 2.5 D) in patient S#11 (under natural conditions),
with the IOL volume depicted in different colors for each accommodation. The IOL moved
backward (opposed as expected) with accommodation (by 700 μm from 0 to 2.5 D of
accommodation).
Figure 5.2. Relative shift of the A-IOL as a function of accommodative demand
(solid diamonds, OD; open circles, OS) and pilocarpine stimulation (solid squares;
P in the legend). Positive shifts indicate backward A-IOL movement, and negative
shift forward lens movement. (A) Phenylephrine; (B) natural; (C) 3-D view of the
anterior segment.
5.2.3. Lens thickness
Average pre-operative crystalline lens thickness was 4.53±0.22 mm. The standard deviation
of repeated lens thickness measurements was 0.030 mm (averaged across eyes). Pre-
operative lens thickness was highly correlated between right and left eyes (Figure 5.3,
r=0.79; p=0.006). However, we did not find an association between pre-operative lens
thickness and A-IOL shift (in any of the conditions under test). Also pre-operative lens
thickness was not statistically correlated with the difference of pre-operative and post-
operative ACD.

PRESBYOPIA-CATARACT & IOL
122
Figure 5.3. Lens central thickness preoperatively, OS vs OD.
5.2.4. IOL tilt
Lens tilt was measured with reproducibility of 0.79 deg around the x-axis, and of 0.44 deg
around the y-axis. There were no differences in the measurement reproducibility between the
crystalline lens, A-IOL and across different accommodative efforts. The lens average tilt
magnitude was 5.71 deg pre-operatively (crystalline lens) and 5.01 deg post-operatively (A-
IOL, relaxed accommodation). The intersubject variability in lens tilt was lowest for the
natural lens (standard deviation=1.30 deg) and highest for the A-IOLs with increasing
accommodative effort (2.46, 3.02 and 3.19 deg, for A-IOL at 0, 1.25 and 2.5 D of
accommodative effort, respectively). Figure 5.4 shows the horizontal and vertical
coordinates of tilt in right (A and C) and left (B and D) eye, both pre-operatively (A and B)
and post-operatively (phenylephrine, all accommodative efforts, C and D). Pre-operatively
the crystalline lens was systematically tilted around the vertical axis by 5.1 deg on average
with the nasal side of the lens forward (positive OD). Also, the lens tends to tilt around the
horizontal axis (by 1.96 deg on average) with the superior side of the lens moved forward.
There is a high mirror symmetry in natural lens tilt between left and right eyes (r=0.847;
p=0.0019). Post-operatively (relaxed accommodation), the nasal/temporal symmetry between
left and right eye IOL tilt is lost (r=0.237; p=0.5): in 2 eyes the nasal side of the lens IOLs
tilted further backward, and in 8 eyes tilted forward. There is a slight trend for the lens to
superior side of the lens to move further backward. Two eyes (S#9-OD and S#10-OS
experienced large shifts in IOL alignment with respect to the natural lens), showing tilts
around y of more than 9 deg for the relaxed state of accommodation.
Figure 5.4 shows A-IOL tilt around x (E) and around y (F) as a function of accommodative
effort, in all eyes (right eyes indicated by diamonds/solid lines and left eyes by
circles/dashed lines). While the tilt around y (nasal/temporal tilt) remained fairly constant
with accommodative effort the tilt around x (superior/inferior) varied significantly with
accommodative effort in most eyes showing the characteristic V/inverted V-patterns found in
other parameters (A-IOL shift and pupil diameter) with accommodative effort. In 12 eyes the
superior side of the IOL moved backward and in 8 eyes forward with accommodative effort.
On average, the IOL tilted around the x-axis 1.65 deg for 1.25 D, and 1.53 deg for 2.5 D of
accommodative effort. The largest A-IOL tilt change (9.5 deg) during accommodative effort

Chapter V. OCT-based Geometry and Aberrometry in Patients with A-IOLs
123
occurred for S#1-OS. There was no correlation between the relative tilt of the implanted A-
IOL (relaxed state) with respect to the natural lens and its change with accommodation.
Figure 5.4. Pre-operative (A, B) and Post-operative (C, D) lens tilt coordinates on
right (A, C) and left (B, D) eyes. (E) A-IOL Tilt around x (superior/inferior); (F) A-
IOL tilt around y (nasal/temporal). Tilts around x represent superior/inferior tilts.
Tilts around y represent nasal/temporal tilts. OD: Right eye; OS: Left eye; D:
diopters.
5.2.5. Capsulorhexis and haptic axis
The average measured capsulorhexis diameter was 4.88±0.72 mm (3-months post-
operatively). The capsulorhexis was generally elliptical in shape, and slightly smaller than
the intended diameter, likely due to fibrosis-induced shrinkage. The magnitude of the
capsulorhexis shifts with respect to the IOL center was 0.34±0.30 mm on average.
Horizontal shifts ranged from 0.22 temporal to 0.63 mm nasal in the right eye, and were
consistently temporal in the left eye; vertical shifts ranged from 1.33 superior to -0.63 mm
inferior. In the left eye, the largest tilts tended to occur for the largest capsulorhexis
diameters and largest capsulorhexis shifts. No significant correlation was found between the
direction of capsulorhexis shift and the tilt orientation.
The average haptic polar orientation was 129.95±20.38 deg, consistent with the 120 deg (11
o’clock) incision location, in both left and right eyes. We did not find significant correlations
between horizontal and vertical components of the haptic polar orientations and the
measured tilts around horizontal and vertical axes. Tilt changes with accommodation tended
to correlate with slight polar rotations in the lens (up to 6.9 deg).

PRESBYOPIA-CATARACT & IOL
124
5.2.6. Individual aberrations: unaccommodated state
Figure 5.5 shows astigmatism and relevant high order Zernike terms/orders in Crystalens and
control groups (monofocal IOL and young) for the un-accommodated state, averaged across
eyes in each group (for 4-mm pupils). We found significant differences (p<0.005) in
astigmatism, HOA RMS and vertical trefoil (Z3-3
) between IOLs groups (Crystalens
accommodative IOL and monofocal IOL) and young control group. The average HOA RMS
wavefront error was 0.18±0.05 µm (ranging from 0.06 µm to 0.28 µm) in Crystalens eyes,
0.20±0.08 µm (ranging from 0.11 µm to 0.47 µm) in monofocal IOL eyes and 0.09±0.04 µm
(ranging from 0.03 µm to 0.17 µm) in young eyes, for 4-mm pupil diameters. Repeated wave
aberration measurements were highly reproducible within each subject: average HOA RMS
standard deviations for repeated measurements were 0.05, 0.04 and 0.03 µm, for Crystalens,
monofocal IOL and young control eyes respectively.
Figure 5.5. Astigmatism (left) and high order Zernike terms/orders (right) in A-
IOLs (Crystalens) and control (monofocal IOLs and young) groups for the un-
accommodated state, averaged across eyes. Data are for 4-mm pupils. D stands for
diopters and µm stands for microns; * stands for statistical significance at a level of
p<0.005).
Table 5.1 shows the contribution of selected high order aberrations (Z40, coma (Z3
-1, Z3
1) and
trefoil (Z3-3
, Z33)) to total RMS. Vertical trefoil (Z3
-3) was the predominant high order
aberration in the Crystalens group (-0.08 µm, 33.15% of the total RMS) and in the
monofocal IOL control group (-0.09 µm, 35.73% of the total RMS), and significantly higher
(p<0.0001) than in the young control group (-0.003 µm, 3.39% of the total RMS). Individual
coma Zernike coefficients were not statistically significantly different between Crystalens
and control groups (monofocal IOL and young). The coma RMS was significantly higher
(p<0.005) in Crystalens (0.08±0.04 µm) and in monofocal IOL group (0.10 ± 0.07 µm) than
in the young control group (0.05±0.02 µm). Spherical aberration was not statistically
significantly different across the three groups (0.02±0.03 µm in the Crystalens group; 0.02 ±
0.03 µm in the monofocal IOL group, 0.02±0.02 µm in the young group), indicating that, on
average, aspheric designs correct for corneal spherical aberration in a similar proportion than
the crystalline lens in young subjects. Nevertheless, due to the lower amount of other
aberrations, the contribution of spherical aberration to HOA is much higher in the young
control group (21.20% of the total RMS).

Chapter V. OCT-based Geometry and Aberrometry in Patients with A-IOLs
125
Table 5.1. Percentage of some relevant high order aberration terms (Z40, Z3
-1, Z31, Z3
-3
and Z33) to total high-order aberrations root-mean-square in the unaccommodated state
for the Crystalens (Accommodative Intraocular Lenses ), monofocal Intraocular Lenses
and young groups.
Crystalens (%) Monofocal IOL (%) Young (%)
Z40 10.13 7.35 21.20
Z3-1 4.17 13.15 0.78
Z31 7.87 0.74 12.75
Z3-3 33.15 35.72 3.39
Z33 14.98 20.21 5.08
5.2.7. Individual aberrations: changes with accommodative stimulus
Figure 5.6 shows average ocular 2nd
and higher-order Zernike coefficients, and the
corresponding wave aberration maps (excluding tilt, but including defocus, astigmatism and
HOAs; and excluding tilt, defocus and astigmatism, but including HOAs) for Crystalens eyes
(top: A, B, C) and for young eyes (bottom: D, E, F) for far, intermediate (1.25 D) and near
(2.5 D) vision respectively for 4-mm pupil diameters, under phenylephrine (Crystalens) and
natural condition (young control). In the Crystalens group wave aberrations maps are similar
across accommodative demands, whereas in the young control group the wave aberration
maps show drastic changes (in defocus, but also, to a lesser extent, in HOA). On average, the
defocus term (Z20), astigmatism or high order aberrations did not change systematically with
accommodative demand in Crystalens eyes. On the other hand, as expected, young eyes
showed highly statistically significant changes in the defocus term (p<0.001), and in the
spherical aberration (Z40) which shifted towards less positive values with accommodation
(p<0.005). Additionally, vertical trefoil (Z3-3
, p=0.09), vertical coma (Z3-1
, p=0.02) and
secondary vertical astigmatism (Z4-4
, p=0.05) showed changes with accommodation in the
young control group.

PRESBYOPIA-CATARACT & IOL
126
Figure 5.6. Average Zernike coefficients and wave aberration maps for different
accommodative demands in A-IOLs (Crystalens) and young control groups. Data
are for phenylephrine (Crystalens) and natural (young) conditions, and for 4-mm
pupils. Zernike coefficients are shown up to the 4th order. Wave aberration maps
are calculated from average Zernike coefficients up to the 5th order excluding
piston and tilt and (B, E), and excluding piston, tilt, defocus and astigmatism (C,
F).

Chapter V. OCT-based Geometry and Aberrometry in Patients with A-IOLs
127
Figure 5.7 shows the accommodative change of defocus (left) and astigmatism (right),
expressed in diopters, in all Crystalens eyes under phenylephrine. Some Crystalens eyes
(24%) experienced significant changes in defocus with accommodative demand (S#1 (OS),
S#2 (OD), S#2 (OS), S#3 (OD), and S#3 (OS)), although the direction for the change
differed across subjects. While an accommodative response consistent with effective near
accommodation should show a negative shift in the Zernike defocus term (as seen in the
control group), seven Crystalens eyes (S#2 (OS), S#3 (OS), S#4 (OS), S#5 (OS), S#7 (OS),
S#10 (OD) and S#11 (OD)) actually changed defocus in the opposite direction. The largest
change in defocus with accommodative demand (approximately 0.4 D) occurred for S#2
(OD). Additionally, some subjects (14%) showed significant changes in astigmatism with
different accommodative demands (S#1 (OS), S#10 (OS), and S#11 (OD) for intermediate).
A larger change in defocus and astigmatism was generally observed for the 1.25 D than for a
2.5 D accommodative demand. The absolute average defocus shift across accommodative
demands was 0.11 D between intermediate-far, and 0.10 D between near and far. The
absolute average difference in astigmatism was 0.09 D between intermediate and far, and
0.10 D between near and far.
Figure 5.7. Relative change in defocus (left) and astigmatism (right), in diopters, in
all Crystalens (A-IOLs) eyes as a function of accommodative demand. Data are for
measurements under phenylephrine and 4-mm pupil diameters. OD: solid symbols;
OS: open symbols.
Figure 5.8 shows the change of the HOA RMS, spherical aberration (Z40), coma-like terms
(Z31 and Z3
-1), and trefoil-like terms (Z3
3 and Z3
-3) with accommodative demand in all
Crystalens subjects, for 4-mm pupil diameters and under phenylephrine. Most eyes
experienced slight changes in aberrations with accommodative demand. In many cases, the
largest change occurred for 1.25 D of accommodative demand, and decreased for 2.5 D.
S#11 (OD) showed the largest change in HOA RMS (approximately 0.05 µm), for 1.25 D of
accommodative demand. This eye showed significant increase in coma, trefoil and spherical
aberration (p<0.05). Conversely, other eyes (e.g., S#1 OD) also showed significant changes
(p<0.05) in coma, trefoil and spherical aberration, but towards more negative values.

PRESBYOPIA-CATARACT & IOL
128
Figure 5.8. Relative change in root-mean-square high-order aberrations (top left),
spherical (top right), coma (bottom left) and trefoil (bottom right) of all Crystalens
(A-IOLs) subjects as a function of accommodative demand. Data are for
measurements under phenylephrine and 4-mm pupil diameters. OD: solid symbols;
OS: open symbols.
5.2.8. Wave aberrations with phenylephrine and natural viewing conditions
Measurements of defocus and astigmatism (and its angle) measured in different sessions and
conditions (phenylephrine and natural viewing) in Crystalens eyes did not show significant
differences between conditions (Figure 5.9). The average deviations were less than 0.01 D in
defocus (mean defocus 0.037 D and 0.047 D for phenylephrine and natural conditions,
respectively), less than 0.037 D in astigmatism (mean astigmatism -0.95 D and -0.91 D for
phenylephrine and natural conditions, respectively), and less than 8.3 deg in astigmatic angle
(-4 and 4.3 deg with phenylephrine and natural conditions, respectively).

Chapter V. OCT-based Geometry and Aberrometry in Patients with A-IOLs
129
Figure 5.9. Defocus for natural conditions versus defocus with phenylephrine in A-
IOLs (Crystalens group) (left). Astigmatism for natural conditions vs astigmatism
with phenylephrine in A-IOLs (Crystalens group) (right). Lines are linear
regressions of the data.
5.2.9. Change in accommodative response with accommodative demand
Figure 5.10 shows the accommodative response in Crystalens eyes (left) and young control
eyes (right) estimated for natural viewing conditions using equation 5.1. For Crystalens eyes,
on average, the effective defocus (M) did not show significant differences between
conditions: 0.03±0.33 D (intermediate-far) and 0.03±0.32 D (near-far). Mean pupil diameter
(Crystalens group) was 3.90±0.64 mm for far, 3.72±0.47 mm for intermediate and 3.59±0.64
mm for near. As found for paraxial defocus, most Crystalens eyes did not show significant
accommodative responses. In addition, while some Crystalens eyes (14%) showed
significant accommodative responses in the expected direction (S#1 (OS), S#2 (OD), S#7
(OD)), other eyes (14%) respond in the opposite direction (S#3 (OS), S#7 (OS) and
S#11(OD)). Figure 5.10 (right) shows for comparison the effective defocus changes in the
young control group. The accommodative response in young eyes was on average -
0.79±0.25 D (intermediate-far) and -1.67±0.30 D (near-far). The accommodative lag varied
across subjects and was on average 0.46±0.25 D (ranging from 0 to 0.7 D) and 0.82±0.30 D
(ranging from 0 to 1.03 D) D for 1.25 and 2.5 D stimuli, respectively. Mean pupil diameter
in the young control group was 5.62±0.83 mm for far, 5.45±0.76 mm for intermediate and
5.17±0.69 mm for near.

PRESBYOPIA-CATARACT & IOL
130
Figure 5.10. Accommodative response as a function of accommodative demand,
relative to 0, computed from the corresponding changes in defocus, spherical
aberration and pupil diameter, under natural conditions. Crystalens (A-IOL) group
(left); Young control group (right). OD: solid symbols; OS: open symbols.
5.2.10. Depth-of-focus
Figure 5.11 shows the through-focus Visual Strehl in Crystalens (top left, 3-mm pupil;
bottom left, natural pupil), monofocal IOL control (top middle, 3-mm pupil), and young
control (top right, 3-mm pupil; bottom middle, natural pupil) groups, as well as the average
through-focus Strehl ratio for all groups and conditions (bottom right). Maximum Visual
Strehl in the Crystalens group (0.42±0.15 for natural pupil diameter, and 0.61±0.11 for 3-mm
pupils) was significantly lower (p=0.05 and p<0.0005, for natural pupil and 3-mm pupil
diameters, respectively) than in the young control group (0.56±0.21 for natural pupil
diameter and 0.88±0.08 for 3-mm pupils) and marginally lower (p=0.09) than in the
monofocal IOL group. Despite the large intersubject variability (arising from differences in
the subjects’ HOA and pupil dynamics), the differences in optical quality between the
Crystalens and young control groups are attenuated with natural pupils, mostly as a result of
the age-related smaller pupil size of Crystalens eyes (3.90±0.64 mm, un-accommodated
state) in comparison to the young eyes (5.62±0.83 mm, un-accommodated state).

Chapter V. OCT-based Geometry and Aberrometry in Patients with A-IOLs
131
Figure 5.11. Through-focus Visual Strehl for the Crystalens (A-IOLs) group (top
left, 3-mm pupil diameter; bottom left, natural pupil diameter), monofocal IOL
group (top middle, 3-mm pupil diameter), and young group (top right, 3-mm pupil
diameter; bottom middle, natural pupil diameter). (Bottom right) Average through-
focus groups for the Crystalens (A-IOL) group (black lines) and for the control
groups (gray lines, monofocal IOL and young), for 3-mm (solid) and natural
(dashed) pupil diameters.
Depth-of-focus (DoF) was estimated from the Visual Strehl through-focus curve for each
eye. Figure 5.12 shows the DoF for relative and absolute definitions (3-mm pupil, top;
natural pupil, bottom). The Crystalens group shows the largest DoF in all conditions
compared to the control groups. For 3-mm pupil, the relative DoF definition yields a value of
1.02±0.15 D for the Crystalens group, and 0.77±0.12 D for the young control group. DoF of
the Crystalens group is statistically significantly higher than the DoF of the monofocal IOL
group (p=0.04, relative definition, 3-mm pupil) and than the DoF of the young control group
(p<0.0005, relative definition, 3-mm pupil, p<0.005; absolute definition, natural pupil,
p<0.0005).
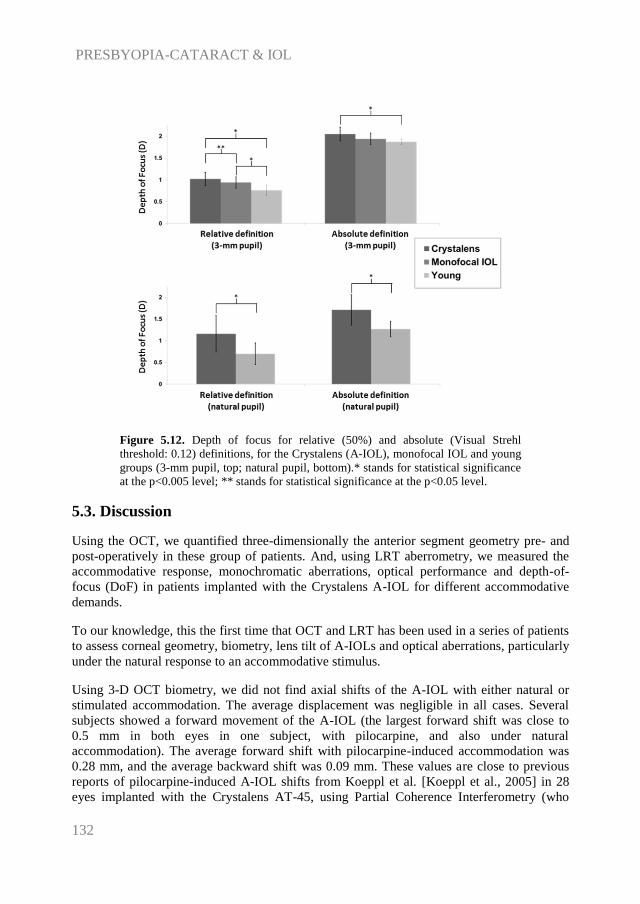
PRESBYOPIA-CATARACT & IOL
132
Figure 5.12. Depth of focus for relative (50%) and absolute (Visual Strehl
threshold: 0.12) definitions, for the Crystalens (A-IOL), monofocal IOL and young
groups (3-mm pupil, top; natural pupil, bottom).* stands for statistical significance
at the p<0.005 level; ** stands for statistical significance at the p<0.05 level.
5.3. Discussion
Using the OCT, we quantified three-dimensionally the anterior segment geometry pre- and
post-operatively in these group of patients. And, using LRT aberrometry, we measured the
accommodative response, monochromatic aberrations, optical performance and depth-of-
focus (DoF) in patients implanted with the Crystalens A-IOL for different accommodative
demands.
To our knowledge, this the first time that OCT and LRT has been used in a series of patients
to assess corneal geometry, biometry, lens tilt of A-IOLs and optical aberrations, particularly
under the natural response to an accommodative stimulus.
Using 3-D OCT biometry, we did not find axial shifts of the A-IOL with either natural or
stimulated accommodation. The average displacement was negligible in all cases. Several
subjects showed a forward movement of the A-IOL (the largest forward shift was close to
0.5 mm in both eyes in one subject, with pilocarpine, and also under natural
accommodation). The average forward shift with pilocarpine-induced accommodation was
0.28 mm, and the average backward shift was 0.09 mm. These values are close to previous
reports of pilocarpine-induced A-IOL shifts from Koeppl et al. [Koeppl et al., 2005] in 28
eyes implanted with the Crystalens AT-45, using Partial Coherence Interferometry (who

Chapter V. OCT-based Geometry and Aberrometry in Patients with A-IOLs
133
reported an average backward shift of 0.136 mm), and from Stachs et al. [Stachs et al., 2006]
in 4 patients implanted with the Crystalens AT-45, using custom-developed 3-D UBM (who
reported an average forward shift of 0.13 mm). Those A-IOL axial shifts are too small to
produce a clinically relevant dioptric shift.
The correlation of the biometric measurements pre- and post-operatively gives also some
interesting insights on the mechanism of the A-IOL. As expected, anterior chamber depth
(ACD) and lens thickness (LT) are highly correlated in right and left eyes, pre-operatively.
The right-left correlation of ACD post-operatively indicates that the overall axial position of
the A-IOL is driven by anatomical parameters, primarily the size of the anterior segment, as
previously suggested in monofocal IOLs [Olsen, 2006]. However, we did not find a fine-
tuning of the IOL location (in relaxed accommodation) within the capsular bag. Olsen et al.
[Olsen, 2006] found in patients implanted with monofocal IOLs that the post-operative ACD
is linearly related with the pre-operative ACD as well as with LT, and used this finding as a
predictor for the estimated lens position, through the C-constant, which would account for
the role of haptic angulation and biomechanical features of the IOL platform in the actual
axial location of the IOL. The fact that we could not determine a C-constant for this lenses
(due to the high dispersion of the correlation of ACDpre-ACDpost vs lens thickness)
suggests that the lens does not sit on a well-defined location within the lens capsule, very
likely as the result of the hinged haptic design, and therefore its axial position in a relaxed
accommodation state cannot be finely defined. In addition, the fact that we could not
establish a correlation between lens thickness and A-IOL shift suggests that other factors
beyond the lens anatomy (e.g., capsular fibrosis) play a role in the A-IOL ability to move
within the eye and in the direction of displacement.
Quantitative 3-D OCT also allowed accurate measurements of the A-IOL tilt, both pre-
operatively and post-operatively at different accommodative demands. Knowledge of the
relative location of the implanted A-IOL within the capsular bag, and potential changes with
accommodation provides additional insights into the mechanism of the A-IOL. As previously
reported we found a nasal-temporal tilt of the natural lens (close to 5 deg on average), highly
symmetric across left and right eyes. While the left-right symmetry of lens tilt and
decentration occurs in some eyes (as previously reported in pseudophakic eyes implanted
with monofocal IOLs), the lack of a general symmetric pattern, changes in orientation of the
lens tilt, and the presence of large relative lens tilts (with respect to the pre-operative lens
orientation) indicate a certain degree of instability in the A-IOL alignment, likely due to the
hinged nature of the haptics in this lens.
Cases of very large IOL tilts in patients implanted with the Crystalens have been reported in
the literature, known as “Z syndrome” [Yuen et al., 2008]. We also found significant
increase in lens tilt with accommodative effort. Very interestingly this tilt happens primarily
around the x axis (superior/inferior tilt), closer to the orientation of the hinged IOL haptics.
However, we did not find a significant correlation between the haptic axis coordinates and
tilt coordinates, nor between the size or decentration of the capsulorhexis and the coordinates
of tilt. Remarkably, in the left eye trends were found between the capsulorhexis diameter and
decentration magnitude and the magnitude of IOL tilt. Asymmetric fibrosis is likely to play
a role on this effect.

PRESBYOPIA-CATARACT & IOL
134
Incidentally, the location of the incision (and therefore the haptic axis) seems to play a
critical role in the tilt outcomes. The non-mirror symmetric location of the incision (temporal
in the right eye and nasal in the left eye) may be related to the disrupture of the right/left eye
lens tilt symmetry that was found in the natural lens. Whereas in the right eye the nasal-
inferior of the natural lens tends to be preserved post-operatively, in the left eye, the
variability in tilt around y is largely increased, perhaps reflecting tensions between the
capsular bag natural orientation and the lens axis location.
The biometric findings in the eyes implanted with the Crystalens can be correlated with
optical findings obtained with the LRT, both in terms of magnitude and direction of the A-
IOL shifts. With OCT we found that Crystalens axial shifts with accommodative demand
ranged from 0.07 to -0.1 mm, being consistent with the defocus shifts ranging from 0.43 to -
0.36 D found with LRT.
The positive shifts are opposite to the expected A-IOL shift/defocus change, and the overall
magnitudes are below clinical relevance. Our data therefore confirm that this A-IOL does not
produce a relevant change in eye optical power by axial shifts of its position. Also, in
keeping with the observation that the 1.25 D stimulus elicited relatively larger
accommodative A-IOL shifts, we also found larger changes in defocus (and aberrations) for
the 1.25 D intermediate accommodation demand, in most subjects.
While spherical aberration changed significantly in young accommodating eyes, we did not
find, on average, significant changes in spherical aberration with accommodation in
Crystalens eyes. Individually, most eyes did not show significant changes in spherical
aberration with accommodative demand, although some showed significant shifts towards
more positive values, and others towards more negative values, indicating that, even if
modifications in the A-IOL surface might occur leading to optical changes, these are not
systematic nor can reliably produce the desired accommodative response. In fact, our
estimates of accommodative response, integrating changes in defocus, spherical aberration
and pupil diameter, do not show functional accommodation in any of the eyes.
Crystalens and monofocal IOL eyes show significantly higher amounts of astigmatism and
higher-order aberrations than young eyes. The increased trefoil found both in Crystalens and
monofocal IOL eyes may be associated with incision-induced corneal aberrations, as shown
by a prior study [Guirao et al., 2004]. However, the fact that trefoil increased with
accommodative demand in some eyes suggests also some lenticular involvement.
Increased astigmatism may be related to the incision, but also to tilt of the IOL. Very
interestingly, in general, eyes with the higher amount of post-operative astigmatism, coma
and trefoil are those for which larger amounts of tilt: e.g., S#10 (OS) showed the largest
amount of astigmatism (0.75 ± 0.05 µm) and also large tilts around x and y (tilt x = -4.86 ±
1.15 deg; tilt y = 9.10 ± 1.15 deg).
Hence, we found correlations between RMS HOAs (r=-0.48; p=0.038), RMS astigmatism
(r=-0.47; p=0.041) and RMS trefoil (r=-0.61; p=0.005) and the tilt around x, for the un-
accommodated state. Although not significant, we observed slight correlations between the

Chapter V. OCT-based Geometry and Aberrometry in Patients with A-IOLs
135
RMS coma and the magnitude of tilt (r=0.37; p=0.12). In addition, we observed some trend
between changes in aberrations and in tilt with accommodative demand: e.g., astigmatism vs
tilt around x for near vision (r=0.47; p=0.04); coma vs tilt around x for near vision (r=0.38;
p=0.09)). Some differences in the accommodative response may occur since 3-D biometry
and aberrometry were measured in different instruments (OCT and LRT, respectively),
influenced by differences in the accommodation target (single letter vs word) and stimulus
(Badal vs proximity), ambient illumination (0.2 vs 3.4 cd/m2), and alignment of the subject.
The high intersubject variability in the high order aberrations and their change with
accommodation agrees with reports by Wolffsohn et al. [Wolffsohn et al., 2010] in eyes
implanted with another axial-shift based A-IOL (Tetraflex).
The high “amplitudes of accommodation” measured by push-up test, defocus curves or
reading performance in Crystalens eyes reported by some previous studies (i.e. 2.42 D and
1.74 D respectively) [Alio et al., 2004; Macsai et al., 2006] may be confounded by multiple
factors. It has been speculated that the functional visual performance in Crystalens eyes may
be in fact achieved by pseudo-accommodation, rather than true optical power changes
[Beiko, 2013]. Increased aberrations (such as those produced by increased A-IOL tilt and
corneal aberrations, as shown here) result in increased depth-of-focus. Using Visual Strehl as
optical quality metric, we found that the DoF was expanded on average approximately 0.2 D
over normal young eyes and 0.1 D over monofocal IOL, with the differences being
systematic and statistically significant. While this amount may not represent a clinically
relevant increase in depth-of-focus, the contrast achieved out-of-focus may produce
additional functional near vision in these patients.
Several Crystalens eyes showed changes in astigmatism, spherical aberration, trefoil and
coma with accommodation, which must arise from geometrical and alignment changes in the
lens with accommodative demand. These changes are highly variable across subjects in both
magnitude and sign. However, the higher amount of aberrations in Crystalens eyes in
comparison with young eyes, likely arising from A-IOL tilt and increased corneal
aberrations, results in increased depth-of-focus, which may explain some functional near
vision performance in these eyes (by pseudo-accommodation, rather than by true
accommodative changes in optical power).
To sum up, OCT and LRT allowed characterization of the anterior segment geometry pre-
and post-operatively (anterior and posterior corneal surface geometry, ACD, lens geometry
and alignment, and IOL geometry and alignment) and aberration measurements. These
measurements therefore shed light into the mechanisms of operation of the Crystalens A-
IOL.
(1) The axial shifts of the A-IOL were very small, and in many cases the lens shifted
backwards (opposite to the expected movements) upon accommodative effort. This
indicates that the claimed working mechanism of the Crystalens AO A-IOL is not by
an axially shift. Significant IOL tilts occurred (particularly around the horizontal
axis), consistent with the orientation of the hinged haptics.

PRESBYOPIA-CATARACT & IOL
136
(2) LRT measurements confirm OCT measurements. LRT aberration measurements in
eyes implanted with the Crystalens AO A-IOLs showed changes in objective
accommodative response below 0.4 D, and negative accommodative responses in
14% of the eyes.

Chapter VI. Chromatic Aberration with IOLs
137
Chapter VI. CATARACT AND IOL
Chromatic Aberration with IOLs
This chapter is based on the following publication:
In Vivo Chromatic Aberration in Eyes Implanted with Intraocular Lenses, by P. Pérez-
Merino, C. Dorronsoro, L. Llorente, S. Durán, I. Jimenez-Alfaro, S. Marcos in
Investigative Ophthalmology and Visual Science (2013).
The contribution of Pablo Pérez-Merino to the study, in collaboration with other coauthors,
was the literature search, the design of the experiments, the adaptation of the Laser Ray
Tracing setup (in collaboration with Carlos Dorronsoro) and the analysis routines, and the
data collection, analysis and processing.

CATARACT & IOL
138

Chapter VI. Chromatic Aberration with IOLs
139
Retinal image quality is determined by the combined optical aberrations of the cornea and
crystalline lens, pupil size, and intraocular scattering. In eyes with cataract, scattering by the
opacified lens causes a major decrease in image quality. Upon replacement of the crystalline
lens by an artificial lens, the source of scattering is eliminated and refractive errors are
generally well corrected. State-of-the art aspheric designs also aim at compensating the
spherical aberration of the cornea [Barbero, 2003; Holladay et al., 2002; Marcos et al.,
2005a; Piers et al., 2007; Tabernero et al., 2006]. In natural conditions, both monochromatic
and chromatic aberrations play a role in determining retinal image quality [Charman &
Jennings, 1976; Howarth & Bradley, 1986; Llorente et al., 2003; Marcos et al., 1999; Marcos
et al., 2001; McLellan et al., 2002; Ravikumar et al., 2008; Rynders et al., 1995; Thibos et
al., 1990; Thibos et al., 1991; Yoon & Williams, 2002]. In fact, it has been shown that
interactions between monochromatic and chromatic aberrations occur, and that the presence
of monochromatic aberrations partly attenuates the optical degradation produced by the
Longitudinal Chromatic Aberration (LCA), or viceversa [McLellan et al., 2002; Ravikumar
et al., 2008]. Modifications in either the monochromatic or chromatic aberration component
may alter this compensatory effect found in the natural eye.
LCA in the eye is determined by dispersion of light in the intraocular media and in the
crystalline lens [Charman & Jennings, 1976; Howarth & Bradley, 1986]. Unlike Transverse
Chromatic Aberration (TCA), which shows a high intersubject variability, LCA is less
variable across subjects, and seems to remain fairly constant with age [Charman & Jennings,
1976; Howarth & Bradley, 1986; Marcos et al., 1999; Marcos et al., 2001; McLellan et al.,
2002; Ravikumar et al., 2008; Thibos et al., 1990].
The replacement of the crystalline lens by an intraocular lens (IOL) modifies the chromatic
dispersion properties of the eye, according to the dispersion properties of the IOL material
(defined by the Abbe number). Reports of the Abbe number of different IOL materials range
between 35 to 60 (37, for the Alcon acrylic; 55, for the Tecnis Acrylic) [Nagata et al., 1999].
In principle, the higher the Abbe number the lower the LCA. This role of the IOL material
on the chromatic difference of focus of the pseudophakic eye has been already
acknowledged [Negishi et al., 2001; Zhao & Mainster, 2007], and it has led to proposals for
IOLs designs aiming at correcting the chromatic aberration of the eye [Artal et al., 2010;
Weeber & Piers, 2012]. This has also prompted studies on the expected performance of eyes
corrected for LCA both computationally from real aberration measurements [Llorente et al.,
2003; Marcos et al., 1999] or psychophysically [Yoon & Williams, 2002].
The chromatic aberrations of the phakic eye have been studied widely, and numerous studies
report experimental measurements (psychophysical or objective) of the LCA in normal
phakic eyes [Charman & Jennings, 1976; Howarth & Bradley, 1986; Llorente et al., 2003;
Thibos et al., 1991]. However, most estimates of the LCA in pseudophakic eyes are based on
computer simulations, using data for the Abbe number of the lens material [Zhao &
Mainster, 2007] or on bench measurements of the isolated IOLs [Siedlecki & Ginis, 2007].
To our knowledge, only one study measured the LCA in vivo (between 500 and 650 nm) in
pseudophakic eyes implanted with PMMA and Acrylic IOLs [Nagata et al., 1999], using a
modified chromoretinoscopy system [Bobier & Sivak, 1978b].

CATARACT & IOL
140
In a previous study, we reported the measurement of chromatic difference of focus based on
aberrometry at two different wavelengths [Llorente et al., 2003]. In particular, the use of
Laser Ray Tracing (LRT) or Hartmann-Shack aberrometry using different illumination might
allow us rapid and reliable measurement of LCA in phakic subjects. Aberrometry provides,
in addition, monochromatic high-order aberrations (HOA) measurements. This allows testing
the correction/induction of HOA for a given IOL design, and ultimately, estimating the
polychromatic image quality in the pseudophakic eye [Marcos et al., 2001].
In the present chapter, we measured monochromatic aberrations in both 532 nm (green) and
785 nm (IR) wavelengths in patients implanted with Alcon Acrysof and with AMO Tecnis
Acrylic aspheric IOLs. We estimated the LCA as the chromatic difference of focus between
the equivalent spherical error corresponding to each wavelength, by using a previously
described and validated aberrometry-based methodology.
To our knowledge, this is the first report of both monochromatic and chromatic aberrations
in pseudophakic patients, as well as the first report in vivo of the chromatic difference of
focus of two of the most widespread IOL materials.
6.1. Methods
6.1.1. Patients, Surgery and IOLs
Eighteen eyes from eighteen patients participated in the study, 9 implanted with the Tecnis
ZCB00 1-Piece (Abbot Medical Optics Inc., Santa Ana, CA, USA), and 9 implanted with the
Acrysof IQ SN60WF (Alcon Inc., Fort Worth, TX, USA). Both IOLs are monofocal, acrylic
and aspheric, but they differ in the specific optical design and material. Table 6.1 shows the
age and refractive profiles of the two groups of patients.
Table 6.1. Age and refractive profiles of the Tecnis and Acrysof groups.
Tecnis Group (n=9) Acrysof Group (n=9)
Age (mean ± std) 73.4±10.9 74.3±7.2
IOL power (mean ± std) 21.2±0.8 22.0±1.6
Selection criteria of the patients included good general health, no ocular pathology, and no
complications during surgery. All enrolled patients provided informed consent. The
protocols had been approved by the Institutional Review Board, and met the tenets of the
Declaration of Helsinki. Patients received a comprehensive ophthalmic evaluation at the
hospital (Fundación Jiménez Díaz, Madrid, Spain) prior to enrollment to the study and
surgery. The examination included uncorrected and best-corrected visual acuity,
biomicroscopy, keratometry, corneal topography, tonometry and indirect ophthalmoscopy.
Axial length and anterior chamber depth were measured with optical biometry (IOL Master
500, Carl Zeiss Meditec AG, Jena, Germany). The IOL power was calculated with the SRK-
T formula, always selecting the closest value to emmetropia.

Chapter VI. Chromatic Aberration with IOLs
141
Postoperative evaluations at the hospital were conducted at 1 day, 1 week, 1 month and 3
months after surgery, and included uncorrected and best-corrected VA, autorefractometry,
manifest refraction, biomicroscopy, keratometry, tonometry, and indirect ophthalmoscopy.
All procedures were performed by the same surgeon (Dr. Sonia Durán) on an outpatient
basis under topical anaesthesia. A 2.2-mm corneal incision and a paracentesis were
performed with a surgical knife. A 6.0-mm continuous curvilinear capsulorhexis was made
under viscoelastic material. Phacoemulsification of the lens was performed with the
Millenium Venturi system (Bausch & Lomb, Rochester, NY, USA). After removing cortical
material, the surgeon proceeded to clean the anterior and posterior capsules with the
automatic I-A straight tip. Both foldable posterior chamber lenses were implanted using the
Monarch III injector through the 2.2 mm incision. Once the viscoelastic material was
removed, the incision was closed by hydration without sutures. Postoperatively, patients
were treated with a combination of antibiotic and corticosteroid drops (dexametasone plus
tobramicyn) for 4 weeks.
6.1.2. Laser Ray Tracing: Total Aberration Analysis
Total wave aberrations were measured using custom laser ray tracing, which has been
described in detail in previous studies and in chapter II.
Illumination was provided by two collinear laser diodes (laser-diode pumped green He-Ne
laser at 532 nm (Brimrose, Baltimore, USA), and an IR laser diode at 785 nm (Schäfter +
Kirchhoff, Hamburg, Germany).
Measurements were done under mydriasis (1 drop 1% tropicamide) for a 4-6 mm pupil
diameter at three months after cataract surgery. Each set of measurements consisted of 5 runs
for green and 5 for IR wavelengths under the same conditions, and the results presented are
the average of the corresponding 5 repeated measurements.
6.1.3. Data Analysis
Ray aberrations were estimated from the deviations of the centroids of the retinal images
corresponding to each entry pupil location from the reference (chief ray), using Matlab
(MathWorks, Inc.) custom software. These deviations are proportional to the local
derivatives of the monochromatic wave aberrations. The monochromatic wave aberration
was described with Zernike polynomials up to 7th
order. The spherical error for each
wavelength was estimated considering different definitions for spherical equivalent error (M)
[Thibos et al., 2004b; Thibos & Horner, 2001].
Equation 6.1: 𝑀 =−4√3𝑍2
0
𝑅2
Equation 6.2: 𝑀 =−4√3𝑍2
0+12√5𝑍40−24√7𝑍6
0
𝑅2
Equation 6.3: 𝐽0 =−2√6𝑍2
2
𝑅2 ; 𝐽45 =−2√6𝑍2
−2
𝑅2 ; 𝐶 = −2√𝐽02 + 𝐽45
2 ; 𝑀 = (−4√3𝑍2
0
𝑅2 − 𝐶)/2

CATARACT & IOL
142
The LCA was then estimated as the difference between the spherical equivalent error
obtained for green and IR wavelengths, as described in an earlier study from our laboratory
on phakic subjects [Llorente et al., 2003]. The analysis was done for a 4-mm effective pupil
diameter for all subjects.
Point Spread Functions (PSF) were also computed using standard Fourier Optics for the
same pupil diameter. Image quality was analyzed in terms of Strehl Ratio, defined as the
maximum of the PSF relative to the maximum of the diffraction-limited PSF. Strehl ratio is
an appropriate optical quality metric in non-highly aberrated optical systems, and in the
absence of large amounts of defocus, as in this study [Cheng et al., 2004]. Besides, through
focus analysis of Strehl Ratio have been shown to allow accurate estimates of the best
subjective focus [Guirao & Williams, 2003]. PSFs in green were computed at best focus (that
maximizing Strehl ratio); PSFs in IR were computed assuming the chromatic difference of
focus in the defocus term. The effect of the chromatic difference of focus was evaluated on
average PSFs for each group (Tecnis or Acrysof). Average PSFs in focus and defocused by
the chromatic difference of focus were computed by averaging individual PSFs in each
condition, assuming no aberrations (diffraction-limited ideal case), the measured HOA only,
and HOA and astigmatism (from IR aberration data). All computations were performed for
4-mm pupils. Univariate analysis (independent samples Student´s t-test) was used to evaluate
the differences in chromatic difference of focus between green and IR, as well as in
monochromatic aberrations and optical quality between the two groups implanted with the
IOLs.
6.2. Results
6.2.1. Monochromatic Aberrations
Figure 6.1 shows the Zernike coefficients, and the corresponding wave aberration maps
(excluding tilt, defocus and astigmatism), for two representative subjects from the Tecnis and
Acrysof groups respectively. Repeated wave aberration measurements were highly
reproducible within each subject. The RMS standard deviation for HOA for repeated
measurements was 0.04 µm (averaged across subjects). The standard deviation for the
defocus Zernike term for repeated measurements was 0.06 µm (averaged across subjects).

Chapter VI. Chromatic Aberration with IOLs
143
Figure 6.1. a) Second-order and b) Higher-order Zernike coefficients (averaged
across 5 repeated measurements) for a representative eye implanted with Tecnis
(S#5), for IR (785 nm, red column) and green (532 nm, green column)
illumination. c) Wave aberration maps (calculated from average Zernike
coefficients excluding tilt, defocus and astigmatism) for IR (785 nm, upper) and
green (532 nm, lower) (Tecnis (S#5)). d) Second-order and e) Higher-order Zernike
coefficients (averaged across 5 repeated measurements) for a representative eye
implated with Acrysof (S#17), for IR (785 nm, red column) and green (532 nm,
green column). f) Wave aberration maps (calculated from average Zernike
coefficients excluding tilt, defocus and astigmatism) for IR (785 nm, upper) and
green (532 nm, lower) respectively (Acrysof (S#17)).
The average value for defocus (Z20), astigmatism-term (Z2
2 and Z2
-2), spherical aberration
(Z40), coma-like term (Z3
1 and Z3
-1), and the RMS for HOAs for the Tecnis as well as for the
Acrysof group are summarized in Table 2, for both green and IR wavelengths. For both IOL
groups, the defocus term shows significant differences across wavelengths (p<0.05).
However, the levels of astigmatism, coma, spherical aberration and total HOAs are very
similar between Tecnis and Acrysof IOLs.

CATARACT & IOL
144
6.2.2. Chromatic Difference of Focus
As expected, the defocus term was significantly different across wavelengths in both Tecnis
and Acrysof groups (see Table 6.2).
Table 6.2. Effective Defocus (D), and RMS (µm) for defocus (Z20), spherical (Z4
0),
astigmatism (Z22 and Z2
-2), coma (Z31 and Z3
-1), and total HOAs (mean ± SD) in Tecnis
and Acrysof groups for 532 nm and 785 nm. Data are shown as mean ± standard
deviation.
Defocus
(D)
Astigmatism
(µm)
Spherical
(µm)
Coma
(µm)
Total HOAs
(µm)
532 nm Tecnis -0.14±0.15 0.36±0.26 0.01±0.03 0.14±0.07 0.21±0.08
Acrysof -0.28±0.27 0.46±0.24 0.02±0.03 0.09±0.03 0.17±0.04
785 nm Tecnis 0.30±0.17 0.39±0.30 0.01±0.03 0.13±0.09 0.22±0.11
Acrysof 0.41±0.24 0.49±0.18 0.02±0.02 0.09±0.03 0.18±0.04
Figure 6.2 shows the chromatic difference of focus (estimating LCA) expressed in diopters
(D) between green and IR wavelengths in both groups, using the different definitions for
spherical equivalent error (M). The average chromatic difference of focus (from Eq. 6.1) in
patients implanted with Tecnis was 0.46 0.15 D and in patients implanted with Acrysof
was 0.76 0.12 D, between 532 (green) and 785 nm (IR). The chromatic difference of focus
of a phakic population (0.78 0.16 D) from an earlier study using the same instrument is
also used for comparison with our results. The difference in LCA between the Tecnis and the
phakic population of our previous study (9 subjects) was statistically significant different
(p<0.05), whereas there was no statistically significant differences between the Acrysof and
phakic groups.
Figure 6.2. Chromatic difference of focus for Tecnis and Acrysof between 532 and
785 nm wavelengths. Eq. (1), Eq. (2) and Eq. (3) correspond to different definitions
for spherical equivalent error: equation 6.1, equation 6.2 and equation 6.3,
respectively.

Chapter VI. Chromatic Aberration with IOLs
145
6.2.3. Effect of Chromatic Difference of Focus on Retinal Image Quality
Figure 6.3 shows simulated PSFs from monochromatic aberration measurements at green
and IR wavelengths for all subjects, including astigmatism and HOAs. PSFs varied
significantly across subjects for both the Acrysof IOLs and Tecnis IOLs, with some subjects
showing markedly asymmetric PSFs (dominated by coma and/or astigmatism) while others
showing closer to diffraction-limited intensity distribution. The effect of the defocus
produced by the chromatic difference of focus on the IR PSF appears more dependent on the
amount of present astigmatism and HOA than on the lens type defocus produced a larger
degradation on the highest quality PSFs (more so in eyes implanted with the Acrysof IOL).
For example Strehl ratio changed from 0.16 (G) to 0.007 (IR) in S#2, and from 0.14 (G) to
0.007 (IR) in S#13, in the presence of chromatic defocus. On the other hand, the chromatic
defocus produced a relatively lower degradation in higher aberrated eyes, i.e. Strehl ratios
from 0.021 (G) to 0.020 (IR) in S#9, and from 0.018 (G) to 0.010 (IR) in S#10. In eyes with
astigmatism, chromatic defocus moved the best focus (i.e. the focus that maximized Strehl
ratio) along the Sturm interval.
Figure 6.3. Simulated PSFs from the wave aberrations corresponding to all
subjects of the study (pupil size = 4 mm), implanted with Tecnis and Acrysof) for
all eyes in green (at the best focus) and IR (defocused by the chromatic difference
of focus) wavelengths.
Figure 6.4 illustrates the effective impact of the chromatic difference of focus on the image
quality for both IOLs, in terms of PSFs (a-c) and Strehl ratios (d-f), averaged across subjects
in each group, and for 4-mm diameter pupils. The PSFs (all based on IR measurements) are
shown in best focus (upper panels) and defocused by the corresponding chromatic difference
of focus (lower panels), for both Tecnis and Acrysof. Three conditions were tested: (a)

CATARACT & IOL
146
assuming diffraction-limited optics, i.e. full correction of astigmatism and HOAs; (b)
considering the measured HOA aberrations present (excluding astigmatism); (c) considering
both measured HOA and astigmatism. In the absence of HOA (Figure 6.4.d), Strehl ratio
decreased from 1 (in focus) to 0.08 (defocused) in eyes implanted with Tecnis, and to 0.01 in
eyes implanted with Acrysof. However, the presence of real HOA and astigmatism
diminished dramatically the impact of chromatic difference of focus on retinal image quality.
HOA decrease image quality at best focus with respect to diffraction-limit (Strehl ratio of
0.15 in both Tecnis and Acrysof groups), but attenuate to a much lesser extent than in the
diffraction-limited case the chromatic defocused image, resulting in a Strehl ratio of
0.090.05 for Tecnis and 0.050.03 for Acrysof (Figure 6.4.e). Including the subjects’
astigmatism (Figure 6.4.f) further degraded image quality in focus (Strehl ratio of 0.08, both
for Tecnis and Acrysof) and further attenuated the impact of chromatic defocus (Strehl ratios
of 0.030.02 for Tecnis and 0.020.01 for Acrysof).
Figure 6.4. (a) Average PSF excluding astigmatism and HOAs at best focus, i.e.
diffraction-limited (top) and defocused by the measured chromatic difference of
focus G-IR (bottom) of the Tecnis (left) and Acrysof (right) IOLs. (b) Average PSF
with HOAs, excluding astigmatism at best focus (top) and defocused by the
chromatic difference of focus (bottom) for both groups. (c) Average PSF with
HOAs and astigmatism at best focus (top) and defocused by the chromatic
difference of focus (button) for both groups. Average Strehl ratios in eyes
implanted with Tecnis and Acrysof, in focus and defocused by the chromatic
difference of focus (d) for a theoretical diffraction-limited eye, (e) for HOAs
without astigmatism, and (f) for HOAs and astigmatism. CDF=Chromatic
difference of focus.

Chapter VI. Chromatic Aberration with IOLs
147
When evaluated in terms of retinal image quality metrics (Strehl), we did not find statistical
differences between in focus image quality of eyes implanted with Tecnis or Acrysof (HOA
only, and HOA and astigmatism; p>0.5). Also, we did not find differences in the chromatic
defocused conditions between the two lenses (HOA only, p=0.08; HOA and astigmatism
p>0.5). Optical quality in focus and with chromatic defocus were statistically significant
different with astigmatism (p<0.05) in both IOLs, and without considering astigmatism in
Acrysof (p<0.05) but not in Tecnis.
6.3. Discussion
We have shown that LRT aberrometry using different wavelengths is a reproducible
technique to measure monochromatic aberrations, as well as chromatic difference of focus in
vivo in eyes implanted with different IOLs. Intra-subject repeatability in chromatic difference
of focus estimates was high, and the intersubject variability in LCA (0.15 D and 0.12 D, for
Tecnis and Acrysof respectively) was similar or even smaller to that values reported in
previous studies in phackic eyes using both objective (0.29 D) [Llorente et al., 2003] and
psychophysical techniques (0.16 D) [Marcos et al., 1999] or those from the only report in
pseudophakic eyes (0.18 D and 0.22 D, for PMMA and Acrysof respectively) [Nagata et al.,
1999].
Our in vivo measurements of chromatic difference of focus (0.46 D and 0.76 D in eyes
implanted with Tecnis and Acrysof IOLS, respectively), are in general, consistent with
theoretical predictions using computer eye models and the nominal/measured material Abbe
numbers in our range of wavelengths (0.35 D and 0.65 D, for Tecnis and Acrysof
respectively) [Zhao & Mainster, 2007]. The reported Chromatic Difference of Focus is lower
than the Longitudinal Chromatic Aberration for the entire visible wavelength range. Our
measurements are restricted to the longer wavelength part of the spectrum, although the
impact of the short wavelength range on vision is relatively minor, due to the reduced density
of blue cones, and the important absorption of light in the macular pigment and in the IOL
yellow filters (Acrysof). In addition, double-pass based measurements of LCA tend to be
lower than psychophysical measurements of LCA [Charman & Jennings, 1976; Rynders et
al., 1995]. In contrast, chromoretinoscopy measurements performed on patients implanted
with PMMA and Acrysof IOLs (the only previous report of LCA measured in vivo on
pseudophakic patients) [Nagata et al., 1999] overestimate LCA with respect to theoretical
computations. In comparison with chromoretinoscopy experimental measurements,
theoretical estimates of LCA (between 500 and 640 nm) in eyes implanted with Acrysof
IOLs were on average 0.22 D lower (modeling by Nagata et al. [Nagata et al., 1999]) or 0.4
D (modeling by Zhao et al. [Zhao & Mainster, 2007]). As expected, we found a consistently
lower LCA in eyes implanted with Tecnis IOLs (reported Abbe number=55) than in eyes
implanted with Acrysof (reported Abbe number=37). A comparison with the LCA of a group
of phakic patients [Llorente et al., 2003] measured with the same instrument revealed that the
Tecnis group had a significantly lower LCA than the natural crystalline lens, but the
differences between the Acrysof and the phakic subjects were not statistically significant.
The correction of the LCA in the eye has been long been debated and proposals of LCA-
correcting IOLs have been made, mostly in the form of diffractive elements [Artal et al.,

CATARACT & IOL
148
2010; Weeber & Piers, 2012]. While the monochromatic MTF of the eye clearly exceeds the
polychromatic MTF [Marcos et al., 1999; McLellan et al., 2002], and there is evidence that,
in the absence of both chromatic and monochromatic aberrations, visual performance
exceeds that with non-corrected chromatic aberrations [Ravikumar et al., 2008; Yoon &
Williams, 2002], correction of LCA alone has not yielded remarkable vision correction
[Zhang et al., 1991]. Reasons for this relatively low benefit of correcting LCA include the
presence of TCA, and the fact that monochromatic aberrations and LCA interact favorably in
eyes with physiological amounts of aberrations [Marcos et al., 1999; Marcos et al., 2001;
McLellan et al., 2002; Ravikumar et al., 2008]. McLellan et al. [McLellan et al., 2002] and
Ravikumar et al. [Ravikumar et al., 2008] reported that, in fact, the presence of
monochromatic aberrations attenuated the degrading effect of the chromatic aberration,
particularly for shorter wavelengths, in contrast with a diffraction-limited eye where
chromatic defocus produced large differences in the MTF across wavelengths. As the IOLs
become more sophisticated in design (ultimately aiming at correcting the HOA of the
individual eye) [Artal et al., 2010; Holladay et al., 2002; Piers et al., 2007; Tabernero et al.,
2006; Weeber & Piers, 2012], the correction of LCA may become more relevant. Both IOLs
of the study had aspheric surfaces, and aimed by design at correcting (or at least reducing)
the positive spherical aberration of the average cornea [Marcos et al., 2005b; Piers et al.,
2007], similarly to the corneal/internal balance of spherical aberration in the young eye
[Artal & Guirao, 1998; Barbero et al., 2002b]. The measured HOA in the pseudophakic
patients of the study (average RMS_HOA= 0.21±0.08 µm (Tecnis) and 0.17±0.04 µm
(Acrysof), green light, 4-mm pupil) were of the order of magnitude of those found in a young
population (average RMS_HOA=0.70±0.11 µm, green light, 6.51-mm pupil) [Llorente et al.,
2003]. Our simulations of the PSFs reveal the image quality degradation produced by the
HOAs in the tested pseudophakic patients, which changed in shape and magnitude across
eyes. According to the mentioned prior literature, physiological amounts of LCA are not
greatly detrimental to retinal image quality, as a result of the positive interaction with the
existing natural HOA. In fact, in most eyes, the interactions of HOA and astigmatism with
chromatic defocus attenuated the impact of the chromatic difference of focus on the PSF,
very much like the effect of pure defocus, having a lesser relative impact on image
degradation in the presence of HOA and astigmatism than in a diffraction-limited eye. As
seen in Figures 6.3 and 6.4, the relative impact of the chromatic difference of focus in eyes
with HOAs (with or without astigmatism), is much lower than that expected in a diffraction
limited eye (Figure 6.4.a and 6.4.d), with no significant differences in the degradation of the
PSF with LCA between groups. Other functions that have been suggested to be helped by the
presence of LCA include emmetropization and accommodation [Kruger et al., 1993; Kruger
& Pola, 1986].

CONCLUSIONS
149
Epilogue: CONCLUSIONS AND FUTURE WORK
This thesis addressed physical quantitative evaluations of geometry (OCT-based) and
aberrations (OCT and LRT-based) in normal eyes and eyes with keratoconus, presbyopia and
cataract pre- and post-treatment. In particular, this thesis has focused on better understanding
of the ICRS as a keratoconus treatment (quantitative geometrical and optical corneal changes
and 3-D ICRS positioning), the mechanism of accommodation (in vivo crystalline lens
topographies) and the potential of accommodative IOLs for the treatment of presbyopia and
cataract (in vivo 3-D positioning and aberrations while stimulating accommodation). We
have studied the changes induced in the geometry of the optical surfaces (cornea and
crystalline lens/IOL), and also the optical outcomes in terms of optical monochromatic and
chromatic aberrations. Measurements on real patients have allowed us to assess the
individual ocular properties in the visual performance of different anterior segment
conditions (keratoconus, accommodation, presbyopia and cataract).
Achievements
1. We have developed different instrument implementations in OCT and Laser Ray
Tracing (LRT), measurement procedures and image processing algorithms for the
accurate study of the 3-D geometry, biometry and aberrometry of the optical surfaces
of the eye (cornea and corneal implants; crystalline lens and IOL). The technology
has demonstrated precise measurements on patients with different anterior segment
physiological and clinical conditions: keratoconus, accommodation, presbyopia and
cataract and their corresponding treatments (ICRS, IOLs and A-IOLs).
2. We have designed two external fixation/accommodation channels for compensating
refractive errors and estimulating accommodation in LRT and OCT.
3. We have developed a ray-tracing multi-surface methodology based on OCT for
simulating corneal and ocular aberrations. The procedure includes the description of
the surface shape with Zernike coefficients and wavefront analysis. OCT-Corneal
aberrometry was validated against LRT ocular aberrations in keratoconic eyes (eyes
with cornea-dominated wave aberrations).
4. We have studied, for the first time, with 3-D quantitative distortion-corrected OCT,
the surface shape, thickness, geometrical and optical (aberrations) of the keratoconic
cornea before and after ICRS surgery. We have also analyzed the 3-D positioning
(depth and tilt) of the ICRS and we have defined analitical metrics for determining the
regulariry of the corneal surfaces.
5. We have explored, for the first time in vivo, the cornea and crystalline lens surface
topography as a function of accommodation, allowing studying relationships across
corneal and crystalline lens surfaces.
6. We have measured, for the first time and objectively with OCT and LRT, the
accommodative response, aberrations, depth of focus and 3-D axial changes in
patients implanted with an accommodative-IOL.

CONCLUSIONS
150
7. We have analyzed in vivo the longitudinal chromatic aberration (LCA) in patients
implanted with different IOLs.
Conclusions
1. ICRS produced a significant flattening of the anterior corneal surface (by 1.71±1.83
D), particularly with a 5-mm optical zone diameter segment. The benefit for corneal
surface regularization and thickness redistribution varied across patients, which was
influenced by the arc-length of the ICRS and by the rotation inside the cornea.
The 3-D ICRS depth measured with OCT matched the planned femtosecond ICRS
depth well (within 15±15 µm). On average, ICRS showed an overall tilt of -6.8±2.6
deg (temporal) and -2.1±0.8 deg (superior).
ICRS produced a significant decrease in astigmatism (27%), but on average did not
produce a consistent decrease of HOAs, which is consistent with the small increase of
visual acuity following treatment. The effect of the ICRS implantation on optical
quality varied across patients.
2. In young eyes, corneal anterior and posterior surface astigmatism tend to be aligned.
The anterior lens astigmatism is on average rotated 27 deg with respect to corneal
astigmatism. The anterior and posterior lens astigmatism axes are close to orthogonal
(80 deg, on average).
On average, we found that the posterior corneal surface compensated part of the
anterior cornea (18% astigmatism, 12% coma). The astigmatism and the high-order
irregularities were statistically significant higher in the posterior crystalline lens
surface than in the anterior crystalline lens surface in the relaxed state. Coma and
trefoil were correlated in the anterior and posterior lens surfaces, suggesting
coordinated development.
In the relaxed state, the spherical term accounted for most of the surface irregularity
in the anterior lens (47%) and astigmatism in the posterior lens (70%). However, in
accommodated lenses astigmatism was the predominant surface irregularity in the
anterior lens (90%).
As the crystalline lens accommodated, astigmatism changed both in magnitude
(increased in the anterior lens surface) and angle (relative shift 10-20 deg), spherical
term changed from positive to negative values in the anterior lens surface.
3. OCT measurements of the A-IOL (Crystalens AO) 3-D positioning revealed small A-
IOL axial shifts with accommodative effort (and in many patients backward, opposite
to the expected movements), ranging from 0.07 to -0.1 mm. Significant IOL tilts
occurred particularly around the horizontal axis, consistent with the orientation of the
hinged haptics.

CONCLUSIONS
151
LRT measurements showed that the accommodative response of eyes implanted with
the Crystalens AO A-IOL was lower than 0.4 D in all eyes (consistent with the
reported small axial shifts). Several subjects showed changes in astigmatism,
spherical aberration, trefoil and coma with accommodation, which arise from
geometrical and alignment changes in the lens with accommodative demand. These
changes are highly variable across subjects in both magnitude and sign.
Pseudoaccommodation from increased depth-of-focus may contribute to near vision
functionality in Crystalens AO-implanted patients.
4. Replacement of the crystalline lens by the IOL did not increase chromatic difference
of focus above that of phakic eyes implanted with two commercially available IOLs
(0.46 D and 0.76 D, respectivley). The group implanted with IOLs with low Abbe
number showed values of chromatic difference of focus very similar to physiological
values in young eyes (0.78 D).
The interactions of HOAs and astigmatism with chromatic defocus attenuated the
impact of the longitudinal chromatic aberration (LCA) on the PSF. The relative
impact of the LCA in eyes with HOAs is much lower than that expected in a
diffraction-limited eye, with no significant differences in the degradation of the PSF
with the LCA between IOL groups.
Clinical impact
The results of this thesis have a number of clinical implications, which may change
paradigments in diagnosis, clinical management and treatment evaluation in different
anterior segment conditions, such as in keratoconus (new nomograms based on OCT to
increase the predictability of ICRS surgery in keratoconus) and cataract (full 3-D biometry
prior to cataract surgery based on OCT).
Future work
LINKING ABERRATIONS and ANTERIOR SEGMENT GEOMETRY. Modeling the
optics of an individual patient´s eye and predicting the resulting optical performance
addresses a current unmet need in visual optics. Combined measurements of wavefront
aberrations and 3-D corneal and crystalline lens/IOL surface shape provided a deeper
understanding of the relative contributions corneal and lens surfaces themselves to the
aberrations and allowed realistic individual simulations of the ocular properties such as
ocular aberrations by incorporating patient´s based eye biometry. These measurements will
allow to evaluate the contribution of the individual optical components (corneal and lens
surfaces) and their alignment to optical degradation.
KERATOCONUS and ICRS TREATMENT. OCT-based corneal aberrometry, topography
and 3-D ICRS positioning provided a better approach for the improvement of ICRS surgery.
Further studies on a larger population using similar keratoconus patterns, similar surgical

CONCLUSIONS
152
parameters and similar ICRS combination may give further insights on the mechanism of
action and help in improving surgical nomograms.
CRYSTALLINE LENS. In vivo crystalline lens topography allows investigating the role of
crystalline lens in visual processes. Further studies on a larger population of different age
and/or refractive profiles will allow gaining insights on the role of the crystalline lens on the
age-dependent changes of the eye´s optics, myopia development, ocular astigmatism and
accommodation.
CHROMATIC ABERRATION. Aberrometry-based measurements provide both high-order
aberrations and longitudinal chromatic aberration. A full estimation of retinal image quality
in vivo would require measurements at a higher number of wavelengths (covering the visible
spectrum) and individual estimates of transverse chromatic aberration. Which can be
achieved by adding multiple laser of different wavelengths or a supercontinuum laser source.
ACCOMMODATING IOLs. Application of OCT (direct visualization) and LRT
aberrometry (objective accommodative response) in the study of patients implanted with
accommodative IOLs (A-IOL) will be essential to evaluate the mechanism of action of the
A-IOL and its final positioning in different accommodative demands.
MULTIFOCAL CONTACT LENSES. The adaptation of multifocal contact lenses is still
challenging for patients and practitioners. An in vivo 3-D objective evaluation of the optical
and fitting effects will be helpful for providing the best contact lens design.
CUSTOMIZING IOLs. OCT-based anterior segment geometry can be used to generate
customized eye models both preoperatively (for ray tracing calculations of the IOL power)
and custom selection of IOLs.
SWEPT-SOURCE OCT and 3-D QUANTITATIVE IMAGE PROCESSING
ALGORITHMS. The long imaging depth range, high resolution and ultrahigh speed of new
swept-source generation enables unprecendent 3-D measurements of the entire eye (from the
cornea to the retina). The high performance of swept-source, the integration of quantitative
image processing tools and an external aberrometer channel in a single instrument will
enable new applications, being particularly relevant in cataract surgery and presbyopia.

Resumen en Español
153
RESUMEN EN ESPAÑOL
El ojo es un sistema óptico extraordinariamente simple, tiene dos lentes transparentes, la
córnea y el cristalino, que de manera combinada forman las imágenes del mundo en la retina,
iniciando el proceso visual. La córnea proporciona la mayor parte de la potencia refractiva
del ojo, ya que contribuye aproximadamente con 2/3 de la potencia total del ojo en estado
relajado (aproximadamente 42 D). Este gran aporte se debe a la forma de la superficie
corneal y a la diferencia de índice de refracción entre la córnea (1.37) y el aire (1.0). El
cristalino aporta el tercio restante y tiene la capacidad de autoenfoque en personas jóvenes,
es decir, permite cambiar el estado refractivo del ojo, acomodar, para proporcionar una
imagen nítida de los objetos a distintas distancias.
Sin embargo, alteraciones o irregularidades que se presenten en la córnea o el cristalino, o
descentramientos respectivos, suponen un claro deterioro en la calidad óptica y, en
consecuencia, de la visión. Estas imperfecciones del sistema visual son conocidas como
aberraciones ópticas, donde la imagen de la retina de un punto objeto no es otro punto sino
una distribución extensa de la luz, y se caracterizan por su degradación del contraste y su
limitación en el contenido de las frecuencias espaciales de las imágenes proyectadas. Al
menos en sujetos jóvenes se ha demostrado que una parte de las aberraciones corneales se
compensa por las aberraciones del cristalino pero, existen patologías y/o condiciones
oculares en las que este equilibrio se rompe, ya que, en la adolescencia, el queratocono
degrada progresivamente la córnea, mientras que la presbicia y las cataratas son condiciones
asociadas al envejecimiento que afectan al cristalino.
Por un lado, un análisis de las aberraciones en condiciones patológicas y, por otro, una
precisa cuantificación tridimensional de las superficies de la córnea y el cristalino (y sus
posibles tratamientos) es esencial en la exploración ocular, ya que de esta forma se podrá
proporcionar una evaluación exacta del ojo estudiado, analizar qué superficie es la que altera
la calidad visual, y decidir qué tratamiento es el más adecuado, abordando, en definitiva, la
deseada solución personalizada para queratocono, presbicia y cataratas.
La interacción entre óptica y geometría es clave para entender el mecanismo de la función
visual. Por ello, en este trabajo se ha llevado a cabo el desarrollo de un OCT para visualizar
en alta resolución y cuantificar tridimensionalmente el segmento anterior del ojo y hemos
adaptado el aberrómetro Trazado de rayos laser (LRT) para medir las aberraciones oculares
de forma precisa en distintas condiciones oculares: queratocono y su tratamiento con ICRS,
estimulando la acomodación y en pacientes con lentes intraoculares (IOL) monofocales y
acomodativas.
En particular, se presenta (1) una serie de estudios longitudinales en los que analizamos
tridimensionalmente la geometría de la córnea y la posición de los anillos intracorneales, las
aberraciones corneales con OCT y, también, las propiedades ópticas con LRT en pacientes
con queratocono antes y después de la implantación de ICRS; (2) se evalúa por primera vez
in vivo la topografía del cristalino con la acomodación; (3) se analiza por primera vez la

Resumen en Español
154
posición tridimensional y el impacto visual de las lentes intraoculares acomodativas después
de la cirugía de cataratas; y (4) se analiza in vivo la aberración cromática longitudinal en
pacientes con lentes intraoculares.
Capítulo I. INTRODUCCIÓN
En resumen, el capítulo de introducción describe los antecedentes más relevantes en los
campos de la óptica, fisiología, oftalmología y optometría que han sido relevantes para el
desarrollo de esta tesis. Se presentan las bases fundamentales de las técnicas de imagen del
segmento anterior, entre ellas el OCT, y se describen los métodos de medida aberrometría,
incluyendo la terminología del campo de la óptica utilizada, como frente de onda,
aberraciones y las métricas de análisis de calidad óptica. Y, por último, se presentan las
patologías y condiciones del segmento anterior (queratocono, acomodación, presbicia y
cataratas) y las aplicaciones clínicas estudiadas en esta tesis (anillos intracorneales y lentes
intraoculares monofocales y acomodativas).
En el ojo, la calidad visual está prácticamente determinada por la relación entre sus
elementos ópticos, córnea y cristalino. Durante el crecimiento del ojo, existe una alta
correlación entre la potencia de la córnea, del cristalino y la longitud axial, es decir, la
distancia focal se va ajustando para proporcionar la mejor calidad óptica. La calidad óptica
depende de ese acople, por lo que el papel del cristalino ha de considerarse en conjunción al
de la córnea. Artal y cols. y Kelly y cols., mostraron una correlación significativa en
astigmatismo horizontal/vertical, coma lateral y aberración esférica entre la córnea y el
cristalino, demostrando un ajuste activo entre ambos elementos. Sin embargo, hay
condiciones oculares (por ejemplo, queratocono, presbicia y cataratas) que producen
imperfecciones en las superficies ópticas, rompen el ajuste córnea/cristalino y degradan la
calidad óptica del ojo, aumentando las aberraciones y provocando un emborronamiento de la
imagen.
Las aberraciones oculares se han medido en los últimos años gracias al desarrollo de
sensores de frente de onda y su apertura a la clínica, contando con Hartmann-Shack y
Trazado de rayos laser (LRT) como aberrómetros más comunes.
Por su parte, la forma tridimensional de la córnea se ha descrito mediante sistemas de
topografía corneal computerizada, como el disco de Plácido o la cámara de Scheimpflug, y el
estudio de la óptica de la córnea (aberraciones corneales) se ha desarrollado a partir de su
geometría. Sin embargo, los resultados ópticos sobre el cristalino in vivo siempre han sido
indirectos (restando las aberraciones corneales de las totales) y los geométricos están
generalmente limitados a propiedades axiales.
Por su carácter no invasivo, su mayor resolución (2 m), velocidad de adquisición (150000
AScans/s) y profundidad de evaluación en el ojo (hasta 30 mm), la tomografía de coherencia
óptica (OCT) se ha convertido en la técnica de imagen más prometedora para el análisis
tridimensional de todo el segmento anterior (córnea, cristalino y sus posibles tratamientos).
En este aspecto, en nuestro grupo se han desarrollado algoritmos de cuantificación
tridimensional compensando la distorsión de las imágenes de OCT.

Resumen en Español
155
Siendo clave el OCT y sus programas de procesado para el desarrollo de lo modelos de ojo
personalizados en distintas patologías oculares, como queratocono, presbicia y cataratas, y
una correcta evaluación de sus tratamientos (anillos intracorneales (ICRS) en queratocono y
las lentes intraoculares acomodativas (A-IOLs) en presbicia y cataratas).
En este contexto, las grandes líneas de investigación en esta tesis doctoral se han orientado a
estudiar la relación entre la forma tridimensional de las superficies del ojo (OCT) y la
calidad óptica (LRT) en distintas condiciones clínicas del segmento anterior.
(1) Queratocono y anillos intracorneales (ICRS). La implantación de ICRS es un
tratamiento aceptado para el tratamiento del queratocono, ya que, por un lado,
aplana la córnea y, por otro, ofrece en la mayoría de los casos una mejora a largo
plazo en la agudeza visual. Sin embargo, en la actualidad, la implantación de los
anillos se basa en un nomograma con pocos parámetros de entrada. Además, es
difícil estimar la mejora en calidad visual, su mecanismo de acción dentro de la
córnea y su efecto en las superficies anterior y posterior de la córnea. Por ello, las
nuevas técnicas de imagen pueden proporcionar la información necesaria para
mejorar el resultado final de esta técnica quirúrgica.
Algunas preguntas por resolver son: ¿Cuál es el efecto real de los anillos en las
superficies corneales? ¿Qué estabilidad tienen los anillos en la córnea? ¿Existe una
redistribución del espesor corneal al implantar los anillos? ¿Los anillos frenan la
progresión del queratocono? ¿Aumentan las aberraciones de alto orden?
(2) Acomodación. La mayoría de los estudios in vivo del cristalino con la acomodación
describen cambios axiales o de curvatura en la zona central pero no de las
superficies del cristalino en 3-D. Por ello, un análisis exhaustivo de la forma del
cristalino y su geometría es crítico para entender (1) sus propiedades ópticas , (2) el
papel de las superficies del cristalino en la compensación de las aberraciones
corneales (en particular, astigmatismo y aberración esférica), (3) la implicación del
cristalino en el desarrollo de errores refractivos (por ej., miopía), (4) los cambios en
la óptica del ojo con la edad, y por último, (5) podrá mejorar la predicción en el
cálculo de la potencia de IOLs.
(3) Presbicia/Cataratas y lentes intraoculares (IOLs). El aumento de la esperanza de
vida y el incremento de la demanda visual para visión cercana ha llevado en los
últimos años al desarrollo de IOLs que imiten en cierta medida las propiedades
naturales del cristalino joven. Las IOL monofocales son diseños esféricos que
proporcionan una excelente visión funcional; sin embargo, limitan la profundidad
de foco y no abordan la compensación de las aberraciones corneales. Hoy en día,
existen muchas más posibilidades para mejorar la calidad visual de estos pacientes.
Así, se han propuesto lentes que corrijan el astigmatismo, que compensen la
aberración esférica de la córnea, que disminuyan la aberración cromática, que
proporcionen multifocalidad o acomodación. Como consecuencia, ahora es posible
elegir una IOL específica para cada paciente en función de sus necesidades. En este
contexto, una medida precisa de las aberraciones oculares y la biometría en 3-D

Resumen en Español
156
pre- y post-operatoria es crítico para el diseño personalizado de IOLs y su
planificación quirúrgica.
Sin embargo, quedan todavía preguntas sin respuesta: ¿Cuál es la calidad óptica de
los pacientes operados con IOL? ¿Funcionan las IOL acomodativas como se
esperaba? ¿Proporcionan un rango acomodativo objetivo? ¿Qué consecuencias
visuales de las aberraciones monocromáticas y cromáticas ? ¿Aumentan las
aberraciones de alto orden?
Capítulo II. MATERIAL Y MÉTODOS
En este capítulo se presentan las técnicas experimentales utilizadas en el transcurso de esta
tesis doctoral.
En primer lugar, se utilizó un aberrómetro de Trazado de Rayos Laser (LRT) desarrollado en
el Instituto de Óptica. Este sistema cuantifica la aberración transversal en función de la
posición de la pupila. En el LRT la pupila se muestrea secuencialmente mediante un escáner
que barre la pupila y proyecta un haz de luz en la retina. Las imágenes del haz de luz en la
retina en las distintas posiciones de entrada son grabadas por una cámara.
El LRT consta esencialmente de (1) Canal de iluminación, con dos posibles fuentes de luz:
laser infrarrojo (785 nm) y láser verde (532 nm); (2) Escáner, el escáner distribuye el haz de
luz por la pupila; (3) Sistema de Badal, compuesto por dos espejos y dos lentes que
compensan los errores refractivos del sujeto; (4) Cámara de pupila y retina, la cámara de
pupila graba las imágenes correspondientes a la posición de entrada del haz de luz en la
pupila y la cámara de retina recoge la luz reflejada de la retina para cada haz de entrada y (5)
Sistema externo de Fijación/Acomodación.
En la sección de LRT se describen los protocolos de control de medida, calibración y
análisis.
En segundo lugar, se utilizó un sistema de Tomografía de Coherencia Óptica (OCT) de
dominio espectral desarrollado en el Instituto de Óptica en colaboración con la Copernicus
University de Torun, Polonia. Este sistema permite la obtención in vivo de imágenes
tridimensionales del segmento anterior con resolución de micras y a gran velocidad. Un OCT
es esencialmente (1) luz monocromática de baja coherencia, (2) un interferómetro Michelson
en configuración de fibra óptica y (3) un escáner óptico. El interferómetro consta de una
fuente de luz, un divisor de haz y dos espejos. Y en OCT el desarrollo es el siguiente: la luz
de baja coherencia que sale del diodo superluminiscente (SLD, 840 nm) se divide en un
divisor de haz. Los haces que van a cada brazo se reflejan, uno en el espejo de referencia y el
otro en la muestra (ojo), y vuelven a juntarse en el divisor de haz. De ahí van al detector.
Cuando los caminos ópticos de los dos haces coinciden exactamente (o están dentro del
margen de la longitud de coherencia de la luz), las interferencias entre ellos son
constructivas, y la señal captada es alta.

Resumen en Español
157
Los sistemas de OCT obtienen la imagen punto a punto. Por tanto, el sistema de iluminación
enfoca el haz de luz en un solo punto de la muestra. Gracias a la utilización de luz de baja
coherencia, no hay luz proveniente de otros puntos situados en el mismo plano que el punto
de interés. En OCT de dominio espectral la longitud del brazo de referencia se fija y la luz de
salida del interferómetro se analiza con un espectrómetro. Debido a la longitud de onda y el
ancho espectral del SLD, la interferencia de banda ancha se registra con detectores
espectralmente separados, en nuestro caso codificando la frecuencia óptica en el espacio con
un detector dispersivo (en nuestro caso con una red de dispersión y una cámara CMOS
lineal). Y, por la relación de Fourier y el teorema de Wiener-Khintchine, relacionado con la
autocorrelación y la densidad de potencia espectral, el barrido en profundidad puede ser
calculado de forma inmediata mediante la transformada de Fourier del espectro registrado,
sin necesidad de modificar la longitud de camino del brazo de muestreo. Esta característica
hace que se incremente la velocidad del proceso de manera importante, a la vez que reduce
las pérdidas durante un registro puntual en profundidad y mejore la razón señal/ruido.
En la sección de OCT se describe también el brazo de fijación/acomodación, los programas
de corrección de distorsión, procesado de imagen y cuantificación del segmento anterior del
ojo, con especial dedicación a la metodología desarrollada para el análisis de las aberraciones
corneales basada en trazado de rayos virtual a través de las elevaciones corneales con la
ayuda de un programa de diseño óptico (ZEMAX).
En este capítulo también se definen las métricas de calidad óptica obtenidas a partir de la
aberración de onda, en foco y a través de foco. La PSF designa la distribución de
intensidades de la imagen de una fuente tras su paso por un sistema óptico. La MTF nos
ofrece el grado de detalle, esto es, la reducción del contraste en función de frecuencia
espacial de la imagen a su paso por un sistema óptico. En particular, Visual Sthrel es la
métrica más utilizada por su alta correlación con la Agudeza Visual medida en la clínica.
Y, por último, se explica el protocolo de medidas realizado en los pacientes estudiados en
esta tesis.
Capítulo III. QUERATOCONO & ICRS
Este capítulo está basado en los artículos “Quantitative OCT-based longitudinal evaluation
of intracorneal ring segment implantation in keratoconus, Invest Ophthalmol Vis Sci 2013”
y “Ocular and Optical Coherence Tomography-based corneal aberrometry in keratoconic
eyes treated by intracorneal ring segments, Am J Ophthalmol 2014” de Pérez-Merino y cols.
Los coautores son Sergio Ortiz, Nicolás Alejandre, Alberto de Castro, Ignacio Jimenez-
Alfaro y Susana Marcos.
Propósito. Caracterizar las propiedades geométricas de la córnea y analizar las aberraciones
corneales explorando las posibilidades del OCT como una nueva herramienta para el análisis
completo (geométrico y óptico) del queratocono y su tratamiento quirúrgico con anillos
intracorneales (ICRS).

Resumen en Español
158
Métodos. El primer apartado está basado en el análisis longitudinal de la geometría corneal
con OCT y se evalúa la topografía corneal, paquimetría y la posición tridimensional de los
anillos en pacientes de queratocono operados con ICRS; las medidas se realizan en 10
pacientes antes y después de la operación (7, 30 y 90 días). El segundo apartado está basado
en la propuesta del OCT como aberrómetro corneal, donde se midieron 19 ojos antes y 3-
meses después de la implantación de anillos intracorneales y se compararon los resultados
con las aberraciones totales (LRT) en 8 ojos. A partir de los datos de elevación de la córnea
(superficie anterior y posterior) se puede calcular la deformación de un frente de ondas que
la atraviese por medio del programa de diseño óptico ZEMAX. El análisis geométrico y
aberrométrico se realizó para 4-mm de diámetro (centro pupilar).
Resultados. En promedio, el radio de curvatura de la córnea fue de 7.020.54 mm (anterior),
5.400.77 mm (posterior) y el mínimo espesor corneal 38460 m antes de la implantación
de ICRS. Después de la cirugía de ICRS (90 días), el radio de curvatura de la córnea fue de
7.260.53 mm (anterior), 5.440.71 mm (posterior) y el mínimo espesor corneal 39646 m.
La implantación de los ICRS aplanó la superficie anterior de la córnea y disminuyó su
potencia (1.711.83 D). Las irregularidades de la córnea (definidas por los términos de
Zernike de alto orden de las superficies corneales) y la distribución del espesor (definida
como la variación de RMS del espesor) disminuyó en algunos pacientes y aumentó en otros.
La profundidad tridimensional de los ICRS fue muy similar a la planificada con laser de
femtosegundo (diferencias en promedio de 1520 m) y mostraron una inclinación de -
6.82.6 grados (temporal) y -2.10.8 grados (superior) 7 días después de la implantación de
los ICRS. En promedio, hubo una ligera y progresiva disminución de la profundidad de los
ICRS (10 m, del día 7 al 90 post-op) y una pequeña variación de la inclinación (1 grado).
Comparando los datos de aberraciones corneales (OCT) y totales (LRT) antes y después de
la implantación de los ICRS (90 días), se encontró una alta correlación en la mayoría de los
sujetos. Los valores de RMS HOAs con OCT fueron 0.780.35 m (pre-op) y 0.880.36 m
(post-op) y con LRT 0.570.39 m (pre-op) y 0.530.24 m (post-op), para 4-mm de pupila.
La superficie posterior de la córnea compensó parcialmente las aberraciones de la superficie
anterior (8.3%, pre-op; 4.1%, post-op). Individualmente, las aberraciones predominantes
fueron coma vertical (Z3-1
), trefoil vertical (Z3-3
) y astigmatismo secundario (Z44). La
implantación de ICRS disminuyó el astigmatismo corneal en un 27% y el coma un 5%. Sin
embargo, no se encontró una disminución estadísticamente significativa en las aberraciones
de alto orden después de la cirugía de ICRS.
Conclusiones. Comprender el acople entre la óptica y la geometría corneal es esencial para
mejorar la planificación quirúrgica en pacientes con queratocono. El OCT es una
herramienta útil ya que nos permite analizar de forma precisa (1) los cambios topográficos de
la superficie anterior y posterior de la córnea, (2) la redistribución del espesor corneal, (3) la
posición tridimensional (profundidad e inclinación) de los ICRS, y (4) evaluar las
aberraciones de la córnea. ICRS es una alternativa quirúrgica que aplana la superficie
anterior de la córnea y disminuye el astigmatismo corneal. Sin embargo, la respuesta en
regularización de las superficies corneales y cambios en las aberraciones de alto orden
presenta una variabilidad alta entre sujetos.

Resumen en Español
159
Capítulo IV. ACOMODACIÓN
Este capítulo está basado en el artículo “Crystalline lens topography in accommodating eyes,
Biomed Opt Express 2015” de Pérez-Merino y cols.
Los coautores son Miriam Velasco-Ocana, Eduardo Martinez-Enriquez y Susana Marcos.
Propósito. Analizar por primera vez in vivo los cambios topográficos de las superficies
anterior y posterior del cristalino con la acomodación para entender (1) sus propiedades
ópticas, (2) el papel de las superficies del cristalino en la compensación de las aberraciones
corneales (en particular, astigmatismo y aberración esférica), y (3) la relación entre las
superficies anterior y posterior del cristalino.
Métodos. Con OCT medimos 9 cristalinos de 7 sujetos no présbitas (332 años de edad) en 5
estados acomodativos, de 0 a 6 D (en pasos de 1.5 D). Se obtuvieron imágenes 3-D del
segmento anterior (1) Córnea+Iris, (2) Cristalino anterior+Iris y (3) Cristalino posterior+Iris
con una densidad de 300 AScans x 50 BScans (11 x 11 mm), y se caracterizaron las
superficies de la córnea y el cristalino restando la mejor esfera de referencia y mediante el
ajuste de polinomios de Zernike de sexto orden (analizando la RMS de las irregularidades de
alto orden, astigmatismo, coma y trefoil). La relación entre los ángulos y magnitud de
astigmatismo de córnea (anterior y posterior) y cristalino (anterior y posterior) se estudió en
el estado desacomodado y para cada demanda acomodativa. Por último, se analizó la
biometría del segmento anterior con la acomodación: profundidad de cámara anterior (ACD),
espesor del cristalino y radios de todas las superficies.
Resultados. Los radios de curvatura del cristalino disminuyeron 0.780.18 mm/D (anterior)
y 0.130.07 mm/D (posterior), ACD disminuyó 0.040.01 mm/D y el espesor del cristalino
aumentó 0.040.01 mm/D con la acomodación. En el estado relajado, el término de esférica
(47%) aporta la mayor parte de irregularidad de superficie en la superficie anterior del
cristalino y el término de astigmatismo (70%) en la superficie posterior del cristalino. Sin
embargo, con acomodación astigmatismo fue la irregularidad de superficie predominante
(90%). La RMS de las irregularidades de alto orden de la superficie posterior del cristalino es
estadísticamente significativa mayor que la de la superficie anterior del cristalino (x2.02,
p<0.0001). Encontramos una correlación negativa significativa en el coma vertical (Z3-1
) y el
trefoil oblicuo (Z3-3
) entre las superficies del cristalino. El ángulo de astigmatismo presentó
un alto grado de alineamiento entre las superficies de la córnea, moderado entre las
superficies de la córnea y la superficie anterior del cristalino (27 grados), y un ángulo
perpendicular entre las superficies anterior y posterior del cristalino (80 grados).
Conclusiones. El OCT con programas específicos dedicados al procesado de imagen,
corrección de las distorsiones y cuantificación es una herramienta única en la evaluación de
los cambios de forma en la superficie del cristalino con la acomodación. Una precisa
descripción de la forma del cristalino es crítica para estudiar la implicación del cristalino en
la óptica del ojo en estado desacomodado y acomodado, incluyendo el astigmatismo y las
irregularidades de alto orden. Nuestros resultados demuestran que la compensación de
astigmatismo no solo sucede entre la córnea y el cristalino, sino también entre las propias

Resumen en Español
160
superficies. Con acomodación el cambio más representativo aparece en el término de
esférica que pasa de valores positivos a negativos, aunque también se producen cambios en
astigmatismo y en irregularidades de alto orden.
Capítulo VI. PRESBICIA/CATARATAS & A-IOL
Este capítulo está basado en los artículos “Aberrometry in patients implanted with
accommodative introcular lenses, Am J Ophthalmol 2014” de Pérez-Merino y cols y
“Three-dimensional evaluation of accommodating intraocular lens shift and alignment in
vivo, Ophthalmology 2014” de Marcos y cols.
Los coautores son Sergio Ortiz, Judith Birkenfeld, Carlos Dorronsoro, Sonia Durán, Ignacio
Jimenez-Alfaro y Susana Marcos.
Propósito. Evaluar de forma objetiva la respuesta acomodativa, cambio de aberraciones,
profundidad de foco y cambios biométricos en 3-D en ojos implantados con la IOL
acomodativa (A-IOL) Crystalens-AO.
Métodos. Se examinaron 11 pacientes (22 ojos) con cataratas después de la implantación de
la Crystalens-AO A-IOL. También se incluyeron en el estudio dos grupos controles (sujetos
jóvenes y sujetos implantados con IOL monofocal) de 17 ojos cada uno. En la primera parte
del estudio se analizaron los cambios ópticos por medio del estudio de las aberraciones
oculares con el LRT: (1) aberraciones oculares, (2) respuesta acomodativa paraxial (asociada
con cambios en el desenfoque), (3) respuesta acomodativa efectiva (asociada con cambios en
el desenfoque, aberraciones esféricas y diámetro de pupila), (4) profundidad de foco,
estimada a partir de VSMTF a través de foco. En el segundo apartado se analizan los
cambios biométricos del segmento anterior (cornea+A-IOL) mediante cuantificación
tridimensional con OCT: (5) ACD, (6) espesor del cristalino, (7) inclinación de A-IOL.
Todas las medidas se realizaron para demandas acomodativas de 0, 1.25 y 2.5 D.
Resultados. Trefoil vertical (Z3-3
) y coma (Z31, Z3
-1) fueron las aberraciones individuales de
alto orden predominantes en el grupo Crystalens y control de IOL monofocal, y fueron más
altas que en el grupo control de sujetos jóvenes (p<0.0001). La profundidad de foco fue
estadísticamente significativa mayor en el grupo de Crystalens que en los grupos controles.
En promedio, en el grupo de Crystalens el término de desenfoque (Z20), astigmatismo o las
aberraciones de alto orden no cambiaron con la demanda acomodativa. Tampoco se
observaron cambios en el desenfoque efectivo entre las distintas condiciones acomodativas:
0.340.48 D (visión lejos), 0.320.50 D (visión intermedia), 0.340.44 D (visión cercana).
Con OCT, la visualización directa de la A-IOL nos permitió cuantificar las distancias de
ACD pre-op (2.640.24 mm) y post-op (3.650.35 mm, en el estado relajado), encontrando
una significativa correlación (r=0.93; p<0.05). La posición de la A-IOL no cambió
axialmente con la demanda acomodativa, presentando únicamente cambios en la inclinación
vertical (siendo mayor de 9 grados en dos de los sujetos). El mayor cambio en inclinación
tuvo lugar en la demanda acomodativa de 1.25 D. Los sujetos con mayor cantidad de
astigmatismo (r=-0.47, p=0.04), HOAs (r=-0.48, p=0.03) y trefoil (r=-0.61, p=0.05) fueron
los que mayor cantidad de inclinación en la A-IOL presentaron.

Resumen en Español
161
Conclusiones. La respuesta acomodativa de los ojos implantados con Crystalens A-IOL,
medida objetivamente con LRT y OCT, fue menor de 0.4 D y menor de 0.07 mm en todos
los sujetos. Varios sujetos presentaron cambios en astigmatismo, aberración esférica, trefoil
y coma con la acomodación, que se asocian con los cambios geométricos y de alineamiento
en la A-IOL con la demanda acomodativa.
Capítulo VII. CATARATAS & IOL
Este capítulo está basado en los artículos “In vivo chromatic aberration in eyes implanted
with Intraocular lenses, Invest Ophthalmol Vis Sci 2013” de Pérez-Merino y cols.
Los coautores son Carlos Dorronsoro, Lourdes Llorente, Sonia Durán, Ignacio Jimenez-
Alfaro y Susana Marcos.
Propósito. Medir in vivo y objetivamente las aberraciones monocromáticas a diferentes
longitudes de ondas y determinar la aberración cromática longitudinal (LCA) entre verde e
IR en ojos implantados con dos modelos de IOL.
Métodos. Se midieron 18 ojos (9 implantados con Tecnis ZB99 1-Piece acrylic IOL y 9
implantados con AcrySof SN60WF IOL) con LRT en dos longitudes de onda, 532 nm
(verde) y 785 (IR). Se analizaron las aberraciones monocromáticas para ambas longitudes de
onda y la diferencia cromática de foco se estimó como la diferencia entre el error equivalente
esférico para cada longitud de onda.
Resultados. Las medidas de las aberraciones fueron altamente reproducibles para las dos
longitudes de onda. Excepto para el término de desenfoque (Z20) no se encontraron
diferencias significativas en las aberraciones de alto orden. En promedio, la diferencia
cromática de foco fue de 0.460.15 D en el grupo Tecnis y 0.750.12 D en el grupo AcrySof
(p<0.05). La diferencia cromática de foco en el grupo de AcrySof no fue estadísticamente
significativa en comparación con LCA descrita anteriormente en ojos jóvenes (0.780.16 D).
El impacto de la LCA en la calidad de imagen retiniana (medida en términos de Strehl ratio)
disminuyó drásticamente cuando se incluyó el astigmatismo y las aberraciones de alto orden,
en este caso no se apreciaron diferencias estadísticamente significativas en la calidad de
imagen retiniana entre los grupos Tecnis y AcrySof.
Conclusiones. LRT con diferentes longitudes de onda es una excelente técnica para evaluar
objetivamente la LCA en ojos con IOLs. La implantación de estos modelos de IOL no
aumentó la LCA en comparación con ojos fáquicos, siendo el grupo de AcrySof el que
presentó valores similares a los fisiológicos de sujetos jóvenes. Las aberraciones juegan un
importante papel en los resultados visuales en pacientes con IOL.
Epílogo. CONCLUSIONES Y TRABAJO FUTURO
En este estudio, por primera vez, se ha analizado la contribución geométrica y óptica de los
componentes oculares individuales en diversas patologías, condiciones oculares y
procedimientos quirúrgicos, y se presentan técnicas basadas en LRT y OCT para su uso

Resumen en Español
162
sistemático en el estudio de las propiedades ópticas del ojo en las aplicaciones clínicas más
comunes de córnea y cristalino.
Las principales aportaciones de este trabajo son las siguientes:
1. Hemos desarrollado diferentes implementaciones de sistemas ópticos, protocolos de
medida y algoritmos de procesado para el estudio preciso de geometría y las
aberraciones de las superficies ópticas (córnea+tratamiento y cristalino/tratamiento).
Estas técnicas son Tomografía de Coherencia Óptica (OCT) y Trazado de Rayos
Laser (LRT), y han demostrado ser útiles en la medida de pacientes con distintas
patologías o condiciones clínicas del segmento anterior del ojo como: queratocono,
acomodación, presbicia y cataratas y sus distintos tratamientos (anillos intracorneales,
ICRS; lentes intraoculares monofocales, IOL; lentes intraoculares acomodativas, A-
IOL).
2. Hemos desarrollado una metodología computacional con OCT para estimar las
aberraciones de las superficies anterior y posterior de la córnea basado en un trazado
de rayos virtual. El procedimiento incluye la descripción de la forma de la córnea en
polinomios de Zernike y el cálculo de la aberración de onda. El procedimiento
completo se validó in vivo en sujetos con queratocono (donde las aberraciones de la
córnea aportan la totalidad de las aberraciones oculares) y los resultados se
compararon con los obtenidos en aberrometría LRT (sistema estándar en aberrometría
ocular).
3. Hemos estudiado, por primera vez con OCT, la forma tridimensional, espesor,
geometría y óptica (aberraciones de cada superficie) de la córnea de sujetos con
queratocono (antes y después del tratamiento con ICRS). También se ha analizado de
forma tridimensional la posición, profundidad e inclinación de los ICRS y, por
último, se definieron métricas para el análisis de la regularidad de superficie y
distribución del espesor.
En este estudio encontramos que algunos pacientes presentan unas superficies más
regulares y, en consecuencia, una disminución de las aberraciones corneales, y en
otros pacientes se observa una mayor irregularidad superficial y un aumento en las
aberraciones. Su fracaso en algunos pacientes en aplanar y regularizar la superficies
corneales y proponer una calidad visual adecuada a priori parece determinada por la
elección quirúrgica. De este estudio se extrae que el cambio en el radio corneal
anterior está asociado con el diámetro de la zona óptica, y la longitud del arco del
ICRS con el efecto sobre el radio en la superficie posterior. Asimismo, hemos
demostrado que la rotación de los ICRS con el tiempo modifica la regularidad de la
superficie anterior de la córnea.
4. Hemos diseñado dos canales de fijación/acomodación externos para estimular la
acomodación en los sistemas de OCT y LRT.

Resumen en Español
163
5. Hemos estudiado, por primera vez, la topografía del cristalino in vivo y sus cambios
con la acomodación, analizando en detalle la contribución de los componentes
individuales de la córnea (superficie anterior y posterior) y cristalino (superficie
anterior y posterior) y sus distancias relativas. La relación entre todas las superficies
ópticas aporta una información clave para entender el mecanismo de la acomodación
y contribuye de forma significativa al conocimiento de los cambios ópticos
producidos.
En promedio, encontramos que la superficie posterior de la córnea compensa un 18%
del astigmatismo y un 12% del coma de la superficie anterior. El astigmatismo y las
irregularidades de alto orden de la superficie posterior del cristalino es
significativamente mayor que en la superficie anterior y en la mayoría de sujetos sus
ejes muestran diferencia de 90 grados. En el estado relajado, las dos superficies del
cristalino muestran una alta correlación en las irregularidades de sus superficies, en
particular coma y trefoil, indicando un desarrollo coordinado.
Con acomodación, se producen cambios en magnitud (aumenta el astigmatismo en la
superficie anterior del cristalino, siendo en la mayoría de sujetos mayor que el de la
superficie posterior) y eje (entre 10 y 20 grados) en las dos superficies del cristalino.
También, se produce un cambio de valores positivos a negativos en el coeficiente
esférico en la superficie anterior del cristalino y cambios en coma y trefoil
(alcanzando un mínimo la demanda acomodativa de 3 D).
6. Por primera vez, se ha medido de forma objetiva in vivo la respuesta acomodativa
(aberraciones, LRT; biometría tridimensional, OCT) de la lente intraocular
Crystalens-AO (única lente intraocular acomodativa aprobada por la FDA). El cambio
en desenfoque estimulando acomodación con LRT varió de 0.43 a -0.36 D, siendo
consistente con el cambio axial de 0.07 a -0.01 mm. Los resultados de LRT
demuestran que los cambios en la respuesta acomodativa con Crystalens AO A-IOL
están por debajo de 0.5 D y que un 14% de los pacientes presentan respuestas
acomodativas negativas. Los resultados de OCT confirman las medidas de LRT, ya
que los cambios axiales con acomodación son muy pequeños y, en algunos caso,
opuestos al esperado. Estas evidencias indican que el mecanismo de funcionamiento
de la Crystalens AO A-IOL no produjo los cambios en potencia o axiales esperados.
En este estudio también hemos observado una mayor inclinación en la posición de la
A-IOL, indicando un cierto grado de inestabilidad en el alineamiento, y siendo mayor
con el esfuerzo acomodativo (principalmente alrededor del eje X, inclinación
superior/inferior). Curiosamente, los ojos con mayor astigmatismo, coma y trefoil
presentaron la mayor cantidad de inclinación. Esta mayor cantidad de aberraciones en
los pacientes de Crystalens resultó en un ligero aumento en la profundidad de foco,
pudiendo ofrecer un mayor rango funcional en visión de cerca.
7. Hemos medido, por primera vez, la aberración cromática longitudinal (LCA) in vivo
en pacientes con IOLs. En este estudio, hemos analizado dos modelos de lentes
intraoculares asféricas con distinto número de Abbe (Tecnis, número de Abbe = 55;
AcrySof, número de Abbe = 37. La compensación de la LCA ha sido objeto de debate
en los últimos años, ya que el beneficio de su corrección tan solo ha sido estudiado
por medio de simulaciones ópticas. Nuestras medidas de LCA se ajustan a las

Resumen en Español
164
medidas teóricas (0.46 D, Tecnis; 0.76 D, AcrySof), ya que la IOL con mayor número
de Abbe presenta una menor LCA. Sin embargo, el relativo impacto de la LCA con
las aberraciones de alto orden (con y sin astigmatismo) es menor del esperado, ya que
no se observan diferencias significativas en la degradación de la PSF entre ambas
IOLs.
Uno de los avances tecnológicos más espectaculares de los últimos años en oftalmología es
la aparición de técnicas y diagnóstico de imagen. La utilización independiente o combinada
de sistemas ópticos, imagen de alta resolución y algoritmos de cuantificación precisos, OCT
y aberrometría LRT en esta tesis, aportan la información necesaria para cualquier
exploración del segmento anterior del ojo y cualquier planteamiento quirúrgico. Las
posibilidades de explorar in vivo la topografía del cristalino no sólo abre una nueva línea de
investigación y ofrece nuevos conocimientos sobre el mecanismo de acomodación, si no que
también determina la contribución de cada superficie óptica (córnea y cristalino) a la calidad
óptica del ojo y establece el grado de relación/compensación entre superficies, por lo que
podrá aportar avances sobre el desarrollo de errores refractivos (por ejemplo, miopía) y
analizar en detalle los cambios del cristalino relacionados con la edad. Además, las
capacidades cuantitativas del OCT se pueden ampliar para analizar en detalle la córnea y el
cristalino antes de abordar una cirugía y determinar el cambio postoperatorio (incluyendo la
posición tridimensional de los tratamientos, ICRS en queratocono y IOLs en cataratas), y en
un futuro próximo desarrollar en un único instrumento (en particular, con los nuevos
desarrollos swept-source) toda la exploración ocular. Esto abre nuevas posibilidades en el
análisis y tratamiento del queratocono y, en exclusiva, en la cirugía de cataratas, ya que, este
desarrollo propondrá perspectivas novedosas y únicas en el modelo de ojos personalizados,
en el cálculo de la potencia de la lente basada en trazado de rayos y en la determinación de la
posición final de la lente, ofreciendo, en definitiva, un paso definitivo en el abordaje de la
personalización de los tratamientos del segmento anterior del ojo.

List of Publications
165
List of PUBLICATIONS
Publications included in this thesis
1. P. Pérez-Merino, M. Velasco-Ocana, E. Martínez-Enríquez, & S. Marcos. “OCT-
based crystalline lens topography in accommodating eyes”. Biomed Opt Express;
2015.
2. S. Marcos, S. Ortiz, P. Pérez-Merino, J. Birkenfeld, S. Durán & I. Jiménez-Alfaro.
“Three-dimensional evaluation of accommodating intraocular lens shift and alignment
in vivo”. Ophthalmology; 121(1):45-55. 2014.
3. P. Pérez-Merino, J. Birkenfeld, C. Dorronsoro, S. Ortiz, S. Durán, I. Jiménez-Alfaro
& S. Marcos. “Aberrometry in patients with accommodative intraocular lenses”. Am J
Ophthalmol; 157(5):1077-89. 2014.
4. P. Pérez-Merino, S. Ortiz, N. Alejandre, A. de Castro, I. Jiménez-Alfaro & S. Marcos.
“Ocular and optical coherence tomography-based corneal aberrometry in keratoconic
eyes treated by intracorneal ring segments”. Am J Ophthalmol; 157(1):116-27. 2014.
5. P. Pérez-Merino, S. Ortiz, N. Alejandre, I. Jiménez-Alfaro & S. Marcos.
“Quantitative OCT-based longitudinal evaluation of intracorneal ring segment
implantation in keratoconus”. Invest Ophthalmol Vis Sci; 54(9):6040-51. 2013
6. P. Pérez-Merino, C. Dorronsoro, L. Llorente, S. Durán, I. Jiménez-Alfaro & S.
Marcos. “In vivo chromatic aberration in eyes implanted with intraocular lenses”.
Invest Ophthalmol Vis Sci; 54(4):2654-61. 2013.
Other Publications
1. M. Sun, A. de Castro, P. Pérez-Merino, E. Martínez-Enriquez, M. Velasco-Ocana &
S. Marcos. “Intraocular lens alignment from an en face optical coherence image
Purkinje-like method”. Submitted to Biomed Opt Express; 2015.
2. M. Sun, A. de Castro, S. Ortiz, P. Pérez-Merino, J. Birkenfeld & S. Marcos.
“Intraocular lens alignment from an en face optical coherence image Purkinje-like
method”. Optical Engineering; 53(6):06174. 2014.
3. E. Gambra, S. Ortiz, P. Pérez-Merino, M. Gora, M. Wojtkowski & S. Marcos. “Static
and dynamic crystalline lens accommodation evaluated using quantitative 3-D OCT”.
Biomed Opt Express; 4(9):1595-609. 2013.
4. S. Ortiz, P. Pérez-Merino, S. Durán, M. Velasco-Ocana, J. Birkenfeld, A. de Castro, I.
Jiménez-Alfaro & S. Marcos. “In vivo human crystalline lens topography”. Biomed
Opt Express; 4(3):387-96. 2013.
5. C. Dorronsoro, D. Pascual, P. Pérez-Merino, S. Kling & S. Marcos. “Dynamic OCT
measurement of corneal deformation by an air puff in normal and cross-linked
corneas”. Biomed Opt Express; 3(3):473-87. 2012.
6. S. Ortiz, P. Pérez-Merino, N. Alejandre, E. Gambra, I. Jimenez-Alfaro & S. Marcos.
“Quantitative OCT-based corneal topography in keratoconus with intracorneal ring
segments”. Biomed Opt Express; 3(5):814-24. 2012.

List of Publicacitions
166
7. P. Gallego, C. Martínez-García, P. Pérez-Merino, L. Ibares-Frías, A. Mayo-Iscar & J.
Merayo-Lloves. “Scleral changes induced by atropine in chicks as an experimental
model of myopia”. Ophthalmic Physiol Opt; 32(6):478-84. 2012.
8. S. Ortiz, P. Pérez-Merino, E. Gambra, A. de Castro & S. Marcos. “In vivo human
crystalline lens topography”. Biomed Opt Express; 3(10):2471-88. 2012.
9. S. Marcos, J. Requejo-Isidro, J. Merayo-Lloves, A.U. Acuña, V. Hornillos, E.
Carrillo, P. Pérez-Merino, S. del Olmo-Aguado, C. del Aguila, F. Amat-Guerri & L.
Rivas. “Fluorescent labeling of acanthamoeba assessed in situ from corneal sectioned
microscopy”. Biomed Opt Express; 3(10):2489-99. 2012.
10. J.M. Bueno, E.J. Gualda, A. Giakoumaki, P. Pérez-Merino, S. Marcos & P. Artal.
“Multiphoton microscopy of ex vivo corneas after collagen cross-linking”. Invest
Ophthalmol Vis Sci; 52(8):5325-31. 2011.
11. S. Ortiz, D. Siedlecki, P. Pérez-Merino, N. Chia, A. de Castro, M. Szkulmowski, M.
Wojtkowski & S. Marcos. “Corneal topography from spectral optical coherence
tomography (sOCT)”. Biomed Opt Express; 2(12):3232-47. 2011.
12. C. Dorronsoro, S. Schumacher, P. Pérez-Merino, J. Siegel, M. Mrochen & S. Marcos.
“Effect of air-flow on the evaluation of refractive surgery ablation patterns”. Opt
Express; 19(5):4653-66. 2011.
13. P. Pérez-Merino, M.C. Martínez-García, S. Mar-Sardaña, A. Pérez-Escudero, T.
Blanco-Mezquita, A. Mayo-Iscar & J. Merayo-Lloves. “Corneal light transmission
and roughness after refractive surgery”. Optom Vis Sci; 87(7):469-74. 2010.
14. P. Pérez-Merino, F. Parra, L. Ibares-Frías, P. Gallego, B. Vázquez-Lasa, L. Benito, J.
San Román, C. Martínez-García & J. Merayo-Lloves. “Clinical and pathological
effects of different acrylic intracorneal ring segments in corneal additive surgery”.
Acta Biomater; 6(7):2572-9. 2010.
International Congress Contributions
Personally presented
1. P. Pérez-Merino, M. Velasco-Ocana, E. Martinez-Enriquez, S. Marcos. “OCT-based
crystalline lens topography in accommodating eyes”. Association for Research in
Vision and Ophtalmology (ARVO). Denver, CO. 2015. Oral communication.
2. P. Pérez-Merino, C. Dorronsoro, L. Llorente, S. Duran, I. Jimenez-Alfaro, S. Marcos.
"in vivo chromatic aberration of intraocular lenses”. IONS 2013. Zurich, Switzerland.
2013. Oral communication.
3. P. Perez-Merino, S. Ortiz, N. Alejandre, A. de Castro, I. Jimenez-Alfaro, S. Marcos.
“OCT-based topography and corneal aberrations and ray tracing total aberrations in
keratoconus before and after ICRS treatment”. Association for Research in Vision and
Ophtalmology (ARVO). Fort Lauderdale, FL. 2012. Poster.
4. P. Perez-Merino, S. Ortiz, N. Alejandre, A. de Castro, I. Jimenez-Alfaro, S. Marcos.
“Assesing corneal geometrical and optical changes on ICRS-treated corneas with
quantitative OCT”. Eurokeratoconus. Bordeaux, France. 2011. Poster.
5. P. Perez-Merino, S. Ortiz, N. Alejandre, A. de Castro, I. Jimenez-Alfaro, S. Marcos.
“Full OCT Corneal Topography and Aberrations in Keratoconic Patients and Their
Change After Intrastromal Corneal Ring Segments (ICRS) Implantation”. Association

List of Publications
167
for Research in Vision and Ophtalmology (ARVO). Fort Lauderdale, FL. 2011.
Poster.
6. C. Dorronsoro, S. Schumacher, P. Perez-Merino, J. Siegel, M. Mrochen, S. Marcos.
“Effect of Aspiration Air-Flow Speed on the Effective Refractive Surgery Ablation
Patterns”. Association for Research in Vision and Ophtalmology (ARVO). Fort
Lauderdale, FL. 2011. Poster.
7. P. Perez-Merino, S. Ortiz, N. Alejandre, E. Gambra, I. Jimenez-Alfaro, S. Marcos.
“Pre- and Post-operative quantitative 3-D OCT imaging of keratoconic eyes
implanted with intracorneal ring segments”. V European Meeting on Visual and
Physiological Optics. Stockholm, Sweden. 2010. Poster.
8. P. Pérez-Merino, F. Parra, L. Ibares-Frías, P. Gallego, B. Vázquez-Lasa, L. Benito, J.
San Román, C. Martinez-Garcia, J. Merayo-Lloves. “Biomaterials and Intracorneal
Ring Segments: Acrylic Copolymers”. Jornadas de Jóvenes Investigadores en Óptica
Visual 2010: de la ciencia básica a la transferencia tecnológica. Madrid, Spain. 2010.
Oral communication.
9. P. Perez-Merino, L. Ibares-Frías, P. Gallego, S. Del Olmo, F. Parra, M.R. Aguilar, B.
Vazquez-Lasa, J. San Román, E. Larra, J. Merayo-Lloves. “Effect of different
intracorneal ring composites shift on clinical and optical outcome”. Association for
Research in Vision and Ophtalmology (ARVO). Fort Lauderdale, FL. 2009. Poster.
10. P. Perez-Merino, M.C. Martinez-Garcia, S. Mar-Sardaña, A. Perez- Escudero T.
Blanco-Mezquita, J. Merayo-Lloves. “Relationship between the roughness of corneal
epithelium and the transmission of light”. Association for Research in Vision and
Ophtalmology (ARVO). Fort Lauderdale, FL. 2008. Poster.
Presented by collaborators
1. N. Alejandre-Alba, P. Pérez-Merino, S. Quintana, P. Pascual, I. Jimenez-Alfaro, S.
Marcos. “Scheimpflug-based derived aberrometry before and after implantation of
different combinations of ICRS in keratoconus”. Association for Research in Vision
and Ophtalmology (ARVO). Denver, CO. 2015. Poster.
2. C. Dorronsoro, J.R: Alonso-Sanz, D. Pascual, A. Radhakrishnan, M. Velasco-Ocana,
P. Pérez-Merino, S. Marcos. “Visual performance and perception with bifocal and
trifocal presbyopia corrections simulated using a hand-held simultaneous vision
device”. Association for Research in Vision and Ophtalmology (ARVO). Denver,
CO. 2015. Poster.
3. N. Bekesi, P. Pérez-Merino, L. Ibares-Frías, C. Martínez-Garcia, I.E. Kochevar, S.
Marcos, “Corneal deformation imaging of Rose-Bengal-green light cross-linked
rabbit corneas: in vivo vs ex vivo treatments and measurements”. Association for
Research in Vision and Ophtalmology (ARVO). Denver, CO. 2015. Poster.
4. M. Sun, P. Pérez-Merino, S. Duran, I. Jimenez-Alfaro, S. Marcos, “OCT-based ray
tracing on pseudophakic eyes to identify optimal IOL centration”. Association for
Research in Vision and Ophtalmology (ARVO). Denver, CO. 2015. Poster.
5. M. Sun, P. Pérez-Merino, A. de Castro, J. Birkenfeld, S. Ortiz, S. Marcos, “Full OCT-
based pseudophakic custom computer eye model”. Association for Research in Vision
and Ophtalmology (ARVO). Orlando, FL. 2014. Poster.
6. S. Marcos, S. Ortiz, P. Pérez-Merino, M. Velasco, M. Sun, J. Birkenfeld, S. Durán, I.

List of Publicacitions
168
Jimenez-Alfaro. “Three-dimensional biometry and alignment in eyes implanted with
accommodative-IOLs as a function of accommodative demand”. Association for
Research in Vision and Ophtalmology (ARVO). Seattle, WA. 2013. Oral
communication.
7. S. Ortiz, P. Pérez-Merino, E. Gambra, S. Marcos. “Image analysis and quantification
in anterior segment OCT: techniques and applications”. Biomedical Optics. Miami,
FL. 2012. Oral communication.
8. S. Marcos, S. Ortiz, P. Pérez-Merino. “Quantitative Three-Dimensional anterior
segment imaging optical coherence tomography: development and its applications”.
30th European Society of Cataract and Refractive Surgery Meeting. Milan, Italy.
2012. Oral communication.
9. S. Marcos, P. Pérez-Merino, C. dorronsoro, L. Llorente, S. Durán, I. Jiménez-Alfaro.
“Effect of tilt and decentration of IOL”. 30th European Society of Cataract and
Refractive Surgery Meeting. Milan, Italy. 2012. Oral communication.
10. S. Marcos, E. Gambra, S. Ortiz, P. Pérez-Merino. “Aberrations of the optical system”.
30th European Society of Cataract and Refractive Surgery Meeting. Milan, Italy.
2012. Oral communication.
11. S. Marcos, E. Gambra, S. Ortiz, P. Pérez-Merino. “Accommodation dynamics using
high-speed optical coherence tomography”. 7th
Accommodation Club. Miami, FL.
2012. Oral communication.
12. J. Birkenfeld, A. de Castro, S. Ortiz, P. Pérez-Merino, E. Gambra, S. Marcos. “Three-
dimensional reconstrution of the isolated human crystalline lens gradient index
distribution”. Association for Research in Vision and Ophtalmology (ARVO). Fort
Lauderdale, FL. 2011. Oral communication.
13. C. Dorronsoro, D. Pascual, P. Pérez-Merino, S. Kling, S. Marcos. “Medida de la
deformación producida por un pulso de aire en corneas normales y en corneas tratadas
con cross-linking mediante imagen OCT”. X Reunión Nacional de Óptica. Zaragoza,
Spain. 2012. Oral communication.
14. S. Ortiz, D. Siedlecki, P. Pérez-Merino, S. Marcos. “Anterior Segment Optical
Coherence Tomography (OCT): From Nice Images to Accurate Topography”.
Association for Research in Vision and Ophtalmology (ARVO). Fort Lauderdale, FL.
2011. Oral communication.
15. J. Birkenfeld, A. de Castro, S. Ortiz, P. Pérez-Merino, E. Gambra, S. Marcos.
“Quantitative 3D Imaging of the in vivo Crystalline Lens During Accommodation”.
Association for Research in Vision and Ophtalmology (ARVO). Fort Lauderdale, FL.
2011. Oral communication.
16. S. Ortiz, P. Perez-Merino, E. Gambra, S. Kling, A. de Castro, D. Pascual, I.
Grulkwoski, M. Gora, M. Wojtkowski. “Quantitative three-dimensional anterior
segment imaging optical coherence tomography: developments and applications”. V
European Meeting on Visual and Physiological Optics. Stockholm, Sweden. 2010.
Oral communication.
17. E. Gambra, S. Ortiz, P. Pérez-Merino, M. Gora, M. Wojtkowski, S. Marcos.
“Quantitative 3D Imaging of the in vivo Crystalline Lens During Accommodation”.
Association for Research in Vision and Ophtalmology (ARVO). Fort Lauderdale, FL.
2010. Oral communication.
18. S. Kling, P. Perez-Merino, S. Ortiz, D. Pascual, S. Marcos. “Biomechanical Response

List of Publications
169
to Intraocular Pressure Changes From Scheimpflug and Anterior Segment OCT”.
Association for Research in Vision and Ophtalmology (ARVO). Fort Lauderdale, FL.
2010. Oral communication.
19. J. M. Bueno, E. J. Gualda, A. Giakoumaki, P. Perez-Merino, S. Kling, S. Marcos, P.
Artal. “Second Harmonic Imaging of Corneas After Collagen Cross-Linking”.
Association for Research in Vision and Ophtalmology (ARVO). Fort Lauderdale, FL.
2010. Poster.
20. L. Ibares-Frias, P. Perez-Merino, P. Gallego, S. del Olmo, B. Vázquez-Lasa, J. San
Román, N. Garagorri, E. Larra, J. Merayo-Lloves, E. Hernandez-Galilea. “Clinical
and pathological outcome of new materials for corneal additive surgery”. Association
for Research in Vision and Ophtalmology (ARVO). Fort Lauderdale, FL. 2009.
Poster.
21. J. Merayo-Lloves, T. Blanco, J. Hincapié, R. Cantalapiedra, P. Perez-Merino, I.
Alcalde, P. Gallego, S. del Olmo-Aguado, L. Ibares-Frias, S. Mar. “Long-term light
scattering measurements after corneal collagen cross-linking using riboflavin/UVA
treatment (CXL)”. Association for Research in Vision and Ophtalmology (ARVO).
Fort Lauderdale, FL. 2009. Poster.
Invited talks
P. Perez-Merino. “From corneal topography to ZEMAX: Odd cases”. IOL Power Club, 11th
Scientific Session Agenda. San Sebastian, Spain. 2015.
P. Perez-Merino. “Topografía y aberraciones del segment anterior del ojo: aplicaciones en
queratocono y cataratas”. Instituto Oftalmológico Fernández Vega. Oviedo, Spain. 2014.
P. Perez-Merino. “Topografía de queratocono por OCT”. I Reunión de la Sociedad Gallega
de Optometría Clínica. Santiago, Spain. 2012.
P. Perez-Merino. “Fundamentos de OCT”. I Reunión de la Sociedad Gallega de Optometría
Clínica. Santiago, Spain. 2012.
P. Perez-Merino, “Keratoconus roundtable disccussion group”. Association for Research in
Vision and Ophtalmology (ARVO). Fort Lauderdale, FL. 2012.
P. Perez-Merino, S. Ortiz, N. Alejandre, I. Jimenez-Alfaro, S. Marcos. “Evaluación del
queratocono con OCT cuantitativo”. III Congreso Fundacional de la Asociación Española de
Tecnología y Cirugía de Implantes, Refractiva y Cornea. Madrid, Spain. 2012.
P. Perez-Merino, T. Blanco-Mezquita, R. Rodriguez-Cantalapiedra, P. Gallego, I. Alcalde, S.
del Olmo, M.C. Martinez-Garcia, S. Mar-Sardaña, J. Merayo-Lloves. “Transparencia
Corneal tras Cross-Linking en modelo de gallina”. I Congreso Fundacional de la Asociación
Española de Tecnología y Cirugía de Implantes, Refractiva y Cornea. Madrid, Spain. 2010.

List of Publicacitions
170
Other information that might be relevant
Panel reviewer 2015 IDEA2 Madrid-MIT M+Vision Consortium.
S. Ortiz, P. Pérez-Merino, S. Marcos. “Eye biometry using quantitative 3-D OCT”, Optics
and Photonics News; 24(12):31-31.
Book Chapters:
- “Monochromatic aberrations”. Authors: Susana Marcos, Pablo Pérez-Merino, Carlos
Dorronsoro. Book: Handbook of visual optics. Year: 2015.
- “Biomecánica de la córnea”. Authors: Jesús Merayo-Lloves, Pablo Pérez-Merino,
Nestor Cortes, David Galarreta. Book: Técnicas de modelado corneal desde la
ortoqueratología hasta el cross-linking. Dr. Julian Cezón. Editor: Sociedad Española de
Cirugía Ocular Implanto-Refractiva. Year: 2009. ISBN: 8493314471, 9788493314477.
- “Transparencia y cicatrización tras cross-linking del colágeno corneal”. Authors:
Jesús Merayo-Lloves, Pablo Pérez-Merino, Tomás Blanco, Janeth Hincapie, Lucía
Ibares, Nestor Cortes, David Galarreta, Susana del Olmo, Patricia Gallego, Roberto
Cantalapiedra, Carmen Martínez, Santiago Mar. Book: Técnicas de modelado corneal
desde la ortoqueratología hasta el cross-linking. Dr. Julian Cezón. Editor: Sociedad
Española de Cirugía Ocular Implanto-Refractiva. Year: 2009. ISBN: 8493314471,
9788493314477.
Reviewer in different scientific journals: PLOS One, Biomedical Optics Express, Journal of
Cataract and Refractive Surgery, Optometry and Vision Science, European Journal of
Ophthalmology, Journal of Optometry.
IOSA (Instituto de Óptica-OSA Student Chapter). Outreach activities.
Honors
Awardee of IDEA2 Madrid-MIT M+Vision Consortium. NiCO project: smartphone-based
corneal topographer (http://mvisionconsortium.mit.edu/2014-idea²-madrid-awardees-
announced). 2014.
Awardee in innoSmart European Competition (http://www.innosmart.eu/). 2015.


Bibliography
173
Bibliography
Ahmad, B. U., Shah, G. K., & Hardten, D. R. (2014). Presbyopia-correcting intraocular
lenses and corneal refractive procedures: a review for retinal surgeons. Retina,
34(6), 1046-1054.doi: 10.1097/IAE.0000000000000237
Alio, J. L., Pinero, D. P., Aleson, A., Teus, M. A., Barraquer, R. I., Murta, J., . . . Uceda-
Montanes, A. (2011). Keratoconus-integrated characterization considering anterior
corneal aberrations, internal astigmatism, and corneal biomechanics. J Cataract
Refract Surg, 37(3), 552-568.doi: 10.1016/j.jcrs.2010.10.046
Alio, J. L., & Shabayek, M. H. (2006). Corneal higher order aberrations: a method to grade
keratoconus. J Refract Surg, 22(6), 539-545
Alio, J. L., Tavolato, M., De la Hoz, F., Claramonte, P., Rodriguez-Prats, J. L., & Galal, A.
(2004). Near vision restoration with refractive lens exchange and
pseudoaccommodating and multifocal refractive and diffractive intraocular lenses:
comparative clinical study. J Cataract Refract Surg, 30(12), 2494-2503.doi:
10.1016/j.jcrs.2004.04.052
Alio, J. L., Vega-Estrada, A., Esperanza, S., Barraquer, R. I., Teus, M. A., & Murta, J.
(2014). Intrastromal corneal ring segments: how successful is the surgical treatment
of keratoconus? Middle East Afr J Ophthalmol, 21(1), 3-9.doi: 10.4103/0974-
9233.124076
Allison, M., & Brennan, N. (1997). The Axis of Astigmatism in Right and Left Eye Pairs.
Optometry and Vision Science, 74, 668-675
Applegate, R. A., Ballentine, C., Gross, H., Sarver, E. J., & Sarver, C. A. (2003a). Visual
acuity as a function of Zernike mode and level of root mean square error. Optometry
and Vision Science, 80(2), 97-105
Applegate, R. A., Hilmante, l. G., Howland, H. C., Tu, E. Y., Starck, T., & Zayac, E. J.
(2000). Corneal first surface optical aberrations and visual performance. Journal of
Refractive surgery, 16, 507-514
Applegate, R. A., Marsack, J. D., Ramos, R., & Sarver, E. J. (2003b). Interaction between
aberrations to improve or reduce visual performance. Journal of Cataract and
Refractive Surgery, 29(8), 1487-1495
Applegate, R. A., Marsack, J. D., & Thibos, L. N. (2006). Metrics of retinal image quality
predict visual performance in eyes with 20/17 or better visual acuity. Optometry
and Vision Science, 83(9), 635-640
Aramberri, J. (2003). Intraocular lens power calculation after corneal refractive surgery:
double-K method. J Cataract Refract Surg, 29(11), 2063-2068
Arnulf, A., & Dupuy, O. (1956). Méthode objective pour l'etude des défauts du systéme
optique de l'oeil Problems in contemporary optics (pp. 330-335): Inst. Naz. Ottica,
Arcetri-Firenze.
Artal, P., & Guirao, A. (1998). Contributions of the cornea and the lens to the aberrations of
the human eye. Optics Letters, 23(21), 1713-1715

Bibliography
174
Artal, P., Guirao, A., Berrio, E., & Williams, D. R. (2001a). Compensation of corneal
aberrations by the internal optics in the human eye. J Vis, 1(1), 1-8.doi:
10.1167/1.1.1
Artal, P., Guirao, A., Berrio, E., & Williams, D. R. (2001b). Compensation of corneal
aberrations by the internal optics in the human eye. Journal of Vision., 1, 1-8.
http://journalofvision.org/1/1/1, DOI 10.1167/1161.1161.1161.
Artal, P., Manzanera, S., Piers, P., & Weeber, H. (2010). Visual effect of the combined
correction of spherical and longitudinal chromatic aberrations. Opt Express, 18(2),
1637-1648.doi: 10.1364/OE.18.001637
Artal, P., & Tabernero, J. (2010). Optics of human eye: 400 years of exploration from
Galileo's time. Appl Opt, 49(16), D123-130.doi: 10.1364/AO.49.00D123
Atchison, D. A. (1989). Optical design of intraocular lenses .1. On-axis performance.
Optometry and Vision Science, 66(8), 492-506
Atchison, D. A. (1991). Design of aspheric intraocular lenses. Ophthalmic Physiology
Optics, 11(2), 137-146
Atchison, D. A. (1995). Accommodation and presbyopia. Ophthalmic Physiol Opt, 15(4),
255-272
Atchison, D. A., & Smith, G. (1995). Continuous gradient index and shell models of the
human lens. Journal of the Optical Society of America A, 14, 1684-1695
Atchison, D. A., & Smith, G. (2000). Optics of the Human Eye. Oxford: Butterworth-
Heinemann.
Baldwin, W. R., & Mills, D. (1981). A longitudinal study of corneal astigmatism and total
astigmatism. Am J Optom Physiol Opt, 58(3), 206-211
Barbero, S., & Marcos, S. (2007). Analytical tools for customized design of monofocal
intraocular lenses. http://www.opticsinfobase.org/abstract.cfm?URI=oe-15-14-8576
Opt Express, 15, 8576-8591
Barbero, S., Marcos, S., Merayo-Lloves, J., & Moreno-Barriuso, E. (2002a). Validation of
the estimation of corneal aberrations from videokeratography in keratoconus.
Journal of Refractive surgery, 18, 263-270
Barbero, S., Marcos, S., & Merayo-Lloves, J. M. (2002b). Total and corneal aberrations in an
unilateral aphakic subject. Journal of Cataract and Refractive Surgery., 28, 1594-
1600
Barbero, S., Marcos, S., Montejo, J., & Dorronsoro, C. (2011). Design of isoplanatic
aspheric monofocal intraocular lenses. Opt Express, 19(7), 6215-6230.doi:
10.1364/OE.19.006215
Barbero, S., Marcos, S., & Jimenez-Alfaro, I. (2003). Optical aberrations of intraocular
lenses measured in vivo and in vitro. Journal of the Optical Society of America A.,
20, 1841-1851
Bassnett, S., Shi, Y., & Vrensen, G. F. (2011). Biological glass: structural determinants of
eye lens transparency. Philos Trans R Soc Lond B Biol Sci, 366(1568), 1250-
1264.doi: 10.1098/rstb.2010.0302
Bedford, R. E., & Wyszecki, G. (1957). Axial chromatic aberration of the human eye.
Journal of the Optical Society of America A, 47, 564-565
Beebe, D. C. (2003). The Lens In: Kaufman PL,Alm A, eds. Adler´s Physiology of the Eye. 3
ed. St. Louis: Mosby, 117-158

Bibliography
175
Beems, E. M., & Van Best, J. A. (1990). Light transmission of the cornea in whole human
eyes. Exp Eye Res, 50(4), 393-395
Beiko, G. (2007). Status of accommodative intraocular lenses. Curr Opin Ophthalmol, 18(1),
74-79.doi: 10.1097/ICU.0b013e328011fbab
Beiko, G. H. (2013). Comparison of visual results with accommodating intraocular lenses
versus mini-monovision with a monofocal intraocular lens. J Cataract Refract Surg,
39(1), 48-55.doi: 10.1016/j.jcrs.2012.08.059
Benedek, G. B. (1971). Theory of transparency of the eye. Appl Opt, 10(3), 459-473.doi:
10.1364/AO.10.000459
Bennett, E. S. (2008). Contact lens correction of presbyopia. Clin Exp Optom, 91(3), 265-
278.doi: 10.1111/j.1444-0938.2007.00242.x
Berrio, E., Tabernero, J., & Artal, P. (2010). Optical aberrations and alignment of the eye
with age. J Vis, 10(14).doi: 10.1167/10.14.34
Birkenfeld, J., de Castro, A., & Marcos, S. (2014). Contribution of shape and gradient
refractive index to the spherical aberration of isolated human lenses. Invest
Ophthalmol Vis Sci, 55(4), 2599-2607.doi: 10.1167/iovs.14-14201
Birkenfeld, J., de Castro, A., Ortiz, S., Pascual, D., & Marcos, S. (2013). Contribution of the
gradient refractive index and shape to the crystalline lens spherical aberration and
astigmatism. Vision Res, 86, 27-34.doi: 10.1016/j.visres.2013.04.004
Bobier, C. W., & Sivak, J. G. (1978a). Chromoretinoscopy. Vision research, 18, 247-250
Bobier, C. W., & Sivak, J. G. (1978b). Chromoretinoscopy. Vision Res, 18(3), 247-250
Bolz, M., Prinz, A., Drexler, W., & Findl, O. (2007). Linear relationship of refractive and
biometric lenticular changes during accommodation in emmetropic and myopic
eyes. British Journal of Ophthalmology, 91(3), 360-365
Boote, C., Dennis, S., Huang, Y., Quantock, A. J., & Meek, K. M. (2005). Lamellar
orientation in human cornea in relation to mechanical properties. J Struct Biol,
149(1), 1-6.doi: 10.1016/j.jsb.2004.08.009
Born, M., & Wolf, E. (1993). Principles of Optics (6th ed.). Oxford, U.K.: Pergamon Press.
Bradley, A. (1992). Perceptual Manifestations of Imperfect Optics in the Human Eye:
Attempts to Corrects for Ocular Chromatic Aberration. Optometry and Vision
Science, 69(7), 515-521
Brown, B., Bowman, K. J., & Collins, M. J. (1987). Visual Performance with Multifocal
Contact Lenses and Spectacles.
Burns, S., & Marcos, S. (2001). Measurement of image quality with the spatilly resolved
refractometer. In S. McRae, R. Krueger & R. Applegate (Eds.), Customized corneal
ablation: The quest for super vision (pp. 203-209): Stack publising.
Campbell, F. W., & Gubisch, R. W. (1966). Optical quality of the human eye. Journal of
Physiology (London), 186, 558-578
Canovas, C., & Artal, P. (2011). Customized eye models for determining optimized
intraocular lenses power. Biomed Opt Express, 2(6), 1649-1662.doi:
10.1364/BOE.2.001649
Colin, J., Cochener, B., Savary, G., & Malet, F. (2000). Correcting keratoconus with
intracorneal rings. J Cataract Refract Surg, 26(8), 1117-1122
Cumming, J. S., Colvard, D. M., Dell, S. J., Doane, J., Fine, I. H., Hoffman, R. S., . . . Slade,
S. G. (2006). Clinical evaluation of the Crystalens AT-45 accommodating

Bibliography
176
intraocular lens: results of the U.S. Food and Drug Administration clinical trial. J
Cataract Refract Surg, 32(5), 812-825.doi: 10.1016/j.jcrs.2006.02.007
Chalita, M. R., & Krueger, R. R. (2004). Wavefront aberrations associated with the Ferrara
intrastromal corneal ring in a keratoconic eye. J Refract Surg, 20(6), 823-830
Charman, W. N. (2008). The eye in focus: accommodation and presbyopia. Clinical and
Experimental Optometry, 91(3), 207-225.doi: 10.1111/j.1444-0938.2008.00256.x
Charman, W. N. (2009). Physiological optics in 2008: standing on Helmholtz's shoulders.
Ophthalmic Physiol Opt, 29(3), 209-210.doi: 10.1111/j.1475-1313.2009.00668.x
Charman, W. N., & Jennings, J. A. (1976). Objective measurements of the longitudinal
chromatic aberration of the human eye. Vision Res, 16(9), 999-1005
Chen, L., Kruger, P. B., Hofer, H., Singer, B., & Williams, D. R. (2006). Accommodation
with higher-order monochromatic aberrations corrected with adaptive optics.
Journal of the Optical Society of America a-Optics Image Science and Vision,
23(1), 1-8
Chen, M., & Yoon, G. (2008). Posterior corneal aberrations and their compensation effects
on anterior corneal aberrations in keratoconic eyes. Invest Ophthalmol Vis Sci,
49(12), 5645-5652.doi: 10.1167/iovs.08-1874
Cheng, X., Bradley, A., Hong, X., & Thibos, L. (2003a). Relationship between refractive
error and monochromatic aberrations of the eye. Optom Vis Sci., 80, 43-49
Cheng, X., Bradley, A., & Thibos, L. N. (2004). Predicting subjective judgment of best focus
with objective image quality metrics. Journal of Vision, 4(4), 310-321
Cheng, X., Thibos, L., & Bradley, A. (2003b). Estimating visual quality from wavefront
aberration measurements. J Refract Surg., 19, 579-584
Chinn, S. R., Swanson, E. A., & Fujimoto, J. G. (1997). Optical coherence tomography using
a frequency-tunable optical source. Opt Lett, 22(5), 340-342
Choi, M., Weiss, S., Schaeffel, F., Seidemann, A., Howland, H. C., Wilhelm, B., & Wilhelm,
H. (2000). Laboratory, clinical, and kindergarten test of a new eccentric infrared
photorefractor (PowerRefractor). Optom Vis Sci, 77(10), 537-548
Choma, M., Sarunic, M., Yang, C., & Izatt, J. (2003). Sensitivity advantage of swept source
and Fourier domain optical coherence tomography. Opt Express, 11(18), 2183-2189
Dauwe, C., Touboul, D., Roberts, C. J., Mahmoud, A. M., Kerautret, J., Fournier, P., . . .
Colin, J. (2009). Biomechanical and morphological corneal response to placement
of intrastromal corneal ring segments for keratoconus. J Cataract Refract Surg,
35(10), 1761-1767.doi: 10.1016/j.jcrs.2009.05.033
Daza de Valdés, B. (1623). Uso de los anteojos.
de Castro, A., Birkenfeld, J., Maceo, B., Manns, F., Arrieta, E., Parel, J. M., & Marcos, S.
(2013). Influence of shape and gradient refractive index in the accommodative
changes of spherical aberration in nonhuman primate crystalline lenses. Invest
Ophthalmol Vis Sci, 54(9), 6197-6207.doi: 10.1167/iovs.13-11996
de Castro, A., Ortiz, S., Gambra, E., Siedlecki, D., & Marcos, S. (2010). Three-dimensional
reconstruction of the crystalline lens gradient index distribution from OCT imaging.
Opt Express, 18(21), 21905-21917.doi: 10.1364/OE.18.021905
de Castro, A., Siedlecki, D., Borja, D., Uhlhorn, S., Parel, J. M., Manns, F., & Marcos, S.
(2011). Age-dependent variation of the Gradient Index profile in human crystalline
lenses. J Mod Opt, 58(19-20), 1781-1787.doi: 10.1080/09500340.2011.565888

Bibliography
177
Dick, H. B., & Kaiser, S. (2002). [Dynamic aberrometry during accommodation of phakic
eyes and eyes with potentially accommodative intraocular lenses]. Ophthalmologe,
99(11), 825-834.doi: 10.1007/s00347-002-0737-3
Drexler, W., Baumgartner, A., Findl , O., Hitzenberger, C., & Fercher, A. (1997). Biometric
investigation of changes in the anterior eye segment during accomodation. Vision
research, 37(19), 2789-2800
Drexler, W., Findl, O., Menapace, R., Rainer, G., Vass, C., Hitzenberger, C., & Fercher, A.
(1998). Partial coherence interferometry: a novel approach to biometry in cataract
surgery. american journal of ophtalmology, 126(4), 524-534
Dubbelman, M., & Heijde, V. (2001). The shape of the aging human lens: curvature,
equivalent refractive index and the lens paradox. Vision research, 41, 1867-1877
Dubbelman, M., Sicam, V. A., & Van der Heijde, G. L. (2006a). The shape of the anterior
and posterior surface of the aging human cornea. Vision Res, 46(6-7), 993-1001.doi:
10.1016/j.visres.2005.09.021
Dubbelman, M., Sicam, V. A., & van der Heijde, R. G. (2007a). The contribution of the
posterior surface to the coma aberration of the human cornea. J Vis, 7(7), 10 11-
18.doi: 10.1167/7.7.10
Dubbelman, M., Sicam, V. A. D. P., & van der Heijde, R. G. L. (2007b). The contribution of
the posterior surface to the coma aberration of the human cornea,
http://journalofvision.org/7/7/10/, doi:10.1167/7.7.10. Journal of Vision, 7, 1-8
Dubbelman, M., Sicarn, V., & Van der Heijde, G. L. (2006b). The shape of the anterior and
posterior surface of the aging human cornea. Vision research, 46(6-7), 993-1001
Dubbelman, M., Van der Heijde, G. L., & Weeber, H. A. (2005). Change in shape of the
aging human crystalline lens with accommodation. Vision research, 45(1), 117-
132.doi: 10.1016/j.visres.2004.07.032
Dunne, M. C., Elawad, M. E., & Barnes, D. A. (1996). Measurement of astigmatism arising
from the internal ocular surfaces. Acta Ophthalmol Scand, 74(1), 14-20
Dupps Jr, W. J., & Wilson, S. E. (2006). Biomechanics and wound healing in the cornea.
Exp Eye Res, 83(4), 709-720
Einighammer, J., Oltrup, T., Feudner, E., Bende, T., & Jean, B. (2009). Customized aspheric
intraocular lenses calculated with real ray tracing. J Cataract Refract Surg, 35(11),
1984-1994.doi: 10.1016/j.jcrs.2009.05.053
Elsheikh, A., Alhasso, D., & Rama, P. (2008). Biomechanical properties of human and
porcine corneas. Exp Eye Res, 86(5), 783-790
Fercher, A. F., Hitzenberger, C. K., Drexler, W., Kamp, G., & Sattmann, H. (1993). In vivo
optical coherence tomography. Am J Ophthalmol, 116(1), 113-114
Fercher, A. F., Mengedoht, K., & Werner, W. (1988). Eye-length measurement by
interferometry with partially coherent light. Opt Lett, 13(3), 186-188
Fyodorov, S. N., Galin, M. A., & Linksz, A. (1975). Calculation of the optical power of
intraocular lenses. Invest Ophthalmol, 14(8), 625-628
Gambra, E., Ortiz, S., Perez-Merino, P., Gora, M., Wojtkowski, M., & Marcos, S. (2013).
Static and dynamic crystalline lens accommodation evaluated using quantitative 3-
D OCT. Biomed Opt Express, 4(9), 1595-1609.doi: 10.1364/BOE.4.001595
Gambra, E., Sawides, L., Dorronsoro, C., & Marcos, S. (2009). Accommodative lag and
fluctuations when optical aberrations are manipulated. J Vis, 9(6), 4 1-15.doi:
10.1167/9.6.4

Bibliography
178
Gambra, E., Wang, Y., Yuan, J., Kruger, P. B., & Marcos, S. (2010). Dynamic
accommodation with simulated targets blurred with high order aberrations. Vision
Res, 50(19), 1922-1927.doi: 10.1016/j.visres.2010.06.015
Garner, L. F., & Smith, G. (1997). Changes in equivalent and gradient refractive index of the
crystalline lens with accommodation. Optom Vis Sci, 74(2), 114-119
Glasser, A. (2008). Restoration of accommodation: surgical options for correction of
presbyopia. Clin Exp Optom, 91(3), 279-295.doi: 10.1111/j.1444-
0938.2008.00260.x
Glasser, A., & Campbell, M. (1998a). Presbyopia and the optical changes in the human
crystalline lens with age. Vision research, 38(2), 209-229
Glasser, A., & Campbell, M. C. (1998b). Presbyopia and the optical changes in the human
crystalline lens with age. Vision Res, 38(2), 209-229
Gokhale, N. S. (2013). Epidemiology of keratoconus. Indian J Ophthalmol, 61(8), 382-
383.doi: 10.4103/0301-4738.116054
Goncharov, A. V., & Dainty, C. (2007). Wide-field schematic eye models with gradient-
index lens. Journal of the Optical Society of America a-Optics Image Science and
Vision, 24(8), 2157-2174
Gorgun, E., Kucumen, R. B., Yenerel, N. M., & Ciftci, F. (2012). Assessment of intrastromal
corneal ring segment position with anterior segment optical coherence tomography.
Ophthalmic Surg Lasers Imaging, 43(3), 214-221.doi: 10.3928/15428877-
20120301-01
Grosvenor, T., Quintero, S., & Perrigin, D. M. (1988). Predicting refractive astigmatism: a
suggested simplification of Javal's rule. Am J Optom Physiol Opt, 65(4), 292-297
Grulkowski, I., Gora, M., Szkulmowski, M., Gorczynska, I., Szlag, D., Marcos, S., . . .
Wojtkowski, M. (2009). Anterior segment imaging with Spectral OCT system using
a high-speed CMOS camera. Opt Express, 17(6), 4842-4858
Grulkowski, I., Liu, J. J., Potsaid, B., Jayaraman, V., Jiang, J., Fujimoto, J. G., & Cable, A.
E. (2013). High-precision, high-accuracy ultralong-range swept-source optical
coherence tomography using vertical cavity surface emitting laser light source. Opt
Lett, 38(5), 673-675.doi: 10.1364/OL.38.000673
Grulkowski, I., Liu, J. J., Potsaid, B., Jayaraman, V., Lu, C. D., Jiang, J., . . . Fujimoto, J. G.
(2012). Retinal, anterior segment and full eye imaging using ultrahigh speed swept
source OCT with vertical-cavity surface emitting lasers. Biomed Opt Express,
3(11), 2733-2751.doi: 10.1364/BOE.3.002733
Guirao, A., & Artal, P. (1999a). Corneal aberrations as a function of age. Investigative
Ophthalmology & Visual Science, 40(4), S535-S535
Guirao, A., & Artal, P. (1999b). Off-axis monochomatic aberrations estimated from double
pass measurements in the human eye. Vision research, 39(2), 207-217
Guirao, A., Redondo, M., Geraghty, E., Piers, P., Norrby, S., & Artal, P. (2002). Corneal
optical aberrations and retinal image quality in patients in whom monofocal
intraocular lenses were implanted. Arch Ophthalmol, 120, 1143-1151
Guirao, A., Tejedor, J., & Artal, P. (2004). Corneal aberrations before and after small-
incision cataract surgery. Invest Ophthalmol Vis Sci, 45(12), 4312-4319.doi:
10.1167/iovs.04-0693
Guirao, A., & Williams, D. (2003). A method to predict refractive errors from wave
aberration data. Optom Vis Sci., 80, 36-42

Bibliography
179
Gullstrand, A. (1909). Appendix II in: H. von Helmholtz ‘Handbuch der Physiologischen
Optik’, 3rd edition, part I.
. 350-358
Hart, R. W., & Farrell, R. A. (1968). Light scattering in the cornea. Journal of the Optical
Society of America A, 59, 766-775
Hartmann, J. (1900). Bemerkungen über den Bau und die Justierung von Spektrgraphen. Z
Instumentenkd, 20, 47-58
Hartmann, J. (1904). Objektivuntersuchungen. Z Instrumentenkd, 24, 1-32
He, J. C., Burns, S. A., & Marcos, S. (2000a). Monochromatic aberrations in the
accommodated human eye. Vision Res, 40(1), 41-48
He, J. C., Burns, S. A., & Marcos, S. (2000b). Monochromatic aberrations in the
accommodated human eye. Vision research, 40, 41-48
He, J. C., & Wang, J. (2014). Measurement of wavefront aberrations and lens deformation in
the accommodated eye with optical coherence tomography-equipped wavefront
system. Opt Express, 22(8), 9764-9773.doi: 10.1364/OE.22.009764
Ho, A., Manns, F., Therese, & Parel, J. M. (2006). Predicting the performance of
accommodating intraocular lenses using ray tracing. J Cataract Refract Surg, 32(1),
129-136.doi: 10.1016/j.jcrs.2005.07.047
Hofer, H., Artal, P., Singer, B., Aragon, J., & Williams, D. (2001). Dynamics of the eye´s
wave aberration. Journal Optical Society of America A, 18(3), 497-506
Hoffer, K. J. (1993). The Hoffer Q formula: a comparison of theoretic and regression
formulas. J Cataract Refract Surg, 19(6), 700-712
Hoffer, K. J., Aramberri, J., Haigis, W., Olsen, T., Savini, G., Shammas, H. J., & Bentow, S.
(2015). Protocols for Studies of Intraocular Lens Formula Accuracy. Am J
Ophthalmol.doi: 10.1016/j.ajo.2015.05.029
Holladay, J., Piers, P., Koranyi, G., van der Mooren, M., & Norrby, N. (2002). A new
intraocular lens design to reduce spherical aberration of pseudophakic eyes. Journal
Refractive Surgery, 18, 683-691
Holladay, J. T., Prager, T. C., Chandler, T. Y., Musgrove, K. H., Lewis, J. W., & Ruiz, R. S.
(1988). A three-part system for refining intraocular lens power calculations. J
Cataract Refract Surg, 14(1), 17-24
Howarth, P. A. (1984). The lateral chromatic aberration of the eye. Ophthalmology and
Physiological Optics, 4(3), 223-226
Howarth, P. A., & Bradley, A. (1986). The longitudinal chromatic aberration of the human
eye, and its correction. Vision research, 26, 361-366
Howland, H. C. (2000, Feb 12). The history and methods of ophthalmic wavefront sensing.
Paper presented at the 1st International Congress of Wavefront Sensing and
Aberration-free Refractive Correction, Santa Fe, New Mexico.
Howland, H. C., & Howland, B. (1977). A subjective method for the measurement of the
monochromatic aberrations of the eye. Journal of the Optical Society of America A,
67, 1508-1518
Huang, D., Swanson, E. A., Lin, C. P., Schuman, J. S., Stinson, W. G., Chang, W., . . . et al.
(1991). Optical coherence tomography. Science, 254(5035), 1178-1181
Ibn al-Haytham, A. (1028-1038). Kitab al-Manazir (Book of Optics).

Bibliography
180
Izatt, J. A., Hee, M. R., Swanson, E. A., Lin, C. P., Huang, D., Schuman, J. S., . . . Fujimoto,
J. G. (1994). Micrometer-scale resolution imaging of the anterior eye in vivo with
optical coherence tomography. Arch Ophthalmol, 112(12), 1584-1589
Jakus, M. A. (1962). Further observations on the fine structure of the cornea. Invest
Ophthalmol, 1, 202-225
Jester, J. V. (2008). Corneal crystallins and the development of cellular transparency.
Seminars in Cell & Developmental Biology, 19(2), 82-93
Jones, C. E., Atchison, D. A., & Pope, J. M. (2007). Changes in lens dimensions and
refractive index with age and accommodation. Optometry and Vision Science,
84(10), 990-995
Karnowski, K., Kaluzny, B. J., Szkulmowski, M., Gora, M., & Wojtkowski, M. (2011).
Corneal topography with high-speed swept source OCT in clinical examination.
Biomed Opt Express, 2(9), 2709-2720.doi: 10.1364/BOE.2.002709
Kasthurirangan, S., Markwell, E. L., Atchison, D. A., & Pope, J. M. (2011). MRI study of
the changes in crystalline lens shape with accommodation and aging in humans. J
Vis, 11(3).doi: 10.1167/11.3.19
Keller, P. R., Collins, M. J., Carney, L. G., Davis, B. A., & van Saarloos, P. P. (1996). The
relation between corneal and total astigmatism. Optom Vis Sci, 73(2), 86-91
Kelly, J. E., Mihashi, T., & Howland, H. C. (2004a). Compensation of corneal
horizontal/vertical astigmatism, lateral coma, and spherical aberration by internal
optics of the eye. Journal of Vision, 4(4), 262-271
Kelly, J. E., Mihashi, T., & Howland, H. C. (2004b). Compensation of corneal
horizontal/vertical astigmatism, lateral coma, and spherical aberration by internal
optics of the eye. J Vis, 4(4), 262-271.doi: 10:1167/4.4.2
Kepler, J. (1604). Ad Vitellionem paralipomena.
Kim, M. J., Zheleznyak, L., Macrae, S., Tchah, H., & Yoon, G. (2011). Objective evaluation
of through-focus optical performance of presbyopia-correcting intraocular lenses
using an optical bench system. J Cataract Refract Surg, 37(7), 1305-1312.doi:
10.1016/j.jcrs.2011.03.033
Klein, S. A. (1997). Axial curvature and the skew ray error in corneal topography. Optom Vis
Sci, 74(11), 931-944
Kling, S., & Marcos, S. (2013). Finite-element modeling of intrastromal ring segment
implantation into a hyperelastic cornea. Invest Ophthalmol Vis Sci, 54(1), 881-
889.doi: 10.1167/iovs.12-10852
Kling, S., Remon, L., Perez-Escudero, A., Merayo-Lloves, J., & Marcos, S. (2009).
Biomechanical Response of Normal and Cross-linked Porcine Corneas. Paper
presented at the IOVS 2009: ARVO E-Abstract: 5477.
Knupp, C., Pinali, C., Lewis, P. N., Parfitt, G. J., Young, R. D., Meek, K. M., & Quantock,
A. J. (2009). The architecture of the cornea and structural basis of its transparency.
Adv Protein Chem Struct Biol, 78, 25-49.doi: 10.1016/S1876-1623(08)78002-7
Koeppl, C., Findl, O., Menapace, R., Kriechbaum, K., Wirtitsch, M., Buehl, W., . . . Drexler,
W. (2005). Pilocarpine-induced shift of an accommodating intraocular lens: AT-45
Crystalens. J Cataract Refract Surg, 31(7), 1290-1297.doi:
10.1016/j.jcrs.2005.03.055

Bibliography
181
Koretz, J., Cook, C., & Kaufman, P. (1997). Accommodation and presbyopia in the human
eye. Changes in the anterior segment and crystalline lens with focus. Invest
Ophthalmol Vis Sci., 38, 569-578.
Kruger, P. B., Mathews, S., Aggarwala, K. R., & Sanchez, N. (1993). Chromatic aberration
and ocular focus: Fincham revisited. Vision Res, 33(10), 1397-1411
Kruger, P. B., & Pola, J. (1986). Stimuli for accommodation: blur, chromatic aberration and
size. Vision Res, 26(6), 957-971
Lai, M. M., Tang, M., Andrade, E. M., Li, Y., Khurana, R. N., Song, J. C., & Huang, D.
(2006). Optical coherence tomography to assess intrastromal corneal ring segment
depth in keratoconic eyes. J Cataract Refract Surg, 32(11), 1860-1865.doi:
10.1016/j.jcrs.2006.05.030
Langenbucher, A., Huber, S., Nguyen, N. X., Seitz, B., Gusek-Schneider, G. C., & Kuchle,
M. (2003). Measurement of accommodation after implantation of an
accommodating posterior chamber intraocular lens. J Cataract Refract Surg, 29(4),
677-685
Le Grand, Y. (1956). Optique Physiologique (Vol. 3); L'espace Visuel (1 ed. Vol. 3). Paris:
Éditions de la Revue d'Optique.
Leng, L., Yuan, Y., Chen, Q., Shen, M., Ma, Q., Lin, B., . . . Lu, F. (2014). Biometry of
anterior segment of human eye on both horizontal and vertical meridians during
accommodation imaged with extended scan depth optical coherence tomography.
PLoS One, 9(8), e104775.doi: 10.1371/journal.pone.0104775
Leydolt, C., Neumayer, T., Prinz, A., & Findl, O. (2009). Effect of patient motivation on
near vision in pseudophakic patients. Am J Ophthalmol, 147(3), 398-405 e393.doi:
10.1016/j.ajo.2008.09.002
Li, X., Yang, H., & Rabinowitz, Y. S. (2009). Keratoconus: classification scheme based on
videokeratography and clinical signs. J Cataract Refract Surg, 35(9), 1597-
1603.doi: 10.1016/j.jcrs.2009.03.050
Li, Y., Meisler, D. M., Tang, M., Lu, A. T., Thakrar, V., Reiser, B. J., & Huang, D. (2008).
Keratoconus diagnosis with optical coherence tomography pachymetry mapping.
Ophthalmology, 115(12), 2159-2166.doi: 10.1016/j.ophtha.2008.08.004
Li, Y., Shekhar, R., & Huang, D. (2006). Corneal pachymetry mapping with high-speed
optical coherence tomography. Ophthalmology, 113(5), 792-799 e792.doi:
10.1016/j.ophtha.2006.01.048
Li, Y., Tan, O., Brass, R., Weiss, J. L., & Huang, D. (2012). Corneal epithelial thickness
mapping by Fourier-domain optical coherence tomography in normal and
keratoconic eyes. Ophthalmology, 119(12), 2425-2433.doi:
10.1016/j.ophtha.2012.06.023
Liang, J., Grimm, B., Goelz, S., & Bille, J. F. (1994). Objective measurement of wave
aberrations of the human eye with the use of a Hartmann-Shack wave-front sensor.
Journal of the Optical Society of America A, 11, 1949-1957
Liang, J., & Williams, D. R. (1997a). Aberrations and retinal image quality of the normal
human eye. Journal of the Optical Society of America A, 14, 2873-2883
Liang, J., & Williams, D. R. (1997b). Aberrations and retinal image quality of the normal
human eye. J Opt Soc Am A Opt Image Sci Vis, 14(11), 2873-2883
Lopez-Gil, N., Iglesias, I., & Artal, P. (1998). Retinal image quality in the human eye as a
function of the accommodation. Vision Res, 38(19), 2897-2907
Bibliography
182
Lopez-Gil, N., Rucker, F. J., Stark, L. R., Badar, M., Borgovan, T., Burke, S., & Kruger, P.
B. (2007). Effect of third-order aberrations on dynamic accommodation. Vision
research, 47(6), 755-765
Losada, M. A., & Navarro, R. (1998). Point spread function of the human eye obtained by a
dual double-pass method. Appl Opt, 7, L7-L13
Loyd, T. L., & Gills, J. P. (1986). Linear regression software for intraocular lens implant
power calculation. Am J Ophthalmol, 102(3), 405-406
Lyle, W. (1971). Changes in corneal astigmatism with age. Am J Optom Arch Am Acad
Optom, 48, 467-478
Llorente, L., Diaz-Santana, L., Lara-Saucedo, D., & Marcos, S. (2003). Aberrations of the
human eye in visible and near infrared illumination. Optometry and Vision Science,
80, 26-35
Macsai, M. S., Padnick-Silver, L., & Fontes, B. M. (2006). Visual outcomes after
accommodating intraocular lens implantation. J Cataract Refract Surg, 32(4), 628-
633.doi: 10.1016/j.jcrs.2006.01.027
Maeda, N., Fujikado, T., Kuroda, T., Mihashi, T., Hirohara, Y., Nishida, K., . . . Tano, Y.
(2002). Wavefront aberrations measured with Hartmann-Shack sensor in patients
with keratoconus. Ophthalmology, 109(11), 1996-2003
Maeda, N., Klyce, S. D., Smolek, M. K., & Thompson, H. W. (1994). Automated
keratoconus screening with corneal topography analysis. Invest Ophthalmol Vis Sci,
35(6), 2749-2757
Mahajan, V. N. (1994). Zernike circle polynomials and optical aberrations of systems with
circular pupil. Appl Opt, 33, 8121-8124
Malacara, D., Martin, J., & Sánchez-Mondragón, J. J. (1990). Wavefront fitting with discrete
orthogonal polynomials in a unit radius circle. Optical Engineering, 29(6), 672-675
Marcos, S., Barbero, S., & Jimenez-Alfaro, I. (2005a). Optical quality and depth-of-field of
eyes implanted with spherical and aspheric intraocular lenses. J Refract Surg, 21(3),
223-235
Marcos, S., Barbero, S., & Jiménez-Alfaro, I. (2005b). Optical quality and depth-of-field of
eyes implanted with spherical and aspheric intraocular lenses. Journal of Refractive
surgery, 21, 223-235
Marcos, S., Burns, S. A., Moreno-Barriusop, E., & Navarro, R. (1999). A new approach to
the study of ocular chromatic aberrations. Vision Res, 39(26), 4309-4323
Marcos, S., Burns, S. A., Prieto, P. M., Navarro, R., & Baraibar, B. (2001). Investigating
sources of variability of monochromatic and transverse chromatic aberrations across
eyes. Vision research, 41, 3861-3871
Marcos, S., Díaz-Santana, L., Llorente, L., & Dainty, C. (2002). Ocular aberrations with ray
tracing and Shack-Hartmann wavefront sensors: does polarization play a role?
Journal of the Optical Society of America A., 19, 1063-1072
Marcos, S., Rosales, P., Llorente, L., Barbero, S., & Jiménez-Alfaro, I. (2008). Balance of
corneal horizontal coma by internal optics in eyes with intraocular artificial lenses:
evidence of a passive mechanism. Vision Res., 48, 70-79
Marcos, S., Velasco-Ocana, M., Dorronsoro, C., Sawides, L., Hernandez, M., & Marin, G.
(2015). Impact of astigmatism and high-order aberrations on subjective best focus. J
Vis, 15(11), 4.doi: 10.1167/15.11.4

Bibliography
183
Marchini, G., Pedrotti, E., Sartori, P., & Tosi, R. (2004). Ultrasound biomicroscopic changes
during accommodation in eyes with accommodating intraocular lenses: pilot study
and hypothesis for the mechanism of accommodation. J Cataract Refract Surg,
30(12), 2476-2482.doi: 10.1016/j.jcrs.2004.04.053
Massig, J. H., Lingelbach, E., & Lingelbach, B. (2005). Videokeratoscope for accurate and
detailed measurement of the cornea surface. Appl Opt, 44(12), 2281-2287
Mathias, R. T., Rae, J. L., & Baldo, G. J. (1997). Physiological properties of the normal lens.
Physiol Rev, 77(1), 21-50
Maurice, D. M. (1957). The structure and transparency of the cornea. J Physiol, 136(2), 263-
286
Mclellan, J., Marcos, S., & Burns, S. (2001). Age-related changes in monochromatic wave
aberrations in the human eye. Investigative Ophthalmology and Visual Science,
1390-1395
McLellan, J. S., Marcos, S., & Burns, S. A. (1999). The change of the aberrations of the eye
with age. Investigative Opthalmology and Visual Science (Suppl.), 40, 36
McLellan, J. S., Marcos, S., Prieto, P. M., & Burns, S. A. (2002). Imperfect optics may be
the eye's defence against chromatic blur. Nature, 417(6885), 174-176.doi:
10.1038/417174a
McLeod, S. D., Vargas, L. G., Portney, V., & Ting, A. (2007). Synchrony dual-optic
accommodating intraocular lens. Part 1: optical and biomechanical principles and
design considerations. J Cataract Refract Surg, 33(1), 37-46.doi:
10.1016/j.jcrs.2006.09.020
Meek, K. M., & Knupp, C. (2015). Corneal structure and transparency. Prog Retin Eye
Res.doi: 10.1016/j.preteyeres.2015.07.001
Meek, K. M., & Newton, R. H. (1999). Organization of collgen fibrils in the corneal stroma
in relation to mechanical properties and surgical practice. Refractive Surgery, 15,
695-699
Meek, K. M., Tuft, S. J., Huang, Y., Gill, P. S., Hayes, S., Newton, R. H., & Bron, A. J.
(2005). Changes in collagen orientation and distribution in keratoconus corneas.
Invest Ophthalmol Vis Sci, 46(6), 1948-1956.doi: 10.1167/iovs.04-1253
Mejia-Barbosa, Y., & Malacara-Hernandez, D. (2001). A review of methods for measuring
corneal topography. Optom Vis Sci, 78(4), 240-253
Michael, R., & Bron, A. J. (2011). The ageing lens and cataract: a model of normal and
pathological ageing. Philos Trans R Soc Lond B Biol Sci, 366(1568), 1278-
1292.doi: 10.1098/rstb.2010.0300
Molebny, V. V., Pallikaris, I. G., Naoumidis, L. P., Chyzh, I. H., Molebny, S. V., &
Sokurenko, V. M. (1997). Retina Ray-Tracing technique for eye-refraction
mapping. Proceedings of the SPIE, 2971, 175-183
Moreno-Barriuso, E., & Navarro, R. (2000). Laser Ray Tracing versus Hartmann-Shack
Sensor for Measuring Optical Aberrations in the Human Eye. Journal of the Optical
Society of America A, 17, 974-985
Morishige, N., Takagi, Y., Chikama, T., Takahara, A., & Nishida, T. (2011). Three-
dimensional analysis of collagen lamellae in the anterior stroma of the human
cornea visualized by second harmonic generation imaging microscopy. Invest
Ophthalmol Vis Sci, 52(2), 911-915.doi: 10.1167/iovs.10-5657

Bibliography
184
Morishige, N., Wahlert, A. J., Kenney, M. C., Brown, D. J., Kawamoto, K., Chikama, T., . . .
Jester, J. V. (2007). Second-harmonic imaging microscopy of normal human and
keratoconus cornea. Investigative Ophthalmology & Visual Science, 48(3), 1087-
1094
Morrell, A., Whitefoot, H., & Charman, W. (1991). Ocular chromatic aberration and age.
Ophthalmic Physiol Opt, 11, 385-390
Naftali, M., & Jabaly-Habib, H. (2013). Depth of intrastromal corneal ring segments by
OCT. Eur J Ophthalmol, 23(2), 171-176.doi: 10.5301/ejo.5000212
Nagata, T., Kubota, S., Watanabe, I., & Aoshima, S. (1999). [Chromatic aberration in
pseudophakic eyes]. Nihon Ganka Gakkai Zasshi, 103(3), 237-242
Nakagawa, T., Maeda, N., Higashiura, R., Hori, Y., Inoue, T., & Nishida, K. (2011). Corneal
topographic analysis in patients with keratoconus using 3-dimensional anterior
segment optical coherence tomography. J Cataract Refract Surg, 37(10), 1871-
1878.doi: 10.1016/j.jcrs.2011.05.027
Navarro, R., & Losada, M. A. (1997). Aberrations and relative efficiency of light pencils in
the living human eye. Optometry and Vision Science, 74, 540-547
Navarro, R., Moreno, E., & Dorronsoro, C. (1998). Monochromatic aberrations and point-
spread functions of the human eye across the visual field. Journal of the Optical
Society of America A, 15, 2522-2529
Navarro, R., Rozema, J. J., & Tassignon, M. J. (2013). Optical changes of the human cornea
as a function of age. Optom Vis Sci, 90(6), 587-598.doi:
10.1097/OPX.0b013e3182928bc6
Negishi, K., Ohnuma, K., Hirayama, N., Noda, T., Policy-Based Medical Services Network
Study Group for Intraocular, L., & Refractive, S. (2001). Effect of chromatic
aberration on contrast sensitivity in pseudophakic eyes. Arch Ophthalmol, 119(8),
1154-1158
Neri, A., Ruggeri, M., Protti, A., Leaci, R., Gandolfi, S. A., & Macaluso, C. (2015).
Dynamic imaging of accommodation by swept-source anterior segment optical
coherence tomography. J Cataract Refract Surg, 41(3), 501-510.doi:
10.1016/j.jcrs.2014.09.034
Nishi, Y., Mireskandari, K., Khaw, P., & Findl, O. (2009). Lens refilling to restore
accommodation. Journal of Cataract and Refractive Surgery, 35(2), 374-382.doi:
10.1016/j.jcrs.2008.10.054
Nordan, L. T. (1997). Keratoconus: diagnosis and treatment. Int Ophthalmol Clin, 37(1), 51-
63
Norrby, S., Piers, P., Campbell, C., & van der Mooren, M. (2007). Model eyes for evaluation
of intraocular lenses. Appl Opt, 46(26), 6595-6605
Novis, C. (2000). Astigmatism and toric intraocular lenses. Curr Opin Ophthalmol, 11(1),
47-50
Olsen, T. (2006). Prediction of the effective postoperative (intraocular lens) anterior chamber
depth. J Cataract Refract Surg, 32(3), 419-424.doi: 10.1016/j.jcrs.2005.12.139
Ortiz, S., Perez-Merino, P., Alejandre, N., Gambra, E., Jimenez-Alfaro, I., & Marcos, S.
(2012a). Quantitative OCT-based corneal topography in keratoconus with
intracorneal ring segments. Biomed Opt Express, 3(5), 814-824.doi:
10.1364/BOE.3.000814

Bibliography
185
Ortiz, S., Perez-Merino, P., Duran, S., Velasco-Ocana, M., Birkenfeld, J., de Castro, A., . . .
Marcos, S. (2013). Full OCT anterior segment biometry: an application in cataract
surgery. Biomed Opt Express, 4(3), 387-396.doi: 10.1364/BOE.4.000387
Ortiz, S., Perez-Merino, P., Gambra, E., de Castro, A., & Marcos, S. (2012b). In vivo human
crystalline lens topography. Biomed Opt Express, 3(10), 2471-2488.doi:
10.1364/BOE.3.002471
Ortiz, S., Siedlecki, D., Grulkowski, I., Remon, L., Pascual, D., Wojtkowski, M., & Marcos,
S. (2010). Optical distortion correction in optical coherence tomography for
quantitative ocular anterior segment by three-dimensional imaging. Opt Express,
18(3), 2782-2796.doi: 10.1364/OE.18.002782
Ortiz, S., Siedlecki, D., Perez-Merino, P., Chia, N., de Castro, A., Szkulmowski, M., . . .
Marcos, S. (2011). Corneal topography from spectral optical coherence tomography
(sOCT). Biomed Opt Express, 2(12), 3232-3247.doi: 10.1364/BOE.2.003232
Ortiz, S., Siedlecki, D., Remon, L., & Marcos, S. (2009a). Optical coherence tomography for
quantitative surface topography. Appl Opt, 48(35), 6708-6715.doi:
10.1364/AO.48.006708
Ortiz, S., Siedlecki, D., Remon, L., & Marcos, S. (2009b). Three-dimensional ray tracing on
Delaunay-based reconstructed surfaces. Appl Opt, 48(20), 3886-3893
Ostrin, L. A., & Glasser, A. (2004). Accommodation measurements in a prepresbyopic and
presbyopic population. Journal of Cataract and Refractive Surgery, 30(7), 1435-
1444
Pepose, J. S., Wang, D., & Altmann, G. E. (2012). Comparison of through-focus image
sharpness across five presbyopia-correcting intraocular lenses. Am J Ophthalmol,
154(1), 20-28 e21.doi: 10.1016/j.ajo.2012.01.013
Perez-Escudero, A., Dorronsoro, C., & Marcos, S. (2010). Correlation between radius and
asphericity in surfaces fitted by conics. J Opt Soc Am A Opt Image Sci Vis, 27(7),
1541-1548.doi: 10.1364/JOSAA.27.001541
Perez-Merino, P., Ortiz, S., Alejandre, N., de Castro, A., Jimenez-Alfaro, I., & Marcos, S.
(2014). Ocular and optical coherence tomography-based corneal aberrometry in
keratoconic eyes treated by intracorneal ring segments. Am J Ophthalmol, 157(1),
116-127 e111.doi: 10.1016/j.ajo.2013.08.017
Perez-Merino, P., Ortiz, S., Alejandre, N., Jimenez-Alfaro, I., & Marcos, S. (2013).
Quantitative OCT-based longitudinal evaluation of intracorneal ring segment
implantation in keratoconus. Invest Ophthalmol Vis Sci, 54(9), 6040-6051.doi:
10.1167/iovs.13-12401
Perez-Merino, P., Parra, F., Ibares-Frias, L., Gallego, P., Vazquez-Lasa, B., Benito, L., . . .
Merayo-Lloves, J. (2010). Clinical and pathological effects of different acrylic
intracorneal ring segments in corneal additive surgery. Acta Biomater, 6(7), 2572-
2579.doi: 10.1016/j.actbio.2010.01.014
Phillips, P., Perez-Emmanuelli, J., Rosskothen, H. D., & Koester, C. J. (1988). Measurement
of intraocular lens decentration and tilt in vivo. Journal of Cataract and Refractive
Surgery, 14, 129-135
Piers, P. (2002). Contribution of the cornea and internal surfaces to the change of ocular
aberrations with age. Journal of the opt society america A, 19(1), 137-143
Piers, P. A., Norrby, N. E., & Mester, U. (2004). Eye models for the prediction of contrast
vision in patients with new intraocular lens designs. Opt Lett, 29(7), 733-735

Bibliography
186
Piers, P. A., Weeber, H. A., Artal, P., & Norrby, S. (2007). Theoretical comparison of
aberration-correcting customized and aspheric intraocular lenses. J Refract Surg,
23(4), 374-384
Pierscionek, B. K. (1996). Aging changes in the optical elements of the eye. J. Biomed. Opt.,
1, 147-157
Pinero, D. P., Alio, J. L., Aleson, A., Escaf, M., & Miranda, M. (2009a). Pentacam posterior
and anterior corneal aberrations in normal and keratoconic eyes. Clin Exp Optom,
92(3), 297-303.doi: 10.1111/j.1444-0938.2009.00357.x
Pinero, D. P., Alio, J. L., El Kady, B., Coskunseven, E., Morbelli, H., Uceda-Montanes, A., .
. . Pascual, I. (2009b). Refractive and aberrometric outcomes of intracorneal ring
segments for keratoconus: mechanical versus femtosecond-assisted procedures.
Ophthalmology, 116(9), 1675-1687.doi: 10.1016/j.ophtha.2009.05.016
Pinero, D. P., Alio, J. L., Teus, M. A., Barraquer, R. I., & Uceda-Montanes, A. (2010).
Modeling the intracorneal ring segment effect in keratoconus using refractive,
keratometric, and corneal aberrometric data. Invest Ophthalmol Vis Sci, 51(11),
5583-5591.doi: 10.1167/iovs.09-5017
Pinsky, P. M., van der Heide, D., & Chernyak, D. (2005). Computational modeling of
mechanical anisotropy in the cornea and sclera. J Cataract Refract Surg, 31(1), 136-
145.doi: 10.1016/j.jcrs.2004.10.048
Plainis, S., & Pallikaris, I. G. (2006, Sep 07-09). Ocular monochromatic aberration statistics
in a large emmetropic population. Paper presented at the 3rd European Meeting in
Physiological Optics, London, ENGLAND.
Polack, F. M. (1961). Morphology of the cornea. I. Study with silver stains. Am J
Ophthalmol, 51, 1051-1056
Porter, J., Guirao , A., Cox , I., & Williams, D. (2001). Monochromatic aberrations of the
human eye in a large population. J Opt Soc Am A, 18(8), 1793-1803
Qin, B., Chen, S., Brass, R., Li, Y., Tang, M., Zhang, X., . . . Huang, D. (2013). Keratoconus
diagnosis with optical coherence tomography-based pachymetric scoring system. J
Cataract Refract Surg, 39(12), 1864-1871
Rabinowitz, Y. S. (1995). Videokeratographic indices to aid in screening for keratoconus. J
Refract Surg, 11(5), 371-379
Rabinowitz, Y. S. (1998). Keratoconus. Surv Ophthalmol, 42(4), 297-319
Rabinowitz, Y. S., Rasheed, K., Yang, H., & Elashoff, J. (1998). Accuracy of ultrasonic
pachymetry and videokeratography in detecting keratoconus. J Cataract Refract
Surg, 24(2), 196-201
Radhakrishnan, H., & Charman, W. N. (2007). Age-related changes in ocular aberrations
with accommodation. J Vis, 7(7), 11.11-21
Ramasubramanian, V., & Glasser, A. (2015). Can ultrasound biomicroscopy be used to
predict accommodation accurately? J Refract Surg, 31(4), 266-273.doi:
10.3928/1081597X-20150319-06
Rand, R. H., Howland, H. C., & Applegate, R. A. (1997). Mathematical model of a Placido
disk keratometer and its implications for recovery of corneal topography. Optom Vis
Sci, 74(11), 926-930
Ravikumar, S., Thibos, L. N., & Bradley, A. (2008). Calculation of retinal image quality for
polychromatic light. J Opt Soc Am A Opt Image Sci Vis, 25(10), 2395-2407

Bibliography
187
Read, S. A., Collins, M. J., Iskander, D. R., & Davis, B. A. (2009). Corneal topography with
Scheimpflug imaging and videokeratography: comparative study of normal eyes. J
Cataract Refract Surg, 35(6), 1072-1081.doi: 10.1016/j.jcrs.2009.01.020
Reinstein, D. Z., Gobbe, M., Archer, T. J., Silverman, R. H., & Coleman, D. J. (2010).
Epithelial, stromal, and total corneal thickness in keratoconus: three-dimensional
display with artemis very-high frequency digital ultrasound. J Refract Surg, 26(4),
259-271.doi: 10.3928/1081597X-20100218-01
Reinstein, D. Z., Srivannaboon, S., & Holland, S. P. (2001). Epithelial and stromal changes
induced by intacs examined by three-dimensional very high-frequency digital
ultrasound. J Refract Surg, 17(3), 310-318
Ridley, H. (1952). Intra-ocular acrylic lenses; a recent development in the surgery of
cataract. Br J Ophthalmol, 36(3), 113-122
Roberts, C. (2000). The cornea is not a piece of plastic. Journal of Refractive surgery, 16,
407-413
Roorda, A., & Glasser, A. (2004). Wave aberrations of the isolated crystalline lens. J Vis,
4(4), 250-261.doi: 10:1167/4.4.1
Rosales, P., Dubbelman, M., Marcos, S., & van der Heijde, R. (2006). Crystalline lens radii
of curvature from Purkinje and Scheimpflug imaging. J Vis, 6(10), 1057-1067.doi:
10.1167/6.10.5
Rosales, P., & Marcos, S. (2006). Phakometry and lens tilt and decentration using a custom-
developed Purkinje imaging apparatus: validation and measurements. J Opt Soc Am
A Opt Image Sci Vis, 23(3), 509-520
Rosales, P., & Marcos, S. (2007). Customized computer models of eyes with intraocular
lenses. Opt Express, 15(5), 2204-2218
Rosales, P., & Marcos, S. (2009). Pentacam Scheimpflug quantitative imaging of the
crystalline lens and intraocular lens. J Refract Surg, 25(5), 421-428
Rosales, P., Wendt, M., Marcos, S., & Glasser, A. (2008). Changes in crystalline lens radii of
curvature and lens tilt and decentration during dynamic accommodation in rhesus
monkeys. J Vis, 8(1), 18 11-12.doi: 10.1167/8.1.18
Ruggeri, M., Uhlhorn, S. R., De Freitas, C., Ho, A., Manns, F., & Parel, J. M. (2012).
Imaging and full-length biometry of the eye during accommodation using spectral
domain OCT with an optical switch. Biomed Opt Express, 3(7), 1506-1520.doi:
10.1364/BOE.3.001506
Rynders, M., Lidkea, B., Chisholm, W., & Thibos, L. N. (1995). Statistical distribution of
foveal transverse chromatic aberration, pupil centration, and angle psi in a
population of young adult eyes. J Opt Soc Am A Opt Image Sci Vis, 12(10), 2348-
2357
Saad, A., & Gatinel, D. (2010). Topographic and tomographic properties of forme fruste
keratoconus corneas. Invest Ophthalmol Vis Sci, 51(11), 5546-5555.doi:
10.1167/iovs.10-5369
Salmon, T. O., West, R. W., Gasser, W., & Kenmore, T. (2003). Measurement of refractive
errors in young myopes using the COAS Shack-Hartmann aberrometer. Optom Vis
Sci, 80(1), 6-14
Sanders, D., Retzlaff, J., Kraff, M., Kratz, R., Gills, J., Levine, R., . . . Loyd, T. (1981).
Comparison of the accuracy of the Binkhorst, Colenbrander, and SRK implant
power prediction formulas. J Am Intraocul Implant Soc, 7(4), 337-340

Bibliography
188
Sanders, D. R., Retzlaff, J., & Kraff, M. C. (1988). Comparison of the SRK II formula and
other second generation formulas. J Cataract Refract Surg, 14(2), 136-141
Sanders, D. R., Retzlaff, J. A., Kraff, M. C., Gimbel, H. V., & Raanan, M. G. (1990).
Comparison of the SRK/T formula and other theoretical and regression formulas. J
Cataract Refract Surg, 16(3), 341-346
Savini, G., & Hoffer, K. J. (2011). IOL power after excimer laser surgery. Ophthalmology,
118(8), 1691-1692.doi: 10.1016/j.ophtha.2011.04.004
Schlegel, Z., Lteif, Y., Bains, H. S., & Gatinel, D. (2009). Total, corneal, and internal ocular
optical aberrations in patients with keratoconus. J Refract Surg, 25(10 Suppl),
S951-957.doi: 10.3928/1081597X-20090915-10
Schoneveld, P., Pesudovs, K., & Coster, D. J. (2009). Predicting visual performance from
optical quality metrics in keratoconus. Clin Exp Optom, 92(3), 289-296.doi:
10.1111/j.1444-0938.2009.00372.x
Shabayek, M. H., & Alio, J. L. (2007). Intrastromal corneal ring segment implantation by
femtosecond laser for keratoconus correction. Ophthalmology, 114(9), 1643-
1652.doi: 10.1016/j.ophtha.2006.11.033
Shack, R., Platt, B. (1971). Production and use of a lenticular Hartmann screen. J. Opt. Soc.
Am., 61, 656
Shankar, H., Taranath, D., Santhirathelagan, C. T., & Pesudovs, K. (2008). Repeatability of
corneal first-surface wavefront aberrations measured with Pentacam corneal
topography. J Cataract Refract Surg, 34(5), 727-734.doi:
10.1016/j.jcrs.2007.11.056
Shao, Y., Tao, A., Jiang, H., Mao, X., Zhong, J., Shen, M., . . . Wang, J. (2015). Age-related
changes in the anterior segment biometry during accommodation. Invest
Ophthalmol Vis Sci, 56(6), 3522-3530.doi: 10.1167/iovs.15-16825
Shen, M., Wang, M. R., Yuan, Y., Chen, F., Karp, C. L., Yoo, S. H., & Wang, J. (2010). SD-
OCT with prolonged scan depth for imaging the anterior segment of the eye.
Ophthalmic Surg Lasers Imaging, 41 Suppl, S65-69.doi: 10.3928/15428877-
20101031-18
Sicam, V., Dubbelman, M., & van der Heijde, R. G. L. (2006). Spherical aberration of the
anterior and posterior surface of the human cornea. Journal of the Optical Society of
America a-Optics Image Science and Vision, 23(3), 544-549
Sicam, V., & Van der Heijde, R. G. L. (2006). Topographer reconstruction of the
nonrotation-symmetric anterior corneal surface features. Optometry and Vision
Science, 83(12), 910-918
Siedlecki, D., de Castro, A., Gambra, E., Ortiz, S., Borja, D., Uhlhorn, S., . . . Parel, J. M.
(2012). Distortion correction of OCT images of the crystalline lens: gradient index
approach. Optom Vis Sci, 89(5), E709-718.doi: 10.1097/OPX.0b013e3182508344
Siedlecki, D., & Ginis, H. S. (2007). On the longitudinal chromatic aberration of the
intraocular lenses. Optom Vis Sci, 84(10), 984-989.doi:
10.1097/OPX.0b013e318157ac82
Simonet, P., & Campbell, M. C. W. (1990). The optical transverse chromatic aberration on
the fovea of the human eye. Vision research, 30(2), 187-206
Smirnov, M. S. (1961). Measurement of the wave aberration of the human eye. Biofizika, 6,
687-703

Bibliography
189
Smith, G., & Atchison, D. (2001). The gradient index and spherical aberration of the lens of
the human eye. Ophthalmology physiology optics, 21(4), 317-326
Sogutlu, E., Pinero, D. P., Kubaloglu, A., Alio, J. L., & Cinar, Y. (2012). Elevation changes
of central posterior corneal surface after intracorneal ring segment implantation in
keratoconus. Cornea, 31(4), 387-395.doi: 10.1097/ICO.0b013e31822481df
Spoerl, E., Huhle, M., & Seiler, T. (1998). Induction of Cross-links in Corneal Tissue. Exp
Eye Res, 66(1), 97-103
Stachs, O., Schneider, H., Beck, R., & Guthoff, R. (2006). Pharmacological-induced haptic
changes and the accommodative performance in patients with the AT-45
accommodative IOL. J Refract Surg, 22(2), 145-150
Sun, M., Birkenfeld, J., de Castro, A., Ortiz, S., & Marcos, S. (2014). OCT 3-D surface
topography of isolated human crystalline lenses. Biomed Opt Express, 5(10), 3547-
3561.doi: 10.1364/BOE.5.003547
Swanson, E. A., Izatt, J. A., Hee, M. R., Huang, D., Lin, C. P., Schuman, J. S., . . . Fujimoto,
J. G. (1993). In vivo retinal imaging by optical coherence tomography. Opt Lett,
18(21), 1864-1866
Szalai, E., Berta, A., Hassan, Z., & Modis, L., Jr. (2012). Reliability and repeatability of
swept-source Fourier-domain optical coherence tomography and Scheimpflug
imaging in keratoconus. J Cataract Refract Surg, 38(3), 485-494.doi:
10.1016/j.jcrs.2011.10.027
Tabernero, J., Benito, A., Alcon, E., & Artal, P. (2007). Mechanism of compensation of
aberrations in the human eye. Journal of the Optical Society of America a-Optics
Image Science and Vision, 24(10), 3274-3283
Tabernero, J., Piers, P., Benito, A., Redondo, M., & Artal, P. (2006). Predicting the optical
performance of eyes implanted with IOLs to correct spherical aberration. Invest
Ophthalmol Vis Sci, 47(10), 4651-4658.doi: 10.1167/iovs.06-0444
Tahir, H. J., Tong, J. L., Geissler, S., Vedamurthy, I., & Schor, C. M. (2010). Effects of
accommodation training on accommodation and depth of focus in an eye implanted
with a crystalens intraocular lens. J Refract Surg, 26(10), 772-779.doi:
10.3928/1081597X-20100921-02
Tang, M., Li, Y., Avila, M., & Huang, D. (2006). Measuring total corneal power before and
after laser in situ keratomileusis with high-speed optical coherence tomography.
Journal of Cataract and Refractive Surgery, 32, 1843-1850
Thibos, L., & Hong, X. (1999). Comparison of monochromatic aberrations of the human eye
measured with the Howland crossed-cylinder aberroscope and the Shack-Hartmann
aberrometer. Paper presented at the Technical Digest Optical Society of America
Annual Meeting, Santa Clara, California (USA).
Thibos, L. N., Bradley, A., Still, D. L., Zhang, X., & Howarth, P. A. (1990). Theory and
measurement of ocular chromatic aberration. Vision Res, 30(1), 33-49
Thibos, L. N., Bradley, A., & Zhang, X. X. (1991). Effect of ocular chromatic aberration on
monocular visual performance. Optom Vis Sci, 68(8), 599-607
Thibos, L. N., Faao, P., & Xin Hong, M. (1999). Clinical applications of the Shack-
Hartmann aberrometer. Optometry and Vision Science, 76, 817-825
Thibos, L. N., Hong, X., Bradley, A., & Applegate, R. A. (2004a). Accuracy and precision of
objective refraction from wavefront aberrations. Journal of Vision, 4(4), 329-351

Bibliography
190
Thibos, L. N., Hong, X., Bradley, A., & Applegate, R. A. (2004b). Accuracy and precision
of objective refraction from wavefront aberrations. J Vis, 4(4), 329-351.doi:
10.1167/4.4.9
Thibos, L. N., & Horner, D. (2001). Power vector analysis of the optical outcome of
refractive surgery. J Cataract Refract Surg, 27(1), 80-85
Tomidokoro, A., Oshika, T., Amano, S., Higaki, S., Maeda, N., & Miyata, K. (2000).
Changes in anterior and posterior corneal curvatures in keratoconus.
Ophthalmology, 107(7), 1328-1332
Torquetti, L., Ferrara, G., Almeida, F., Cunha, L., Araujo, L. P., Machado, A., . . . Ferrara, P.
(2014). Intrastromal corneal ring segments implantation in patients with
keratoconus: 10-year follow-up. J Refract Surg, 30(1), 22-26
Torquetti, L., & Ferrara, P. (2010). Intrastromal corneal ring segment implantation for
ectasia after refractive surgery. J Cataract Refract Surg, 36(6), 986-990.doi:
10.1016/j.jcrs.2009.12.034
Trokel, S. (1962). The physical basis for transparency of the crystalline lens. Invest
Ophthalmol, 1, 493-501
Truscott, R. J., & Zhu, X. (2010). Presbyopia and cataract: a question of heat and time. Prog
Retin Eye Res, 29(6), 487-499.doi: 10.1016/j.preteyeres.2010.05.002
Tucker, J., & Rabie, E. P. (1980). Depth-of-focus of the pseudophakic eye. Br J Physiol Opt,
34, 12-21
Uhlhorn, S. R., Borja, D., Manns, F., & Parel, J. M. (2008). Refractive index measurement of
the isolated crystalline lens using optical coherence tomography. Vision Res,
48(27), 2732-2738.doi: 10.1016/j.visres.2008.09.010
van der Mooren, M., Steinert, R., Tyson, F., Langeslag, M. J., & Piers, P. A. (2015).
Explanted multifocal intraocular lenses. J Cataract Refract Surg, 41(4), 873-
877.doi: 10.1016/j.jcrs.2015.02.005
Vega-Estrada, A., Alio, J. L., Brenner, L. F., & Burguera, N. (2013). Outcomes of
intrastromal corneal ring segments for treatment of keratoconus: five-year follow-up
analysis. J Cataract Refract Surg, 39(8), 1234-1240.doi: 10.1016/j.jcrs.2013.03.019
Vega-Estrada, A., Alio, J. L., & Plaza-Puche, A. B. (2015). Keratoconus progression after
intrastromal corneal ring segment implantation in young patients: Five-year follow-
up. J Cataract Refract Surg, 41(6), 1145-1152.doi: 10.1016/j.jcrs.2014.08.045
Vinas, M., Dorronsoro, C., Cortes, D., Pascual, D., & Marcos, S. (2015). Longitudinal
chromatic aberration of the human eye in the visible and near infrared from
wavefront sensing, double-pass and psychophysics. Biomed Opt Express, 6(3), 948-
962.doi: 10.1364/BOE.6.000948
Von Helmholtz, H. (1909). Helmholtz's Treatise on Physiological Optics. New York: Optical
Society of America.
Wang, L., Canovas, C., Weeber, H. A., Piers, P. A., & Koch, D. D. (2012). Aspheric
intraocular lenses. Ophthalmology, 119(6), 1284; author reply 1285.doi:
10.1016/j.ophtha.2012.02.020
Wardrop, J. (1808). Essays on the Morbid Anatomy of the Human Eye.
Weeber, H. A., & Piers, P. A. (2012). Theoretical performance of intraocular lenses
correcting both spherical and chromatic aberration. J Refract Surg, 28(1), 48-52.doi:
10.3928/1081597X-20111103-01

Bibliography
191
Wojtkowski, M., Bajraszewski, T., Targowski, P., & Kowalczyk, A. (2003). Real-time in
vivo imaging by high-speed spectral optical coherence tomography. Opt Lett,
28(19), 1745-1747
Wojtkowski, M., Leitgeb, R., Kowalczyk, A., Bajraszewski, T., & Fercher, A. F. (2002). In
vivo human retinal imaging by Fourier domain optical coherence tomography. J
Biomed Opt, 7(3), 457-463.doi: 10.1117/1.1482379
Wolffsohn, J. S., Davies, L. N., Gupta, N., Naroo, S. A., Gibson, G. A., Mihashi, T., & Shah,
S. (2010). Mechanism of action of the tetraflex accommodative intraocular lens. J
Refract Surg, 26(11), 858-862.doi: 10.3928/1081597X-20100114-04
Wride, M. A. (2011). Lens fibre cell differentiation and organelle loss: many paths lead to
clarity. Philos Trans R Soc Lond B Biol Sci, 366(1568), 1219-1233.doi:
10.1098/rstb.2010.0324
Yoon, G. Y., & Williams, D. R. (2002). Visual performance after correcting the
monochromatic and chromatic aberrations of the eye. J Opt Soc Am A Opt Image
Sci Vis, 19(2), 266-275
Young, T. (1801). On the mechanisms of the eye. Phil. Trans. Royal Society, 19, 23-88
Yuen, L., Trattler, W., & Boxer Wachler, B. S. (2008). Two cases of Z syndrome with the
Crystalens after uneventful cataract surgery. J Cataract Refract Surg, 34(11), 1986-
1989.doi: 10.1016/j.jcrs.2008.05.061
Yun, S., Tearney, G., de Boer, J., Iftimia, N., & Bouma, B. (2003). High-speed optical
frequency-domain imaging. Opt Express, 11(22), 2953-2963
Zamora-Alejo, K. V., Moore, S. P., Parker, D. G., Ullrich, K., Esterman, A., & Goggin, M.
(2013). Objective accommodation measurement of the Crystalens HD compared to
monofocal intraocular lenses. J Refract Surg, 29(2), 133-139.doi:
10.3928/1081597X-20130117-09
Zernike, F. (1934). Beugungstheorie des schneidenverfahrens und seiner verbesserten form,
des phasenkontrastmethode. Physica, 1, 689-704
Zhang, X. X., Bradley, A., & Thibos, L. N. (1991). Achromatizing the human eye: the
problem of chromatic parallax. J Opt Soc Am A, 8(4), 686-691
Zhao, H., & Mainster, M. A. (2007). The effect of chromatic dispersion on pseudophakic
optical performance. Br J Ophthalmol, 91(9), 1225-1229.doi:
10.1136/bjo.2007.118745
Zhao, M., Kuo, A. N., & Izatt, J. A. (2010). 3D refraction correction and extraction of
clinical parameters from spectral domain optical coherence tomography of the
cornea. Opt Express, 18(9), 8923-8936.doi: 10.1364/OE.18.008923
Zheleznyak, L., Kim, M. J., MacRae, S., & Yoon, G. (2012). Impact of corneal aberrations
on through-focus image quality of presbyopia-correcting intraocular lenses using an
adaptive optics bench system. J Cataract Refract Surg, 38(10), 1724-1733.doi:
10.1016/j.jcrs.2012.05.032
Zhu, Z., Janunts, E., Eppig, T., Sauer, T., & Langenbucher, A. (2011). Tomography-based
customized IOL calculation model. Curr Eye Res, 36(6), 579-589.doi:
10.3109/02713683.2011.566978


Acknowledgements
193
Acknowledgements
“Cuando yo salí del pueblo, hace ya la friolera de cuarenta y ocho años, me topé con el Aniano, el
Corsario, bajo el chopo del Elicio, frente al palomar de la Tía Zenona, ya en el camino de Pozal de la
Culebra. Y el Aniano se vino a mí y me dijo: ¿Dónde va el estudiante? Y yo le dije, ¡Qué sé yo! Lejos.
¿Por tiempo? Dijo él. Y yo le dije: Ni lo sé.
Miguel Delibes, Viejas historias de Castilla la Vieja
Bien podría ser la historia de cualquiera que sale de casa y empieza su camino. Yo no es que
me fuera muy lejos, de hecho, en los tiempos que corren, Madrid podría considerarse un
barrio de la periferia, todo es cuestión de desplazar el centro (y ya lo hicieron a lo largo de la
historia poniendo otra esfera de referencia). El caso es que después de unos cuantos años por
Valladolid, salí (la friolera fue de veintitantos) y Susana me acogió en su laboratorio, en su
familia del VioBio (Visual Optics and Biophotonics) Lab. Y aquí empieza esta parte del
camino hacia Ítaca, el de la tesis, donde he conocido a la gente más especial de mi vida. Sin
ellos, y sin los que ya estaban, claro, esto no podría ser.
Susana (S. Marcos), muchas gracias, muchas gracias de todo corazón. Aún recuerdo tu
llamada un día de mayo de 2009, estaba en el coche y paré donde pude, al volver a arrancar
puse a todo volumen “ring the bells” y de lo contento que estaba me canté toda la canción
con la ventanilla bajada. Me iba a trabajar a tu laboratorio. Para mí, tu laboratorio, el
Instituto de Óptica, el CSIC, era un sueño. En realidad, cada paso dado desde que crucé la
puerta del IO ha estado acompañado por pequeños sueños. Así que muchas gracias por
confiar en mí, abrir esa puerta y dejarla abierta. El grupo es referencia mundial en Óptica
Visual, en Ciencia, y en Ciencia nadie te pone, te haces. La Ciencia no son científicos que se
equivocan y aciertan. La Ciencia es trabajo, pasión, valentía, ingenio, constancia,
inteligencia, educación, aprendizaje, confianza y también curiosidad. Es lo que es. Y yo, he
tenido la suerte cada día de ver, tocar y sentir Ciencia en el Instituto de Óptica. Te debo
mucho a ti. Gracias, Susana, por dejar que aprenda cada día a tu lado.
Jesús (J. Merayo). Más que un guía, un mentor, un gran científico (mira que es grande lo que
estás haciendo en la Fundación Fernández-Vega), un viticultor incluso y un excelente
oftalmólogo, es un gran amigo. Contigo compartí las primeras discusiones científicas y
disfruté de los primeros ARVO. Confiaste en mí desde el principio y gracias a ti puedo
escribir estas líneas en el Instituto de Óptica. Sabes que no tengo palabras suficientes para
agradecerte todos estos años y sabes, también, que con los ojos cerrados te seguiría donde
fuera. Este trabajo también es tuyo. Muchas gracias, Jesús.
Carmen (C. Martínez) y Santiago (S. Mar). Los dos profesores de este camino, Carmen en
Medicina, Santiago en Físicas. Una perfecta conjunción. Mis padres científicos. Mi primer
paper fue fruto de aquel trabajo de fin de master. A ti, Carmen, qué te puedo decir, que eres
como una madre y una amiga. ¡Muchas gracias!
Carlos (C. Dorronsoro). Desde que me abrieron la puerta del IO soy incapaz de cerrarla y
desde que me abriste la del despacho no soy capaz de salir, y, lo cierto, es que no dejo de
asombrarme ni un solo momento con tu trabajo y sacrificio. También, aunque esto ya no es
sorpresa, admiro como buscas nuevos desafíos y nuevas metas implicando a todos. No sé de

Acknowledgements
194
dónde sacas las fuerzas y las ideas, pero me encanta. Las cenas, cervezas, conciertos
(Smashing, Muse, Subterfuge, Vistillas y, como no, Nada Surf), excursiones nocturnas (la
mítica Peñalara y el paseo por las Rocky), carreras (la del CSIC y la de Central Park) quedan
grabadas. Gracias por compartir tanto en este despacho, en el labo y fuera del CSIC.
Enrique (E. Gambra), Alfonso (A. Pérez-Escudero), Sam (S. Arba-Mosquera). La inquietud
y curiosidad por descubrir el maravilloso mundo de la Investigación tuvo un brote
esplendoroso con vosotros vagando por distintas ciudades. Sí, sí, con vosotros, ¡qué tres
físicos!. Enrique, tú, que fuiste como un hermano mayor en mi primer día de colegio, como
una madre en Santa Juliana (cenas, intermedios, conversaciones, qué a gustito estábamos en
el sofá rojo…) y como un padre en el laboratorio. Tú, que serás un gran compañero en todo
momento. Muchas gracias.
María (M. Vinas). Porque me encanta como eres. Porque la vida hay que vivirla como lo
haces tú. Porque afrontas los contratiempos y los resuelves. Porque te puedo preguntar
cualquier duda. Porque tienes una capacidad de trabajo tremenda. Porque has desarrollado un
setup increíble. Porque eres espectacular y divina. Porque eres luchadora y comprometida.
Porque quiero salir a la calle y brindar contigo. Porque escribiendo esto me veo en Chueca,
Malasaña, NY, Denver, Zurich y Miami Beach. Porque estés donde estés. Porque ahora
mismo te daría un abrazo. Futura Dra. Viñas para mí eres el ejemplo de lo que es trabajo en
Investigación.
Dani (D. Cortés). Dani no es negociable. Nos guardamos unos cuantos secretos, unos
cuantos vídeos, muchas vivencias y los días más importantes de nuestras vidas con un mes
de diferencia. Contigo he compartido Madrid. Sé que compartiremos muchos momentos en
uno y otro lado del charco (ahí tienes tu sueño). Sé que lo esencial es invisible a los ojos. Sé
que eres especial y amarillo.
Alberto (A. de Castro) y Lucie (L. Sawides). Ay, Alber y Lucie. Recuerdo como con envidia
espiaba vuestros pasos subiendo López de Hoyos, Alberto gesticulando y Lucie sonriendo.
Los dos llenasteis de unión el grupo y de planes los días. Alberto, las palabras que escuché a
Fabrice Manns decir sobre ti me parecieron las más bonitas que he escuchado sobre un
doctorando. Tú has tenido una paciencia increíble enseñando a un zote algo de Zemax y
Matlab, entre muchísimas otras cosas. Dr. de Castro, muchas gracias. Dra. Sawides, mi boca
se abre sola al ver la alegría y seguridad que tienes al dar las charlas, nunca quites tu sonrisa.
Menudo tándem.
Lourdes (L. Llorente). No coincidimos todo lo que me hubiera gustado en el IO, pero sí lo
suficiente como para saber que hubiera trabajado a tu lado muy a gusto. Menos mal que
siempre hay buenas excusas para un mensaje, un wasap y un buen encuentro, seguro que
pronto llegarán muchos más encuentros.
Dani (D. Pascual). Tío, tú estás por encima del bien, tú has hecho la mili, tú has echado el
cuerpo a tierra y te has partido un piño. Si me garantizan que haciéndola podría llegar a una
mínima parte de todo lo que sabes mañana mismo iría a filas. Lástima que no sea así. Verte
trabajar y ver como con tanta paciencia nos explicas lo que no sabemos bien merece la pena
el día. Dani, eres un gran ejemplo para todos, para todo.

Acknowledgements
195
Sergio (S. Barbero). Además de ser un Científico como la copa de un pino eres una persona
increíble. Cuando discutimos algo sobre óptica, algo a lo que no llegamos, siempre decimos,
vamos a preguntar a Sergio, que lo sabe todo. Muchas gracias por tener siempre la puerta
abierta y la respuesta. Muchas gracias por el primer EMVPO de Estocolmo y por todas las
excursiones. Estar contigo es como observar al atardecer el rayo verde en el horizonte en
cualquier pico de la sierra madrileña, un placer infinito.
Pablo (P. de Gracia). No puedo olvidar tus historias, tu carácter, tu originalidad, pabladas y
lazos sorianos. Personaje único, si ya lo dice “el mundo”.
Judith (J. Birkenfeld). Estoy seguro que sigues bailando y riendo por los lab del MIT. En los
del IO nunca sabías lo que había al otro lado de la puerta.
Jorge (J. Lamela). Qué alegría de tío, solo te veo con una sonrisa en estos momentos. Que
sea siempre así.
Damian (D. Siedlecki). Great Damian! What can I possibly say?!? I am glad you stood in my
way. Dzięki! Thanks for being the first reviewer of this manuscript (OCT team). You are a
great friend.
Sabine (S. Kling), Danke!. Mengchan (M. Sun), Xièyi! 謝意. Aishu (A. Radhakrishnan),
Nanri! धन्यवाद. Nandor (N. Bekesi), Köszönet!. Andrés (A. de la Hoz), ¡Gracias!. James,
Vyas, Hrebesh. Thanks to all of you for the great opportunity to work with you in an
incredible international atmosphere and my sincere gratitude for all the time spent (site/non
site). Enrique (E. Bustos), Belén, muchas gracias por todo. Contigo, Enrique, seguiré
pateando el asfalto.
Sonia (S. Durán), Iñigo (I. Jiménez-Alfaro). Tener tan cerca y tan accesibles a tan grandes
oftalmólogos es fantástico. Muchas gracias por todo. Sonia, vente al IO cuando quieras, aún
recuerdo con una sonrisa la historia del saxo.
Miriam (M. Velasco-Ocana). Nos hemos ido juntando poco a poco y a día de hoy agradezco
esa proximidad y confianza. Miriam, tú completas lo que falta, organizas el caos y uno se
encuentra cómodo, como en casa. Eres una gran compañera, una buena amiga y tienes una
valía increíble. Has hecho especial estos años. ¡Qué de cosas están por venir!
Edu (-ez2, E. Martínez-Enríquez). Si es que contigo me quedaría hablando toda una vida,
aunque no siempre te mire a los ojos. Haces accesible lo incomprensible, cercano el
procesado de imágenes, surrealistas las conversaciones y mágico el día. Qué fácil es trabajar
contigo. Qué fácil es estar contigo.
Nico (N. Alejandre). Lo cierto es que cada semana estoy esperando que llegue el miércoles
para poder verte y charlar un rato, ya sea de ojos, política, educación, ciclismo, basket,
sueños, ideas, el NiCO. Ojalá, algún día llevemos a cabo todas las ideas imaginadas. Eres
prota en este doc y en todo este tiempo. Eres un gran amigo, esta tesis también es tuya.
¡Muchas gracias!
Sergio (S. Ortiz). Compañero de labo, de OCT, de faena, de vida. El procesado de las
medidas de OCT ha sido posible gracias a tu gran trabajo. Hace poco escuché a Santamaría
contar como él y Bescós, compañeros en el labo y muy distintos en carácter, fraguaron una

Acknowledgements
196
amistad que aún les dura (y ya van años). Tanto en el labo como fuera hemos contado el uno
con el otro, hace poco más de dos años y a esta misma hora estábamos por Valladolid mano
a mano y hasta aquí puedo escribir. Ay, maño, por este camino todavía nos quedan muchos
paseos, confesiones, canciones, charlas y mucho camino. Gracias de todo corazón, Sergio.
Llegado aquí, solo puedo escribir, muchas gracias VioBio Lab. ¡Qué de momentos vividos!
No me puedo olvidar de todos los pacientes de la Fundación Jiménez-Díaz que
desinteresadamente aguantaron unas cuantas horas de medidas en los distintos estudios. Sin
ellos, este trabajo no hubiera sido posible.
Los del GPL, los silenciosos, los del ondiñas. Antonio, no sé que tienes que tanto atraes,
majo, contigo las horas uno las echa muy tranquilamente. Giorgio, todavía me duele el cuello
de las veces que he mirado para arriba para hablar contigo (percheroooo). Andrés, algún día
me encantaría explicar mi trabajo con la pasión que tú pones. Puerto, a ojos cerrados te
votaría. Jan, para cuándo la próxima. Mario, ilacixem, la alegría del otro lado del pasillo.
También me acuerdo de aquellos amigos y compañeros del primer año en el IO. Elena Gil,
Rafa (Vali), Jose Rodrigo. Aquel despacho que con tanta curiosidad miraba al cruzar el
pasillo. Aquellos días culturales. Aquellas largas conversaciones.
Eloy, Chari, Encarnita, Jose Luis. ¡Qué buen equipo!
Patricia (P. Gallego), Lucía (L. Ibares), Rober (R. Cantalapiedra), Nacho (I. Alcalde), Susana
(S. del Olmo), Tomás (T. Blanco), Iván (I. Fernández). Parte de los sueños que comenzamos
hace ya unos años hacen parada con la tesis. Mi sincero agradecimiento y enhorabuena a
todos vosotros.
Como no, el IOBA, institución ejemplar que ha puesto a Valladolid en un lugar de referencia
en Oftalmología. Es de admirar la fuerza, ilusión y creatividad de su director (J.C. Pastor) y
su equipo. Yolanda (Y. Diebold), recuerdo ahora la conversación que tuvimos al terminar el
máster, ya ves. Maria Jesús y Raúl (M.J. González y R. Martin), con vosotros he conversado
mucho de óptica, profesión, dudas, no sé, de todo, buenos profes, buenos ejemplos. Y, mi
Lurdes y su sonrisa, qué decir.
No me olvido de Leti (y su family), Mikel (M. Aldaba), Victoria (V. de Juan), Anita (Cis),
Cristina, Gema, Henar, MJ, Paco y Jorge, María (Niño, mi niña y su pequeño Mateo), Elena
(Alonso), Lauri (Herrero, ¿una de Catan?), Saad (paga Antonio), Antonio (el que paga), entre
otros tantos amigos de clase y profesión. Aurori, Karen, Javi, Alfonso. Mis compañeritos de
piso, os quiero mucho. A los Mena, ellos siempre se han preocupado y con ellos he
aprendido (Itzi, Iratxe, Jon, Arrieta, Toño, Yolanda, Ana, Carmen).
Los de toda una vida. Nelson, Juan, Agus, Óscar, Diego, JL, Ra, Rober, Sergio, Samu, Sino,
Cucu, Nano, Api, Pableras y Jorge. A todos, a vuestras parejas, familias y peques que están y
que vienen, tengo la gran suerte de decir que tengo unos amigos estupendos, que yo no soy
sin ellos, que sin ellos mi vida hubiera sido tremendamente aburrida y que con ellos soy
feliz.
Mi familia (Cipriano, Adriana, Victoria, Resu, Leandro, Marta y Luís, Panin, Jesús, Olga,
Jose, Miluca, Jesús, Ana, Olgui, Miguel, Joel y Keko, Bea, Tino, Álvaro y Adriana, Jesús y
Balta). Olgui, aunque todo esté perdido siempre nos queda molestar. A mis estupendos

Acknowledgements
197
suegros, cuñados y sobrinos, Rodolfo e Isa, Josemi, Laura, Álvar y Carla, Javi que me
abrieron las puertas de su casa y juntos hemos formado un nuevo hogar y una vida.
Mi hermanito, David. Tú me llamas, así, hermanito, pero, aunque no lo parezca en realidad,
soy el mayor. Me da pena que ya no seamos tan pequeños, que ya no juguemos, riñamos y lo
arreglemos, las diapos de Félix Rodríguez de la Fuente. Tú has estado ahí cuando lo he
necesitado. Muchas gracias, David.
Mis padres. Recuerdo que en el tercer año de instituto, en una encuesta había una pregunta
relacionada con la profesión de mi padre, y yo contesté que era “trabajador”. Ya con el paso
de los años, ante el asombro del profesor de filosofía, no puedo más que reafirmar aquella
respuesta y añadir que es un trabajador de la vida. Ha trabajado el campo, el azúcar, las
máquinas y, ahora, su casa, su huerta, sus gallinas, su ilusión. Y, además, ha aplicado el
método científico durante toda su vida, el método aplicado a las pequeñas cosas con su
observación y sus resultados. Mi madre, Ramoni, es una luchadora, una “corredora” de
fondo, la persona más valiente que conozco, siempre cuidando de todo, de todos, de manera
infatigable. De mi familia tengo un cariño y un apoyo inagotable. Me han dado el amor a la
vida y la educación, ante esto, solo me puedo quitar el sombrero y agradeceros todo.
De la forma más inesperada, a veces, aparece un número con significado (especial o no). En
este caso fue el dos. Dos minutos, tarde. Dos días, una cita. Dos meses, quédate a mi lado.
Dos años, y una vida. Una hermosa casualidad, dos aes y un nombre palíndromo, Ana. Un
día (el dos) abriste la puerta de abajo y las baldosas del suelo me propusieron una mágica
partida de ajedrez. Desde ese momento subir a casa se convierte en una trepidante aventura.
Ahora (año dos) escribo estas líneas en el lugar de estudio compartido y no quiero salir. Ana,
contigo quiero viajar a Ítaca, sentarme en cualquier sitio y echar la vista atrás, recordar este
tiempo, a tu lado. Todo futuro es maravilloso.
Pablo Pérez-Merino
Divino Pastor, 20 de septiembre de 2015 (2015, International year of light)

Copyright © 2022 FDOKUMEN