Soil-gas helium and surface-waves detection of fault zones in granitic bedrock
7
Soil-gas helium and surface-waves detection of fault zones in granitic bedrock G K Reddy, T Seshunarayana, Rajeev Menon and P Senthil Kumar ∗ National Geophysical Research Institute, Hyderabad 500 606, India. ∗ e-mail: [email protected] Fracture and fault networks are conduits that facilitate groundwater movement in hard-rock terrains. Soil-gas helium emanometry has been utilized in Wailapally watershed, near Hyderabad in southern India, for the detection of fracture and fault zones in a granite basement terrain having a thin regolith. Based on satellite imagery and geologic mapping, three sites were selected for detailed investigation. High spatial resolution soil-gas samples were collected at every one meter at a depth of > 1.5 m along 100 m long profiles (3 in number). In addition, deep shear-wave images were also obtained using the multichannel analysis of surface waves. The study clearly indicates several soil-gas helium anomalies (above 200 ppb) along the profiles, where the shear-wave velocity images also show many near-surface vertical low velocity zones. We thus interpret that the soil-gas helium anomalous zones and the vertical low-velocity zones are probable traces of fault/fracture zones that could be efficient natural recharge zones and potential groundwater conduits. The result obtained from this study demonstrates the efficacy of an integrated approach of soil-gas helium and the seismic methods for mapping groundwater resource zones in granite/gneiss provinces. 1. Introduction Near-surface groundwater is a vital resource for agriculture, industry and human consumption. Therefore groundwater exploration gains emphasis for meeting the steadily increasing demand for water especially when draught conditions prevail. Fracture and fault networks form an important groundwater resource zone in hard rock terrains. A significant portion of the investigated area exposes hard-rocks such as granites and gneisses that may extend to several kilometers from the surface to deep crustal interiors. For example, the Archaean cratons constitute about 70% gneisses and granites (Condie 1993). These crystalline hard- rocks are poor groundwater reservoir rocks, in which the inherent porosity is absent. However, these rocks are rendered porous and permeable when they are intersected by fractures and faults that form in response to tectonic processes. These structures are then capable of not only holding large volume of groundwater but also transport- ing surface water to the deeper levels of the earth’s crust. Hence, precise mapping of these structures and imaging their deep interiors through geologi- cal, geochemical and geophysical methods is very important for fruitful exploration of groundwater resource zones. The imaging of deep interiors is also important in geotechnical applications and is useful in earthquake hazard assessment. Although conventional geological mapping would provide the surface distribution of these structures, it is met with severe uncertainty, where the rocks are enveloped with thick alluvium. In such a situation, geophysical and geochemical techniques may aid in deciphering their surface and depth distribution. The soil-gas helium emanometry is an excellent geochemical tool capable of detecting fault and fracture zones. For example, soil-gas helium anomalies are found along the earthquake surface rupture zones as well as seismically reactivated Keywords. Soil-gas helium; surface-waves; faults and fractures; groundwater; granite basement. J. Earth Syst. Sci. 119, No. 5, October 2010, pp. 745–751 © Indian Academy of Sciences 745
-
Upload
independent -
Category
Documents
-
view
0 -
download
0
Transcript of Soil-gas helium and surface-waves detection of fault zones in granitic bedrock
Soil-gas helium and surface-waves detectionof fault zones in granitic bedrock
G K Reddy, T Seshunarayana, Rajeev Menon and P Senthil Kumar∗
National Geophysical Research Institute, Hyderabad 500 606, India.∗e-mail: [email protected]
Fracture and fault networks are conduits that facilitate groundwater movement in hard-rockterrains. Soil-gas helium emanometry has been utilized in Wailapally watershed, near Hyderabadin southern India, for the detection of fracture and fault zones in a granite basement terrain havinga thin regolith. Based on satellite imagery and geologic mapping, three sites were selected fordetailed investigation. High spatial resolution soil-gas samples were collected at every one meterat a depth of >1.5m along 100 m long profiles (3 in number). In addition, deep shear-wave imageswere also obtained using the multichannel analysis of surface waves. The study clearly indicatesseveral soil-gas helium anomalies (above 200 ppb) along the profiles, where the shear-wave velocityimages also show many near-surface vertical low velocity zones. We thus interpret that the soil-gashelium anomalous zones and the vertical low-velocity zones are probable traces of fault/fracturezones that could be efficient natural recharge zones and potential groundwater conduits. The resultobtained from this study demonstrates the efficacy of an integrated approach of soil-gas heliumand the seismic methods for mapping groundwater resource zones in granite/gneiss provinces.
1. Introduction
Near-surface groundwater is a vital resource foragriculture, industry and human consumption.Therefore groundwater exploration gains emphasisfor meeting the steadily increasing demand forwater especially when draught conditions prevail.Fracture and fault networks form an importantgroundwater resource zone in hard rock terrains.A significant portion of the investigated areaexposes hard-rocks such as granites and gneissesthat may extend to several kilometers from thesurface to deep crustal interiors. For example, theArchaean cratons constitute about 70% gneissesand granites (Condie 1993). These crystalline hard-rocks are poor groundwater reservoir rocks, inwhich the inherent porosity is absent. However,these rocks are rendered porous and permeablewhen they are intersected by fractures and faultsthat form in response to tectonic processes. Thesestructures are then capable of not only holding
large volume of groundwater but also transport-ing surface water to the deeper levels of the earth’scrust. Hence, precise mapping of these structuresand imaging their deep interiors through geologi-cal, geochemical and geophysical methods is veryimportant for fruitful exploration of groundwaterresource zones. The imaging of deep interiors isalso important in geotechnical applications and isuseful in earthquake hazard assessment. Althoughconventional geological mapping would providethe surface distribution of these structures, itis met with severe uncertainty, where the rocksare enveloped with thick alluvium. In such asituation, geophysical and geochemical techniquesmay aid in deciphering their surface and depthdistribution.
The soil-gas helium emanometry is an excellentgeochemical tool capable of detecting fault andfracture zones. For example, soil-gas heliumanomalies are found along the earthquake surfacerupture zones as well as seismically reactivated
Keywords. Soil-gas helium; surface-waves; faults and fractures; groundwater; granite basement.
J. Earth Syst. Sci. 119, No. 5, October 2010, pp. 745–751© Indian Academy of Sciences 745
746 G K Reddy et al
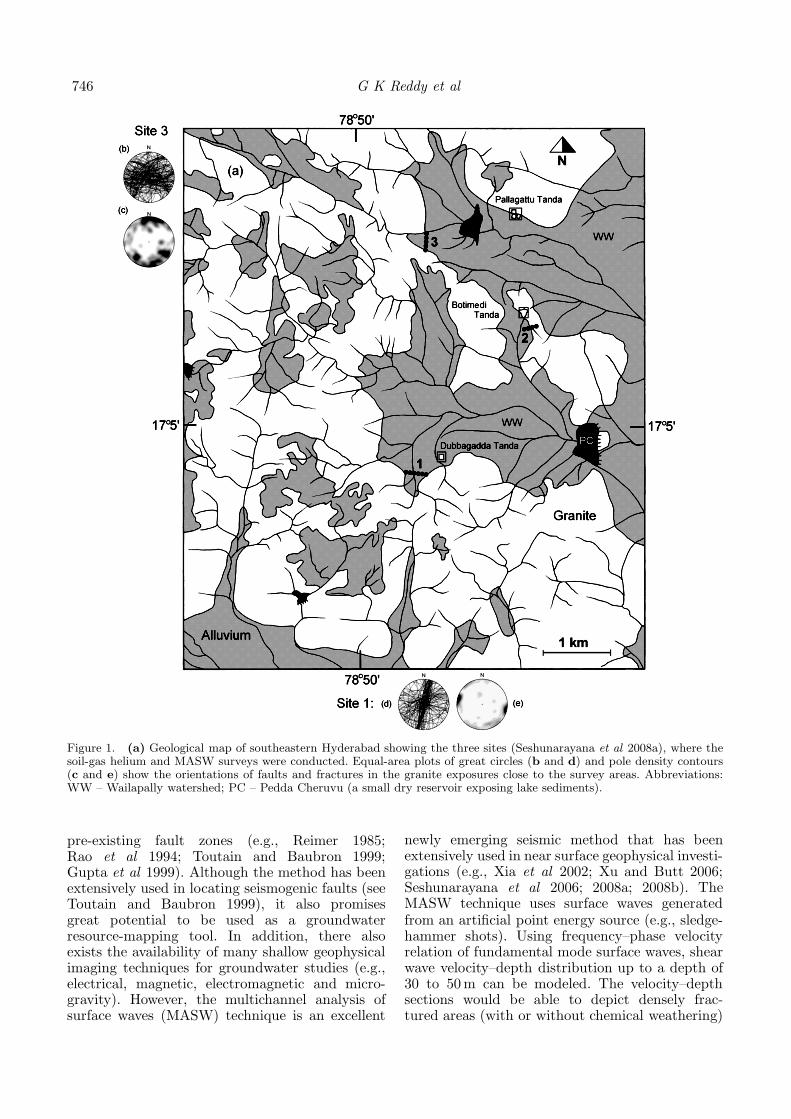
Figure 1. (a) Geological map of southeastern Hyderabad showing the three sites (Seshunarayana et al 2008a), where thesoil-gas helium and MASW surveys were conducted. Equal-area plots of great circles (b and d) and pole density contours(c and e) show the orientations of faults and fractures in the granite exposures close to the survey areas. Abbreviations:WW – Wailapally watershed; PC – Pedda Cheruvu (a small dry reservoir exposing lake sediments).
pre-existing fault zones (e.g., Reimer 1985;Rao et al 1994; Toutain and Baubron 1999;Gupta et al 1999). Although the method has beenextensively used in locating seismogenic faults (seeToutain and Baubron 1999), it also promisesgreat potential to be used as a groundwaterresource-mapping tool. In addition, there alsoexists the availability of many shallow geophysicalimaging techniques for groundwater studies (e.g.,electrical, magnetic, electromagnetic and micro-gravity). However, the multichannel analysis ofsurface waves (MASW) technique is an excellent
newly emerging seismic method that has beenextensively used in near surface geophysical investi-gations (e.g., Xia et al 2002; Xu and Butt 2006;Seshunarayana et al 2006; 2008a; 2008b). TheMASW technique uses surface waves generatedfrom an artificial point energy source (e.g., sledge-hammer shots). Using frequency–phase velocityrelation of fundamental mode surface waves, shearwave velocity–depth distribution up to a depth of30 to 50 m can be modeled. The velocity–depthsections would be able to depict densely frac-tured areas (with or without chemical weathering)
Soil-gas helium and surface-waves detection of fault zones in granitic bedrock 747
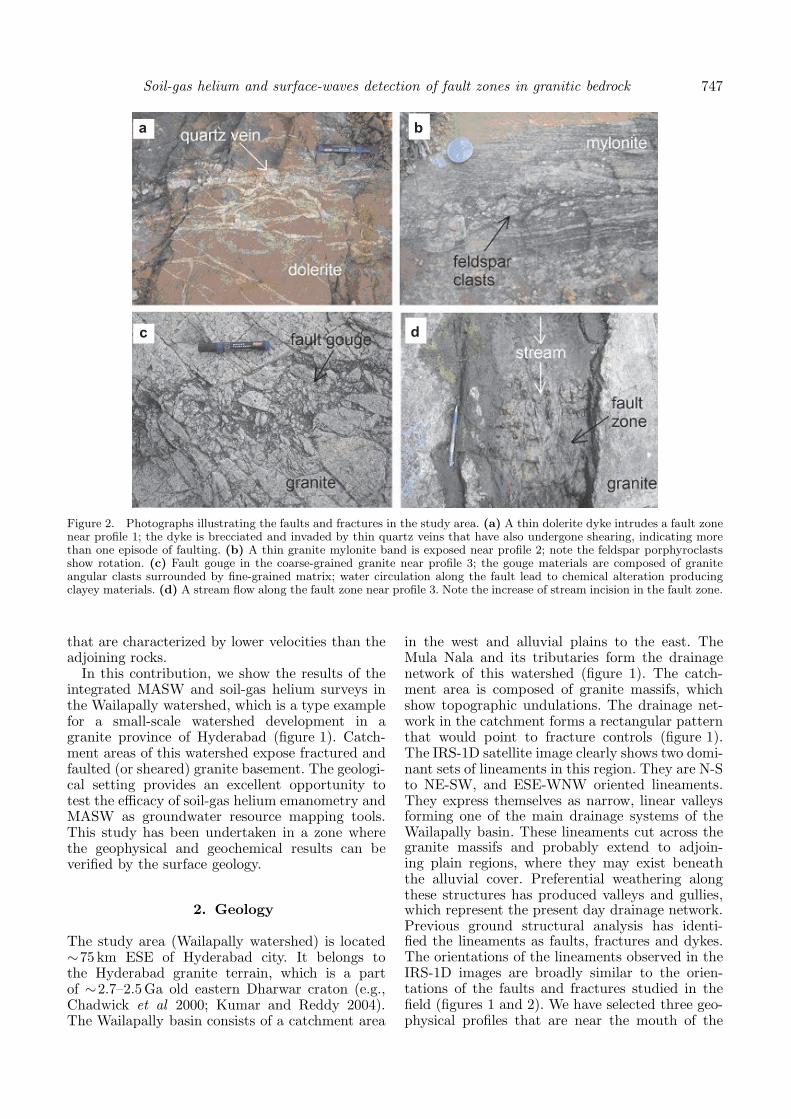
Figure 2. Photographs illustrating the faults and fractures in the study area. (a) A thin dolerite dyke intrudes a fault zonenear profile 1; the dyke is brecciated and invaded by thin quartz veins that have also undergone shearing, indicating morethan one episode of faulting. (b) A thin granite mylonite band is exposed near profile 2; note the feldspar porphyroclastsshow rotation. (c) Fault gouge in the coarse-grained granite near profile 3; the gouge materials are composed of graniteangular clasts surrounded by fine-grained matrix; water circulation along the fault lead to chemical alteration producingclayey materials. (d) A stream flow along the fault zone near profile 3. Note the increase of stream incision in the fault zone.
that are characterized by lower velocities than theadjoining rocks.
In this contribution, we show the results of theintegrated MASW and soil-gas helium surveys inthe Wailapally watershed, which is a type examplefor a small-scale watershed development in agranite province of Hyderabad (figure 1). Catch-ment areas of this watershed expose fractured andfaulted (or sheared) granite basement. The geologi-cal setting provides an excellent opportunity totest the efficacy of soil-gas helium emanometry andMASW as groundwater resource mapping tools.This study has been undertaken in a zone wherethe geophysical and geochemical results can beverified by the surface geology.
2. Geology
The study area (Wailapally watershed) is located∼75 km ESE of Hyderabad city. It belongs tothe Hyderabad granite terrain, which is a partof ∼2.7–2.5Ga old eastern Dharwar craton (e.g.,Chadwick et al 2000; Kumar and Reddy 2004).The Wailapally basin consists of a catchment area
in the west and alluvial plains to the east. TheMula Nala and its tributaries form the drainagenetwork of this watershed (figure 1). The catch-ment area is composed of granite massifs, whichshow topographic undulations. The drainage net-work in the catchment forms a rectangular patternthat would point to fracture controls (figure 1).The IRS-1D satellite image clearly shows two domi-nant sets of lineaments in this region. They are N-Sto NE-SW, and ESE-WNW oriented lineaments.They express themselves as narrow, linear valleysforming one of the main drainage systems of theWailapally basin. These lineaments cut across thegranite massifs and probably extend to adjoin-ing plain regions, where they may exist beneaththe alluvial cover. Preferential weathering alongthese structures has produced valleys and gullies,which represent the present day drainage network.Previous ground structural analysis has identi-fied the lineaments as faults, fractures and dykes.The orientations of the lineaments observed in theIRS-1D images are broadly similar to the orien-tations of the faults and fractures studied in thefield (figures 1 and 2). We have selected three geo-physical profiles that are near the mouth of the
748 G K Reddy et al
valleys formed from the fault and fracture zones(figure 1). The site descriptions are as follows:
2.1 Profile 1 near Dubbagadda Tanda
An approximately 120-m long east-west surveyprofile was selected across the N-S oriented valley.The dominant rock type is pink-colour por-phyritic granite that contains quartz, K-feldsparand biotite. A dry stream occurs along the valleyfloor that coincides with a 15–20 m wide, N-S toNNE-SSW, sub-vertical brittle to brittle-ductilefault zone in the upstream direction. There existsa subordinate amount of NE-SW and ESE-WNWfractures. The N-S fault zones commonly exhibita right-lateral strike-slip movement. Thin quartzand dolerite veins are emplaced through the faultzone, but are deformed intensely, suggesting theirsyn-tectonic emplacement (figure 2a). Some of thefaults are associated with pseudotachylyte veins,which are proven indicators of seismic faulting.
2.2 Profile 2 near Botimedi Tanda
This is an ideal site for characterizing a faultzone covered with a relatively thick weathering capand a little soil cover. The bedrock is massive,pink coloured, porphyritic granite. The weatheringcap retains relict mineralogy and texture of theunderlying granite. The thickness of the weather-ing cap varies from a few centimeters to meters,and has closely spaced sheet joints near the sur-face. A 2–4 m wide, NW-SE striking, sub-vertical,fault zone is also exposed near the survey profile(figure 2b). A 90-m long seismic traverse waschosen in a roughly ENE-WSW direction. Thesoil-gas helium survey profile was limited to 40 mcovering the fault exposures, because the rest ofthe profile is unsuitable for soil-gas sampling owingto the hard weathering cap.
2.3 Profile 3 near Pallagattu Tanda
A 130-m long, N-S oriented survey profile wasselected at the mouth of the ESE-WNW valley. Therocks exposed in this valley are porphyritic graniteand coarse-grained granite. These rocks are pink-coloured, massive, homogeneous, and have primaryfoliations at places. Pegmatites and aplites are thelate phases invading the granites. Mafic micro-granular enclaves and xenolithic amphibolites arecommon. Rock exposures in the valley show evi-dence of fracturing and faulting (figure 2c). Themain fracture/fault system strikes in ESE-WNWdirection and dips sub-vertically. There are othersets of sub-vertical fractures in the N-S to NNE-SSW directions. At places, these fractures are filledwith pseudotachylyte veins. There are structurally
controlled springs in this valley and that supplieswater to streams (figure 2d), but water disappearsin the down stream direction because of enhancedrecharge along the streambed.
3. Data
High spatial resolution soil-gas helium surveyswere carried out over the fault/fracture zones,along the three profiles (figure 1). The soil-gas samples were collected from a depth of ∼1.5m.A sampling interval of 1 meter was maintainedalong the profiles in an effort to precisely mapthe fracture/fault zones. The instrument used forthe soil-gas helium analysis is an Alcatel ModelASM 100 T helium leak detector, whose sampleinlet system was suitably modified to measurethe soil-gas helium abundance. The helium con-centration was measured to a precision of 20 ppbat 5000 ppb concentration level and the heliumvalues are shown as excesses over the atmosphericabundance of 5240 ppb. The regional backgroundvalue for soil-gas helium in the Wailapally area is∼80–110 ppb above the atmospheric helium abun-dance. The values registered above the backgroundlevel are considered as anomalous.
The shear-wave velocity sections for the threeprofiles were obtained by modeling the MASWdata (Seshunarayana et al 2008a), following thestandard procedures (Miller et al 1999; Park et al1999; Xu et al 2006). Rayleigh wave data (richin ground-role) were recorded using an engineer-ing seismograph (Strata View, manufactured byGeometrics Inc, USA) and 24 low-frequency 4.5 Hzvertical geophones, placed at 1m interval. Acousticenergy was generated using a 10-kg sledgehammerhit on a metal plate. The near offset was chosenbetween 5 and 10 m, depending upon the siteconditions. The shot interval is 1m. The acquiredsurface wave data were processed using the SurfSeissoftware of Kansas Geological Survey. Each setof Rayleigh wave data (shot gather) were trans-formed from time domain to frequency domainto generate dispersion curves (frequency vs. phasevelocity), which have been further transformed intoshear-wave velocity-depth profile through an inver-sion process. Each set of velocity-depth profileswas arranged in a sequential order from the firstshot station to form a 2-D shear wave velocityfield. For more details of the methodology, seeSeshunarayana et al (2008a).
4. Discussion
The soil-gas helium and MASW methods inde-pendently detect the fault/fracture zones in the
Soil-gas helium and surface-waves detection of fault zones in granitic bedrock 749
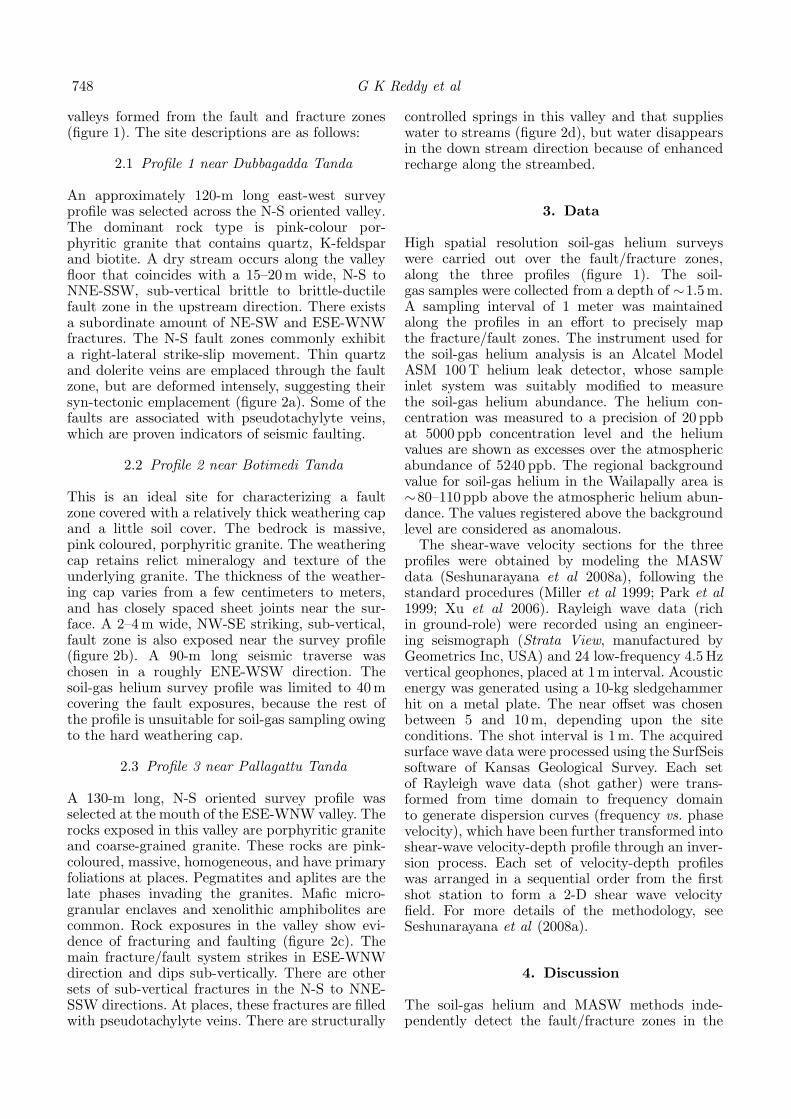
Figure 3. The shear wave velocity section and the soil-gas helium abundance along the profile 1. The original helium profileis superimposed by a three-point moving average plot (a thick blue line). The background soil-gas helium abundance alongthe profile is 80 ppb above the atmospheric abundance of 5240 ppb (a dashed line).
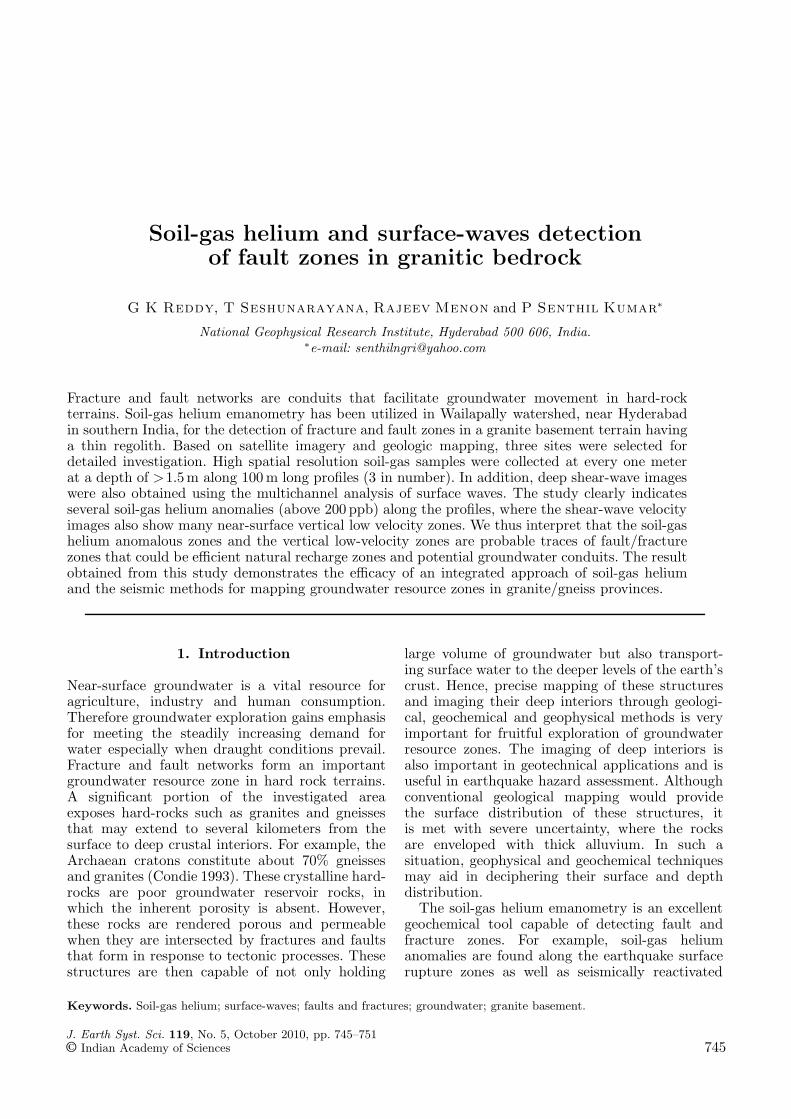
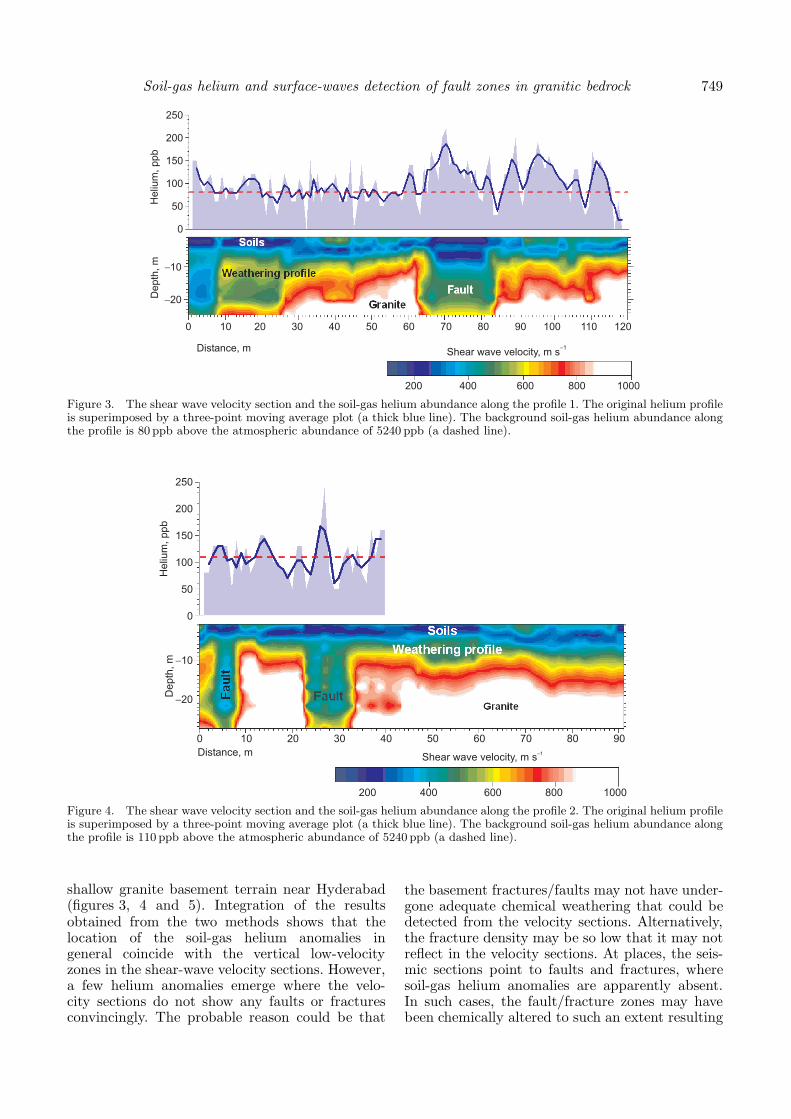
Figure 4. The shear wave velocity section and the soil-gas helium abundance along the profile 2. The original helium profileis superimposed by a three-point moving average plot (a thick blue line). The background soil-gas helium abundance alongthe profile is 110 ppb above the atmospheric abundance of 5240 ppb (a dashed line).
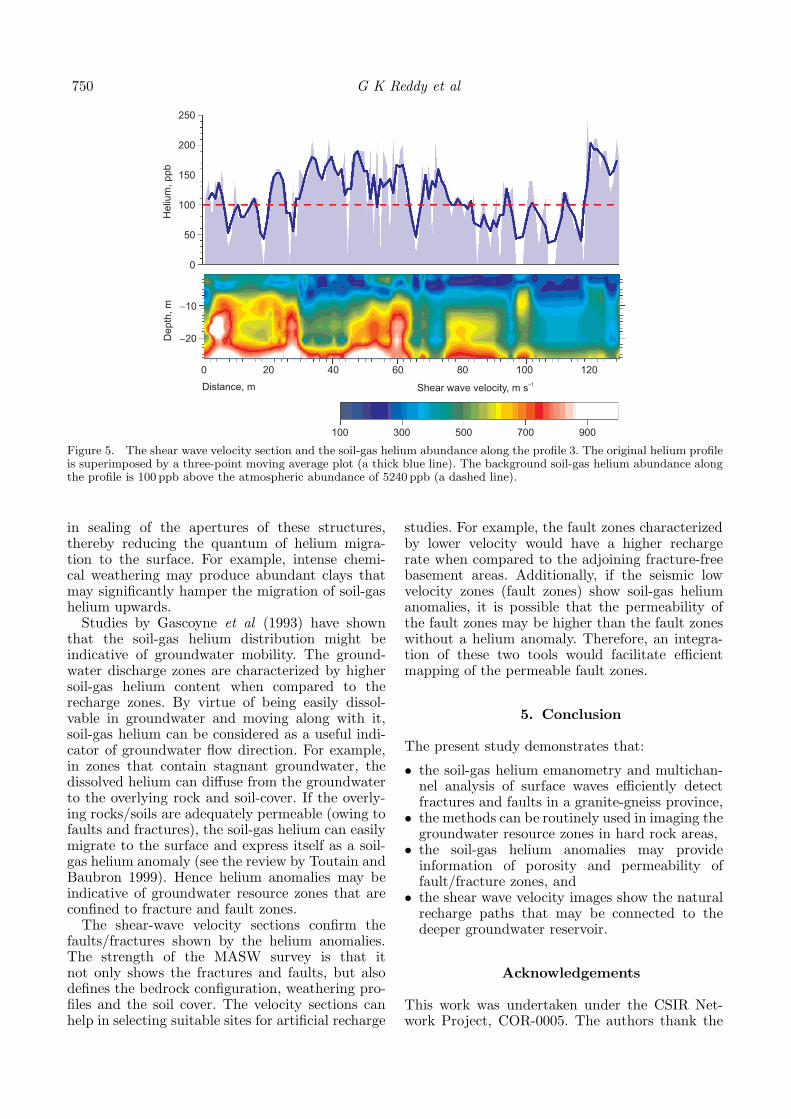
shallow granite basement terrain near Hyderabad(figures 3, 4 and 5). Integration of the resultsobtained from the two methods shows that thelocation of the soil-gas helium anomalies ingeneral coincide with the vertical low-velocityzones in the shear-wave velocity sections. However,a few helium anomalies emerge where the velo-city sections do not show any faults or fracturesconvincingly. The probable reason could be that
the basement fractures/faults may not have under-gone adequate chemical weathering that could bedetected from the velocity sections. Alternatively,the fracture density may be so low that it may notreflect in the velocity sections. At places, the seis-mic sections point to faults and fractures, wheresoil-gas helium anomalies are apparently absent.In such cases, the fault/fracture zones may havebeen chemically altered to such an extent resulting
750 G K Reddy et al
Figure 5. The shear wave velocity section and the soil-gas helium abundance along the profile 3. The original helium profileis superimposed by a three-point moving average plot (a thick blue line). The background soil-gas helium abundance alongthe profile is 100 ppb above the atmospheric abundance of 5240 ppb (a dashed line).
in sealing of the apertures of these structures,thereby reducing the quantum of helium migra-tion to the surface. For example, intense chemi-cal weathering may produce abundant clays thatmay significantly hamper the migration of soil-gashelium upwards.
Studies by Gascoyne et al (1993) have shownthat the soil-gas helium distribution might beindicative of groundwater mobility. The ground-water discharge zones are characterized by highersoil-gas helium content when compared to therecharge zones. By virtue of being easily dissol-vable in groundwater and moving along with it,soil-gas helium can be considered as a useful indi-cator of groundwater flow direction. For example,in zones that contain stagnant groundwater, thedissolved helium can diffuse from the groundwaterto the overlying rock and soil-cover. If the overly-ing rocks/soils are adequately permeable (owing tofaults and fractures), the soil-gas helium can easilymigrate to the surface and express itself as a soil-gas helium anomaly (see the review by Toutain andBaubron 1999). Hence helium anomalies may beindicative of groundwater resource zones that areconfined to fracture and fault zones.
The shear-wave velocity sections confirm thefaults/fractures shown by the helium anomalies.The strength of the MASW survey is that itnot only shows the fractures and faults, but alsodefines the bedrock configuration, weathering pro-files and the soil cover. The velocity sections canhelp in selecting suitable sites for artificial recharge
studies. For example, the fault zones characterizedby lower velocity would have a higher rechargerate when compared to the adjoining fracture-freebasement areas. Additionally, if the seismic lowvelocity zones (fault zones) show soil-gas heliumanomalies, it is possible that the permeability ofthe fault zones may be higher than the fault zoneswithout a helium anomaly. Therefore, an integra-tion of these two tools would facilitate efficientmapping of the permeable fault zones.
5. Conclusion
The present study demonstrates that:
• the soil-gas helium emanometry and multichan-nel analysis of surface waves efficiently detectfractures and faults in a granite-gneiss province,
• the methods can be routinely used in imaging thegroundwater resource zones in hard rock areas,
• the soil-gas helium anomalies may provideinformation of porosity and permeability offault/fracture zones, and
• the shear wave velocity images show the naturalrecharge paths that may be connected to thedeeper groundwater reservoir.
Acknowledgements
This work was undertaken under the CSIR Net-work Project, COR-0005. The authors thank the
Soil-gas helium and surface-waves detection of fault zones in granitic bedrock 751
Director, NGRI for granting permission to publishthis paper. We extend our thanks to all Engineer-ing Geophysics Department members for the assis-tance in fieldwork. We are grateful to C Shankar,G Ramacharyulu and G Ramulu of the heliumgroup for their co-operation. We specially thankDave Hart for his helpful comments on an earlierversion. The anonymous reviewers are thanked fortheir useful comments.
References
Chadwick B, Vasudev V N and Hegde G V 2000 TheDharwar craton, southern India, interpreted as the resultof late Archaean oblique convergence; Precamb. Res. 9991–111.
Condie K C 1993 Chemical composition and evolutionof the upper continental crust: Contrasting resultsfrom surface samples and shales; Chem. Geol. 1041–37.
Gascoyne M, Wuschke D M and Durrance E M 1993 Frac-ture detection and ground water flow characterizationusing He and Rn in soil gases, Manitoba, Canada; Appl.Geochem. 8 223–233.
Gupta H K, Rao R U M, Srinivasan R, Rao G V, Reddy G K,Dwivedy K, Banerjee D, Mohanty R and Satyasaradhi Y1999 Anatomy of surface rupture zones of two stable con-tinental region earthquakes, 1967 Koyna and 1993 Latur,India; Geophys. Res. Lett. 26 1985–1988.
Kumar P S and Reddy G K 2004 Radioelements and heatproduction of an exposed Archaean crustal cross-section,Dharwar Craton, south India; Earth Planet. Sci. Lett.224 309–324.
Miller R D, Xia J, Park C B and Ivanov J 1999 Multichannelanalysis of surface waves to map bedrock; The LeadingEdge 18 1392–1396.
Park C B, Miller R D and Xia J 1999 Multi-channel analysisof surface waves; Geophysics 64 800–808.
Rao G V, Reddy G K, Rao R U M and Gopalan K1994 Extraordinary helium anomaly over surface rup-ture of September 1993 Killari earthquake; Curr. Sci. 66933–935.
Reimer G M 1985 Prediction of central California earth-quakes from soil-gas fluctuations; Pure Appl. Geophys.122 369–375.
Seshunarayana T, Prasad P P, Rao S V P P and Kousalya M2006 Seismic surveys for earthquake microzonationof Jabalpur – A case study; In: Earthquake Mitigation,Preparedness, Seismic Vulnerability Assessment, Nationalworkshop on earthquake resistant design for the builtenvironment (eds) Chapter T S et al 4.3.1.
Seshunarayana T, Senthil Kumar P, Sampath Rao V,Mysaiah D, Satish Kumar K and Pavan Kishore P 2008aMultichannel analysis of surface waves reveals shear zonesand fractures in a shallow granite basement: Waila-pally watershed near Hyderabad; J. Geol. Soc. India 71261–265.
Seshunarayana T, Satish Kumar K, Deenanadh S,Rama Mohan Rao Y and Senthil Kumar P 2008b Sub-surface imaging of dolerite dykes in Hyderabad graniteterrain using multichannel analysis of surface waves,In: Indian Dykes (eds) R K Srivastava, Ch Sivaji andN V Chalapathi Rao (New Delhi: Narosa PublishingHouse) pp. 331–338.
Toutain J-P and Baubron J-C 1999 Gas geochemistry andseismotectonics: A review; Tectonophys. 304 1–27.
Xia J, Miller R D, Park C B and Tian G 2002 DeterminingQ of near-surface materials from Rayleigh waves; J. Appl.Geophys. 51 121–129.
Xu C and Butt S D 2006 Evaluation of MASW techniques toimage steeply dipping cavities in laterally inhomogeneousterrain; J. Appl. Geophys. 59 106–116.
Xu Y, Xia J and Miller R D 2006 Quantitative estimationof minimum offset for multichannel surface-wave surveywith actively exciting source; J. Appl. Geophys. 59117–125.
MS received 16 July 2009; revised 14 June 2010; accepted 16 June 2010