Sorption and flow in graphite-zeolite compacts I. Helium, argon and nitrogen
17
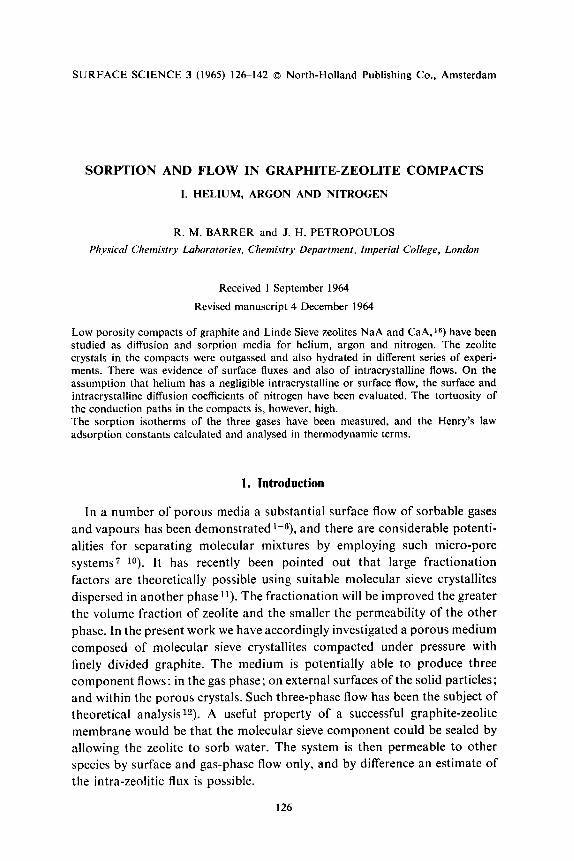
SURFACE SCIENCE 3 (1965) 126-142 o North-Holland Publishing Co., Amsterdam SORPTION AND FLOW IN GRAPHITE-ZEOLITE COMPACTS I. HELIUM, ARGON AND NITROGEN R. M. BARRER and J. H. PETROPOULOS Physical Chemistry Laboratories, Chemistry Department, Imperial College, London Received 1 September 1964 Revised manuscript 4 December 1964 Low porosity compacts of graphite and Linde Sieve zeolites NaA and CaA,16) have been studied as diffusion and sorption media for helium, argon and nitrogen. The zeolite crystals in the compacts were outgassed and also hydrated in different series of experi- ments. There was evidence of surface fluxes and also of intracrystalline flows. On the assumption that helium has a negligible intracrystalline or surface flow, the surface and intracrystalline diffusion coefficients of nitrogen have been evaluated. The tortuosity of the conduction paths in the compacts is, however, high. The sorption isotherms of the three gases have been measured, and the Henry’s law adsorption constants calculated and analysed in thermodynamic terms. 1. Introduction In a number of porous media a substantial surface flow of sorbable gases and vapours has been demonstrated lms), and there are considerable potenti- alities for separating molecular mixtures by employing such micro-pore systems7-lo). It has recently been pointed out that large fractionation factors are theoretically possible using suitable molecular sieve crystallites dispersed in another phasell). The fractionation will be improved the greater the volume fraction of zeolite and the smaller the permeability of the other phase. In the present work we have accordingly investigated a porous medium composed of molecular sieve crystallites compacted under pressure with finely divided graphite. The medium is potentially able to produce three component flows: in the gas phase; on external surfaces of the solid particles: and within the porous crystals. Such three-phase flow has been the subject of theoretical analysisl2). A useful property of a successful graphite-zeolite membrane would be that the molecular sieve component could be sealed by allowing the zeolite to sorb water. The system is then permeable to other species by surface and gas-phase flow only, and by difference an estimate of the intra-zeolitic flux is possible. 126
Transcript of Sorption and flow in graphite-zeolite compacts I. Helium, argon and nitrogen
SURFACE SCIENCE 3 (1965) 126-142 o North-Holland Publishing Co., Amsterdam
SORPTION AND FLOW IN GRAPHITE-ZEOLITE COMPACTS
I. HELIUM, ARGON AND NITROGEN
R. M. BARRER and J. H. PETROPOULOS
Physical Chemistry Laboratories, Chemistry Department, Imperial College, London
Received 1 September 1964
Revised manuscript 4 December 1964
Low porosity compacts of graphite and Linde Sieve zeolites NaA and CaA,16) have been studied as diffusion and sorption media for helium, argon and nitrogen. The zeolite crystals in the compacts were outgassed and also hydrated in different series of experi- ments. There was evidence of surface fluxes and also of intracrystalline flows. On the assumption that helium has a negligible intracrystalline or surface flow, the surface and intracrystalline diffusion coefficients of nitrogen have been evaluated. The tortuosity of the conduction paths in the compacts is, however, high. The sorption isotherms of the three gases have been measured, and the Henry’s law adsorption constants calculated and analysed in thermodynamic terms.
1. Introduction
In a number of porous media a substantial surface flow of sorbable gases
and vapours has been demonstrated lms), and there are considerable potenti-
alities for separating molecular mixtures by employing such micro-pore
systems7-lo). It has recently been pointed out that large fractionation
factors are theoretically possible using suitable molecular sieve crystallites
dispersed in another phasell). The fractionation will be improved the greater
the volume fraction of zeolite and the smaller the permeability of the other
phase. In the present work we have accordingly investigated a porous medium
composed of molecular sieve crystallites compacted under pressure with
finely divided graphite. The medium is potentially able to produce three
component flows: in the gas phase; on external surfaces of the solid particles:
and within the porous crystals. Such three-phase flow has been the subject of
theoretical analysisl2). A useful property of a successful graphite-zeolite
membrane would be that the molecular sieve component could be sealed by
allowing the zeolite to sorb water. The system is then permeable to other
species by surface and gas-phase flow only, and by difference an estimate of
the intra-zeolitic flux is possible.
126
(1) SORPTION AND FLOW IN GRAPHITE-ZEOLITE COMPACTS 127
2. Theoretical aspects of three-phase flow
2.1. THE STEADY STATEOF FLOW
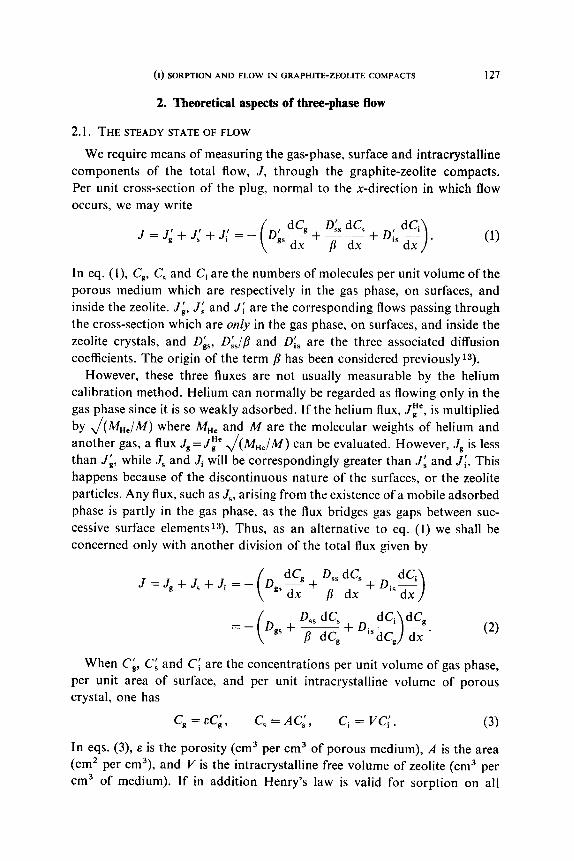
We require means of measuring the gas-phase, surface and intracrystalline
components of the total flow, J, through the graphite-zeolite compacts.
Per unit cross-section of the plug, normal to the x-direction in which flow
occurs, we may write
In eq. (I), C,, C, and Ci are the numbers of molecules per unit volume of the
porous medium which are respectively in the gas phase, on surfaces, and
inside the zeolite. Jb, Ji and .I: are the corresponding flows passing through
the cross-section which are only in the gas phase, on surfaces, and inside the
zeolite crystals, and Dhs, D~,/p and Di, are the three associated diffusion
coefficients. The origin of the term p has been considered previouslyla).
However, these three fluxes are not usually measurable by the helium
calibration method. Helium can normally be regarded as flowing only in the
gas phase since it is so weakly adsorbed. If the helium flux, J:‘, is multiplied
by ~(Mn-_I~) h w ere MHe and M are the molecular weights of helium and
another gas, a flux Jg = Jze ,/(M,,/M) can be evaluated. However, Jg is less
than 56, while J, and Ji will be correspondingly greater than Ji and Ji. This
happens because of the discontinuous nature of the surfaces, or the zeolite
particles. Any flux, such as J,, arising from the existence of a mobile adsorbed
phase is partly in the gas phase, as the flux bridges gas gaps between suc-
cessive surface elements13). Thus, as an alternative to eq. (1) we shall be
concerned only with another division of the total flux given by
J=J.+Js+Ji=- D,,d~+D,dC,+~is~ P dx
=- (2)
When CL, Cg and Ci are the concentrations per unit volume of gas phase,
per unit area of surface, and per unit intracrystalline volume of porous
crystal, one has
c, = ec;, C, = AC;, Ci = VCl. (3)
In eqs. (3), E is the porosity (cm3 per cm3 of porous medium), A is the area
(cm’ per cm3>, and V is the intracrystalline free volume of zeolite (cm3 per
cm3 of medium). If in addition Henry’s law is valid for sorption on all
128 R. hi. BARRER AND J. H. PETROPOULOS
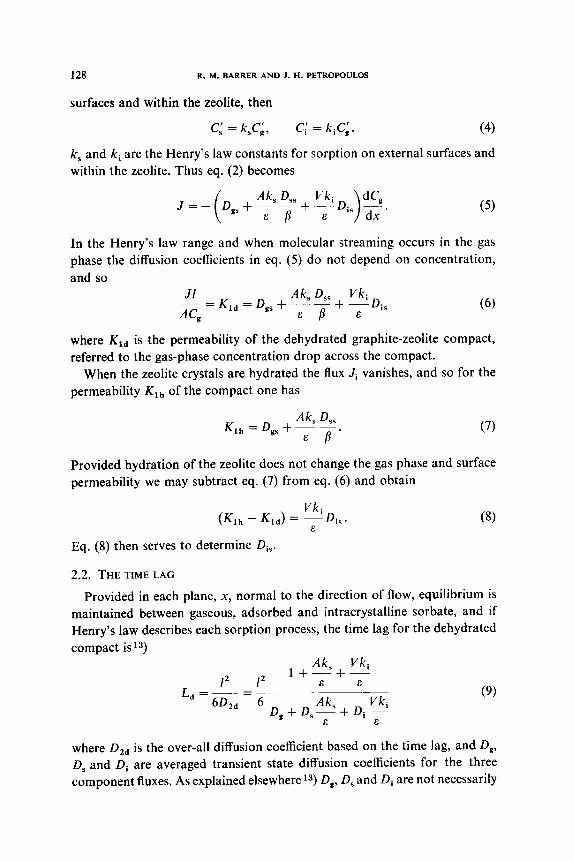
surfaces and within the zeolite, then
C; = k,C;, Cl = kiCi. (4)
k, and ki are the Henry’s law constants for sorption on external surfaces and
within the zeolite. Thus eq. (2) becomes
In the Henry’s law range and when molecular streaming occurs in the gas
phase the diffusion coefficients in eq. (5) do not depend on concentration,
and so
Jl Ak, D,, Vki _ = K,, = D,, + ~- 2 + -Di,
AC, EP 6
where Ktd is the permeability of the dehydrated graphite-zeolite compact,
referred to the gas-phase concentration drop across the compact.
When the zeolite crystals are hydrated the flux Ji vanishes, and so for the
permeability K,, of the compact one has
(7)
Provided hydration of the zeolite does not change the gas phase and surface
permeability we may subtract eq. (7) from eq. (6) and obtain
(K,, - K,,) = “,“i Di,.
Eq. (8) then serves to determine Di,.
2.2. THE TIME LAG
Provided in each plane, x, normal to the direction of flow, equilibrium is
maintained between gaseous, adsorbed and intracrystalline sorbate, and if
Henry’s law describes each sorption process, the time lag for the dehydrated
compact is 13)
l2 l2 1+!5+?
& L,=-=-
602, 6 D,+D,Ak,+D;l/k, E &
where D,, is the over-all diffusion coefficient based on the time lag, and D,,
D, and Di are averaged transient state diffusion coefficients for the three
component fluxes, As explained elsewhere 13) D,, D, and Di are not necessarily
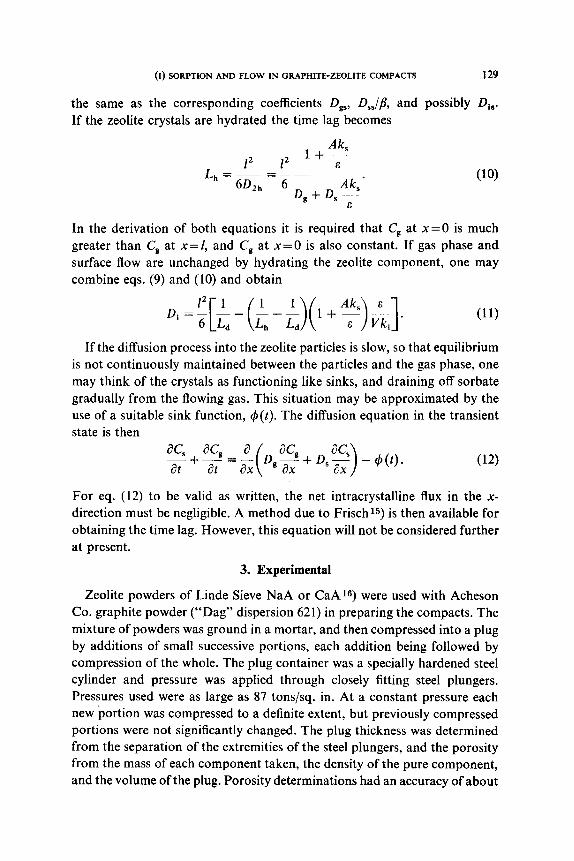
(I) SORPTION AND FLOW IN GRAPHITE-ZEOLITE COMPACTS 129
the same as the corresponding coefficients DBs, D,,lp, and possibly Di,. If the zeolite crystals are hydrated the time lag becomes
l2 l2 L, = ~
6D,, =d--’ D,+D,%
&
(10)
In the derivation of both equations it is required that CB at x=0 is much
greater than C, at x= I, and C, at x= 0 is also constant. If gas phase and
surface flow are unchanged by hydrating the zeolite component, one may
combine eqs. (9) and (10) and obtain
If the diffusion process into the zeolite particles is slow, so that equilibrium
is not continuously maintained between the particles and the gas phase, one
may think of the crystals as functioning like sinks, and draining off sorbate
gradually from the flowing gas. This situation may be approximated by the
use of a suitable sink function, 4(t). The diffusion equation in the transient
state is then
-4(t). (12)
For eq. (12) to be valid as written, the net intracrystalline flux in the x-
direction must be negligible. A method due to Frisch ls) is then available for
obtaining the time lag. However, this equation will not be considered further
at present.
3. Experimental
Zeolite powders of Linde Sieve NaA or CaAis) were used with Acheson
Co. graphite powder (“Dag” dispersion 621) in preparing the compacts. The
mixture of powders was ground in a mortar, and then compressed into a plug
by additions of small successive portions, each addition being followed by
compression of the whole. The plug container was a specially hardened steel
cylinder and pressure was applied through closely fitting steel plungers.
Pressures used were as large as 87 tons/sq. in. At a constant pressure each
new portion was compressed to a definite extent, but previously compressed
portions were not significantly changed. The plug thickness was determined
from the separation of the extremities of the steel plungers, and the porosity
from the mass of each component taken, the density of the pure component,
and the volume of the plug. Porosity determinations had an accuracy of about
130 R. hf. BARRER AND J. H. PETROPOLJLOS
f 10%. The plugs eventually studied had the following compositions by
volume:
Plug A: 60% NaA+40% graphite
B : 40% NaA + 60% graphite
D : 40% NaA + 60% graphite
G: 60% CaA+40% graphite
H : 40% CaA + 60% graphite.
Membrane D differed from membrane B in that the preliminary grinding
of graphite-zeolite mixture was more prolonged.
Spectroscopically pure helium, argon and nitrogen were supplied by the
British Oxygen Company. Sorption and flow measurements were made using
volumetric apparatus similar to that described elsewhereiss6). In the flow
measurements the boundary conditions at the ingoing and outgoing faces
of the plug (x = 0 and x = 1 respectively) were
C,= constant at x=0 for all t
C,=O for O<x<f at t=O
C, at x = 1 is much less than C, at x= 0 for all t.
Permeabilities, time-lags and sorption isotherms were measured over a
range of pressures and temperatures. Sorption isotherms were obtained for
water-free zeolite powders, graphite powder, and on pieces of graphite-
zeolite compact or on compressed graphite. The flow experiments were
conducted on the plugs in several states:
State I - the zeolite component is hydrated
State II - the zeolite component is dehydrated
State III - the zeolite component is rehydrated.
The compacts in their holders reached states I, II and III as follows. The
hydrated compacts were pumped out for several days at temperatures rising
to 60-65 “C. This caused a partial loss of water from regions near x=0 and
x = 1 but was not expected to render the bulk of the zeolite crystals permeable
to diffusing gases. The plug thus treated is in state I. State II was reached by
outgassing the plug at temperatures rising gradually to 340-370 “C and
maintaining these temperatures for one to two weeks while constantly
outgassing. Even then owing to the length and compacted character of the
plugs traces of water were still being evolved. State III was attained by
allowing the compacts in State II to sorb water vapour at a temperature of
100 “C falling to 50 “C ,or less, over a period of about one month. The
compact was then pumped out as in reaching state I.
Diffusion cells and sorption bulb were immersed in water or oil thermo-
TA
BLE
1
Syst
em
Hen
ry’s
la
w c
onst
ant
Mea
n A
S0
mol
ecul
es
per
cm3
of s
orpt
ion
volu
me
>
AE
A
A0
mol
ecul
es
per
cm3
of g
as p
hase
(k
cals
/mol
e)
(cal
s/m
ole)
be
twee
n 0”
and
75
“C
(c
als/
mol
e-de
g)
s --
8
0 “C
23
“C
50
“C
75
“C
0
“C
23 “
C
50 “
C
75 “
C
He
- N
aA
0.69
0.
63
0.57
0.
52
- 78
0 20
5 27
0 36
5 45
5 -
3.52
(a
)*
f 0.
83
0.76
0.
69
0.63
10
1 16
2 24
2 32
4 -
3.1s
(b
)*
g ;!
He
- C
aA
0.70
0.
58
0.50
0.
40
- 13
00
200
320
450
640
- 5.
49
(a)
2 0.
82
0.68
0.
58
0.46
11
0 23
0 34
5 53
0 -
5.17
(b
) ;
NZ
- N
aA
70.6
37
.4
20.1
12
.2
- 44
30
- 23
10
- 21
30
- 19
30
- 17
30
- 7.
76
(a)
84.9
45
.0
24.2
14
.7
-240
0 -
2230
-
2040
-
1850
-
7.42
(b
) i m
Na-
CaA
20
4 94
.9
43.7
22
.6
- 55
20
- 28
80
- 26
80
- 22
20
- 18
30
- 10
.01
(a)
239
111.
3 51
.2
26.5
5
- 29
70
- 27
10
- 23
10
- 19
30
- 9.
96
(b)
” 0
Ar
- C
aA
25.1
15
.6
9.75
6.
76
- 33
60
- 17
60
- 16
15
- 14
60
- 13
20
- 5.
8s
(a)
9
30.1
18
.3
11.4
7.
93
- 18
50
- 17
10
- 15
60
- 14
30
- 5.
56
(b)
2
* In
all
lines
(a)
the
sor
ptio
n vo
lum
e is
tak
en
as t
he t
otal
in
trac
ryst
allin
e vo
lum
e;
in a
ll lin
es (
b) i
t is
thi
s vo
lum
e le
ss t
he f
ree
volu
me
of t
he s
odal
ite
cage
s.
132 R. M. BARRER AND I. H. PETROPOULOS
stats controlled to + 0.1 “C, or at most to + 0.2 “C. A high temperature oil
in the latter case formed a thermostat fluid suitable for use up to 175 “C.
4. Sorption of permanent gases
Before considering the flow measurements the membranes and their
components must be well characterised as sorbents of the permanent gases.
Isotherms were measured at O”, 23”, 50” and 75 “C for He-NaA, He-CaA,
Ar-CaA, N,-NaA, N,-CaA and N,- and Ar-graphite. In the range of
pressures below 15 cm Hg all isotherms save those of nitrogen in CaA at 0
and 23 “C obeyed Henry’s law. Even for the exceptions the limiting Henry’s
law isotherm slopes were readily obtained. The higher affinity of nitrogen as
compared with argon for CaA is known to be associated with the quadrupole
moment of nitrogen17* I*).
The thermodynamic distribution coefficient, k,, may be written lg) as
(13)
The chosen standard state in the gas phase is p= I atm (or Cg= l/RT) and
in the sorbed state also Cg= l/RT. These are states of high dilution, and
since the Henry’s law region is also one of relatively high dilution we may
assume in this region that f,/f, - 1 and so k, N k,. Also the energy of sorption,
AE, will be virtually identical with the standard energy of sorption, AE’.
The standard free energy and entropy of sorption, AA0 and AS’, are then
given by
and
AA0 = - RTln k, = - RTln k, (14)
AA0 = AE” - TAS’ = AE - TAS’. (15)
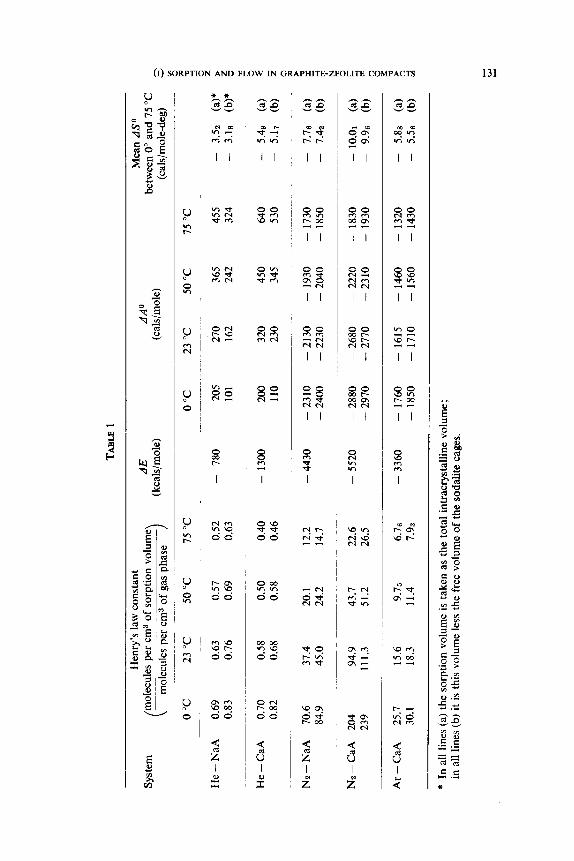
Some values of k,, k, and of AE, AA0 and AS0 are given in table I. Those
for helium are particularly interesting because k, is less than unity and AA0
is positive. This situation arises because although AE is exothermic its
influence is outweighed by the loss of thermal entropy, AS’, when helium is
entrained within the crystals.
It 1s often considered that negative adsorption in the sense of Gibbs’
adsorption equation cannot occur in a porous solid20). However, in the
present work the method of measuring sorption is such as to ensure that the
absolute amount rather than a Gibbs excess of intracrystalline sorption is
obtained. Thus, the volume of the empty sorption bulb is first determined,
and from it the total volume of the hydrated crystals subsequently introduced
is subtracted. The net volume is then used to evaluate the uptake of helium.
(I) SORPTION AND FLOW IN GRAPHITE-ZEOLITE COMPACTS 133
On outgassing the zeolite its zeolitic water is removed and a known intra-
crystalline volume is thereby created wherein the sorption occurs. If this
volume is added to the above net volume in calculating helium uptake, then
the Gibbs surface excess is evaluated. If it is not, then the absolute sorption
is evaluated. As noted above, we have used the latter procedure, and so
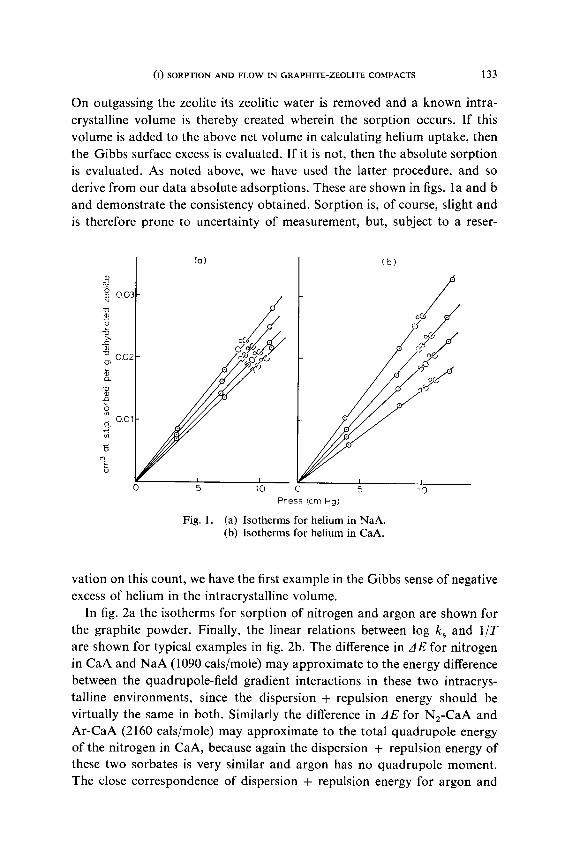
derive from our data absolute adsorptions. These are shown in figs. la and b
and demonstrate the consistency obtained. Sorption is, of course, slight and
is therefore prone to uncertainty of measurement, but, subject to a reser-
(b)
Press km Hg)
Fig. 1. (a) Isotherms for helium in NaA. (b) Isotherms for helium in CaA.
vation on this count, we have the first example in the Gibbs sense of negative
excess of helium in the intracrystalline volume.
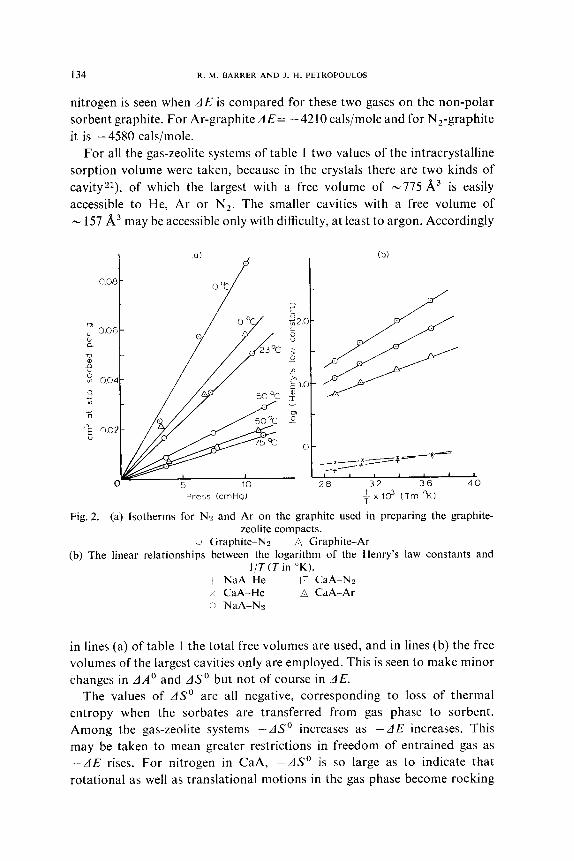
In fig. 2a the isotherms for sorption of nitrogen and argon are shown for
the graphite powder. Finally, the linear relations between log k, and l/r
are shown for typical examples in fig. 2b. The difference in AE for nitrogen
in CaA and NaA (1090 cals/mole) may approximate to the energy difference
between the quadrupole-field gradient interactions in these two intracrys-
talline environments, since the dispersion + repulsion energy should be
virtually the same in both. Similarly the difference in AE for N,-CaA and
Ar-CaA (2160 cals/mole) may approximate to the total quadrupole energy
of the nitrogen in CaA, because again the dispersion + repulsion energy of
these two sorbates is very similar and argon has no quadrupole moment.
The close correspondence of dispersion + repulsion energy for argon and
134 R. M. BARRER AND J. H. PETROPOULOS
nitrogen is seen when AE is compared for these two gases on the non-polar
sorbent graphite. For Ar-graphite AE= - 4210 cals/mole and for N,-graphite
it is -4580 cals/mole.
For all the gas-zeolite systems of table I two values of the intracrystalline
sorption volume were taken, because in the crystals there are two kinds of
cavityzr), of which the largest with a free volume of -775 A3 is easily
accessible to He, Ar or N,. The smaller cavities with a free volume of
N 157 A3 may be accessible only with difficulty, at least to argon. Accordingly
Preis (cmHg)
x SW--=*-- _X---_:Z==+
-+- 1 I a I_
28 32 36 40
+ x lo3 (Tm OK)
Fig. 2. (a) Isotherms for NZ and Ar on the graphite used in preparing the graphite- zeolite compacts.
L Graphite-N2 B Graphite-Ar (b) The linear relationships between the logarithm of the Henry’s law constants and
l/T(Tin “K). -1~ NaA-He a CaA-N2 x CaA-He B CaA-Ar !: NaA-Nz
in lines (a) of table I the total free volumes are used, and in lines (b) the free
volumes of the largest cavities only are employed. This is seen to make minor
changes in AA0 and AS0 but not of course in AE.
The values of dS” are all negative, corresponding to loss of thermal
entropy when the sorbates are transferred from gas phase to sorbent.
Among the gas-zeolite systems -dS” increases as - AE increases. This
may be taken to mean greater restrictions in freedom of entrained gas as
-AE rises. For nitrogen in CaA, -AS0 is so large as to indicate that
rotational as well as translational motions in the gas phase become rocking
TA
BL
E 2
Ste
ady-
stat
e pe
rmea
bili
ty
coef
fici
ents
an
d ti
me-
lag
diff
usi
on
coef
fici
ents
of
hel
ium
in
gra
phit
e-ze
olit
e co
mpa
cts
KI
x lo
3 D
Z
x lo
3 fr
om
tim
e la
g, L
K
I~~I
KI~
z P
lug
Sta
te *
(c
m2
set-
I)
(cm
2 se
t-l)
of
plu
g 0
“C
23 “
C
50 “
C
75°C
0°
C
23 “
C
50 “
C
7s “
C
0°C
23
“C
50
“C
75
“C
A
I1
5.38
5.
24
5.00
4.
91
1.96
2.
06
2.11
2.
22
III
4.99
4.
77
4.71
-
2.31
2.
37
2.50
2 IS
c =I
8 %
v
B
II
1.98
1.
91
1.83
1.
84
1.30
1.
50
1.65
1.
75
1.58
1.
67
1.85
1.
91
F
III
1.59
1.
55
1.53
-
2.00
2.
05
2.10
-
1.95
2.
04
2.13
-
2 ?
I 1.
24
1.21
1.
16
- 1.
85
2.02
2.
11
$ D
II
2.
74
2.59
2.
50
2.50
1.
79
1.88
2.
00
2.09
5
III
2.89
2.
80
2.77
-
2.22
2.
33
2.41
-
B
? R
I 9.
42
9.35
9.
35
- 2.
47
2.48
2.
48
- 0
G
Ira
13.7
13
.6
13.3
13
.1
1.87
2.
05
2.18
2.
27
f:
;;I
IIb
15.1
14
.7
14.3
-
- 2.
22
2.30
-
8 II
I 12
.2
13.0
13
.4
- 2.
62
2.66
2.
62
- 5
1 1.
69
1.62
1.
58
- 1.
76
1.84
1.
94
- 2
H
II
2.97
2.
92
2.82
2.
76
1.51
1.
67
1.83
-
III
2.27
2.
21
2.18
-
2.09
2.
17
2.23
-
* I
=
hyd
rate
d;
II =
de
hyd
rate
d;
III
=
reh
ydra
ted.
136 R. M. BARRER AND J. H. PETROPOULOS
vibrations or vibrations respectively within the zeolite. The values of --AS’
may be compared with those given by Barrer and Reesrs) in their table 2 for
a number of sorptions obeying Henry’s law.
5. Diffusion and flow
5.1. HELIUM
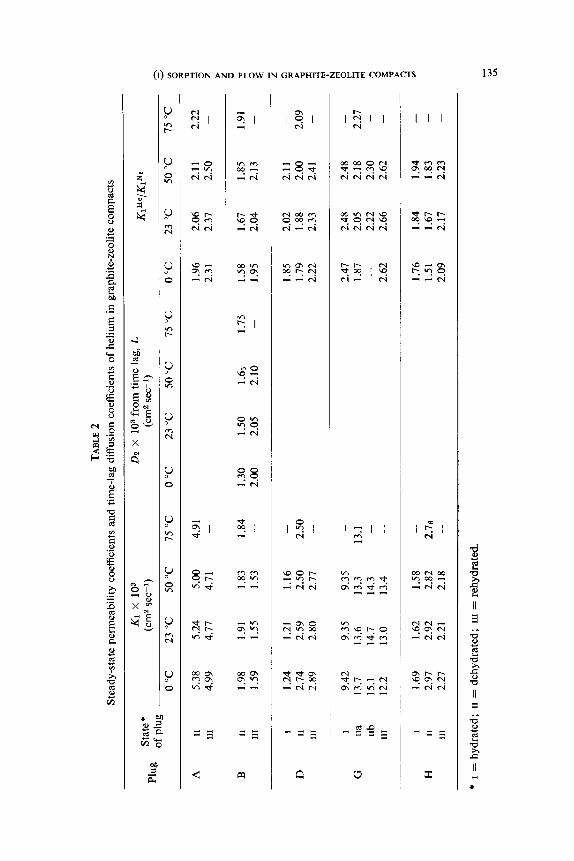
Measurements of steady-state flow and of time-lags served for the evalu-
ation of permeability and diffusion coefficients as summarised in table 2.
The view that the intracrystalline flow of helium is insignificant is supported
in the case of plug B by the close similarity in the magnitudes of K, and D, in table 2. When a gas shows significant sorption the time-lag period increases
strongly and D, decreases to correspond, as may be seen by reference to
table 3. The changes observed in the sequence state t+state n-+state III of the
plugs indicate that these graphite-zeolite compacts are not fully stable, but
that most of the alteration in flow properties occurs on the first outgassing,
that is, between stages I and II.
On account of these changes the ratio of the permeability coefficients for
helium and nitrogen in table 2 may give more information regarding surface
and intracrystalline flow of nitrogen than absolute values of K, and D,. For
flows confined purely to the gas phase the ratio should be ,/(MNr/MHe)=2.65. In all compacts K ~“/K~’ departs further from the theoretical ratio when the
compact is dehydrated. The value 2.65 is reached only for plug G in state III,
so that in general there is a flux involving a sorbed phase of nitrogen,
probably mainly on the graphite surfaces in states I and III. However, even in
these states some zeolitic water may be removed especially near x=0 and
x=1 and very limited intracrystalline flow of nitrogen is possible in these
portions of the plug even in these two hydrated states.
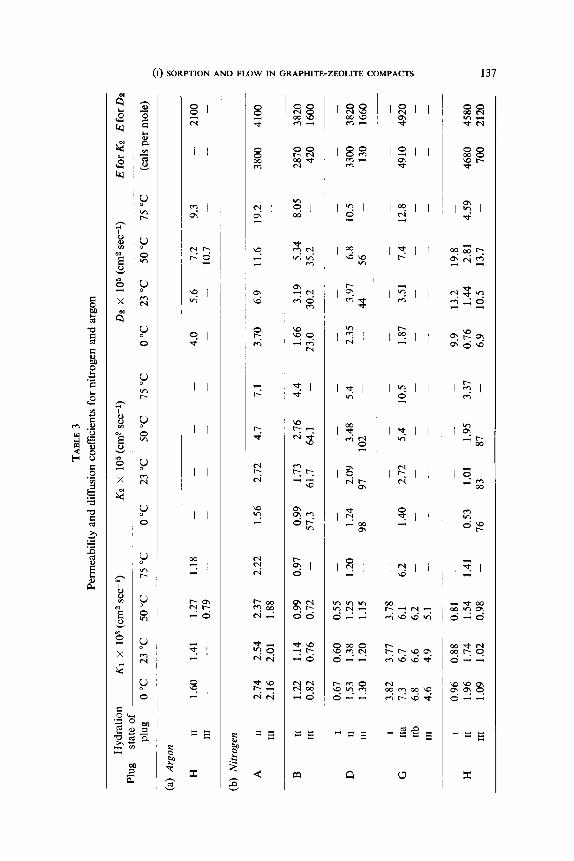
5.2. ARC~N AND NtTROG~~
The permeability coefficients in the steady state may be considered either
in terms of the concentration gradients in the gas phase, as in eq. (2), and
the derived equations (6) and (7), or they may be considered as below in
terms of the gradient of the total concentration, C= (C, + C, + Ci):
(16)
In the region where Henry’s law governs the distribution of gas between the
gas phase and both the surface and the intracrystalline free volume in the
zeolite, one may proceed as previously (eqs. (3), (4) and (5)) and obtain a
TABLE
3
Per
mea
bili
ty
and
diff
usi
on
coef
fici
ents
fo
r n
itro
gen
an
d ar
gon
Hyd
rati
on
Kl
x
lo3
(cm
2 se
t-l)
K
Z x
lo
5 (c
m2
set-
l)
D2
x
lo5
(cm
2 se
t-l)
E
for
KZ
E
for
DZ
P
lug
stat
e of
Plu
g 0
“C
23 “
C
50 “
C
15 “
C
0°C
23
“C
50
“C
75
“C
0
“C
23 “
C
50°C
75
“C
--
(cal
s pe
r m
ole)
(a)
Arg
on
H
II
1.60
1.
41
1.21
1.
18
- -
- -
4.0
5.6
7.2
9.3
--
2100
II
I 0.
79
- _
- -
- 10
.7
- -
-
(b)
Nit
roge
n
A
II
2.74
2.
54
2.37
2.
22
1.56
2.
72
4.1
7.1
3.70
6.
9 11
.6
19.2
38
00
4100
II
I 2.
16
2.01
1.
88
- -
B
II
1.22
1.
14
0.99
0.
97
0.99
1.
73
2.76
4.
4 1.
66
3.19
5.
34
8.05
28
70
3820
11
1 0.
82
0.76
0.
12
- 57
.3
61.1
64
.1
23.0
30
.2
35.2
-
420
1600
I 0.
67
0.60
0.
55
- -
- -
- -
- -
-
D
II
1.53
1.
38
1.25
1.
20
1.24
2.
09
3.48
5.
4 2.
35
3.91
6.
8 10
.5
3300
38
20
III
1.30
1.
20
1.15
-
98
91
102
- 44
56
13
0 16
60
I 3.
82
3.71
3.
78
- -
- -
- -
G
Ira
1.3
6.7
6.1
6.2
1.40
2.
72
5.4
10.5
1.
87
3.51
1.
4 12
.8
4910
49
20
ub
6.8
6.6
6.2
- -
- -
- -
- -
III
4.6
4.9
5.1
- -
- -
-
I 0.
96
0.88
0.
81
- -
9.9
13.2
19
.8
H
11
1.96
1.
74
1.54
1.
41
0.53
1.
01
1.95
3.
37
0.76
I .
44
2.81
4.
59
4680
45
80
III
1.09
1.
02
0.98
-
76
83
81
- 6.
9 10
.5
13.7
70
0 21
20
138 R. M. BARRER AND 1. H. PETROPOULOS
a new permeability coefficient, K,, which is for the dehydrated and hydrated
states respectively
(17)
and
These coefficients may be compared directly with the corresponding diffusion
coefficients D,, and D,, of eqs. (9) and (10).
The relevant coefficients are summarised in table 3, along with values of
K,. The ratios D,/K, are greater than one when the plugs are in state II, but
are less than one if the plugs are in state III. This supports the viewrs) that
one cannot assume the identity of steady and transient state diffusion
coefficients. The change in the ratio between states II and III also demonstrates
the reality and importance of an intracrystalline flux in state II.
The permeabilities, K,, given by eqs. (6) and (7), have very small negative
temperature coefficients. Thus, the increase in D,,/p and in Di, with rising
temperature is not quite as large as the decrease in k, and ki. Both D,,/p and
Di, refer to fluxes J, and Ji partly in gas phasel4). The flux J, must, as noted
earlier, pass by evaporation across gas gaps between one element of surface
and the next before being re-constituted on the surface. This process requires
the full energy of vaporisation; in addition, however, molecules comprising
J, hop or flow along each element of surface with an energy of activation
smaller than the full energy of evaporation. The resultant energy of activation
for surface diffusion is thus somewhat less than the energy of evaporation.
A similar argument applies to the molecules comprising Ji which evaporate
in passing from one porous crystal to the next, and also diffuse through
successive crystals. Accordingly the small negative temperature coefficient is
readily understood. There is also a slight increase in D,, (or Dg) with rising
temperature, and there may be a temperature effect on the pore geometry.
Even the helium permeabilities of table 2 show small negative temperature
coefficient so that either helium has a component of flow of adsorbed or
intracrystalline gas, or there are changes restricting the flow channels with
rising temperature, or both.
The large positive temperature coefficients of K, and D, arise from the
(I) SORPTION AND FLOW IN GRAPHITE-ZEOLITE COMPACTS 139
denominators or (I+$)
in the relevant expressions such as eqs. (I 7) and (18). As expected from this
argument, the temperature coefficient when the denominator contains the
term I/ki/c is much greater than when this term is not present, for Vk,/c
for argon and nitrogen considerably exceeds Ak,/s or I. The Arrhenius
energies of activation in the last two columns of table 3 are smaller than the
energies of intracrystalline sorption in table 1, but especially in the compacts
containing CaA the differences in the two energies are not large.
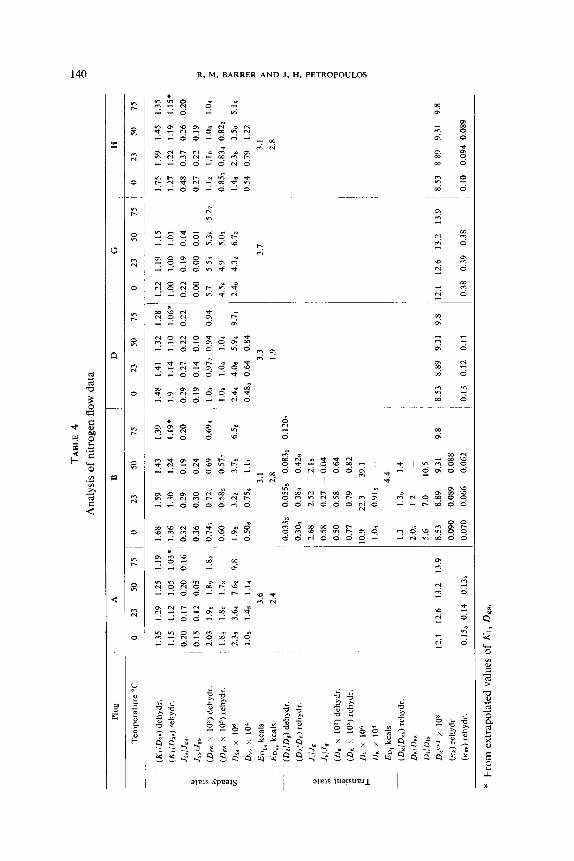
5.3. ANALYSIS OF NITROGEN FLOW
One may now use the helium flow measurements to interpret the nitrogen
flux in terms of its three component fluxes, J,, J, and Ji, and the three
diffusion coefficients to correspond. The method is similar to that of Barrer
and Gabor la) and neglects any flow of sorbed helium. The gas phase flux, Jg,
and the diffusion coefficient Dgs, are given by Jg/Ji’ = Dgs/D~se = J(M,,/M).
Also from eq. (8) we may evaluate ( Vki/.z) Di, for the intracrystalline flow,
whence Ji/J,=( Vki/E)(Di,/D,,). Vki/ E is k nown from the sorption experiments,
and both Di, and Ji follow. Finally, the remaining flux J, = J-(Ji + Jg) is
obtained, and since J,/J,=(Ak,/&)(D,,/P)/D,,, we may derive OS,//?. The
adsorption results have already given Ak,/c. These flux ratios and diffusion
coefficients are summarised in table 4, lines I to 8. Next, in lines 9 and 10,
are given the energies of activation, EDis and E,,,, for Di, and D,,/p.
From the time lags for helium, D!e may next be found [L,,=1,/(60~‘)]
and then D, for nitrogen [Dg=Dre J(MH,/MN2)]. Next from eq. (10) for
nitrogen in compacts in state III, taking Ak,/& from the sorption data, one
can determine D,. As before, assuming that hydration of the zeolite does not
significantly alter flow and adsorption on external surfaces or the gas phase,
one may use eqs. (12) or (14) to evaluate Di, since Vki/E is known from the
adsorption experiments. In this way flux ratios and diffusion coefficients,
and finally an energy of activation for Di, were found and are given in table 4,
lines 11 to 19. In lines 20 to 22 are recorded the ratios of relevant pairs of
time-lag and steady-state diffusion coefficients.
One may also compare D, and D,, with the Knudsen flow diffusion
coefficient, DF’, which one would find in one long cylindrical capillary
having a volume to surface ratio equal to that in the actual porous mediumr3).
Then D,, = IC~~D~’ ; D, = K&):’
where DEgy’ =8E J 2RT ~
3A nM
TA
BL
E
4
Ana
lysi
s of
nitr
ogen
fl
ow d
ata
Plu
g
Tem
pera
ture
“C
_
(KJD
as)
deh
ydr.
W,/D
.s)
reh
ydr.
J,sl
J,s
2 m
Jss/
Js.
=:
-0”
(Des
x
103)
deh
ydr.
z (D
es
x 10
”)re
hyd
r.
s D
is
x IO
”
D,,
x IO
”
En,
, k
cals
ED
_ kc
&
(h/D
,)
deh
ydr.
(&/D
e)
reh
ydr.
9 h/
Js
m
z Js
iJsz
;
(De
x 10
3) d
ehyd
r.
.u
; (D
E
x 10
3) r
ehyd
r.
e c D
, x
lo6
D.
x lo
1
En,
k
cals
-~
(DE
/D&
re
hyd
r.
Ds/
D..
DiiD
iS
Dgc
kl
x lo
3
1 (K
J reh
ydr.
(K&
re
hyd
r.
A
B
I D
I
G
0 23
50
75
,
0 23
50
75
i
0 23
50
75
0
23
50
__7:
1.35
1.15
0.20
0.15
2.03
1.88
2.33
1.0%
1.29
1.
25
1.12
1.
05
0.17
0.
20
0.12
0.
05
I .98
1.88
I.80
1.
78
3.64
7.
62
1.48
1.
14
3.6
2.4
1.19
1.
68
1.03
* 1.
36
0.16
0.
32
0.36
1.85
0.
747
0.60
9.8
1.95
0.50
s
12.1
12
.6
13.2
13
.9
0.15
6 0.
14
0.13
5
0.03
33
0.30
0
1.59
I .4
3 1.
39
1.30
1.
24
1.19
*
0.29
0.
19
0.20
0.30
0.
24
0.72
, 0.
69
0.69
4
0.58
5 0.
571
3.22
3.
7s
6.52
0.75
4 1.
11
3.1
2.8
0.05
55
0.08
31
0.12
0,
0.38
3 0.
429
1.48
1.
41
1.32
1.
28
~
1.06
*i
1.22
1.
19
1.15
1.9
1.14
1.
10
1.00
1.
00
1.01
0.29
0.
27
0.22
0.
22
0.22
0.
19
0.14
0.19
0.
14
0.10
0.
00
0.00
0.
01
1.03
1 .o
s
WI’
y:
E
0.94
i :
:l,
::zd
53:
5.27
2.44
4.
0s
5.94
9.
71
2.40
4.
32
6.7~
0.48
5 0.
64
0.84
3.3
3.7
I .9
H
0 23
50
75
1.75
1.
59
1.45
1.
35
1.27
1.
22
1.19
1.
15’
0.48
0.
37
0.26
0.
20
0.27
0.
22
0.19
I.12
I.
10
I .06
1 .O
a
0.85
, 0.
834
0.82
3
1.46
2.
38
3.50
5.
10
0.54
0.
79
1.22
3.1
2.8
2.68
2.
52
2.12
0.
58
0.27
~
0.
04
0.50
0.
58
0.64
I
0.77
0.
79
0.82
I
0.9
22.3
39
.1
1.04
0.
91s
-
4.4
1.3
1.3s
1.
4
2.05
1.
2 _
5.6
7.0
10.5
8.53
8.
89
9.31
9.
8 8.
53
8.89
9.
31
9.8
12.1
12
.6
13.2
13
.9
8.53
8.
89
9.31
9.
8
0.09
0 0.
089
0.08
8
0.07
0 0.
066
0.06
2 ~
0.13
0.12
0.
11
0.38
0.
39
0.38
0.
10
0.09
4 0.
089
* F
rom
ex
trap
olat
ed
valu
es o
f K
I,
D~
s.
(I) SORPTION AND FLOW IN GRAPHITE-ZEOLITF COMPACTS 141
and legs and rcg are structure factors. In this way one finds the results in the
last three lines of table 4. Clearly the structure factors are small indicating
tortuous diffusion paths in the compact. This is expected since during
formation under compression the graphite flakes in the compact will tend
to orient with their basal surfaces normal to the direction of compression,
which is also that of flow.
The steady-state intracrystalline and surface fluxes are seen from table 4
to be smaller than the gas-phase flow. In plug B in state II the intracrystalline
flow in the transient state during the time-lag period is, however, considerably
larger than the gas-phase flux. The intracrystalline diffusion coefficients are
considerably smaller (in the range 10m6 to lo-’ cm2 see-‘) than the surface
diffusion coefficients (ca. 10m4 cm2 set-‘) and the gas-phase diffusion
coefficients (ca. lop3 cm2 set-‘). Dis, Q, OS,//3 and D, all refer of course to
flows which are partly in the gas phase (l.c.). In all cases the gas-phase
diffusion coefficients are similar though not equal in the dehydrated and the
rehydrated states of any compact. They differ considerably, however, among
the different plugs. On the other hand the intracrystalline diffusion coef-
ficients at a given temperature are all of similar magnitude in each compact,
as would be expected for a process of which a good part is occurring within
the same intracrystalline channel system.
The Arrhenius energies of activation for Di, and Di are all rather smaller
than the energies of sorption of nitrogen (table 1); those for D,,/j3 are
considerably less than the energy of sorption of nitrogen on graphite (l.c.).
Finally, in compact B transient-state (time-lag) diffusion coefficients all tend
to be larger than the corresponding steady-state values. Especially is this so
for Di and Di,.
6. Conclusion
As a result of this study it has been possible to demonstrate rather small
intracrystalline flows of nitrogen in dehydrated compacts of graphite with
Linde Sieve A in Na- and Ca-forms. The work points to several directions
in which further examination of such compacts is needed. First, one may
choose a vapour of enhanced sorbability (Part II). Second, one may try to
avoid the large tortuosity associated with the incorporation of flaky graphite,
by using other bonding agents. Third, one may employ zeolites more open
in structure than Linde Sieve A, such as Linde Sieve X or Norton Co.
Zeolon. These possibilities are being currently investigated.
One of us (J.H.P.) wishes to acknowledge with thanks the award of
an Esso Postdoctoral Fellowship which enabled him to take part in this
work,
142 R. M. BARRER AND J. H. PETROPOULOS
References
1) E. A. Flood, R. H. Tomlinson and A. E. Leger, Canad. J. Chem. 30 (1952) 389. 2) P. C. Carman and F. A. Haul, Proc. Roy. Sot. A209 (1951) 38. 3) R. M. Barrer and E. Strachan, Proc. Roy. Sot. A231 (1955) 52. 4) E. R. Gilliland, R. F. Baddour and L. J. Russell, J. Amer. Inst. Chem. Eng. 4 (1958)
90. 5) R. A. W. Haul and R. Peerbooms, Naturwiss. 5 (1958) 109. 6) R. Ash, R. M. Barrer and C. G. Pope, Proc. Roy. Sot. A271 (1963) 1. 7) D. H. Hagerbaumer and K. Kammermeyer, Chem. Eng. Prog. Symposium Series
No. 10, Collected Research Papers 50 (1954) 25. 8) K. Kammermeyer and D. H. Hagerbaumer, Jour. Am. Inst. Chem. Eng. l(l955) 215. 9) R. Ash, R. M. Barrer and C. G. Pope, Proc. Roy. Sot. A271 (1963) 19.
10) K. Kammermeyer and L. 0. Rutz, Chem. Eng. Prog. Symposium Series No. 24, Collected Research Papers 55 (1959) 163.
11) R. M. Barrer and J. H. Petropoulos, Brit. J. App. Phys. 12 (1961) 691. 12) R. Ash and R. M. Barrer, Trans. Farad. Sot. 59 (1963) 2260. 13) R. M. Barrer and T. Gabor, Proc. Roy. Sot. A251 (1959) 353. 14) R. M. Barrer and T. Gabor, Proc. Roy. Sot. A256 (1960) 267. 15) H. L. Frisch, J. Phys. Chem. 61 (1957) 93. 16) D. W. Breck, W. G. Eversole, R. M. Milton, T. B. Reed and T. L. Thomas, J. Amer.
Chem. Sot. 78 (1956) 5963. 17) G. L. Kington and A. C. Macleod, Trans. Farad. Sot. 55 (1959) 1799. 18) R. M. Barrer and W. I. Stuart, Proc. Roy. Sot. A249 (1959) 464. 19) R. M. Barrer and L. V. C. Rees, Trans. Farad. Sot. 57 (1961) 999. 20) cf. D. M. Young and A. D. Crowell, Physical Adsorption of Cases (Butterworth,
London, 1962) p. 1. 21) D. W. Breck and T. B. Reed, J. Amer. Chem. Sot. 78 (1956) 5972.