
Structure and dynamics of liquid helium systems and their ...
78
Structure and dynamics of liquid helium systems and their interaction with atomic dopants and free electrons David Mateo Valderrama Aquesta tesi doctoral està subjecta a la llicència Reconeixement- CompartIgual 3.0. Espanya de Creative Commons. Esta tesis doctoral está sujeta a la licencia Reconocimiento - CompartirIgual 3.0. España de Creative Commons. This doctoral thesis is licensed under the Creative Commons Attribution-ShareAlike 3.0. Spain License.
-
Upload
khangminh22 -
Category
Documents
-
view
2 -
download
0
Transcript of Structure and dynamics of liquid helium systems and their ...
Structure and dynamics of liquid helium systems and their interaction with atomic
dopants and free electrons
David Mateo Valderrama
Aquesta tesi doctoral està subjecta a la llicència Reconeixement- CompartIgual 3.0. Espanya de Creative Commons. Esta tesis doctoral está sujeta a la licencia Reconocimiento - CompartirIgual 3.0. España de Creative Commons. This doctoral thesis is licensed under the Creative Commons Attribution-ShareAlike 3.0. Spain License.
Structure and dynamics of liquid heliumsystems and their interaction with atomic
dopants and free electrons
by
David Mateo Valderrama

Structure and dynamics of liquid heliumsystems and their interaction with atomic
dopants and free electrons
by
David Mateo Valderrama
Supervisor: Dr. Manuel Barranco GomezTutor: Dr. Martı Pi Pericay
Thesis submitted for the degree of Doctor of Philosophy underthe Physics PhD program at the University of Barcelona.March 2013
Tesis presentada para obtener el grado de Doctor en el pro-grama de doctorado de Fısica de la Universidad de Barcelona.Marzo de 2013

Resumen
Contexto
El helio es la unica sustancia que permanece lıquida a temperatura cero. Esta curiosacaracterıstica es una clara manifestacion macroscopica de la naturaleza cuantica de lamateria. El helio es el segundo elemento mas ligero y su estructura de capa cerrada esresponsable de la debil atraccion entre atomos de He. Estas dos propiedades son la causade que el helio tenga una energıa de punto cero suficientemente grande como para evitarla solidificacion, incluso a temperatura estrictamente cero. La energıa del punto cero–tambien conocida como movimiento del punto cero– es la energıa asociada a la localizacionde la distribucion de probabilidad de un sistema. La existencia de esta energıa es unaprediccion de la mecanica cuantica sin equivalente clasico que desempena el papel deenergıa cinetica incluso cuando no hay “movimiento” en el sentido clasico. La naturalezacuantica del He se manifiesta no solo impidiendo su solidificacion sino tambien causandouna transicion de segundo orden cuando la temperatura se reduce por debajo de los 2.18grados Kelvin de un estado lıquido normal (He I) a un estado superfluido (He II); unnuevo estado de la materia en el que la ausencia de viscosidad permite al helio fluir libre-mente (sin disipacion) cuando se desplaza a velocidades por debajo de cierto valor lımite.[1]
El helio aparece tanto en forma de lıquido homogeneo como en forma de gotas. Lasgotas pueden estar formadas por cualquiera de los dos isotopos estables del helio, 3He y4He, o de una mezcla de ambos. A bajas temperaturas, una gota mixta de 3He–4He esun agregado estructurado con 4He en su nucleo y 3He en su capa externa. Una propiedadinteresante de estas gotas es que pueden ser dopadas con impurezas de forma relativa-mente facil. El estudio espectroscopico de estas impurezas permite analizar el entorno dehelio que las rodea. [2–7] Dependiendo de la impureza, esta se situara bien en el centrode la gota, en la superficie, o en la interficie 3He–4He.[8] La estructura de gotas de 3He,4He y, en menor medida, 3He–4He alrededor de impurezas atomicas o electrones libres hasido estudiada tanto a nivel teorico como experimental.
La dinamica de estos sistemas se ha resistido a una exploracion teorica durantemuchos anos. Uno podrıa argumentar que, dado los pocos experimentos llevados a cabosobre la respuesta del helio en la escala del picosegundo, una descripcion precisa de ladinamica es una cuestion puramente academica de poca relevancia para la comunidad
i
ii RESUMEN
experimental. Sin embargo, diversos experimentos como por ejemplo la observacion de ladesaparicion de burbujas electronicas excitadas[9] por el Prof. Maris o la medicion de lavelocidad de desorcion de atomos de Ag dentro de gotas[10] del Prof. Drabbels muestranque una descripcion teorica completa y precisa del proceso dinamico que subyace a estasexperiencias es fundamental para comprender los resultados.
Resultados
En esta tesis se presenta una coleccion de cuatro artıculos publicados y un manuscritoaun no publicado, todos ellos en el campo de la fısica de bajas temperaturas y fluidoscuanticos. Cada uno de ellos reporta un paso adelante en la descripcion teorica de lossistemas de helio por medio de la teorıa del funcional de la densidad.
Los primeros dos artıculos [11, 12] estan clasificados como “estructura” ya que tratancuestiones relacionadas con la descripcion del estado fundamental de complejos de heliodopados con impurezas atomicas. En ellos hemos calculado la estructura y determinadosu efecto sobre el espectro de absorcion dipolar del Na en agregados de 3He–4He y delMg en el lıquido homogeneo e isotopicamente mezclado. Para el caso de Na en gotasse ha encontrado que, a pesar de necesitar una gran cantidad de 3He para que la capaexterior de la gota sature, el espectro de la impureza es muy insensible a la composicionisotopica y rapidamente satura al valor que toma en las gotas de 3He puras. Para Mgen el lıquido mezclado, la presencia de 3He induce cambios en el espectro mucho maspequenos que su anchura caracterıstica, por lo que se ha encontrado que el efecto generalde la composicion isotopica de la mezcla en la espectroscopıa es mınima.
Hemos explorado tambien los lımites del funcional de la densidad para un numeropequeno de atomos de helio interactuando con una molecula lineal de sulfuro de carbonilo(OCS). Para ello hemos implementado un esquema de Kohn-Sham para el 3He y hemosobtenido la estructura de agregados OCS@3HeN para un numero de atomos N hasta 40.Hemos comparado los resultados de los agregados de 4He con el mismo numero de atomosy hemos encontrado que la alta anisotropıa de la molecula de OCS magnifica los efectos delas diferentes estadısticas de cada isotopo. Nuestra estimacion de los momentos de inerciade estos agregados es consistente con la interpretacion de los datos experimentales[13]que sugieren una estructura de 11 atomos de helio rotando solidariamente con la moleculade OCS.
Los siguientes tres trabajos [10, 14, 15], clasificados como “dinamica”, describen laevolucion temporal de ciertos procesos de interes experimental en los sistemas de helio.Mientras que las publicaciones sobre la estructura completan una lınea de trabajo bienestablecida, las de esta seccion abren un nuevo frente de exploracion teorica sobre losprocesos dinamicos con resolucion de picosegundos. En ellos se presenta un procedimien-to eficiente para describirlos cuantitativamente mediante una teorıa del funcional dela densidad dependiente del tiempo (TDDFT, por sus siglas en ingles) para el helio,acoplado a la dinamica adecuada para la impureza. Cual es la dinamica “adecuada”
iii
depende de las propiedades de la impureza: para la burbuja electronica 1P se puedeutilizar una descripcion puramente mecanocuantica del electron en una aproximacionadiabatica, mientras que para la burbuja 2P la aproximacion adiabatica no es aplicabley se deben acoplar las evoluciones en tiempo real del helio y del electron. Para unaimpureza masiva como la Ag una descripcion clasica de su movimiento es suficiente, peroel efecto de spin-orbita es lo suficientemente importante como para que el estado electroni-co del atomo deba tenerse en cuenta en la dinamica como un grado de libertad cuantizado.
En el caso de las burbujas electronicas, hemos relacionado la desaparicion de lasburbujas 1P a altas presiones con la existencia de un camino de relajacion no-radiativo quecausa la rotura de la burbuja en dos mitades casi esfericas tras haber transcurrido unos 20picosegundos desde su excitacion. Hemos sido capaces de establecer esta relacion graciasa que nuestro calculo predice la “fision” de la burbuja solo para presiones superioresa 1 bar, que es el mismo umbral observado experimentalmente para la desaparicion delas burbujas 1P. [9] Teniendo en cuenta que aumentar la presion en 1 bar aumenta ladensidad de saturacion del lıquido en poco mas de un 1 %, la exactitud de este resultadoindica que TDDFT contiene la fısica relevante para describir este tipo de procesos y tienecapacidad de prediccion cuantitativa. Tambien hemos encontrado un marcado cambioen el comportamiento del espectro de absorcion con resolucion temporal de la burbuja1P dependiendo de si esta fisiona o no, es decir, dependiendo de la presion del lıquido.La observacion experimental de este cambio y su determinacion podrıa completar lainformacion obtenida en los experimentos de cavitacion y fotoconductividad.
En el caso de la desorcion de un atomo de plata tras su fotoexcitacion en el interiorde una gota de He, nuestros calculos dinamicos predicen un rango de velocidades parala impureza consistente con la distribucion de velocidades experimental. Esta velocidades el resultado de cuanta energıa transfiere la impureza a la gota, lo cual depende delos modos de excitacion disponibles para dicha transferencia. Nuestra descripcion dellıquido solo permite excitaciones colectivas tales como ondas de densidad u oscilaciones desuperficie, por lo que la compatibilidad de nuestros resultados con los datos experimentalesse puede tomar como una evidencia indirecta de la superfluidez de las nanogotas dehelio. Adicionalmente hemos descartado la nucleacion vortices como un posible canalde transferencia de energıa en gotas nanoscopicas al no haberlos generado en nuestroscalculos.

iv RESUMEN
Contents
Resumen i
1 Introduction 11.1 Theoretical description of helium systems . . . . . . . . . . . . . . . . . . 2
1.1.1 Density Functional Theory . . . . . . . . . . . . . . . . . . . . . . 3
2 Structure 52.1 Absorption spectrum of atomic impurities in isotopic mixtures of liquid
helium . . . . . . . . . . . . . . . . . . . . . . . . . . . . . . . . . . . . . 52.2 A density functional study of the structure of small OCS@3HeN clusters 14
3 Dynamics 233.1 Evolution of the excited electron bubble in liquid 4He and the appearance
of fission-like processes . . . . . . . . . . . . . . . . . . . . . . . . . . . . . 233.2 Excited electron-bubble states in superfluid 4He: A time-dependent density
functional approach . . . . . . . . . . . . . . . . . . . . . . . . . . . . . . 343.3 Translational dynamics of photoexcited atoms in 4He nanodroplets: The
case of silver . . . . . . . . . . . . . . . . . . . . . . . . . . . . . . . . . . 44
4 Summary and Conclusions 594.1 Outlook . . . . . . . . . . . . . . . . . . . . . . . . . . . . . . . . . . . . . 61
A List of publications 63
Bibliography 65
v

vi CONTENTS
Chapter 1
Introduction
Helium first revealed itself in 1868 as a bright yellow line coming from the Sun. As theunworldly substance it seemed to be, it was named after the Greek word for Sun, helios.Fourteen years later its presence on Earth was unraveled by analyzing the spectral linesof the lava on Mount Vesuvius. Before the turn of the century, helium would be capturedand isolated for study in several laboratories around Europe. In 1908, Heike KamerlinghOnnes achieved the liquefaction of helium by cooling it below four degrees Kelvin, buthelium would always defy solidification under normal pressure.[16] This seemingly inno-cent realization marks the start for an exhaustive research which would reveal a newstate of matter and surprising new phenomenology in the field of low temperature physics.
Helium is the only substance which remains liquid at zero temperature. This strikingfeature is a clear and indisputable macroscopic manifestation of the quantum nature ofmatter. Helium is the second lightest element and its closed shell structure is responsiblefor the extremely small attraction between He atoms. These two properties cause thehelium to have a zero point energy large enough to keep it from solidifying even at strictlyzero temperature. The zero point energy –also known as zero point motion– is the energyassociated with the localization of the probability distribution of a system on a finiteregion of space. The existence of this energy is a prediction of Quantum Mechanics withno classical equivalent, and plays the role of a kinetic energy present even when there isno “motion” in the classical sense. The quantum nature of He does not only prevents itfrom solidifying but also causes a second order phase transition when the temperature isreduced below 2.18 Kelvin from normal liquid state (He I) to a superfluid state (He II);a new state of matter in which the absence of viscosity allows it to flow freely (with nodissipation) at velocities below a certain limit.[1]
The superfluid state is a highly correlated state where particle excitations are sup-pressed in favor of delocalized collective excitations. It is associated with Bose-Einsteincondensation, a manifestation of the bosonic nature of helium’s most abundant isotope,4He. Helium has a second stable isotope, 3He, which has spin 1/2 and therefore followsfermionic statistics. The different statistics have a critical effect on the macroscopic
1

2 CHAPTER 1. INTRODUCTION
properties of the liquid. For example, for 3He one needs to go to much lower tem-peratures, below 2.6 mK, to find its superfluid state. This state is associated withthe condensation of 3He atom pairs, similar to the Cooper pairing of electrons in asuperconducting state.[17] Because 3He and 4He are practically identical in all propertiesbut statistics, a thorough comparison of these two substances is particularly interest-ing to understand the role quantum statistics plays in the behavior of many-body systems.
Helium can appear both as a bulk liquid and as droplets. At low temperatures, amixed 3He-4He drop is a structured cluster with 4He in its core and 3He in its outer shell.One attractive feature of these drops is that they can be doped with impurities withrelative ease for spectroscopic probing of the helium environment.[2–7] Depending on theimpurity it will either go to the center of the drop, reside at its surface, or sink downto the 3He–4He interface.[8] The structure of 3He, 4He and, to a lesser extend, 3He–4Hemixed droplets and liquids around atomic impurities or free electrons has been studiedboth in the experimental and theoretical fronts.
The dynamics of these systems, on the other hand, have proven elusive for manyyears. One may naively argue that, because few experiments are carried out to study theresponse of helium at the picosecond scale, an accurate dynamical description of heliumsystems is a purely academic issue of little relevance to the experimental community.However, many experiments such as Prof. Maris’ observation of disappearing excited1P electron bubbles[9] or Prof. Drabbels’ measurement of the desorption velocity of Agatoms inside drops[10] have shown that a complete and accurate theoretical description ofthe dynamical processes underlying these experiments is fundamental to understand them.
The publications presented in this thesis are split in two chapters: Chapter 2 addressessome problems on the structure of drops and the mixed liquid. The differences between3He and 4He are studied through the dipole absorption spectrum of Na and Mg impuritiesand through their effect on the moment of inertia of solvated carbonyl sulfide molecules.Chapter 3 presents the development of an accurate and consistent framework to addresstime-dependent problems in helium liquids and clusters of some thousand atoms. Thismethodology is used to help interpret the experiments by Profs. Maris and Drabbelscommented above.
1.1 Theoretical description of helium systems
A good theoretical description is essential to fully understand the experimental evidence.Any potential description must take into account the key role of quantum mechanics andthe strong He–He correlations.
There are several approaches to a theoretical exploration of the properties of many-body systems. One possibility is to solve numerically the N -body Schrodinger equationby Quantum Monte Carlo simulation techniques.[18, 19] These techniques partially
1.1. THEORETICAL DESCRIPTION OF HELIUM SYSTEMS 3
alleviate the prohibitive scaling of computational cost with the number of particles thatsolving the Schrodinger equation has. These are ab initio procedures that give a verydetailed description of the groundstate of the system but require humongous amount ofcomputational power to describe systems of experimental interest such as drops with somethousands of atoms. Other ab initio techniques include Green’s Function, PropagatorMethods, Correlated Basis Function or Coupled Cluster Method.[20–22] These methodsinvolve either diagramatic expansions or variations of a trial wavefunction, and are eitherless suited or just not suited for complex setups like a cluster doped with a stronglyinteracting impurity.
One alternative to these microscopic approaches is to pursue a phenomenologicaldescription of the system by using Density Functional Theory. In this approach, all theproperties of the liquid are encoded in an energy functional which depends only on theone-body density instead of the complete N -body wavefunction.[23–26] This provides agood scaling with the number of particles while maintaining a wide applicability. Theprice to pay is the added complexity of finding a realistic energy functional and thelimitation of having an hydrodynamic description of the system, with no information onthe atoms themselves nor their correlations.
We have chosen the later approach in all the works presented here as its accuracy andefficiency have been proven. Besides, it is the only realistic way of computing real-timedynamics in the picosecond domain for a system of thousands interacting He atoms sofar.
1.1.1 Density Functional Theory
Density functional theory is a rigorous formulation of nonrelativistic quantum many-bodyphysics in which the energy of the system is taken as a functional of the one-bodydensity and not the complete N -body wavefunction. The base for this formulation is thedemonstration [27] by Hohenberg and Kohn in 1964 that the groundstate properties of aquantum system of interacting particles can be characterized completely by the one-bodydensity through the appropriate energy functional.
Several energy functionals for a system of interacting helium atoms have been devel-oped over the years. The quintessential functional when dealing with inhomogeneous4He settings is a finite-range functional known as “Orsay-Trento” presented in 1995 byF. Dalfovo et al.[28] The extension to inhomogeneous 3He–4He mixtures made in [29](which reduces to Orsay-Trento in the absence of 3He) has been the functional of choicefor the works presented in this thesis.
With an energy functional at hand, this theory can be easily extended to a Time-Dependent Density Functional Theory (TDDFT). In its simplest implementation, thedynamics of the system is obtained by minimizing the quantum action for the effective
4 CHAPTER 1. INTRODUCTION
macroscopic wavefunction Ψ,
A[Ψ] =∫
dt
{E[ρ] +
∫d�r
h2
2m|�∇Ψ|2 − ihΨ∗ ∂
∂tΨ
},
where Ψ is a complex field whose squared modulus equals the one-body density, ρ = |Ψ|2.This minimization yields a time-dependent Schrodinger-like equation for Ψ(�r, t) of theform
ih∂
∂tΨ(�r, t) =
(− h2
2m∇2 +
δE
δρ(�r, t)
)Ψ(�r, t) .
which can be efficiently solved numerically by generic differential equation methods suchas a predictor-corrector algorithm.[30]
In all the problems addressed in this work helium is coupled to an impurity, which maybe either an atomic impurity such as Ag or an excess electron trapped in a bubble. Thiscoupling is introduced as a helium-impurity potential also entering in the time evolutionequation for the impurity. The power and suitability of TDDFT for the dynamics ofliquid helium and droplets becomes apparent since the same formalism has allowed tocouple, with only small changes, the helium evolution with an adiabatically evolvingwavefunction,[14] a real-time evolving wavefunction,[15] o a moving classical particle withspin-orbit degrees of freedom.[10]
Chapter 2
Structure
2.1 Absorption spectrum of atomic impurities in isotopicmixtures of liquid helium
Resumen (Spanish)
El espectro de absorcion de impurezas atomicas en mezclas isotopicas de helio lıquido sedescribe en este trabajo mediante calculos basados en un formalismo del funcional dela densidad a temperatura cero. Se consideran dos casos: en el primero, el espectro deabsorcion de atomos de Na ligados a gotas de 4He1000–3HeN3 , con valores de N3 de 100 a3000 se presenta como caso de estudio de una impureza que no solvata en gotas de helio.En el segundo, el espectro de absorcion de atomos de Mg solvatados en mezclas isotopicasde 3He y 4He se presenta como caso de estudio de impureza disuelta en el lıquido uniforme.
Encontramos que el espectro de las impurezas se ve poco afectado por la composicionisotopica del entorno, y que depende basicamente de la cantidad de helio que tiene asu alrededor sin importar el isotopo. En el caso de mezclas de lıquido uniforme, losresultados se presentan en funcion de la presion para diferentes valores de concentracionde 3He. Los resultados para los lıquidos isotopicamente puros de 3He y 4He se comparancon los datos experimentales disponibles en la literatura.
5
PHYSICAL REVIEW B 83, 174505 (2011)
Absorption spectrum of atomic impurities in isotopic mixtures of liquid helium
David Mateo, Alberto Hernando, Manuel Barranco, Ricardo Mayol, and Martı PiDepartament ECM, Facultat de Fısica, and IN2UB, Universitat de Barcelona, Diagonal 647, 08028 Barcelona, Spain
(Received 7 February 2011; published 6 May 2011)
We theoretically describe the absorption spectrum of atomic impurities in isotopic mixtures of liquid heliumwithin a zero-temperature density functional approach. Two situations are considered. In the first one, theabsorption spectrum of Na atoms attached to 4He1000-3HeN3 droplets withN3 values from 100 to 3000 is presentedas a case study of an impurity that does not dissolve into helium droplets. In the second one, the absorptionspectrum of Mg atoms in liquid 3He-4He mixtures is presented as a case study of an impurity dissolved intoliquid helium. We have found that the absorption spectrum of the impurity is rather insensitive to the isotopiccomposition because the line shift is mostly affected by the total He density around the impurity, not by its actualcomposition. For bulk liquid mixtures, results are presented as a function of pressure at selected values of the 3Heconcentration. The results for isotopically pure 3He and 4He liquids doped with Mg are compared with availableexperimental data.
DOI: 10.1103/PhysRevB.83.174505 PACS number(s): 67.60.−g, 78.40.−q, 32.30.Jc
I. INTRODUCTION
The study of the absorption spectrum of impurities inliquid helium and its droplets has drawn considerable interestbecause it is a powerful tool to investigate the structure ofthe dopant-liquid complex, having become a classical fieldin optical spectroscopy. The optical properties of impuritiesin liquid 4He and its droplets have been reviewed in Refs. 1and 2, respectively.Electronic spectroscopy studies have been carried out for
atomic impurities in 4He, and to a lesser extent, in 3He.3–5
Only very recently, the electronic absorption spectrum of anatomic impurity—a Ca atom—in mixed 3He-4He dropletshas been reported and analyzed within density functional(DF) theory.6 A distinct feature of Ca atoms in mixedhelium droplets is that, depending on the size and isotopiccomposition of the droplet, it may reside at the 3He-4Heinterface. Therefore, one would expect that its electronicspectrum might shed light on the structure of that interface, asthis spectrum is affected by the liquid environment around theimpurity.Experiments on doped mixed droplets have to face the
serious problem of determining the actual composition ofthe system. This is not easy because of the large numberof atoms, mostly of 3He, that are evaporated off the dropletafter the dopant pick-up, altering the initial composition ofthe droplet in a way that is difficult to ascertain. The initialcomposition is not easy to determine either. In contrast,experiments in liquid mixtures may be carried out underwell-controlled conditions, fixing, e.g., the 3He concentrationx3 = N3/(N3 + N4) and particle density ρ = (N3 + N4)/V
and temperature (T ) of the mixture, which in turn determinethe total pressure (P ) throughout the equation of state of thefluid.In this work, we aim to study the effect of isotopic
composition on the absorption spectrum of atomic impuritiesin both finite (droplets) and extensive (liquid) helium systems.We present results for the 3p ← 3s transition of Na attachedto 3He-4He droplets, complementing those we have previouslypublished for Ca.6 It is well known experimentally7 and
theoretically8 that, because of the limited solubility of 3He in4He at low temperatures,9 mixed droplets have a core-shellstructure made of nearly pure 4He and 3He, respectively.Since Na atoms do not dissolve into helium droplets, thea priori most interesting situation is when the number of3He atoms, N3, is rather small as compared to that of4He, N4. Otherwise, the environment around Na is madeof pure 3He and one should not expect any difference withthe absorption spectrum of Na in isotopically pure 3Hedroplets.3
At variance with the droplet situation, 3He segregation inliquid helium mixtures at low temperatures only appears forconcentrations above a critical value that depends on pressure.9
Hence, it is plausible that the absorption spectrum couldbe sensitive to the x3 value of the mixture. To check thishypothesis, we present calculations of the absorption spectrumaround the 3s 3p 1P 1 ← 3s2 1S0 transition of Mg atoms inliquid helium mixtures for selected values of x3 and P .This work is organized as follows. In Sec. II, we briefly
recall the DF method used to obtain the structure of dopedhelium mixtures, drops, and bulk liquid as well, and theprocedure used to determine the absorption spectrum incor-porating shape fluctuations of the liquid bubble around thedopant. The absorption spectrum of Na in 4He1000-3HeN3droplets with N3 = 100 to 3000, and that of Mg in 3He-4He liquid mixtures for selected values of x3 and P , isdiscussed in Sec. III. Finally, a summary is presented inSec. IV.
II. METHOD
A. Density functional description of the ground stateof doped isotopic mixtures
The energy of the Na-droplet complex is written as afunctional of the Na wave function �(r), the 4He effectivemacroscopic wave function �(r) = √
ρ4(r), where ρ4(r) isthe 4He atomic density normalized to N4 atoms, and the3He particle and kinetic energy densities ρ3(r) (normalizedto N3 atoms) and τ3(r).10 We have used a Thomas-Fermi
174505-11098-0121/2011/83(17)/174505(8) ©2011 American Physical Society
6 CHAPTER 2. STRUCTURE
MATEO, HERNANDO, BARRANCO, MAYOL, AND PI PHYSICAL REVIEW B 83, 174505 (2011)
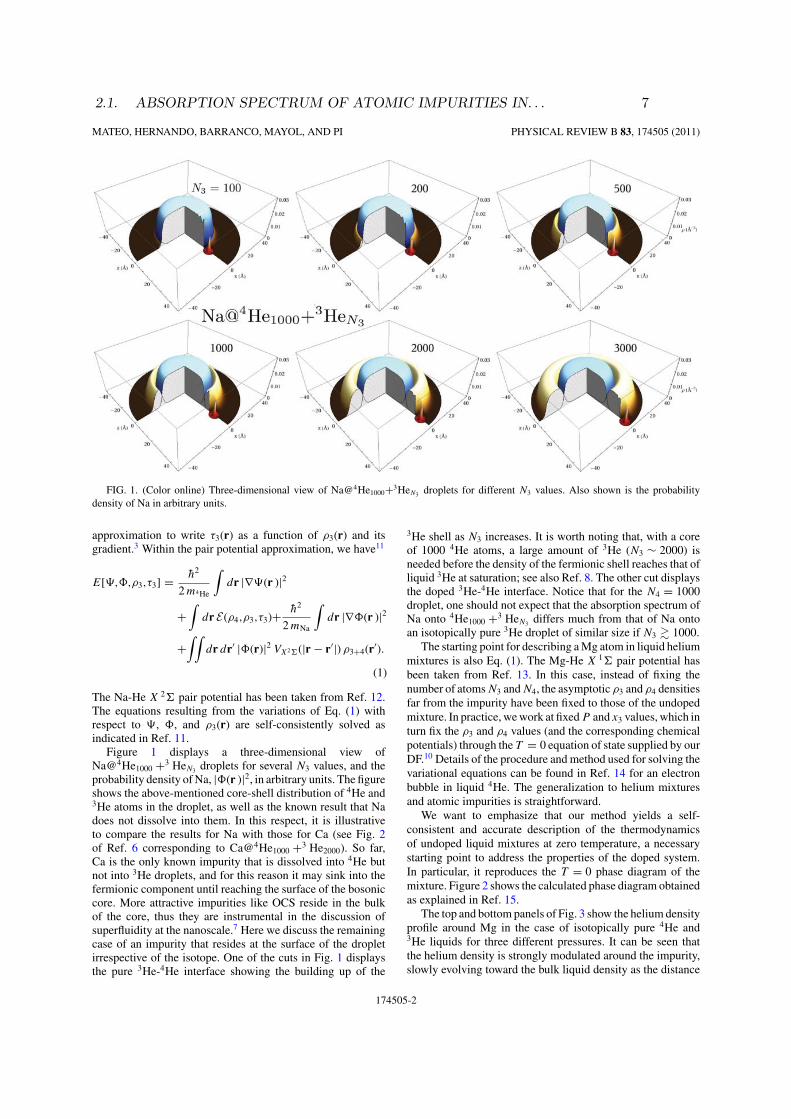
FIG. 1. (Color online) Three-dimensional view of Na@4He1000+3HeN3 droplets for different N3 values. Also shown is the probabilitydensity of Na in arbitrary units.
approximation to write τ3(r) as a function of ρ3(r) and itsgradient.3 Within the pair potential approximation, we have11
E[�,�,ρ3,τ3] = h2
2m4He
∫dr |∇�(r )|2
+∫
dr E(ρ4,ρ3,τ3)+ h2
2mNa
∫dr |∇�(r )|2
+∫∫
dr dr′ |�(r)|2 VX2�(|r − r′|) ρ3+4(r′).
(1)
The Na-He X 2� pair potential has been taken from Ref. 12.The equations resulting from the variations of Eq. (1) withrespect to �, �, and ρ3(r) are self-consistently solved asindicated in Ref. 11.Figure 1 displays a three-dimensional view of
Na@4He1000 +3 HeN3 droplets for several N3 values, and theprobability density ofNa, |�(r )|2, in arbitrary units. The figureshows the above-mentioned core-shell distribution of 4He and3He atoms in the droplet, as well as the known result that Nadoes not dissolve into them. In this respect, it is illustrativeto compare the results for Na with those for Ca (see Fig. 2of Ref. 6 corresponding to Ca@4He1000 +3 He2000). So far,Ca is the only known impurity that is dissolved into 4He butnot into 3He droplets, and for this reason it may sink into thefermionic component until reaching the surface of the bosoniccore. More attractive impurities like OCS reside in the bulkof the core, thus they are instrumental in the discussion ofsuperfluidity at the nanoscale.7 Here we discuss the remainingcase of an impurity that resides at the surface of the dropletirrespective of the isotope. One of the cuts in Fig. 1 displaysthe pure 3He-4He interface showing the building up of the
3He shell as N3 increases. It is worth noting that, with a coreof 1000 4He atoms, a large amount of 3He (N3 ∼ 2000) isneeded before the density of the fermionic shell reaches that ofliquid 3He at saturation; see also Ref. 8. The other cut displaysthe doped 3He-4He interface. Notice that for the N4 = 1000droplet, one should not expect that the absorption spectrum ofNa onto 4He1000 +3 HeN3 differs much from that of Na ontoan isotopically pure 3He droplet of similar size if N3 � 1000.The starting point for describing aMg atom in liquid helium
mixtures is also Eq. (1). The Mg-He X 1� pair potential hasbeen taken from Ref. 13. In this case, instead of fixing thenumber of atomsN3 andN4, the asymptotic ρ3 and ρ4 densitiesfar from the impurity have been fixed to those of the undopedmixture. In practice, wework at fixedP and x3 values, which inturn fix the ρ3 and ρ4 values (and the corresponding chemicalpotentials) through the T = 0 equation of state supplied by ourDF.10 Details of the procedure and method used for solving thevariational equations can be found in Ref. 14 for an electronbubble in liquid 4He. The generalization to helium mixturesand atomic impurities is straightforward.We want to emphasize that our method yields a self-
consistent and accurate description of the thermodynamicsof undoped liquid mixtures at zero temperature, a necessarystarting point to address the properties of the doped system.In particular, it reproduces the T = 0 phase diagram of themixture. Figure 2 shows the calculated phase diagram obtainedas explained in Ref. 15.The top and bottom panels of Fig. 3 show the helium density
profile around Mg in the case of isotopically pure 4He and3He liquids for three different pressures. It can be seen thatthe helium density is strongly modulated around the impurity,slowly evolving toward the bulk liquid density as the distance
174505-2
2.1. ABSORPTION SPECTRUM OF ATOMIC IMPURITIES IN. . . 7
ABSORPTION SPECTRUM OF ATOMIC IMPURITIES IN . . . PHYSICAL REVIEW B 83, 174505 (2011)
0
10
20
30
40
0 5 10 15 20
x3
(%)
Segregation Line
Spinodal Line
P (bar)
Stable
Metastable
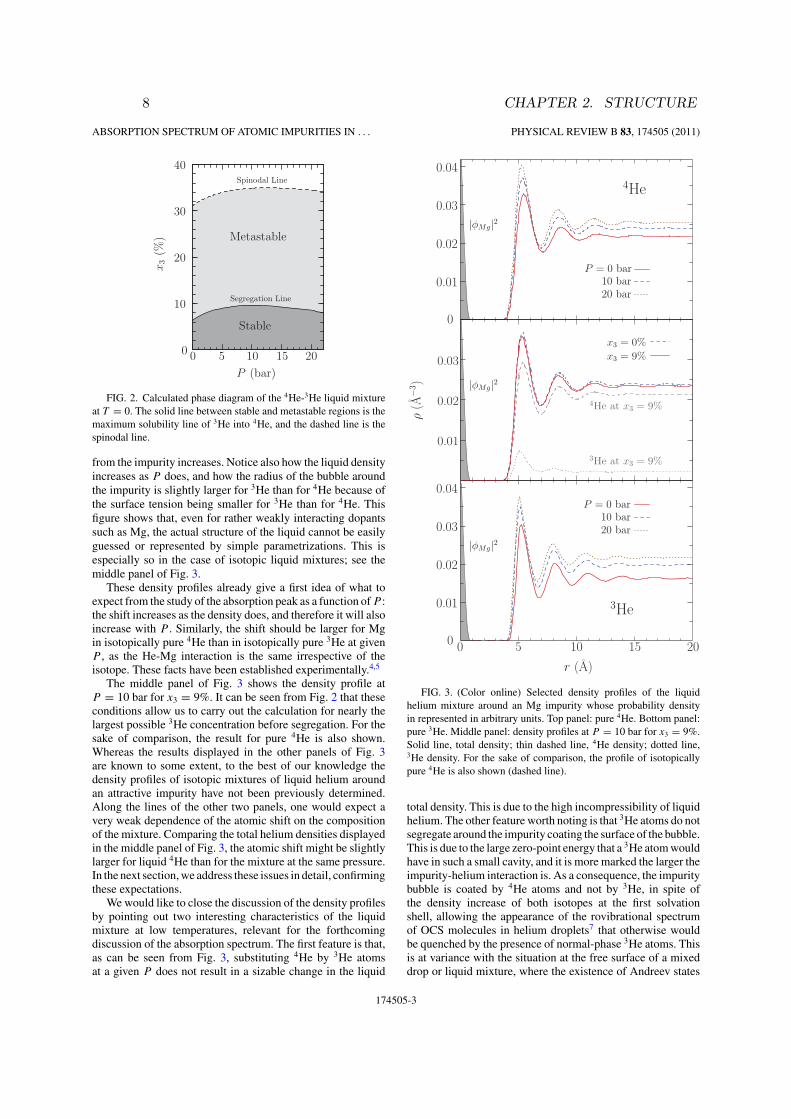
FIG. 2. Calculated phase diagram of the 4He-3He liquid mixtureat T = 0. The solid line between stable and metastable regions is themaximum solubility line of 3He into 4He, and the dashed line is thespinodal line.
from the impurity increases. Notice also how the liquid densityincreases as P does, and how the radius of the bubble aroundthe impurity is slightly larger for 3He than for 4He because ofthe surface tension being smaller for 3He than for 4He. Thisfigure shows that, even for rather weakly interacting dopantssuch as Mg, the actual structure of the liquid cannot be easilyguessed or represented by simple parametrizations. This isespecially so in the case of isotopic liquid mixtures; see themiddle panel of Fig. 3.These density profiles already give a first idea of what to
expect from the study of the absorption peak as a function ofP :the shift increases as the density does, and therefore it will alsoincrease with P . Similarly, the shift should be larger for Mgin isotopically pure 4He than in isotopically pure 3He at givenP , as the He-Mg interaction is the same irrespective of theisotope. These facts have been established experimentally.4,5
The middle panel of Fig. 3 shows the density profile atP = 10 bar for x3 = 9%. It can be seen from Fig. 2 that theseconditions allow us to carry out the calculation for nearly thelargest possible 3He concentration before segregation. For thesake of comparison, the result for pure 4He is also shown.Whereas the results displayed in the other panels of Fig. 3are known to some extent, to the best of our knowledge thedensity profiles of isotopic mixtures of liquid helium aroundan attractive impurity have not been previously determined.Along the lines of the other two panels, one would expect avery weak dependence of the atomic shift on the compositionof the mixture. Comparing the total helium densities displayedin the middle panel of Fig. 3, the atomic shift might be slightlylarger for liquid 4He than for the mixture at the same pressure.In the next section,we address these issues in detail, confirmingthese expectations.We would like to close the discussion of the density profiles
by pointing out two interesting characteristics of the liquidmixture at low temperatures, relevant for the forthcomingdiscussion of the absorption spectrum. The first feature is that,as can be seen from Fig. 3, substituting 4He by 3He atomsat a given P does not result in a sizable change in the liquid
0
0.01
0.02
0.03
0.04
r (A)
|φMg|2
0
0.01
0.02
0.03
0.04
P = 0 bar10 bar20 bar
4He
0.01
0.02
0.03
ρ(A−3
)
x3 = 0%
3He at x3 = 9%
4He at x3 = 9%
x3 = 9%
|φMg|2
3He
P = 0 bar10 bar20 bar
0 10 15 205
|φMg|2
FIG. 3. (Color online) Selected density profiles of the liquidhelium mixture around an Mg impurity whose probability densityin represented in arbitrary units. Top panel: pure 4He. Bottom panel:pure 3He. Middle panel: density profiles at P = 10 bar for x3 = 9%.Solid line, total density; thin dashed line, 4He density; dotted line,3He density. For the sake of comparison, the profile of isotopicallypure 4He is also shown (dashed line).
total density. This is due to the high incompressibility of liquidhelium. The other feature worth noting is that 3He atoms do notsegregate around the impurity coating the surface of the bubble.This is due to the large zero-point energy that a 3He atomwouldhave in such a small cavity, and it is more marked the larger theimpurity-helium interaction is. As a consequence, the impuritybubble is coated by 4He atoms and not by 3He, in spite ofthe density increase of both isotopes at the first solvationshell, allowing the appearance of the rovibrational spectrumof OCS molecules in helium droplets7 that otherwise wouldbe quenched by the presence of normal-phase 3He atoms. Thisis at variance with the situation at the free surface of a mixeddrop or liquid mixture, where the existence of Andreev states
174505-3
8 CHAPTER 2. STRUCTURE
MATEO, HERNANDO, BARRANCO, MAYOL, AND PI PHYSICAL REVIEW B 83, 174505 (2011)
bearing a large capacity of hosting 3He atoms makes possiblethe accumulation of this isotope at the surface.8
B. Absorption spectrum
To determine the absorption spectrum of an impurity atomembedded in a condensed system, it is customary to useLax’s method,16 together with the diatomics-in-moleculesapproach.17 This is basically the method we have followed,11
once the ground state (gs) of the dopant-helium mixture(droplet or bulk liquid) has been determined. The 2� and2� excited pair potentials for Na-He are from Ref. 18, and the1� and 1� ones for Mg-He are from Ref. 19. In the case ofNa, we have also considered the spin-orbit splitting.11
With only these ingredients, the model yields a gooddescription of the absorption energies—provided the pairpotentials are accurate enough—but the shape, especiallythe width, of the absorption line is poorly reproduced.The well-known reason for this drawback is the neglectof the coupling of the impurity dipole excitation to theshape fluctuations (modes) of the liquid cavity around it.Including this coupling in the calculation yields a muchbetter agreement with experiments. This is illustrated, e.g.,in Ref. 20 for Mg atoms in 4He droplets and in Ref. 21for electron bubbles in liquid 4He. Taking into account shapefluctuations is very cumbersome if the impurity bubble is notspherical. The situation is far more complex for liquid 3Heand mixtures because the modes of the cavity are difficult todetermine.Shape fluctuations are effortlessly calculated in quantum
Monte Carlo simulations of the absorption spectrum22–24
by taking advantage of the information carried out by thequantum “walkers.” Somewhat inspired by this atomiclikesimulation, an easy-to-implement method has been proposedwithin DF theory to include shape fluctuations, and it hasbeen applied to the case of Cs in liquid 4He,25 and was lateradapted to the droplet geometry.26,27 The extension to the caseof isotopic mixtures is straightforward, but for the sake ofcompleteness we present it here as applied to the case ofa Na impurity, outlining the method we have followed todetermine the absorption spectrum of an impurity in liquidhelium.The Born-Oppenheimer approximation allows the factor-
ization of the electronic and nuclear wave functions, andthe Franck-Condon approximation allows the positions of theatomic nuclei to remain frozen during the electronic transition.Within these approximations, the line shape for an electronictransition from the gs to an excited state (ex) is obtained as theFourier transform of the time-correlation function,
I (ω) ∝∑m
∫dte−i(ω+ωgs)t
∫d3r�gs∗e(it/h)H
exm �gs , (2)
where hωgs and �gs(r) are the eigenenergy and eigenfunctionof Na in its gs, respectively. The Hamiltonian is H ex
m = Tkin +V ex
m (r), where Tkin is the kinetic energy operator and V exm (r) is
the potential energy surface defined by the mth eigenvalueof the excited potential matrix V (r) = U (r)+ VSO, whereU (r) is the convolution of the excited pair potentials 2�
and 2� with the total helium density ρ(r), as the 3He- and4He-impurity pair potentials are the same, andVSO accounts for
the spin-orbit coupling.11 Introducing �gs(r) = ∑ν am
ν �mν (r)
in Eq. (2), where �mν (r) are the eigenfunctions of H ex
m andam
ν = ∫d3r �m
ν (r)∗�gs(r) are the Franck-Condon factors, we
obtain
I (ω) ∝∑m
∫dte−i(ω+ωgs)t
∑ν
∣∣amν
∣∣2eiωmν t
=∑m
∑ν
∣∣amν
∣∣2δ(ω + ωgs − ωmν
), (3)
where hωmν are the eigenvalues of H
exm .
If the Franck-Condon factors arise from the overlapbetween the gs and excited states with large quantum numbers,corresponding to the continuous or quasicontinuous spectrumof H ex
m , we can assume that 〈Tkin〉 � 〈V exm 〉, and the Hamil-
tonian is approximated by H exm ∼ V ex
m (r). Introducing thisapproximation in Eq. (2) and integrating over time, we getthe semiclassical expression for I (ω),
I (ω) ∝∑m
∫d3r|�gs(r)|2δ(ω − [V ex
m (r)/h − ωgs]) . (4)
We have evaluated this expression as follows. First, the heliumdistribution is stochastically represented by a large numberof configurations nc, of the order of 106. Each configurationconsists of a set of N positions for the He atoms in thesampling box and one for the impurity. These positions arerandomly generated by importance sampling techniques, usingthe DF helium density ρ(r)/N as the probability densitydistribution, plus a hard-sphere repulsion between He atomsto approximately take into account He-He correlations. Thediameter of the sphere has to be of the order of h = 2.18 Ato be consistent with the DF description of the liquid, as h isthe length used in the functional to screen the Lennard-Jonesinteraction between particles and to compute the coarse-grained density.10 We have chosen a density-dependent sphereradius of the form
Ri = R(ri) = h
2
(ρ0
ρ(ri)
)1/3, (5)
where ρ0 is the saturation density value and ρ is the coarse-grained density, defined as the averaged density over a sphereof radius h. Although this scaling has no effect in the bulk, it isfundamental to correctly reproducing the density in the dropletsurface region. The rationale for choosing this Ri is sketchedin the Appendix. Lastly, the position of the impurity is alsorandomly generated using |�gs(r)|2 as the probability densitydistribution.To determine the line shape, we obtain for each configu-
ration {j} the V exm {j} eigenvalues of the excited-state energy
matrix∑
i U (|r{j}i − r{j}
Na |)+ VSO [Eq. (16) of Ref. 11] andsubtract from them the pairwise sum of the gs pair potentialinteractions V gs{j} = ∑
i VX 2�(|r{j}i − r{j}
Na |) to obtain theexcitation energy. The histogram of the collected stochasticenergies is identified with the absorption spectrum, i.e.,
I (ω) ∝∑m
1
nc
nc∑{j}
δ[ω − (
V exm {j} − V gs{j})/h]
. (6)
In this way, we obtain the absorption spectrum of impuritiesin liquid helium including shape fluctuations. When this is the
174505-4
2.1. ABSORPTION SPECTRUM OF ATOMIC IMPURITIES IN. . . 9
ABSORPTION SPECTRUM OF ATOMIC IMPURITIES IN . . . PHYSICAL REVIEW B 83, 174505 (2011)
main source of broadening, as for impurities embedded in theliquid or in the bulk of drops, the method has proved to repro-duce fairly well the broadening of the absorption line, as weshow for Mg in Sec. III. Note that other sources of broadeningsuch as thermal wandering20 or droplet size distribution effectsmay have a sizable influence for impurities residing in the outersurface of the droplet, and they are not accounted for by thisprocedure.
III. ABSORPTION SPECTRUM RESULTS
A. Na in mixed helium droplets
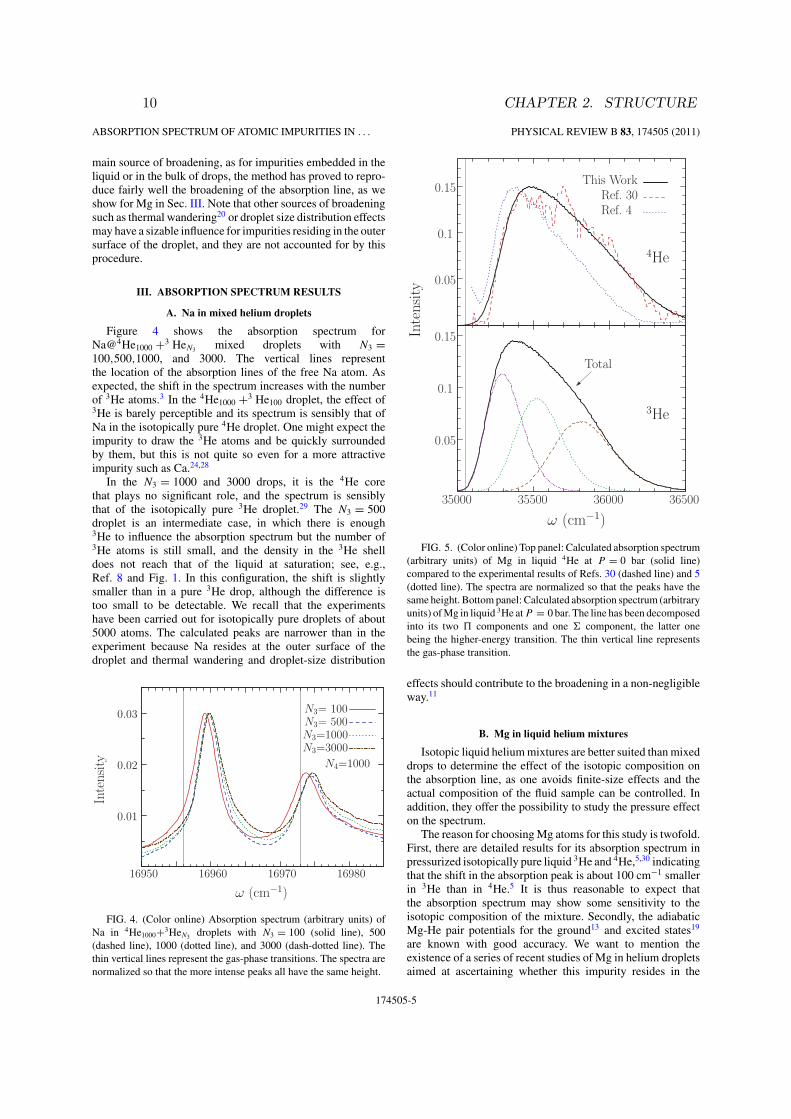
Figure 4 shows the absorption spectrum forNa@4He1000 +3 HeN3 mixed droplets with N3 =100,500,1000, and 3000. The vertical lines representthe location of the absorption lines of the free Na atom. Asexpected, the shift in the spectrum increases with the numberof 3He atoms.3 In the 4He1000 +3 He100 droplet, the effect of3He is barely perceptible and its spectrum is sensibly that ofNa in the isotopically pure 4He droplet. One might expect theimpurity to draw the 3He atoms and be quickly surroundedby them, but this is not quite so even for a more attractiveimpurity such as Ca.24,28
In the N3 = 1000 and 3000 drops, it is the 4He corethat plays no significant role, and the spectrum is sensiblythat of the isotopically pure 3He droplet.29 The N3 = 500droplet is an intermediate case, in which there is enough3He to influence the absorption spectrum but the number of3He atoms is still small, and the density in the 3He shelldoes not reach that of the liquid at saturation; see, e.g.,Ref. 8 and Fig. 1. In this configuration, the shift is slightlysmaller than in a pure 3He drop, although the difference istoo small to be detectable. We recall that the experimentshave been carried out for isotopically pure droplets of about5000 atoms. The calculated peaks are narrower than in theexperiment because Na resides at the outer surface of thedroplet and thermal wandering and droplet-size distribution
0.01
0.02
0.03
16950 16960 16970 16980
Inte
nsi
ty
ω (cm−1)
N3= 100N3= 500N3=1000N3=3000
N4=1000
FIG. 4. (Color online) Absorption spectrum (arbitrary units) ofNa in 4He1000+3HeN3 droplets with N3 = 100 (solid line), 500(dashed line), 1000 (dotted line), and 3000 (dash-dotted line). Thethin vertical lines represent the gas-phase transitions. The spectra arenormalized so that the more intense peaks all have the same height.
0.05
0.1
0.15
Inte
nsi
ty
0.05
0.1
0.15
35000 35500 36000 36500
ω (cm−1)
This WorkRef. 30Ref. 4
4He
3He
Total
FIG. 5. (Color online) Top panel: Calculated absorption spectrum(arbitrary units) of Mg in liquid 4He at P = 0 bar (solid line)compared to the experimental results of Refs. 30 (dashed line) and 5(dotted line). The spectra are normalized so that the peaks have thesame height. Bottompanel: Calculated absorption spectrum (arbitraryunits) ofMg in liquid 3He atP = 0 bar. The line has been decomposedinto its two � components and one � component, the latter onebeing the higher-energy transition. The thin vertical line representsthe gas-phase transition.
effects should contribute to the broadening in a non-negligibleway.11
B. Mg in liquid helium mixtures
Isotopic liquid heliummixtures are better suited thanmixeddrops to determine the effect of the isotopic composition onthe absorption line, as one avoids finite-size effects and theactual composition of the fluid sample can be controlled. Inaddition, they offer the possibility to study the pressure effecton the spectrum.The reason for choosingMg atoms for this study is twofold.
First, there are detailed results for its absorption spectrum inpressurized isotopically pure liquid 3He and 4He,5,30 indicatingthat the shift in the absorption peak is about 100 cm−1 smallerin 3He than in 4He.5 It is thus reasonable to expect thatthe absorption spectrum may show some sensitivity to theisotopic composition of the mixture. Secondly, the adiabaticMg-He pair potentials for the ground13 and excited states19
are known with good accuracy. We want to mention theexistence of a series of recent studies of Mg in helium dropletsaimed at ascertaining whether this impurity resides in the
174505-5
10 CHAPTER 2. STRUCTURE
MATEO, HERNANDO, BARRANCO, MAYOL, AND PI PHYSICAL REVIEW B 83, 174505 (2011)
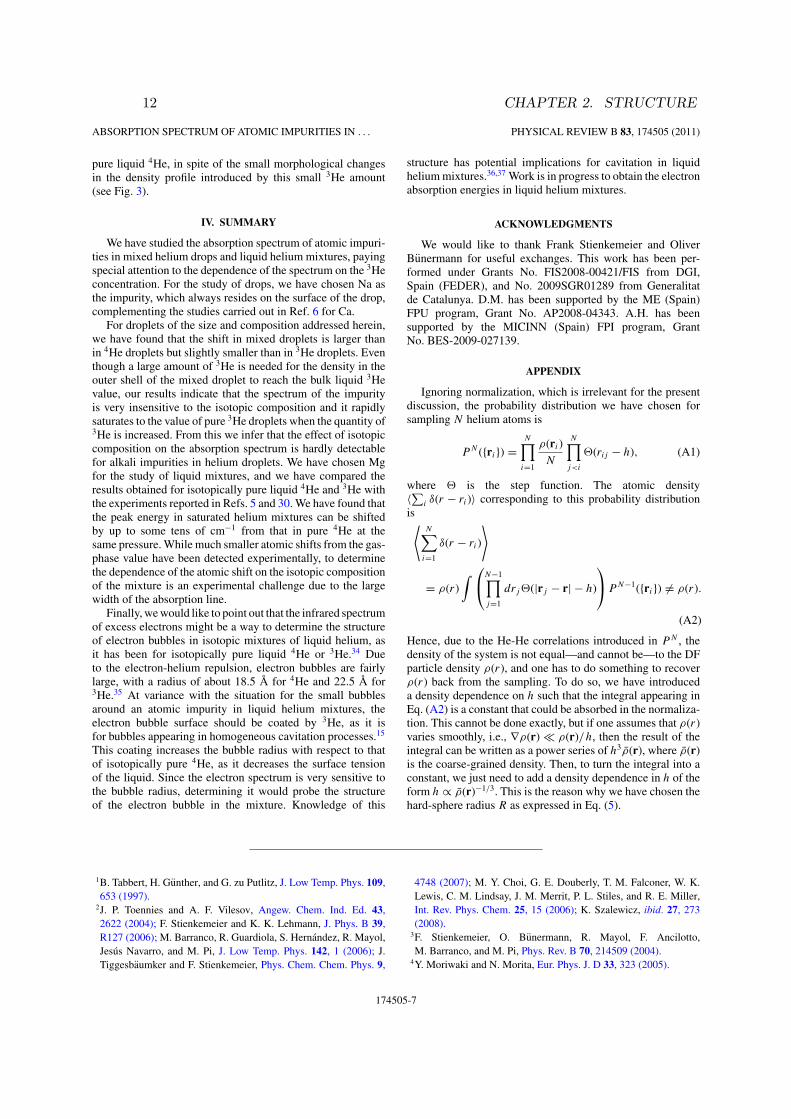
bulk or at the surface of 4He drops.19,20,31–33 Most studiespoint toward a sizable radial delocalization of Mg inside largedrops.In a first stage, we have computed the absorption spectrum
of Mg in isotopically pure liquid 4He and 3He. For the former,there are two inconsistent sets of experimental data obtainedby the same group, both of which are compared with ourcalculations in the top panel of Fig. 5. No detailed resultsfor the line shape in the case of 3He have been published forcomparison. We remind the reader that our calculations areat T = 0, whereas the experiments have been carried out at1.4 K.While our calculations compare very well with the ex-
perimental results for 4He in Ref. 30, they are blueshiftedwith respect to those of Ref. 5 for 4He and 3He as well.Despite this discrepancy, we have found, in agreement withthe experimental findings,5 that the shift is 0.77 nm largerin bulk 4He than in bulk 3He. This is an important checkto assure that the calculation may disclose effects associatedwith the isotopic composition of the liquid mixture, as shownbelow.The pressure dependence of the absorption spectrum of Mg
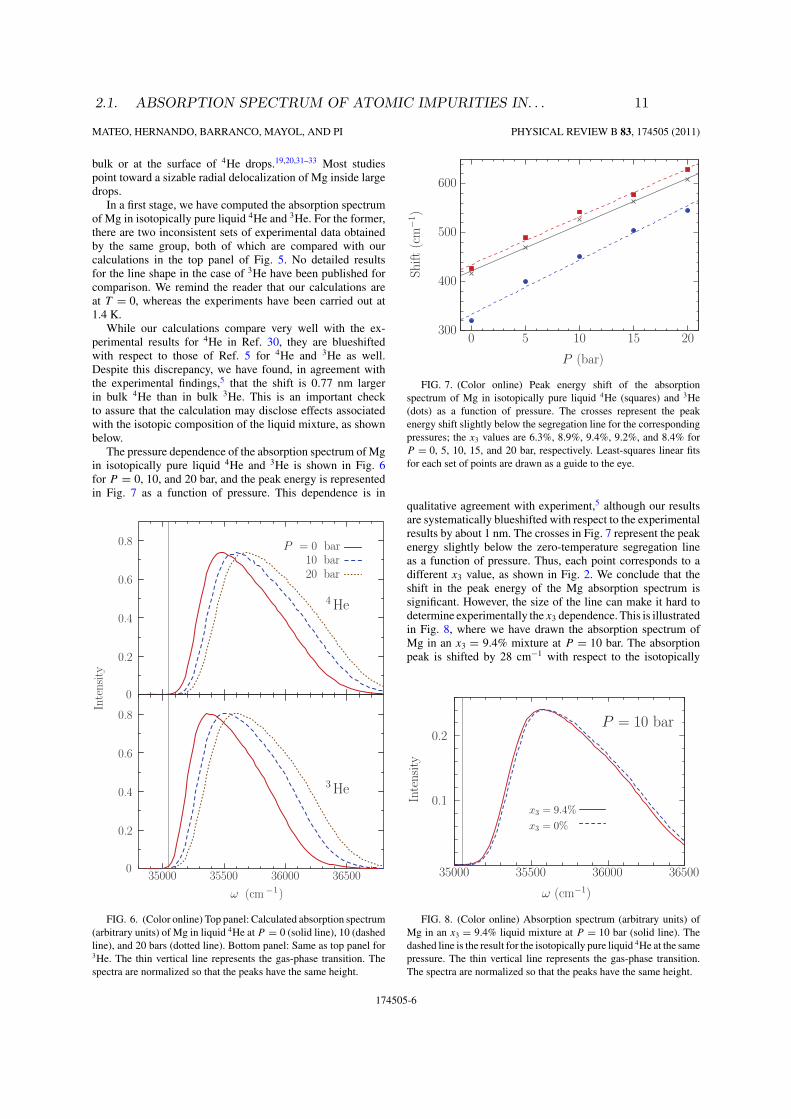
in isotopically pure liquid 4He and 3He is shown in Fig. 6for P = 0, 10, and 20 bar, and the peak energy is representedin Fig. 7 as a function of pressure. This dependence is in
0
0.2
0.4
0.6
0.8
0
0.2
0.4
0.6
0.8
35000 35500 36000 36500
Inte
nsi
ty
ω (cm −1)
P = 0 bar10 bar20 bar
4 He
3 He
FIG. 6. (Color online) Top panel: Calculated absorption spectrum(arbitrary units) of Mg in liquid 4He at P = 0 (solid line), 10 (dashedline), and 20 bars (dotted line). Bottom panel: Same as top panel for3He. The thin vertical line represents the gas-phase transition. Thespectra are normalized so that the peaks have the same height.
300
400
500
600
0 5 10 15 20
Shift
(cm−1
)
P (bar)
FIG. 7. (Color online) Peak energy shift of the absorptionspectrum of Mg in isotopically pure liquid 4He (squares) and 3He(dots) as a function of pressure. The crosses represent the peakenergy shift slightly below the segregation line for the correspondingpressures; the x3 values are 6.3%, 8.9%, 9.4%, 9.2%, and 8.4% forP = 0, 5, 10, 15, and 20 bar, respectively. Least-squares linear fitsfor each set of points are drawn as a guide to the eye.
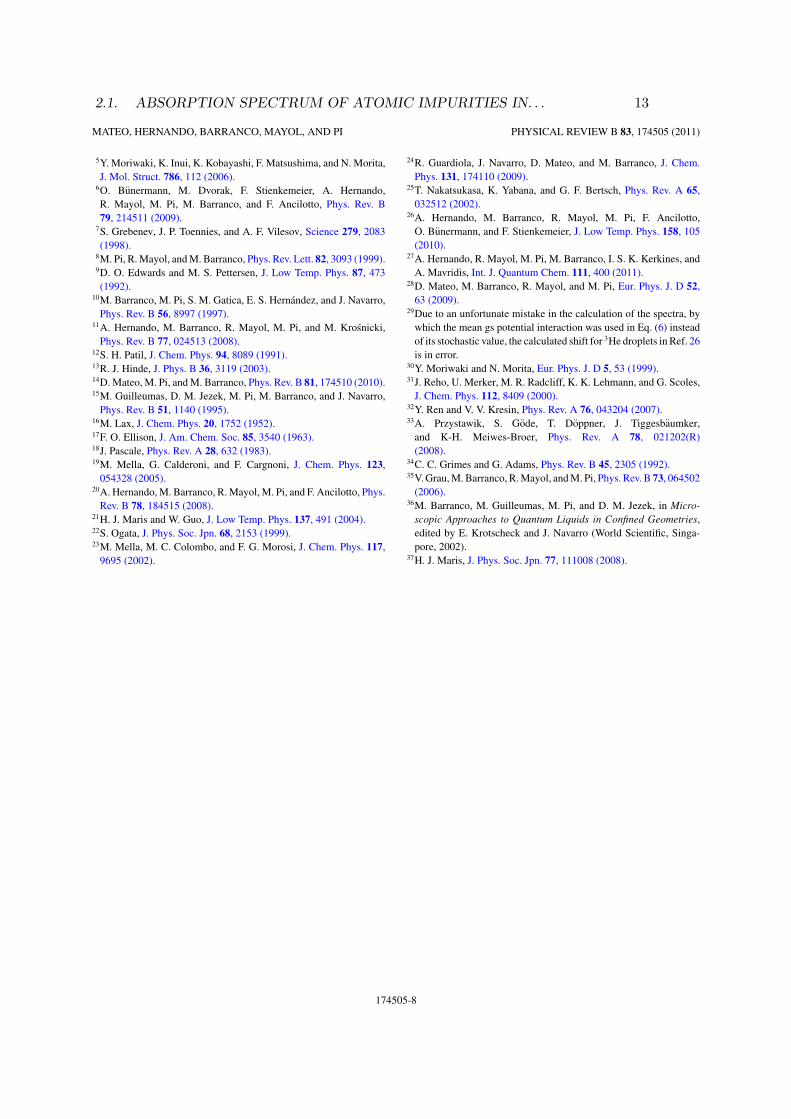
qualitative agreement with experiment,5 although our resultsare systematically blueshifted with respect to the experimentalresults by about 1 nm. The crosses in Fig. 7 represent the peakenergy slightly below the zero-temperature segregation lineas a function of pressure. Thus, each point corresponds to adifferent x3 value, as shown in Fig. 2. We conclude that theshift in the peak energy of the Mg absorption spectrum issignificant. However, the size of the line can make it hard todetermine experimentally the x3 dependence. This is illustratedin Fig. 8, where we have drawn the absorption spectrum ofMg in an x3 = 9.4% mixture at P = 10 bar. The absorptionpeak is shifted by 28 cm−1 with respect to the isotopically
0.2
35000 35500 36000 36500
Inte
nsi
ty
ω (cm−1)
x3 = 9.4%
x3 = 0%
P = 10 bar
0.1
FIG. 8. (Color online) Absorption spectrum (arbitrary units) ofMg in an x3 = 9.4% liquid mixture at P = 10 bar (solid line). Thedashed line is the result for the isotopically pure liquid 4He at the samepressure. The thin vertical line represents the gas-phase transition.The spectra are normalized so that the peaks have the same height.
174505-6
2.1. ABSORPTION SPECTRUM OF ATOMIC IMPURITIES IN. . . 11
ABSORPTION SPECTRUM OF ATOMIC IMPURITIES IN . . . PHYSICAL REVIEW B 83, 174505 (2011)
pure liquid 4He, in spite of the small morphological changesin the density profile introduced by this small 3He amount(see Fig. 3).
IV. SUMMARY
We have studied the absorption spectrum of atomic impuri-ties in mixed helium drops and liquid helium mixtures, payingspecial attention to the dependence of the spectrum on the 3Heconcentration. For the study of drops, we have chosen Na asthe impurity, which always resides on the surface of the drop,complementing the studies carried out in Ref. 6 for Ca.For droplets of the size and composition addressed herein,
we have found that the shift in mixed droplets is larger thanin 4He droplets but slightly smaller than in 3He droplets. Eventhough a large amount of 3He is needed for the density in theouter shell of the mixed droplet to reach the bulk liquid 3Hevalue, our results indicate that the spectrum of the impurityis very insensitive to the isotopic composition and it rapidlysaturates to the value of pure 3He droplets when the quantity of3He is increased. From this we infer that the effect of isotopiccomposition on the absorption spectrum is hardly detectablefor alkali impurities in helium droplets. We have chosen Mgfor the study of liquid mixtures, and we have compared theresults obtained for isotopically pure liquid 4He and 3He withthe experiments reported in Refs. 5 and 30.We have found thatthe peak energy in saturated helium mixtures can be shiftedby up to some tens of cm−1 from that in pure 4He at thesame pressure.While much smaller atomic shifts from the gas-phase value have been detected experimentally, to determinethe dependence of the atomic shift on the isotopic compositionof the mixture is an experimental challenge due to the largewidth of the absorption line.Finally,wewould like to point out that the infrared spectrum
of excess electrons might be a way to determine the structureof electron bubbles in isotopic mixtures of liquid helium, asit has been for isotopically pure liquid 4He or 3He.34 Dueto the electron-helium repulsion, electron bubbles are fairlylarge, with a radius of about 18.5 A for 4He and 22.5 A for3He.35 At variance with the situation for the small bubblesaround an atomic impurity in liquid helium mixtures, theelectron bubble surface should be coated by 3He, as it isfor bubbles appearing in homogeneous cavitation processes.15
This coating increases the bubble radius with respect to thatof isotopically pure 4He, as it decreases the surface tensionof the liquid. Since the electron spectrum is very sensitive tothe bubble radius, determining it would probe the structureof the electron bubble in the mixture. Knowledge of this
structure has potential implications for cavitation in liquidheliummixtures.36,37 Work is in progress to obtain the electronabsorption energies in liquid helium mixtures.
ACKNOWLEDGMENTS
We would like to thank Frank Stienkemeier and OliverBunermann for useful exchanges. This work has been per-formed under Grants No. FIS2008-00421/FIS from DGI,Spain (FEDER), and No. 2009SGR01289 from Generalitatde Catalunya. D.M. has been supported by the ME (Spain)FPU program, Grant No. AP2008-04343. A.H. has beensupported by the MICINN (Spain) FPI program, GrantNo. BES-2009-027139.
APPENDIX
Ignoring normalization, which is irrelevant for the presentdiscussion, the probability distribution we have chosen forsampling N helium atoms is
P N ({ri}) =N∏
i=1
ρ(ri)
N
N∏j<i
�(rij − h), (A1)
where � is the step function. The atomic density〈∑i δ(r − ri)〉 corresponding to this probability distributionis⟨
N∑i=1
δ(r − ri)
⟩
= ρ(r)∫ ⎛
⎝N−1∏j=1
drj�(|rj − r| − h)
⎞⎠P N−1({ri}) �= ρ(r).
(A2)
Hence, due to the He-He correlations introduced in P N , thedensity of the system is not equal—and cannot be—to the DFparticle density ρ(r), and one has to do something to recoverρ(r) back from the sampling. To do so, we have introduceda density dependence on h such that the integral appearing inEq. (A2) is a constant that could be absorbed in the normaliza-tion. This cannot be done exactly, but if one assumes that ρ(r)varies smoothly, i.e., ∇ρ(r) � ρ(r)/h, then the result of theintegral can be written as a power series of h3ρ(r), where ρ(r)is the coarse-grained density. Then, to turn the integral into aconstant, we just need to add a density dependence in h of theform h ∝ ρ(r)−1/3. This is the reason why we have chosen thehard-sphere radius R as expressed in Eq. (5).
1B. Tabbert, H. Gunther, and G. zu Putlitz, J. Low Temp. Phys. 109,653 (1997).2J. P. Toennies and A. F. Vilesov, Angew. Chem. Ind. Ed. 43,2622 (2004); F. Stienkemeier and K. K. Lehmann, J. Phys. B 39,R127 (2006); M. Barranco, R. Guardiola, S. Hernandez, R. Mayol,Jesus Navarro, and M. Pi, J. Low Temp. Phys. 142, 1 (2006); J.Tiggesbaumker and F. Stienkemeier, Phys. Chem. Chem. Phys. 9,
4748 (2007); M. Y. Choi, G. E. Douberly, T. M. Falconer, W. K.Lewis, C. M. Lindsay, J. M. Merrit, P. L. Stiles, and R. E. Miller,Int. Rev. Phys. Chem. 25, 15 (2006); K. Szalewicz, ibid. 27, 273(2008).3F. Stienkemeier, O. Bunermann, R. Mayol, F. Ancilotto,M. Barranco, and M. Pi, Phys. Rev. B 70, 214509 (2004).4Y. Moriwaki and N. Morita, Eur. Phys. J. D 33, 323 (2005).
174505-7
12 CHAPTER 2. STRUCTURE
MATEO, HERNANDO, BARRANCO, MAYOL, AND PI PHYSICAL REVIEW B 83, 174505 (2011)
5Y. Moriwaki, K. Inui, K. Kobayashi, F. Matsushima, and N. Morita,J. Mol. Struct. 786, 112 (2006).6O. Bunermann, M. Dvorak, F. Stienkemeier, A. Hernando,R. Mayol, M. Pi, M. Barranco, and F. Ancilotto, Phys. Rev. B79, 214511 (2009).7S. Grebenev, J. P. Toennies, and A. F. Vilesov, Science 279, 2083(1998).8M. Pi, R.Mayol, andM. Barranco, Phys. Rev. Lett. 82, 3093 (1999).9D. O. Edwards and M. S. Pettersen, J. Low Temp. Phys. 87, 473(1992).
10M. Barranco, M. Pi, S. M. Gatica, E. S. Hernandez, and J. Navarro,Phys. Rev. B 56, 8997 (1997).
11A. Hernando, M. Barranco, R. Mayol, M. Pi, and M. Krosnicki,Phys. Rev. B 77, 024513 (2008).
12S. H. Patil, J. Chem. Phys. 94, 8089 (1991).13R. J. Hinde, J. Phys. B 36, 3119 (2003).14D. Mateo, M. Pi, andM. Barranco, Phys. Rev. B 81, 174510 (2010).15M. Guilleumas, D. M. Jezek, M. Pi, M. Barranco, and J. Navarro,Phys. Rev. B 51, 1140 (1995).
16M. Lax, J. Chem. Phys. 20, 1752 (1952).17F. O. Ellison, J. Am. Chem. Soc. 85, 3540 (1963).18J. Pascale, Phys. Rev. A 28, 632 (1983).19M. Mella, G. Calderoni, and F. Cargnoni, J. Chem. Phys. 123,054328 (2005).
20A. Hernando,M. Barranco, R.Mayol, M. Pi, and F. Ancilotto, Phys.Rev. B 78, 184515 (2008).
21H. J. Maris and W. Guo, J. Low Temp. Phys. 137, 491 (2004).22S. Ogata, J. Phys. Soc. Jpn. 68, 2153 (1999).23M. Mella, M. C. Colombo, and F. G. Morosi, J. Chem. Phys. 117,9695 (2002).
24R. Guardiola, J. Navarro, D. Mateo, and M. Barranco, J. Chem.Phys. 131, 174110 (2009).
25T. Nakatsukasa, K. Yabana, and G. F. Bertsch, Phys. Rev. A 65,032512 (2002).
26A. Hernando, M. Barranco, R. Mayol, M. Pi, F. Ancilotto,O. Bunermann, and F. Stienkemeier, J. Low Temp. Phys. 158, 105(2010).
27A. Hernando, R. Mayol, M. Pi, M. Barranco, I. S. K. Kerkines, andA. Mavridis, Int. J. Quantum Chem. 111, 400 (2011).
28D. Mateo, M. Barranco, R. Mayol, and M. Pi, Eur. Phys. J. D 52,63 (2009).
29Due to an unfortunate mistake in the calculation of the spectra, bywhich the mean gs potential interaction was used in Eq. (6) insteadof its stochastic value, the calculated shift for 3He droplets in Ref. 26is in error.
30Y. Moriwaki and N. Morita, Eur. Phys. J. D 5, 53 (1999).31J. Reho, U. Merker, M. R. Radcliff, K. K. Lehmann, and G. Scoles,J. Chem. Phys. 112, 8409 (2000).
32Y. Ren and V. V. Kresin, Phys. Rev. A 76, 043204 (2007).33A. Przystawik, S. Gode, T. Doppner, J. Tiggesbaumker,and K-H. Meiwes-Broer, Phys. Rev. A 78, 021202(R)(2008).
34C. C. Grimes and G. Adams, Phys. Rev. B 45, 2305 (1992).35V.Grau,M.Barranco, R.Mayol, andM. Pi, Phys. Rev. B 73, 064502(2006).
36M. Barranco, M. Guilleumas, M. Pi, and D. M. Jezek, in Micro-scopic Approaches to Quantum Liquids in Confined Geometries,edited by E. Krotscheck and J. Navarro (World Scientific, Singa-pore, 2002).
37H. J. Maris, J. Phys. Soc. Jpn. 77, 111008 (2008).
174505-8
2.1. ABSORPTION SPECTRUM OF ATOMIC IMPURITIES IN. . . 13
14 CHAPTER 2. STRUCTURE
2.2 A density functional study of the structure of smallOCS@3HeN clusters
Resumen (Spanish)
La estructura de agregados con N = 1, 8, 18, y 40 atomos de 3He dopados con una molecu-la de OCS se ha calculado mediante un esquema Kohn-Sham del funcional de la densidad.El estado fundamental para N = 1 esta altamente localizado alrededor de la “cintura”de la molecula, y los excitados estan considerablemente mas deslocalizados. El agregadocon 8 atomos presenta una densidad apreciable en ambos extremos de la molecula lineary en la cintura. Con N = 18 la molecula pasa a estar completamente solvatada por 3He.Con N = 40 la densidad muestra dos capas de solvatacion completas con estructura masbien esferica. Una comparacion con calculos realizados para los mismos tamanos con4He muestra apreciables similitudes como la acumulacion alrededor de la cintura molecu-lar, pero tambien revela una estructura mas difusa y menos anisotropica en el caso del 3He.
Estos calculos se presentan en el contexto del analisis reciente del espectro infrarojodel OCS medido en grandes gotas de 3He puro.[13] El momento de inercia de la estructuraconstituida por 11 atomos, consistente con los datos experimentales, se encuentra entrelos momentos de inercia predichos en este trabajo para N = 8 y 18 atomos. En general,los calculos muestran que las gotas de 3He dopadas son ligeramente mas difusas y menosligadas que sus equivalentes de 4He.
THE JOURNAL OF CHEMICAL PHYSICS 138, 044321 (2013)
A density functional study of the structure of small OCS@3HeN clustersDavid Mateo,1 Martí Pi,1 Jesús Navarro,2 and J. Peter Toennies31Departament E.C.M., Facultat de Física, and IN2UB, Universitat de Barcelona, Diagonal 645, E-08028Barcelona, Spain2IFIC (CSIC-Universidad de Valencia), Apartado Postal 22085, E-46.071-Valencia, Spain3Max Planck Institut für Dynamik und Selbstorganisation, Am Fassberg 17, 37077 Göttingen, Germany
(Received 15 November 2012; accepted 2 January 2013; published online 31 January 2013)
Kohn-Sham density functional calculations are reported for the structures of clusters consisting of acarbonyl sulfide (OCS) molecule with N = 1, 8, 18, and 40 attached 3He atoms. The N = 1 clusterground state is highly localized at the molecular waist (donut ring position), but for higher levels ofexcitation becomes increasingly delocalized. The first magic cluster with 8 atoms has a significantdensity at both ends of the molecule in addition to the donut ring. With N = 18 3He atoms themolecule is enclosed by a magic number closed shell. Another magic stable structure consisting oftwo nearly isotropically spherical closed shells is found atN= 40. A comparison with calculations forthe same sized 4He clusters show some important similarities, e.g., pile up at the donut ring positionbut altogether a more diffuse, less anisotropic structure. These results are discussed in the light of therecently analyzed infrared spectra measured in large pure 3He droplets (N ≈ 1.2 × 10⁴) [B. Sartakov,J. P. Toennies, and A. F. Vilesov, J. Chem. Phys. 136, 134316 (2012)]. The moments of inertia of the11 atom spherical shell structure, which is consistent with the experimental spectrum, lies betweenthe predicted moments of inertia for N = 8 and N = 18 clusters. Overall the calculations reveal thatthe structures and energies of small doped 3He are only slightly more diffuse and less energetic thanthe same 4He clusters. © 2013 American Institute of Physics. [http://dx.doi.org/10.1063/1.4788828]
I. INTRODUCTION
In the course of the last two decades superfluid dropletsof 4He atoms have become established as very gentleand ultra-cold, nearly ideal matrix for high resolutionspectroscopy.1,2 One of the most surprising observations isthe appearance of well resolved rotational lines, as first ob-served for SF6 and carbonyl sulfide (OCS), indicating that themolecules rotate freely inside the droplets. This remarkablebehaviour has since been confirmed for more than 30 othersmall molecules and several clusters. Another important ob-servation made for heavy molecules like OCS embedded insuperfluid 4He droplets is the increase of the effective mo-ment of inertia (MOI) by about a factor 2.8 compared to thefree OCS molecule.3 The increased MOI can be explained bya symmetric donut ring of 4He atoms around the waist of theOCS molecule, which participate in the end-over-end rota-tions of the molecule. The ring consists of 5 atoms in the caseof small clusters with only that number of atoms.4–7 In largerclusters the evidence indicates that the donut ring consists of6 atoms.3,8, 9 Theory has identified the donut atoms as a non-superfluid fraction as opposed to the other surrounding super-fluid atoms which do not rotate with the molecule.10 Recentspectroscopic and theoretical studies of linear molecules, suchas CO2 and N2O, with N = 2 to 80 attached 4He atoms alsosuggest the presence of a donut ring around their waist.11, 12
The absence of the expected Q-branch in the ro-vibrationalspectrum of molecules in 4He droplets is consistent with thefact that the energy of axial rotations of the donut ring ofatoms is too large for excitation in the very cold droplets.The absence of Q-branches in small 4He doped clusters with
N = 2 to 80 atoms has also been explained in the same way.4
A similar explanation also applies to rings of 5 and 6 bosonicpH2 molecules.13 Thus the accumulation of particles in thedonut ring position appears to be a characteristic property ofbosons.
Fermionic 3He clusters and droplets are of even more ba-sic interest than those made up of 4He atoms since all nuclei,atoms, and molecules may be looked upon each as a specialtype of fermionic cluster and thus the understanding of theirinteractions is truly fundamental. Of all the fermions 3He isthe simplest neutral fermion with the twofold unique char-acteristic of occurring both in the thermodynamic limit as abulk liquid and as a finite-sized droplet. 3He droplets havebeen predicted to have temperatures of the order of 0.1 K14 asrecently confirmed experimentally15 and are therefore muchcolder than 4He droplets (0.37 K),16,17 but not cold enough tobe superfluid (Tc ∼ 3× 10⁻³ K). Thus 3He droplets were usedto test for the effect of superfluidity on the dynamical behaviorof the embedded chromophore molecule OCS.18 The broadunresolved spectrum observed in pure 3He droplets was inter-preted as evidence that the sharp rotational spectrum of thesame molecule in 4He droplets results from their being super-fluid. Subsequently it was suggested that it was not the lackof hydrodynamic superfluidity, but instead the strong couplingto the particle-hole excitations of the fermionic 3He bath, notpresent in bosonic 4He with its sharp phonon and roton dis-persion curve, that caused the line broadening.19
Very recently the infrared spectrum of OCS in large pure3He droplets reported in 199818 was fully analyzed.15 Theanalysis indicates that as with 4He droplets a Q-branch is mostlikely absent and that the effective moment of inertia is even
0021-9606/2013/138(4)/044321/8/$30.00 © 2013 American Institute of Physics138, 044321-1
Downloaded 06 Feb 2013 to 161.116.81.135. Redistribution subject to AIP license or copyright; see http://jcp.aip.org/about/rights_and_permissions
2.2. A DENSITY FUNCTIONAL STUDY OF THE STRUCTURE. . . 15
044321-2 Mateo et al. J. Chem. Phys. 138, 044321 (2013)
larger than in 4He droplets by a factor of two. Compared tothe free molecule the MOI is a factor 5.5 larger. The increasewas attributed to an evenly distributed shell of 11 3He atomssurrounding the chromophore.
Aside from the above infrared study, only a fewother spectroscopic experiments have been reported for 3Hedroplets all of which have been in the visible-UV region.20–26
These experiments have revealed changes in the line shiftsand widths of optical transitions of alkali atoms22,23 that aresmaller in 3He than in 4He droplets. For both isotopes theseshifts and widths are small since alkali atoms are located onthe surface of the droplets irrespective of the helium isotope.23
It has also been established that alkaline earth atoms heavierthan Mg reside on the surface of 4He droplets whereas they allreside in the interior of 3He droplets.25 One experiment has re-ported on the spectroscopy of Ca attached to mixed 3He-4Hedroplets,24 concluding that the Ca atom sits at the interfaceof both isotopes. In the only experiment involving embed-ded molecules the vibronic spectrum of glyoxal (C2H2O2) re-vealed a zero phonon line with a broad wing to the red due toparticle-hole pair excitations.26 A small sharp peak superim-posed on the wing was attributed to vibrations of the snowballshell of 3He surrounding the molecule.
Here we report on the first detailed calculations of thestructure and energy levels of small clusters of 3He atomsattached to the highly anisotropic OCS molecule. In thepast a number of density functional (DF) calculations havebeen reported for the radial density distribution of pure 3Hedroplets27–29 and the surface distortion produced by partlysolvated metal atoms.25,30, 31 The present calculations may belooked upon as an extension of earlier DF calculations forrare gas atoms and the spherical SF6 molecule, immersed inthe interior of small 3He clusters,32 to an anisotropic foreignmolecule.
The article starts with a description of the T = 0 densityfunctional theory used. For a single attached 3He atom theenergy levels for the 19 lowest bound states and the densitydistributions for the six lowest σ -states are calculated by solv-ing the Schrödinger equation. The Kohn-Sham energy levelsof the lowest occupied and some of the unoccupied statesindicate that unlike N = 6, the N = 8, 18, and 40 clustershave closed shells and correspond to the only magic numbersizes. The anisotropic density distributions are reported for N= 8, 18, and 40 and compared with similar calculations forthe same sized bosonic 4He clusters. As with the 4He atomsthere is an increase of the density at the donut position, butthe atoms are more uniformly distributed over the surface ofthe chromophore. The moments of inertia are analyzed andcompared and found to be reasonably consistent with the re-cent analysis of OCS rotational spectra in large 3He droplets.The article closes with a discussion of the differences betweenfermionic and bosonic clusters.
II. DENSITY FUNCTIONAL THEORY
The OCS-3HeN complex is analyzed here within a finite-range density functional framework. The main ingredients arethe He-OCS ab initio interaction potentials of Paesani and
Whaley5 and the density functional previously used33 to de-scribe pure 3He droplets. The axisymmetric He-OCS poten-tial energy surfaces reported by Paesani and Whaley were ob-tained from fourth-order Möller-Plesset perturbation theory.We used their VMP4eq potential, which corresponds to theOCS equilibrium geometry.5 This potential like all the otherpotentials has its global minimum perpendicular to the OCSaxis centered between the O and C atoms in what is calledthe donut ring position. Two other weaker local minima arelocated at the two ends of the linear molecule.
In the present calculations of OCS@3HeN complexesthe OCS molecule enters into the calculations only via theanisotropic OCS-He interaction, i.e., the molecule itself istreated as an external potential acting on the 3HeN droplet.Thus the total energy E of a complex is written as
E[ρ, τ ] =∫
dr {E(ρ, τ ) + VHe−OCS(r) ρ(r)} . (1)
In this expression E(ρ, τ ) is the 3He energy density functionalof Ref. 33, which is written in terms of the 3He particle andkinetic energy densities ρ(r) and τ (r) as
E(ρ, τ ) = ¯2
2m∗3(r)
τ (r) + 1
2cρ2(r)ργ (r)
+1
2
∫dr′ ρ(r)VLJ (|r − r′|)ρ(r′) . (2)
The first term is the kinetic energy with an effective 3He mass
m∗3(r) = m3
(1 − ρ(r)
ρc
)−2
, (3)
where ρc is a constant listed below and ρ(r) is a coarse-grained density as introduced in the study of classical fluids,34
defined by
ρ(r) =∫
dr′ ρ(r′)w(|r − r′|) , (4)
with
w(r) = 3
4πh3, r ≤ h,
= 0, r < h. (5)
The second term in Eq. (2) describes short-range correlationsand the third term is a truncated Lennard-Jones potential,which accounts for the long range interaction between the Heatoms
VLJ (r) = 4ε
[(σ
r
)12−
(σ
r
)6]
, r > h,
= 0, r ≤ h. (6)
The same parameter values obtained earlier were used:33 ρc
= 0.0406 Å−3, ε = 10.22 K, σ = 2.46 Å, γ = 2.1251,c = 1.55379 × 10⁶ K Å3+3∗γ , h = 2.1131 Å.
Downloaded 06 Feb 2013 to 161.116.81.135. Redistribution subject to AIP license or copyright; see http://jcp.aip.org/about/rights_and_permissions
16 CHAPTER 2. STRUCTURE
044321-3 Mateo et al. J. Chem. Phys. 138, 044321 (2013)
The 3He particle and kinetic energy densities ρ(r) andτ (r), respectively, are expressed in terms of the Kohn-Sham(KS) single-particle (s.p.) orbitals φi(r)
ρ(r) =∑
i
ni |φi(r)|2, (7)
τ (r) =∑
i
ni |∇φi(r)|2, (8)
where the ni are the occupation numbers. To account for spinpairing each of the φi(r) are occupied by two atoms. We haveself-consistently solved the Euler-Lagrange equations that re-sult from the variations of Eq. (1) with respect to the 3Henormalized s.p. orbitals
δ
δφ∗i
⎛⎝E[ρ, τ ] −
∑j
εj |φj |2⎞⎠ = 0, (9)
resulting in
−∇ ¯2
2m∗3
∇φi +{
δEδρ
+ VHe−OCS
}φi = εiφi, (10)
where εi is the ith 3He s.p. energy.Equation (10) has been solved by discretizing the deriva-
tives with 13-point formulas. An imaginary time method inconjunction with a Gram-Schmidt orthonormalization pro-cedure was employed to determine the eigenfunctions andeigenvalues.35 In previous investigations36,37 we chose towork in a three-dimensional cartesian grid, ignoring the ob-vious axial symmetry of the system. The rationale for thisprocedure is that the non-local terms in the functional—i.e.,convolution integrals—can be computed more efficiently insuch a grid using fast Fourier transform techniques.38 In thepresent case we have chosen a mixed approach in which theKS orbitals (and thus the particle and kinetic energy densi-ties) are computed in a two-dimensional, axially symmetricgrid with integration steps of �r = �z = 0.35 Å. We theninterpolate the values of the particle and kinetic energy den-sities to map the bidimensional cylindrical grid into a threedimensional cartesian one. This mixed approach is useful forfermionic systems where a large number of KS orbitals is in-volved but only the convolution of the total density is neededand it has the advantage that the computation is much fasterdue to the lower dimension of the grid. It also allows to as-sign a well-defined orbital angular momentum lz to every s.p.state, guaranteeing that states with different value of lz are or-thogonal; nevertheless a Gram-Schmidt procedure is requiredfor all states with the same lz value. Besides the twofold spindegeneracy of every s.p. state, we recall that the ±lz orbitalsare also doubly degenerate. Consequently, states with lz = 0are twofold spin degenerate and those with lz �= 0 are fourfolddegenerate. Throughout, Greek letters σ , π , δ. . . will be usedto denote states with |lz| = 0, 1, 2. . . .
Although the primary concern of this work is the descrip-tion of fermionic 3He complexes, it is interesting to makea comparison with the bosonic ones with the same numberof helium atoms and calculated along similar lines. To thisend, we have used a slightly modified version of the Orsay-Trento (OT) functional,39 usually employed for 4He droplets.
The original OT functional contains two terms of the formρρ2 and ρρ3, which look similar to the term ρ2ργ enteringthe density functional for 3He given in Eq. (2), except that thelatter contains a squared bare density ρ2 in place of a linearbare density. This makes some difference for doped heliumclusters, since a “squared” density term yields stable resultswhereas for very attractive impurities a “linear” one does not.Consequently, we have replaced the two mentioned terms bythe new ones ρ2ρ and ρ2ρ2, keeping the same original param-eters. This modified OT functional has also been successfullyused for studying the solvation of several ionic impurities inbulk liquid 4He.40
We restrict our cluster calculations to the sizes N = 6,8, 18, and 40 of which the last three were found to be theonly closed shell magic numbers in this size region along withN = 2, which we decided not to include because of thelarge error introduced by the self-interaction in such a smallcluster. The same magic numbers were found earlier for thestrongly interacting spherical noble gas atoms Kr and Xe andfor SF6.32 For the less strongly interacting atoms Ne and Aran additional magic number was found with N = 20. Thesemagic clusters are characterized by the existence of a clearenergy gap between the last occupied and the first unoccupiedlevels, so that the Fermi energy can be unambiguously definedas the highest single-particle energy of the occupied orbitals.In that case the density of the cluster is represented by a singleSlater determinant of Kohn-Sham orbitals. Non-magic clus-ters are instead characterized by a quasi-degeneracy of thehighest occupied and lowest unoccupied single particle lev-els, so that there is some ambiguity in the attribution of theoccupied levels.
III. RESULTS
A. Energies and densities of the OCS-3He dimer
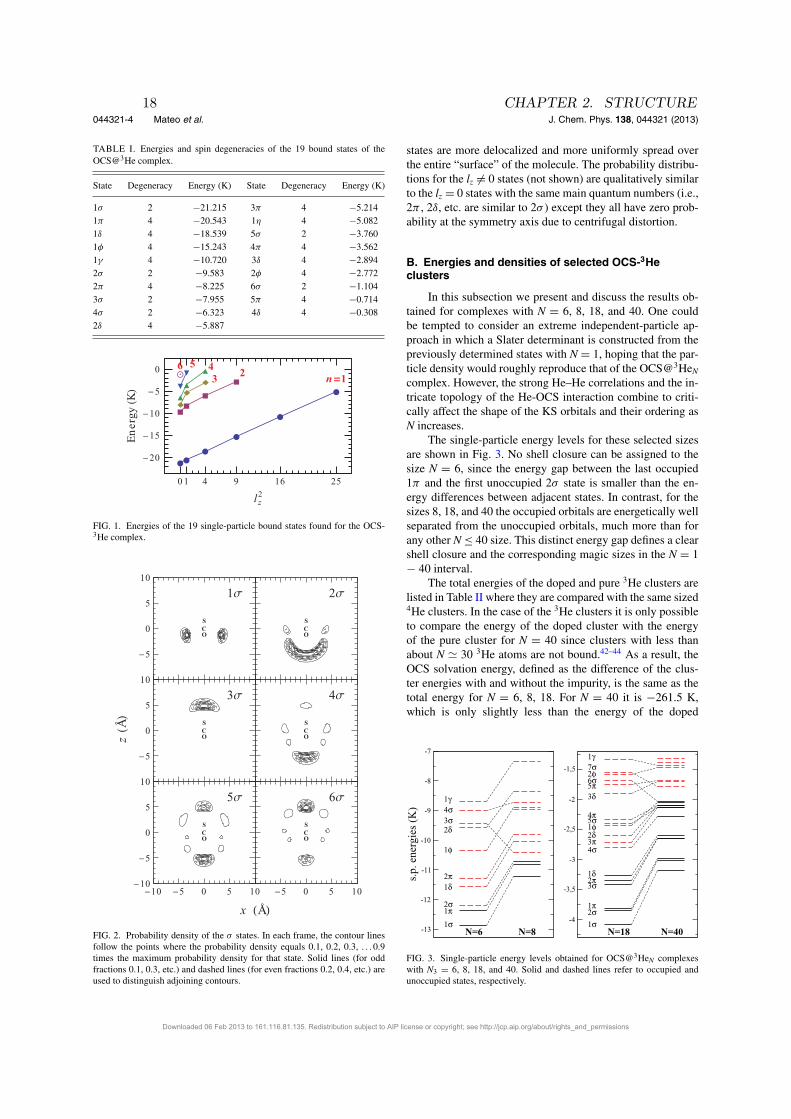
As a first step towards understanding the OCS@3HeNclusters, we discuss first the N = 1 case. With only a sin-gle 3He atom the structure provides insight into the effect ofthe large zero point energy of the light particle on its local-ization in the anisotropic potential. The Schrödinger equationfor a 3He atom in the anisotropic OCS-3He interaction poten-tial was solved numerically. There are only 19 bound levels,whose energies are listed in Table I. Because of the spin- andlz-degeneracy mentioned above the 19 levels correspond toaltogether 64 bound states. The energy levels are plotted inFig. 1 as a function of l2z . The first band of n = 1 states in-creases linearly with l2z , as expected for the increased rota-tional energies of the highly localized ring-shaped bands.41
For n > 1 the curves bend over with increasing l2z .The probability density distribution of the σ states is
shown in Fig. 2. The first three states are situated in each ofthe three lowest minima of the anisotropic potential. The 1σstate is highly localized at the global minimum in the donutring position between the O and C atoms. The next highest 2σstate is spread out at the O end of the molecule over a wideangular range corresponding to the wide potential minimum.5
The 3σ state is more localized in the narrow angular regionof the slightly deeper well at the S end. The higher energy σ
Downloaded 06 Feb 2013 to 161.116.81.135. Redistribution subject to AIP license or copyright; see http://jcp.aip.org/about/rights_and_permissions
2.2. A DENSITY FUNCTIONAL STUDY OF THE STRUCTURE. . . 17
044321-4 Mateo et al. J. Chem. Phys. 138, 044321 (2013)
TABLE I. Energies and spin degeneracies of the 19 bound states of theOCS@3He complex.
State Degeneracy Energy (K) State Degeneracy Energy (K)
1σ 2 −21.215 3π 4 −5.2141π 4 −20.543 1η 4 −5.0821δ 4 −18.539 5σ 2 −3.7601φ 4 −15.243 4π 4 −3.5621γ 4 −10.720 3δ 4 −2.8942σ 2 −9.583 2φ 4 −2.7722π 4 −8.225 6σ 2 −1.1043σ 2 −7.955 5π 4 −0.7144σ 2 −6.323 4δ 4 −0.3082δ 4 −5.887
0 1 4 9 16 25
0
5
10
15
20
l z2
Energy
K
n 123456
FIG. 1. Energies of the 19 single-particle bound states found for the OCS-3He complex.
OCS
1Σ
OCS
3Σ
OCS
5Σ
OCS
2Σ
OCS
4Σ
OCS
6Σ
10 5 0 5 10 5 0 5 1010
5
0
5
10
5
0
5
10
5
0
5
10
x Å
zÅ
FIG. 2. Probability density of the σ states. In each frame, the contour linesfollow the points where the probability density equals 0.1, 0.2, 0.3, . . . 0.9times the maximum probability density for that state. Solid lines (for oddfractions 0.1, 0.3, etc.) and dashed lines (for even fractions 0.2, 0.4, etc.) areused to distinguish adjoining contours.
states are more delocalized and more uniformly spread overthe entire “surface” of the molecule. The probability distribu-tions for the lz �= 0 states (not shown) are qualitatively similarto the lz = 0 states with the same main quantum numbers (i.e.,2π , 2δ, etc. are similar to 2σ ) except they all have zero prob-ability at the symmetry axis due to centrifugal distortion.
B. Energies and densities of selected OCS-3Heclusters
In this subsection we present and discuss the results ob-tained for complexes with N = 6, 8, 18, and 40. One couldbe tempted to consider an extreme independent-particle ap-proach in which a Slater determinant is constructed from thepreviously determined states with N = 1, hoping that the par-ticle density would roughly reproduce that of the OCS@3HeNcomplex. However, the strong He–He correlations and the in-tricate topology of the He-OCS interaction combine to criti-cally affect the shape of the KS orbitals and their ordering asN increases.
The single-particle energy levels for these selected sizesare shown in Fig. 3. No shell closure can be assigned to thesize N = 6, since the energy gap between the last occupied1π and the first unoccupied 2σ state is smaller than the en-ergy differences between adjacent states. In contrast, for thesizes 8, 18, and 40 the occupied orbitals are energetically wellseparated from the unoccupied orbitals, much more than forany other N ≤ 40 size. This distinct energy gap defines a clearshell closure and the corresponding magic sizes in the N = 1− 40 interval.
The total energies of the doped and pure 3He clusters arelisted in Table II where they are compared with the same sized4He clusters. In the case of the 3He clusters it is only possibleto compare the energy of the doped cluster with the energyof the pure cluster for N = 40 since clusters with less thanabout N � 30 3He atoms are not bound.42–44 As a result, theOCS solvation energy, defined as the difference of the clus-ter energies with and without the impurity, is the same as thetotal energy for N = 6, 8, 18. For N = 40 it is −261.5 K,which is only slightly less than the energy of the doped
-13
-12
-11
-10
-9
-8
-7
s.p.
ene
rgie
s (K
)
-4
-3,5
-3
-2,5
-2
-1,5
N=18 N=401σ2σ1π
3σ2π1δ
4σ3π2δ1φ5σ4π
3δ5π6σ2φ7σ1γ
1σ1π2σ
1δ2π
1φ
2δ3σ4σ1γ
N=6 N=8
FIG. 3. Single-particle energy levels obtained for OCS@3HeN complexeswith N3 = 6, 8, 18, and 40. Solid and dashed lines refer to occupied andunoccupied states, respectively.
Downloaded 06 Feb 2013 to 161.116.81.135. Redistribution subject to AIP license or copyright; see http://jcp.aip.org/about/rights_and_permissions
18 CHAPTER 2. STRUCTURE
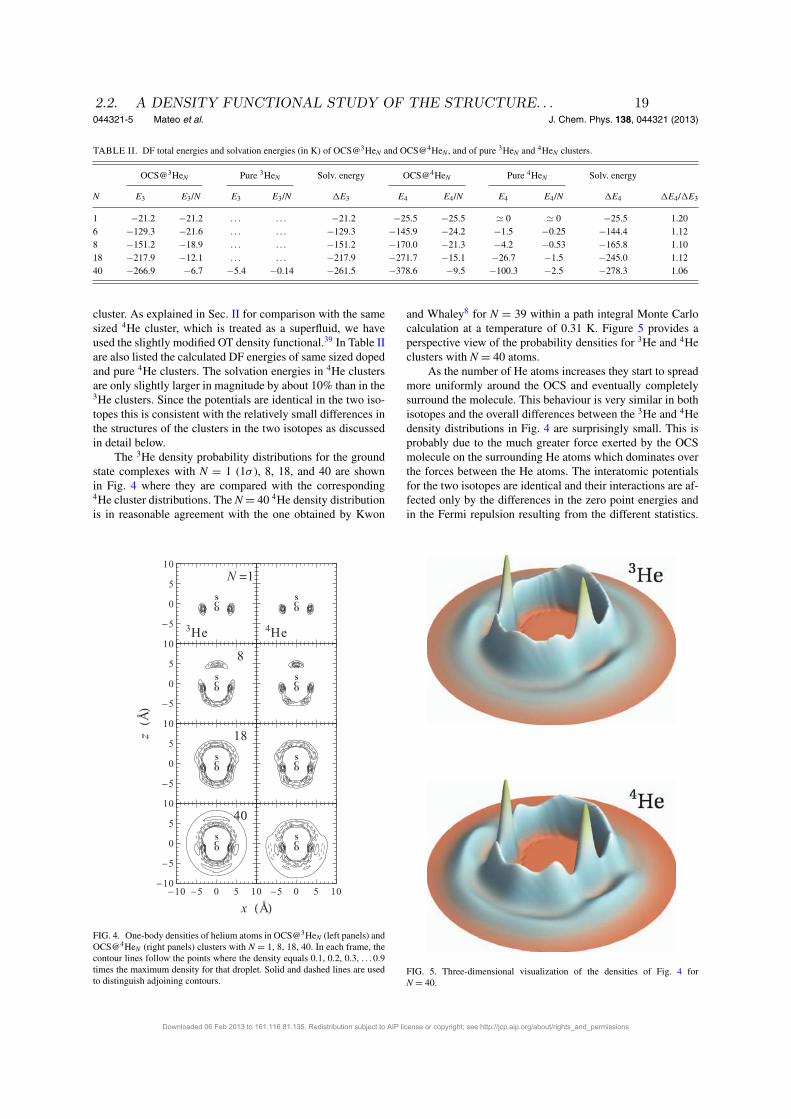
044321-5 Mateo et al. J. Chem. Phys. 138, 044321 (2013)
TABLE II. DF total energies and solvation energies (in K) of OCS@3HeN and OCS@4HeN, and of pure 3HeN and 4HeN clusters.
OCS@3HeN Pure 3HeN Solv. energy OCS@4HeN Pure 4HeN Solv. energy
N E3 E3/N E3 E3/N �E3 E4 E4/N E4 E4/N �E4 �E4/�E3
1 −21.2 −21.2 . . . . . . −21.2 −25.5 −25.5 � 0 � 0 −25.5 1.206 −129.3 −21.6 . . . . . . −129.3 −145.9 −24.2 −1.5 −0.25 −144.4 1.128 −151.2 −18.9 . . . . . . −151.2 −170.0 −21.3 −4.2 −0.53 −165.8 1.1018 −217.9 −12.1 . . . . . . −217.9 −271.7 −15.1 −26.7 −1.5 −245.0 1.1240 −266.9 −6.7 −5.4 −0.14 −261.5 −378.6 −9.5 −100.3 −2.5 −278.3 1.06
cluster. As explained in Sec. II for comparison with the samesized 4He cluster, which is treated as a superfluid, we haveused the slightly modified OT density functional.39 In Table IIare also listed the calculated DF energies of same sized dopedand pure 4He clusters. The solvation energies in 4He clustersare only slightly larger in magnitude by about 10% than in the3He clusters. Since the potentials are identical in the two iso-topes this is consistent with the relatively small differences inthe structures of the clusters in the two isotopes as discussedin detail below.
The 3He density probability distributions for the groundstate complexes with N = 1 (1σ ), 8, 18, and 40 are shownin Fig. 4 where they are compared with the corresponding4He cluster distributions. The N = 40 4He density distributionis in reasonable agreement with the one obtained by Kwon
OCS
N 1
3He
OCS
8
OCS
18
OCS
40
OCS
4He
OCS
OCS
OCS
10 5 0 5 10 5 0 5 1010
5
0
5
10
5
0
5
10
5
0
5
10
5
0
5
10
x Å
zÅ
FIG. 4. One-body densities of helium atoms in OCS@3HeN (left panels) andOCS@4HeN (right panels) clusters with N = 1, 8, 18, 40. In each frame, thecontour lines follow the points where the density equals 0.1, 0.2, 0.3, . . . 0.9times the maximum density for that droplet. Solid and dashed lines are usedto distinguish adjoining contours.
and Whaley8 for N = 39 within a path integral Monte Carlocalculation at a temperature of 0.31 K. Figure 5 provides aperspective view of the probability densities for 3He and 4Heclusters with N = 40 atoms.
As the number of He atoms increases they start to spreadmore uniformly around the OCS and eventually completelysurround the molecule. This behaviour is very similar in bothisotopes and the overall differences between the 3He and 4Hedensity distributions in Fig. 4 are surprisingly small. This isprobably due to the much greater force exerted by the OCSmolecule on the surrounding He atoms which dominates overthe forces between the He atoms. The interatomic potentialsfor the two isotopes are identical and their interactions are af-fected only by the differences in the zero point energies andin the Fermi repulsion resulting from the different statistics.
FIG. 5. Three-dimensional visualization of the densities of Fig. 4 forN = 40.
Downloaded 06 Feb 2013 to 161.116.81.135. Redistribution subject to AIP license or copyright; see http://jcp.aip.org/about/rights_and_permissions
2.2. A DENSITY FUNCTIONAL STUDY OF THE STRUCTURE. . . 19
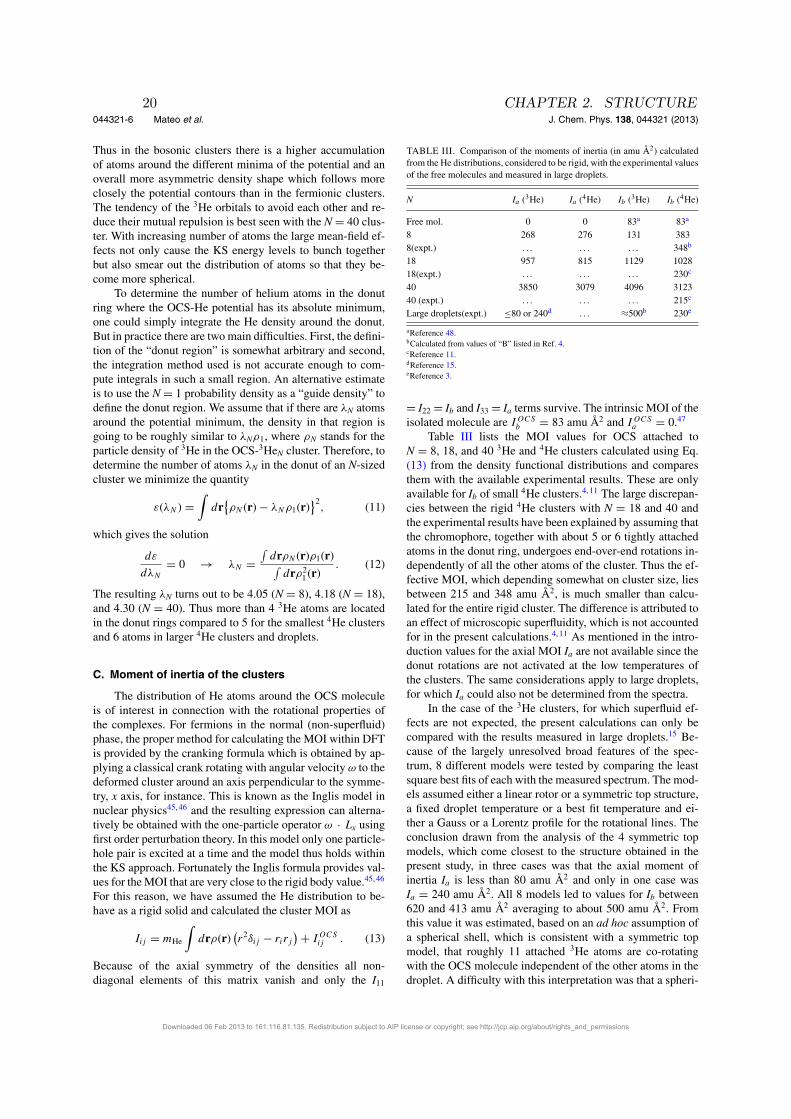
044321-6 Mateo et al. J. Chem. Phys. 138, 044321 (2013)
Thus in the bosonic clusters there is a higher accumulationof atoms around the different minima of the potential and anoverall more asymmetric density shape which follows moreclosely the potential contours than in the fermionic clusters.The tendency of the 3He orbitals to avoid each other and re-duce their mutual repulsion is best seen with the N = 40 clus-ter. With increasing number of atoms the large mean-field ef-fects not only cause the KS energy levels to bunch togetherbut also smear out the distribution of atoms so that they be-come more spherical.
To determine the number of helium atoms in the donutring where the OCS-He potential has its absolute minimum,one could simply integrate the He density around the donut.But in practice there are two main difficulties. First, the defini-tion of the “donut region” is somewhat arbitrary and second,the integration method used is not accurate enough to com-pute integrals in such a small region. An alternative estimateis to use the N = 1 probability density as a “guide density” todefine the donut region. We assume that if there are λN atomsaround the potential minimum, the density in that region isgoing to be roughly similar to λNρ1, where ρN stands for theparticle density of 3He in the OCS-3HeN cluster. Therefore, todetermine the number of atoms λN in the donut of an N-sizedcluster we minimize the quantity
ε(λN ) =∫
dr{ρN (r) − λNρ1(r)
}2, (11)
which gives the solution
dε
dλN
= 0 → λN =∫
drρN (r)ρ1(r)∫drρ2
1 (r). (12)
The resulting λN turns out to be 4.05 (N = 8), 4.18 (N = 18),and 4.30 (N = 40). Thus more than 4 3He atoms are locatedin the donut rings compared to 5 for the smallest 4He clustersand 6 atoms in larger 4He clusters and droplets.
C. Moment of inertia of the clusters
The distribution of He atoms around the OCS moleculeis of interest in connection with the rotational properties ofthe complexes. For fermions in the normal (non-superfluid)phase, the proper method for calculating the MOI within DFTis provided by the cranking formula which is obtained by ap-plying a classical crank rotating with angular velocity ω to thedeformed cluster around an axis perpendicular to the symme-try, x axis, for instance. This is known as the Inglis model innuclear physics45,46 and the resulting expression can alterna-tively be obtained with the one-particle operator ω · Lx usingfirst order perturbation theory. In this model only one particle-hole pair is excited at a time and the model thus holds withinthe KS approach. Fortunately the Inglis formula provides val-ues for theMOI that are very close to the rigid body value.45,46
For this reason, we have assumed the He distribution to be-have as a rigid solid and calculated the cluster MOI as
Iij = mHe
∫drρ(r)
(r2δij − rirj
) + IOCSij . (13)
Because of the axial symmetry of the densities all non-diagonal elements of this matrix vanish and only the I11
TABLE III. Comparison of the moments of inertia (in amu Å2) calculatedfrom the He distributions, considered to be rigid, with the experimental valuesof the free molecules and measured in large droplets.
N Ia (3He) Ia (4He) Ib (3He) Ib (4He)
Free mol. 0 0 83a 83a
8 268 276 131 3838(expt.) . . . . . . . . . 348b
18 957 815 1129 102818(expt.) . . . . . . . . . 230c
40 3850 3079 4096 312340 (expt.) . . . . . . . . . 215c
Large droplets(expt.) ≤80 or 240d . . . ≈500b 230e
aReference 48.bCalculated from values of “B” listed in Ref. 4.cReference 11.dReference 15.eReference 3.
= I22 = Ib and I33 = Ia terms survive. The intrinsic MOI of theisolated molecule are IOCS
b = 83 amu Å2 and IOCSa = 0.47
Table III lists the MOI values for OCS attached toN = 8, 18, and 40 3He and 4He clusters calculated using Eq.(13) from the density functional distributions and comparesthem with the available experimental results. These are onlyavailable for Ib of small 4He clusters.4, 11 The large discrepan-cies between the rigid 4He clusters with N = 18 and 40 andthe experimental results have been explained by assuming thatthe chromophore, together with about 5 or 6 tightly attachedatoms in the donut ring, undergoes end-over-end rotations in-dependently of all the other atoms of the cluster. Thus the ef-fective MOI, which depending somewhat on cluster size, liesbetween 215 and 348 amu Å2, is much smaller than calcu-lated for the entire rigid cluster. The difference is attributed toan effect of microscopic superfluidity, which is not accountedfor in the present calculations.4, 11 As mentioned in the intro-duction values for the axial MOI Ia are not available since thedonut rotations are not activated at the low temperatures ofthe clusters. The same considerations apply to large droplets,for which Ia could also not be determined from the spectra.
In the case of the 3He clusters, for which superfluid ef-fects are not expected, the present calculations can only becompared with the results measured in large droplets.15 Be-cause of the largely unresolved broad features of the spec-trum, 8 different models were tested by comparing the leastsquare best fits of each with the measured spectrum. The mod-els assumed either a linear rotor or a symmetric top structure,a fixed droplet temperature or a best fit temperature and ei-ther a Gauss or a Lorentz profile for the rotational lines. Theconclusion drawn from the analysis of the 4 symmetric topmodels, which come closest to the structure obtained in thepresent study, in three cases was that the axial moment ofinertia Ia is less than 80 amu Å2 and only in one case wasIa = 240 amu Å2. All 8 models led to values for Ib between620 and 413 amu Å2 averaging to about 500 amu Å2. Fromthis value it was estimated, based on an ad hoc assumption ofa spherical shell, which is consistent with a symmetric topmodel, that roughly 11 attached 3He atoms are co-rotatingwith the OCS molecule independent of the other atoms in thedroplet. A difficulty with this interpretation was that a spheri-
Downloaded 06 Feb 2013 to 161.116.81.135. Redistribution subject to AIP license or copyright; see http://jcp.aip.org/about/rights_and_permissions
20 CHAPTER 2. STRUCTURE
044321-7 Mateo et al. J. Chem. Phys. 138, 044321 (2013)
cal shell implies Ia ≈ 350 amu Å2 which is significantly largerthan even the only comparable large value obtained assum-ing a symmetric top structure. Although the present predictedvalue for N = 8 (Ia = 268 amu Å2) is already somewhat largerthan the best fit value of 240 amu Å2 it is gratifying that thespherical shell value of Ia ≈ 350 amu Å2 lies between thepresent calculated values for N = 8 and 18. Since also the av-erage experimental value of Ib = 500 amu Å2 lies betweenthe present values for N = 8 and N = 18 we conclude thatthe present calculations are reasonably consistent with the 11atom spherical shell structure considered to be the most likelystructure by the experimentalists.
It is surprising, however, that the experimental value forIb does not coincide with a magic number. The fact that theexperimental number of 11 differs significantly from the twonearest magic numbers suggests that perhaps the transitionbetween co-rotating and decoupled atoms is a gradual one.Finally we note that the argument used to explain the missingQ-branch in 4He clusters does not apply to 3He clusters. In thelatter case the fermionic statistics allows the axial rotations tobe excited even at the very low temperatures (≈0.1 K) of thedroplets as outlined in the appendix of Ref. 15. In this respectthe experiment also lends support to the symmetric top (andspherical shell) model since it is the only one which predictsthe presence of a Q-branch in the experimental spectrum.
Thus these calculations largely clarify the differences be-tween the solvation shells for the two isotopes. In the bosonic4He droplets the attached atoms are compactly localized inthe donut ring which can accommodate at most 6 atoms whilethe others are completely decoupled from the rotations as iscurrently attributed to the phenomenon of microscopic su-perfluidity. The co-rotating He atoms are attributed to a non-superfluid fraction, which are “adiabatically following”10 therotations of the chromophore in contrast to the other atomswhich are superfluid. In the fermionic 3He droplets the co-rotating shell contains more atoms and is only partly local-ized in the donut position, and therefore is more spread out.Moreover the surrounding atoms and their collective exci-tations interact more strongly with the rotating complex.19
The attached solvation shell is however also decoupled fromthe rest of the 3He droplet even though it is certainly notsuperfluid.
IV. DISCUSSION
The present calculations of the MOI involve a numberof assumptions in addition to those inherent in density func-tional theory. Foremost for the interpretation of the OCS-3He-droplet spectra is the assumption of a rigid cluster with a fixedsize, which rotates without interacting with its environment.This model must be considered to be highly idealized in viewof the large viscosity of 3He (200 micropoise at 0.1 K) whichis largely responsible for the large line widths in the experi-mental spectrum. The present theory also neglects the effectof the translations and rotations of the chromophore on thedensity distributions. In the case of small 4He clusters thishas been investigated for a number of chromophores includ-ing OCS.8,48, 49 The density becomes somewhat more spread
out and delocalized and the moment of inertia is slightlyincreased.49 In the present case a dynamic quantum MonteCarlo simulation would be required to more accurately esti-mate the size of the cluster which rotates together with thechromophore molecule. Such a calculation or even a simpleclassical model would also have to account for the large vis-cosity of the 3He liquid.
Finally, we comment briefly on the future prospects ofcarrying out ab initio calculations of small doped 3He clus-ters. Our experience in the present study indicates that theextreme independent-particle approach, which has been sohelpful in nuclear physics, fails to properly predict the atomshell filling. This is largely due to the strong helium-heliuminteraction and the neglect of Fermi statistics; both aspectswhich are incorporated in the DF approach used here. Jung-wirth and Krylov50 were the first to call attention to the closeanalogy between the quantum chemistry theory of atoms andmolecules and that of 3He atoms attached to heavy chro-mophores. The electron-electron Coulomb repulsion is re-placed by the 3He-3He van der Waals potential and theCoulomb attraction to the nucleus by the strong van der Waalsattraction between the 3He atoms and the chromophore. Fol-lowing this analogy, a full-configuration-interaction nuclear-orbital implementation has been developed and applied byde Lara-Castells and collaborators52,52, 53 to study ground-and excited-state properties of doped clusters containing upto four 3He atoms. However, because of the weakly attrac-tive long range and strongly repulsive short range interac-tion of the He atoms, very large basis sets were required inorder to get satisfactory results for larger systems. Finallywe note that a diffusion Monte Carlo calculation, which hasbeen employed in the past to study both pure and doped3He clusters,43, 44, 54, 55 can be used to study larger clusters upto several tens of atoms. Work along these lines is now inprogress.
ACKNOWLEDGMENTS
This work has been supported by 2009SGR1289 fromGeneralitat de Catalunya, FIS2011-28617-C02-02 from DGI,Spain. We thank Manuel Barranco for many discussions, sug-gestions, and comments about this paper, Francesco Paesaniand Birgitta Whaley for providing us with their OCS-He inter-action, Pilar de Lara-Castells for clarifying comments abouther theory, Robert McKellar for correspondence, and BorisSartakov for reading and commenting on the paper.
1See the articles in “Special topic issue: Helium nanodroplets—A novelmedium for chemistry and physics,” J. Chem. Phys. 115(22) (2001);online at http://jcp.aip.org/resource/1/jcpsa6/v115/i22.
2J. P. Toennies and A. F. Vilesov, Angew. Chem., Int. Ed. 43(20), 2622(2004).
3S. Grebenev, M. Hartmann, M. Havenith, B. Sartakov, J. P. Toennies, andA. F. Vilesov, J. Chem. Phys. 112, 4485 (2000).
4J. Tang and A. R. W. McKellar, J. Chem. Phys. 119, 5467 (2003).5F. Paesani and K. B. Whaley, J. Chem. Phys. 121, 4180 (2004).6Y. Xu and W. Jaeger, J. Chem. Phys. 119, 5457 (2003).7S. Moroni, A. Sarsa, S. Fantoni, K. E. Schmidt, and S. Baroni, Phys. Rev.Lett. 90, 143401 (2003).
8Y. Kwon and K. B. Whaley, J. Chem. Phys. 115, 10146 (2001).9F. Paesani, F. A. Gianturco, and K. B. Whaley, J. Chem. Phys. 115, 10225(2001).
Downloaded 06 Feb 2013 to 161.116.81.135. Redistribution subject to AIP license or copyright; see http://jcp.aip.org/about/rights_and_permissions
2.2. A DENSITY FUNCTIONAL STUDY OF THE STRUCTURE. . . 21

044321-8 Mateo et al. J. Chem. Phys. 138, 044321 (2013)
10Y. Kwon, P. Huang, M. V. Patel, D. Blume, and K. B. Whaley, J. Chem.Phys. 113(16), 6469 (2000).
11A. R. W. McKellar, Y. Xu, and W. Jäger, J. Phys. Chem. A 111, 7329(2007).
12A. R. W. McKellar, Appl. Phys. B 90, 213 (2008).13S. Grebenev, B. Sartakov, J. P. Toennies, and A. Vilesov, Phys. Rev. Lett.
89(22), 225301 (2002).14A. Guirao, M. Pi, and M. Barranco, Z. Phys. D 21(2), 185 (1991).15B. Sartakov, J. P. Toennies, and A. Vilesov, J. Chem. Phys. 136, 134316(2012).
16D. M. Brink and S. Stringari, Z. Phys. D: At., Mol. Clusters 15, 257 (1990).17M. Hartmann, N. Pörtner, B. Sartakov, J. P. Toennies, and A. F. Vilesov, J.Chem. Phys. 110, 5109 (1999).
18S. Grebenev, J. P. Toennies, and A. F. Vilesov, Science 279(5359), 2083(1998).
19V. S. Babichenko and Y. Kagan, Phys. Rev. Lett. 83(17), 3458 (1999).20S. Grebenev, N. Pörtner, A. F. Vilesov, M. Hartmann, A. Lindinger, E. Lu-govoi, J. P. Toennies, and B. Sartakov, Proceedings of the Nobel Symposium117: The Physics and Chemistry of Clusters (World Scientific, Singapore,2001).
21K. von Haeften, T. Laarmann, H. Wabnitz, and T. Möller, Phys. Rev. Lett.88, 233401 (2002).
22F. Stienkemeier, O. Bunermann, R. Mayol, F. Ancilotto, M. Barranco, andM. Pi, Phys. Rev. B 70, 214509 (2004).
23O. Bünermann, G. Droppelmann, A. Hernando, R. Mayol, and F. Stienke-meier, J. Phys. Chem. A 111, 12684 (2007).
24O. Bünermann, M. Dvorak, F. Stienkemeier, A. Hernando, R. Mayol, M.Pi, M. Barranco, and F. Ancilotto, Phys. Rev. B 79, 214511 (2009).
25A. Hernando, R. Mayol, M. Pi, M. Barranco, F. Ancilotto, O. Bunermann,and F. Stienkemeier, J. Phys. Chem. A 111, 7303 (2007).
26N. Pörtner, J. P. Toennies, A. F. Vilesov, G. Benedek, and W. Hizhnyakov,Europhys. Lett. 88, 26007 (2009).
27S. Weisberger and P. G. Reinhard, Z. Phys. D: Atoms, Molecules and Clus-ters 23, 275 (1992).
28M. Barranco, D. M. Jezek, E. S. Hernández, J. Navarro, and Ll. Serra, Z.Phys. D: At., Mol. Clusters 28, 257 (1993).
29J. Harms, J. P. Toennies, M. Barranco, and M. Pi, Phys. Rev. B 63, 184513(2001).
30A. Hernando, M. Barranco, R. Mayol, M. Pi, and F. Ancilotto, Phys. Rev.B 78, 184515 (2008).
31D. Mateo, M. Barranco, R. Mayol, and M. Pi, Eur. Phys. J. D 52, 63–66(2009).
32F. Garcias, Ll. Serra, M. Casas, and M. Barranco, J. Chem. Phys. 108, 9102(1998).
33M. Barranco, M. Pi, S. M. Gatica, E. S. Hernández, and J. Navarro, Phys.Rev. B 56, 8997 (1997).
34P. Tarazona, Phys. Rev. A 31, 2672 (1985).35F. Ancilotto, D. G. Austing, M. Barranco, R. Mayol, K. Muraki, M. Pi, S.Sasaki, and S. Tarucha, Phys. Rev. B 67, 205311 (2003).
36D. Mateo, D. Jin, M. Barranco, and M. Pi, J. Chem. Phys. 134, 044507(2011).
37M. Pi, R. Mayol, A. Hernando, M. Barranco, and F. Ancilotto, J. Chem.Phys. 126, 244502 (2007).
38M. Frigo and S. G. Johnson, Proc. IEEE 93, 216 (2005).39F. Dalfovo, A. Lastri, L. Pricaupenko, S. Stringari, and J. Treiner, Phys.Rev. B 52, 1193 (1995).
40S. L. Fiedler, D. Mateo, T. Aleksanyan, and J. Eloranta, Phys. Rev. B 86,144522 (2012).
41R. Mayol, M. Barranco, E. S. Hernández, M. Pi, and M. Guilleumas, Phys.Rev. Lett. 90, 185301 (2003).
42M. Barranco, J. Navarro, and A. Poves, Phys. Rev. Lett. 78, 4729(1997).
43R. Guardiola and J. Navarro, Phys. Rev. A 71, 035201 (2005).44E. Sola, J. Casulleras, and J. Boronat, Phys. Rev. B 73, 092515 (2006).45A. de Shalit and H. Feshbach, Theoretical Nuclear Physics (Wiley, NewYork, 1974), pp. 415 ff.
46P. Ring and P. Schuck, The Nuclear Many-Body Problem (Springer, NewYork, 1980).
47H. Hunt, S. C. Foster, J. W. C. Johns, and A. R. W. McKellar, J. Mol.Spectrosc. 111, 42 (1985).
48M. V. Patel, A. Viel, F. Paesani, P. Huang, and K. B. Whaley, J. Chem.Phys. 118, 5011 (2003).
49F. Paesani and K. B. Whaley, J. Chem. Phys. 121, 5293 (2004).50P. Jungwirth and A. I. Krylov, J. Chem. Phys. 115, 10214 (2001).51M. P. de Lara-Castells, G. Delgado-Barrio, P. Villareal, and A. O.Mitrushchenkov, J. Chem. Phys. 125, 221101 (2006).
52M. P. de Lara-Castells, N. F. Aguirre, P. Villareal, G. Delgado-Barrio, andA. O. Mitrushchenkov, J. Chem. Phys. 132, 194313 (2010).
53M. P. de Lara-Castells, G. Delgado-Barrio, P. Villareal, and A. O.Mitrushchenkov, Int. J. Quantum Chem. 111, 406 (2011).
54R. Guardiola, J. Navarro, D. Mateo, and M. Barranco, J. Chem. Phys. 131,174110 (2009).
55J. Navarro, D. Mateo, M. Barranco, and A. Sarsa, J. Chem. Phys. 136,054301 (2012).
Downloaded 06 Feb 2013 to 161.116.81.135. Redistribution subject to AIP license or copyright; see http://jcp.aip.org/about/rights_and_permissions
22 CHAPTER 2. STRUCTURE
Chapter 3
Dynamics
3.1 Evolution of the excited electron bubble in liquid 4Heand the appearance of fission-like processes
Resumen (Spanish)
Hemos seguido la evolucion de una burbuja electronica excitada en 4He superfluidodurante unas decenas de picosegundos combinando el calculo dinamico del lıquido conla evolucion adiabatica del electron. El calculo muestra como el camino seguido por laburbuja excitada al estado 1P en su relajacion hacia el estado fundamental depende deforma crıtica de la presion aplicada. Para presiones inferiores a 1 bar, el electron puededesexcitarse radiativamente hasta el estado fundamental deformado y evolucionar hacia elautentico estado fundamental esferico. Para presiones superiores a 1 bar hemos observadoque dos “baby bubbles” claramente diferenciadas aparecen en el trascurso de la evolucion,lo que apunta a un nuevo camino de relajacion en el que el electron se localiza en unade las dos burbujas mientras la vacıa colapsa. Esto permite una relajacion puramenteno-radiativa.
Nuestros calculos muestran en buen acuerdo con los experimentos en los que lasburbujas electronicas 1P se detectan solo por debajo de una presion crıtica del ordende 1 bar mientras que para presiones mas elevadas la relajacion de las burbujas sucedepor una vıa diferente. Un analisis similar de la burbuja 2P muestra que la aproximacionadiabatica falla en un estadio temprano de la evolucion debido al cruce de los estados 2Py 1F.
23
Evolution of the excited electron bubble in liquid 4He and the appearanceof fission-like processes
David Mateo, Martí Pi, and Manuel BarrancoDepartament ECM, Facultat de Física, and IN2UB, Universitat de Barcelona, Diagonal 647, 08028 Barcelona, Spain
�Received 9 October 2009; revised manuscript received 5 March 2010; published 11 May 2010�
We have studied the evolution of an excited electron bubble in superfluid 4He for several tens of picosecondcombining the dynamics of the liquid with an adiabatic evolution for the electron. The path followed by theexcited bubble in its decay to the ground state is shown to strongly depend on pressure. While for pressuresbelow 1 bar the 1P excited electron bubble has allowance for radiatively decay to the deformed ground state,evolving then nonradiatively toward the ground state of the spherical electron bubble, we have found thatabove 1 bar two distinct baby bubbles appear in the course of the dynamical evolution, pointing to a differentrelaxation path in which the electron may be localized in one of the baby bubbles while the other collapses,allowing for a pure radiationless de-excitation. Our calculations are in agreement with experiments indicatingthat relaxed 1P bubbles are only observed for pressures smaller than a critical one, on the order of 1 bar, andthat above this value the decay of the excited bubble has to proceed differently. A similar analysis carried outfor the 2P bubble shows that the adiabatic approximation fails at an early stage of its dynamical evolution dueto the crossing of the 2P and 1F states.
DOI: 10.1103/PhysRevB.81.174510 PACS number�s�: 47.55.D�, 67.25.du, 33.20.Kf, 71.15.Mb
I. INTRODUCTION
Electron bubbles �ebubbles� in liquid helium are fascinat-ing objects with an apparently simple structure that havebeen the subject of a large number of experimental and the-oretical studies, see, e.g., Refs. 1–12 and references therein.The imaging of individual ebubbles moving in the liquid,13
some unexplained events in cavitation experiments,14 and theefforts in creating and detecting multielectron bubbles15,16
are recent issues calling for a dynamical description of theelectron bubble, but not the only ones. For instance, theequilibration of the electron bubble in superfluid liquid he-lium, studied in detail by Eloranta and Apkarian8 withintime-dependent density-functional �DF� theory, also neededof an accurate dynamical description. The ebubbles ad-dressed in that work are spherically symmetric, which madethe calculations affordable for using the best available DF for4He, the so-called Orsay-Trento functional.17 Other dynami-cal studies have resorted to much simpler approaches in-spired on local functionals of the kind proposed by Stringariand Treiner long time ago,18 or on generalizations of theGross-Pitaevskii equation to the description of liquidhelium.19–22 They have allowed to carry out dynamical stud-ies involving nonspherical ebubbles, and their interactionwith vortices in the superfluid. However, these local ap-proaches do not describe the superfluid accurately. In par-ticular, its elemental excitations are poorly reproduced. Tocircumvent this shortcoming, nonlocal extensions have beenproposed23 and applied, e.g., to vortex nucleation in super-fluid helium.24
Another problem requiring a dynamical treatment, stillnot addressed in full detail, is the relaxation of an ebubbleafter being excited by photoabsorption, which constitutes thesubject matter of this work. This process couples the fairlyslow displacement of the helium bubble with the rapid mo-tion of the electron it hosts, producing excitations in the liq-uid that take away a sizeable part of the energy deposited in
the ebubble during the absorption. The emission spectrum ofthe electron bubble after it has relaxed around the excitedelectron state has been calculated.10,25,26 However, whetherand how these full relaxed configurations are attained beforedecaying by photoemission was not elucidated.In this work we attempt a theoretical description of the
evolution of the excited ebubble based on the zero-temperature DF approach, using an as much accurate as tech-nically feasible description of the liquid and an electron-helium �e-He� interaction that have been proved to reproducethe experimental absorption energies of the ebubble. The ini-tial configuration is determined by a static calculation of theexcited ebubble. This state has a large radiative lifetime, onthe order of several tens of microsecond, in contrast with theshort time scale for the helium displacement, on the order ofpicosecond. The subsequent dynamical evolution of theebubble is described within the adiabatic approximation,which is valid for a period of time difficult to ascertain,27 thatwe shall discuss in some detail. We will show that, depend-ing on the initial excited state and the external pressure ap-plied to the liquid, the bubble may keep its initial simplyconnected topology, or evolve toward a nonsimply connectedone made of two baby bubbles that share the probability offinding the electron in,28 the electron eventually localizing inone of them while the other collapses. To reduce the numeri-cal effort to a reasonable amount, we shall mostly discussresults for the collapse of an ebubble starting from thespherical 1P state. Results for the collapse of the 2P state willbe also shown.This work is organized as follows. In Sec. II we describe
our model and present a quasistatic study of the ebubble,completing the results we have presented elsewhere,25 andrecalling some technical details about the method we haveused to solve the variational equations for the fluid and theelectron. In Sec. III we present the adiabatic evolution of theebubble for two selected values of the liquid pressure. Thevalidity of the adiabatic approximation is analyzed in Sec. IVand a summary is presented in Sec. V.
PHYSICAL REVIEW B 81, 174510 �2010�
1098-0121/2010/81�17�/174510�10� ©2010 The American Physical Society174510-1
24 CHAPTER 3. DYNAMICS
II. QUASISTATIC DESCRIPTION
We first address some properties of excited electronbubbles in liquid 4He using the Orsay-Trento density func-tional including the terms that mimic backflow effects andare crucial to quantitatively reproduce the experimentalphonon-roton dispersion relation in bulk liquid 4He at zeropressure.17 They have no influence on the statics of the sys-tem and have been often neglected12,29 in the dynamics be-cause their inclusion makes the dynamical calculations verycumbersome.8,30–32 In practice, we have found that theseterms have little effect on the dynamics of the electronbubble presented in this work.The e-He interaction has been modeled by the Hartree-
type local effective potential derived by Cheng et al.33 Thisallows us to write the energy of the electron-helium systemas a functional of the electron wave function ��r� and the4He effective macroscopic wave function ��r�=���r�exp�ıS�r��, where ��r� is the particle density andv�r�=��S�r� /mHe is the velocity field of the superfluid
E��,�� =�2
2mHe� dr����r��2 +� drE���
+�2
2me� dr����r��2 +� dr���2Ve-He��� . �1�
In this expression, E��� is the 4He “potential” energy densityand the e-He interaction Ve-He��� is written as a function ofthe helium density.33 Details are given in Refs. 9 and 34. Inthe absence of vortex lines, S is zero and E becomes a func-tional of � and �. Otherwise, one has to use the complexwave function ��r� to describe the superfluid.For a given pressure �P�, we have solved the Euler-
Lagrange equations which result from the variation with re-spect to �� and �� of the zero temperature constrainedgrandpotential density ��� ,��=��� ,��−����2, with
���,�� =�2
2mHe����r��2 + E��� +
�2
2me����2 + ���2Ve-He���
− � , �2�
where is chemical potential of the liquid. The variation ofthe above functional yields two coupled equations that haveto be self-consistently solved
−�2
2mHe� + �E
��+ ���2
�Ve-He�����
� = � , �3�
−�2
2me� + Ve-He���� = �� , �4�
where � is the eigenvalue of the Schrödinger equationobeyed by the electron.Our method of solving the variational equations is based
on a high-order discretization in Cartesian coordinates of thedifferential operators entering them �13-point formulas in thepresent case�, and the use of fast Fourier transformationtechniques35 to efficiently compute the convolution integralsin ����, such as the mean-field helium potential and thecoarse-grained density entering the definition of the correla-
tion energy.12 This allows us to use a large spatial mesh step,of about 1 Å size, without an apparent loss of numericalaccuracy when we compare our results with others �see be-low� obtained using three-point formulas for the derivativesthat, as a consequence, require a rather small mesh step to beaccurate. The density at the boundary of the three-dimensional 140�140�140 Å3 box used to carry out thecalculations is fixed to the value of the bulk liquid density atthe given P. We recall that knowledge of E��� allows todetermine the equation of state of the bulk liquid and itschemical potential, since =�E /�� and P=−E���+�.Equations �3� and �4� have been solved employing animaginary-time method,36 and we have carried out the appro-priate tests to check the stability of the solutions. We mentionthat the energies we have obtained for the 1S→1P and 1S→2P transitions9 are in very good agreement withexperiment,6 and that our results compare well with thoseobtained by Eloranta and Apkarian8 using the same func-tional but a different numerical method and e-He interaction.This constitutes an excellent test not only for the numericsbut also for the physical ingredients employed in both calcu-lations. We have recently discussed the effect of the presenceof vortices on the absorption spectrum of ebubbles attachedto them.25
Upon excitation to the 1P state by light absorption, theebubble experiences a drastic change in shape. This is due tothe fairly large radiative lifetime of this state �calculated tobe 44 s in Ref. 26, 60 s in Ref. 10, and 56 s in Ref.25� as compared to any characteristic helium time scale, al-lowing the liquid to relax around the excited state. As a con-sequence, the bubble adapts its shape to the 1P electron prob-ability density before decaying by photoemission to thedeformed 1S state. Consequently, the bubble configuration atthe emission time can be obtained by minimizing the grand-potential of the system keeping the electron in the excited 1Pstate. We have done it by solving Eqs. �3� and �4� taking for� the �1P wave function. In this case, a Gram-Schmidtscheme has been implemented to determine both 1P and 1Srelaxed states that obviously no longer correspond to aspherical bubble. In this axially symmetric environment, thespherical nL states are split depending on the value �m� ofthe orbital angular momentum on the symmetry z axis, andthe m states are degenerate. We have found that, within anL manifold, the m states are ordered in increasing �m�values.25 For this reason, we will refer to the axially sym-metric state that corresponds to the m=0 submanifold whenwe speak of a deformed “nL” state. When needed, we shalluse the conventional notation for the orbital angular momen-tum of single-particle states in linear molecules, namely,� ,� ,� ,� , . . . for �m�=0,1 ,2 ,3 , . . ., and superscripts +�−� forspecularly symmetric �antisymmetric� states.Figure 1 displays quasiequilibrium ebubble configurations
at different stages of the absorption-emission cycle obtainedat P=0 bar. The electron-probability densities are repre-sented by colored clouds, these with one lobe correspond to1S states �spherical bubble, picture 1; deformed bubble, pic-ture 4� and these with two lobes correspond to 1P states�spherical bubble, picture 2; deformed bubble, picture 3�. Inthis figure, the line indicates the bubble dividing surface, i.e.,the surface at which the liquid density equals half the
MATEO, PI, AND BARRANCO PHYSICAL REVIEW B 81, 174510 �2010�
174510-2
3.1. EVOLUTION OF THE EXCITED ELECTRON BUBBLE. . . 25

saturation-density value �0, e.g., 0.0218 Å−3 at P=0 bar,
and represents the surface of the helium bubble. We havefound25 that at P=0 bar, the 1P→1S emission energy is 36meV, close to the 35 meV found in Ref. 10, constitutinganother excellent test of the theoretical framework used byus and by these authors. The energy released in the optical1S-1P absorption-emission cycle can be determined combin-ing the results we have obtained in previous works.9,25 Forinstance, at P=0 bar the released energy is 69 meV �com-pare with the 76 meV obtained in Ref. 10�. This energy istransferred to the superfluid through generation of differentkind of excitations.Quasiequilibrium configurations of the ebubble relaxed
around the 1P state are shown in Fig. 2 for several P values.In this figure, helium is represented by warm colors and theelectron-probability density �arbitrary units� by cool colors.The relaxation of the bubble around the 1P state produces acharacteristic two-lobe peanut structure whose waist—or
neck—is progressively marked as the pressure applied to theliquid increases. Notice that helium displays a stratified den-sity around the bubble. This feature appears whenever thesuperfluid presents a kind of free surface, as in drops, filmsor bubbles.9,17,36
Figure 2 shows that at a pressure of �8 bars helium startsto penetrate between the two lobes of the electron wave func-tion. At �9 bars the helium density in this region reachesthe saturation density, and the bubble splits into two babybubbles. This produces an abrupt change in the emissionenergy, falling an order of magnitute between P=8 and 9bars; in the “broken-neck” region extending up to the solidi-fication pressure, the photon-emission energy is barely�1 meV.25 This is expectable at these pressures, as the maindifference between 1S and 1P probability densities appearsin the waist region. If this region is inaccessible to the elec-tron due to the presence of helium, these states become al-most degenerate. On the contrary, if this region is not acces-sible to the superfluid due, e.g., to the presence of a vortexwhose vorticity line coincides with the symmetry axis of theebubble, the baby bubbles may be held together by a tinyneck.25
It is worth pointing out that some of the quasiequilibriumconfigurations displayed in Fig. 2 may not be reachable inthe evolution of the bubble. The reason is that helium fallingin the waist region during the violent collapse may produce alarge pileup of superfluid in that region, thus causing theactual breaking of the neck at pressures much smaller thanthe 8 bars obtained quasistatically. This possibility has beenanticipated by Maris.2
III. TIME EVOLUTION OF THE EBUBBLE:PICOSECOND DYNAMICS
The dynamics of the excess electron localization in liquidhelium has been adiabatically addressed by Rosenblit andJortner37,38 using a sharp-surface model for the bubble. Thesuperfluid was considered as incompressible, and the bubbleexpansion time, i.e., the time for creating the ebubble, wasestimated to be 8.5 ps when energy dissipation by emissionof sound waves was taken into account.38 This process ex-hibits a marked P dependence, the higher the pressure theshorter the expansion time.Later on, the incompressibility approximation was relaxed
using a DF approach, finding that at P=0 bar the bubblesurface breathes with a period of about 130 ps.8 These cal-culations have revealed that the localization process maylaunch shock waves, and that the subsequent main dissipa-tion mechanism is sound radiation; excitations in the rotonwell were not produced.8 In the present work we considerthat the ebubble has had time enough to relax to its spherical1S ground state and the electron is subsequently excited bylight absorption to the 1P state, whose dynamical evolution isthe subject matter of this section.
A. Adiabatic time evolution
Since the electron evolves much faster than helium astheir mass ratio is mHe /me�7300, we have followed the dy-
AbsorptionΔE = 105 meV
EmissionΔE = −36 meV
Relaxation stage
ΔE = −40 meV
Relaxation stage
ΔE = −29 meV
1
2
3
4
FIG. 1. �Color online� Ebubble quasiequilibrium configurationsat different stages of the absorption-emission cycle correspondingto P=0 bar. The electron-probability densities are represented bycolored clouds. The dashed line is the bubble dividing surface. Thesize of the frames is 70�70 Å2.
P = 0 bar P = 5 bar
P = 8 bar P = 9 bar
FIG. 2. �Color online� 1P bubble quasiequilibrium configura-tions for P=0, 5, 8, and 9 bars. Helium is represented by warmcolors and the electron-probability density �arbitrary scale� by coolcolors. The size of the samples is 70�70 Å2.
EVOLUTION OF THE EXCITED ELECTRON BUBBLE… PHYSICAL REVIEW B 81, 174510 �2010�
174510-3
26 CHAPTER 3. DYNAMICS
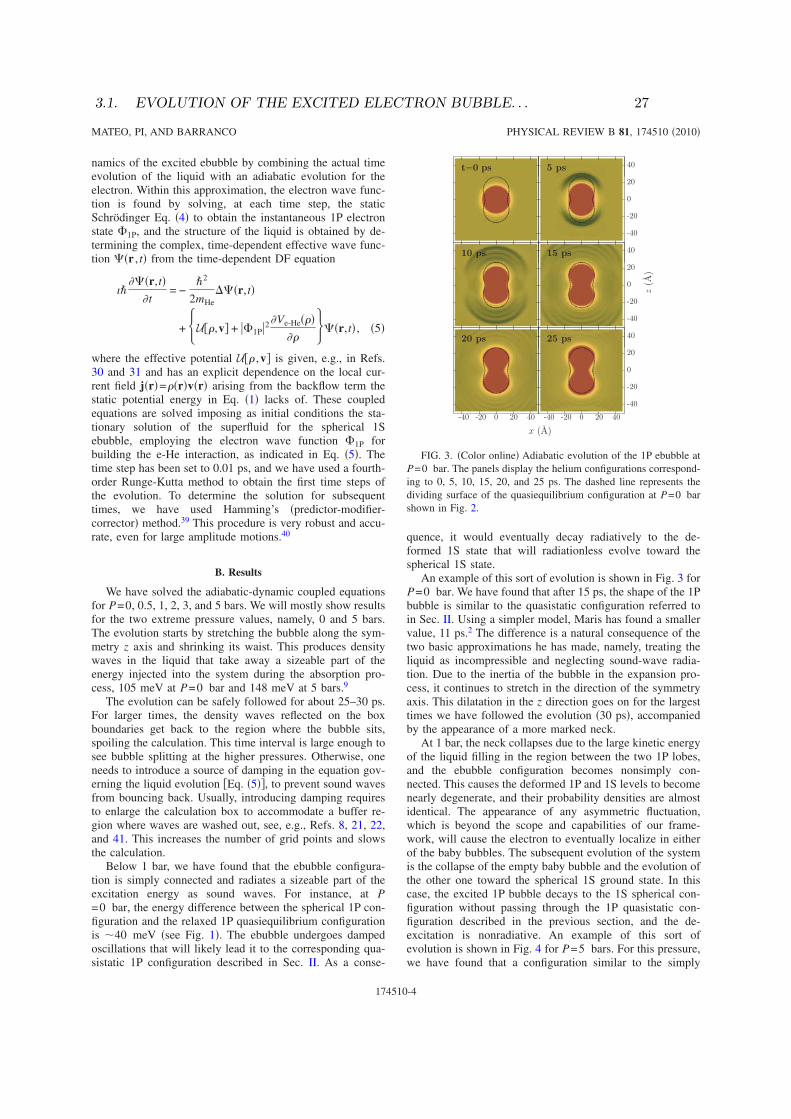
namics of the excited ebubble by combining the actual timeevolution of the liquid with an adiabatic evolution for theelectron. Within this approximation, the electron wave func-tion is found by solving, at each time step, the staticSchrödinger Eq. �4� to obtain the instantaneous 1P electronstate �1P, and the structure of the liquid is obtained by de-termining the complex, time-dependent effective wave func-tion ��r , t� from the time-dependent DF equation
ı����r,t�
�t= −
�2
2mHe��r,t�
+ U��,v� + ��1P�2�Ve-He���
����r,t� , �5�
where the effective potential U�� ,v� is given, e.g., in Refs.30 and 31 and has an explicit dependence on the local cur-rent field j�r�=��r�v�r� arising from the backflow term thestatic potential energy in Eq. �1� lacks of. These coupledequations are solved imposing as initial conditions the sta-tionary solution of the superfluid for the spherical 1Sebubble, employing the electron wave function �1P forbuilding the e-He interaction, as indicated in Eq. �5�. Thetime step has been set to 0.01 ps, and we have used a fourth-order Runge-Kutta method to obtain the first time steps ofthe evolution. To determine the solution for subsequenttimes, we have used Hamming’s �predictor-modifier-corrector� method.39 This procedure is very robust and accu-rate, even for large amplitude motions.40
B. Results
We have solved the adiabatic-dynamic coupled equationsfor P=0, 0.5, 1, 2, 3, and 5 bars. We will mostly show resultsfor the two extreme pressure values, namely, 0 and 5 bars.The evolution starts by stretching the bubble along the sym-metry z axis and shrinking its waist. This produces densitywaves in the liquid that take away a sizeable part of theenergy injected into the system during the absorption pro-cess, 105 meV at P=0 bar and 148 meV at 5 bars.9
The evolution can be safely followed for about 25–30 ps.For larger times, the density waves reflected on the boxboundaries get back to the region where the bubble sits,spoiling the calculation. This time interval is large enough tosee bubble splitting at the higher pressures. Otherwise, oneneeds to introduce a source of damping in the equation gov-erning the liquid evolution �Eq. �5��, to prevent sound wavesfrom bouncing back. Usually, introducing damping requiresto enlarge the calculation box to accommodate a buffer re-gion where waves are washed out, see, e.g., Refs. 8, 21, 22,and 41. This increases the number of grid points and slowsthe calculation.Below 1 bar, we have found that the ebubble configura-
tion is simply connected and radiates a sizeable part of theexcitation energy as sound waves. For instance, at P=0 bar, the energy difference between the spherical 1P con-figuration and the relaxed 1P quasiequilibrium configurationis �40 meV �see Fig. 1�. The ebubble undergoes dampedoscillations that will likely lead it to the corresponding qua-sistatic 1P configuration described in Sec. II. As a conse-
quence, it would eventually decay radiatively to the de-formed 1S state that will radiationless evolve toward thespherical 1S state.An example of this sort of evolution is shown in Fig. 3 for
P=0 bar. We have found that after 15 ps, the shape of the 1Pbubble is similar to the quasistatic configuration referred toin Sec. II. Using a simpler model, Maris has found a smallervalue, 11 ps.2 The difference is a natural consequence of thetwo basic approximations he has made, namely, treating theliquid as incompressible and neglecting sound-wave radia-tion. Due to the inertia of the bubble in the expansion pro-cess, it continues to stretch in the direction of the symmetryaxis. This dilatation in the z direction goes on for the largesttimes we have followed the evolution �30 ps�, accompaniedby the appearance of a more marked neck.At 1 bar, the neck collapses due to the large kinetic energy
of the liquid filling in the region between the two 1P lobes,and the ebubble configuration becomes nonsimply con-nected. This causes the deformed 1P and 1S levels to becomenearly degenerate, and their probability densities are almostidentical. The appearance of any asymmetric fluctuation,which is beyond the scope and capabilities of our frame-work, will cause the electron to eventually localize in eitherof the baby bubbles. The subsequent evolution of the systemis the collapse of the empty baby bubble and the evolution ofthe other one toward the spherical 1S ground state. In thiscase, the excited 1P bubble decays to the 1S spherical con-figuration without passing through the 1P quasistatic con-figuration described in the previous section, and the de-excitation is nonradiative. An example of this sort ofevolution is shown in Fig. 4 for P=5 bars. For this pressure,we have found that a configuration similar to the simply
-40 -20 0 20 40
-40
-20
0
20
40
x (A)
z(A
)
-40
-20
0
20
40
-40
-20
0
20
40
-40 -20 0 20 40
t=0 ps 5 ps
10 ps
20 ps
15 ps
25 ps
FIG. 3. �Color online� Adiabatic evolution of the 1P ebubble atP=0 bar. The panels display the helium configurations correspond-ing to 0, 5, 10, 15, 20, and 25 ps. The dashed line represents thedividing surface of the quasiequilibrium configuration at P=0 barshown in Fig. 2.
MATEO, PI, AND BARRANCO PHYSICAL REVIEW B 81, 174510 �2010�
174510-4
3.1. EVOLUTION OF THE EXCITED ELECTRON BUBBLE. . . 27
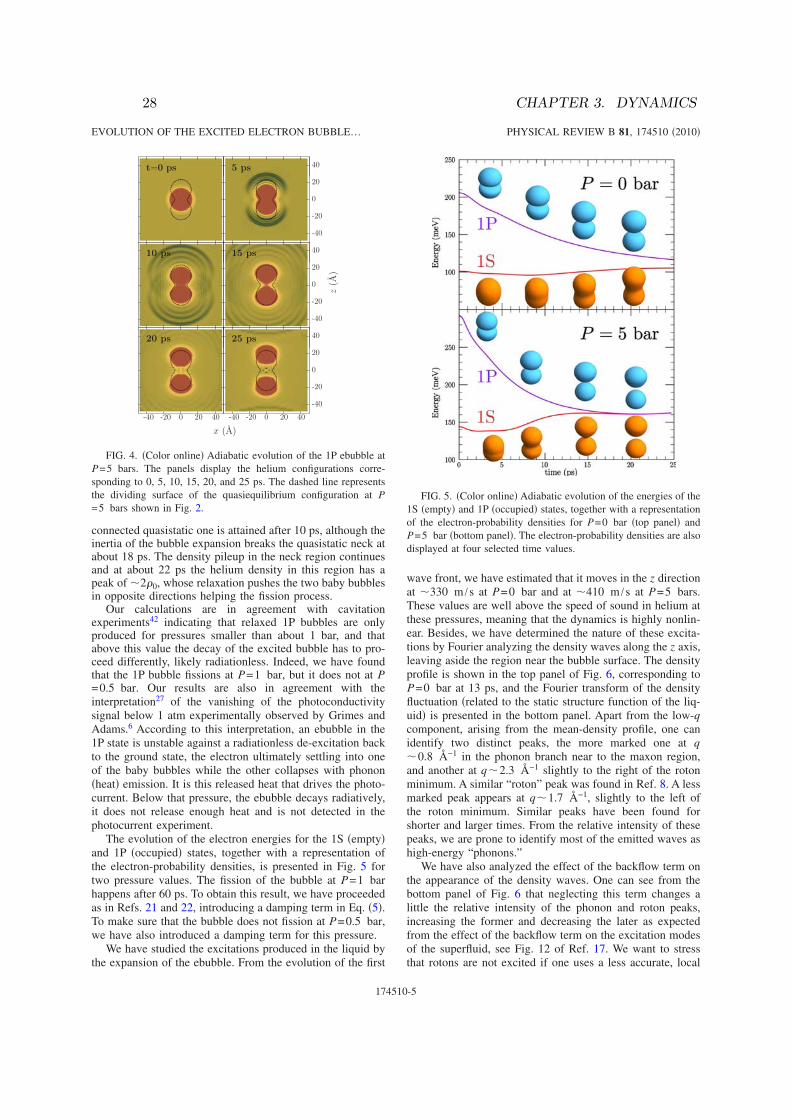
connected quasistatic one is attained after 10 ps, although theinertia of the bubble expansion breaks the quasistatic neck atabout 18 ps. The density pileup in the neck region continuesand at about 22 ps the helium density in this region has apeak of �2�0, whose relaxation pushes the two baby bubblesin opposite directions helping the fission process.Our calculations are in agreement with cavitation
experiments42 indicating that relaxed 1P bubbles are onlyproduced for pressures smaller than about 1 bar, and thatabove this value the decay of the excited bubble has to pro-ceed differently, likely radiationless. Indeed, we have foundthat the 1P bubble fissions at P=1 bar, but it does not at P=0.5 bar. Our results are also in agreement with theinterpretation27 of the vanishing of the photoconductivitysignal below 1 atm experimentally observed by Grimes andAdams.6 According to this interpretation, an ebubble in the1P state is unstable against a radiationless de-excitation backto the ground state, the electron ultimately settling into oneof the baby bubbles while the other collapses with phonon�heat� emission. It is this released heat that drives the photo-current. Below that pressure, the ebubble decays radiatively,it does not release enough heat and is not detected in thephotocurrent experiment.The evolution of the electron energies for the 1S �empty�
and 1P �occupied� states, together with a representation ofthe electron-probability densities, is presented in Fig. 5 fortwo pressure values. The fission of the bubble at P=1 barhappens after 60 ps. To obtain this result, we have proceededas in Refs. 21 and 22, introducing a damping term in Eq. �5�.To make sure that the bubble does not fission at P=0.5 bar,we have also introduced a damping term for this pressure.We have studied the excitations produced in the liquid by
the expansion of the ebubble. From the evolution of the first
wave front, we have estimated that it moves in the z directionat �330 m /s at P=0 bar and at �410 m /s at P=5 bars.These values are well above the speed of sound in helium atthese pressures, meaning that the dynamics is highly nonlin-ear. Besides, we have determined the nature of these excita-tions by Fourier analyzing the density waves along the z axis,leaving aside the region near the bubble surface. The densityprofile is shown in the top panel of Fig. 6, corresponding toP=0 bar at 13 ps, and the Fourier transform of the densityfluctuation �related to the static structure function of the liq-uid� is presented in the bottom panel. Apart from the low-qcomponent, arising from the mean-density profile, one canidentify two distinct peaks, the more marked one at q�0.8 Å−1 in the phonon branch near to the maxon region,and another at q�2.3 Å−1 slightly to the right of the rotonminimum. A similar “roton” peak was found in Ref. 8. A lessmarked peak appears at q�1.7 Å−1, slightly to the left ofthe roton minimum. Similar peaks have been found forshorter and larger times. From the relative intensity of thesepeaks, we are prone to identify most of the emitted waves ashigh-energy “phonons.”We have also analyzed the effect of the backflow term on
the appearance of the density waves. One can see from thebottom panel of Fig. 6 that neglecting this term changes alittle the relative intensity of the phonon and roton peaks,increasing the former and decreasing the later as expectedfrom the effect of the backflow term on the excitation modesof the superfluid, see Fig. 12 of Ref. 17. We want to stressthat rotons are not excited if one uses a less accurate, local
-40 -20 0 20 40
-40
-20
0
20
40
x (A)
z(A
)
-40
-20
0
20
40
-40
-20
0
20
40
-40 -20 0 20 40
t=0 ps 5 ps
10 ps
20 ps
15 ps
25 ps
FIG. 4. �Color online� Adiabatic evolution of the 1P ebubble atP=5 bars. The panels display the helium configurations corre-sponding to 0, 5, 10, 15, 20, and 25 ps. The dashed line representsthe dividing surface of the quasiequilibrium configuration at P=5 bars shown in Fig. 2.
FIG. 5. �Color online� Adiabatic evolution of the energies of the1S �empty� and 1P �occupied� states, together with a representationof the electron-probability densities for P=0 bar �top panel� andP=5 bar �bottom panel�. The electron-probability densities are alsodisplayed at four selected time values.
EVOLUTION OF THE EXCITED ELECTRON BUBBLE… PHYSICAL REVIEW B 81, 174510 �2010�
174510-5
28 CHAPTER 3. DYNAMICS

functional such as that of Refs. 18–22. In this case, only thelow-q phonon spectrum of the superfluid is quantitativelyreproduced. Whether this has a sizeable influence on theebubble dynamics or not, can only be ascertained by a de-tailed comparison between the results obtained using bothkind of functionals.1P ebubbles may be excited by photoabsorption to the 1D
state, either to its m=0 component �2�+� or to its m= 1components �1�−�. The absorption spectrum at differentstages of the time evolution can be measured in a pump-probe experiment by which the ebubble is excited by twoconsecutive laser pulses. The delay set between these pulsesshould correspond to the time elapsed between the excitationof the spherical bubble and the time at which the absorptionspectrum of the 1P ebubble is recorded. Time-resolved elec-tronic spectroscopy has been proposed by Rosenblit andJortner38 as a tool for the exploration of the localization dy-namics of the excess electron.Time-resolved excitation energies are shown in Fig. 7 at
P=0 and 5 bars. While the evolution of the 1�−→1�− ex-citation is qualitatively similar at both pressures, the 1�−
→2�+ excitation evolves differently in the high-pressure re-gime when the bubble splits. Indeed, at 0 bar the excitationenergy smoothly decreases with time, whereas at 5 bars itstarts decreasing, increasing next, and eventually becominglarger than the excitation energy to the 1�− state. Note that
both the change in behavior and the crossing take place somepicosecond before bubble splitting.The 1�−→1�− transition is little affected by bubble split-
ting because it involves two states with negative specularsymmetry, which means that the probability density of bothstates is zero in the neck region. On the contrary, the 1�−
→2�+ transition involves two states with different specularsymmetry and thus it is more affected by bubble splitting.Along with the excitation energies, some values of the
associated oscillator strengths are displayed in Fig. 7. Theoscillator strengths have been calculated in the dipole ap-proximation as43
fab =2me
3�2�Ea − Eb�� a�r�b��2.
As known, the oscillator strengths fulfill a sum rule that inthe one-electron case is �afab=1.
44 At both pressures, wehave found that these transitions have comparable oscillatorstrengths. The largest difference appears for P=5 bars in thesplit-bubble regime. In it, the strength of the 1�−→2�+ tran-sition is roughly half that of the 1�−→1�− transition. Wethus conclude that the analysis of the peak energy and oscil-lator strength of the 1�−→2�+ transition might disclose thefission-like behavior of the excited 1P bubble, complement-ing the experimental information gathered from cavitationand photoconductivity experiments.The current field �j�r�=��r�v�r�� is shown in Fig. 8 for
P=0 and 5 bars at 12 and 22 ps. At 12 ps the current fieldsare qualitatively similar for both pressures: the bubble ex-pands along the symmetry axis and shrinks in a plane per-pendicular to it. At 22 ps, when P=5 bars, large currentskeep bringing liquid into the neck region, splitting the bubble
0
4
8
12
16
0 0.5 1 1.5 2 2.5 3
Inte
nsi
ty(a
rb.
units)
q (A−1)
0
0.005
0.01
0.015
0.02
0.025
0 10 20 30 40 50 60 70
ρ(A
−3)
z (A)
FIG. 6. �Color online� Top panel: density profile of the super-fluid corresponding to P=0 bar at 13 ps �only the z�0 part isshown�. The inset shows the ebubble configuration in a 140�140 Å2 frame, and the region displayed in the rectangle is theFourier transformed one. Bottom panel: solid line, Fourier trans-form of the superfluid density profile shown in gray in the toppanel. The dashed line is the Fourier transform of the density ob-tained at the same evolution time without including backflow ef-fects. In both cases the peak at q=0 Å−1 arises from the mean-density profile, not subtracted from the local density beforetransforming. The lines have been drawn as a guide to the eyes.
80
90
100
110
120
130
ΔE
(meV
)
1σ− → 2σ+
1σ− → 1π−
130
140
150
160
170
180
4 6 8 10 12 14 16 18 20
ΔE
(meV
)
time (ps)
0.63
0.57
f = 0.650.65
0.650.65
0.34
0.56
P = 0 bar
P = 5 bar
FIG. 7. �Color online� Time-resolved excitation energies at P=0 and 5 bars for electron transitions from the 1�− state arisingfrom the spherical 1P, m=0 one, to either the 1�− state �circles�, orto the 2�+ one �squares�, both initially belonging to the spherical1D manifold. In each panel, the oscillator strength for two selectedtime values is also displayed. Lines have been drawn as a guide tothe eyes.
MATEO, PI, AND BARRANCO PHYSICAL REVIEW B 81, 174510 �2010�
174510-6
3.1. EVOLUTION OF THE EXCITED ELECTRON BUBBLE. . . 29
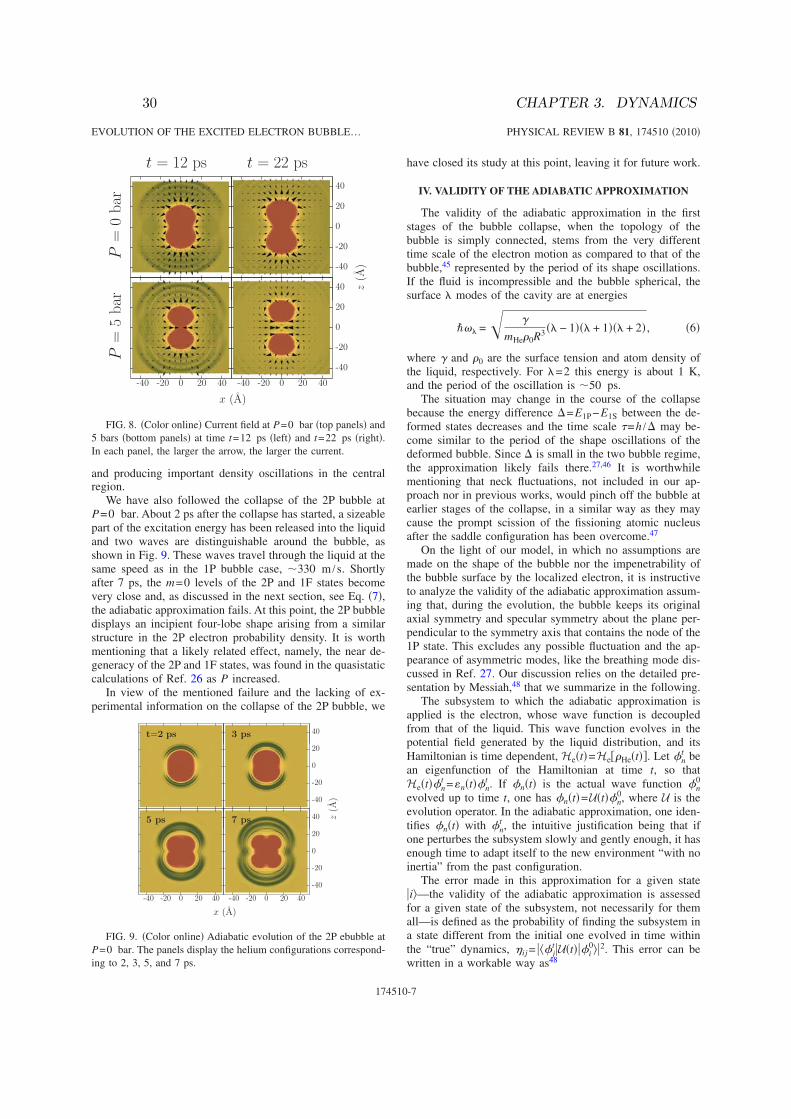
and producing important density oscillations in the centralregion.We have also followed the collapse of the 2P bubble at
P=0 bar. About 2 ps after the collapse has started, a sizeablepart of the excitation energy has been released into the liquidand two waves are distinguishable around the bubble, asshown in Fig. 9. These waves travel through the liquid at thesame speed as in the 1P bubble case, �330 m /s. Shortlyafter 7 ps, the m=0 levels of the 2P and 1F states becomevery close and, as discussed in the next section, see Eq. �7�,the adiabatic approximation fails. At this point, the 2P bubbledisplays an incipient four-lobe shape arising from a similarstructure in the 2P electron probability density. It is worthmentioning that a likely related effect, namely, the near de-generacy of the 2P and 1F states, was found in the quasistaticcalculations of Ref. 26 as P increased.In view of the mentioned failure and the lacking of ex-
perimental information on the collapse of the 2P bubble, we
have closed its study at this point, leaving it for future work.
IV. VALIDITY OF THE ADIABATIC APPROXIMATION
The validity of the adiabatic approximation in the firststages of the bubble collapse, when the topology of thebubble is simply connected, stems from the very differenttime scale of the electron motion as compared to that of thebubble,45 represented by the period of its shape oscillations.If the fluid is incompressible and the bubble spherical, thesurface � modes of the cavity are at energies
��� =� �
mHe�0R3 �� − 1��� + 1��� + 2� , �6�
where � and �0 are the surface tension and atom density ofthe liquid, respectively. For �=2 this energy is about 1 K,and the period of the oscillation is �50 ps.The situation may change in the course of the collapse
because the energy difference =E1P−E1S between the de-formed states decreases and the time scale �=h / may be-come similar to the period of the shape oscillations of thedeformed bubble. Since is small in the two bubble regime,the approximation likely fails there.27,46 It is worthwhilementioning that neck fluctuations, not included in our ap-proach nor in previous works, would pinch off the bubble atearlier stages of the collapse, in a similar way as they maycause the prompt scission of the fissioning atomic nucleusafter the saddle configuration has been overcome.47
On the light of our model, in which no assumptions aremade on the shape of the bubble nor the impenetrability ofthe bubble surface by the localized electron, it is instructiveto analyze the validity of the adiabatic approximation assum-ing that, during the evolution, the bubble keeps its originalaxial symmetry and specular symmetry about the plane per-pendicular to the symmetry axis that contains the node of the1P state. This excludes any possible fluctuation and the ap-pearance of asymmetric modes, like the breathing mode dis-cussed in Ref. 27. Our discussion relies on the detailed pre-sentation by Messiah,48 that we summarize in the following.The subsystem to which the adiabatic approximation is
applied is the electron, whose wave function is decoupledfrom that of the liquid. This wave function evolves in thepotential field generated by the liquid distribution, and itsHamiltonian is time dependent, He�t�=He��He�t��. Let �n
t bean eigenfunction of the Hamiltonian at time t, so thatHe�t��n
t =�n�t��nt . If �n�t� is the actual wave function �n
0
evolved up to time t, one has �n�t�=U�t��n0, where U is the
evolution operator. In the adiabatic approximation, one iden-tifies �n�t� with �n
t , the intuitive justification being that ifone perturbes the subsystem slowly and gently enough, it hasenough time to adapt itself to the new environment “with noinertia” from the past configuration.The error made in this approximation for a given state
�i�—the validity of the adiabatic approximation is assessedfor a given state of the subsystem, not necessarily for themall—is defined as the probability of finding the subsystem ina state different from the initial one evolved in time withinthe “true” dynamics, �ij= � � j
t�U�t���i0��2. This error can be
written in a workable way as48
t = 12 ps t = 22 ps
-40 -20 0 20 40
-40
-20
0
20
40
x (A)
z(A
)-40
-20
0
20
40
-40 -20 0 20 40
P=
0bar
P=
5bar
FIG. 8. �Color online� Current field at P=0 bar �top panels� and5 bars �bottom panels� at time t=12 ps �left� and t=22 ps �right�.In each panel, the larger the arrow, the larger the current.
-40 -20 0 20 40
-40
-20
0
20
40
x (A)
z(A
)-40
-20
0
20
40
-40 -20 0 20 40
t=2 ps 3 ps
5 ps 7 ps
FIG. 9. �Color online� Adiabatic evolution of the 2P ebubble atP=0 bar. The panels display the helium configurations correspond-ing to 2, 3, 5, and 7 ps.
EVOLUTION OF THE EXCITED ELECTRON BUBBLE… PHYSICAL REVIEW B 81, 174510 �2010�
174510-7
30 CHAPTER 3. DYNAMICS

�ij�t� = � �
�� j�t� − �i�t��2 � j
t�dHe
dt��i
t��2. �7�
If �ij �1∀ i� j, the adiabatic approximation is justified. It isusually understood that it breaks down when the levels getvery close or when they cross each other. Notice, however,that this assumes that these states can be connected by theevolved Hamiltonian. If a symmetry is dynamically con-served �in our case, angular momentum and specular sym-metry are�, then the adiabatic evolution of states with a givenquantum number associated to this symmetry is not per-turbed by states with different values of this quantum num-ber. Although sometimes ignored, this is a very reasonablestatement.In the case of the 1�− state arising from the spherical 1P
manifold, the adiabatic approximation holds even when itsenergy becomes almost identical to the energy of the 1�+
state arising from the spherical 1S one, i.e., a small doesnot invalidate the adiabatic approximation. The closest statehaving the same angular momentum and specular symmetryis the 2�− one arising from the spherical 1F manifold. AtP=5 bars, we have found that these two states are 2000 Kapart in the 10–20 ps range. Since ��7.6 K ps, one has� / �E2�−−E1�−�2�2�10−6 ps K−1. The value of the matrixelement in Eq. �7� is some tens of kelvin per picosecond, sothat the adiabatic approximation would be fulfilled even forthe configuration displayed in Fig. 4 at 25 ps. Indeed, wehave calculated � in the above time range and have foundthat it is on the order of 10−8.It is also worth analyzing the stability of the quasiequilib-
rium configurations when the symmetries are not exactlyconserved because of perturbations from the environment. Inthis situation, let us assume that when the bubble splits theelectron localizes in one of the lobes. Leaving out the dis-cussion on the actual localization process, we have tried toinfer the likely evolution of an ebubble with a localized elec-tron. The localized electron state in either baby bubble isapproximated by
� =1�2�1S
1�2�1P. �8�
Consider now a short-time dynamics in which the liquid iskept frozen. The evolution of, e.g., the �+ localized state isan oscillation between the two lobes
��t� = e−iE1St/��cos��t��+ − i sin��t��−� , �9�
where �= �E1P−E1S� /�. If this frequency is large enough,the liquid cannot react to the localization of the electron ineither lobe and will essentially behave as if the electron weredelocalized.The time elapsed between two consecutive localizations
of the electron in a given baby bubble is �=� /�. The valueof this period as a function of pressure for the quasiequilib-rium configurations is displayed in Fig. 10. In the split-bubble regime �P�9 bars�, this period is of several picosec-ond, indicating that the electron-localization dynamics intoone of the baby bubbles is not a trivial process to address.
The electron will bounce back and forth as the liquid tries toadapt to it. Real-time calculations are thus needed to describeelectron localization.It is clear that the previous discussion on the validity of
the adiabatic evolution lacks for incorporating fluctuations orexcitations of low-energy modes that may appear in thecourse of the bubble evolution and couple the 1P and 1Sstates that otherwise are not, as previously discussed. Onesuch mode has been thoroughly addressed by Elser:27 a pea-nut configuration, whose walls are impenetrable by the elec-tron, is represented by two intersecting sharp spheres of ra-dius R2 �instead of the deformed baby bubbles displayed inFig. 4� joined along a circular orifice of radius a. Thesespheres are breathing in counterphase, producing an antisym-metric mode whose stiffness K and inertia M can be ob-tained analytically. This mode is very appealing, as it repre-sents a small, swifting imbalance of the symmetric electron-probability density.In the harmonic limit, if a�R2, the stiffness and inertia of
the asymmetric mode are49
K = 16� E02
R22+ ��� + R2P�� ,
M = 4��m4He�0R23. �10�
In these equations, E0=�R02�9 meV represents the energy
unit with �=2.36�10−2 meV Å−2 being the surface tensionof the liquid, R0�20 Å is the radius of the spherical bubble,R2�16 Å is the radius of the baby bubbles, ��1.70 is adimensionless constant, and =E1P−E1S. The frequency ofthe antisymmetric breathing mode is given by �AB=�K /M,and the radius of the orifice is27
0
1
2
3
4
5
3 6 9 12 15 18
P (bar)
τ(p
s)
1√2
φ1S1√2
φ1Pφ+ = +
FIG. 10. �Color online� Top: superposition of the 1S and 1Pstates corresponding to the quasiequilibrium configuration at P=9 bars to approximately localize the electron in one of the babybubbles. Bottom: tunneling period of a localized electron in one ofthe lobes of the quasiequilibrium ebubble as a function of pressure.
MATEO, PI, AND BARRANCO PHYSICAL REVIEW B 81, 174510 �2010�
174510-8
3.1. EVOLUTION OF THE EXCITED ELECTRON BUBBLE. . . 31
=4�
3E0�R0
R2�2� a
R2�3. �11�
The adiabatic approximation fails when �AB� /�. Thisyields �0.14 meV in the P=0–5 bars range, as only thefirst term in the stiffness turns out to be relevant in thisregime. Thus, keeping only the first term in K, one gets50
a
R2= �� 27
8�4��� me
mHe�0R03��R2
R0��1/9
� 0.13. �12�
Hence, a�2.1 Å. Clearly, such analytical results cannot beobtained within the DF approach, but we can use them todetermine whether the dynamic and static configurationsshown in Secs. II and III are reliable.The adiabatic approximation thus holds at P=0 bar, as
the neck radius is fairly large, see Fig. 3, and is alwaysmuch larger than 0.14 meV, see Fig. 5. From Fig. 4 we alsoconclude that, at P=5 bars, the adiabatic approximation isvalid up to nearly the collapse of the waist. Indeed, the neckradius of the helium configuration at about 17–18 ps is�2 Å, see Fig. 4. It is worth noting the difficulty in definingan effective radius for the orifice when the surface of thebubble is diffuse; we recall that the surface thickness of a4He drop of 103–104 atoms is some 6–8 Å.51 Note also thatthe surface thickness of the helium bubble is rather indepen-dent of the curvature of the surface, as can be inferred fromthe fairly constant bright region around the bubbles dis-played in Figs. 3 and 4.Since we do not treat the bubble as impenetrable to the
excess electron, the relation between the actual and a val-ues should not exactly be as given by Eq. �11�. Using theresult ��AB�=0.14 meV as a criterion for the applicabil-ity of the adiabatic approximation instead of reaching thelimiting value a�2 Å, we find that the approximation holdsup to 21 ps, when the bubble has already split into two babybubbles. Both procedures indicate that when the adiabaticapproximation likely fails, the baby bubbles have alreadydeveloped.The previous analysis leads us to conclude that, at high
pressures, baby bubbles are formed some tens of picosecondafter the starting of the collapse of the 1P bubble. From thispoint on, the likely fate of the system is the localization ofthe electron in one of the baby bubbles and the collapse ofthe other. This process is helped/triggered by fluctuationsthat break the specular symmetry of the ebubble configura-tion. As mentioned, determining the time scale of electronlocalization is beyond the capabilities of the adiabatic ap-proximation. It has been calculated21 that once the electron islocalized, it takes to the superfluid some 20 ps to adapt to itwhile the other baby bubble is absorbed.
V. SUMMARY
Within density-functional theory, we have carried out ananalysis of the adiabatic evolution of the excited electronbubble in superfluid liquid 4He. We have found that for pres-
sures below 1 bar, the 1P ebubble may relax to its quasistaticequilibrium configuration and decay radiatively to the de-formed 1S state. This state evolves nonradiatively to thespherical 1S bubble, completing the absorption/emissioncycle. This conclusion arises, in part, from studies carried outfor 100 ps using a less accurate functional,52 whose resultsqualitatively agree with ours for the first tens of picosecond.At higher pressures, the situation drastically changes and
the excited 1P bubble no longer decays to the quasistaticequilibrium configuration, whose physical realization is un-likely. Indeed, our analysis of the adiabatic approximationindicates that it is valid up to a point where two deformed,nearly disconnected baby bubbles appear in the dynamicalevolution, pointing toward a fission-like de-excitation pro-cess, the likely subsequent evolution of the system being thelocalization of the electron in one of the baby bubbles andthe collapse of the other. This collapse takes some 20 ps,21
and the whole de-excitation process is radiationless.We have also found a marked change in the behavior of
the time-resolved absorption spectrum of the 1P bubble de-pending on whether the bubble fissions or not, i.e., on theliquid pressure. This change is, in principle, an experimen-tally accessible observable whose determination maycomplement the information obtained from cavitation andphotoconductivity experiments.Our analysis of the collapse of the 2P bubble has shown
that the adiabatic approximation breaks down at an earlystage of the dynamical process due to the crossing of 2P and1F states. Although disclosed by the adiabatic approxima-tion, this crossing has nothing to do with the approximationitself, but is inherent to the dynamics of the electron bubble.From the crossing point on, the bubble will relax around amixed state with 2P and 1F components, and hence thephysical realization of a pure quasiequilibrium 2P configura-tion is unlikely. It is very plausible that the same applies toother high-energy nL ebubbles generated in the absorptionprocess. The possibility that some of them undergo a spon-taneous symmetry breaking, as suggested by Grinfeld andKojima53 for the 2S state, can only reinforce our conclusion.Obviously, this does not question the existence of either re-laxed quasiequilibrium configurations at low pressures or ofbaby bubbles at high pressures, arising from the evolution ofthe spherical 2P bubble. It just means that, on the one hand,the relaxed bubble will not be a pure 2P configuration and,on the other hand, to study the de-excitation of these bubblesone has to go beyond the adiabatic approximation and carryout a more demanding real-time dynamics calculation for theelectron.
ACKNOWLEDGMENTS
We thank Humphrey Maris, Francesco Ancilotto, DafeiJin, and Alberto Hernando for useful discussions. This workhas been performed under Grant No. FIS2008-00421/FISfrom DGI, Spain �FEDER�, and Grant No. 2009SGR1289from Generalitat de Catalunya.
EVOLUTION OF THE EXCITED ELECTRON BUBBLE… PHYSICAL REVIEW B 81, 174510 �2010�
174510-9
32 CHAPTER 3. DYNAMICS

1M. Rosenblit and J. Jortner, J. Chem. Phys. 124, 194505 �2006�;124, 194506 �2006�.
2H. J. Maris, J. Phys. Soc. Jpn. 77, 111008 �2008�.3 J. A. Northby and T. M. Sanders, Phys. Rev. Lett. 18, 1184
�1967�.4W. B. Fowler and D. L. Dexter, Phys. Rev. 176, 337 �1968�.5T. Miyakawa and D. L. Dexter, Phys. Rev. A 1, 513 �1970�.6C. C. Grimes and G. Adams, Phys. Rev. B 41, 6366 �1990�.7C. C. Grimes and G. Adams, Phys. Rev. B 45, 2305 �1992�.8 J. Eloranta and V. A. Apkarian, J. Chem. Phys. 117, 10139
�2002�.9V. Grau, M. Barranco, R. Mayol, and M. Pi, Phys. Rev. B 73,064502 �2006�.
10L. Lehtovaara and J. Eloranta, J. Low Temp. Phys. 148, 43�2007�.
11B. DuVall and V. Celli, Phys. Rev. 180, 276 �1969�.12M. Pi, R. Mayol, A. Hernando, M. Barranco, and F. Ancilotto, J.Chem. Phys. 126, 244502 �2007�.
13W. Guo, D. Jin, G. M. Seidel, and H. J. Maris, Phys. Rev. B 79,054515 �2009�.
14A. Ghosh and H. J. Maris, Phys. Rev. Lett. 95, 265301 �2005�.15 J. Tempere, I. F. Silvera, and J. T. Devreese, Surf. Sci. Rep. 62,159 �2007�.
16 J. Fang, A. E. Dementyev, J. Tempere, and I. F. Silvera, Rev. Sci.Instrum. 80, 043901 �2009�.
17F. Dalfovo, A. Lastri, L. Pricaupenko, S. Stringari, and J.Treiner, Phys. Rev. B 52, 1193 �1995�.
18S. Stringari and J. Treiner, Phys. Rev. B 36, 8369 �1987�; J.Chem. Phys. 87, 5021 �1987�.
19N. G. Berloff and P. H. Roberts, Phys. Rev. B 63, 024510�2000�; J. Phys. A 34, 81 �2001�.
20E. J. M. Madarassy and C. F. Barenghi, J. Low Temp. Phys. 152,122 �2008�.
21D. Jin, W. Guo, W. Wei, and H. J. Maris, J. Low Temp. Phys.158, 307 �2010�.
22D. Jin and H. J. Maris, J. Low Temp. Phys. 158, 317 �2010�.23N. G. Berloff and P. H. Roberts, J. Phys. A 32, 5611 �1999�.24N. G. Berloff and P. H. Roberts, Phys. Lett. A 274, 69 �2000�.25D. Mateo, A. Hernando, M. Barranco, and M. Pi, J. Low Temp.Phys. 158, 397 �2010�.
26H. J. Maris, J. Low Temp. Phys. 132, 77 �2003�.27V. Elser, J. Low Temp. Phys. 123, 7 �2001�.28R. Jackiw, C. Rebbi, and J. R. Schrieffer, J. Low Temp. Phys.
122, 587 �2001�.29F. Ancilotto, M. Barranco, and M. Pi, Phys. Rev. Lett. 91,105302 �2003�.
30L. Lehtovaara, T. Kiljunen, and J. Eloranta, J. Comput. Phys.194, 78 �2004�.
31L. Giacomazzi, F. Toigo, and F. Ancilotto, Phys. Rev. B 67,104501 �2003�.
32F. Ancilotto, F. Dalfovo, L. P. Pitaevskii, and F. Toigo, Phys.Rev. B 71, 104530 �2005�.
33E. Cheng, M. W. Cole, and M. H. Cohen, Phys. Rev. B 50, 1136�1994�; 50, 16134 �1994� �erratum�.
34M. Pi, M. Barranco, R. Mayol, and V. Grau, J. Low Temp. Phys.139, 397 �2005�.
35M. Frigo and S. G. Johnson, Proc. IEEE 93, 216 �2005�.36M. Barranco, M. Guilleumas, E. S. Hernández, R. Mayol, M. Pi,and L. Szybisz, Phys. Rev. B 68, 024515 �2003�.
37M. Rosenblit and J. Jortner, Phys. Rev. Lett. 75, 4079 �1995�.38M. Rosenblit and J. Jortner, J. Phys. Chem. A 101, 751 �1997�.39A. Ralston and H. S. Wilf, Mathematical Methods for Digital
Computers �Wiley, New York, 1960�.40M. Barranco, R. Guardiola, S. Hernández, R. Mayol, J. Navarro,and M. Pi, J. Low Temp. Phys. 142, 1 �2006�.
41Ch. Cerjan, D. Kosloff, R. Kosloff, and M. Reshef, Geophysics50, 705 �1985�.
42H. J. Maris, A. Ghosh, D. Konstantinov, and M. Hirsch, J. LowTemp. Phys. 134, 227 �2004�.
43M. Weissbluth, Atoms and Molecules �Academic Press, NewYork, 1978�.
44Recall that if the initial state �b� is not the ground state, the sumincludes negative terms arising from de-excitation transitions,hence a partial sum can be greater than unity.
45H. J. Maris, J. Low Temp. Phys. 120, 173 �2000�.46A. I. M. Rae and W. F. Vinen, J. Low Temp. Phys. 123, 1 �2001�.47U. Brosa, S. Grossmann, A. Müller, and E. Becker, Nucl. Phys.A 502, 423 �1989�.
48A. Messiah, Quantum Mechanics �North-Holland, Amsterdam,1962�.
49Since the asymmetric mode of Ref. 27 does not conserve thevolume of the bubble, the stiffness slightly changes from theexpression given in Ref. 27 if P�0. In the numerical applica-tion we have used the ��P� law deduced in Ref. 9.
50This equation differs from Eq. �9� of Ref. 27 because of an errormade there to obtain it from a straightforward combination of itsEqs. �3� and �8�, as can be easily checked.
51J. Harms, J. P. Toennies, and F. Dalfovo, Phys. Rev. B 58, 3341�1998�.
52D. Jin, W. Guo, W. Wei, and H. J. Maris �unpublished�, and Ref.21.
53P. Grinfeld and H. Kojima, Phys. Rev. Lett. 91, 105301 �2003�.
MATEO, PI, AND BARRANCO PHYSICAL REVIEW B 81, 174510 �2010�
174510-10
3.1. EVOLUTION OF THE EXCITED ELECTRON BUBBLE. . . 33
34 CHAPTER 3. DYNAMICS
3.2 Excited electron-bubble states in superfluid 4He: Atime-dependent density functional approach
Resumen (Spanish)
Presentamos un estudio sistematico de los diferentes estados excitados de las burbujaselectronicas en 4He superfluido usando el metodo del funcional de la densidad dependientedel tiempo. Para describir la evolucion de las burbujas 1P hemos usado dos funcionalesdistintos junto con dos esquemas diferentes de evolucion temporal: un funcional precisode rango finito para el helio con una aproximacion adiabatica para el electron, y unfuncional eficiente de rango cero para el helio con una evolucion en tiempo real para elelectron. Una comparacion detallada entre los resultados obtenidos con cada metodo nospermite seleccionar el mas idoneo para cada problema.
Con este conocimiento previo, hemos aplicado el funcional de rango finito al calculo delespectro de absorcion de las burbujas 1P resuelto temporalmente, en principio accesibleexperimentalmente con la tecnologıa actual. Tambien hemos usado el funcional de rangocero para calcular la evolucion en tiempo real de la burbuja 2P durante unos cientos depicosegundos, que presenta interes a nivel teorico debido a la perdida de adiabaticidad deeste estado. Nuestros resultados permiten descartar la existencia de burbujas metaestablesrelajadas entorno de estados excitados por encima del 1P, invalidando por no ser fısicosestudios previos de estos estados llevados a cabo con metodos estaticos.
THE JOURNAL OF CHEMICAL PHYSICS 134, 044507 (2011)
Excited electron-bubble states in superfluid 4He: A time-dependent densityfunctional approach
David Mateo,1 Dafei Jin,2 Manuel Barranco,1 and Martí Pi11Departament ECM, Facultat de Física, and IN2UB, Universitat de Barcelona. Diagonal 647,08028 Barcelona, Spain2Department of Physics, Brown University, Providence, Rhode Island 02912, USA
(Received 3 November 2010; accepted 30 December 2010; published online 24 January 2011)
We present a systematic study on the excited electron-bubble states in superfluid 4He using a time-dependent density functional approach. For the evolution of the 1P bubble state, two different func-tionals accompanied with two different time-development schemes are used, namely an accuratefinite-range functional for helium with an adiabatic approximation for electron versus an efficientzero-range functional for helium with a real-time evolution for electron. We make a detailed com-parison between the quantitative results obtained from the two methods, which allow us to employwith confidence the optimal method for suitable problems. Based on this knowledge, we use thefinite-range functional to calculate the time-resolved absorption spectrum of the 1P bubble, which inprinciple can be experimentally determined, and we use the zero-range functional to real-time evolvethe 2P bubble for several hundreds of picoseconds, which is theoretically interesting due to the breakdown of adiabaticity for this state. Our results discard the physical realization of relaxed, metastableconfigurations above the 1P state. © 2011 American Institute of Physics. [doi:10.1063/1.3544216]
I. INTRODUCTION
Electron bubble (e-bubble) in liquid helium has beenan attractive topic for numerous experimental and theoreti-cal studies in the past, and it has drawn again some inter-est in recent years.1–11 Density functional (DF) theory hasproved to be a powerful tool in dealing with many interest-ing physical situations involving electron bubbles. When it isapplied to optically excited e-bubbles, not only can it achievequantitative agreement with experiments on the absorptionspectra,1, 3, 12, 13 but it can also nicely display the dynamicalevolutions on the picosecond time scale, such as how the bub-bles change shapes, release energy, or even break into smallerbubbles.14,15 These latest works likely require using differ-ent density functionals (finite-range or zero-range for liquidhelium) in different time-development schemes (adiabatic orreal-time evolutions for electron). Regardless of the technicaldetails, the time-dependent density functional approach is nodoubt the only workable approach at present for studying theevolution of the excited e-bubble states in liquid helium. Thequantitative results drawn from these simulations can be use-ful to interpret the experimental results and predict new ones.
Upon dipole excitation from the 1S ground state to the1P or 2P excited state, an e-bubble evolves by relaxing itsshape around the excited electron probability density. This re-laxation eventually drives the e-bubble back to the spherical1S ground state. It has been quantitatively shown15 that de-pending on the pressure (P) applied to the liquid, this mayhappen in two different ways. At a pressure below about 1bar, the e-bubble undergoes damped oscillations for a periodof time long enough to allow the electron to radiatively decayto the deformed 1S state, which then evolves radiationlesslyto the spherical 1S state. In contrast, at 1 bar or above, theexcited e-bubble evolves toward a configuration made of twobaby bubbles, so that the probability of finding the electron
evenly distributes between them. This two-bubble configura-tion is unstable against asymmetric perturbations, and one ex-pects this instability to cause the electron to localize in one ofthe baby bubbles while the other collapses.12, 15, 16
When doing this calculation, the authors of Ref. 15 nat-urally chose the so-called Orsay–Trento DF.17 This func-tional is finite range and incorporates a term that mimicsbackflow effects in order to accurately reproduce the disper-sion relation of the elementary excitations of superfluid 4He.This is instrumental to properly describe the energy trans-fer from the bubble to the liquid that proceeds by causingall sorts of possible excitations in the superfluid. The tokenone has to pay for its use is the very high computational cost.Due to the large difference between the intrinsic time scalesof electron and helium, this functional is not well adaptedfor fully real-time, three-dimensional evolutions. Consider-ing this limitation, the adiabatic approximation was used toupdate the electron wavefunction at every instantaneous he-lium configuration.15 One of the main concerns is then to es-tablish how long the adiabatic approximation is valid for. Acareful analysis led to the conclusion that it holds for the 1Pe-bubble for at least several tens of picoseconds,15 a periodof time large enough to guarantee the reliability of the resultsobtained for this state. Contrarily, the adiabatic approxima-tion breaks down very quickly for the 2P e-bubble, implyingthat the existence of relaxed quasiequilibrium 2P bubbles isquestionable.
The authors of Ref. 14 followed a different path. In-stead of using a finite-range DF, they employed a much sim-pler zero-range one. This allowed them to carry out fullyreal-time calculations for hundreds of picoseconds withoutimposing any adiabatic assumption, at the price of an inac-curate description of the elementary excitations of the liq-uid. Although this may not qualitatively affect the physical
0021-9606/2011/134(4)/044507/9/$30.00 © 2011 American Institute of Physics134, 044507-1
Downloaded 27 May 2011 to 161.116.81.135. Redistribution subject to AIP license or copyright; see http://jcp.aip.org/about/rights_and_permissions
3.2. EXCITED ELECTRON-BUBBLE STATES IN SUPERFLUID 4HE. . . 35
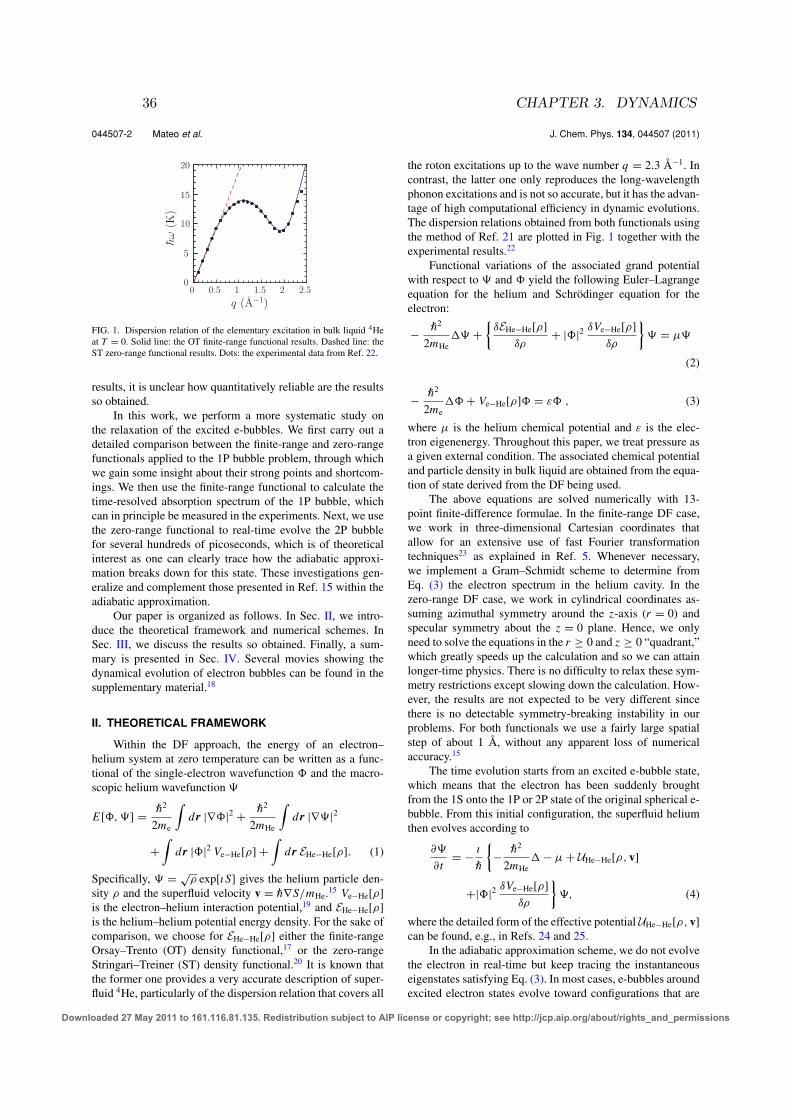
044507-2 Mateo et al. J. Chem. Phys. 134, 044507 (2011)
0 0.5 1 1.5 2 2.50
5
10
15
20
q (A−1)
hω
(K)
FIG. 1. Dispersion relation of the elementary excitation in bulk liquid 4Heat T = 0. Solid line: the OT finite-range functional results. Dashed line: theST zero-range functional results. Dots: the experimental data from Ref. 22.
results, it is unclear how quantitatively reliable are the resultsso obtained.
In this work, we perform a more systematic study onthe relaxation of the excited e-bubbles. We first carry out adetailed comparison between the finite-range and zero-rangefunctionals applied to the 1P bubble problem, through whichwe gain some insight about their strong points and shortcom-ings. We then use the finite-range functional to calculate thetime-resolved absorption spectrum of the 1P bubble, whichcan in principle be measured in the experiments. Next, we usethe zero-range functional to real-time evolve the 2P bubblefor several hundreds of picoseconds, which is of theoreticalinterest as one can clearly trace how the adiabatic approxi-mation breaks down for this state. These investigations gen-eralize and complement those presented in Ref. 15 within theadiabatic approximation.
Our paper is organized as follows. In Sec. II, we intro-duce the theoretical framework and numerical schemes. InSec. III, we discuss the results so obtained. Finally, a sum-mary is presented in Sec. IV. Several movies showing thedynamical evolution of electron bubbles can be found in thesupplementary material.18
II. THEORETICAL FRAMEWORK
Within the DF approach, the energy of an electron–helium system at zero temperature can be written as a func-tional of the single-electron wavefunction � and the macro-scopic helium wavefunction �
E[�,�] = ¯22me
∫d r |∇�|2 + ¯2
2mHe
∫d r |∇�|2
+∫d r |�|2 Ve−He[ρ]+
∫d r EHe−He[ρ]. (1)
Specifically, � = √ρ exp[ı S] gives the helium particle den-
sity ρ and the superfluid velocity v = ¯∇S/mHe.15 Ve−He[ρ]is the electron–helium interaction potential,19 and EHe−He[ρ]is the helium–helium potential energy density. For the sake ofcomparison, we choose for EHe−He[ρ] either the finite-rangeOrsay–Trento (OT) density functional,17 or the zero-rangeStringari–Treiner (ST) density functional.20 It is known thatthe former one provides a very accurate description of super-fluid 4He, particularly of the dispersion relation that covers all
the roton excitations up to the wave number q = 2.3 Å−1. Incontrast, the latter one only reproduces the long-wavelengthphonon excitations and is not so accurate, but it has the advan-tage of high computational efficiency in dynamic evolutions.The dispersion relations obtained from both functionals usingthe method of Ref. 21 are plotted in Fig. 1 together with theexperimental results.22
Functional variations of the associated grand potentialwith respect to � and � yield the following Euler–Lagrangeequation for the helium and Schrödinger equation for theelectron:
− ¯22mHe
�� +{
δEHe−He[ρ]δρ
+ |�|2 δVe−He[ρ]δρ
}� = μ�
(2)
− ¯22me
�� + Ve−He[ρ]� = ε� , (3)
where μ is the helium chemical potential and ε is the elec-tron eigenenergy. Throughout this paper, we treat pressure asa given external condition. The associated chemical potentialand particle density in bulk liquid are obtained from the equa-tion of state derived from the DF being used.
The above equations are solved numerically with 13-point finite-difference formulae. In the finite-range DF case,we work in three-dimensional Cartesian coordinates thatallow for an extensive use of fast Fourier transformationtechniques23 as explained in Ref. 5. Whenever necessary,we implement a Gram–Schmidt scheme to determine fromEq. (3) the electron spectrum in the helium cavity. In thezero-range DF case, we work in cylindrical coordinates as-suming azimuthal symmetry around the z-axis (r = 0) andspecular symmetry about the z = 0 plane. Hence, we onlyneed to solve the equations in the r ≥ 0 and z ≥ 0 “quadrant,”which greatly speeds up the calculation and so we can attainlonger-time physics. There is no difficulty to relax these sym-metry restrictions except slowing down the calculation. How-ever, the results are not expected to be very different sincethere is no detectable symmetry-breaking instability in ourproblems. For both functionals we use a fairly large spatialstep of about 1 Å, without any apparent loss of numericalaccuracy.15
The time evolution starts from an excited e-bubble state,which means that the electron has been suddenly broughtfrom the 1S onto the 1P or 2P state of the original spherical e-bubble. From this initial configuration, the superfluid heliumthen evolves according to
∂�
∂t= − ı¯
{− ¯22mHe
� − μ + UHe−He[ρ, v]
+|�|2 δVe−He[ρ]δρ
}�, (4)
where the detailed form of the effective potential UHe−He[ρ, v]can be found, e.g., in Refs. 24 and 25.
In the adiabatic approximation scheme, we do not evolvethe electron in real-time but keep tracing the instantaneouseigenstates satisfying Eq. (3). In most cases, e-bubbles aroundexcited electron states evolve toward configurations that are
Downloaded 27 May 2011 to 161.116.81.135. Redistribution subject to AIP license or copyright; see http://jcp.aip.org/about/rights_and_permissions
36 CHAPTER 3. DYNAMICS
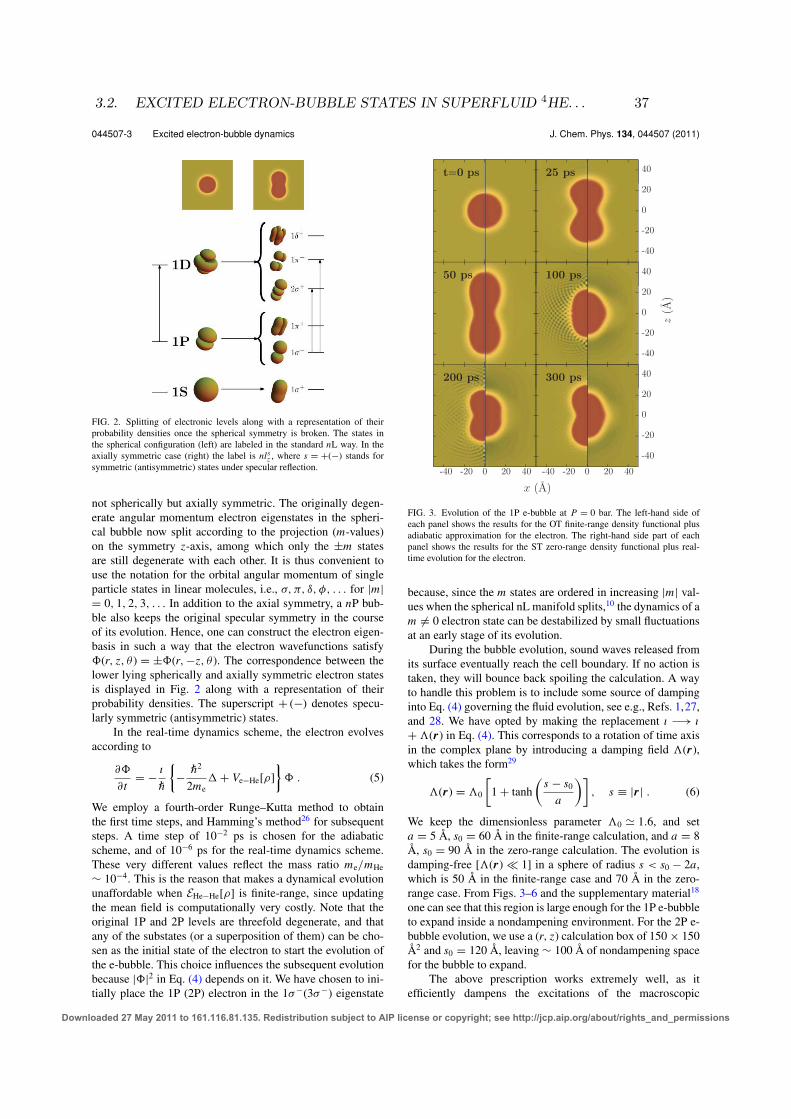
044507-3 Excited electron-bubble dynamics J. Chem. Phys. 134, 044507 (2011)
FIG. 2. Splitting of electronic levels along with a representation of theirprobability densities once the spherical symmetry is broken. The states inthe spherical configuration (left) are labeled in the standard nL way. In theaxially symmetric case (right) the label is nlsz , where s = +(−) stands forsymmetric (antisymmetric) states under specular reflection.
not spherically but axially symmetric. The originally degen-erate angular momentum electron eigenstates in the spheri-cal bubble now split according to the projection (m-values)on the symmetry z-axis, among which only the ±m statesare still degenerate with each other. It is thus convenient touse the notation for the orbital angular momentum of singleparticle states in linear molecules, i.e., σ, π, δ, φ, . . . for |m|= 0, 1, 2, 3, . . . In addition to the axial symmetry, a nP bub-ble also keeps the original specular symmetry in the courseof its evolution. Hence, one can construct the electron eigen-basis in such a way that the electron wavefunctions satisfy�(r, z, θ ) = ±�(r,−z, θ ). The correspondence between thelower lying spherically and axially symmetric electron statesis displayed in Fig. 2 along with a representation of theirprobability densities. The superscript + (−) denotes specu-larly symmetric (antisymmetric) states.
In the real-time dynamics scheme, the electron evolvesaccording to
∂�
∂t= − ı¯
{− ¯22me
� + Ve−He[ρ]}
� . (5)
We employ a fourth-order Runge–Kutta method to obtainthe first time steps, and Hamming’s method26 for subsequentsteps. A time step of 10−2 ps is chosen for the adiabaticscheme, and of 10−6 ps for the real-time dynamics scheme.These very different values reflect the mass ratio me/mHe∼ 10−4. This is the reason that makes a dynamical evolutionunaffordable when EHe−He[ρ] is finite-range, since updatingthe mean field is computationally very costly. Note that theoriginal 1P and 2P levels are threefold degenerate, and thatany of the substates (or a superposition of them) can be cho-sen as the initial state of the electron to start the evolution ofthe e-bubble. This choice influences the subsequent evolutionbecause |�|2 in Eq. (4) depends on it. We have chosen to ini-tially place the 1P (2P) electron in the 1σ−(3σ−) eigenstate
-40 -20 0 20 40
-40
-20
0
20
40
x (A)
z(A
)
-40
-20
0
20
40
-40
-20
0
20
40
-40 -20 0 20 40
t=0 ps 25 ps
50 ps
200 ps
100 ps
300 ps
FIG. 3. Evolution of the 1P e-bubble at P = 0 bar. The left-hand side ofeach panel shows the results for the OT finite-range density functional plusadiabatic approximation for the electron. The right-hand side part of eachpanel shows the results for the ST zero-range density functional plus real-time evolution for the electron.
because, since the m states are ordered in increasing |m| val-ues when the spherical nL manifold splits,10 the dynamics of am �= 0 electron state can be destabilized by small fluctuationsat an early stage of its evolution.
During the bubble evolution, sound waves released fromits surface eventually reach the cell boundary. If no action istaken, they will bounce back spoiling the calculation. A wayto handle this problem is to include some source of dampinginto Eq. (4) governing the fluid evolution, see e.g., Refs. 1,27,and 28. We have opted by making the replacement ı −→ ı+ (r) in Eq. (4). This corresponds to a rotation of time axisin the complex plane by introducing a damping field (r),which takes the form29
(r) = 0
[1+ tanh
(s − s0a
)], s ≡ |r| . (6)
We keep the dimensionless parameter 0 � 1.6, and seta = 5 Å, s0 = 60 Å in the finite-range calculation, and a = 8Å, s0 = 90 Å in the zero-range calculation. The evolution isdamping-free [ (r) � 1] in a sphere of radius s < s0 − 2a,which is 50 Å in the finite-range case and 70 Å in the zero-range case. From Figs. 3–6 and the supplementary material18
one can see that this region is large enough for the 1P e-bubbleto expand inside a nondampening environment. For the 2P e-bubble evolution, we use a (r, z) calculation box of 150× 150Å2 and s0 = 120 Å, leaving ∼ 100 Å of nondampening spacefor the bubble to expand.
The above prescription works extremely well, as itefficiently dampens the excitations of the macroscopic
Downloaded 27 May 2011 to 161.116.81.135. Redistribution subject to AIP license or copyright; see http://jcp.aip.org/about/rights_and_permissions
3.2. EXCITED ELECTRON-BUBBLE STATES IN SUPERFLUID 4HE. . . 37
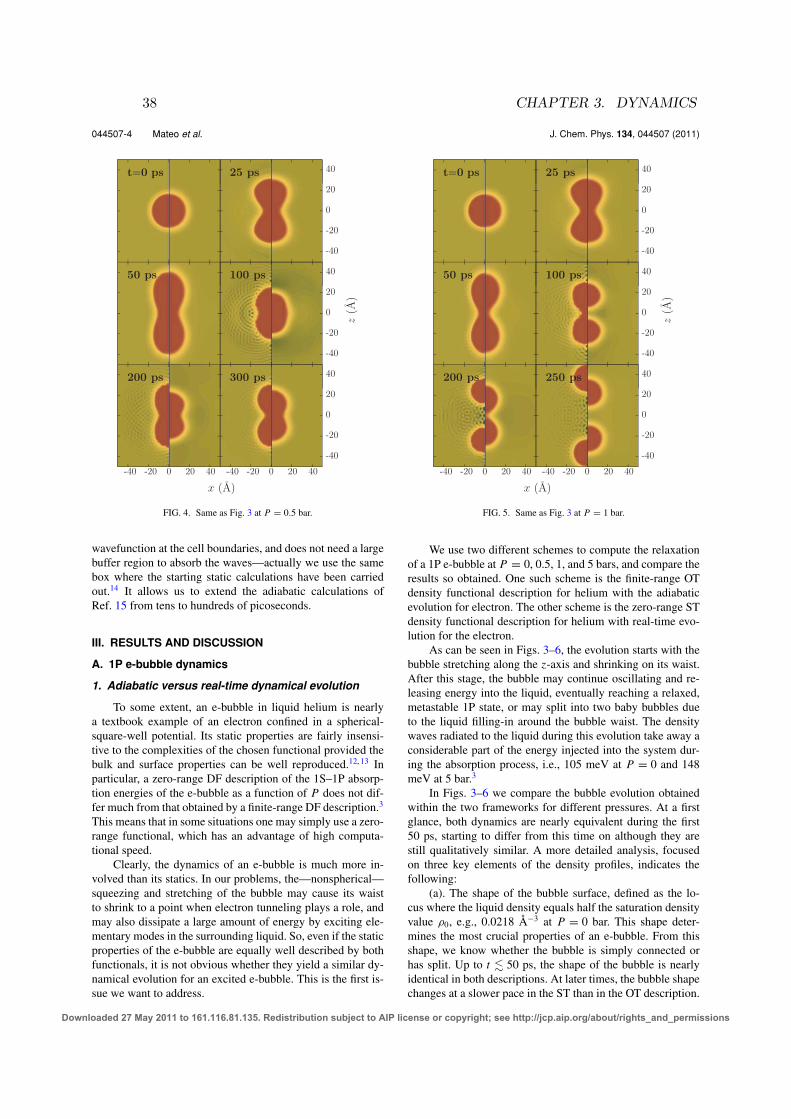
044507-4 Mateo et al. J. Chem. Phys. 134, 044507 (2011)
-40 -20 0 20 40
-40
-20
0
20
40
x (A)
z(A
)-40
-20
0
20
40
-40
-20
0
20
40
-40 -20 0 20 40
t=0 ps 25 ps
50 ps
200 ps
100 ps
300 ps
FIG. 4. Same as Fig. 3 at P = 0.5 bar.
wavefunction at the cell boundaries, and does not need a largebuffer region to absorb the waves—actually we use the samebox where the starting static calculations have been carriedout.14 It allows us to extend the adiabatic calculations ofRef. 15 from tens to hundreds of picoseconds.
III. RESULTS AND DISCUSSION
A. 1P e-bubble dynamics
1. Adiabatic versus real-time dynamical evolution
To some extent, an e-bubble in liquid helium is nearlya textbook example of an electron confined in a spherical-square-well potential. Its static properties are fairly insensi-tive to the complexities of the chosen functional provided thebulk and surface properties can be well reproduced.12,13 Inparticular, a zero-range DF description of the 1S–1P absorp-tion energies of the e-bubble as a function of P does not dif-fer much from that obtained by a finite-range DF description.3
This means that in some situations one may simply use a zero-range functional, which has an advantage of high computa-tional speed.
Clearly, the dynamics of an e-bubble is much more in-volved than its statics. In our problems, the—nonspherical—squeezing and stretching of the bubble may cause its waistto shrink to a point when electron tunneling plays a role, andmay also dissipate a large amount of energy by exciting ele-mentary modes in the surrounding liquid. So, even if the staticproperties of the e-bubble are equally well described by bothfunctionals, it is not obvious whether they yield a similar dy-namical evolution for an excited e-bubble. This is the first is-sue we want to address.
-40 -20 0 20 40
-40
-20
0
20
40
x (A)
z(A
)
-40
-20
0
20
40
-40
-20
0
20
40
-40 -20 0 20 40
t=0 ps 25 ps
50 ps
200 ps
100 ps
250 ps
FIG. 5. Same as Fig. 3 at P = 1 bar.
We use two different schemes to compute the relaxationof a 1P e-bubble at P = 0, 0.5, 1, and 5 bars, and compare theresults so obtained. One such scheme is the finite-range OTdensity functional description for helium with the adiabaticevolution for electron. The other scheme is the zero-range STdensity functional description for helium with real-time evo-lution for the electron.
As can be seen in Figs. 3–6, the evolution starts with thebubble stretching along the z-axis and shrinking on its waist.After this stage, the bubble may continue oscillating and re-leasing energy into the liquid, eventually reaching a relaxed,metastable 1P state, or may split into two baby bubbles dueto the liquid filling-in around the bubble waist. The densitywaves radiated to the liquid during this evolution take away aconsiderable part of the energy injected into the system dur-ing the absorption process, i.e., 105 meV at P = 0 and 148meV at 5 bar.3
In Figs. 3–6 we compare the bubble evolution obtainedwithin the two frameworks for different pressures. At a firstglance, both dynamics are nearly equivalent during the first50 ps, starting to differ from this time on although they arestill qualitatively similar. A more detailed analysis, focusedon three key elements of the density profiles, indicates thefollowing:
(a). The shape of the bubble surface, defined as the lo-cus where the liquid density equals half the saturation densityvalue ρ0, e.g., 0.0218 Å−3 at P = 0 bar. This shape deter-mines the most crucial properties of an e-bubble. From thisshape, we know whether the bubble is simply connected orhas split. Up to t � 50 ps, the shape of the bubble is nearlyidentical in both descriptions. At later times, the bubble shapechanges at a slower pace in the ST than in the OT description.
Downloaded 27 May 2011 to 161.116.81.135. Redistribution subject to AIP license or copyright; see http://jcp.aip.org/about/rights_and_permissions
38 CHAPTER 3. DYNAMICS

044507-5 Excited electron-bubble dynamics J. Chem. Phys. 134, 044507 (2011)
-40 -20 0 20 40
-40
-20
0
20
40
x (A)
z(A
)-40
-20
0
20
40
-40
-20
0
20
40
-40 -20 0 20 40
t=0 ps 5 ps
10 ps
20 ps
15 ps
25 ps
FIG. 6. Same as Fig. 3 at P = 5 bar.
Figure 7 illustrates the time evolution of the bubble sur-face. In particular, the top panel shows the evolution of thepoint on the bubble surface at r = 0 with z > 0. This repre-sents half the longitudinal extent of the e-bubble. One can seethat this length oscillates in the ST calculation with a lowerfrequency than in the OT one. Notice that superfluidity is in-strumental to keep the bubble surface oscillating without ap-preciable dampening (yet some energy is still released to theliquid). If helium were in the normal state, these oscillationswould be washed out more quickly due to viscosity effects,likely raising the pressure threshold at which the bubble splits.
0
10
20
30
40
50
z(A
)
P = 0 bar
0 50 100 150 200 250 3000
10
20
30
40
t (ps)
z(A
)
1 bar
FIG. 7. Evolution of the extent of the bubble along the z-axis at P = 0 and1 bar. The solid line is the OT finite-range result, and the dashed line is theST zero-range result.
If the bubble symmetrically splits into two baby bub-bles, there are two such points, as can be seen in the bot-tom panel for P = 1 bar. We have found that, besides themoment at which the distance between the baby bubbles in-creases steadily—about 175 ps for the OT functional and 200ps for ST functional—there is a time interval between ∼60and ∼90 ps for the OT functional, and ∼60 and ∼110 for theST functional, where the 1P bubble at P = 1 bar has splitbut the emerging baby bubbles are “locked” by the sharedelectron that exerts some attractive force on them, forcingthem back to a simply connected configuration. Eventually,the baby bubbles are unlocked and the distance between themgrows.
(b). The surface thickness of the bubble, defined as thewidth of the region satisfying 0.1ρ0 ≤ ρ(r) ≤ 0.9ρ0. Thethickness of the bubble surface has been found to be nearlyindependent of the local surface curvature at anytime duringthe evolution, see also Ref. 15. It is about 1 Å larger in theST than in the OT description,17,30 as can be seen in Figs. 3–6(the blurrier the bubble–helium interface, the larger the sur-face thickness). The zero temperature OT result, about 6 Å, isin agreement with the experimental findings.31,32
(c). The density oscillations traveling through the liquid.This is the point at which the differences between the twofunctionals become more apparent. The density waves pro-duced by the ST functional have much larger wavelengthsbecause this approach cannot sustain short wavelength inho-mogeneities due to the huge energy cost from the |∇ρ(r)|2surface energy term. The OT functional has not such a termand is free from this drawback. Roughly speaking, the shortwavelength waves arising in the OT approach are smeared outin a sort of big tsunami in the ST case, see for instance thepanels corresponding to t = 5 and 10 ps in Fig. 6. It is worthemphasizing that the wave interference pattern found in theOT description is not an artifact produced by waves bouncingback from the box boundaries, as those are already washedout by the damping term. It arises from the interference ofwaves produced at different points on the e-bubble surface.
We estimated in Ref. 15 that the first wave front wasmoving at supersonic velocities, about 330 m/s at P = 0 and410 m/s at P = 5 bar. This rises the interesting question ofwhether shock waves33 are generated by the displacement ofthe surface of the bubble. As a matter of fact, a shock wavewas launched in the spherical expansion of a highly com-pressed electron bubble.1 This wave travelled at supersonicvelocities (560 m/s), while the subsequent fronts moved atthe speed of sound, some 240 m/s. The analysis carried outby these authors was facilitated by the spherical geometryof the expansion that allowed them to use a very large boxfor this one-dimensional problem. In our case, the problemis three-dimensional, the wave fronts have a more complexstructure and our numerical scheme does not allow to confirmnor discard the appearance of shock waves in the superfluid.In particular, it does not allow us to distinguish between a verydistorted density profile, like that we have shown in Fig. 6 ofRef. 15, and a discontinuity in the density and pressure profilecharacterizing shock waves.33 Since there is no reason to be-lieve that geometry plays any fundamental role, we are proneto suggest that when the energy released to the liquid is large
Downloaded 27 May 2011 to 161.116.81.135. Redistribution subject to AIP license or copyright; see http://jcp.aip.org/about/rights_and_permissions
3.2. EXCITED ELECTRON-BUBBLE STATES IN SUPERFLUID 4HE. . . 39
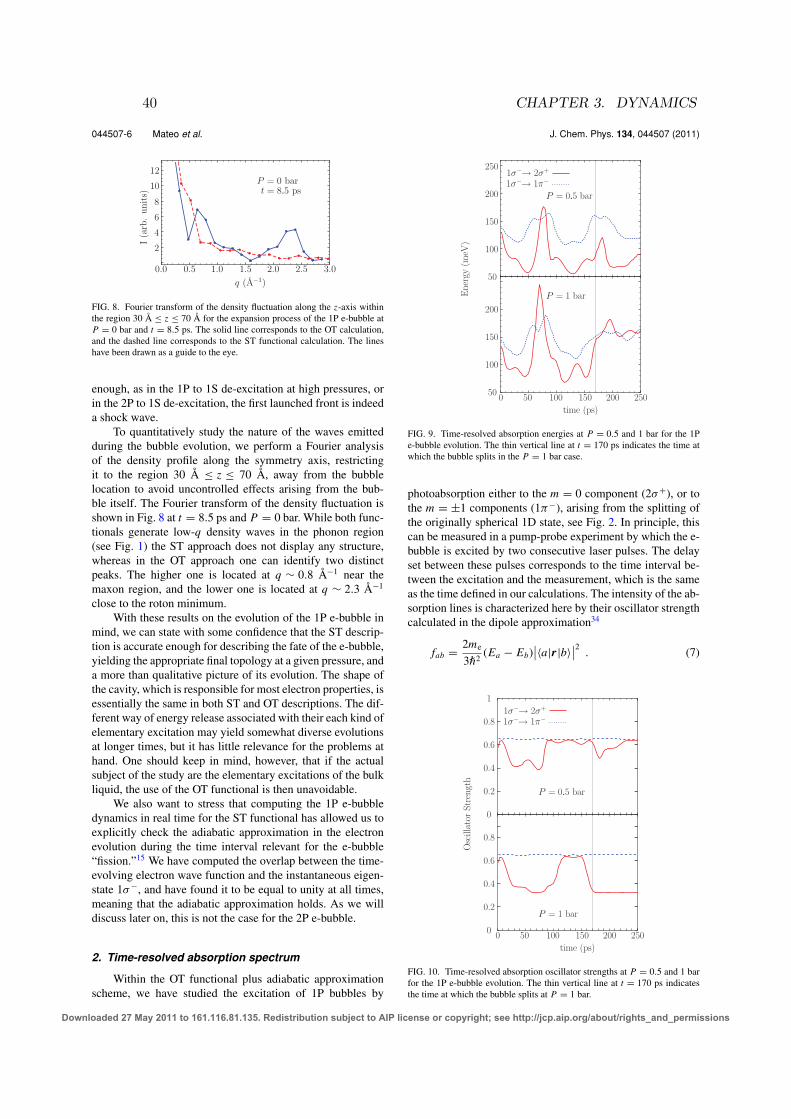
044507-6 Mateo et al. J. Chem. Phys. 134, 044507 (2011)
0.0 0.5 1.0 1.5 2.0 2.5 3.0
2
4
6
8
10
12
q (A−1)
I(a
rb.
unit
s)
P = 0 bart = 8.5 ps
FIG. 8. Fourier transform of the density fluctuation along the z-axis withinthe region 30 Å ≤ z ≤ 70 Å for the expansion process of the 1P e-bubble atP = 0 bar and t = 8.5 ps. The solid line corresponds to the OT calculation,and the dashed line corresponds to the ST functional calculation. The lineshave been drawn as a guide to the eye.
enough, as in the 1P to 1S de-excitation at high pressures, orin the 2P to 1S de-excitation, the first launched front is indeeda shock wave.
To quantitatively study the nature of the waves emittedduring the bubble evolution, we perform a Fourier analysisof the density profile along the symmetry axis, restrictingit to the region 30 Å ≤ z ≤ 70 Å, away from the bubblelocation to avoid uncontrolled effects arising from the bub-ble itself. The Fourier transform of the density fluctuation isshown in Fig. 8 at t = 8.5 ps and P = 0 bar. While both func-tionals generate low-q density waves in the phonon region(see Fig. 1) the ST approach does not display any structure,whereas in the OT approach one can identify two distinctpeaks. The higher one is located at q ∼ 0.8 Å−1 near themaxon region, and the lower one is located at q ∼ 2.3 Å−1
close to the roton minimum.With these results on the evolution of the 1P e-bubble in
mind, we can state with some confidence that the ST descrip-tion is accurate enough for describing the fate of the e-bubble,yielding the appropriate final topology at a given pressure, anda more than qualitative picture of its evolution. The shape ofthe cavity, which is responsible for most electron properties, isessentially the same in both ST and OT descriptions. The dif-ferent way of energy release associated with their each kind ofelementary excitation may yield somewhat diverse evolutionsat longer times, but it has little relevance for the problems athand. One should keep in mind, however, that if the actualsubject of the study are the elementary excitations of the bulkliquid, the use of the OT functional is then unavoidable.
We also want to stress that computing the 1P e-bubbledynamics in real time for the ST functional has allowed us toexplicitly check the adiabatic approximation in the electronevolution during the time interval relevant for the e-bubble“fission.”15 We have computed the overlap between the time-evolving electron wave function and the instantaneous eigen-state 1σ−, and have found it to be equal to unity at all times,meaning that the adiabatic approximation holds. As we willdiscuss later on, this is not the case for the 2P e-bubble.
2. Time-resolved absorption spectrum
Within the OT functional plus adiabatic approximationscheme, we have studied the excitation of 1P bubbles by
0 50 100 150 200 250
Ener
gy(m
eV)
time (ps)
P = 1 bar
50
100
150
200
250
50
100
150
200
P = 0.5 bar
1σ−→ 2σ+
1σ−→ 1π−
FIG. 9. Time-resolved absorption energies at P = 0.5 and 1 bar for the 1Pe-bubble evolution. The thin vertical line at t = 170 ps indicates the time atwhich the bubble splits in the P = 1 bar case.
photoabsorption either to the m = 0 component (2σ+), or tothe m = ±1 components (1π−), arising from the splitting ofthe originally spherical 1D state, see Fig. 2. In principle, thiscan be measured in a pump-probe experiment by which the e-bubble is excited by two consecutive laser pulses. The delayset between these pulses corresponds to the time interval be-tween the excitation and the measurement, which is the sameas the time defined in our calculations. The intensity of the ab-sorption lines is characterized here by their oscillator strengthcalculated in the dipole approximation34
fab = 2me3¯2 (Ea − Eb)
∣∣〈a|r|b〉∣∣2 . (7)
0.2
0.4
0.6
0.8
1
0
0.2
0.4
0.6
0.8
0
Osc
illa
tor
Str
engt
h
0 50 100 150 200 250
P = 1 bar
P = 0.5 bar
time (ps)
1σ−→ 2σ+
1σ−→ 1π−
FIG. 10. Time-resolved absorption oscillator strengths at P = 0.5 and 1 barfor the 1P e-bubble evolution. The thin vertical line at t = 170 ps indicatesthe time at which the bubble splits at P = 1 bar.
Downloaded 27 May 2011 to 161.116.81.135. Redistribution subject to AIP license or copyright; see http://jcp.aip.org/about/rights_and_permissions
40 CHAPTER 3. DYNAMICS
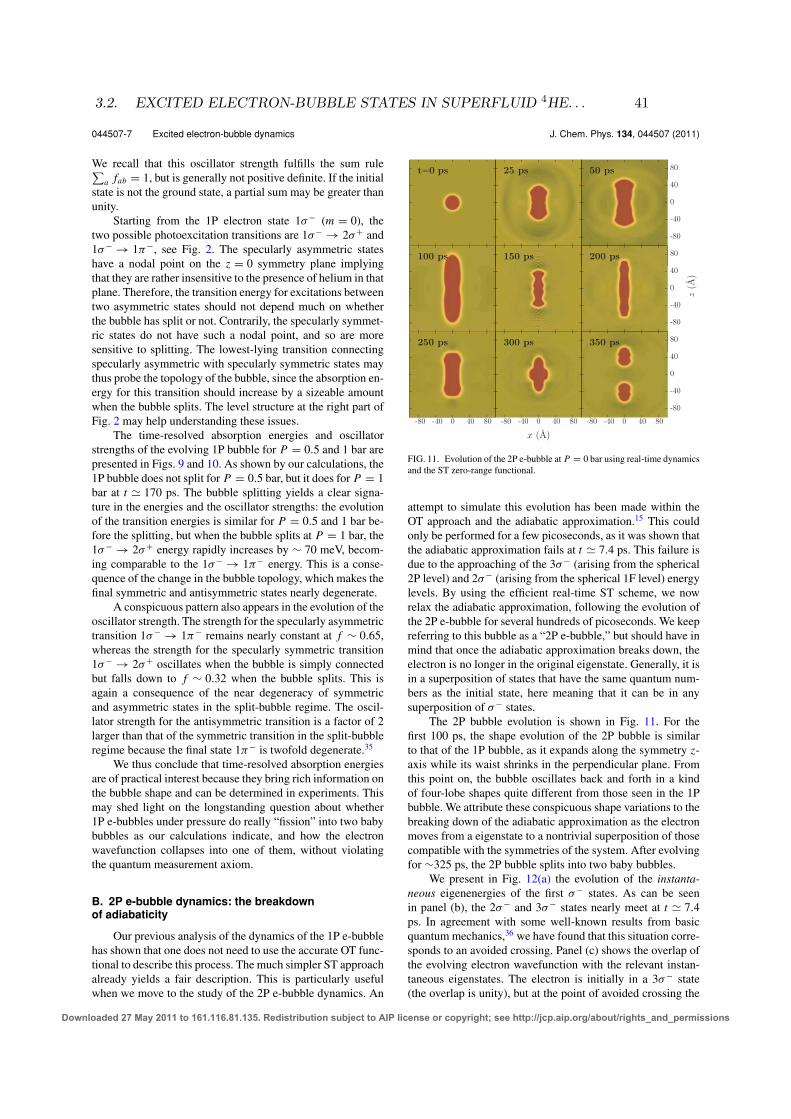
044507-7 Excited electron-bubble dynamics J. Chem. Phys. 134, 044507 (2011)
We recall that this oscillator strength fulfills the sum rule∑a fab = 1, but is generally not positive definite. If the initial
state is not the ground state, a partial sum may be greater thanunity.
Starting from the 1P electron state 1σ− (m = 0), thetwo possible photoexcitation transitions are 1σ− → 2σ+ and1σ− → 1π−, see Fig. 2. The specularly asymmetric stateshave a nodal point on the z = 0 symmetry plane implyingthat they are rather insensitive to the presence of helium in thatplane. Therefore, the transition energy for excitations betweentwo asymmetric states should not depend much on whetherthe bubble has split or not. Contrarily, the specularly symmet-ric states do not have such a nodal point, and so are moresensitive to splitting. The lowest-lying transition connectingspecularly asymmetric with specularly symmetric states maythus probe the topology of the bubble, since the absorption en-ergy for this transition should increase by a sizeable amountwhen the bubble splits. The level structure at the right part ofFig. 2 may help understanding these issues.
The time-resolved absorption energies and oscillatorstrengths of the evolving 1P bubble for P = 0.5 and 1 bar arepresented in Figs. 9 and 10. As shown by our calculations, the1P bubble does not split for P = 0.5 bar, but it does for P = 1bar at t � 170 ps. The bubble splitting yields a clear signa-ture in the energies and the oscillator strengths: the evolutionof the transition energies is similar for P = 0.5 and 1 bar be-fore the splitting, but when the bubble splits at P = 1 bar, the1σ− → 2σ+ energy rapidly increases by ∼ 70 meV, becom-ing comparable to the 1σ− → 1π− energy. This is a conse-quence of the change in the bubble topology, which makes thefinal symmetric and antisymmetric states nearly degenerate.
A conspicuous pattern also appears in the evolution of theoscillator strength. The strength for the specularly asymmetrictransition 1σ− → 1π− remains nearly constant at f ∼ 0.65,whereas the strength for the specularly symmetric transition1σ− → 2σ+ oscillates when the bubble is simply connectedbut falls down to f ∼ 0.32 when the bubble splits. This isagain a consequence of the near degeneracy of symmetricand asymmetric states in the split-bubble regime. The oscil-lator strength for the antisymmetric transition is a factor of 2larger than that of the symmetric transition in the split-bubbleregime because the final state 1π− is twofold degenerate.35
We thus conclude that time-resolved absorption energiesare of practical interest because they bring rich information onthe bubble shape and can be determined in experiments. Thismay shed light on the longstanding question about whether1P e-bubbles under pressure do really “fission” into two babybubbles as our calculations indicate, and how the electronwavefunction collapses into one of them, without violatingthe quantum measurement axiom.
B. 2P e-bubble dynamics: the breakdownof adiabaticity
Our previous analysis of the dynamics of the 1P e-bubblehas shown that one does not need to use the accurate OT func-tional to describe this process. The much simpler ST approachalready yields a fair description. This is particularly usefulwhen we move to the study of the 2P e-bubble dynamics. An
-80 -40 0 40 80
x (A)
z(A
)
-80
-40
0
40
8025 ps 50 ps
150 ps
300 ps
200 ps
350 ps
-80
-40
0
40
80
-80
-40
0
40
80
-80 -40 0 40 80
t=0 ps
100 ps
250 ps
-80 -40 0 40 80
FIG. 11. Evolution of the 2P e-bubble at P = 0 bar using real-time dynamicsand the ST zero-range functional.
attempt to simulate this evolution has been made within theOT approach and the adiabatic approximation.15 This couldonly be performed for a few picoseconds, as it was shown thatthe adiabatic approximation fails at t � 7.4 ps. This failure isdue to the approaching of the 3σ− (arising from the spherical2P level) and 2σ− (arising from the spherical 1F level) energylevels. By using the efficient real-time ST scheme, we nowrelax the adiabatic approximation, following the evolution ofthe 2P e-bubble for several hundreds of picoseconds. We keepreferring to this bubble as a “2P e-bubble,” but should have inmind that once the adiabatic approximation breaks down, theelectron is no longer in the original eigenstate. Generally, it isin a superposition of states that have the same quantum num-bers as the initial state, here meaning that it can be in anysuperposition of σ− states.
The 2P bubble evolution is shown in Fig. 11. For thefirst 100 ps, the shape evolution of the 2P bubble is similarto that of the 1P bubble, as it expands along the symmetry z-axis while its waist shrinks in the perpendicular plane. Fromthis point on, the bubble oscillates back and forth in a kindof four-lobe shapes quite different from those seen in the 1Pbubble. We attribute these conspicuous shape variations to thebreaking down of the adiabatic approximation as the electronmoves from a eigenstate to a nontrivial superposition of thosecompatible with the symmetries of the system. After evolvingfor ∼325 ps, the 2P bubble splits into two baby bubbles.
We present in Fig. 12(a) the evolution of the instanta-neous eigenenergies of the first σ− states. As can be seenin panel (b), the 2σ− and 3σ− states nearly meet at t � 7.4ps. In agreement with some well-known results from basicquantum mechanics,36 we have found that this situation corre-sponds to an avoided crossing. Panel (c) shows the overlap ofthe evolving electron wavefunction with the relevant instan-taneous eigenstates. The electron is initially in a 3σ− state(the overlap is unity), but at the point of avoided crossing the
Downloaded 27 May 2011 to 161.116.81.135. Redistribution subject to AIP license or copyright; see http://jcp.aip.org/about/rights_and_permissions
3.2. EXCITED ELECTRON-BUBBLE STATES IN SUPERFLUID 4HE. . . 41
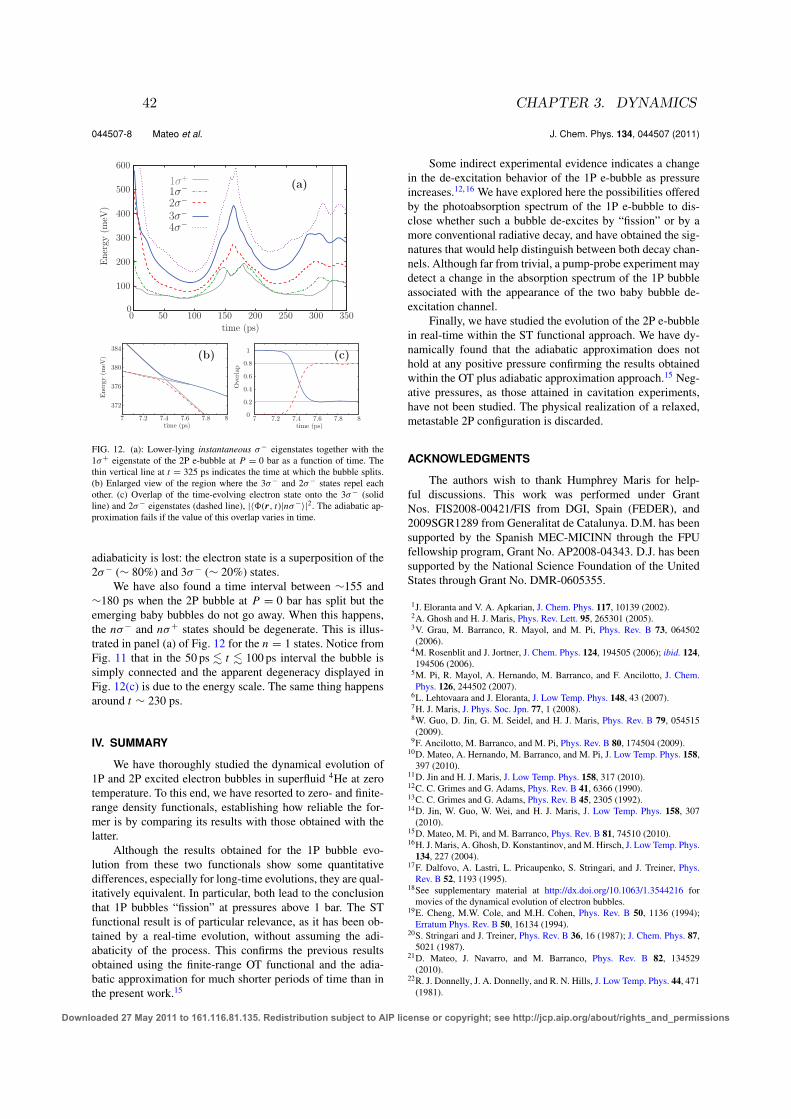
044507-8 Mateo et al. J. Chem. Phys. 134, 044507 (2011)
time (ps)
1σ−2σ−3σ−4σ−
Ener
gy(m
eV)
372
376
380
384
7 7.2 7.4 7.6 7.8 8
Ene
rgy
(meV
)
time (ps)
0
0.2
0.4
0.6
0.8
1
Ove
rlap
7 7.2 7.4 7.6 7.8 8time (ps)
0
100
200
300
400
500
600
0 50 100 150 200 250 300 350
1σ+
(b) (c)
(a)
FIG. 12. (a): Lower-lying instantaneous σ− eigenstates together with the1σ+ eigenstate of the 2P e-bubble at P = 0 bar as a function of time. Thethin vertical line at t = 325 ps indicates the time at which the bubble splits.(b) Enlarged view of the region where the 3σ− and 2σ− states repel eachother. (c) Overlap of the time-evolving electron state onto the 3σ− (solidline) and 2σ− eigenstates (dashed line), |〈�(r, t)|nσ−〉|2. The adiabatic ap-proximation fails if the value of this overlap varies in time.
adiabaticity is lost: the electron state is a superposition of the2σ− (∼ 80%) and 3σ− (∼ 20%) states.
We have also found a time interval between ∼155 and∼180 ps when the 2P bubble at P = 0 bar has split but theemerging baby bubbles do not go away. When this happens,the nσ− and nσ+ states should be degenerate. This is illus-trated in panel (a) of Fig. 12 for the n = 1 states. Notice fromFig. 11 that in the 50 ps � t � 100 ps interval the bubble issimply connected and the apparent degeneracy displayed inFig. 12(c) is due to the energy scale. The same thing happensaround t ∼ 230 ps.
IV. SUMMARY
We have thoroughly studied the dynamical evolution of1P and 2P excited electron bubbles in superfluid 4He at zerotemperature. To this end, we have resorted to zero- and finite-range density functionals, establishing how reliable the for-mer is by comparing its results with those obtained with thelatter.
Although the results obtained for the 1P bubble evo-lution from these two functionals show some quantitativedifferences, especially for long-time evolutions, they are qual-itatively equivalent. In particular, both lead to the conclusionthat 1P bubbles “fission” at pressures above 1 bar. The STfunctional result is of particular relevance, as it has been ob-tained by a real-time evolution, without assuming the adi-abaticity of the process. This confirms the previous resultsobtained using the finite-range OT functional and the adia-batic approximation for much shorter periods of time than inthe present work.15
Some indirect experimental evidence indicates a changein the de-excitation behavior of the 1P e-bubble as pressureincreases.12,16 We have explored here the possibilities offeredby the photoabsorption spectrum of the 1P e-bubble to dis-close whether such a bubble de-excites by “fission” or by amore conventional radiative decay, and have obtained the sig-natures that would help distinguish between both decay chan-nels. Although far from trivial, a pump-probe experiment maydetect a change in the absorption spectrum of the 1P bubbleassociated with the appearance of the two baby bubble de-excitation channel.
Finally, we have studied the evolution of the 2P e-bubblein real-time within the ST functional approach. We have dy-namically found that the adiabatic approximation does nothold at any positive pressure confirming the results obtainedwithin the OT plus adiabatic approximation approach.15 Neg-ative pressures, as those attained in cavitation experiments,have not been studied. The physical realization of a relaxed,metastable 2P configuration is discarded.
ACKNOWLEDGMENTS
The authors wish to thank Humphrey Maris for help-ful discussions. This work was performed under GrantNos. FIS2008-00421/FIS from DGI, Spain (FEDER), and2009SGR1289 from Generalitat de Catalunya. D.M. has beensupported by the Spanish MEC-MICINN through the FPUfellowship program, Grant No. AP2008-04343. D.J. has beensupported by the National Science Foundation of the UnitedStates through Grant No. DMR-0605355.
1J. Eloranta and V. A. Apkarian, J. Chem. Phys. 117, 10139 (2002).2A. Ghosh and H. J. Maris, Phys. Rev. Lett. 95, 265301 (2005).3V. Grau, M. Barranco, R. Mayol, and M. Pi, Phys. Rev. B 73, 064502(2006).4M. Rosenblit and J. Jortner, J. Chem. Phys. 124, 194505 (2006); ibid. 124,194506 (2006).5M. Pi, R. Mayol, A. Hernando, M. Barranco, and F. Ancilotto, J. Chem.Phys. 126, 244502 (2007).6L. Lehtovaara and J. Eloranta, J. Low Temp. Phys. 148, 43 (2007).7H. J. Maris, J. Phys. Soc. Jpn. 77, 1 (2008).8W. Guo, D. Jin, G. M. Seidel, and H. J. Maris, Phys. Rev. B 79, 054515(2009).9F. Ancilotto, M. Barranco, and M. Pi, Phys. Rev. B 80, 174504 (2009).10D. Mateo, A. Hernando, M. Barranco, and M. Pi, J. Low Temp. Phys. 158,397 (2010).
11D. Jin and H. J. Maris, J. Low Temp. Phys. 158, 317 (2010).12C. C. Grimes and G. Adams, Phys. Rev. B 41, 6366 (1990).13C. C. Grimes and G. Adams, Phys. Rev. B 45, 2305 (1992).14D. Jin, W. Guo, W. Wei, and H. J. Maris, J. Low Temp. Phys. 158, 307(2010).
15D. Mateo, M. Pi, and M. Barranco, Phys. Rev. B 81, 74510 (2010).16H. J. Maris, A. Ghosh, D. Konstantinov, andM. Hirsch, J. Low Temp. Phys.
134, 227 (2004).17F. Dalfovo, A. Lastri, L. Pricaupenko, S. Stringari, and J. Treiner, Phys.Rev. B 52, 1193 (1995).
18See supplementary material at http://dx.doi.org/10.1063/1.3544216 formovies of the dynamical evolution of electron bubbles.
19E. Cheng, M.W. Cole, and M.H. Cohen, Phys. Rev. B 50, 1136 (1994);Erratum Phys. Rev. B 50, 16134 (1994).
20S. Stringari and J. Treiner, Phys. Rev. B 36, 16 (1987); J. Chem. Phys. 87,5021 (1987).
21D. Mateo, J. Navarro, and M. Barranco, Phys. Rev. B 82, 134529(2010).
22R. J. Donnelly, J. A. Donnelly, and R. N. Hills, J. Low Temp. Phys. 44, 471(1981).
Downloaded 27 May 2011 to 161.116.81.135. Redistribution subject to AIP license or copyright; see http://jcp.aip.org/about/rights_and_permissions
42 CHAPTER 3. DYNAMICS

044507-9 Excited electron-bubble dynamics J. Chem. Phys. 134, 044507 (2011)
23M. Frigo and S. G. Johnson, Proc. IEEE 93, 216 (2005).24L. Giacomazzi, F. Toigo, and F. Ancilotto, Phys. Rev. B 67, 104501(2003).
25L. Lehtovaara, T. Kiljunen, and J. Eloranta, J. Comput. Phys. 194, 78(2004).
26A. Ralston and H. S. Wilf, Mathematical Methods for Digital Computers(John Wiley and Sons, New York, 1960).
27C. Cerjan, D. Kosloff, R. Kosloff, and M. Reshef, Geophysics 50, 705(1985).
28D. Neuhauser and K. Lopata, J. Chem. Phys. 129, 134106 (2008).29D. Jin and W. Guo, Phys. Rev. B 82, 094524 (2010).30J. Dupont-Roc, M. Himbert, N. Pavloff, and J. Treiner, J. Low Temp. Phys.
81, 31 (1990).
31J. Harms, J. P. Toennies, and F. Dalfovo, Phys. Rev. B 58, 3341(1998).
32K. Penanen, M. Fukuto, R. K. Heilmann, I. F. Silvera, and P. S. Pershan,Phys. Rev. B 62, 9621 (2000).
33L. Landau and E. Lifchitz,Mécanique des Fluides (Éditions Mir, Moscow,1971).
34M. Weissbluth, Atoms and Molecules (Academic, New York, 1978).35Fig. 10 displays the oscillator strength per energy level and not per state.
π states are twofold degenerate due to the two possible l values, l = ±1,while σ states are nondegenerate as l = 0. For this reason, when these statesbecome nearly degenerate in the split-bubble regime, one transition hasf ∼ 0.32 and the other f ∼ 0.65, a factor of 2 larger.
36E. Teller, J. Phys. Chem. 41, 1 (1937).
Downloaded 27 May 2011 to 161.116.81.135. Redistribution subject to AIP license or copyright; see http://jcp.aip.org/about/rights_and_permissions
3.2. EXCITED ELECTRON-BUBBLE STATES IN SUPERFLUID 4HE. . . 43
44 CHAPTER 3. DYNAMICS
3.3 Translational dynamics of photoexcited atoms in 4Henanodroplets: The case of silver
Resumen (Spanish)
La dinamica de translacion seguida por atomos de plata en nanogotas de 4He tras lastransiciones 5p 2P1/2 ← 5s2S1/2 y 5p 2P3/2 ← 5s2S1/2 se ha investigado en una colabora-cion teorico-experimental. Experimentalmente, se ha observado que los atomos de Agson expulsados tras la excitacion al estado 2P1/2 con una distribucion de velocidadescuyo maximo se encuentra hacia los 55 m/s. Cuando la plata se excita al estado 2P3/2
se encuentra una rica fenomenologıa: unas veces la impureza permanece solvatada y lasveces que es expulsada lo hace o bien en forma de atomo de Ag o bien como exciplex deAgHe con una distribucion de velocidad similar (aunque no identica) a la del estado 2P1/2.
Analizamos estos resultados mediante un esquema del funcional de la densidadtridimensional dependiente del tiempo. La dinamica del complejo Ag-4He1000 se haseguido durante varias decenas de picosegundos, tiempo suficiente para observar laformacion en tiempo real de exciplexes en la gota y la expulsion de los atomos de Ag dela misma.
Translational dynamics of photoexcited atoms in 4He nanodroplets: the case of silver
David Mateo,1 Alberto Hernando,2 Manuel Barranco,1 Evgeniy Loginov,3 Marcel Drabbels,3 and Martı Pi11Departament ECM, Facultat de Fısica, and IN2UB,
Universitat de Barcelona. Diagonal 645, 08028 Barcelona, Spain2Laboratoire Collisions, Agregats, Reactivite, IRSAMC,
Universite Paul Sabatier 118 route de Narbonne 31062 - Toulouse CEDEX 09, France3 Laboratoire de Chimie Physique Moleculaire, Swiss Federal Instituteof Technology Lausanne (EPFL), CH-1015 Lausanne, Switzerland
(Dated: March 13, 2013)
The dynamics following the photoexcitation of Ag atoms in 4He nanodroplets via the 5p 2P1/2 ←5s2S1/2 and 5p 2P3/2 ← 5s2S1/2 transitions has been investigated in a joint experimental and the-
oretical effort. It has been experimentally found that upon excitation to the 2P1/2 state, the Agatoms are ejected with a speed distribution peaking at about 55 m/s. When Ag is excited to the2P3/2 state, a rich phenomenology is found. While a fraction of the impurities remains solvated, theimpurities that are ejected from the droplets either as Ag or AgHe have speed distributions similar,but not identical, to those found for excitation to the 2P1/2 state. The experiment findings arequalitatively analyzed within a three-dimensional, time-dependent density functional approach forthe helium droplet. The dynamics of the Ag-4He1000 system has been followed for several tens ofpicoseconds, long enough to observe AgHe exciplex formation and the departure of the photoexcitedAg atom from the helium droplet.
PACS numbers: 36.40.-c, 32.30.Jc, 78.40.-q, 67.25.-k
I. INTRODUCTION
The effect of the strong perturbations induced by elec-tronic excitation of impurities in helium droplets is a sub-ject of growing interest.1–3 This is motivated by the ideathat insight into the dynamical evolution of an electron-ically excited impurity in helium droplets is a first steptowards a better understanding of chemical reactions inthis quantum environment. With this goal in mind, wehave recently undertaken a joint experimental and theo-retical study of the desorption of alkali atoms from thesurface of 4He nanodroplets following excitation via the(n+1)s ← ns transition.4 The subsequent dynamical evo-lution of both the excited impurity and helium dropletwas followed within a time-dependent density-functional(TDDF) approach. This has allowed us to characterizethe physical observables and successfully compare themwith experiment. Moreover, the calculations have dis-closed the dramatic effect that the excitation of the im-purity causes on the hosting droplet, generating densitywaves that propagate at supersonic velocities.4
The aim of the present work is to extend this work andgain insight into the dynamics of photoexcited atoms re-siding in the bulk of helium droplets. Silver atoms areespecially appealing as probe for such studies. The spec-troscopy and the photoinduced dynamics of silver atomsin both liquid helium and in helium droplets has beenthoroughly investigated by a wide variety of experimentaltechniques.5–10 The system has also been addressed the-oretically. The solvation structure and absorption spec-trum of a silver impurity in helium droplets have beencalculated using methods and interaction potentials ofdifferent complexity and accuracy.11–13 In addition, thephotoexcitation dynamics of a silver atom embedded in
a 4He200 cluster has been simulated up to 2.5 ps using aquantum molecular dynamics approach.11
These studies have revealed that the dynamical pro-cesses induced by the photoexcitation of the solvated sil-ver atom are very complex and depend strongly on thecharacter of the excited state. In the experiments involv-ing helium droplets, it was found that the excited silveratoms are ejected from the helium droplets.9,10 The un-derlying mechanism is not exactly known, but is expectedto be related to the repulsive interaction between the ex-cited silver atom and the helium at long-range. It hasbeen speculated that as a result the excited silver atomis transported towards the surface of the helium dropletfrom which it then desorbs.9 If correct, this mechanismallows to probe the translational dynamics of the excitedsilver atoms in helium and test for the possible existenceof a critical velocity in helium droplets. In the currentwork we analyze the velocity distributions of the ejectedsilver atoms and compare them qualitatively with theresults of simulations. Besides providing insight into thetranslational dynamics, the simulations also allow to havea first glimpse at exciplex formation. The underlyingTDDFT-based model, which explicitly takes into accountspin-orbit interactions in order to describe non-radiativetransitions between excited 2P states, is widely appli-cable. While here it is used to describe the dynamicalevolution of the Ag@4HeN complex after dipole excita-tion, the method can be readily adapted to other dopantsand/or excitations.
This paper is organized as follows. In Sec. II we brieflyrecall the experimental findings of Ref. 10 complementedwith some material recently obtained. Basic details of thetheoretical approach are presented in Sec. III. In Sec. IVwe present a semi-quantitative comparison of the numer-
3.3. TRANSLATIONAL DYNAMICS OF PHOTOEXCITED ATOMS IN 4HE. . . 45
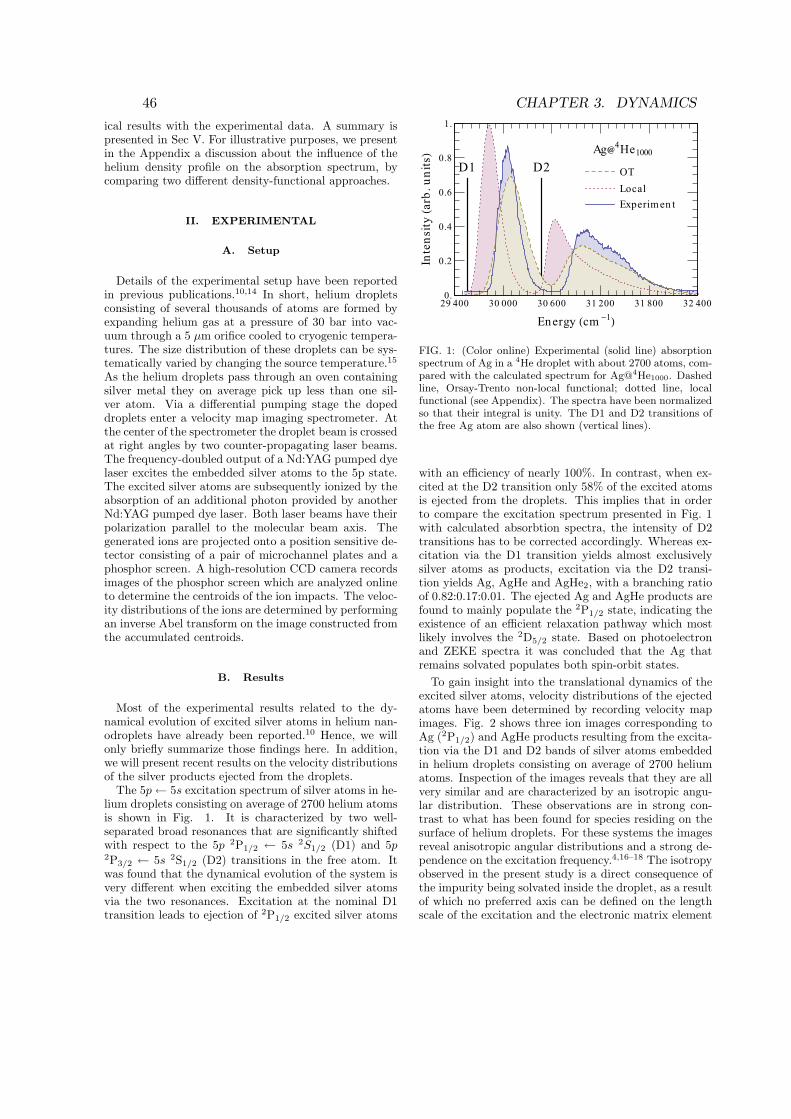
ical results with the experimental data. A summary ispresented in Sec V. For illustrative purposes, we presentin the Appendix a discussion about the influence of thehelium density profile on the absorption spectrum, bycomparing two different density-functional approaches.
II. EXPERIMENTAL
A. Setup
Details of the experimental setup have been reportedin previous publications.10,14 In short, helium dropletsconsisting of several thousands of atoms are formed byexpanding helium gas at a pressure of 30 bar into vac-uum through a 5 μm orifice cooled to cryogenic tempera-tures. The size distribution of these droplets can be sys-tematically varied by changing the source temperature.15As the helium droplets pass through an oven containingsilver metal they on average pick up less than one sil-ver atom. Via a differential pumping stage the dopeddroplets enter a velocity map imaging spectrometer. Atthe center of the spectrometer the droplet beam is crossedat right angles by two counter-propagating laser beams.The frequency-doubled output of a Nd:YAG pumped dyelaser excites the embedded silver atoms to the 5p state.The excited silver atoms are subsequently ionized by theabsorption of an additional photon provided by anotherNd:YAG pumped dye laser. Both laser beams have theirpolarization parallel to the molecular beam axis. Thegenerated ions are projected onto a position sensitive de-tector consisting of a pair of microchannel plates and aphosphor screen. A high-resolution CCD camera recordsimages of the phosphor screen which are analyzed onlineto determine the centroids of the ion impacts. The veloc-ity distributions of the ions are determined by performingan inverse Abel transform on the image constructed fromthe accumulated centroids.
B. Results
Most of the experimental results related to the dy-namical evolution of excited silver atoms in helium nan-odroplets have already been reported.10 Hence, we willonly briefly summarize those findings here. In addition,we will present recent results on the velocity distributionsof the silver products ejected from the droplets.
The 5p ← 5s excitation spectrum of silver atoms in he-lium droplets consisting on average of 2700 helium atomsis shown in Fig. 1. It is characterized by two well-separated broad resonances that are significantly shiftedwith respect to the 5p 2P1/2 ← 5s 2S1/2 (D1) and 5p2P3/2 ← 5s 2S1/2 (D2) transitions in the free atom. Itwas found that the dynamical evolution of the system isvery different when exciting the embedded silver atomsvia the two resonances. Excitation at the nominal D1transition leads to ejection of 2P1/2 excited silver atoms
D1 D2Ag�4He1000
Experimen tLocalOT
29 400 30 000 30 600 31 200 31 800 32 4000.
0.2
0.4
0.6
0.8
1.
Energy �cm �1�
Intensity�arb.units�
FIG. 1: (Color online) Experimental (solid line) absorptionspectrum of Ag in a 4He droplet with about 2700 atoms, com-pared with the calculated spectrum for Ag@4He1000. Dashedline, Orsay-Trento non-local functional; dotted line, localfunctional (see Appendix). The spectra have been normalizedso that their integral is unity. The D1 and D2 transitions ofthe free Ag atom are also shown (vertical lines).
with an efficiency of nearly 100%. In contrast, when ex-cited at the D2 transition only 58% of the excited atomsis ejected from the droplets. This implies that in orderto compare the excitation spectrum presented in Fig. 1with calculated absorbtion spectra, the intensity of D2transitions has to be corrected accordingly. Whereas ex-citation via the D1 transition yields almost exclusivelysilver atoms as products, excitation via the D2 transi-tion yields Ag, AgHe and AgHe2, with a branching ratioof 0.82:0.17:0.01. The ejected Ag and AgHe products arefound to mainly populate the 2P1/2 state, indicating theexistence of an efficient relaxation pathway which mostlikely involves the 2D5/2 state. Based on photoelectronand ZEKE spectra it was concluded that the Ag thatremains solvated populates both spin-orbit states.
To gain insight into the translational dynamics of theexcited silver atoms, velocity distributions of the ejectedatoms have been determined by recording velocity mapimages. Fig. 2 shows three ion images corresponding toAg (2P1/2) and AgHe products resulting from the excita-tion via the D1 and D2 bands of silver atoms embeddedin helium droplets consisting on average of 2700 heliumatoms. Inspection of the images reveals that they are allvery similar and are characterized by an isotropic angu-lar distribution. These observations are in strong con-trast to what has been found for species residing on thesurface of helium droplets. For these systems the imagesreveal anisotropic angular distributions and a strong de-pendence on the excitation frequency.4,16–18 The isotropyobserved in the present study is a direct consequence ofthe impurity being solvated inside the droplet, as a resultof which no preferred axis can be defined on the lengthscale of the excitation and the electronic matrix element
46 CHAPTER 3. DYNAMICS
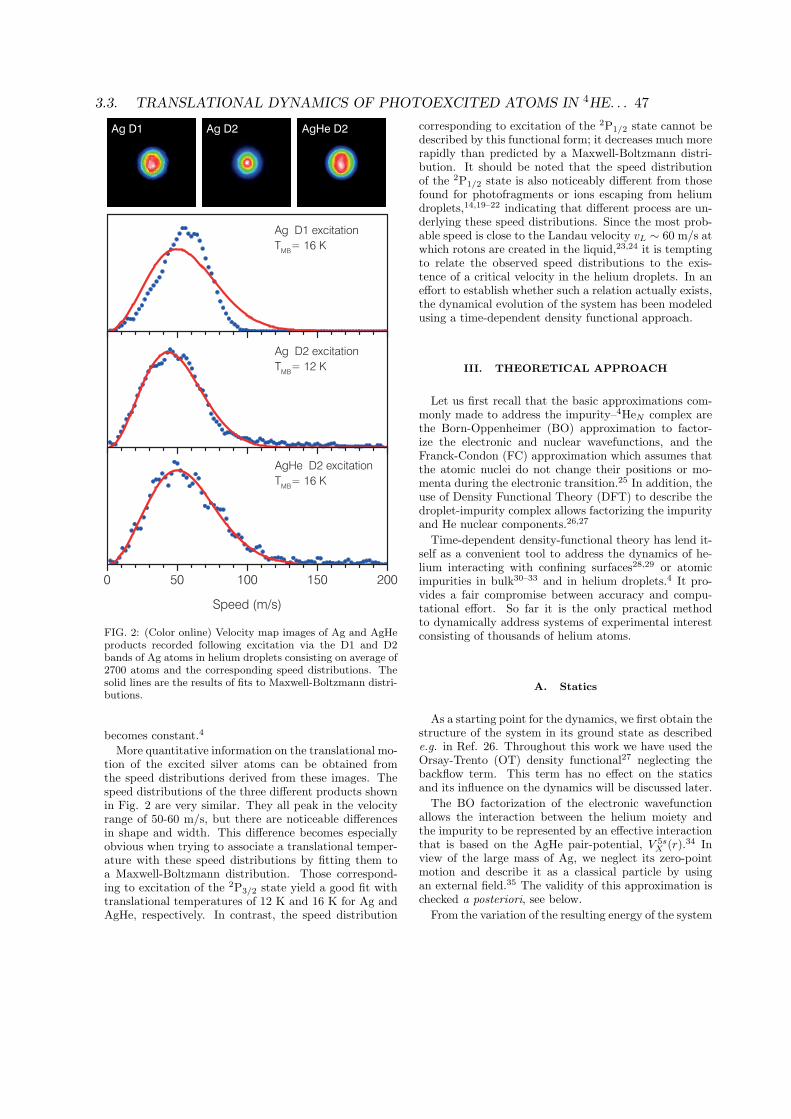
Ag D1 Ag D2 AgHe D2
FIG. 2: (Color online) Velocity map images of Ag and AgHeproducts recorded following excitation via the D1 and D2bands of Ag atoms in helium droplets consisting on average of2700 atoms and the corresponding speed distributions. Thesolid lines are the results of fits to Maxwell-Boltzmann distri-butions.
becomes constant.4
More quantitative information on the translational mo-tion of the excited silver atoms can be obtained fromthe speed distributions derived from these images. Thespeed distributions of the three different products shownin Fig. 2 are very similar. They all peak in the velocityrange of 50-60 m/s, but there are noticeable differencesin shape and width. This difference becomes especiallyobvious when trying to associate a translational temper-ature with these speed distributions by fitting them toa Maxwell-Boltzmann distribution. Those correspond-ing to excitation of the 2P3/2 state yield a good fit withtranslational temperatures of 12 K and 16 K for Ag andAgHe, respectively. In contrast, the speed distribution
corresponding to excitation of the 2P1/2 state cannot bedescribed by this functional form; it decreases much morerapidly than predicted by a Maxwell-Boltzmann distri-bution. It should be noted that the speed distributionof the 2P1/2 state is also noticeably different from thosefound for photofragments or ions escaping from heliumdroplets,14,19–22 indicating that different process are un-derlying these speed distributions. Since the most prob-able speed is close to the Landau velocity vL ∼ 60 m/s atwhich rotons are created in the liquid,23,24 it is temptingto relate the observed speed distributions to the exis-tence of a critical velocity in the helium droplets. In aneffort to establish whether such a relation actually exists,the dynamical evolution of the system has been modeledusing a time-dependent density functional approach.
III. THEORETICAL APPROACH
Let us first recall that the basic approximations com-monly made to address the impurity–4HeN complex arethe Born-Oppenheimer (BO) approximation to factor-ize the electronic and nuclear wavefunctions, and theFranck-Condon (FC) approximation which assumes thatthe atomic nuclei do not change their positions or mo-menta during the electronic transition.25 In addition, theuse of Density Functional Theory (DFT) to describe thedroplet-impurity complex allows factorizing the impurityand He nuclear components.26,27
Time-dependent density-functional theory has lend it-self as a convenient tool to address the dynamics of he-lium interacting with confining surfaces28,29 or atomicimpurities in bulk30–33 and in helium droplets.4 It pro-vides a fair compromise between accuracy and compu-tational effort. So far it is the only practical methodto dynamically address systems of experimental interestconsisting of thousands of helium atoms.
A. Statics
As a starting point for the dynamics, we first obtain thestructure of the system in its ground state as describede.g. in Ref. 26. Throughout this work we have used theOrsay-Trento (OT) density functional27 neglecting thebackflow term. This term has no effect on the staticsand its influence on the dynamics will be discussed later.
The BO factorization of the electronic wavefunctionallows the interaction between the helium moiety andthe impurity to be represented by an effective interactionthat is based on the AgHe pair-potential, V 5s
X (r).34 Inview of the large mass of Ag, we neglect its zero-pointmotion and describe it as a classical particle by usingan external field.35 The validity of this approximation ischecked a posteriori, see below.
From the variation of the resulting energy of the system
3.3. TRANSLATIONAL DYNAMICS OF PHOTOEXCITED ATOMS IN 4HE. . . 47
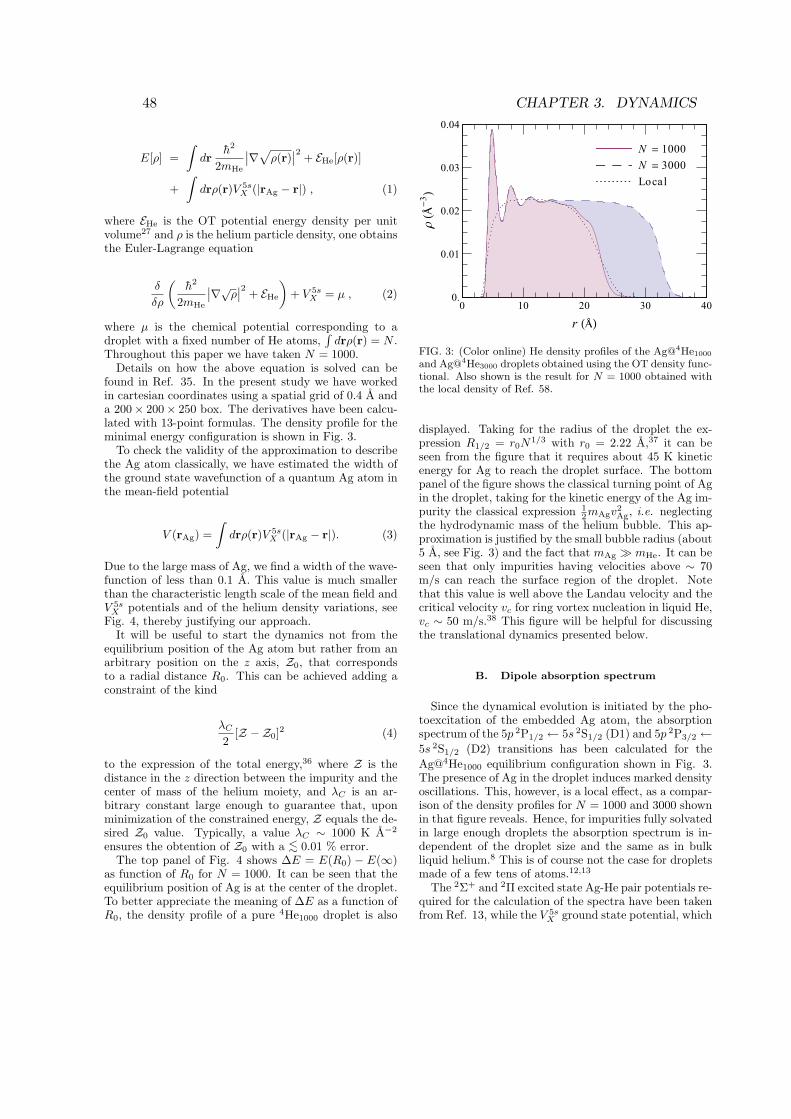
E[ρ] =∫
drh2
2mHe
∣∣∇√ρ(r)∣∣2 + EHe[ρ(r)]
+∫
drρ(r)V 5sX (|rAg − r|) , (1)
where EHe is the OT potential energy density per unitvolume27 and ρ is the helium particle density, one obtainsthe Euler-Lagrange equation
δ
δρ
(h2
2mHe
∣∣∇√ρ∣∣2 + EHe
)+ V 5s
X = μ , (2)
where μ is the chemical potential corresponding to adroplet with a fixed number of He atoms,
∫drρ(r) = N .
Throughout this paper we have taken N = 1000.Details on how the above equation is solved can be
found in Ref. 35. In the present study we have workedin cartesian coordinates using a spatial grid of 0.4 A anda 200× 200× 250 box. The derivatives have been calcu-lated with 13-point formulas. The density profile for theminimal energy configuration is shown in Fig. 3.
To check the validity of the approximation to describethe Ag atom classically, we have estimated the width ofthe ground state wavefunction of a quantum Ag atom inthe mean-field potential
V (rAg) =∫
drρ(r)V 5sX (|rAg − r|). (3)
Due to the large mass of Ag, we find a width of the wave-function of less than 0.1 A. This value is much smallerthan the characteristic length scale of the mean field andV 5sX potentials and of the helium density variations, see
Fig. 4, thereby justifying our approach.It will be useful to start the dynamics not from the
equilibrium position of the Ag atom but rather from anarbitrary position on the z axis, Z0, that correspondsto a radial distance R0. This can be achieved adding aconstraint of the kind
λC2
[Z − Z0]2 (4)
to the expression of the total energy,36 where Z is thedistance in the z direction between the impurity and thecenter of mass of the helium moiety, and λC is an ar-bitrary constant large enough to guarantee that, uponminimization of the constrained energy, Z equals the de-sired Z0 value. Typically, a value λC ∼ 1000 K A−2ensures the obtention of Z0 with a <∼ 0.01 % error.
The top panel of Fig. 4 shows ΔE = E(R0) − E(∞)as function of R0 for N = 1000. It can be seen that theequilibrium position of Ag is at the center of the droplet.To better appreciate the meaning of ΔE as a function ofR0, the density profile of a pure 4He1000 droplet is also
N � 1000N � 3000Local
0 10 20 30 400.
0.01
0.02
0.03
0.04
r ���
���3 �
FIG. 3: (Color online) He density profiles of the Ag@4He1000
and Ag@4He3000 droplets obtained using the OT density func-tional. Also shown is the result for N = 1000 obtained withthe local density of Ref. 58.
displayed. Taking for the radius of the droplet the ex-pression R1/2 = r0N
1/3 with r0 = 2.22 A,37 it can beseen from the figure that it requires about 45 K kineticenergy for Ag to reach the droplet surface. The bottompanel of the figure shows the classical turning point of Agin the droplet, taking for the kinetic energy of the Ag im-purity the classical expression 1
2mAgv2Ag, i.e. neglecting
the hydrodynamic mass of the helium bubble. This ap-proximation is justified by the small bubble radius (about5 A, see Fig. 3) and the fact that mAg � mHe. It can beseen that only impurities having velocities above ∼ 70m/s can reach the surface region of the droplet. Notethat this value is well above the Landau velocity and thecritical velocity vc for ring vortex nucleation in liquid He,vc ∼ 50 m/s.38 This figure will be helpful for discussingthe translational dynamics presented below.
B. Dipole absorption spectrum
Since the dynamical evolution is initiated by the pho-toexcitation of the embedded Ag atom, the absorptionspectrum of the 5p 2P1/2 ← 5s 2S1/2 (D1) and 5p 2P3/2 ←5s 2S1/2 (D2) transitions has been calculated for theAg@4He1000 equilibrium configuration shown in Fig. 3.The presence of Ag in the droplet induces marked densityoscillations. This, however, is a local effect, as a compar-ison of the density profiles for N = 1000 and 3000 shownin that figure reveals. Hence, for impurities fully solvatedin large enough droplets the absorption spectrum is in-dependent of the droplet size and the same as in bulkliquid helium.8 This is of course not the case for dropletsmade of a few tens of atoms.12,13
The 2Σ+ and 2Π excited state Ag-He pair potentials re-quired for the calculation of the spectra have been takenfrom Ref. 13, while the V 5s
X ground state potential, which
48 CHAPTER 3. DYNAMICS
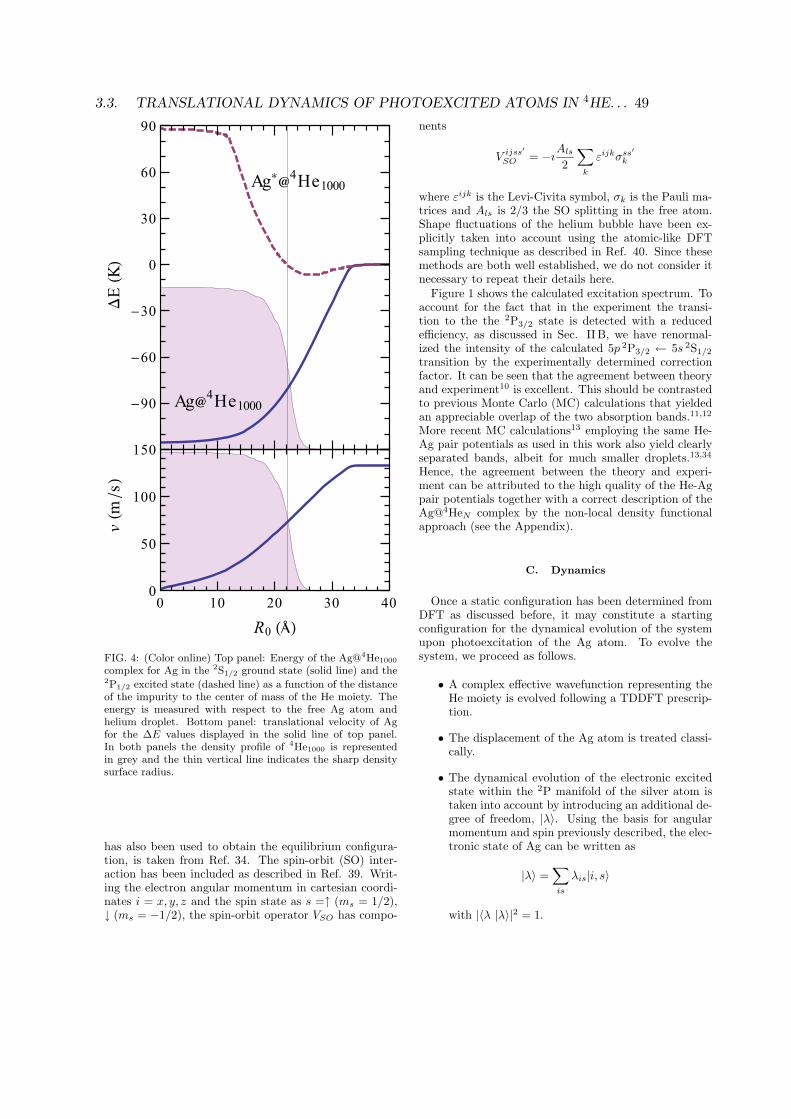
Ag�4He1000
Ag��4He1000
0 10 20 30 400
50
100
150
�90
�60
�30
0
30
60
90
R0 ���
v�m�s�
�E�K�
FIG. 4: (Color online) Top panel: Energy of the Ag@4He1000
complex for Ag in the 2S1/2 ground state (solid line) and the2P1/2 excited state (dashed line) as a function of the distanceof the impurity to the center of mass of the He moiety. Theenergy is measured with respect to the free Ag atom andhelium droplet. Bottom panel: translational velocity of Agfor the ΔE values displayed in the solid line of top panel.In both panels the density profile of 4He1000 is representedin grey and the thin vertical line indicates the sharp densitysurface radius.
has also been used to obtain the equilibrium configura-tion, is taken from Ref. 34. The spin-orbit (SO) inter-action has been included as described in Ref. 39. Writ-ing the electron angular momentum in cartesian coordi-nates i = x, y, z and the spin state as s =↑ (ms = 1/2),↓ (ms = −1/2), the spin-orbit operator VSO has compo-
nents
V ijss′
SO = −ıAls2
∑k
εijkσss′
k
where εijk is the Levi-Civita symbol, σk is the Pauli ma-trices and Als is 2/3 the SO splitting in the free atom.Shape fluctuations of the helium bubble have been ex-plicitly taken into account using the atomic-like DFTsampling technique as described in Ref. 40. Since thesemethods are both well established, we do not consider itnecessary to repeat their details here.
Figure 1 shows the calculated excitation spectrum. Toaccount for the fact that in the experiment the transi-tion to the the 2P3/2 state is detected with a reducedefficiency, as discussed in Sec. II B, we have renormal-ized the intensity of the calculated 5p 2P3/2 ← 5s 2S1/2transition by the experimentally determined correctionfactor. It can be seen that the agreement between theoryand experiment10 is excellent. This should be contrastedto previous Monte Carlo (MC) calculations that yieldedan appreciable overlap of the two absorption bands.11,12More recent MC calculations13 employing the same He-Ag pair potentials as used in this work also yield clearlyseparated bands, albeit for much smaller droplets.13,34Hence, the agreement between the theory and experi-ment can be attributed to the high quality of the He-Agpair potentials together with a correct description of theAg@4HeN complex by the non-local density functionalapproach (see the Appendix).
C. Dynamics
Once a static configuration has been determined fromDFT as discussed before, it may constitute a startingconfiguration for the dynamical evolution of the systemupon photoexcitation of the Ag atom. To evolve thesystem, we proceed as follows.
• A complex effective wavefunction representing theHe moiety is evolved following a TDDFT prescrip-tion.
• The displacement of the Ag atom is treated classi-cally.
• The dynamical evolution of the electronic excitedstate within the 2P manifold of the silver atom istaken into account by introducing an additional de-gree of freedom, |λ〉. Using the basis for angularmomentum and spin previously described, the elec-tronic state of Ag can be written as
|λ〉 =∑is
λis|i, s〉
with |〈λ |λ〉|2 = 1.
3.3. TRANSLATIONAL DYNAMICS OF PHOTOEXCITED ATOMS IN 4HE. . . 49
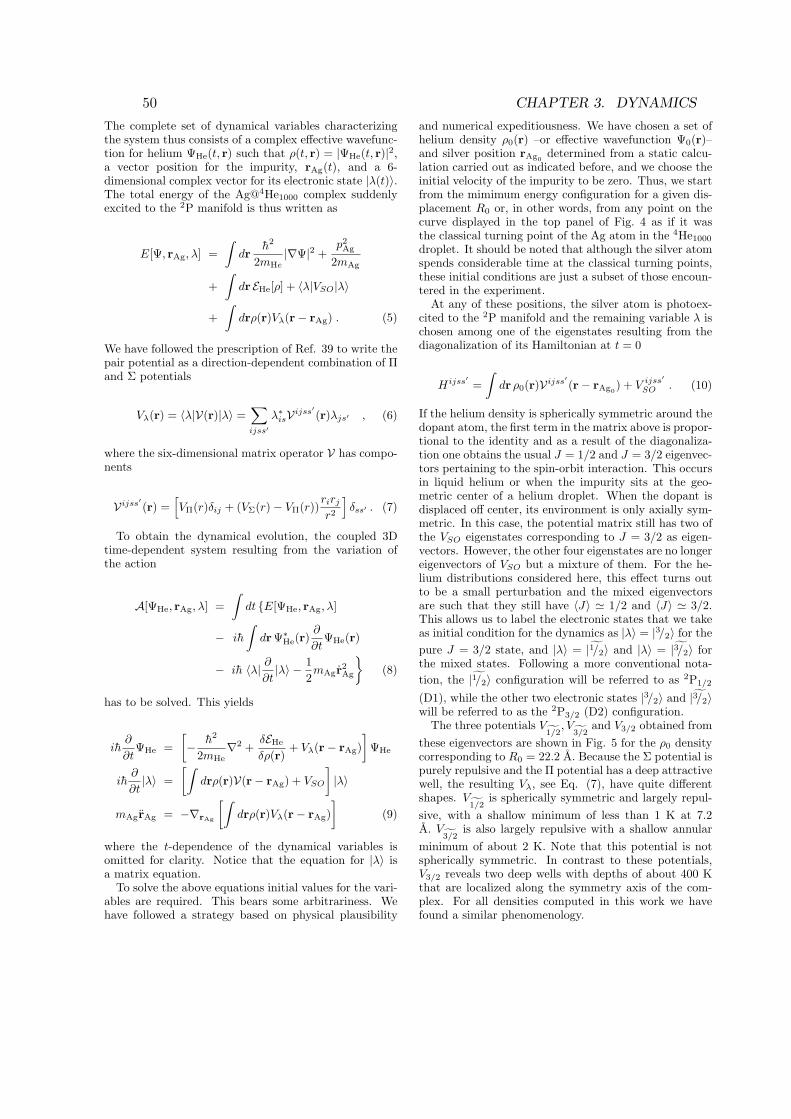
The complete set of dynamical variables characterizingthe system thus consists of a complex effective wavefunc-tion for helium ΨHe(t, r) such that ρ(t, r) = |ΨHe(t, r)|2,a vector position for the impurity, rAg(t), and a 6-dimensional complex vector for its electronic state |λ(t)〉.The total energy of the Ag@4He1000 complex suddenlyexcited to the 2P manifold is thus written as
E[Ψ, rAg, λ] =∫
drh2
2mHe|∇Ψ|2 +
p2Ag2mAg
+∫
dr EHe[ρ] + 〈λ|VSO|λ〉
+∫
drρ(r)Vλ(r− rAg) . (5)
We have followed the prescription of Ref. 39 to write thepair potential as a direction-dependent combination of Πand Σ potentials
Vλ(r) = 〈λ|V(r)|λ〉 =∑ijss′
λ∗isVijss′(r)λjs′ , (6)
where the six-dimensional matrix operator V has compo-nents
Vijss′(r) =[VΠ(r)δij + (VΣ(r)− VΠ(r))
rirjr2
]δss′ . (7)
To obtain the dynamical evolution, the coupled 3Dtime-dependent system resulting from the variation ofthe action
A[ΨHe, rAg, λ] =∫
dt {E[ΨHe, rAg, λ]
− ih
∫drΨ∗He(r)
∂
∂tΨHe(r)
− ih 〈λ| ∂∂t|λ〉 − 1
2mAgr2Ag
}(8)
has to be solved. This yields
ih∂
∂tΨHe =
[− h2
2mHe∇2 +
δEHeδρ(r)
+ Vλ(r− rAg)]
ΨHe
ih∂
∂t|λ〉 =
[∫drρ(r)V(r− rAg) + VSO
]|λ〉
mAgrAg = −∇rAg
[∫drρ(r)Vλ(r− rAg)
](9)
where the t-dependence of the dynamical variables isomitted for clarity. Notice that the equation for |λ〉 isa matrix equation.
To solve the above equations initial values for the vari-ables are required. This bears some arbitrariness. Wehave followed a strategy based on physical plausibility
and numerical expeditiousness. We have chosen a set ofhelium density ρ0(r) –or effective wavefunction Ψ0(r)–and silver position rAg0 determined from a static calcu-lation carried out as indicated before, and we choose theinitial velocity of the impurity to be zero. Thus, we startfrom the mimimum energy configuration for a given dis-placement R0 or, in other words, from any point on thecurve displayed in the top panel of Fig. 4 as if it wasthe classical turning point of the Ag atom in the 4He1000droplet. It should be noted that although the silver atomspends considerable time at the classical turning points,these initial conditions are just a subset of those encoun-tered in the experiment.
At any of these positions, the silver atom is photoex-cited to the 2P manifold and the remaining variable λ ischosen among one of the eigenstates resulting from thediagonalization of its Hamiltonian at t = 0
Hijss′ =∫
dr ρ0(r)Vijss′(r− rAg0) + V ijss′
SO . (10)
If the helium density is spherically symmetric around thedopant atom, the first term in the matrix above is propor-tional to the identity and as a result of the diagonaliza-tion one obtains the usual J = 1/2 and J = 3/2 eigenvec-tors pertaining to the spin-orbit interaction. This occursin liquid helium or when the impurity sits at the geo-metric center of a helium droplet. When the dopant isdisplaced off center, its environment is only axially sym-metric. In this case, the potential matrix still has two ofthe VSO eigenstates corresponding to J = 3/2 as eigen-vectors. However, the other four eigenstates are no longereigenvectors of VSO but a mixture of them. For the he-lium distributions considered here, this effect turns outto be a small perturbation and the mixed eigenvectorsare such that they still have 〈J〉 1/2 and 〈J〉 3/2.This allows us to label the electronic states that we takeas initial condition for the dynamics as |λ〉 = |3/2〉 for thepure J = 3/2 state, and |λ〉 = |1/2〉 and |λ〉 = |3/2〉 forthe mixed states. Following a more conventional nota-tion, the |1/2〉 configuration will be referred to as 2P1/2
(D1), while the other two electronic states |3/2〉 and |3/2〉will be referred to as the 2P3/2 (D2) configuration.
The three potentials V1/2
, V3/2
and V3/2 obtained fromthese eigenvectors are shown in Fig. 5 for the ρ0 densitycorresponding to R0 = 22.2 A. Because the Σ potential ispurely repulsive and the Π potential has a deep attractivewell, the resulting Vλ, see Eq. (7), have quite differentshapes. V
1/2is spherically symmetric and largely repul-
sive, with a shallow minimum of less than 1 K at 7.2A. V
3/2is also largely repulsive with a shallow annular
minimum of about 2 K. Note that this potential is notspherically symmetric. In contrast to these potentials,V3/2 reveals two deep wells with depths of about 400 Kthat are localized along the symmetry axis of the com-plex. For all densities computed in this work we havefound a similar phenomenology.
50 CHAPTER 3. DYNAMICS
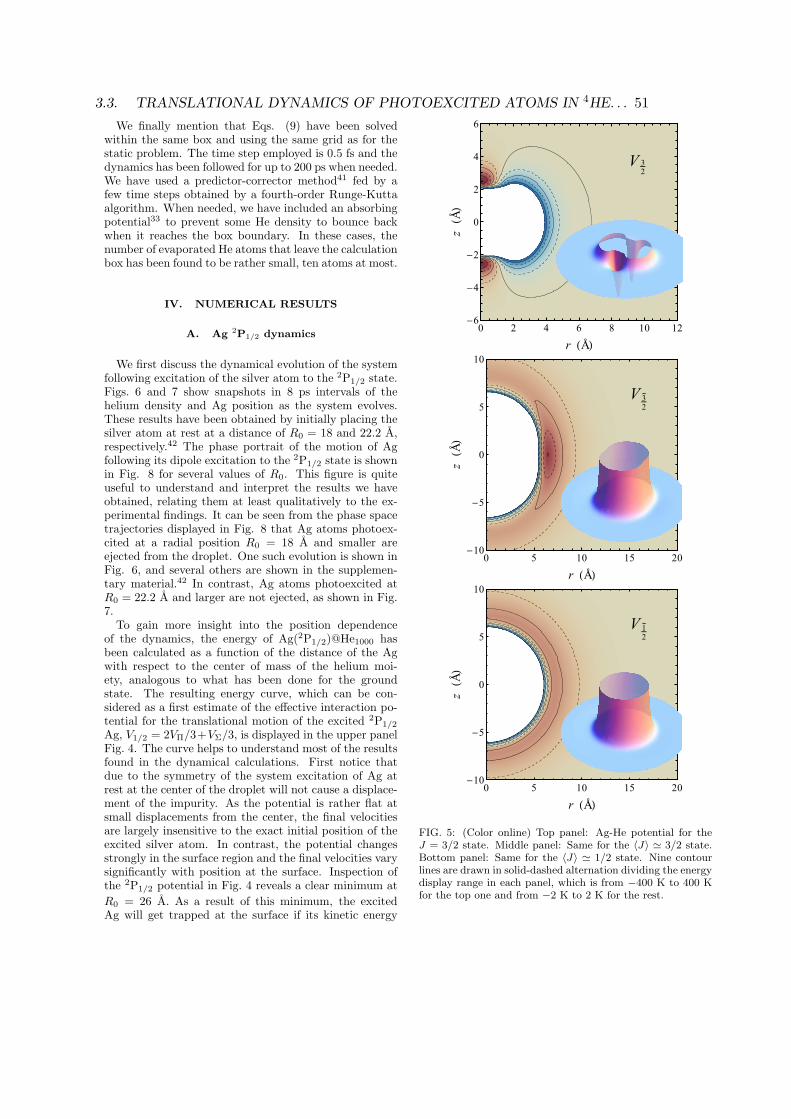
We finally mention that Eqs. (9) have been solvedwithin the same box and using the same grid as for thestatic problem. The time step employed is 0.5 fs and thedynamics has been followed for up to 200 ps when needed.We have used a predictor-corrector method41 fed by afew time steps obtained by a fourth-order Runge-Kuttaalgorithm. When needed, we have included an absorbingpotential33 to prevent some He density to bounce backwhen it reaches the box boundary. In these cases, thenumber of evaporated He atoms that leave the calculationbox has been found to be rather small, ten atoms at most.
IV. NUMERICAL RESULTS
A. Ag 2P1/2 dynamics
We first discuss the dynamical evolution of the systemfollowing excitation of the silver atom to the 2P1/2 state.Figs. 6 and 7 show snapshots in 8 ps intervals of thehelium density and Ag position as the system evolves.These results have been obtained by initially placing thesilver atom at rest at a distance of R0 = 18 and 22.2 A,respectively.42 The phase portrait of the motion of Agfollowing its dipole excitation to the 2P1/2 state is shownin Fig. 8 for several values of R0. This figure is quiteuseful to understand and interpret the results we haveobtained, relating them at least qualitatively to the ex-perimental findings. It can be seen from the phase spacetrajectories displayed in Fig. 8 that Ag atoms photoex-cited at a radial position R0 = 18 A and smaller areejected from the droplet. One such evolution is shown inFig. 6, and several others are shown in the supplemen-tary material.42 In contrast, Ag atoms photoexcited atR0 = 22.2 A and larger are not ejected, as shown in Fig.7.
To gain more insight into the position dependenceof the dynamics, the energy of Ag(2P1/2)@He1000 hasbeen calculated as a function of the distance of the Agwith respect to the center of mass of the helium moi-ety, analogous to what has been done for the groundstate. The resulting energy curve, which can be con-sidered as a first estimate of the effective interaction po-tential for the translational motion of the excited 2P1/2
Ag, V1/2 = 2VΠ/3+VΣ/3, is displayed in the upper panelFig. 4. The curve helps to understand most of the resultsfound in the dynamical calculations. First notice thatdue to the symmetry of the system excitation of Ag atrest at the center of the droplet will not cause a displace-ment of the impurity. As the potential is rather flat atsmall displacements from the center, the final velocitiesare largely insensitive to the exact initial position of theexcited silver atom. In contrast, the potential changesstrongly in the surface region and the final velocities varysignificantly with position at the surface. Inspection ofthe 2P1/2 potential in Fig. 4 reveals a clear minimum atR0 = 26 A. As a result of this minimum, the excitedAg will get trapped at the surface if its kinetic energy
0 2 4 6 8 10 12�6
�4
�2
0
2
4
6
r ��
z��
V 32
0 5 10 15 20�10
�5
0
5
10
r ��
z��
V 32
�
0 5 10 15 20�10
�5
0
5
10
r ��
z��
V 12
�
FIG. 5: (Color online) Top panel: Ag-He potential for theJ = 3/2 state. Middle panel: Same for the 〈J〉 � 3/2 state.Bottom panel: Same for the 〈J〉 � 1/2 state. Nine contourlines are drawn in solid-dashed alternation dividing the energydisplay range in each panel, which is from −400 K to 400 Kfor the top one and from −2 K to 2 K for the rest.
3.3. TRANSLATIONAL DYNAMICS OF PHOTOEXCITED ATOMS IN 4HE. . . 51
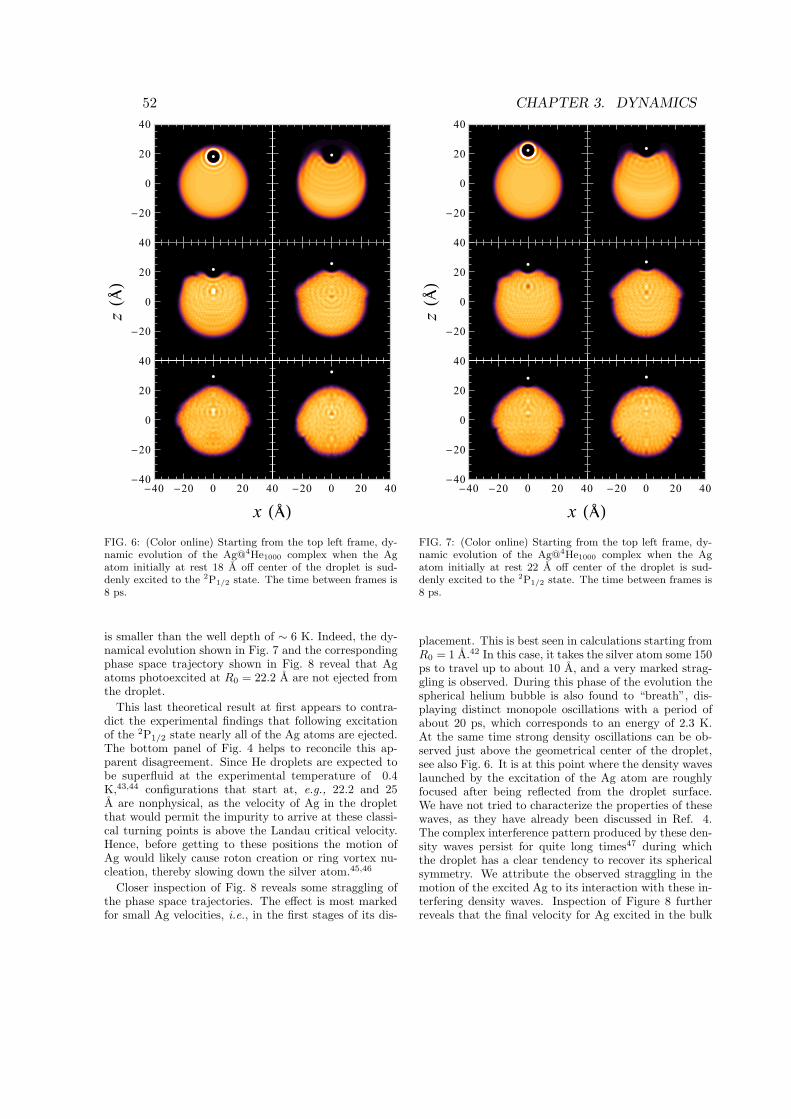
�40 �20 0 20 40 �20 0 20 40�40
�20
0
20
40
�20
0
20
40
�20
0
20
40
x ���
z���
FIG. 6: (Color online) Starting from the top left frame, dy-namic evolution of the Ag@4He1000 complex when the Agatom initially at rest 18 A off center of the droplet is sud-denly excited to the 2P1/2 state. The time between frames is8 ps.
is smaller than the well depth of ∼ 6 K. Indeed, the dy-namical evolution shown in Fig. 7 and the correspondingphase space trajectory shown in Fig. 8 reveal that Agatoms photoexcited at R0 = 22.2 A are not ejected fromthe droplet.
This last theoretical result at first appears to contra-dict the experimental findings that following excitationof the 2P1/2 state nearly all of the Ag atoms are ejected.The bottom panel of Fig. 4 helps to reconcile this ap-parent disagreement. Since He droplets are expected tobe superfluid at the experimental temperature of 0.4K,43,44 configurations that start at, e.g., 22.2 and 25A are nonphysical, as the velocity of Ag in the dropletthat would permit the impurity to arrive at these classi-cal turning points is above the Landau critical velocity.Hence, before getting to these positions the motion ofAg would likely cause roton creation or ring vortex nu-cleation, thereby slowing down the silver atom.45,46
Closer inspection of Fig. 8 reveals some straggling ofthe phase space trajectories. The effect is most markedfor small Ag velocities, i.e., in the first stages of its dis-
�40 �20 0 20 40 �20 0 20 40�40
�20
0
20
40
�20
0
20
40
�20
0
20
40
x ���
z���
FIG. 7: (Color online) Starting from the top left frame, dy-namic evolution of the Ag@4He1000 complex when the Agatom initially at rest 22 A off center of the droplet is sud-denly excited to the 2P1/2 state. The time between frames is8 ps.
placement. This is best seen in calculations starting fromR0 = 1 A.42 In this case, it takes the silver atom some 150ps to travel up to about 10 A, and a very marked strag-gling is observed. During this phase of the evolution thespherical helium bubble is also found to “breath”, dis-playing distinct monopole oscillations with a period ofabout 20 ps, which corresponds to an energy of 2.3 K.At the same time strong density oscillations can be ob-served just above the geometrical center of the droplet,see also Fig. 6. It is at this point where the density waveslaunched by the excitation of the Ag atom are roughlyfocused after being reflected from the droplet surface.We have not tried to characterize the properties of thesewaves, as they have already been discussed in Ref. 4.The complex interference pattern produced by these den-sity waves persist for quite long times47 during whichthe droplet has a clear tendency to recover its sphericalsymmetry. We attribute the observed straggling in themotion of the excited Ag to its interaction with these in-terfering density waves. Inspection of Figure 8 furtherreveals that the final velocity for Ag excited in the bulk
52 CHAPTER 3. DYNAMICS
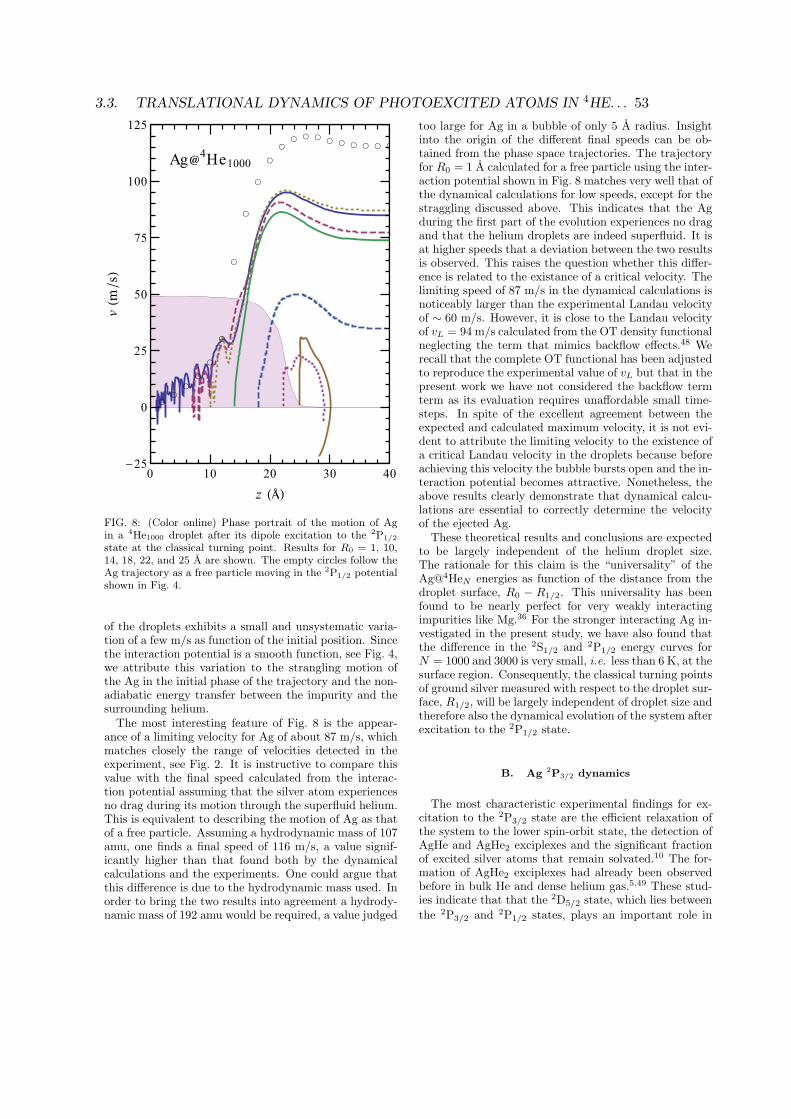
��
�
�
�
�
�
�
�
�
�� � � � � � � � �
Ag�4He1000
0 10 20 30 40�25
0
25
50
75
100
125
z ���
v�m�s�
FIG. 8: (Color online) Phase portrait of the motion of Agin a 4He1000 droplet after its dipole excitation to the 2P1/2
state at the classical turning point. Results for R0 = 1, 10,14, 18, 22, and 25 A are shown. The empty circles follow theAg trajectory as a free particle moving in the 2P1/2 potentialshown in Fig. 4.
of the droplets exhibits a small and unsystematic varia-tion of a few m/s as function of the initial position. Sincethe interaction potential is a smooth function, see Fig. 4,we attribute this variation to the strangling motion ofthe Ag in the initial phase of the trajectory and the non-adiabatic energy transfer between the impurity and thesurrounding helium.
The most interesting feature of Fig. 8 is the appear-ance of a limiting velocity for Ag of about 87 m/s, whichmatches closely the range of velocities detected in theexperiment, see Fig. 2. It is instructive to compare thisvalue with the final speed calculated from the interac-tion potential assuming that the silver atom experiencesno drag during its motion through the superfluid helium.This is equivalent to describing the motion of Ag as thatof a free particle. Assuming a hydrodynamic mass of 107amu, one finds a final speed of 116 m/s, a value signif-icantly higher than that found both by the dynamicalcalculations and the experiments. One could argue thatthis difference is due to the hydrodynamic mass used. Inorder to bring the two results into agreement a hydrody-namic mass of 192 amu would be required, a value judged
too large for Ag in a bubble of only 5 A radius. Insightinto the origin of the different final speeds can be ob-tained from the phase space trajectories. The trajectoryfor R0 = 1 A calculated for a free particle using the inter-action potential shown in Fig. 8 matches very well that ofthe dynamical calculations for low speeds, except for thestraggling discussed above. This indicates that the Agduring the first part of the evolution experiences no dragand that the helium droplets are indeed superfluid. It isat higher speeds that a deviation between the two resultsis observed. This raises the question whether this differ-ence is related to the existance of a critical velocity. Thelimiting speed of 87 m/s in the dynamical calculations isnoticeably larger than the experimental Landau velocityof ∼ 60 m/s. However, it is close to the Landau velocityof vL = 94 m/s calculated from the OT density functionalneglecting the term that mimics backflow effects.48 Werecall that the complete OT functional has been adjustedto reproduce the experimental value of vL but that in thepresent work we have not considered the backflow termterm as its evaluation requires unaffordable small time-steps. In spite of the excellent agreement between theexpected and calculated maximum velocity, it is not evi-dent to attribute the limiting velocity to the existence ofa critical Landau velocity in the droplets because beforeachieving this velocity the bubble bursts open and the in-teraction potential becomes attractive. Nonetheless, theabove results clearly demonstrate that dynamical calcu-lations are essential to correctly determine the velocityof the ejected Ag.
These theoretical results and conclusions are expectedto be largely independent of the helium droplet size.The rationale for this claim is the “universality” of theAg@4HeN energies as function of the distance from thedroplet surface, R0 − R1/2. This universality has beenfound to be nearly perfect for very weakly interactingimpurities like Mg.36 For the stronger interacting Ag in-vestigated in the present study, we have also found thatthe difference in the 2S1/2 and 2P1/2 energy curves forN = 1000 and 3000 is very small, i.e. less than 6 K, at thesurface region. Consequently, the classical turning pointsof ground silver measured with respect to the droplet sur-face, R1/2, will be largely independent of droplet size andtherefore also the dynamical evolution of the system afterexcitation to the 2P1/2 state.
B. Ag 2P3/2 dynamics
The most characteristic experimental findings for ex-citation to the 2P3/2 state are the efficient relaxation ofthe system to the lower spin-orbit state, the detection ofAgHe and AgHe2 exciplexes and the significant fractionof excited silver atoms that remain solvated.10 The for-mation of AgHe2 exciplexes had already been observedbefore in bulk He and dense helium gas.5,49 These stud-ies indicate that that the 2D5/2 state, which lies betweenthe 2P3/2 and 2P1/2 states, plays an important role in
3.3. TRANSLATIONAL DYNAMICS OF PHOTOEXCITED ATOMS IN 4HE. . . 53
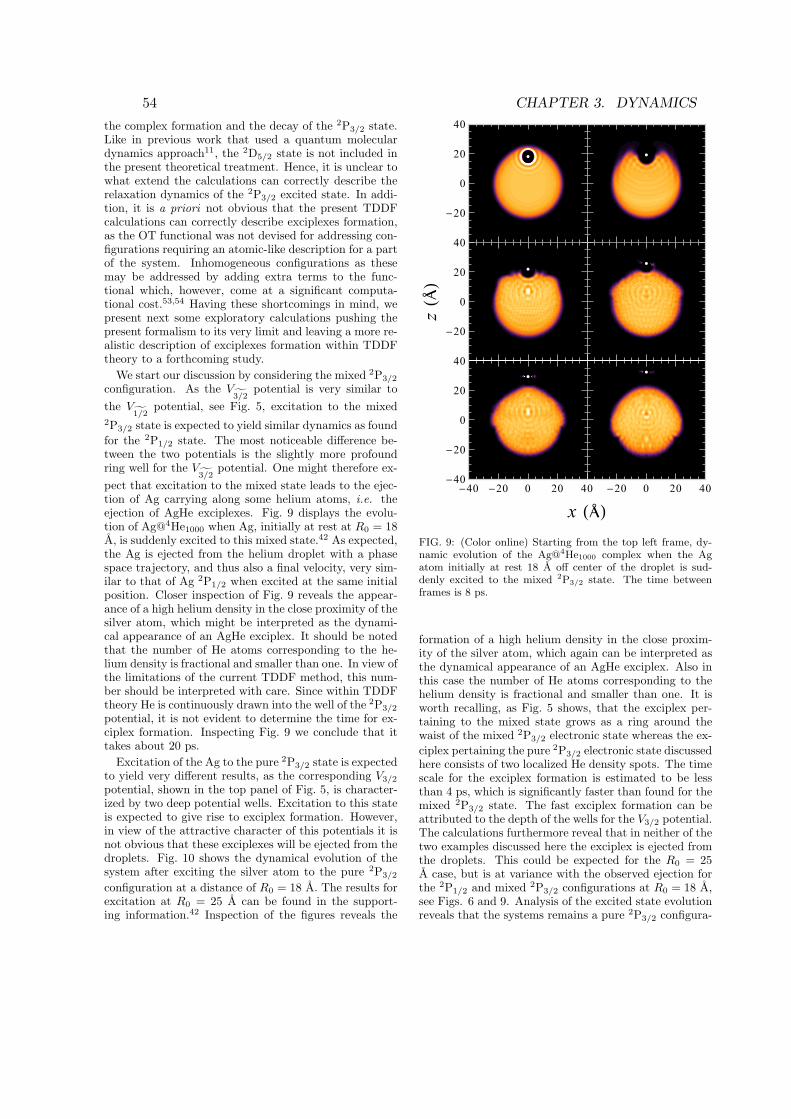
the complex formation and the decay of the 2P3/2 state.Like in previous work that used a quantum moleculardynamics approach11, the 2D5/2 state is not included inthe present theoretical treatment. Hence, it is unclear towhat extend the calculations can correctly describe therelaxation dynamics of the 2P3/2 excited state. In addi-tion, it is a priori not obvious that the present TDDFcalculations can correctly describe exciplexes formation,as the OT functional was not devised for addressing con-figurations requiring an atomic-like description for a partof the system. Inhomogeneous configurations as thesemay be addressed by adding extra terms to the func-tional which, however, come at a significant computa-tional cost.53,54 Having these shortcomings in mind, wepresent next some exploratory calculations pushing thepresent formalism to its very limit and leaving a more re-alistic description of exciplexes formation within TDDFtheory to a forthcoming study.
We start our discussion by considering the mixed 2P3/2
configuration. As the V3/2
potential is very similar tothe V
1/2potential, see Fig. 5, excitation to the mixed
2P3/2 state is expected to yield similar dynamics as foundfor the 2P1/2 state. The most noticeable difference be-tween the two potentials is the slightly more profoundring well for the V
3/2potential. One might therefore ex-
pect that excitation to the mixed state leads to the ejec-tion of Ag carrying along some helium atoms, i.e. theejection of AgHe exciplexes. Fig. 9 displays the evolu-tion of Ag@4He1000 when Ag, initially at rest at R0 = 18A, is suddenly excited to this mixed state.42 As expected,the Ag is ejected from the helium droplet with a phasespace trajectory, and thus also a final velocity, very sim-ilar to that of Ag 2P1/2 when excited at the same initialposition. Closer inspection of Fig. 9 reveals the appear-ance of a high helium density in the close proximity of thesilver atom, which might be interpreted as the dynami-cal appearance of an AgHe exciplex. It should be notedthat the number of He atoms corresponding to the he-lium density is fractional and smaller than one. In view ofthe limitations of the current TDDF method, this num-ber should be interpreted with care. Since within TDDFtheory He is continuously drawn into the well of the 2P3/2
potential, it is not evident to determine the time for ex-ciplex formation. Inspecting Fig. 9 we conclude that ittakes about 20 ps.
Excitation of the Ag to the pure 2P3/2 state is expectedto yield very different results, as the corresponding V3/2
potential, shown in the top panel of Fig. 5, is character-ized by two deep potential wells. Excitation to this stateis expected to give rise to exciplex formation. However,in view of the attractive character of this potentials it isnot obvious that these exciplexes will be ejected from thedroplets. Fig. 10 shows the dynamical evolution of thesystem after exciting the silver atom to the pure 2P3/2
configuration at a distance of R0 = 18 A. The results forexcitation at R0 = 25 A can be found in the support-ing information.42 Inspection of the figures reveals the
�40 �20 0 20 40 �20 0 20 40�40
�20
0
20
40
�20
0
20
40
�20
0
20
40
x ���
z���
FIG. 9: (Color online) Starting from the top left frame, dy-namic evolution of the Ag@4He1000 complex when the Agatom initially at rest 18 A off center of the droplet is sud-denly excited to the mixed 2P3/2 state. The time betweenframes is 8 ps.
formation of a high helium density in the close proxim-ity of the silver atom, which again can be interpreted asthe dynamical appearance of an AgHe exciplex. Also inthis case the number of He atoms corresponding to thehelium density is fractional and smaller than one. It isworth recalling, as Fig. 5 shows, that the exciplex per-taining to the mixed state grows as a ring around thewaist of the mixed 2P3/2 electronic state whereas the ex-ciplex pertaining the pure 2P3/2 electronic state discussedhere consists of two localized He density spots. The timescale for the exciplex formation is estimated to be lessthan 4 ps, which is significantly faster than found for themixed 2P3/2 state. The fast exciplex formation can beattributed to the depth of the wells for the V3/2 potential.The calculations furthermore reveal that in neither of thetwo examples discussed here the exciplex is ejected fromthe droplets. This could be expected for the R0 = 25A case, but is at variance with the observed ejection forthe 2P1/2 and mixed 2P3/2 configurations at R0 = 18 A,see Figs. 6 and 9. Analysis of the excited state evolutionreveals that the systems remains a pure 2P3/2 configura-
54 CHAPTER 3. DYNAMICS
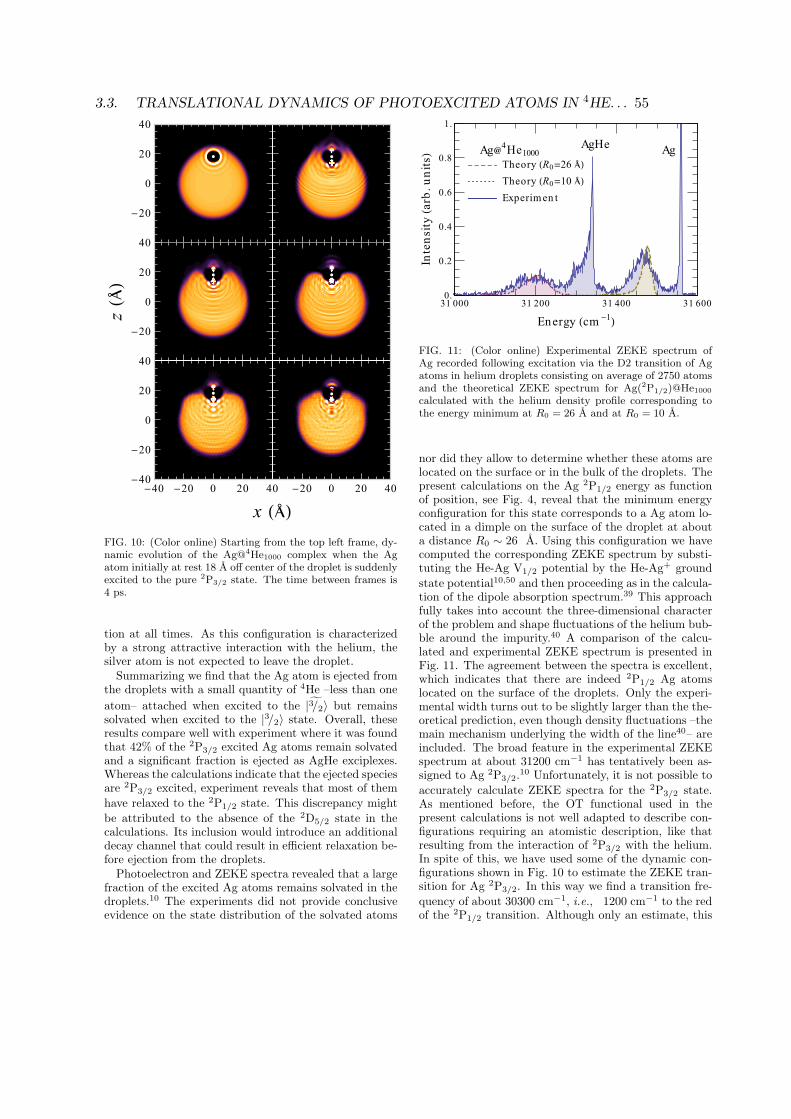
�40 �20 0 20 40 �20 0 20 40�40
�20
0
20
40
�20
0
20
40
�20
0
20
40
x ���
z���
FIG. 10: (Color online) Starting from the top left frame, dy-namic evolution of the Ag@4He1000 complex when the Agatom initially at rest 18 A off center of the droplet is suddenlyexcited to the pure 2P3/2 state. The time between frames is4 ps.
tion at all times. As this configuration is characterizedby a strong attractive interaction with the helium, thesilver atom is not expected to leave the droplet.
Summarizing we find that the Ag atom is ejected fromthe droplets with a small quantity of 4He –less than oneatom– attached when excited to the |3/2〉 but remainssolvated when excited to the |3/2〉 state. Overall, theseresults compare well with experiment where it was foundthat 42% of the 2P3/2 excited Ag atoms remain solvatedand a significant fraction is ejected as AgHe exciplexes.Whereas the calculations indicate that the ejected speciesare 2P3/2 excited, experiment reveals that most of themhave relaxed to the 2P1/2 state. This discrepancy mightbe attributed to the absence of the 2D5/2 state in thecalculations. Its inclusion would introduce an additionaldecay channel that could result in efficient relaxation be-fore ejection from the droplets.
Photoelectron and ZEKE spectra revealed that a largefraction of the excited Ag atoms remains solvated in thedroplets.10 The experiments did not provide conclusiveevidence on the state distribution of the solvated atoms
Ag�4He1000 AgAgHe
Experimen tTheory �R0�10 ��Theory �R0�26 ��
31 000 31 200 31 400 31 6000.
0.2
0.4
0.6
0.8
1.
Energy �cm �1�
Intensity�arb.units�
FIG. 11: (Color online) Experimental ZEKE spectrum ofAg recorded following excitation via the D2 transition of Agatoms in helium droplets consisting on average of 2750 atomsand the theoretical ZEKE spectrum for Ag(2P1/2)@He1000
calculated with the helium density profile corresponding tothe energy minimum at R0 = 26 A and at R0 = 10 A.
nor did they allow to determine whether these atoms arelocated on the surface or in the bulk of the droplets. Thepresent calculations on the Ag 2P1/2 energy as functionof position, see Fig. 4, reveal that the minimum energyconfiguration for this state corresponds to a Ag atom lo-cated in a dimple on the surface of the droplet at abouta distance R0 ∼ 26 A. Using this configuration we havecomputed the corresponding ZEKE spectrum by substi-tuting the He-Ag V1/2 potential by the He-Ag+ groundstate potential10,50 and then proceeding as in the calcula-tion of the dipole absorption spectrum.39 This approachfully takes into account the three-dimensional characterof the problem and shape fluctuations of the helium bub-ble around the impurity.40 A comparison of the calcu-lated and experimental ZEKE spectrum is presented inFig. 11. The agreement between the spectra is excellent,which indicates that there are indeed 2P1/2 Ag atomslocated on the surface of the droplets. Only the experi-mental width turns out to be slightly larger than the the-oretical prediction, even though density fluctuations –themain mechanism underlying the width of the line40– areincluded. The broad feature in the experimental ZEKEspectrum at about 31200 cm−1 has tentatively been as-signed to Ag 2P3/2.10 Unfortunately, it is not possible toaccurately calculate ZEKE spectra for the 2P3/2 state.As mentioned before, the OT functional used in thepresent calculations is not well adapted to describe con-figurations requiring an atomistic description, like thatresulting from the interaction of 2P3/2 with the helium.In spite of this, we have used some of the dynamic con-figurations shown in Fig. 10 to estimate the ZEKE tran-sition for Ag 2P3/2. In this way we find a transition fre-quency of about 30300 cm−1, i.e., 1200 cm−1 to the redof the 2P1/2 transition. Although only an estimate, this
3.3. TRANSLATIONAL DYNAMICS OF PHOTOEXCITED ATOMS IN 4HE. . . 55

result clearly rules out that experimental feature at 31200cm−1 originates from Ag 2P3/2. Photoionization studieson doped helium droplets have found that the ionizationthreshold generally is several 100 cm−1 lower in energyfor solvated species than for those located at the surfaceof helium droplets.51,52 Hence, it is very likely that the31200 cm−1 feature corresponds to solvated Ag 2P1/2.This suggestion is confirmed by calculations where Ag islocated at R0 = 10 A, i.e., in the bulk of the droplet. Ascan be seen in Fig. 11, the agreement between the cal-culated and experimentally observed ZEKE transition isexcellent. This assignment implies that the 2P3/2 excitedAg atoms relax very efficiently to the 2P1/2 state. Thefact that the dynamical calculations do not reveal sucha relaxation process can be attributed to the simplifica-tion not to include the 2D5/2 state in the simulations.This assignment raises the question as why Ag 2P1/2 isobserved in the bulk of the droplets even though the in-teraction of Ag 2P1/2 with helium is repulsive, see Fig.5. One possible explanation would be that the ionizationrate is sufficiently high that the Ag atoms are ionizedbefore they have been ejected from the droplets. Thiswould also explain why the fraction of solvated Ag 2P1/2
was found to increase with droplet radius.10
V. SUMMARY AND OUTLOOK
We have carried out a combined experimental and the-oretical investigation of the translational dynamics of Agatoms in helium droplets photoexcited to the 2P mani-fold. An analysis of the experimental results has beencarried out within a full dynamical, three dimensionalapproach that combines a time-dependent DFT descrip-tion of the droplet with a classical dynamics descriptionof the impurity. Our theoretical approach has a broadapplicability. In particular, it is well suited to describethe solvation and desolvation of Ba+ cations in heliumdroplets.21
The experiments have revealed that the 5p 2P1/2 ←5s 2S1/2 (D1) and 5p 2P3/2 ← 5s 2S1/2 (D2) transitionsare significantly blue-shifted with respect to the corre-sponding gas phase transitions, and that they do notoverlap. These observations are quantitatively repro-duced by the static calculations, which allows us to haveconfidence in the theoretical model.
In qualitative agreement with experiment, the dynam-ical calculations reveal the existence of a limiting velocityfor silver atoms ejected from the droplets following exci-tation to the 2P1/2 state. The calculations furthermorereveal that at low velocities the Ag does not experienceany drag by the surrounding helium, which can be takenas evidence of superfluidity of the helium droplets. Athigher velocities, a clear deviation from this behavior isobserved. The limiting velocity attained by the silveratom is close to the Landau velocity associated with theused OT density functional. However, we cannot conclu-sively attribute the limiting velocity to the critical Lan-
dau velocity because, by the time the Ag atom has ac-celerated enough to potentially excite rotons or nucleatevortices in the liquid, the bubble has already burst open.Nonetheless, we would like to stress that the employedmethod makes use of a dynamical framework that allowsfor roton excitation and ring vortex nucleation, albeitat velocities about 50 % larger than found experimen-tally. The observed maximum speed could therefore wellbe related to the critical velocity associated with theseprocesses. In this respect it is worth noting that ring vor-tex nucleation by neutral impurities or cations moving inliquid helium has never been addressed by realistic meth-ods. The huge structural changes neutral impurities in-duce in the surrounding liquid at small length scales willrender the development of any vorticity around a neu-tral impurity very difficult. Hence, before consideringthe possibility of ring vortex nucleation as a dissipationmechanism of the translational energy of impurities indroplets, a realistic attempt to generate them in liquidhelium is called for.
The calculations indicate that excitation of Ag via theD2 transition leads to exciplexes formation. Those ex-cited to the mixed |3/2〉 state are found to be ejectedfrom the droplets, whereas those excited to the pure |3/2〉state remain solvated. Although these results qualita-tively agree with the experimental findings, experimen-tally a strong relaxation to the 2P1/2 state is observed.This discrepancy likely comes from the absence of the2D5/2 state in the calculations. Although evidence for ex-ciplex formation is found in the calculations, an accuratedescription of the dynamical exciplex formation is still achallenge. Within TDDFT, a possible way to achieve thisis to use a test particle description of the helium droplet,generalizing the approach of Ref. 4. Alternatively, onemight use the solid-like density functional approach ofRefs. 53,54 that allows to describe localized bunches ofHe atoms while the rest of the cluster is still delocalized.
Acknowledgments
We would like to thank Fausto Cargnoni and MassimoMella for supplying us with the Ag-He pair potentials,and Francesco Ancilotto for useful discussions. This workhas been performed under Grants No. FIS2011-28617-C02-01 from DGI, Spain (FEDER), 2009SGR1289 fromGeneralitat de Catalunya, and 200020-129623 from theSwiss National Science Foundation. AH has been sup-ported by the ANR (France), Grant No. ANR-08-BLAN-0146-01. DM has been supported by the ME (Spain)FPU program, Grant No. AP2008-04343.
Appendix
It is interesting to see the effect on the spectrum ofthe solvation structure surrounding the impurity, whichis always overlooked within the standard bubble model
56 CHAPTER 3. DYNAMICS
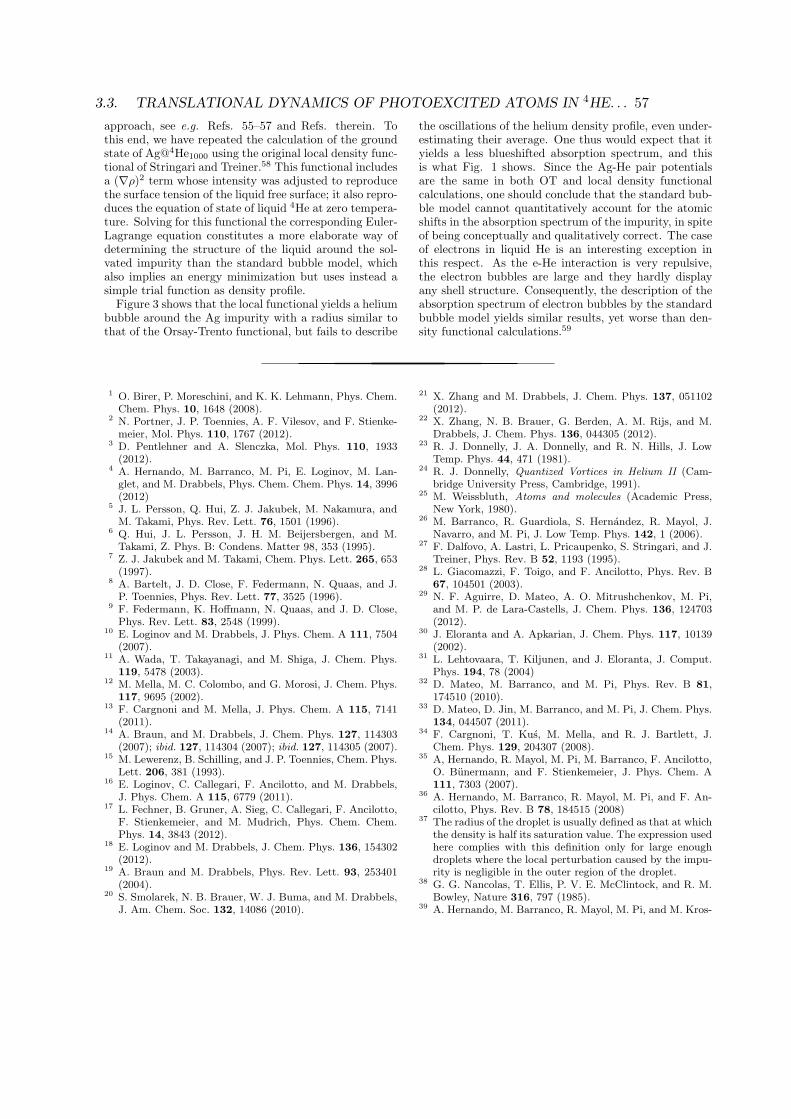
approach, see e.g. Refs. 55–57 and Refs. therein. Tothis end, we have repeated the calculation of the groundstate of Ag@4He1000 using the original local density func-tional of Stringari and Treiner.58 This functional includesa (∇ρ)2 term whose intensity was adjusted to reproducethe surface tension of the liquid free surface; it also repro-duces the equation of state of liquid 4He at zero tempera-ture. Solving for this functional the corresponding Euler-Lagrange equation constitutes a more elaborate way ofdetermining the structure of the liquid around the sol-vated impurity than the standard bubble model, whichalso implies an energy minimization but uses instead asimple trial function as density profile.
Figure 3 shows that the local functional yields a heliumbubble around the Ag impurity with a radius similar tothat of the Orsay-Trento functional, but fails to describe
the oscillations of the helium density profile, even under-estimating their average. One thus would expect that ityields a less blueshifted absorption spectrum, and thisis what Fig. 1 shows. Since the Ag-He pair potentialsare the same in both OT and local density functionalcalculations, one should conclude that the standard bub-ble model cannot quantitatively account for the atomicshifts in the absorption spectrum of the impurity, in spiteof being conceptually and qualitatively correct. The caseof electrons in liquid He is an interesting exception inthis respect. As the e-He interaction is very repulsive,the electron bubbles are large and they hardly displayany shell structure. Consequently, the description of theabsorption spectrum of electron bubbles by the standardbubble model yields similar results, yet worse than den-sity functional calculations.59
1 O. Birer, P. Moreschini, and K. K. Lehmann, Phys. Chem.Chem. Phys. 10, 1648 (2008).
2 N. Portner, J. P. Toennies, A. F. Vilesov, and F. Stienke-meier, Mol. Phys. 110, 1767 (2012).
3 D. Pentlehner and A. Slenczka, Mol. Phys. 110, 1933(2012).
4 A. Hernando, M. Barranco, M. Pi, E. Loginov, M. Lan-glet, and M. Drabbels, Phys. Chem. Chem. Phys. 14, 3996(2012)
5 J. L. Persson, Q. Hui, Z. J. Jakubek, M. Nakamura, andM. Takami, Phys. Rev. Lett. 76, 1501 (1996).
6 Q. Hui, J. L. Persson, J. H. M. Beijersbergen, and M.Takami, Z. Phys. B: Condens. Matter 98, 353 (1995).
7 Z. J. Jakubek and M. Takami, Chem. Phys. Lett. 265, 653(1997).
8 A. Bartelt, J. D. Close, F. Federmann, N. Quaas, and J.P. Toennies, Phys. Rev. Lett. 77, 3525 (1996).
9 F. Federmann, K. Hoffmann, N. Quaas, and J. D. Close,Phys. Rev. Lett. 83, 2548 (1999).
10 E. Loginov and M. Drabbels, J. Phys. Chem. A 111, 7504(2007).
11 A. Wada, T. Takayanagi, and M. Shiga, J. Chem. Phys.119, 5478 (2003).
12 M. Mella, M. C. Colombo, and G. Morosi, J. Chem. Phys.117, 9695 (2002).
13 F. Cargnoni and M. Mella, J. Phys. Chem. A 115, 7141(2011).
14 A. Braun, and M. Drabbels, J. Chem. Phys. 127, 114303(2007); ibid. 127, 114304 (2007); ibid. 127, 114305 (2007).
15 M. Lewerenz, B. Schilling, and J. P. Toennies, Chem. Phys.Lett. 206, 381 (1993).
16 E. Loginov, C. Callegari, F. Ancilotto, and M. Drabbels,J. Phys. Chem. A 115, 6779 (2011).
17 L. Fechner, B. Gruner, A. Sieg, C. Callegari, F. Ancilotto,F. Stienkemeier, and M. Mudrich, Phys. Chem. Chem.Phys. 14, 3843 (2012).
18 E. Loginov and M. Drabbels, J. Chem. Phys. 136, 154302(2012).
19 A. Braun and M. Drabbels, Phys. Rev. Lett. 93, 253401(2004).
20 S. Smolarek, N. B. Brauer, W. J. Buma, and M. Drabbels,J. Am. Chem. Soc. 132, 14086 (2010).
21 X. Zhang and M. Drabbels, J. Chem. Phys. 137, 051102(2012).
22 X. Zhang, N. B. Brauer, G. Berden, A. M. Rijs, and M.Drabbels, J. Chem. Phys. 136, 044305 (2012).
23 R. J. Donnelly, J. A. Donnelly, and R. N. Hills, J. LowTemp. Phys. 44, 471 (1981).
24 R. J. Donnelly, Quantized Vortices in Helium II (Cam-bridge University Press, Cambridge, 1991).
25 M. Weissbluth, Atoms and molecules (Academic Press,New York, 1980).
26 M. Barranco, R. Guardiola, S. Hernandez, R. Mayol, J.Navarro, and M. Pi, J. Low Temp. Phys. 142, 1 (2006).
27 F. Dalfovo, A. Lastri, L. Pricaupenko, S. Stringari, and J.Treiner, Phys. Rev. B 52, 1193 (1995).
28 L. Giacomazzi, F. Toigo, and F. Ancilotto, Phys. Rev. B67, 104501 (2003).
29 N. F. Aguirre, D. Mateo, A. O. Mitrushchenkov, M. Pi,and M. P. de Lara-Castells, J. Chem. Phys. 136, 124703(2012).
30 J. Eloranta and A. Apkarian, J. Chem. Phys. 117, 10139(2002).
31 L. Lehtovaara, T. Kiljunen, and J. Eloranta, J. Comput.Phys. 194, 78 (2004)
32 D. Mateo, M. Barranco, and M. Pi, Phys. Rev. B 81,174510 (2010).
33 D. Mateo, D. Jin, M. Barranco, and M. Pi, J. Chem. Phys.134, 044507 (2011).
34 F. Cargnoni, T. Kus, M. Mella, and R. J. Bartlett, J.Chem. Phys. 129, 204307 (2008).
35 A, Hernando, R. Mayol, M. Pi, M. Barranco, F. Ancilotto,O. Bunermann, and F. Stienkemeier, J. Phys. Chem. A111, 7303 (2007).
36 A. Hernando, M. Barranco, R. Mayol, M. Pi, and F. An-cilotto, Phys. Rev. B 78, 184515 (2008)
37 The radius of the droplet is usually defined as that at whichthe density is half its saturation value. The expression usedhere complies with this definition only for large enoughdroplets where the local perturbation caused by the impu-rity is negligible in the outer region of the droplet.
38 G. G. Nancolas, T. Ellis, P. V. E. McClintock, and R. M.Bowley, Nature 316, 797 (1985).
39 A. Hernando, M. Barranco, R. Mayol, M. Pi, and M. Kros-
3.3. TRANSLATIONAL DYNAMICS OF PHOTOEXCITED ATOMS IN 4HE. . . 57
nicki, Phys. Rev. B 77, 024513 (2008).40 D. Mateo, A. Hernando, M. Barranco, R. Mayol, and M.
Pi, Phys. Rev. B 83, 174505 (2011).41 A. Ralston and H. S. Wilf, Mathematical methods for dig-ital computers (John Wiley and Sons, New York, 1960).
42 See supplementary material at http://www.ecm.ub.es/
famn/share/quantum_liquids/helium4/Ag/ for the con-tinuous movies corresponding to Figs. 6-7 and 9-10 andother results.
43 D. M. Brink and S. Stringari, Z. Phys. D 15, 257 (1990).44 J. Harms, M. Hartmann, J. P. Toennies, A. F. Vilesov, and
B. Sartakov, J. Mol. Spectrosc. 185, 204 (1997).45 F. Ancilotto, M. Barranco, and M. Pi, Phys. Rev. B 82,
014517 (2010).46 D. Jin and W. Guo, Phys. Rev. B 82, 094524 (2010)47 Notice that the time elapsed between the first two frames
in Fig. 6 is 8 ps, whereas the dynamics of Na was followedin Ref. 4 for just 5 ps.
48 D. Mateo, M. Barranco, and J. Navarro, Phys. Rev. B 82,134529 (2010).
49 Z. J. Jakubek, Q. Hui, and M. Takami, Phys. Rev. Lett.79, 629 (1997).
50 The He-Ba+ pair potential has been calculated at theCCSD(T) level of theory10 using the same basis set as inZ. J. Jakubek and M. Takami, Chem. Phys. Lett. 265, 653(1997).
51 E. Loginov and M. Drabbels, Phys. Rev. Lett. 106, 083401(2011).
52 E. Loginov, D. Rossi, and M. Drabbels, Phys. Rev. Lett.95, 163401 (2005).
53 F. Ancilotto, M. Barranco, F. Caupin, R. Mayol, and M.Pi, Phys. Rev. B 72, 214522 (2005)
54 F. Ancilotto, M. Pi, R. Mayol, M. Barranco, and K. K.Lehmann, J. Phys. Chem. A 111, 12695 (2007)
55 B. Tabbert, H. Gunther, and G. zu Putlitz, J. Low Temp.Phys. 109, 653 (1997).
56 Y. Moriwaki and N. Morita, Eur. Phys. J. D 13, 11 (2001).57 Y. Moriwaki, K. Inui, K. Kobayashi, F. Matsushima, and
N. Morita, J. Mol. Struct. 786, 112 (2006).58 S. Stringari and J. Treiner, Phys. Rev. B 36, 16 (1987); J.
Chem. Phys. 87, 5021 (1987).59 V. Grau, M. Barranco, R. Mayol, and M. Pi, Phys. Rev.
B 73, 064502 (2006).
58 CHAPTER 3. DYNAMICS
Chapter 4
Summary and Conclusions
This thesis presents a collection of four papers published in peer-reviewed scientificjournals plus a manuscript yet to be submitted, all of them in the field of low temperaturephysics and quantum fluids. Each of these works reports a step forward in the ever-developing theoretical description of helium systems by means of density functional theory.
The first two papers [11, 12] are labelled as “structure” and deal with questionsrelated to the groundstate description of helium complexes around atomic impurities. Wehave computed such structure and determined its effect on the dipole absorption spectrumof Na in 3He–4He clusters and of Mg in the homogeneous, isotopically mixed liquid. Forthe case of Na in clusters we have found that even though a large amount of 3He isneeded for the density in the outer shell of the mixed droplet to reach the bulk liquid3He value, the spectrum of the impurity is very insensitive to the isotopic compositionand it rapidly saturates to the value of pure 3He droplets when the quantity of 3He isincreased. For Mg in the mixed liquid, the presence of 3He in the liquid induces shifts inthe spectrum much smaller than its typical width so we have found the spectroscopiceffect of the isotopic composition to be minor.
We have also explored the limits of density functional calculations for a small numberof helium atoms interacting with a linear carbonyl sulfide (OCS) molecule. To thisend we have implemented a Kohn-Sham scheme for 3He and computed the structure ofOCS@3HeN clusters for N up to to 40. We have compared the results for 4He clusterswith the same N value and found that the high anisotropy of the OCS molecule magnifiesthe effect of the different statistics of each isotope. Our estimate of the moments ofinertia for these clusters is consistent with the interpretation of experimental data[13]suggesting an 11 atoms shell structure rigidly rotating with the OCS molecule.
The next three papers [10, 14, 15], labelled as “dynamics”, deal with the real-timedescription of dynamical processes in helium systems of experimental interest. Whilethe publications on statics are a steady completion of a well established line of work,the papers of this section open a new front for theoretical exploration of dynamicalprocesses with picosecond resolution. We present an efficient and quantitatively accurate
59
60 CHAPTER 4. SUMMARY AND CONCLUSIONS
procedure to compute the dynamics of an excited electron bubble and of an excited silverimpurity, following a time-dependent density functional theory (TDDFT) approach forhelium coupled to the appropiate dynamics for the impurity. The “appropiate” dynamicsdepends on the properties of the impurity: for the 1P electron bubble one can use apurely quantum mechanical description of the electron within an adiabatic approximation,whereas for the 2P bubble the adiabatic approximation must be lifted. For a heavyimpurity such as Ag a classical description of its motion is enough, but its spin-orbitstrength is large enough for the electronic state of the atom to be taken into account asa quantized degree of freedom. Our work shows that the use of TDDFT provides a goodcompromise between quantitative accuracy and computational efficiency, allowing to carryon the dynamical evolution of drops with thousand He atoms for hundred picoseconds.
In the case of the electron bubble, we have related the experimental disappearanceof 1P bubbles at high pressures[9] with the existence of a nonradiative de-excitationpath involving the bubble splitting about 20 picoseconds after the excitation. Our claimis sustained by the fact that our calculation predicts the splitting only for pressuresabove 1 bar, which is the same pressure threshold of the experimental disappearance.This agreement shows the remarkable accuracy of the calculations, as increasing theliquid pressure by 1 bar increases its density by a mere 1%. We have also found amarked change in the behavior of the time-resolved absorption spectrum of the 1Pbubble depending on whether the bubble fissions or not, i.e., on the liquid pressure. Thischange is in principle an experimentally accessible observable whose determination maycomplement the information obtained from cavitation and photoconductivity experiments.
In the case of the desorption of a silver atom from a He drop, our dynamical calcula-tions predict a range of velocities for the ejected impurity consistent with the experimentalvelocity distribution. This velocity is the result of how much energy is transferred fromthe impurity to the droplet, which depends on the accesible excitation modes. Ourdescription of helium only allows for collective excitations such as density waves andsurface oscilaltions, thus the agreement in the impurity velocity can be taken as indirectevidence of the superfluidity of helium nanodroplets. Besides, we have also ruled outvortex nucleation as a likely mode for energy transfer in such small drops doped withAg. The huge structural changes in the surrounding liquid at the nanoscale induced byattractive impurities (neutral atoms or cations for instance) will render the developmentof any vorticity extremely difficult in such small systems. In this respect it is worthnoting that ring vortex nucleation by attractive impurities moving in liquid helium hasnever been addressed by realistic methods.
In the course of our research we have developed and implemented several numericaltools, to mention a few: a Kohn-Sham implementation for 3He clusters that fullytakes into account the symmetries of the system while still using the power of FastFourier Transform techniques to compute convolution integrals,[12] the coupling of twowavefunctions evolving at very different time-scales through an adiabatic approach,[14]
4.1. OUTLOOK 61
the implementation of an efficient damping scheme to prevent bouncing waves fromspoiling the calculation,[15] and the inclusion of a time-evolving electronic configuration(limited to the P manifold) of an impurity moving through helium.[10]
4.1 Outlook
There are dynamical processes in doped helium systems at the picosecond scale wherethe methodology presented here could be applied after some further developments areintroduced. Situations where highly-localized structures appear –such as exciplexes[31] orsnowballs[32]– are particularly challenging as they push the TDDFT formalism to its lim-its of application. How many atoms conform the snowball around an ion? When and howdoes the exciplex appear? How long does it take to form these structures? These are exam-ples of open questions calling for improvements in the present implementation of TDDFT.It is worth mentioning the existence of methods to handle solid-like configurations withinDFT,[33] and test particle-like methods[34] that could be tried in dynamical situationsinvolving these very localized structures. Work along these lines is in progress in the group.

62 CHAPTER 4. SUMMARY AND CONCLUSIONS
Appendix A
List of publications
2009
• Spectrum of a 3He atom in a Ca@4He50 droplet. David Mateo, Manuel Barranco,Ricardo Mayol, Jesus Navarro, and Martı Pi. J. Phys.: Conf. Ser. 150, 032051(2009)
• Ca impurity in small mixed 3He–4He clusters. Rafael Guardiola, Jesus Navarro,David Mateo, and Manuel Barranco. J. Chem. Phys. 131, 174110 (2009)
• Solvation onset of Ca in mixed helium droplets. David Mateo, Manuel Barranco,Ricardo Mayol, and Martı Pi. Eur. Phys. J. D 52, 63 (2009)
2010
• Evolution of the excited electron bubble in liquid 4He and the appearance of fission-like processes. David Mateo, Martı Pi, and Manuel Barranco. Phys. Rev. B 81,174510 (2010)
• Elementary excitations in superfluid 3He–4He mixtures. David Mateo, ManuelBarranco, and Jesus Navarro. Phys. Rev. B 82, 134529 (2010)
• Infrared Absorption and Emission Spectrum of Electron Bubbles Attached to LinearVortices in Liquid 4He. David Mateo, Alberto Hernando, Manuel Barranco, andMartı Pi. J. Low Temp. Phys. 158, 397 (2010)
2011
• Absorption spectrum of atomic impurities in isotopic mixtures of liquid helium.David Mateo, Alberto Hernando, Manuel Barranco, Ricardo Mayol, and Martı Pi.Phys. Rev. B 83, 174505 (2011)
• Excited electron-bubble states in superfluid 4He: A time-dependent density functionalapproach. David Mateo, Dafei Jin, Manuel Barranco, and Martı Pi. J. Chem. Phys.134, 044507 (2011)
63

64 APPENDIX A. LIST OF PUBLICATIONS
2012
• Mg impurity in helium droplets. Jesus Navarro, David Mateo, Manuel Barranco,and Antonio Sarsa. J. Chem. Phys. 136, 054301 (2012)
• Helium mediated deposition: Modeling the He−TiO2(110)-(1×1) interaction po-tential and application to the collision of a helium droplet from density functionalcalculations. Nestor F. Aguirre, David Mateo, Alexander O. Mitrushchenkov, MartıPi, and Marıa Pilar de Lara-Castells. J. Chem. Phys. 136, 124703 (2012)
• Theoretical modeling of ion mobility in superfluid 4He. Steven L. Fiedler, DavidMateo, Tatevik Aleksanyan, and Jussi Eloranta. Phys. Rev. B 86, 144522 (2012)
2013
• A density functional study of the structure of small OCS@3HeN clusters. DavidMateo, Martı Pi, Jesus Navarro, and J. Peter Toennies. J. Chem. Phys. 138,044321 (2013)
• Electron Photo-ejection from Bubble States in Liquid 4He. Julian Barragan, DavidMateo, Martı Pi, Francesc Salvat, Manuel Barranco, and Humphrey J. Maris. J.Low Temp. Phys. DOI: 10.1007/s10909-012-0730-4 (2013)
In progress
• Existence of a critical Landau velocity in finite size helium systems, Nils B. Brauer,Szymon Smolarek, Evgeniy Loginov, David Mateo, Alberto Hernando, Martı Pi,Manuel Barranco, Wybren J. Buma, and Marcel Drabbels. To be submitted (2013).
• Translational dynamics of photoexcited atoms in 4He nanodroplets: The case ofsilver, David Mateo, Alberto Hernando, Manuel Barranco, Evgeniy Loginov, MarcelDrabbels, and Martı Pi. To be submitted (2013).
Bibliography
[1] Pitaevskii, L. and Stringari, S. Bose-Einstein Condensation, volume 116 of Interna-tional Series of Monographs on Physics. Claredon Press, (2003).
[2] Toennies, J. P. and Vilesov, A. F. Angewandte Chemie International Edition 43(20),2622–2648 (2004).
[3] Stienkemeier, F. and Lehmann, K. K. Journal of Physics B: Atomic, Molecular andOptical Physics 39(8), R127 (2006).
[4] Barranco, M., Guardiola, R., Hernandez, S., Mayol, R., Navarro, J., and Pi, M.Journal of Low Temperature Physics 142, 1–81 (2006).
[5] Tiggesbaumker, J. and Stienkemeier, F. Phys. Chem. Chem. Phys. 9, 4748–4770(2007).
[6] Choi, M. Y., Douberly, G. E., Falconer, T. M., Lewis, W. K., Lindsay, C. M., Merritt,J. M., Stiles, P. L., and Miller, R. E. International Reviews in Physical Chemistry25(1-2), 15–75 (2006).
[7] Szalewicz, K. International Reviews in Physical Chemistry 27(2), 273–316 (2008).
[8] Ancilotto, F., Cheng, E., Cole, M., and Toigo, F. Zeitschrift fur Physik B CondensedMatter 98, 323–329 (1995).
[9] Maris, H. J., Ghosh, A., Konstantinov, D., and Hirsch, M. J. Low Temp. Physics134, 227 (2004).
[10] Mateo, D., Hernando, A., Barranco, M., Loginov, E., Drabbels, M., and Pi, M. tobe submitted, (2013).
[11] Mateo, D., Hernando, A., Barranco, M., Mayol, R., and Pi, M. Phys. Rev. B 83,174505 May (2011).
[12] Mateo, D., Pi, M., Navarro, J., and Toennies, J. P. The Journal of Chemical Physics138(4), 044321 (2013).
[13] Sartakov, B. G., Toennies, J. P., and Vilesov, A. F. The Journal of Chemical Physics136(13), 134316 (2012).
65
66 BIBLIOGRAPHY
[14] Mateo, D., Pi, M., and Barranco, M. Phys. Rev. B 81, 174510 May (2010).
[15] Mateo, D., Jin, D., Barranco, M., and Pi, M. The Journal of Chemical Physics134(4), 044507 (2011).
[16] van Delft, D. Physics Today 61(3), 36–42 (2008).
[17] Leggett, A. J. Rev. Mod. Phys. 47, 331–414 Apr (1975).
[18] Krotscheck, E. Microscopic Quantum Many-Body Theories and their applications,volume 510 of Lecture Notes in Physics, 187–250. Springer (1998).
[19] Boronat, J. Microscopic Approaches to Quantum Liquids in Confined Geometries,volume 4 of Series on Advances in Quantum Many-Body Theory, chapter 2, 21–86.World Scientific (2002).
[20] Saarela, M., Apaja, V., and Halinen, J. Microscopic Approaches to Quantum Liquidsin Confined Geometries, volume 4 of Series on Advances in Quantum Many-BodyTheory, chapter 4, 129–193. World Scientific (2002).
[21] Apaja, V. and Krotscheck, E. Microscopic Approaches to Quantum Liquids inConfined Geometries, volume 4 of Series on Advances in Quantum Many-BodyTheory, chapter 5, 197–258. World Scientific (2002).
[22] Bishop, R. F. Microscopic Quantum Many-Body Theories and their applications,volume 510 of Lecture Notes in Physics, 1–70. Springer (1998).
[23] Padmore, T. C. and Cole, M. W. Phys. Rev. A 9, 802–807 Feb (1974).
[24] Ebner, C. and Saam, W. F. Phys. Rev. B 12, 923–939 Aug (1975).
[25] Kohn, W. and Sham, L. J. Phys. Rev. 140, A1133–A1138 Nov (1965).
[26] Hernandez, E. S. and Navarro, J. Microscopic Approaches to Quantum Liquidsin Confined Geometries, volume 4 of Series on Advances in Quantum Many-BodyTheory, chapter 6, 261–312. World Scientific (2002).
[27] Hohenberg, P. and Kohn, W. Phys. Rev. 136, B864–B871 Nov (1964).
[28] Dalfovo, F., Lastri, A., Pricaupenko, L., Stringari, S., and Treiner, J. Phys. Rev. B52, 1193–1209 Jul (1995).
[29] Barranco, M., Pi, M., Gatica, S. M., Hernandez, E. S., and Navarro, J. Phys. Rev.B 56, 8997–9003 Oct (1997).
[30] Ralston, A. and Wilf, H. S. Mathematical methods for digital computers, volume 1,95–120. John Wiley and Sons (1960).
[31] Loginov, E. and Drabbels, M. The Journal of Physical Chemistry A 111(31),7504–7515 (2007). PMID: 17569515.

67
[32] Muller, S., Mudrich, M., and Stienkemeier, F. The Journal of Chemical Physics131(4), 044319 (2009).
[33] Ancilotto, F., Barranco, M., Caupin, F., Mayol, R., and Pi, M. Phys. Rev. B 72,214522 Dec (2005).
[34] Hernando, A., Barranco, M., Pi, M., Loginov, E., Langlet, M., and Drabbels, M.Phys. Chem. Chem. Phys. 14, 3996–4010 (2012).