A first principles molecular dynamics study of vibrational spectral diffusion and hydrogen bond...
7
A first principles molecular dynamics study of vibrational spectral diffusion and hydrogen bond dynamics in liquid methanol Vivek K. Yadav, Anwesa Karmakar, Jyoti Roy Choudhuri, Amalendu Chandra ⇑ Department of Chemistry, Indian Institute of Technology, Kanpur 208016, India article info Article history: Received 31 May 2012 In final form 5 September 2012 Available online 16 September 2012 Keywords: Liquid methanol Ab initio molecular dynamics Hydrogen bonds Spectral diffusion abstract We present a first principles theoretical study of vibrational spectral diffusion and hydrogen bond dynamics in liquid methanol at room temperature. The dynamics of spectral diffusion of OD modes of deuterated methanol reveals two times scales: a short time scale of about 120 fs and a longer time scale of about 3.2 ps. A damped oscillation is also found at around 120–180 fs. Calculations of power spectrum of relative velocities and hydrogen bond correlation functions reveal that the short time dynamics orig- inates from intermolecular motion of hydrogen bonded methanol pairs while the long time relaxation corresponds to the breaking dynamics of hydrogen bonds. The quantitative details of the time constants are found to depend on the frequency of tagged OD bonds. Ó 2012 Elsevier B.V. All rights reserved. 1. Introduction Methanol is the simplest organic molecule containing both hydrophilic (hydroxyl) and hydrophobic (methyl) groups. The structure of liquid methanol has been extensively studied using neutron and X-ray diffraction and spectroscopic methods [1–8] and also theoretically [9–16]. Due to the presence of hydroxyl group, methanol molecules form hydrogen bonds which greatly influence the characteristics of this solvent. However, unlike liquid water where each molecule forms about four hydrogen bonds [17,18], each molecule in liquid methanol forms only about two hydrogen bonds [19–24] and this reduced number of hydrogen bonds leads to quite different structural and dynamical properties of liquid methanol compared to that of water. Studies of vibrational spectral diffusion within the stretch band of normal or deuterated methanol by using ultrafast time resolved infrared spectroscopy provide a very powerful experimental means to investigate the hydrogen bond dynamics in liquid methanol at molecular level [25–28]. Vibrational frequencies of a hydrogen bonded molecule are known to be sensitive to its local solvent environment. When the surrounding environment fluctuates, the vibrational frequency also fluctuates. The time dependence of these vibrational frequency fluctuations is known as vibrational spectral diffusion. Recent experiments on vibrational spectral dif- fusion in liquid methanol involving time resolved pump–probe experiments have shown the presence of two time scales: A short time scale around 0.1 ps and a long time scale of 1.6 ± 0.3 ps [25]. Many simulations using classical molecular dynamics with empir- ical force fields have also been carried out to study the dynamics of liquid methanol [15,16,22,23]. More recently, the technique of ab initio molecular dynamics [29,30] has also been employed to study liquid methanol which goes beyond the use of any empirical inter- action potentials. However, the existing ab initio simulation studies have primarily focused on the structure, single-particle dynamics such as diffusion and orientational relaxation and pair dynamics such as relaxation of hydrogen bonds [31–37]. To the best of our knowledge, the dynamics of vibrational spectral diffusion in liquid methanol has not yet been studied through first principles simulations. The present work deals with a first principles theoretical study of the vibrational spectral diffusion and hydrogen bond dynamics in liquid methanol. We have employed the method of ab initio molecular dynamics [29,30] for the generation of the trajectories and wavelet analysis [38–41] method for the time dependent fre- quency calculations along the trajectories. First, we analyze the equilibrium aspects of frequency-structure correlations in metha- nol. Mainly, the relations between the fluctuating stretch frequen- cies of OD bonds of deuterated methanol and associated DO hydrogen bonds are found out. Subsequently, the dynamics of vibrational spectral diffusion are studied by means of frequency time correlation and spectral hole dynamics [41,42] calculations. The results of the dynamics are analyzed in terms of the damped intermolecular vibrations of intact hydrogen-bonded methanol pairs and also the lifetimes of free and hydrogen bonded states of OD bonds. The quantitative details of the time constants of frequency correlations and spectral shifts are found to depend on the frequencies of the tagged OD bonds. The results are analyzed 0301-0104/$ - see front matter Ó 2012 Elsevier B.V. All rights reserved. http://dx.doi.org/10.1016/j.chemphys.2012.09.006 ⇑ Corresponding author. Tel.: +91 512 2597241; fax: +91 512 2597436. E-mail address: [email protected] (A. Chandra). Chemical Physics 408 (2012) 36–42 Contents lists available at SciVerse ScienceDirect Chemical Physics journal homepage: www.elsevier.com/locate/chemphys
Transcript of A first principles molecular dynamics study of vibrational spectral diffusion and hydrogen bond...
Chemical Physics 408 (2012) 36–42
Contents lists available at SciVerse ScienceDirect
Chemical Physics
journal homepage: www.elsevier .com/locate /chemphys
A first principles molecular dynamics study of vibrational spectral diffusionand hydrogen bond dynamics in liquid methanol
Vivek K. Yadav, Anwesa Karmakar, Jyoti Roy Choudhuri, Amalendu Chandra ⇑Department of Chemistry, Indian Institute of Technology, Kanpur 208016, India
a r t i c l e i n f o
Article history:Received 31 May 2012In final form 5 September 2012Available online 16 September 2012
Keywords:Liquid methanolAb initio molecular dynamicsHydrogen bondsSpectral diffusion
0301-0104/$ - see front matter � 2012 Elsevier B.V. Ahttp://dx.doi.org/10.1016/j.chemphys.2012.09.006
⇑ Corresponding author. Tel.: +91 512 2597241; faxE-mail address: [email protected] (A. Chandra).
a b s t r a c t
We present a first principles theoretical study of vibrational spectral diffusion and hydrogen bonddynamics in liquid methanol at room temperature. The dynamics of spectral diffusion of OD modes ofdeuterated methanol reveals two times scales: a short time scale of about 120 fs and a longer time scaleof about 3.2 ps. A damped oscillation is also found at around 120–180 fs. Calculations of power spectrumof relative velocities and hydrogen bond correlation functions reveal that the short time dynamics orig-inates from intermolecular motion of hydrogen bonded methanol pairs while the long time relaxationcorresponds to the breaking dynamics of hydrogen bonds. The quantitative details of the time constantsare found to depend on the frequency of tagged OD bonds.
� 2012 Elsevier B.V. All rights reserved.
1. Introduction
Methanol is the simplest organic molecule containing bothhydrophilic (hydroxyl) and hydrophobic (methyl) groups. Thestructure of liquid methanol has been extensively studied usingneutron and X-ray diffraction and spectroscopic methods [1–8]and also theoretically [9–16]. Due to the presence of hydroxylgroup, methanol molecules form hydrogen bonds which greatlyinfluence the characteristics of this solvent. However, unlike liquidwater where each molecule forms about four hydrogen bonds[17,18], each molecule in liquid methanol forms only about twohydrogen bonds [19–24] and this reduced number of hydrogenbonds leads to quite different structural and dynamical propertiesof liquid methanol compared to that of water.
Studies of vibrational spectral diffusion within the stretch bandof normal or deuterated methanol by using ultrafast time resolvedinfrared spectroscopy provide a very powerful experimental meansto investigate the hydrogen bond dynamics in liquid methanol atmolecular level [25–28]. Vibrational frequencies of a hydrogenbonded molecule are known to be sensitive to its local solventenvironment. When the surrounding environment fluctuates, thevibrational frequency also fluctuates. The time dependence ofthese vibrational frequency fluctuations is known as vibrationalspectral diffusion. Recent experiments on vibrational spectral dif-fusion in liquid methanol involving time resolved pump–probeexperiments have shown the presence of two time scales: A shorttime scale around �0.1 ps and a long time scale of 1.6 ± 0.3 ps [25].
ll rights reserved.
: +91 512 2597436.
Many simulations using classical molecular dynamics with empir-ical force fields have also been carried out to study the dynamics ofliquid methanol [15,16,22,23]. More recently, the technique of abinitio molecular dynamics [29,30] has also been employed to studyliquid methanol which goes beyond the use of any empirical inter-action potentials. However, the existing ab initio simulation studieshave primarily focused on the structure, single-particle dynamicssuch as diffusion and orientational relaxation and pair dynamicssuch as relaxation of hydrogen bonds [31–37]. To the best of ourknowledge, the dynamics of vibrational spectral diffusion inliquid methanol has not yet been studied through first principlessimulations.
The present work deals with a first principles theoretical studyof the vibrational spectral diffusion and hydrogen bond dynamicsin liquid methanol. We have employed the method of ab initiomolecular dynamics [29,30] for the generation of the trajectoriesand wavelet analysis [38–41] method for the time dependent fre-quency calculations along the trajectories. First, we analyze theequilibrium aspects of frequency-structure correlations in metha-nol. Mainly, the relations between the fluctuating stretch frequen-cies of OD bonds of deuterated methanol and associated D� � �Ohydrogen bonds are found out. Subsequently, the dynamics ofvibrational spectral diffusion are studied by means of frequencytime correlation and spectral hole dynamics [41,42] calculations.The results of the dynamics are analyzed in terms of the dampedintermolecular vibrations of intact hydrogen-bonded methanolpairs and also the lifetimes of free and hydrogen bonded statesof OD bonds. The quantitative details of the time constants offrequency correlations and spectral shifts are found to depend onthe frequencies of the tagged OD bonds. The results are analyzed

18002000220024002600
(a)
1
2
3
4(b)
8 10 12 14 16 18 200.5
1
1.5 (c)
Fig. 1. (a) The fluctuating frequency of a tagged OD bond, (b) distance of the D atomof this bond from its nearest oxygen of a neighboring molecule and (c) covalentbond distance of the same OD bond along the simulation trajectory.
V.K. Yadav et al. / Chemical Physics 408 (2012) 36–42 37
in terms of the dynamics of hydrogen bonds of varying strengthsand also of free non-hydrogen bonded OD groups. By using thepopulation time correlation function formalism, a first principlescalculation of the kinetics of local structural relaxation of hydrogenbonds is also presented and the relations of such local structuralrelaxation with the observed dynamics of spectral diffusion arealso discussed.
The rest of the paper is organized as follows. Section 2 containsthe details of ab initio molecular dynamics simulations and timeseries analysis for frequency calculations. In Section 3, the resultsof the frequency-structure correlations are discussed. Section 4contains results of the vibrational spectral diffusion and hydrogenbond dynamics in liquid methanol. Finally, our conclusions arebriefly summarized in Section 5.
2. Ab initio molecular dynamics simulations
The ab initio molecular dynamics simulations have been per-formed by using the Car–Parrinello method [29] and the CPMDcode [43]. Our simulation system contains 32 methanol moleculesin a cubic box of length 12.9 Å. The size of the box corresponds tothe experimental density of the methanol at 300 K [44]. The simu-lation box was replicated periodically in three dimensions and theelectronic structure of the extended system was calculated byusing the Kohn–Sham formulation [45] of density functional the-ory within the plane wave basis. The Troullier–Martins pseudopo-tentials [46] were used to treat the core electrons and the planewave expansion of the Kohn–Sham orbitals was truncated at70 Ry. A fictitious mass of 800 au was assigned to the electronicorbitals and the coupled equations of motion describing the systemdynamics were integrated using a time step of 5 au (0.125 fs). Allhydrogen atoms were assigned the mass of deuterium to reducethe influence of quantum effects on the dynamical properties.Our choice of CD3OD in place of CH3OH ensured that electronic adi-abaticity and energy conservation were maintained throughout thesimulations for the chosen values of the fictitious electronic massparameter and time step. We used the BLYP functional [47] inour electronic structure calculations as was also done in earlierab initio simulations of liquid methanol [31–37]. The initial config-urations were generated using classical molecular dynamics simu-lations. Subsequently, the system was equilibrated for 15 ps incanonical ensemble using ab initio molecular dynamics [29,43]and then the simulations were continued for another 50 ps inmicrocanonical ensemble for calculations of various equilibriumand dynamical quantities.
The time-dependent frequencies of OD bonds were calculatedthrough a time series analysis using the so-called wavelet method.In particular, we have followed the method described in Ref. [39].The basic idea behind the wavelet analysis is to express a time-dependent function f ðtÞ in terms of basis functions which are con-structed as translations and dilation’s of a mother wavelet w
wa;bðtÞ ¼ a�12w
t � ba
� �; ð1Þ
where the mother wavelet should decay to zero rapidly as t ! �1.The coefficients of this expansion are given by the wavelet trans-form of the f ðtÞ, which is given as
Lwf ða; bÞ ¼ a�12
Z 1
�1f ðtÞ�w t � b
a
� �dt ð2Þ
for a > 0 and b real. For the mother wavelet, we have used theMorlet–Grossman wavelet [48]
wðtÞ ¼ 1rffiffiffiffiffiffiffi2pp e2pikte
�t2
2r2 ; ð3Þ
with k ¼ 1 and r ¼ 2. The scale factor (a) of Eq. (2) is inversely pro-portional to the frequency, and thus the wavelet transform of Eq. (2)at each b gives the frequency content of f ðtÞ over a time windowabout b. In the present work, we are interested in the OD stretch fre-quencies of deuterated methanol molecules. For this purpose, thetime dependent function f ðtÞ for a given OD bond is constructedto be a complex function with its real and imaginary parts equalto the instantaneous OD distance and the corresponding momen-tum along the OD bond [41,49]. Subsequently, for a given timet ¼ b, we determined the scale a that maximizes the modulus ofthe corresponding wavelet transform as given by Eq. (2) and the fre-quency was determined from the optimized scale found at thatpoint of time. The process was then repeated for all the OD bondsover the entire trajectory that was produced in the present simula-tions. We note that the Morlet-Grossman wavelet of Eq. (3) with theabove mentioned values of the parameters k and r was successfullyused as the mother wavelet in many earlier studies of time seriesanalysis of fluctuating frequencies from dynamical trajectories[39–41,49–52]. Some of these earlier studies also included calcula-tions of stretch frequencies of OD and OH modes of aqueous sys-tems [41,49–52]. In view of these earlier work, we preferred touse the same mother wavelet without any alteration of the param-eter values.
3. Frequency structure correlations
The OD stretch frequency in a hydrogen bonded liquid isstrongly correlated with the length of the hydrogen bond betweenthe D atom of the OD group and the nearest oxygen atom of an-other molecule. In Fig. 1(a), we have shown the variation of thestretch frequency with time for one such OD mode in the system.In Fig. 1(b), the variation of the D� � �O hydrogen bond distance isalso shown with time for the same chosen OD mode. A correlationbetween the two fluctuating quantities is evident. When the D� � �Odistance is large, the frequency of the OD covalent bond in thatparticular time region also increases from its average value. Wenote that when the D� � �O distance increases, the OD bond becomesmore like that of a free methanol and, hence, its stretch frequencyincreases. On the other hand, when the D� � �O distance decreases,i.e. the hydrogen bond gets stronger, it is seen that the OD stretchfrequency decreases from its average value. In Fig. 1(c), we haveshown the fluctuations of the OD covalent bond distance for the
0
0.01
0.02
0.03
0.04
0.05
0.06
(a)
1.4 1.6 1.8 2 2.2 2.4 2.62000
2200
2400
2600(b)
0.2
0.4
0.6
0.8
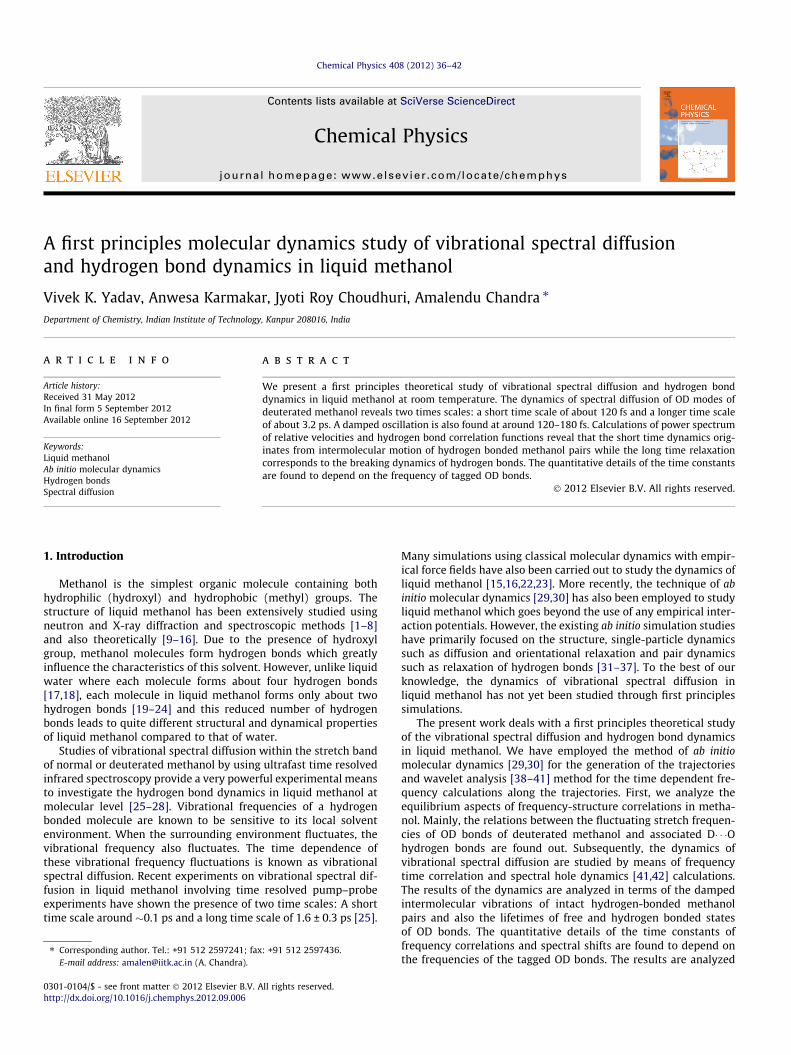
Fig. 2. (a) The distribution of the OD bond distance for the fixed values of the ODfrequency. The solid, dashed-dotted, and dashed curves are for OD frequenciesDx ¼ 0� 5; �100� 5, and 100� 5 cm�1, respectively, where Dx represents thedeviation from the average frequency. (b) The joint probability distribution of theOD stretch frequency and D� � �O distance. The contour levels of different fractions ofthe maximum value are shown in different color codes. (For interpretation of thereferences to the color in this figure legend, the reader is referred to the web versionof this article.)
38 V.K. Yadav et al. / Chemical Physics 408 (2012) 36–42
same bond and over the same time interval. We note that thelength of the OD covalent bond fluctuates over a smaller distancewith maximum amplitude found to be only about 0.25 Å aboveand below the average bond length of about 1 Å. The D� � �O hydro-gen bond distance, on the other hand, could fluctuate over a largerdistance, sometimes more than 1 Å from its average distance ofabout 1.8 Å as can be seen from Fig. 1(b). Of course, in some ofthese configurations of large D� � �O distance, the hydrogen bondis actually broken and RD� � �O in that case merely means the distancebetween the deuterium of OD bond and its nearest oxygen of aneighboring methanol molecule. In view of this, the correlationof the fluctuations of stretch frequency of the OD bond with itsbond length is not as clearly visible as it was for the hydrogen bonddistance. Nevertheless, some correlations can still be extractedfrom Fig. 1(c). For example, the frequency fluctuations in the re-gions around 12.2 and 19 ps reveal an enhanced frequency associ-ated with relatively shorter length of the OD covalent bond.
The relation between the frequency of OD bonds and the lengthof D� � �O hydrogen bonds, averaged over all molecules, is shown inFig. 2(a). In this figure, we have shown the distribution of D� � �Ohydrogen bond distance for three different values of the OD fre-quency within �5 cm�1. It is seen that as the frequency increases,the maximum of the corresponding distribution of D� � �O distancealso gets shifted towards higher distance. On the other hand, thepeak of the distribution of D� � �O distance is found to shift to short-er distance when the frequency is decreased. Similar results werefound earlier for OD bonds in D2O and HOD systems[41,42,49,53]. Due to the significant dispersion and overlap of thedistributions, one can not assign a single frequency for a givenD� � �O hydrogen bond distance. The above findings are more clearlyrevealed in Fig. 2(b) where we have presented contour plots of theconditional probability of finding a particular frequency for a givenD� � �O distance. Clearly, one can not assign a single instantaneousfrequency to a given D� � �O hydrogen bond due to substantial dis-persion in the probability distribution. However, on average, thefrequency of an OD bond is found to increase with increase ofthe length of the associated D� � �O hydrogen bond. Thus, a
frequency-structure correlation is seen to exist on average wherethe frequency of an OD bond decreases or increases with the de-crease or increase of the associated D� � �O hydrogen bond distance.
We also note that our calculated average stretch frequency isfound to be 2225 cm�1 which is somewhat red shifted from theaverage frequency of the corresponding experimental spectrum[25]. This discrepancy is likely due to the systematic errors intro-duced by the density functional, electronic fictitious mass, and fi-nite basis set cutoff that are used in the electronic structurecalculations and it may also depend on the size of the simulationsystem. Similar discrepancies were also found in earlier simulationstudies of liquid D2O systems for similar levels of calculations[41,49]. We note that a proper choice of the electronic fictitiousmass is an important issue in carrying our Car–Parrinello simula-tions. This parameter introduces an extra inertia into the system,hence can affect its dynamics. Besides, a proper choice of thisparameter is also required to ensure electronic adiabaticity duringthe simulations. While the value of 800 au for the fictitious massparameter has been found to be acceptable for maintaining elec-tronic adiabaticity for deuterated systems such as CD3OD andD2O [33,41,49], it may still introduce a systematic error in thevibrational frequency because of additional inertia effects. A de-tailed analysis of the extent of such systematic errors in vibrationalfrequencies due to the fictitious electronic mass is available in Ref.[54]. Regarding the effects of finite basis sets on the calculatedvibrational frequencies, we note the work of Ref. [55] which showsthat a converged basis set decreases the red shift in the OD stretch-ing band of the IR spectrum. The systematic errors in the calculatedfrequencies could have been corrected by using a scaling factor aswas done in many previous studies of aqueous systems. In thepresent work, we primarily focus on the dynamics of spectral dif-fusion and the normalized dynamics of spectral diffusion remainsunaltered by use of any such scaling factors. Hence, we preferredto deal with the calculated frequencies as they were obtained fromsimulations and time series analysis without using any scalingfactors.
4. Spectral diffusion and hydrogen bond dynamics
4.1. Frequency-time correlation function
The central dynamical quantity in the study of vibrational spec-tral diffusion is the frequency time correlation function which isdefined as
CxðtÞ ¼ hdxðtÞdxð0Þi=hdxð0Þ2i ð4Þ
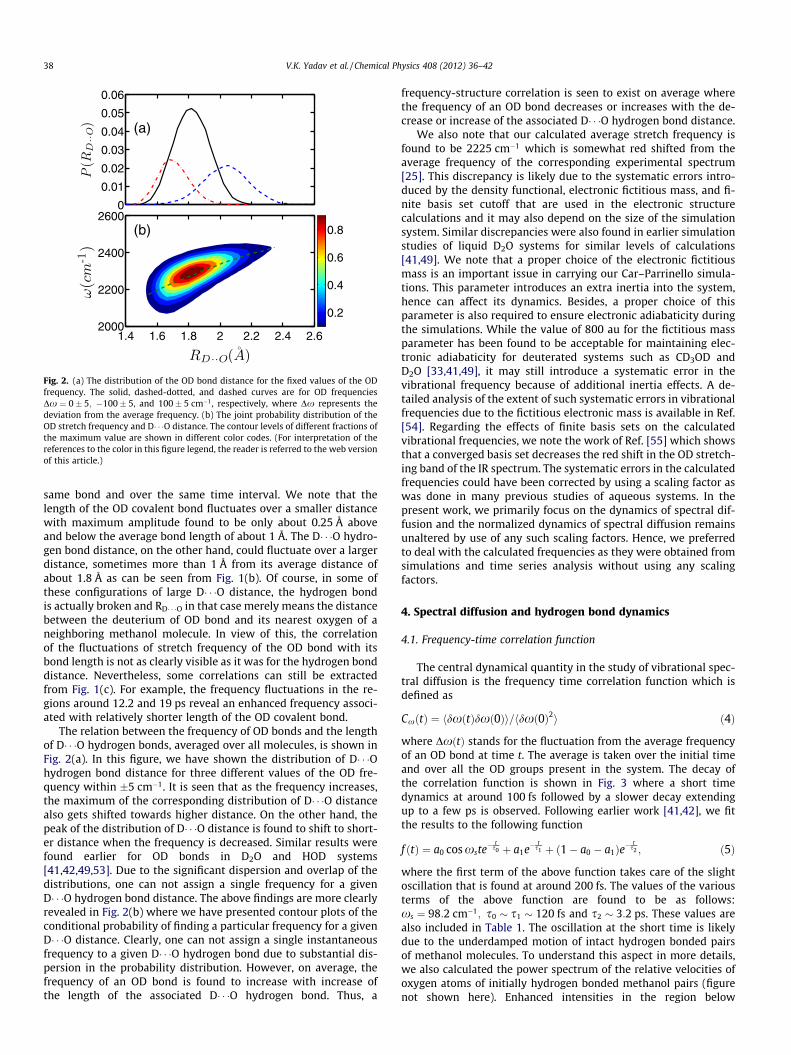
where DxðtÞ stands for the fluctuation from the average frequencyof an OD bond at time t. The average is taken over the initial timeand over all the OD groups present in the system. The decay ofthe correlation function is shown in Fig. 3 where a short timedynamics at around 100 fs followed by a slower decay extendingup to a few ps is observed. Following earlier work [41,42], we fitthe results to the following function
f ðtÞ ¼ a0 cos xste� t
s0 þ a1e�t
s1 þ ð1� a0 � a1Þe�t
s2 ; ð5Þ
where the first term of the above function takes care of the slightoscillation that is found at around 200 fs. The values of the variousterms of the above function are found to be as follows:xs ¼ 98:2 cm�1; s0 � s1 � 120 fs and s2 � 3:2 ps. These values arealso included in Table 1. The oscillation at the short time is likelydue to the underdamped motion of intact hydrogen bonded pairsof methanol molecules. To understand this aspect in more details,we also calculated the power spectrum of the relative velocities ofoxygen atoms of initially hydrogen bonded methanol pairs (figurenot shown here). Enhanced intensities in the region below
0 1 2 3 40
0.2
0.4
0.6
0.8
1Frequency correlation
Fig. 3. The time correlation function of OD fluctuating frequencies averaged over allthe molecules of the system. The dashed and solid grey curves correspond tosimulation data and fit by a function given by Eq. (5), respectively.
Table 1Values of various time constants (ps), frequency (cm�1) and weights of frequencytime correlation and time dependent frequency shifts of hole and remaining modesafter creation of holes in the blue and red sides of the average frequency.
Quantity Excitation s0 s1 s2 xs a0 a1
CxðtÞ – 0.12 0.12 3.1 98.2 0.23 0.41D �xhðtÞ Blue 0.14 0.09 3.0 103.6 0.12 0.52D �xrðtÞ Blue 0.16 0.12 6.0 103.7 0.22 0.58D �xhðtÞ Red 0.14 0.12 5.9 116.3 0.22 0.42D �xrðtÞ Red 0.14 0.10 3.4 109.8 0.10 0.40
0 1 2 3 4 50
0.2
0.4
0.6
0.8
1
1.2
CHB
(t)
SHB
(t)
Fig. 4. The time dependence of the continuous (solid) and intermittent (dashed)hydrogen bond time correlation functions.
V.K. Yadav et al. / Chemical Physics 408 (2012) 36–42 39
150 cm�1 reveal the presence of intermolecular bending andstretching vibrations of such hydrogen bonded methanol pairs.Thus, the damped oscillations of the first term of Eq. (5) likely arisefrom the fast intermolecular vibrations of intact hydrogen bondedpairs of methanol molecules. The associated time constants of theshort time relaxation (s0 and s1 of Table 1) likely correspond tothe dynamic modulation of OD frequencies due to fast changes inthe characteristics of intact hydrogen bonds such as changes inthe hydrogen bond length and angle that can alter the OD frequen-cies. Also, in order to investigate the origin of the slower relaxationcomponent of the frequency time correlation, we have looked at thedynamics of hydrogen bonds by using the so-called population cor-relation function method [41,49,56–64]. We calculate two hydro-gen bond correlation functions SHB(t) and CHB(t) where SHB(t)describes the probability that an initially hydrogen bonded metha-nol-methanol pair remains continuously hydrogen bonded at alltimes up to time t and CHB(t) describes the probability that a meth-anol-methanol pair is hydrogen bonded at time t given that it wasalso hydrogen bonded at time t ¼ 0, independent of any possiblebreaking in the interim time. The time integral of SHB(t) can beinterpreted as the average lifetime of hydrogen bonds and it willbe denoted as sHB. The time dependence of the intermittent proba-bility describes the local structural relaxation of hydrogen bonds.After a hydrogen bond is broken, the pair of molecules can remainas nearest neighbors for some time before they either reform thehydrogen bond or diffuse away from each other. We define NHB(t)as the time dependent probability that a hydrogen bond is brokenat time t ¼ 0 but the two molecules remain in the vicinity of eachother as nearest neighbors but are not hydrogen bonded at time t.Following previous work [57], we write a simple kinetic equationfor the decay of CHB(t) as given below
�dCHBðtÞdt
¼ kHBCHBðtÞ � k0HBNHBðtÞ ð6Þ
where kHB and k0HB are the forward and backward rate constants,respectively. The inverse of the kHB can be interpreted as the
average lifetime of hydrogen bonds. The hydrogen bond betweenthe D and O atoms of two methanol molecules are based on the geo-metric criteria that the D� � �O distance should be less than 2.45 Åand O� � �O distance should also be less than 3.4 Å. These distancecut-offs correspond to the first minimum of the intermolecularD� � �O and O� � �O radial distribution functions (results now shownhere). The results of the continuous and intermittent hydrogenbond correlation functions are shown in Fig. 4. On integratingSHBðtÞ, the value of sHB is found to be 2.8 ps. We have applied theleast square fit of Eq. (6) to the simulation results of CHBðtÞ andNHBðtÞ in the region of 0 < t < 4 ps to obtain the corresponding rateconstants of hydrogen bond structural relaxation from the route ofintermittent correlations. The inverse of the forward rate constant isfound to be 3.0 ps which compares well with the lifetime as ob-tained from the integration of the continuous correlation function.Thus, the long time relaxation of vibrational spectral diffusion ofOD modes of methanol can be attributed to the breaking dynamicsof methanol-methanol hydrogen bonds. We note in this contextthat the experimental value for this long-time relaxation of spectraldiffusion was found to be 1.6 ± 0.3 ps [25]. The discrepancy is likelydue to the use of BLYP density functional in the present calculationswhich is known to provide a somewhat slower dynamics for rota-tional and translational motion in dense hydrogen bonded systems.
4.2. Hole dynamics at different frequencies
We present calculations of the dynamics of a hole that is createdby the removal of a bunch of OD modes in different regions of theinhomogeneous frequency distribution. The time evolution of suchinitially created non-equilibrium distribution is closely related tothe dynamics of pump–probe signals of time dependent infraredspectroscopic experiments on vibrational spectral diffusion. It isassumed that at time t ¼ 0, a laser pump pulse having a Gaussianfrequency profile burns a hole in the ground state having frequencydistribution of the form [41,42]
Phðx;0Þ ¼ PeqðxÞe�ðx�xp Þ2
2r2 ; ð7Þ
where xP stands for the pulse center frequency and PeqðxÞ denotesthe equilibrium distribution of all the OD frequencies present in thesystem. Clearly, the initial distribution of the remaining frequenciesin the ground state is equal to PeqðxÞ � Phðx;0Þ. For the given sys-tem, we have calculated time evolution of nonequilibrium distribu-tions of the remaining modes (Prðx; tÞ) and also of the hole modes(Phðx; tÞ) after the hole is created at t ¼ 0. The average frequencies
0
0.01
0.02
(a)
−400 −300 −200 −100 0 100 200 300 4000
0.01
0.02
(b)
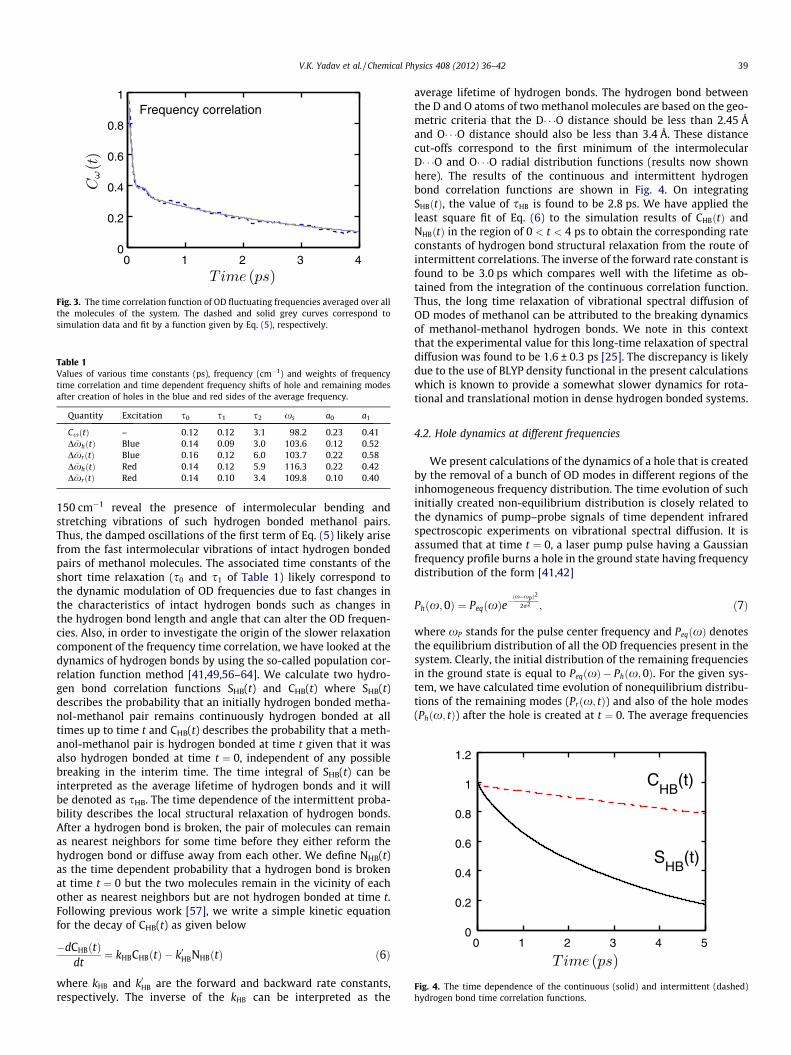
Fig. 5. The time variation of the distribution of (a) hole and (b) remaining modesafter hole creation in the blue side at time t ¼ 0. The solid, dashed and dashed-dotted curves are for times t ¼ 10 fs, 50 fs and 1.25 ps.
0
0.01
0.02 (a)
−400 −300 −200 −100 0 100 200 300 4000
0.01
0.02 (b)
Δω (cm-1)Fig. 6. The time variation of the distribution of (a) hole and (b) remaining modesafter hole creation in the red side at time t ¼ 0. The solid, dashed and dashed-dottedcurves are for times t ¼ 10 fs, 50 fs and 1.25 ps.
−100
−50
0
50
100(a)
0 1 2 3 40
0.2
0.4
0.6
0.8
1(b)
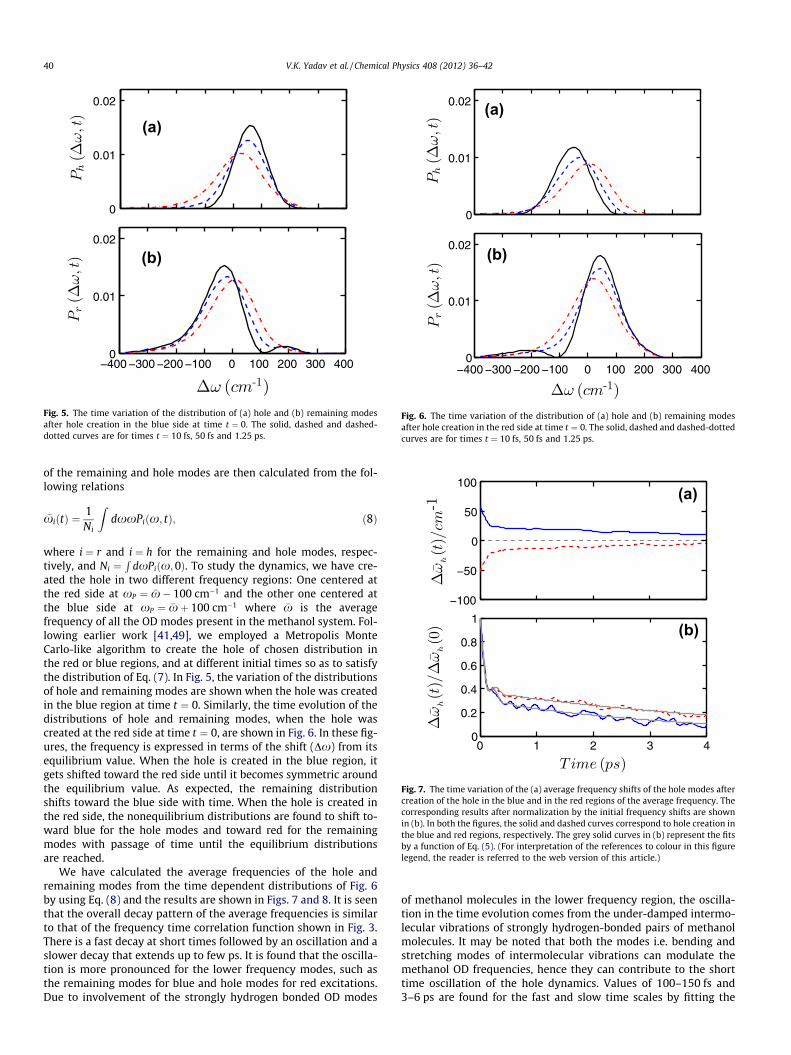
Fig. 7. The time variation of the (a) average frequency shifts of the hole modes aftercreation of the hole in the blue and in the red regions of the average frequency. Thecorresponding results after normalization by the initial frequency shifts are shownin (b). In both the figures, the solid and dashed curves correspond to hole creation inthe blue and red regions, respectively. The grey solid curves in (b) represent the fitsby a function of Eq. (5). (For interpretation of the references to colour in this figurelegend, the reader is referred to the web version of this article.)
40 V.K. Yadav et al. / Chemical Physics 408 (2012) 36–42
of the remaining and hole modes are then calculated from the fol-lowing relations
�xiðtÞ ¼1Ni
ZdxxPiðx; tÞ; ð8Þ
where i ¼ r and i ¼ h for the remaining and hole modes, respec-tively, and Ni ¼
RdxPiðx;0Þ. To study the dynamics, we have cre-
ated the hole in two different frequency regions: One centered atthe red side at xP ¼ �x� 100 cm�1 and the other one centered atthe blue side at xP ¼ �xþ 100 cm�1 where �x is the averagefrequency of all the OD modes present in the methanol system. Fol-lowing earlier work [41,49], we employed a Metropolis MonteCarlo-like algorithm to create the hole of chosen distribution inthe red or blue regions, and at different initial times so as to satisfythe distribution of Eq. (7). In Fig. 5, the variation of the distributionsof hole and remaining modes are shown when the hole was createdin the blue region at time t ¼ 0. Similarly, the time evolution of thedistributions of hole and remaining modes, when the hole wascreated at the red side at time t ¼ 0, are shown in Fig. 6. In these fig-ures, the frequency is expressed in terms of the shift (Dx) from itsequilibrium value. When the hole is created in the blue region, itgets shifted toward the red side until it becomes symmetric aroundthe equilibrium value. As expected, the remaining distributionshifts toward the blue side with time. When the hole is created inthe red side, the nonequilibrium distributions are found to shift to-ward blue for the hole modes and toward red for the remainingmodes with passage of time until the equilibrium distributionsare reached.
We have calculated the average frequencies of the hole andremaining modes from the time dependent distributions of Fig. 6by using Eq. (8) and the results are shown in Figs. 7 and 8. It is seenthat the overall decay pattern of the average frequencies is similarto that of the frequency time correlation function shown in Fig. 3.There is a fast decay at short times followed by an oscillation and aslower decay that extends up to few ps. It is found that the oscilla-tion is more pronounced for the lower frequency modes, such asthe remaining modes for blue and hole modes for red excitations.Due to involvement of the strongly hydrogen bonded OD modes
of methanol molecules in the lower frequency region, the oscilla-tion in the time evolution comes from the under-damped intermo-lecular vibrations of strongly hydrogen-bonded pairs of methanolmolecules. It may be noted that both the modes i.e. bending andstretching modes of intermolecular vibrations can modulate themethanol OD frequencies, hence they can contribute to the shorttime oscillation of the hole dynamics. Values of 100–150 fs and3–6 ps are found for the fast and slow time scales by fitting the

−100
−50
0
50
100(a)
0 1 2 3 40
0.2
0.4
0.6
0.8
1(b)
Time(ps)
Fig. 8. The time variation of the (a) average frequency shifts of the remainingmodes after hole creation in the blue and in the red regions. The correspondingresults after normalization by the initial frequency shifts are shown in (b). In boththe figures, the solid and dashed curves correspond to hole creation in the blue andred sides, respectively. The grey solid curves in (b) represent the fits by a function ofEq. (5). (For interpretation of the references to colour in this figure legend, thereader is referred to the web version of this article.)
V.K. Yadav et al. / Chemical Physics 408 (2012) 36–42 41
calculated dynamics to Eq. (5) (Table 1). We note that the longertime constant corresponds to the lifetime of methanol-methanolhydrogen bonds. It may be noted that the relaxation has longertime constant for the lower frequency modes whereas a relativelyfaster relaxation is found for the higher frequency modes becausethe higher frequency modes are attached to weaker hydrogenbonds which have shorter lifetimes.
5. Summary and conclusion
In this work, a first principles theoretical study has been pre-sented for the vibrational frequency-structure correlations anddynamics of spectral diffusion in liquid methanol without usingany predefined empirical model potential. A time series analysisof the ab initio simulation trajectory by using the wavelet methodhas been performed to calculate the frequency fluctuations. Ourcalculations reveal that although a one-to-one relation does not ex-ist between the instantaneous frequency of the OD bond of a meth-anol molecule and the D� � �O hydrogen bond distance, such acorrelation does exist on average. It is found that the frequencytime correlation function has a short time decay correspondingto the motion of intact methanol-methanol hydrogen bonds anda slower long time decay corresponding to the breaking dynamicsof these hydrogen bonds. The two time scales are found to be�120 fs and �3.2 ps, respectively. An oscillation in the shorter timepart of the dynamics is also found to be present which arises fromthe underdamped intermolecular vibration of the hydrogenbonded methanol pairs. Theoretical calculations have also beenperformed for the time dependent spectral shifts subsequent tocreation of holes in the red and blue regions of the vibrationalstretch frequency distribution and the results are analyzed interms of the dynamics of intact hydrogen bonds and also ofhydrogen bond breaking. The theoretical results are found to bein reasonably good agreement with the findings of recent spectro-scopic experiments [25].
Acknowledgment
Financial supports from the Department of Science and Tech-nology (DST) and Council of Scientific and Industrial Research(CSIR), Government of India, are gratefully acknowledged.
References
[1] M. Magini, G. Paschina, G. Piccaluga, J. Chem. Phys. 77 (1982) 2051.[2] A.H. Narten, A. Habenschuss, J. Chem. Phys. 80 (1984) 3387.[3] S. Sarkar, R.N. Joarder, J. Chem. Phys. 99 (1993) 2032.[4] Y. Tanaka, N. Ohtomo, K. Arakawa, Mol. Phys. 57 (1984) 644.[5] T. Yamaguchi, K. Hidaka, A.K. Soper, Mol. Phys. 96 (1999) 1159.[6] A.K. Adya, L. Bianchi, Christopher J. Wormald, J. Chem. Phys. 112 (2000) 4231.[7] K. Lin, X. Zhou, Y. Luo, S. Liu, J. Phys. Chem. B 114 (2010) 3567.[8] K.N. Woods, H. Wiedemann, J. Chem. Phys. 123 (2005) 134506.[9] I.M. Svishchev, P.G. Kusalik, J. Chem. Phys. 100 (1994) 5165.
[10] L. Bianchi, O.N. Kalugin, A.K. Adya, C.J. Wormald, Mol. Simul. 25 (2000) 321.[11] M.E. Martin, M.L. Sanchez, F.J.O. del Valle, M.A. Aguilar, J. Chem. Phys. 116
(2002) 1613.[12] R. Ludwig, Chem. Phys. Chem. 6 (2005) 1369.[13] M. Valdez-Gonzalez, H. Saint-Martin, J. Hernandez-Cobos, R. Ayala, E. Sanchez-
Marcos, I. Ortega-Blake, J. Chem. Phys. 127 (2007) 224507.[14] D. Costa, G. Munao, F. Saija, C. Caccamo, J. Chem. Phys. 127 (2007) 224501.[15] J.C.G. Pereira, C.R.A. Catlow, G.D. Price, J. Phys. Chem. A 105 (2001) 1909.[16] M. Haughney, M. Ferrario, I.R. McDonald, J. Phys. Chem. 91 (1987) 4934.[17] F. Franks (Ed.), Water – A Comprehensive Treatise, vols. 1–8, Plenum, New
York, 1972–1979.[18] G.N.I. Clark, C.D. Cappa, J.D. Smith, R.J. Saykally, T. Head-Gordon, Mol. Phys.
108 (2010) 1415.[19] J.A.B. da Silva, F.G.B. Moreira, V.M.L. dos Santos, R.L. Longo, Phys. Chem. Chem.
Phys. 13 (2011) 593.[20] A. Vrhovsek, O. Gereben, A. Jamnik, L. Pusztai, J. Phys. Chem. B 115 (2011)
13473.[21] J.-M. Andanson, P.A. Bopp, J.-C. Soetens, J. Mol. Liq. 129 (2006) 101.[22] M. Matsumoto, K.E. Gubbins, J. Chem. Phys. 93 (1990) 1981.[23] S. Paul, A. Chandra, J. Chem. Theory Comput. 1 (2005) 1221.[24] L. Zoranic, F. Sokolic, A. Perera, J. Chem. Phys. 127 (2007) 24502.[25] I.R. Piletic, K.J. Gaffney, M.D. Fayer, J. Chem. Phys. 119 (2003) 423.[26] J.B. Asbury, T. Steinel, C. Stromberg, K.J. Gaffney, I.R. Piletic, A. Goun, M.D.
Fayer, Phys. Rev. Lett. 91 (2003) 237402.[27] K.J. Gaffney, I.R. Piletic, M.D. Fayer, J. Chem. Phys. 118 (2003) 2270.[28] J.B. Asbury, T. Steinel, M.D. Fayer, J. Phys. Chem. B 108 (2004) 6544.[29] R. Car, M. Parrinello, Phys. Rev. Lett. 55 (1985) 2471.[30] D. Marx, J. Hutter, Ab initio Molecular Dynamics; Theory and Implementation
in modern methods and algorithm of Quantum Chemistry, NIC Series, John vonNeumann Institute for computing, Julich, 2000.
[31] E. Tsuchida, Y. Kanada, M. Tsukada, Chem. Phys. Lett. 311 (1999) 236.[32] J.-W. Handgraaf, T.S. van Erp, E.J. Meijer, Chem. Phys. Lett. 367 (2003) 617.[33] J.A. Morrone, M.E. Tuckerman, J. Chem. Phys. 117 (2002) 4403.[34] M. Pagliai, G. Cardini, R. Righini, V. Schettino, J. Chem. Phys. 119 (2003) 6655.[35] J.-W. Handgraaf, E.J. Meijer, M.-P. Gaigeot, J. Chem. Phys. 121 (2004) 10111.[36] M.J. McGrath, I.-F.W. Kuo, J.I. Siepmann, Phys. Chem. Chem. Phys. 13 (2011)
19943.[37] M.J. McGrath, I.-F.W. Kuo, J.N. Ghogomu, C.J. Mundy, J.I. Siepmann, J. Phys.
Chem. B 115 (2011) 11688.[38] M. Fuentes, P. Guttorp, P.D. Sampson, in: B. Finkenstadt, L. Held, V. Isham
(Eds.), Statistical Methods for Spatio-Temporal Systems, Chapman and Hall/CRC, Boca Raton, 2007 (Chapter 3).
[39] L.V. Vela-Arevelo, S. Wiggins, Int. J. Bifur. Chaos Appl. Sci. Eng. 11 (2001) 1359.[40] A. Semparithi, S. Keshavamurthy, Phys. Chem. Chem. Phys. 5 (2003) 5051.[41] B.S. Mallik, A. Semparithi, A. Chandra, J. Phys. Chem. A 112 (2008) 5104.[42] R. Rey, K.B. Moller, J.T. Hynes, J. Phys. Chem. A 106 (2002) 11993;
K.B. Moller, R. Rey, J.T. Hynes, J. Phys. Chem. A 108 (2004) 1275.[43] J. Hutter, A. Alavi, T. Deutsch, M. Bernasconi, S. Goedecker, D. Marx, M.
Tuckermann, M. Parrinello, CPMD Program MPI Fur Festkoperforschung andIBM Zurich Research Laboratory.
[44] D.R. Lide (Ed.), Handbook of Chemistry and Physics, vol. 87, CRC/Taylor andFrancis, Boca Raton, FL/London, 2006.
[45] W. Kohn, L.J. Sham, Phys. Rev. A 140 (1965) 1133.[46] N. Troullier, J.L. Martins, Phys. Rev. B 43 (1991) 1993.[47] A.D. Becke, Phys. Rev. A 38 (1988) 3098;
C. Lee, W. Yang, R.G. Parr, Phys. Rev. B 37 (1988) 785.[48] R. Carmona, W. Hwang, B. Torresani, Practical Time-Frequency Analysis, Gabor
and Wavelet Transforms with an Implementations, Academic Press, New York,1998.
[49] B.S. Mallik, A. Semparithi, A. Chandra, J. Chem. Phys. 129 (2008) 194512.[50] S. Pratihar, A. Chandra, J. Phys. Chem. A 114 (2010) 11869.[51] R. Gupta, A. Chandra, J. Mol. Liq. 165 (2012) 1.[52] D. Chakraborty, A. Chandra, Chem. Phys. 392 (2012) 96;
, J. Chem. Phys. 135 (2011) 114510.[53] C.P. Lawrence, J.L. Skinner, Chem. Phys. Lett. 369 (2003) 472;
, J. Chem. Phys. 117 (2003) 8847;, J. Chem. Phys. 118 (2003) 264.

42 V.K. Yadav et al. / Chemical Physics 408 (2012) 36–42
[54] P. Tangney, J. Chem. Phys. 124 (2006) 44111.[55] H.-S. Lee, M.E. Tuckerman, J. Chem. Phys. 126 (2007) 164501.[56] D. Rapaport, Mol. Phys. 50 (1983) 1151.[57] A. Luzar, D. Chandler, Phys. Rev. Lett. 76 (1996) 928;
A. Luzar, D. Chandler, Nature (London) 53 (1996) 379.[58] A. Luzar, J. Chem. Phys. 113 (2000) 10663.[59] A. Chandra, Phys. Rev. Lett. 85 (2000) 768.
[60] S. Balasubramanian, S. Pal, B. Bagchi, Phys. Rev. Lett. 89 (2002) 115505.[61] H. Xu, H.A. Stern, J. Phys. Chem. B 105 (2001) 11929;
H. Xu, H.A. Stern, B.J. Berne, J. Phys. Chem. B 106 (2002) 2054.[62] S.K. Pattanayak, S. Chowdhuri, J. Phys. Chem. B 115 (2011) 13241.[63] J. Chanda, S. Bandyppadhyay, J. Chem. Theor. Comput. 1 (2005) 963;
, J. Phys. Chem. B 110 (2006) 23482.[64] S. Paul, A. Chandra, J. Chem. Phys. 123 (2005) 184706.