Soil ecosystem health and services–Evaluation of ecological indicators susceptible to chemical...
9
Ecological Indicators 16 (2012) 67–75 Contents lists available at ScienceDirect Ecological Indicators jo ur nal homep age: www.elsevier.com/locate/ecolind Soil ecosystem health and services – Evaluation of ecological indicators susceptible to chemical stressors Marianne Thomsen a,∗ , Jack H. Faber b , Peter Borgen Sorensen a a National Environmental Research Institute, Aarhus University, P.O. Box 358, 4000 Roskilde, Denmark b Alterra, Wageningen UR, P.O. Box 47, 6700 AA Wageningen, The Netherlands a r t i c l e i n f o Keywords: Soil ecosystem health Ecosystem services Ecological requirements Vulnerability Chemical stress a b s t r a c t The paper presents a methodological framework for quantifying soil ecosystem health with special focus on chemical stressors and ecological integrity as determinant for biological productivity of soil ecosys- tems. Ecological risk assessment is needed to facilitate the assessment of soil health and the capability of a soil to provide ecosystem services such as e.g. detoxification and decomposition of wastes, soil for- mation and renewal of soil fertility. We have developed such an approach that is based on systematic enumeration of vulnerable indicators that reflect essential soil ecosystem structures and processes that underlay such soil ecosystem services. The method is illustrated for a shortlist of common chemical stress- ors, represented by nickel, cadmium, chlorpyriphos, lindane and diazinon, and applied in a comparative assessment of suitability for use of grassland on contaminated soil. A comprehensive and relevant set of ecological integrity indicators has been analysed to derive a smaller core set of indicators highly relevant for all types of grassland use; i.e. reflecting ecological requirements to be fulfilled for any sustainable use of grassland. © 2011 Elsevier Ltd. All rights reserved. 1. Introduction Biocapacity is the supply created by the biosphere, or a measure of the amount of biologically productive area available to provide the ecosystem services that humanity consumes. However, the quality of the goods and services provided depends on the quality of the supplying ecosystem (Mench et al., 2009). In Denmark, soil and food intake represent significant sources to children’s expo- sure to lead (Pizzol et al., 2010) compared to lead exposure by inhalation. As such, soil quality criteria for different types of land use obviously must be (and can be) based on acceptable levels of human exposure to contaminants. Likewise, sustainable manage- ment practices restoring and maintaining soil ecosystem health in terms of suitability for use (i.e. the provision of ecosystem services) should be addressed; not only in term of quantitative above ground yields, but also services promoting the quality of air and water environments and maintaining plant and human health should be protected (Nielsen & Winding, 2002). Within the methodological framework of the National Footprint Accountings (NFA), the ecological footprint and biocapacity are ∗ Corresponding author at: National Environmental Research Institute (NERI), Aarhus University, Frederiksborgvej 399, DK-4000 Roskilde, Denmark. Tel.: +45 46301358. E-mail address: [email protected] (M. Thomsen). derived by multiplying the required and available bioproductive area with the ratio of national biological productivity of a specific land use type to the worlds average productivity of all land types included in the EFA framework (Ewing et al., 2010; Monfreda et al., 2004). According to Ewing et al. (2010), the biological capacity (bio- capacity) represents the biosphere’s ability to meet human demand for material consumption and waste disposal. However, as both ecological footprint and biocapacity are calculated from actual and above ground yields, the Ecological Footprint Analysis (EFA) fails to capture a biocapacity with reference to sustainable soil ecosystem health preserving yields. We will not discuss of the equivalency factors (Kitzes et al., 2009) as these are empirical factors used for transforming required (EF) and available (BC) bioproductive land into units of global hectares and have been discussed elsewhere (e.g. Kitzes et al., 2009; Venetoulis & Talberth, 2008; Wiedmann & Lenzen, 2007; Wiedmann & Barrett, 2010). Bioproductivity varies according to the inherent soil ecosystem characteristics, e.g. soil texture and soil organic matter and climate. This variation in time and space are verified by EFA studies using local yields for primary products at the sub-national level showing results varying by a factor of 2-10 (Haberl et al., 2001; Wiedmann & Lenzen, 2007). At sub-national level, sustainable yields may be addressed in terms of sustainable and resource efficient management practices that balances carbon sequestering against the amount of harvested 1470-160X/$ – see front matter © 2011 Elsevier Ltd. All rights reserved. doi:10.1016/j.ecolind.2011.05.012
-
Upload
independent -
Category
Documents
-
view
1 -
download
0
Transcript of Soil ecosystem health and services–Evaluation of ecological indicators susceptible to chemical...
Ss
Ma
b
a
KSEEVC
1
otqoasiuhmtsyep
A
AT
1d
Ecological Indicators 16 (2012) 67–75
Contents lists available at ScienceDirect
Ecological Indicators
jo ur nal homep age: www.elsev ier .com/ locate /eco l ind
oil ecosystem health and services – Evaluation of ecological indicatorsusceptible to chemical stressors
arianne Thomsena,∗, Jack H. Faberb, Peter Borgen Sorensena
National Environmental Research Institute, Aarhus University, P.O. Box 358, 4000 Roskilde, DenmarkAlterra, Wageningen UR, P.O. Box 47, 6700 AA Wageningen, The Netherlands
r t i c l e i n f o
eywords:oil ecosystem healthcosystem servicescological requirementsulnerabilityhemical stress
a b s t r a c t
The paper presents a methodological framework for quantifying soil ecosystem health with special focuson chemical stressors and ecological integrity as determinant for biological productivity of soil ecosys-tems. Ecological risk assessment is needed to facilitate the assessment of soil health and the capabilityof a soil to provide ecosystem services such as e.g. detoxification and decomposition of wastes, soil for-mation and renewal of soil fertility. We have developed such an approach that is based on systematicenumeration of vulnerable indicators that reflect essential soil ecosystem structures and processes that
underlay such soil ecosystem services. The method is illustrated for a shortlist of common chemical stress-ors, represented by nickel, cadmium, chlorpyriphos, lindane and diazinon, and applied in a comparativeassessment of suitability for use of grassland on contaminated soil. A comprehensive and relevant set ofecological integrity indicators has been analysed to derive a smaller core set of indicators highly relevantfor all types of grassland use; i.e. reflecting ecological requirements to be fulfilled for any sustainable useof grassland.. Introduction
Biocapacity is the supply created by the biosphere, or a measuref the amount of biologically productive area available to providehe ecosystem services that humanity consumes. However, theuality of the goods and services provided depends on the qualityf the supplying ecosystem (Mench et al., 2009). In Denmark, soilnd food intake represent significant sources to children’s expo-ure to lead (Pizzol et al., 2010) compared to lead exposure bynhalation. As such, soil quality criteria for different types of landse obviously must be (and can be) based on acceptable levels ofuman exposure to contaminants. Likewise, sustainable manage-ent practices restoring and maintaining soil ecosystem health in
erms of suitability for use (i.e. the provision of ecosystem services)hould be addressed; not only in term of quantitative above groundields, but also services promoting the quality of air and waternvironments and maintaining plant and human health should be
rotected (Nielsen & Winding, 2002).Within the methodological framework of the National Footprintccountings (NFA), the ecological footprint and biocapacity are
∗ Corresponding author at: National Environmental Research Institute (NERI),arhus University, Frederiksborgvej 399, DK-4000 Roskilde, Denmark.el.: +45 46301358.
E-mail address: [email protected] (M. Thomsen).
470-160X/$ – see front matter © 2011 Elsevier Ltd. All rights reserved.oi:10.1016/j.ecolind.2011.05.012
© 2011 Elsevier Ltd. All rights reserved.
derived by multiplying the required and available bioproductivearea with the ratio of national biological productivity of a specificland use type to the worlds average productivity of all land typesincluded in the EFA framework (Ewing et al., 2010; Monfreda et al.,2004). According to Ewing et al. (2010), the biological capacity (bio-capacity) represents the biosphere’s ability to meet human demandfor material consumption and waste disposal. However, as bothecological footprint and biocapacity are calculated from actual andabove ground yields, the Ecological Footprint Analysis (EFA) fails tocapture a biocapacity with reference to sustainable soil ecosystemhealth preserving yields.
We will not discuss of the equivalency factors (Kitzes et al.,2009) as these are empirical factors used for transforming required(EF) and available (BC) bioproductive land into units of globalhectares and have been discussed elsewhere (e.g. Kitzes et al.,2009; Venetoulis & Talberth, 2008; Wiedmann & Lenzen, 2007;Wiedmann & Barrett, 2010).
Bioproductivity varies according to the inherent soil ecosystemcharacteristics, e.g. soil texture and soil organic matter and climate.This variation in time and space are verified by EFA studies usinglocal yields for primary products at the sub-national level showingresults varying by a factor of 2-10 (Haberl et al., 2001; Wiedmann
& Lenzen, 2007).At sub-national level, sustainable yields may be addressed interms of sustainable and resource efficient management practicesthat balances carbon sequestering against the amount of harvested
6 ical In
asprasie
ttbcir22mt2spi
iaptmsa2sm(astitt&p
svicflaeaeceimtscttopc
8 M. Thomsen et al. / Ecolog
bove ground NPP; securing that soil respiration does not exceedoil formation. Sustainable yields could be addressed by the bio-hysical quotient, i.e. the ratio of soil respiration (CO2 efflux) to theesidual soil C, describing the efficiency of substrate stabilization asn indicator of soil formation (Smith et al., 2007). Alternatively, byustainable yields could be quantified at the level of no decline, orncrease, in the in the below ground NPP (Dhital et al., 2010; Walsht al., 2010).
The provision of soil ecosystem services such as fertile soil inerms of biological productive land is associated with soil ecosys-em functioning, and is the result of interactions between soiliota and their chemical and physical environment. Soil ecologi-al integrity is what provides biological productive land and theres a need for at least a minimum appreciation of soil ecosystemequirements to the soil microenvironment quality (Doran & Zeiss,000; Kamal et al., 2010; Spurlock et al., 2002; Sobolev & Begonia,008). Chemical, biological and physical soil quality aspects deter-ining ecosystem productivity, such as below ground NPP, are
otally absent in the EFA methodology (Venetoulis & Talberth,008). Therefore we present an overall framework for addressingoil ecosystem health, which may be used for defining local bioca-acity estimates based on sustainable yields respecting ecological
ntegrity.As environmental stressors and soil management practices may
mpact the interactions between soil biota and their chemicalnd physical environment, soil health can be reduced and therovision of soil ecosystem services becomes limited. Opposite sus-ainable and intelligent resource efficient management practices
ay improve soil chemical and physical quality aspects supportingoil biota and i.e. soil formation and mitigate climate change as wells (e.g. Hodson, 2010; Lal, 2004; Mench et al., 2009; Tack and Meers,010; Tilman et al., 2006). Increased soil organic matter increasesoil fertility and yields (Pan et al., 2006; Lal, 2004, 2008). Further-ore, an increase in soil organic matter improves water retention
inhibition of soil erosion), aeration, and other physical soil char-cteristics. To sustain soil ecosystem health therefore, one coulday that the harvested NPP should not exceed the soil organic mat-er formation, which requires that anthropogenic emissions do notmpact the biological component of soil ecosystem. With respecto contaminated soils, phytoremediation of the toxic metal con-ent to an environmentally safe level (Koopmans et al., 2007; Tack
Meers, 2010) could be introduced as a chemical quality measureromoting the soil biological mass and i.e. soil formation.
This paper presents a conceptual system model for describingoil ecosystem health in terms of suitability for use (i.e. the pro-ision of ecosystem services), with focus on deriving ecologicalndicators of ecosystem vulnerability to chemical stress. Impacts ofhemical stress on biological diversity and land use impacts on soilertility or health are complex matter difficult to quantify. Nonethe-ess, such impacts are the drivers for decreased habitat quality to
level that may exceed soil ecosystems ability to maintain thecological processes and functions mediating waste assimilationnd detoxification and i.e. productivity. A classification of vitalcological indicators enables a simple ranking analysis deriving aore set of vulnerability criteria. The relative susceptibility of soilcosystems to chemical stressors may then be evaluated accord-ng to the derived vulnerability criteria. The conceptual system
odel and multi-criteria methodology is illustrated implementinghe system model using defined ecosystem services as proxies foroil health. Our assumption is that if indicators reflecting ecologi-al requirements for ecosystem services are not exposed beyondheir no-effect concentration thresholds, the associated ecosys-
em service is not impacted. Vulnerability criteria for three typesf grassland ecosystems are ranked and available data on multi-le chemical stressors, i.e. nickel, cadmium, diazinon, lindane andhlorpyriphos, are discussed in terms ecological requirements. Thedicators 16 (2012) 67–75
system model may be used for the identification of high-concernareas in need of soil ecosystem health improving intervention mea-sures, as well as for selection of relevant endpoints for site-specificecological risk assessment.
2. Methodology
2.1. System model
A systematic approach for deriving scenario descriptions hasbeen developed by Thomsen et al. (2006) and further improvedin Sorensen et al. (2010) as a tool for defining worst case. In thepresent paper, this approach is illustrated for identifying highest-risk scenarios in respect to ecological requirements for land useon the basis of available toxicity data in the literature. Ecologicalrequirements for land use are defined as conditions that need tobe fulfilled in order for the soil ecosystem to provide the ecologicalservices desired by society regarding a particular use of land.
The system model consists of the following sub-models:
(1) Model for problem analysis (Problem Decomposition Model, PDM).Includes all sub-problems that may contribute to the cause ofthe risk problem; in this case-study preserving and enhancingthe soil ecosystem services suggested to be based on a set ofecological requirements for land use and associated ecologicalindicators.
(2) Model for scenario composition (Scenario Composition Model,SCM). Estimates a reduced set of sub-problems assumed toreflect the most important aspects in relation to highest riskconditions. In this case-study, soil ecosystem health sub-problems identified as ecological indicators susceptible tochemical stressors.
(3) Model for criteria setting (Criteria Model, CM). Finds analogiesbetween the sets of sub-problems included in SCM and datasets that will form criteria of higher/lower risk condition; inthis case-study, quantification of sub-problems susceptible tochemical stressors by eco-toxicological data sets as approxima-tions of sub-problems in SCM.
(4) Model for scenario selection (Scenario Selection Model, SSM). Pre-dicts the highest risk scenarios based on the criteria values; inthis case-study vulnerability criterion with respect to chemicalstressors.
(5) Model for risk quantification (Risk Quantification Model, RQM).Predicts the risk level for each of the selected scenarios.
The present work describes step 1 in general terms, with focus onstep 2, 3 and 4. Step 5 may be addressed in soil health scenarioanalyses for setting up quality criteria for long term sustainabil-ity of soil ecosystem services. As such, the system model may beused for deriving ecological indicators vital for future soil ecosys-tem health assessment, decision support for soil ecosystem healthmanagement; and, where needed, soil health improving interven-tion strategies for securing long-term fertility and i.e. productivityof land. Details regarding the System Model Approach and an indepth description of the derived ecological indicators may be foundin Thomsen et al. (2006).
2.2. Implementation of the system model using ecosystemservices as proxies for soil health
2.2.1. Problem Decomposition ModelBelow, ecosystem services are listed and subdivided into ecolog-
ical requirements and associated ecological indicators. Ecologicalindicators susceptible to chemical stressors are of relevance forthe identification of specific eco-toxicological data used as inputdata in the multi-criteria model used for estimating worst-case
M. Thomsen et al. / Ecological Indicators 16 (2012) 67–75 69
Ecosystemserv ice 1
Ecolog icalrequ irement 1.1
Soil suitab le f or spe cific land use
Ecosystemserv ice 2
Ecosystemserv ice x
Ind icator 1.1.1
Ecolog icalrequ irement 1.2
Ecolog icalrequ irement 1.y
Ind icator 1.1.2 Ind icator 1.1.z
Risk problem
Sub -problemsat level 1
Sub -problemsat level 2
Sub -problemsat level 3
F uitabir nd fune
sPmlt
audtipto
2cSiFaaru
2hspsedf
r
((
(
(
(
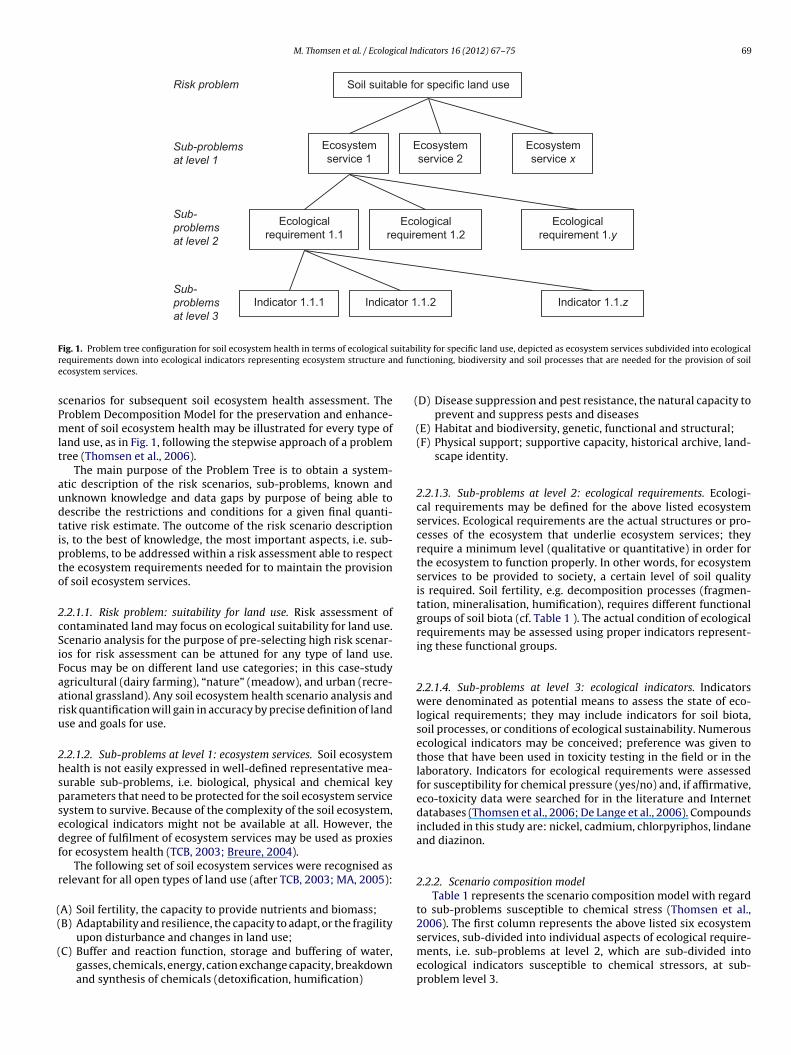
ig. 1. Problem tree configuration for soil ecosystem health in terms of ecological sequirements down into ecological indicators representing ecosystem structure acosystem services.
cenarios for subsequent soil ecosystem health assessment. Theroblem Decomposition Model for the preservation and enhance-ent of soil ecosystem health may be illustrated for every type of
and use, as in Fig. 1, following the stepwise approach of a problemree (Thomsen et al., 2006).
The main purpose of the Problem Tree is to obtain a system-tic description of the risk scenarios, sub-problems, known andnknown knowledge and data gaps by purpose of being able toescribe the restrictions and conditions for a given final quanti-ative risk estimate. The outcome of the risk scenario descriptions, to the best of knowledge, the most important aspects, i.e. sub-roblems, to be addressed within a risk assessment able to respecthe ecosystem requirements needed for to maintain the provisionf soil ecosystem services.
.2.1.1. Risk problem: suitability for land use. Risk assessment ofontaminated land may focus on ecological suitability for land use.cenario analysis for the purpose of pre-selecting high risk scenar-os for risk assessment can be attuned for any type of land use.ocus may be on different land use categories; in this case-studygricultural (dairy farming), “nature” (meadow), and urban (recre-tional grassland). Any soil ecosystem health scenario analysis andisk quantification will gain in accuracy by precise definition of landse and goals for use.
.2.1.2. Sub-problems at level 1: ecosystem services. Soil ecosystemealth is not easily expressed in well-defined representative mea-urable sub-problems, i.e. biological, physical and chemical keyarameters that need to be protected for the soil ecosystem serviceystem to survive. Because of the complexity of the soil ecosystem,cological indicators might not be available at all. However, theegree of fulfilment of ecosystem services may be used as proxiesor ecosystem health (TCB, 2003; Breure, 2004).
The following set of soil ecosystem services were recognised aselevant for all open types of land use (after TCB, 2003; MA, 2005):
A) Soil fertility, the capacity to provide nutrients and biomass;B) Adaptability and resilience, the capacity to adapt, or the fragility
upon disturbance and changes in land use;C) Buffer and reaction function, storage and buffering of water,
gasses, chemicals, energy, cation exchange capacity, breakdownand synthesis of chemicals (detoxification, humification)
lity for specific land use, depicted as ecosystem services subdivided into ecologicalctioning, biodiversity and soil processes that are needed for the provision of soil
D) Disease suppression and pest resistance, the natural capacity toprevent and suppress pests and diseases
E) Habitat and biodiversity, genetic, functional and structural;(F) Physical support; supportive capacity, historical archive, land-
scape identity.
2.2.1.3. Sub-problems at level 2: ecological requirements. Ecologi-cal requirements may be defined for the above listed ecosystemservices. Ecological requirements are the actual structures or pro-cesses of the ecosystem that underlie ecosystem services; theyrequire a minimum level (qualitative or quantitative) in order forthe ecosystem to function properly. In other words, for ecosystemservices to be provided to society, a certain level of soil qualityis required. Soil fertility, e.g. decomposition processes (fragmen-tation, mineralisation, humification), requires different functionalgroups of soil biota (cf. Table 1 ). The actual condition of ecologicalrequirements may be assessed using proper indicators represent-ing these functional groups.
2.2.1.4. Sub-problems at level 3: ecological indicators. Indicatorswere denominated as potential means to assess the state of eco-logical requirements; they may include indicators for soil biota,soil processes, or conditions of ecological sustainability. Numerousecological indicators may be conceived; preference was given tothose that have been used in toxicity testing in the field or in thelaboratory. Indicators for ecological requirements were assessedfor susceptibility for chemical pressure (yes/no) and, if affirmative,eco-toxicity data were searched for in the literature and Internetdatabases (Thomsen et al., 2006; De Lange et al., 2006). Compoundsincluded in this study are: nickel, cadmium, chlorpyriphos, lindaneand diazinon.
2.2.2. Scenario composition modelTable 1 represents the scenario composition model with regard
to sub-problems susceptible to chemical stress (Thomsen et al.,2006). The first column represents the above listed six ecosystem
services, sub-divided into individual aspects of ecological require-ments, i.e. sub-problems at level 2, which are sub-divided intoecological indicators susceptible to chemical stressors, at sub-problem level 3.
70 M. Thomsen et al. / Ecological Indicators 16 (2012) 67–75
Table 1Sub-problems at level 1, 2 and 3 of the problem tree. Grey cells in the third column represent ecological indicators for which data are available for the five case-studycompounds nickel, cadmium, chlorpyriphos, lindane, and diazinon.
Sub-problems at level 1:ecosystem service
Sub-problems at level 2:ecological requirements
Sub-problems at level 3:susceptible ecological indicators
Soil fertility General biodiversity aspects 1 Biodiversity indicesMicrobial aspects 2 Arginine deaminase activity
3 Carbon sources utilization diversity4 Cellulase activity5 Microbial biomass and activity6 Mycorrhizal infestation7 Nitrification8 Phosphatase activity9 Soil respiration
10 Sulphur oxidation11 Urease activity
Plant aspects 12 Dicotyledons biomass (fodder quality)13 N content (fodder quality)14 Litter standing crop15 Root density16 Root turnover17 Vegetation biomass18 Vegetation standing crop
Fauna aspects 19 Anecic earthworms20 Ants21 Cattle meat quality22 Collembola23 Earthworm community structure24 Earthworms25 Epigeic earthworms26 Hoverflies, other dipterans, beetles27 Isopods28 Millipedes29 Mites30 Native bees31 Nematode community composition32 Nematodes33 Pollinators34 Protozoa35 Slugs, snails, beetles36 Springtails37 Springtails, mites
Physical/chemical aspects 38 Ionic strength39 Loss on ignition40 Soil aggregates41 Soil bulk density
Adaptability and resilience Fauna aspects 42 Earthworm ecological groups43 Mites functional groups44 Nematode community structure45 Oribatid mites
General biodiversity aspects 46 Diversity indices47 Rank abundance distribution48 Soil food web complexity
Microbial aspects 49 Fungi:bacteria ratio50 Nucleic acids microbial population characterization
Buffer and reaction Fauna aspects 51 Anecic earthworms52 Earthworm bioturbation activity53 Epigeic and endogeic earthworms
Microbial aspects 54 Carbon sources utilization diversity55 Methanotrophic diversity
Physical/chemical aspects 56 Loss on ignition57 Soil organic matter
Plant aspects 58 Litter standing crop59 Primary production60 Root turnover61 Tree growth62 Vegetation standing crop
Disease suppression Fauna aspects 63 Predator species diversityGeneral biodiversity aspects 64 Green vein landscape elements
65 Key speciesMicrobial aspects 66 Antibiotics producers
Biodiversity General biodiversity aspects 67 Diversity indices68 Growth form diversity69 Isoenzymes70 Key stone species71 Species diversity
Microbial aspects 72 Nucleic acids microbial population characterizationPhysical support General biodiversity aspects 73 Vegetation cover
Physical/chemical aspects 74 Soil aggregates75 Soil bulk density76 Soil stratification
Plant aspects 77 Root density

M.
Thomsen
et al.
/ Ecological
Indicators 16
(2012) 67–75
71
Table 2Data set quantifying of sub-problems at level 3 (see also Thomsen et al., 2006; De Lange et al., 2006). Toxicity threshold concentrations in [mg/kg dry wt]. (A), no observed effect concentrations; (B) toxicity effect concentrationsin mg/kg dry wt soil.
Ecological indicators,sub-problem level 3
Microbialbiomass andactivity
Soilrespiration
Anecicearthworms
Collembola Earthworms Epigeicearthworms
Springtails Springtails,mites
Earthwormecologicalgroups
Anecicearthworms
Epigeic andendogeicearthworms
Keyspecies
Key stonespecies
ID 5 9 19 22 24 25 36 37 42 51 53 65 70
A Cadmium Max 450 250 350 250 130 350 350 250 250 130 250 250Chlorpyrifos 0.0146 10 100 100 0.065 5 117.4 10 10Diazinon 0.25 0.25 8.71 8.71Lindane 29 0.056 29 29 32 32Nickel 9685 800 700 700 800 800 700 700 700 700Cadmium Median 160 250 66 22.5 19 66 43 22.5 250 19 14 14Chlorpyrifos 0.0146 10 40 4.6 0.065 100 0 4.6 4.6 4.6Diazinon 0.25 0.25 4.48 4.48Lindane 12 0.053 12 12 10 10Nickel 461 645 110 110 645 645 110 110 110 110Cadmium Min 63 250 2.9 5.3 5.3 2.9 2.9 5.3 250 5.3 1.7 1.7Chlorpyrifos 0.0146 10 2.6 2.6 0.065 4.6 0 2.6 2.6 2.6Diazinon 0.25 0.25 0.25 0.25Lindane 3.2 0.032 3.2 3.2 0.032 0.032Nickel 280 173 65 65 173 173 65 65 65 65
B Cadmium MaxChlorpyrifos 10 77.8 117.4 117.4 0.26 117.4 77.8 117.4 100 100Diazinon 233 0.7 233 130 0.7 233 233 130 233 233Lindane 40.4 465 2.21 399 40.4 399 399 399Nickel 476 883 883 476 476 883 883 883 883Cadmium MedianChlorpyrifos 10 61.8 70.8 11.65 0.056 11.65 61.8 0.3 11.65 11.65Diazinon 59 0.7 94.5 130 0.7 94.5 59 130 4.3 4.7Lindane 40.4 40.4 0.1815 40.4 40.4 40.4 30.2 30.2Nickel 476 622.5 622.5 476 476 622.5 622.5 622.5 622.5Cadmium MinChlorpyrifos 0.0146 45.8 0.3 0.3 0.017 0.3 45.8 0.3 10 10Diazinon 32 0.7 32 130 0.7 32 32 130 0.7 0.7Lindane 40.4 1.9 0.0936 1.9 40.4 1.9 0.0936 0.0936Nickel 476 362 362 476 476 362 362 362 362
72 M. Thomsen et al. / Ecological Indicators 16 (2012) 67–75
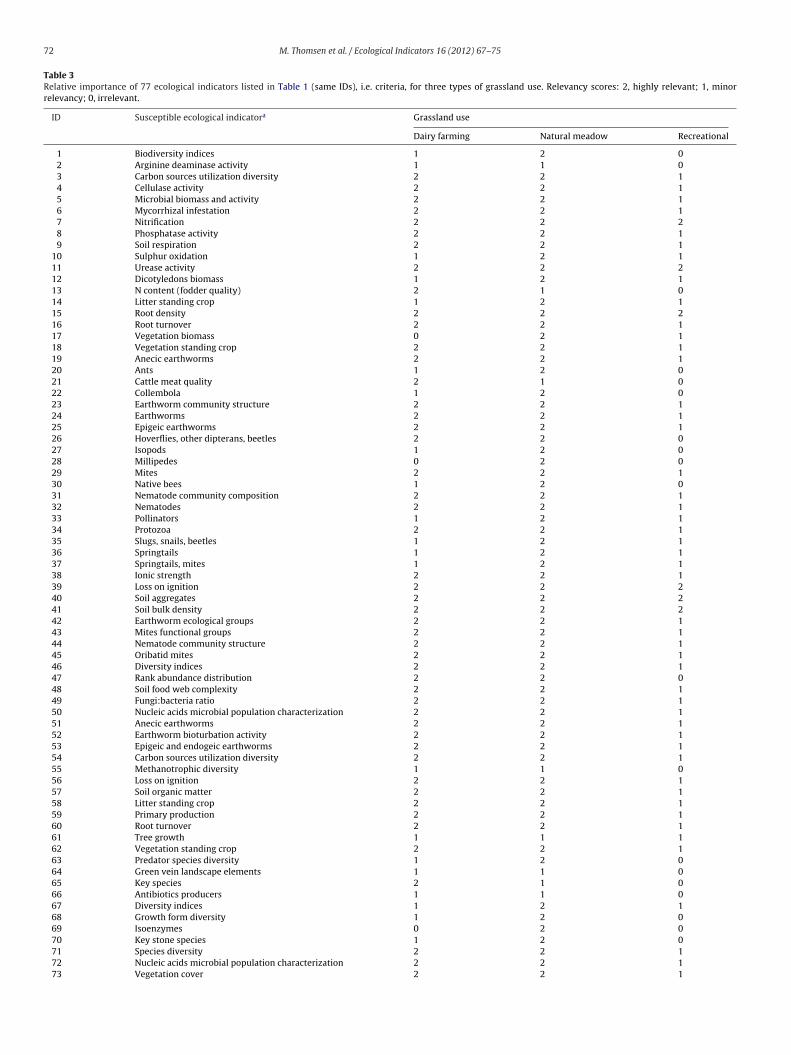
Table 3Relative importance of 77 ecological indicators listed in Table 1 (same IDs), i.e. criteria, for three types of grassland use. Relevancy scores: 2, highly relevant; 1, minorrelevancy; 0, irrelevant.
ID Susceptible ecological indicatora Grassland use
Dairy farming Natural meadow Recreational
1 Biodiversity indices 1 2 02 Arginine deaminase activity 1 1 03 Carbon sources utilization diversity 2 2 14 Cellulase activity 2 2 15 Microbial biomass and activity 2 2 16 Mycorrhizal infestation 2 2 17 Nitrification 2 2 28 Phosphatase activity 2 2 19 Soil respiration 2 2 1
10 Sulphur oxidation 1 2 111 Urease activity 2 2 212 Dicotyledons biomass 1 2 113 N content (fodder quality) 2 1 014 Litter standing crop 1 2 115 Root density 2 2 216 Root turnover 2 2 117 Vegetation biomass 0 2 118 Vegetation standing crop 2 2 119 Anecic earthworms 2 2 120 Ants 1 2 021 Cattle meat quality 2 1 022 Collembola 1 2 023 Earthworm community structure 2 2 124 Earthworms 2 2 125 Epigeic earthworms 2 2 126 Hoverflies, other dipterans, beetles 2 2 027 Isopods 1 2 028 Millipedes 0 2 029 Mites 2 2 130 Native bees 1 2 031 Nematode community composition 2 2 132 Nematodes 2 2 133 Pollinators 1 2 134 Protozoa 2 2 135 Slugs, snails, beetles 1 2 136 Springtails 1 2 137 Springtails, mites 1 2 138 Ionic strength 2 2 139 Loss on ignition 2 2 240 Soil aggregates 2 2 241 Soil bulk density 2 2 242 Earthworm ecological groups 2 2 143 Mites functional groups 2 2 144 Nematode community structure 2 2 145 Oribatid mites 2 2 146 Diversity indices 2 2 147 Rank abundance distribution 2 2 048 Soil food web complexity 2 2 149 Fungi:bacteria ratio 2 2 150 Nucleic acids microbial population characterization 2 2 151 Anecic earthworms 2 2 152 Earthworm bioturbation activity 2 2 153 Epigeic and endogeic earthworms 2 2 154 Carbon sources utilization diversity 2 2 155 Methanotrophic diversity 1 1 056 Loss on ignition 2 2 157 Soil organic matter 2 2 158 Litter standing crop 2 2 159 Primary production 2 2 160 Root turnover 2 2 161 Tree growth 1 1 162 Vegetation standing crop 2 2 163 Predator species diversity 1 2 064 Green vein landscape elements 1 1 065 Key species 2 1 066 Antibiotics producers 1 1 067 Diversity indices 1 2 168 Growth form diversity 1 2 069 Isoenzymes 0 2 070 Key stone species 1 2 071 Species diversity 2 2 172 Nucleic acids microbial population characterization 2 2 173 Vegetation cover 2 2 1

M. Thomsen et al. / Ecological Indicators 16 (2012) 67–75 73
Table 3 (Continued )
ID Susceptible ecological indicatora Grassland use
Dairy farming Natural meadow Recreational
74 Soil aggregates 2 2 175 Soil bulk density 2 2 276 Soil stratification 1 2 077 Root density 2 2 2
a Estimated relevance of ecological indicators sensitive to chemical stressors for grassland ecosystems in relation to typical examples for land use: agricultural (dairyfarming), “nature” (meadow), and urban (recreational grassland). Ecological indicators were ordered by soil ecosystem service and basic aspects of the ecosystem.
Table 4Classification of 77 ecological indicators into equivalent weight classes. Cr1, Cr2, Cr3: respective criteria values for dairy grassland, natural meadow and recreational grassland;2, highly relevant; 1, minor relevancy; 0, irrelevant. ID numbers in bold represent ecological indicators for which data are available.
Grassland type relevancycriteria (Cr1,Cr2,Cr3)
susceptible indicators with Equivalent weight
No toxicity data available Toxicity data available
(2,2,2) 11, 15, 39, 40, 41, 75, 77(2,2,1) 4, 6, 8, 16, 18, 23, 29, 31, 32, 34, 38, 43, 44, 45, 46, 48, 49, 50, 52, 54, 56, 57, 58, 59, 60, 62, 71, 72, 73, 74 5, 9, 19, 24, 25, 42, 51, 53(1,2,1) 12, 14, 33, 35, 67 36, 37(2,2,0) 47(2,1,0) 13, 21 65(1,2,0) 20, 27, 30, 63, 68, 76 22, 70
2
eiDm
tmt
aotitie
lcbetcsqip
22mdctbfti
(1,1,0) 55, 64, 66(0,2,0) 69
.2.3. Toxicity dataCriterion data sets, i.e. toxicological data as approximations of
cological indicators susceptible to chemical stress, are presentedn Table 2, depicting toxicity data from field and laboratory studies.escriptive statistics for the two data sets are presented as mini-um (Min), median (Median) and maximum (Max) concentrations.Toxicity data may be used for ranking soil heath risk scenarios in
he scenario selection model, as well as in consecutive risk assess-ent for the derivation of soil quality parameters needed to fulfil
he defined ecological requirements.If no toxicity threshold data are available in the literature, then
data gap exists. When no criterion data for the approximationf ecological indicators for a sub-problem at level 2 exit, thenhis sub-problem is left out of subsequent analysis, leading toncreased ignorance and, thus, basic uncertainty. An example fromhe present case-study is missing data on any of the ecologicalndicators quantifying impacts of chemical stressors on affectingcological requirements related to plant aspects.
It is also possible to identify basic uncertainty if only a veryimited number of the ecological indicators for a sub-problem areovered by data. An example from the present case-study is micro-ial aspects of ecological requirements which are poorly covered;.g. no data on impacts of chemical stress on two genera of bac-eria vital for soil nitrification, a central process in the nitrogenycle related to soil fertility, are available for any of the five case-tudy compounds. Thus, the degree of completeness in data foruantification of the ecological indicators listed in Table 1 is highly
mportant for soil ecosystem health assessment as a part of a com-lete uncertainty assessment.
.2.4. Criteria model
.2.4.1. Data on the importance of selected ecological indicators. Soilsay, in general, provide a number of ecosystem services, and
epending on the intentional land use, some of these may beonsidered more relevant than others. In the present section, a sys-ematic approach of describing soil health scenarios in terms of
asic criteria for soil ecosystem functioning are presented. There-ore, a tentative classification of soil health criteria is presented inerms of their relevance to land use. For illustration purposes, a lim-ted selection of land use types is presented. This classification intoland uses and ecosystem services may serve as a basis to recognisevulnerable and sensitive structures and processes in ecosystemsthat are needed in the provision of ecosystem services. Eventually,in subsequent risk assessment, soil quality standards may be devel-oped for chemicals with potential impact on soil health (the mainrisk problem) through definition of toxicity thresholds to safeguardsustainable land use. In Table 3, the basic criteria for soil ecosystemfunctioning are listed. In addition, the relative importance is givenaccording to expert judgement of soil ecosystem requirements inview of three types of grassland use.
3. Results and discussion
A critical issue is to find a reduced core set of the 77 ecologicalindicators listed in Table 2. It is also a critical issue to assess whetheravailable data cover the most important indicators. So, the first stepis simply to group the ecological indicators in clusters of similarimportance, i.e. equivalent weights, for all three types of ecosystemservices, as presented in Table 4. The next step is to assess the datacoverage for the most important ecological indicators.
A comparison between Tables 3 and 4 shows that for the coreset of ecological indicators having the highest score of 2 for allthree types of grassland no ecological indicator is covered withdata. The data coverage improves if it is assumed that urban grass-land soil ecosystem health is of less importance for the provision ofassociated soil ecosystem services than dairy farming and naturalmeadows. In this case, (2,2,1) scoring includes 8 ecological indi-cators for which the impact of chemicals stressor are covered bydata. In general, little knowledge on the impact of chemical stress-ors on soil health is available, and uncertainty from such data gapsis therefore highly critical.
3.1. Concluding remarks
We have developed an approach that is based on systematicenumeration of vulnerable indicators that reflect essential soil
ecosystem structures and processes that underlay soil ecosys-tem services. The method is illustrated for a shortlist of commonchemical stressors, for which toxicity data are relatively well-available in the scientific literature, and applied in a comparative
7 ical In
auosrutattf
aaoebchothdildtnotnc
tptcpmKn2slGicae
A
ptEbmDi
R
B
4 M. Thomsen et al. / Ecolog
ssessment of suitability for use of grassland on contaminated soilnder various types of land use. A comprehensive and relevant setf ecological indicators has been analysed to derive a smaller coreet of indicators highly relevant for all types of grassland use; i.e.eflecting ecological requirements to be fulfilled for any sustainablese of grassland. However, available data to assess the sensitivityo chemical stressors reveal critical data gaps. While this is limitingny analytical and theoretical approach for soil health assessmento evaluate soil preservation, management and legislation, the sys-ematic enumeration of indicators will illustrate ignorance andacilitate uncertainty assessment.
Soil fertility is an important and complex ecosystem service; large set of indicators was enumerated, clearly outnumberingny listing for other ecosystem services. This is perhaps a resultf bias from available knowledge or personal experience. How-ver, too many indicators are not a problem, but too few mighte, as it can result in ignorance from data gaps. Would these beritical data gaps? How can we know this? Perhaps soil biologyas focused upon the most important aspects in past decades toverview at least the very largest part of important soil health cri-eria. But again, how can we know this? On the other hand: it isard or perhaps impossible to identify missing criteria. We haveisclosed some: actinomycetes, autotrophic bacteria, pollinating
nsects with soil dwelling larvae (e.g. some hoverflies and beetles),ichens, and other symbionts, and faunistic and floristic geneticiversity. Some of these indicators are thought to have minor con-ributions to ecosystem services (which is probably a reason forot being studied by ecotoxicologists). There is misrepresentationf plant ecological indicators, except perhaps for primary produc-ion under soil fertility. Although this is a clear omission, this mayot jeopardize risk assessment scenarios much, as plants are notonsidered to be most sensitive to the chemicals assessed here.
A loss of any component of sustainable ecosystems is not cap-ured by biocapacity measured in terms of productivity as long asrevailing conditions sustains increased yields by substitute inputso the system (Carter, 2002; Mózner et al., 2011). Therefore, a pre-autionary approach could be used to define maximum ecologicalroductivity appreciating some level of soil ecosystem require-ents needed for maintaining ecological integrity (Harris, 2009).
nowledge of soil ecosystem requirements may guide the plan-ing of health improving soil management practices (e.g. Khan,005; Koopmans et al., 2007; Lugato et al., 2006) and future sitepecific sustainable land management to be accounted for in Eco-ogical Footprint Analysis (Bastianoni et al., 2011; Kissinger andottlieb, 2011; Wiedmann & Barrett, 2010). Maintenance or restor-
ng of grassland soil ecosystem health may play a significant role inlimate change mitigation by enhanced soil carbon sequestrationnd reduced soil respiration or CO2 efflux (Conant, 2010; Zhangt al., 2010).
cknowledgements
This work has been part of and has been funded within theroject Novel Methods for Integrated Risk Assessment of Cumula-ive Stressors in Europe (NoMiracle, contract No. 003956) under theU’s 6th Framework Program for R&D. Funding was also providedy the strategic research program “Sustainable spatial develop-ent of ecosystems, landscapes, seas and regions” financed by theutch Ministry of Agriculture, Nature Conservation and Food Qual-
ty (KB-01-007-004).
eferences
astianoni, S., Niccolucci, V., Pulselli, R.M., Marchettini, N., 2011. Indicator and indi-candum: “sustainable way” vs “prevailing conditions” in Ecological Footprintdefinition. Ecol. Indicators.
dicators 16 (2012) 67–75
Breure, A.M., 2004. Ecological soil monitoring and quality assessment. In: Doelman,P., Eijsackers, H. (Eds.), Vital Soil. Function, Value and Properties, vol. 29. Elsevier,Amsterdam, pp. 281–305.
Carter, M.R., 2002. Soil quality for sustainable land management: organic matter andaggregation interactions that maintain soil functions. Agron. J. 94, 38–47.
Conant, R.T., 2010. Challenges and opportunities for carbon sequestration in grass-land systems. A technical report on grassland management and climate changemitigation. Prepared for the Plant Production and Protection Division Food andAgriculture Organization of the United Nations (FAO). Integr. Crop Manage. 9(ISSN1020-4555).
De Lange H.J., Van der Pol, J.J.C., Lahr, J., Faber, J.H., 2006. Ecological vulnerabilityin wildlife; a conceptual approach to assess impact of environmental stressors.Wageningen, Alterra, Alterra-Report 1305, 112 pp.
Dhital, D., Muraoka, H., Yashiro, Y., Shizu, Y., Koizumi, H., 2010. Measurementof net ecosystem production and ecosystem respiration in a Zoysia japon-ica grassland, central Japan, by the chamber method. Ecol. Res. 25, 483–493,doi:10.1007/s11284-009-0678-2.
Doran, J.W., Zeiss, M.R., 2000. Soil health and sustainability: managing the bioticcomponent of soil quality. Appl. Soil Ecol. 15, 3–11.
Ewing, B., Reed, A., Galli, A., Kitzes, J., Wackernagel, M., 2010. Calculation Method-ology for the National Footprint Accounts, 2010 ed. Global Footprint Network,Oakland.
Harris, J., 2009. Soil microbial communities and restoration ecology: facilitators orfollowers? Science 325, 573–574, doi:10.1126/science.1172975.
Haberl, H., Erb, K.H., Krausmann, F., 2001. How to calculate and interpret ecologicalfootprints for long periods of time: the case of Austria 1926–1995. Ecol. Econ.38, 25–45.
Hodson, M.E., 2010. The need for sustainable soil remediation. Elements 6, 363–368.Khan, A.G., 2005. Role of soil microbes in the rhizospheres of plants growing on
trace metal contaminated soils in phytoremediation. J. Trace Elem. Med. Biol.18, 355–364.
Kissinger, M., Gottlieb, D., 2011. From global to place oriented hectares - The case ofIsrael’s wheat ecological footprint and its implications for sustainable resourcesupply. Ecol. Indicators 16, 51–57.
Kamal, K., Prasad, R., Varma, A., 2010. Soil microbial diversity in relation to heavymetals. Soil Heavy Met. Soil Biol. 19, 31–63, doi:10.1007/978-3-642-02436-8.
Kitzes, J., Galli, A., Bagliani, M., Barrett, J., Dige, G., Ede, S., Erb, K., Giljum, S., Haberl, H.,Hails, C., Jolia-Ferrier, L., Jungwirth, S., Lenzen, M., Lewis, K., Loh, J., Marchettini,N., Messinger, H., Milne, K., Moles, R., Monfreda, C., Moran, D., Nakano, K., Pyhälä,A., Rees, W., Simmons, C., Wackernagel, M., Wada, Y., Walsh, C., Wiedmann, T.,2009. A research agenda for improving national ecological footprint accounts.Ecol. Econ. 68, 1991–2007.
Koopmans, G.F., Römkens, P.F.A.M., Song, J., Temminghoff, E.J.M., Japenga, J., 2007.Predicting the Phytoextraction duration to remediate heavy metal contaminatedsoils. Water Air Soil Pollut. 181, 355–371.
Lal, R., 2004. Soil carbon sequestration to mitigate climate change. Geoderma 123,1–22.
Lal, R., 2008. Carbon sequestration. Phil. Trans. R. Soc. B 363, 815–830.Lugato, F., Berti, A., L.Giardini, L., 2006. Soil organic carbon (SOC) dynamics with
and without residue incorporation in relation to different nitrogen fertilisationrates. Geoderma 135, 315–321, doi:10.1016/j.geoderma.2006.01.012.
Mench, M., Schwitzguébel, J.-P., Schroeder, P., Bert, V., Gawronski, S., Gupta, S., 2009.Assessment of successful experiments and limitations of phytotechnologies:contaminant uptake, detoxification and sequestration, and consequences forfood safety. Environ. Sci. Pollut. Res. 16, 876–900.
MA, 2005. Millennium Ecosystem Assessment. Ecosystems and Human Well-being,vol. 1: Current State and Trends. World Resources Institute, Washington, DC.
Monfreda, C., Wackernagel, M., Deumling, D., 2004. Establishing national naturalcapital accounts based on detailed Ecological Footprint and biological capacityassessments. Land Use Policy 21, 231–246.
Mózner, Z., Tabi, A., Csutora, M., 2011. In the quest for the sustainable agricul-tural yield - Comparing the environmental impacts of intensive and extensiveagricultural practices. Ecol. Indicators.
Nielsen, M.N., Winding, A., 2002. Microorganisms as indicators of soil health.National Environmental Research Institute, Denmark. Technical report No. 388.
Pan, Y., Birdsey, R.A., Hom, J., McCoullough, K., Clark, K., 2006. Improved satelliteestimates of net primary productivity from MODIS satellite data at regional andlocal scales. Ecol. Appl. 16, 125–132.
Pizzol, M., Thomsen, M., Andersen, M.S., 2010. Long-term human exposure tolead from different media and intake pathways. Sci. Total Environ. 48,5478–5488.
Smith, J.L., Bell, J.M., Bolton Jr., H., Bailey, V.L., 2007. The initial rate of C substrateutilization and longer-term soil C storage. Biol. Fertil. Soils 44, 315–320.
Sobolev, D., Begonia, M.F.T., 2008. Effects of heavy metal contamination upon soilmicrobes: lead-induced changes in general and denitrifying microbial commu-nities as evidenced by molecular markers. Int. J. Environ. Res. Public Health 5,450–456.
Spurlock, J.M.O., Johnson, K., Olson, J., 2002. Estimating net primary productiv-ity from grassland biomass dynamics measurements. Global Change Biol. 8,736–753.
Sorensen, P.B., Assmuth, T., Greiger, K., Baun, A., Thomsen, M., 2010. Improved
worst-case definition for risk assessment. Part I. A methodological knowl-edge mapping for finding worst-case in risk assessment. Sci. Total Environ.,doi:10.1016/j.scitotenv.2009.11.01.Tack, F.M.G., Meers, E., 2010. Assisted phytoextraction: helping plants to help us.Elements 6, 383–388.
ical In
T
T
T
V
M. Thomsen et al. / Ecolog
ilman, D., Reich, P.B., Knops, J.M., 2006. Biodiversity and ecosystem stability in adecade-long grassland experiment. Nature 441, 629–632.
CB, 2003. Advice. Towards a more ecologically sustainable land use. TechnicalCommittee on Soil Protection. The Hague. TCB report A33.
homsen, M., Sorensen P.B., Fauser, P., Faber, J., Lahr, J., Peirano, F., Vernai, A.M.,
Strebel, K., Schlink, U., Porragas, G.E, Giralt i Prat, F., Rallo, R., Pistocchi, A., 2006.Preselection of scenario for cumulative risk assessment. NoMiracle deliverableD1.2.4., available at http://nomiracle.jrc.it/.enetoulis, J., Talberth, J., 2008. Refining the ecological footprint. Environ. Dev. Sus-tain. 10, 441–469, doi:101007/s10668-006-9074-z.
dicators 16 (2012) 67–75 75
Walsh, C., Moles, R., O’Regan, B., 2010. Application of an Expanded SequestrationEstimate to the Domestic Energy Footprint of the Republic of Ireland. Sustain-ability 2, 2555–2572.
Wiedmann, T., Barrett, J., 2010. A review of the Ecological Footprint indicator—Perceptions and methods. Sustainability 2, 1645–1693, doi:10.3390/su2061645.
Wiedmann, T., Lenzen, M., 2007. On the conversion between local and globalhectares in Ecological Footprint analysis. Ecol. Econ. 60, 673–677.
Zhang, F., Wang, T., Xue, X., Han, B., Peng, F., You, Q., 2010. The response of soilCO2 efflux to desertification on alpine meadow in the Qinghai–Tibet Plateau.Environ. Earth Sci. 60, 349–358.