Perceived Occupational Stressors and the Health Software Professionals in Bengaluru, India
Upload
khangminh22Category
view
0download
0
�����������������
Citation: Slopen, N.; Cook, B.L.;
Morgan, J.W.; Flores, M.W.; Mateo, C.;
Garcia Coll, C.; Acevedo Garcia, D.;
Priest, N.; Wethington, E.; Lee, E.;
et al. Family Stressors and Resources
as Social Determinants of Health
among Caregivers and Young
Children. Children 2022, 9, 452.
https://doi.org/10.3390/
children9040452
Academic Editor: Rada K. Dagher
Received: 20 December 2021
Accepted: 16 March 2022
Published: 23 March 2022
Publisher’s Note: MDPI stays neutral
with regard to jurisdictional claims in
published maps and institutional affil-
iations.
Copyright: © 2022 by the authors.
Licensee MDPI, Basel, Switzerland.
This article is an open access article
distributed under the terms and
conditions of the Creative Commons
Attribution (CC BY) license (https://
creativecommons.org/licenses/by/
4.0/).
children
Article
Family Stressors and Resources as Social Determinants ofHealth among Caregivers and Young ChildrenNatalie Slopen 1,2,*, Benjamin Le Cook 3,4, Justin Winston Morgan 1, Michael William Flores 3, Camila Mateo 4,Cynthia Garcia Coll 5, Dolores Acevedo Garcia 6 , Naomi Priest 7,8, Elaine Wethington 9 , Esther Lee 10,Margo Moyer 3, Nathaniel M. Tran 11, Sandra Krumholz 1 and David R. Williams 1,12
1 Department of Social and Behavioral Sciences, Harvard T. H. Chan School of Public Health,Boston, MA 02115, USA; [email protected] (J.W.M.); [email protected] (S.K.);[email protected] (D.R.W.)
2 Center on the Developing Child, Harvard University, Cambridge, MA 02138, USA3 Health Equity Research Lab, Cambridge Health Alliance, Cambridge, MA 02139, USA;
[email protected] (B.L.C.); [email protected] (M.W.F.); [email protected] (M.M.)4 Harvard Medical School, Boston, MA 02115, USA; [email protected] Department of Pediatrics, University of Puerto Rico, San Juan 00935, Puerto Rico; [email protected] Institute for Child, Youth and Family Policy, Heller School for Social Policy and Management,
Brandeis University, Waltham, MA 02454, USA; [email protected] Center for Social Research and Methods, Australia National University, Canberra 0200, Australia;
[email protected] Population Health, Murdoch Children’s Research Centre, Royal Children’s Hospital, Melbourne 3025, Australia9 Survey Research Center, Institute for Social Research, University of Michigan, Ann Arbor, MA 48106, USA;
[email protected] University of Michigan School of Public Health, Ann Arbor, MI 48109, USA; [email protected] Department of Health Policy, Vanderbilt University, Nashville, TN 37203, USA;
[email protected] Departments of African and African American Studies and of Sociology, Harvard University,
Cambridge, MA 02138, USA* Correspondence: [email protected]
Abstract: Life course-informed theories of development suggest it is important to integrate informa-tion about positive and negative aspects of the social environment into studies of child and parentalwellbeing, including both stressors that compromise health and resources that promote well-being.We recruited a sample of 169 pairs of caregivers and young children (birth to 5 years) from a commu-nity health clinic and administered survey questions to assess stressors and resources. We constructedinventories of stressors and resources and examined the relationships between these inventories andcaregivers’ depressive symptoms, anxiety symptoms, and sleep problems, and young children’s med-ical diagnoses derived from electronic health records. Cumulative stressors and resources displayedbivariate and adjusted associations with caregivers’ depressive symptoms, anxiety symptoms, andsleep problems. For depressive and anxiety symptoms, these associations were evident in models thatincluded stressors and resources together. Caregivers with high stressors and low resources displayedthe highest levels of depressive and anxiety symptoms and sleep problems. In terms of children’shealth outcomes, only modest trends were evident for developmental/mental health outcomes, butnot other diagnostic categories. Future studies are needed to examine stressors and resources togetherin larger samples and in relation to prospectively assessed measures of child well-being.
Keywords: stressors; protective factors; children; caregivers; health
1. Introduction
Social context affects the health and wellbeing of parents and children, includingstressors that compromise health and resources that promote well-being [1]. The interplay
Children 2022, 9, 452. https://doi.org/10.3390/children9040452 https://www.mdpi.com/journal/children

Children 2022, 9, 452 2 of 20
of compounding stressors and resources, shaped by the social determinants of health, influ-ences healthy development and also health disparities by race/ethnicity and socioeconomicstatus, which emerge early in life and widen over time [2]. The accurate measurement ofstressors and resources that affect infants and young children requires a comprehensiveassessment of experiences in their parents’ lives and an understanding of the broader socialcontext in which families reside [3,4]. Within life course theory, an accumulation modelsuggests that the occurrence of multiple risk exposures exceeds the negative developmentalconsequences of a single exposure [5], often displaying a graded positive relationship [6–9].More recently, studies have shown that an accumulation model also applies to the accrualof resources or assets in the family, with additional protective factors associated with alower risk of poor health or increased well-being and resilience [10,11]. Whereas mostresearch using an additive model has focused on either the accumulation of stressors [6]or resources [12], a variety of theories and frameworks within developmental psychologyemphasize the importance of studying risks and protective factors together [13].
Several recent studies have examined childhood stressors and resources together forhealth outcomes in children [14,15] and adults [11,16,17]. For example, in a nationallyrepresentative study with children aged 8 to 17 (n = 40,302), adverse childhood experiencesand positive childhood experiences interacted, whereby children who were exposed to highlevels of adversity and low positive experiences had over 8 times the odds of depressioncompared to children with low adversity and high positive experiences [14]. In anotherstudy (n = 489, ages 10–13 years at baseline), researchers found that the ratio of childhoodadversities to protective factors was associated with a range of health outcomes nearly tenyears later [16]. Similar patterns are evident when outcomes are assessed in adulthood:for example, using data from a random digit-dial telephone survey of over 6000 adults inWisconsin, positive childhood experiences were associated with a lower risk of depression,adjusting for adverse childhood experiences [11]. These studies align with other studiesillustrating that positive social experiences can protect against the adverse health conse-quences of stressors [17–20]. In the present study, we build on existing research to examinestressors and resources together in relation to outcomes in young children and the parentsof young children.
Social scientists and health practitioners have developed a wide array of optionsfor high-quality measures of distinct family processes, attributes, and events relevant forcharacterizing the lives of caregivers and young children. Validated measures for specificparent or family characteristics, experiences, or contexts are typically long (e.g., ≥10 items),making it challenging to bring together multiple measures to characterize caregiver andyoung children’s social environments comprehensively within research or clinical con-texts, and to incorporate multiple detailed, multi-item assessments into analyses. Withthe increasing interest in integrating information about positive and negative aspects ofchildren’s social environment into research studies and clinical practices [11,21–25], there isa need for brief yet robust measures to capture this information.
Guided by an accumulation model [6], in the present study, we constructed inventoriesof cumulative risk and protective factors using short scales and single-item questions toreflect stressors and protective factors across multiple domains relevant to children’sdevelopment from infancy through five years of age and their parent’s wellbeing. Wefocused this study on young children and their parents, given the importance of theseearliest years for healthy development over time.
2. Methods2.1. Participants
Our study team recruited 169 caregiver-child dyads from the waiting room of a singlecommunity health center in Massachusetts. Families were eligible for inclusion in this cross-sectional study if the adult was a primary caregiver to a young child (ages 0 to 5 years)present in the clinic for an appointment. If eligible, the primary caregiver completedan informed consent process and the survey in English, Spanish, Portuguese, or Haitian

Children 2022, 9, 452 3 of 20
Creole (i.e., the four most common languages spoken in this clinic population). Caregiverscompleted the surveys via a tablet while at the clinic, with help from research assistantsas needed. Following survey completion, the research assistant added the child’s medicalrecord number to the survey record to make it possible to link the child’s electronic healthrecord (EHR) to the survey responses. The Institutional Review Board at Cambridge HealthAlliance approved the study.
2.2. Measures
We collected information on a broad range of stressors and resources that can impactopportunities for healthy child development until five years of age. Experts from psychol-ogy, sociology, public health, and human development (some included in this authorshipgroup) were asked to recommend brief yet validated questions for a range of stressorsand resources recognized as central to parental wellbeing and child health. The overallgoal was to create a survey with high-quality brief measures. The included constructs andassociated measures were selected based on the current theories of early child developmentand research building on these models [1,26–28], structured discussions, and eventualconsensus among these experts. We retained the original items and response values, whichare not consistent across items; as described below, following other research that hascombined information across multiple measures with different scales [29,30], we createddichotomous variables for each construct to represent high or low values for each stressor orresource (described in more detail below). This approach to developing cumulative scoresis widespread within child development research, as it is (a) parsimonious, (b) statisticallysensitive with small samples, (c) avoids assumptions about the relative strengths of thecomponent factors or their collinearity, and (d) fits with underlying theoretical models thatsuggest that multiple exposures are more potent than single exposures [6].
2.2.1. Cumulative Stressor Inventory
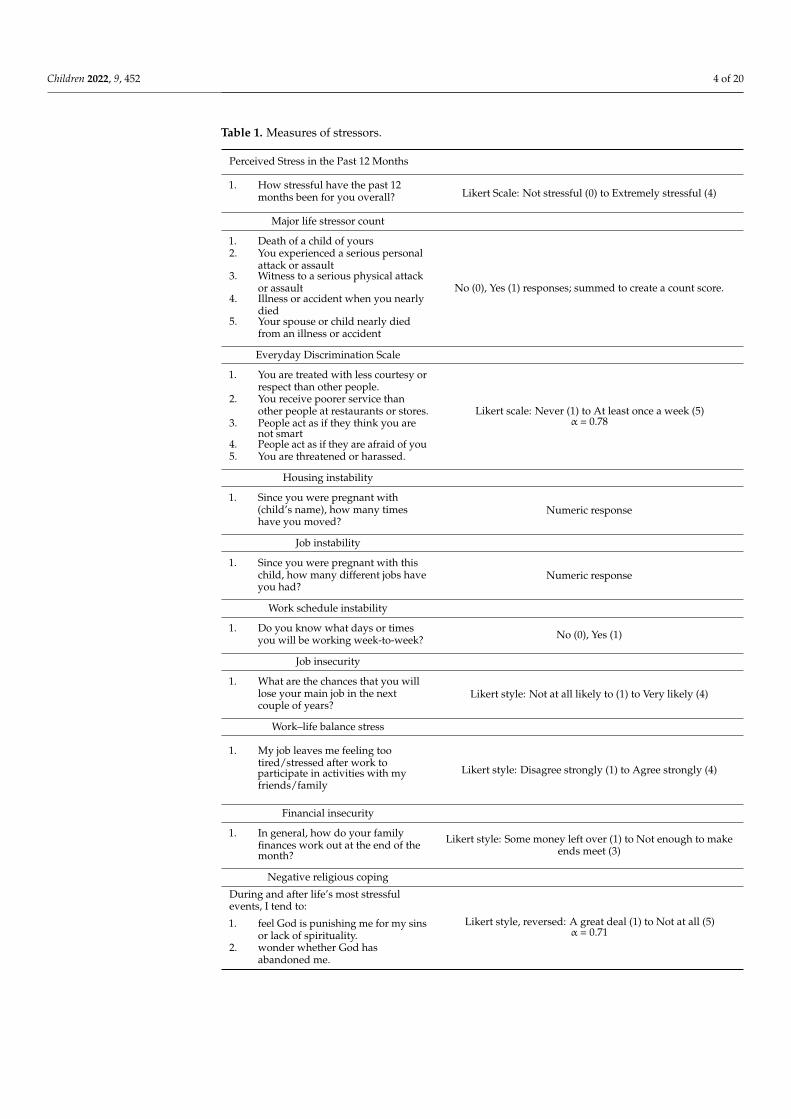
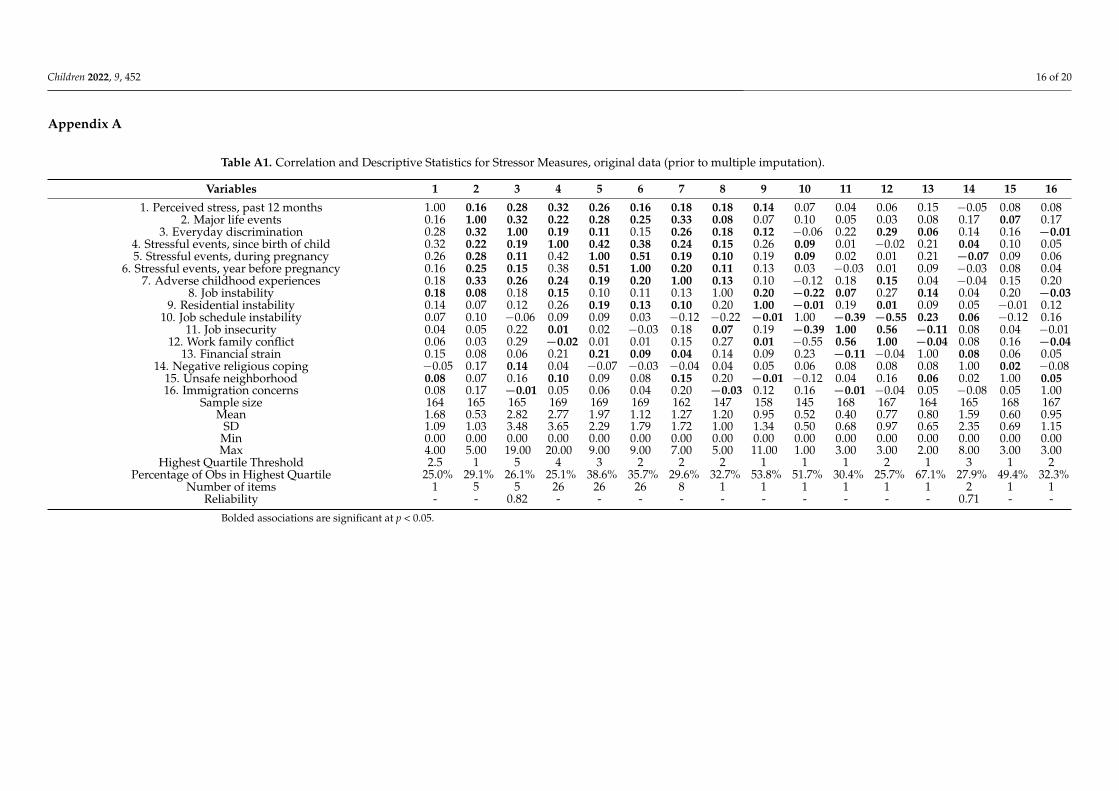
We constructed a cumulative stressor inventory that included 16 dichotomous indi-cators (range 0–16), created from the items listed in Table 1. The 16 included indicatorsreflect: (1) perceived stress in the past 12 months (1 Likert-style item); (2) major life events(5 dichotomous items) [31]; (3) everyday discrimination (5 Likert-style items) [32]; (4) hous-ing instability (1 count item); (5) job instability (1 count item); (6) work schedule instability(1 Likert-style item); (7) job insecurity (1 Likert-style item); (8) work–life balance stress(1 Likert-style item); (9) financial insecurity (1 Likert-style item); (10) negative religiouscoping (2 Likert-style items); (11) neighborhood safety (1 Likert-style item); (12) familyimmigration concerns (1 Likert-style items, adapted from the National Survey of Hispanics);26 stressful events during (13) the 12 months prior to conception of the child attendingthe clinic, (14) during pregnancy, and (15) since the child was born (with events selectedfrom a variety of sources); and, (16) adverse childhood experiences of the respondent (8 di-chotomous items) [33]. Table A1 in Appendix A presents correlations between the stressors,means, standard deviations, and ranges. In addition, this table shows the thresholds fordichotomization of each of the 16 indicators for use in the cumulative stressor score (i.e., topquartile, or closest approximation), as well as Cronbach’s alpha for the Likert-style mea-sures with multiple items. To create the cumulative stressor inventory score, we summedthe indicator variables created for each measure. In addition to this continuous score, weconstructed a quartile variable to examine graded patterns.
Children 2022, 9, 452 4 of 20
Table 1. Measures of stressors.
Perceived Stress in the Past 12 Months
1. How stressful have the past 12months been for you overall? Likert Scale: Not stressful (0) to Extremely stressful (4)
Major life stressor count
1. Death of a child of yours2. You experienced a serious personal
attack or assault3. Witness to a serious physical attack
or assault4. Illness or accident when you nearly
died5. Your spouse or child nearly died
from an illness or accident
No (0), Yes (1) responses; summed to create a count score.
Everyday Discrimination Scale
1. You are treated with less courtesy orrespect than other people.
2. You receive poorer service thanother people at restaurants or stores.
3. People act as if they think you arenot smart
4. People act as if they are afraid of you5. You are threatened or harassed.
Likert scale: Never (1) to At least once a week (5)α = 0.78
Housing instability
1. Since you were pregnant with(child’s name), how many timeshave you moved?
Numeric response
Job instability
1. Since you were pregnant with thischild, how many different jobs haveyou had?
Numeric response
Work schedule instability
1. Do you know what days or timesyou will be working week-to-week? No (0), Yes (1)
Job insecurity
1. What are the chances that you willlose your main job in the nextcouple of years?
Likert style: Not at all likely to (1) to Very likely (4)
Work–life balance stress
1. My job leaves me feeling tootired/stressed after work toparticipate in activities with myfriends/family
Likert style: Disagree strongly (1) to Agree strongly (4)
Financial insecurity
1. In general, how do your familyfinances work out at the end of themonth?
Likert style: Some money left over (1) to Not enough to makeends meet (3)
Negative religious coping
During and after life’s most stressfulevents, I tend to:
1. feel God is punishing me for my sinsor lack of spirituality.
2. wonder whether God hasabandoned me.
Likert style, reversed: A great deal (1) to Not at all (5)α = 0.71
Children 2022, 9, 452 5 of 20
Table 1. Cont.
Neighborhood safety
1. How safe is it to walk around alonein (child’s name)’s neighborhoodafter dark? Is it:
Likert style: Completely safe (1) to Extremely dangerous (4)
Family immigration concerns
1. Do you have concerns or worriesabout immigration issues for you oranyone close to you?
Likert style: A lot (1) to Not at all (4)
Stressful events, during the 12 monthspreconception
1. A close family member was verysick and had to go into the hospital;
2. I had to take care of a seriously ill ordisabled member of the family;
3. One of (child’s name)’s parents orguardians died;
4. Someone else very close to me died;5. I separated or got divorced from my
husband or partner;6. I was apart from my partner due to
military deployment or extendedwork-related travel;
7. I argued with my partner more thanusual;
8. My partner was unfaithful to me;9. I had a major disagreement over
child support, custody, or visitation;10. I experienced domestic violence or
unwanted sexual contact;11. I had serious problems with a family
member or close friend;12. My partner or I went to jail;13. I lived with someone who was
mentally ill or suicidal, or severelydepressed or abusing drugs oralcohol for more than a couple ofweeks;
14. I had major difficulties findingappropriate child care or day care;
15. I did not have a job for 3 months orlonger when I wanted to beworking;
16. I was robbed or my homeburglarized;
17. My partner lost their job;18. I lost my job;19. My partner or I had a cut in work
hours or pay;20. Someone else in my household was
unemployed and looking for workfor longer than 3 months;
21. I had problems paying the rent,mortgage, or other bills;
22. I sometimes went without seeing adoctor because I could not pay thebill;
23. I was homeless or had to sleepoutside, in a car, in a shelter, or insomebody else’s house;
24. There were times when I neededday care or babysitting but did nothave money to pay it;
25. I needed basic items for my child(e.g., diapers) but did not havemoney to pay for them;
26. The food I bought didn’t last and Ididn’t have money to get more.
No (0), Yes (1) responses; summed to create a count score.

Children 2022, 9, 452 6 of 20
Table 1. Cont.
Stressful events, during pregnancy
Same as above.
Stressful events, since child was born
Same as above.
Parent adverse childhood events
Looking back before you were 18 years ofage:
1. Did you live with anyone who wasdepressed, mentally ill, or suicidal?
2. Did you live with anyone who was aproblem drinker or alcoholic, orwho used street drugs or abusedprescription medications?
3. Did you live with anyone whoserved time or was sentenced toserve time in a prison, jail, or othercorrectional facility?
4. Were your parents separated ordivorced?
5. Did your parents or other adults inyour home ever slap, hit, kick,punch or beat each other, or yoursibling(s)?
6. Did a parent or adult in your homeever hit, beat, kick, or physicallyhurt you in any way? Do notinclude spanking.
7. Did a parent or adult in your homeever swear at you, insult you, or putyou down?
8. Did anyone at least 5 years olderthan you or an adult, ever touch yousexually, or try to make you touchthem sexually, or force you to havesex?
Yes, No; summed to create a count score.
2.2.2. Cumulative Resources Inventory
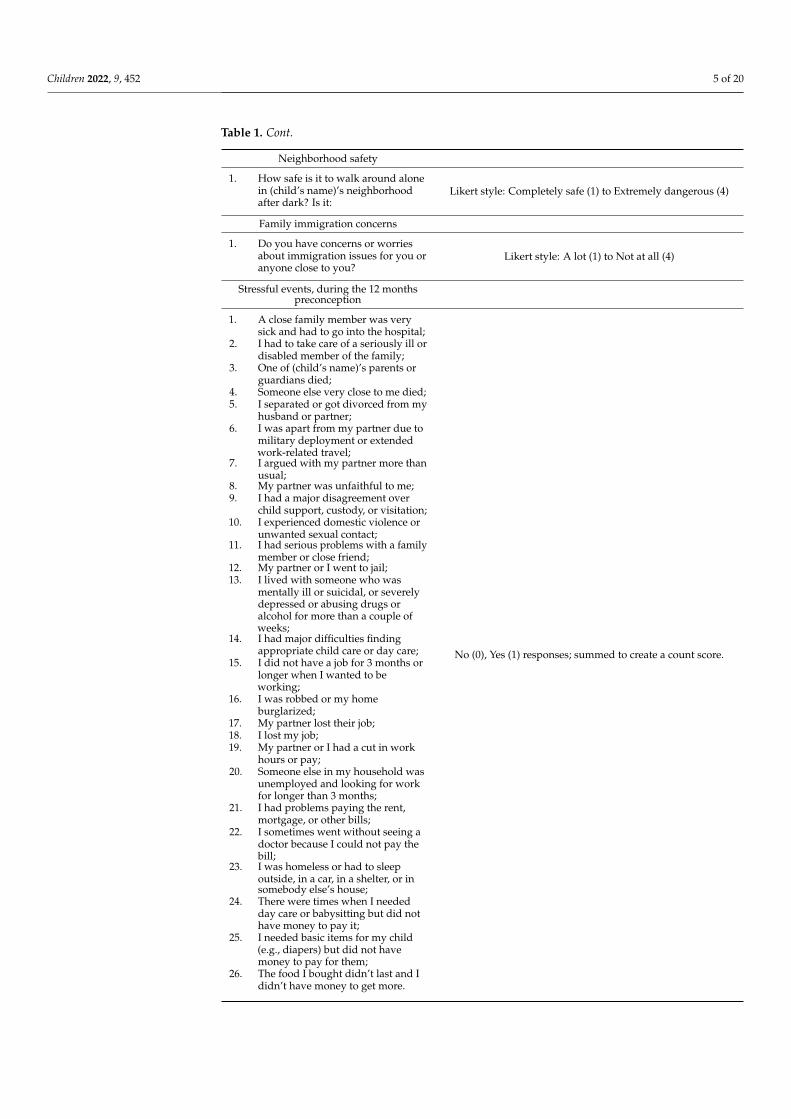
The cumulative resources inventory included 11 indicators created from the itemslisted in Table 2. The indicators for resources included measures of: (1) social connec-tions (3 Likert-style items); (2) social support (4 count items, modified from a variety ofscales [34–36]); (3) resilience (4 Likert-style items); (4) positive religious coping (2 Likert-style items); (5) purpose in life (3 Likert-style items); (6) self-esteem (4 Likert-style items);(7) mastery (4 Likert-style items); (8) optimism (3 Likert-style items); (9) conscientiousness(4 Likert-style items); (10) family functioning (6 Likert-style items); (11) child routines(e.g., regular bedtime, frequent family dinners (2 count items; items developed for thissurvey); and (12) partner support (3 Likert-style items) [37]. Table A2 presents the correla-tions between the protective factors, means, standard deviations, ranges, thresholds fordichotomization for use in the composite score (typically, the top quartile for continuousscores), and Cronbach’s alpha (when appropriate). To create the cumulative resourcesinventory score, we summed across the 12 indicators described above to create a contin-uous score. From this continuous score, we also created a quartile variable to examinegraded patterns.
Children 2022, 9, 452 7 of 20
Table 2. Measures of Resources and Protective Factors.
Social Connections
1. Talk on the phone, text, or get togetherwith family, friends, or neighbors
2. Attend church or religious services3. Attend meetings of any other groups,
clubs, or organizations
Likert scale: Never/less than once per week (1) toDaily/almost every day (5)
α = 0.27
Social relationships
How many close friends or relatives do youhave:
1. who you could tell your deepestthoughts and feelings?
2. who you could turn to when you needhelp with your children?
3. who you could count on to loan you$200 if you needed it?
4. who would provide you with a placeto live if you needed it?
4 categories: 0, 1–2, 3–5, 6 or more.α = 0.85
Resilience
During and after life’s most stressful events,I tend to:1. find a way to do what’s necessary to
carry on.2. know I will bounce back.3. learn important and useful life lessons.4. practice ways to handle things better
next time.
Likert scale: A great deal (1) to Not at All (5)α = 0.80
Positive religious coping
During and after life’s most stressful events,I tend to:1. work together with God as partners.2. look to God for strength, support, and
guidance.
Likert scale, reversed: A great deal (1) to Not at all (5)α = 0.95
Purpose in life
1. I have trouble finding peace of mind.2. I have a sense of direction and
purpose in life.3. When I think about it, I’m not so sure
that my life adds up to much.
Likert Scale: Strongly agree (1) to Disagree strongly (4)α = 0.56
Self-esteem
1. I take a positive attitude towardmyself.
2. On the whole, I am satisfied withmyself.
3. I certainly feel useless at times.4. At times I think I am no good at all.
Likert Scale: Strongly agree (1) to Disagree strongly (4)α = 0.71
Mastery
1. I can do just about anything I really setmy mind to.
2. When I really want to do something, Iusually find a way to succeed at it.
3. Whether or not I am able to get what Iwant is in my own hands.
4. What happens to me in the futuremostly depends on me.
Likert Scale: Strongly agree (1) to Disagree strongly (4)α = 0.75
Children 2022, 9, 452 8 of 20
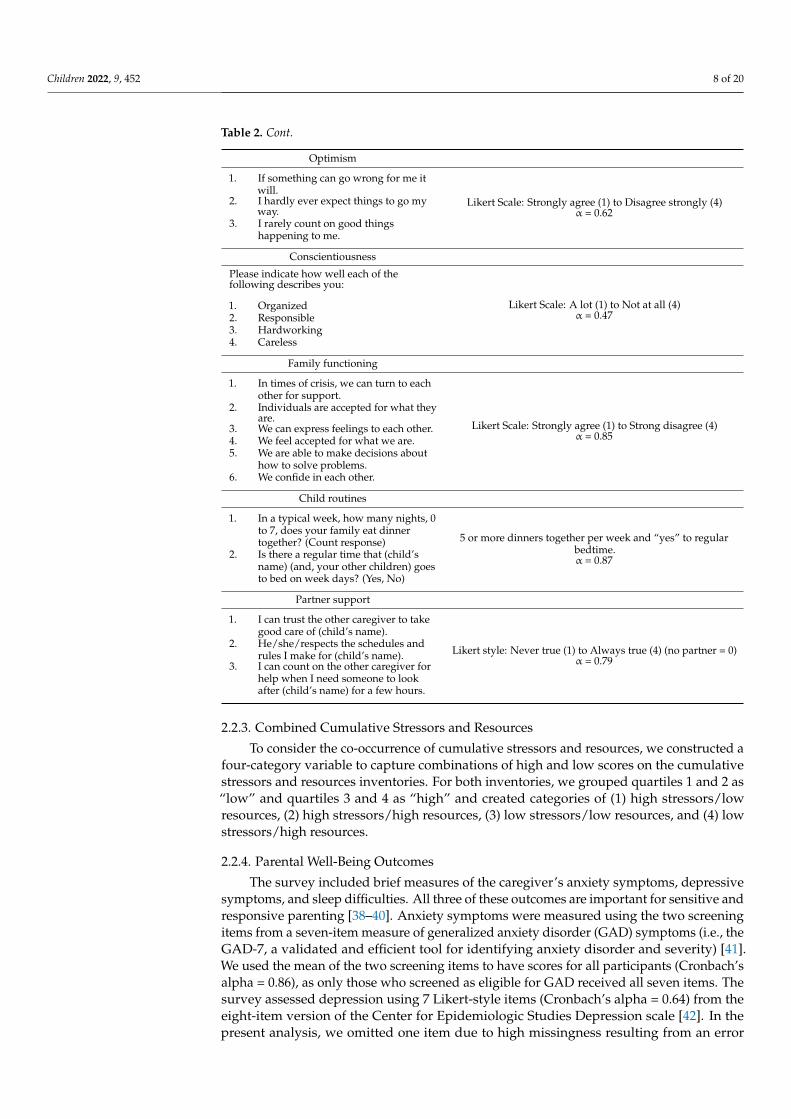
Table 2. Cont.
Optimism
1. If something can go wrong for me itwill.
2. I hardly ever expect things to go myway.
3. I rarely count on good thingshappening to me.
Likert Scale: Strongly agree (1) to Disagree strongly (4)α = 0.62
Conscientiousness
Please indicate how well each of thefollowing describes you:
1. Organized2. Responsible3. Hardworking4. Careless
Likert Scale: A lot (1) to Not at all (4)α = 0.47
Family functioning
1. In times of crisis, we can turn to eachother for support.
2. Individuals are accepted for what theyare.
3. We can express feelings to each other.4. We feel accepted for what we are.5. We are able to make decisions about
how to solve problems.6. We confide in each other.
Likert Scale: Strongly agree (1) to Strong disagree (4)α = 0.85
Child routines
1. In a typical week, how many nights, 0to 7, does your family eat dinnertogether? (Count response)
2. Is there a regular time that (child’sname) (and, your other children) goesto bed on week days? (Yes, No)
5 or more dinners together per week and “yes” to regularbedtime.α = 0.87
Partner support
1. I can trust the other caregiver to takegood care of (child’s name).
2. He/she/respects the schedules andrules I make for (child’s name).
3. I can count on the other caregiver forhelp when I need someone to lookafter (child’s name) for a few hours.
Likert style: Never true (1) to Always true (4) (no partner = 0)α = 0.79
2.2.3. Combined Cumulative Stressors and Resources
To consider the co-occurrence of cumulative stressors and resources, we constructed afour-category variable to capture combinations of high and low scores on the cumulativestressors and resources inventories. For both inventories, we grouped quartiles 1 and 2 as“low” and quartiles 3 and 4 as “high” and created categories of (1) high stressors/lowresources, (2) high stressors/high resources, (3) low stressors/low resources, and (4) lowstressors/high resources.
2.2.4. Parental Well-Being Outcomes
The survey included brief measures of the caregiver’s anxiety symptoms, depressivesymptoms, and sleep difficulties. All three of these outcomes are important for sensitive andresponsive parenting [38–40]. Anxiety symptoms were measured using the two screeningitems from a seven-item measure of generalized anxiety disorder (GAD) symptoms (i.e., theGAD-7, a validated and efficient tool for identifying anxiety disorder and severity) [41].We used the mean of the two screening items to have scores for all participants (Cronbach’salpha = 0.86), as only those who screened as eligible for GAD received all seven items. Thesurvey assessed depression using 7 Likert-style items (Cronbach’s alpha = 0.64) from theeight-item version of the Center for Epidemiologic Studies Depression scale [42]. In thepresent analysis, we omitted one item due to high missingness resulting from an error
Children 2022, 9, 452 9 of 20
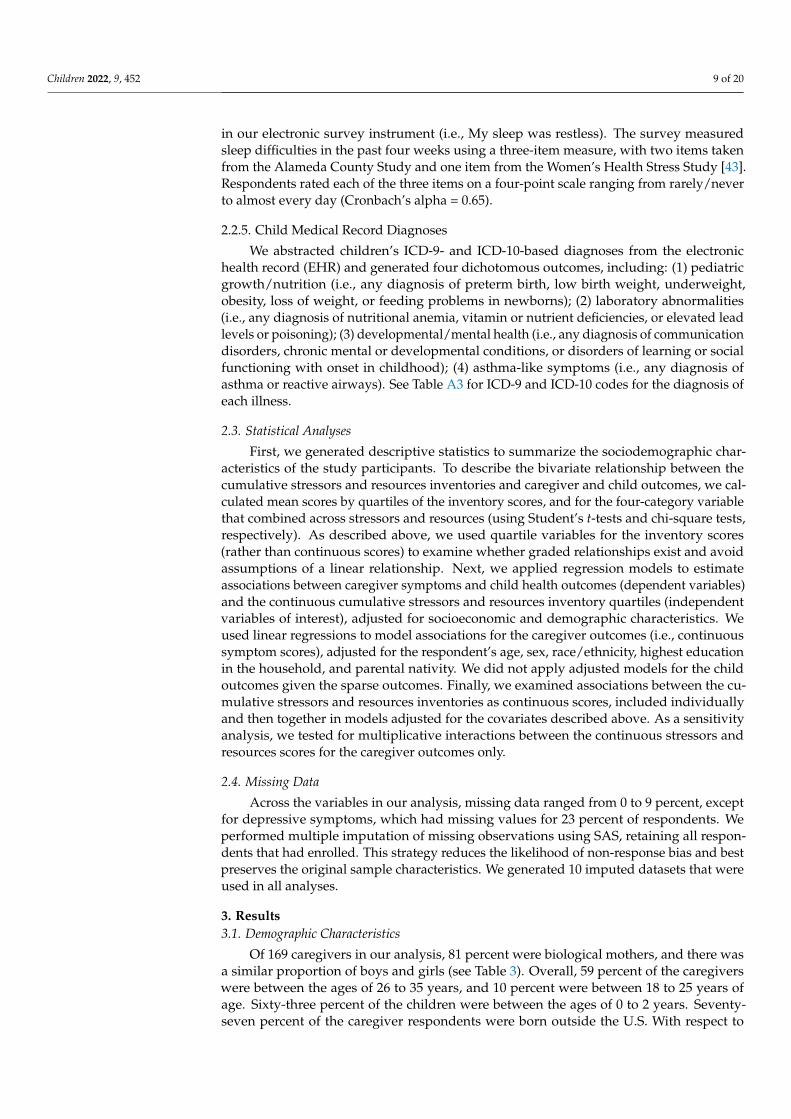
in our electronic survey instrument (i.e., My sleep was restless). The survey measuredsleep difficulties in the past four weeks using a three-item measure, with two items takenfrom the Alameda County Study and one item from the Women’s Health Stress Study [43].Respondents rated each of the three items on a four-point scale ranging from rarely/neverto almost every day (Cronbach’s alpha = 0.65).
2.2.5. Child Medical Record Diagnoses
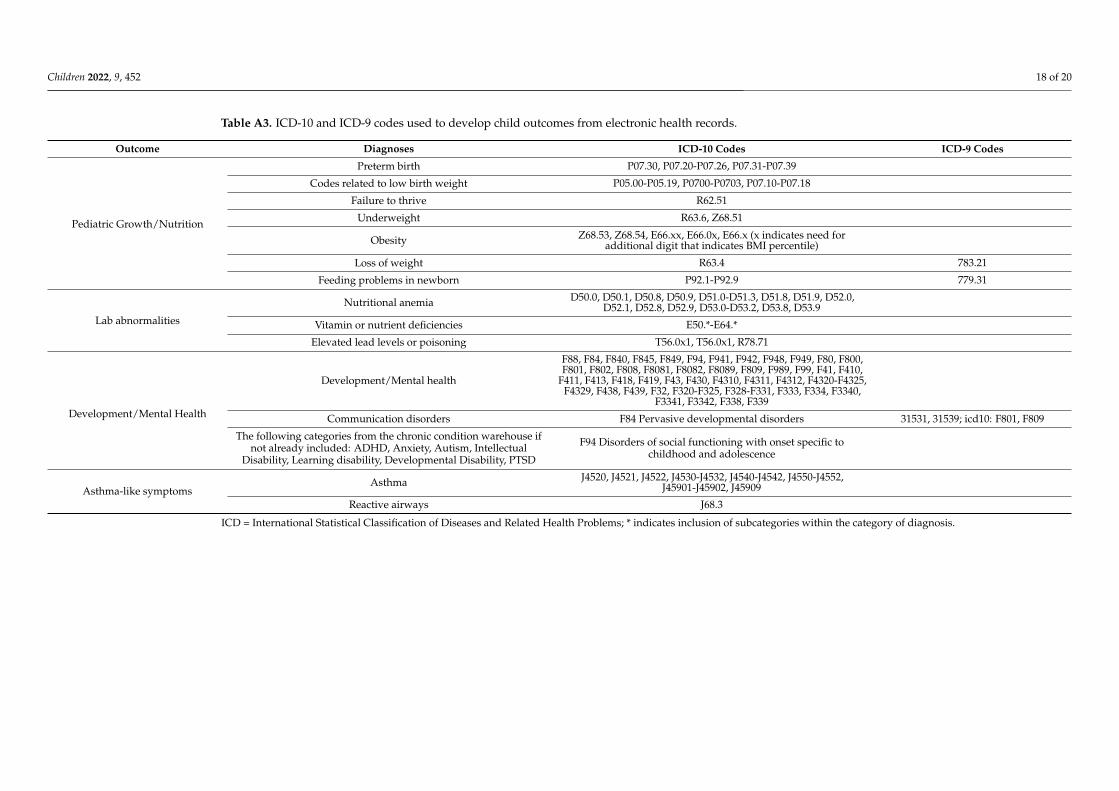
We abstracted children’s ICD-9- and ICD-10-based diagnoses from the electronichealth record (EHR) and generated four dichotomous outcomes, including: (1) pediatricgrowth/nutrition (i.e., any diagnosis of preterm birth, low birth weight, underweight,obesity, loss of weight, or feeding problems in newborns); (2) laboratory abnormalities(i.e., any diagnosis of nutritional anemia, vitamin or nutrient deficiencies, or elevated leadlevels or poisoning); (3) developmental/mental health (i.e., any diagnosis of communicationdisorders, chronic mental or developmental conditions, or disorders of learning or socialfunctioning with onset in childhood); (4) asthma-like symptoms (i.e., any diagnosis ofasthma or reactive airways). See Table A3 for ICD-9 and ICD-10 codes for the diagnosis ofeach illness.
2.3. Statistical Analyses
First, we generated descriptive statistics to summarize the sociodemographic char-acteristics of the study participants. To describe the bivariate relationship between thecumulative stressors and resources inventories and caregiver and child outcomes, we cal-culated mean scores by quartiles of the inventory scores, and for the four-category variablethat combined across stressors and resources (using Student’s t-tests and chi-square tests,respectively). As described above, we used quartile variables for the inventory scores(rather than continuous scores) to examine whether graded relationships exist and avoidassumptions of a linear relationship. Next, we applied regression models to estimateassociations between caregiver symptoms and child health outcomes (dependent variables)and the continuous cumulative stressors and resources inventory quartiles (independentvariables of interest), adjusted for socioeconomic and demographic characteristics. Weused linear regressions to model associations for the caregiver outcomes (i.e., continuoussymptom scores), adjusted for the respondent’s age, sex, race/ethnicity, highest educationin the household, and parental nativity. We did not apply adjusted models for the childoutcomes given the sparse outcomes. Finally, we examined associations between the cu-mulative stressors and resources inventories as continuous scores, included individuallyand then together in models adjusted for the covariates described above. As a sensitivityanalysis, we tested for multiplicative interactions between the continuous stressors andresources scores for the caregiver outcomes only.
2.4. Missing Data
Across the variables in our analysis, missing data ranged from 0 to 9 percent, exceptfor depressive symptoms, which had missing values for 23 percent of respondents. Weperformed multiple imputation of missing observations using SAS, retaining all respon-dents that had enrolled. This strategy reduces the likelihood of non-response bias and bestpreserves the original sample characteristics. We generated 10 imputed datasets that wereused in all analyses.
3. Results3.1. Demographic Characteristics
Of 169 caregivers in our analysis, 81 percent were biological mothers, and there wasa similar proportion of boys and girls (see Table 3). Overall, 59 percent of the caregiverswere between the ages of 26 to 35 years, and 10 percent were between 18 to 25 years ofage. Sixty-three percent of the children were between the ages of 0 to 2 years. Seventy-seven percent of the caregiver respondents were born outside the U.S. With respect to
Children 2022, 9, 452 10 of 20
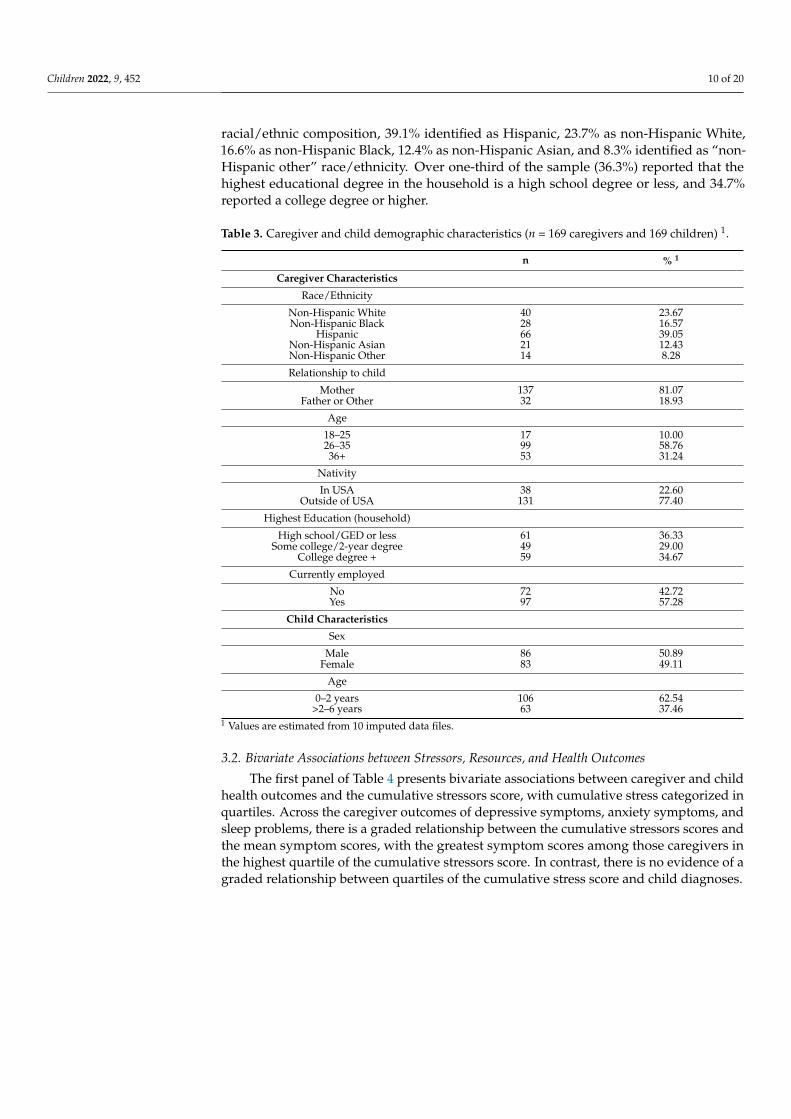
racial/ethnic composition, 39.1% identified as Hispanic, 23.7% as non-Hispanic White,16.6% as non-Hispanic Black, 12.4% as non-Hispanic Asian, and 8.3% identified as “non-Hispanic other” race/ethnicity. Over one-third of the sample (36.3%) reported that thehighest educational degree in the household is a high school degree or less, and 34.7%reported a college degree or higher.
Table 3. Caregiver and child demographic characteristics (n = 169 caregivers and 169 children) 1.
n % 1
Caregiver Characteristics
Race/Ethnicity
Non-Hispanic White 40 23.67Non-Hispanic Black 28 16.57
Hispanic 66 39.05Non-Hispanic Asian 21 12.43Non-Hispanic Other 14 8.28
Relationship to child
Mother 137 81.07Father or Other 32 18.93
Age
18–25 17 10.0026–35 99 58.7636+ 53 31.24
Nativity
In USA 38 22.60Outside of USA 131 77.40
Highest Education (household)
High school/GED or less 61 36.33Some college/2-year degree 49 29.00
College degree + 59 34.67
Currently employed
No 72 42.72Yes 97 57.28
Child Characteristics
Sex
Male 86 50.89Female 83 49.11
Age
0–2 years 106 62.54>2–6 years 63 37.46
1 Values are estimated from 10 imputed data files.
3.2. Bivariate Associations between Stressors, Resources, and Health Outcomes
The first panel of Table 4 presents bivariate associations between caregiver and childhealth outcomes and the cumulative stressors score, with cumulative stress categorized inquartiles. Across the caregiver outcomes of depressive symptoms, anxiety symptoms, andsleep problems, there is a graded relationship between the cumulative stressors scores andthe mean symptom scores, with the greatest symptom scores among those caregivers inthe highest quartile of the cumulative stressors score. In contrast, there is no evidence of agraded relationship between quartiles of the cumulative stress score and child diagnoses.
Children 2022, 9, 452 11 of 20
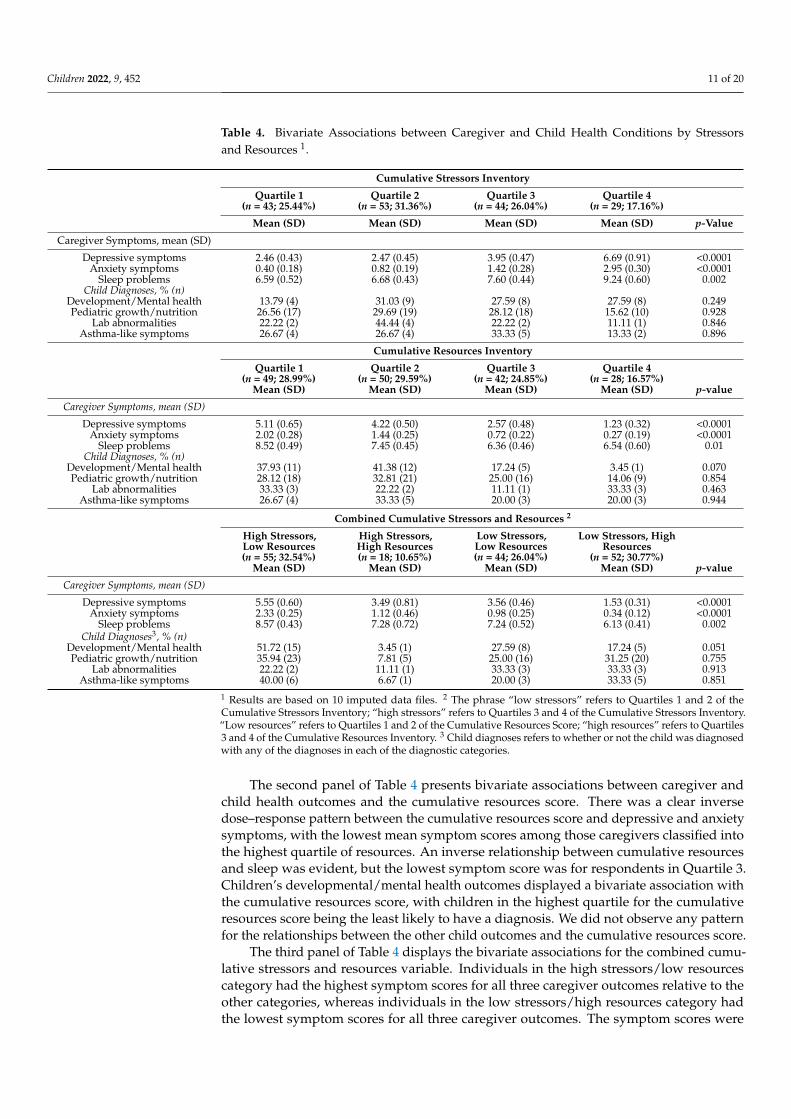
Table 4. Bivariate Associations between Caregiver and Child Health Conditions by Stressorsand Resources 1.
Cumulative Stressors Inventory
Quartile 1(n = 43; 25.44%)
Quartile 2(n = 53; 31.36%)
Quartile 3(n = 44; 26.04%)
Quartile 4(n = 29; 17.16%)
Mean (SD) Mean (SD) Mean (SD) Mean (SD) p-Value
Caregiver Symptoms, mean (SD)
Depressive symptoms 2.46 (0.43) 2.47 (0.45) 3.95 (0.47) 6.69 (0.91) <0.0001Anxiety symptoms 0.40 (0.18) 0.82 (0.19) 1.42 (0.28) 2.95 (0.30) <0.0001
Sleep problems 6.59 (0.52) 6.68 (0.43) 7.60 (0.44) 9.24 (0.60) 0.002Child Diagnoses, % (n)
Development/Mental health 13.79 (4) 31.03 (9) 27.59 (8) 27.59 (8) 0.249Pediatric growth/nutrition 26.56 (17) 29.69 (19) 28.12 (18) 15.62 (10) 0.928
Lab abnormalities 22.22 (2) 44.44 (4) 22.22 (2) 11.11 (1) 0.846Asthma-like symptoms 26.67 (4) 26.67 (4) 33.33 (5) 13.33 (2) 0.896
Cumulative Resources Inventory
Quartile 1(n = 49; 28.99%)
Quartile 2(n = 50; 29.59%)
Quartile 3(n = 42; 24.85%)
Quartile 4(n = 28; 16.57%)
Mean (SD) Mean (SD) Mean (SD) Mean (SD) p-value
Caregiver Symptoms, mean (SD)
Depressive symptoms 5.11 (0.65) 4.22 (0.50) 2.57 (0.48) 1.23 (0.32) <0.0001Anxiety symptoms 2.02 (0.28) 1.44 (0.25) 0.72 (0.22) 0.27 (0.19) <0.0001
Sleep problems 8.52 (0.49) 7.45 (0.45) 6.36 (0.46) 6.54 (0.60) 0.01Child Diagnoses, % (n)
Development/Mental health 37.93 (11) 41.38 (12) 17.24 (5) 3.45 (1) 0.070Pediatric growth/nutrition 28.12 (18) 32.81 (21) 25.00 (16) 14.06 (9) 0.854
Lab abnormalities 33.33 (3) 22.22 (2) 11.11 (1) 33.33 (3) 0.463Asthma-like symptoms 26.67 (4) 33.33 (5) 20.00 (3) 20.00 (3) 0.944
Combined Cumulative Stressors and Resources 2
High Stressors,Low Resources(n = 55; 32.54%)
High Stressors,High Resources(n = 18; 10.65%)
Low Stressors,Low Resources(n = 44; 26.04%)
Low Stressors, HighResources
(n = 52; 30.77%)Mean (SD) Mean (SD) Mean (SD) Mean (SD) p-value
Caregiver Symptoms, mean (SD)
Depressive symptoms 5.55 (0.60) 3.49 (0.81) 3.56 (0.46) 1.53 (0.31) <0.0001Anxiety symptoms 2.33 (0.25) 1.12 (0.46) 0.98 (0.25) 0.34 (0.12) <0.0001
Sleep problems 8.57 (0.43) 7.28 (0.72) 7.24 (0.52) 6.13 (0.41) 0.002Child Diagnoses3, % (n)
Development/Mental health 51.72 (15) 3.45 (1) 27.59 (8) 17.24 (5) 0.051Pediatric growth/nutrition 35.94 (23) 7.81 (5) 25.00 (16) 31.25 (20) 0.755
Lab abnormalities 22.22 (2) 11.11 (1) 33.33 (3) 33.33 (3) 0.913Asthma-like symptoms 40.00 (6) 6.67 (1) 20.00 (3) 33.33 (5) 0.851
1 Results are based on 10 imputed data files. 2 The phrase “low stressors” refers to Quartiles 1 and 2 of theCumulative Stressors Inventory; “high stressors” refers to Quartiles 3 and 4 of the Cumulative Stressors Inventory.“Low resources” refers to Quartiles 1 and 2 of the Cumulative Resources Score; “high resources” refers to Quartiles3 and 4 of the Cumulative Resources Inventory. 3 Child diagnoses refers to whether or not the child was diagnosedwith any of the diagnoses in each of the diagnostic categories.
The second panel of Table 4 presents bivariate associations between caregiver andchild health outcomes and the cumulative resources score. There was a clear inversedose–response pattern between the cumulative resources score and depressive and anxietysymptoms, with the lowest mean symptom scores among those caregivers classified intothe highest quartile of resources. An inverse relationship between cumulative resourcesand sleep was evident, but the lowest symptom score was for respondents in Quartile 3.Children’s developmental/mental health outcomes displayed a bivariate association withthe cumulative resources score, with children in the highest quartile for the cumulativeresources score being the least likely to have a diagnosis. We did not observe any patternfor the relationships between the other child outcomes and the cumulative resources score.
The third panel of Table 4 displays the bivariate associations for the combined cumu-lative stressors and resources variable. Individuals in the high stressors/low resourcescategory had the highest symptom scores for all three caregiver outcomes relative to theother categories, whereas individuals in the low stressors/high resources category hadthe lowest symptom scores for all three caregiver outcomes. The symptom scores were

Children 2022, 9, 452 12 of 20
relatively similar for individuals categorized in the high stressors/low resources and lowstressors/high resources groups. We observed an association between the combined cu-mulative stressors and resources variable and children’s developmental/mental healthoutcomes, with over half of children (51.7%) who had this diagnosis categorized within the“high stressors/low resources” group; however, we did not observe patterns between thiscombined variable and the other child diagnostic outcomes.
3.3. Adjusted Associations between Stressors, Protective Factors, and Health Outcomes
Table 5 presents the results of adjusted models for caregiver symptoms. Relative toindividuals in the lowest cumulative stressors quartile (i.e., lowest stressors category),caregivers in the highest quartile displayed elevated depressive (β = 4.06, 95% ConfidenceInterval (CI): 2.09, 6.01) and anxiety (β = 2.63, 95% CI: 1.88, 3.38) symptoms and sleepproblems (β = 2.65, 95% CI: 0.96, 4.34). The cumulative resources inventory also displayedan inverse graded association with depressive and anxiety symptoms in the adjusted model.In the comparison of symptoms scores for Quartile 1 to Quartile 4, individuals in Quartile4 showed lower depressive (β = −3.93, 95% CI: −5.46, −2.40) and anxiety (β = −1.91,95% CI: −2.62, −1.20) symptoms and sleep problems (β = −1.96, 95% CI: −3.51, −0.40),of a slightly smaller magnitude to that observed for the comparison between Quartiles1 and 4 for the stressors inventory. Finally, in the models that consider the combinationof cumulative stressors and resources, relative to individuals with low stressors and highresources, caregivers with high stressors/low resources displayed elevated depressive(β = 3.84, 95% CI: 2.45, 5.19) and anxiety symptoms (β = 2.01, 95% CI: 1.41, 2.60) and sleepproblems (β = 2.32, 95% CI: 1.05, 3.61).
Table 5. Adjusted linear regression models to estimate the associations between stressors andresources inventories and caregiver outcomes (n = 169) 1.
DepressionSymptoms
AnxietySymptoms
SleepProblems
β (SE) β (SE) β (SE)
Cumulative Stressors Inventory
Quartile 1 Reference Reference ReferenceQuartile 2 0.08 (0.65) 0.46 (0.27) 0.17 (0.68)Quartile 3 1.54 (0.66) * 0.99 (0.35) ** 0.86 (0.72)Quartile 4 4.06 (0.96) *** 2.63 (0.39) *** 2.65 (0.85) **
Cumulative Resources Inventory
Quartile 1 Reference Reference ReferenceQuartile 2 −0.91 (0.69) −0.69 (0.36) −1.04 (0.71)Quartile 3 −2.27 (0.80) ** −1.38 (0.37) *** −2.10 (0.74) **Quartile 4 −3.93 (0.76) *** −1.91 (0.36) *** −1.96 (0.79) *
Combined Cumulative Stressorsand Resources 2
Low Stressors, High Resources Reference Reference ReferenceLow Stressors, Low Resources 1.82 (0.65) ** 0.74 (0.30) * 1.12 (0.69)
High Stressors, High Resources 1.88 (0.90) * 0.83 (0.49) 1.24 (0.90)High Stressors, Low Resources 3.84 (0.67) *** 2.01 (0.30) *** 2.32 (0.65) ***
SE = standard error; * <0.05, ** <0.01, *** <0.0001. 1 Results are based on 10 imputed data files; linear regressionmodels adjusted for caregiver’s age, race/ethnicity and nativity, and highest educational level in the household.2 The phrase “low stressors” refers to Quartiles 1 and 2 of the Cumulative Stressors Inventory; “high stressors”refers to Quartiles 3 and 4 of the Cumulative Stressors Inventory. “Low resources” refers to Quartiles 1 and 2 of theCumulative Resources Score; “high resources” refers to Quartiles 3 and 4 of the Cumulative Resources Inventory.
Finally, in Table 6, we present associations between the continuous stressors andresources inventory scores and caregiver outcomes, with the stressors and resources scoresincluded individually (Model 1), and then together (Model 2), in adjusted models. For
Children 2022, 9, 452 13 of 20
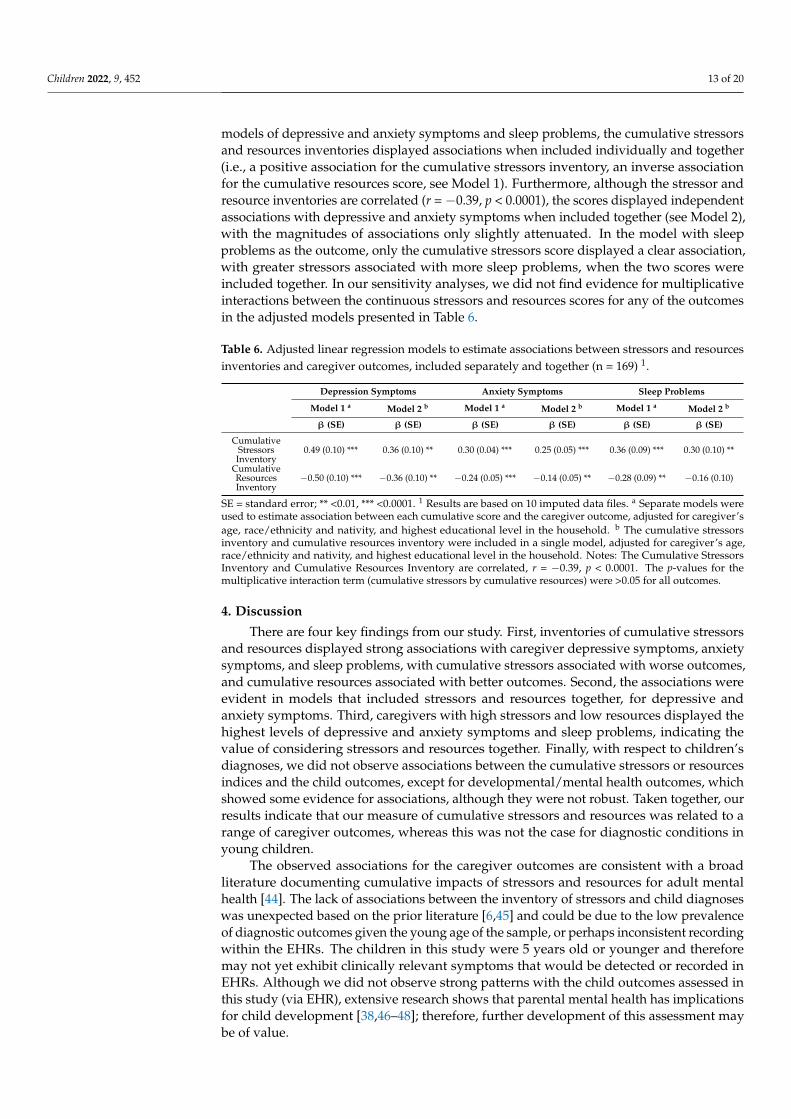
models of depressive and anxiety symptoms and sleep problems, the cumulative stressorsand resources inventories displayed associations when included individually and together(i.e., a positive association for the cumulative stressors inventory, an inverse associationfor the cumulative resources score, see Model 1). Furthermore, although the stressor andresource inventories are correlated (r = −0.39, p < 0.0001), the scores displayed independentassociations with depressive and anxiety symptoms when included together (see Model 2),with the magnitudes of associations only slightly attenuated. In the model with sleepproblems as the outcome, only the cumulative stressors score displayed a clear association,with greater stressors associated with more sleep problems, when the two scores wereincluded together. In our sensitivity analyses, we did not find evidence for multiplicativeinteractions between the continuous stressors and resources scores for any of the outcomesin the adjusted models presented in Table 6.
Table 6. Adjusted linear regression models to estimate associations between stressors and resourcesinventories and caregiver outcomes, included separately and together (n = 169) 1.
Depression Symptoms Anxiety Symptoms Sleep Problems
Model 1 a Model 2 b Model 1 a Model 2 b Model 1 a Model 2 b
β (SE) β (SE) β (SE) β (SE) β (SE) β (SE)
CumulativeStressorsInventory
0.49 (0.10) *** 0.36 (0.10) ** 0.30 (0.04) *** 0.25 (0.05) *** 0.36 (0.09) *** 0.30 (0.10) **
CumulativeResourcesInventory
−0.50 (0.10) *** −0.36 (0.10) ** −0.24 (0.05) *** −0.14 (0.05) ** −0.28 (0.09) ** −0.16 (0.10)
SE = standard error; ** <0.01, *** <0.0001. 1 Results are based on 10 imputed data files. a Separate models wereused to estimate association between each cumulative score and the caregiver outcome, adjusted for caregiver’sage, race/ethnicity and nativity, and highest educational level in the household. b The cumulative stressorsinventory and cumulative resources inventory were included in a single model, adjusted for caregiver’s age,race/ethnicity and nativity, and highest educational level in the household. Notes: The Cumulative StressorsInventory and Cumulative Resources Inventory are correlated, r = −0.39, p < 0.0001. The p-values for themultiplicative interaction term (cumulative stressors by cumulative resources) were >0.05 for all outcomes.
4. Discussion
There are four key findings from our study. First, inventories of cumulative stressorsand resources displayed strong associations with caregiver depressive symptoms, anxietysymptoms, and sleep problems, with cumulative stressors associated with worse outcomes,and cumulative resources associated with better outcomes. Second, the associations wereevident in models that included stressors and resources together, for depressive andanxiety symptoms. Third, caregivers with high stressors and low resources displayed thehighest levels of depressive and anxiety symptoms and sleep problems, indicating thevalue of considering stressors and resources together. Finally, with respect to children’sdiagnoses, we did not observe associations between the cumulative stressors or resourcesindices and the child outcomes, except for developmental/mental health outcomes, whichshowed some evidence for associations, although they were not robust. Taken together, ourresults indicate that our measure of cumulative stressors and resources was related to arange of caregiver outcomes, whereas this was not the case for diagnostic conditions inyoung children.
The observed associations for the caregiver outcomes are consistent with a broadliterature documenting cumulative impacts of stressors and resources for adult mentalhealth [44]. The lack of associations between the inventory of stressors and child diagnoseswas unexpected based on the prior literature [6,45] and could be due to the low prevalenceof diagnostic outcomes given the young age of the sample, or perhaps inconsistent recordingwithin the EHRs. The children in this study were 5 years old or younger and thereforemay not yet exhibit clinically relevant symptoms that would be detected or recorded inEHRs. Although we did not observe strong patterns with the child outcomes assessed inthis study (via EHR), extensive research shows that parental mental health has implicationsfor child development [38,46–48]; therefore, further development of this assessment maybe of value.
Children 2022, 9, 452 14 of 20
The current study builds on a variety of studies that have examined individual typesof parental or family characteristics in relation to outcomes in young children and theirparents (e.g., parental adverse childhood experiences [45], economic strain [49], discrimina-tion [50], and optimism [51]). Our study included comprehensive assessments of both riskand protective factors, and we contribute to a growing research area to briefly yet systemat-ically assess social and contextual factors that are important to health and well-being inchildren [21] and adults [52].
While interpreting the results from this study, it is important to consider several limi-tations. First, the cross-sectional design limited our ability to study the temporal orderingbetween our study variables, and therefore, this study is not designed to make causalinferences. Second, all child health outcomes were derived from EHRs, which could beincomplete and did not allow for the examination of continuous symptom scores, whichmay be ideal for young children such as those in this study. More subtle emerging devel-oping deviations (e.g., fear, behavioral problems in preschool or at home, inadaptabilityto routine changes, etc.) may not be captured by most pediatric assessments or diagnoses.Third, the survey information was linked to the child’s EHR, which contains diagnosessince birth, meaning our analyses cannot document temporal ordering for either child oradult health outcomes. Fourth, all measures of stressors and resources relied on relativelybrief caregiver self-reports, and negative experiences may be under-reported, or positiveexperiences or attributes could be inflated. Fifth, given the design for this pilot study,which relied on convenience sampling, the sample is small and susceptible to selection bias.Finally, we conducted multiple tests because we had three caregiver outcomes and fourchild outcomes; however, given the sample size of this pilot study, we were not able toadjust for multiple comparisons.
Notably, this study also has several strengths, including (1) the unique communityhealth clinic sample primarily comprised of racial/ethnic minorities and immigrants; (2) thetranslation of the survey into four languages to facilitate inclusion of non-English speakingfamilies; and (3) the inclusion of numerous reliable and valid brief measures to comprisecomprehensive inventories of stressors and resources, in line with the accumulation model,which is supported by the child development literature. In future research, it is importantto examine the utility of this measure and other measures of cumulative stressors andresources, within longitudinal study designs that include repeated measures of childdevelopment. In addition, it will be informative to consider a broader range of outcomes inyoung children, beyond diagnostic conditions, including sleep [53], potential biomarkersof stressors [54,55], and child wellbeing outcomes [56,57] (e.g., happiness, self-esteem, andprosocial behaviors).
In conclusion, our study has documented clear associations between stressors andresources and parental outcomes, and these results are complemented by other studiesshowing the importance of parental wellbeing for optimal child development [58]. Futurestudies are needed to develop concise stressors and resources inventories using largersamples across a range of contexts, and these measures should be evaluated in relationto prospectively assessed measures of child well-being and symptomatology. This line ofresearch holds promise for advancing the understanding of social determinants of healthdisparities for parents and children and informing interventions to prevent the emergenceof health disparities.
Author Contributions: Conceptualization, N.S., B.L.C., C.G.C., D.A.G., N.P., E.W. and D.R.W.; Formalanalysis, N.S., J.W.M., and M.W.F.; Funding acquisition, B.L.C., S.K. and D.R.W.; Methodology, N.S.,B.L.C., M.W.F., C.M., C.G.C., D.A.G., N.P., E.W. and D.R.W.; Project administration, S.K., E.L., M.M.,and N.M.T.; Resources, B.L.C.; Supervision, B.L.C.; Writing—original draft, N.S.; Writing—reviewand editing, B.L.C., J.W.M., C.M., C.G.C., D.A.G., N.P., E.W., S.K., E.L., M.M., N.M.T., and D.R.W. Allauthors have read and agreed to the published version of the manuscript.
Funding: This research was supported by the W.K. Kellogg Foundation, grant number P0131281.

Children 2022, 9, 452 15 of 20
Institutional Review Board Statement: The Institutional Review Board at Cambridge Health Al-liance approved the study.
Informed Consent Statement: Not applicable.
Acknowledgments: We thank the patients, families, providers, and staff of the study’s affiliatedcommunity health center. We also thank members of the Health Equity Lab at Cambridge HealthAlliance for their contributions to data collection.
Conflicts of Interest: The authors declare no conflict of interest.
Children 2022, 9, 452 16 of 20
Appendix A
Table A1. Correlation and Descriptive Statistics for Stressor Measures, original data (prior to multiple imputation).
Variables 1 2 3 4 5 6 7 8 9 10 11 12 13 14 15 16
1. Perceived stress, past 12 months 1.00 0.16 0.28 0.32 0.26 0.16 0.18 0.18 0.14 0.07 0.04 0.06 0.15 −0.05 0.08 0.082. Major life events 0.16 1.00 0.32 0.22 0.28 0.25 0.33 0.08 0.07 0.10 0.05 0.03 0.08 0.17 0.07 0.17
3. Everyday discrimination 0.28 0.32 1.00 0.19 0.11 0.15 0.26 0.18 0.12 −0.06 0.22 0.29 0.06 0.14 0.16 −0.014. Stressful events, since birth of child 0.32 0.22 0.19 1.00 0.42 0.38 0.24 0.15 0.26 0.09 0.01 −0.02 0.21 0.04 0.10 0.055. Stressful events, during pregnancy 0.26 0.28 0.11 0.42 1.00 0.51 0.19 0.10 0.19 0.09 0.02 0.01 0.21 −0.07 0.09 0.06
6. Stressful events, year before pregnancy 0.16 0.25 0.15 0.38 0.51 1.00 0.20 0.11 0.13 0.03 −0.03 0.01 0.09 −0.03 0.08 0.047. Adverse childhood experiences 0.18 0.33 0.26 0.24 0.19 0.20 1.00 0.13 0.10 −0.12 0.18 0.15 0.04 −0.04 0.15 0.20
8. Job instability 0.18 0.08 0.18 0.15 0.10 0.11 0.13 1.00 0.20 −0.22 0.07 0.27 0.14 0.04 0.20 −0.039. Residential instability 0.14 0.07 0.12 0.26 0.19 0.13 0.10 0.20 1.00 −0.01 0.19 0.01 0.09 0.05 −0.01 0.12
10. Job schedule instability 0.07 0.10 −0.06 0.09 0.09 0.03 −0.12 −0.22 −0.01 1.00 −0.39 −0.55 0.23 0.06 −0.12 0.1611. Job insecurity 0.04 0.05 0.22 0.01 0.02 −0.03 0.18 0.07 0.19 −0.39 1.00 0.56 −0.11 0.08 0.04 −0.01
12. Work family conflict 0.06 0.03 0.29 −0.02 0.01 0.01 0.15 0.27 0.01 −0.55 0.56 1.00 −0.04 0.08 0.16 −0.0413. Financial strain 0.15 0.08 0.06 0.21 0.21 0.09 0.04 0.14 0.09 0.23 −0.11 −0.04 1.00 0.08 0.06 0.05
14. Negative religious coping −0.05 0.17 0.14 0.04 −0.07 −0.03 −0.04 0.04 0.05 0.06 0.08 0.08 0.08 1.00 0.02 −0.0815. Unsafe neighborhood 0.08 0.07 0.16 0.10 0.09 0.08 0.15 0.20 −0.01 −0.12 0.04 0.16 0.06 0.02 1.00 0.0516. Immigration concerns 0.08 0.17 −0.01 0.05 0.06 0.04 0.20 −0.03 0.12 0.16 −0.01 −0.04 0.05 −0.08 0.05 1.00
Sample size 164 165 165 169 169 169 162 147 158 145 168 167 164 165 168 167Mean 1.68 0.53 2.82 2.77 1.97 1.12 1.27 1.20 0.95 0.52 0.40 0.77 0.80 1.59 0.60 0.95
SD 1.09 1.03 3.48 3.65 2.29 1.79 1.72 1.00 1.34 0.50 0.68 0.97 0.65 2.35 0.69 1.15Min 0.00 0.00 0.00 0.00 0.00 0.00 0.00 0.00 0.00 0.00 0.00 0.00 0.00 0.00 0.00 0.00Max 4.00 5.00 19.00 20.00 9.00 9.00 7.00 5.00 11.00 1.00 3.00 3.00 2.00 8.00 3.00 3.00
Highest Quartile Threshold 2.5 1 5 4 3 2 2 2 1 1 1 2 1 3 1 2Percentage of Obs in Highest Quartile 25.0% 29.1% 26.1% 25.1% 38.6% 35.7% 29.6% 32.7% 53.8% 51.7% 30.4% 25.7% 67.1% 27.9% 49.4% 32.3%
Number of items 1 5 5 26 26 26 8 1 1 1 1 1 1 2 1 1Reliability - - 0.82 - - - - - - - - - - 0.71 - -
Bolded associations are significant at p < 0.05.

Children 2022, 9, 452 17 of 20
Table A2. Correlation and Descriptive Statistics for Resources Measures, original data (prior to multiple imputation).
Variables 1 2 3 4 5 6 7 8 9 10 11 12
1. Frequency of social contact 1 −0.0419 0.179673 0.406722 0.272452 0.277569 0.207693 0.252595 0.135476 0.141578 0.132751 0.020492. Social support 0.26 0.13 0.17 −0.04 0.38 0.32 0.09 0.40 0.03 0.28 0.310657 0.116441
3. Resilience score 0.18 −0.08 1 0.28 0.49 0.51 0.40 0.29 0.26 0.31 0.24039 0.0281934. Positive Religious Coping 0.41 −0.09 0.28 1 0.19 0.26 0.12 0.08 0.11 0.15 −0.01159 −0.06827
5. Purpose in life 0.27 0.02 0.49 0.19 1 0.65 0.32 0.49 0.42 0.29 0.181122 0.0656796. Self-esteem 0.28 −0.03 0.51 0.26 0.65 1 0.33 0.40 0.31 0.34 0.205096 0.090047
7. Mastery scale 0.21 −0.10 0.40 0.12 0.32 0.33 1 0.08 0.15 0.27 0.087198 −0.023398. Optimism scale 0.25 −0.03 0.29 0.08 0.49 0.40 0.08 1 0.16 0.15 0.217487 0.042628
9. Conscientiousness scale 0.14 −0.01 0.26 0.11 0.42 0.31 0.15 0.16 1 0.26 0.036122 −0.0081610. Family Assessment Device 0.14 0.11 0.31 0.15 0.29 0.34 0.27 0.15 0.26 1 0.371593 0.079003
11. Trust in other caregiver 0.13 0.11 0.24 −0.01 0.18 0.21 0.09 0.22 0.04 0.37 1.00 0.0812. Child routine indicator 0.02 0.54 0.03 −0.07 0.07 0.09 −0.02 0.04 −0.01 0.08 0.08 1.00
Sample size 163 169 162 167 162 166 161 165 164 166 157 167Mean 7.16 0.80 12.96 6.45 6.80 9.44 9.48 5.47 10.22 10.23 8.26 0.53
SD 2.97 0.40 3.12 2.71 1.98 2.54 2.32 2.37 1.62 2.18 1.48 0.50Min 1.00 0.00 3.00 0.00 1.00 0.00 0.00 0.00 4.00 3.00 0.00 0Max 14.00 1.00 16.00 8.00 9.00 12.00 12.00 9.00 12.00 12.00 9.00 1.00
Highest Quartile Threshold 9 1 16 8 9 12 12 7 12 12 9 1Percentage of Obs in Highest
Quartile 35.0% 29.3% 33.3% 66.5% 32.1% 30.1% 26.1% 33.3% 25.6% 48.2% 71.3% 53.3%
Number of items 3 4 4 2 3 4 4 3 4 4 3 2Reliability 0.27 0.85 0.80 0.96 0.56 0.71 0.75 0.62 0.47 0.85 0.79 0.87
Note: Bolded associations are significant at p < 0.05.
Children 2022, 9, 452 18 of 20
Table A3. ICD-10 and ICD-9 codes used to develop child outcomes from electronic health records.
Outcome Diagnoses ICD-10 Codes ICD-9 Codes
Pediatric Growth/Nutrition
Preterm birth P07.30, P07.20-P07.26, P07.31-P07.39
Codes related to low birth weight P05.00-P05.19, P0700-P0703, P07.10-P07.18
Failure to thrive R62.51
Underweight R63.6, Z68.51
Obesity Z68.53, Z68.54, E66.xx, E66.0x, E66.x (x indicates need foradditional digit that indicates BMI percentile)
Loss of weight R63.4 783.21
Feeding problems in newborn P92.1-P92.9 779.31
Lab abnormalities
Nutritional anemia D50.0, D50.1, D50.8, D50.9, D51.0-D51.3, D51.8, D51.9, D52.0,D52.1, D52.8, D52.9, D53.0-D53.2, D53.8, D53.9
Vitamin or nutrient deficiencies E50.*-E64.*
Elevated lead levels or poisoning T56.0x1, T56.0x1, R78.71
Development/Mental Health
Development/Mental health
F88, F84, F840, F845, F849, F94, F941, F942, F948, F949, F80, F800,F801, F802, F808, F8081, F8082, F8089, F809, F989, F99, F41, F410,
F411, F413, F418, F419, F43, F430, F4310, F4311, F4312, F4320-F4325,F4329, F438, F439, F32, F320-F325, F328-F331, F333, F334, F3340,
F3341, F3342, F338, F339
Communication disorders F84 Pervasive developmental disorders 31531, 31539; icd10: F801, F809
The following categories from the chronic condition warehouse ifnot already included: ADHD, Anxiety, Autism, Intellectual
Disability, Learning disability, Developmental Disability, PTSD
F94 Disorders of social functioning with onset specific tochildhood and adolescence
Asthma-like symptomsAsthma J4520, J4521, J4522, J4530-J4532, J4540-J4542, J4550-J4552,
J45901-J45902, J45909
Reactive airways J68.3
ICD = International Statistical Classification of Diseases and Related Health Problems; * indicates inclusion of subcategories within the category of diagnosis.
Children 2022, 9, 452 19 of 20
References1. National Academies of Sciences Engineering and Medicine. Vibrant and Healthy Kids: Aligning Science, Practice, and Policy to
Advance Health Equity; National Academies Press: Cambridge, MA, USA, 2019.2. Clark, H.; Coll-Seck, A.M.; Banerjee, A.; Peterson, S.; Dalglish, S.L.; Ameratunga, S.; Balabanova, D.; Bhan, M.K.; Bhutta, Z.A.;
Borrazzo, J. A future for the world’s children? A WHO–UNICEF–Lancet Commission. Lancet 2020, 395, 605–658. [PubMed]3. Bronfenbrenner, U.; Morris, P.A. The Bioecological Model of Human Development. In Handbook of Child Psychology; John Wiley &
Sons, Inc.: Hoboken, NJ, USA, 2007.4. Shonkoff, J.P.; Garner, A.S. The Lifelong Effects of Early Childhood Adversity and Toxic Stress. Pediatrics 2012, 129, E232–E246.
[CrossRef]5. Ben-Shlomo, Y.; Kuh, D. A life course approach to chronic disease epidemiology: Conceptual models, empirical challenges and
interdisciplinary perspectives. Int. J. Epidemiol. 2002, 31, 285–293. [CrossRef]6. Evans, G.W.; Li, D.; Sepanski Whipple, S. Cumulative Risk and Child Development. Psychol. Bull. 2013, 139, 1342–1396. [CrossRef]
[PubMed]7. Sameroff, A.J. Environmental Risk Factors in Infancy. Pediatrics 1998, 102, 1287–1292. [CrossRef]8. Rutter, M. Protective factors in children’s responses to stress and disadvantage. In Primary Prevention of Psychopathology; Kent,
W.M., Rolf, J.E., Eds.; University Press of New England: Hanover, NH, USA, 1979; Volume 3, pp. 49–74.9. Turney, K. Cumulative Adverse Childhood Experiences and Children’s Health. Child. Youth Serv. Rev. 2020, 105538. [CrossRef]10. Yamaoka, Y.; Bard, D.E. Positive Parenting Matters in the Face of Early Adversity. Am. J. Prev. Med. 2019, 56, 530–539. [CrossRef]11. Bethell, C.; Jones, J.; Gombojav, N.; Linkenbach, J.; Sege, R. Positive childhood experiences and adult mental and relational health
in a statewide sample: Associations across adverse childhood experiences levels. JAMA Pediatrics 2019, 173, e193007. [CrossRef]12. Sege, R.D.; Browne, C.H. Responding to ACEs with HOPE: Health outcomes from positive experiences. Acad. Pediatrics 2017, 17,
S79–S85. [CrossRef]13. Masten, A.S. Resilience in children threatened by extreme adversity: Frameworks for research, practice, and translational synergy.
Dev. Psychopathol. 2011, 23, 493–506. [CrossRef]14. Elmore, A.L.; Crouch, E.; Kabir Chowdhury, M.A. The Interaction of Adverse Childhood Experiences and Resiliency on the
Outcome of Depression Among Children and Youth, 8–17 year olds. Child Abus. Negl. 2020, 107, 104616. [CrossRef] [PubMed]15. Miguel, P.M.; Pereira, L.O.; Silveira, P.P.; Meaney, M.J. Early environmental influences on the development of children’s brain
structure and function. Dev. Med. Child Neurol. 2019, 61, 1127–1133. [CrossRef] [PubMed]16. Crandall, A.; Miller, J.R.; Cheung, A.; Novilla, L.K.; Glade, R.; Novilla, M.L.B.; Magnusson, B.M.; Leavitt, B.L.; Barnes, M.D.;
Hanson, C.L. ACEs and counter-ACEs: How positive and negative childhood experiences influence adult health. Child Abus.Negl. 2019, 96, 104089. [CrossRef]
17. Narayan, A.J.; Rivera, L.M.; Bernstein, R.E.; Harris, W.W.; Lieberman, A.F. Positive childhood experiences predict less psy-chopathology and stress in pregnant women with childhood adversity: A pilot study of the benevolent childhood experiences(BCEs) scale. Child Abus. Negl. 2018, 78, 19–30. [CrossRef] [PubMed]
18. Asok, A.; Bernard, K.; Roth, T.L.; Rosen, J.B.; Dozier, M. Parental responsiveness moderates the association between early-lifestress and reduced telomere length. Dev. Psychopathol. 2013, 25, 577–585. [CrossRef] [PubMed]
19. van den Berg, A.E.; Maas, J.; Verheij, R.A.; Groenewegen, P.P. Green space as a buffer between stressful life events and health. Soc.Sci. Med. 2010, 70, 1203–1210. [CrossRef]
20. Cohen, S.; Wills, T.A. Stress, social support, and the buffering hypothesis. Psychol. Bull. 1985, 98, 310–357. [CrossRef]21. Oh, D.L.; Jerman, P.; Purewal Boparai, S.K.; Koita, K.; Briner, S.; Bucci, M.; Harris, N.B. Review of Tools for Measuring Exposure
to Adversity in Children and Adolescents. J. Pediatric Health Care 2018, 32, 564–583. [CrossRef]22. Lacey, R.E.; Minnis, H. Practitioner Review: Twenty years of research with adverse childhood experience scores—Advantages,
disadvantages and applications to practice. J. Child Psychol. Psychiatry 2020, 61, 116–130. [CrossRef]23. Bleck, J.; DeBate, R. Long-Term Association Between Developmental Assets and Health Behaviors: An Exploratory Study. Health
Educ. Behav. 2016, 43, 543–551. [CrossRef]24. Traub, F.; Boynton-Jarrett, R. Modifiable Resilience Factors to Childhood Adversity for Clinical Pediatric Practice. Pediatrics 2017.
[CrossRef] [PubMed]25. National Academies of Sciences, E. Medicine. Integrating Social Care into the Delivery of Health Care: Moving Upstream to Improve the
Nation’s Health; National Academies Press: Cambridge, MA, USA, 2019.26. Ferguson, K.T.; Evans, G.W. Social ecological theory: Family systems and family psychology in bioecological and bioecocultural
perspective. In APA Handbook of Contemporary Family Psychology: Foundations, Methods, and Contemporary Issues across the Lifespan;APA Handbooks in Psychology®; American Psychological Association: Washington, DC, USA, 2019; Volume 1, pp. 143–161.
27. Shonkoff, J.P.; Boyce, W.T.; McEwen, B.S. Neuroscience, molecular biology, and the childhood roots of health disparities: Buildinga new framework for health promotion and disease prevention. JAMA 2009, 301, 2252–2259. [CrossRef]
28. Lopez, M.; Ruiz, M.O.; Rovnaghi, C.R.; Tam, G.K.Y.; Hiscox, J.; Gotlib, I.H.; Barr, D.A.; Carrion, V.G.; Anand, K.J.S. The socialecology of childhood and early life adversity. Pediatric Res. 2021, 89, 353–367. [CrossRef] [PubMed]
29. Slopen, N.; Kontos, E.; Ryff, C.; Ayanian, J.; Albert, M.; Williams, D. Psychosocial stress and cigarette smoking persistence,cessation, and relapse over 9–10 years: A prospective study of middle-aged adults in the United States. Cancer Causes Control2013, 24, 1849–1863. [CrossRef] [PubMed]
Children 2022, 9, 452 20 of 20
30. Cuevas, A.G.; Chen, R.; Thurber, K.A.; Slopen, N.; Williams, D.R. Psychosocial Stress and Overweight and Obesity: FindingsFrom the Chicago Community Adult Health Study. Ann. Behav. Med. 2019, 53, 8. [CrossRef]
31. Sternthal, M.J.; Slopen, N.; Williams, D.R. Racial Disparities in Health: How Much Does Stress Really Matter? Du Bois Rev. Soc.Sci. Res. Race 2011, 8, 95–113. [CrossRef]
32. Hunte, H.E.R.; Williams, D.R. The association between perceived discrimination and obesity in a population-based multiracialand multiethnic adult sample. Am. J. Public Health 2009, 99, 1285–1292. [CrossRef]
33. Merrick, M.T.; Ford, D.C.; Ports, K.A.; Guinn, A.S. Prevalence of adverse childhood experiences from the 2011-2014 BehavioralRisk Factor Surveillance System in 23 states. JAMA Pediatrics 2018, 172, 1038–1044. [CrossRef]
34. Xiao, S. Social support rating scale. J. Clin. Psychiatry 1994, 4, 98–100.35. Lawler, F.H.; Mold, J.W.; McCarthy, L.H. Do older people benefit from having a confidant? An Oklahoma Physicians Re-
source/Research Network (OKPRN) study. J. Am. Board Fam. Med. 2013, 26, 9–15.36. Reid, K.M.; Taylor, M.G. Social support, stress, and maternal postpartum depression: A comparison of supportive relationships.
Soc. Sci. Res. 2015, 54, 246–262. [CrossRef] [PubMed]37. McLanahan, S.; Beck, A.N. Parental relationships in fragile families. Future Child. 2010, 20, 17–37. [CrossRef]38. McQuillan, M.E.; Bates, J.E.; Staples, A.D.; Deater-Deckard, K. Maternal stress, sleep, and parenting. J. Fam. Psychol. 2019, 33, 349.
[CrossRef] [PubMed]39. Bernard, K.; Nissim, G.; Vaccaro, S.; Harris, J.L.; Lindhiem, O. Association between maternal depression and maternal sensitivity
from birth to 12 months: A meta-analysis. Attach. Hum. Dev. 2018, 20, 578–599. [CrossRef] [PubMed]40. Seymour, M.; Giallo, R.; Cooklin, A.; Dunning, M. Maternal anxiety, risk factors and parenting in the first post-natal year. Child
Care Health Dev. 2015, 41, 314–323. [CrossRef] [PubMed]41. Spitzer, R.L.; Kroenke, K.; Williams, J.B.; Löwe, B. A brief measure for assessing generalized anxiety disorder: The GAD-7. Arch.
Intern. Med. 2006, 166, 1092–1097. [CrossRef]42. Briggs, R.; Carey, D.; O’Halloran, A.; Kenny, R.; Kennelly, S. Validation of the 8-item Centre for Epidemiological Studies Depression
Scale in a cohort of community-dwelling older people: Data from The Irish Longitudinal Study on Ageing (TILDA). Eur. Geriatr.Med. 2018, 9, 121–126. [CrossRef]
43. Albert, M.A.; Durazo, E.M.; Slopen, N.; Zaslavsky, A.M.; Buring, J.E.; Silva, T.; Chasman, D.; Williams, D.R. Cumulative psycho-logical stress and cardiovascular disease risk in middle aged and older women: Rationale, design, and baseline characteristics.Am. Heart J. 2017, 192, 1–12. [CrossRef]
44. Hatch, S.L. Conceptualizing and Identifying Cumulative Adversity and Protective Resources: Implications for UnderstandingHealth Inequalities. J. Gerontol. Ser. B 2005, 60, S130–S134. [CrossRef]
45. Folger, A.T.; Eismann, E.A.; Stephenson, N.B.; Shapiro, R.A.; Macaluso, M.; Brownrigg, M.E.; Gillespie, R.J. Parental AdverseChildhood Experiences and Offspring Development at 2 Years of Age. Pediatrics 2018, 141. [CrossRef]
46. De Luca, S.M.; Yueqi, Y.; DiCorcia, D.; Padilla, Y. A longitudinal study of Latino and non-Hispanic mothers’ and fathers’ depressivesymptoms and its association with parent-child communication. J Affect Disord 2018, 227, 580–587. [CrossRef] [PubMed]
47. Platt, R.; Weiss-Laxer, N.S.; Creedon, T.B.; Roman, M.J.S.; Cardemil, E.V.; Cook, B. Association between maternal and child mentalhealth among US Latinos: Variation by nativity, ethnic subgroup, and time in the USA. Arch Womens Ment Health 2020, 23, 421–428.[CrossRef] [PubMed]
48. Narayanan, M.K.; Nærde, A. Associations between maternal and paternal depressive symptoms and early child behaviorproblems: Testing a mutually adjusted prospective longitudinal model. J Affect Disord 2016, 196, 181–189. [CrossRef] [PubMed]
49. Gassman-Pines, A.; Ananat, E.O.; Fitz-Henley, J. COVID-19 and Parent-Child Psychological Well-being. Pediatrics 2020, 146,e2020007294. [CrossRef]
50. Heard-Garris, N.; Cale, M.; Camaj, L.; Hamati, M.; Dominguez, T. Transmitting Trauma: A systematic review of vicarious racismand child health. Soc. Sci. Med. 2017, 199, 230–240. [CrossRef]
51. Castro-Schilo, L.; Taylor, Z.E.; Ferrer, E.; Robins, R.W.; Conger, R.D.; Widaman, K.F. Parents’ Optimism, Positive Parenting, andChild Peer Competence in Mexican-Origin Families. Parenting 2013, 13, 95–112. [CrossRef]
52. Shields, G.S.; Slavich, G.M. Lifetime stress exposure and health: A review of contemporary assessment methods and biologicalmechanisms. Soc. Personal. Psychol. Compass 2017, 11, e12335. [CrossRef]
53. Chaput, J.P.; Gray, C.E.; Poitras, V.J.; Carson, V.; Gruber, R.; Birken, C.S.; MacLean, J.E.; Aubert, S.; Sampson, M.; Tremblay, M.S.Systematic review of the relationships between sleep duration and health indicators in the early years (0–4 years). BMC PublicHealth 2017, 17, 855. [CrossRef]
54. Condon, E.M.; Tobon, A.L.; Mayes, L.C.; Sadler, L.S. Acceptability and Feasibility of Hair and Salivary Biomarker CollectionAmong Multiethnic School-Age Children. Matern. Child Health J. 2020, 24, 865–874. [CrossRef]
55. Oerther, S.; Lorenz, R. State of the science: Using telomeres as biomarkers during the first 1,000 days of life. West. J. Nurs. Res.2019, 41, 305–325. [CrossRef]
56. Pollard, E.L.; Lee, P.D. Child well-being: A systematic review of the literature. Soc. Indic. Res. 2003, 61, 59–78. [CrossRef]57. Sirgy, M.J. The Wellbeing of Children and Youth. In The Psychology of Quality of Life: Wellbeing and Positive Mental Health; Sirgy,
M.J., Ed.; Springer International Publishing: Cham, Switzerland, 2021; pp. 551–580.58. Meaney, M.J. Perinatal maternal depressive symptoms as an issue for population health. Am. J. Psychiatry 2018, 175, 1084–1093.
[CrossRef] [PubMed]
Copyright © 2022 FDOKUMEN