Social and economic impacts of Kahurangi National Park
61
Social and economic impacts of Kahurangi National Park SCIENCE FOR CONSERVATION 119 C. Nicholas Tayor, Janet Gough, Julie Warren and Wayne McClintock Published by Department of Conservation P.O. Box 10-420 Wellington, New Zealand
-
Upload
independent -
Category
Documents
-
view
4 -
download
0
Transcript of Social and economic impacts of Kahurangi National Park

Social and economic impacts ofKahurangi National Park
SCIENCE FOR CONSERVATION 119
C. Nicholas Tayor, Janet Gough, Julie Warren and Wayne McClintock
Published by
Department of Conservation
P.O. Box 10-420
Wellington, New Zealand
Science for Conservation presents the results of investigations by DOC staff, and by contracted
science providers outside the Department of Conservation. Publications in this series are internally
and externally peer reviewed.
©August 1999, Department of Conservation
ISSN 1173�2946
ISBN 0�478�21845�1
This publication originated from work done under Department of Conservation Investigation
no. 2364, carried out by C. Nicholas Taylor, Janet Gough, Julie Warren and Wayne McClintock,
Taylor Baines and Associates, PO Box 8620, Riccarton, Christchurch (e-mail: [email protected]).
It was approved for publication by the Manager, Science & Research Unit, Science Technology and
Information Services, Department of Conservation, Wellington.
Cataloguing-in-Publication data
Social and economic impacts of Kahurangi National Park / C. Nicholas
Taylor ... [et al.]. Wellington, N.Z. : Dept. of Conservation, 1999.
1 v. ; 30 cm. (Science for conservation, 1173�2946 ; 119)
Includes bibliographical references.
ISBN 0478218451
1. National parks and reserves�New Zealand�Kahurangi National Park.
2. Conservation of natural resources�Economic aspects�New Zealand�
Tasman District. 3. Conservation of natural resources�Social aspects�
New Zealand�Tasman District. 4. Tourist trade�Economic aspects�New
Zealand�Tasman District. 5. Tourist trade�Social aspects�New Zealand
�Tasman District. I. Taylor, C. N. (C. Nicholas) Series: Science for
conservation (Wellington, N.Z.) ; 119.

CONTENTS
Abstract 5
1. Introduction 6
1.1 Background 6
1.2 Research objective and outputs 8
1.3 The FRST Rural tourism study 9
1.4 Research methods 10
2. Community profiles 11
2.1 Golden Bay 11
2.2 Collingwood 15
2.3 Takaka 18
2.4 Tapawera 21
2.5 Murchison 25
2.6 Karamea 29
2.7 The Westport coalfields area 33
2.8 Demographic overview 34
3. Current issues for the Park and adjacent communities 35
3.1 Use and maintenance of tracks and huts 35
3.2 The management of concessions 40
3.3 Access roads 41
3.4 The trans-park road proposal 42
3.5 Helicopter operations 43
3.6 Recreational hunting 44
3.7 Mountain bikes 45
3.8 Pest and weed control and other management issues 45
3.9 Mining 45
3.10 Forestry and sphagnum moss 46
3.11 Water resources 46
3.12 Eeling 46
4. Tourism development and economic impacts 47
4.1 Economic projections from the 1993 assessment 47
4.2 The tourism industry 47
4.3 Estimations of employment effects in 1998 52
4.4 Social impacts of tourism 52
4.5 Marketing and information about the Park 53
5. The management of change 56
5.1 Investment in infrastructure and establishment of the Park 56
5.2 Community liaison and involvement 58
5.3 Monitoring and evaluation 60
6. References 61
Appendix 1
Kahurangi Park study�keywords 62

5
Abstract
Kahurangi National Park was gazetted in 1996. This report considers the social
and economic effects of the Park on local economies, tourism and recreational
use, management issues and interactions with communities. The research
develops longitudinal data on the effects of the Park which can be used in
management of effects and for building relationships between the Park and its
neighbouring communities. The results will also be of use as a comparative case
in the investigation of future park proposals.
The key communities around the Park are Collingwood and Takaka (Golden
Bay), Tapawera, Murchison and Karamea. Demographic profiles of these using
1996 census data provide a baseline for future analysis. Most had declining
populations during the mid to late 1980s as a result of economic restructuring,
but since 1991 populations have been relatively stable, although they are ageing
and have a loss of young people that is typical of rural communities. Relatively
high numbers of self employed and employers in these communities reflect
industries based on family farming and small businesses such as tourism.
Since the Park was gazetted there has been an increase in demand for all types of
walks, including lesser-known tracks and short walks, from both domestic and
international visitors. It is widely considered that use of the Park will continue
to grow. Corresponding impacts will need to be managed to protect the visitor
experience and limit damage to natural values. There is concern about
inadequate funding of facilities by the Department of Conservation (DOC),
including the creation of new amenities. Issues for Park management�which
are being tackled by the draft management plan for the Park�include helicopter
access, particularly around the Wilderness area, mountain bike access, road
proposals, hunting policy, water use and eeling.
Tourism businesses have grown in Golden Bay, Karamea and, to a lesser extent,
Murchison in the five years since 1993. Kahurangi is now a key feature in the
promotion of the top of the South Island. Tourism growth means that the
original estimate of 50 direct and 30 indirect jobs created by the Park in the five
years following its establishment should prove conservative.
Visitor centres need more information about the Park. The Takaka, Karamea and
Murchison communities have plans to improve their information centres in
collaboration with DOC. A more professional and coordinated approach was
advocated to promote the Park and areas around the Park. To maximise social
and economic benefits of the Park there needs to be investment in amenities and
information, from private, public and community sources. DOC has shown a
willingness to work with communities and attitudes to the Park have become
more positive. This proactive approach and close community liaison is
supported by the neighbouring communities.

6
1. Introduction
1 . 1 B A C K G R O U N D
Kahurangi, gazetted in 1996, is New Zealand�s newest national park. It is also
the second largest, at 452 000 ha, stretching from the northwestern corner of
the South Island to Murchison in the south (Fig. 1). It is known for its diverse
landscape and geology, wide biodiversity and extensive wilderness area. It also
has numerous tracks and walks, including the well-known Heaphy Track, which
crosses the north of the Park. Rafting, kayaking and fishing activities are centred
on the Karamea River catchment, but there are numerous other rivers and also
tidal streams running into Whanganui Inlet. (Fig. 1) A Kahurangi National Park
Draft Management Plan 1998�2008 (henceforth referred to as the Draft
Management Plan) has been prepared by the Department of Conservation
(DOC), (Department of Conservation, 1997). The Plan includes a detailed
description of the Park, its Maori heritage and current management issues.
Previously a Forest Park administered by the New Zealand Forest Service, the
Park and adjoining areas became public conservation land administered by DOC
in 1987. By this time a national park in the area had been proposed. The
Department conducted an ongoing investigation from June 1991 that included
consultation with communities and interested groups and individuals on the
West Coast, and in Golden Bay and Nelson. As part of its investigation DOC was
also required by the general policy of the New Zealand Conservation Authority
to prepare an assessment of the likely social and economic impacts.
The social and economic impact assessment was commissioned in April 1993
and conducted by the Institute for Social Research and Development and Taylor
Baines and Associates (Warren & Taylor 1993). This is henceforth referred to as
the 1993 assessment. It was a �scoping� exercise, which included profiling of
communities, identification of issues and assessment of likely impacts. It built
on the existing work of the Department and, where possible, existing data.
Methods included the review of reports examining social and economic impacts
from other national parks, and background material relating to the northwest
South Island proposal; profiling of communities around the Park using existing
reports and information, and census material from 1986 and 1991; key
interviews to identify issues and possible impacts; and assessment of economic
impacts including effects on existing or possible future resource uses, roading,
tourism and recreation, and the effects of new facilities or infrastructure.
Summaries of the report were included in a public discussion document
released by the Department in 1993. Subsequently there was an opportunity for
public submissions and further community consultation.
Previous assessments of social and economic effects of national parks in New
Zealand are limited in numbers and coverage. They include studies of proposed
parks including Wanganui (Department of Lands and Survey, 1984), Paparoa
(Department of Lands and Survey, 1985; Stephens and Wells, 1983), Northland
Kauri (Northland Regional Council, 1991), and additions to existing parks,
including Waitutu (Wilson et al., 1985) and Red Hills (Department of
Conservation, 1987). There have also been studies of existing parks such as Mt

7
Figure 1. Map of Kahurangi
National Park showing
communities surrounding the
park and administrative
boundaries.
Cook (Kerr et al., 1986), Westland (Pearce, 1982) and Fiordland (Kerr et al.,
1990), and of conservation lands in general (Gough et al., 1995). These various
reports provide information on changes in land use and economic effects in
neighbouring communities, including employment and expenditure, created by
a park and its workforce, and by the visitors to a park. There is, however, a lack
of longitudinal studies1. Social effects are only covered very lightly in respect to
issues such as changes in lifestyle. �Consultation� usually relies heavily on a
process of public submissions. None of the reports investigate the mitigation or
management of effects.
There are a number of townships and small communities around the extensive
border of the new Park. These include Collingwood, Takaka, Tapawera,
Murchison and Karamea. At greater distance from the park are the larger towns
and provincial centres of Westport, Motueka, Nelson and Greymouth. The 1993
assessment identified that communities affected by the Park are traditionally
1 Longitudinal studies examine impacts over time by revisiting sites at intervals.

8
resource-based and have experienced a series of ups and downs in their
utilisation of resources, including pastoral farming, forestry, fishing and mining.
Since the early 1980s they have generally experienced losses of services,
employment and population as a result of economic restructuring. They have
also built up a tourist industry, and the new Park now plays a central role in their
tourism strategies. Their continued economic viability is fragile, however, and
the loss or gain of a few jobs, or of a small business or service, can have an
exaggerated influence on their future. These boundary communities are the
ones most likely to be affected by the Park in the longer term.
The 1993 assessment also identified a number of issues for the new Park, and it
was considered that some would require ongoing mitigation and management.
Issues then included access roads, the proposed Nelson-Marlborough to West
Coast road link across the Park, tourism concessions, helicopter operations,
recreational hunting and fishing, pest and weed control, restrictions on mining,
hydro-electric development, forestry and logging, and sphagnum moss
collection. There were particular issues related to the setting and management
of Park boundaries, and recreational and other activities in the boundary areas.
All these issues are reviewed and updated below.
The purpose of this report is to update the 1993 assessment, focussing on the
impacts and management issues created by the Park in its adjoining
communities. The research on which the report is based was undertaken for the
Department of Conservation by Taylor Baines and Associates.
1 . 2 R E S E A R C H O B J E C T I V E A N D O U T P U T S
The objective of the research was:
� to conduct an analysis of the social and economic impacts of Kahurangi
National Park including tourism and recreational use, Park expenditure and
employment, and an examination of Park interactions with local
communities.
Outputs from the research were to include:
� the development of longitudinal data on the social and economic effects of
the new Park soon after it has been gazetted. These data will be useful either
for future analysis of the impacts of this national park, or as comparative
information for the investigation of any new park proposals in New Zealand;
� conclusions from the analysis that contribute to the management of effects
from the new Park and particularly to the developing relationships between
the Park and adjacent communities.

9
1 . 3 T H E F R S T R U R A L T O U R I S M S T U D Y
In the period 1996 to 1998 Taylor Baines and Associates worked on a rural
tourism research project in association with a contract to the Centre for
Research, Evaluation and Social Assessment (CRESA) from the Foundation for
Research, Science and Technology (FRST)2.
The working definition of rural tourism is tourism that relies on the natural and
heritage resources and people of rural communities. There is little information
about such tourism in New Zealand, despite there being over 3000 rural tourism
operators and the potential for rural tourism to contribute to the tourism
industry and rural communities by:
� expanding the range of tourism products and tourist types in New Zealand,
� distributing tourism benefits more widely around regions,
� diversifying rural economic activity,
� adding value to existing economic activity (both rural and urban),
� increasing rural employment,
� fostering conservation and sustainable resource management practices,
� maintaining rural populations and services.
The FRST research has developed a database of rural tourism operators to profile
existing activity and demand and show its geographical distribution. The
database, with over 3000 entries, provides a basis for future rural tourism
planning and development. It shows the diversity of enterprises, ranging from
accommodation (home-based and others), adventure and other activities
(mostly natural resource based), retailers (often crafts people), gardens, food
outlets, wineries and heritage products. A sample was drawn from the database
to conduct a national survey of rural tourism operators. The survey has provided
a profile of the businesses, their operators and their visitors. Key findings are
that the businesses were often operated in conjunction with other economic
activity, such as farming or other businesses, and paid employment. Domestic
tourists are the mainstay of this sector, and both domestic and international
visitors are attracted to natural environment, lifestyles and associated activities.
Businesses tend to be poor users of information and advice, lack formal planning
and are under-capitalised. Both the data base and survey results from the rural
tourism research were used for the analysis of tourism development associated
with the Kahurangi National Park.
A major component of the rural tourism research was eight community or sub-
regional case studies of rural tourism development. One of the case study areas
was Golden Bay. Others in the South Island were Wairau Valley, Mt Somers and
the Maniototo. The case studies have examined the potential for tourism
development, opportunities and constraints, and local strategic issues. The
Golden Bay case study was selected for the potential to examine the effects of
the new Park on tourism development in that area. It also provided a unique
opportunity to extend the result of the preliminary, investigative studies of the
proposed Park into further baseline work and an investigation of actual effects,
as described in this report.
2 RES601�Rural tourism for sustainable rural economic development.

10
1 . 4 R E S E A R C H M E T H O D S
The methods used for the assessment were common to the Golden Bay study
and the other Park communities. They are typical of social assessment work
(Taylor et al. 1995). They were:
� Community profiling Profiling is used in social assessment to describe
baseline conditions and also, periodically, to establish the extent of social
change. Profiles of the communities around the Park were updated from the
1993 assessment using secondary (existing) data and statistics, especially
1996 census data3. For the West Coast there is also considerable
documentation profiling the social and economic characteristics of the
Region and Buller District. The Buller District Council has prepared a set of
resource material and discussion documents for the preparation of a district
plan (�Towards 2011�). There is also a set of community profiles prepared by
the West Coast Regional Council for towns, townships and localities.
� Analysis of other Park data Park-related data such as information on DOC
employment and expenditure, visitor centre numbers, hut and track use data
were examined for trends and changes, along with tourism sector data such
as visitor monitoring information from centres run as part of the Visitor
Information Network (VIN).
� Employment estimates Estimates of direct and indirect employment
generated by the Park were made from secondary and primary (field
interview) data and cross checked using employment multipliers estimated
by Narayan (1993).
� Personal interviews and small meetings Interviews and small meetings
were held with key people in communities and interest groups across
different sectors. These covered DOC staff, tourism sector people such as
business operators and staff of visitor centres, other businesses, local and
regional government staff and representatives, central government agencies,
recreation groups, and people involved in community activities. Notes on
interviews and meetings were key-worded (see Appendix 1) and the content
analysed using a qualitative database programme.
3 Problems were encountered because the 1996 census was released much later than expected, and
there have been technical problems obtaining accurate, local-level data using Supermap 3� the
Statistics New Zealand computer package.

11
2. Community profiles
There are a number of townships and small communities along the extensive
border of the Park. The key small communities are Collingwood and Takaka
(Golden Bay), Tapawera, Murchison and Karamea. These communities are
profiled in detail in this section, using variables that allow some comparison to
the profiling done in the original assessment. The detailed demographic analysis
is based, however, on 1996 data rather than 1991 data as used in the original
assessment. As 1996 was the year the Kahurangi National Park was gazetted,
these 1996 data could therefore become the baseline for future analysis.
Population trend data are provided as well.
2 . 1 G O L D E N B A Y
There are many recent immigrants to Golden Bay. There was a wave of
immigrants in the 1970s, seeking alternative lifestyles. More recent immigrants
also come for the lifestyle, but they tend to be wealthy, and some are regarded
as �very rich�, as evidenced by their substantial homes. Some have hired labour,
and they spend considerable amounts of money in the local economy. Tourism
continues to grow. The dairy industry is also strong. As a result, Golden Bay has
experienced steady population growth over the last 10 years, despite the
economic downturn, public service restructuring, and closures such as that of
the Tarakoe cement works. These changes have been reflected in the loss of
power by farmers on the local council, its merger with the much larger Tasman
District Council4; and a change in planning philosophy, with greater subdivision
of rural land.
Population changes from 1986 to 1996
Golden Bay�s population grew by 381 persons (12%) between 1986 and 1996,
despite a decline in the late 1980s. The population grew rapidly between 1991
and 1996. In comparison, the rate of population growth in Tasman District as a
whole was 5% between 1986 and 1991, doubling to a growth rate of around 12%
between 1991 and 1996 (Table 2.1.1).
TABLE 2 .1 .1 . GOLDEN BAY�POPULATION CHANGES FROM 1986 TO 1996.
CENSUS YEAR GOLDEN BAY TASMAN DISTRICT
NO. OF PERSONS % CHANGE IN NO. OF PERSONS % CHANGE IN
POPULATION POPULATION
1986 3093 � 32 403 �
1991 3027 �2.1 34 029 5.0
1996 3474 14.8 37 974 11.6
4 Golden Bay District was incorporated into the Tasman District with local government
restructuring.
12
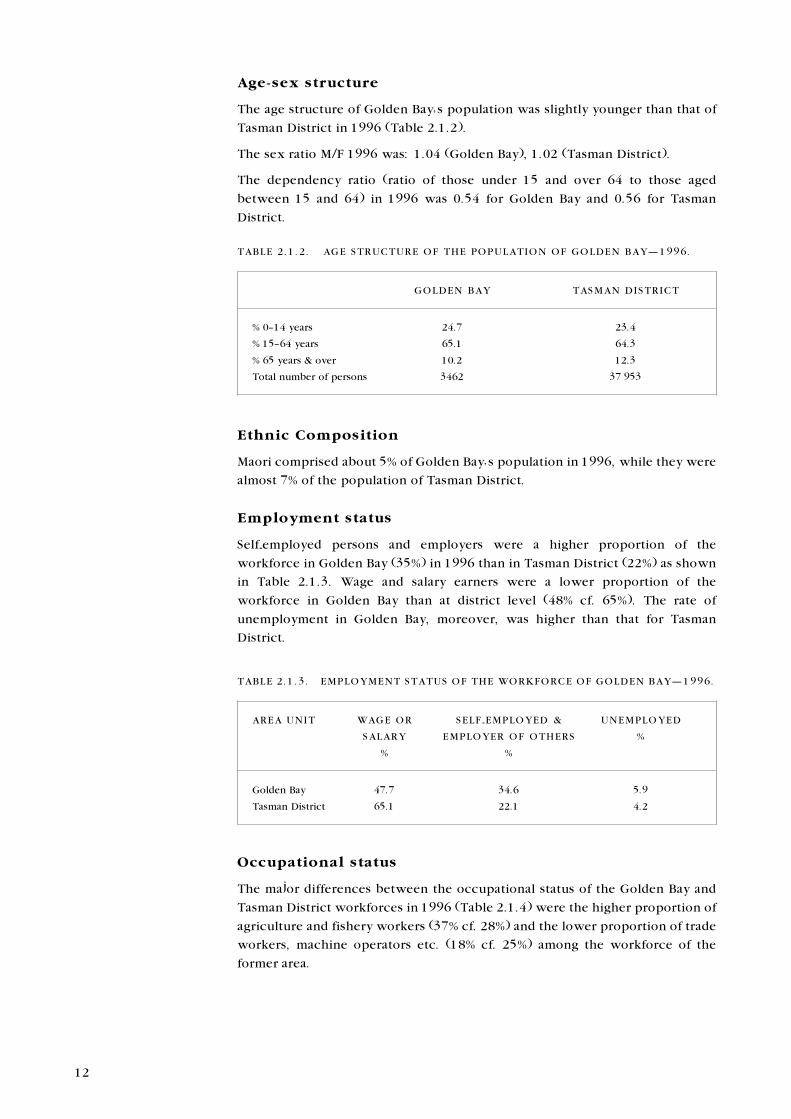
Age-sex structure
The age structure of Golden Bay�s population was slightly younger than that of
Tasman District in 1996 (Table 2.1.2).
The sex ratio M/F 1996 was: 1.04 (Golden Bay), 1.02 (Tasman District).
The dependency ratio (ratio of those under 15 and over 64 to those aged
between 15 and 64) in 1996 was 0.54 for Golden Bay and 0.56 for Tasman
District.
TABLE 2 .1 .2 . AGE STRUCTURE OF THE POPULATION OF GOLDEN BAY�1996.
GOLDEN BAY TASMAN DISTRICT
% 0�14 years 24.7 23.4
% 15�64 years 65.1 64.3
% 65 years & over 10.2 12.3
Total number of persons 3462 37 953
Ethnic Composition
Maori comprised about 5% of Golden Bay�s population in 1996, while they were
almost 7% of the population of Tasman District.
Employment status
Self-employed persons and employers were a higher proportion of the
workforce in Golden Bay (35%) in 1996 than in Tasman District (22%) as shown
in Table 2.1.3. Wage and salary earners were a lower proportion of the
workforce in Golden Bay than at district level (48% cf. 65%). The rate of
unemployment in Golden Bay, moreover, was higher than that for Tasman
District.
Occupational status
The major differences between the occupational status of the Golden Bay and
Tasman District workforces in 1996 (Table 2.1.4) were the higher proportion of
agriculture and fishery workers (37% cf. 28%) and the lower proportion of trade
workers, machine operators etc. (18% cf. 25%) among the workforce of the
former area.
TABLE 2 .1 .3 . EMPLOYMENT STATUS OF THE WORKFORCE OF GOLDEN BAY�1996.
AREA UNIT WAGE OR SELF -EMPLOYED & UNEMPLOYED
SALARY EMPLOYER OF OTHERS %
% %
Golden Bay 47.7 34.6 5.9
Tasman District 65.1 22.1 4.2

13
Industry�major divisions
The main sources of employment for the workforce of Golden Bay in 1996
(Table 2.1.5) were the agriculture/forestry and fishing (36%), commercial/
social/personal services (16%) and the wholesale/retail/accommodation (14%)
sectors of the economy. These sectors were also major sources of jobs for the
workforce of Tasman District; although the agriculture/forestry and fishing
sector provided a lower proportion of employment at the district level.
TABLE 2 .1 .4 . OCCUPATIONAL STATUS OF THE WORKFORCE OF
GOLDEN BAY�1996.
OCCUPATIONAL CATEGORY GOLDEN BAY TASMAN DISTRICT
% OF WORKFORCE % OF WORKFORCE
Administrators/managers 8.6 8.5
Professionals & technicians 15.8 15.2
Clerks 5.0 8.1
Service/sales 9.1 10.6
Agriculture & fishery 37.3 28.2
Trades workers/machine operators/elementary occupations 18.4 25.2
Not specified 5.9 4.2
Total number of persons 1575 18 729
TABLE 2 .1 .5 . SECTORAL DISTRIBUTION OF THE WORKFORCE OF GOLDEN
BAY�1996.
SECTOR GOLDEN BAY TASMAN DISTRICT
% OF WORKFORCE % OF WORKFORCE
Agriculture/forestry & fishing 36.4 30.5
Mining/quarrying 0.8 0.2
Manufacturing 8.0 12.5
Electricity/gas/water 0.2 0.3
Construction 3.8 5.7
Wholesale/retail/accommodation 14.0 17.2
Transport/communications 3.8 4.0
Business/financial 4.4 7.4
Govt administration & defence 1.7 2.0
Community/social/personal services 15.6 13.5
Not specified 11.4 6.6
Total number of persons 1 581 18 723
Household incomes
Household incomes in Golden Bay in 1996 (Table 2.1.6) were lower than in the
wider Tasman District. Just over half of the households reported incomes below
$30 001 per annum, while at district level only 43% of households were in this
category.

14
Income support
Residents of Golden Bay (46% of the population aged 15 years and over) had a
slightly higher dependency on income support than the population of Tasman
District (43%). The main forms of income support received in 1996 were
national superannuation (36% of all benefits), the unemployment benefit (27%)
and the domestic purposes benefit (10%).
Education
In 1996 the population of Golden Bay (aged over 15 years) held slightly more
formal qualifications at tertiary and secondary level (Table 2.1.7) than did the
district population.
TABLE 2 .1 .6 . DISTRIBUTION OF HOUSEHOLD INCOMES IN GOLDEN BAY�1996.
HOUSEHOLD INCOME RANGE GOLDEN BAY TASMAN DISTRICT
% OF HOUSEHOLDS % OF HOUSEHOLDS
$10 000 & under 8.7 5.9
$10 001�$30 000 41.8 37.0
$30 001 & over 27.5 40.3
TABLE 2 .1 .7 . HIGHEST EDUCATIONAL QUALIFICATIONS HELD BY RESIDENTS
OF GOLDEN BAY�1996.
HIGHEST EDUCATIONAL GOLDEN BAY TASMAN DISTRICT
QUALIFICATION % OF RESIDENTS % OF RESIDENTS
University 8.0 5.1
Other tertiary 26.6 26.4
Secondary 30.9 30.1
No qualifications 29.0 34.2
Household tenure
Nine percent of dwellings were provided rent free to their occupiers in Golden
Bay in 1996. The higher incidence of this type of tenure (cf. 4% for Tasman
District) probably reflects the greater role of the agricultural sector in Golden
Bay�s economy, compared with the Tasman District as a whole (Table 2.1.8).
TABLE 2 .1 .8 . TENURE OF DWELLINGS IN GOLDEN BAY�1996.
FORM OF TENURE GOLDEN BAY TASMAN DISTRICT
% OF DWELLINGS % OF DWELLINGS
Provided rent free 9.0 4.3
Rented 15.8 18.2
Owned with a mortgage 30.4 35.8
Owned without a mortgage 38.1 36.1
Total number of dwellings 1401 14 163
15
Social and economic development
There are distinct social groupings in Golden Bay. The alternative lifestylers
have distinct networks and �nodes of energy� that tend to be very personal,
rather than put into wider community issues. A lot of people are reclusive,
getting away from the main culture. This leads to a �locals vs natives� mentality.
Furthermore, 27% of land holders are not resident and there is concern about
the conflicts brought about by the sale of land to foreigners, which pushes up
the value of land. Because of the restrictions on building on the coastal fringe,
the price of coastal properties has gone up considerably. It is also acknowledged
that foreigners bring capital and money into the Bay. While land has been
subdivided into �unproductive� uses, this also means that more land is protected
from development or left to revert to native bush.
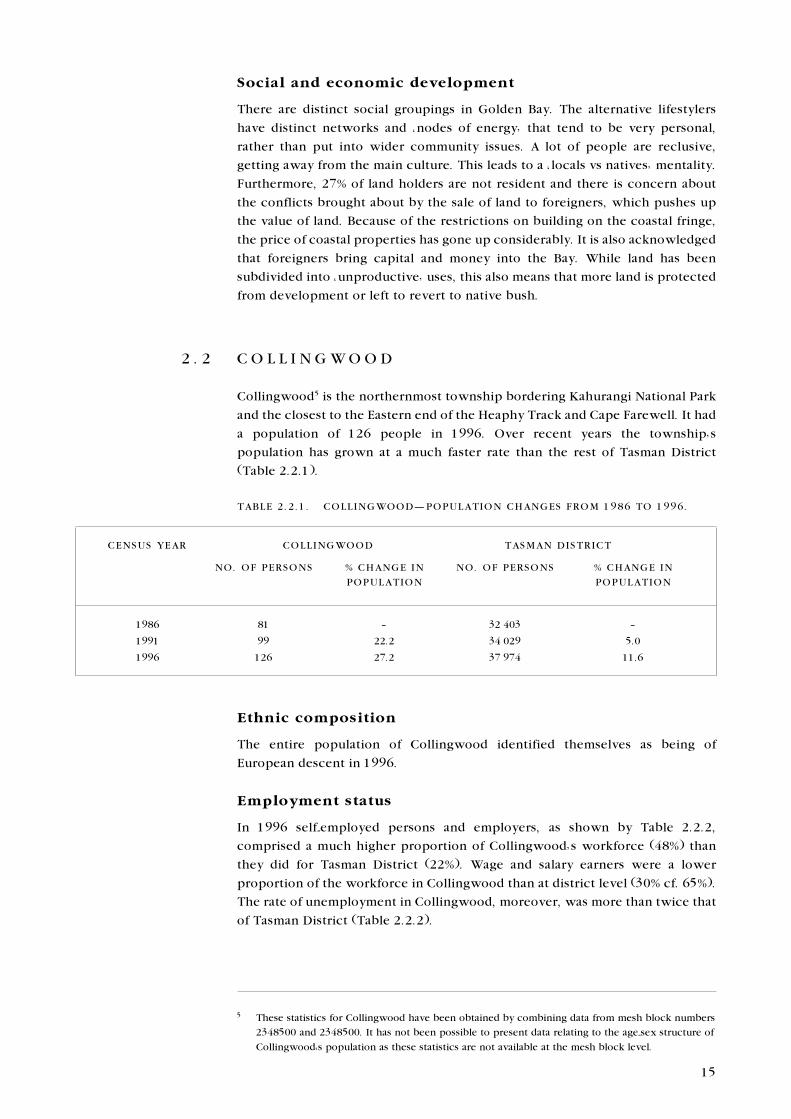
2 . 2 C O L L I N G W O O D
Collingwood5 is the northernmost township bordering Kahurangi National Park
and the closest to the Eastern end of the Heaphy Track and Cape Farewell. It had
a population of 126 people in 1996. Over recent years the township�s
population has grown at a much faster rate than the rest of Tasman District
(Table 2.2.1).
TABLE 2 .2 .1 . COLLINGWOOD�POPULATION CHANGES FROM 1986 TO 1996.
CENSUS YEAR COLLINGWOOD TASMAN DISTRICT
NO. OF PERSONS % CHANGE IN NO. OF PERSONS % CHANGE IN
POPULATION POPULATION
1986 81 � 32 403 �
1991 99 22.2 34 029 5.0
1996 126 27.2 37 974 11.6
Ethnic composition
The entire population of Collingwood identified themselves as being of
European descent in 1996.
Employment status
In 1996 self-employed persons and employers, as shown by Table 2.2.2,
comprised a much higher proportion of Collingwood�s workforce (48%) than
they did for Tasman District (22%). Wage and salary earners were a lower
proportion of the workforce in Collingwood than at district level (30% cf. 65%).
The rate of unemployment in Collingwood, moreover, was more than twice that
of Tasman District (Table 2.2.2).
5 These statistics for Collingwood have been obtained by combining data from mesh block numbers
2348500 and 2348500. It has not been possible to present data relating to the age-sex structure of
Collingwood's population as these statistics are not available at the mesh block level.

16
Occupational status
The major differences between the occupational status of Collingwood and the
District workforces in 1996 (Table 2.2.3) were the higher proportion of trade
workers, machine operators etc. (35% cf. 25%) and the lower proportion of
agriculture and fishery workers (20% cf. 28%) among the township�s residents.
TABLE 2 .2 .2 . EMPLOYMENT STATUS OF THE WORKFORCE OF
COLLINGWOOD�1996.
AREA UNIT WAGE OR SELF -EMPLOYED & UNEMPLOYED
SALARY EMPLOYER OF OTHERS %
% %
Collingwood 30.4 47.8 8.7
Tasman District 65.1 22.1 4.2
TABLE 2 .2 .3 . OCCUPATIONAL STATUS OF THE WORKFORCE OF
COLLINGWOOD�1996.
OCCUPATIONAL CATEGORY COLLINGWOOD TASMAN DISTRICT
% OF WORKFORCE % OF WORKFORCE
Administrators/managers 10.0 8.5
Professionals & technicians 15.0 15.2
Clerks � 8.1
Service/sales 10.0 10.6
Agriculture & fishery 20.0 28.2
Trades workers/machine operators/elementary occupations 35.0 25.2
Not specified 10.0 4.2
Total number of persons 60 18 729
Industry�major divisions
The main sources of employment for Collingwood�s workforce were the
agriculture/forestry and fishing (22%), wholesale/retail/accommodation (22%),
and commercial/social/personal services sectors (22%) (Table 2.2.4).
TABLE 2 .2 .4 . SECTORAL DISTRIBUTION OF THE WORKFORCE OF
COLLINGWOOD�1996.
SECTOR COLLINGWOOD TASMAN DISTRICT
% OF WORKFORCE % OF WORKFORCE
Agriculture/forestry & fishing 22.2 30.5
Mining/quarrying � 0.2
Manufacturing 5.6 12.5
Electricity/gas/water � 0.3
Construction 11.1 5.7
Wholesale/retail/accommodation 22.2 17.2
Transport/communications � 4.0
Business/financial � 7.4
Govt administration & defence � 2.0
Community/social/personal services 22.2 13.5
Not specified 16.7 6.6
Total number of persons 54 18 723

17
Household incomes
Household incomes in Collingwood in 1996 (Table 2.2.5) were lower than in
the District as a whole. Half of the households in the township reported
incomes between $10 001 and $30 000 per annum, while only 37% of the
households of Tasman District indicated they had incomes within this range.
TABLE 2 .2 .5 . DISTRIBUTION OF HOUSEHOLD INCOMES IN
COLLINGWOOD�1996.
HOUSEHOLD INCOME RANGE COLLINGWOOD TASMAN DISTRICT
% OF HOUSEHOLDS % OF HOUSEHOLDS
$10 000 & under 5.0 5.9
$10 001�$30 000 50.0 37.0
$30 001 & over 30.0 40.3
Income support
The major forms of income support the residents of Collingwood received in
1996 were national superannuation (47% of all benefits), the unemployment
benefit (18%) and the domestic purposes benefit (18%).
Education
The residents of Collingwood (aged over 15 years) held proportionally more
formal qualifications at tertiary and secondary levels in 1996 than did the
District�s population (Table 2.2.6).
TABLE 2 .2 .6 . HIGHEST EDUCATIONAL QUALIFICATIONS HELD BY RESIDENTS
OF COLLINGWOOD�1996.
HIGHEST EDUCATIONAL COLLINGWOOD TASMAN DISTRICT
QUALIFICATION % OF RESIDENTS % OF RESIDENTS
University 9.4 5.1
Other tertiary 34.4 26.4
Secondary 31.3 30.1
No qualifications 21.9 34.2
Household tenure
There was a slightly higher incidence of home ownership in Collingwood (76%)
when compared with Tasman District (72%). Furthermore, a higher proportion
of the township�s housing stock was owned without a mortgage (43% cf. 36%
for the district) (Table 2.2.7).

18
2 . 3 T A K A K A
Takaka is the principal town in Golden Bay, with a population of 1224 in 1996.
Population changes from 1986 to 1996
The town had strong population growth between 1976 and 1986 (an increase of
255 persons or 27%). The population increased slightly by 1991 and since then
has remained relatively stable (Table 2.3.1). The increase of 3% between 1986
and 1996 was much lower that the 17% increase recorded over the same period
by Tasman District.
TABLE 2 .2 .7 . TENURE OF DWELLINGS IN COLLINGWOOD�1996.
FORM OF TENURE COLLINGWOOD TASMAN DISTRICT
% OF DWELLINGS % OF DWELLINGS
Provided rent free 4.8 4.3
Rented 19.1 18.2
Owned with a mortgage 33.3 35.8
Owned without a mortgage 42.9 36.1
Total number of dwellings 63 14 163
TABLE 2 .3 .1 . TAKAKA�POPULATION CHANGES FROM 1986 TO 1996.
CENSUS YEAR TAKAKA TASMAN DISTRICT
NO. OF PERSONS % CHANGE IN NO. OF PERSONS % CHANGE IN
POPULATION POPULATION
1986 1185 � 32 403 �
1991 1218 2.8 34 029 5.0
1996 1224 0.5 37 974 11.6
Age-sex structure
Takaka�s population has a slightly older age structure than the wider Tasman
district population with one sixth of its residents aged 65 years and over. The
town has a high dependency ratio, and females outnumber males (Table 2.3.2).
Sex ratio M/F 1996: 0.97 (Takaka), 1.02 (Tasman District).
Dependency ratio 1996: 0.67 (Takaka), 0.56 (Tasman District).
TABLE 2 .3 .2 . AGE STRUCTURE OF THE POPULATION OF TAKAKA�1996.
TAKAKA TASMAN DISTRICT
% 0�14 years 23.7 23.4
% 15�64 years 59.8 64.3
% 65 years & over 16.5 12.3
Total number of persons 1239 37 953
19
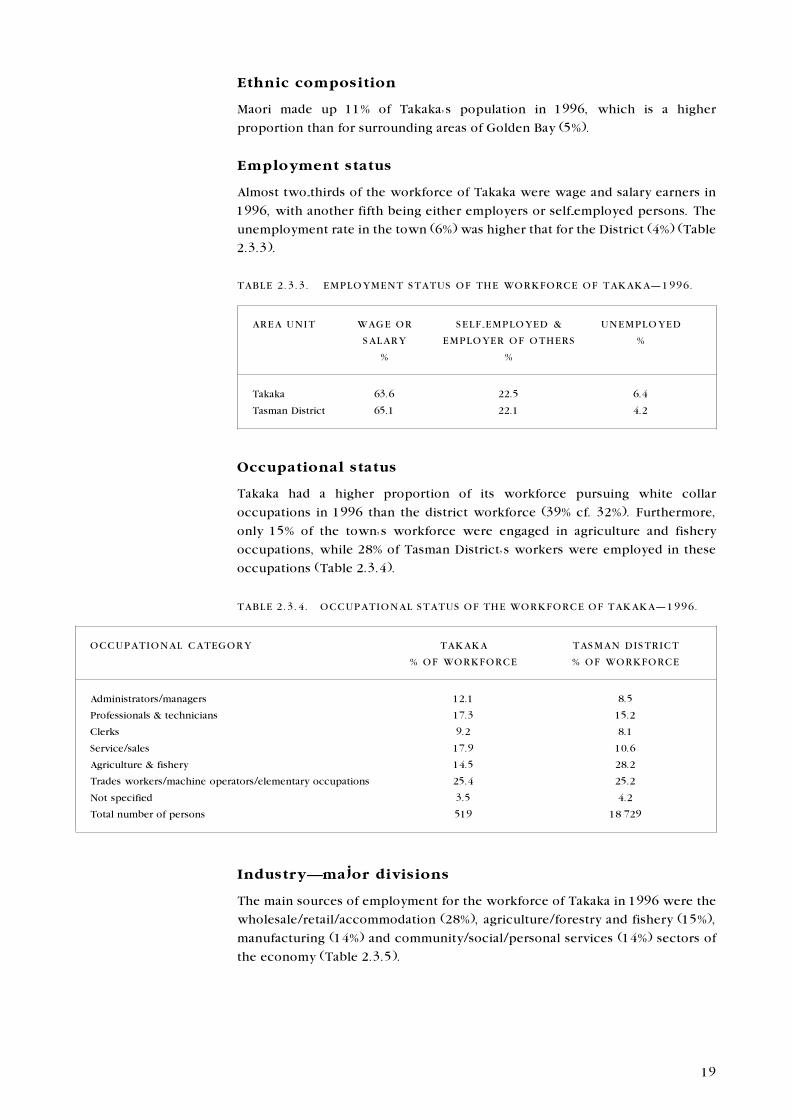
Ethnic composition
Maori made up 11% of Takaka�s population in 1996, which is a higher
proportion than for surrounding areas of Golden Bay (5%).
Employment status
Almost two-thirds of the workforce of Takaka were wage and salary earners in
1996, with another fifth being either employers or self-employed persons. The
unemployment rate in the town (6%) was higher that for the District (4%) (Table
2.3.3).
TABLE 2 .3 .3 . EMPLOYMENT STATUS OF THE WORKFORCE OF TAKAKA�1996.
AREA UNIT WAGE OR SELF -EMPLOYED & UNEMPLOYED
SALARY EMPLOYER OF OTHERS %
% %
Takaka 63.6 22.5 6.4
Tasman District 65.1 22.1 4.2
Occupational status
Takaka had a higher proportion of its workforce pursuing white collar
occupations in 1996 than the district workforce (39% cf. 32%). Furthermore,
only 15% of the town�s workforce were engaged in agriculture and fishery
occupations, while 28% of Tasman District�s workers were employed in these
occupations (Table 2.3.4).
TABLE 2 .3 .4 . OCCUPATIONAL STATUS OF THE WORKFORCE OF TAKAKA�1996.
OCCUPATIONAL CATEGORY TAKAKA TASMAN DISTRICT
% OF WORKFORCE % OF WORKFORCE
Administrators/managers 12.1 8.5
Professionals & technicians 17.3 15.2
Clerks 9.2 8.1
Service/sales 17.9 10.6
Agriculture & fishery 14.5 28.2
Trades workers/machine operators/elementary occupations 25.4 25.2
Not specified 3.5 4.2
Total number of persons 519 18 729
Industry�major divisions
The main sources of employment for the workforce of Takaka in 1996 were the
wholesale/retail/accommodation (28%), agriculture/forestry and fishery (15%),
manufacturing (14%) and community/social/personal services (14%) sectors of
the economy (Table 2.3.5).

20
Household incomes
Household incomes in Takaka in 1996 were lower than those for households in
the greater Tasman District (Table 2.3.6).
TABLE 2 .3 .5 . SECTORAL DISTRIBUTION OF THE WORKFORCE
OF TAKAKA�1996.
SECTOR TAKAKA TASMAN DISTRICT
% OF WORKFORCE % OF WORKFORCE
Agriculture/forestry & fishing 14.5 30.5
Mining/quarrying � 0.2
Manufacturing 13.9 12.5
Electricity/gas/water � 0.3
Construction 8.7 5.7
Wholesale/retail/accommodation 27.7 17.2
Transport/communications 5.8 4.0
Business/financial 6.9 7.4
Govt administration & defence 1.7 2.0
Community/social/personal services 13.9 13.5
Not specified 6.9 6.6
Total number of persons 519 18 723
TABLE 2 .1 .6 . DISTRIBUTION OF HOUSEHOLD INCOMES IN TAKAKA�1996.
HOUSEHOLD INCOME RANGE TAKAKA TASMAN DISTRICT
% OF HOUSEHOLDS % OF HOUSEHOLDS
$10 000 & under 6.8 5.9
$10 001�$30 000 38.8 37.0
$30 001 & over 38.8 40.3
Income support
There was a higher degree of dependence on income support amongst the
residents of Takaka (50% of the population aged 15 years and over) than
amongst the population of Tasman District as a whole (43%). The main forms of
income support received by the town�s residents in 1996 were national
superannuation (44% of total benefits) and the unemployment benefit (22% of
benefits).
Education
The formal educational qualifications held by Takaka�s residents in 1996 were
lower than in the population of Tasman District as a whole (Table 2.3.7).
Household tenure
There was a slightly higher incidence of home ownership in Takaka (74%) than
in Tasman District (72%) in 1996 (Table 2.3.8).

21
Social and economic development
Several community groups active in social and economic development are based
in Takaka. These include Golden Bay Enterprise Action Inc., which concentrates
on employment and business development; Focus Golden Bay, which looks at
social and economic planning; and groups active in tourism promotion.
TABLE 2 .3 .7 . HIGHEST EDUCATIONAL QUALIFICATIONS HELD BY RESIDENTS
OF TAKAKA�1996.
HIGHEST EDUCATIONAL TAKAKA TASMAN DISTRICT
QUALIFICATION % OF RESIDENTS % OF RESIDENTS
University 3.5 5.1
Other tertiary 26.8 26.4
Secondary 25.8 30.1
No qualifications 38.1 34.2
TABLE 2 .1 .8 . TENURE OF DWELLINGS IN TAKAKA�1996.
FORM OF TENURE TAKAKA TASMAN DISTRICT
% OF DWELLINGS % OF DWELLINGS
Provided rent free 4.1 4.3
Rented 15.6 18.2
Owned with a mortgage 36.7 35.8
Owned without a mortgage 37.4 36.1
Total number of dwellings 441 14 163
2 . 4 T A P A W E R A
Population changes from 1986 to 1996
Tapawera�s population fell by 3% between 1986 and 1996. There was a
significant decline in population in the late 1980s (9%) as a result of
restructuring of the forestry sector and consequent redundancies. But during
the 1991�96 period the population grew by 6%. Over the entire decade,
however, the population changes in the township did not reflect the general
pattern of growth that occurred in Tasman District (Table 2.4.1).
TABLE 2 .4 .1 . TAPAWERA�POPULATION CHANGES FROM 1986 TO 1996.
CENSUS YEAR TAPAWERA TASMAN DISTRICT
NO. OF PERSONS % CHANGE IN NO. OF PERSONS % CHANGE IN
POPULATION POPULATION
1986 423 � 32 403 �
1991 387 �8.5 34 029 5.0
1996 411 6.2 37 974 11.6

22
Age-sex structure
Tapawera�s population is more youthful than that of Tasman District as a whole.
Children comprised a third of the population in 1996, while persons 65 years
and over were only 5% of the township�s residents (Table 2.4.2).
Sex ratio M/F 1996: 1.00 (Tapawera), 1.02 (Tasman District).
Dependency ratio 1996: 0.63 (Tapawera), 0.56 (Tasman District).
TABLE 2 .4 .2 . AGE STRUCTURE OF THE POPULATION OF TAPAWERA�1996.
TAPAWERA TASMAN DISTRICT
% 0�14 years 33.6 23.4
% 15�64 years 61.4 64.3
% 65 years & over 5.0 12.3
Total number of persons 420 37 953
Ethnic composition
Maori comprised 16% of the population of Tapawera in 1996, compared with
almost 7% of the population of Tasman District.
Employment status
Two-thirds of Tapawera�s workforce were wage and salary earners in 1996. Only
a sixth of the workforce were either self-employed persons or employers, while
over a fifth belonged to these categories in the district workforce. Furthermore,
some 12% of the township�s workers reported they were unemployed�a rate
that was almost three times the level of unemployment in Tasman District
(Table 2.4.3).
TABLE 2 .4 .3 . EMPLOYMENT STATUS OF THE WORKFORCE OF TAPAWERA�1996.
AREA UNIT WAGE OR SELF -EMPLOYED & UNEMPLOYED
SALARY EMPLOYER OF OTHERS %
% %
Tapawera 65.6 16.4 11.5
Tasman District 65.1 22.1 4.2
Occupational status
One third of Tapawera�s workers were pursuing agriculture and fishery
occupations in 1996. Another third of them were trades workers, machine
operators or were engaged in elementary occupations. White collar workers,
however, were a smaller proportion of the workforce than in the greater Tasman
District (Table 2.4.4).

23
Industry�major divisions
In 1996 the major sources of employment for the workforce were the
agriculture/forestry and fishing (36%), wholesale/retail/accommodation (15%),
manufacturing (13%) and community/social/personal services (13%) sectors
(Table 2.4.5).
TABLE 2 .4 .4 . OCCUPATIONAL STATUS OF THE WORKFORCE OF
TAPAWERA�1996.
OCCUPATIONAL CATEGORY TAPAWERA TASMAN DISTRICT
% OF WORKFORCE % OF WORKFORCE
Administrators/managers 7.3 8.5
Professionals & technicians 12.7 15.2
Clerks 7.3 8.1
Service/sales 7.3 10.6
Agriculture & fishery 30.9 28.2
Trades workers/machine operators/elementary occupations 32.8 25.2
Not specified 1.8 4.2
Total number of persons 165 18 729
Household incomes
Household incomes in Tapawera in 1996 were lower than those at District level
(Table 2.4.6).
Income support
There was a high degree of dependence on income support among the residents
of Tapawera in 1996. The main types of income support received by residents
were the unemployment benefit (29% of total benefits), national superannuation
(20%), the domestic purposes benefit (16%) and the sickness benefit (14%).
TABLE 2 .4 .5 . SECTORAL DISTRIBUTION OF THE WORKFORCE OF
TAPAWERA�1996.
SECTOR TAPAWERA TASMAN DISTRICT
% OF WORKFORCE % OF WORKFORCE
Agriculture/forestry & fishing 35.8 30.5
Mining/quarrying � 0.2
Manufacturing 13.2 12.5
Electricity/gas/water � 0.3
Construction 3.8 5.7
Wholesale/retail/accommodation 15.1 17.2
Transport/communications 3.8 4.0
Business/financial 7.5 7.4
Govt administration & defence 1.9 2.0
Community/social/personal services 13.2 13.5
Not specified 5.7 6.6
Total number of persons 159 18 723

24
Household tenure
There were significant differences between the patterns of household tenure in
Tapawera and Tasman District in 1996. Over a quarter (28%) of households
rented their dwellings, while less than a fifth (18%) of households did so at the
district level. Moreover, over two-thirds of the households in Tapawera which
owned their dwellings were encumbered with a mortgage, whereas at the
district level owner-occupied dwellings were almost equally divided (both
around 36%) between those with a mortgage and those without (Table 2.4.8).
TABLE 2 .4 .6 . DISTRIBUTION OF HOUSEHOLD INCOMES IN TAPAWERA�1996.
HOUSEHOLD INCOME RANGE TAPAWERA TASMAN DISTRICT
% OF HOUSEHOLDS % OF HOUSEHOLDS
$10 000 & under 6.4 5.9
$10 001�$30 000 40.4 37.0
$30 001 & over 38.3 40.3
TABLE 2 .4 .7 . HIGHEST EDUCATIONAL QUALIFICATIONS HELD BY RESIDENTSOF TAPAWERA�1996.
HIGHEST EDUCATIONAL TAPAWERA TASMAN DISTRICT
QUALIFICATION % OF RESIDENTS % OF RESIDENTS
University 4.3 5.1
Other tertiary 21.3 26.4
Secondary 28.7 30.1
No qualifications 44.7 34.2
TABLE 2 .4 .8 . TENURE OF DWELLINGS IN TAPAWERA�1996.
FORM OF TENURE TAPAWERA TASMAN DISTRICT
% OF DWELLINGS % OF DWELLINGS
Provided rent free 4.3 4.3
Rented 27.7 18.2
Owned with a mortgage 44.7 35.8
Owned without a mortgage 19.1 36.1
Total number of dwellings 141 14 163
Education
The residents of Tapawera in 1996 held relatively fewer educational
qualifications than their counterparts in the rest of the District. Some 45% of
Tapawera residents reported that they had no qualifications, compared with
34% of the population of Tasman District (Table 2.4.7).

25
2 . 5 M U R C H I S O N
Murchison is a township of 580 people situated on the main highway between
Buller and Nelson. A service town for the local area, its economy also draws
heavily on passing traffic and tourism, with businesses such as garages and tea
rooms. There are also several motels.
Interviews identified that Murchison was seen to be in a state of ongoing decline
economically despite the current strength of dairying and a number of new
conversions (to dairying) that have been a boost to the area. The town has lost
services and professional people.
The recent loss of the ASB bank was reported as having a profound effect on the
town. People are travelling to Motueka or Nelson to do their banking, and do
their shopping there as well. Lower prices in the larger towns mean that they
pay for their trip, and shopping is becoming a recreational activity. There are
social impacts as people go into the Murchison town centre less often, with less
contact in the street as a result.
Residents described the main street of Murchison as �dead� and the side street
worse, with several closed shops. It was suggested that a tourism company is
going to take over one of the closed shops. A tearoom is up for sale and there is
strong competition in the town for the wayside business of travellers. Several
tourist businesses are part time, the operators having farms or other businesses
or employment. Others come into the area for the tourist season only, such as a
rafting company based in Queenstown and another in Motueka. These outside
businesses are seen by some as having only a limited value to the town��they
fleece the dollars, then go�.
The Park, and activities associated with the park such as walking, fishing and
rafting, are seen as a way of attracting greater numbers of tourists or, more
importantly, keeping them in Murchison for longer.
Population changes from 1986 to 1996
During the decade between 1986 and 1996 the population of Murchison fell by
8% from 633 to 582, while the population of Tasman District grew by 17%. The
decline in population occurred during the first five years of the period. Since
1991, however, the township�s population has remained relatively stable (Table
2.5.1).
TABLE 2 .5 .1 . MURCHISON�POPULATION CHANGES 1986�1996.
CENSUS YEAR MURCHISON TASMAN DISTRICT
NO. OF PERSONS % CHANGE IN NO. OF PERSONS % CHANGE IN
POPULATION POPULATION
1986 633 � 32 403 �
1991 579 �8.5 34 029 5.0
1996 582 0.5 37 974 11.6

26
Age-sex structure
Murchison had a slightly smaller proportion of its population in the working age
group (15 to 64 years) in 1996 than did Tasman District. There are a large
number of widowed and elderly in the town (Table 2.5.2).
Sex ratio M/F 1996: 1.10 (Murchison), 1.02 (Tasman District).
Dependency ratio 1996: 0.63 (Murchison), 0.56 (Tasman District).
TABLE 2 .5 .2 . AGE STRUCTURE OF THE POPULATION OF MURCHISON�1996.
MURCHISON TASMAN DISTRICT
% 0�14 years 24.0 23.4
% 15�64 years 61.2 64.3
% 65 years & over 14.8 12.3
Total number of persons 588 37 953
TABLE 2 .5 .3 . EMPLOYMENT STATUS OF THE WORKFORCE OF
MURCHISON�1996.
AREA UNIT WAGE OR SELF -EMPLOYED & UNEMPLOYED
SALARY EMPLOYER OF OTHERS %
% %
Murchison 66.0 24.7 5.2
Tasman District 65.1 22.1 4.2
Ethnic composition
Maori comprised about 5% of Murchison�s population in 1996, compared to 7%
for the population of Tasman District.
Employment status
The employment status of Murchison�s workforce was broadly similar to the
District�s workforce in 1996. Two-thirds were wage and salary earners and
another quarter were either employers or self-employed persons.
Unemployment is higher than for Tasman District, but the unemployed in the
town were described there as being �invisible� and the census figure may be an
understatement (Table 2.5.3).
Occupational status
The occupational status of Murchison�s residents in 1996 differed from that of
Tasman District as a whole. There were fewer professionals and technicians,
clerks, and agricultural and fishery workers in the town�s workforce, and more
service and sales workers and those engaged in blue collar work (trades
workers, machine operators and elementary occupations) (Table 2.5.4).

27
Industry�major divisions
The major sources of employment for the residents of Murchison in 1996 were
the wholesale/retail/accommodation (34%), agricultural/forestry and fishing
(18%), and community/social/personal services (15%) sectors. By contrast,
Tasman District had higher proportions of its workforce engaged in the
agricultural/ forestry and fishing, and manufacturing sectors of the economy
(Table 2.5.5).
TABLE 2 .5 .4 . OCCUPATIONAL STATUS OF THE WORKFORCE OF
MURCHISON�1996.
OCCUPATIONAL CATEGORY MURCHISON TASMAN DISTRICT
% OF WORKFORCE % OF WORKFORCE
Administrators/managers 9.8 8.5
Professionals & technicians 8.7 15.2
Clerks 6.5 8.1
Service/sales 23.9 10.6
Agriculture & fishery 17.4 28.2
Trades workers/machine operators/elementary occupations 31.5 25.2
Not specified 2.2 4.2
Total number of persons 276 18 729
TABLE 2 .5 .5 . SECTORAL DISTRIBUTION OF THE WORKFORCE OF
MURCHISON�1996.
SECTOR MURCHISON TASMAN DISTRICT
% OF WORKFORCE % OF WORKFORCE
Agriculture/forestry & fishing 18.1 30.5
Mining/quarrying 5.3 0.2
Manufacturing 1.1 12.5
Electricity/gas/water � 0.3
Construction 9.6 5.7
Wholesale/retail/accommodation 34.0 17.2
Transport/communications 8.5 4.0
Business/financial 3.2 7.4
Govt administration & defence 2.0 2.0
Community/social/personal services 14.9 13.5
Not specified 3.2 6.6
Total number of persons 282 18 723
Household incomes
Households incomes in Murchison were lower than that of those for Tasman
District in 1996. Over two-fifth�s of households reported earnings between
$10 000 to $30 000 for that financial year (Table 2.5.6).

28
Income support
Residents of Murchison were less dependent on income support (39% of the
population aged 15 years and over) than the population of Tasman District
(43%). The major forms of income support they received during 1996 were
national superannuation (52% of benefits) and the unemployment benefit (22%).
Education
In 1996 almost a half of the residents of Murchison who were aged 15 years or over
reported that they held no formal educational qualifications (cf. 34% for Tasman
District). Only the proportion of those holding secondary school qualifications
(31%) approximated that for the Tasman District as a whole (Table 2.5.7).
TABLE 2 .5 .6 . DISTRIBUTION OF HOUSEHOLD INCOMES IN MURCHISON�1996.
HOUSEHOLD INCOME RANGE MURCHISON TASMAN DISTRICT
% OF HOUSEHOLDS % OF HOUSEHOLDS
$10 000 & under 6.5 5.9
$10 001�$30 000 42.9 37.0
$30 001 & over 35.1 40.3
TABLE 2 .5 .7 . HIGHEST EDUCATIONAL QUALIFICATIONS HELD BY RESIDENTS
OF MURCHISON�1996.
HIGHEST EDUCATIONAL MURCHISON TASMAN DISTRICT
QUALIFICATION % OF RESIDENTS % OF RESIDENTS
University 2.0 5.1
Other tertiary 15.5 26.4
Secondary 31.1 30.1
No qualifications 49.3 34.2
Household tenure
The only notable difference in household tenure between Murchison and
Tasman District in 1996 was the higher proportion of rental dwellings in the
township, and slightly fewer houses with mortgages (Table 2.5.8).
TABLE 2 .5 .8 . TENURE OF DWELLINGS IN MURCHISON�1996.
FORM OF TENURE MURCHISON TASMAN DISTRICT
% OF DWELLINGS % OF DWELLINGS
Provided rent free 4.1 4.3
Rented 21.6 18.2
Owned with a mortgage 33.8 35.8
Owned without a mortgage 36.5 36.1
Total number of dwellings 222 14 163

29
Social and economic development
People interviewed in the town recognised the potential of tourism, with a
focus around the new Park, but they lacked the experience, resources and/or
initiative to set it off. This problem could be overcome by the development of a
co-ordinated business strategy for the town. The community is relatively small,
however, with only a few people who are well linked into organisations that
could assist, such as the District Council and government agencies. There is an
air of uncertainty about the future of the town.
2 . 6 K A R A M E A
Karamea is a geographically isolated area, with one road providing access to the
rest of the Buller District to the South. The main population centre�Karamea
township6 (453 residents in 1996)�has a few shops, a garage and a visitor
information centre, while accommodation is spread for several kilometres on
each side of the township.
The area around the township is very dependent on dairying, with about 40
dairy farmers. Of 150 children at the school, a quarter were reported as coming
from farming families. The dairy processing factory has been closed since 1993.
The milk now goes to Hokitika. There has been a downturn in other traditional
areas of the resource economy, particularly in forestry with one mill closing and
the other operating with a very reduced cut. In 1997 There was one person
working sphagnum moss full time and 30 working it part time.
There have been a number of business closures in Karamea township, including
the post office, a garage and a tearoom. There were reported to be around 90
people unemployed. There is no bank and the small supermarket and some
other businesses such as hotels act as cash suppliers to visitors and locals.
Recent floods have added to business uncertainty.
On the positive side, there has been significant recent growth in
accommodation in Karamea, evidenced by the number of new motel units. This
has been in response to increased numbers of tourists, many of whom take part
in activities in the new Park. But operators reported that there are not �enough�
small craft-type businesses like the two woodworkers to attract tourists to the
�business� section of the town. Most tourism businesses in Karamea tend to be
run by �outsiders�. Locals tend not to get involved with tourism businesses�it
was considered that they are �a bit scared� to take the risk. Yet home stays do
well in the area. The community is looking for growth from increased interest in
the Park and the area in general. But there is a recognition that to take best
advantage of the opportunities offered by the Park the community needs to
work together.
Population changes from 1986 to 1996
The population of Karamea fell by 5% from 477 to 453 during the period 1986 to
1996. By contrast, the Buller District experienced a growth in population of
some 13% over this decade. Since 1991, however, the population of Karamea
has declined at a slower rate (Table 2.6.1).
6 Note the statistical Area Unit for Karamea includes the settlement and some surrounding farm
land�an area of approximately 5 km radius.

30
Age-sex structure
Karamea�s population in 1996 was slightly younger than that of the greater
Buller District, with a higher proportion of children and a lower proportion of
elderly persons. Young people have to leave the town for education and work
opportunities. Some go to boarding school in Christchurch or Nelson. Those
that stay or return usually join a family farm or business (Table 2.6.2).
Sex ratio M/F 1996: 1.01 (Karamea), 1.16 (Buller).
Dependency ratio 1996: 0.56 (Karamea), 0.54 (Buller).
TABLE 2 .6 .1 . KARAMEA�POPULATION CHANGES 1986�1996.
CENSUS YEAR KARAMEA BULLER DISTRICT
NO. OF PERSONS % CHANGE IN NO. OF PERSONS % CHANGE INPOPULATION POPULATION
1986 477 � 2028 �
1991 459 �3.8 2088 3.0
1996 453 �1.3 2298 10.1
TABLE 2 .6 .2 . AGE STRUCTURE OF THE POPULATION OF KARAMEA�1996.
KARAMEA BULLER DISTRICT
% 0�14 years 29.9 27.5
% 15�64 years 63.9 64.8
% 65 years & over 6.1 7.6
Total number of persons 441 2277
Ethnic composition
Maori comprised 9% of Karamea�s population in 1996, and about 7% of the
population of Buller District.
Employment status
The employment status of the workforce of Karamea differed considerably from
that of Buller as a whole, having a higher proportion of self-employed persons
and employers in 1996 (34% cf. 24%), but a lower proportion of wage and salary
earners (40% cf. 53%), as shown in Table 2.6.3. These figures reflect the
importance of farming and small businesses to the Karamea economy.
TABLE 2 .6 .3 . EMPLOYMENT STATUS OF THE WORKFORCE OF KARAMEA�1996.
AREA UNIT WAGE OR SELF -EMPLOYED & UNEMPLOYEDSALARY EMPLOYER OF OTHERS %
% %
Karamea 39.7 33.8 11.8
Buller District 52.8 23.7 12.0

31
Occupational status
Two-fifths of the workforce of Karamea were engaged in agriculture and fishery
occupations in 1996, while just over a quarter of Buller�s workforce belonged to
this category. There were also lower proportions of the town�s workforce
engaged in white collar occupations and blue collar occupations related to non-
primary industries when compared with Buller�s workforce (Table 2.6.4).
TABLE 2 .6 .4 . OCCUPATIONAL STATUS OF THE WORKFORCE OF
KARAMEA�1996.
OCCUPATIONAL CATEGORY KARAMEA BULLER DISTRICT
% OF WORKFORCE % OF WORKFORCE
Administrators/managers 8.3 10.1
Professionals & technicians 13.3 13.3
Clerks 6.7 8.1
Service/sales 11.7 12.3
Agriculture & fishery 40.0 26.3
Trades workers/machine operators/elementary occupations 15.1 25.0
Not specified 5.0 4.9
Total number of persons 180 924
Industry�major divisions
The major sources of employment for the workforce of Karamea in 1996 (Table
2.6.5) were the agriculture/forestry/fishing (39%), wholesale/retail/
accommodation (18%) and the community/social/personal services (16%)
sectors. The most significant feature of the sectoral distribution of Karamea�s
workforce was that two fifths of the town�s workers were employed in the
primary sector compared with just over a quarter for the District as a whole.
TABLE 2 .6 .5 . SECTORAL DISTRIBUTION OF THE WORKFORCE
OF KARAMEA�1996.
SECTOR KARAMEA BULLER DISTRICT
% OF WORKFORCE % OF WORKFORCE
Agriculture/forestry & fishing 39.3 26.7
Mining/quarrying � 3.9
Manufacturing 8.2 6.8
Electricity/gas/water � 0.3
Construction 1.6 5.2
Wholesale/retail/accommodation 18.0 21.2
Transport/communications 1.6 4.6
Business/financial 3.3 5.2
Govt administration & defence 1.6 3.6
Community/social/personal services 16.4 13.7
Not specified 9.8 8.8
Total number of persons 183 921
32
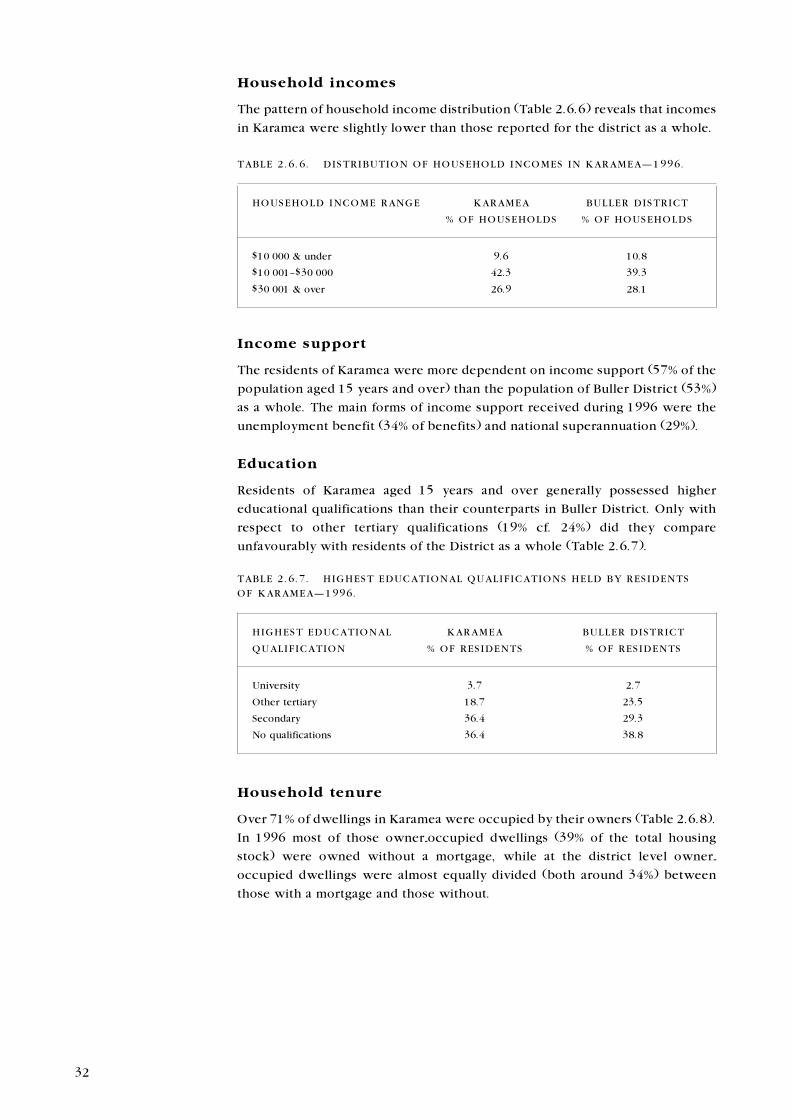
Household incomes
The pattern of household income distribution (Table 2.6.6) reveals that incomes
in Karamea were slightly lower than those reported for the district as a whole.
TABLE 2 .6 .6 . DISTRIBUTION OF HOUSEHOLD INCOMES IN KARAMEA�1996.
HOUSEHOLD INCOME RANGE KARAMEA BULLER DISTRICT
% OF HOUSEHOLDS % OF HOUSEHOLDS
$10 000 & under 9.6 10.8
$10 001�$30 000 42.3 39.3
$30 001 & over 26.9 28.1
Income support
The residents of Karamea were more dependent on income support (57% of the
population aged 15 years and over) than the population of Buller District (53%)
as a whole. The main forms of income support received during 1996 were the
unemployment benefit (34% of benefits) and national superannuation (29%).
Education
Residents of Karamea aged 15 years and over generally possessed higher
educational qualifications than their counterparts in Buller District. Only with
respect to other tertiary qualifications (19% cf. 24%) did they compare
unfavourably with residents of the District as a whole (Table 2.6.7).
TABLE 2 .6 .7 . HIGHEST EDUCATIONAL QUALIFICATIONS HELD BY RESIDENTS
OF KARAMEA�1996.
HIGHEST EDUCATIONAL KARAMEA BULLER DISTRICT
QUALIFICATION % OF RESIDENTS % OF RESIDENTS
University 3.7 2.7
Other tertiary 18.7 23.5
Secondary 36.4 29.3
No qualifications 36.4 38.8
Household tenure
Over 71% of dwellings in Karamea were occupied by their owners (Table 2.6.8).
In 1996 most of those owner-occupied dwellings (39% of the total housing
stock) were owned without a mortgage, while at the district level owner-
occupied dwellings were almost equally divided (both around 34%) between
those with a mortgage and those without.
33
Social and economic development
The Karamea community is very active7 and there were reported to be a lot of
newcomers. It is a mobile community�while some people move in, others
move out. There is a good medical centre. When the Medical Association (that
operates the medical centre) noted that there was a need for housing for the
elderly, Buller District Council contributed $150 000 and local fundraising
raised $30 000, and the land was donated. There are numerous community
organisations, including a strong volunteer fire brigade, St John, bowls group,
junior rugby and hockey. Golf was reported to be declining and senior rugby
struggling. It was noted, however, that very few of the unemployed get involved
in community activities. One group tried to get a Task Force Green person to do
some landscaping and couldn�t get anyone to do it. There is reputedly a lot of
marijuana growing in the area.
2 . 7 T H E W E S T P O R T C O A L F I E L D S A R E A
There are a number of small localities of a few hundred people that lie on or just
off the main road north from Westport to Karamea. A number are based
historically on coal mining, including Hector, Granity and Ngakawau. The large
opencast mine at Stockton still produces considerable quantities of high-quality
coal, but from low-labour, opencast methods. Employment is now based mainly
on agriculture, forestry, fishing and hunting. The populations in these small
communities are generally in a long-term decline following economic
restructuring, particularly in the coal mining industry. The old coal mining
areas, particularly Mokihinui, are popular for domestic recreation and holidays.
There are a number of small hotels, cafes, craft shops and businesses catering to
visitors and people passing along the road between Westport and Karamea.
There are also a number of short walks and a major historical attraction in the
old coal workings on the Denniston Plateau. Interviews indicated that these
businesses are benefiting from the increased flow of visitors along the road,
with the increase being attributed to the new Park.
Westport, a town south-west of Kahurangi National Park, at the mouth of the
Buller river, is the service and administrative centre for Buller District, the
Department of Conservation and other agencies. The population of the town
TABLE 2 .6 .8 . TENURE OF DWELLINGS IN KARAMEA�1996.
FORM OF TENURE KARAMEA BULLER DISTRICT
% OF DWELLINGS % OF DWELLINGS
Provided rent free 5.4 6.4
Rented 14.3 15.7
Owned with a mortgage 32.1 34.4
Owned without a mortgage 39.3 34.8
Total number of dwellings 168 897
7 There is a strong sense of belonging to a community and wanting to contribute to the well-being of
that community. Regular social functions are well attended by members of the wider community
including outlying farms.

34
declined by 6% from 4494 in 1991 to 4236 in 1996, while the population of
Buller District grew by 10%. Westport depends on farming, forestry and mining
in the greater area around the town, the cement manufacturing plant just
outside town, and the town�s port activity and a fishing fleet. A quarter of
Westport�s population are national superannuitants. Moreover, two-thirds of the
town�s residents are in receipt of some type of welfare benefit.
2 . 8 D E M O G R A P H I C O V E R V I E W
The study communities had falls in population between 1986 and 1991, mostly
resulting from economic restructuring, particularly the reduction and/or
removal of many government organisations and services. However, since 1991
they have had reasonably stable total populations. People in these communities
are predominantly of European descent. Populations are aging, with losses of
young people, particularly in the 15 to 19 age group.
Golden Bay and Karamea have relatively high numbers of self employed and
employers, reflecting industries based on family farming and small enterprises,
including small-scale tourism activities such as homestays, craft shops and
recreation/tours.

35
3. Current issues for the Parkand adjacent communities
In this section we examine issues related to the creation of Kahurangi National
Park from the perspective of the local communities. Wherever relevant and
possible we compare the nature and status of these issues today to those that
prevailed during the investigation stage of the Park in 1993 (as reported in the
1993 assessment).
Issues addressed are:
� the use and maintenance of tracks and huts,
� the management of concessions,
� access roads,
� the trans Park road proposal,
� helicopter operations,
� recreational hunting,
� mountain bikes,
� pest and weed control, and other management issues,
� mining,
� forestry and sphagnum moss,
� water resources,
� eeling.
3 . 1 U S E A N D M A I N T E N A N C E O F T R A C K S A N DH U T S
The main walking tracks
The 1993 assessment found a general concern that the tourism industry was not
adequately using tracks in the north-west Nelson area. Use was uneven, and
concentrated on the main tracks8, especially the Abel Tasman coastal track,
during the peak summer months. As a result, DOC experienced considerable
problems managing the main tracks and associated facilities. Social carrying
capacity for more specialised tourists9 appeared to have been reached, with
overcrowding experienced in summer months. These problems cannot
necessarily be overcome by transferring people from Abel Tasman to other
tracks such as the Heaphy or Wangapeka. These trampers are often �one timers�
and the Abel Tasman experience is not available from other tracks, which may
be more difficult and do not provide the special coastal experiences.
Nonetheless, the two main options identified for management were increased
shoulder seasons (the period between the peak and off peak seasons) and
encouraging more trampers to use the Kahurangi area.
8 The main tracks were considered to be the Heaphy and Wangapeka tracks (Kahurangi National
Park) and the Abel Tasman Walkway (Abel Tasman National Park).
9 Some tourist companies offer tours to special interest groups such as botanists, geologists and
ornithologists, and provide special facilities and specially qualified guides.

36
Overall, people in the tourism industry agreed in 1993 that the Heaphy Track
was not being used to capacity�either physical or social. Peak use occurred in
the 1970s when there was an expectation that a road would be built linking
Karamea and Collingwood, motivating people to use the track before the
experience changed as a consequence of the road. Since then, numbers have
declined, with somewhere between 2000 and 4000 people walking it annually
until the early 1990s. It was considered in 1993 that improved facilities on the
track would allow an increase in numbers, both in the peak period and during
the shoulder periods.
In 1998 these dilemmas remain, although it appears that patterns of domestic
tramping have changed and international visitors are increasing. Some people
find with that changing patterns of employment there is less time to tramp, and
tramps tend to be shorter. The new school holidays with the four-term year are
also changing the pattern of use. For example, the Abel Tasman Track has been
in heavy use in the new October holiday and, as a result, DOC needs to get hut
wardens in earlier.
There are few reliable sets of track-counter data showing trends for tracks in the
Kahurangi National Park. Data on the use of major tracks in the period 1988 to
1997 are shown in Fig. 2. Use of the Heaphy Track increased markedly in the
period from 1993 to 1995, prior to the gazetting of the Park, and has since
declined back to around the 4000 per annum mark. The increase from 1993 to
1995 is attributed to an influx of mountain bikers using the track before it was
closed to them under Park rules. The use of the Wangapeka Track has remained
relatively stable. Visitor numbers to the Upper Cobb have also remained
relatively stable, with two years of highest use in 1993 and 1996. Use of the Mt
Arthur track increased in the early 1990s, but the Mt Arthur Tablelands have
seen a marked increase since 1995.
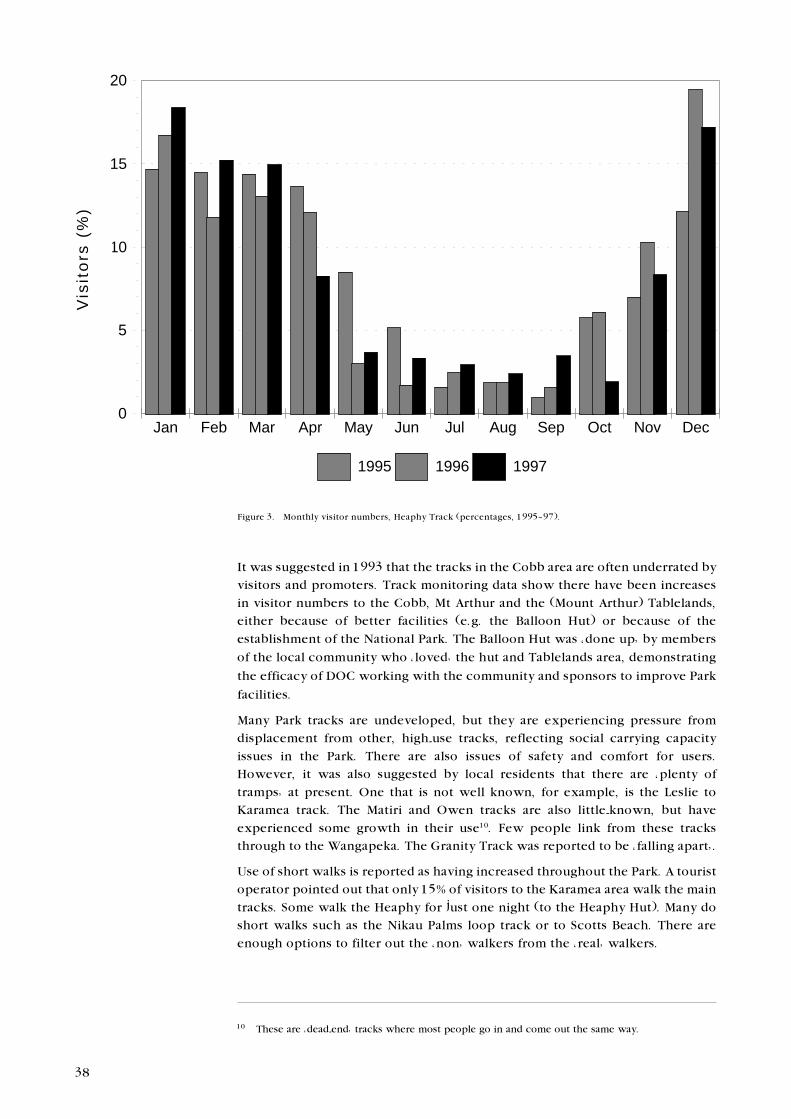
Figure 3 shows the highly seasonal nature of use of the Heaphy Track. Indeed it
became more so in the 1995 to 1997 period, although there has been a small
increase in the proportion of winter use. At peak times, huts on the Heaphy are
full and one-way walking has been proposed, although this would not be a
popular response. The Wangapeka is not used to capacity, and its use could be
increased with existing facilities and by encouraging people to use the track
throughout the year. Interviews with DOC staff and tourism businesses pointed
to a decrease in use of the track in the longer term, and deterioration of its
surface and facilities. It was suggested that the track was promoted by New
Zealand Forest Service (NZFS) but not by DOC, and use decreased when staffing
was stopped in 1990/91. There have been recent problems over access through
private farm land at the Karamea end, necessitating 2 km of rerouting. A 3-km
stretch of new track would mean the Wangapeka could do a loop to Karamea via
Granite Creek.
Increase in use of other track and huts
There was a strong expectation and prediction in 1993 that the new park would
increase demand for all types of walks, including the main tracks, lesser-known
tracks and short walks. Considerable anecdotal evidence, plus DOC staff
observations and data from hut books show that this increased use had indeed
eventuated across the Park by 1998. Users are a mix of domestic and
international visitors. Furthermore, it is widely considered that the Park will
continue to attract more use, increasing the need to manage social and
ecological impacts.

37
Figure 2. Track visitor monitoring data by year.
0
2,000
4,000
6,000
8,000
1987 1990 1993 1996
Heaphy
0
2,000
4,000
6,000
8,000
1987 1990 1993 1996
Wangapeka
0
2,000
4,000
6,000
8,000
1987 1990 1993 1996
Mount Authur
0
2,000
4,000
6,000
8,000
1987 1990 1993 1996
Tablelands
0
2,000
4,000
6,000
8,000
1987 1990 1993 1996
Upper Cobb
8000
8000
8000
8000
8000
Mount Arthur
2000
4000
6000
4000
6000
2000
6000
4000
2000
6000
4000
2000
6000
4000
2000
38
It was suggested in 1993 that the tracks in the Cobb area are often underrated by
visitors and promoters. Track monitoring data show there have been increases
in visitor numbers to the Cobb, Mt Arthur and the (Mount Arthur) Tablelands,
either because of better facilities (e.g. the Balloon Hut) or because of the
establishment of the National Park. The Balloon Hut was �done up� by members
of the local community who �loved� the hut and Tablelands area, demonstrating
the efficacy of DOC working with the community and sponsors to improve Park
facilities.
Many Park tracks are undeveloped, but they are experiencing pressure from
displacement from other, high-use tracks, reflecting social carrying capacity
issues in the Park. There are also issues of safety and comfort for users.
However, it was also suggested by local residents that there are �plenty of
tramps� at present. One that is not well known, for example, is the Leslie to
Karamea track. The Matiri and Owen tracks are also little-known, but have
experienced some growth in their use10. Few people link from these tracks
through to the Wangapeka. The Granity Track was reported to be �falling apart�.
Use of short walks is reported as having increased throughout the Park. A tourist
operator pointed out that only 15% of visitors to the Karamea area walk the main
tracks. Some walk the Heaphy for just one night (to the Heaphy Hut). Many do
short walks such as the Nikau Palms loop track or to Scotts Beach. There are
enough options to filter out the �non� walkers from the �real� walkers.
Figure 3. Monthly visitor numbers, Heaphy Track (percentages, 1995�97).
0
5
10
15
20
Per
cent
age
Jan Feb Mar Apr May Jun Jul Aug Sep Oct Nov Dec
1995 1996 1997
10 These are �dead-end� tracks where most people go in and come out the same way.
Vis
ito
rs (
%)
39
Upkeep of tracks and huts
In 1993 there was public understanding of funding constraints in adequately
maintaining and developing huts and tracks in the Park area. However, there was
also concern about the allocation of funds between tracks and huts, and amongst
DOC Conservancies. For instance, people believed that major tracks such as the
Abel Tasman, the Heaphy and, to a lesser extent, the Wangapeka, were being
maintained at the expense of other shorter and less popular tracks in the area.
There was also a perception that hut fees collected in the old Forest Park area
ended up in a �consolidated fund�, and could not, therefore, be applied to track
and hut maintenance where they were generated.
Given the increase in tourism and use of facilities across the Park, as noted
above, these issues have intensified since 1993. The Department of
Conservation is realistic in acknowledging that it has strictly limited funds to
carry out maintenance, and this should be done according to plan and
agreement, both internally and with the public. Therefore they have instituted a
national priority system for expenditure, and this is part of the Draft
Management Plan for the Park. The reality of this system is that some tracks and
huts will not be maintained.
Numerous comments were made by residents and tourist operators on the lack
of track and hut maintenance. For example, the Heaphy track was described as
is in �good shape� on the Nelson side but as �very poorly maintained and in bad
shape� on the West Coast side. Other facilities such as toilets at the Kohaihai end
of the Heaphy Track were reported to need maintenance and, despite some new
signs, there could be more signage. DOC were described as �pulling out
strategically placed huts� from the Park. DOC staff noted that they were short on
labour for hut and track maintenance, despite a casual labour allocation.
Nevertheless, there has been considerable expenditure on the Heaphy Track, in
particular, over the past two years.
Department of Conservation staff believe that while there are clear needs, the
standard of facilities in Kahurangi are generally good, and better than in some
other national parks. Funding is a problem across the country. Other factors
affect maintenance and new structures. A DOC Quality and Hazard Management
System set in place since the platform collapse at Cave Creek in 1995 includes
provision for huts and structures. The provisions of the new Health and Safety in
Employment legislation and the Building Act may also discourage DOC from
taking responsibility for additional structures such as huts and swing bridges.
New tracks and huts
The 1993 study pointed to the need to develop new tracks in the Park. So far no
track development has taken place. Indeed, DOC consider new tracks are �out of
the question� at the moment. Under present funding levels DOC is only able to
bring structures up to standard and maintain existing tracks. The argument is
�quality not quantity�. However, communities around the park consider that in
creating a national park there was a commitment to development in order to
maximise local benefits. They consider they were given assurances that
�facilities will not be lost�. Eventually the question of Park development funding
will need to be addressed.

40
There were a number of suggestions for track development. There is no marked
loop track between the Thousand Acre Plateau and the Matiri, although one was
reputedly investigated some years ago. Development would include a better hut
placement. It is also possible to go up the Matiri valley and join the Wangapeka
Track (�if you can read maps� expertly!) Another possibility would be a new
track through Granite Creek. Easy, �in and out� or loop tracks are also suggested,
particularly near the main Park communities. For example, a track looping from
the Heaphy to the Oparara arches near Karamea has been suggested. There were
several suggestions that short walks be developed from Karamea.
Not all proposals are confined to the Park. One respondent proposed the idea of
a linked track system around Golden Bay, perhaps similar to the Banks Peninsula
track. This would require the co-ordination of private sector operators and land
owners, community groups, DOC and the Tasman District Council.
Currently there is little community involvement in the development of tracks
and huts. In Murchison the local community have been involved with
development of a local walk, but not in the Park. Taskforce Green was also
suggested as a mechanism that could be used to assist any track project. One
way of enhancing existing track use and funding track development might be
through encouraging sponsorship of appropriate facilities.
3 . 2 T H E M A N A G E M E N T O F C O N C E S S I O N S
The 1993 assessment indicated frequent dissatisfaction with the allocation of
concessions within the then Forest Park. Based on experiences with ongoing
problems in Paparoa National Park, tourist industry people anticipated problems
with the proposed national park. Concerns included delays in finalising the
management plan, costs and delays in administering applications, length of
concessions, and percentage payments to DOC.
Since 1993 DOC has made considerable changes and developed a national
system for dealing with concessions. Under the Conservation Amendment Act
(1996) applications for concessions must identify the possible effects of their
proposed activity, and suggest measures to avoid, remedy or mitigate any
potential adverse effects. This is a more �enabling� approach. Policy on
concessions is provided in the Kahurangi Draft Management Plan. Nonetheless,
there appear to be some remaining inconsistencies and problems in the way
concessions are managed. There is still a need to co-ordinate concession
management in DOC, through area, conservancy, regional and national levels.
There has been a notable increase in tourist concessions in the Park, most for
guided walks. The concessionaires are based mainly in Golden Bay, Motueka and
Karamea. Some are New Zealand wide, multi-conservancy concessions, e.g. NZ
Experience. There has also been an increase in illegal operations. The growth
overall is modest, and any expectation that �hordes would gallop in� has not
been fulfilled. The increase in tourist businesses is discussed in more detail in
Section 4.
Issues identified for concessions (across a number of interviews with tourism
operators and DOC staff) were:

41
� The process of applying for a concession was described as too �onerous�,
including safety questions, information on effects and their amelioration,
personal and business financial information.
� Fees are a concern. The minimum fee is $200 and it usually costs $700�800
for processing costs, for an ordinary 5-year permit.
� Concern was expressed about the prospect of �tendering� for concessions,
where an existing business might have its concession tendered away. (This
does not appear to be part of DOC policy).
� In contrast, other respondents were concerned about fairness when, with
the aim of limiting or managing effects, DOC issues only one consession
Others may want this operation opened up for competition. Access to cave
systems is one area of concern, with further restrictions proposed in the
Draft Management Plan.
� The management planning process has led to uncertainty, with
concessionaires reporting they have been advised to delay submitting new
proposals until the Management Plan is complete.
� The adequacy of dialogue and flow of information between DOC and
concessionaires has been raised. An example was the question, �What
happens to concession funds?�, which remains an issue from 1993.
� There needs to be more intense monitoring of concessions, their operation
and effects, and resources are required for DOC to do this task properly.
3 . 3 A C C E S S R O A D S
The 1993 assessment concluded that for the full social and economic values of a
national park to be achieved a wide network of access roads needs to be
maintained, or further developed through joint funding arrangements (e.g.
DOC, district councils & other parties). Park development and access were seen
to be interrelated. Some problems in access to the tracks existed because there
were no regular bus services, but with an increase in numbers of visitors local
bus operators considered they could easily extend their services.
It was clear in 1993 that local councils faced an inevitable problem justifying the
construction and maintenance of roads into areas that are, by their very nature,
subject to low rate takes. There are precedents for DOC jointly maintaining
roads that provide access to park facilities and features. It was suggested that
agreements and liaison between DOC and local councils, and with the tourism
industry, would be needed in the future. The position had not changed in 1998.
Furthermore, proposed road reforms may also have an impact on little-used
roads in the area.
The new Park is placing clear pressure on access roads. Examples given were
those to the Cobb Valley, Mt Arthur, the Matiri Valley, the Wangapeka Track
from Karamea, the Oparara Arches, and the Fenian Track (near Karamea).
Comments were made that access roads are part of the upgrade of facilities
generally needed. Poor roads and lack of maintenance were cited.

42
Many comments were made in Karamea about the state of the Oparara Arches
Road, which has been closed for several periods of time, and the Fenian, which
remains closed. Financial resources were the limitation for all interested parties.
The Oparara road has been improved, but could be better, and remains difficult
for camper vans, which are adding to the problem. On the other hand, improved
access to this area will increase people pressure on the cave systems. For the
Fenian, there has been an issue in co-ordination of effort between DOC, the
Buller District Council and the West Coast Regional Council, which controls a
quarry that restricts access because of dangerous rock overhangs.
Transfund (the government road funding agency) funds all highways and a
number of special purpose roads where there is no rating base but a public
need�in most cases because of a tourist attraction. Roading policy is presently
being reviewed. In general, the present policy for special purpose roads is that
Transfund provide the funding and the local (District) Council does the work. In
some cases (Franz and Fox glacier roads, and Hooker Valley Road) Transfund
gives the funding to DOC, who does the work. There are discussions at present
about some of the roads around Karamea. There are also a number of unformed
roads in the Park, vested in local authorities, and the Draft Management Plan
indicates that these will be formally incorporated into the Park.
There are commercial services providing shuttles to the main track ends.
However, new services are required as new areas open up. For example, access
into the Matiri Valley is difficult without a vehicle. Some visitors bike in, while
others hitch a ride on school buses. Some motel owners will take visitors in by
car. There is potential for a service to be started from Murchison as use of the
southern area of the Park develops.
3 . 4 T H E T R A N S - P A R K R O A D P R O P O S A L
During the park investigations in 1993 it was hoped by a number of parties that
a national park would not �shut out� a road link between Nelson and the West
Coast as a �future� option. Comments about the need for such a road varied then,
with a polarisation of views. Neither was there agreement as to where such a
road could be located, with north from Karamea along the coast, to Collingwood
via the Heaphy, or more directly via the Wangapeka, being the main options. It
was maintained that the latter route made the best sense in terms of its utility for
general use as a short cut to Nelson, serving sectors such as agriculture as well
as tourism.
While there did not appear to be such a strong call for a road in 1997, it does
remain an issue for some people. As a result, the proposed road has been
included in the Draft Management Plan, which states that any road proposal
would have to go through a full resource consent process. The road area would
need to be excluded from the Park and vested in a new managing authority.
It is also possible that continuing tourism development in Karamea will increase
opposition to a road from this sector. A number of operators made the point that
the very �isolation� of Karamea was an attraction in itself and a basis for
promoting the area.

43
3 . 5 H E L I C O P T E R O P E R A T I O N S
Prior to the gazetting of the national park, helicopter operators could enter the
Forest Park, excluding the wilderness area, if they had concessions to do so.
Operators based in Motueka, Nelson, and Westport were taking in rafters,
fishers, trampers and hunters, as well as their supplies. DOC personnel were
using helicopters for essential management such as the maintenance and
development of huts and tracks and also for Search and Rescue. Most of the
issues for helicopters revolved around restrictions to flying over or landing in
the Northwest Nelson Wilderness Area. The restrictions were seen to limit
existing activities and the potential for adventure tourism.
Little has changed. The wilderness area was incorporated into the Park as an
integral feature and helicopter access is a contentious issue for people who
want to fly in and around it, particularly along the Karamea River and its
tributaries. There are also conflicts between helicopters and other users in other
parts of the Park, which are wilderness in nature, if not in name. It is evident
that there are differences in perception between people in local communities
who are used to helicopters in their lives and work, and visitors who are in the
Park for peace and solitude.
The level of helicopter use has changed, but the types of use are similar. A
�massive�11 increase of helicopters in the Park was described. They can appear
very noisy, especially in the headwater fisheries and similar sensitive areas. On
the other hand, helicopters are opening up the Park to people who would not
otherwise get in, such as fishers and rafters. Kayakers are becoming interested
in helicopter use as well. Some tourism people noted that helicopters are a good
way of getting visitors�especially overseas tourists�into the Park. People
involved in the walking side of tourism, however, described the helicopters as
very �invasive� and there is potential for conflict between different park users
and different branches of the industry.
Key issues are use of landing sites along the Karamea River, and access for
fishing and rafting. The Draft Management Plan recognises the demand for
helicopter access to the Wilderness Area, but notes the inherent conflict with
the values of the area. Helicopter hunting is allowed for pest control, however
several people interviewed gave accounts of illegal passenger transport, raising
the issue of compliance and monitoring. The Department of Conservation itself
also adds to the helicopter use in ferrying staff and supplies. Management
techniques could include helicopter-free areas, limits to landing sites,
conditions on concessions and time (daily and seasonal) restrictions. Co-
operation between helicopter operators could reduce the number of trips by
minimising one-way empty trips, where helicopters at present take people or
equipment into an area and return empty.
Rafting
Rafting is an increasing tourism activity and one of the main users of helicopters
for access. There are several companies operating in the Park, primarily on the
Karamea, and nearby rivers, especially the Buller. To raft the stretch of the
Karamea that flows through the Wilderness Area requires some portage. To
11 No data were available.
44
avoid this, there would need to be a landing site in the Wilderness. Access lower
down would also allow for shorter trips. Experience in adjacent areas indicates
that shorter trips would be popular.
It was noted that some of the locals view rafting companies on the Murchison
side of the Park as �fly-by-nighters�, without realising �how much money they
bring into the community�.
Trout fishing
There is increasing interest in the Park from tourist fishers and guiding
operators, fishing mainly for brown trout, some of trophy size. The Karamea and
its tributaries �the Leslie, Ugly and Roaring Lion�are the most popular rivers.
In 1993 the Karamea catchment was noted to be a high-value fishery where the
intensity of fishing is low because of its remoteness. The wilderness character
and scenic values were considered to be rated highly by fishers. Use was
expected to increase, and put pressure on the resource despite �catch and
release� policies. There was a concern in 1993 that national park status may limit
any stock enhancement.
Observations from Fish and Game (Nelson) and tourism operators confirm that
there has been increased visitor pressure on the Park fishery in recent years.
While there are no numeric data, Fish and Game have noted an increase in
licence sales to overseas visitors and increased activity by fishing guides. Fishers
remain attracted by both the nature of the fishery (large brown trout) and the
isolated, wilderness nature of the setting. It is likely that the increasing interest
in the fishery is more a result of international tourism promotion of New
Zealand for trout fishing than the creation of a national park. Certainly the Park
does not appear to have constrained activity. In fact, despite the isolation and
limited helicopter access to some areas, it is more likely that social carrying
capacity and behaviour of the stock under pressure are the strongest limiting
factors12.
Fish and Game generally do not stock sports fisheries that have not been stocked
previously, unless there are �extreme� circumstances. Their policy is to keep trout
fisheries such as the Karamea as �wild� and �self-sustaining� resources, thus
avoiding any direct conflict over the issue of indigenous versus introduced fauna
in a national park.
3 . 6 R E C R E A T I O N A L H U N T I N G
The original Forest Park had a Recreational Hunting Area (RHA) that was highly
regarded by hunters and hunting organisations (particularly the Deerstalkers
Association). The value of the area stemmed from provisions, within a
management plan, for herd enhancement, and hunting restrictions to protect
animal numbers. Loss of the Area was a threat to hunters, with a shift to hunting
for pest control as the priority objective in a national park, rather than
recreation. Recreational hunting continues in the Park, however, and the Draft
Management Plan acknowledges hunting as a legitimate activity, as the first line
of attack in pest control.
12 Research by the Cawthron Institute in Nelson is currently investigating fishing behaviour and
impacts on back country rivers, including rivers in Kahurangi National Park.

45
3 . 7 M O U N T A I N B I K E S
Mountain biking is a popular activity, especially in the Nelson and Golden Bay
areas, with increasing activity from tourists. Prior to the Park the biking tracks at
Cobb and Mt Arthur were popular, as was the Heaphy Track. With formation of
the Park there was concern about provisions for biking as bikes are banned from
national parks.
Prior to the gazetting of the Park there were a noticeable number of mountain
bikes, indeed the proposal for a park generated interest from bikers, especially
those taking the last opportunity to bike the Heaphy. Their exclusion from the
Park has caused a marked reduction in the number of cyclists coming through
towns such as Karamea. Mountain bike access to the Park remains a major, and
contentious, issue for bikers and tourist operators who service this sector of the
industry.
It was acknowledged that there is potential for real conflict between walkers
and bikers, as evident when bikes did use the Heaphy Track. There could be a
compromise, such as opening the Heaphy to cyclists at certain times, e.g.
October to November, but as the Draft Management Plan points out, this would
require a change in national park policy. Another option is to provide biking
alternatives outside the Park, including on other DOC estate. There is a lack of
mountain bike tracks in the Karamea area in particular.
3 . 8 P E S T A N D W E E D C O N T R O L A N D O T H E RM A N A G E M E N T I S S U E S
In 1993 farmers and others were critical of DOC�s erosion containment, clearing
of waterways, control of weeds and pests such as ragwort, gorse, goats and
possums, and fire control. With a change of land status, they predicted that
these activities would be further undermined. These are all issues covered in the
Draft Management Plan. The main concern today is the same as that before the
Park. Does DOC have the resources, rather than the will, to implement the
required programmes?
These are issues that require ongoing communication and liaison with the
boundary communities.
3 . 9 M I N I N G
The mining industry expressed concern in the 1993 assessment that national
park status would preclude future mineral investigation and mining over a large
part of the South Island where the status of mineral resources was still largely
unknown. The primary response to this issue by the authorities defining the
Park boundaries was to exclude areas with evidence of commercial prospects
for minerals from the Park. These areas included Sam�s Creek and Mt Burnett.
There is the potential for government to re-designate particular areas later if
commercial mining becomes a realistic prospect. In addition, while the Crown
Minerals Amendment Act (No. 2, 1997) prohibits mining in National parks, a
few, very low impact activities can still be permitted (as specified in the Act).

46
3 . 1 0 F O R E S T R Y A N D S P H A G N U M M O S S
In 1993 there were people in the communities bordering the Park who believed
that sustainable yield forestry, tourism and national park status were not
necessarily incompatible. They were concerned that the West Coast Forestry
Accord that was meant to provide a medium-term supply of indigenous timber in
Karamea would not be fulfilled. They were suspicious of national park status as
a further constraint to forestry cutting and proposed that �buffer zones� be used
to provide areas of sustained-yield timber production with a mix of exotics and
indigenous production. These zones were not created around the Park. One
exception are some �scruffy� Tasmanian blackwood groves in the Park for which
Timberlands have one-off cutting rights. Neither have exotics been planted on
any scale.
Sphagnum moss production was also an issue for the Park investigations. In
particular, the West Coast communities around Karamea have obtained
considerable part-time employment from gathering and processing the moss.
But areas with commercial value for sphagnum moss production also tended to
have lower conservation values, and these were largely excluded from the Park,
so the Park has had no discernable impact on this activity.
3 . 1 1 W A T E R R E S O U R C E S
There is considerable potential for small and medium capacity hydro electricity
development in the area of the Park, and interest groups were concerned in
1993 that any land status change may limit future developments. Indeed, case
law prohibits hydro-electric schemes of any size from national parks. Yet there
is still potential for low-impact, micro-hydro schemes to be considered.
Although there are potential micro-hydro areas outside the Park, surrounding
communities still believe that there is also potential for low-impact schemes
drawing water from the Park, and they consider that this option has been limited
for them. There are also a number of existing use rights for farmers and
communities who draw water from the Park, and concern that these need to be
protected.
3 . 1 2 E E L I N G
While eel fisheries are managed by the Ministry of Fisheries, a fisher needs a
permit from DOC to operate in the Park. Cultural harvest is also allowed (for
non-commercial use). There is one eeler operating in the Park at present, and
the practices of this eeler have raised concern about the sustainability of the
resource and the role of a national park in protecting eel habitat. There is
uncertainty about the basis on which the current �permit� operates, and a need
was identified for monitoring this type of activity more closely.
47
4. Tourism development andeconomic impacts
4 . 1 E C O N O M I C P R O J E C T I O N S F R O M T H E 1 9 9 3
A S S E S S M E N T
The 1993 assessment of the Park noted that any new economic activity
generated by it needed to be balanced against the opportunity costs. But the
remoteness of the northwest Nelson area and limited available infrastructure
meant that many of the natural resources remained unmeasured or unexploited,
such as by mining or hydro electricity (both prohibited by law in National
Parks). Also, any new industry, such as hydro-electric generation, could be
expected to be independent of the gazetting of the national park and therefore
have no impact on the economics of the proposal itself.
The economic analysis undertaken in 1993 projected the direct impact of the
Park to be a net increase of about 50 full-time equivalent jobs over the first five
years in the area adjacent to the proposed national park, including Westport and
Karamea, Murchison, Motueka and Takaka (but not Nelson) plus a number of
other much smaller settlements around the boundary of the Park. At a national
level, the indirect impact was assessed as another 35 full-time equivalent jobs.
The direct jobs projected ranged from hostel operators to concessionaires and
DOC maintenance and administrative staff.
Loss of proposed mining activity was seen as a potentially large opportunity cost
in terms of employment (assessed at up to 150 FTE). But, as noted above, this
loss has been avoided by excluding the major known mining prospects.
4 . 2 T H E T O U R I S M I N D U S T R Y
The 1993 assessment indicated considerable agreement that tourism provided
an opportunity for the communities around the Park to become more
economically viable, and there was some confidence that a national park would
enhance the tourism industry. However, this confidence was not universal, and
it was too early to discern any clear impacts then. At the time tourism was
already becoming increasingly important for the communities within the
vicinity of the investigation area. The smaller centres had narrow, resource-
based economies, which had felt the effects of public service restructuring,
economic recession and decreasing mining and forestry activity.
In 1993 there was clear evidence that although summer domestic visitors
predominated, the tourism industry was diversifying. Overseas visitors were
coming to the top of the South Island, attracted to the forests, mountains and
rivers, and beaches. Many of these attractions already lay within the DOC estate,
particularly the major walking tracks.
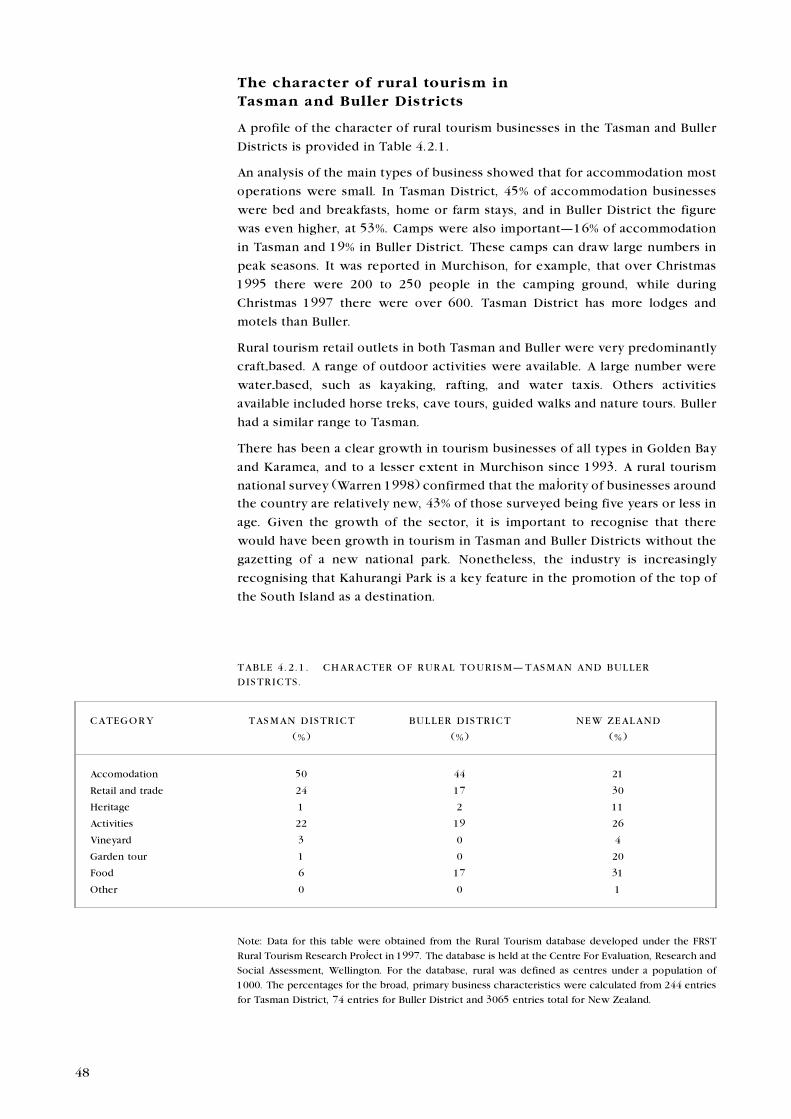
48
The character of rural tourism inTasman and Buller Districts
A profile of the character of rural tourism businesses in the Tasman and Buller
Districts is provided in Table 4.2.1.
An analysis of the main types of business showed that for accommodation most
operations were small. In Tasman District, 45% of accommodation businesses
were bed and breakfasts, home or farm stays, and in Buller District the figure
was even higher, at 53%. Camps were also important�16% of accommodation
in Tasman and 19% in Buller District. These camps can draw large numbers in
peak seasons. It was reported in Murchison, for example, that over Christmas
1995 there were 200 to 250 people in the camping ground, while during
Christmas 1997 there were over 600. Tasman District has more lodges and
motels than Buller.
Rural tourism retail outlets in both Tasman and Buller were very predominantly
craft-based. A range of outdoor activities were available. A large number were
water-based, such as kayaking, rafting, and water taxis. Others activities
available included horse treks, cave tours, guided walks and nature tours. Buller
had a similar range to Tasman.
There has been a clear growth in tourism businesses of all types in Golden Bay
and Karamea, and to a lesser extent in Murchison since 1993. A rural tourism
national survey (Warren 1998) confirmed that the majority of businesses around
the country are relatively new, 43% of those surveyed being five years or less in
age. Given the growth of the sector, it is important to recognise that there
would have been growth in tourism in Tasman and Buller Districts without the
gazetting of a new national park. Nonetheless, the industry is increasingly
recognising that Kahurangi Park is a key feature in the promotion of the top of
the South Island as a destination.
TABLE 4 .2 .1 . CHARACTER OF RURAL TOURISM�TASMAN AND BULLER
DISTRICTS.
CATEGORY TASMAN DISTRICT BULLER DISTRICT NEW ZEALAND
(%) (%) (%)
Accomodation 50 44 21
Retail and trade 24 17 30
Heritage 1 2 11
Activities 22 19 26
Vineyard 3 0 4
Garden tour 1 0 20
Food 6 17 31
Other 0 0 1
Note: Data for this table were obtained from the Rural Tourism database developed under the FRST
Rural Tourism Research Project in 1997. The database is held at the Centre For Evaluation, Research and
Social Assessment, Wellington. For the database, rural was defined as centres under a population of
1000. The percentages for the broad, primary business characteristics were calculated from 244 entries
for Tasman District, 74 entries for Buller District and 3065 entries total for New Zealand.

49
The most marked recent growth has been in Karamea. Before the �Last Resort�
accommodation and activity centre venture was established, Karamea had a
camping ground and one �motel�. Now there is a range of accommodation with
recent expansion of existing businesses including the �Last Resort�.
Accommodation providing 50 new beds in Karamea has been built by three
operators since 1995. Growth in Karamea would probably have happened
without the gazetting of the Park, as the New Zealand tourist mix diversified and
new destinations, including natural, isolated areas were sought out. However,
the Park is adding to the growth and, conversely, without the growth there
would be a limited visitor base in the west for access to the Park�s resources.
In many ways Karamea appears to be at the beginning of a tourism growth
curve, as recorded in other tourism communities. In terms of the tourism
growth cycle (Warren & Taylor 1994), Karamea is at the �involvement� stage�
when the volume of tourism grows and becomes more regular, and some
residents provide facilities designed primarily for visitors. The next stage is
�development� when the area will become a well-defined destination and
numbers increase rapidly. Golden Bay is well into a development phase, now
attracting outside investment. Murchison, already with a steady flow of road
traffic, is also experiencing some growth as a destination in its own right.
The character of the visitors
There has been growth in visitor numbers (domestic and overseas) in
communities around the Park. There are limited local data that together show
recent trends:
� Takaka�The Visitor Information Centre recorded an increase in visitor
numbers from 1995 (21 804) to 1996 (25 393) and to 1997 (26 811), an
increase of 23% in three years.
� Murchison�The Visitor Information Centre (which is closed in winter)
recorded an increase from 1994/95 (10 200) to 1995/96 (11 000) to 1996/97
(12 300) and to 1997/98 (12 600), an increase of 24% over four years.
� Karamea�The Karamea Resource and Information Centre recorded an
increase in visitor numbers from 1995 (4427) to 1996 (5579) to 1997 (7829),
an increase of 77% in three years.
� Westport Visitor Information Centre recorded an increase from 1995
(36 000) to 1997 (42 900) for visitor inquiries at the Centre, an increase of
19% over three years.
Visitor numbers are constrained by available accommodation in the high season
(summer), despite the new units that have been built in towns like Collingwood
and Karamea. Operators are expanding in response to what they see as a definite
increase in visitor numbers over the past few years and a perception that this
trend will continue.
Operators report a highly seasonal visitor profile, as they did in 1993.
Seasonality is shown in visitor data, for example in Westport (Fig. 4). The main
season is December to February. The shoulder seasons are October to November
and March to April. There is a very distinct winter �off� season. These seasonal
variations are similar to those for visitor numbers on the walking tracks (Section
3.1 above). Despite some signs of more visitors during the shoulder seasons�
spring 1997 being �one of the best shoulder seasons ever��seasonal data follow

50
the Heaphy track data in showing that an even stronger summer period has
developed. Whitebaiters bolster the early shoulder on the West Coast
(Karamea).
The national survey of rural tourism businesses identified that domestic tourists
are the mainstay of their market, with little change between 1991 and 1996
(Warren 1998). There was a similar pattern from the interviews with operators
around the Park, who have a high dependency on domestic visitors. The majority
of international visitors are European, with large numbers from Germany, as well
as some from the United Kingdom, Switzerland, and Israel. Others come from the
United States of America, Australia and South Africa. There are some Asian
visitors, one of the main sources being language schools in Nelson.
People come on holiday and they have disposable income, which is spent on
activities, arts and craft work. Visitors want friendly, smaller scale and not too
expensive accommodation. But there has been a marked shift from backpackers,
with fewer �Kiwi Experience� types. There were reported to be no in-bound
backpacker trips to Golden Bay. More are in the 50-plus age group. There has
been an increase in campervans, including the smaller vans. There are fewer
bikers and hitchhikers but increased numbers of kayakers, rafters and fishers,
people wanting outdoors experiences including those available in the Park.
People are staying longer�typically for three days. In Karamea, The �Last
Resort� complex has created a market and become a destination in itself. All
these patterns in visitor numbers and types are confirmed by the national rural
tourism study (Warren 1998).
As noted in Section 3.1, in the discussion about walking tracks, there has been
an increase in visitor numbers on some of the lesser-known tracks. The DOC
Motueka office reported that records of hut log books show an increase in
international visitors, (from negligible to around 20%) in areas such as the
0
5
10
15
20 P
erce
ntag
e
Jan Feb Mar Apr May Jun Jul Aug Sep Oct Nov Dec
1995 1996 1997
Figure 4. Monthly visitor numbers Westport (percentages, 1995�97).
Vis
ito
rs (
%)

51
Mount Arthur Tablelands, possibly because of better facilities (e.g. Balloon Hut)
and/or because of the establishment of the Park. An operator commented that
the car park at Mt Arthur �is always full now�. The Department of Conservation
in Murchison noted a similar, if smaller, shift with international visitors around
5�10% and increasing. Overall there has been an increase in all types of visitors
to more �difficult� areas, and also to the short, popular walks.
The character of the tourism businesses
There are more tourism operators in and around the Park, but not necessarily
enough new tourists to fill the services supplied. As a result, there is
considerable competition between businesses. In addition to new businesses,
others have changed hands�a third of the motels were reported to change
hands each year. However, comments made by local tourism operators and
residents indicated that there are believed to be limits to tourism development,
so continual growth in numbers should not necessarily be their aim.
Data from interviews of tourist-related businesses around the Park confirm the
results of the national rural tourism survey (Warren 1998)�that the majority of
these types of businesses are relatively new and their current operators have not
been at it for long. Of 26 operators around the Park for whom length of
operation was available from interviews, 58% had been operating for less than
three years. The great majority of these were new businesses as well (i.e. started
by the operator interviewed). The remaining 42% of the businesses were mostly
more than ten years old�suggesting a strong distinction between those
business that are well established (and primarily based on domestic tourism)
and those that are new; indeed, have started in the time of the Park, and are
focussed much more on international as well as domestic tourists.
As also found in the national survey (Warren 1998), many of the tourism
businesses around the Park are part-time. They are typically associated with
farming, other employment, and the provision of local services such as a garage,
local pub or post shop. Some believed that they could not survive unless they
were �strapped onto� another business.
Operators typically noted the time it takes to establish a tourism business. Few
expect that they will be viable, or making a good return on capital and labour, in
the short term. After capital expansion they are forced into a period of
consolidation. Some had made a substantial capital investment to set up or
expand their businesses. Yet there was limited evidence of formal business
planning�primarily this is undertaken by larger businesses who obtain bank
loans. The high birth and death rates of businesses, lack of planning, no
marketing budget, and too many �lifestylers� in the industry are described as
concerns. Again, these findings confirm the national study (Warren 1998) and a
previous study of eco-tourism businesses (Warren & Taylor 1994).
The businesses tend to employ part-time and seasonal staff in addition to the
work of the operating family. This employment is naturally seasonal in nature.
Some mentioned the difficulty of obtaining and retaining staff, either as a result
of the seasonal work, or because young people in particular tend to move on
after having some initial training and work experience after leaving school. One
business described being �desperate� for employees �last summer� and others
described similar difficulties. While there are substantial numbers of

52
unemployed people in the Park communities, they are not always motivated to
work. There is potential for further pre-employment and in-service training.
Training needs are largely met by the regional polytechs. While training is
needed for employees, operators also need business training and advice. There
are obvious opportunities for training providers.
4 . 3 E S T I M A T I O N S O F E M P L O Y M E N T E F F E C T SI N 1 9 9 8
There are a number of businesses in Karamea that clearly get a proportion of
their business from the attractions provided by the Park. In other communities,
such as Collingwood, Takaka and the rest of Golden Bay, Motueka, Murchison
and Westport, there is a further direct effect. For instance, people passing
through Westport and communities along the road to Karamea generate
economic activity. But to what extent the Park has caused this new activity is
difficult to estimate, and would require comprehensive surveys of businesses
and visitors alike to pin down. The next census in 2001 will provide data on
employment by sector for comparison with the 1996 baseline. At the stage of
our surveys (in 1998), two years after the establishment of the Park, there is
sufficient new activity in the Park (most identified through information on
concessions) and new services, such as accommodation, bars, cafés, crafts and
transport near to the Park and servicing Park visitors, to conclude that the
original estimate of 50 direct jobs in five years will prove conservative.
There is also a flow-on effect on employment and expenditure. Narayan (1993)
calculated Type II multipliers (direct, indirect and induced effects) for the West
Coast of 1.56 for cafés, restaurants and motels, 1.66 for transport, and 1.76 for
business services. Sectors such as building and construction are higher.
Therefore, an average multiplier for tourism in the order of 1.6 gives a modest
effect, i.e. 50 new jobs in tourism can be expected to have a flow-on effect
creating an additional 30 jobs in the regional economy. This is similar to the
effect projected in the original economic assessment of the Park.
The direct and indirect economic effects of the Park on expenditure and
employment will depend on the approach taken to managing the Park and
tourist sector. Various options and three scenarios are discussed in Section 5.
4 . 4 S O C I A L I M P A C T S O F T O U R I S M
There is ample research to show that tourism, including eco-tourism, is far from a
panacea for rural communities (Warren & Taylor 1994). The original assessment
in 1993 indicated that with growth in the tourist industry there will be a shift in
emphasis from production to service work in the Park communities. Because
service occupations are typically filled by women, there is likely to be a shift in the
participation rates of men and women in the workforce. While jobs for men may
disappear, jobs for women, especially part-time jobs, may increase. It was also
predicted that if tourism does increase, then the lifestyles of people in the small
communities are likely to change. For instance, it is likely that the summer
�crowds� may be there for longer periods of the year as the tourist shoulder
periods extend. However, with increased populations, plus tourist numbers,
services such as medical services or public transport may be more viable.

53
It is evident in 1998 that lifestyles in and around the Kahurangi National Park are
indeed changing and becoming more diverse. While economic activity in the
areas surrounding the Park is still based strongly on farming, and dairy farming
in particular, there other well established groups, including the original
�alternative lifestylers�, low income and unemployed groups attracted to cheap
housing in the area since the economic restructuring of the late 1980s, the �new
lifestylers��some very wealthy�and now tourism entrepreneurs and business
people. Social conflicts and divisions were described by interviewees, and are
likely to increase.
Of the areas surrounding the park, Golden Bay probably has the greatest
diversity and potential for social conflicts. Some of these conflicts involve land
use, and the value of land. Others involve planning issues, and there have been
some heated battles in the Bay about coastal subdivision, marine farm proposals,
and hotel-resort proposals.
The impacts of existing activity can also cause problems. One issue cited was
conflict between tourism and local traffic. In Karamea, there was concern about
the effects of air traffic. A large number of helicopters and planes in the area
cause a noise problem in the town itself and around the airport. An increase was
also noted in the numbers of motorised vehicles and wet bikes (wave riders etc.)
on the Karamea estuary.
Environmental issues are not all generated by tourism. For example, tourist
operators commented on the use of rivers as �a rubbish dump� for farmers. There
are also local conflicts over water pollution by the dairy industry.
The communities around the Park previously experienced �very little� crime. It
was reported that there is now �more than there used to be�. The most common
problems involve theft from vehicles at road ends and car parks, while people
are away tramping. The 1997/98 summer season was said to be the first time for
a car to be stolen from the end of the road to the Heaphy Track at Karamea.
Farmers now know to take the keys out of their vehicles. There is, however,
very little vandalism in the Park itself. Overall, most problems are at the main
public access points. For instance, no problems have yet been experienced at
the end of the Matiri road.
4 . 5 M A R K E T I N G A N D I N F O R M A T I O N A B O U T
T H E P A R K
The 1993 assessment found general agreement that national park status would
improve the marketing potential of the region, especially to overseas tourists. It
was also established that national park status is insufficient on its own. The Park
needs to be marketed in association with other national parks as an area with
special and unique qualities. It was noted that other national parks tend to be
marketed around a particular attraction or a number of attractions, such as the
Punakaiki rocks or the Abel Tasman Track. Very similar views were expressed by
people in the tourism and related industries during this current study. However,
five years later on the reservations are perhaps clearer, and the need for good
public information is articulated more strongly.
54
Kahurangi has been well established as the Park name since 1993, when the
name was an issue with many people. An image has certainly been developed
around Kahurangi, as a dramatic and diverse wilderness with many attractions to
visitors. The name has appeared on many maps and promotion brochures.
Information on the Park has appeared in magazines, including airline in-flight
magazines, and guide books such as the Lonely Planet Guide (Turner et al.
1996). The Heaphy Track remains a key feature of the Park and is now marketed
internationally as one of New Zealand�s �great walks�. Specific articles increase
local use; for example, an article on Mt Owen in a Christchurch newspaper in
1997 reportedly caused a �big increase� in numbers using that area. On the
Karamea side, the Park was seen as a drawcard that has not yet been properly
exploited. On the Golden Bay side, however, the Park was seen more as �simply
another park�. While tourists are beginning to recognise the name Kahurangi,
they don�t necessarily ask specifically about it as a national park. In general,
overseas visitors seemed to be more aware of the Park than domestic tourists.
There is a notable lack of general information on the Park available to tourists at
Visitor Centres. In addition, a particular need was noted for area-specific
brochures at the different entry points to the Park. These could include local
history as well as better information on the flora, fauna and birdlife of the Park in
the form of flyers and leaflets (rather than books). People often come back after
a walk and ask their hosts about things they have seen. They look then at any
bird and botanical books available.
A more professional approach to promotion of the park and the area around the
Park was advocated by many people interviewed. At present there are visitor
information centres in Takaka, Murchison (summer only) and Karamea. These
visitor centres have largely been run by volunteer committees and staff. There
has been a move towards paid people and a more �professional� and commercial
approach, linking into the official national Visitor Information Network (VIN)
operated by the New Zealand Tourism Board. There are VIN centres in the main
towns of Motueka and Takaka, and also in Westport and Nelson. Each of these
communities also has a DOC office, and several of these offices, in particular
Takaka and Motueka, have had information centres, and have also provided hut
and track passes and hunting permits.
In the three key communities of Takaka, Karamea and Murchison there are plans
to improve the existing community-based information centres and combine
these with DOC. This move has already been made in Motueka. Combining
information facilities is likely to take different forms in different communities.
Some of the smaller DOC centres are not staffed full-time and, as noted
previously, some of the community visitor centres are run by volunteers and are
open for limited times.
One of the issues still to be addressed is the location of each combined
information centre. This was also an issue in Motueka where the old DOC
information centre was on the edge of the business area and well away from the
VIN centre in the middle of town. The DOC office in Murchison is also well
away from the main highway where the tourist information centre is well
located. Overall, sensible rationalisation is needed. The combined DOC and VIN
centre in Reefton was quoted as providing an excellent model to follow.
55
The Department of Conservation has a key role to play in the rationalisation and
development of the local information centres. This will require DOC to actively
work with the local committees, and will also require funding. Funding
proposals by DOC are very limited. For example, in Karamea DOC has offered
$3000 in the form of Park interpretation stands to be included in a proposed
refurbished centre. The centre committee will need to find other sources of
funds (see development scenarios in Section 5 below). Furthermore, the local
communities will, in most cases, need to overcome local divisions and
leadership issues. For instance, there is a promotions group functioning in
Murchison, but links with the volunteer committee running the visitor centre
are not strong and could be improved.
Communities and local businesses do not easily recognise that they need to
work together to attract more visitors to their area rather than trying to compete
for a fixed pool of visitors. This is a common problem faced by local rural
tourism groups (Taylor & Warren 1998). Clustering is required with existing
organisations, such as Tourism Nelson, and the larger tourism businesses. One
suggestion was for joint marketing of the region in Auckland through TRENZ
(the annual national tourism exhibition). The future may be to market the top of
the South Island, or the centre of New Zealand (including Wellington) as a
destination. Use of the Internet was seen as a valuable direct marketing tool
with a few businesses operating Web pages, and others planning to do so.
Co-ordination between DOC, other agencies, local government and local
businesses could be improved. For example, the Oparara Road (Karamea) was
closed for some time recently, yet at the same time Air New Zealand and DOC in
Hokitika were continuing to promote the Oparara arches. A similar example
arose with respect to the Franz Josef area in 1998, when Auckland travel agents
were reported as telling visitors that the Franz Josef bridge was closed, several
weeks after it had been opened following repair of flood damage!

56
5. The management of change
5 . 1 I N V E S T M E N T I N I N F R A S T R U C T U R E A N DE S T A B L I S H M E N T O F T H E P A R K
It is important to consider how the social and economic benefits gained from
the conservation estate through creation of the Kahurangi National Park can be
maximised. In 1993 most people recognised that it would cost extra money to
build up the infrastructure required for a national park. It was suggested that
establishment funding for the Park could be provided through a special, joint
injection of public, private and community monies. It was considered that
mechanisms to recover the costs of providing and maintaining national park
facilities also needed to be implemented.
It was generally agreed by people in the tourist sector in 1993 that it is
necessary to manage and market tourism more effectively, to enhance or protect
the experiences of overseas and domestic tourists, extend the shoulder periods,
spread use over a number of attractions in the area and maximise economic
benefits in the region. A strategic approach to tourism would be achieved
though establishing joint management arrangements between DOC and other
tourism interests. These could include management regimes for nearby, non-
park conservation estate, for activities such as mountain biking and horse riding,
and to take pressure of use off the Park, e.g. in the location of concessions in
areas beyond the Park.
These issues of investment and establishment of the Park remain largely
unattended in 1998 and, in many respects, are even more obvious. It is argued
that �only lip service is being paid to the Park�, not just by DOC. The Department
of Conservation needs more money for huts and track maintenance, and to build
staff skills, quality of performance and morale. But the district councils and
Transit New Zealand need more money to invest in signage and roads. Overall,
there is a need for central government assistance and incentives; for example, in
support of business initiatives and tourist promotion, or even through Taskforce
Green and assistance to community projects.
Investment scenarios
Three scenarios have been derived from analysis of the information received
during this survey from people interviewed in communities around the Park,
DOC staff, and tourism operators. The scenarios are optional strategies for the
future of Kahurangi National Park. Their purpose is to provide DOC with a basis
for discussion of development strategies with the communities surround the
Park.
Scenario 1�An investment and development programme� A 5�10 year development programme with targeted investment (see below)
in new huts, tracks, facilities and access roads, while maintaining existing
facilities to a high standard, including the Heaphy as a premier track.
57
� Development of three well-equipped visitor centres, operated jointly by
DOC and the local communities, at Takaka, Murchison and Karamea.
� New signage, interpretation programmes and provision of free information
and fliers about the Park.
� Increased DOC front-line staffing.
� Increased differentiation between less-specialised users of highly developed
facilities (e.g. intensive walking on a highly-developed track) and specialised
recreationalists in lowly-developed facilities and wilderness areas.
� The investment would come from a mix of central and local government
funding, private sector operations, sponsorship, and community involvement.
Income from concessions and user charges would increase and be invested
back into the Park.
Benefits would include increased economic impact in local communities
through tourism and recreational use, increased knowledge of the Park and its
resources, both nationally and internationally, and increased public
commitment to national park and conservation goals.
The additional costs associated with the scenario would be significant and, as
noted, funding would need to come from a mixture of sources.
Risks (or indirect costs) that could result from the adoption of this approach are
that other areas and projects could suffer as a result of funds and effort (public,
private and community) being diverted.
Scenario II�The status quo� No new huts or tracks. Limited maintenance of access roads. Upkeep of huts
and tracks limited and based on DOC national priority system. Some little-
used huts and tracks fall into disrepair or are removed.
� Community joint venture information centres developed in existing
buildings with minor funding from DOC.
� Slow increase in tourism development based on the Park. Static domestic
recreational use. No increase in concession and user fee income.
� User charges on information and low-level staffing. Likely to result in lack of
growth in Park use and limited advance of education and conservation goals.
� Park use away from short walks and main tracks likely to become relatively
specialised, or restricted to highly experienced trampers, fishers and hunters
(the latter using helicopter access). Increased conflict between these parties.
There are few benefits seen as likely to accrue from this scenario, and no
additional financial costs.
There is a significant risk that increasing use of helicopter servicing of the
specialist activities (fishing, hunting, and rafting) will reduce the value of the
wilderness experience both for these users and general users (trampers,
walkers, and nature conservation tourists) to the extent that fewer people will
come to the area13. There is also a risk that walking use will become restricted to
the Heaphy Track, with some overuse experienced there at peak times.
13 One intending tourist operaror has already abandoned plans to take groups on multi-day trips into
the Park because of the helicopter noise near huts.
58
Scenario III�The sinking lid
� No new huts and tracks, reduced maintenance of facilities based on DOC
national priority system. Most huts, tracks and access roads go into decline.
Increased pest and weed problems.
� Little used huts removed and low-use tracks not maintained, and allowed to
become overgrown.
� Increased wilderness areas, which require little maintenance but may
enhance intrinsic conservation values.
� No DOC assistance to local information centres, all information based on user
pays, resulting in reducing interest in the Park.
� Little increase in Park-based tourism, reduction in domestic general
recreationalists, and an increase in specialised, wilderness recreation.
� Reduced income from concessions and user fees.
There are no additional direct costs, and benefits will accrue as cost savings.
There may also be conservation benefits (including intrinsic values) from
reduced use of the Park.
Risks are that few visitors will enjoy the experience of the Park, educational
values will be reduced and businesses in communities surrounding the Park will
suffer.
5 . 2 C O M M U N I T Y L I A I S O N A N D I N V O L V E M E N T
Since 1993 the structure of DOC has changed significantly. Under the new
structure there are three regional offices, and eight conservancies with a
number of area offices. Westport is an area office, and Karamea is attached to
Westport, currently with four staff based at Karamea. The number of staff at the
Murchison office (attached to St Arnaud Area Office) has been reduced to one.
The West Coast is in the Southern region and Nelson is in the Central region.
Conservation Board areas are not necessarily the same as conservancy areas. The
Nelson Conservation Board oversees the whole of the Kahurangi Park, and the
Management Planning process for the Park is being conducted by the Nelson
conservancy. The West Coast Conservation Board has very little impact on what
happens in the Park, and there was some concern that the Board was not
allowed to put in a formal submission to the recently circulated draft
Management Plan (they had to do it as individuals).
Although the Park is the responsibility of the Nelson Conservation Board, the
Nelson-West Coast Conservancy boundary runs through the Park (see Fig. 1).
Policy is therefore directed from Nelson, but the work is carried out by two
conservancies. It was noted that the physical state of the Heaphy Track
deteriorates markedly when crossing from the section maintained by Nelson
Conservancy to the section managed by West Coast Conservancy. There appears
to be a lack of coordination between the two conservancies over administration
of the Park; for example, the upkeep of huts and their supply with gas and coal.

59
In 1993 there was general recognition that the Department needed to maintain
ongoing liaison and community involvement, and take an active role in the
tourist industry. In 1998, the same views were expressed, but there was only
limited evidence that DOC was taking an active role. Lack of resourcing was
recognised as a key issue and DOC was referred to as being �stretched�. Another
comment was that there was a �lot of planning, poor on action� in relation to
track construction, culverts etc. Nonetheless, the DOC office in Karamea works
reasonably closely with the Information Centre and takes Centre staff out on the
tracks and provides them with some training. The Department of Conservation
reports to the Information Centre each month, saying what they have been
doing, and what they plan to do in the short to medium term.
There is a perception in the Park communities that DOC is not as active in
maintaining huts and tracks as previously. The Department of Conservation has
centralised its workforce to the main stations (field centres) with �hit� teams
available from these bases to undertake track maintenance and provide staffing
at peak times. This may be affecting community perceptions of the adequacy of
DOC staffing as staff are not as visible as in the past.
People in the Karamea and Golden Bay communities had expected DOC to put
bigger resources into the new Park, and hoped that DOC would actively
promote the Park. They expected to see more people employed. The impression
was that DOC is not doing much and is low on resources and morale. The local
community has had to wait too long for action on issues considered to be of vital
importance to the community; for example, dealing with problems on the
Oparara Road, and the Fenian Track.
There is a significant issue with respect to overlapping and confusing
jurisdictions. For example, the Fenian Track is an unformed legal road which
DOC administers as a track. It has been closed since August 1997, and was
closed for a period two years prior to that as well. Westland District Council and
the West Coast Regional Council also have some responsibilities for the track/
road. However, none of these agencies is taking responsibility for stabilising the
quarry area or rerouting of the track (for safety), and the loss of the track has
cost the local community some tourism business.
The Oparara Road was opened at Christmas, having been closed for several
months and previously (two years earlier) for nine months. The Westland
District Council is considering taking over the road with DOC input. It isn�t a
legal road and if the Council takes it over it will have to be surveyed out of the
Park.
Community attitudes have changed over the past few years. Kahurangi has
become an important �psychological part� of both Golden Bay and the Karamea
area. It is part of their isolation, part of their context of areas with outstanding
natural environments. The effect of the Park is already evident in these
communities and helps to raise environmental consciousness as well as create
economic opportunities. These effects are much less evident in Murchison,
where the visitor economy is based on its position on the main highway, and
activities outside the Park, particularly fishing. Karamea residents and
businesses are planning for an increase in business and using the Park as a
marketing drawcard.
The formation of the Park means that local residents can�t do some things that
they previously took for granted (and this effect may not yet be fully realised).
60
Under the previous administration (Forest Park) local residents could negotiate,
for example, to take fallen wood for woodworking. Now, DOC will not allow
this activity, even though they may have to remove logs themselves that block a
river bed or track.
Westland District Council relations with DOC have not been good but are
improving. The Council sees Karamea as a weekend destination for Wellington
professionals, and have assisted the Karamea Community to seal the airstrip by
providing a loan. There is a perception that DOC is adopting a very short-term
perspective and doesn�t seem to have any real long-term plans.
5 . 3 M O N I T O R I N G A N D E V A L U A T I O N
There is a need to monitor the social and economic impacts of the Park over
time, based on the 1993 assessment and this 1997/98 assessment. The
monitoring will be useful for park planning and management, and can be applied
to strategic planning by the Park communities. It will also form the baseline for
longer-term assessments of effects of the Park. The information will also be
useful as a comparative case in the assessment and evaluation of future park
proposals around New Zealand.
Some specific needs are:
� An improved system of reliable track counters to provide systematic,
longitudinal data.
� Regular analysis of hut books for visitor characteristics.
� Regular analysis of visitor centre data and sample visitor surveys, in a joint
venture with district and regional tourism offices.
� Ongoing maintenance of a concessions database for the Park.
� Regular recording of issues that arise during consultation with Park
communities.
� The allocation of resources to visitor monitoring and analysis by DOC.
A comprehensive update of social and economic impacts of the Park should be
planned for 2002�assuming 2001 census data are available at that time.
61
6. References
Department of Conservation 1987: Red Hills National Park Investigation. A Report to the National
Parks and Reserves Authority. Department of Conservation, Wellington.
Department of Conservation 1997: Kahurangi National Park Draft Management Plan. Department
of Conservation, Nelson/Marlborough Conservancy. Management Plan Series No. 11.
Department of Lands and Survey 1984: Proposed Wanganui River National Park - a report to the
National Parks and Reserves Authority. Department of Lands and Survey, Wellington.
Department of Lands and Survey 1985: Proposed Punakaiki National Park - a report to the National
Parks and reserves Authority. Department of Lands and Survey, Wellington.
Gough, J.D; Ball, R.J. 1995: The Contribution of Conservation Lands to the West Coast Regional
Economy. Centre for Resource management/Lincoln Environmental. Information Paper
No. 52.
Kerr, G.N.; Sharp, B.M.H.; Gough, J.D. 1986: Economic Benefits of Mt Cook National Park. Lincoln
Papers in Resource Management No. 12., Centre for Resource Management, University of
Canterbury and Lincoln College.
Kerr, G.N.; Taylor, C.N.; Kerr C.; Fitzgerald, K. 1990: Fiordland: a study of the issues and options
for development. Report to the Fiordland Promotion Association, Centre for Resource
Management, Lincoln College.
Narayan, V. 1993: Input/output table: the West Coast region (1986/87): its application and
analysis. Economic Impact Analysis, Discussion Document, The West Coast Regional
Council.
New Zealand National Parks and Reserves Authority 1983: General Policy for National Parks.
National Parks Series No. 27. Department of Lands and Survey, Wellington.
Northland Regional Council 1991: Socio-economic assessment of the proposed Northland Kauri
National Park. Northland Regional Council, Whangarei.
Pearce, D.G. 1982: Westland National Park Economic Impact Study. Department of Geography,
University of Canterbury, Christchurch.
Stephens, R.J.; Wells, C. 1983: The Regional Social and Economic Impact of a Punakaiki National
Park. Victoria University of Wellington.
Taylor, C.N.; Goodrich C.G.; Bryan, C.H. 1995: Social Assessment: Theory, Process and
Techniques. Taylor Baines and Associates, Christchurch.
Turner, P.; Williams, J.; Keller, N.; Wheeler, T. 1996: New Zealand: a Lonely Planet Survival Kit.
Lonely Planet Productions, Hawthorn, Australia.
Warren, J.A.N. 1998: Rural tourism in New Zealand: the experience of individual businesses.
Centre for Research, Evaluation and Social Assessment.
Warren, J.A.N.; Taylor, C.N. 1993: Northwest Nelson National Park: a social assessment. A report
prepared for the Department of Conservation, NZ Institute for Social Research and
Development Ltd, Christchurch.
Warren, J.A.N.; Taylor, C.N. 1994: Developing Eco-tourism in New Zealand. NZ Institute for Social
Research and Development Ltd, Wellington.
Wilson, N.D.; Mawhinney, K.A.; Watt, W.J. 1985: Waitutu State Forest national Park Investigation.
Joint Study Team Department of Lands and Survey, N.Z. Forest Service and Southland
United Council.

62
Appendix 1
K A H U R A N G I P A R K S T U D Y � K E Y W O R D S 1 4
interview [name of the person interviewed]
date [date of the interview]
area [e.g. Murchison, Karamea, Golden Bay]
organisation [the name of the organisation or company that the interviewee is
involved with]
contact [Address and phone number/s if available]
type [tourist operation type and description]
personal [personal background and work history of the operator]
profile [social and economic profile of the community and surrounding region]
bike [issues relating to mountain bikes]
chopper [issues relating to helicopter access]
concessions [issues relating to the process of application and allocation, fees,
management of the resource and monitoring]
council [role of local and regional government�supply of public infrastructure
such as water, toilets]
crime [levels and changes in crime in the area]
develop [business development process and plans]
doc [general role of DOC�relations with the community�see also park and
concessions]
eel [issue relating to harvesting of eels]
employ [employment generated by the park and or tourism activity]
highway [roads and signage, access roads]
hunting [issues relating to recreational hunting]
maori [issues relating to Maori interests and use]
mining [issues related to mining in the park area]
moss [issues relating to sphagnum moss]
network [developing and maintaining local and regional networks and groups]
park [management issues for national park and conservation land�note key
issues have their own words e.g. moss, mining, road, bike, track, chopper]
promo [advertising and promotion of tourism and the park]
rates [issues around charging and commissions for tourism businesses]
resources [nature of the tourist resource]
road [issues relating to the trans-park road proposal]
strategy [tourism development strategy for the surrounding areas]
stress [personal issues and stress, community conflicts]
support [level of community support for tourism and the park]
track [issues relating to the use and maintenance of tracks and huts]
training [training needs in the area, including for tourism]
trends [tourist trends]
visitor [nature and numbers of visitors to the business or area]
water [issues relating to extraction of water and hydro electricity]
14 All field and meeting notes were coded using the above key words so that the material could be
sorted and analysed using AskSam software.