Quantitative trait loci: individual gene effects on quantitative characters
Upload
khangminh22Category
view
5download
0
Please cite this paper as:
Kowalski, P. and M. Molnar (2009-07-22), “Economic Impactsof the Phase-Out in 2005 of Quantitative Restrictions underthe Agreement on Textiles and Clothing”, OECD Trade PolicyPapers, No. 90, OECD Publishing, Paris.http://dx.doi.org/10.1787/220185234525
OECD Trade Policy Papers No. 90
Economic Impacts of thePhase-Out in 2005 ofQuantitative Restrictionsunder the Agreement onTextiles and Clothing
Przemyslaw Kowalski
Margit Molnar

Unclassified TAD/TC/WP(2007)14/FINAL Organisation de Coopération et de Développement Économiques Organisation for Economic Co-operation and Development 22-Jul-2009 ___________________________________________________________________________________________
English - Or. English TRADE AND AGRICULTURE DIRECTORATE TRADE COMMITTEE
Working Party of the Trade Committee
ECONOMIC IMPACTS OF THE PHASE-OUT IN 2005 OF QUANTITATIVE RESTRICTIONS UNDER THE AGREEMENT ON TEXTILES AND CLOTHING OECD Trade Policy Working Paper No. 90
by Przemyslaw Kowalski and Margit Molnar
All Trade Policy Working Papers are available on the OECD website at: http://www.oecd.org/trade
JT03268163
Document complet disponible sur OLIS dans son format d'origine Complete document available on OLIS in its original format
TA
D/T
C/W
P(2007)14/FINA
L
Unclassified
English - O
r. English

TAD/TC/WP(2007)14/FINAL
2
ABSTRACT
This paper discusses the economic impacts of the phase-out of the Multi-Fibre Arrangement (MFA), which was provided for under the 1994 Agreement on Textiles and Clothing (ATC). It presents an overview of the integration process of textile and clothing products into the GATT, takes stock of the most recent changes in the global textile and clothing (T&C) markets, and analyses some major economic impacts and strategies adopted by producers in OECD and non-OECD countries to survive in the post-MFA global competitive arena. Evidence presented in the paper points to the long-term character of the adjustment process both in the OECD and T&C-producing developing countries. This process began already prior to the inception of the ATC and continued throughout its duration, despite the back loading of much of the actual quota removal until 2005. Entrepreneurs in the textiles and clothing industry anticipated and prepared for the quota removal well in advance of the completion of the phase-out. Exporters in countries with low costs and high productivity such as China, India, Pakistan and Vietnam have started consolidating their production of labour-intensive T&C products and pursued economies of scale to benefit from enlarged markets. This was accompanied by a dynamic upgrading of the capital stocks, mostly through imports of machinery from the OECD countries. Producers in high-cost OECD countries moved towards a market structure characterised by a larger number of more specialised firms. Producers in lower cost OECD countries such as Turkey or Mexico seem to have followed strategies similar to the dynamic Asian producers and engaged more directly in competition in labour-intensive products. Some producers located in high income countries have been successfully differentiating away from the market segments where they have to compete on labour cost towards segments where they can compete on quality, application of sophisticated technology, design and marketing strategies as well as by concentrating on fewer products categories and exploitation of scale economies. Consumers have gained from the MFA quota phase-out through declining prices for T&C products, whereby the most competitive import markets saw the deepest price declines.
Keywords: textiles, clothing, trade, quotas, Multi-Fibre Arrangement, Agreement on Textiles and Clothing, adjustment, vertical differentiation, horizontal differentiation, price competition, quality competition.
ACKNOWLEDGEMENTS
This study has been prepared by Przemyslaw Kowalski and Margit Molnar under the supervision of Douglas Lippoldt and Raed Safadi. Clarisse Legendre, Jacqueline Maher and Laura Munro provided, respectively, excellent statistical, administrative and research assistance. The final report benefitted from discussions in the OECD Working Party of the Trade Committee, which has agreed to make the study more widely available through declassification on its responsibility.
This study is available on the OECD website at the following address: http://www.oecd.org/trade.
Copyright OECD 2009
Applications for permission to reproduce or translate all or part of this material should be made to: OECD Publications, 2 rue André Pascal, 75775 Paris Cedex 16, France.

TAD/TC/WP(2007)14/FINAL
3
TABLE OF CONTENTS
ECONOMIC IMPACTS OF THE PHASE-OUT IN 2005 OF QUANTITATIVE RESTRICTIONS UNDER THE AGREEMENT ON TEXTILES AND CLOTHING ............................................................... 5
Executive summary ..................................................................................................................................... 5 Textiles and clothing in world trade, an overview ...................................................................................... 8
The MFA and the ATC .......................................................................................................................... 16 Phase-out of MFA quotas under the ATC ............................................................................................. 17 Major post-ATC changes in the EU and the US markets ...................................................................... 18
Survival strategies ..................................................................................................................................... 24 Vertical differentiation........................................................................................................................... 25 Horizontal specialisation ....................................................................................................................... 38 Reorientation of markets........................................................................................................................ 43 Relocation of production facilities ......................................................................................................... 46 Selected structural changes prior to and during the ATC phase-out ..................................................... 47
Conclusions ............................................................................................................................................... 58
REFERENCES ............................................................................................................................................. 61
ANNEX ........................................................................................................................................................ 64
Tables
Table 1. World exports on textiles and clothing 2003-07 ........................................................................... 8 Table 2. Textiles exports as % of total merchandise exports, 2007 ............................................................ 9 Table 3. Top 20 importers of textiles and clothing products ..................................................................... 10 Table 4. Top 20 exporters of textiles and clothing products ..................................................................... 11 Table 5. Employment in textiles and clothing industry in selected OECD countries ............................... 49
Figures
Figure 1. EU25 imports of textiles by country and region in 2005-08 ...................................................... 20 Figure 2. EU25 imports of clothing by country and region 2005-08 ........................................................ 21 Figure 3. United States imports of textiles by country and region in 2005-08.......................................... 22 Figure 4. United States imports of clothing by country and region 2005-08 ............................................ 23 Figure 5. Positioning strategies of China’s selected major competitors in the US market 1997-2007 ............................................................................................................................... 27 Figure 6. Men’s suits made of wool: unit values and market shares of major competitors in the EU15 market ........................................................................................................................................................ 30 Figure 7. Men’s suits made of wool: unit values and market shares of major competitors in the US market .................................................................................................................................................. 31 Figure 8. Men’s woollen suits: price positioning with respect to China and market share gains (1996-2008) ................................................................................................................ 32

TAD/TC/WP(2007)14/FINAL
4
Figure 9. Men’s cotton shirts: unit values and market shares of major competitors in the EU15 market ............................................................................................................................................. 35 Figure 10. Men’s cotton shirts: unit values and market shares of major competitors in the US market .................................................................................................................................................. 36 Figure 11. Men’s cotton shirts: price positioning with respect to China and market share gains (1996-2008) ................................................................................................................ 37 Figure 12. Trade specialisation of China vis-à-vis its top 10 competitors ................................................ 42 Figure 13. Trade specialisation of China vis-à-vis its top 10 competitors ................................................ 42 Figure 14. Unit labour costs in China and other emerging markets (index) ............................................. 43 Figure 15. Producers previously restricted by quotas consolidate their export markets ........................... 44 Figure 16. Imports of textiles and clothing machinery in major T&C exporting countries 1988-2006 (average annual rates of growth of import value) ..................................................................................... 48 Figure 17. Share of OECD suppliers in imports of textiles and clothing machinery in major T&C exporting countries 1999-2006 ........................................................................................................ 49 Figure 18. Relative prices of textiles and clothing in major ATC markets ............................................... 53 Figure 19. Price levels of clothing and footwear in selected OECD and non-OECD countries ............... 56 Figure 20. Mark-ups of prices over average production costs in selected European markets................... 57
Boxes
Box 1. Technical textiles ........................................................................................................................... 13 Box 2. China – the major beneficiary of the phase-out of ATC................................................................ 39 Box 3. Textile and clothing industry in India ............................................................................................ 40 Box 4. Indonesia’s textile and garment industry ....................................................................................... 45 Box 5. Changing world T&C trade and trade-related labour adjustment costs and policies .................... 50 Box 6. Effects of the ATC phase-out and the retail sector ........................................................................ 54

TAD/TC/WP(2007)14/FINAL
5
ECONOMIC IMPACTS OF THE PHASE-OUT IN 2005 OF QUANTITATIVE RESTRICTIONS UNDER THE AGREEMENT ON TEXTILES AND CLOTHING
Executive summary
The Agreement on Textiles and Clothing (ATC) was one of the major achievements of the Uruguay Round. It put an end to the system that permitted quantitative restrictions to be imposed on portions of the trade in textile and clothing products, a system that lasted for more than 40 years under, first, the Long Term Agreement Regarding International Trade in Cotton Textiles (LTA) and, then, the MFA. This paper discusses the economic impacts of the phase-out of the Multi-Fibre Arrangement (MFA) in the period up to 2008. It provides an overview of the integration process of textile and clothing products into the GATT, takes stock of the most recent changes in the global textile and clothing markets, and analyses some major economic impacts and strategies adopted by producers in OECD and non-OECD countries to survive in the post-MFA global competitive arena.
The main findings can be summarised as follows:
• Even with the temporary voluntary restraints imposed by China on its exports to the EU and the US markets in 2005, the 2005-07 period saw rapid growth in imports of apparel from China. Contrary to some earlier predictions other low-cost countries such as India, Vietnam or Bangladesh also experienced rapid growth of exports. Many OECD and non-OECD suppliers lost significant market shares.
• Following an initial surge in 2005, rates of growth for textiles imports from China tended to level off in period 2006-07; the evidence suggests that the 2005 surge may have been a one-off effect.
• Available data suggest that 2008 brought about a significant contraction of imports from all trading partners in both textiles and clothing and in both the EU and the US markets, due to lower consumer confidence, difficulties in financing trade due to the on-going financial market turmoil and the global slowdown of economic activity.
• The 2005 abolition of the quota system has been significantly reshaping the global T&C production, consumption and trade and investment landscapes bringing about efficiency gains but also significant adjustment challenges in the OECD countries as well as non-OECD countries. The effects of the phase-out are not uniform, nor are they restricted to the MFA countries or countries whose exports were governed by the quotas, but also extend to third countries.
• Statistical evidence presented in the paper points to the rather long-term character of the adjustment process both in the OECD and T&C-producing developing countries. This process began already prior to the inception of the ATC and continued throughout its duration, despite the back loading of much of the actual quota removal until 2005. Entrepreneurs in the textiles and clothing industry anticipated and prepared for the quota removal well in advance of the completion of the phase-out.

TAD/TC/WP(2007)14/FINAL
6
• Production of both textiles and clothing in major high-income T&C exporting countries has seen intermittent periods of reductions and growth since the 1980s and this pattern became more pronounced with the inception of the ATC. In contrast, major low-income T&C exporters such as China, India and Pakistan experienced a long period of T&C production growth, albeit with some variation by product and year.
• The employment trends are yet more polarised with some major OECD T&C producers shedding labour from the textile and clothing sectors rather consistently since the 1980s, including the ATC period, and low cost developing countries expanding their employment in the sector. Overall, the reduction in T&C employment in most OECD countries has been much deeper than reduction in employment in other manufacturing sectors and clearly generated significant social costs and structural adjustment challenges because of its high share of total manufacturing employment in certain countries, its regional concentration and its high intensity in the use of female labour, among others. However, this trend clearly started already much before the signing of the ATC when the MFA quotas were still fully in place. In fact, improved productivity and reorganisation seemed crucial for the OECD T&C industry to stay afloat; the fittest producers were best positioned to survive.
• In anticipation of the phase out of MFA quotas exporters in countries with low costs and high productivity such as China, India, Pakistan and Vietnam have started consolidating their production of labour-intensive T&C products and pursued economies of scale to benefit from enlarged markets. This was accompanied by a dynamic upgrading of the capital stocks, mostly through imports of machinery form the OECD countries. In some of these countries there remains an ample scope for further technology and capital stock upgrading.
• High-cost OECD T&C exporters moved towards a market structure characterised by a larger number of more specialised firms that are smaller in terms of average number of employed staff but larger in terms of average revenue per firm and per employee. Producers in lower cost OECD countries such as Turkey or Mexico seem to have followed strategies similar to the dynamic Asian producers and engaged more directly in competition in labour-intensive products.
• Some producers located in high income countries have been successfully differentiating away from the market segments where they have to compete on labour cost towards segments where they can compete on quality (vertical differentiation), application of sophisticated technology, design and marketing strategies as well as by concentrating on fewer products (horizontal differentiation) categories and exploitation of scale economies.
• Trends in unit prices and market shares of major exporters to the EU and the US in the period 1996-2008 indicated a number of cases of successful vertical differentiation by producers located in high income countries. The comparison of pricing strategies for products that may be more easily differentiable in terms of quality (e.g. suits or bras) with those that are not (e.g. cotton shirts) indicated that the latter type of products were subject to fiercer competition from low-cost producers.
• Suppliers to the EU market pursued a larger spectrum of price and quality strategies while suppliers to the US market competed with producers from China more directly, especially after 2005. This resulted in a more significant reorganisation of the US import markets (more spectacular entries and exits from the market) while in the EU market shares were comparatively more stable. This might suggests, subject to the caveats mentioned in the main body of the paper, lower barriers to import competition and larger gains to the consumers in the US.

TAD/TC/WP(2007)14/FINAL
7
• Consumers clearly stand to gain from the MFA quota phase-out on condition that quality and safety of the cheaper products can be assured and that the price decreases are actually passed on to the consumers. Indeed, relative prices of clothing have been falling since the early 1990s in most OECD countries but there were important differences in the rates of these changes, which has been associated in the literature with varying levels of competition in national retail sectors. In general, prices of T&C products have been falling much more sluggishly in the EU countries. Norway, which was the first country to phase out all its MFA quotas in 2001 in advance of the agreed 2005 deadline and to significantly reduce tariffs on T&C imports, clearly enjoyed the deepest reduction in prices and the pace of this reduction clearly accelerated immediately after the quota phase out. Interestingly, consumers in Japan which never had MFA quotas seem to have been impacted negatively by the 2005 phase-out which could be associated with a significant redirection of Chinese exports from the Japanese market towards the markets earlier protected by the quotas.
• Still, prices of textile and clothing products in the OECD area remain relatively high. This can be to some extent explained by higher levels of income and associated consumer tastes but there are significant variations across OECD countries with similar income levels, pointing to different levels of market access and competition, especially in the retail sector. Remaining OECD tariff protection on T&C products is higher as compared to other manufacturing sectors.

TAD/TC/WP(2007)14/FINAL
8
Textiles and clothing in world trade, an overview
1. The textile and clothing industry is a large and diverse sector that can be subdivided into distinct parts thus offering opportunities for countries with differing resource endowments. The traditional division is between the production of natural fibres, fabrics, and finished clothing but the import, distribution and retail segments play an ever more important role in the industry’s value chain (OECD, 2006; Nordas, 2005). Natural fibre production is the domain of agricultural economies with access to plants from which the fibre is produced. Synthetic fibre production depends on the ability to innovate or adopt new technologies (see Box 1 for discussion of trade in technical textiles). Fibres, natural or synthetic, are spun into yarn and yarn is either woven or knitted into fabric. Fabric is then finished which involves dying, printing or softening, among others. Fabric production is a highly automated capital-intensive activity and is susceptible to technological advances. Clothing production consists of cutting the fabric, grouping it, tying into bundles and sewing together. Clothing production is labour intensive and workers are specialised in a limited number of tasks performed repetitively. Nevertheless, cutting is often a computer-assisted process and specialised machines are used for different types of sewing (Nordas, 2005).
2. Annex Table 1 lays out the cost structure of firms in the textiles and apparel industries in the top 10 exporting countries on the eve of ATC quota phase out in 2004. The textiles industry was generally more capital intensive than the clothing industry. Interestingly, local labour costs accounted for a higher share of costs in the clothing sector in low-cost China and India while in most of the top OECD exporters their place seems to be taken, at least to some extent, by the higher shares of intermediate inputs. There is also a clear tendency across countries to source the intermediate inputs domestically, though in some cases the shares of imported intermediates are quite high (e.g. in some EU countries).
3. The T&C industry remains a significant industry world–wide, though its share in world trade and its annual output growth rates have been falling over the past few years (Table 1). In 2007 — the most recent year for which consistent data are available — world trade in T&C amounted to USD 610 billion, or 4.3% of world exports compared to 5.5% and 5.1% in 2003 and 2004, respectively. T&C still plays an important, though decreasing, role in trade of OECD countries amounting to 3% of their merchandise exports; however, such trade is more critically important for many developing countries where the share of T&C in total exports can reach more than 60%.
Table 1. World exports of textiles and clothing 2003-07
2003 2004 2005 2006 2007Value ( in billions USD) 458 514 531 575 610% of world exports 5.52 5.10 4.66 4.39 4.31% change from year before 15.25 12.14 3.29 8.31 6.07
Source: UN Comtrade (2008).
4. Table 2 presents the shares of T&C in total exports for various country groups and individual countries where these shares are highest. The share in OECD’s trade was 3% in 2007, which is below the world average, though this masks a considerable reliance on T&C shipments by countries such as Portugal, Greece or Italy with shares of between 9 to 13% of their total exports. The textiles and clothing sector is also an important contributor to the industrial employment and production in a number of OECD countries (see Table 5). In contrast to the OECD area, low and middle income countries in East Asia, the Pacific and South Asia record particularly high shares with Bangladesh, Pakistan or Mauritius recording shares of, respectively, 84%, 60% and 47%. The high reliance on T&C shipments underlies the relatively more important role that this sector plays in development and trade integration of these and other developing countries. More broadly developing countries account for more than 50% of value of world textile exports

TAD/TC/WP(2007)14/FINAL
9
and, as pointed out by the WTO “in no other category of manufactured goods do developing countries enjoy such a large net-trading position” (WTO, 2006).
Table 2. Textiles exports as % of total merchandise exports, 2007
By country grouping% %
Bangladeshb 83.8All countries Total 4.5 Pakistan 60.2
Mauritius 47.4All high-income 3.1 Madagascar 40.7High-income non-OECD 3.2 Albania 27.3High-income OECD 2.8 Tunis ia 26.7OECD 30 3.0 Morocco 26.2
Guatemala 22.7Low & Middle income East Asia & Pacific 10.9 Jordan 22.4Low & Middle Income Europe 4.2 Moldova 20.6Low & Middle income Latin America and Caribbean 2.8 Macedonia, FYR 20.2Low & Middle income Middle East and North America 12.0 Turkey 17.3Low & Middle income South Asia 19.4 Vietnam 16.4
India 14.4LDC --- Least Developed Countries 5.5 Mali 14.0
Bulgaria 13.9China 13.6Romania 13.1Hong Kong, China 11.7Mongolia 11.5
20 countries with highest sharesa
a) For which the data were available for 2007. b) For Bangladesh the data is for 2004. Source: UN ComTrade (2008).
5. The EU25 and US are the two main destination markets for T&C products accounting respectively for USD 223 billion and USD 104 billion or 42% and 21% of world imports in this category in 2007 (Table 4). Other important importers include Hong Kong, China with nearly 6% of world’s imports, Japan (6%), and China (5%) (Table 3).1 Canada and Mexico account for approximately 2% of world imports. Remarkably, 2003 and 2004 — the two years that preceded the phase-out of ATC quotas — recorded high growth rates of textiles trade of around 12%, while in 2005 these rates revert to 3-4% levels. In 2006 the rate of growth of world textile and clothing products imports rebound to 6% but 2007 saw a negative growth of 0.8%.
6. The world’s largest single country exporter of T&C products in 2007 was China with USD 166 billion or 30% of world exports, followed by Hong Kong, China with USD 41 billion (7%) (Table 4). Yet, the EU25 as a group remains the most important exporter with USD 176 billion or 31% of world exports. Other OECD countries with higher shares are the US (3.9% of world exports), Turkey (3.3%), Korea (2.4%), Mexico (1.3%) and Japan (1.5%).
1 Nevertheless, significant shares of textile and clothing imports of China and Hong Kong, China are re-
exported.

TAD/TC/WP(2007)14/FINAL
10
Table 3. Top 20 importers of textile and clothing products
A. Sum of imports value (Billions USD)
2000 2001 2002 2003 2004 2005 2006 2007All countries 363.34 361.91 370.87 413.37 462.81 479.89 508.81 504.63United States 78.14 76.60 78.72 84.39 91.09 97.37 101.15 103.98Germany 28.15 28.31 28.29 31.90 34.74 36.31 39.02 42.33Hong Kong, China 29.13 27.61 27.11 28.30 30.39 31.32 32.02 31.99United Kingdom 19.72 19.57 21.34 23.99 27.46 27.86 29.29 ..Japan 24.35 23.47 21.71 24.05 26.66 27.50 29.11 29.36China 16.56 16.26 16.99 19.29 23.01 23.44 25.68 25.37France 17.54 17.60 18.31 21.48 23.94 24.58 25.59 28.80Italy 14.00 14.24 14.83 17.57 20.73 21.30 23.93 26.36Spain 7.06 7.51 8.42 10.46 12.53 13.72 15.57 18.42Belgium 8.37 8.45 8.70 9.94 11.14 11.69 12.37 13.83Canada 7.67 7.54 7.59 8.15 9.06 9.92 10.74 11.56Netherlands 7.22 6.69 6.78 8.08 9.24 9.10 10.20 11.27Mexico 10.04 9.41 9.40 9.08 8.91 9.05 9.06 8.68Korea, Rep. 5.37 5.43 6.13 6.26 6.68 6.93 7.98 8.83Austria 4.08 4.17 4.28 5.19 5.84 5.98 6.16 6.98Switzerland 4.46 4.37 4.62 5.28 5.80 5.87 6.13 6.86Turkey 3.45 2.97 4.09 5.07 6.28 6.73 6.10 8.17Poland 3.18 3.27 3.67 4.07 4.99 5.16 5.55 6.95Australia 3.37 2.83 3.17 3.73 4.34 4.69 4.92 5.52
B. Share in all countries' imports
2000 2001 2002 2003 2004 2005 2006 2007All countries 100.0 100.0 100.0 100.0 100.0 100.0 100.0 100.0United States 21.5 21.2 21.2 20.4 19.7 20.3 19.9 20.6Germany 7.7 7.8 7.6 7.7 7.5 7.6 7.7 8.4Hong Kong, China 8.0 7.6 7.3 6.8 6.6 6.5 6.3 6.3United Kingdom 5.4 5.4 5.8 5.8 5.9 5.8 5.8 ..Japan 6.7 6.5 5.9 5.8 5.8 5.7 5.7 5.8China 4.6 4.5 4.6 4.7 5.0 4.9 5.0 5.0France 4.8 4.9 4.9 5.2 5.2 5.1 5.0 5.7Italy 3.9 3.9 4.0 4.3 4.5 4.4 4.7 5.2Spain 1.9 2.1 2.3 2.5 2.7 2.9 3.1 3.7Belgium 2.3 2.3 2.3 2.4 2.4 2.4 2.4 2.7Canada 2.1 2.1 2.0 2.0 2.0 2.1 2.1 2.3Netherlands 2.0 1.8 1.8 2.0 2.0 1.9 2.0 2.2Mexico 2.8 2.6 2.5 2.2 1.9 1.9 1.8 1.7Korea, Rep. 1.5 1.5 1.7 1.5 1.4 1.4 1.6 1.7Austria 1.1 1.2 1.2 1.3 1.3 1.2 1.2 1.4Switzerland 1.2 1.2 1.2 1.3 1.3 1.2 1.2 1.4Turkey 1.0 0.8 1.1 1.2 1.4 1.4 1.2 1.6Poland 0.9 0.9 1.0 1.0 1.1 1.1 1.1 1.4Australia 0.9 0.8 0.9 0.9 0.9 1.0 1.0 1.1

TAD/TC/WP(2007)14/FINAL
11
Table 3. Top 20 importers of textile and clothing products (cont’)
C. Percentage growth rates
2001 2002 2003 2004 2005 2006 2007All countries -0.4 2.5 11.5 12.0 3.7 6.0 -0.8United States -2.0 2.8 7.2 7.9 6.9 3.9 2.8Germany 0.6 -0.1 12.8 8.9 4.5 7.5 8.5Hong Kong, China -5.2 -1.8 4.4 7.4 3.1 2.2 -0.1United Kingdom -0.7 9.0 12.4 14.5 1.5 5.1 ..Japan -3.6 -7.5 10.8 10.9 3.1 5.9 0.8China -1.8 4.5 13.5 19.3 1.9 9.5 -1.2France 0.3 4.0 17.3 11.5 2.7 4.1 12.5Italy 1.7 4.1 18.5 18.0 2.7 12.3 10.2Spain 6.4 12.0 24.3 19.7 9.5 13.5 18.3Belgium 1.0 2.9 14.2 12.1 5.0 5.8 11.8Canada -1.7 0.7 7.3 11.2 9.4 8.2 7.7Netherlands -7.3 1.4 19.1 14.3 -1.5 12.1 10.5Mexico -6.3 -0.1 -3.4 -1.8 1.5 0.2 -4.2Korea, Rep. 1.2 13.0 2.1 6.7 3.7 15.2 10.6Austria 2.2 2.7 21.2 12.6 2.3 3.1 13.3Switzerland -2.0 5.7 14.4 9.7 1.2 4.5 11.9Turkey -14.1 37.7 24.1 23.9 7.1 -9.4 34.0Poland 2.9 12.5 10.6 22.8 3.3 7.6 25.3Australia -15.8 11.9 17.6 16.3 8.0 5.0 12.1
Source: UN Comtrade (2008).
Table 4. Top 20 exporters of textile and clothing products
A. Sum of exports value (Billions USD)
2000 2001 2002 2003 2004 2005 2006 2007All countries 358.46 350.28 366.62 423.25 473.61 489.89 530.87 559.98China 49.38 49.83 57.85 73.35 88.77 107.66 138.09 165.80Hong Kong, China 36.37 34.37 33.67 35.06 37.95 39.58 40.82 40.83Italy 24.67 25.54 25.87 29.51 33.17 32.97 34.72 38.25Germany 18.64 19.25 20.46 23.14 25.73 26.97 29.34 32.45United States 21.99 20.02 19.33 20.44 21.95 21.92 22.70 22.04India 11.75 10.47 11.80 13.31 13.39 17.92 19.42 20.97Turkey 10.01 10.40 12.07 15.12 17.60 18.90 15.93 18.58France 11.90 11.63 12.37 14.12 15.24 15.11 15.89 17.94Belgium 10.22 10.30 10.99 12.43 13.74 13.95 15.07 16.99Korea, Rep. 18.16 15.59 15.32 14.96 14.90 13.70 13.01 13.25Chinese Taipei 15.22 12.63 12.15 11.88 12.54 11.81 11.79 11.63Pakistan .. .. .. 8.30 8.92 10.26 10.87 10.74United Kingdom 8.82 8.22 8.39 9.53 10.60 10.14 10.56 ..Indonesia 8.20 7.68 6.89 7.05 7.65 8.60 9.45 9.81Spain 5.04 5.37 6.12 7.38 8.11 8.30 9.17 10.66Netherlands 4.89 4.79 5.26 6.84 8.20 8.14 9.05 10.58Mexico 11.28 10.17 10.11 9.51 9.68 9.56 8.45 7.32Japan 8.18 7.31 7.12 7.54 8.33 8.07 8.10 8.45Thailand 5.55 5.29 5.18 5.54 6.43 6.73 6.95 7.04

TAD/TC/WP(2007)14/FINAL
12
Table 4. Top 20 exporters of textile and clothing products (cont’)
B. Share in all countries' exports
2000 2001 2002 2003 2004 2005 2006 2007All countries 100.0 100.0 100.0 100.0 100.0 100.0 100.0 100.0China 13.8 14.2 15.8 17.3 18.7 22.0 26.0 29.6Hong Kong, China 10.1 9.8 9.2 8.3 8.0 8.1 7.7 7.3Italy 6.9 7.3 7.1 7.0 7.0 6.7 6.5 6.8Germany 5.2 5.5 5.6 5.5 5.4 5.5 5.5 5.8United States 6.1 5.7 5.3 4.8 4.6 4.5 4.3 3.9India 3.3 3.0 3.2 3.1 2.8 3.7 3.7 3.7Turkey 2.8 3.0 3.3 3.6 3.7 3.9 3.0 3.3France 3.3 3.3 3.4 3.3 3.2 3.1 3.0 3.2Belgium 2.9 2.9 3.0 2.9 2.9 2.8 2.8 3.0Korea, Rep. 5.1 4.5 4.2 3.5 3.1 2.8 2.5 2.4Chinese Taipei 4.2 3.6 3.3 2.8 2.6 2.4 2.2 2.1Pakistan .. .. .. 2.0 1.9 2.1 2.0 1.9United Kingdom 2.5 2.3 2.3 2.3 2.2 2.1 2.0 ..Indonesia 2.3 2.2 1.9 1.7 1.6 1.8 1.8 1.8Spain 1.4 1.5 1.7 1.7 1.7 1.7 1.7 1.9Netherlands 1.4 1.4 1.4 1.6 1.7 1.7 1.7 1.9Mexico 3.1 2.9 2.8 2.2 2.0 2.0 1.6 1.3Japan 2.3 2.1 1.9 1.8 1.8 1.6 1.5 1.5Thailand 1.5 1.5 1.4 1.3 1.4 1.4 1.3 1.3
C. Year-on-year growth rates
2001 2002 2003 2004 2005 2006 2007All countries -2.3 4.7 15.4 11.9 3.4 8.4 5.5China 0.9 16.1 26.8 21.0 21.3 28.3 20.1Hong Kong, China -5.5 -2.0 4.1 8.2 4.3 3.1 0.0Italy 3.5 1.3 14.1 12.4 -0.6 5.3 10.2Germany 3.3 6.3 13.1 11.2 4.8 8.8 10.6United States -8.9 -3.5 5.8 7.4 -0.2 3.6 -2.9India -10.9 12.8 12.8 0.5 33.9 8.4 8.0Turkey 3.8 16.1 25.3 16.4 7.4 -15.7 16.6France -2.3 6.4 14.2 7.9 -0.8 5.1 12.9Belgium 0.8 6.6 13.1 10.5 1.5 8.0 12.8Korea, Rep. -14.1 -1.7 -2.3 -0.4 -8.1 -5.0 1.8Chinese Taipei -17.0 -3.8 -2.2 5.6 -5.8 -0.2 -1.3Pakistan .. .. .. 7.5 15.0 6.0 -1.2United Kingdom -6.8 2.0 13.7 11.2 -4.4 4.2 ..Indonesia -6.4 -10.3 2.4 8.5 12.5 9.8 3.9Spain 6.6 13.9 20.6 9.9 2.4 10.4 16.3Netherlands -2.1 10.0 29.9 19.9 -0.7 11.3 16.8Mexico -9.9 -0.6 -6.0 1.9 -1.3 -11.6 -13.4Japan -10.6 -2.6 5.9 10.4 -3.2 0.4 4.3Thailand -4.8 -2.0 6.8 16.2 4.6 3.3 1.3
Source: UN Comtrade (2007).

TAD/TC/WP(2007)14/FINAL
13
Box 1. Technical textiles
The importance of so-called technical textiles in world textile and clothing trade is somewhat difficult to assess because of their variable definition and scope. One definition that was adopted by the Textile Institute characterises such textiles as textile materials and products manufactured primarily for their technical and performance properties rather than their aesthetic or decorative characteristics. However, as was pointed out by Horrocks and Anand (2000), this definition leaves a considerable scope for interpretation when an increasing number of products are combining both performance and decorative properties (e.g. high performance sportswear). Other definitions that function in the literature include industrial textiles that consist of products other than those intended for apparel, household and furnishing end-uses or products made of man-made fibres such as e.g. viscose, polyamide or polyester.
Evidently, it is hard to define a border between a traditional and technical textile product but existing definitions appear to suggest that what technical textile products have in common is the combination of the techniques of manipulating fibres, fabrics and finishing as well as understanding of how these techniques perform in different combinations and environments (Horrocks and Anand, 2000). This in turn suggests a high R&D and new technology intensity of these products as compared to, for example, textile products that rely more heavily on labour input, traditional textiles technology or locally available natural fibres.
Horrocks and Anand (2000) estimated that broadly-defined technical textile products accounted for as much as 50% of all textile manufacturing activity and output at the beginning of 2000s and that this share had been increasing up to that point. To estimate trends in international trade of technical textiles, exports of different kinds of textile products at the HS chapter level (HS 50-60) have been classified into traditional, technical and mixed textiles product categories. The traditional textiles have been assumed to include: silk (HS chapter 50), wool (HS 51), cotton (HS 52), other vegetable textile fibres (HS 53). Technical textiles include: man-made filaments (HS 54) that include yarns, filaments and woven fabrics made of or containing fibres such as nylon, polyamide, polyester, polypropylene, viscose; man-made staple fibres (HS 55); and impregnated, coated or laminated textile fabric (HS 59), e.g. various man-made tyre cord fabrics. The mixed textiles products category is composed of products manufactured from traditional fibres as well as man-made fibres and includes: wadding, felt, nonwovens, yarns, twine, cordage (HS 56), carpets (HS 57); and knitted or crocheted fabric (HS 60).
By this definition, in 2007, the two top technical textiles exports worldwide were woven dyed fabric containing 85% textured polyester (HS 540752) and impregnated fabric coated and covered with polyurethane (HS 590320); they accounted for, respectively, 6% and 4% of the world technical textiles market in value terms.
Interestingly, the share of mixed textile products in world textile exports increased from around 17% to 30% during the period from 1988 to 2007. Over time, technical textiles (defined as HS 54, 55, 59) have accounted for a gradually declining share of world trade in textile products, reaching 40% in 2007 (Figure A.). The share of traditional products has been declining more rapidly from close to 40% in the late 1980s to 30% in 2007. However, these world trends mask considerable differences in the degree of specialisation across regions and income groups. While for the OECD countries’ the trends in composition of textile trade mimic those for world trade, fast growing Asian producers such as China or India have been clearly increasing their specialization in technical and mixed products (Figures B and C, respectively). In China the share of technical textiles exports is now close to 40%, almost double of what it was at the beginning of the 1990s. In 2007, China was also the largest exporter of technical textiles in the world with the share of 18% of the world market (Table A). Technical textiles accounted for 30% of India’s textiles exports in 2007, a three-fold increase since the beginning of the 1990s. These trends should be seen in parallel with the decreasing share of technical textiles in exports of OECD countries to trading partners in low and middle income Asian countries (Figure D) signifying a gradual shift of manufacturing of these R&D-intensive textile products towards emerging economies.
Caveat: Given the fact that the definition used above is not a single agreed definition of technical textiles the following statistics should not be taken at face value.

TAD/TC/WP(2007)14/FINAL
14
Figure A. Share of technical textiles in world exports
0%10%20%30%40%50%60%70%80%90%
100%
Technical Mixed Traditional
Figure B. Share of technical textiles in China’s textile products exports
0%10%20%30%40%50%60%70%80%90%
100%
Technical Mixed Traditional

TAD/TC/WP(2007)14/FINAL
15
Figure C. Share of technical textiles in India’s textile products exports
0%10%20%30%40%50%60%70%80%90%
100%
Technical Mixed Traditional
Figure D. Share of technical textiles in OECD countries’ exports to low and middle income countries in Asia
0%10%20%30%40%50%60%70%80%90%
100%
Technical Mixed Traditional

TAD/TC/WP(2007)14/FINAL
16
Table A. Top 10 exporters of technical textiles products
2000 2007 2000 2007All countries 69.9 91.9 100% 100%China 4.4 17.0 6% 18%Germany 5.4 8.0 8% 9%Chinese Taipei 7.6 6.6 11% 7%Korea, Rep. 8.0 5.6 12% 6%United States 5.3 5.3 8% 6%Italy 4.2 5.2 6% 6%Japan 4.7 4.6 7% 5%Hong Kong, China 4.1 3.0 6% 3%Indonesia 2.4 3.0 3% 3%France 2.7 2.7 4% 3%
value (Billions USD) share in all countries' exports
Source: UN Comtrade and authors’ calculations, Horrocks and Anand (2000).
The MFA and the ATC
7. 1 January 2005 marked the end of the ten year period of eliminating quantitative restrictions on imports of textiles and clothing set out in the WTO Agreement on Textiles and Clothing. The ATC was designed to regulate the transition between the MFA — an agreement that came into force in 1974 as a replacement of the Long Term Agreement Regarding International Trade in Cotton Textiles signed in 1962 — and a full integration of textile and clothing products into the GATT rules.2
8. The ATC was a transitory system which established rules for phasing out bilateral quotas maintained under the MFA and integrating textile and clothing products fully into the GATT 1994. Under the provisions of the ATC all MFA restrictions in place on 31 December 1994 were to be carried over into the new agreement and maintained until the restrictions are removed or the products are integrated into GATT. Four importers took advantage of these provisions: the EU, Canada, Norway and the United States.3 For
2 Additionally, the ATC regulated the application of transitional safeguards in the form of quantitative
restrictions that could also be applied by countries that had not maintained quotas under the MFA on imports of products covered by the ATC that cause serious damage or threat thereof to the import-competing domestic industry.
3 These restrictions were reported in detail in national notifications to the Textiles Monitoring Body of the WTO (TMB) and consisted of information on: bilateral 1994 limits on imports of each product category; allowed percentage annual growth rates of these limits; percentage swing rates between product categories; and carryover and carry forward rates that specified how quotas could be transferred between different years of trading. Notifications of quantitative restrictions with respect to then non-WTO members, China for example, were made for information purposes only and did not imply that the US would accord the benefits of the ATC to these countries. The notification system was actually less transparent than it may seem, especially from a cross-country comparison and assessment of economic impacts viewpoints. First, each of the four notifying countries used different product classification within the MFA. Second, they maintained different initial quotas that were not related to their bilateral trade potential in any particular way. Third, they set different annual quota growth rates. Fourth, at the product category level some limits were specified in the number of imported items, some in square meters and some in kilograms making the assessment of their restrictiveness and cross-country comparisons extremely difficult. Fifth, existing quotas could have been changed in the interim as long as the targets set for integration stages were obeyed. All these factors imply that the extent of restrictiveness of

TAD/TC/WP(2007)14/FINAL
17
these countries the integration of a product into GATT 1994 had two consequences: first, any quantitative restriction maintained on such a product under the ATC was eliminated; second, the transitional safeguard mechanism could not be invoked any more with respect to imports of such a product (WTO, 2004). For WTO members that did not maintain quotas under the MFA the effect of implementing integration programmes was to remove the possibility of having recourse to the transitional safeguard mechanism.
9. It is reported that on the eve of signing of the ATC the US had bilateral agreements with as many as 41 countries of which 25 were members of the WTO (WTO, 1995a). For the majority of the products the annual growth rates of quotas were set at 6% or above though rarely exceeding 7%. For many low cost Asian textiles producers such as China, Hong Kong, China, Chinese Taipei and the Republic of Korea the annual quota growth rates were very often between 0.5 and 3% and the number of products restricted by quotas was for these countries clearly much higher. For example, Costa Rica faced quotas on exports of five product categories in 1994 while China was subjected to approximately 110.
10. In its initial notification, the EC listed restrictions on imports from 13 WTO members consisting of information on direct and outward processing trade (OPT) quotas and flexibility provisions (WTO, 1995b). As in the case of the US, the annual growth rates of quotas rarely exceeded 7% and tended to be lower for China and other low cost Asian producers. The EU restrictions on trade with China were only notified to the TMB in early 2002, following China’s accession to the WTO.
11. Canada’s 1995 notification of quotas carried forward into the ATC listed 43 countries of which 26 were WTO members (WTO, 1995c). For China the annual quota growth rates seemed in line with rates set for other countries though China was clearly restricted on a larger number of items than other countries. Norway’s notification indicated quantitative restrictions on imports from 20 countries on four relatively broad product categories (WTO, 1995d). As in the case of Canada, the annual quota growth rates for China were comparable with rates set for other countries.
Phase-out of MFA quotas under the ATC
12. Integration of textiles products into the GATT 1994 was considered the main pillar through which the ATC was supposed to deliver market opening. Products were to be integrated in four consecutive steps: 16% of the 1990 trade volume by 1 January 1995, 33% by 1 January 1998, 51% by 1 January 2002 and 100% by first January 2005. In this respect a back-loading was built into the system since the last 50% of the volume integration was scheduled to occur on 1 January 2005. Additionally, the choice of products to be liberalised at each stage was left to the concerned countries as long as the integrated items comprised four broad categories of products: tops and yarns; fabrics; made-up textile products; and clothing. As a result, in initial phases the integration of products into the GATT did not necessarily cover the products on which MFA quotas existed in the first place. Also, different MFA quotas had different restrictiveness which was demonstrated by varying quota fill rates and those non-binding quotas were the ones to be integrated first. Also, the commitments were set in terms of volumes not values which implied that the first two stages of the ATC were characterised by integration of low value added and low-skilled labour content items (Reinert, 2000).
13. Annex Table 2 indicates that 89% of the quotas the US had in 1990 were abolished in the final stage of the ATC. Respective shares for the EU and Canada are 70 and 79%. Norway was an exception as it eliminated all restrictions in three quicker steps: 1 January 1996, 1 January 1998, 1 January 1999 and 1 January 2001.
the MFA, and consequently the extent of liberalisation brought about by the ATC, was rather specific to each individual bilateral trade relation. Hence, it should be borne in mind that the concept of a generalised assessment of the economic impact of the MFA and the ATC is limited.

TAD/TC/WP(2007)14/FINAL
18
14. In addition to the integration of textile and clothing products into the GATT, the ATC accelerated the annual growth rates of quotas carried over from the MFA. These growth rates were supposed to be increased by 16% by 1 January 1995, by 25% by 1 January 1998 and by 27% by 1 January 2002. What this pillar of the ATC meant in practice was that if the quota was set to increase by 6% annually4 under the MFA it should increase by 6*1.16=6.96% annually under the first phase and by 6.96*1.25=8.7% annually under the second phase of the ATC, and so on. As per Nordas (2005), the accumulated aggregate increases of the quotas over the ATC period in the EU were 18% and in the US 25% above the levels they would have been with the continuation of the MFA.
15. In the period January-March 2005, US imports of cotton trousers from China increased by 1 500% and those of knit cotton shirts by 1,250% as compared to their levels recorded during the same period in 2004.5 Other low cost producers that have significantly increased their exports to the US included India, Indonesia, Vietnam, Pakistan and Bangladesh, among others. In late April 2005 the US Committee on the Implementation of the Textile Agreement (CITA) began considering requests for safeguard action on imports from China on seven product categories. Approximately one month later quantitative limitations on imports of seven textile categories were established through 31 December 2005 and bilateral negotiations with China were requested. Upon receipt of the request China agreed to limit its exports to a level not greater than 7.5% above the amount shipped during the preceding 12 months.
16. The bilateral talks between the US and China that concluded in November 2005 resulted in a memorandum of understanding in which the reintroduction of restraints for 21 product categories was agreed under the special T&C safeguard clause of China’s WTO accession protocol. The temporary restraints were imposed on several items including cotton shirts, cotton trousers, and underwear and reported to cover 90% of imports restricted in 2004. Depending on the product category, the agreement allowed for an increase of between 173% and 640% in biennium 2004-06, between 12.5% and 16% in 2007 and 15% and 17% in 2008.
17. Similarly to the US, in the EU the beginning of 2005 brought about significant increases of imports from China. The highest percentage increases with respect to the first quarter 2004 were recorded for pullovers (534%), men’s trousers (413%), blouses (186%) and bed linen (164%). Investigations for evidence on market disruptions caused by the surge of imports from China were initiated at the end of April 2005 and a memorandum of understanding was reached in June 2005. The agreement limited, until end-2007, China’s exports in ten product categories for the years 2005, 2006 and 2007 with annual quantity growth rates ranging from 10% to 12.5% from the base imports level in the period April 2004 – March 2005. The restricted items included: pullovers, men’s trousers, blouses, t-shirts, dresses, bras, flax yarn, cotton fabrics, bed linen, and table and kitchen linen.
Major post-ATC changes in the EU and the US markets
18. Even with the reintroduction of temporary quotas, 2005 and 2006 brought about significant changes in the EU and the US markets. The value of China’s textile and apparel exports to the EU25 increased by 43% in 2005 and this was the largest increase across all the suppliers. This surge was mainly driven by apparel products which grew by 45% while textiles exports increased by 22%. India and Vietnam have also experienced growing exports, by 18% and 6%, respectively and this was largely driven by wearing apparel. Other countries that enjoyed small increases were the United Sates, Turkey and Bulgaria (Figures 1-2).
4 Under the MFA, the restricted textile and clothing were limited to 6% annual growth though in exceptional
circumstances theses growth rates could be set at lower levels. 5 Based on a communication from the US Department of State.

TAD/TC/WP(2007)14/FINAL
19
19. However, for most of the other suppliers the value of their exports to the EU25 has decreased in 2005. One group of countries with negative impacts include those enjoying some sort of preferential access to the EU market, such as Morocco (-7%) and Tunisia (-13%) which are parties to the Euro-Mediterranean Partnership Agreements, Bangladesh (-5%) which enjoyed duty and quota-free market access within the Everything but Arms initiative or Mauritius which enjoyed preferential access granted to the ACP countries.6 Nevertheless, several other suppliers such as Korea (-24%), Australia (-29%), or Thailand (-8%) also faced decreasing demands for their shipments.
20. Remarkably, the negative 2005 trends were reversed in 2006 for almost all suppliers. The value of Chinese exports grew by 13% — a marked slowdown from the year before — and the value of exports increased for most other suppliers including Bangladesh (30%), Vietnam and Hong Kong, China (47% each), Sri Lanka (21%), Cambodia (16%), Pakistan (13%) and Mauritius (10%). This illustrates the impact of the temporary restraints which apparently succeeded in curbing the surging imports from China only in 2006. This is likely to do with the fact that even though a quota for 2005 was also established, it was base imports level in period April 2004 – March 2005, which covered the first three months of China’s unlimited access to the market.
21. In 2007 the EU imports of textiles products from China grew at approximately 10%, down from the growth in 2005 and 2006. Apparel imports, on the other hand, grew at a rate close to 16%, up from 13% in 2006. This suggests that with the increases in the temporary restraints China’s competitors in the EU25 market are put under an increasing pressure, especially in apparel. This is also visible in the rates of exports growth calculated for these suppliers which, especially in apparel, were much lower in the first in 2007 than they were in 2006 (Figures 1-2).
22. In the US market, 2005 and 2006 brought about even larger increases in imports from China (Figures 3-4). The growth of imports of textile products was at a high of 29% in 2005 but fell since then to 18% and 12% in 2006 and 2007. The value of apparel imports apparel products grew by an astounding 70% in 2005 and at around 20% in both 2006 and 2007. The impacts on third countries in the US market give a clearer picture with India, Indonesia, Vietnam, Bangladesh and Cambodia all increasing their apparel exports, albeit at falling rates, in 2005-07. In textiles products only India and Vietnam seem to have been withstanding the competition post 2005. Many suppliers lost market shares and these include, in textiles: South Korea, Turkey, NAFTA members Mexico and Canada as well as several EU exporters. As far as clothing products are concerned persistently falling exports in the period 2005-07 have been recorded in the case of Mexico, Hong Kong, China, Guatemala, Dominica Republic and Macau.
6 Annex Box 2 provides a discussion of Madagascar’s textiles and clothing industry, its reliance on preferential
trade and ways of coping with the MFA phase-out.

TAD/TC/WP(2007)14/FINAL
20
Figure 1. EU25 imports of textiles by country and region in 2005-08
A. Value, in billions EUR
13.4
2.4
1.7
1.3
0.8
0.8
0.6
0.6
0.5
0.3
0.3
0.4
0.3
0.3
0.2
0.2
0.2
0.2
0.2
0.2
0.1
14.4
2.8
1.9
1.4
0.9
0.8
0.7
0.5
0.5
0.4
0.3
0.4
0.3
0.3
0.2
0.2
0.2
0.2
0.2
0.2
0.1
14.9
3.0
2.1
1.6
0.9
0.9
0.8
0.6
0.5
0.4
0.4
0.3
0.3
0.3
0.2
0.2
0.2
0.2
0.1
0.1
0.1
13.9
3.0
1.9
1.5
0.8
0.8
0.7
0.5
0.5
0.3
0.4
0.4
0.3
0.2
0.2
0.2
0.2
0.1
0.1
0.1
0.1
0 2 4 6 8 10 12 14 16
World excl. EU25 intra-trade
China
Turkey
India
United States
Switzerland
Pakistan
South Korea
Japan
Indonesia
Romania
Chinese Taipei
Australia
Thailand
Egypt
Bulgaria
Israel
South Africa
Iran
New Zealand
Tunisia
2005 2006 2007 2008 P
B. Percentage change
-50 -40 -30 -20 -10 0 10 20 30 40
World excl. EU25 intra-trade
China
Turkey
India
United States
Switzerland
Pakistan
South Korea
Japan
Indonesia
Romania
Chinese Taipei
Australia
Thailand
Egypt
Bulgaria
Israel
South Africa
Iran
New Zealand
Tunisia
2005 2006 2007 2008 P
Source: Eurostat COMEXT (2007).

TAD/TC/WP(2007)14/FINAL
21
Figure 2. EU25 imports of clothing by country and region 2005-08
A. Value, in billions EUR
59.8
18.7
9.3
4.0
3.7
3.8
2.6
2.3
1.7
1.4
1.1
1.2
0.8
0.8
0.8
0.6
0.4
0.5
0.4
0.4
0.3
66.7
21.1
9.4
4.6
4.8
3.7
2.6
2.4
2.5
1.6
1.3
1.5
1.1
1.0
0.9
0.6
0.5
0.6
0.5
0.5
0.4
69.3
24.3
10.2
4.7
4.6
3.0
2.7
2.6
1.7
1.7
1.3
1.2
1.2
1.1
0.8
0.7
0.5
0.5
0.5
0.5
0.5
34.1
12.9
4.6
2.3
2.4
1.2
1.3
1.3
0.7
0.8
0.6
0.6
0.6
0.6
0.4
0.4
0.3
0.3
0.2
0.2
0.2
0 10 20 30 40 50 60 70 80
World excl. EU25 intra-trade
China
Turkey
India
Bangladesh
Romania
Tunisia
Morocco
Hong Kong, China
Pakistan
Bulgaria
Indonesia
Viet-Nam
Sri Lanka
Thailand
Switzerland
Egypt
Cambodia
United States
Mauritius
Fyrom
2005 2006 2007 2008 P
B. Percentage change
-80 -60 -40 -20 0 20 40 60
World excl. EU25 intra-trade
China
Turkey
India
Bangladesh
Romania
Tunisia
Morocco
Hong Kong, China
Pakistan
Bulgaria
Indonesia
Viet-Nam
Sri Lanka
Thailand
Switzerland
Egypt
Cambodia
United States
Mauritius
Fyrom
2005 2006 2007 2008 P
Source: Eurostat COMEXT (2007).

TAD/TC/WP(2007)14/FINAL
22
Figure 3. United States imports of textiles by country and region in 2005-08
A. Value, in billions USD
20.5
7.3
1.6
1.6
1.6
1.2
0.8
0.8
0.7
0.5
0.3
0.3
0.3
0.3
0.2
0.2
0.2
0.3
0.2
0.2
0.2
21.6
8.5
1.8
1.8
1.4
1.1
0.8
0.8
0.6
0.5
0.4
0.3
0.3
0.3
0.2
0.2
0.2
0.2
0.2
0.2
0.2
22.5
9.6
1.9
1.7
1.2
1.1
0.8
0.7
0.6
0.5
0.4
0.3
0.3
0.3
0.2
0.2
0.2
0.2
0.2
0.2
0.2
22.0
10.0
2.0
1.5
1.0
1.0
0.7
0.6
0.6
0.5
0.4
0.3
0.3
0.2
0.2
0.2
0.2
0.2
0.2
0.2
0.2
0 5 10 15 20 25
WorldChinaIndia
PakistanCanadaMexico
ItalyKorea
TurkeyChinese Taipei
JapanThailandGermany
BrazilFrance
United KingdomIndonesia
IsraelBelgiumPortugalVietnam
2005 2006 2007 2008 P
B. Percentage change
-30 -20 -10 0 10 20 30 40
World
China
India
Pakistan
Canada
Mexico
Italy
Korea
Turkey
Chinese Taipei
Japan
Thailand
Germany
Brazil
France
United Kingdom
Indonesia
Israel
Belgium
Portugal
Vietnam
2005 2006 2007 2008 P
Source: OTEXA (2007).

TAD/TC/WP(2007)14/FINAL
23
Figure 4. United States imports of clothing by country and region 2005-08
A. Value, in billions USD
68.7
15.1
6.1
2.7
2.9
3.0
2.4
2.6
1.7
3.5
1.8
1.8
0.0
1.3
1.6
1.8
1.4
1.1
1.8
1.2
0.7
71.6
18.5
5.3
3.2
3.7
3.2
2.9
2.4
2.1
2.8
1.8
2.0
1.7
1.4
1.4
1.7
1.3
1.3
1.5
1.2
0.9
73.9
22.7
4.5
4.4
4.0
3.2
3.1
2.5
2.4
2.0
1.8
1.7
1.6
1.5
1.5
1.5
1.4
1.1
1.1
1.0
1.0
70.9
21.8
4.0
5.4
4.0
3.0
3.3
2.6
2.4
1.9
1.7
1.4
1.4
1.5
1.6
1.4
1.4
1.0
0.8
1.0
0.9
0 10 20 30 40 50 60 70 80
World
China
Mexico
Vietnam
Indonesia
India
Bangladesh
Honduras
Cambodia
Hong Kong, China
Thailand
Philippines
Sri Lanka
Pakistan
El Salvador
Guatemala
Italy
Jordan
Dominican Republic
Macau
Nicaragua
2005 2006 2007 2008 P
B. Percentage change
-40 -20 0 20 40 60 80
World
China
Mexico
Vietnam
Indonesia
India
Bangladesh
Honduras
Cambodia
Hong Kong, China
Thailand
Philippines
Sri Lanka
Pakistan
El Salvador
Guatemala
Italy
Jordan
Dominican Republic
Macau
Nicaragua
2005 2006 2007 2008 P
Source: OTEXA (2007).

TAD/TC/WP(2007)14/FINAL
24
23. Overall, the two markets bear some similarity in that the rates of growth of textiles imports from China have been levelling off in the period 2005-07 while in the apparel sector they seem to have grown again in 2007 after a visible dip in 2006 that was likely associated with the intermittent effects of temporary quotas, which mostly concerned apparel products. Yet, the level of 2007 growth rates suggest that it is unlikely that imports from China will ever grow at the rates observed in early 2005. This suggests a rather one-off effect of 2005 quota removal.
24. At this stage import data for 2008 are only available through September but a projection of the annual outcome can be made by comparing them with import data for the corresponding period in 2007. Such projections suggest that 2008 brought about a significant contraction of imports from all trading partners in both textiles and clothing and in both the EU and the US markets. In the EU the value of imports of textiles was down 7% form 2007 and the value of imports of clothing products was down by a stunning 51%. The corresponding reductions for the US were calculated at 2 and 4%. These are only projections based on incomplete data but they suggest a global slowdown in T&C trade, presumably due to lower consumer confidence and difficulties in financing of trade activities due to the on-going financial market turmoil but also, more generally, the global economic slowdown in the OECD area. OECD (2008), for example, recently reported a global fall of export orders in 2008.
Survival strategies
25. Conceptually, the economic implications of the phase out of textiles and clothing quotas differ slightly across different theories of international trade. The traditional trade theory based on assumptions of constant returns to scale and perfectly competitive markets would predict increased specialisation across countries with different endowments with labour abundant countries specialising in labour-intensive activities. Physical and human capital-abundant countries would tend to specialise in capital-intensive, skill-intensive and research-intensive segments of the industry, and this is, at least partially, what was observed over the recent decades; even within the T&C industry there is tendency for physical and human capital-rich countries to specialise in capital-intensive segments of the market, with high content of technology and innovation.
26. The new trade theory that acknowledges the existence of increasing returns to scale and product differentiation predicts that, while the net trade flows will reflect factor endowments (e.g. China with its inexpensive labour would be a net exporter of labour-intensive T&C products), T&C producers in capital-intensive countries (i.e. OECD) will be able to stay in the market and in fact engage in intra-industry trade with these countries as long as their products are differentiated from those produced in labour-abundant countries. Another implication of the new trade theory, and particularly one of its branches — the new economic geography, is that market sizes and trade costs matter and that, on the one hand, spatial location of production has implications for trade and, on the other hand, trade has implications for spatial location of production. A very basic implication is that producers in the proximity of large markets may have a competitive edge and may remain in the market even with relatively high production costs. Yet, reduction of trade costs in such a framework could lead to the formation of a core and periphery. The core would specialise in industries with increasing returns to scale and spillovers should enforce the advantages of large markets, as will forward and backward linkages. The periphery is likely to specialise in low wage industries, in industries with less product differentiation and limited spillovers. This initial core-periphery structure, however, could be eroded with the decrease in trade costs or barriers, with the emergence of agglomeration diseconomies or with wage changes in the core or periphery.
27. At a more practical level the anticipation and the actual phase out of MFA quotas forced T&C exporters to compete in global markets under less distorted conditions. Traditional T&C industries in many OECD and non-OECD countries have been under increasing pressure from low cost producers such as China but this situation reflected the actual comparative cost advantage rather than effects of a largely

TAD/TC/WP(2007)14/FINAL
25
arbitrary state regulation as was clearly the case with MFA quotas. This is a preferred situation from a long-term stand point under the condition that the labour shed form this industry is reabsorbed in other more competitive segments of the economy and social costs of such a change are minimised (see OECD, 2005).
28. Also, many OECD producers seem to have endured the mounting competition by adopting new strategies in their quest for survival in the global competitive arena. Some of the strategies adopted by producers included improving productivity of employed labour, differentiating away from the market segments where they have to compete on labour cost towards segments where they compete on quality (vertical differentiation), application of sophisticated technology, design and marketing strategies as well as by concentrating on fewer products categories (horizontal differentiation) and exploitation of scale economies.
29. The analysis that follows suggests that vertical specialisation has been mainly adopted by OECD producers while some developing country producers managed to compete with China by offering similar prices. Horizontal specialisation has been adopted by OECD as well as developing country producers. The strategy of reorientation of markets has been followed by many developing-country producers, while relocation to lower cost production sites has been typically adopted by OECD producers.
30. Interestingly, productivity improvements that allowed successful OECD producers to remain in the market seem to have been achieved not only by the general reduction in employment but also by moving towards a market structure characterised by a larger number of more specialised firms that are smaller in terms average number of employed staff but larger in terms of average per firm output. This is in contrast with the trends in major low cost exporting countries such as China, India or Pakistan which saw falling numbers of firms that, on average, were employing growing numbers of employees. This suggests a consolidation of production and exploitation of economies of scale. These trends seem to conform rather well to both the endowment and product differentiation hypotheses of trade liberalisation.
31. These strategies and major measures adopted to cope with changing textiles and clothing landscapes are illustrated with the analysis of main trends in major OECD importers and major OECD and non-OECD exporters as well as Annex boxes highlighting main developments in two smaller developing country exporters: Honduras and Madagascar (Annex Boxes 1 and 2).
Vertical differentiation
32. As already foreshadowed, one strategy to survive in the competitive arena, in particular for more efficient producers, is to differentiate their products by quality. For established high-quality producers this mainly means withdrawing from low-cost segments and upgrading their high value added activities. For late-comers, this strategy can be pursued, for instance, by upgrading production technology. New technology facilitates achieving higher aggregate efficiency, which in turn leads to a higher quality of every good (i.e. produces the quality margin). Moving up the value added chain induces vertical specialisation or differentiation by quality. The prerequisite for such a strategy is the acquisition of new technology through imports or R&D, or both. Some of the lower cost producers, such as China but also Turkey, India or Pakistan, for instance, have been successful in adopting this strategy; for some time before the inception of the ATC they had been importing advanced textile machines, mainly from OECD countries, and boosting R&D investment in the textiles and garments industry.
33. To examine which producers chose to differentiate their products vertically and whether this worked, a comparison of unit prices of major exporters in the EU and the US, two world’s largest markets that had quotas until 2005, is performed, under the assumption that unit prices reflect quality within the same product category (Ito and Fukao, 2005). It has to be acknowledged that this is a rather brave

TAD/TC/WP(2007)14/FINAL
26
assumption and it does not allow one to easily distinguish between a situation where the producer is simply too expensive and a situation where the producer is offering a product of high quality, a distinction key to the interpretation of the success of adopted strategies. There is no easy way around this problem with the available data but to combine the unit price data with information on evolution of market shares. If unit prices diverge as compared to the cheapest producers but market shares are stable or growing it is likely that we are dealing with a successful quality differentiation strategy. If unit prices diverge and market shares fall it is more likely that consumers do not perceive the higher unit price product to be of better quality but rather as too expensive or that only the producers of truly high quality remain in the market while others exit.
34. When choosing China as a benchmark, differentiation strategies of its major competitors in the US market can be inferred. As evident from the time series unit value data, the impact of the 2005 phase-out was much more dramatic in the US market (see Figures 6 and 7 and Annex Figures 2-9). In the EU unit values of imports from China have been falling more gradually since the beginning of 2000s and 2005 was not a major outlier in this trend. The US market saw more abrupt falls of unit prices in 2005, sometimes by as much as 60% with respect to the 2004 level. In both these markets unit prices of products covered by temporary restraints rebound in 2006. These unit price movements are textbook examples of quota effects which reduce competition and introduce incentives for producers to maximize the revenue per quota licence by increasing unit prices. Starting in 2007 a gradual reduction of Chinese unit prices was observed in the EU as the temporary restraints were liberalised and phased out in 2007. In the US a similar, though somewhat less uniform, trend of falling unit prices of Chinese imports from 2007 was observed.
35. In order to analyse the price developments, unit prices of major exporters in OECD markets have been calculated at the six-digit level of the HS classification for the years 1990-2007on the basis of UN Comtrade database. To summarise such a large amount of information unit prices at the detailed product category were expressed in terms of percentage of the “benchmark” unit price, then these prices were weighted by value shares and aggregated to the 2-digit levels and the share of products defined as “similar” or “very different” in terms of quality from the benchmark was calculated.
36. Analysis of developments in the US market indicates that both quality differentiation and competition within the same quality range have been pursued in the ATC period. Not surprisingly, quality differentiation has been mostly observed by the producers from high income countries, in some cases successfully, while producers from a number of low-cost countries have been able to offer Chinese or even lower prices. Italian T&C producers, for example, have clearly adopted the strategy of vertical differentiation. Nearly 80% of other competitors’ products in the US markets are less than a quarter of the Italian unit price and only a few producers approach the Italian unit price (defined as within 10% of the Italian unit price) in a limited number of product categories.
37. In the clothing categories (HS 60-63), only Canada among China’s top ten competitors (Italy is not among the top ten) chose vertical differentiation into higher-quality, higher-price (defined as at least double of the Chinese unit price) while producers in countries such as Honduras, pre-2005 Bangladesh and Pakistan into lower-price (defined as less than half of the Chinese unit price) products (Figure 5A).7 India and Indonesia have been exporting to the US similar quality products as China over the past ten years, while Bangladesh, Pakistan and Vietnam adjusted their prices to China’s from 2005 (Figure 5B). By 2006, over half of clothing exported to the US market had a unit price very close to the China’s (defined as within a 10% range from the Chinese unit price). This strategy of “following” Chinese prices became particularly apparent after 2005, while in the era of the protected markets the share of such products was a mere 15% (e.g. in 2001). Vietnam, a previously lower-cost producer (with over 80% of its clothing exports
7. In the case of Honduras the lower price may be related to geographical proximity.

TAD/TC/WP(2007)14/FINAL
27
to the US being less than half of the Chinese unit price before China’s entry to WTO) has increasingly been producing the same quality products as China.
Figure 5. Positioning strategies of China’s selected major competitors in the US market 1997-2007
A. Few exporters can undercut Chinese prices (share of products with less than half of the Chinese price in %)
0
10
20
30
40
50
60
70
80
90
1997 1998 1999 2000 2001 2002 2003 2004 2005 2006 2007
Bangladesh Honduras Pakistan Vietnam
B. China sets clothing prices post 2005 (share of clothing exports within 10% of the Chinese unit price in %)
0
5
10
15
20
25
30
35
40
45
50
1997 1998 1999 2000 2001 2002 2003 2004 2005 2006 2007
Bangladesh India Indonesia Pakistan Vietnam
Source: OECD calculation from UN Comtrade database (2007).

TAD/TC/WP(2007)14/FINAL
28
38. If we consider a broader group of major OECD and non-OECD exporters (Annex Figure 1) all of them have been gradually experiencing intensifying price competition from China in the US market. The shares of exports of products with less than half of the Chinese price have obviously been smaller than in the case of low-cost producers and falling continuously since the beginning of the 2000s with a major dip in 2005 and a modest revival in 2006 and 2007. Interestingly, this applied more or less equally to high and lower income OECD exporters but also to India indicating that undercutting the Chinese prices has been increasingly difficult for producers in most major exporting countries. Yet, the major difference is that exporters in lower income countries seem to have found it easier to price their products within the range of prices offered by China; of the major exporters only India and Mexico and to some extent Turkey and Korea have been able to increase the shares of their clothing exports within 10% of the Chinese unit price (Annex Figure 1).
39. So far our discussion has focused only on relative price movements. In the reminder of this sub-section the analysis is further deepened by the examination of evolution of unit prices of major exporters to the EU and the US in the period January 1995-September 2008. The in-depth examination that follows covers men’s and boys’ woollen suits (HTS 443) and men’s and boys’ knit cotton shirts (HTS code 338). Additionally we provide a brief discussion and data analysis (in the Annex) of five other product categories (cotton skirts (HTS 342), cotton sweaters (HTS 345), cotton bras and other body support garments (HTS 349) and man-made fibres bras and other body support garments (HTS 649)). These products were chosen to cover a relatively broad spectrum of imports of apparel and to differentiate between the products where it is relatively easy for consumers to differentiate by quality (e.g. suits or bras) and products where such quality differentiation is more difficult (cotton shirts or skirts). The chosen product group also allows a distinction between the products production of which requires relatively sophisticated technology (e.g. bras) and those that can be produced with more basic technology (e.g. cotton shirts or skirts).
40. To focus the analysis of the enormous amount of data we analyse unit prices and market shares of top 4 OECD and top 4 non-OECD exporters (2004 is the reference year to fix the selection of countries based on the pre 2005 situation) and China in each of the describe product categories in the EU15 and the US market. Additionally, we present scatter plots that compare the price positioning of top 30 OECD and non-OECD exporters and the corresponding market share gains in period 1996-2008 (Figures 6-11 and Annex Figures 2-12).
Men’s and boys’ woollen suits
41. As far as men’s and boys’ woollen suits are concerned China has been the cheapest supplier in the EU market and the second cheapest (after Moldova) supplier in the US market throughout the 1990s and 2000s (Figures 6 and 7). Chinese unit prices in the EU market have been falling gradually since the mid-1990s but, after reaching the lowest level in 2004, rose somewhat in 2005 and 2006 before falling again in 2007 and 2008. In the US market unit prices have also been falling during the 1990s and after reaching the period’s trough in 2005 have been rising since 2006. Thus the 2005 phase out of quotas seems to have had a more direct impact on the US woollen suits market. Indeed, this product category was included on the list of restricted products in the memorandum of understanding reached between the US and China in November 2005 but it was not subjected to voluntary restraints imposed in 2005 in the EU market.
42. More generally, restrictions on trade of woollen suits seemed more binding in the US prior to 2005 as is indicated by the high market share that was growing robustly in the EU market throughout the 1990s and, even more rapidly, in 2000s with the highest gains observed in 2005. In the US China’s market share was comparatively smaller and even falling gradually prior to 2005 when it exploded from below 2% in 2004 to close to 10%.

TAD/TC/WP(2007)14/FINAL
29
43. Of the key EU woollen suits market contenders Turkey and Romania seem to have been successful vis-à-vis China prior to 2005. Romania gradually increased its unit prices suggesting quality improvements though that did not seem sufficient to mitigate the impact of the quota removal and Romania’s market shares fell dramatically. Turkish producers maintained unit prices that were higher than those of China and Romania between mid 1990s and mid 2000s but reduced them noticeably in 2005. This strategy seems to have worked since Turkey’s share of EU15 market stabilised in 2006 and actually picked up again in 2008. Bulgarian exporters have been raising their prices and, presumably, the quality consistently throughout the considered period (with a temporary dip in 2005) and at the same time they have been gaining the market shares.
44. German and Italian suit producers had the highest prices and continually strong market positions in the EU15 market though their market shares have been gradually eroded since mid 1990s. In the late 1990s some price competition was observed but since the beginning of 2000 average unit prices started rising again with the largest increases observed post 2005. These price increases coincided with increasing market shares suggesting that successful quality competition might have been at work. More generally, the post 2005 unit price increases of major China’s competitors have been in most cases much larger than those of Chinese unit prices suggesting that many lower or mid-range quality producers have been eliminated from the market. In fact, whether a particular supplying country gained or lost market shares likely depended on whether it hosted a high enough number of high quality producers. Of the OECD countries this seems to have been the case in Germany and Italy but not, for example, in Portugal.
45. Prior to 2005 the US market had seen raising shares of the top four non-OECD suppliers (Colombia, India, Moldova and Vietnam) that had offered unit prices largely competitive with those of Chinese producers. This was also the case for producers from two OECD countries (Mexico and South Korea) that offered mid-range prices. At the same time the two more expensive OECD suppliers (Italy and Canada) had been losing market shares. After the 2005 dip Chinese unit prices rebounded in 2006, likely as a result of introduction of voluntary export restraints on this product category, and unit prices of most other exporters seem to have followed the trends set by China. However, the largest unit price increases had been observed for suppliers based in Italy starting in 2003 (bearing a close similarity to what happened in the EU15 market) presumably reflecting growing quality. At the same time Italy’s share of the market rose significantly despite Italy already being the largest supplier in the US market. This suggests that quality competition by Italian suit producers might have worked in the US as well as in the EU. Some signs of quality upgrading and regaining market shares were also been observed for the Canadian producers in 2008.
46. Main suppliers to the US based in non-OECD countries as well as Mexico and South Korea were in a more direct price and quality competition with China and lost market shares post 2005 further indicating the binding nature of pre 2005 quotas. Vietnam whose textiles industry shares many characteristics with that of China has done considerably better. Introduction of China’s voluntary restraints at the end of 2005 seems to have alleviated some of the competitive pressure on these countries.
47. To gain a broader picture Figure 8 compares pricing strategies and market outcomes for 30 top suppliers of woollen suits to the EU15 (Panel A) and the US markets (Panel B) by scatter-plotting the percentage difference with respect to China’s unit price against the corresponding market share gain for each supplier and year in the period 1996-2008. Interestingly, suppliers to the EU15 market have pursued a larger spectrum of price/quality strategies while the suppliers in the US market competed with producers from China more directly (especially after 2005) which also resulted in a more significant reorganisation of the market (more spectacular entries and exits from the market), while in the EU market shares were comparatively more stable.

TAD/TC/WP(2007)14/FINAL
30
48. It is unlikely that the same producers would normally have different price/quality strategies with respect to their Chinese competitors in two different markets. Therefore the differences in pricing strategies between the EU and the US markets likely reflect a combination of factors such as: (i) differences in trade policy stances such as the extent to which quotas were binding and tariff protection; (ii) differences in the country composition of top 30 suppliers group due to geographical factors and preferential trading agreements (e.g. low cost producers from Latin America in the US market and Northern African producers in the EU market); (iii) influence of other policies, including differences in competition policies, safety rules and standards; (iv) impact of non-tariff barriers.
49. The case of woollen suits and some other products included in the Annex seems to suggest that the combination of all these factors offered a larger scope for price/quality differentiation in the EU market, while suppliers to the US faced a more direct competition with China. One caveat that applies here, however, is that the presented analysis of the EU market included EU suppliers which, for example, do not face import tariffs when shipping to the EU markets, while the analysis of the US market did not include domestic US producers. In this context the different pricing strategies might be explained by the differences in market access conditions between producers from the EU and form outside of the EU.
Figure 6. Men’s suits made of wool: unit values and market shares of major competitors in the EU15 market
A. Unit values (in Euros per 100 kg)
0
5 000
10 000
15 000
20 000
25 000
30 000
Bulgaria China Croatia Germany Italy Morocco Portugal Romania Turkey
1995 1996 1997 1998 1999 2000 2001 2002 2003 2004 2005 2006 2007 2008

TAD/TC/WP(2007)14/FINAL
31
B. Market shares (%)
0
5
10
15
20
25
Bulgaria China Croatia Germany Italy Morocco Portugal Romania Turkey
1995 1996 1997 1998 1999 2000 2001 2002 2003 2004 2005 2006 2007 2008
Source: Authors’ calculations based on COMEXT.
Figure 7. Men’s suits made of wool: unit values and market shares of major competitors in the US market
A. Unit values (in USD per item)
0
50
100
150
200
250
300
350
400
450
Canada China Colombia India Italy Korea, South Mexico Moldova Vietnam
1995 1996 1997 1998 1999 2000 2001 2002 2003 2004 2005 2006 2007 2008

TAD/TC/WP(2007)14/FINAL
32
B. Market shares (%)
0
5
10
15
20
25
30
35
40
Canada China Colombia India Italy Korea, South Mexico Moldova Vietnam
1995 1996 1997 1998 1999 2000 2001 2002 2003 2004 2005 2006 2007 2008
Source: Authors’ calculations based on OTEXA.
Figure 8. Men’s woollen suits: price positioning with respect to China and market share gains (1996-2008)
A. EU market
-150
-100
-50
0
50
100
150
200
-150 50 250 450 650 850
% c
hang
e in
mar
ket s
hare
% difference with respect to China's unit price

TAD/TC/WP(2007)14/FINAL
33
B. US market
-150
-100
-50
0
50
100
150
200
-150 50 250 450 650 850
% c
hang
e in
mar
ket s
hare
% difference with respect to China's unit price Source: Authors’ calculations based on OTEXA and COMEXT, empty rectangles refer to 1996-2004 period while filled markers to 2005-08 period.
Men’s and boy’s knit cotton shirts
50. Analysis of developments in the EU and US markets for woollen suits can be complemented by an analysis of developments for men’s and boys’ cotton shirts. This product category differs from woollen suits in three major ways that are important from the point of view of our analysis. First, items such as t-shirts or pullovers that belong to this textile category are less easily differentiable in terms of quality and therefore not expected to differ much in price.8 Second, voluntary restraints on Chinese exports of these products were introduced in the US as well as the EU market.9 Third, China is actually not the cheapest large supplier of these products in either of the markets.
51. The cheapest large supplier of cotton shirts to the EU15 market was Bangladesh with stable unit prices of approximately half of those of China in late 2000s (Figure 9). Producers from India, Mauritius and to some extent Turkey were in the same price league as compared to producers from China. Germany, Italy and Portugal offered shirts at distinguishably higher prices. After having risen in the late 1990s, prices of shirts came down in early 2000s in all top nine suppliers but Turkey, reaching lowest levels around 2004 or 2005. They have risen since across all these major suppliers but more so in Germany, Italy and Portugal, again, likely reflecting exit of lower quality producers.
52. As was the case for the woollen suits, despite dramatically rising competition from low cost countries exemplified by the increasing market shares of Bangladesh, China and India, producers from 8 Evidence for this is purely anecdotal and there exist very expensive t-shirts but average per unit prices of suits
are higher than those of t-shirts and it can be expected that this may rise quality awareness among consumers. 9 While both the EU and the US re-imposed quotas on Chinese products in 2005 the product categories subject
to quotas differed. For example, the US target included woven shirts, while the EU’s did not.

TAD/TC/WP(2007)14/FINAL
34
Germany managed to grow their unit prices and market shares post 2005, which likely reflected higher quality. Italy lost market share but not the extent that was observed for Turkey, a country that offered prices closer to the lowest in the market. In fact, the scatter-plot of differences with respect to China’s unit price and gains in market share presented in Figure 11 seems to suggest that high quality/price strategy was most effective in keeping the current market shares (narrow distribution of market share changes around the highest price differentials). Mauritius, for example, with prices only slightly higher than the triad Bangladesh, India and China, has been losing market shares consistently since the mid 1990s.
53. In the US market El Salvador, Honduras and to a lesser extent Mexico offered lowest and ever decreasing prices (Figure 10). China and India have been losing market shares in the late 1990s but this trend slowed down in early 2000s and dramatically reversed in 2005 when in one year unit prices Chinese producers more than halved and unit prices of Indian producers came down by around 20%. All other major OECD and non-OECD suppliers, including El Salvador and Honduras, saw their market shares tumbling, while market shares of China and India kept rising dynamically in the three consecutive years 2005, 2006, and 2007. Chinese unit prices rose since 2005 while those of India kept falling most likely as a result of voluntary export restraints on China’s exports.
54. The comparison of cotton shirts with woollen suits indicates that markets for cotton shirts were indeed subject to fiercer competition from low cost producers, perhaps because this product category is less differentiable with respect to quality. In both the EU and the US the phase out of 2005 quotas resulted in dramatic increases of shares of Asian shirts producers and, save the example of quality German suppliers, decreasing market shares of all other suppliers.
55. Indeed, comparison of Figure 11 with Figure 8 indicates that pricing strategies of top 30 suppliers of cotton shirts to the EU and US markets have been much more concentrated around most competitive prices in both destination markets as compared to the strategies of woollen suit suppliers.10 Still, as with the market for suits, the scatter plot for the US is slightly more concentrated around the lowest price level and the market outcomes are more disparate suggesting higher levels of competition. In the EU two distinct pricing strategies can be observed. Selected producers have been able to differentiate their products by price without significant market share loses. Another distinguishable group of suppliers to the EU have been competing on the basis of prices with low price producers though apparently not as fiercely as was the case in the US (i.e. scatter plot cloud more dispersed along the price dimension and less dispersed along the market share change dimension).
56. The Annex presents similar graphical analysis for four other product categories: Cotton skirts (HTS 342); Cotton Sweaters (HTS 345); Cotton bras and other body support garments (HTS 349); and Man-made fibres bras and other body support garments (HTS 649). Bras, which are more easily distinguishable by quality, show some characteristics similar to woollen suits while cotton sweaters present a case comparable to that of cotton shirts. For all these products pricing strategies of suppliers to the US market are more tightly concentrated around cheapest prices and markets seem more contestable, suggesting, subject to the above mentioned caveats, lower barriers to competition and larger gains to the consumers.
10 Analysis of unit prices in the Japan’s market obtained from the Comtrade database that is not presented here
suggest that the variation in unit prices of men’s cotton shirt in the Japanese market is similarly limited. Although Japan did not impose quotas, there have been significant changes in market shares of major exporters over the past decades. The most important change is China’s gain, its market share increased from a third in 1990 to over three-quarters in 2005. At the same time, other countries such as India, Malaysia, Thailand and the United States lost market shares and some high-cost producers (e.g. Belgium and Finland) exited the market. Given that Japan did not impose quotas, this process can be considered as driven by market forces and characterised as survival of the “fittest”.

TAD/TC/WP(2007)14/FINAL
35
Figure 9. Men’s cotton shirts: unit values and market shares of major competitors in the EU15 market
A. Unit values (in Euros per 100 kg)
0
1 000
2 000
3 000
4 000
5 000
6 000
7 000
8 000
9 000
10 000
Bangladesh China Germany Hong Kong, China
India Italy Mauritius Portugal Turkey
1995 1996 1997 1998 1999 2000 2001 2002 2003 2004 2005 2006 2007 2008
B. Market shares (%)
0
2
4
6
8
10
12
14
16
18
Bangladesh China Germany Hong Kong, China
India Italy Mauritius Portugal Turkey
1995 1996 1997 1998 1999 2000 2001 2002 2003 2004 2005 2006 2007 2008
Source: Authors’ calculations based on COMEXT.

TAD/TC/WP(2007)14/FINAL
36
Figure 10. Men’s cotton shirts: unit values and market shares of major competitors in the US market
A. Unit values (in USD per item)
0
20
40
60
80
100
120
140
Canada China El Salvador Honduras India Korea Mexico Pakistan Turkey
1995 1996 1997 1998 1999 2000 2001 2002 2003 2004 2005 2006 2007 2008
B. Market shares (%)
0
2
4
6
8
10
12
14
16
18
20
Canada China El Salvador Honduras India Korea Mexico Pakistan Turkey
1995 1996 1997 1998 1999 2000 2001 2002 2003 2004 2005 2006 2007 2008
Source: Authors’ calculations based on OTEXA.

TAD/TC/WP(2007)14/FINAL
37
Figure 11. Men’s cotton shirts: price positioning with respect to China and market share gains (1996-2008)
A. EU market
-150
-100
-50
0
50
100
150
200
-150 50 250 450 650 850
% c
hang
e in
mar
ket s
hare
% difference with respect to China's unit price B. US market
-150
-100
-50
0
50
100
150
200
-150 50 250 450 650 850
% c
hang
e in
mar
ket s
hare
% difference with respect to China's unit price Source: Authors’ calculations based on OTEXA and COMEXT, empty rectangles refer to 1996-2004 period while filled markers to 2005-08 period.

TAD/TC/WP(2007)14/FINAL
38
Horizontal specialisation
57. As a result of enhanced competition in major markets, many producers chose to concentrate on fewer product categories in their quest to increase their market shares in major markets. Beside the efficiency gains related to the reduction of import sources, such a strategy also allows a better exploitation of economies of scale, thereby benefiting both importers and producers.
58. It is important to note the degree of similarity among different producers’ export structures, as this can heavily influence their positions in third markets. Producers from two countries with very similar structure of export commodities, for instance, can differentiate their products by quality or, if also their qualities are similar, can enter into price competition in global markets. In addition, they can also geographically slice markets. This latter strategy, however, is usually not voluntarily chosen by exporters, but is driven by transport costs or other factors such as bilateral or regional agreements, historical or cultural ties, for example. One possible measure of the degree of similarity is the Kreinin-Finger (1979) index. If the commodity composition of two countries' exports is identical, this measure takes a value of 100, while in case of complete dissimilarity, the value of the index is 0. As producers face different competitors in different markets, the similarity of export structures is examined by market. Also, given that textile and clothing industries are intensive in use of different endowments, similarities in exports of these two commodities need to be looked at separately.
59. In general, the major competitors’ export structures have become more similar in Germany, the largest EU market, over time but there are some clear trends of horizontal differentiation in some product categories. In the textiles market (HS 50-59), the most significant trend is China’s moving up the value chain: while in 1990 it showed little similarity with other producers except Hong Kong, China, by 2007 its export structure has become closer to that of Italy or Poland. Bangladesh and India also export increasingly similar textile commodities as other producers to Germany, nevertheless the overlap of their exports with those of other countries still remains low. The clothing (HS 60-63) landscape shows a somewhat different pattern: Bangladesh has reduced its overlap with other countries except Italy and Turkey between 1990 and 2007. China, on the contrary, exports increasingly similar products to Germany as high-value added producers such as Belgium, Italy and the Netherlands and less similar ones with for instance, India. India has reduced its overlap with China over the past 15 years and increased it with Italy and the Netherlands. These findings suggest that there is a certain degree of horizontal differentiation in the German clothing market: lower-cost producers try to avoid competition with each other and when they can move into product categories supplied by higher-cost exporters.
60. A glance at a more disaggregated (2-digit) level reveals that the overlap between Chinese and Indian exports has been limited in not knitted or crocheted clothing (HS 62) and the other made articles (HS 63) categories and even in knitted or crocheted clothing it has decreased. Trends at the 4-digit level further indicate that the decrease of overlap between Chinese and Indian exports to Germany is to a large extent attributable to the withdrawal of Indian producers from several categories (including women’s ensembles, brassieres etc).

TAD/TC/WP(2007)14/FINAL
39
Box 2. China – the major beneficiary of the phase-out of ATC
China has been the most successful exporter in the global textiles and clothing market in terms of seizing the opportunities offered by changes in trade policy setting in these commodities. Its flexibility in adopting different strategies to cope with the restrictions of the quota system has made it the world’s largest exporter of textiles and clothing. The importance of these sectors for China, however, has been decreasing, mainly as a result of moving up the value chain into less labour-intensive and more sophisticated products.
During the quota system, China was successful in moving into higher-quality products, thereby escaping competition with lower-cost producers and providing alternative products to high-cost ones. This was supported by increasing labour productivity, to a large extent driven by skills and technology upgrading.1 The government’s role in facilitating this process was not negligible: it invested heavily in transport infrastructure and provided an investment-friendly environment to attract foreign technology. As a result, the structure of China’s T&C exports became more similar to that of the top quality producers and less similar to its previous competitors over time. It followed the example of more advanced producers in “quota-hopping”: to avoid the restrictions implied by quotas in accessing the Canadian, European and the US markets, it moved parts of production facilities to countries not subject to, or underutilising, quotas. Given the limitation on its exports to these major markets, China conquered other ones and increased its share to very high levels; for instance in Japan, China is the source of over 80% of imports in the major garments categories.
The phase out of quotas provided enormous opportunities to increase market share in some of the most lucrative markets of the world. As Figure 7 illustrates, China did reap the benefits of the abolishment of the system, sharply increasing the share of its T&C exports destined for the Canadian, European and US markets. At the same time, however, there was no jump in total T&C exports of China and its share of exports to some of its major markets such as Japan dropped sharply. This may suggest that, while some higher-quality segments are still targets, the textile and clothing industry as a whole may have come to the “recycling” phase. China “inherited” the major textile and clothing markets from the “four dragons” (Chinese Taipei, Hong Kong, China, Korea and Singapore), which, by the same token got them from Japan in the 1970s and now time may be reap to pass these markets on to the next catching-up producers.
Reorientation of China’s export markets 1995-2007
Percentages
0
5
10
15
20
25
30
35
Hong Kong, China
Japan United States
Korea Germany Australia Italy Singapore United Kingdom
1995 2000 2005 2007
Source: UN ComTrade (2008).

TAD/TC/WP(2007)14/FINAL
40
61. Trends in the US textile and clothing market are somewhat different from those in Germany: in particular among textiles exporters there is a clear horizontal differentiation. In 1991, China, India and Pakistan exported very similar products and the overlap between exports from Honduras, Hong Kong, China and Indonesia was also significant. Mexico and Indonesia also had some similarities, but Bangladesh’s exports were very distinct. By 2006, the overlap between export from Bangladesh and other countries has increased somewhat, but has remained very low. Moreover, all the other countries’ export structures (except that of Mexico and Vietnam and Mexico and Canada) have become increasingly dissimilar.
62. In clothing, the general trend is decreasing overlap of products, but similarity of the export structure has come close to identical between China and some other exporters such as Mexico and India as well as between Indonesia and Vietnam and Hong Kong, China and Vietnam. This can be explained by China’s and some other exporters’ increase of the range of products they export to the US. Another clear trend is the significant decrease of the overlap between Honduras and most other suppliers. While in 1991 it had a very similar export structure as Bangladesh, Canada, China, Hong Kong, China, Indonesia and Mexico, by 2007 it only had high overlap with Hong Kong, China. Honduras, being a small country with a limit on the variety of products it could produce with reasonable economies of scale, inadequate backward linkage facilities and heavy reliance on imported fabrics, had not been able to increase the range of goods to the extent its competitors did and even exited some product segments (e.g. men’s cotton pyjamas) over the past 15 years (see Annex Box 1).
63. To complement the above analyses of similarities of export structures, the Spearman correlation coefficients of revealed comparative advantage (RCA) indices of the top ten exporters and their most dynamic competitor, China, are calculated. The correlation index takes values between +1 and -1, with positive values showing that a country specialises in similar products as China and with negative values showing dissimilarity of export structures. As Figure 12 indicates, the differences in export structures that existed in 1995 have generally deepened after 2005, especially in clothing products. That China’s textiles export structure has become less dissimilar with that of the United States is likely a result of China’s move into higher value-added textiles segments. At the same time, China exports increasingly similar products with India and Italy and less similar ones with Bangladesh and Hong Kong, China. These findings support the catching up hypothesis: China is moving into more capital- and technology-intensive product segments and improves quality of export goods. The Spearman correlation coefficients of RCAs in the clothing market reveal some different trends (Figure 13). China exports more dissimilar products in 2005 and 2007 compared to 1995 with Italy, the United States and Germany confirming the hypothesis that, despite China’s catching up, a number of producers in the OECD countries have found ways of competing with China by differentiating their product base. The similarity with Bangladesh, India, Turkey and Mexico on the other hand has increased over this period, mostly likely as a result of producers in these countries being able to compete with China in similar product categories, especially when China’s labour costs are on the rise (Figure 14).
Box 3. Textile and clothing industry in India
In 2007, India was the 6th largest exporter accounting for approximately 3.7% of world exports with the total value of textiles and clothing exports of USD 21 billion. It was also one of the exporting countries that benefitted from the 2005 ATC phase-out: the dollar value of exports increased by 34% in 2005. Since 2005, export growth slowed to around 8%. According to Government of India sources, the industry is now growing at the fastest sustained pace for the last six decades (annual growth rate of output of 9-10%).
While these trends are overall very positive, it must be pointed out that the presence of the Indian textiles industry in world markets is exceeded by China which is exporting close to eight times more in value terms (USD 166 billion in

TAD/TC/WP(2007)14/FINAL
41
2007). China is a larger economy on all accounts (GDP, income per capita, population, labour force) but not by a factor of eight. These disproportions are a clear indication that, in spite of the long tradition and historical importance of textiles and apparel in India’s economy and society, the sector had been facing some deeply rooted structural problems that impeded the full realization of its potential.
Indeed, the textiles sector has been historically one of the most important sectors in the Indian economy and it is deeply connected to India’s culture and heritage. Apart from providing one of the basic necessities, it is amongst the earliest established industries in the country and one with very strong links to agriculture — another sector key for the livelihoods of the poorest segments of India’s society. It currently contributes 14% of India’s industrial production, 4% of GDP, 16.7% to the country’s export earnings and employs directly 35 million people in the organised sector.
The data for the organised sector grossly understate the importance of the textiles industry in total employment. In India the unorganised sector is composed of units either entirely unregistered that do not keep any accounts or factories that employ less than 10 or 20 workers, depending on whether they use power or not, as well as some specially notified factories. The unorganized sector contributes 28% of valued added and 73% of aggregate employment. According to estimates by Narayanan (2008) unorganised textiles and apparel sector comprises 31% of gross value added and 79% of employment in the entire textile and apparel sector and the share of informality is especially high in the apparel sector (59% of value added and 89% of employment).
Overall, a comparison of shares in the GDP and total employment (organised and unorganised) suggests clearly a lower-than-average level of productivity of labour in the textiles and apparel sector, although this proportion is still better than for agriculture. Data suggest further that productivity and wages are particularly low in the unorganised sector. Narayanan (2008) reports that the unorganized textiles and apparel activity is predominantly located in the urban areas where labour is drawn from the rural migrant populations, is non-unionised and thus paid a much lower wage rate. Informality means also that the workers can be hired and fired on a daily basis with limited or no protection and are more easily forced to work long hours. Therefore, while informality seems to be one of the key sources of competitive advantage of the Indian textiles and apparel sector, it also seems to come at a significant social and human cost.
This situation in the unorganized sector can be contrasted with the organized sector which may pay higher wages but is suffering from inflexible labour regulations that prevent firms form firing their permanent staff even at times of recessions. Additionally, there are numerous bureaucratic regulations that impede expansion and flexible functioning of factories. Narayanan (2008) gives an example of the hank yarn obligation that requires the spinners to allocate a fixed part of their production to handloom weavers, restricting profits of spinners and, further down the value chain, limiting possibilities of sourcing of raw materials of weavers. Accordingly, recent statistics show growing structural differences between the organized and unorganized textile and apparel sectors in India, with low-productivity employment growing more robustly in the unorganized sector and capital investment expanding faster in the organized sector. Indeed, India’s organized T&C industry has been dynamically upgrading its machinery stock, particularly since early 1990s (Figure 16 and 17).
Narayanan (2008) interprets these diverging trends as evidence for capital-labour substitutability in the sector but a less optimistic interpretation is that bureaucracy and inflexible labour regulations, which apply only to certain somewhat arbitrarily-determined categories of firms, have created an artificial duality in the sector that likely prevents an efficient allocation of resources and the use of most optimal production techniques.
Some recent policy developments suggest that the Government of India is trying to alleviate some of these hurdles. A welcome development was the removal of the woven apparel sector in 2002-03 and the knit-wear sector in 2005-06 from the list of sectors reserved from the small scale industry. This means that these product categories no longer have to be produced by firms with rather arbitrarily specified maximum value of capital assets (for a detailed discussion of the small-scale industry policy in India see Kowalski et al., 2009). Some current government programmes are seeking to improve access of firms to modern technologies and to capital. The Technology Upgrading Funds Scheme, for example, provides reimbursement of 5% of interest paid on loans for technological upgrading of textile machinery. Costs of imported intermediate inputs are also being lowered; excise duties on all man-made fibers and yarns were halved in 2006 and customs duties on polyester raw materials were reduced in 2007.
The key remaining policy challenge, not only for the success of the textiles and apparel industry, seems to be improvement of outdated and inflexible labour laws, decreasing transactions costs (procedural complexities and various taxes) and improving overall infrastructure (OECD, 2007a; Singh, 2008).
Source: Government of India, Narayanan (2008) and Singh (2008).

TAD/TC/WP(2007)14/FINAL
42
Figure 12. Trade specialisation of China vis-à-vis its top 10 competitors
Spearman rank correlation coefficients of RCA indices, textiles
-0.6
-0.5
-0.4
-0.3
-0.2
-0.1
0.0
0.1
0.2
0.3
0.4
0.5
0.6
United States
Germany France Belgium Italy Korea, Rep.
Mexico India Hong Kong, China
Turkey
1996 2005 2007
Source: OECD calculation from UN Comtrade database (2008).
Figure 13. Trade specialisation of China vis-à-vis its top 10 competitors
Spearman rank correlation coefficients of RCA indices, clothing
-0.6
-0.5
-0.4
-0.3
-0.2
-0.1
0.0
0.1
0.2
0.3
0.4
Italy United States
Germany France Hong Kong, China
Korea, Rep.
Turkey Belgium Mexico India
1996 2005 2007
Source: OECD calculation from UN Comtrade database (2008).

TAD/TC/WP(2007)14/FINAL
43
64. The revealed comparative advantage reflects a country’s revealed relative strength in exporting different types of commodities. The RCA index - which measures a country’s export share for a commodity and compares it with the world export share of that commodity - is calculated at the 4-digit level of textiles and clothing categories for 1996-2007. In design-intensive goods, where quality is easily differentiable Italy had the highest revealed comparative advantage among the countries examined, moreover its RCA increased over the recent years. Bangladesh, for instance, is strong in labour-intensive manufactures such as men’s shirts and T-shirts, with the highest RCA values in the group. China’s revealed comparative advantage shows a declining trend in labour intensive products such as men’s shirts and T-shirts, while an increasing trend in neckties. This is a further piece of support for the catching up view but also for raising labour costs (Figure 14). This, however, does not mean that China may not be competitive in these segments in the world market. The RCA index simply reveals the performance of a commodity relative to other commodities, thus it reflects more on the pattern of specialisation rather than competitiveness per se. In other words, Chinese textiles and garments may be competitive in the world market, but other industries may be even more competitive. India’s RCA has also increased for neckties, though it is still very low. India also shows increasing RCA in T-shirts, but its RCA in men’s shirts has decreased.
Figure 14. Unit labour costs in China and other emerging markets (index)
80
100
120
140
160
180
200
Brazil China South AfricaIndia Indonesia OECD average
Source: OECD.
Reorientation of markets
65. During the quota system under the ATC, the major way to expand export markets by the most productive producers was to enter into new markets or increase sales in markets that did not impose quotas. This led to a diversification trend of export markets for rapidly growing producers such as China pre-2005. With the phase out of quotas, these producers have started to gain market shares in Canada, Europe and the United States and a larger share of their exports were directed to these markets. As Figure 15 indicates, countries previously restricted by quotas, such as Bangladesh, China and India reversed the trend of market diversification to market concentration in 2005. This reversal has been sharper for Bangladesh and India, whose top ten export markets had been countries with quota restrictions. China, on the other hand, has important markets such as Australia, Hong Kong, China, Japan and Korea that did not impose quotas among its top ten markets, therefore the reversal towards market concentration is not as drastic as India’s.

TAD/TC/WP(2007)14/FINAL
44
Countries not affected by quotas such as the OECD members, on the contrary do not show any significant change in their export market structure in 2005.
66. The process of phasing out of quotas has also brought about temporary market share gains for less efficient producers. As theory suggests, quotas add extra margins to the export price and limit the export volumes to quota-imposing countries, while there is excess capacity in the rest of the world (assuming that at least some of the producers expand production at a faster pace than market growth in the markets affected by quotas as has been the case) bringing down prices. Lower prices create extra demand in these countries. With the removal of quotas, the logic is supposed to work the other way: to the previously quota-imposing countries exports should surge, which are partly redirected from non-quota imposing countries. The example of China clearly illustrates this: in 2005, there was a sharp increase in the share of China’s exports to Canada, Europe and the United States, while some other major markets, such as Japan and Korea got a smaller share of exports. It should be noted, however, that in the case of Japan this is also due to the fact that Chinese exports grew much faster than Japanese demand.
Figure 15. Producers previously restricted by quotas consolidate their export markets
Share of top 10 export markets in total textiles and garments exports by selected major producers (%)
60
65
70
75
80
85
90
1999 2000 2001 2002 2003 2004 2005
Bangladesh Belgium China FranceGermany India Italy USA
Source: OECD calculation based on UN Comtrade database.

TAD/TC/WP(2007)14/FINAL
45
Box 4. Indonesia’s textile and garment industry
Indonesia ranked 14th among textile and garment exporters with a world market share of 1.8% in 2007 and is a major player in a few market segments. At the 2-digit HS level (which includes 14 sub-groups), it ranked among the top ten exporters in three categories: man-made staple fibres and knitted and non-knitted apparel. In these three markets it has a world market share of over 5%, but market shares are very imbalanced across countries.
Japan features among the top ten destination markets in all three product categories, the United States in two, Canada in one, but the EU15, as a single market, in none. With a 4.1% share in the US textile and garment market in 2006, Indonesia may not be a giant player, but it is very dependent on the US market (nearly 40% of its exports land in the US). Japan’s share in Indonesia’s exports has halved over 1996-2006. Indonesia is an even less important player in other OECD markets, except Turkey, where it had a 5.1% share in 2006. Moreover, it is losing market share in most OECD countries, in particular EU markets. A closer look at the largest EU market, Germany, surprisingly indicates that the major losses in market shares in most product categories are not related to uncompetitive prices, in particular, relative to China’s, but to intense price competition from India and Bangladesh in the market segments in which Indonesia is relatively well established.
Increasing concentration of exports in certain markets is apparent for some product categories, such as man-made staple fibres (HS 55) – Indonesia has become Japan’s No. 1 supplier with a market share of 33.3% in 2005, increasing from a low share of 3.1% in 1990. Through a sharp cut in unit prices, Indonesia has become a major supplier of men’s cotton shirts (HS 6205) to the US market, achieving a market share of 9% in 2006 (a sharp rise from 6% in 2000). Indonesia’s unit price for this product is comparable to China’s, but is higher than Pakistan’s, Bangladesh’s, Guatemala’s or the Dominican Republic’s. A unit price analysis of textile and garment products shows that in the US market, only a very tiny share of products has a unit price double of China’s (10% in the textile industry and 5% in the garment industry) or less than half of China’s (10% for textiles and 1% for garments) and a large share of products are within a 10% range of the Chinese unit price (nearly 30% for textiles and nearly 40% for garments) in 2006.
Protection in the textile and garment industry, both measured in terms of average nominal and effective protection, has substantially decreased in Indonesia in 2000 vis-à-vis 1995, but it remains the highest among manufacturing industries (Molnar and Lesher, 2009). In addition, the high degree of tariff escalation in Indonesia translates into higher imported inputs and lower domestic value-added (WTO, 2007). In fact, the textile and garment sector is among the few sectors that increased its imported share of intermediate inputs and, as a result, registered a fall in the domestic value-added share. Firm-level data also show that this was accompanied by a fall in the share of exports in total production.
Indonesia’s revealed comparative advantage (RCA), an indicator of relative export performance, shows a slight decline over 1996-2006 in textiles and garments, with large variations across product categories. On the one hand, yarn of synthetic staple fibres (HS5509, with a 6.8% of share in textile and garment exports) and women’s and men’s shirts (HS6206 and 6205, with shares of 5% and 4.7% in textile and garment exports in 2006) have experienced a strong boost in revealed comparative advantages. On the other hand, the decline in RCA is in particular apparent for some important export products such as cotton yarn with over 85% cotton content (HS 5205, with a share of nearly 3% in exports in 2006), men’s overcoats (HS 6201 with a 3.8% textile and clothing export share in 2006) and women’s overcoats (HS6202, with a nearly 1% share in textile and clothing exports in 2006).
To assess where the competitive pressure is coming from, the Spearman correlation coefficients of RCA indices of selected competitors are calculated. The correlation index takes values between +1 and -1, with positive values showing that a country specialises in similar products as Indonesia and with negative values showing dissimilarity of export structures. Indonesia’s major competitors are Bangladesh; Hong Kong, China; Turkey and to a lesser extent India and China. While Indonesia’s export structure has become more similar to that of most of its major competitors, it has become less similar to China’s. Indonesia’s export structure also shows less resemblance with EU and US suppliers.

TAD/TC/WP(2007)14/FINAL
46
Spearman correlation coefficients of RCA indices of Indonesia vis-à-vis top 10 competitors
-0.3
-0.2
-0.1
0
0.1
0.2
0.3
0.4
0.5
0.61996 2006
Note: 2004 for Bangladesh. Source: Molnar and Lesher (2009) based on UN Comtrade.
In response to intensified competition in global textile and clothing markets, Indonesian exporters have adopted various strategies ranging from horizontal specialisation (including specialisation in certain markets and products) to price competition. Market concentration is in particular apparent; the US absorbed nearly 40% of Indonesian textile and garment exports in 2006, a 50% increase over 10 years. Such a skewed export market structure may allow for the exploitation of scope and scale economies both in production and transportation. Excessive dependence on a single market, however, may as well expose the industry to unnecessary volatility related to demand changes in that market.
Source: draws on text in Molnar and Lesher (2009).
Relocation of production facilities
67. The quota system under ATC had been an important determinant of the location of foreign direct investment in textiles and garments. Multinationals aiming at re-exporting to the host country had been constrained in increasing their investment in countries where quotas were binding and had been forced to expand in countries that may have had lower production efficiency. Similarly, exporter countries with high productivity but full utilisation of quotas established production facilities in countries with lower productivity but underutilised quotas or in countries not subject to quotas. This resulted in dispersed production of textiles and clothing around the globe, implying inefficiencies.
68. The removal of the quota system, not surprisingly, accelerated the efficiency-enhancing consolidation wave that had started earlier in the industry. This consolidation/relocation wave, alongside declining trade and investment barriers, has also been driven by decreasing services costs, including transportation and communication costs and has allowed for further slicing of the value added chain (Jones and Kierzkowski, 1990). Production plants both from low-cost, low-productivity and high-cost, high-productivity countries are relocating to the most productive, relatively low-cost countries.
69. The move to a more efficient global production system, however, involves adjustment costs that may be sizeable in the short term. These adjustment costs may incur in the form of output and employment losses related to relocation overseas (see next section). Molnar et al. (2007) estimate the labour market impacts in OECD countries of overseas relocation using time series industry data and find that there is heterogeneity across industries. Robust to the way of specification, the findings show that employment in the services industries was positively affected by moving overseas, while in the manufacturing sectors the effect depends on whether the sector has strong commercial ties (in terms of the share of imports and outward FDI) with non-OECD countries.

TAD/TC/WP(2007)14/FINAL
47
70. In the industries with the strongest ties with non-OECD countries, such as textiles and garments, but also food and beverages, electronics and transport equipment, there is a strong negative effect of outward investment on domestic employment, while in other manufacturing industries such as pulp and paper, chemicals, metals and machinery, no significant impact is found. Furthermore, the study also finds that in sectors with strong ties to non-OECD countries, increasing relocation overseas raises the long-run wage elasticity and also the speed of adjustment of domestic employment. In the services sectors, on the contrary, overseas investment reduces the speed of adjustment of domestic employment. The above findings suggest, that in certain manufacturing industries, in particular textiles and garments, overseas and domestic employment may be to a certain extent substitutable, while in services they are rather complements.
Selected structural changes prior to and during the ATC phase-out
Production and employment
71. The most recent available structural data (Mayer and Zignano, 2008) suggest that producers in major T&C exporting countries have been upgrading their production facilities much in advance of the of quota phase-out or even signing of the ATC in 1994 and that the actual phase-out of quotas in 2005 was not associated with any abrupt changes but rather anticipated early on. It is also plausible that, MFA quotas or not, with progressing globalisation producers in higher cost countries have long anticipated the inevitable competition from low cost countries in labour intensive activities and have accordingly diversified their activity towards more sophisticated and higher quality textiles and clothing products, or form the textiles and clothing sector altogether.
72. Production data presented graphically in Annex Figures 13 and 15 indicates that, indeed, in many high income T&C producing countries production of both textiles and clothing was on a downward trend in both more recent and earlier periods as many countries already witnessed reductions of production in the pre-ATC periods. In contrast, major low income T&C producers such as China, India and Pakistan experienced a long period of a more or less consistent T&C production growth.
73. The employment outcomes (Annex Figures 14 and 16) are yet more polarised with some major OECD T&C producers shedding labour form the textile and clothing sectors rather consistently during all considered sub-periods, including pre-ATC. However, the picture across major developing countries suppliers is a bit more nuanced with textile industry employment falling in absolute levels in India and in the 1990s in China and the clothing industry employment increasing consistently in all sub-periods in China, India and Pakistan. This shows a clear initial reorientation form capital-intensive textiles production towards the labour-intensive clothing production in which these low labour cost countries have a natural comparative advantage. Two important OECD producers Mexico and Turkey seem to have been following the path set by the dynamic Asian producers.
74. The employment numbers presenting a more negative picture than production data across all, but particularly OECD, countries suggest that improving labour productivity through reducing employment was one of the strategies adopted by the producers for some time before the 2005 phase out. This is confirmed by the analysis of productivity and market structure developments in the next sub-section.
75. Apart from specialising in low cost labour activities the major dynamic developing country producers have been dynamically investing in technology and machinery. It is not a surprise then that countries where this technological upgrading process has been most dynamic seem to be the major beneficiaries of the quota phase-out. One indicator that could give an idea about the extent and pace of such upgrading is a rate of growth of imports of textiles and clothing machinery plotted for major exporting countries in period 1988-2006 in Figure 16. It is clear that the rates of growth of machinery

TAD/TC/WP(2007)14/FINAL
48
imports in richer exporters have been much lower throughout this period as compared to the group including China and its low cost competitors (India, Pakistan, Turkey or Vietnam). In fact the growth rates of T&C machinery imports in India, Pakistan, Turkey and Vietnam have exceeded that of China in most considered sub-periods. These are also the countries that, despite certain gloomy pre-ATC phase-out predictions, performed relatively well since 2005. Importantly, machinery imports in these countries have been growing dynamically even before the conclusion of the Uruguay Round and signing of the ATC in 1994 again underlining the long-term nature of this adjustment process. They fell intermittently during the 1996-99 sub period in most countries reflecting the negative effects of the 1998 Asian financial crisis but picked up again strongly in the 2000-03 period and continued during the 2004-06 period in the majority of cases.
76. Interestingly, in most cases more than 80% of this textiles and clothing machinery imported in the period 1999-2006 by the low-cost T&C producers originated from the OECD countries and cumulated imports of this machinery in this period by China, India, Pakistan and Vietnam amounted to USD 36 billion while the imports by the United States, Belgium, Luxembourg, Korea, Italy, Germany and France amounted to USD 39 billion. By these statistics close to 50% of T&C OECD countries’ machinery exports were destined for the low-cost Asian T&C producers (Figure 17). These developments in machinery trade and the continually increasing presence of lower labour cost countries in T&C markets is a clear example of a comparative advantage-based specialisation.
Figure 16. Imports of textiles and clothing machinery in major T&C exporting countries 1988-2006 (average annual rates of growth of import value)
-30
-20
-10
0
10
20
30
40
50
60
701988-1991 1992-1995 1996-1999 2000-2003 2004-2006
Source: Authors’ calculations based on COMTRADE data.

TAD/TC/WP(2007)14/FINAL
49
Figure 17. Share of OECD suppliers in imports of textiles and clothing machinery in major T&C exporting countries 1999-2006
0
20
40
60
80
100
120Cumulated imports from the OECD suppliers 99-06 (US$ bln) Average share of T&C machinery imported from the OECD
Source: Authors’ calculations based on COMTRADE data.
77. Overall, reduction in T&C employment in most OECD countries was much deeper than reduction of employment in other manufacturing sector branches (Table 5) and clearly generated significant structural adjustment challenges because of its high shares of total manufacturing employment in certain countries, because of its regional concentration and high intensity in use of female labour (Nordas, 2005). Nevertheless, this trend cannot be really directly associated with the ATC phase-out as it clearly started already much before the signing of the ATC when the MFA quotas were fully in place. In fact reduced employment, improved productivity and reorganisation seemed crucial for the OECD T&C industry to stay afloat.
Table 5. Employment in textiles and clothing industry in selected OECD countries
2000 2001 2002 2003 2004 2005 2006
% of total manufacturing employment in
2006*
% reduction 2000-2006*
% reduction 2000-2006, total
manufacturing***
Australia 77 761 69 902 68 998 62 138 55 315 54 957 .. .. -29.33 -4.48Austria 35 634 33 718 31 392 28 839 25 824 24 142 23 335 3.70 -34.51 -4.56Belgium 54 233 52 388 48 896 45 963 43 269 40 692 38 635 6.49 -28.76 -9.33Canada 142 681 145 982 139 490 125 089 117 107 111 364 105 326 5.00 -26.18 -4.21Czech Republic 130 063 124 744 118 743 107 485 102 829 93 957 85 994 6.19 -33.88 1.65Denmark 13 199 12 485 11 459 10 594 9 607 8 912 .. 2.32 -32.48 -13.37Finland 16 800 16 500 16 000 14 700 13 500 12 900 12 300 2.81 -26.79 -4.98France 216 162 205 123 190 180 173 480 153 432 137 314 .. 4.07 -36.48 -8.58Germany 247 000 238 000 217 000 197 000 187 000 175 000 .. 2.33 -29.15 -8.29Hungary 130 342 125 232 117 873 111 343 98 673 83 914 77 217 8.96 -40.76 -7.95Ireland 12 683 11 889 10 807 9 333 7 890 7 202 6 422 2.38 -49.37 -9.82Italy 661 000 662 200 663 000 660 200 637 900 600 800 582 100 11.64 -11.94 -0.06Korea 622 623 580 181 547 176 489 916 440 899 397 283 .. 9.38 -36.19 -2.93Luxembourg 700 800 1 200 1 200 1 200 1 300 1 400 4.15 100.00 1.81Netherlands 28 756 28 030 26 035 24 120 21 640 20 430 19 963 2.18 -30.58 -11.76Norway 7 500 6 600 6 000 5 700 5 300 5 200 5 200 1.95 -30.67 -10.74Portugal 275 128 268 564 261 828 247 837 239 198 225 171 .. 24.02 -18.16 -10.41Spain 275 900 272 000 255 700 245 100 229 200 226 300 205 400 6.61 -25.55 4.65Sweden 12 923 12 554 12 277 11 446 10 636 9 900 .. 1.38 -23.39 -9.45United States 1 151 957 1 015 488 907 617 812 706 743 471 689 605 646 624 4.16 -43.87 -17.79
*, **, *** for countries for which 2006 data is not available the figures refer to 2005. Source: OECD STAN database (2008).

TAD/TC/WP(2007)14/FINAL
50
Productivity and market structure
78. Indeed, while the findings just discussed suggest that employment has fallen and relocation of production from the OECD to low cost countries has occurred, trends in productivity and market structure suggest that to some extent the OECD producers have managed to successfully adjust to the competition with the low cost producers by boosting productivity, reducing firm sizes and focusing on higher value, niche, products.
79. Annex Figure 17 presents the evolution of labour productivity and wages in the major T&C exporters. Labour productivity, measured by the average value of output per worker is still much higher in major OECD exporting countries as compared to the developing country exporters and so are the wages. Moreover, for some time before the phase-out of the ATC labour productivity in the sector has been rising consistently in OECD producers at a faster pace than in China, India or Pakistan and at a faster rate than OECD wages in the sector, suggesting that productivity improvements have been a part of a longer term competitive strategy of OECD producers. This seems to be particularly the case in the clothing sector, which is consistent with its relatively more intensive use of labour and thus greater exposure to the competition with low wage countries.
80. Interestingly, the productivity increases have been accompanied by significant reductions of number of workers per firm and, to somewhat lesser extent, revenue per firm in all of the studied OECD exporters, including Mexico but excluding Turkey (Annex Figure 18 and 19). At the same time firm numbers were increasing in some OECD countries such as Belgium, Germany, France Italy, Korea, and Mexico while staying relatively unchanged in the US. This suggests a move towards a more fragmented market and, in combination with the information about the vertical differentiation discussed earlier in this paper, a move towards smaller scale, higher-quality, production. The advantage of smaller firms, not only in the T&C industry, is that they are more flexible in responding to market needs (e.g. execution of small scale tailor-made orders and attractive lead times) and in application of particular sophisticated production technologies.
Box 5. Changing world T&C trade and trade-related labour adjustment costs and policies
Trade liberalisation yields economy-wide benefits but the opening of markets to international competition may put pressure on labour markets and result in both temporary and permanent hardships for displaced workers. OECD (2004) argues that labour market implications of liberalization and the associated social costs are a public policy issue because, as compared to capital, the free movement of labour is confronted with significant barriers. At the international level, most countries have restrictions on immigration, while within an economy labour mobility is restricted more by natural factors than by laws, because of significant financial, economic, social and psychological costs associated with the movement of labour.
Governments have a number of reasons to take action on trade-related labour market adjustment. First, labour market policies and programmes may enable a more efficient allocation of resources and maximize the gains from trade liberalization. Second, to make trade liberalization more palatable to their constituencies, politicians may want to make a commitment to assist workers and communities that are adversely affected by the policy. Third, trade liberalization has an equity aspect to it because it may help some people and hurt others. If this is the case, there is an argument that those who benefit from a specific policy should be asked to assist those who are hurt. Finally, the absence of policies and programmes designed to respond to trade-related dislocations may result in some form of reform reversal which may have higher costs than the costs of providing assistance to workers who might be at risk of job loss.
Characteristics of displaced workers
Many workers cannot not move freely from job to job, owing to skill requirements, location, family responsibilities and wage and benefit differentials. In some cases, the labour market is in fact segmented; the mere existence of a job opportunity does not erase the adjustment burden. Kletzer (2001) researched characteristics of workers displaced from a range of manufacturing industries and found that, like workers displaced for other reasons, import-competing displaced workers are older, less formally educated, and more tenured than displaced non-manufacturing workers.

TAD/TC/WP(2007)14/FINAL
51
Workers with long tenure may have rusty job search skills and if they are additionally poorly educated they may be less capable of profiting from training programmes. For many such displaced workers job loss is very costly, owing to difficulties in finding new employment at a level of pay similar to the old job. Indeed, two-thirds of re-employed workers earn less on their new job than they did on their previous job, and one-quarter experience earnings losses in excess of 30%. The loss in average earnings is estimated at 13%. Kletzer (2001) found also that re-employment in manufacturing minimises the earnings losses (on average) while re-employment in services is associated with the largest earnings losses.
As far as displacement from the textiles and clothing industry is concerned a number of characteristics stand out from calculations performed by Lori G. Kletzer for the period 1993-2001 and published in OECD (2004). First, there is a higher prevalence of women and minorities in the textile and clothing industries (Table A). This finding can play an important role in the adjustment process since in many families women tend to be second wage earners and are thus less likely to relocate in order to take a new job. Workers displaced from the textile and clothing industries are twice as likely as other displaced workers to have less than a high school education, and they are far less likely to have attended college (Table B). Textile workers tend to have the longest average job tenure of approximately ten years, almost twice as long as workers displaced from the clothing industry but in fact, as compared to workers displaced from other sectors, the displaced textiles and clothing workers experienced the shortest average job tenure. Still, approximately 80% of the workers displaced from the clothing industry were employed for more than ten years (Table C). There is a higher probability that displaced workers from the clothing and textile industries will be ‘operators’ and a lower probability that they will have a craft. One factor that may help with adjustment is that displaced textile and clothing workers earned significantly less than other displaced manufacturing workers (Table D).
Most of these characteristics may make it more difficult for those displaced from the T&C industry to adjust to changes in the labour market. Indeed, the probability of re–employment within the two–year survey period is significantly lower for workers displaced from the clothing industry and somewhat lower for workers displaced from the textile industry than for workers displaced from other manufacturing industries (OECD, 2004). There are also other factors that make the situation of workers in import-competing T&C industries special. First, the textiles industry is known for the relative importance of offshoring and has the most elastic labour demand (OECD, 2008). Labour demand is relatively inelastic in most services industries, where offshoring is more limited and frequently difficult or even impossible. Additionally, the T&C industry tends to be geographically concentrated in most countries (see e.g. US ERS, 2006, for the case of the US) which may make re-employment of displaced workers more difficult.
Table A. Demographic characteristics of displaced workers
Sector Share Age (in years) Female Minority Married
Clothing 8% 39.47 75% 46% 56%Textile 3% 38.36 54% 35% 69%
Other Import-sensitive 34% 39.61 36% 24% 63%Other manufacturing 55% 39.11 31% 21% 61%
Table B. Education characteristics of displaced workers
SectorLess than high
SchoolHigh School
gradeSome
CollegeCollege or
moreClothing 34% 40% 21% 6%Textile 23% 40% 30% 7%
Other Import-sensitive 11% 37% 30% 23%Other manufacturing 14% 38% 30% 18%
Table C. Tenure characteristics of displaced workers
Sector Displaced from FT Job
Job tenure (years)
Tenure less than 10 years
Craft Operator
Clothing 94% 5.59 19% 8% 76%Textile 97% 9.64 36% 11% 63%
Other Import-sensitive 97% 7.33 28% 21% 35%Other manufacturing 95% 6.96 26% 17% 42%

TAD/TC/WP(2007)14/FINAL
52
Table D. Earnings and replacement rates of displaced workers
SectorMean
earnings
Median
earnings
Earnings less than
$200/week
Earnings greater than $800/week
Replacement
rateClothing $247.31 $201.58 26% 3% 56%Textile $346.37 $283.09 9% 4% 63%
Other Import-sensitive $529.96 $420.44 5% 22% 69%Other manufacturing $471.37 $383.89 5% 18% 69%
Source for Tables A-D: calculations by Kletzer published in OECD (2004).
Policy responses
As far as policy responses are concerned, broad-based approaches rather than specialized sectoral programmes are advocated (OECD, 2004). This is related to the fact that workers who lose their jobs owing to increased imports or shifts in production do not appear to be different from other displaced workers and that it is increasingly difficult to isolate the causes of worker displacement (technological change, productivity gains, increased import competition and shifts in production can all contribute to job losses). Most OECD countries have already established programmes to deal with displaced workers’ needs. In non–OECD countries, displaced workers tend to rely on less sophisticated social safety networks, with family solidarity often the main source of assistance.
In the OECD there is increasing reliance on training (through various subsidies and tax incentives) as part of the toolbox of labour market adjustment programmes. Another innovation in recent years has been the introduction of wage insurance which subsidizes some portion of the difference between the new and the old wage and encourages displaced workers to take a new job sooner. On the labour demand side, conditions associated with such programmes may require that the new employers provide on-the-job training, which has proven to be more effective and cheaper than government-financed classroom training. OECD (2004) emphasized that it is also important to see labour market adjustment policies and programmes in the context of a country’s broader social safety nets. For example, in countries without universal healthcare coverage, or with limited coverage, an important consequence of a lost job is the loss of health insurance and pensions which often affects the entire family. Thus, reforms that bring about better safety nets would go a long way towards easing the costs of trade-related adjustments.
Developing countries are certainly not exempt from labour pressures due to changes in international trade and investment. In some ways, developing countries are at a disadvantage, as many do not have well-developed social safety nets. On the other hand, the wealth of experience in the developed countries may provide developing countries, particularly the most advanced ones, with important lessons from which to develop their own labour market adjustment policies and programmes. International financial institutions may also help them overcome the resource constraints associated with developing a response to issues related to structural adjustment.
Source: Draws significantly on text of Chapter 3 of OECD (2004).
81. This contrasts with the situation in China, India, Pakistan and to some extent Turkey where textiles and clothing firms seem to have been getting larger in terms of number of employed workers and value of output per firm suggesting certain consolidation of production and exploitation of scale economies of production.
Consumer benefits
82. Consumers clearly are major potential beneficiaries of the MFA quotas phase-out on condition that quality and safety of the cheaper products can be assured and on condition that the price decreases are actually passed on to the consumers.
83. Consistent data that would allow a comparison of levels and time changes in textile and clothing products prices in major importing markets are hard to come by but some indicators suggest that the phase-

TAD/TC/WP(2007)14/FINAL
53
out of quotas sped up the reduction of relative prices of textiles and clothing. As long as certain caveats are born in mind, consumer price index (CPI) data allow a calculation of changes of prices of T&C products relative to other consumer goods.11 Figure 18 offers such a comparison for selected OECD countries that include major MFA countries. For presentational purposes the relative price of the basket of textiles and clothing products is set equal to one in 1998 in all included countries and subsequent changes are calculated with respect to this reference level.
84. Relative prices of clothing have been falling throughout the 1990s in all countries in the sample, reflecting likely long-term trends, but there were important differences in the rates of these changes. In general prices of T&C products have been falling much more sluggishly in the EU countries suggesting a less competitive market place. Furthermore, Norway, which was the first country to phase out all its MFA quotas in 2001 in advance of the agreed 2005 deadline and to significantly reduce tariff on T&C imports, clearly enjoyed the deepest reduction and the pace of this reduction clearly accelerated immediately after the quota phase out.12 Interestingly, Japan which never had MFA quotas seems to have been impacted negatively by the 2005 phase out. This can be explained by a significant redirection of Chinese exports (which for some time enjoyed a high share in Japan’s import market) form the Japanese market towards the markets earlier protected by the quotas. Such an effect underscores the pervasive nature of the MFA quotas whose effects extended beyond imposing and restricted countries.
Figure 18. Relative prices of textiles and clothing in major ATC markets
0.5
0.6
0.7
0.8
0.9
1
1.1
1998 1999 2000 2001 2002 2003 2004 2005 2006 2007 2008 Jan-Sep
United States Germany France Italy
11 Changes in relative prices of clothing in a given country can be driven both by the changes of textiles and
clothing prices themselves as well as changes in prices of other items that enter the CPI basket in a given country. Furthermore, both domestic and imported textiles and clothing items enter this calculation and so the calculated changes cannot be unequivocally linked to import effects.
12 Still, in 2005 Norwegians seemed to buy very expensive textiles and clothing products by the OECD standards (Figure 19).

TAD/TC/WP(2007)14/FINAL
54
0.5
0.6
0.7
0.8
0.9
1
1.1
1998 1999 2000 2001 2002 2003 2004 2005 2006 2007 2008 Jan-Sep
Portugal Norway Turkey Canada Japan
Source: Based on CPI data. EUROSTAT, U.S. Bureau of Labour Statistics for the US; Statistics Canada; Statistics Bureau of Japan.
85. Francois et al. (2007) conducted a more formal assessment of the impact of the T&C sector liberalisation on prices across the EU countries. They confirmed causal links between changes in import prices that were associated with consecutive stages of ATC liberalisation and the producer and consumer prices in the EU. Similarly to what transpires from Figure 18 they found significant differences across countries and managed to explain a significant share of this variation by variations in the structure of national retail sectors, and in particular to services sector openness and related competitive effects (Francois et al., 2007). In particular, they employed a range of indices developed at the OECD (OECD, 2000) including indices of retail competition, barriers to entry in the retail sector, retail sector concentration and density of hyper- and super-markets, as well as the ratio of foreign FDI stock in retail to retail GDP. They found that the pass through from import to consumer prices is substantially greater in countries where the retail sectors are characterised by a combination of a large foreign presence through FDI, large stores and a sufficient variety of retailers (low concentration) (see also Box 6).
Box 6. Effects of the ATC phase-out and the retail sector
T&C products are rarely ordered directly by consumers from textiles or apparel factories. Thus, the effects of the ATC phase-out on consumers or producers depend very much on intermediaries that connect the two ends of the supply chain, i.e. retailers.
The ATC quota elimination is generally expected to bring about economic benefits but where exactly these benefits are concentrated along the value chain depends on levels of competition along this chain. As far as producers are concerned, the quota reduction would benefit those producers that were not previously allocated quotas or had to pay for them. Some producers that enjoyed rents associated with prior quota allocations may be left worse off. In general, the quota elimination would be expected to bring about more competition across producers and thus price reductions. It would enable retail buyers to focus on the most competitive suppliers in terms of cost, quality, lead times or ability to deliver products of highly vertically integrated processes, rather than being confined to those who possess quotas. It is also quite likely that retailers would consolidate their purchases by buying from fewer firms and countries. However, the extent to which these benefits are extended to consumers depends on competition among retailers in countries where products are being sourced and in countries where they are being sold.
The retail sector has become more concentrated, particularly in the United States (Nordas, 2005) and there is evidence that big retailers are increasing their market power in sourcing of textiles and clothing products from the exporting countries. In India, for example it is reported that in the fiscal year 2005-06 the big ticket US retail chains’ purchases of garments amounted to USD 2.5 billion or around 14% of total exports of textile and clothing products

TAD/TC/WP(2007)14/FINAL
55
(27% of clothing product exports) by India in that year. Wal-Mart was responsible for USD 1.2 billion, JC Penney and Target for about USD 800 million and Gap for USD 500 million.1 These numbers suggest an important presence of big ticket retailers in India but there are clearly also other buyers with which these big retailers have to compete. Some industry analysts predict quite significant increases in direct sourcing by the big retailers from countries like India as a result of a general trend of moving away from third-party buying offices and setting-up their own wholly-owned sourcing or buying offices. This is consistent with the general trends outlined by Nordas (2005) who points out that increasingly the supply chains in the T&C sector are being organized as integrated production networks where the production is being sliced into specialised activities performed in locations that have particular advantages in performing these activities.
Overall, ongoing changes in the retail sector will have a key role in determining the extent to which the benefits of the ATC phase-out are felt by both producers and consumers. That the competition in the retail sector is indeed important has been established by Francois et al. (2007). Table A presents a selection of more recent (2008) product market regulation indicators for the retail sector across the OECD membership, particularly as they relate to market entry and regulations favouring large outlets in the sector. These indicators show a significant degree of variation across the OECD membership and predict a significant variation of pass-through of price effects associated with the ATC phase-out.
Table A. Selected indicators of product market regulations in the retail sector in the OECD countries, 2008
Licences or permits
needed to engage in
commercial activity
Specific regulation of large outlet
Protection of existing
firms
Barriers to entry
Retail--composite summary
index
Australia 0.0 0.0 3.0 0.7 1.6Austria 0.0 5.0 3.0 3.6 3.6Belgium 2.0 6.0 6.0 3.4 3.7Canada 5.0 0.0 6.0 1.9 3.0Czech republic 2.0 0.0 3.0 1.5 1.6Denmark 4.0 4.0 6.0 2.8 2.9Finland 5.0 3.0 6.0 2.8 3.1France 0.0 6.0 6.0 2.6 3.1Germany 0.0 5.0 3.0 2.1 2.4Greece .. .. .. .. ..Hungary 6.0 2.0 0.0 3.5 2.1Iceland 5.0 0.0 3.0 3.3 2.4Ireland .. .. .. .. ..Italy 4.0 4.0 3.0 2.6 2.6Japan 3.0 4.0 3.0 2.3 2.4Korea 0.0 0.0 0.0 0.7 1.0Luxembourg 4.0 3.0 3.0 4.3 4.3Mexico 4.0 4.0 3.0 2.6 2.4Netherlands 5.0 0.0 0.0 2.1 2.1New Zealand 6.0 3.0 0.0 2.8 2.1Norway 5.0 0.0 3.0 2.3 2.6Poland 6.0 3.0 3.0 4.0 3.2Portugal 0.0 6.0 3.0 2.4 3.0Slovak Republic .. .. .. .. ..Spain 4.0 3.0 3.0 3.0 2.7Sweden 0.0 0.0 3.0 0.2 0.5Switzerland 0.0 0.0 0.0 0.0 0.8Turkey 2.0 0.0 3.0 1.3 1.5United Kingdom 5.0 0.0 0.0 2.3 2.0United States 6.0 3.8 3.0 3.7 2.6
OECD average 3.1 2.4 2.9 2.4 2.4
Source: Methodology by Conway and Nicoletti (2006), data for 2008 from www.oecd.org/eco/pmr. 1Big retailers double sourcing of garments from India, The Hindu Business Line, 21 April 2006.

TAD/TC/WP(2007)14/FINAL
56
86. Notwithstanding the downward trend of textiles and clothing prices, data gathered by the International Comparison Program of the World Bank (Figure 19) suggest that prices of textile and clothing products remain relatively high in the OECD area. This can be to some extent explained by higher levels of income and different consumer tastes, but there are also significant variations across OECD countries with similar income levels, contributing to evidence of different levels of market access and competition. The EU prices of T&C products, for example, tend to be higher than in the US. There is also some evidence of differences across the EU; Molnar and Bottini (2008), for example, estimate that levels of market competition in the textiles and clothing industry, as measured by mark-ups of prices over costs, vary quite significantly across the EU membership (Figure 20). Finally, the relatively high OECD prices of textile and clothing products are likely influenced by remaining tariff protection on T&C products which is higher as compared to other manufacturing sectors (Annex Figure 19).
Figure 19. Price levels of clothing and footwear in selected OECD and non-OECD countries
0
25
50
75
100
125
150
175
200
225
Source: 2005 International Comparison Program, World Bank.

TAD/TC/WP(2007)14/FINAL
57
Figure 20. Mark-ups of prices over average production costs in selected European markets
0.0
0.5
1.0
1.5
2.0
2.5
3.0
CRS nCRS CRS nCRS
Textiles Clothing
Austria Belgium Czech Rep. Germany Spain
0.0
0.2
0.4
0.6
0.8
1.0
1.2
1.4
1.6
1.8
2.0
CRS nCRS CRS nCRS
Textiles Clothing
Finland France Hungary Italy Netherlands
Figure 20. Mark-ups of prices over average production costs in selected European markets (cont.)
0.0
0.5
1.0
1.5
2.0
2.5
3.0
3.5
CRS nCRS CRS nCRS
Textiles Clothing
Norway Poland Portugal Sweden Slovak Rep.
Note: CRS-estimated under the assumption of constant returns to scale, nCRS-estimated without the assumption of increasing returns to scale. Source: Molnar and Bottini (2008).

TAD/TC/WP(2007)14/FINAL
58
Conclusions
87. The Agreement on Textiles and Clothing (ATC) was one of the major achievements of the Uruguay Round. It put an end to the system that permitted quantitative restrictions to be imposed on portions of the trade in textile and clothing products, a system that lasted for more than 40 years under, first, the Long Term Agreement Regarding International Trade in Cotton Textiles (LTA) and, then, the MFA. The MFA provided protection to domestic industries which often had higher costs and at the same time allowed some less efficient exporters to gain access to markets at the expense of more productive ones whose access had been limited. The quota system prompted an artificial structure of global production and sourcing and influenced locational and marketing decisions of global textile and garment producers.
88. Not surprisingly, the abolition of the quota system has been significantly reshaping the global T&C production, consumption and trade and investment landscapes bringing about efficiency gains but also significant adjustment challenges in the OECD countries as well as non-OECD countries. As a direct consequence of a discriminatory nature of the MFA restrictions, the effects of the phase-out are not uniform, nor are they restricted to the MFA countries or countries whose exports were governed by the quotas, but also extend to third countries. Moreover, for some consumers and producers these effects may only be felt as they feed through the markets in the medium to long term, especially since a significant share of imports from China, the world’s top exporter of T&C products, were still restricted by temporary quotas in the EU markets until the end of 2007 and are still restricted in the US market until the end of 2008.
89. The consequences of the ATC phase-out differ across exporters as well importers, and their preparedness is playing a role in how they manage to cope with competitive challenges in more open markets. This report presents statistical evidence that points to the rather long-term character of the adjustment process both in the OECD and textile-producing developing countries. This process began already prior to the inception of the ATC and continued throughout its duration, despite the back loading of the actual quota removal until 2005. Entrepreneurs in the textiles and clothing industry anticipated and prepared for the quota removal much in advance of the completion of the phase-out.
90. Analysis of available production data indicates that in major high income T&C exporting countries production of both textiles and clothing has seen intermittent periods of reductions and growth since the 1980s and that this pattern worsened with the inception of the ATC. In contrast, major low income T&C exporters such as China, India and Pakistan experienced a long period of a more or less consistent T&C production growth, a pattern that seems to have been reinforced with the advent of the ATC, especially in China. The employment trends are yet more polarised with some major OECD T&C producers shedding labour from the textile and clothing sectors rather consistently since the 1980s, including the ATC period, and low cost developing countries expanding their employment in the sector.
91. Overall, the reduction in T&C employment in most OECD countries has been much deeper than reduction of employment in other manufacturing sector branches and clearly generated significant social costs and structural adjustment challenges because of its high shares of total manufacturing employment in certain countries, its regional concentration and its high intensity in the use of female labour, among others. Nevertheless, this trend cannot be associated uniquely with the ATC phase-out as it clearly started already much before the signing of the ATC when the MFA quotas were still fully in place. In fact, improved productivity and reorganisation seemed crucial for the OECD T&C industry to stay afloat; the fittest producers were best positioned to survive.
92. High-cost OECD T&C exporters moved towards a market structure characterised by a larger number of more specialised firms that are smaller in terms of average number of employed staff but larger in terms of average revenue per firm. The advantage of smaller firms, not only in the T&C industry, is that they are

TAD/TC/WP(2007)14/FINAL
59
more flexible in responding to market needs (e.g. execution of small scale tailor-made orders and attractive lead times), in application of particular sophisticated production technologies and in quality competition.
93. Overall, the data suggest that producers located in high income countries have been differentiating away from the market segments where they have to compete on labour cost towards segments where they can compete on quality (vertical differentiation), application of sophisticated technology, design and marketing strategies as well as by concentrating on fewer products (horizontal differentiation) categories as well as exploitation of scale economies.
94. In the anticipation of the phase out of MFA quotas exporters with low costs and high productivity such as China, India, Pakistan and Vietnam have started consolidating their production of labour-intensive T&C products and pursued economies of scale to benefit from enlarged markets. This was accompanied by a dynamic upgrading of the capital stocks, mostly through imports of machinery form the OECD countries. In some of these countries there remains ample scope for further technology and capital stock upgrading. Producers in lower cost OECD countries such as Turkey or Mexico seem to have followed strategies similar to the dynamic Asian producers and engaged more directly in competition in labour-intensive products.
95. To examine which producers chose to differentiate their products vertically and whether this worked, a comparison of unit prices and market shares of major exporters in the EU and the US was performed. Interestingly, suppliers to the EU15 market have pursued a larger spectrum of price/quality strategies while the suppliers in the US market competed with producers from China more directly (especially after 2005) which also resulted in a more significant reorganisation of the market (more spectacular entries and exits from the market), while in the EU market shares were comparatively more stable. However, we found cases of successful vertical differentiation competition in both the EU and the US markets. The comparison of pricing strategies for products that are more easily differentiable in terms of quality (e.g. suits or bras) with those that are not (e.g. cotton shirts) indicated that the latter type of products were subject to fiercer competition from low cost producers. For all studied products pricing strategies of suppliers to the US market were more tightly concentrated around cheapest prices and markets seem more contestable, suggesting, subject to the caveats mentioned in the main body of the paper, lower barriers to competition and larger gains to the consumers.
96. Consumers clearly stand to gain from the MFA quotas phase out under the condition that quality and safety of the cheaper products can be assured and on condition that the price decreases are actually passed on to the consumers. Indeed, relative prices of clothing have been falling throughout the 1990s in all countries in the sample; but, there were important differences in the rates of these changes, which has been associated in the existing literature with varying levels of competition in national retail sectors. In general prices of T&C products have been falling much more sluggishly in the EU countries, suggesting a less competitive environment. Furthermore, Norway, which was the first country to phase out all its MFA quotas in 2002 in advance of the agreed 2005 deadline and to significantly reduce tariff on T&C imports, clearly enjoyed the deepest reduction in prices and the pace of this reduction clearly accelerated immediately after the quota phase out. Interestingly, consumers in Japan which never had MFA quotas seem to have been impacted negatively by the 2005 phase out which can be associated with a significant redirection of Chinese exports from the Japanese market towards the markets earlier protected by the quotas. Such an effect underscores the pervasive nature of the MFA quotas whose effects extended beyond imposing and restricted countries.

TAD/TC/WP(2007)14/FINAL
60
97. Prices of textile and clothing products in the OECD area remain relatively high prices. This can be to some extent explained by higher levels of income and associated consumer tastes, but there are significant variations across OECD countries with similar income levels, pointing to different levels of market access and competition, especially in the retail sector. In addition, OECD tariff protection on T&C products is relatively high in comparison to other manufacturing sectors, which also contributes to price differentials.

TAD/TC/WP(2007)14/FINAL
61
REFERENCES
Bair, J. and E.D. Peters (2006), “Global Commodity Chains and Endogenous Growth: Export Dynamism and Development in Mexico and Honduras”, World Development, Vol. 34, No. 2, pp. 203-221.
Balasubramanyan, V.N. and Y. Wei (2005), “Textiles and Clothing Exports from India and China: A Comparative Analysis”, Journal of Chinese Economic and Business Studies 3(1).
Cling, J-P., M. Razafindrakoto and F. Ribaud (2005), “Export Processing Zones in Madagascar: A Success Story Under Threat?”, World Development, Vol. 33, No. 5, pp. 785-803.
Conway, P. and G. Nicoletti (2006), "Product Market Regulation in Non-Manufacturing Sectors in OECD Countries: Measurement and Highlights", OECD Economics Department Working Paper No. 530.
Finger, J. M. and M.E. Kreinin (1979), “A Measure of Export Similarity and its Possible Uses”, The Economic Journal, 89.
Francois, J., M. Manchin, H. Norberg and D. Spinanger (2007), “Impacts of Textiles and Clothing Sectors Liberalisation on Prices”, The Kiel Institute for the World Economy, Kiel, Germany.
Gaulier, G., F. Lemoine and D. Ünal-Kesenci (2005), “China’s Integration in East Asia: Production Sharing, FDI & High-Tech Trade”, CEPII Working Paper Series No. 2005-09.
Horrocks, A., R. and S. Anand (2000), Handbook of Technical Textiles, Textile Institute, Textile Institute, Manchester, England.
Ito, K. and K. Fukao (2005), “The Vertical Division of Labour and Japanese Outward FDI: Impacts on Human Capital Deepening in Japan”, manuscript.
Japan External Trade Organisation (JETRO) (2005a), Boeki Toshi Hakusho, in Japanese (White Paper on Trade and Investment), JETRO, Tokyo.
Japan External Trade Organisation (JETRO) (2005b), Zaibei Nikkei Seizogyo No Keiei Jittai – 2005 nendo Chosa, in Japanese (Operation Report on Japanese Manufacturing Enterprises in the US – 2005 Survey), JETRO, Tokyo.
Jones, R. W. and H. Kierzkowski (1990), “The Role of Services in Production and International Trade: A Theoretical Framework”, in R.W. Jones and A.O. Krueger, eds., The Political Economy of International Trade: Essays in Honour of Robert E. Baldwin, Oxford, Basil Blackwell.
Kasuga, T., Y. Oka, Y. Yamaguchi, M. Yamada and Y. Kato (2004), “Mareshia ni Okeru Nikkei Obeikei Denki Denshi Meka no Toushi Kankyou Hyouka Chousa Bunseki – Oubeikei Kigyou no Ajia Shinshutsu Joukyou to Wagagkuni Kigyou no Taiou”, in Japanese (Research and Analysis of Investment Environment Evaluation of Japanese and European/American Electrical Machinery and Electronics Makers in Malaysia), JBIC Research Report No. 18, Japan Bank for International Cooperation, Tokyo.
Ke, L. (2005), “Chugoku Kigyo no Taigai Chokusetsu Toshi ni Kansuru Kansatsu”, in Japanese (An Analysis of Outwards Investments by Chinese Companies), Research Report No. 235, Fujitsu Economics Research Institute, Tokyo.
Kletzer, Lori G. (2001), Job Loss from Imports: Measuring the Costs, Washington: Institute for International Economics, September 2001.

TAD/TC/WP(2007)14/FINAL
62
Kowalski, P., N. Dihel and M. Garcia (2009), mimeo, “India’s Trade Integration, Realising the Potential”, OECD Trade Policy Working Paper Series, OECD, Paris.
Lee, C-K (2004), “Economic Relations between Korea and China”, in Korea’s Economy 2004, Korea Economic Institute, Washington, DC.
Lee, C-S and C. K. Lee (2002), “Korea’s FDI into China: Determinants of the Provincial Distribution”, KIEP Working Paper 02-16, Korea Institute for Economic Policy, Seoul.
Macdonald, S. and T. Vollrath (2005), “The Forces Shaping World Cotton Consumption after the Multifiber Agreement”, Electronic Outlook Report from the Economic Research Service, USDA available at www.ers.usda.gov.
Martín, J.A. and V. Orts (2001), “Vertical Specialisation and Intra-industry Trade: The Role of Factor Endowments”, paper presented at the conference on Recent Developments in Intra-Industry Trade organised by the Leverhulme Centre of Nottingham University, available at www.nottingham.ac.uk/economics/leverhulme/ conferences/may_2001/martin&orts.pdf downloaded on October 13, 2005.
Mayer, T., Paillacar, R., Zignano, S., (2008), The CEPII Trade, Production and Bilateral Protection Database: Explanatory Notes, CEPII, accessed at www.cepii.fr/anglaisgraph/bdd/TradeProd/TradeProd_Explanatory_notes.pdf.
Molnar, M. and N. Bottini (2008), “How Large are Competitive Pressures in Services Markets? – Estimation of Mark-Ups for Selected OECD Countries”, paper presented at the OECD Technical Workshop on Trade Barrier Assessment Methodology, Paris, 12 December 2008.
Molnar, M., N. Pain and D. Taglioni (2008), “Globalisation and Employment in the OECD”, OECD Economic Studies No. 44, OECD, Paris.
Narayan, B. (2008) “Indian Textile and Apparel Sector: An Analysis of Aspects Related to Domestic Supply and Demand”, in Mikic, M. Unveiling Protectionism: Regional Responses to Remaining Barriers in the Textiles and Clothing Trade, UNESCAP, United Nations 2008.
Nordas, H. K., (2005), The Global Textile and Clothing Industry post the Agreement on Textiles and Clothing, Discussion Paper No. 5, World Trade Organization, Geneva, Switzerland.
OECD (2004), A New World Map in Textiles and Clothing – Adjusting to Change, OECD, Paris.
OECD (2005), Trade and Structural Adjustment – Embracing Globalisation, OECD, Paris.
OECD (2007a), OECD Economic Survey of India, OECD Economic Surveys, 2007, vol. 2007, no. 14, pp. 1-246.
OECD (2007b), OECD Workers in the Global Economy: Increasingly Vulnerable?, Working Party on Employment, [DELSA/ELSA/WP5(2007)3].
OECD (2008), OECD Economic Outlook, No. 84, OECD, Paris.
Ozden, Caglar and Sharma, Gunjan (2006), “Price Effects of Preferential Market Access: Caribbean Basin Initiative and the Apparel Sector”, World Bank Economic Review, 20(2), pp. 241-259.
Reinert, K.A. (2000), Give Us Virtue, But Not Yet: Safeguard Actions Under the Agreement on Textiles and Clothing, The World Economy, 23, 1:25-55.
Sedowski, L. (2006), “Hanging by a Thread?: The Post-MFA Competitive Dynamics of the Clothing Industry in Madagascar”, PhD Thesis, University of KwaZulu-Natal, Durban, South Africa.
Singh, J.N. (2008) “Indian Textile and Clothing Sector Poised for a Leap”, in Mikic, M. Unveiling Protectionism: Regional Responses to Remaining Barriers in the Textiles and Clothing Trade, UNESCAP, United Nations 2008.

TAD/TC/WP(2007)14/FINAL
63
Tait, N. (2002), “Prospects for the Textile and Clothing Industry in Madagascar”, Textile Outlook International, Mar.-Apr. 2002, p. 131.
US Department of Agriculture, Economic Research Service (2006), “U.S. Textile and Apparel Industries and Rural America: Geographic Concentration of U.S. Textile and Apparel Industries”, accessed at www.ers.usda.gov/briefing/Cotton/USTexAppConcentration.htm
Wijayasiri, J. and J. Dissanayake, J (2008), The Ending of the Multi-fibre Agreement and Innovation in Sri Lankan Textile and Clothing Industry, OECD Trade Policy Working Paper, No. 75, OECD, Paris.
WTO (1995a), Agreement on Textiles and Clothing, Notification under Article 2.1, United States, G/TMB/N/63, World Trade Organisation, Geneva, Switzerland.
WTO (1995b), Agreement on Textiles and Clothing, Notification under Article 2.1, European Community, G/TMB/N/60, World Trade Organisation, Geneva, Switzerland.
WTO (1995c), Agreement on Textiles and Clothing, Notification under Article 2.1, Canada, G/TMB/N/62, World Trade Organisation, Geneva, Switzerland.
WTO (1995d), Agreement on Textiles and Clothing, Notification under Article 2.1, Norway, G/TMB/N/61, World Trade Organisation, Geneva, Switzerland.
WTO (2004), Comprehensive Report of the Textiles Monitoring Body to the Council for Trade in Goods on the Implementation of the Agreement on Textiles and Clothing During the Third Stage of the Integration Process, G/L/683, World Trade Organisation, Geneva, Switzerland.
WTO (2006), World Trade Report 2006, World Trade Organisation, Geneva, Switzerland.
Xiao, G. (2004), “People’s Republic of China’s Round-Tripping FDI: Scale, Causes and Implications”, ADBI Institute Discussion Paper No. 7.
Yang, Z. (2005), “Quanqiuhua Shidai Chanye Zhuanyi shi Meiduihua Maoyi Nicha Genben Yuanyin”, in Chinese (The Fundamental Reason for US-China Trade Deficit is Industrial Shift in the Globalisation Era), Zhongguo Jinrong, August 29, 2005.
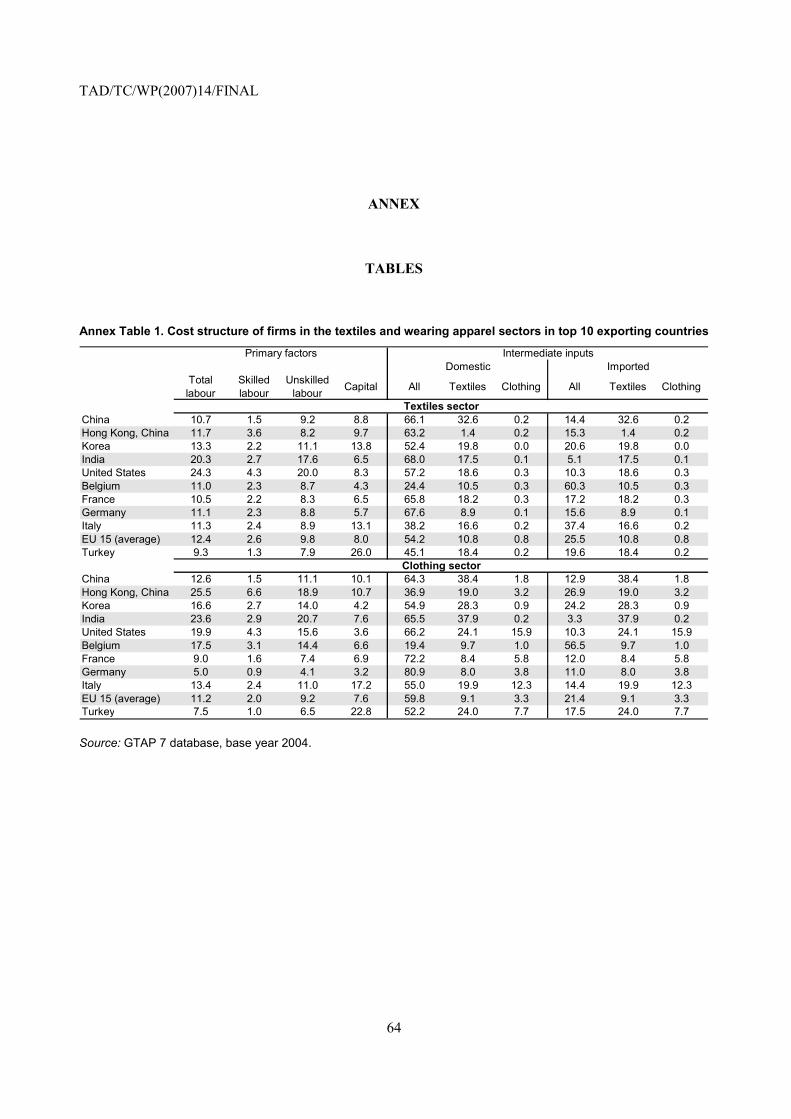
TAD/TC/WP(2007)14/FINAL
64
ANNEX
TABLES
Annex Table 1. Cost structure of firms in the textiles and wearing apparel sectors in top 10 exporting countries
Totallabour
Skilled labour
Unskilled labour Capital All Textiles Clothing All Textiles Clothing
China 10.7 1.5 9.2 8.8 66.1 32.6 0.2 14.4 32.6 0.2Hong Kong, China 11.7 3.6 8.2 9.7 63.2 1.4 0.2 15.3 1.4 0.2Korea 13.3 2.2 11.1 13.8 52.4 19.8 0.0 20.6 19.8 0.0India 20.3 2.7 17.6 6.5 68.0 17.5 0.1 5.1 17.5 0.1United States 24.3 4.3 20.0 8.3 57.2 18.6 0.3 10.3 18.6 0.3Belgium 11.0 2.3 8.7 4.3 24.4 10.5 0.3 60.3 10.5 0.3France 10.5 2.2 8.3 6.5 65.8 18.2 0.3 17.2 18.2 0.3Germany 11.1 2.3 8.8 5.7 67.6 8.9 0.1 15.6 8.9 0.1Italy 11.3 2.4 8.9 13.1 38.2 16.6 0.2 37.4 16.6 0.2EU 15 (average) 12.4 2.6 9.8 8.0 54.2 10.8 0.8 25.5 10.8 0.8Turkey 9.3 1.3 7.9 26.0 45.1 18.4 0.2 19.6 18.4 0.2
China 12.6 1.5 11.1 10.1 64.3 38.4 1.8 12.9 38.4 1.8Hong Kong, China 25.5 6.6 18.9 10.7 36.9 19.0 3.2 26.9 19.0 3.2Korea 16.6 2.7 14.0 4.2 54.9 28.3 0.9 24.2 28.3 0.9India 23.6 2.9 20.7 7.6 65.5 37.9 0.2 3.3 37.9 0.2United States 19.9 4.3 15.6 3.6 66.2 24.1 15.9 10.3 24.1 15.9Belgium 17.5 3.1 14.4 6.6 19.4 9.7 1.0 56.5 9.7 1.0France 9.0 1.6 7.4 6.9 72.2 8.4 5.8 12.0 8.4 5.8Germany 5.0 0.9 4.1 3.2 80.9 8.0 3.8 11.0 8.0 3.8Italy 13.4 2.4 11.0 17.2 55.0 19.9 12.3 14.4 19.9 12.3EU 15 (average) 11.2 2.0 9.2 7.6 59.8 9.1 3.3 21.4 9.1 3.3Turkey 7.5 1.0 6.5 22.8 52.2 24.0 7.7 17.5 24.0 7.7
Textiles sector
Domestic ImportedPrimary factors Intermediate inputs
Clothing sector
Source: GTAP 7 database, base year 2004.

TAD/TC/WP(2007)14/FINAL
65
Annex Table 2. Pace of Quota Abolition
As contained in the communication from ITCB members
US EU Canada NorwayTotal number of quotas at start of ATCa 937 303 368 54
(i) Stage 1 (from 1995):By integration under Article 2.6 0 0 8 0By early elimination under Article 2.15 46
(ii) Stage 2 (from 1998):By integration under Article 2.8(a) 3 21 26 0By Article 2.8(a) and Article 4 2By early elimination under Article 2.15 10c 8
(iii) Stage 3 (from 2002):By integration under Article 2.8(b) 69 57 42 0By Article 2.8(b) and Article 4 2
Under bilateral agreements 13Under AGOA 17
Total number of quotas abolished as of March 2004 103 91 76 54
Quotas to be abolished on 1 January 2005 834 212 292 0
Of which phased out:b
a) Including specific limits and sub-limits notified under Article 2 of the ATC. b) Numbers do not include product categories on which quotas have been eliminated only partially. c) Eliminated only for Romania, not for any other restrained Member. Source: WTO (2004).
Annex Table 3. Costs of trading across the borders in selected top T&C exporters in 2008
Documents for export (number)
Time for export (days)
Cost to export (US$ per container)
Documents for import (number)
Time for import (days)
Cost to import (US$ per container)
China 7 21 460 6 24 545Hong Kong, China 4 6 625 4 5 633Vietnam 6 24 734 8 23 901Korea 4 8 767 6 8 747Germany 4 7 822 5 7 887Turkey 7 14 940 8 15 1063India 8 17 945 9 20 960United States 4 6 990 5 5 1245France 2 9 1078 2 11 1248Italy 5 20 1305 5 18 1305Mexico 5 17 1472 5 23 2700Belgium 4 8 1619 5 9 1600
Source: Doing Business, 2008.

TAD/TC/WP(2007)14/FINAL
66
FIGURES
Annex Figure 1. Positioning strategies of China’s selected OECD competitors in the US market 1997-2007
A. Few exporters can undercut Chinese prices (share of products with less than half of the Chinese price in %)
0
2
4
6
8
10
12
14
16
18
20
1997 1998 1999 2000 2001 2002 2003 2004 2005 2006 2007
Belgium France Germany Hong Kong, China
0
5
10
15
20
25
1997 1998 1999 2000 2001 2002 2003 2004 2005 2006 2007
India Italy Korea, Rep. Mexico Turkey

TAD/TC/WP(2007)14/FINAL
67
B. China sets clothing prices post 2005 (share of clothing exports within 10% of the Chinese unit price in %)
0
5
10
15
20
25
30
35
40
45
1997 1998 1999 2000 2001 2002 2003 2004 2005 2006 2007
Belgium France Germany Hong Kong, China
0
5
10
15
20
25
30
35
40
1997 1998 1999 2000 2001 2002 2003 2004 2005 2006 2007
India Italy Korea, Rep. Mexico Turkey
Source: OECD calculation from UN Comtrade database (2008).

TAD/TC/WP(2007)14/FINAL
68
Annex Figure 2. Cotton skirts: unit values and market shares of major competitors in the EU15 market
Unit values (in Euros per 100 kg)
0
5 000
10 000
15 000
20 000
25 000
30 000
35 000
40 000
45 000
50 000
Austria Belgium China France Germany Hong Kong, China
Morocco Thailand Tunisia
1995 1996 1997 1998 1999 2000 2001 2002 2003 2004 2005 2006 2007 2008
Market shares (%)
0
5
10
15
20
25
30
Austria Belgium China France Germany Hong Kong, China
Morocco Thailand Tunisia
1995 1996 1997 1998 1999 2000 2001 2002 2003 2004 2005 2006 2007 2008
Source: Authors’ calculations based on COMEXT.

TAD/TC/WP(2007)14/FINAL
69
Annex Figure 3. Bras and other body support garments: unit values and market shares of major competitors in the EU15 market
Unit values (in Euros per 100 kg)
0
5 000
10 000
15 000
20 000
25 000
30 000
35 000
40 000
45 000
50 000
Austria Belgium China France Germany Hong Kong, China
Morocco Thailand Tunisia
1995 1996 1997 1998 1999 2000 2001 2002 2003 2004 2005 2006 2007 2008
Market shares (%)
0
5
10
15
20
25
30
Austria Belgium China France Germany Hong Kong, China
Morocco Thailand Tunisia
1995 1996 1997 1998 1999 2000 2001 2002 2003 2004 2005 2006 2007 2008
Source: Authors’ calculations based on COMEXT.

TAD/TC/WP(2007)14/FINAL
70
Annex Figure 4. Cotton sweaters: unit values and market shares of major competitors in the EU15 market
Unit values (in Euros per 100 kg)
0
2 000
4 000
6 000
8 000
10 000
12 000
Bangladesh China Germany Hong Kong, China
India Indonesia Italy Netherlands Turkey
1995 1996 1997 1998 1999 2000 2001 2002 2003 2004 2005 2006 2007 2008
Market shares (%)
0
5
10
15
20
25
Bangladesh China Germany Hong Kong, China
India Indonesia Italy Netherlands Turkey
1995 1996 1997 1998 1999 2000 2001 2002 2003 2004 2005 2006 2007 2008
Source: Authors’ calculations based on COMEXT.

TAD/TC/WP(2007)14/FINAL
71
Annex Figure 5. Cotton skirts: unit values and market shares of major competitors in the US market
Unit values (in USD per item)
0
100
200
300
400
500
600
700
800
900
Cambodia China Hong Kong, China
India Italy Korea Mexico Philippines Turkey
1995 1996 1997 1998 1999 2000 2001 2002 2003 2004 2005 2006 2007 2008
Market shares (%)
0
10
20
30
40
50
60
Cambodia China Hong Kong, China
India Italy Korea Mexico Philippines Turkey
1995 1996 1997 1998 1999 2000 2001 2002 2003 2004 2005 2006 2007 2008
Source: Authors’ calculations based on OTEXA.

TAD/TC/WP(2007)14/FINAL
72
Annex Figure 6. Bras and other body support garments: unit values and market shares of major competitors in the US market
Unit values (in USD per item)
0
50
100
150
200
250
300
350
Canada China Dominican Republic
France Honduras Indonesia Italy Mexico Thailand
1995 1996 1997 1998 1999 2000 2001 2002 2003 2004 2005 2006 2007 2008
Market shares (%)
0
5
10
15
20
25
30
35
40
45
50
Canada China Dominican Republic
France Honduras Indonesia Italy Mexico Thailand
1995 1996 1997 1998 1999 2000 2001 2002 2003 2004 2005 2006 2007 2008
Source: Authors’ calculations based on OTEXA.

TAD/TC/WP(2007)14/FINAL
73
Annex Figure 7. Cotton bras and other body support garments: unit values and market shares of major competitors in the US market
Unit values (in USD per item)
0
50
100
150
200
250
Bangladesh Canada China Honduras Italy Mexico Philippines Thailand Turkey
1995 1996 1997 1998 1999 2000 2001 2002 2003 2004 2005 2006 2007 2008
Market shares (%)
0
5
10
15
20
25
30
35
40
45
50
Bangladesh Canada China Honduras Italy Mexico Philippines Thailand Turkey
1995 1996 1997 1998 1999 2000 2001 2002 2003 2004 2005 2006 2007 2008
Source: Authors’ calculations based on OTEXA.

TAD/TC/WP(2007)14/FINAL
74
Annex Figure 8. Cotton sweaters: unit values and market shares of major competitors in the US market
Unit values (in USD per item)
0
100
200
300
400
500
600
700
Australia Bangladesh China Hong Kong, China
Indonesia Italy Japan Korea Thailand
1995 1996 1997 1998 1999 2000 2001 2002 2003 2004 2005 2006 2007 2008
Market shares (%)
0
10
20
30
40
50
60
Australia Bangladesh China Hong Kong, China
Indonesia Italy Japan Korea Thailand
1995 1996 1997 1998 1999 2000 2001 2002 2003 2004 2005 2006 2007 2008
Source: Authors’ calculations based on OTEXA.

TAD/TC/WP(2007)14/FINAL
75
Annex Figure 9. Cotton skirts: price positioning with respect to China and market share gains (1996-2008)
EU market
-150
-100
-50
0
50
100
150
200
-150 50 250 450 650 850
% c
hang
e in
mar
ket s
hare
% difference with respect to China's unit price US market
-150
-100
-50
0
50
100
150
200
-150 50 250 450 650 850
% c
hang
e in
mar
ket s
hare
% difference with respect to China's unit price Source: Authors’ calculations based on OTEXA and COMEXT, empty rectangles refer to 1996-2004 period while filled markers to 2005-08 period.

TAD/TC/WP(2007)14/FINAL
76
Annex Figure 10. Bras: price positioning with respect to China and market share gains (1996-2008)
EU market (HTS 349 and 649)
-150
-100
-50
0
50
100
150
200
-150 50 250 450 650 850
% c
hang
e in
mar
ket s
hare
% difference with respect to China's unit price US market (HTS 349—bras made of cotton)
-150
-100
-50
0
50
100
150
200
-150 50 250 450 650 850
% c
hang
e in
mar
ket s
hare
% difference with respect to China's unit price

TAD/TC/WP(2007)14/FINAL
77
US market (HTS 349—bras made of man-made fibres)
-150
-100
-50
0
50
100
150
200
-150 50 250 450 650 850
% c
hang
e in
mar
ket s
hare
% difference with respect to China's unit price Source: Authors’ calculations based on OTEXA and COMEXT, empty rectangles refer to 1996-2004 period while filled markers to 2005-08 period.

TAD/TC/WP(2007)14/FINAL
78
Annex Figure 11. Cotton sweaters: price positioning with respect to China and market share gains (1996-2008)
EU market
-150
-100
-50
0
50
100
150
200
-150 50 250 450 650 850
% c
hang
e in
mar
ket s
hare
% difference with respect to China's unit price US market
-150
-100
-50
0
50
100
150
200
-150 50 250 450 650 850
% c
hang
e in
mar
ket s
hare
% difference with respect to China's unit price Source: authors’ calculations based on OTEXA and COMEXT, empty rectangles refer to 1996-2004 period while filled markers to 2005-08 period.

TAD/TC/WP(2007)14/FINAL
79
Annex Figure 12. Textiles: production growth in major T&C exporting countries (average annual growth rates)
-10
-5
0
5
10
15
20
25
Belgium China Germany France Hong Kong, China
India Italy Korea, Rep.
Mexico Pakistan Turkey United States
Vietnam
81-85 86-90 91-95 96-00 01-04
Source: Production and Trade Database, CEPII.
Annex Figure 13. Textiles: growth in employment (average annual growth rates)
-15
-10
-5
0
5
10
15
Belgium China Germany France Hong Kong, China
India Italy Korea, Rep.
Mexico Pakistan Turkey United States
Vietnam
81-85 86-90 91-95 96-00 01-04
Source: Production and Trade Database, CEPII.

TAD/TC/WP(2007)14/FINAL
80
Annex Figure 14. Clothing: production growth in major T&C exporting countries (average annual growth rates)
-20
-10
0
10
20
30
40
50
60
Belgium China Germany France Hong Kong, China
India Italy Korea, Rep.
Mexico Pakistan Turkey United States
Vietnam
81-85 86-90 91-95 96-00 01-04
Source: Production and Trade Database, CEPII.
Annex Figure 15. Clothing: growth in employment (average annual growth rates)
-20
0
20
40
60
80
100
120
140
160
Belgium China Germany France Hong Kong, China
India Italy Korea, Rep.
Mexico Pakistan Turkey United States
Vietnam
81-85 86-90 91-95 96-00 01-04
Source: Production and Trade Database, CEPII.

TAD/TC/WP(2007)14/FINAL
81
Annex Figure 16. Productivity and wages in selected top T&C exporters 1988-2003
Panel A. Textiles
0
20
40
60
80
100
120
140
160
180
200
Bel
gium
Chi
na
Ger
man
y
Fran
ce
Hon
g K
ong,
Chi
na
Indi
a
Italy
Kor
ea
Mex
ico
Pak
ista
n
Turk
ey
Uni
ted
Sta
tes
Bel
gium
Chi
na
Ger
man
y
Fran
ce
Hon
g K
ong,
Chi
na
Indi
a
Italy
Kor
ea
Mex
ico
Pak
ista
n
Turk
ey
Uni
ted
Sta
tes
Wage Output per worker
1983 1988 1993 1998 2003
Panel B. Clothing
0
20
40
60
80
100
120
140
160
180
200
Bel
gium
Chi
na
Ger
man
y
Fran
ce
Hon
g K
ong,
Chi
na
Indi
a
Italy
Kor
ea
Mex
ico
Pak
ista
n
Turk
ey
Uni
ted
Sta
tes
Bel
gium
Chi
na
Ger
man
y
Fran
ce
Hon
g K
ong,
Chi
na
Indi
a
Italy
Kor
ea
Mex
ico
Pak
ista
n
Turk
ey
Uni
ted
Sta
tes
Wage Output per worker
1983 1988 1993 1998 2003
Source: CEPII Trade, Production and Bilateral Protection Database.

TAD/TC/WP(2007)14/FINAL
82
Annex Figure 17. Structural changes in the textiles industries in major T&C exporters 1988-2003
Panel A. Average number of workers per firm
0
50
100
150
200
250
300
350
400
450
Belgium China Germany France Hong Kong, China
India Italy Korea, Rep.
Mexico Pakistan Turkey United States
Vietnam
81-85 86-90 91-95 96-00 01-03
Panel B. Value of average output per firm
0
2 000
4 000
6 000
8 000
10 000
12 000
14 000
16 000
18 000
20 000
Belgium China Germany France Hong Kong, China
India Italy Korea, Rep.
Mexico Pakistan Turkey United States
Vietnam
81-85 86-90 91-95 96-00 01-03

TAD/TC/WP(2007)14/FINAL
83
Panel C. Average number of firms
0
5 000
10 000
15 000
20 000
25 000
30 000
35 000
Belgium China Germany France Hong Kong, China
India Italy Korea, Rep.
Mexico Pakistan Turkey United States
Vietnam
81-85 86-90 91-95 96-00 01-03
Source: Production and Trade Database, CEPII.

TAD/TC/WP(2007)14/FINAL
84
Annex Figure 18. Structural changes in the clothing industries in major T&C exporters 1988-2003
Panel A. Average number of workers per firm
0
100
200
300
400
500
600
Belgium China Germany France Hong Kong, China
India Italy Korea, Rep.
Mexico Pakistan Turkey United States
Vietnam
81-85 86-90 91-95 96-00 01-03
Panel B. Value of average output per firm
0
2 000
4 000
6 000
8 000
10 000
12 000
Belgium China Germany France Hong Kong, China
India Italy Korea, Rep.
Mexico Pakistan Turkey United States
Vietnam
81-85 86-90 91-95 96-00 01-03

TAD/TC/WP(2007)14/FINAL
85
Panel C. Average number of firms
0
5 000
10 000
15 000
20 000
25 000
30 000
35 000
40 000
45 000
50 000
Belgium China Germany France Hong Kong, China
India Italy Korea, Rep.
Mexico Pakistan Turkey United States
Vietnam
81-85 86-90 91-95 96-00 01-03
Source: Production and Trade Database, CEPII.

TAD/TC/WP(2007)14/FINAL
86
Annex Figure 19. OECD average tariff protection by 2-digit HS textile and clothing product group (%)
Panel A. Simple average tariff rates
0 2 4 6 8 10 12 14 16
Total TradeArt of apparel & clothing access, knitted or crocArt of apparel & clothing access, not knitted/cro
Carpets and other textile floor coverings.Cotton
Footwear, gaiters and the like; parts of such artHeadgear and parts thereof.
Impregnated, coated, cover/laminated textile fabrKnitted or crocheted fabrics.
Man-made filaments.Man-made staple fibres.
Other made up textile articles; sets; worn clothiOther vegetable textile fibres; paper yarn & wove
Special woven fab; tufted tex fab; lace; tapestriUmbrellas, walking-sticks, seat-sticks, whips, et
Wadding, felt & nonwoven; yarns; twine, cordage, Wool, fine/coarse animal hair, horsehair yarn & f
Sim
ple
aver
age
appl
ied
rate
Sim
ple
aver
age
pref
eren
tial r
ate
2003 2004 2005 2006 2007
Panel B. Maximum tariff rates
0 100 200 300 400 500 600 700 800 900 1000
Total TradeArt of apparel & clothing access, knitted or crocArt of apparel & clothing access, not knitted/cro
Carpets and other textile floor coverings.Cotton
Footwear, gaiters and the like; parts of such artHeadgear and parts thereof.
Impregnated, coated, cover/laminated textile fabrKnitted or crocheted fabrics.
Man-made filaments.Man-made staple fibres.
Other made up textile articles; sets; worn clothiOther vegetable textile fibres; paper yarn & wove
Special woven fab; tufted tex fab; lace; tapestriUmbrellas, walking-sticks, seat-sticks, whips, et
Wadding, felt & nonwoven; yarns; twine, cordage, Wool, fine/coarse animal hair, horsehair yarn & f
Max
imum
app
lied
rate
Max
imum
pre
fere
ntia
l rat
e
2003 2004 2005 2006 2007

TAD/TC/WP(2007)14/FINAL
87
Panel C. Standard deviation
0 2 4 6 8 10 12 14 16 18
Total TradeArt of apparel & clothing access, knitted or crocArt of apparel & clothing access, not knitted/cro
Carpets and other textile floor coverings.Cotton
Footwear, gaiters and the like; parts of such artHeadgear and parts thereof.
Impregnated, coated, cover/laminated textile fabrKnitted or crocheted fabrics.
Man-made filaments.Man-made staple fibres.
Other made up textile articles; sets; worn clothiOther vegetable textile fibres; paper yarn & wove
Special woven fab; tufted tex fab; lace; tapestriUmbrellas, walking-sticks, seat-sticks, whips, et
Wadding, felt & nonwoven; yarns; twine, cordage, Wool, fine/coarse animal hair, horsehair yarn & f
Stan
dard
dev
iatio
n of
app
lied
rate
Stan
dard
dev
iatio
n pr
efer
entia
l rat
e
2003 2004 2005 2006 2007
Source: COMTRADE accessed through WITS.

TAD/TC/WP(2007)14/FINAL
88
Annex Box 1. The impact of ATC phase-out in Honduras
By restricting the export growth of competitive clothing industries, MFA quotas opened the door to the global market for Honduras’s apparel sector. Given these preferable trading conditions, foreign investment from the US and Asia activated Honduras into a thriving apparel industry. The removal of MFA quotas, however, triggered a decline, causing Honduras’s US market share of 3.09% in 2004 to fall to 2.57% by 2006. Additionally, the country’s impressive escalation from the United States’ 31st largest supplier of apparel products in 1991 to the 7th largest supplier in 2002 stalled and descended to the US’s 10th largest supplier in 2006 (UN ComTrade, 2007). Despite the country’s close geographic and business relations with US apparel firms, MFA expiration threatens the adolescent textiles and clothing industry. Strengthened relations with international companies and increased investment in the textile industry and vertically-integrated enterprises, however, could improve Honduras’s defence against global competition.
The collective shift of the Caribbean Basin (namely, Central America and the Caribbean) into the apparel industry began in the 1950s. At the time, new government policies promoted offshore production and US apparel firms showed increased interest in the Caribbean’s cheap labour supply and geographic proximity. In the 1960s and 1970s, export-oriented industrialisation became more popular among Latin American governments, prompting the growth of many export-processing zones (EPZs).
However, export-led growth did not take hold until 1984 when the Caribbean Basin Initiative improved political stability and economic cooperation with the US. The Special Access Programme, more widely known as the 807 rule, further contributed to the sector’s development in 1986 by allowing low-income countries such as Honduras to export unlimited amounts of apparel to the US if the apparel was made from US-cut fabrics. Following the introduction of this rule, “production-sharing” became a common practice for Caribbean apparel industries. While this initially augmented the growth of apparel sectors, the raw material conditions discouraged development of many local textile sectors, thus hindering the possibility of developing full-package manufacturing plants.
Maquiladoras are the most common type of apparel firm in Honduras, and have made a notable contribution to the decrease of the country’s high unemployment. These factories are used throughout the Caribbean Basin by foreign clothing firms to assemble duty-free fabrics that are then re-imported into the original country as ready-made garments. While “production-sharing” between US and the Caribbean Basin firms has generated employment, it has also stunted the growth of many Caribbean apparel industries because of dependency on US materials and contracts.
Since the 1990s, Honduras has invested in many full-package manufacturing plants. Full-package production is an improvement over production-sharing work because it promotes local textile production, attracts foreign investment, and strengthens market relations. These factors have strengthened the roots of Honduras’s apparel industry and fortified the industry’s defence against MFA expiration.
The emergence of several vertically-integrated firms since 2000 has also contributed to the industry’s impressive growth. Full-package production firms have integrated backwards by acquiring fabric production plants, thus demanding an expansion of Honduras’s textile industry (Bair and Peters, 2006). Textile integration has granted autonomy to many Honduran companies, but the textile industry as a whole remains in an infantile state. As of 2005, the Central American Free Trade Agreement (CAFTA) has encouraged the development of the textile industry by authorising the use of raw materials from any member country. Asian competitors, however, have operated vertically-integrated enterprises for decades.
Foreign involvement in Honduras’s clothing production has solidified the country’s role in the global apparel market. US investment in Honduran export-processing plants has played an integral part in the preliminary transfer of industrial technology and the development of US-Honduran trade relations since the 1990s. As illustrated in the table below, the US has monopolised Honduran exports since granting preferential treatment in 1991, taking advantage of the short lead times generated by Honduras’s geographic proximity. A study by Ozden and Sharma (2006) found that 8.5-9.5% of the average export price increase in Honduras, Costa Rica, and the Dominican Republic could be attributed to US preferential access schemes. Asian investors have taken a firm interest in Honduras as well, funding the majority of Honduran textile factories. As Chinese companies look to expand globally, the Honduran clothing industry offers an attractive investment because of CAFTA’s duty-free access to the US market.

TAD/TC/WP(2007)14/FINAL
89
Annex Box 1. The impact of ATC phase-out in Honduras (continued)
Top 10 destinations of Honduran apparel exports
Percentages and billions USD
1990 1991 1992 1993 1994 1995 1996 1997 1998 1999 2000 2001 2002 2003 2004 2005 2006 2007United States .. 99.3 97.4 97.5 97.7 98.2 98.1 98.3 97.8 98.0 97.5 97.0 96.4 96.3 95.4 94.6 93.0 92.0Morocco .. .. .. .. .. .. .. .. .. .. .. .. .. .. .. .. 1.7 2.4Canada 27.0 0.2 0.3 0.4 0.5 0.7 0.9 0.9 1.2 1.2 0.9 1.3 1.8 1.4 1.8 1.8 2.1 1.9Mexico 5.4 0.1 .. 0.0 0.1 0.0 0.1 0.1 0.1 0.1 0.1 0.2 0.2 0.2 0.4 0.6 0.6 1.1Belgium .. .. .. .. .. .. .. .. .. 0.1 0.7 0.5 0.5 0.5 0.6 0.4 0.6 0.5United Kingdom .. .. .. 0.1 0.1 0.1 0.1 0.0 0.0 0.0 0.0 0.0 0.0 0.2 0.3 0.2 0.4 0.5Guatemala .. .. .. 0.2 0.2 0.1 0.1 0.1 0.1 0.1 0.1 0.1 0.2 0.2 0.1 0.1 0.2 0.3Germany 65.8 0.4 0.6 0.2 0.1 0.1 0.1 0.0 0.0 0.0 0.0 0.1 0.1 0.1 0.1 0.2 0.2 0.2Japan 1.7 0.0 0.0 0.1 0.1 0.1 0.2 0.2 0.3 0.3 0.3 0.3 0.4 0.3 0.3 0.3 0.2 0.2Spain .. 0.0 0.0 0.1 0.0 0.0 0.0 0.0 0.0 0.0 0.0 0.1 0.1 0.1 0.1 0.1 0.1 0.2
Total top 10 0.001 0.203 0.381 0.526 0.672 0.968 1.287 1.751 1.983 2.286 2.523 2.557 2.647 2.713 2.921 2.870 2.762 2.874
Source: UN ComTrade Database.
The stagnation of most Caribbean Basin apparel sectors since 2000 mirrors the progressive expiration of MFA quotas. Honduras’s growth rates have slowed as well, relative to the exponential growth rates achieved in the 1990s, but the shape of the industry has concurrently adapted and advanced in recent years to prepare for increased levels of global competition. Honduras’s progression from production-sharing to full-package manufacturing to vertically-integrated production is central to this development. These sophisticated production schemes offer Honduras a strong competitive advantage over regional competitors who have not evolved from US-dependent maquiladora production, a vulnerable form of enterprise plagued by low barriers to exit.
While Honduras has achieved record growth rates and captured market share from other Caribbean Basin competitors like Jamaica and Haiti, the concentration of quota-sensitive apparel products in the last stage of MFA expiration still poses a significant threat. Knit t-shirts, knit jerseys, and sweaters comprise the majority of Honduras’s export product range (Bair and Peters, 2006). As these products previously were protected by high quota constraints, Honduras now faces direct competition with China. Product differentiation would help to protect Honduras in the global market, but the industry has made limited efforts in this direction.
Annex Box 2. Uncertain times in Malagasy apparel
Madagascar offers a prime example of a low-income country drawn into the apparel industry by MFA quota protection and preferential treatment schemes. By limiting competition from other exporting countries and redirecting foreign investment to Madagascar, these programs have facilitated the global establishment of this emerging industry. Madagascar is a particularly interesting case because of its dramatic growth period from 1990 to 2001, during which the clothing sector was one of the fastest growing industries in Sub-Saharan Africa. Since 2002, the industry endured a severe downturn due to a political crisis, and then rebounded to pre-crisis export levels again by 2004 due to the depreciation of the Malagasy currency (a temporary defence against the pending MFA expiration). To surmount the long-term implications of MFA expiration and compensate for the country’s reputation for political instability, Madagascar should increase the industry’s competitiveness by boosting investment in and vertically-integrating the textile industry, promoting synergies within the export-processing zones and smaller companies, and specialising in niche products that circumvent direct competition with China.
The swift development of Madagascar’s clothing industry in the 1990s can be attributed to three main factors. First, Malagasy exports were promoted as an alternative to exporting countries restricted by the Multi-Fibre Arrangement. Second, duty-free access on clothing imports to the European market, was granted by the EU Cotonou Agreement program and reaffirmed in 2001 by the “Everything But Arms” (EBA) initiative. Last, Madagascar profited from the Africa Growth and Opportunity Act (AGOA) program, which granted duty-free access to the US market for clothing products from Sub-Saharan Africa, with a provision to use local fabric until September 2007. The impact of the AGOA scheme on Madagascar’s clothing industry is evident by the increase in foreign investment after the AGOA scheme was announced in 1997 and the 114% growth in Malagasy apparel exports from 1997 to 2001 (Tait, 2002).

TAD/TC/WP(2007)14/FINAL
90
Annex Box 2. Uncertain times in Malagasy apparel (continued)
Stimulated by these programs, Madagascar has established itself in the global clothing market, primarily in the role of an apparel assembler. The industry has grown from a handful of factories in the 1980s to approximately 115 factories in 2005 (Sedowski, 2006). Meanwhile, the country’s textile industry remains underdeveloped due to the country’s insufficient cotton production and lack of investment in production technologies. Madagascar’s three textile mills cannot meet demand, so most production units are imported from China, a low-cost alternative, and Mauritius, a qualifying LDC AGOA supplier.
The Multi-Fibre Agreement first facilitated the establishment of Madagascar’s apparel industry by promoting triangular manufacturing arrangements. In response to MFA quota restrictions, middle-income countries began to subcontract out all or part of a project to less developed countries, thus developing fledgling industries like Madagascar’s apparel sector by investing in the country’s knowledge-base and technology. As Malagasy apparel firms became more established, they capitalised on these investments by forming direct relationships with buyers (particularly European clients).
The growth of Madagascar’s clothing industry is also largely attributed to foreign investment from Mauritius, which was attracted by Madagascar’s cheap labour supply. Concurrently, Madagascar’s thriving French expat population facilitated an influx of foreign investment into the expanding industry. Asian investors (chiefly, China, Malaysia, Pakistan, Singapore, and Hong Kong, China), quickly followed suit in the 1990s. And since the AGOA program’s announcement, several Middle Eastern companies (particularly from Saudi Arabia and UAE) have also invested in Madagascar apparel sector (Tait, 2002).
Among the various national development initiatives, the introduction of export processing zones (EPZ) in 1990 had the greatest impact on the growth of the clothing and textile industry. Taking advantage of MFA quota protection, duty-free inputs for 95% of exports attracted many new market entrants and the development of three major production centres. These government-subsidised zones aimed to increase foreign investment through duty exemptions, tax deferral and drawback schemes, and a 10% tax on dividends (Tait, 2002). They also contributed to the apparel sector’s competitive advantage, facilitating specialisation within an industry and collaboration to fill large orders. Madagascar and Mauritius’ EPZs have been particularly successful in that they offer EPZ benefits to firms that are located anywhere in the country. Interestingly, the EPZs still suffered in the 2002 political crisis because of the industry’s low barriers to exit, but they were also the best equipped to bounce back (Cling et al., 2005).
The future and policy implications
Despite the apparel industry’s quick recovery after the political crisis, the ability for the country to withstand the expiration of preferential treatment schemes is unclear. Madagascar’s physical infrastructure severely limits the development of the textile and clothing industry. From rent to electricity to administrative costs, Madagascar’s overhead charges have become a serious consideration for potential investors. The country has an inefficient transportation system; the road system is deficient, port facilities are in poor condition, and export lead times are long because the country is not on a direct shipping route (exports must be shipped via Durban, South Africa). In addition, the country’s deficient training facilities are limiting the development of skilled labour and contributing to the industry’s low productivity rates. Despite infrastructural setbacks, however, exports to the EU market have grown since 2004. Interestingly, exports to the US market have concurrently fallen (see table below). Madagascar’s US market share fell from 0.38% in 2004 to 0.25% in 2006, primarily because of a decrease in knit or crocheted apparel and accessory exports. Meanwhile, German market share, the third top destination of Malagasy 2005 exports, increased from 0.09% in 2003 to 0.16% in 2006, due to a gain in market share of the same product category. The slight decrease in the German unit price of these products has not discouraged growth, while a dramatic drop in price from USD 16.90 in 2004 to USD 3.90 in 2006 has visibly impaired exports of this category to the US market (UN ComTrade, 2007).

TAD/TC/WP(2007)14/FINAL
91
Figure 13. Top 10 destinations in 2007 of exports of Madagascar
Percentages
0
10
20
30
40
50
601995 2000 2005 2006 2007
Source : UN ComTrade Database.
Vertical integration offers hope for the future of the clothing industry. Madagascar’s clothing factories could integrate with the country’s few textile production facilities and the handful of accessory manufacturers. This would require expansion of the domestic cotton industry, a factor that will become more pertinent after the AGOA fabric provision phase-out in September 2007. HASYMA, the national cotton production organisation, was privatised in 2004 and has vocalised plans to boost cotton production in the coming years. Developing domestic fabric production would position Madagascar as more competitive in the global market, because the country’s current fabric orders from India and China delay production by three to five weeks. Significant technological advancements would be necessary, however, to reduce Madagascar’s current lead time on orders (of six to seven weeks) to an efficiency level competitive with Indian and Chinese suppliers.
The apparel industry’s chance of long-term survival would also improve by increasing synergies between Madagascar’s many small, adolescent companies. USAID has initiated the JUMPSTART program to promote the development of small and mid-sized firms. Meanwhile, the EU developed a clustering organisation called Text’Ile Mada, to facilitate the pooling of knowledge and product specialisations. The cluster has increased the apparel sector’s competitiveness in the global market by decreasing costs and by uniting companies to offer a broader range of services to overseas clients and compete with China for large orders.
Product specialisation would also increase Madagascar’s competitiveness in the global market. Wadding, felt, non-wovens, yarns, twine, and cordage have been exported to Germany since 1994, and would offer a potential niche market for Madagascar. These products comprised 0.12% of the German market share and 0.02% of the US market share in 2006. While nearly all categories of apparel exports are growing, this product category still remains a minor export category for China. Additionally, Madagascar can offer a price advantage, exporting for USD 1.70 to the German market versus China’s average unit price of USD 4.40 (UN ComTrade, 2007). Further investment in the development and promotion of these products in the US and European markets would allow Madagascar to sidestep Chinese competition.
Even with the expiration of MFA quota protection and the AGOA third-country fabric provision, Madagascar still has limited preferential treatment in the EU market and in the US market until 2015. As a WTO member, Madagascar also benefits from non-discriminatory trade with all member countries, while non-WTO apparel exporters like Laos remain restricted to preferential trade access granted by bilateral trade agreements. The ever-evolving nature of the industry and the global market makes the future undecided, but further expansion of the textile sector, development of intra-firm synergies, and product specialisation would give Madagascar a fighting chance.
Copyright © 2022 FDOKUMEN