ORIGINAL: ENGLISH ECONOMIC AND SOCIAL COMMISSION FOR WESTERN ASIA (ESCWA) ECONOMIC TRENDS AND...
66
-
Upload
independent -
Category
Documents
-
view
1 -
download
0
Transcript of ORIGINAL: ENGLISH ECONOMIC AND SOCIAL COMMISSION FOR WESTERN ASIA (ESCWA) ECONOMIC TRENDS AND...


Distr. GENERAL E/ESCWA/EAD/2007/1 4 January 2007 ORIGINAL: ENGLISH
ECONOMIC AND SOCIAL COMMISSION FOR WESTERN ASIA (ESCWA)
ECONOMIC TRENDS AND IMPACTS
FOREIGN AID AND DEVELOPMENT IN THE ARAB REGION
ISSUE No. 4
United Nations New York, 2007

E/ESCWA/EAD/2007/1 ISSN. 1727-5822
ISBN. 978-92-1-128307-5 92-1-128307-8
07-0014
UNITED NATIONS PUBLICATION
Sales No. E.07.II.L.2

iii
Preface The Economic trends and impacts series analyses the macroeconomic and institutional developments in ESCWA member countries that are major determinants of overall economic and social performance in those countries. The main purpose of the series is to identify major obstacles to a sustainable and equitable development process in the region. The studies in this series are based on comprehensive empirical analysis and include policy recommendations aimed at enhancing the capacity of policymakers to develop appropriate strategies and programmes. This issue examines the role of foreign aid in the development of the Arab region, with a focus on four selected ESCWA members, namely, Egypt, Jordan, Palestine and Yemen. Following an analysis of the major trends in aid flows to the Arab region between 1970 and 2004, the study takes a closer look at specific characteristics of aid flows to these ESCWA members. Against the background of the current debate on aid effectiveness, a panel model for low- and middle-income countries is estimated, which isolates the effect of aid on growth for a set of Arab countries. Based on the results of the empirical analysis, the study presents a number of policy recommendations aimed at enhancing the development impact of aid in the Arab region, especially in the light of the need to accelerate progress towards the achievement of the Millennium Development Goals (MDGs).

iv

v
CONTENTS
Page Preface .................................................................................................................................................. iii Abbreviations and explanatory notes ................................................................................................... vii Executive summary .............................................................................................................................. viii Introduction .......................................................................................................................................... 1 Chapter I. AID FLOWS TO THE ARAB REGION ............................................................................... 5 A. Data on development assistance ......................................................................................... 5 B. Bilateral and multilateral aid flows to the Arab region ...................................................... 6 C. Aid effort ............................................................................................................................ 10 D. Distribution of aid among Arab recipients ......................................................................... 11 E. Aid and income levels ........................................................................................................ 15 F. Aid dependency in selected Arab countries ....................................................................... 17 II. CHARACTERISTICS OF AID FLOWS TO SELECTED ESCWA COUNTRIES ......... 20 A. Overview of aid to selected ESCWA countries.................................................................. 20 B. Degree of concessionality................................................................................................... 21 C. Tying status ........................................................................................................................ 23 D. Technical cooperation ........................................................................................................ 25 E. Sectoral distribution of aid flows........................................................................................ 27 F. Volatility and cyclicality .................................................................................................... 30 III. AID AND ECONOMIC DEVELOPMENT IN THE ARAB REGION .............................. 33 A. Aid and economic growth: theory ...................................................................................... 33 B. Aid and economic growth: a review of empirical findings ................................................ 34 C. Empirical analysis .............................................................................................................. 36 IV. SUMMARY AND POLICY RECOMMENDATIONS......................................................... 43 A Summary ............................................................................................................................ 43 B. Policy recommendations .................................................................................................... 44
LIST OF TABLES 1. Cumulative net ODA to selected Arab recipients by major donors, 1970-2004 ........................ 13
2. Volatility of output and foreign aid in Egypt, Jordan and Yemen, 1970-2004 .......................... 31
3. Cyclical properties of foreign aid in Egypt, Jordan and Yemen................................................. 32
4. Variable definition and source.................................................................................................... 39
5. Additional variables in the social services regression ................................................................ 42

vi
CONTENTS (continued)
Page
LIST OF BOXES 1. The top two inter-Arab aid donors.............................................................................................. 8
2. Emergency aid to Lebanon ......................................................................................................... 14
LIST OF FIGURES
1. Real flows of net ODA to the Arab region ................................................................................. 6
2. Amount of Arab aid donations, annual averages, 1970-2004..................................................... 8
3. Ratio of net ODA to GNI in major donor countries, 2004 ......................................................... 10
4. Distribution of aid to Arab countries, 1970-2004....................................................................... 11
5. Relationship between ODA per capita and GNI per capita in selected Arab countries, 1970-2004................................................................................................................................... 16
6. Ratio of ODA to GNI in selected Arab countries ....................................................................... 19
7. Annual ODA per capita in Egypt, Jordan, Palestine and Yemen, 1970-2004 ............................ 21
8. Concessionality of ODA commitments to Egypt, Jordan, Palestine and Yemen, 1970-2004................................................................................................................................... 22
9. Tying status of aid commitments to Egypt, Jordan, Palestine and Yemen, 1983-2005.............. 24
10. Share of technical cooperation to net ODA in Egypt, Jordan, Palestine and Yemen, 1970-2004................................................................................................................................... 26
11. Sectoral allocation of aid commitments to Egypt, 1980-2004.................................................... 27
12. Sectoral allocation of aid commitments to Jordan, 1980-2004................................................... 28
13. Sectoral allocation of aid commitments to Palestine, 1980-2004............................................... 29
14. Sectoral allocation of aid commitments to Yemen, 1980-2004.................................................. 29

vii
ABBREVIATIONS AND EXPLANATORY NOTES AUER Arab Unified Economic Report CPIA Country Policy and Institutional Assessment CRS Creditor Reporting System DAC Development Assistance Committee EU European Union FGLS feasible generalized least squares GCC Gulf Cooperation Council GDP gross domestic product GMM generalized method of moments GNI gross national income GNP gross national product ICOR incremental capital-output ratio ICRG International Country Risk Guide IMF International Monetary Fund LDC least developed country MDG Millennium Development Goal NGO non-governmental organization ODA official development assistance OECD Organisation for Economic Co-operation and Development OLS ordinary least squares PPP purchasing power parity SME small and medium enterprise TC technical cooperation TFP total factor productivity TSLS two-stage least squares UNESCO United Nations Educational, Scientific, and Cultural Organization UNDP United Nations Development Programme UNRWA United Nations Relief and Works Agency for Palestine Refugees in the Near East References to the dollar symbol ($) indicate United States dollars.

viii
Executive summary Many Arab countries face the risk of failing to achieve the Millennium Development Goals (MDGs) by 2015, particularly the least developed countries (LDCs) in the region and those countries and territories suffering directly from conflict. This can be attributed to weak economic growth during the past two decades, ongoing military conflicts in the region and major shortcomings in the provision of public services. Recent assessments of progress towards MDGs, including the report by the United Nations, entitled “The Millennium Development Goals in the Arab region 2005”, have revealed sharp regional and intraregional discrepancies. Specifically, these assessments have illustrated that poverty levels in Arab LDCs as well as in Iraq and Palestine have increased since 1990. Moreover, current child and maternal mortality ratios in low-income Arab countries are alarmingly high, despite some progress in recent years. Accelerating progress towards MDGs depends on intensified pro-poor policy efforts in the developing countries themselves, stronger regional cooperation, and more generous and effective development support from industrialized countries, particularly in the form of official development assistance (ODA). Against this background, this study examines the role of foreign aid in development of the Arab region during the past three decades, with a particular focus on Egypt, Jordan, Palestine and Yemen. It provides policymakers within Governments and international development institutions with a comprehensive macroeconomic analysis of the major trends and characteristics of foreign aid flows to the Arab region, and of the impact of these aid flows on economic growth and social indicators. In doing so, the study identifies several key policy areas that need to be addressed in order to make aid flows to the Arab region more effective in reducing poverty and promoting development. The effect of aid on economic growth and social indicators is estimated by means of a panel analysis for low- and middle-income countries, which incorporates several main elements of new research approaches in the field and isolates the impact of aid in the Arab region. Overall, aid flows to the Arab region have fluctuated substantially during 1970-2004, depending largely on economic circumstances and geopolitical considerations in the main donor countries. Currently, flows of ODA to Arab countries are well below levels reached during the 1970s and early 1980s, when the strong increase in oil prices resulted in very high aid flows from countries of the Gulf Cooperation Council (GCC) to other Arab countries. According to data by the Organisation for Economic Development and Co-operation (OECD), total real ODA to Arab countries decreased from some $16 billion in 1977 to $5.6 billion in 2000. Since then, the volume of aid received by Arab countries has gradually increased to almost $12 billion in 2004. However, a large portion of this recent increase is attributable to rising levels of assistance to the two countries and territories in conflict, namely, Iraq and Palestine. With respect to aid volatility at the country level, the analysis for Egypt, Jordan and Yemen confirms the result of other studies, namely, that foreign aid is several times more volatile than other macroeconomic variables, such as the gross domestic product (GDP). Aid flows to Arab countries have therefore been associated with a considerable degree of uncertainty, thereby hampering medium- and long-term planning and negatively impacting public investment. An analysis of the geographical distribution pattern of ODA flows to Arab countries over the past three decades suggests that geopolitical reasons, economic interests and past colonial ties have often dominated developmental needs in the aid allocation of donor countries. In fact, aid flows to the Arab region have not primarily targeted the countries with the lowest income, which are most in need of foreign assistance. By contrast, the 1980s and 1990s are characterized by a positive correlation between average income per capita and average ODA per capita. The study also reveals that aid dependency measured by the ratio of ODA inflows to gross national income (GNI) of Arab countries has generally declined over the past three decades. Specifically, in 2000-2004, Iraq, Mauritania, Palestine and Somalia were the only Arab countries and territories that were classified as highly aid dependent. A more detailed assessment of specific characteristics of foreign aid received by Egypt, Jordan, Palestine and Yemen shows that the share of tied aid to total aid to these countries has significantly declined during the past two decades, possibly contributing to higher aid effectiveness. In addition, the share of grants to total aid has increased substantially since the 1970s, particularly in Egypt and Jordan. Most importantly,

ix
an analysis of the sectoral allocation of aid reveals marked changes between the 1980s and 2000-2004. Over time, an increasing fraction of foreign aid has been channelled to such social sectors as education and health at the expense of economic sectors, particularly agriculture and industry. The results of the panel data analysis suggest that, on average, aid has had a positive impact on economic growth in Arab countries through both capital accumulation and increased productivity. At the same time, no evidence was found for the hypothesis that aid works only in good policy environments and that major absorptive capacity constraints exist in the Arab region. Moreover, an assessment of the impact of aid on social indicators reveals a positive effect on life expectancy, albeit not on literacy rates. Based on the results of the empirical analysis, several important observations can be drawn, including, most importantly, that an increase in aid flows to the Arab region is likely to have a beneficial impact on economic growth and health indicators in recipient countries. Consequently, the findings of the study encourage global and regional initiatives aimed at scaling up the volume of development aid to the region. Given the observed high volatility of aid both to the ESCWA region as a whole and to individual countries, a steadier and more predictable flow of aid funds is recommended, especially for the countries in the region that are most dependent on foreign aid. Overall, it is vital that both Arab and non-Arab donors channel a substantially larger share of total ODA to the least developed countries in the region, which are not on track to meeting MDGs by 2015. This could require major donors to the region to base their aid allocation less on geopolitical decisions and more on developmental considerations. The observed strong decline in aid channelled to economic sectors raises concerns about the prospects of these countries for developing their economic base and for achieving higher growth rates in the medium and long run. This is all the more important in the light of the alarmingly high unemployment and underemployment rates across the Arab region, especially among the youth. Given that many Arab countries face the enormous challenge of generating more and better jobs, it is essential that all forms of development assistance take into account the potential short- and medium-run effects on employment. In addition, while significant progress in such areas as untying of aid has been achieved, it is essential to apply the framework and guidelines that were established in the Paris Declaration on Aid Effectiveness in developing programmes and projects. Equally, a significant increase of foreign aid needs to be complemented by intensified domestic policy efforts in Arab countries aimed at creating a policy framework that effectively addresses the main challenges to a higher and more equitable development path. Major obstacles to a better economic performance include insufficient investment levels and productivity gains, lagging political and institutional reforms, inefficient and inequitable educational systems, underdeveloped financial markets, and high trade-related costs. Furthermore, a large part of ODA to Arab countries seems to be motivated by geopolitical considerations rather than according to development needs; and an analysis of the relationship between per-capita income and per-capita ODA in Arab developing countries reveals that aid is not reaching the countries with the highest needs. This is confirmed at the country level, with evidence suggesting that the majority of aid to Jordan and Egypt, for example, is not primarily driven by developmental needs. While empirical research undertaken during the past decades have largely failed to provide a conclusive picture as to the extent that aid contributes to economic growth and development, several recent studies have reached more positive conclusions. Among other things, these studies have highlighted the importance of good institutions in recipient countries for the effectiveness of aid and the superiority of aid motivated by developmental considerations, compared to aid motivated by geopolitical considerations. This study finds evidence in support of output growth aimed at enhancing aid and human development indicators in the Arab region, and documents the negative effect on growth caused by a comparatively large dependent population in the Arab region.

Introduction At the Millennium Summit in September 2000, 147 heads of State and Government and a total of 189 countries adopted the Millennium Declaration, thereby committing themselves to a variety of international development objectives to be met by 2015. The eight Millennium Development Goals (MDGs), together with 18 related targets and 48 indicators, are now commonly accepted as the framework with which to measure development progress at the beginning of the twenty-first century. Recent global and regional reports have revealed that the Arab region has achieved at best mixed results over the past decade.1 Many countries, especially the LDCs in the region and those suffering directly from military conflicts, face the risk of not meeting most of the Goals by 2015. Leading economists and policymakers have repeatedly emphasized that achieving MDGs depends not only on intensified policy efforts in developing countries themselves, but also on further regional cooperation and more generous and effective financial assistance from developed countries. In fact, Goal 8 calls for the establishment of a global partnership for development, including debt relief and increased bilateral and multilateral development assistance, particularly for LDCs. Within that context, the United Nations encouraged countries to “more than double global development assistance over the next few years. Nothing else will help to achieve the Goals”.2 Since the Millennium Summit, a number of international initiatives have been undertaken aimed at gaining global support for a substantial increase in the volume of foreign aid to poor countries, including, for example, the Millennium Project and the Commission for Africa. Advocates for scaling up aid efforts claim that low-income countries can only make fast progress towards MDGs and eradicate extreme poverty by 2015 through a massive transfer of real resources to these countries over the coming years. The main argument for these claims is based on the “financing gap” approach to justify development aid.3 This approach states that developing countries lack domestic funds to invest sufficiently in physical capital (for example, infrastructure and export capacities) as well as human capital (for example, education and health), which constrains economic growth and impedes more equitable development. Given that most developing countries are not able to attract large inflows of private capital, it is argued that the domestic financing gap can ultimately only be filled by foreign aid, thereby increasing investment that translates into higher economic growth. In the context of MDGs, which express a broad and global vision of development, the financing-gap approach becomes even more appealing. In this development framework, improvements in certain areas of development, including, for example, education or gender equality, constitute a value by themselves and are not predominantly evaluated through their impact on economic growth. While calls for a massive scaling up of aid have become more widespread, many development experts have warned against overly optimistic expectations on the effects of larger aid flows. According to a critical analysis of the role foreign aid can play in fostering economic growth, aid agencies need to “set more modest objectives than expecting aid to launch the takeoff into self-sustained growth”.4 One of the major concerns expressed by researchers in the field is that many low-income countries may not have the capacity to absorb efficiently the additional flows of development assistance.5 In this context, other analysts emphasize
1 See, for example, ESCWA, “The Millennium Development Goals in the Arab Region 2005” (E/ESCWA/SCU/2005/3/Rev.1).
2 Address by the former Secretary-General of the United Nations, Kofi Annan, to the St. Paul’s Cathedral event on the Millennium Development Goals (London, 6 July 2005), which is available at: www.un.org/News/Press/docs/2005/ sgsm9984.doc.htm.
3 This was first developed by Chenery and Strout in 1966 and has been used extensively over the past four decades by national and international institutions. H. Chenery and A. Strout, “Foreign assistance and economic development”, The American Economic Review, vol. 56, No. 4 (September 1966), pp. 149-179.
4 W. Easterly, “Can foreign aid buy growth?”, Journal of Economic Perspectives, vol. 17, No. 3 (Summer 2003), pp. 23-48.
5 D. Roodman, “Aid project proliferation and absorptive capacity”, Research Paper No. 2006/04 (Center for Global Development, January 2006).

2
potential disincentive effects on public institutions stemming from large and sustained inflows of foreign aid.6 In fact, substantial increases in the volume of foreign aid to a developing country can reduce incentives for domestic mobilization of resources and put less pressure on Governments to tackle existing inefficiencies in the delivery of public services. Moreover, several recent studies have indicated that substantially higher aid inflows create additional challenges in managing macroeconomic policies.7 These challenges include the possibility of a significant appreciation of the real exchange rate of recipient countries, which undermines the competitiveness of the export sector (the so-called “Dutch Disease”), as well as the fiscal uncertainty implied by a high dependency on external assistance, which makes long-term planning very difficult.8 Certainly, these challenges are even more pronounced in the context of very volatile and not fully predictable aid inflows. In recent years, research on the effectiveness of aid has also led to a major debate on whether foreign assistance should be mainly given to countries with good policies and sound institutions. A highly influential empirical study found that aid has only a positive effect on economic growth in developing countries with good fiscal, monetary and trade policies.9 While this result has been challenged by a number of subsequent studies, it was regarded by many multilateral and bilateral aid agencies as a justification for allocating a larger share of aid to countries with strong policies and institutions.10 In fact, the basic result of the influential empirical study has made its way into many speeches and documents on development assistance.11 In a slightly different form, the argument can also be found in the Millennium Declaration, which calls on the industrialized countries to “grant more generous development assistance, especially to countries that are genuinely making an effort to apply their resources to poverty reduction”.12 Given the risks associated with large aid inflows as well as potential limits to its impact on development, decision-makers in recipient countries must cooperate closely with the donor community in order to enhance the effectiveness of aid funds and, moreover, must strengthen domestic policies and institutions in ways that improve the investment and trade climate. First, scaling up aid creates a need for enhanced coordination of monetary and exchange rate policy with fiscal policy, particularly when the nominal exchange rate is fixed as is the case in the majority of Arab countries.13 Moreover, in order to avoid excessive dependency of national income and Government budget on foreign aid, Governments in aid recipient countries need to intensify efforts aimed at mobilizing domestic resources. Key measures in this regard include improving tax administration and collection, privatizing specific public enterprises and promoting domestic savings by reforming the financial sector. Additionally, more foreign private capital can
6 T. Moss, G. Pettersson and N. Van de Walle, “An aid-institutions paradox? A review essay on aid dependency and State building in sub-Saharan Africa”, Working Paper No. 74 (Center for Global Development, January 2006).
7 P. Heller, “‘Pity the finance minister’: Issues in managing a substantial scaling up of aid flows”, IMF Working Paper No. 05/180 (International Monetary Fund (IMF), September 2005); and R. Rajan and A. Subramanian, “Aid and growth: What does the cross-country evidence really show?” IMF Working Paper No. 05/127 (IMF, June 2005).
8 P. Heller and S. Gupta, “Challenges in expanding development assistance”, IMF Policy Discussion Paper No. 02/5 (International Monetary Fund (IMF), March 2002).
9 C. Burnside and D. Dollar, “Aid, policies, and growth”, American Economic Review, vol. 40, No. 9 (September 2000), pp. 847-868.
10 W. Easterly, R. Levine and D. Roodman, “New data, new doubts: A comment on Burnside and Dollar’s ‘Aid, policies, and growth’ (2000)”, NBER Working Paper No. 9846 (National Bureau of Economic Research (NBER, July 2003).
11 For various citations in the United States on this issue, see W. Easterly, “Can foreign aid buy growth?”, Journal of Economic Perspectives, vol. 17, No. 3 (Summer 2003).
12 The United Nations Millennium Declaration, which is available at: www.un.org/millennium/declaration/ares552e.htm.
13 Under a fixed exchange rate regime, massive aid inflows can create substantial inflationary pressure. The central bank and the ministry of finance of a given country are likely to have different strategies on how to respond to this pressure. P. Heller, “‘Pity the finance minister’: Issues in managing a substantial scaling up of aid flows”, IMF Working Paper No. 05/180 (International Monetary Fund (IMF), September 2005).

3
be attracted by increasing the quality of governance and institutions, which is particularly relevant in the Arab region where most countries perform poorly in terms of the ease of doing business.14 This issue of Economic trends and impacts examines the role foreign aid has played in Arab countries during the past three and a half decades. The Arab region includes both significant aid donor countries, especially Saudi Arabia, and major aid recipient countries in terms of absolute volumes, including Egypt, and relative to population size, including Jordan and Palestine. Over time, aid flows to the 22 Arab countries have fluctuated substantially, depending to a large extent on political and economic developments within and outside the region. This study presents a comprehensive overview of the trends of bilateral and multilateral aid flows to the region by highlighting, among others, the importance of inter-Arab aid, especially during the 1970s and 1980s; and by revealing the differences in the geographical allocation of aid between the various donor groups. In doing so, it provides important insights into the motives of donors for providing development assistance. In addition, an analysis of the correlation between aid per capita and income per capita illustrates the extent to which aid flows to the Arab region have targeted poor countries. This question is of particular importance given the lack of sufficient progress towards MDGs in the Arab LDCs. Within the context of the ongoing debate on the limits of absorptive capacities, the study takes a closer look at the trends in aid dependency in the Arab region in order to determine if, from a quantitative point of view, a massive scaling up of aid flows would result in excessive aid dependency of recipient countries. The assessment of ODA flows to the Arab region is complemented by a more detailed discussion of specific characteristics of aid received by the four ESCWA members, namely, Egypt, Jordan, Palestine and Yemen. These characteristics include the degree of concessionality, the share of tied aid to total aid, the amount of technical assistance received, and the distribution of aid between economic and social sectors. In addition, the study examines the volatility of aid relative to GDP in these countries and territories, and seeks to ascertain whether such aid was pro- or countercyclical. The four ESCWA members were selected to represent all of the sub-groups within the region. According to definitions by the World Bank, Egypt and Jordan are lower middle-income countries with diversified economic structures; and both countries have received significant inflows of aid during the past three decades. Palestine illustrates the case of territories in conflict that are highly dependent on foreign development assistance; and Yemen, which belongs to the group of Arab LDCs, is one of the countries in the region with the highest need for foreign aid. Given the main characteristics of ODA flow to Arab countries, the study examines the impact of aid on development in the region by means of a panel analysis. During the past decade, many empirical studies have tried to assess the relationship between aid and economic growth in low-income countries. Despite great progress in the methodologies used in these studies, a consensus on the actual growth impact of foreign aid has not yet been reached. However, after a period of strong pessimism during the 1990s, the findings of some recent studies have given rise to a more positive view towards aid given to developing countries.15 Against this backdrop, the study estimates a neo-classical growth model for low- and middle-income countries that incorporates some of the main elements of the new research approaches and isolates the effects of aid in the Arab region. This study is divided into four chapters as follows: (a) chapter I analyses the major trends in aid flows to the Arab region between 1970 and 2004, including, whenever possible, all 22 Arab countries; (b) chapter II takes a closer look at specific characteristics of aid flows to Egypt, Jordan, Palestine and Yemen; (c) chapter III presents a brief overview on the different strands in the aid-growth literature and then
14 The World Bank, Doing Business in 2006 (the World Bank, 2005).
15 M. Clemens, S. Radelet and R. Bhavnani, “Counting chickens when they hatch: The short term effect of aid on growth”, Working Paper No. 44 (Center for Global Development, November 2004); and S. Reddy and C. Minoiu, “Development aid and economic growth: A positive long-run relation”, DESA Working Paper No. 29 (Department of Economic and Social Affairs (DESA), September 2006).

4
estimates a panel model for low- and middle income countries by isolating the effect of aid on growth and social indicators for a set of Arab countries; and (d) chapter IV summarizes the main findings of the study and offers a number of policy recommendations aimed at enhancing the development impact of aid in Arab countries, especially in the light of accelerating progress towards MDGs.

5
I. AID FLOWS TO THE ARAB REGION This chapter examines the flow of ODA to Arab countries during the past three decades. It distinguishes between aid from Arab and non-Arab donor countries, documents major aid recipients and discusses the relative importance of foreign aid for selected economies in the region. Furthermore, it examines to what extent development aid has been channelled to the Arab countries with the lowest per capita income in the region.
A. DATA ON DEVELOPMENT ASSISTANCE Like most research conducted in this field, this study relies mainly on the ODA category of foreign flows given that it represents the most important statistical category used by the Development Assistance Committee (DAC) of the Organisation for Economic Co-operation and Development (OECD) that deals with development cooperation matters. Grants or loans to developing countries are classified as ODA if they satisfy the following three criteria: (a) they originate from the official sector in the donor country; (b) the financial terms are concessional;16 and (c) the primary motivation of the grant or loan is the promotion of economic development and welfare in the recipient country. In addition to financial flows, ODA can include technical cooperation and the administrative costs to provide this aid. Aid flows that are not primarily aimed at development, including loans extended for military purposes and loans with a grant element of less than 25 per cent, are excluded from ODA and are reported by OECD under the category “other official flows”.17 The database of OECD comprises two parts, namely: (a) the DAC database, which covers the overall flow of grants and loans to recipient countries, mainly developing countries and countries in transition eligible for aid; and (b) the Creditor Reporting System (CRS) database that provides more details on flows of ODA and such project-specific characteristics as tying status and sectoral allocations. Unlike the DAC database, the data given by the CRS database covers only bilateral and private flows from DAC members. It does not include aid from non-DAC countries, including Arab countries. The second main source of data used for this study is the Arab Unified Economic Report (AUER), which is published by the Arab Monetary Fund on an annual basis. The Report reviews economic developments in the Arab region and includes comprehensive data on aid provided and received by Arab countries. It is important to highlight that occasionally there are significant discrepancies between the two sources of data. This can be attributed to various reasons, including, most prominently, the OECD database excludes a number of Arab institutions or subregional development banks that operate in the Arab region and, consequently, it is narrower in coverage than the AUER and underestimates the reported inter-Arab aid flows; and the AUER reviews only nominal aid flows, whereas the OECD provides both real and nominal values. When examining the volume of aid over time, it is preferable to use real values whenever these can be found, particularly given the need to aggregate aid flows over a number of years. In this document, real flows (available only from the OECD source) are mostly presented in 2003 United States dollars that is in constant prices and exchange rates based on information obtained in the donor countries. OECD figures are therefore adjusted to cover both inflation between the respective year and 2003, and changes in the exchange rate between the currency of the donor country and the United States dollar over the same period. The OECD database provides information on aid flows from bilateral and multilateral sources, which represent the two groups of official aid agencies. Bilateral flows are provided directly by a donor country to an aid recipient and include transactions with national and international non-governmental organizations (NGOs). By contrast, multilateral flows are channelled via international development organizations, including such United Nations agencies as the United Nations Development Programme (UNDP) and the United Nations Relief and Works Agency for Palestine Refugees in the Near East (UNRWA); development
16 Within that context, a loan needs to have a grant element of at least 25 per cent.
17 Data on ODA are published by the OECD on an annual basis and are made available at: www.oecd.org/dac/stats/idsonline.

6
banks, including, for example, the World Bank; and such inter-governmental bodies as the European Commission.
B. BILATERAL AND MULTILATERAL AID FLOWS TO THE ARAB REGION This section studies the size of aid flows from different donor groups to the Arab region during the past three decades.18 Figure 1 depicts total bilateral and multilateral net ODA flows to the Arab region from 1970 to 2004 as reported by the DAC statistics online database of the OECD. Total aid flows to the region are divided into five components, namely: bilateral aid from Arab countries from the United States; from Japan; from the DAC countries in the European Union;19 and other donors, which includes all multilateral aid.
Figure 1. Real flows of net ODA to the Arab region (Millions of United States dollars)
0
2,000
4,000
6,000
8,000
10,000
12,000
14,000
16,000
18,000
1970 1975 1980 1985 1990 1995 2000
All other donors
Arab countries
United States
Japan
DAC EU members
Total donors
Source: Calculated by ESCWA, based on data from OECD. Notes: Official development assistance (ODA) covers loans with a grant element of 25 per cent or more; and net flows include interest payments but exclude loan principle payments. The category “all other donors” includes multilateral organizations.
18 Net ODA is the most conventionally used measure of aggregate aid and is used in most empirical studies. It is equal to gross ODA excluding principal payments on earlier concessional loans, albeit including interest payments. See, for example M. Clemens, S. Radelet and R. Bhavnani, “Counting chickens when they hatch: The short term effect of aid on growth”, Working Paper No. 44 (Center for Global Development, November 2004).
19 The DAC countries in the European Union comprise all 15 members of the Union before the expansion of 1 May 2004, namely: Austria, Belgium, Denmark, Finland, France, Germany, Greece, Ireland, Italy, Luxembourg, Netherlands, Portugal, Spain, Sweden and United Kingdom.
7
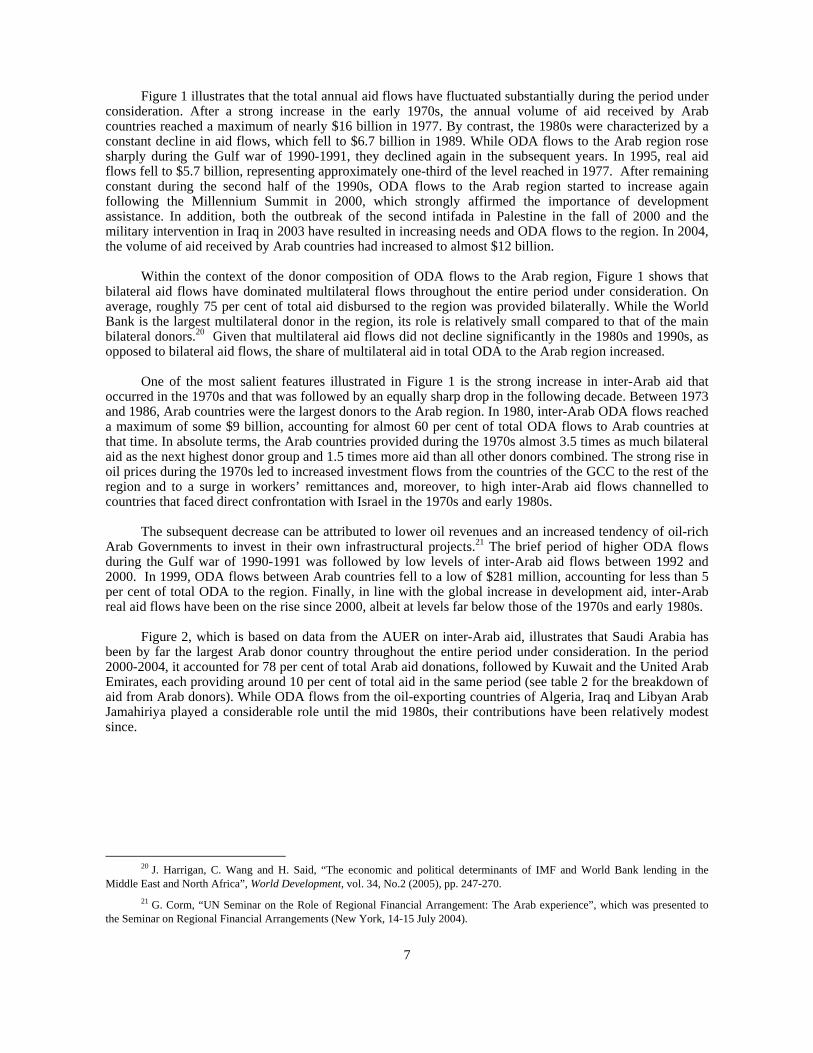
Figure 1 illustrates that the total annual aid flows have fluctuated substantially during the period under consideration. After a strong increase in the early 1970s, the annual volume of aid received by Arab countries reached a maximum of nearly $16 billion in 1977. By contrast, the 1980s were characterized by a constant decline in aid flows, which fell to $6.7 billion in 1989. While ODA flows to the Arab region rose sharply during the Gulf war of 1990-1991, they declined again in the subsequent years. In 1995, real aid flows fell to $5.7 billion, representing approximately one-third of the level reached in 1977. After remaining constant during the second half of the 1990s, ODA flows to the Arab region started to increase again following the Millennium Summit in 2000, which strongly affirmed the importance of development assistance. In addition, both the outbreak of the second intifada in Palestine in the fall of 2000 and the military intervention in Iraq in 2003 have resulted in increasing needs and ODA flows to the region. In 2004, the volume of aid received by Arab countries had increased to almost $12 billion. Within the context of the donor composition of ODA flows to the Arab region, Figure 1 shows that bilateral aid flows have dominated multilateral flows throughout the entire period under consideration. On average, roughly 75 per cent of total aid disbursed to the region was provided bilaterally. While the World Bank is the largest multilateral donor in the region, its role is relatively small compared to that of the main bilateral donors.20 Given that multilateral aid flows did not decline significantly in the 1980s and 1990s, as opposed to bilateral aid flows, the share of multilateral aid in total ODA to the Arab region increased. One of the most salient features illustrated in Figure 1 is the strong increase in inter-Arab aid that occurred in the 1970s and that was followed by an equally sharp drop in the following decade. Between 1973 and 1986, Arab countries were the largest donors to the Arab region. In 1980, inter-Arab ODA flows reached a maximum of some $9 billion, accounting for almost 60 per cent of total ODA flows to Arab countries at that time. In absolute terms, the Arab countries provided during the 1970s almost 3.5 times as much bilateral aid as the next highest donor group and 1.5 times more aid than all other donors combined. The strong rise in oil prices during the 1970s led to increased investment flows from the countries of the GCC to the rest of the region and to a surge in workers’ remittances and, moreover, to high inter-Arab aid flows channelled to countries that faced direct confrontation with Israel in the 1970s and early 1980s. The subsequent decrease can be attributed to lower oil revenues and an increased tendency of oil-rich Arab Governments to invest in their own infrastructural projects.21 The brief period of higher ODA flows during the Gulf war of 1990-1991 was followed by low levels of inter-Arab aid flows between 1992 and 2000. In 1999, ODA flows between Arab countries fell to a low of $281 million, accounting for less than 5 per cent of total ODA to the region. Finally, in line with the global increase in development aid, inter-Arab real aid flows have been on the rise since 2000, albeit at levels far below those of the 1970s and early 1980s. Figure 2, which is based on data from the AUER on inter-Arab aid, illustrates that Saudi Arabia has been by far the largest Arab donor country throughout the entire period under consideration. In the period 2000-2004, it accounted for 78 per cent of total Arab aid donations, followed by Kuwait and the United Arab Emirates, each providing around 10 per cent of total aid in the same period (see table 2 for the breakdown of aid from Arab donors). While ODA flows from the oil-exporting countries of Algeria, Iraq and Libyan Arab Jamahiriya played a considerable role until the mid 1980s, their contributions have been relatively modest since.
20 J. Harrigan, C. Wang and H. Said, “The economic and political determinants of IMF and World Bank lending in the Middle East and North Africa”, World Development, vol. 34, No.2 (2005), pp. 247-270.
21 G. Corm, “UN Seminar on the Role of Regional Financial Arrangement: The Arab experience”, which was presented to the Seminar on Regional Financial Arrangements (New York, 14-15 July 2004).

8
Figure 2. Amount of Arab aid donations, annual averages, 1970-2004 (Millions of United States dollars)
0
10,000
20,000
30,000
40,000
50,000
60,000
70-74 75-79 80-84 85-89 90-94 95-99 00-04
Other Arab countries
Rest of GCC
Saudi Arabia
Source: Calculated by ESCWA, based on the Arab Unified Economic Report (AUER). Note: Aid donations include those to non-Arab countries.
Box 1. The top two inter-Arab aid donors Among non-OECD countries, Saudi Arabia is by far the donor with the largest assistance programme. The total amount of net ODA given by Saudi Arabia, estimated at $1,734 million in 2004, accounted for 47 per cent of total non-DAC donors. Saudi Arabia is also the largest Arab donor followed by Kuwait and the United Arab Emirates. Almost all of the Saudi aid is disbursed bilaterally either directly by the Government or through the Saudi Fund for Development (Saudi Fund). Saudi Arabia has contributed generously to relieve critical humanitarian conditions in many countries and territories, including, more recently, Lebanon, Palestine and Sudan. The Saudi Fund’s commitments in 2005 amounted to $214 million, and the main recipient countries were Algeria, Ivory Coast, Ethiopia, Lebanon, Morocco and Turkey. These funds come primarily in the form of soft loans channelled directly to the Governments of the recipient countries. Between 1975 and 2005, the Saudi Fund disbursed a total of $6.83 billion to 71 countries, approximately half of which went to infrastructure and energy projects; 21 per cent of which was channelled to social projects, including health and education; and the remaining balance going to productive sectors, mainly agriculture and industry. According to the DAC database, Kuwait is the second largest donor in the Arab region. Kuwait’s ODA, which reached $209 million in 2004, is managed by the Kuwait Fund for Arab Economic Development (Kuwait Fund) that disburses the bilateral ODA to recipient countries and provides resources to multilateral agencies. In 2004, the Kuwait Fund loan commitments amounted to $372 million.a/ The main loan recipients were Bahrain, Bangladesh, China, Egypt and Mauritania; and those that received the highest volume of grants were Afghanistan, Bahrain and Palestine. Since its inception in 1961, the Kuwait Fund has provided a total sum of $13 billion, with more than half of this amount channelled to the Arab region. Similar to aid from the Saudi Fund, most of the Kuwait Fund loans, at 59.3 per cent, were given to transport, communication and energy infrastructural projects. The remaining amount went mainly to such productive sectors as agriculture and industry. The Kuwaiti aid programme also provided technical assistance and financial studies in relation to the activities financed in the projects. One of the common characteristics of aid given by Kuwait and Saudi Arabia is that it is channelled to economic and social infrastructural projects. While there is no conclusive empirical evidence on the effectiveness of aid from both countries, results of the projects implemented in recipient countries show that financing infrastructural projects has brought many indirect gains in terms of reduced costs, improved services and enhanced human capabilities in recipient countries. ______________________
a/ One reason for the variation between this amount and total net ODA extended by Kuwait according to OECD is that the former
covers loan commitments, while the latter covers aid disbursements after accounting for interest and repayments.

9
The United States and the DAC countries of the European Union are the other major donors to the Arab region as illustrated in figure 1. While aid flows from DAC countries have been relatively stable during the period under consideration, aid from the United States has varied substantially, depending mainly on political developments in the region and on security considerations. Since the 1970s, and especially after the first oil crisis of 1973-1974, the focus of United States foreign policy gradually shifted towards the Middle East. As a result, Arab countries began to receive increasing amounts of ODA from the United States, which, between 1974 and 1985, increased sevenfold to some $3 billion. After a substantial drop in the second half of the 1980s, this aid to the Arab region surged again during the Gulf war of 1990-1991. The main beneficiary country of these additional aid flows was Egypt. While these ODA flows to Arab countries dropped considerably in the 1990s, falling to a low of $745 million in 1997, there was a sharp increase between 2000 and 2004, which can be attributed to the following three main factors: (a) Jordan received substantially higher amounts of development aid from the United States after implementing the free trade agreement between the two countries in December 2001; (b) since 2001, the United States has significantly increased ODA flows to the conflict countries and territories of Palestine, Somalia and Sudan; and (c) the military intervention in Iraq led by the United States was accompanied by large inflows of humanitarian and development aid in 2003 and 2004 into that country. Aid flows to the Arab region from DAC countries of the European Union are mainly characterized by a gradual increase from 1972 to 1985 and a decrease in the second half of the 1990s, following broad scepticism on the effectiveness of development aid. In contrast to inter-Arab and United States aid, ODA from the DAC countries has not increased substantially during the past years, partly as a result of sluggish economic growth in most DAC countries. Examining the patterns of aid allocation across those countries reveals profound differences in the geographical distribution and the motives for giving aid. For example, France and the United Kingdom primarily support their former colonies with which they maintain close political and economic ties. By contrast, Sweden provides more aid to the poorest countries in the region, especially focusing on the conflict countries and territories of Palestine, Somalia and Sudan. While Germany gives relatively large amounts of ODA to the LDCs in the region, it also provides significant support to Egypt; and Italy is one of the few countries of the Union with a fairly balanced aid distribution pattern. Additionally, Japan represents a significant aid donor for the Arab region, whose share of total aid flows to the region increased substantially after the oil crisis of 1973-1974 from a meager 0.15 per cent to 4.1 per cent in 1978. During the 1980s, Japan’s annual aid to Arab countries remained at $400-500 million, corresponding to 4 per cent of total aid flows to the region. This was followed by a slight increase in Japanese ODA flows to Arab countries in the 1990’s, reaching a total share of 7-9 per cent. During that time, the main beneficiaries of Japanese aid were Egypt, Jordan and the Syrian Arab Republic. In 2004, Japan’s ODA to the region amounted to $840 million, with almost 80 per cent of that total disbursed to Iraq. This is a direct consequence of Japan’s participation in the war in Iraq led by the United States, and of Japan’s commitment to play a major role in the reconstruction of Iraq. The observed reduction in ODA to Arab countries in the 1990s can be partly attributed to an increased level of scepticism on the effectiveness of development aid during this period. Several empirical studies found that aid did not have a positive impact on investment and growth in developing countries.22 While such studies were subject to serious methodological weaknesses and their major result was not robust to alternative samples and specifications, many bilateral and multilateral aid donors became more selective in terms of giving grants and loans. Consequently, real levels of aid decreased globally; and, in 1994, OECD countries provided the smallest level of support relative to their own GDP in 20 years.23
22 P. Mosley, J. Hudson and S. Horrell, “Aid, the public sector and the market in less developed countries”, The Economic Journal, vol. 97 (September 1987), pp. 616-641; and P. Boone, “Politics and the effectiveness of foreign aid”, Discussion Paper No. 272 (Centre for Economic Performance, December 1995).
23 C. Burnside and D. Dollar, “Aid, policies, and growth”, American Economic Review, vol. 40, No. 9 (September 2000), pp. 847-868.

10
C. AID EFFORT From a global perspective, there is mounting concern over enormous shortfalls in the resources required to achieve the internationally agreed development goals, including MDGs. As a result, both the International Conference on Financing for Development (Monterrey, Mexico, 18-22 March 2002) and the World Summit on Sustainable Development in Johannesburg reiterated that economically advanced countries needed to allocate a minimum net amount of 0.7 per cent of their GNP for ODA to developing countries, of which 0.15 to 0.2 per cent of GNP needed to be earmarked for LDCs.24 The benchmark of 0.7 per cent was first codified in by the General Assembly in its resolution 2626 (XXV) of 24 October, which specified the mid-1970s as the deadline for reaching that target.25 By 2015, the year when MDGs are hoped to be achieved, the target will be 40 years old.
Figure 3. Ratio of net ODA to GNI in major donor countries, 2004 (Percentage)
Source: Calculated by ESCWA, based on AUER (2005); the World Bank, World Development Indicators (2006); and data from OECD. Notes: The United Nations target refers to the commitment made by the international community in 1970 to give 0.7 per cent of the GNP of rich countries as ODA. Gross national income (GNI) is GDP plus net compensation of employees and property income from the rest of the world; and GNI is GNP after introducing a terms-of-trade index. Against the backdrop of the benchmark of 0.7 per cent, figure 3 presents ODA as a share of GNI in 2004 for some of the most important DAC donor countries, together with the respective figures for the top three inter-Arab ODA donors, namely, Saudi Arabia, Kuwait and the United Arab Emirates. Interestingly, the Nordic countries top the list of DAC donors with the highest ODA to GNI ratio, namely, Norway (at 0.87 per cent), Denmark (at 0.85 per cent) and Sweden (at 0.78 per cent). The only other DAC countries to exceed the United Nations target in 2004 were Luxembourg (at 0.83 per cent) and the Netherlands (at 0.73 per cent).
24 Gross national product (GNP), which the OECD used until 2000, has since been replaced by the similar index of gross national income (GNI), which includes a terms-of-trade adjustment.
25 General Assembly resolution 2626 (XXV) dated 24 October 1970 on the international development strategy for the second United Nations development decade, para. 43.
United Nations target
0 0.1 0.2 0.3 0.4 0.5 0.6 0.7 0.8 0.9 1
NorwayDenmark
LuxembourgSaudi Arabia
KuwaitSweden
NetherlandsFrance
United KingdomGermany
JapanUnited States
United Arab EmiratesItaly
ODA/GNI

11
Besides providing high ODA relative to GNI, the Nordic development assistance programmes are also known for giving more aid to countries with democratic structures, for not penalizing poor trade policies, and for not supplying political allies with more aid.26 At the lower end of the spectrum are Italy (at 0.15 per cent) and the United States (at 0.17 per cent).27 In general, the ODA to GNI ratios for smaller European countries are much higher than the corresponding figures for large DAC member countries. As a result of the limited aid efforts of these large economies, total flows from DAC member countries in 2004 accounted only for 0.26 per cent of their combined GNI, up from 0.25 per cent in 2003, 0.23 per cent in 2002, and 0.22 per cent in 2001. According to figures from the Arab Unified Economic Report, aid extended by Saudi Arabia (at 0.8 per cent of GNI) and Kuwait (at 0.8 per cent of GNI) in 2004 has been substantial, surpassing the benchmark of 0.7 per cent and exceeding the shares of most DAC member countries.28 Based on data from OECD, the ODA to GNI ratio for the United Arab Emirates in 2004 was 0.17 per cent.
D. DISTRIBUTION OF AID AMONG ARAB RECIPIENTS Figure 4 shows the geographical distribution of total aid flows from non-Arab and Arab donors over the period 1970-2004.
Figure 4. Distribution of aid to Arab countries, 1970-2004
(Percentage)
A. Total real net ODA from non-Arab donors
Comoros1%
Djibouti2%
Egypt34%
Jordan6%
Iraq5%
Bahrain0%
Palestine4%
Somalia6%
Sudan10%
Algeria5%
Oman0% Morocco
9%
Lebanon2%
Mauritania4%
Yemen5%
Tunisia6%
Syrian Arab Republic3%
26 S. Gates and A. Hoeffler, “Global aid allocation: Are Nordic donors different?”, Working Paper Series No. 234 (Centre for the Study of African Economics, 2004).
27 However, the United States continues to be the major donor in terms of disbursed volume.
28 OECD reports lower ODA flows than the AUER for both Saudi Arabia and Kuwait in 2004, thereby resulting in lower ODA to GNI ratios of 0.69 per cent for Saudi Arabia and 0.35 per cent for Kuwait.

12
B. Total real net ODA from Arab donors
Mauritania2%
Lebanon3%Morocco
8%Oman
3%
Algeria1%
Sudan5%
Somalia2%
Palestine1%
Bahrain4%
Iraq0%
Jordan16%
Egypt22%
Djibouti1%
Comoros0%Tunisia
1%Yemen
7%
Syrian Arab Republic24%
Source: Calculated by ESCWA, based on data from OECD. Notes: A total of five Arab countries, namely, Kuwait, Libyan Arab Jamahiriya, Qatar, Saudi Arabia and United Arab Emirates, did not receive significant amounts of development aid during the period under consideration and were consequently excluded from the figures. Figures of 0 per cent result from the rounding of amounts smaller than 0.5 per cent. Figure 4 reveals several major differences in the geographical allocation of aid between Arab and non-Arab donors. First, the Syrian Arab Republic has been the major recipient of ODA from Arab donors, at 24 per cent of total aid. By contrast, it has only obtained 3 per cent of total aid to the region from non-Arab donors. Similarly, Jordan has received a substantially higher share of Arab aid (at 16 per cent) than of non-Arab aid (at 6 per cent). The opposite pattern applies to the countries of the Maghreb, namely, Algeria, Morocco and Tunisia; to Arab LDCs in Africa, namely, Comoros, Djibouti, Mauritania, Somalia and Sudan; and to the conflict countries and territories of Iraq and Palestine. Each of these groups has received a much higher share of total aid from non-Arab donors than from Arab donors. Finally, Egypt has been the major aid recipient country in the Arab region, receiving a particularly high share of total non-Arab aid to the region (at 34 per cent). Table 1 provides a closer look at the donor distribution from the perspective of individual recipients. The United States only dominates aid flows to Egypt and Iraq, where it has provided 38 and 48 per cent of total ODA, respectively, during 1970-2004; and has been a comparatively minor donor in terms of aid flows to LDCs relative to DAC members in Europe and Arab donors. By contrast, countries of the EU have been strong supporters of Arab LDCs, in addition to being main donors to the countries of the Maghreb. As mentioned above, Arab donors have provided the largest share of development aid to Jordan, Yemen and, especially, the Syrian Arab Republic, which received 84 per cent of its total aid from Arab countries. Multilateral agencies, which account for the major part of aid flows under the category “other donors”, play a main role in development assistance to LDCs and countries and territories in conflict, with the exception of Iraq. In the case of Palestine, almost half of total aid has come from multilateral agencies, most notably UNRWA.

13
TABLE 1. CUMULATIVE NET ODA TO SELECTED ARAB RECIPIENTS BY MAJOR DONORS, 1970-2004
United States
DAC members of
the EU Japan Arab donors Other donorsa/ All donors
(Millions
of $) (%)
(Millions
of $) (%)
(Millions
of $) (%)
(Millions
of $) (%)
(Millions
of $) (%)
(Millions
of $)
Algeria (19) (0) 8 123 71 114 1 829 7 2 353 21 11 401
Bahrain 0 0 47 1 19 0 3 944 97 64 2 4 074
Comoros 12 1 1 067 51 60 3 241 11 732 35 2 112
Djibouti 98 2 2 328 59 169 4 687 17 689 17 3 971
Egypt 38 489 38 17 606 17 4 957 5 30 128 30 9 802 10 100 982
Iraq 5 308 48 2 255 20 1 186 11 296 3 2 048 18 11 092
Jordan 5 248 17 3 185 10 1 868 6 17 842 56 3 605 11 31 748
Lebanon 703 8 1 727 21 55 1 3 508 42 2 296 28 8 289
Libyan Arab
Jamahiriya 0 0 355 53 6 1 3 0 304 46 668
Mauritania 462 5 2 729 27 441 4 2 661 26 3 889 38 10 182
Morocco 1 820 6 11 375 40 1 193 4 9 356 33 4 753 17 28 497
Oman 247 6 88 2 130 3 3 657 87 104 2 4 227
Palestine 1 135 12 1 926 21 254 3 1 576 17 4 471 48 9 362
Somalia 2 647 17 4 694 30 181 1 2 556 17 5 324 35 15 402
Sudan 3 400 13 7 013 26 811 3 6 389 24 9 368 35 26 981
Syrian Arab
Republic 547 2 1 584 5 1 157 3 27 968 84 2 050 6 33 307
Tunisia 677 5 7 406 55 793 6 1 323 10 3 340 25 13 539
Yemen 971 5 3 339 18 839 4 9 028 48 4 663 25 18 840
Source: Calculated by ESCWA, based on data from OECD. Notes: Percentages in the table represent the share of various donors to total aid for each of the respective recipient countries. Kuwait, Qatar, Saudi Arabia and United Arab Emirates are major Arab donors and were therefore excluded in the table. The top five donors of ODA to Arab countries in 2003-2004 are provided in annex table 4. a/ Other donors includes multilateral organizations. Overall, the established patterns on the geographical distribution of aid provided in table 1 lead to a number of conclusions concerning the motives of donors in providing assistance to developing countries in general and to Arab countries in particular. Recent studies have indicated that factors other than economic necessity or effective use of aid have played a key role in determining the volume of aid that a country receives.29 Generally, these studies have distinguished between donations motivated by past colonial ties, foreign policy considerations, policy performance of recipient countries, trade promotion, and recipient’s needs.
29 A. Alesina and D. Dollar, “Who gives foreign aid to whom and why?”, NBER Working Paper Series No. 6612 (National Bureau of Economic Research (NBER), June 1998); and M. McGillivray, “Aid effectiveness and selectivity: Integrating multiple objectives into aid allocations”, Discussion Paper No. 2003/71 (United Nations University and World Institute for Development Economics Research (WIDER), October 2003).

14
Box 2 Emergency aid to Lebanon The war of July-August 2006 in Lebanon left deep repercussions on all facets of Lebanese life. While a price tag cannot be placed on the losses in terms of lives, the overall cost of damage to the infrastructure, livelihoods and losses of business opportunities and profits are expected to run into billions of dollars. According to the latest estimate by the Ministry of Finance, the direct costs of the war stand at $2.8 billions. During the war, Lebanon received various forms of humanitarian and developmental aid from many sources. Donations and humanitarian aid in the form of food and medical supplies were channelled to devastated areas and to other areas where thousands of people were displaced by the war. This aid was provided by most Arab countries, principally, Egypt, Iraq, Jordan, Kuwait, Qatar, Saudi Arabia and United Arab Emirates, and by non-Arab major donors, the United Nations, the Red Cross and other international NGOs. Technical assistance was also provided for de-mining, cleaning oil-spills, rebuilding roads and bridges, and restoring livelihoods. Aid and other forms of financial backing significantly supported Government measures aimed at absorbing the financial crisis caused by the war. The financial sector experienced mounting pressure owing to heightened uncertainty and loss of confidence. According to a recent report by the Ministry of Finance, private deposits went down by $3 billion (3.55 per cent) during July 2006.a/ The same report mentioned that Saudi Arabia provided $1 billion in a soft loan deposited at the Central Bank and pledged another $500 million for reconstruction. Similarly, Kuwait deposited $500 million and donated $300 million for reconstruction. The flow of funds from both countries helped to restore confidence in the economy and to back the Central Bank’s reserves of foreign currency, as reflected by reduced pressure on the exchange rate and on the prices of Lebanese bonds and stocks. Moreover, at the donors’ conference held in Stockholm, donor countries pledged more than $900 million in aid for Lebanon’s recovery, comprised 87 per cent in grants and the remaining in loans. Arab countries and Arab multilateral organizations were among the top donors, with total pledges amounting to $440.3 million. Three forms were proposed for the donation of aid, namely: (a) sponsorship of projects; (b) cash payments to the Government account; and (c) in-kind contributions.b/ Equally, the Paris III Conference of Donors (25 January 2007) succeeded in attracting substantial aid to Lebanon. Without the various forms of aid received by Lebanon, the implementation of any recovery plan could fall very short from meeting the overall requirements of reconstruction and compensation for losses. ____________________ a/ Ministry of Finance in Lebanon, “Impact of the July offensive on the public finances in 2006” (30 August 2006).
b/ “Government details Stockholm conference donor commitments”, The Daily Star (1 October 2006).
Based on the different patterns of the geographical distribution of aid, the following conclusions can be drawn: (a) For Arab donors, geographical and cultural proximity appear to be important factors in determining the allocation of development aid. The non-GCC ESCWA members, namely, Egypt, Iraq, Jordan, Lebanon, Palestine, Syrian Arab Republic and Yemen, have received 80 per cent of total Arab aid to the region, but only 59 per cent of total aid from non-Arab donors; (b) Development aid from DAC countries in the EU seems to be motivated more by development considerations than aid from the United States. This is illustrated by the fact that for LDCs in the region and, with the exception of Iraq, countries and territories in conflict the share of ODA received from EU donors is much larger than the corresponding share from the United States; (c) The distribution of aid by the United States to the Arab region appears to be mainly determined by geopolitical factors and economic interests, rather than development purposes as shown by the relatively low support to such LDCs as Comoros, Djibouti and Yemen; and by the high development assistance to Egypt, Iraq and Jordan. In this context, it is worth noting that the mission statement of USAID speaks of a twofold purpose of foreign assistance, namely: “furthering America’s foreign policy interests in expanding democracy and free markets while improving the lives of the citizens of the developing world”.30 A recent
30 See the official website of USAID, which is available at: www.usaid.gov/about_usaid/.

15
example of this foreign aid policy is the case of Morocco, which has been praised by United States officials for undertaking political and economic reforms and for assisting in combating terrorism;31 (d) The relatively high aid flows from countries of the EU to Morocco, Tunisia, and, especially, Algeria, suggest that past colonial ties continue to play a significant role in the aid allocation for this donor group;32 (e) Multilateral agencies giving aid to the region are mainly motivated by development considerations as is evident in their high share in total aid contributions to LDCs in the region and Palestine. This result confirms the findings in several other studies that claim that bilateral aid is more susceptible to donor interests than aid from multilateral agencies.33
E. AID AND INCOME LEVELS
This section sheds further light on the relationship between aid and income levels in the Arab region. Evidence in the previous section suggested that donors were only partly motivated by humanitarian and developmental considerations; and that the countries with the highest need for development assistance, namely, the LDCs in the region, had received a relatively small share of total aid flows to the Arab region during the past three decades. In this section, the analysis is taken one step further by examining the correlation between income per capita and development aid per capita for selected Arab countries. As emphasized in the empirical literature on the developmental impact of aid, the dynamic relationship between ODA and national income is likely to be characterized by mutual causality. Income levels are expected to be a determinant of aid flows, while aid should promote economic growth, thereby leading to higher income levels. A thorough empirical analysis of the growth and development effects of ODA in the Arab region during the past decades is provided in chapter III. By contrast, this section applies a simple correlation approach to examine the extent to which donors have focused their assistance on the poorest countries in the region. Figure 5 plots average ODA per capita against average GNI per capita in the Arab region for three consecutive periods, namely, 1980-1989, 1990-1999 and 2000-2004, in order investigate any changes over time of the relationship between aid and income levels. The figure shows that aid flows to the Arab region have not targeted the countries with low income per capita. On the contrary, during the 1980s and 1990s, relatively more development assistance was given to countries with higher per capita income. The 1980s were characterized by a significantly positive correlation between average income per capita and average ODA per capita in the sample of 12 Arab countries. When Bahrain, which had the highest average income per capita and the second highest average ODA per capita level during that decade, is removed from the sample, the two variables still show a weak positive correlation. In the 1990s, while the regression line again slopes upwards, the relationship between average income per capita and average ODA per capita is weaker than for the previous decade. Finally, the period 2000-2004 shows a slightly negative correlation between the two variables, implying that in recent years a higher share of total ODA to the Arab region was extended to relatively poor countries. However, this does not mean that on average more ODA per capita was given to the Arab LDCs during 2000-2004 than in previous periods. By contrast, the majority of the poorest countries in the region have received less ODA per capita in absolute terms than during the 1980s and 1990s. What caused the observed change in the correlation between GNI per capita and ODA per capita is the fact that average ODA per capita to the relatively richer countries declined more than average ODA per capita to the poorest countries. 31 Parallel to the implementation of a free trade agreement between the two countries in 2004, Morocco was declared an eligible candidate for funding under the Millennium Challenge Account. Consequently, United States aid to Morocco in fiscal year 2005 was almost five times higher than aid in fiscal year 2004.
32 Alesina and Dollar identified colonial ties as a major determinant of aid allocation and highlighted France as a country that primarily gives aid to former colonies tied by political alliances. A. Alesina and D. Dollar, “Who gives foreign aid to whom and why?”, NBER Working Paper Series No. 6612 (National Bureau of Economic Research (NBER), June 1998).
33 A. Maizels and M.K Nissanke, “Motivations for aid to developing countries”, World Development, vol. 12, No. 9, (September 1984), pp. 879-900.

16
Figure 5. Relationship between ODA per capita and GNI per capita in selected Arab countries, 1970-2004
(Constant United States dollars)
Source: Calculated by ESCWA, based the World Bank, World Development Indicators (2006); and on data from OECD.
Notes: The data represent annual averages for the specified periods.
Owing to limitations in the availability of GNI per capita data, the country samples underlying the figures differ slightly. Kuwait, Qatar, Saudi Arabia and United Arab Emirates are major Arab donors and were excluded in the figure.
2000-2004
- 50
100
150
200
250
300
350
400
- 2,000 4,000 6,000 8,000 10,000 12,000
GNI per capita
OD
A p
er c
apita
Eg
Al Tu Om
LbMa
Dj Jo Bh
Pl
Su Mo
Sy
Co
Ye
1990-1999
-
50
100
150
200
250
- 2,000 4,000 6,000 8,000 10,000 12,000
GNI per capita
OD
A p
er c
apita
Al Tu
Co Ma
Dj
Lb
Jo
Pl
Om
Bh
Sy
Mo
Eg
Ye
Su
1980-1989
-
100
200
300
400
500
600
- 1,000 2,000 3,000 4,000 5,000 6,000 7,000 8,000 9,000
GNI per capita
OD
A p
er c
apita
Om
Bh
Sy
Al
Jo
Co
Tu Eg
Mo So
Ma
Su

17
Given the above-mentioned mutual causality between development aid and income, there is a need for caution. In figure 5, five- and ten-year averages of ODA per capita and income per capita data were used. Generally, these time spans are feasibly long enough for ODA to have a substantial impact on income levels, which would require a different interpretation of the results. However, based on the evidence in the previous sections, it seems unlikely that a large part of the positive correlations for the two variables found for the 1980s and 1990s could be explained by positive growth effects of ODA flows. In order to confirm this, a second set of correlation coefficients was derived. For the entire period under consideration, three-year averages of ODA flows were plotted against income per capita lagged by one period with respect to the first year of the three-year average. The resulting figures converge with those presented in figure 5 for longer time averages. Overall, it can be concluded that ODA flows to the Arab region during the past 25 years were not focused on low-income countries. The reasons for this are as follows: (a) Low income per capita is only one dimension of poverty and should not therefore be the main criterion in deciding the allocation of aid. The aid agencies of many donor countries, including, for example, those of the Nordic countries, base the distribution of development aid on a broad understanding of poverty and vulnerability. Consequently, a large part of aid is given to countries in conflict or for emergency relief even though these countries may have a significantly higher per capita income than LDCs; (b) Donor behaviour is not always driven by developmental interests. It has been documented time and again that some bilateral donors predominantly follow geo-strategic and/or commercial purposes, which can provide a clear bias against very poor countries; (c) A significantly low level of income per capita is often associated with poor quality of institutions. The increasing focus of development assistance on countries with relatively good policies and institutions could therefore have contributed to the observed bias against the poorest countries. Given that Arab LDCs are not on track to meeting MDGs by 2015, future aid flows to the region must focus more on these countries. Faster progress towards MDGs in the poorest countries of the Arab region can only be achieved if the international donor community provides significantly higher development aid while donors and recipients cooperate closely to ensure a more effective use of the resources.
F. AID DEPENDENCY IN SELECTED ARAB COUNTRIES There are two closely related concerns about rapidly increasing aid flows to developing countries, namely: potential limits for these countries to absorb efficiently additional aid flows, and increased dependency of national incomes and Government budgets on foreign aid. The discussion on the limits of absorptive capacities is linked to possible disincentive effects of large and sustained aid inflows on public institutions and to macroeconomic disturbances caused by these inflows, including the “Dutch Disease”.34 As demonstrated in a number of studies, large inflows of aid can reduce incentives for domestic mobilization of resources and put less pressure on Governments to tackle existing inefficiencies in the delivery of public services.35 Large aid inflows may also lead to a considerable appreciation of the recipient countries’ real exchange rate, which in turn negatively affects the competitiveness and the growth of the external sector. This effect is known in the literature as “Dutch
34 Rajan and Subramanian investigate the empirical relevance of the “Dutch Disease” effect on substantive aid inflows. R. Rajan and A. Subramanian, “What undermines aid’s impact on growth” IMF Working Paper No. 05/126 (International Monetary Fund (IMF), June 2005).
35 P. Heller, “‘Pity the finance minister’: Issues in managing a substantial scaling up of aid flows”, IMF Working Paper No. 05/180 (International Monetary Fund (IMF), September 2005).

18
Disease”. Indeed, there is strong evidence that past aid has often undermined the competitiveness of labour-intensive and exporting sectors, thereby offsetting the beneficial effect of aid on growth.36 Additionally, aid flows that are highly volatile and not fully predictable can create major challenges for recipient Governments to budget appropriately and will make long-term planning very difficult.37 Over the past years, empirical studies have increasingly taken account of potential limits to the absorptive capacities by including diminishing returns to aid when examining the impact on economic growth.38 Diminishing returns imply that at some point, which is referred to as the saturation point, the incremental impact of an additional dollar of aid will be zero. Individual case studies and cross-country estimates suggest that this saturation point varies substantially across recipient countries and depends on a large number of factors, including, among others, the quality of institutions and aid policies, the type of aid and the degree of harmonization among donors.39 While saturation points provide broad guidance for an upper bound of aid allocations, it may not be reasonable from a donor’s perspective to give aid up to that point. Furthermore, if the Government in the recipient country has a weak capacity to mobilize domestic revenues, even modest ODA to income ratios could imply an excessive fiscal dependency on foreign aid. Accordingly, a recent reference document by OECD classifies those countries with a net ODA to GNI ratio above 9 per cent as highly dependent on aid.40 Figure 6 illustrates the degree to which selected Arab countries have depended on foreign aid during the past three decades, measured by the ratio of ODA inflows to GNI.41 The countries of the GCC and the Libyan Arab Jamahiriya are again excluded given the comparatively insignificant aid flows to these countries; and Somalia is excluded owing the lack of comprehensive and reliable data. Figure 6 presents average ODA to GNI ratios of 14 Arab countries for the periods 1970-1979, 1980-1989, 1990-1999 and 2000-2004. In the majority of the countries, the ratio is currently significantly lower than it was in the 1970s and 1980s. This comes as no surprise given the very high real aid flows to Arab countries during the second half of the 1970s and the early 1980s. With the exception of Palestine and Mauritania, most Arab countries in the sample have a low or modest ratio of aid dependency, ranging from 1 to 11 per cent. The reduction in aid dependency has been particularly pronounced in Egypt and Jordan, as both countries have achieved relatively high growth rates in the recent past and experienced declines in the average volume of ODA. For the period 2000-2004, high degrees of aid dependency can be observed for some Arab LDCs and countries in conflict. In Comoros and Djibouti, ODA to GNI ratios have fallen considerably over the past two decades and are now only slightly above 10 per cent, mainly owing to
36 Heller points out that a high fiscal dependency on foreign aid is likely to restrict the political autonomy of the recipient country and development priority issues may be tailored to the concerns and interests of the main donors. Ibid.
37 For example, when aid commitments for a given year are higher than actual disbursements. See P. Heller and S. Gupta, “Challenges in expanding development assistance”, IMF Policy Discussion Paper No. 02/5 (International Monetary Fund (IMF), March 2002).
38 H. Hansen and F. Tarp, “Aid and growth regressions”, Journal of Development Economics, vol. 64 (2001), pp. 547-570; and C. Dalgaard, H. Hansen and F. Tarp, “On the empirics of foreign aid and growth”, Working Paper No.13 (Economic Policy Research Unit, September 2003).
39 Clemens and Radelet summarize existing evidence on this topic and conclude that the saturation point of aid possibly ranges between 15 and 45 per cent of GDP. M. Clemens and S. Radelet, “Absorptive capacity: How much is too much?” in Challenging foreign aid: A policy maker’s guide to the Millennium Challenge Account (Center for Global Development, 2003), chapter 7.
40 Organisation for Economic Co-operation and Development (OECD), “Harmonizing donor practices for effective aid delivery”, DAC Guidelines and Reference Series (OECD, 2003).
41 Owing to the lack of a comprehensive and reliable set of data on national budgets, aid dependency is measured only by the ratio of ODA inflows to GNI.

19
decreases in aid flows to these countries. In Mauritania, the average ratio has remained largely constant since the 1970s, at a level of some 20 per cent. In Palestine, the escalation of violence in 2000 and the Israeli policy of closures have led to a serious deterioration of living conditions over the past few years. With GNI declining sharply, the territories have become increasingly dependent on foreign aid flows. The average ODA to GNI ratio over the period 2000-04 was at an alarming level of 30 per cent and is likely to have increased further in 2005. In Iraq, the relatively low ODA to GNI ratio of 7 per cent for the period 2000-2004 does not reflect accurately the recent increase in aid dependency. In 2004, the ODA to GNI ratio was approximately 23 per cent, up from less than 1 per cent in 2000.
Figure 6. Ratio of ODA to GNI in selected Arab countries
Source: Calculated by ESCWA, based on data from OECD.
0
0.1
0.2
0.3
0.4
0.5
0.6
Alg
eria
Com
oros
Djib
outi
Egy
pt
Ira q
Jord
an
Leb
anon
Mau
rita
nia
Mor
occo
Pale
stin
e
Suda
n
Syri
anA
rab
Rep
ublic
Tun
isia
Yem
en
Tot
al O
DA
/GN
I
70-79
80-89
90-99
00-04

20
II. CHARACTERISTICS OF AID FLOWS TO SELECTED ESCWA MEMBERS
Development aid is governed by terms and conditions which affect to a great extent the way it is dispensed in a recipient country. Part of such aid is given in the form of soft loans, which must be repaid within a given frame of time. Sometimes aid to a recipient country is conditioned by the procurement of goods and services from the donor country. Moreover, aid donations are often volatile, not fully predictable and pro-cyclical.42 The characteristics of aid directly affect Government financial planning in recipient countries, and have strong implications for designing and implementing developmental projects. Recipient countries, particularly LDCs, rely to a great extent on foreign aid when implementing development programmes and specific projects. Indeed, the provision of governmental services, which is partly financed by aid funds, has often been disrupted when part of the aid stopped flowing to recipient countries.43 This chapter discusses some of the relevant characteristics of aid, including the degree of concessionality, the tying status, the sectoral distribution, and the degree of volatility and cyclicality. Owing to limitations in scope and space, this discussion is focused on four ESCWA members, namely, Egypt, Jordan, Palestine and Yemen, which were selected in order to represent all the subgroups within the ESCWA region. During 1974-2004, Egypt and Jordan were among the main recipients of both Arab and non-Arab aid. Both were chosen to represent lower middle-income countries with diversified economies. The choice of Palestine was to illustrate the case of a country or territory in conflict that is highly dependent on foreign aid. Finally, Yemen represents the case of an Arab LDC that has received relatively small amounts of ODA over the past decades.
A. OVERVIEW OF AID TO SELECTED ESCWA MEMBERS Figure 7 illustrates the trends in ODA per capita since 1970 in the four ESCWA members under study. ODA to Jordan has been much higher in per capita terms than aid to Egypt and Yemen, particularly during the 1970s and 1980s. In all three countries, aid per capita levels have declined considerably during the past decades, whereas data for Palestine show an increasing trend since the early 1990s. While Egypt was the largest Arab recipient of aid flows in absolute terms in the period 1970-2004, ODA per capita levels are relatively low and have declined sharply from their peak of $179 in 1975 to a low of $15 in 2003. The fall is in line with the general decline in aid flows to the region in the 1980s and the 1990s. In per capita terms, Jordan received the highest ODA in the region until the early 1990s, reaching a peak of $1,272 in 1979. ODA per capita was particularly high until the mid-1980s mainly owing to large aid flows from Arab countries. During the Baghdad Conference in 1979, a group of Arab countries promised to pay Jordan $1.25 billion per year for the coming decade. The donation was motivated by political reasons to support frontline countries with Israel.44 The actual amount disbursed declined over time, which explains the reduction in ODA per capita to $121 in 1989. Between 1990 and 1992, ODA per capita grew slightly despite the increase in the population of Jordan as a direct consequence of the Gulf war during that period.
42 A. Bulir and A.J Hamann, “Volatility of development aid: From the frying pan into the fire?”, IMF Working Paper No. 06/065 (IMF, March 2006); and S. Pallage and M. Robe, “Foreign aid and the business cycle”, Review of International Economics, vol. 9 (November 2001).
43 R. Vargas Hill, “Assessing rhetoric and reality in the predictably of aid”, Human Development Report 2005 (United Nations Development Programme (UNDP), 2005).
44 Library of Congress Country Studies, which is available at: http://memory.loc.gov/cgibin/query/r?frd/cstdy: @field(DOCID+jo0059).

21
Palestine received more ODA following the signature of the Oslo Accords in 1993.45 ODA per capita grew notably in 2001 and 2002 to more than $500 as a result of greater aid flows to relieve the critical humanitarian conditions brought by Israel’s attacks against the second intifada. This caused a shift in aid flows from medium- and long-term development projects to emergency and humanitarian aid.46 A significant part of aid was also used for budgetary purposes of the Palestinian Authority, thereby resulting in a high aid dependency ratio in Palestine.
Figure 7. Annual ODA per capita in Egypt, Jordan, Palestine and Yemen, 1970-2004 (Constant 2004 United States dollars)
ODA per capita
0
200
400
600
800
1000
1200
1400
1970
1972
1974
1976
1978
1980
1982
1984
1986
1988
1990
1992
1994
1996
1998
2000
2002
2004
USD
Egypt
Jordan
Yemen
Palestine
Source: Calculated by ESCWA, based on data from OECD.
Notes: In the case of Palestine, ODA per capita data are not available prior to 1993.
The real net ODA data for Egypt, Jordan, Palestine and Yemen for 1970-2004 are provided in annex table 5. ODA per capita in Yemen has basically moved in line with the declining overall trend. It decreased from $170 in 1976 to $12 in 2004. Despite its status as a LDC, aid flows to Yemen have fallen in absolute terms from their levels in the 1970s and 1980s, which can be partly attributed to a high population growth rate of more than 3 per cent per year during the period 1970-2004. Multilateral donors have also scaled down the amount of aid given to Yemen given that some of their aid programmes failed to achieve the expected results.
B. DEGREE OF CONCESSIONALITY According to DAC terminology, ODA comprises official flows with a developmental purpose in the form of grants, including those tied to technical assistance, and highly concessional loans with a maturity exceeding one year. Loans are defined as highly concessional when their grant element or the subsidy portion implicitly included in the loan relative to the loan’s face value is at least 25 per cent. Under DAC, grant elements are computed under special assumptions, including, chiefly: (a) the loan interest rates used in computing the interest charges are assumed constant throughout the life of the loan; and (b) a discount rate of 10 per cent is arbitrarily fixed and used to represent the opportunity cost in all current value calculations. Presently, there is a wide consensus that development aid, especially to highly indebted low-income countries, needs to be given primarily in the form of grants rather than loans. This view was expressed, for
45 World Health Organization, Regional Office for the Eastern Mediterranean, “Country cooperation strategy for WHO and the Occupied Palestinian Territory, 2006-2008” (WHO, 2006).
46 Ibid.

22
example, in the Monterrey Consensus on Financing for Development. Advocates of grants question the use of loans in development cooperation for a variety of reasons. Most importantly, there is mounting concern that grants would mainly contribute to an increase in already unsustainable levels of external indebtedness of high-aid recipients. Furthermore, grants can be disbursed more easily than loans, are more predictable and focus more on developmental objectives. However, switching to grants as the primary instrument of development financing still falls short of worldwide approval. There remain some strong arguments in favour of a mix between grants and loans, including as follows: (a) loans may prove to be “more responsible” money, which is less likely to be squandered given that it discourages unproductive, rent-seeking activities and strengthens ownership by the partner countries; (b) grants are more likely to reduce the incentives of the recipient Government to increase the domestic tax base and to promote national savings, thereby possibly leading to greater aid dependency; and (c) a country that is labelled as “grants-only” could find it more difficult to attract alternative sources of financing, including foreign direct investment, since the absence of official loans could be taken as a negative signal. Regarding the degree of aid concessionality in the sample of ESCWA members under consideration, figure 8 illustrates that development assistance in the form of grants relative to loans has gained prominence in recent years. Much of this increase is explained by the growing weight of technical cooperation and budget support.
Figure 8. Concessionality of ODA commitments to Egypt, Jordan, Palestine and Yemen, 1970-2004
Source: Calculated by ESCWA, based on data from OECD.
Notes: In the case of Palestine, ODA per capita data are not available prior to 1993.
Concessional loans (grants) are transfers made in cash, goods or services for which no repayment is required. Grant-like flow elements of loans are transactions in which the donor country retains formal title to repayment, but has expressed its intention in the commitment to hold the proceeds of repayment in the borrowing country.
Egypt
-
5,000
10,000
15,000
20,000
25,000
1970
1975
1980
1985
1990
1995
2000(M
illio
ns o
f co
nsta
nt 2
003
USD
)
Grants Loans
Jordan
-
1,000
2,000
3,000
4,000
1970
1975
1980
1985
1990
1995
2000(M
illio
ns o
f co
nsta
nt 2
003
USD
)
Grants Loans
Palestine
-
500
1,000
1,500
2,000
1993
1995
1997
1999
2001
2003(M
illio
ns o
f co
nsta
nt 2
003
USD
)
Grants Loans
Yemen
-
500
1,000
1,500
2,000
1970
1975
1980
1985
1990
1995
2000(M
illio
ns o
f co
nsta
nt 2
003
USD
)
Grants Loans

23
Figure 8 shows that the share of grants in total aid commitments has increased significantly during the past 30 years in Egypt and Jordan. During the 1970s, loans accounted for three-quarters of total ODA to Egypt and almost half of ODA to Jordan. In the period 2000-2004, the ratios dropped to 18 per cent for Egypt and 15 per cent for Jordan. This change in the composition of aid to Egypt and Jordan can partly be attributed to the fact that the share of United States aid in total aid to these two countries has increased substantially since the 1970s. As mentioned above, United States aid programmes generally provide grants, not loans to developing countries. In the case of Palestine, where data on the concessionality of aid commitments is only available since 1993, grants have constituted the main instrument of development financing. This can be mainly explained by the very limited capacity of the Palestinian Authority to repay loans, which is a result of insufficient fiscal revenues, and the fact that the bulk of foreign aid is spent on consumptive activities rather than on productive investment. In Yemen, loans have generally accounted for a much larger share in total aid than in the other countries. In 2000-2004, almost 50 per cent of total aid to Yemen was in the form of loans. The main share of these loans was provided by multilateral agencies, which often extend loans to countries on condition of substantial policy reforms. The trend of donors shifting from concessional loans to grants is also apparent in other regions and aimed at limiting the debt-burden of aid recipient countries.47
C. TYING STATUS Historically, aid flows have often been tied to a set of conditions restricting the aid recipient to the purchase of goods and services from suppliers based in the donor country or a limited group of countries. Such aid represents essentially an export subsidy in the donor country and is therefore a form of protectionism.48 It is now widely accepted that tying aid leads to a distortion of aid allocation and has negative consequences for recipient countries. First, tied aid is less cost-effective than untied aid given that it does not allow the recipient country to contract or buy from the lowest bidder. Based on empirical studies, the direct excess costs of tied aid are between 15 and 30 per cent, which translates into a 13 to 23 per cent reduction in the value of aid.49 In addition, tied aid involves a number of indirect costs for the recipient Government, including administrative costs and costs arising from a lack of donor coordination. Secondly, the recipient Government is not allowed to buy local goods or hire local companies, which could otherwise contribute to promoting economic development. Consequently, aid untying has become a crucial goal in the recent international debate on the effectiveness of development aid aimed at reducing transaction costs for recipient countries and improving their ownership of the process.50 The DAC tying statistics split aid commitments into three categories, namely: untied, tied and partially untied. The last represents aid subject to restrictions that are looser than those of tied aid whereby aid is usually subject to the restriction that it is spent on goods and services from the donor nation and/or developing countries, or else to the restriction that it is spent on goods and services from developing countries only.
47 S. Gupta, C. Patillo and S. Wagh, “Are donor countries giving more or less aid?”, IMF Working Paper No. 06/01 (International Monetary Fund (IMF), January 2006).
48 As Jepma points out in his comprehensive review of the issue, the motives for tying aid are more political than macroeconomic given that the positive effects on overall employment and growth in the donor economy are likely to be small. C. Jepma, “The tying of aid”, Development Centre Studies (OECD, 1991).
49 Ibid.
50 Aid untying is one of the main objectives of the Paris Declaration on Aid Effectiveness, which is available at: www.oecd.org/dataoecd/11/41/34428351.pdf.

24
Figure 9 shows how the tying status of total committed aid to Egypt, Jordan, Palestine and Yemen has changed over the period 1983-2005. The graphs illustrate that the share of tied aid has decreased significantly during the past two decades and that, currently, most of the aid to these four ESCWA members is untied. During 1983-1989, 20 per cent or less of total aid to Egypt, Jordan and Yemen was completely untied. The average share of untied aid in total aid increased substantially during the 1990s; and in 2000-2005, it ranged from 63 per cent in Palestine to 78 per cent in Yemen.
Figure 9. Tying status of aid commitments to Egypt, Jordan, Palestine and Yemen, 1983-2005
(Percentages)
Egypt, 1983-2005 (percentage)
6839
13
15
19
17
57 68
4
0%
20%
40%
60%
80%
100%
1983-1989 1990-1999 2000-2005
(%)
Tied Partially Tied Untied
Jordan, 1983-2005(percentage)
61
2711
19
21
20
71 68
2
0%
20%
40%
60%
80%
100%
1983-1989 1990-1999 2000-2005(%
)
Tied Partially Tied Untied
Palestine, 1990-2005(percentage)
40
14
29
4663
80%
20%
40%
60%
80%
100%
1990-1999 2000-2005
(%)
Tied Partially Tied Untied
Source: Calculated by ESCWA, based on data from the Creditor Reporting System (CRS) of OECD. Notes: The tying data reported here refer to aid commitments rather than actual disbursements. Tied or partially tied official loans or grants have conditions whereby the recipient country is limited to buying goods or services from a designated country, mostly the donor or a group of countries which does not include all developing countries. In the case of Palestine, data on the tying status of aid commitments are not available prior to 1988. While bilateral and multilateral efforts to untie aid have resulted in significant progress in this area, a considerable amount of aid to Arab countries still remains either tied or partially tied ranging from 22 per cent in Yemen to 37 per cent in Palestine. This undermines its efficiency, increases the costs for recipient countries and channels some of the benefits back to specific sectors in the donor country.

25
D. TECHNICAL COOPERATION In addition to concessionality and tying status, the DAC database of OECD divides official development assistance according to the form of aid, including project and programme aid, technical cooperation, developmental food aid, emergency and distress relief, debt relief, and support to national and international NGOs. Over the past decades, the composition of aid has changed considerably. Specifically, the shares of project and programme aid and of technical cooperation in total world ODA have increased significantly since the 1960s, while the share of developmental food aid declined.51 During 2000-2004, donors provided some 25 per cent of their total ODA in the form of technical cooperation. Despite serious concerns on the effectiveness of technical cooperation, such countries as Australia, Greece and the United States give 50 per cent or more of their aid in this form. According to OECD, technical cooperation (TC) is the provision of know-how in the form of personnel, training, research and associated costs from donor to recipient countries. It includes the direct supply of experts from donor countries, scholarship programmes and other forms of contribution to the human capital of the local population. Consequently, TC is a form of aid that is primarily information and services oriented. OECD differentiates between “free-standing TC”, which has the primary purpose of increasing the stock of human capital in developing countries, and “investment-related TC”, which provides know-how with the aim of increasing the physical capital stock of the recipient country. The effectiveness of TC is strongly debated among donors and recipients. Just as tied aid must be spent on the donor country’s products and services, aid in the form of technical cooperation must usually be purchased from the donor country, which reduces the purchasing power of aid and channels some of the benefits back to the consulting industry in the donor country. In addition, technical cooperation can thwart the objective of achieving greater self-reliance in developing countries. In particular, technical cooperation that aims at capacity-building of local institutions continues to be a controversial issue. By contrast, some forms of technical cooperation, including engineering and other activities related to physical investment, are generally considered more effective. Figure 10 illustrates the change in the share of technical cooperation in net ODA for the ESCWA members under consideration. The share of technical cooperation has increased in both Egypt and Jordan. The relatively high share of TC in net ODA in Egypt since the 1980s is related to the role of the United States as a major donor to this country. Generally, the increase in the share of technical cooperation observed in Egypt and Jordan corresponds to the trend in more technologically advanced aid recipient countries, which is characterized by a stronger focus on building human capital than on meeting emergencies and basic needs.52 Available information for Palestine shows that while net ODA was on the rise between 1990 and 2004, the share of technical cooperation in net ODA flowing to the territories has declined relative to its past levels. This can mainly be explained by the escalation in hostilities, which has resulted in higher needs of emergency aid and has hampered or even impeded the work of foreign agencies. In Yemen, the share of technical cooperation in net ODA increased considerably from the 1970s to the 1990s, and declined subsequently. While there are many factors behind this decline, absorptive capacity constraints seem to play a decisive role. A report by the International Monetary Fund (IMF) in 2003 on technical assistance to Yemen found that the country had received more TC than it could possibly absorb given its political and institutional structures.53 In order to enhance the efficiency and effectiveness of the 51 S. Gupta, C. Patillo and S. Wagh, “Are donor countries giving more or less aid?”, IMF Working Paper No. 06/01 (International Monetary Fund (IMF), January 2006).
52 Organisation for Economic Co-operation and Development (OECD), Development Cooperation Report 2005, vol. 7, No. 1 (OECD, 2006).
53 International Monetary Fund (IMF), “Technical assistance provided to Yemen, FY1999-2003” (IMF).

26
resource allocation, the IMF became more selective in its TC policy towards Yemen. While the overall amount of TC was reduced, efforts were intensified to improve the design and implementation of the different programmes and projects carried out in Yemen.
Figure 10. Share of technical cooperation in net ODA in Egypt, Jordan, Palestine and Yemen, 1970-2004
Source: Calculated by ESCWA, based on data from OECD. Notes: Technical cooperation includes education and training grants to nationals of the recipient countries and payments to consultants and advisors serving in recipient countries; and excludes consultancy services offered within projects, which are covered in bilateral projects. In the case of Palestine, data on the share of technical cooperation are not available prior to 1990. What do these trends imply? In principle, TC aims to promote existing potentials that allow for long-term economic and social development. Unfortunately, there is little analysis to confirm the overall effectiveness of TC as an instrument for human and institutional capacity-building in the Arab region. However, in the light of the ongoing controversy over the effectiveness of many forms of TC, technical cooperation must become more cost-effective, result-oriented and tailored to the needs and conditions of the local population in the recipient country.
A. Egypt, 1970-2004
4%32%
25%
44%
0
1,000
2,000
3,000
4,000
70-79 80-89 90-99 00-04
Mil
lion
s U
S$
All other ODA Technical Assistance
Palestine, 1990-2004
16%
36%
0200400600800
1,0001,200
90-99 00-04
Mill
ions
US$
All other ODA Technical Assistance
Yemen, 1970-2004
15%24%
19%
11%
0
100
200
300
400
500
70-79 80-89 90-99 00-04
Mill
ions
US$
All other ODA Technical Assistance
Jordan, 1970-2004
19%
21%
6%
4%
0
100
200
300
400
500
600
700
800
70-79 80-89 90-99 00-04
Mil
lion
s U
S$
All other ODA Technical Assistance

27
E. SECTORAL DISTRIBUTION OF AID FLOWS This section examines the sectoral distribution of total ODA flows to Egypt, Jordan, Palestine and Yemen, with a focus on those social and economic sectors that have received substantial financing in the period 1980-2004. The information provided in this section is based on the CRS database of the OECD. It refers to aid commitments rather than disbursements and excludes all aid from non-DAC bilateral donors. Data on multilateral aid is included to the extent possible. Given that Arab countries, particularly Saudi Arabia, were major donors to the four ESCWA members under examination, the aid flows reported in this section represent only part of total aid committed to these countries and are not comparable to the total aid volumes of the DAC database. Despite these limitations, the CRS data allow for establishing trends in the sectoral distribution of aid. The figures set forth below show the sectoral allocation of average annual aid commitments to the different social and economic sectors in the four ESCWA members. From a general perspective, the most striking feature is the marked change in the overall distribution of resources. Specifically, over time, foreign aid has been more and more channelled to social sectors at the expense of economic sectors. This trend is most pronounced in Jordan and Yemen. In both countries, aid to economic sectors declined significantly since the 1980s, while ODA commitments to the social sectors are now several times higher than they were two decades ago. Egypt is the only country in the sample where aid to economic sectors during the period 2000-2004 has been higher than aid to social sectors (see figure 11). The increased preference of DAC donors to finance social infrastructure and services is in line with the efforts aimed at accelerating progress in developing countries to achieve MDGs. At the same time, the considerable decline in aid channelled to economic sectors raises concerns about the prospects of these countries for developing their economic base and for achieving higher growth rates in the medium and long run. This is all the more important as the four ESCWA members examined in this section suffer from alarmingly high unemployment and underemployment rates, especially among the youth. Given that these countries face the enormous challenge to generate more and better jobs for men and women, it is vital that all forms of development assistance take into account potential effects on employment.
Figure 11. Sectoral allocation of aid commitments to Egypt, 1980-2004 (Millions of United States dollars constant 2004)
Average Annual Aid Commitments to Social Sectorsin Egypt, 1980-2004
0
100
200
300
400
80-89 90-99 00-04Mill
ions
of
Con
stan
t 200
4 U
S$
Education
Government &civil society
Health
Other Social Infrastructure
Water Supply & sanitation
Average Annual Aid Commitments to Economic Sectorsin Egypt, 1980-2004
0
100
200
300
400
80-89 90-99 00-04Mil
lions
of
Con
stan
t 200
4 U
S$ Agriculture &Industry
Energy
Transport, Storage &Communication
Banking & Business
Tourism & Trade
Source: Calculated by ESCWA, based on data from the Creditor Reporting System (CRS) of OECD. Note: See annex table 6 for the relevant tables of data. In Egypt, the average annual aid to social sectors increased between 1980-1989 and 1990-1999, and declined thereafter. In the 1980s and 1990s, some 40 per cent of total aid to social sectors was channelled into “water supply and sanitation”. More recently, the focus has shifted to education, in line with the priorities of the Government, which has taken up an ambitious and comprehensive reform programme to improve the educational system.

28
According to its second MDG Country Report, Egypt has progressed at an acceptable rate towards the attainment of the second Goal of achieving universal primary education.54 However, two major challenges in the area of education remain, namely: (a) the country has to ensure that more of the poor have access to education; and (b) the quality standards of education have to be increased substantially. These challenges may be dealt with by providing more technical assistance to Egyptian governorates with low values of Human Development Index. With respect to the economic sectors, figure 11 shows that the allocation of aid commitments has altered drastically over the past two decades. Aid channelled to the productive sectors of “agriculture and industry”, to the “energy” sector, and to the “transport, storage, and communication” sector has declined sharply, whereas aid commitments to the two service sectors “banking and business” and “tourism and trade” have increased substantially. While this shift reflects the increasing importance of the service sector in Egypt’s economic structure, it is likely to have had a negative impact on the employment situation in the country.
Figure 12. Sectoral allocation of aid commitments to Jordan, 1980-2004 (Millions of United States dollars constant 2004)
Average Annual Aid Commitments to SocialSectors in Jordan, 1980-2004
0
20
40
60
80
100
80-89 90-99 00-04Mil
lion
s of
Con
stan
t 200
4 U
S$ Education
Government & civilsociety
Health
Other Social Infrastructure
Water Supply & sanitation
Average Annual Aid Commitments to EconomicSectors in Jordan, 1980-2004
0
10
20
30
40
50
80-89 90-99 00-04Mil
lion
s of
Con
stan
t 200
4 U
S$ Agriculture & Industry
Energy
Transport, Storage &Communication
Banking & Business
Tourism & Trade
Source: Calculated by ESCWA, based on data from the Creditor Reporting System (CRS) of OECD. Note: See annex table 6 for the relevant tables of data. Figure 12 illustrates that the bulk of aid committed to the social sector in Jordan has gone to “water supply and sanitation” as a response to the country’s primary challenge of managing scarce water resources. The scarcity of water is widely regarded as one of the main restrictions for the country to achieve sustainable development. All major DAC donors to Jordan, including the United States, individual EU member countries, Japan and the World Bank, have supported the country’s ongoing programme to improve water supply. Average annual aid commitments towards “education”, “health”, “government and civil society” and “other social infrastructure” have also continuously increased from 1980 to 2004. While Jordan’s educational and health indicators are good relative to other countries of a similar income level in the region, some important challenges remain. In the education sector, the main concerns are related to an insufficient quality of education and a mismatch between the skills taught in schools and universities and the requirements in the labour market. This is reflected by a high unemployment rate, particularly among the youth. In addition, education for women is often directed into generalist streams, which deprives them from more specialized and higher-paid employment and contributes to the significant gender gap in income. According to the Human Development Report, the ratio of estimated female to male earned income in Jordan was 0.3 in 2004, which is one of the lowest ratios in the group of medium human development countries.55
54 Ministry of Planning in Egypt and the United Nations, Millennium Development Goals: Second Country Report (2004).
55 United Nations Development Programme (UNDP), “Beyond scarcity: Power, poverty and the global water crisis”, Human Development Report 2006 (UNDP, 2006).

29
In the light of these challenges, the Government has launched an ambitious education reform programme in 2003, which is strongly supported by international donors. In the area of health, Jordan suffers from a lack of adequate services in remote and poor areas, which is a consequence of limited medical facilities and the lack of qualified staff who usually refrain from working in remote areas. Therefore, international aid focuses on widening the accessibility to medical care in rural areas, on improving the legal and regulatory framework in the health sector, on upgrading medical equipment, and on training the national health care staff. As in Egypt, the structure of aid channelled to the economic sectors in Jordan has changed substantially since the 1980s. In real terms, aid commitments for “agriculture and industry” have declined by some 50 per cent between 1980-1989 and 2000-2004, whereas support for “banking and business” and “tourism and trade” has increased considerably. This is in tune with Jordan’s sectoral contribution to GDP whereby the services sector accounted for more than two-thirds of GDP in 2000.
Figure 13. Sectoral allocation of aid commitments to Palestine, 1990-2004 (Millions of United States dollars constant 2004)
Average Annual Aid Commitments to EconomicSectors in Palestine, 1990-2004
0
5
10
15
20
25
90-99 00-04Mill
ions
of
Con
stan
t 200
4 U
S$ Agriculture &Industry
Energy
Transport, Storage &Communication
Banking & Business
Tourism & Trade
Source: Calculated by ESCWA, based on data from the Creditor Reporting System (CRS) of OECD.
Note: See annex table 6 for the relevant tables of data. In Palestine, the average annual aid commitments to all social sectors increased between 1990-1999 and 2000-2004 as a result of the ongoing military conflict in the territories that has devastated large parts of the social and physical infrastructure (see figure 13). With diminishing water resources and desertification of various areas, aid flows to “water supply and sanitation” are becoming vital in order to ensure that residents receive the minimum daily amount of water needed for consumption, hygiene and cleaning. In terms of aid commitments to the economic sectors, “transport, storage and communication” received the highest share in both periods as donors gave priority to infrastructure rehabilitation and reconstruction activities.
Figure 14. Sectoral allocation of aid commitments to Yemen, 1980-2004 (Millions of United States dollars constant 2004)
Average Annual Aid Commitments to SocialSectors in Yemen, 1980-2004
0
20
40
60
80
100
80-89 90-99 00-04Mil
lion
s of
Con
stan
t 200
4 U
S$ Education
Government &civil societyHealth
Other Social InfrastructureWater Supply & sanitation
Average Annual Aid Commitments to EconomicSectors in Yemen, 1980-2004
0
20
40
60
80
100
120
80-89 90-99 00-04Mil
lion
s pf
Con
stan
t 200
4 U
S$ Agriculture & Industry
Energy
Transport, Storage &Communication
Banking & Business
Tourism & Trade
Source: Calculated by ESCWA, based on data from the Creditor Reporting System (CRS) of OECD.
Note: See annex table 6 for the relevant tables of data.
Average Annual Aid Commitments to SocialSectors in Palestine, 1990-2004
0
50
100
150
90-99 00-04Mill
ions
of
Con
stan
t 200
4 U
S$
Education
Government &civil society
Health
Other Social Infrastructure
Water Supply & sanitation

30
In Yemen, the importance of ODA to the social sector has been on the rise since the 1980s, as shown in figure 14. During 1980-1989, total commitments to social sectors were less than half of those to economic sectors. This situation has changed drastically over the past 15 years to the extent that, in the period 2000-2004, aid commitments to the entire economic sector equalled those going to support “water supply and sanitation”, which was merely a fourth (24.4 per cent) of total commitments towards the social sector. The change in the structural aid allocation is a response to the significant humanitarian challenges Yemen faces. Among the most pressing problems are the very limited access to safe water and poor public health care services especially in rural areas, which result in high child and infant mortality rates. Access to basic education for girls is inadequate and the average female illiteracy rate is still very high despite some significant progress in both the health and education sectors. International assistance to Yemen is increasingly targeting the most vulnerable groups in the population, with an emphasis on children and women. The programmes focus on improving local healthcare and water supply structures, particularly for people living in remote areas. Furthermore, international donors aim to strengthen pluralism, governance and the participation of the civil society in decision-making processes. This has resulted in a strong increase in aid to the “Government and civil society” (see figure 14).
F. VOLATILITY AND CYCLICALITY This section focuses on the volatility and cyclicality of aid given that both are closely related to the effectiveness of aid. Owing to the lack of a sufficiently long data series on GDP, Palestine was omitted from the analysis; and the analysis set forth below encompasses Egypt, Jordan and Yemen. In assessing the volatility and business cycle properties of aid, the data is first transformed into per capita real terms. Assuming that the recipient’s resources are mainly used for domestic purchases, both real GDP per capita and real aid per capita are adjusted for differences in purchasing power parities (PPP).56 The source for the data on real GDP adjusted for PPP, the GDP deflator and a PPP adjustment factor are all provided by the World Development Indicators of the World Bank. Moreover, data on aid commitment, which have been denominated in nominal terms, are taken from the DAC database of OECD; and the data are adjusted for PPP and then deflated with the same deflator as the GDP data. This methodology is applied to both Jordan and Egypt for annual data covering the period 1975-2003. However, given the complete lack of PPP data on Yemen, real GDP and ODA are expressed in per capita dollars (2000 constant) for the period 1990-2003. In a second step, the natural logarithms of the PPP-adjusted per capita time series are detrended using the Hodrick-Prescott filter in order to separate the cyclical component from the long-term growth component.57 Essentially, the filter minimizes the weighted sum of the following two components: (a) the squared deviations of the filtered series (the growth component) from the unfiltered series; and (b) the smoothness of the filtered series. The relative weight between these two components is determined by a smoothing parameter, λ, whereby higher values of λ lead to a smoother trend series.58 Here, the smoothing parameter was set to 100, which is the value normally used for annual data. Table 2 shows the volatility of the cyclical components of real GDP per capita and different forms of aid per capita for Egypt, Jordan and Yemen. While Arab aid from bilateral and multilateral Arab donors is included in the aggregates, it cannot be analysed separately given the lack of a continuous time-series needed to apply the Hodrick-Prescott filter. 56 See S. Pallage and M. Robe, “Foreign aid and the business cycle”, Review of International Economics, vol. 9, No. 4 (2001), pp. 641-672.
57 R. Hodrick and E. Prescott, “Postwar U.S. business cycles: an empirical investigation”, Journal of Money, Credit and Banking, vol. 29, No. 1 (February 1997), pp. 1-16.
58 With λ at infinity, the filter collapses to a linear trend; whereas when λ is zero, the filtered series is identical with the original series.

31
TABLE 2. VOLATILITY OF OUTPUT AND FOREIGN AID IN EGYPT, JORDAN AND YEMEN, 1970-2004 (Percentages)
Egypt Jordan Yemen GDP 3.19 5.97 3.47 Total ODA 44.31 44.34 37.62 ODA from the United States 56.21 72.87 92.64 ODA from DAC European Union 40.82 46.57 38.02 ODA from Japan 80.36 152.74 95.23 Multilateral ODA 53.15 61.77 44.20 Bilateral ODA 46.23 50.62 40.44
Source: Calculated by ESCWA, based on data from OECD. Note: Sample moments are computed from the cyclical component of the Hodrick-Prescott filtered logarithms of the series. All series are expressed in per capita real terms adjusted for differences in PPP. The major finding is that aid is several times more volatile than the recipient’s GDP. For Egypt and Jordan, values for total aid volatility are similar to those reported by Pallage and Robe for the period 1969-1995.59 Total multilateral ODA commitments are always more volatile than bilateral commitments. The most volatile of the major sources is ODA by Japan to all countries, particularly to Jordan, whereas the least volatile is aid to Yemen from DAC EU countries. In fact, for all three recipient countries, aid from the DAC EU countries is the least volatile among the three major bilateral donor groups. These results are in line with the main findings of recent research that has shown aid to be much more volatile than such macroeconomic variables as GDP or fiscal revenues.60 Volatility of aid is often associated with high uncertainty of aid inflows. Uncertainty in aid inflows is likely to have a negative impact on the level of investment, especially public investment, and therefore on growth. Moreover, highly volatile and uncertain aid receipts can lower economic growth given that they constrain fiscal behaviour and do not allow for adequate long-term planning. The business cycle properties of foreign aid are assessed by computing the contemporaneous correlations between the cyclical components of aid and output, as well as correlations with one- to three-year lags and leads of output. A negative contemporaneous correlation means that aid receipts are counter-cyclical, whereas a positive contemporaneous correlation implies that aid receipts are pro-cyclical (see table 3). Table 3 shows some evidence in support of a weak pro-cyclicality of total aid commitments to all three countries. This is most pronounced in the case of United States aid to Egypt; whereas multilateral aid flows tend to be more counter-cyclical, especially for two lags in the real GDP series (-0.3643). Equally, multilateral aid is counter-cyclical in Jordan; and while total bilateral aid, which includes ODA from Arab countries, is pro-cyclical, the three major bilateral non-Arab aid groups display mild contemporaneous counter-cyclicality. In Yemen, all aid categories exhibit pro-cyclical behaviour. The welfare implications of any mechanism to smooth out the impact of output swings on consumption can be quite substantial. Aid flows can be one of these mechanisms, among others, including remittances from abroad. The pro-cyclicality observed in aid commitments to Egypt, Jordan and Yemen suggests that aid has not dampened the business cycle of these countries.
59 S. Pallage and M. Robe, op. cit.
60 D. Fielding and G. Mavrotas, “The volatility of aid”, Discussion Paper No. 2005/06 (United Nations University and World Institute for Development Economics Research (WIDER), February 2005); and A. Bulir and A.J. Hamann, “Volatility of development aid: From the frying pan into the fire?”, IMF Working Paper No. 06/065 (IMF, March 2006).

32
TABLE 3. CYCLICAL PROPERTIES OF FOREIGN AID IN EGYPT, JORDAN AND YEMEN
Country X(-3) X(-2) X(-1) Real GDP X X(+1) X(+2) X(+3)
GDP -0.0062 0.0120 0.4796 1.0000 0.4796 0.0120 -0.0062
Total ODA -0.5119 -0.3348 -0.1337 0.1000 -0.0708 -0.0755 -0.1443 ODA from the United States -0.5050 -0.2814 -0.0124 0.2331 0.0431 -0.0593 -0.1564 ODA from DAC European Union -0.2677 0.0123 -0.0997 -0.1584 -0.0833 -0.0015 0.0112
ODA from Japan 0.0822 -0.1565 -0.1923 -0.0895 -0.1595 0.0359 0.0047
Multilateral ODA -0.2617 -0.3643 -0.2433 -0.1768 -0.0590 0.0322 0.0851
Egypt
Bilateral ODA -0.5004 -0.2942 -0.1043 0.1192 -0.0704 -0.0918 -0.1623
GDP -0.2291 0.3566 0.5656 1.0000 0.5656 0.3566 -0.2291
Total ODA 0.1674 0.4086 0.0792 0.1076 -0.1090 0.0182 -0.0452 ODA from the United States -0.2494 -0.1901 -0.2522 -0.0325 0.1765 0.1928 -0.1291 ODA from DAC European Union -0.0044 -0.1037 -0.4872 -0.1453 -0.1875 0.1910 0.1237
ODA from Japan 0.1401 0.0927 -0.0128 -0.2139 -0.2134 -0.1632 -0.1022
Multilateral ODA -0.1899 -0.1756 -0.2532 -0.3034 -0.1702 0.0488 0.1763
Jordan
Bilateral ODA 0.2822 0.5142 0.1650 0.1330 -0.1110 -0.0116 -0.1047
GDP -0.0945 0.1305 0.0968 1.0000 0.0968 0.1305 -0.0945
Total ODA -0.0633 0.1720 0.3275 0.3992 0.1156 0.1941 -0.2262 ODA from the United States 0.4864 0.4569 0.1126 0.2361 -0.1454 -0.1764 -0.2316 ODA from DAC European Union -0.1631 0.0097 -0.0072 0.1198 -0.0332 0.0793 -0.0061
ODA from Japan 0.0124 0.0575 0.2818 0.0302 -0.0272 0.4260 -0.3742
Multilateral ODA -0.1396 0.2145 0.4710 0.4327 0.1545 0.0633 -0.3577
Yemen
Bilateral ODA 0.0856 0.1087 0.0994 0.2958 0.0338 0.3206 -0.0483 Source: Calculated by ESCWA, based on data from OECD. Note: Sample moments are computed from the cyclical component of the Hodrick-Prescott filtered logarithms of the series. All series are expressed in per capita real terms adjusted for differences in PPP.

33
III. AID AND ECONOMIC DEVELOPMENT IN THE ARAB REGION The possible effect of aid on growth and development has been the subject of economic research for several decades. While evidence at the micro level suggests that most development projects work, the results of empirical research at a macro level are mixed. This contrast is known in the aid effectiveness literature as the micro-macro-paradox.61 In line with the predictions of macroeconomic theory, a large number of studies have found that aid has generally had a significant positive impact on economic growth.62 However, based on different data sets and estimation techniques, many other studies over the past three decades have concluded that aid has not contributed significantly to growth.63 Some researchers have even suggested that under specific circumstances development aid can undermine growth. This chapter introduces the theoretical reasoning behind the relationship between aid and growth, and provides a brief overview of the empirical debate on the subject; and then examines the effectiveness of aid flows received by Arab and other developing countries between 1970 and 2004. As shown in chapter I, the Arab region has received significant amounts of aid flows in that period. How Arab countries have fared with incoming aid flows has very important policy implications for both recipient and donor countries, especially in the light of accelerating progress towards achieving MDGs.
A. AID AND ECONOMIC GROWTH: THEORY The standard theoretical model used during the past decades to analyse the impact of aid on economic growth is the so-called “two-gap” model of Chenery and Strout.64 This model states that developing countries can only attain a certain rate of growth if foreign resources close a savings gap and a foreign-exchange gap. It is assumed that an incremental increase in aid inflows can increase the recipient country’s investment by the same amount. Using the Harrod-Domer type of growth assumption, the incremental capital-output ratio (ICOR) can be estimated.65 The impact of aid on growth is realized when aid fills the two gaps representing shortages of domestic savings and foreign exchange. However, this model rests on two key assumptions that are highly questionable, namely: (a) that the relationship between investment and growth is stable in the short and medium terms; and (b) that foreign aid is entirely used to finance investment and not consumption.66 Despite the fact that the theoretical foundations of the two-gap model are often regarded as very weak, it has been used extensively by international organizations to motivate development aid. Since the introduction of the two-gap model, the literature has developed to accommodate richer behavioural assumptions. Exploration of various dynamic optimization models were made available in line with developments in the literature of economic growth in the 1980s. Many empirical studies have evolved since then to support or to counter the implications of economic theories on aid effectiveness.
61 P. Mosley, Overseas aid: Its defence and reform (Wheatsheaf Books, 1987), chapter 5.
62 See, for example, M.T. Hadjimichael et al., “Sub-Saharan Africa: Growth, savings and investment, 1986-1993”, IMF Occasional Paper No. 118 (International Monetary Fund (IMF), 1995); and H. Hansen and F. Tarp, “Aid and growth regressions”, Journal of Development Economics, vol. 64 (2001), pp. 547-570.
63 Within that context, see, for example, P. Mosley, J. Hudson and S. Horrell, “Aid, the public sector and the market in less developed countries”, The Economic Journal, vol. 97 (September 1987), pp. 616-641; P. Boone, “The impact of foreign aid on savings and growth”, Centre for Economic Performance Working Paper No. 677 (London School of Economics, 1994); and R. Rajan and A. Subramanian, “What undermines aid’s impact on growth” IMF Working Paper No. 05/126 (International Monetary Fund (IMF), June 2005).
64 H. Chenery and A. Strout, “Foreign assistance and economic development”, The American Economic Review, vol. 56, No. 4 (September 1966), pp. 679-753.
65 The incremental capital-output ratio (ICOR) measures the amount of aggregate investment required to achieve a target GDP growth rate.
66 For more information, see W. Easterly, “Can foreign aid buy growth?”, Journal of Economic Perspectives, vol. 17, No. 3 (Summer 2003), pp. 23-48.

34
B. AID AND ECONOMIC GROWTH: A REVIEW OF EMPIRICAL FINDINGS Empirical studies on the relationship between development aid and economic growth can be broadly grouped into four categories, based on their main findings.67
1. The first group The first group of studies claims that aid has either no significant effect on growth or even undermines it. Early studies in this group relied mainly on simple correlations and did not address the issue of causality by regressing growth on aid.68 Generally, they share a similar view that reveals aid as counterproductive to its purpose given that it generates a low-growth economy where aid-dependency expands public spending and wipes out domestic savings.69 If aid funds a particular project that the recipient Government was adamant on funding anyway even in the absence of aid, this releases Government resources which could be spent on building presidential palaces or bolstering the political base. In this case, the latter would be the effective contribution made by aid. Using a broader sample than previous studies and covering 117 countries for the period 1971 to 1990, Boone found in a frequently cited study no relation between aid and growth with five-year growth periods.70 In a recent study on the topic, Rajan and Subramanian tested the strength of the relationship between aid and growth in a single framework and across different periods of time, sources and types of aid. They did not find a robust positive relationship between aid and growth.71 A companion paper examined possible factors that could hinder aid from having a positive impact on growth.72 Among these factors, the authors singled out the Dutch Disease effect, namely, that the large influx of foreign currency in the form of aid leads to an overvaluation of the real exchange rate, which in turn lowers the competitiveness of the recipient country’s labour-intensive or exporting sectors. As a result of the reduced competitiveness, these sectors grow slower than in countries that have received less aid.
2. The second group The second group of studies has found on average a significant positive impact of aid on growth. According to this group, the arguments put forth by the first group are only partially correct given that aid has successfully supported poverty reduction and growth promotion in many countries. Consequently, even if aid flows have not stimulated growth under all circumstances, they have had a positive effect on average. Following the lines of Chenery and Strout, this group asserts that aid supplements domestic savings, contributes to filling the foreign exchange gap and creates access to better technology and managerial skills.73 In the first study that regresses economic growth on aid, Papanek found a strongly significant 67 S. Radelet, “Grants for the world’s poorest: How the World Bank should distribute its funds”, CGD Notes (Center for Global Development (CGD), June 2005).
68 See, for example, T. E. Weisskopf, “The impact of foreign capital inflow on domestic savings in underdeveloped countries”, Journal of International Economics, vol. 2 (February 1972), pp. 25-38; and T. E. Weisskopf, “An econometric test of alternative constraints on the growth of underdeveloped countries”, Review of Econometrics and Statistics, vol. 54 (1972).
69 Within that context, Mosley leveled arguments on the public sector aspects of aid, including its “fungibility”, which may help sustain corrupt Governments, thereby allowing bad policies to propagate and fester. P. Mosley, “Aid, savings and growth revisited”, Oxford Bulletin of Economics and Statistics, vol. 42, No. 2 (1980), pp. 79-95.
70 While this result was sensitive to the period of observation, Boone concluded that aid was not causally linked to growth. P. Boone, “The impact of foreign aid on savings and growth”, Centre for Economic Performance Working Paper No. 677 (London School of Economics, 1994).
71 R. Rajan and A. Subramanian, “What undermines aid’s impact on growth” IMF Working Paper No. 05/126 (International Monetary Fund (IMF), June 2005).
72 R. Rajan and A. Subramanian, “Aid and growth: What does the cross-country evidence really show?” IMF Working Paper No. 05/127 (IMF, June 2005).
73 H. Chenery and A. Strout, “Foreign assistance and economic development”, The American Economic Review, vol. 56, No. 4 (September 1966), pp. 679-753.

35
positive effect of aid.74 A similar result was obtained for a sample of low-income countries in sub-Saharan Africa. In the mid-1990s, following the pessimistic findings of Boone’s study, this strand of the aid-growth literature took a significant turn when several researchers began to allow for a nonlinear effect of aid on growth.75 In other words, these studies tested the hypothesis that aid promotes economic growth with diminishing returns, namely, that each additional dollar of aid has a lower (positive) impact on growth than the preceding dollar. Eventually, the absorptive capacity in the recipient country reaches a limit such that additional aid flows will have no or even negative effects on growth. Using different estimation techniques, most of these studies have found a strongly positive non-linear impact of aid on growth.
3. The third group A third group of studies emerged during the second half of the 1990s, which was spearheaded by research undertaken by the World Bank and that gained much momentum among multilateral development banks and other international donors.76 This group assumes that aid has a conditional relationship with growth, thereby impacting it positively only under certain conditions that span characteristics of both recipient and donor practices, while the average effect of aid is close to zero. Its winning appeal is the ability to explain why aid has worked in some countries, albeit not in others. This line of reasoning has had an enormous influence on donor practices, especially multinationals, and is the basis of the Millennium Challenge Account of the United States.77 The most influential study of this strand is that by Burnside and Dollar that focused on the impact of policy on aid effectiveness.78 The authors used an interaction term between aid and an index of economic policy in order to study the aid-policy-growth relationship, comprising fiscal, monetary and foreign-exchange variables in the recipient country. The results of Burnside and Dollar’s analysis suggest that aid promotes growth only in countries with sound economic policy regimes. The authors assume that synergy effects among aid and policy are successful because, in good policy environments, either the fraction of invested aid or the resulting increase in productivity is larger. Other recipient country conditions expounded by proponents of this strand include vulnerability of terms of trade to climactic shocks, political conflict, geography, export price shocks and strong civil liberties.79 However, very few of these studies have survived independent replication.80
74 G.F. Papanek, “Aid, foreign private investment, savings and growth in less developed countries”, Journal of Political Economy, vol. 81 (1973), pp. 120-130.
75 See, for example, M.T Hadjimichael et al., “Sub-Saharan Africa: Growth, savings and investment, 1986-1993”, IMF Occasional Paper No. 118 (International Monetary Fund (IMF), 1995); and H. Hansen and F. Tarp, “Aid and growth regressions”, Journal of Development Economics, vol. 64 (2001), pp. 547-570.
76 J. Isham, D. Kaufman and L. Pritchett, “Governance and returns on investment: An empirical investigation”, Policy Research Working Paper No. 1550 (the World Bank, November 1995).
77 S. Radelet, “Challenging foreign aid: A policymaker’s guide to the Millennium Challenge Account” (Center for Global Development, 2003).
78 C. Burnside and D. Dollar, op. cit.
79 For more on these issues, see P. Guillaumont and L. Chauvet, “Aid and growth revisited: Policy, economic vulnerability and political instability”, which was presented at the Annual Bank Conference on Development Economics: Toward Pro-poor Policies (Oslo, 24-26 June 2002); P. Collier and A. Hoeffler, “On the incidence of civil war in Africa”, Journal of Conflict Resolution, vol. 46, No.1 (2002), pp. 13-28; P. Collier and J. Dehn, “Aid, shocks and growth”, Policy Research Working Paper No. 2688 (the World Bank, 2001); and J. Isham, D. Kaufman and L. Pritchett, “Governance and returns on investment: An empirical investigation”, Policy Research Working Paper No. 1550 (the World Bank, November 1995).
80 For example, Easterly, Levine and Roodman found that the results of Burnside and Dollar were not robust to increase the sample size; and Roodman found that they hinged on just seven outliers whose removal from the cross-country regressions reversed the findings. W. Easterly, R. Levine and D. Roodman, “Aid, policies, and growth: Comment”, American Economic Review, vol. 94, No.3 (June 2004), pp. 774-780; and C. Burnside and D. Dollar, op. cit.

36
4. The fourth group Finally, a fourth group shifts the focus of attention from experimenting with growth specifications, to exploring various ways in which aid is likely to impact on growth. In other words, the studies in this literature strand differentiate between the growth impacts of different types of aid. For example, Ownes and Hoddinott contended that household welfare in Zimbabwe was increased more by “developmental aid”, defined as assistance to infrastructure, agriculture and industry, than by “humanitarian aid” in the form of emergency transfers and food aid;81 and Mavrotas found a positive effect from programme and project aid in Uganda, and a negative effect from TA and food aid on growth.82 In an influential study by the Centre for Global Development, Bhavnani, Clemens and Radelet tried to match aid flows to a realistic time period over which they could influence growth and essentially distinguished between three components of aid, namely:83 (a) emergency and humanitarian aid whose effects, if any, were expected to be immediate; (b) short-term aid, including budget and balance of payments support, investments in infrastructure, and aid for such productive sectors as agriculture, to affect growth in the short run; and (c) late-impact aid, including aid to promote democracy, health, environment and education, to affect growth only over a long period of time. Short-term aid using a four-year period over which it can influence growth was found to have had a robust and sizeable impact on economic growth during 1973-2001. Moreover, another study disentangled the effects of two components of aid into a developmental, growth-enhancing component and a geopolitically-motivated, possibly-growth depressing component. The authors allow the effect of aid on economic growth to occur over long time-lags involving periods of several decades and document a strong positive impact for aid of the first type.84
C. EMPIRICAL ANALYSIS Given the different strands of the empirical literature on the aid-growth literature, this section provides evidence on the effect of aid on growth in the Arab region by means of a panel analysis. In particular, this section seeks to answer the following four major questions that have evolved from the literature: (a) what, if any, is the channel through which aid affects growth; (b) do any policy interaction terms govern that relationship; (c) does aid have diminishing returns; and (d) how would the results change if aid were to be qualified by type based on the expected time frame over which the impact of aid could be perceived.
1. Model, data and estimation technique In order to provide answers to the above questions, a neo-classical growth model is estimated that accounts for the channels through which growth could affect aid. In addition, the model incorporates an aid-policy interaction term, allows for diminishing returns to the aid variable and permits the differentiation between various types of aid. The growth regression model for N countries indexed by i and T time periods indexed by t, therefore takes the following form:85
81 T. Owens and J. Hoddinott, “Investing in development or investing in relief: quantifying the poverty tradeoffs using Zimbabwe household panel data” (Center for the Study of African Economies, September 1998).
82 G. Mavrotas, “Assessing aid effectiveness in Uganda: An aid-disaggregation approach” (Oxford Policy Management, January 2003).
83 M. Clemens, S. Radelet and R. Bhavnani, op. cit.
84 S. Reddy and C. Minoiu, “Development aid and economic growth: A positive long-run relation”, DESA Working Paper No. 29 (Department of Economic and Social Affairs (DESA), September 2006).
85 This form of the aid-growth regression is now standard in the empirical literature and was used, for example, in M. Clemens, S. Radelet and R. Bhavnani, op. cit.

37
=titi yy ,, /& nettid ,βα + ( ) ( ) titititi
nettiti
nettiti yXIdqdq ,,,,
2
,,,, ln εθηλρδγ +++++×++ (1)
where yy /& represents the growth rate of income per capita, netd is net ODA disbursements, q is some country characteristic on which the effect of aid may partially rest, I is a vector of investment variables, X is a vector of additional country characteristics, ,,,,, ρδγβα and θ are all constants, η and λ are vectors of constants, and ε is random noise. The specification is such that it addresses simultaneously or at separate attempts the four questions this section seeks to answer. As suggested in the literature, equation (1) incorporates interaction terms with regard to the country characteristic q and the aid-squared variable (d2) which is expected to capture decreasing marginal returns to aid. A more detailed explanation of the right-hand side variables is provided next along with a description of their source. The variable q constitutes an “economic policy index”.86 On the supposition that aid works only within the context of a sound macroeconomic policy framework consisting of monetary, exchange-rate and fiscal policies, the index comprises the lag of inflation, the change in trade openness and a “rent” variable, which is equal to fuel exports over total exports times the lag of Government consumption. The index is calculated in the following way. First, a growth equation is estimated using the three policy indicators and other variables but not aid as explanatory factors. The coefficient estimates from this equation are taken as weights to calculate the economic policy index as follows: q = constant + α (fiscal policy) +β (monetary policy) + γ (trade policy) (2) where α, β and γ are the coefficient estimates from the regression of growth and the constant captures the impact of all other variables in the regression (excluding the period dummies) evaluated at each variable’s mean. The index is then interacted with foreign aid, to test for conditionality. Additionally, each component of the index is included as a separate regressor in X, since each is of independent interest and its effect on growth is sometimes unknown a priori. Motivated by concerns about potentially adverse effects of high aid levels, the quadratic aid term ( 2d ) appears alongside the stand-alone aid variable. The aid-squared term reflects decreasing marginal returns to aid so that a positive coefficient ( ρ ) for that term implies that each new dollar of aid has a smaller impact on growth than the preceding dollar. Theoretical arguments put forward to motivate non-linear specifications of the aid-growth relationship seem ad hoc, yet empirical evidence in support of its significance has not been short of pervasive.87 Moreover, all these causal devises can be interpreted as means through which economic policy impacts on aid effectiveness, namely: the Dutch disease reflects poor management of the domestic fiscal and monetary policies and the foreign exchange-rate policy; and capacity constraints are closely related to macroeconomic governance. Occasionally, the policy variable is also interacted with the quadratic aid term. Two definitions of aid are employed whereby aid under either definition is net ODA relative to the World Bank data on GDP. In the first, aid is total official development assistance. In the second, aid is the sum of those components of total aid, known as short-term aid, whose growth effects are likely to be felt over four years, namely:88 (a) emergency and humanitarian aid whose effect is observed in the immediate
86 C. Burnside and D. Dollar, op. cit.
87 R. Durbarry, N. Gemmell and D. Greenaway discuss Dutch Disease problems undercutting export performance in “New evidence on the impact of foreign aid on economic growth”, CREDIT Research Paper No. 98/8 (Centre for Research in Economic Development and International Trade (CREDIT), 1998); Hadjimichael et al., op. cit. speak of absorptive capacity constraints; and R. Lensink and H. White consider inappropriate technology and institutional weaknesses caused by the aid inflow in their study, entitled “Are there negative returns to aid?”, Journal of Development Studies, vol. 37, No.6 (2001), pp. 42-65.
88 The three components of ODA are disentangled according to M. Clemens, S. Radelet and R. Bhavnani, op. cit.

38
term; (b) aid that could possibly impact on growth in four years, including budget and balance of payments support, investments in infrastructure, and aid for such productive sectors as agriculture and industry; and (c) aid that affects growth only in the long term, including support for democracy, health, education and environment. For specifications employing this alternate definition of aid, only the second component is used, namely, short-term aid. Both aid definitions are obtained from the OECD database. In order to check whether aid affects growth through the investment link, foreign direct investment is included as a regressor.89 In the effort to proxy for all physical capital accumulation sources, gross domestic investment is controlled for as well. While these two variables are not exhaustive, they do cover substantial ground. In an attempt to account for “investment in human capital”, the Barro-Lee data set on educational attainment was used.90 Alternatively, using the data on illiteracy by the United Nations Educational, Scientific, and Cultural Organization (UNESCO), the term “illiteracy” turned out to be insignificant; and investment in human capital was therefore omitted from the specifications included herein.91 The physical investment variables appear in the current regressions as the logarithm of “one plus foreign direct investment” and the “logarithm of gross fixed investment”. The logarithm of the initial level of per capita GDP captures any conditional convergence effects to the extent that there is an inverse relationship between the initial level of output per capita and output growth when the convergence hypothesis is true. The lag of M2 to GDP proxies for the state of the financial system and a measure of institutional quality (called ICRG) captures Government bureaucracy.92 Additionally, the demographic structure in a country can impact economic growth. In order to account for a potential demographic impact on growth, the dependency ratio is included in the regressions. It is expected that a high dependency ratio reduces economic growth as a smaller percentage of the population contributes to production. Furthermore, the regressions include an index of ethno-linguistic fractionalization, given that this variable is a determinant of economic growth in many specifications. Table 4 below contains a detailed description of all the variables in equations (1) and (2) and their sources. It includes a large number of covariates typically included in growth regressions of this type in the literature. The sample covers the years 1969-2004 and extends to all low- and middle-income countries for which data are available.93 The sample was enlarged to include non-Arab countries in order to overcome the low number of observations in the Arab region. The Arab countries in the sample include Algeria, Egypt, Jordan, Morocco, Syrian Arab Republic, Sudan and Tunisia. Additionally, the panel is unbalanced for lack of information on all countries for every year. The dependent variable is the four-year growth rate of per-capita GDP, and the left-hand side variables are generally the sample averages over the corresponding period. In order to account for possible convergence, the initial level of GDP per capita at each of the four-year periods is included.94 89 This is the case in H. Hansen and F. Tarp, “Aid and growth regressions”, Journal of Development Economics, vol. 64 (2001), pp. 547-570.
90 However, owing to the unavailability of data for many countries, the sample was significantly reduced. See R. Barro and J. Lee, “International comparisons of educational attainment,” NBER Working Paper No. 4349 (National Bureau of Economic Research NBER, April 1993).
91 This is in line with Burnside and Dollar who also find the education variable to be insignificant. C. Burnside and D. Dollar, op. cit.
92 This variable is drawn from the International Country Risk Guide (ICRG) and includes measures of the extent of corruption, rule of law, risk of expropriation or repudiation of contracts, and bureaucratic quality.
93 The World Bank, World Development Indicators 2006.
94 The choice of four-year periods follows from existing literature and is, most importantly, in line with M. Clemens, S. Radelet and R. Bhavnani, op. cit., whose data on short-term aid is used in the current study.

39
TABLE 4. VARIABLE DEFINITION AND SOURCE
Variable name Description GDP growth Growth rate of real GDP Government size lag Government consumption as a share of GDP, lagged variably for endogeneity Inflation lag Inflation rate, lagged once for endogeneity Initial GDP Initial GDP level to test the convergence hypothesis M2GDP Lag Lag of (M2 to GDP); variable captures financial liquidity or the depth of financial
markets Open Change in openness (or sum of imports and exports as a share of GDP)
Rent Share of fuel exports in total exports times lagged Government consumption; variable captures the rentier nature of Governments
Dependency ratio Population aged 0-14 (young dependent population) divided by population 15-64 (working-age population); variable captures dependency ratio
ICRG Composite Index Composite index based on political financial and economic risk ratings compiled by ICRG. Variable includes measures of the extent of corruption, rule of law, risk of expropriation or repudiation of contracts, and bureaucratic quality. Political risk accounts for 50 per cent of the composite rating while financial and economic risk ratings account for 25 per cent each. The highest overall rating (theoretically 100) indicates the lowest risk, and the lowest rating (theoretically 0) indicates the highest risk
Ethnic fractionalization Index of ethno-linguistic fractionalisation Aid ODA divided by GDP Aid2 Aid squared to test for diminishing returns as a result of absorptive capacity
constraints Aid×Policy Interaction term between aid and the policy index. Policy Calculation based on the study by Burnside and Dollar. Index is set equal to
“constant + α(fiscal policy) +β(monetary policy) + γ(foreign or trade policy)” where α, β and γ are the coefficient estimates from the regression of growth on all variables but aid, and the constant is the sum of all the other variables in the regression (excluding period dummies) evaluated at each variable’s mean
Foreign direct investment Foreign direct investment as a share of GDP GDI Gross fixed capital formation (previously known as gross domestic investment) as
share of GDP Short-term aid Ratio of short-term aid to total aid; ratio is then multiplied by total ODA to GDP to
arrive at short-term aid as share of GDP Source: Compiled by ESCWA, based on W. Easterly, R. Levine and D. Roodman, “Aid, policies, and growth: Comment”, American Economic Review, vol. 94, No.3 (June 2004); the World Bank, World Development Indicators (2006); and on data from OECD. There are therefore nine periods in total in the panel regression starting 1969-1972 and ending 2001-2004. However, only eight periods constitute the size of the panel for reasons related to the possible endogeneity of aid. Essentially, given this concern, aid is instrumented for everywhere (even in the quadratic aid and policy interaction terms) by aid lagged one period. As a result of this choice of instrumentation, the number of periods is reduced to eight. Finally, global events and regional differences are accounted for through the inclusion of time and regional dummies, with the period 1969-1972 and the Middle East acting as the two bases or excluded dummies. In line with similar efforts in the literature, contesting specifications that use different combinations of the right-hand-side variables are evaluated within a common framework. Close attention is given to checking the statistical significance of the synergy effect between aid and policy, and to decreasing marginal returns to aid, especially in the context of the Arab region. In all the regressions, Arab aid is permitted a marginal effect on growth that is possibly dissimilar to the effect observed for the non-Arab countries in the sample.

40
This is achieved by interacting the aid variable with a dummy for the Arab countries, in addition to having aid as a stand-alone term. Consequently, for an Arab country, the effect of aid on growth is the sum of the coefficients of the two terms. This helps to answer the question of how the growth impact of aid in the Arab region compares to its effectiveness in all other low- and middle-income countries combined. In all regressions, the 1 per cent of outlying data points that are distant from the main body of the data are excluded.95 The problem of endogeneity is among the chief concerns in estimating cross-country panel regressions. Most current work accounts for endogeneity by using instrumental variables to isolate an exogenous source of variation in aid that is not ascribed to the level of economic growth in the recipient country. In many of these studies, the estimation technique includes a combination of instrumental variables (IV), generalized method of moments (GMM), feasible generalized least squares (FGLS), or simply pooled ordinary least squares (OLS) with lagged aid acting as an alternative for instrumentation. For this study, the last two techniques are performed. Given the potentially serious concern over the endogeneity of total aid, the aid variable is lagged once as above-mentioned in order for the lag of aid to act as the right-hand-side explanatory variable in all OLS and FGLS models. Insofar as the correlation between past and present aid is sufficiently high, lagging the aid variable can be viewed as an alternative to instrumenting aid under the IV model. The lagged aid variable can be interpreted as a means of assessing either the effect of past aid on present growth or the effect of present aid on present growth with the one-lag value acting as an instrument for present aid given it is unlikely to be endogenous to present growth. Estimation via two-stage least squares (TSLS) was carried out with the logarithm of arms exports and a dummy for common versus civil law acting as instruments. However, owing to the weakness of the instruments and the significant reduction in sample size (from 268 to 72 observations in total), the results were not robust and are therefore not reported here.
2. Results In order to ensure that the results are robust to different specifications of equation (1) and to the estimation technique, a series of regressions was estimated as follows: (a) Pooled OLS models with robust standard errors were estimated assuming that aid is the one-lag total aggregate. While the specifications differ by their number of interaction and quadratic aid covariates, they all exclude the investment variables (see annex table 7); (b) Addressing the question of how ODA impacts economic growth, pooled OLS models were estimated that control for both domestic and foreign investment again by using the total aggregate of aid (see annex table 8); (c) An FGLS model was estimated that takes account of the panel data structure; (d) Total aid as explanatory variable is replaced by short-term aid as defined above.96 Short-term aid is also used with a one-period lag. Again, equation (1) was estimated using either pooled OLS or FGLS and either including or excluding investment. In all these regressions, the included time dummies are jointly significant, and R-squared values are within ranges similar to those observed in the literature. The major findings that are broadly invariant to the choice of the aid variable, the exact specification and the estimation technique are briefly summarized below.
95 This is in line with the method for identifying outliers used by A. Hadi, “Identifying multiple outliers in multivariate data”, Journal of the Royal Statistical Society, vol. 54, No. 3 (1992), pp. 761-771.
96 M. Clemens, S. Radelet and R. Bhavnani, op. cit.

41
The first finding in this study does not support the strong pessimism on aid effectiveness expressed in some studies. There is evidence suggesting that both total ODA and short-impact aid have, on average, promoted growth in Arab countries and in other middle- and low-income countries in the sample. Arab aid appears to be quite efficient; specifically, an increase of one percentage point in the aid to GDP ratio leads to an average increase of a little less than 0.35 percentage points in GDP-per-capita growth. This result holds across a wide array of robustness tests that are not reported here owing to space constraints. The results are even more significant when short-impact Arab aid is used. With regard to the question of whether aid works better in countries with good policies, the results reveal an almost persistent lack of explanatory power for the interaction term (short-term aid policy). Consequently, it can be concluded that the result of a positive growth impact of aid does not hinge on this interaction term and that those who argue that aid works only in countries with good institutions could be overstating their case. Moreover, the results show no evidence on the hypothesis that absorptive capacity constraints exist in the Arab region as suggested by the coefficient estimate of the quadratic aid term. It is therefore argued that the possibility of a binding constraint on absorptive capacity should not be seen as an immutable barrier to scaling up aid to the region. While efforts to strengthen institutions and build human capacities could translate into positive growth effects as suggested by a significant and positive coefficient on the ICRG index, this study advises that policy discussions avert focusing exclusively on how to expand the limits of aid on growth. Rather, it seems worthwhile shifting more attention to discussing ways of channelling more aid to the neediest areas. Other results show that some of the previously identified covariates are not strongly related to growth. These include ethnic fractionalization, the lag of inflation, the change in openness and the lag of M2 to GDP variables. This implies that, on average, the tax on investment returns, which is embodied by high inflation levels, changes in trade patterns, and the liquidity of the financial markets have not significantly affected growth in low- and middle-income countries over the past 40 years. While the parameter estimate on the rent-seeking variable and Government size impacted growth in the right direction, the estimates are not always significant. Otherwise, it appears that the conditional convergence hypothesis sustains itself in the sample, thereby implying that low- and middle-income countries with lower output-per-capita grow faster than their richer counterparts. Furthermore, the high burden on a society, identified by a high dependency ratio, has a significant negative impact on growth in most specifications. Another interesting result of the analysis addresses the channels through which aid is likely to impact growth in the Arab region. Foreign direct investment and gross domestic investment are included as additional regressors in order to check whether aid affects growth through investment. The regression results reveal that, after controlling for these variables, Arab aid maintains an effect on growth in all pooled OLS specifications. This finding lends support to the view that aid affects growth through both capital formation (as captured by the two investment variables) and through channels that impact on technology or total factor productivity (TFP). However, this last conclusion is not robust to the FGLS specification of the model, thereby suggesting the TFP channel could be weak on average. Finally, the analysis examines whether aid contributes to the promotion of social services and, therefore, to the achievement of MDGs. To that end, the impact of lagged aid on changes in such basic indicators of human development as illiteracy and life-expectancy is examined (see table 5). Annex table 11 shows the results of a pooled OLS regression, with the social indicator representing the dependent variable and lagged total aid, one of the independent variables. Accordingly, there exists evidence in columns 2 and 4 of annex table 11 of a significant positive effect of aid to Arab countries on life expectancy and male life expectancy, albeit with no significant effect on illiteracy for the countries in the sample. This is not unlike the findings of Masud and Yontcheva who investigated the hypothesis that aid helps recipient countries to improve on such human development indicators as infant mortality and

42
education.97 Assuming that life expectancy functions as a proxy for the living conditions of the poor, then aid to the Arab countries appears to be effective in reaching out to the poor.
TABLE 5. ADDITIONAL VARIABLES IN THE SOCIAL SERVICES REGRESSION Agriculture value added per worker Measure of agricultural productivity. Value added in agriculture
measures the output of the agricultural sector less the value of intermediate inputs
Urban population as a percentage of total The share of the total population living in areas defined as urban in each country
Life expectancy The number of years a newborn infant could live if prevailing patterns of mortality at the time of its birth were to stay the same throughout its life
Life expectancy of women The number of years a newborn female infant could live if prevailing patterns of mortality at the time of her birth were to stay the same throughout her life
Life expectancy of men The number of years a newborn male infant would live if prevailing patterns of mortality at the time of his birth were to stay the same throughout his life.
Illiteracy rate Adult illiteracy rate is the percentage of people aged 15 and over who cannot, with understanding, read and write a short, simple statement in their everyday life
Sources: Compiled by ESCWA, based on the United Nations Educational, Scientific, and Cultural Organization (UNESCO) Institute for Statistics; and the World Bank, World Development Indicators (2006). Note: The countries and territories in the sample are as follows: Algeria, Bahrain, Egypt, Djibouti, Iraq, Jordan, Lebanon, Libyan Arab Jamahiriya, Mauritania, Morocco, Oman, Palestine, Somalia, Syrian Arab Republic, Sudan, Tunisia and Yemen.
97 N. Masud and B. Yontcheva, “Does foreign aid reduce poverty? Empirical evidence from nongovernmental and bilateral aid”, IMF Working Paper 05/100 (International Monetary Fund, May 2005).

43
IV. SUMMARY AND POLICY RECOMMENDATIONS
A. SUMMARY This study examined the role of foreign aid in development of the Arab region, with a particular focus on four ESCWA members, namely, Egypt, Jordan, Palestine and Yemen. Following an analysis of aid flows to Arab countries at a regional level, the study presented more detailed information on development assistance provided to these four ESCWA members. Against the background of recent progress in empirical research on the relationship between aid and development, the study then examined the impact of aid on development in the Arab region by means of a panel analysis. Overall, annual levels of aid flows to the Arab region have fluctuated substantially during the period 1970 to 2004, depending largely on economic circumstances and geopolitical considerations of donor countries. Throughout the entire period under consideration bilateral aid flows have exceeded multilateral flows. After a strong increase in the 1970s, the annual volume of aid received by Arab countries reached a maximum of nearly $16 billion in real terms in 1977. Most of the aid in the 1970s and early 1980s was provided by Arab countries, particularly Saudi Arabia. By contrast, the 1980s and 1990s were mainly characterized by declining levels of aid inflows and, in 2000, ODA flows had fallen to a low of $5.6 billion. This decrease was primarily the result of a strong decline in inter-Arab aid. ODA flows from other major donors, including the United States and countries of the European Union, had also fallen during this period, in part owing to a high level of scepticism regarding the effectiveness of development aid. Since 2000, ODA flows to Arab countries are again on an increasing trend, reaching almost $12 billion in 2004. However, most of the recent increase in aid can be attributed to the high aid volumes provided to the conflict countries and territories in the region, namely, Iraq and Palestine. An analysis of the geographical distribution patterns of aid has revealed that geopolitical considerations, colonial and cultural ties, and economic interests have often dominated developmental needs in donors’ aid allocation decisions. As a result, ODA flows to the Arab region during the past 25 years were not focused on the countries with the lowest income levels in the region. On the contrary, during the 1980s and 1990s, relatively more development assistance was given to the countries in the region with higher per capita income. In almost all Arab countries, the aid dependency ratio measured by the ratio of ODA inflows to GNI is currently significantly lower than it was in the 1970s and 1980s. With the exception of Iraq, Mauritania, Palestine and Somalia, Arab countries do not depend to a large extent on foreign aid. In Palestine, the average ODA to GNI ratio during the period 2000-2004 increased to the alarming level of 30 per cent. Regarding the degree of aid concessionality in the four selected ESCWA members, it was shown that development assistance in the form of grants relative to loans has gained prominence in recent years. In addition, the share of tied aid has significantly decreased during the past two decades to the extent that most aid to these four countries and territories is currently untied. In line with global trends, the share of technical cooperation in total aid has increased considerably in Egypt and Jordan. However, it has recently fallen in Palestine mainly owing to higher needs of emergency aid, and in Yemen in part as a result of absorptive capacity constraints. The sectoral allocation of average annual aid commitments has changed considerably in each of the four ESCWA members between the 1980s and 2000-2004. Foreign aid has been progressively more channelled to social sectors at the expense of economic sectors. The decline has been particularly pronounced for the productive sectors of industry and agriculture. Over the recent past, education has become a priority area of development aid in all four countries and territories under consideration. Aid to Egypt, Jordan and Yemen is several times more volatile than the GDP in these countries and, therefore, likely to be associated with a considerable degree of uncertainty. This study has also found

44
evidence of a weak pro-cyclicality of total aid commitments to all three countries, thereby suggesting that aid has not dampened the respective business cycles. The panel analysis provided evidence that both total ODA and short-impact aid have, on average, promoted economic growth in Arab and in other middle- and low-income countries. The results do not provide support for the hypothesis that aid only works in countries with a good policy framework. Moreover, no evidence was found for severe absorptive capacity constraints. The results also indicate that aid could have impacted growth both through capital accumulation and through increases in total factor productivity. When estimating the impact of aid on social indicators, the study found a significantly positive effect on life expectancy, albeit not on illiteracy.
B. POLICY RECOMMENDATIONS Arab countries, especially those in conflict and the LDCs, face the challenge of achieving a higher and more equitable growth path over the next decade in order to accelerate progress towards the achievement of MDGs. Primarily, this requires intensified efforts within these countries themselves aimed at establishing a policy framework that is more conducive to investment and employment generation and that reaches out to the poor. However, it also needs more efficient regional cooperation and increased support from industrialized countries. One of the factors that could contribute to faster economic and social progress is a substantial increase in foreign aid inflows to the developing countries in the region. While aid does not foster growth and development everywhere, recent empirical evidence indicates that on average it has positive returns. The results of this study suggest that in the Arab region there has been a significant beneficial impact of aid both on economic growth and on human development measured by life expectancy during the past decades. This finding provides additional justification for calls to scale up significantly the volume of development aid over the coming years. Given the observed high volatility of aid to both the region as a whole and to Egypt, Jordan and Yemen, which represent the three ESCWA members for which aid volatility and cyclicality were explicitly derived, a steadier and more predictable flow of aid funds is recommended. This would likely facilitate medium- and long-term planning and reduce potential negative effects of aid flows. Since aid volatility is the highest in the most aid-dependent countries, this issue is of particular importance for the LDCs in the region and those suffering from conflict. As illustrated in this study, available data show that aid flows to the region have generally not targeted the countries most in need. Over the past 30 years, aid flows to Arab countries were often motivated by geopolitical considerations and colonial and cultural ties, which has resulted in a bias against some of the least developed countries in the region. In addition, since the mid-1990s, bilateral and multilateral donor agencies have increasingly concentrated aid on developing countries with “good” policies and institutions, frequently basing their allocation patterns on controversial policy indexes, including, for example, the Country Policy and Institutional Assessment (CPIA) by the World Bank. While efforts by developing countries aimed at improving governance and fighting poverty must certainly be rewarded, the results of this study provide support for less focus of aid on countries with good policy environments. As with many other recent studies, the quality of policies did not turn out to be a decisive factor for the effectiveness of aid. This suggests that aid can have a positive impact in countries with a relatively low quality of policies and institutions. In addition, most empirical research has focused exclusively on the impact of foreign aid on economic growth. However, in a broader development framework, aid should not be evaluated solely through its effect on growth, rather there is a need to assess its impact on other dimensions of human development, including education, health, gender equality and protection of the environment. In some LDCs, development assistance could have contributed substantially to improvements in social and human indicators, even if this has not been translated into significantly higher economic growth rates.

45
Given that most Arab LDCs are not on track to meet MDGs by 2015, it is vital that both Arab and non-Arab donors channel a larger share of total ODA to these countries. A substantial increase in funds directed to LDCs is only feasible if some of the major donors to the region base their aid allocation decisions less on geopolitical and more on developmental considerations. The recent debate on the limited impact of foreign aid on development has led to a number of international initiatives aimed at increasing the effectiveness of aid in promoting development, including, most prominently, the Paris Declaration on Aid Effectiveness, which is organized around five main principles, namely: ownership, alignment, harmonization, managing for results and mutual accountability. This study has indicated that significant progress has been achieved in the area of untying aid provided to Egypt, Jordan, Palestine and Yemen. In order to ensure a stronger impact of aid on development it is essential that the framework and guidelines established in the Paris Declaration are actually applied in development strategies, programmes and projects. The targets of the Millennium Declaration and other internationally agreed development goals can help ESCWA member countries to set national priorities as the basis for establishing partnerships for external support. First, a top priority in the region must be set aimed at achieving greater harmonization between donors and recipients and between various donors for the same recipients. This issue is particularly important given that potential synergies have not been fully exploited in the region, and that better development outcomes could be achieved by improving the two-way communication between all partners. Recent experiences of development cooperation in Yemen clearly demonstrate the need to increase donor harmonization and to hold both sides accountable for the results. Moreover, Arab aid-recipients need to improve their record of policy implementation by enhancing the capacity of institutions that are responsible for the management of aid funds. At the same time, countries with a good performance and implementation record need to have greater ownership of the aid projects, must receive a larger share of total aid in the form of programme funding, and get longer-term commitments from the international donor community as this is also likely to contribute to institution-building. By contrast, countries with relatively poor institutions should receive more of their aid as project aid, especially if it is of a shorter-term nature. The analysis of the sectoral composition of aid flows to the four ESCWA members under consideration revealed major changes over the past two decades. During the 1980s, most of the aid to these countries was channelled to economic sectors, with the labour-intensive sectors of agriculture and industry receiving a significant part of the funds. During 2000-2004, by contrast, the bulk of foreign aid was directed towards social sectors, including education, Government and civil society, and water supply. Among the economic sectors, the focus increasingly shifted towards services, particularly banking and business. To a certain extent, these changes in the sectoral composition are in line with both increased efforts to accelerate MDG progress and the shift towards a more service-based economic structure of these countries. However, in the light of the strong rise in unemployment and underemployment rates in all four ESCWA members under consideration, the question arises whether decisions on the allocation of development assistance funds have taken into account the likely impact on employment. Consequently, future decisions on development assistance programmes and projects must give more weight to the short- and medium-term effects on employment. In the context of employment-generating development activities, human capacity-building remains of particular importance to Arab countries. The sectoral allocation of aid flows has demonstrated that in all four of the selected ESCWA members, education has become a priority area during the past years. Development aid has the capacity to empower people in rural areas, especially through technical assistance. Priority technical requirements for building human capacities must therefore be identified in all Arab countries, which will lay the basis for investment projects for donor financing over the immediate and longer terms. In this regard, a strategic rethinking on how to foster a local, home-grown private sector in these countries needs to be put on the top of the development agenda. Small and medium enterprise (SME) development designed specifically for women and the youth

46
could represent a significant step towards lowering unemployment rates and reducing the vast gender gap in earned income that still exists in most Arab countries. In the light of calls for a significant scaling up of aid to Arab countries, the provision of reliable and timely data remains a major challenge for the majority of Arab countries. One basic limitation faced by this study was that DAC statistics of the OECD database mainly measures donors’ efforts and, therefore, cannot be used to assess directly the outcomes in recipient countries. Many non-DAC statistics remain inadequate, with some Arab aid allocations categorized as “unallocated/unspecified” in terms of their “destinations”. Given that national sources provide only limited information on the types and characteristics of aid flows, all efforts to quantify aid effectiveness, to draw timetables and to set specific targets are effectively curtailed. The creation of a centralized data bank on aid to Arab countries, which could be executed by any of the existing regional funds, needs to be perceived as vital for disseminating good practices among member countries and for representing a major focus for Arab agencies. Finally, it is important to emphasize that aid should not be thought of as a panacea or the ultimate cure for the economic and human development challenges that Arab countries are currently facing. As argued above, intensified efforts to create a policy framework that addresses the main obstacles to a higher and more equitable development path are vital to ensuring faster progress towards the achievement of MDGs. Despite the heterogeneity of Arab countries, a number of obstacles to a better economic performance can be identified. These obstacles are mostly interrelated and characterize each country to varying degrees. These include insufficient investment levels and productivity gains, lagging political and institutional reforms, inefficient and inequitable educational systems, underdeveloped financial markets and high trade-related costs.

47
Annex
ANNEX TABLE 1. TOTAL BILATERAL/MULTILATERAL REAL NET ODA TO ALL ARAB COUNTRIES, 1970-2004 (Millions of constant 2003 United States dollars)
Multilateral Non-Arab (%)
Multilateral Arab (%)
Bilateral non-Arab (%)
Bilateral Arab (%) Total
1970 821 22 - - 2 009 55 826 23 3 655 1971 735 22 -* - 2 057 62 542 16 3 334 1972 741 22 - - 1 875 55 784 23 3 400 1973 848 12 - - 1 828 26 4 247 61 6 923 1974 936 8 286 3 2 158 19 7 977 70 11 358 1975 1 143 8 137 1 2 959 21 10 123 70 14 363 1976 1 174 8 1 025 7 3 417 24 8 501 60 14 116 1977 1 289 8 2 466 15 3 956 25 8 222 52 15 933 1978 1 552 11 1 932 14 4 379 32 6 017 43 13 879 1979 1 536 10 263 2 4 112 28 8 874 60 14 784 1980 1 606 10 222 1 4 639 30 8 989 58 15 457 1981 1 897 12 303 2 4 856 31 8 527 55 15 583 1982 1 908 14 220 2 5 238 39 6 103 45 13 469 1983 1 928 16 211 2 5 198 43 4 868 40 12 204 1984 1 655 14 128 1 5 836 51 3 932 34 11 551 1985 1 842 15 130 1 6 568 52 4 089 32 12 629 1986 1 391 14 132 1 5 704 56 2 919 29 10 146 1987 1 222 13 90 1 5 696 61 2 260 24 9 269 1988 1 199 17 114 2 5 101 73 577 8 6 992 1989 1 384 20 211 3 4 867 72 292 4 6 754 1990 1 350 10 113 1 7 075 51 5 243 38 13 780 1991 2 039 16 158 1 8 973 71 1 430 11 12 600 1992 1 448 16 268 3 6 571 74 650 7 8 937 1993 1 978 25 216 3 4 986 63 733 9 7 912 1994 1 862 23 275 3 5 470 67 568 7 8 175 1995 1 428 25 3 0 3 990 69 390 7 5 811 1996 1 739 28 (3) (0) 4 204 67 378 6 6 318 1997 2 037 33 (5) (0) 3 730 60 470 8 6 232 1998 2 108 34 (4) (0) 3 740 60 414 7 6 258 1999 1 820 31 5 0 3 736 64 281 5 5 842 2000 1 592 28 (0) (0) 3 555 63 497 9 5 644 2001 2 198 34 (2) (0) 3 596 55 737 11 6 529 2002 1 848 24 37 0 3 667 47 2 225 29 7 778 2003 1 953 23 1 0 6 201 74 278 3 8 432 2004 1 892 18 32 0 8 473 80 249 2 10 646
Source: Calculated by ESCWA, based on data from OECD. Note: Arab countries include Algeria, Bahrain, Comoros, Djibouti, Egypt, Iraq, Jordan, Kuwait, Lebanon, Libyan Arab Jamahiriya, Mauritania, Morocco, Oman, Palestine, Qatar, Saudi Arabia, Somalia, Sudan, Syrian Arab Republic, Tunisia, United Arab Emirates and Yemen. Aid is in constant 2003 million dollars.

48
ANNEX TABLE 2. NOMINAL AID FLOWS FROM ARAB SOURCES, 1970-2004 (Millions of United States dollars)
Total
Arab GCC
United
Arab
Emirates
Saudi
Arabia Oman Qatar Kuwait
Other
Arab Algeria Iraq
Libyan
Arab
Jamahiriya
1970-1974 7 696 6 611 923 4 013 … 279 1 396 1 085 73 453 559
1975-1979 31 870 29 130 4 857 18 515 … 1 076 4 682 2 740 449 1 577 714
1980-1984 32 741 30 450 2 768 21 503 6 692 5 481 2 291 354 1 091 846
1985-1989 15 515 14 831 272 12 253 198 28 2 080 684 262 -76 498
1990-1994 13 429 13 190 1 957 8 698 189 44 2 302 239 45 76 118
1995-1999 6 811 6 811 482 4 359 77 187 1 706 … … … …
2000-2004 15 776 15 776 1 471 12 339 73 392 1 501
2000 3 227 3 227 376 2 505 24 94 228 … … … …
2001 3 265 3 265 398 2 455 24 129 259 … … … …
2002 3 888 3 888 558 2 674 6 73 577 … … … …
2003 2 982 2 982 130 2 803 10 23 16 … … … …
2004 2 414 2 414 9 1 902 9 73 421 … … … …
1970-2004 139 614 132 575 14 201 94 019 616 3 090 20 649 7 039 1 183 3 121 2 735
Percentage 100.00 94.96 10.17 67.34 0.44 2.21 14.79 5.04 0.85 2.24 1.96
Source: Calculated by ESCWA, based on the Arab Unified Economic Report (AUER), 2005.
ANNEX TABLE 3. ARAB-BASED NATIONAL, REGIONAL AND MULTILATERAL ODA
(Millions of United States dollars)
Total aid extended since
creation To Arab region To Africa To Asia
To Latin America
To other countries
Share of each
institution
Regional Arab institutions
Arab fund (AFESD) 15 923.4 15 923.4 0 0 0 0 21.98
Arab Monetary Fund 4 293 4 293 0 0 0 0 5.93
Sub- total 20 216.4 20 216.4 0 0 0 0 27.91 National institutions for
ODA
Abu Dhabi fund 3 316.8 2 595.6 147 567 0 7.2 4.58
Saudi fund 7 636.9 3 674.7 1 440.6 2 367.8 59.9 93.9 10.54
Kuwait fund 13 014.4 6 965.1 2 280.5 3 196 302.5 270.3 17.97
Sub-total 23 968.1 13 235.4 3 868.1 6 130.8 362.4 371.4 33.09 Share of each beneficiary
region 100 55.22 16.14 25.58 1.51 1.55 Non-exclusively Arab
institutions
Islamic bank 20 528.3 10 049.2 2 014.6 8 422.7 17.5 24.3 28.34 Arab Bank for the
Development of Africa 2 348 9.6 2 338.4 0 0 0 3.24
OPEC fund 5 371 955.3 2 173.7 1 547.4 641 53.6 7.42
Sub-total 28 247.3 11 014.1 6 526.7 9 970.1 658.5 77.9 39.00 Share of each beneficiary
region 100 38.99 23.11 35.30 2.33 0.28 Total Arab and associated
funds 72 431.8 44 465.9 10 394.8 16 101 1 020.9 449.3 100.00 Total share of each
beneficiary region 100 61.39 14.35 22.23 1.41 0.62
Source: Calculated by ESCWA, based on the Arab Unified Economic Report (AUER), 2005.

49
ANNEX TABLE 4. TOP FIVE DONORS OF GROSS ODA, 2003-2004 AVERAGES (Millions of United States dollars)
Algeria Bahrain Comoros Djibouti
France 165 Arab Countries 95.6 France 13.9 France 25
EC 72 France 0.93 IDA 5.9 IDA 20
Spain 26 Japan 0.23 EC 4 Japan 8
Italy 25 UNTA 0.17 UNTA 1.8 EC 7
Germany 11 Germany 0.06 UNICEF 0.7 United States 5
Egypt Iraq Jordan Lebanon
United States 767 United States 2 286 United States 666 EC 61
EC 160 Japan 333 UNRWA 89 France 55
France 149 United Kingdom 228 Japan 72 UNRWA 54
Germany 134 Netherlands 107 Germany 71 United States 29
Arab Countries 104 EC 99 EC 59 Japan 14
Libyan Arab Jamahiriya Mauritania Morocco Oman
France 2.6 Japan 54 France 302 Arab Countries 62.2
Germany 2.58 EC 51 EC 184 Belgium 6.3
Italy 1.73 IDA 49 Japan 89 Japan 4
Turkey 0.77 France 48 Arab countries 82 France 0.8
UNHCR 0.7 United states 19 Germany 75 UNTA 0.8
Palestine Somalia Sudan Syrian Arab Republic
UNRWA 268 EC 38 United States 277 EC 70
United States 234 Norway 37 EC 158 Arab countries 48
EC 184 United States 33 United Kingdom 75 Japan 31
Norway 54 Netherlands 15 Norway 45 UNRWA 28
Sweden 37 Italy 12 Germany 32 France 23
Tunisia Yemen
France 167 IDA 91
Japan 110 Germany 34
EC 104 United States 33
Germany 46 Japan 30
Italy 41 Netherlands 29 Source: Calculated by ESCWA, based on data from OECD.
ANNEX TABLE 5. REAL NET ODA TO EGYPT, JORDAN, PALESTINE AND YEMEN, 1970-2004
(Millions of constant 2003 United States dollars)
Egypt Jordan Palestine Yemen 1970 895 398 - 88 1971 598 241 - 156 1972 541 393 - 205 1973 2 821 684 - 214 1974 4 164 904 - 593 1975 6 519 1 250 - 703 1976 5 700 1 364 - 1 229 1977 6 132 961 - 1 071 1978 5 426 992 - 856 1979 3 046 2 673 - 706 1980 2 691 2 401 - 1 081 1981 2 419 2 067 - 978

50
ANNEX TABLE 5 (continued)
Egypt Jordan Palestine Yemen 1982 2 664 1 571 - 1 104 1983 2 593 1 561 - 859 1984 3 143 1 386 - 863 1985 2 990 1 079 - 791 1986 2 578 913 - 533 1987 2 473 818 - 592 1988 2 030 551 - 400 1989 2 086 369 - 490 1990 6 707 1 058 - 491 1991 6 050 1 062 - 344 1992 4 100 458 - 278 1993 2 702 347 206 347 1994 2 998 380 514 180 1995 2 009 507 499 160 1996 2 236 497 566 245 1997 2 153 489 666 389 1998 2 145 450 683 408 1999 1 727 463 568 498 2000 1 515 614 741 309 2001 1 443 500 1 050 548 2002 1 330 568 1 850 668 2003 988 1 228 972 234 2004 1 368 554 1 048 232
Source: Calculated by ESCWA, based on data from OECD.
Annex figure. Real net ODA to Egypt, Jordan, Palestine and Yemen, 1970-2004
Source: Calculated by ESCWA, based on data from OECD.
- 1,000 2,000 3,000 4,000 5,000 6,000 7,000 8,000
1970 1973 1976 1979 1982 1985 1988 1991 1994 1997 2000 2003
(Mill
ions
of
cons
tant
200
3 U
S$)
Egypt Jordan Palestine Yemen

51
ANNEX TABLE 6. AVERAGE ANNUAL AID COMMITMENTS TO SOCIAL AND ECONOMIC SECTORS IN EGYPT, JORDAN, PALESTINE AND YEMEN, 1980-2004
(Millions of United States dollars)
Social Sectors Economic Sectors
80-89 90-99 00-04 80-89 90-99 00-04
Education 84 69 119 Agriculture and Industry 386 268 74
Government 65 124 55 Energy 288 192 84
Health 46 63 24 Transport, Storage and Communication 215 109 26
Other Social Infrastructure 51 91 84 Banking and Business 81 205 185
Water Supply and sanitation 200 233 73 Tourism and Trade 0 6 123
Egypt
Sum 446 581 355 Sum 970 781 492
Education 11 21 35 Agriculture and Industry 36 23 17
Government 3 18 28 Energy 11 16 1
Health 2 7 11 Transport, Storage and Communication 42 6 4
Other Social Infrastructure 2 11 31 Banking and Business 5 15 23
Water Supply and sanitation 16 58 95 Tourism and Trade - 8 7
Jordan
Sum 34 115 200 Sum 93 67 52
Education NA 21 47 Agriculture and Industry 10 17
Government NA 35 102 Energy 12 13
Health NA 14 40 Transport, Storage and Communication 14 23
Other Social Infrastructure NA 21 70 Banking and Business 7 21
Water Supply and sanitation NA 51 127 Tourism and Trade 1 0
Palestine
Sum NA 142 387 Sum 43 74
Education 26 21 77 Agriculture and Industry 101 33 30
Government 3 22 32 Energy 22 8 6
Health 10 16 19 Transport, Storage and Communication 35 29 17
Other Social Infrastructure 1 14 55 Banking and Business - 12 1
Water Supply and sanitation 29 41 56 Tourism and Trade - 0 2
Yemen
Sum 69 113 239 Sum 158 82 56
Source: Calculated by ESCWA, based on data from the Creditor Reporting System (CRS) of OECD.
ANNEX TABLE 7. RESULTS OF POOLED ORDINARY LEAST SQUARES (OLS) REGRESSIONS: NO INVESTMENT VARIABLES AND ASSUMING ALL AID
IS THE TOTAL AGGREGATE, LAGGED ONCE
OLS
(1)
OLS
(2)
OLS
(3)
OLS
(4)
OLS
(5)
OLS
(6)
FGLS
(7)
-0.666 -0.659 -0.658 -0.660 -0.577 -0.566 -0.566
Initial GDP (0.306)* (0.341) (0.342) (0.377) (0.384) (0.388) (0.306)
-0.008 -0.014 -0.014 -0.014 -0.013 -0.015 -0.015
Inflation lag (0.011) (0.011) (0.011) (0.011) (0.012) (0.012) (0.0015)
-0.044 -0.127 -0.127 -0.127 -0.131 -0.139 -0.139
Government size lag (0.060) (0.061)* (0.061)* (0.062)* (0.071) (0.075) (0.059)
0.028 0.005 0.005 0.005 0.012 0.011 0.012
M2GDP lag (0.016) (0.016) (0.016) (0.016) (0.016) (0.016) (0.017)

52
ANNEX TABLE 7 (continued)
OLS
(1)
OLS
(2)
OLS
(3)
OLS
(4)
OLS
(5)
OLS
(6)
FGLS
(7)
0.423 0.540 0.542 0.542 0.666 0.734 0.734
Open (0.306) (0.314) (0.315) (0.312) (0.341) (0.358)* (0.357)*
-0.035 -0.030 -0.030 -0.030 -0.050 -0.060 -0.060
Rent (0.034) (0.031) (0.032) (0.032) (0.035) (0.041) (0.037)
-0.036 -0.043 -0.043 -0.043 -0.038 -0.037 -0.037
Dependency ratio (0.017)* (0.017)* (0.017)* (0.017)* (0.017)* (0.017)* (0.017)*
0.404 0.541 0.532 0.532 0.520 0.521 0.521
ICRG (0.164)* (0.166)** (0.191)** (0.195)** (0.201)* (0.202)* (0.164)**
-0.627 0.094 0.096 0.093 0.319 0.362 0.362
Ethnic fractionalization (0.898) (0.896) (0.898) (0.932) (0.952) (0.959) (0.833)
-0.015 -0.027 -0.028 -0.060 0.169 0.169
Aid (0.048) (0.113) (0.145) (0.298) (0.538) (0.524)
0.347 0.350 0.350 0.924 0.930 0.930
Arab aid (0.087)** (0.088)** (0.096)** (0.254)** (0.255)** (0.327)**
0.002 0.002 0.011 0.012 0.012
Aid* ICRG (0.020) (0.021) (0.029) (0.030) (0.028)
0.000 -0.001 -0.014 -0.014
Aid2 (0.005) (0.005) (0.025) (0.025)
0.000 -0.111 -0.111
Aid* policy (0.078) (0.219) (0.226)
-0.297 -0.292 -0.292
Arab aid* policy (0.107)** (0.111)** (0.152)
0.006 0.006
Aid2*policy (0.011) (0.012)
8.893 10.459 10.501 10.513 9.369 9.387 9.387
Constant (3.238)** (3.271)** (3.240)** (3.590)** (3.745)* (3.752)* (3.311)**
Observations 268 268 268 268 268 268 268
R-squared 0.16 0.21 0.21 0.21 0.22 0.22 ****
Time dummies
Jointly
significant
Jointly
significant
Jointly
significant
Jointly
significant
Jointly
significant
Jointly
significant
Jointly
significant
Outliers Excluded Excluded Excluded Excluded Excluded Excluded Excluded
Source: Compiled by ESCWA.
Note: * significant at 5 per cent and ** significant at 1 per cent. Everywhere, the one-lag of the total aid variable is used as an alternative to
instrumentation. Robust standard errors are in parentheses.
ANNEX TABLE 8. RESULTS OF OLS: ALL INVESTMENT VARIABLES AND ASSUMING ALL AID IS THE TOTAL AGGREGATE
OLS
(1)
OLS
(2)
OLS
(3)
OLS
(4)
OLS
(5)
FGLS
(6)
-1.288 -1.390 -1.406 -1.338 -1.329 -1.329
Initial GDP (0.291)** (0.332)** (0.368)** (0.369)** (0.378)** (0.311)**
0.011 0.006 0.005 0.005 0.005 0.005
Inflation lag (0.012) (0.012) (0.012) (0.012) (0.012) (0.014)
-0.033 -0.073 -0.073 -0.072 -0.077 -0.077
Government size lag (0.051) (0.057) (0.057) (0.063) (0.068) (0.055)
0.020 -0.001 -0.001 0.001 0.001 0.001
M2GDP lag (0.016) (0.016) (0.016) (0.016) (0.016) (0.016)
-0.082 0.099 0.106 0.119 0.117 0.117
Open (0.314) (0.310) (0.307) (0.305) (0.306) (0.296)

53
ANNEX TABLE 8 (continued)
OLS
(1)
OLS
(2)
OLS
(3)
OLS
(4)
OLS
(5)
FGLS
(6)
-0.057 -0.058 -0.059 -0.080 -0.085 -0.085
Rent (0.030) (0.028)* (0.029)* (0.039)* (0.044) (0.037)*
-0.039 -0.040 -0.040 -0.034 -0.034 -0.034
Dependency ratio (0.015)* (0.015)* (0.015)** (0.016)* (0.016)* (0.017)*
0.306 0.436 0.418 0.413 0.411 0.411
ICRG (0.152)* (0.156)** (0.189)* (0.200)* (0.200)* (0.158)**
-1.264 -0.841 -0.870 -0.640 -0.618 -0.618
Ethnic fractionalization (0.803) (0.817) (0.847) (0.855) (0.872) (0.799)
0.365 0.392 0.395 0.383 0.382 0.382
FDI (0.160)* (0.163)* (0.167)* (0.166)* (0.167)* (0.157)*
4.357 4.009 4.006 4.018 4.003 4.003
GDI (0.694)** (0.687)** (0.687)** (0.684)** (0.682)** (0.709)**
-0.072 -0.108 -0.102 0.124 0.124
Aid (0.046) (0.146) (0.360) (0.734) (0.725)
0.281 0.282 1.139 1.105 1.105
Arab aid (0.081)** (0.086)** (0.361)** (0.369)** (0.608)
0.004 0.006 0.007 0.007
Aid* ICRG (0.018) (0.024) (0.024) (0.025)
0.001 0.002 -0.011 -0.011
Aid2 (0.005) (0.005) (0.033) (0.038)
-0.012 -0.068 -0.068
Aid* policy (0.067) (0.163) (0.171)
-0.238 -0.226 -0.226
Arab aid* policy (0.100)* (0.104)* (0.165)
0.003 0.003
Aid2*policy (0.008) (0.009)
1.920 4.549 4.790 3.824 3.910 3.910
Constant (3.549) (3.592) (3.951) (3.932) (3.886) (3.562)
Observations 268 268 268 268 268 268 (60ids)
R-squared 0.29 0.32 0.32 0.32 0.32
Time dummies
Jointly
significant
Jointly
significant
Jointly
significant
Jointly
significant
Jointly
significant
Jointly
significant
Outliers Excluded Excluded Excluded Excluded Excluded Excluded
Source: Compiled by ESCWA.
Note: * significant at 5 per cent and ** significant at 1 per cent. Everywhere, the one-lag of the total aid variable is used as an alternative to
instrumentation. Robust standard errors are in parentheses.
ANNEX TABLE 9. RESULTS OF OLS: NO INVESTMENT VARIABLES AND ASSUMING ALL AID IS SHORT-TERM AID
OLS
(1)
OLS
(2)
OLS
(3)
OLS
(4)
FGLS
(5)
-0.831 -0.729 -0.923 -0.844 -0.844
Initial GDP (0.413)* (0.475) (0.486) (0.510) (0.369)*
-0.012 -0.012 -0.014 -0.014 -0.014
Inflation lag (0.013) (0.013) (0.014) (0.014) (0.016)
-0.101 -0.105 -0.147 -0.146 -0.146
Government size lag (0.077) (0.077) (0.086) (0.085) (0.064)*
0.007 0.007 0.021 0.024 0.024
M2GDP lag (0.020) (0.020) (0.022) (0.022) (0.019)

54
ANNEX TABLE 9 (continued)
OLS
(1)
OLS
(2)
OLS
(3)
OLS
(4)
FGLS
(5)
0.297 0.267 0.321 0.235 0.235
Open (0.359) (0.358) (0.347) (0.341) (0.364)
-0.038 -0.041 -0.021 -0.031 -0.031
Rent (0.035) (0.038) (0.040) (0.041) (0.036)
-0.047 -0.050 -0.063 -0.062 -0.062
Dependency ratio (0.020)* (0.019)** (0.019)** (0.019)** (0.019)**
0.610 0.554 0.480 0.452 0.452
ICRG (0.185)** (0.198)** (0.212)* (0.209)* (0.173)**
0.079 0.258 -0.249 -0.295 -0.295
Ethnic fractionalization (1.013) (1.065) (1.116) (1.115) (0.923)
-0.056 -0.103 3.155 9.158 9.158
Short-term aid (0.105) (0.307) (1.836) (4.023)* (3.745)*
0.534 0.668 0.764 1.427 1.427
Short-term Arab aid (0.162)** (0.228)** (0.682) (0.827) (0.761)
0.041 -0.031 0.008 0.008
Short-term aid* ICRG (0.057) (0.058) (0.066) (0.070)
-0.014 0.016 -1.012 -1.012
Short-term aid2 (0.017) (0.024) (0.638) (0.564)
0.489 1.407 1.407
Short-term aid* policy (0.264) (0.597)* (0.569)*
-0.155 -0.465 -0.465
Short-term Arab aid* policy (0.249) (0.322) (0.321)
-0.153 -0.153
Short-term aid2* policy (0.094) (0.084)
8.783 8.406 13.166 12.338 12.338
Constant (3.685)* (3.998)* (4.079)** (4.189)** (3.712)**
Observations 235 235 217 217 217 (55 ids)
R-squared 0.21 0.21 0.26 0.28
Time dummies Jointly significant Jointly significant Jointly significant Jointly significant Jointly significant
Outliers Excluded Excluded Excluded Excluded Excluded
Source: Compiled by ESCWA.
Note: * significant at 5 per cent and ** significant at 1 per cent. Everywhere, the one-lag of the total aid variable is used as an alternative to
instrumentation. Robust standard errors are in parentheses.
ANNEX TABLE 10. RESULTS OF OLS: ALL INVESTMENT VARIABLES, ASSUMING
ALL AID IS SHORT-TERM AID
OLS
(1)
OLS
(2)
OLS
(3)
OLS
(4)
FGLS
(5)
-1.572 -1.519 -1.433 -1.433 -1.433
Initial GDP (0.403)** (0.465)** (0.470)** (0.471)** (0.362)**
0.011 0.011 0.011 0.011 0.011
Inflation lag (0.013) (0.014) (0.013) (0.014) (0.015)
-0.056 -0.057 -0.066 -0.066 -0.066
Government size lag (0.072) (0.073) (0.075) (0.077) (0.060)
0.007 0.006 0.007 0.007 0.007
M2GDP lag (0.020) (0.021) (0.020) (0.020) (0.018)
-0.177 -0.196 -0.182 -0.182 -0.182
Open (0.351) (0.344) (0.344) (0.345) (0.344)

55
ANNEX TABLE 10 (continued)
OLS
(1)
OLS
(2)
OLS
(3)
OLS
(4)
FGLS
(5)
-0.068 -0.067 -0.098 -0.098 -0.098
Rent (0.035) (0.035) (0.045)* (0.048)* (0.039)*
-0.037 -0.039 -0.030 -0.031 -0.031
Dependency ratio (0.017)* (0.017)* (0.018) (0.018) (0.018)
0.472 0.463 0.519 0.519 0.519
ICRG (0.196)* (0.194)* (0.231)* (0.232)* (0.179)**
-0.971 -0.901 -0.531 -0.529 -0.529
Ethnic fractionalization (0.925) (0.965) (1.002) (1.001) (0.891)
0.424 0.420 0.388 0.388 0.388
FDI (0.195)* (0.198)* (0.201) (0.201) (0.180)*
4.207 4.190 4.182 4.183 4.183
GDI (0.728)** (0.724)** (0.720)** (0.727)** (0.758)**
-0.241 -0.208 0.177 0.157 0.157
Short-term aid (0.291) (0.310) (0.961) (1.331) (1.374)
0.446 0.483 1.880 1.887 1.887
Short-term Arab aid (0.172)* (0.191)* (0.843)* (0.879)* (1.242)
0.016 0.024 0.003 0.003 0.003
Short-term aid* ICRG (0.045) (0.050) (0.072) (0.072) (0.068)
-0.006 -0.004 -0.002 -0.002
Short-term aid2 (0.016) (0.019) (0.053) (0.077)
-0.084 -0.079 -0.079
Short-term aid* policy (0.140) (0.265) (0.304)
1.089 0.820 -0.392 -0.403 -0.396
Constant (3.984) (4.287) (4.400) (4.448) (0.330)
Short-term Arab aid* policy -0.395 -0.396 -0.000
(0.229) (0.232) (0.020)
Short-term aid2* policy -0.000 1.699
(0.014) (3.925)
Observations 235 235 235 235 235 (56 ids)
R-squared 0.32 0.32 0.33 0.33
Time dummies Jointly significant Jointly significant Jointly significant Jointly significant Jointly significant
Outliers Excluded Excluded Excluded Excluded Excluded
Source: Compiled by ESCWA.
Note: * significant at 5 per cent and ** significant at 1 per cent. Everywhere, the one-lag of the aid variable is used as an alternative to
instrumentation. Robust standard errors are in parentheses.
ANNEX TABLE 11. RESULTS OF OLS SOCIAL IMPACT OF AID
OLS
(1)
OLS
(2)
OLS
(3)
OLS
(4)
Illiteracy Life expectancy Life expectancy female Life expectancy male
0.000 0.000 0.000 0.000
Real GDP per capita (0.001) (0.000) (0.000) (0.000)
-0.002 0.001 0.001 0.001
Agriculture VA per worker (0.001) (0.000)** (0.000)** (0.000)**
-0.395 0.135 0.154 0.117 Urban population (percentage
of total) (0.077)** (0.029)** (0.028)** (0.030)**

56
ANNEX TABLE 11 (continued)
OLS
(1)
OLS
(2)
OLS
(3)
OLS
(4)
Illiteracy Life expectancy Life expectancy female Life expectancy male
0.254 -0.304 -0.307 -0.301
ICRG (0.659) (0.225) (0.228) (0.227)
-0.562 0.082 0.111 0.055
Government consumption (0.180)** (0.068) (0.069) (0.068)
0.654 -0.250 -0.270 -0.231
Dependency ratio (0.077)** (0.029)** (0.030)** (0.030)**
0.678 0.262 0.200 0.320
Arab aid (0.479) (0.104)* (0.102) (0.110)**
-0.045 0.001 0.002 -0.001
Aid (0.034) (0.012) (0.012) (0.012)
13.354 69.916 72.204 67.738
Constant (9.085) (3.165)** (3.259)** (3.125)**
Observations 298 298 298 298
R-squared 0.58 0.67 0.70 0.63
Source: Compiled by ESCWA.
Note: * significant at 5 per cent and ** significant at the 1per cent level. Everywhere, the one-lag of the total aid variable is used as an
alternative to instrumentation. Robust standard errors are in parentheses.