The Economic and Fiscal Impacts of the Distilling Industry in ...
74
The Economic and Fiscal Impacts of the Distilling Industry in Kentucky, 2021 Prepared for the Kentucky Distillers’ Association by Paul Coomes, Ph.D. Economic Consultant, and Emeritus Professor of Economics University of Louisville and Barry Kornstein Economic Consultants with assistance from Rob Monsma January 19, 2022
-
Upload
khangminh22 -
Category
Documents
-
view
0 -
download
0
Transcript of The Economic and Fiscal Impacts of the Distilling Industry in ...
The Economic and Fiscal Impacts of the Distilling Industry in Kentucky, 2021
Prepared for the
Kentucky Distillers’ Association
by
Paul Coomes, Ph.D.
Economic Consultant, and
Emeritus Professor of Economics
University of Louisville
and
Barry Kornstein
Economic Consultants
with assistance from Rob Monsma
January 19, 2022

CONTENTS
EXECUTIVE SUMMARY ....................................................................................................... 1
THE SIZE OF THE DISTILLING INDUSTRY IN KENTUCKY ..................................................... 5
Distilleries by location ............................................................................................ 5 Bourbon production and inventory ........................................................................ 6 Employment and payrolls ....................................................................................... 8 Exports .................................................................................................................... 9 Distilling’s share of Kentucky and national economic activity ................................ 9 Impact of Covid-19 ............................................................................................... 12 Recent and planned investments by Kentucky distillers ...................................... 14 Barrel production ................................................................................................. 16 Grain purchases .................................................................................................... 17 Other physical inputs ............................................................................................ 17
ECONOMIC IMPACTS ....................................................................................................... 18
Employment, output, payroll ............................................................................... 18 Impact of construction ......................................................................................... 20 Impact of equipment investment ......................................................................... 22 Average annual impact from planned investments ............................................. 22
TAXATION AND FISCAL IMPACTS .................................................................................... 24
Property taxes ...................................................................................................... 26 Tax revenues related to payrolls of distilleries ..................................................... 29 State licenses and fees ......................................................................................... 30 Local licenses and fees ......................................................................................... 30 Alcohol consumption taxes .................................................................................. 31 Tax impacts over time .......................................................................................... 33
CONCLUSION .................................................................................................................... 36
APPENDICESA. Federal industrial classification codes relevant to the distilling industry .................... 38
B. Licensed distillers in Kentucky ...................................................................................... 39 C. Measures of employment and payroll for Kentucky’s distilling industry ..................... 44 D. National growth in distilling establishments over the last decade .............................. 53 E. Exports of Kentucky distilled spirits .............................................................................. 55 F. The distilling industry’s linkages to other industries .................................................... 58 G. Grain usage by Kentucky distillers ............................................................................... 62 H. Economic multipliers .................................................................................................... 65 I. Wholesale tax rates on alcohol, by state ....................................................................... 69

The Distilling Industry in Kentucky, 2021 1
Executive Summary
istilling in Kentucky continues its incredible two-decade growth wave. Almost every
important economic measure is up over our prior studies – facilities, production,
employment, payroll, investment, inventory, taxes generated.
There have been two headwinds for the industry since our last study, and both are now
receding. The decline in Bourbon exports is set to rebound now that the European Union has
suspended its retaliatory tariffs for three years – in sync with the United States’ reduction in
tariffs on steel and aluminum imports. And the Covid-19 pandemic hit the Bourbon tourism
industry hard in 2020; but 2021 saw a strong recovery at Kentucky Bourbon Trail® visitor
centers across the Commonwealth.
Kentucky produces and ages 95 percent of the Bourbon sold and consumed in the world.
Kentucky companies are also involved in distilling, bottling, packaging and shipping many
different kinds of distilled spirits (sometimes distilled elsewhere and brought to Kentucky
facilities for final processing). Nearly all distillers market their products outside of Kentucky and
the United States, making distilled spirits a major export industry for the Commonwealth.
The sales of distilled spirits support the wages, salaries and benefits of workers in the state’s
distilling industry, as well as those employed by suppliers. The dollars circulate further, as
employees spend their income in the regional economy, generating jobs and income in other
industries.
This is the sixth statewide economic study of the distilling industry that we have conducted for
the Kentucky Distillers’ Association (KDA) since 20091. Our first report identified 19 distilling
establishments in eight counties, directly supporting about 3,000 jobs. In 2021, we were able to
identify 95 establishments in 40 counties, employing approximately 6,000 people.
Those direct distilling jobs support many other jobs around Kentucky, due to supplier linkages
with other industries and to the spending and re-spending of employee payrolls in communities
around the state. We estimate that the total annual economic impact of the distilling industry is
22,540 jobs, with annual payroll of $1.23 billion, producing $8.94 billion of economic output.
This is an estimate of what would happen in the state in the event the distilling industry
disappeared from Kentucky.
1 This study, finalized in 2021, primarily refers to economic and fiscal activity in 2020. Some of the data used are on
a calendar year basis, and other data are on a July to June fiscal year basis. In all cases, we use the latest data available. The first study, released in and titled ‘2009’, primarily refers to activity in 2008.
D

The Distilling Industry in Kentucky, 2021 2
Meanwhile, other states are taking notice of the distilling industry with now more than 2,200
distilleries operating in the other 49 states. Those states offer a variety of incentives and
privileges making it attractive to lure what was once a Kentucky dominated industry.
The current study updates and expands our five previous studies, offering an examination of
distilling industry growth, impact on other industries in Kentucky, and contribution to state and
local government tax revenues.
Among the most important and interesting findings are:
The state database on licensed distillers reveals 95 distilling locations operated by 75
companies in Kentucky as of 2021, with several more license applications in the pipeline.
This is five times the number of distilleries documented in our original 2009 study, with
most of the growth due to the emergence of craft distilleries. There are distilleries now in
40 counties. While craft distilleries are distributed throughout the state, large “heritage”
distilleries remain concentrated in the “amber triangle” region of Central Kentucky
between Lexington, Bardstown and Louisville, but also as far away as Owensboro.
Kentucky distillers produced 2.4 million barrels of Bourbon in 2020, and now have a
record 10.3 million barrels stored in warehouses. Adding in brandy and other aging spirits
brings the total barrel inventory to nearly 11 million.
In 2020 there were approximately 6,000 people working directly in Kentucky’s distilled
spirits industry, with annual wages and salaries of $602 million. Federal economic
statistics indicate that over the last two decades, the number of distilling establishments
in Kentucky tripled, with an 83 percent growth in employment, and a 250 percent growth
in wages and salaries. For the first time, average annual pay per job surpassed $100,000.
The full economic impact of the distilling industry includes the linked activity of suppliers
and new household spending. In our original study, focused on 2008 activity, we
estimated the total economic impact in Kentucky to be 9,848 jobs and $442 million in
payroll. For 2020, we estimate that the total economic impact has grown to 22,540 jobs
and $1.23 billion in payroll – more than double that of 12 years prior.
The distilling industry in Kentucky has been rapidly adding jobs over the past two
decades, while on net, the remainder of the state’s manufacturing industry has shed
employment. However, due to the enormous rise of craft distilleries in other states,
Kentucky’s national share of distilling jobs has slipped from 43 percent to 30 percent from
2001 to 2020. Likewise, the state’s share of distilling jobs has slipped from 24 percent to 6

The Distilling Industry in Kentucky, 2021 3
percent in the last 20 years. Kentucky’s share of national distilling payroll has remained in
the 45 to 50 percent range, due to the location of several major industry headquarters in
the state.
Kentucky distillers shipped $391 million of products abroad in 2020. The industry’s
exports are dominated by whiskies, with Bourbon the main component. The noticeable
decline in 2020 was due to the heavy retaliatory tariffs imposed on whiskey by the
European Union and China, reducing Kentucky whiskey exports by $170 million. Other
products exported by Kentucky distillers include brandy, liqueurs, cordials, vodka, rum,
and gin.
Our IMPLAN model shows the distilling industry stands out from others in terms of the
unusually high tax burden as it relates to the portion of output, with taxes accounting for
21 cents per dollar of output. Only three other industries generate a higher tax share –
wholesale petroleum, commercial fishing, and tobacco manufacturing – and all are much
smaller than distilling in terms of Kentucky employment and payroll. The wine industry is
taxed at 3.2 cents per dollar of output; breweries are taxed at 8.2 cents per dollar output.
For most manufacturing sectors, the portion of each dollar of output that goes to taxes is
less than a penny.
The distilling industry is estimated to directly or indirectly be responsible for about $286
million in state and local tax payments in Kentucky annually. The total includes local and
state property, taxes, local occupational taxes, and Kentucky state individual income and
sales taxes. State government accounts for 80 percent of the total tax revenues, with 20
percent going to local government entities.
Kentucky remains the only jurisdiction in the world that taxes aging spirits in the barrel,
largely because in other states and countries it is viewed as a part of the production
process. For 2021, the Kentucky Department of Revenue estimates local and state
governments would collect $33.2 million in taxes on barrels aging in inventory, and that
inventory is assessed at $4.4 billion. Another $10.4 million in property taxes were paid last
year on distillers’ real estate and equipment.
Kentucky distillers paid more than $1.8 billion in federal excise tax on alcohol production
in 2020. That means the Commonwealth’s signature industry accounted for 22 percent of
alcohol excise tax paid nationally, by far the largest share by any state.
The value of real and tangible property owned by Kentucky distillers has quadrupled in
the last decade, while the value of the distilled spirits inventory aging in barrels has nearly
The Distilling Industry in Kentucky, 2021 4
tripled in that time. These increasing values mean distillers are paying considerably more
in more real and tangible property taxes, resulting in a marked increase in impact of the
distilling industry over that time.
KDA members reported capital spending of $1.9 billion over the last five years, almost
equally split between construction and other items, such as machinery, equipment, and
furnishings. Moreover, they plan to spend $3.3 billion over the next five years for a total
of $5.2 billion in capital investment over a 10-year period. Every KDA member, whether a
large Heritage producer or a small Craft distiller, reported significant investments. This is
by far the highest investment spending we have documented over our five studies since
2009. NOTE: This capital spending number includes only the hard costs of construction and does not include the cost to distill, produce and age product, as some distilleries calculate for promotional purposes.
Distilling continues to have the second-highest job multiplier across 329 manufacturing
industries with activity in Kentucky; the only one with both more jobs and a higher
employment multiplier than distilling is light truck and utility vehicle manufacturing. Our
IMPLAN custom regional input-output model is used for estimating the economic impact
of distilling, the most conventional method available for such analyses. These models can
predict the impact of changes in one industry on all other industries in a regional
economy. The most common summary measure of an industry’s economic impact is
called a multiplier, which is the ratio of the change in the total economy to the change in
the industry.
A hypothetical $10 million new distillery construction project, based on the report’s economic models, would create 85 direct construction jobs with a $4.9 million estimated
payroll. In total – with direct, indirect and induced effects combined – the project would lead to $17.5 million in sales increases across Kentucky firms, 130 new jobs, and a $7.2 million
payroll increase statewide.
Corn production grew faster in core distilling counties the past two decades than it did
statewide, data indicate. This correlated growth was especially apparent in Nelson,
Shelby, Washington, Mercer and Marion – where large, heritage distillers are located.
Nelson County is, of course, home to many heritage distilleries. Marion County is home to
Maker’s Mark distillery, and has seen a tripling of corn production over the past 20 years.

The Distilling Industry in Kentucky, 2021 5
The Size of the Distilling Industry in Kentucky
e treat the distilling industry here as the collection of firms that earn revenues
primarily from distilling and selling spirits. These firms may engage in other
revenue-generating activities, such as making brandy, beer, wooden barrels,
tourism and hospitality, research, managing and marketing other product lines (including wines
and non-spirits products), and selling merchandise in their gift shops.
Economic statisticians attempt to classify industrial activity by business establishment, or
location. If a distilling company makes barrels in one location, distills Bourbon in another
location, ages it in warehouses at another location, and has corporate offices at yet another
location, then the company might have activity listed under four different industrial
classifications.
The detailed industrial classification codes relevant to Kentucky’s distilling industry are provided
in Appendix A. We presume the companies would not be located in Kentucky were it not for
their distilling operations, and hence for purposes of this study we attempt to count all of their
activity as part of the industry.
Distilleries by location
A comprehensive list of the current licensed distilling operations in Kentucky is provided in
Appendix B. The operations may include only distilling, or the whole range of distilling, bottling
and office functions. The license database indicates there are distilleries in 95 distinct locations
in 50 cities and 40 counties. About 75 separate companies own these distilling operations.
Looking back at our previous studies, we see the number of distillery locations grew from 19 in
2009, to 31 in 2013, to 68 in 2018, and 95 in 2021. All but one of the net new additions to the
list since 2018 are small distilleries, licensed to produce less than 50,000 gallons annually.
The major producers in the distilling industry in Kentucky are the Bardstown Bourbon Company,
Beam Suntory (Jim Beam and Maker’s Mark), Brown-Forman, Castle & Key, Diageo, Four Roses,
Green River, Heaven Hill, the Louisville Distilling Company, Lux Row, Michter’s, Rabbit Hole,
Sazerac (Barton 1792, Buffalo Trace, and Glenmore), Wild Turkey, and Wilderness Trail.
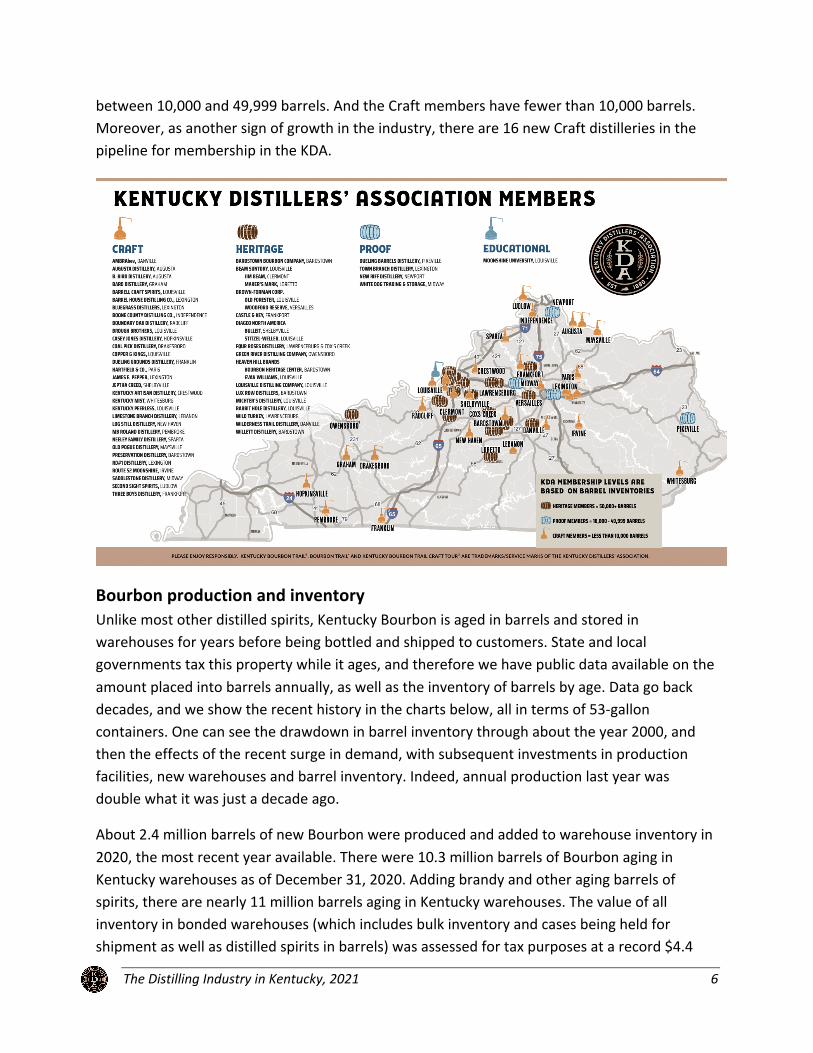
With the exception of Owensboro, the larger distilleries are located near Interstates 64, I-65, or
the Bluegrass Parkway. Smaller craft distilleries have opened across the state. The map shows
locations of KDA members throughout the state by level of membership (not all distillers are
KDA members). There are now more than 50 member distilleries, up from only seven in our
original study in 2009.
KDA now has four levels of membership: Heritage, Proof, Craft and Educational. Heritage
members have an inventory of over 50,000 barrels. Proof members have an inventory of
W
The Distilling Industry in Kentucky, 2021 6
between 10,000 and 49,999 barrels. And the Craft members have fewer than 10,000 barrels.
Moreover, as another sign of growth in the industry, there are 16 new Craft distilleries in the
pipeline for membership in the KDA.
Bourbon production and inventory
Unlike most other distilled spirits, Kentucky Bourbon is aged in barrels and stored in
warehouses for years before being bottled and shipped to customers. State and local
governments tax this property while it ages, and therefore we have public data available on the
amount placed into barrels annually, as well as the inventory of barrels by age. Data go back
decades, and we show the recent history in the charts below, all in terms of 53-gallon
containers. One can see the drawdown in barrel inventory through about the year 2000, and
then the effects of the recent surge in demand, with subsequent investments in production
facilities, new warehouses and barrel inventory. Indeed, annual production last year was
double what it was just a decade ago.
About 2.4 million barrels of new Bourbon were produced and added to warehouse inventory in
2020, the most recent year available. There were 10.3 million barrels of Bourbon aging in
Kentucky warehouses as of December 31, 2020. Adding brandy and other aging barrels of
spirits, there are nearly 11 million barrels aging in Kentucky warehouses. The value of all
inventory in bonded warehouses (which includes bulk inventory and cases being held for
shipment as well as distilled spirits in barrels) was assessed for tax purposes at a record $4.4

The Distilling Industry in Kentucky, 2021 7
billion in 2021. Inventory subject to county-level property taxes (mostly in barrels) was assessed
at $2.55 billion in 2020, when the total bonded warehouse assessment was $3.84 billion.
Property tax records also reveal the age distribution of Bourbon barrels in Kentucky
warehouses. We have complete data for KDA members only, but members traditionally account
for about 85 percent of annual production statewide, and thus the vintage profile is
representative of the industry. One can see in the chart below how inventories begin to be
drawn down, particularly after four years of aging. However, there remains over 240,000
barrels that have been stored in warehouses for more than eight years.
-
2,000,000
4,000,000
6,000,000
8,000,000
10,000,000
12,000,000
Barrels of Bourbon Produced, and Warehouse Inventory, Kentucky Totals, 1970-2020
Source: Kentucky Distillers' Association, and Kentucky Department of Revenue, as of the end of each year.
Inventory
Production

The Distilling Industry in Kentucky, 2021 8
There are no published official data on the annual value of production, or sales, by distillers of
spirits in Kentucky. Annual production volume is obviously different than sales volume for most
Kentucky spirits, due to the need to age Bourbon for several years. And the value of products
bottled or otherwise sold varies continually with changing market prices around the world. Our
IMPLAN input-output model of Kentucky, which we use below to estimate economic impacts,
predicts Kentucky distillers produced $5.8 billion of output in 2019. This is 30 percent of the
$19.5 billion IMPLAN predicts for the U.S. distilling industry as a whole, and is the same as
Kentucky’s share of national distilling employment.
Employment and payrolls
In 2020 there were approximately 6,000 people working directly in Kentucky’s distilled spirits
industry, with annual wages and salaries of $602 million. Over the last two decades, the
number of distilling establishments more than tripled in Kentucky. Distilling employment grew
by 83 percent, and wages and salaries grew by 249 percent. For the first time, average annual
pay per job has passed $100,000. There are actually several different sources of employment
and payroll data, and we discuss these at some length in Appendix C. The primary estimates of
225,018
105,521217,264
417,348
834,881
1,285,020
1,542,258
1,848,459
2,050,391
0
500,000
1,000,000
1,500,000
2,000,000
2,500,000
Over 8 years 2013 2014 2015 2016 2017 2018 2019 2020
Number of Bourbon Barrels in Inventory by Year ProducedKDA Members Only
Source: Kentucky Department of Revenue, as produced for purposes of annual property tax assessments, and provided to the Kentucky Distillers' Association. KDA
members have traditionally accounted for about 87 percent of state production.
The Distilling Industry in Kentucky, 2021 9
jobs and payroll we use for our modeling of economic impacts are derived from required
employer filings for state unemployment insurance premiums, which we consider to be the
most comprehensive and accurate of available estimates. This is supplemented by information
obtained from a recent survey of KDA members, and from the Kentucky Directory of
Manufacturers.
Exports of Bourbon and other distilled products
Kentucky distillers shipped over $391 million of products abroad in 2020, with whiskey
accounting for 82 percent of the total. Other products exported by Kentucky distillers include
grape brandy, liqueurs, cordials, vodka, rum, and gin. High retaliatory tariffs by the European
Union and China on U.S. whiskey caused Kentucky exports to fall from its historical peak of
$488.6 million in 2019 to $319.0 million in 2020 – a drop of about $170 million – which pulled
down the total spirits category. Even so, the value of Kentucky whiskey exports is now triple
what it was in 2000, reflecting growth in both volume and price. The leading importers of
Kentucky whiskey last year were Japan, Spain, Australia, United Kingdom, Canada, and
Germany. The Distilled Spirits Council of the United States (DISCUS) digs deeper into federal
export data and breaks out Bourbon from the whiskey category. The group shows $304 million
in Bourbon exports in 2020, on 19.7 million proof gallons of volume. Note, 82 percent of
Bourbon is exported in bulk, rather than form. See Appendix E for more detail on exports.
Distilling’s share of Kentucky and national economic activity
It is well known that we are amid a national boom in small, local distilling operations. These are
sometimes called craft distillers, or micro-distillers. We examine the growth over the past
decade of distillery establishments nationally in some detail in Appendix D, and reveal the
recently occurred wide geographic spread.
Nationally, distillers employing fewer than 10 people grew from 78 to 716 establishments.
Small distillers were in 58 U.S. counties in 2006, but a decade later they were in 400 counties
across the country.
However, there has been little change in the location of large distilling operations. Among the
large employers, most are in Kentucky or adjacent states. Several Kentucky counties have
distillery operations employing more than 400 people – Bullitt, Franklin, Jefferson, and Nelson.
As we document in Appendix C, Kentucky’s share of distilling establishments fell from 24 to 6
percent over the 2001-20 period, while its share of employment fell from 43 to 30 percent.
Kentucky’s share of distilling payroll rose from 40 to 45 percent of the U.S. total, due largely to
the presence of high paying professional jobs at headquarters here. So, while the industry has
expanded greatly in terms of geographic locations, Kentucky remains the main player in terms of
overall production, employment, and payroll.

The Distilling Industry in Kentucky, 2021 10
Distilling directly supports around 6,000 jobs, which is a small fraction (0.2 percent) of all jobs in
Kentucky. However, this is a narrow way to view the industry’s economic importance for
several reasons. First, one needs to distinguish between jobs that are based on making things
we sell to other states and the rest of world, and jobs that are based on producing things sold
mainly to Kentucky households.
The export-based jobs bring new dollars into the region and make the economy larger, while
the population-based jobs essentially absorb dollars already in the region. Distilling products
are widely exported out-of-state, and the industry is an economic engine for Kentucky.
Industries like grocery stores, most retail, health care, education, and personal services exist to
serve regional populations, and hence expand only in response to growth in the population and
income, which in turn is determined primarily by growth in Kentucky’s exporting industries.
Second, employment is only one important indicator of an industry’s relative importance. Other
economic variables include the value of output, employee compensation, and tax revenues
generated. In all of these dimensions, distilling has a greater economic contribution than a
simple job count would suggest.
Couriers and messengers
All other crop farming
Scientific research and devl svc
Mgmt of companies and enterprises
Insurance carriers, except direct life
Hotels and motels, incl casino hotelsAnimal production, except cattle
and poultry and eggs
Mgmt consulting svc
Wholesale - Other durable goods merchant wholesalers
Beef cattle ranching and farming, incl feedlots and dual-purpose
ranching and farming
Custom computer programming svc
Scenic and sightseeing trans and support activities for trans
Computer systems design svc
Wholesale - Machinery, equip, and supplies
Light truck and utility vehicle mfg
Automobile mfg
Grain farmingPrinting
Motor vehicle seating and interior trim mfg
Other plastics product mfg
Other motor vehicle parts mfgCoal mining
Tobacco farming
Poultry processing
Motor vehicle steering, suspension component (except spring), and
brake systems mfg
Other amusement and recreation industries
Motor vehicle metal stamping
Distilleries
Bread and bakery product, except frozen, mfgOther accommodations
Data processing, hosting, and related svcOil and gas extraction
Poultry and egg productionPaperboard container mfg
Wood container and pallet mfgRadio and television broadcasting
Water trans
Spring and wire product mfg
Aluminum sheet, plate, and foil mfg
Commercial and industrial machinery and equip rental and
leasingMotor vehicle body mfg
0.0%
0.5%
1.0%
1.5%
2.0%
2.5%
3.0%
3.5%
4.0%
4.5%
5.0%
0.0% 0.2% 0.4% 0.6% 0.8% 1.0% 1.2% 1.4% 1.6% 1.8%
Shar
e of
Ken
tuck
y Out
put
Share of Kentucky Employment
Top Exporting Industries' Share of Kentucky Employment and OutputSource: IMPLAN model of Kentucky, using 2019 economic data

The Distilling Industry in Kentucky, 2021 11
In the chart above, we highlight the 40 export-based industries in Kentucky that rank highest in
employment as a share of the state total, using estimates from our IMPLAN model. We also
show their relative contributions to total state output. One can see distilling ranks fourth
highest in terms of output contribution, reflecting the high value of the distilling product, as
well as the high employee pay, dividend payments and exceptionally high taxes paid. In terms
of contribution to state output, the light truck and auto manufacturing industries lead the way,
followed by insurance carriers, then distilling. Not shown are the rankings in terms of employee
compensation, where distilling ranks 14th statewide.
Another way to look at the economic importance of industries in Kentucky is to examine what
their share is of the national counterpart industries. This is summarized in the next chart. For
544 detailed industrial sectors, we divided Kentucky’s employment and output by the national
totals for each industry. Clearly, distilling stands out by this measure, with 30 percent of
national distilling employment, 30 percent of national output, and (not shown) 45 percent of
national employee compensation. No other Kentucky industry has higher shares of both
national employment and output.
Couriers and messengers
All other crop farmingScientific research and devl svc
Animal production, except cattle and poultry …
Light truck and utility vehicle mfg
Automobile mfg
Motor vehicle seating and interior trim mfg
Other motor vehicle parts mfg
Coal mining
Tobacco farming
Poultry processing
Motor vehicle steering, suspension component (except spring), and brake systems mfg
Motor vehicle metal stamping
Distilleries
Wood container and pallet mfgWater trans
Spring and wire product mfg
Aluminum sheet, plate, and foil mfg
Motor vehicle body mfg
0%
5%
10%
15%
20%
25%
30%
35%
0% 5% 10% 15% 20% 25% 30% 35% 40% 45%
KY Sh
are
of U
S Ou
tput
KY Share of US Employment
Top Kentucky Exporting Industries' Share of US Employment and OutputSource: IMPLAN model of Kentucky and United States, using 2019 economic data

The Distilling Industry in Kentucky, 2021 12
Impact of Covid-19
The Covid-19 pandemic publicly hit the United States in February 2020, and by March there
were widespread business closures due to state government orders or from private decisions to
protect employees and customers. As was well-documented, many distilleries shifted
production from spirits to hand sanitizer to aid the national effort to slow the spread of the
virus. Bourbon-based tourism certainly suffered in Kentucky, as visitor centers closed and
people stopped traveling except for essential needs.
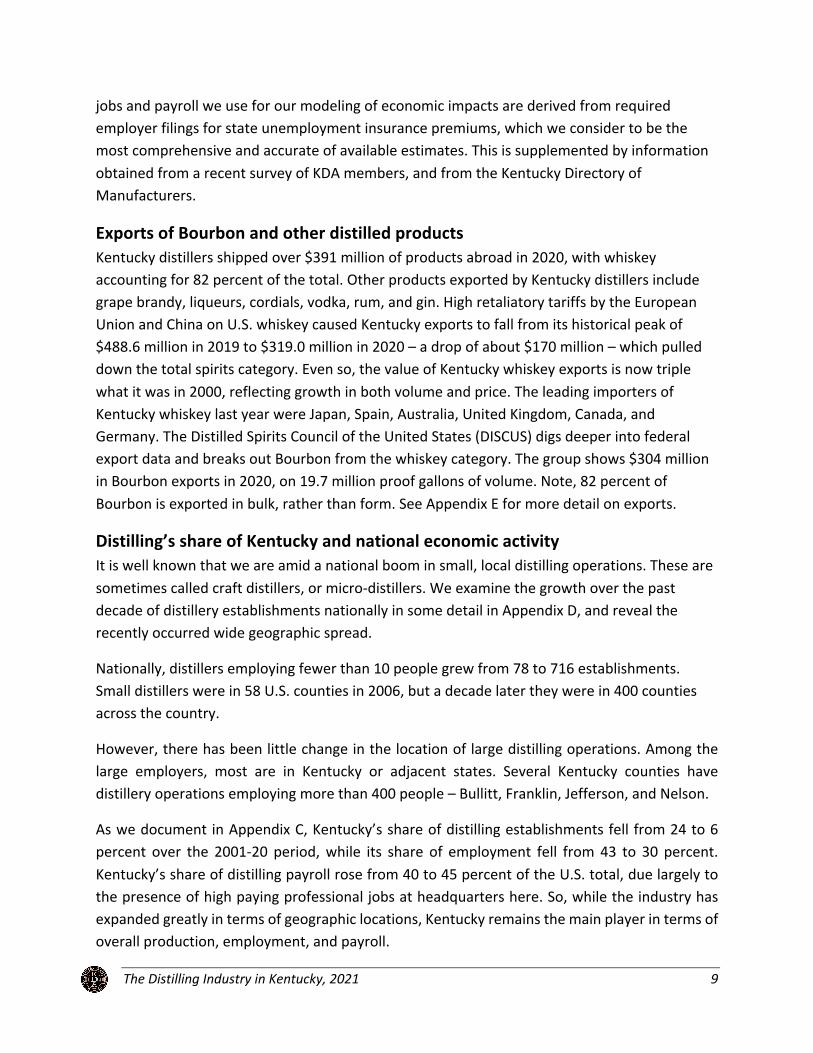
However, U.S. sales of domestic whiskey continued to grow in 2020, as consumers shifted more
toward home consumption and purchased more premium brands. National data from the
Distilled Spirits Council of the United States (DISCUS) show these trends over the past two
decades. Below are two charts, first for volume, second for value. The shift to more expensive
brands, as well as the strong growth in cases sold, is evident in the charts. Suppliers had
revenues of $4.3 billion in 2020, inclusive of federal excise taxes paid. They sold 28.4 million
cases of domestic whiskey last year in the U.S. Super Premium whiskies accounted for only 2.4
percent of volume sold in 2002, but by 2020 its share had grown to 14.4 percent.
0
5,000
10,000
15,000
20,000
25,000
30,000
2002 2003 2004 2005 2006 2007 2008 2009 2010 2011 2012 2013 2014 2015 2016 2017 2018 2019 2020
US Whiskey Sales by Branding, Cases (000) of 9-liter Bottles
Super
Premium
High End
Premium
Premium
Value
Source: Distilled Spirits Council of the United States, www.distilledspirits.org/wp-
content/uploads/2021/01/American-Whiskey-2020.pdf
The Distilling Industry in Kentucky, 2021 13
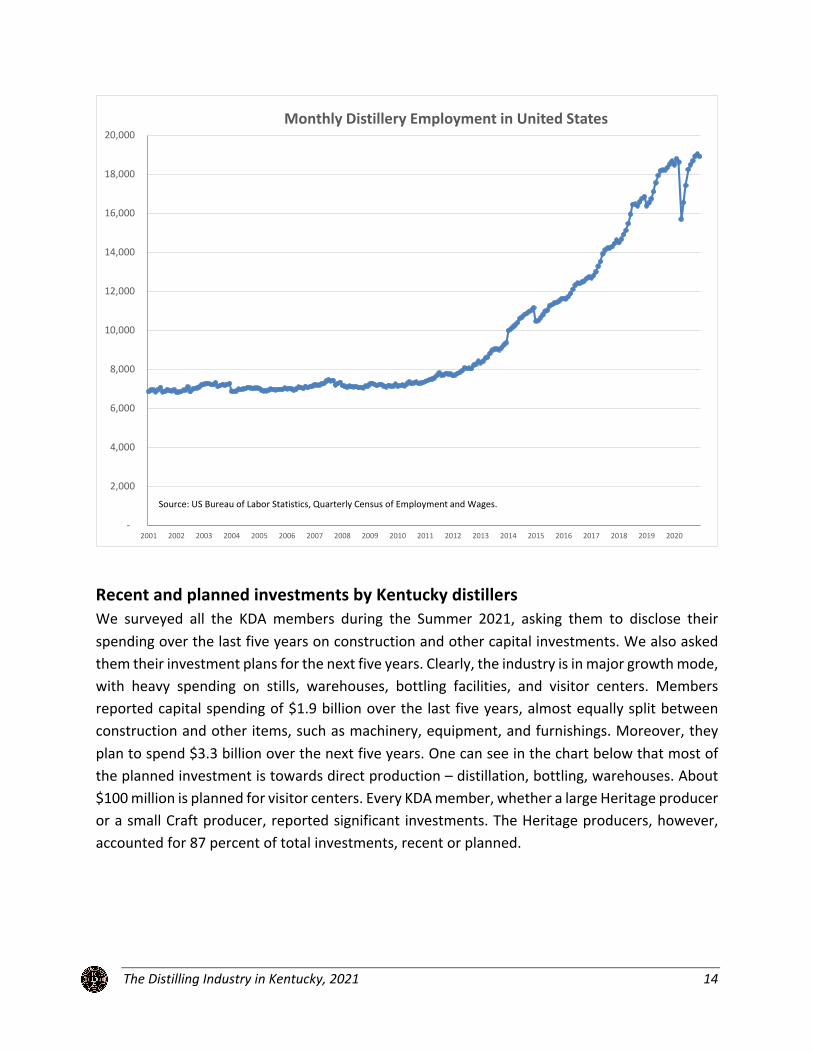
Monthly data on distillery employment are available nationally, but not at the state level.
However, as Kentucky accounts for almost a third of the industry employment, we can
reasonably use the national data to discern the degree of retrenchment regionally. As one can
see, employment declined from 2019 levels in April, May, and June of 2020, but then began to
grow again in late summer. April was the hardest hit month, with a decline of 1,400 jobs
nationally, or 8.2 percent compared to April 2019. Wages and salaries also declined in the
second quarter of 2020, by $10.7 million compared to the same quarter in 2019, or 3.6 percent.
Payrolls returned to robust growth in the third quarter of 2020.
We do have comparable data on the average monthly distilling employment in Kentucky, and
they show 2.4 percent growth in 2020 over 2019, almost identical to the 2.6 percent growth
nationally. So, the Covid-19 impact pictured here likely applies to Kentucky as well.
$0
$500
$1000
$1500
$2000
$2500
$3000
$3500
$4000
$4500
$5000
2003 2004 2005 2006 2007 2008 2009 2010 2011 2012 2013 2014 2015 2016 2017 2018 2019 2020
US Whiskey Sales by Branding, Supplier Revenues (million $)
Super
Premium
High End
Premium
Premium
Value
Source: Distilled Spirits Council of the United States, www.distilledspirits.org/wp-
content/uploads/2021/01/American-Whiskey-2020.pdf , includes federal excise taxes.
The Distilling Industry in Kentucky, 2021 14
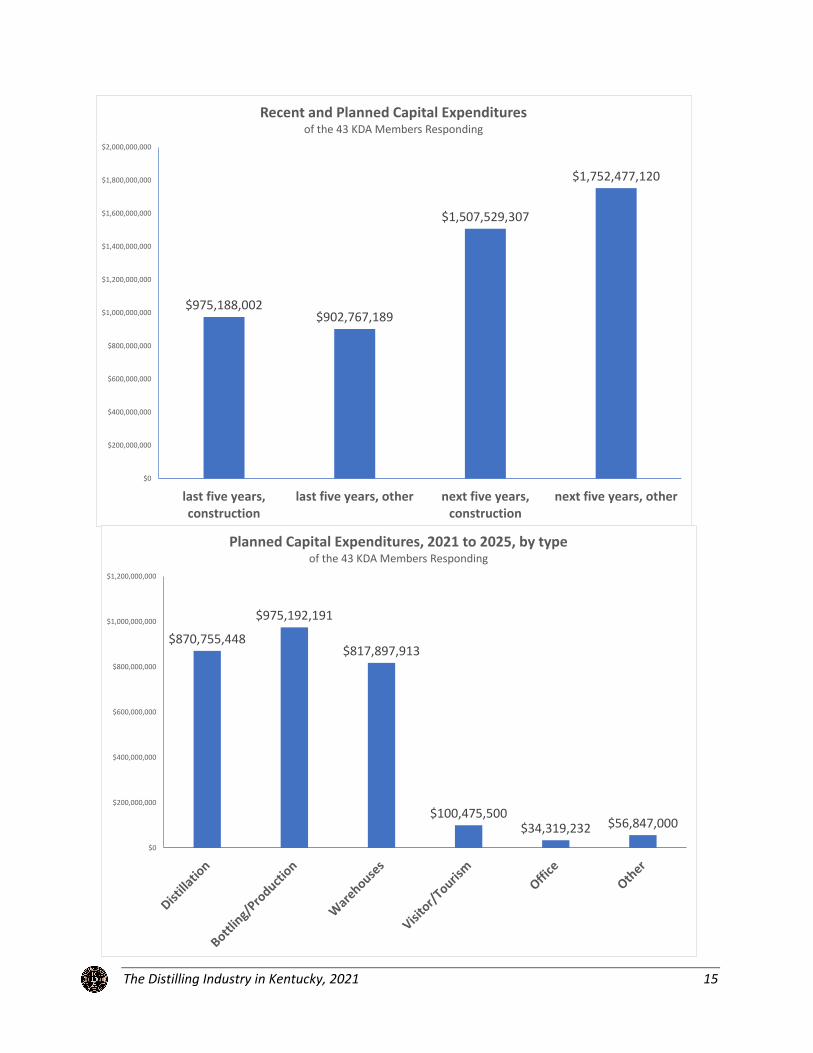
Recent and planned investments by Kentucky distillers
We surveyed all the KDA members during the Summer 2021, asking them to disclose their
spending over the last five years on construction and other capital investments. We also asked
them their investment plans for the next five years. Clearly, the industry is in major growth mode,
with heavy spending on stills, warehouses, bottling facilities, and visitor centers. Members
reported capital spending of $1.9 billion over the last five years, almost equally split between
construction and other items, such as machinery, equipment, and furnishings. Moreover, they
plan to spend $3.3 billion over the next five years. One can see in the chart below that most of
the planned investment is towards direct production – distillation, bottling, warehouses. About
$100 million is planned for visitor centers. Every KDA member, whether a large Heritage producer
or a small Craft producer, reported significant investments. The Heritage producers, however,
accounted for 87 percent of total investments, recent or planned.
-
2,000
4,000
6,000
8,000
10,000
12,000
14,000
16,000
18,000
20,000
2001 2002 2003 2004 2005 2006 2007 2008 2009 2010 2011 2012 2013 2014 2015 2016 2017 2018 2019 2020
Monthly Distillery Employment in United States
Source: US Bureau of Labor Statistics, Quarterly Census of Employment and Wages.
The Distilling Industry in Kentucky, 2021 15
$975,188,002$902,767,189
$1,507,529,307
$1,752,477,120
$0
$200,000,000
$400,000,000
$600,000,000
$800,000,000
$1,000,000,000
$1,200,000,000
$1,400,000,000
$1,600,000,000
$1,800,000,000
$2,000,000,000
last five years,construction
last five years, other next five years,construction
next five years, other
Recent and Planned Capital Expendituresof the 43 KDA Members Responding
$870,755,448
$975,192,191
$817,897,913
$100,475,500$34,319,232 $56,847,000
$0
$200,000,000
$400,000,000
$600,000,000
$800,000,000
$1,000,000,000
$1,200,000,000
Planned Capital Expenditures, 2021 to 2025, by typeof the 43 KDA Members Responding

The Distilling Industry in Kentucky, 2021 16
A related measure of investment is available from the Kentucky Cabinet for Economic
Development. The agency tracks publicly announced projects, and records the planned
investment and the projected number of new direct jobs. There were 114 distillery projects
announced between 2014 and 2020, totaling $3.2 billion in value. We have organized the data
by year, as shown in the accompanying charts. Two-thirds of the investment was listed solely as
production activity – distilling, bottling, warehousing. The other one-third reported a mixture of
investments, usually to include production, visitor centers, and offices. Eleven projects
mentioned a visitor center, and 12 projects mentioned a headquarters investment.
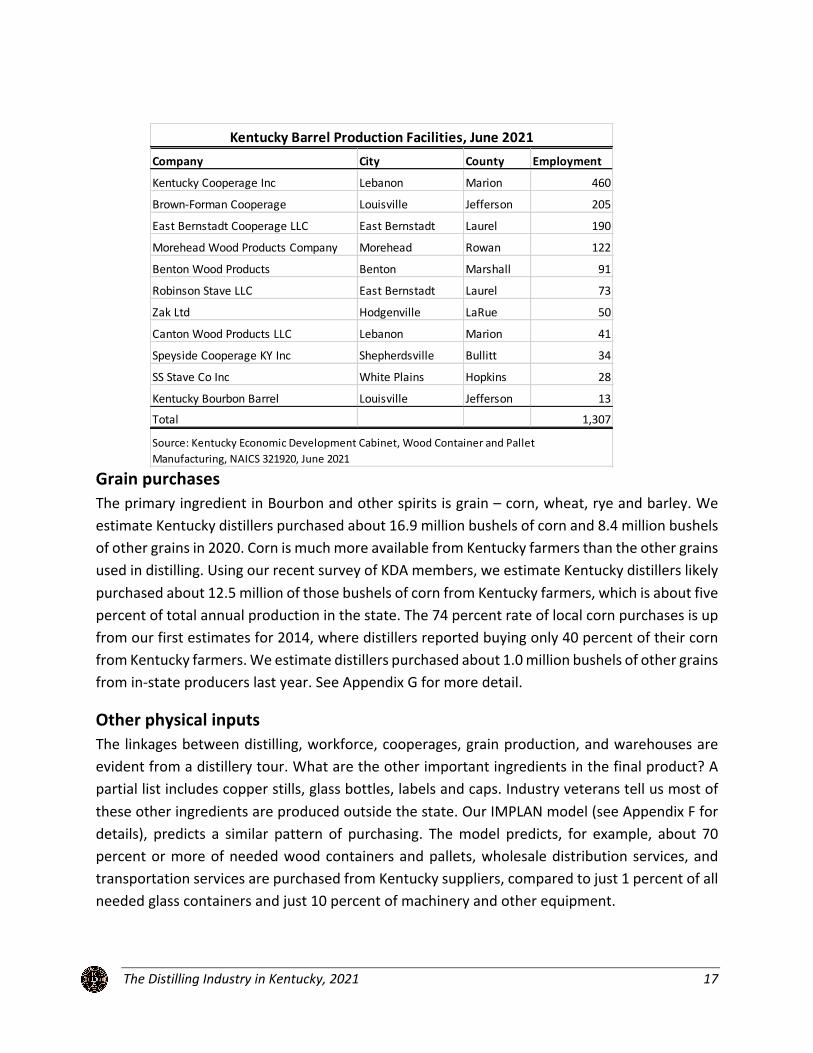
Barrel production
Bourbon requires several years of storage in new oak barrels. Because of the concentration of
Bourbon distilleries in Kentucky, as well as the state’s large endowment of oak forests, there are
many cooperages and related operations here. A recent query of the database maintained by the
Kentucky Cabinet for Economic Development revealed 13 barrel producing operations, with total
employment of over 1,300. We see operations in eight counties, with two each in Jefferson and
Marion counties.
$448,445,795
$167,727,512 $189,880,077
$320,738,585
$1,600,952,714
$153,433,702
$278,377,885
$0
$200,000,000
$400,000,000
$600,000,000
$800,000,000
$1,000,000,000
$1,200,000,000
$1,400,000,000
$1,600,000,000
$1,800,000,000
2014 2015 2016 2017 2018 2019 2020
Announced Investments by Kentucky Distillersas approved for incentives by the Kentucky Economic Development Cabinet
The Distilling Industry in Kentucky, 2021 17
Grain purchases
The primary ingredient in Bourbon and other spirits is grain – corn, wheat, rye and barley. We
estimate Kentucky distillers purchased about 16.9 million bushels of corn and 8.4 million bushels
of other grains in 2020. Corn is much more available from Kentucky farmers than the other grains
used in distilling. Using our recent survey of KDA members, we estimate Kentucky distillers likely
purchased about 12.5 million of those bushels of corn from Kentucky farmers, which is about five
percent of total annual production in the state. The 74 percent rate of local corn purchases is up
from our first estimates for 2014, where distillers reported buying only 40 percent of their corn
from Kentucky farmers. We estimate distillers purchased about 1.0 million bushels of other grains
from in-state producers last year. See Appendix G for more detail.
Other physical inputs
The linkages between distilling, workforce, cooperages, grain production, and warehouses are
evident from a distillery tour. What are the other important ingredients in the final product? A
partial list includes copper stills, glass bottles, labels and caps. Industry veterans tell us most of
these other ingredients are produced outside the state. Our IMPLAN model (see Appendix F for
details), predicts a similar pattern of purchasing. The model predicts, for example, about 70
percent or more of needed wood containers and pallets, wholesale distribution services, and
transportation services are purchased from Kentucky suppliers, compared to just 1 percent of all
needed glass containers and just 10 percent of machinery and other equipment.
Company City County EmploymentKentucky Cooperage Inc Lebanon Marion 460
Brown-Forman Cooperage Louisville Jefferson 205
East Bernstadt Cooperage LLC East Bernstadt Laurel 190
Morehead Wood Products Company Morehead Rowan 122
Benton Wood Products Benton Marshall 91
Robinson Stave LLC East Bernstadt Laurel 73
Zak Ltd Hodgenville LaRue 50
Canton Wood Products LLC Lebanon Marion 41
Speyside Cooperage KY Inc Shepherdsville Bullitt 34
SS Stave Co Inc White Plains Hopkins 28
Kentucky Bourbon Barrel Louisville Jefferson 13Total 1,307
Kentucky Barrel Production Facilities, June 2021
Source: Kentucky Economic Development Cabinet, Wood Container and Pallet Manufacturing, NAICS 321920, June 2021
The Distilling Industry in Kentucky, 2021 18
Economic Impact of the Distilling Industry in Kentucky
n this section, we analyze how production, jobs, and payroll in the distilling industry ripple
throughout Kentucky, creating even more economic activity. We use a custom input-output
model of the state to represent the linkages between distilling and hundreds of other
industries, as well as households, and then to predict the total economic impacts.
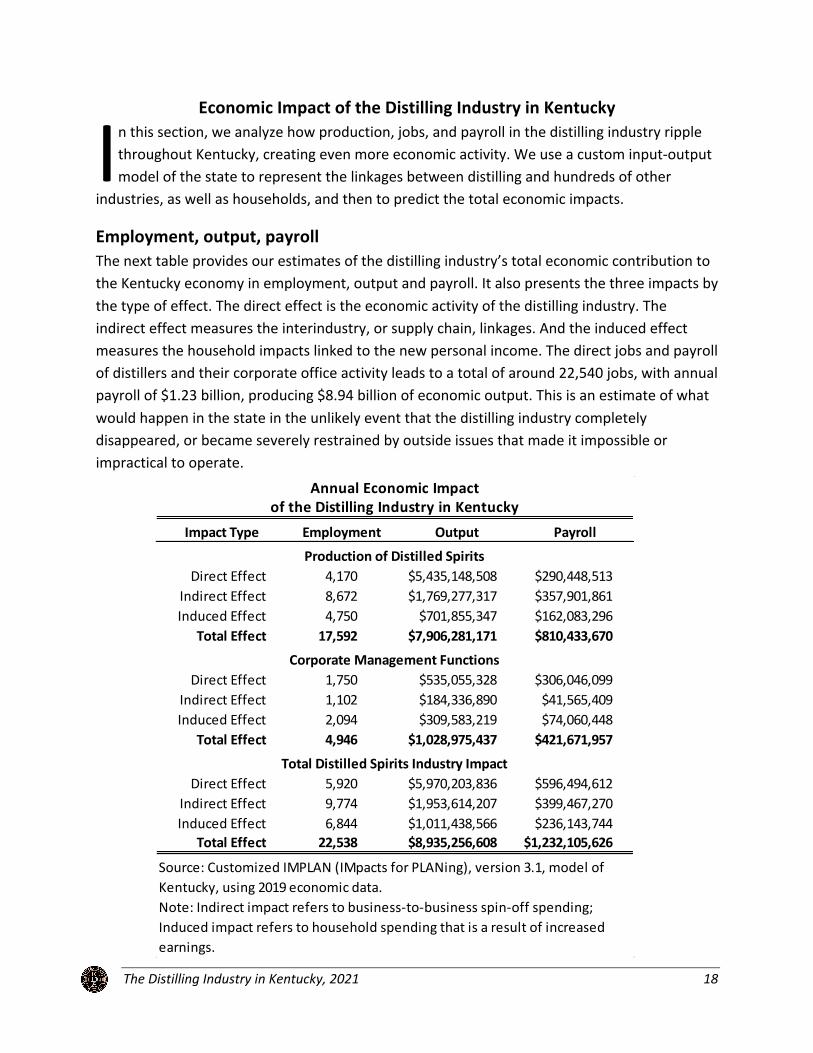
Employment, output, payroll
The next table provides our estimates of the distilling industry’s total economic contribution to
the Kentucky economy in employment, output and payroll. It also presents the three impacts by
the type of effect. The direct effect is the economic activity of the distilling industry. The
indirect effect measures the interindustry, or supply chain, linkages. And the induced effect
measures the household impacts linked to the new personal income. The direct jobs and payroll
of distillers and their corporate office activity leads to a total of around 22,540 jobs, with annual
payroll of $1.23 billion, producing $8.94 billion of economic output. This is an estimate of what
would happen in the state in the unlikely event that the distilling industry completely
disappeared, or became severely restrained by outside issues that made it impossible or
impractical to operate.
I
Impact Type Employment Output Payroll
Direct Effect 4,170 $5,435,148,508 $290,448,513Indirect Effect 8,672 $1,769,277,317 $357,901,861Induced Effect 4,750 $701,855,347 $162,083,296
Total Effect 17,592 $7,906,281,171 $810,433,670
Direct Effect 1,750 $535,055,328 $306,046,099Indirect Effect 1,102 $184,336,890 $41,565,409Induced Effect 2,094 $309,583,219 $74,060,448
Total Effect 4,946 $1,028,975,437 $421,671,957
Direct Effect 5,920 $5,970,203,836 $596,494,612Indirect Effect 9,774 $1,953,614,207 $399,467,270Induced Effect 6,844 $1,011,438,566 $236,143,744
Total Effect 22,538 $8,935,256,608 $1,232,105,626
Note: Indirect impact refers to business-to-business spin-off spending; Induced impact refers to household spending that is a result of increased earnings.
Annual Economic Impactof the Distilling Industry in Kentucky
Production of Distilled Spirits
Corporate Management Functions
Total Distilled Spirits Industry Impact
Source: Customized IMPLAN (IMpacts for PLANing), version 3.1, model of Kentucky, using 2019 economic data.

The Distilling Industry in Kentucky, 2021 19
Our economic impact analysis is based on approximately 6,000 distilling industry jobs across the
state – 4,250 production-related jobs and 1,750 corporate management-related jobs1. Our
IMPLAN models have been customized to reflect the particular structure of the industry in
Kentucky and all the functions of the production process, from distilling to barreling to bottling,
shipping and marketing. Appendix F provides a more detailed explanation of the industrial
linkages in the model.
Production activities supported about 17,590 jobs with a payroll of $810.4 million. The
contribution to Kentucky’s economic output was about $7.91 billion. Corporate activities
supported about 4,950 jobs with a payroll of $422 million. The contribution to Kentucky’s
economic output of the management jobs was about $1 billion.
Aside from the core distilleries and management sector, the industries most affected by
distilling in Kentucky are wood container and pallet manufacturing, truck transportation,
wholesale trade, employment services, real estate, restaurants and bars, and grain farming.
According to the Kentucky Cabinet for Economic Development, there are at least 1,300
employees working in cooperages, stave manufacturing plants, and used barrel refurbishers (all
1 The direct effect in the production section of the table is less than 4,250 because the activities of the distilling
industry have an effect on itself, essentially spin-off into its own industrial sector. We do not want to double count this own-industry spin-off in our analysis of the contribution of the industry. What the table shows is that if we eliminated all of the corporate management function jobs and about 4,170 production jobs, one result would be the elimination of all of the remaining production jobs (part of the indirect effect).
Industry Sector Employment Labor IncomeDistilleries 4,250 $403,611,119Management of companies and enterprises 2,027 $378,811,840Wood container and pallet manufacturing 1,146 $77,247,962Truck transportation 1,101 $70,623,261Employment services 716 $25,211,863Wholesale - Other nondurable goods merchant wholesalers 663 $44,963,137Other real estate 610 $13,134,380Full-service restaurants 569 $14,253,454Grain farming 517 $14,211,409Limited-service restaurants 451 $9,871,958Hospitals 449 $33,754,984
Note: Labor income includes employee compensation and proprietors income.
Industries Most Affected by the Distilling Industry
Source: Customized IMPLAN (IMpacts for PLANing), version 3.1, model of Kentucky, using 2019 economic data.
The Distilling Industry in Kentucky, 2021 20
in the wood container manufacturing industry) throughout the Commonwealth, mostly in the
eastern and south-central counties. All are operating at capacity.
Real estate, restaurants, and hospitals are sectors that link to distilling primarily through
household spending channels. For example, we estimate if Kentucky’s distilling industry did not
exist, there would be about 570 fewer jobs in full-service restaurants in the state. Hospitals,
because they are huge employers and nearly everyone will need their services at some point,
are linked to activity in all other industries. As the distilleries and their suppliers expand, more
employees and households are covered by commercial insurance, and thus generate revenues,
jobs, and payroll for hospitals.
Appendix H provides an analysis of the economic multipliers behind these estimates.
Impact of construction
Distillery companies have invested billions of dollars into their facilities and equipment the
decades. This is evident from the large property tax payments they make to government
jurisdictions each year, a topic we examine in the next section.
We already noted Kentucky distillers invested roughly $1.9 billion in improvement projects
since 2016, which is more than that projected in our 2016 and 2018 studies. In addition, the
distillers are planning another $3.3 billion in projects over the next five years, with all the
distillers expanding capacity, erecting new warehouses for barrel aging and putting more focus
on the visitor experience, particularly among the KDA’s Kentucky Bourbon Trail® and Kentucky
Bourbon Trail Craft Tour® distilleries. Here we analyze the one-time economic impacts of a
hypothetical $10 million distillery construction project. Our estimates can be scaled up or down
according to the size of the investment under consideration.
We use our IMPLAN model of Kentucky to perform the analysis. The model has a sector entitled
“Construction of new manufacturing structures” that fits this question. We simulated a $10
million increase in demand for that sector, and the model predicted the impacts on business
output, jobs, and payrolls. The results are shown in the next table.
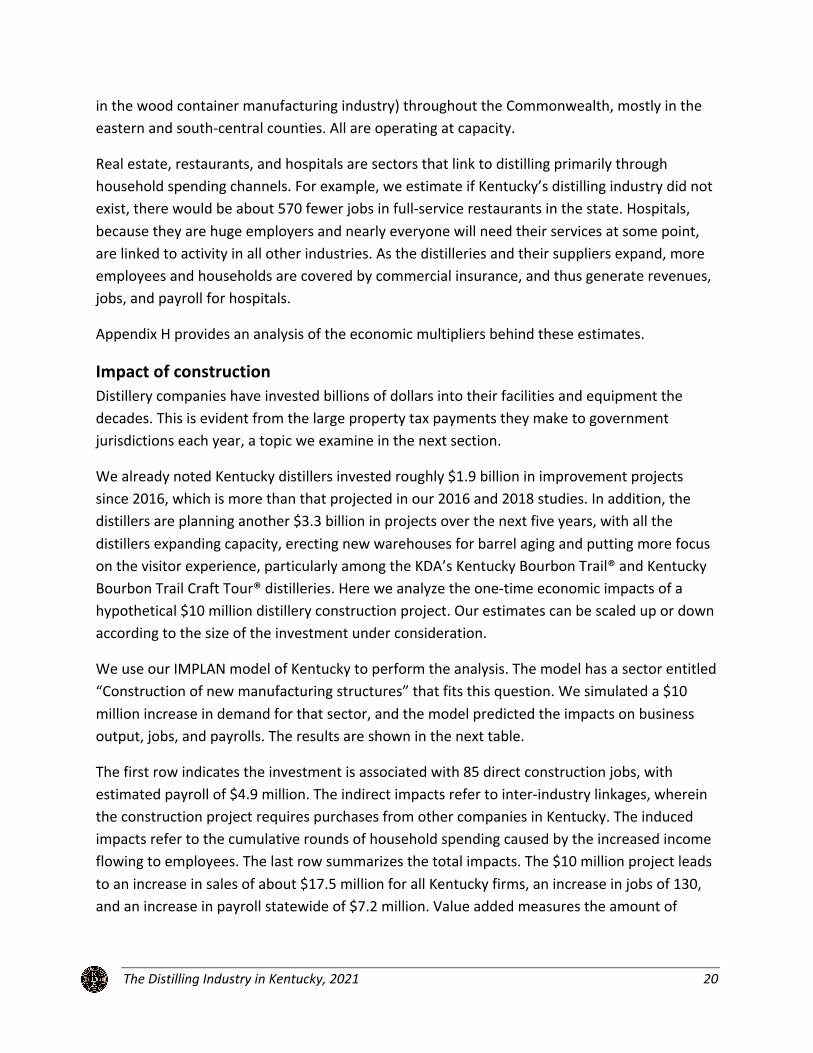
The first row indicates the investment is associated with 85 direct construction jobs, with
estimated payroll of $4.9 million. The indirect impacts refer to inter-industry linkages, wherein
the construction project requires purchases from other companies in Kentucky. The induced
impacts refer to the cumulative rounds of household spending caused by the increased income
flowing to employees. The last row summarizes the total impacts. The $10 million project leads
to an increase in sales of about $17.5 million for all Kentucky firms, an increase in jobs of 130,
and an increase in payroll statewide of $7.2 million. Value added measures the amount of
The Distilling Industry in Kentucky, 2021 21
output that is generated in the regional economy, as opposed to the total sales value2. These
results are similar to our previous studies.
We can make an estimate of the amount of additional tax revenues that would be generated,
using some of the results developed later in this study. Construction supplies and materials are
potentially subject to Kentucky’s 6% sales tax, and could amount to a couple hundred thousand
dollars in tax revenues for the project. However, when job growth is involved, companies often
qualify for an exemption to the sales tax. Kentucky state government would receive a one-time
increase in individual income and sales tax receipts of about $637,000 at the historical effective
tax rates, and local governments (including public school systems) would receive an additional
$86,000 in occupational taxes. Thus, excluding any possible sales tax payments on construction
materials and machinery, governments in Kentucky would receive a total one-time increase of
$724,000 in tax revenue.
It is impossible to precisely predict the long-term fiscal impacts of such an investment without
specifying where the investment occurs in the state. Property tax rates vary widely among
jurisdictions. A rule of thumb is that real estate is subject to property taxation at the rate of 1%,
though the rate can be much higher in very urbanized places with intensive public services
(schools, fire, police, libraries, streets, garbage pickup, EMS). Assuming that the property was
valued at construction cost, this implies that the direct investment leads to annual property tax
revenues to local and state governments of $100,000 per year.
2 To illustrate the difference between output and value added, consider a car dealership. They may sell a new
vehicle for $30,000 (Kentucky output), but most of those dollars go to an out-of-state manufacturer. Value added in that case measures the several thousand dollars that the dealership adds in vehicle prep, display, financing, and sales support, as well as local taxes. The value added concept is intended to measure the amount of dollars that ‘stick’ to the regional economy.
Impact Type Employment Labor Income Value Added Output
Direct Effect 85 $4,911,755 $5,048,175 $10,000,000
Indirect Effect 15 $874,197 $1,483,819 $3,034,693
Induced Effect 30 $1,404,390 $2,488,593 $4,492,868
Total Effect 130 $7,190,341 $9,020,587 $17,527,560
Estimated Economic Impact of $10 million Construction Investment by the Distilling Industry in Kentucky
Source: IMPLAN model of Kentucky, using 2019 economic data, sector 51 "Construction of New Manufacturing Structures".

The Distilling Industry in Kentucky, 2021 22
Impact of equipment investment
Kentucky’s distillery companies are equipped with state-of-the-art stills, bottling machinery,
computers and whatever else they need to manufacture and sell their products. Nearly half of
the upcoming $3.3 billion in investment will go toward various kinds of durable machinery. We
therefore also simulated a $10 million equipment investment using IMPLAN’s capital
investment scenario for the beverage manufacturing sector. Summary results are below.
The direct effects here are felt by Kentucky industries selling equipment to the distilling
industry. These direct purchases are expected to amount to about 20 percent of the total
capital equipment spending, about $2 million. That activity supports nine jobs with a payroll of
$699,000. Business-to-business (indirect) and household spending (induced) create more
impacts, and the $10 million of capital spending leads to an increase in sales of about $3.5
million for all Kentucky firms, an increase of 19 jobs and an increase in payroll statewide of
$1.18 million. The new payroll would be associated with an increase in Kentucky state income
and sales tax revenues of $104,000, plus about $14,000 in new occupational taxes for local
government jurisdictions.
Average annual impact possible from distilling industry planned investments
KDA members have roughly $3.3 billion in expansion and improvement projects planned over
the next five years. We can use the results of the last two sections to estimate the average
annual impact on the state’s economy of this activity over the coming five-year period.
In the following table we assume a fairly uniform spending pattern over the five years ($652
million per year) and follow the reported ratio between construction and capital equipment of
46:54. Results will be different depending on the exact spending mix. Relatively more
Impact Type Employment Labor Income Value Added Output
Direct Effect 9 $698,517 $987,009 $2,066,296
Indirect Effect 4.6 $252,809 $364,764 $726,043
Induced Effect 4.9 $228,372 $404,942 $731,025
Total Effect 18.6 $1,179,698 $1,756,715 $3,523,365
Estimated Economic Impact of $10 million Equipment Investment by the Distilling Industry in Kentucky
Source: IMPLAN model of Kentucky, using 2019 economic data, using Acitivity template for Beverage manufacturing.
The Distilling Industry in Kentucky, 2021 23
construction spending will increase the impact, while relatively more capital equipment
spending will decrease the overall impact.
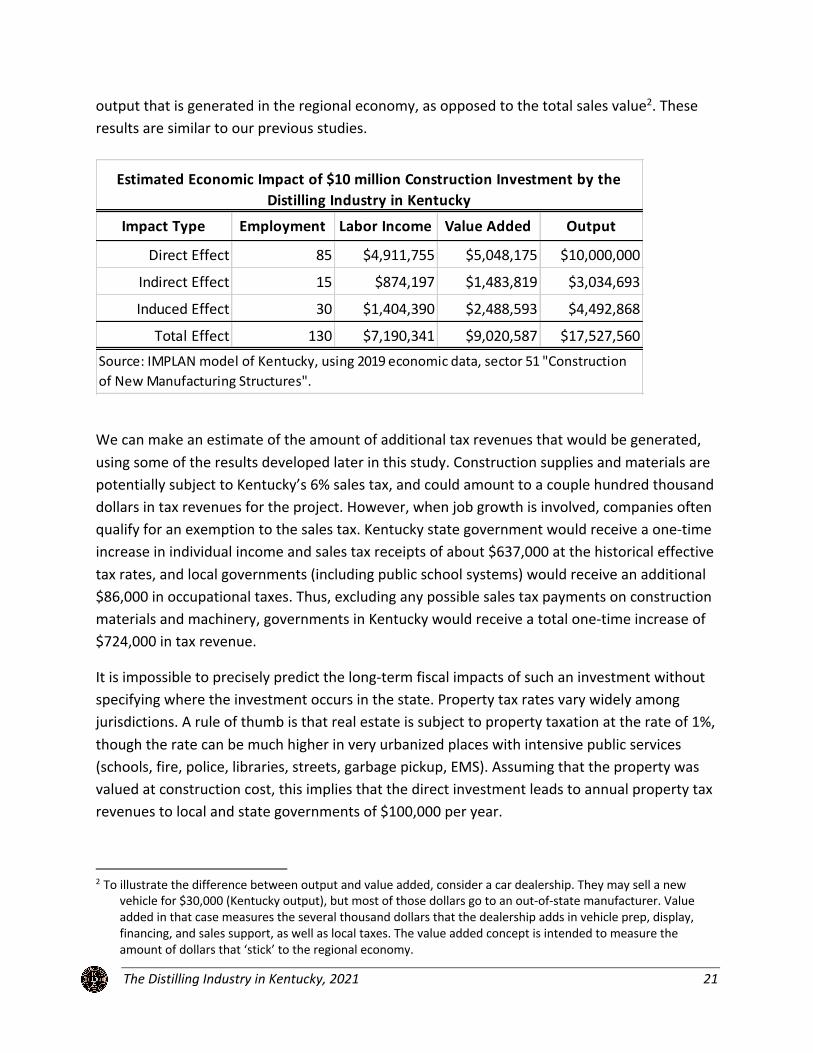
We estimate the distilling industry construction and capital improvement projects could
support an average of 4,565 additional jobs in Kentucky through 2025. Those jobs would have
about $258.1 million in total payroll and generate about $25.4 million in combined state and
local income and sales taxes each year. The real estate improvements could mean an additional
$4.8 million in property tax revenues each year for local and state governments.
Employment Output PayrollProperty
Taxes
Income, Sales, Occupational
Taxes
4,565 $651,958,539 $258,140,871 $4,808,957 $25,400,896
Estimate of Average Annual Impact of Kentucky Distilling Industry's $3.3 Billion Investment Plans Over the Next Five Years
Source: IMPLAN model of Kentucky, using 2019 economic data.
The Distilling Industry in Kentucky, 2021 24
Taxation and Fiscal Impacts of the Industry
here are many types of taxes that distillers and the consumers of spirits pay, and the
taxes go to many different jurisdictions in Kentucky. Indeed, this is the most complicated
part of our analysis. Distilleries remain one the highest taxed of the 544 Kentucky
industrial sectors we analyzed using our IMPLAN input-output model of the state. Twenty-one
percent of the value of distillery output goes to government taxes – a rate exceeded by only
three sectors: wholesale petroleum, commercial fishing, and tobacco manufacturing – sectors
with a much smaller economic footprint than distilling. The effective tax rate on distilling is
higher than that of breweries (8.2 percent) and wineries (3.1 percent). This calculation includes
taxes levied by all levels of government, including federal, state, and local.
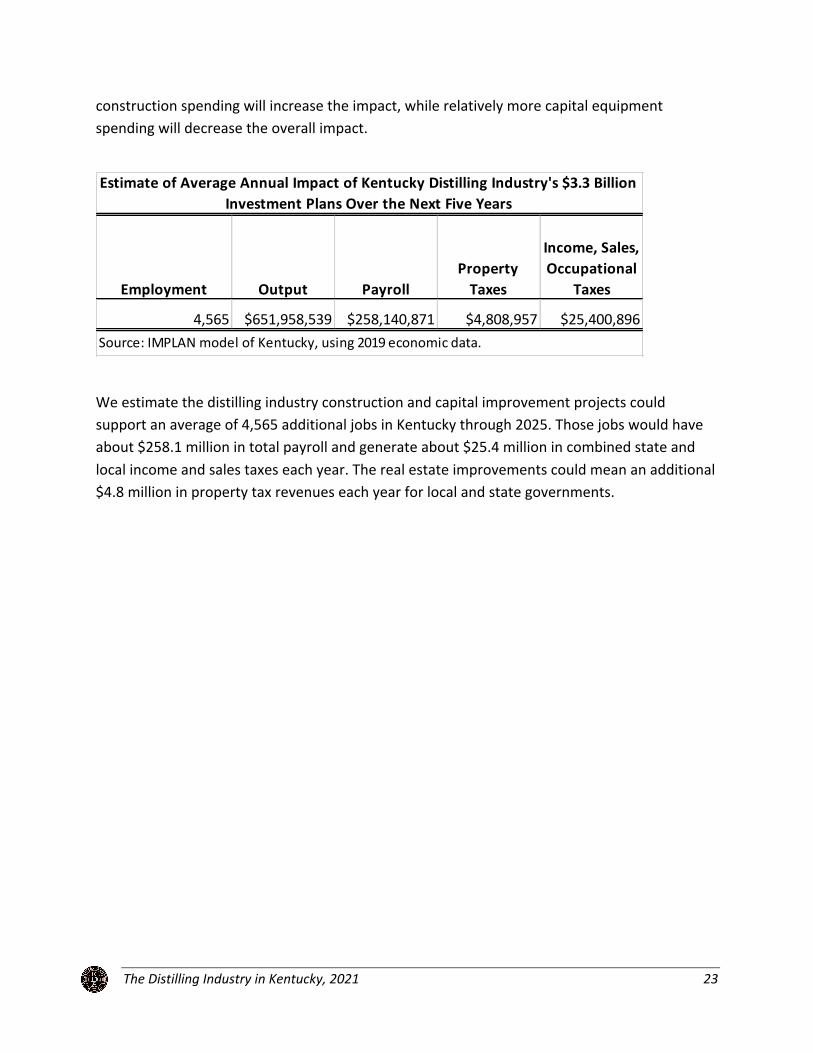
Before we look into the details of state and local taxation in Kentucky, it is worth noting how
dominant the state is in
terms of federal excise taxes
on alcohol production.
According to the U.S. Alcohol
and Tobacco Tax and Trade
Bureau, Kentucky is
responsible for 22 percent of
all alcohol excise tax
collections. See chart. The
collections shown cover not
only spirits, but beer and
wine. However, beer and
wine production are small in
Kentucky, and distilling
clearly is the cause of
Kentucky’s first-place rank. In
2020, Kentucky distillers
remitted $1.8 billion in excise
taxes to the U.S. Treasury.
The tax rate is $13.50 per
proof gallon of production.
Thus, for example, one gallon
of 100 proof Bourbon (50%
alcohol) would generate
$13.50 in federal excise
taxes, paid by the distiller.
T
$50,770
$102,161
$177,040
$229,868
$274,229
$399,261
$441,119
$638,456
$673,414
$724,612
$766,704
$858,215
$1,168,562
$1,369,094
$1,458,124
$1,670,059
$1,677,342
$1,734,000
$4,371,780
$5,373,373
$6,059,477
$6,939,601
$14,406,483
$15,892,809
$17,116,874
$20,421,005
$30,213,638
$30,859,459
$36,140,119
$48,406,385
$51,651,734
$70,769,198
$79,095,262
$93,625,830
$104,192,432
$132,127,388
$143,560,752
$172,694,340
$176,404,288
$192,647,022
$221,915,984
$230,934,566
$242,785,606
$310,655,462
$328,235,874
$345,509,582
$397,482,058
$406,893,587
$564,614,000
$756,342,525
$1,135,106,128
$1,801,427,336
$0.00 $500,000,000.00 $1,000,000,000.00 $1,500,000,000.00 $2,000,000,000.00
ND
SD
MS
DC
WY
OK
NE
WV
RI
NV
MT
HI
AK
NM
KS
LA
ID
SC
DE
VT
UT
AZ
AL
PR
IA
MI
WA
MA
NC
OR
NH
CT
ME
AR
MD
MN
NJ
WI
PA
NY
GA
TN
VA
IN
OH
CO
FL
MO
IL
TX
CA
KY
Federal Alcohol Excise Tax Collections, 2020
Source: US Alcohol and Tobacco Tax and Trade Bureau, by special request.
Data refer to calendar year 2020, and include excise taxes for spirits, wine,
and beer. Kentucky accounted for 22 percent of the national total of $8.2
billion. For more information, see ATT annual report, www.ttb.gov/about-
ttb/plans-and-reports-annual-reports.

The Distilling Industry in Kentucky, 2021 25
In the rest of this section, we look into many details of taxation of distilled spirits in Kentucky,
not just of distilleries themselves, but through the distribution chain to wholesalers, retail
package stores, and restaurants and bars. Like many states, Kentucky has a three tier system of
regulation and taxation of alcohol products. Production is taxed at the
distillery/bottling/storage sites. Wholesalers are required to remit separate taxes based on
both volume and value in the process of supplying retail businesses. Then, restaurants, bars,
package stores and other outlets collect a separate state retail sales tax based on value.
We have collected data and made estimates for the most important tax items, including local
and state property taxes, state alcohol production and consumption taxes, local occupational
taxes, and Kentucky state individual income and sales taxes.
A summary of our estimates is provided in the table above. All entries refer to the latest year
available for data, primarily calendar 2020 or fiscal 2021. Production-related taxes account for
$166.6 million of the $285.9 million total. Some of the entries are based on sheriff department
records and official government tallies, some on company provided reports, while other entries
are estimates based on historical ratios. Clearly, Kentucky state government is the biggest tax
recipient, accounting for 80 percent of the total over all levels of government. Public school
districts and local governments are the biggest recipients of property taxes paid by the industry.
These entries are probably the most important taxes on distilled spirits, but there are many
other taxes paid that are harder to quantify. For example, we do not know the amount of taxes
Local Public Schools
City, County, Other Local
Governments
Kentucky State
Government TotalProduction-related
Property taxes - real estate and tangible property $4,964,881 $3,038,162 $2,406,396 $10,409,439
Property taxes - spirits aging in barrels $18,190,508 $7,872,999 $1,743,895 $27,807,402
Individual income taxes from distillery-related payrolls $59,440,739 $59,440,739
General sales taxes from distillery-related payrolls $49,137,208 $49,137,208
Occupational taxes from distillery-related payrolls $1,709,977 $17,772,197 $19,482,174
Distilled spirits license fees** $72,647 $273,915 $346,562
Subtotal $24,865,366 $28,756,005 $113,002,153 $166,623,524
Consumption-relatedWholesale case tax* $202,034 $202,034
Wholesale excise tax on volume* $17,520,621 $17,520,621
Wholesale tax on value* $62,862,108 $62,862,108
Retail sales tax, restaurants, bars, other for on-premise consumption $11,516,459 $11,516,459
Retail sales tax, sales for off-premise consumption $21,542,989 $21,542,989
Distilled spirits license fees** $3,322,713 $2,291,125 $5,613,838
Subtotal $3,322,713 $115,935,336 $119,258,049
Grand Total $24,865,366 $32,078,718 $228,937,488 $285,881,572* Wholesale taxes shown are for state fiscal year July 2020 to June 2021.
Estimated Annual Kentucky Taxes on the Production and Consumption of Distilled Spirits, 2020
** Production-related license fees are primiarily for distillers and rectifiers licensees; consumption-related license fees are largely for retail and
package drink licenses.

The Distilling Industry in Kentucky, 2021 26
on insurance premiums, motor fuels, and utilities paid to state and local governments. So,
$285.9 million should be considered a lower boundary on the true unknown amount of taxes
paid. In the following sections we discuss each type of tax in the table individually and then
compare our results with the previous report.
Property taxes
A distillery pays property taxes on its land and buildings to the local school system, the county
government, the city government, a fire district, a library, health or agricultural district, and the
Commonwealth of Kentucky. Distilleries also pay tangible property taxes to those jurisdictions
on the value of machinery, furniture, vehicles, and the distilled spirits aging in warehouses.
We have attempted to track down the various properties owned by the distillery companies,
and to organize public information on their tax bills in 2020. Unlike in past years, nearly all
Kentucky counties now have their property tax bills and assessments available in online
searchable databases. We were able to identify a total of about $10.4 million paid to local and
state governments. The assessed value of land, buildings, equipment, and inventory (ready to
sell) was $1.49 billion, of which $555.2 million was real estate and $932.5 million was tangible
property. The pie chart above shows the distribution of taxes paid by jurisdiction type. Public
schools are the biggest recipient of property tax payments, with revenues of about $4.96
The Distilling Industry in Kentucky, 2021 27
million or 47.6 percent of the total. Kentucky state government is next, with $2.4 million (23
percent), followed by city and county governments with $1.8 million (17.6 percent). Local
libraries received $602,000 (5.8 percent). The ‘Other’ category includes property tax revenues
received by local health departments, agricultural extension offices, soil conservation districts,
fire districts, and an air board. That total was just over $601,000 (5.8 percent) in 2020.
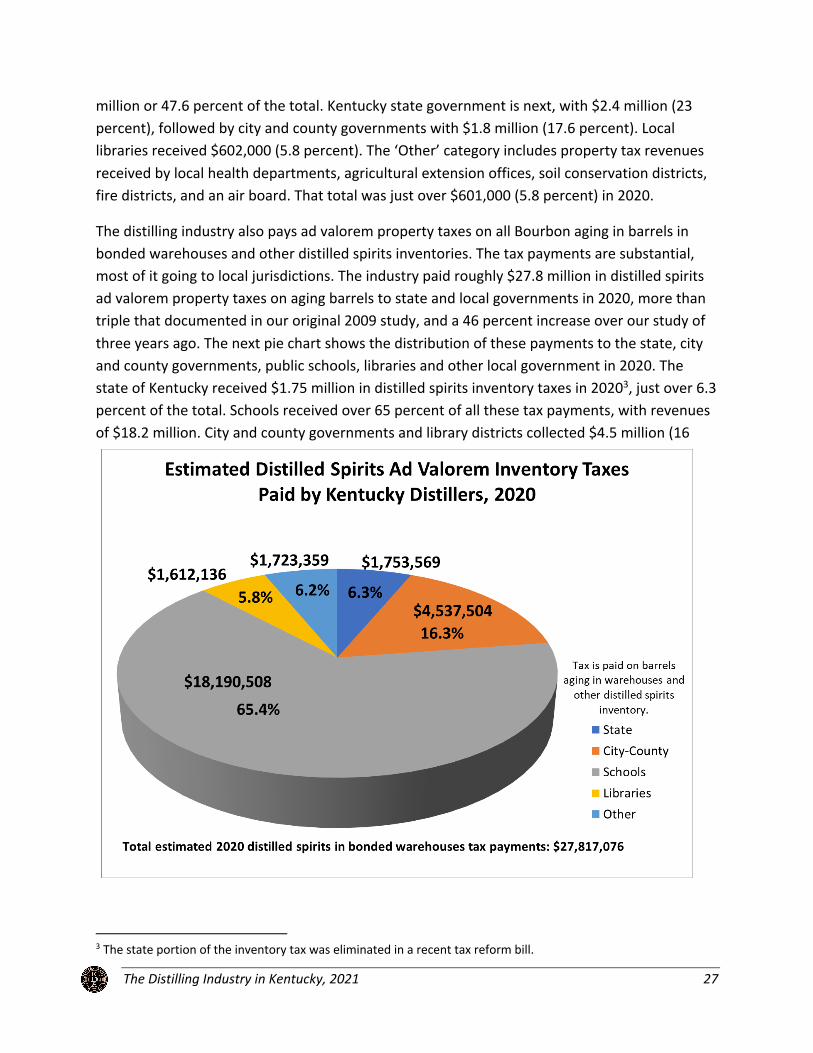
The distilling industry also pays ad valorem property taxes on all Bourbon aging in barrels in
bonded warehouses and other distilled spirits inventories. The tax payments are substantial,
most of it going to local jurisdictions. The industry paid roughly $27.8 million in distilled spirits
ad valorem property taxes on aging barrels to state and local governments in 2020, more than
triple that documented in our original 2009 study, and a 46 percent increase over our study of
three years ago. The next pie chart shows the distribution of these payments to the state, city
and county governments, public schools, libraries and other local government in 2020. The
state of Kentucky received $1.75 million in distilled spirits inventory taxes in 20203, just over 6.3
percent of the total. Schools received over 65 percent of all these tax payments, with revenues
of $18.2 million. City and county governments and library districts collected $4.5 million (16
3 The state portion of the inventory tax was eliminated in a recent tax reform bill.

The Distilling Industry in Kentucky, 2021 28
percent) and $1.6 million (5.8 percent), respectively. Just over $1.7 million (6.2 percent) went to
various other government entities.
Since the state tangible property tax rate on distilled spirits inventory is a flat $0.05 per $100 of
valuation, we can use historical data on General Fund receipts from this tax to see the upward
trend in inventory values over the past three decades, displayed in the chart below. The chart
reflects payments through the 2020 tax year. The collections imply an inventory value of $3.5
billion last year, but the actual value is higher due to an exemption for property scheduled to be
shipped out-of-state within six months of the assessment date. The total value certified by the
Kentucky Department of Revenue for 2020 was over $3.8 billion. And for tax year 2021, the
state certified value for all inventories (including those not subject to tax) reached $4.4 billion.
Most tax collections on these aging barrels occur in just 10 counties, with only Jefferson County
having a population of more than 100,000 people, so the taxes collected at the local level have
a big impact in those communities, an impact that has grown nearly threefold in the last dozen
years. On the other hand, Kentucky is the only place in the world that levies an annual aging
barrel ad valorem tax, and the state’s distillers have long argued that it puts them at a
$0
$500,000,000
$1,000,000,000
$1,500,000,000
$2,000,000,000
$2,500,000,000
$3,000,000,000
$3,500,000,000
$4,000,000,000
Value of Distilled Spirits Inventory, 1983-2020
Source: derived from Kentucky state government property tax receipts data, by fiscal year. Current rate is $.05 per $100 of assessed value. Actual value is somewhat higher due to an exemption for property scheduled to be shipped out of state within six months of the assessment date.
The Distilling Industry in Kentucky, 2021 29
competitive disadvantage and could stunt the growth of craft distillers here because Bourbon
and other aged whiskeys are central to most of the fledgling businesses’ long-term plans. They
must wait out the aging process before they can sell most of that product, yielding no revenues
yet incurring ongoing tax payments and overhead.
Tax revenues related to payrolls of distilleries
We now turn to the income and sales tax paid by employees who owe their incomes to
distillery operations in Kentucky. The most important categories are the Kentucky individual
income tax, the Kentucky general sales tax, and the occupational taxes paid to local
governments. In several counties, we suspect that the distillery’s employees are the largest
direct payer of occupational taxes among all places of employment, but company-specific
payroll data are not publicly available.
Kentucky income and sales tax receipts related to distillery payrolls can be estimated using
effective tax rates. Effective tax rates are calculated by dividing historical tax revenues by
payrolls. We use wage and salary data from the U.S. Bureau of Economic Analysis and tax
collection data from the Kentucky Department of Revenue to calculate the average effective tax
rates over the 2016-20 period. The effective income tax rate is 4.87 percent and the effective
sales tax rate is 4.00 percent.
Multiplying by the $1.23 billion in total distillery-related payroll yields $60.0 million in Kentucky
individual income tax receipts and $49.3 million in Kentucky sales tax receipts, for a total of
$109.3 million to state government annually. This represents an estimate of how much less in
tax receipts Kentucky state government would receive from these two most important
categories were the distillery industry to go to another state.
Next, we turn to occupational taxes received by local governments. We have taken the local
government jurisdictions that levy occupational taxes in counties containing Kentucky
distilleries and weighted their rates by the distilling payroll in each county. This gives us a
weighted average local occupational tax rate to apply to the direct payroll impact of the
IMPLAN model. We have also created a weighted average of all occupational taxes across the
state using estimates of payrolls within counties (when jurisdictions within counties differ in
their occupational tax rates) and county wages and salaries as the weights. We apply this
weighted average to the combined indirect and induced payroll impact. We applied the same
methods for school district occupational taxes. Most of these jurisdictions also levy a ‘net
profits tax’ on companies, typically at the same rate as the tax on payrolls, but we do not have
data on corporate profits subject to the tax.
Applying the appropriate distillery-related payroll impact (either direct or combined indirect
and induced) to the weighted local tax rates, we estimate local school districts received about
The Distilling Industry in Kentucky, 2021 30
$1.71 million in occupational taxes in 2020, and local city or county governments received
$17.77 million.
State licenses and fees
The Kentucky Department of Alcoholic Beverage Control administers a number of license fees
applicable to any business producing, storing, transporting, distributing, selling, or serving
alcoholic beverages within the state. In fiscal year 2020, the state collected $7.5 million in fees
for these licenses4. In our 2018 study, we used a detailed examination of licenses by type to
parse out the license and fee revenue to the spirits category. Here we extrapolate the FY18
results using the growth in total ABC regulatory revenues. This results in an estimate for FY20 of
$2.3 million in consumption-related license fees related to spirits. On the production side there
are distiller’s and rectifier’s Class A and B licenses and a storage license, which we estimate
brought in $274,000 from the state’s distillers.
Local licenses and fees
On the production side, distillers pay for local licenses as well as their state license. We
estimate that city and county governments collected $73,000 distiller’s and bottler’s fees. On
the consumption side, any business selling alcoholic beverages in Kentucky must pay annual
license fees to local governments. This includes restaurants, caterers, hotels, bars, grocery
stores, pharmacies, and package stores. The fees vary by type of alcohol sold and by size of city.
For example, a restaurant in Louisville offering spirits must pay the City-County government
$1,600 each year, compared to $500 in Morehead. Moreover, jurisdictions typically assess
different fee amounts for different types of establishments (e.g., airport, racetrack, restaurant,
package store), and even by time of day (higher fees if establishment is open after midnight).
We do not know the total amount of fees paid annually to all the jurisdictions. Some alcohol
sales are allowed in 66 counties, many with multiple cities of different sizes and alcohol laws. In
our 2018-2019 report, we estimated that local governments received $3.3 million in
consumption-related license fees related to spirits sales for FY17. In Jefferson County, the
Metro government handles all licensing throughout the county, and collects about $2.5 million
annually in license fees, which is essentially the same as that collected in FY175. Using Louisville
as representative of all the local jurisdictions, we estimate distilled spirits accounts for $3.3
million in license fees for local governments annually in Kentucky.
4 As a reaction to Covid-19 business closures, the state waived renewal fees in FY21 on businesses selling for on-
premise consumption. This caused renewal fee revenues to fall by $1.7 million compared to FY20. We use FY20 figures here, as they reflect more normal operations.
5 Similar to the state, Louisville waived fees for establishments serving alcohol for the calendar year 2021. Here we use the growth from FY17 to FY20 as representative of fee revenue in a normal year.

The Distilling Industry in Kentucky, 2021 31
Alcohol consumption taxes
Kentucky state government levies a number of taxes on alcohol sales generally, and distilled
spirits in particular. Here we consider taxation at the excise, wholesale and retail levels, i.e.,
consumption-based taxes. Kentucky taxes alcohol consumption away from home (restaurants,
bars, hotels) at a 6 percent rate, and levies the same rate on package sales at liquor stores and
other outlets. Kentucky also taxes spirits at the wholesale level, with an 11 percent sales tax
collected on transactions from wholesalers to retailers, and an excise tax of $1.92 per wine-
gallon of spirits sold. Kentucky is one of only two states with a tax at the wholesale level in
addition to the excise tax; South Dakota’s rate is 2 percent. This means Kentucky taxes alcohol
by the volume (excise) and value (wholesale). There is also a ‘case tax’ of $0.05 per case levied
on wholesalers, though this brought in only around $202,000 to the state government in fiscal
2021. The wholesale tax on wine and beer is only 10 percent in Kentucky. The preceding chart
Beer Wine SpiritsAlabama** $0.53 $1.70 $19.11
Arkansas $0.34 $1.47 $8.33
Georgia $0.48 $1.51 $3.79
Illinois $0.23 $1.39 $8.55
Indiana $0.12 $0.47 $2.68
Kentucky* $0.89 $3.23 $8.41
Missouri $0.06 $0.42 $2.00
North Carolina** $0.62 $1.00 $14.58
Ohio** $0.18 $0.32 $9.83
South Carolina $0.77 $1.08 $5.42
Tennessee*** $1.29 $1.27 $4.46
Virginia** $0.26 $1.51 $19.89
West Virginia** $0.18 $1.00 $7.62
Kentucky's ranking 2 1 6
Wholesale Tax Rates per gallon on Alcohol, Kentucky and Twelve Nearby States, January 2021
Source: Tax Foundation, Facts and Figures 2021: How does your state compare, Tables 28, 29, 30. https://taxfoundation.org/2021-state-tax-data/
* Kentucky's rate includes both the excise tax per gallon plus the wholesale ad valorem taxes, converted to a gallonage basis. The Kentucky ad valorem wholesale tax rates are 10.00% on beer and wine, and 11 percent on spirits.
** These are 'control states' for spirits, meaning the state government manages the purchasing and retail pricing.
*** Tennessee rates incorporate the $0.15 tax per case, www.tn.gov/revenue/taxes/alcoholic-beverages-taxes/due-dates-and-tax-rates.html
The Distilling Industry in Kentucky, 2021 32
calculates an implied tax rate that considers excise and wholesales combined due to Kentucky’s
unique tax structure on alcohol.
The combined wholesale taxes – $1.92 per gallon plus 11 percent ad valorem tax – on spirits is
among the highest among U.S. states. Nearly all the states with higher wholesale taxes are
‘control states’, meaning the distribution and pricing is controlled by state government. Only
four ‘market states’ levy higher total wholesale taxes on spirits than Kentucky – Washington,
Alaska, Minnesota, and Illinois. Kentucky’s wholesale tax is almost twice Tennessee’s, the
second biggest producer of whiskey. Given Kentucky’s prominence in Bourbon production,
there is a contrast with the tax treatment in states that are prominent in wine and beer
production. For example, California and New York are the largest wine producing states, and
their wholesale taxes are among the four lowest states. Similarly, Missouri, Wisconsin and
Colorado have among the five lowest wholesale taxes on beer, and these states are the largest
beer producers.
See Appendix I for a comparison of Kentucky’s alcohol excise tax rates compared to those in all
other states. The Appendix also includes a chart showing the wholesale taxes per gallon of
alcohol, as opposed to per gallon of product. These calculations were made under the
assumption spirits contain on average 40 percent alcohol, wine 12 percent, and beer 5 percent.
If alcohol content were taxed consistently across the three categories, all the dots on the graph
would line up for a particular state. One can see that alcohol is taxed consistently in only a few
jurisdictions, namely Louisiana, Maryland, and Washington D.C. There is a lot of variation
among states. Washington State is a clear outlier, with very high taxation of alcohol in spirits.
Kentucky puts a high tax burden on alcohol in wine, and beer has the lowest tax burden. By
contrast, note Tennessee, the second largest whiskey producing state, taxes alcohol in spirits at
half the rate it taxes alcohol in beer. Moreover, Tennessee’s wholesale tax on spirits is only
$4.46 per gallon, compared to Kentucky’s combined tax of $8.41 per gallon.
There are no official data available on the amount of Kentucky retail sales taxes from alcohol
consumption. We have constructed estimates using detailed product sales data from the 2007,
2012 and 2017 Economic Census. The census provides estimates by industry of both retail sales
of alcoholic beverages for off-premise consumption, and sales of alcoholic beverages served for
immediate consumption, or on-premise. We further broke out spirits from total alcohol sales
using national data that are even more detailed than those available at the state level.
The Census Bureau estimated that ‘Alcoholic beverages served for immediate consumption’ at
restaurants, bars, hotels and other venues in Kentucky totaled $490 million in 2017. Of that,
distilled spirits accounted for just over 36 percent. Thus, sales of distilled spirits for immediate
consumption at Kentucky restaurants, bars, and hotels were about $177 million in 2017. We
use historical growth in the average wholesale price per gallon to estimate these retail sales
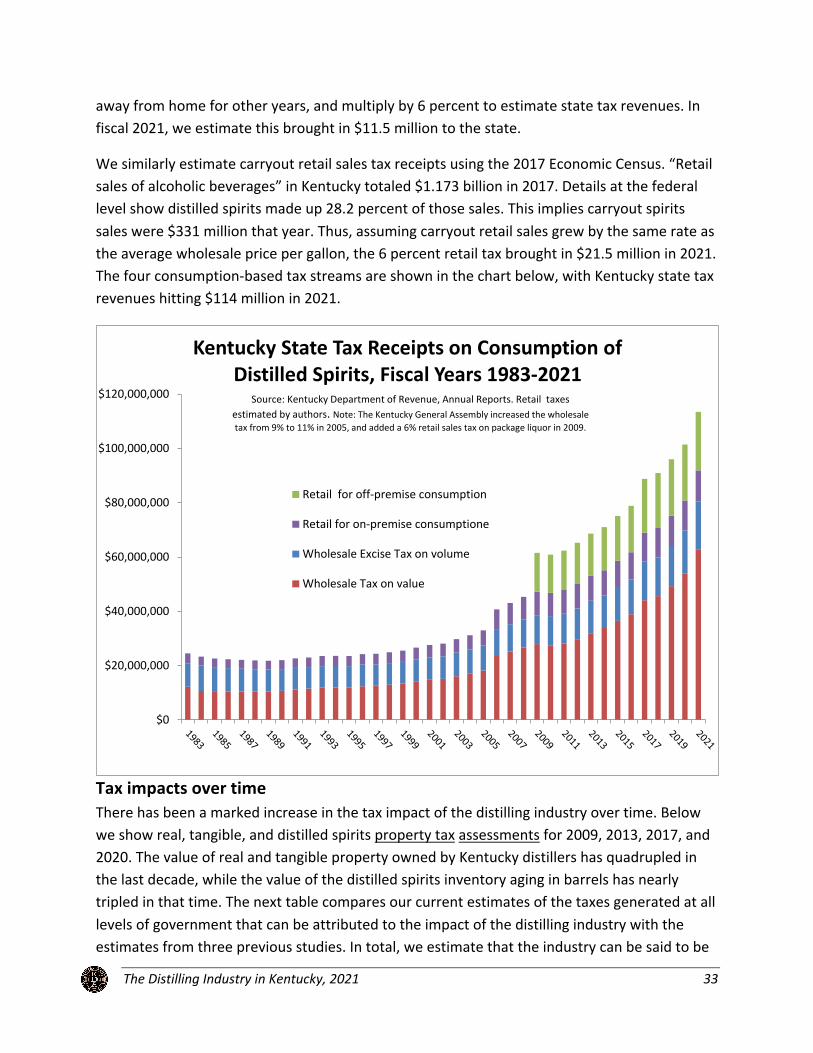
The Distilling Industry in Kentucky, 2021 33
away from home for other years, and multiply by 6 percent to estimate state tax revenues. In
fiscal 2021, we estimate this brought in $11.5 million to the state.
We similarly estimate carryout retail sales tax receipts using the 2017 Economic Census. “Retail
sales of alcoholic beverages” in Kentucky totaled $1.173 billion in 2017. Details at the federal
level show distilled spirits made up 28.2 percent of those sales. This implies carryout spirits
sales were $331 million that year. Thus, assuming carryout retail sales grew by the same rate as
the average wholesale price per gallon, the 6 percent retail tax brought in $21.5 million in 2021.
The four consumption-based tax streams are shown in the chart below, with Kentucky state tax
revenues hitting $114 million in 2021.
Tax impacts over time
There has been a marked increase in the tax impact of the distilling industry over time. Below
we show real, tangible, and distilled spirits property tax assessments for 2009, 2013, 2017, and
2020. The value of real and tangible property owned by Kentucky distillers has quadrupled in
the last decade, while the value of the distilled spirits inventory aging in barrels has nearly
tripled in that time. The next table compares our current estimates of the taxes generated at all
levels of government that can be attributed to the impact of the distilling industry with the
estimates from three previous studies. In total, we estimate that the industry can be said to be
$0
$20,000,000
$40,000,000
$60,000,000
$80,000,000
$100,000,000
$120,000,000
Kentucky State Tax Receipts on Consumption of Distilled Spirits, Fiscal Years 1983-2021
Retail for off-premise consumption
Retail for on-premise consumptione
Wholesale Excise Tax on volume
Wholesale Tax on value
Source: Kentucky Department of Revenue, Annual Reports. Retail taxes estimated by authors. Note: The Kentucky General Assembly increased the wholesale tax from 9% to 11% in 2005, and added a 6% retail sales tax on package liquor in 2009.

The Distilling Industry in Kentucky, 2021 34
generating around $150 million, or 112 percent, more tax revenue throughout the state than it
did in 2010.
The growth in the consumption-related taxes are fairly straightforward. Simply put, Kentucky
consumers have been just as much a part of the worldwide Bourbon boom as anybody else.
Since the tax rates have all remained the same, it is simply a matter of the number of cases and
gallons sold in the state, and the value of sales increasing. That the excise tax per gallon has the
lowest percentage increase tells us the average price of spirits Kentuckians have been drinking
is going up, which is consistent with premium brand growth.
On the production side, the increases in property taxes and license fees reflect the recent wave
of investment made by distillers and growth in the number of distilleries. The increases of the
income, sales, and occupational taxes are related to the total payroll effect from our input-
Tax 2009 2013 2017 2020
Real Property $138,725,818 $232,717,889 $396,806,745 $555,244,114 300.2%
Tangible Business Property $246,361,726 $400,823,294 $691,375,604 $932,536,745 278.5%
Distilled Spirits in Bonded Warehouses $893,432,418 $1,332,029,432 $1,752,809,266 $2,547,423,543 185.1%
Total Property Related Tax Assessment $1,278,519,962 $1,965,570,615 $2,840,991,615 $4,035,204,402 215.6%
Property Related Tax Assessments of Kentucky Distillers, 2009, 2013, 2017, 2020
Percent Change '09-'20
Sources: County Sheriff tax offices in 38 counties.
Estimated Assessments, Subject to County-level Tax
Revenues Generated at All Levels of Government 2010 2013 2015 2017 2020 Change Percent
Production-related
Property taxes - real estate and tangible property $2,705,829 $3,600,882 $5,455,338 $6,878,763 $10,409,439 $7,703,610 284.7%Property taxes - spirits aging in barrels $11,697,908 $11,940,044 $13,412,692 $19,024,834 $27,807,402 $16,109,494 137.7%
Individual income taxes from distillery-related payrolls $25,248,351 $32,792,590 $37,001,568 $47,164,694 $59,440,739 $34,192,388 135.4%General sales taxes from distillery-related payrolls $21,938,745 $28,494,070 $31,798,948 $39,912,341 $49,137,208 $27,198,463 124.0%Occupational taxes from distillery-related payrolls $6,497,408 $8,424,378 $12,073,846 $15,714,466 $19,482,174 $12,984,765 199.8%
Distilled spirits license fees** $186,790 $237,190 $188,590 $314,235 $346,562 $159,772 85.5%Subtotal $68,275,032 $91,539,153 $105,980,981 $135,059,333 $166,623,524 $98,348,492 144.0%
Consumption-related
Case sales tax $110,086 $122,873 $132,802 $153,781 $202,034 $91,948 83.5%Excise tax per gallon $10,942,531 $11,962,448 $12,468,749 $14,237,920 $17,520,621 $6,578,090 60.1%
Wholesale tax $28,175,617 $31,911,903 $36,471,357 $44,064,952 $62,862,108 $34,686,491 123.1%General retail sales tax, restaurants and bars $8,748,501 $9,908,614 $11,324,320 $13,314,640 $11,516,459 $2,767,958 31.6%
Package retail sales tax $14,443,509 $16,358,821 $18,696,108 $22,593,905 $21,542,989 $7,099,480 49.2%Distilled spirits license fees** $4,301,591 $4,697,707 $4,869,387 $5,497,641 $5,613,838 $1,312,247 30.5%
Subtotal $66,721,835 $74,962,366 $83,962,723 $99,862,840 $119,258,049 $52,536,213 78.7%
Grand Total $134,996,867 $166,501,519 $189,943,705 $234,922,172 $285,881,572 $150,884,705 111.8%
Comparison of Estimated Annual Kentucky Taxes on the Production and Consumption of Distilled Spririts, 2010-2017
* This represents an estimate based on a five year average of Kentucky corporate income tax payments and local net profits tax payments from some, but not all, the major companies compiled for the previous version of this study. Corporate income tax payments tend to vary widely from year to year, making prediction unreliable.** Production-related license fees are mostly for distillers and rectifiers licenses; consumption-related license fees are largely for retail and package drink licenses.

The Distilling Industry in Kentucky, 2021 35
output model, predicting $1.23 billion in payroll at Kentucky businesses was being directly or
indirectly supported by the distilling industry. This is 25 percent more than the previous study.
The Distilling Industry in Kentucky, 2021 36
Conclusion he distilling industry in Kentucky continues to expand in response to growing domestic
and international demand for its signature Bourbon products. We have studied the
industry six times since 2009, and have been able to document steady growth in
facilities, jobs, payroll, exports, and tax payments. In our first study, we reported 19 distilling
establishments owned by 10 companies, located in 8 counties. There are now distilleries in 95
distinct locations, owned by 75 companies, across 40 counties. This reflects the expansions by
large legacy distillers, but also the recent explosion in craft distillers. The boom in craft distillers
is nationwide, but Kentucky remains the central state in terms of production, accounting for 30
percent of U.S. employment in the distilling industry.
The industry now directly employs around 6,000 workers in Kentucky, with a payroll of $600
million annually. But the full economic impact is much larger, due to the many businesses in
Kentucky supplying materials and services to distillers, as well as increased household spending
related to distillery payrolls. Examples include farmers who provide grain, companies that
provide oak barrels and packaging materials, truckers, bankers, insurers, and marketing firms.
We estimate that the total statewide economic impact of the distilling industry in 2020 was
22,540 jobs, with annual payroll of $1.23 billion.
The production and consumption of distilled spirits provides an increasing flow of tax payments
to state and local governments. We estimate the distilling industry is directly or indirectly
responsible for about $286 million in state and local tax payments in Kentucky annually. This is
more than double the amount we documented in our 2009 study. The total includes local and
state property taxes, state alcohol production and consumption taxes, local occupational taxes,
and Kentucky state individual income and sales taxes. State government accounts for 80
percent of the total tax revenues, with 20 percent going to local government entities. School
districts and local governments are the biggest recipients of property taxes paid by the industry.
For 2021, the Kentucky Department of Revenue estimates state and local governments will
collect $33.2 million in taxes on barrels aging in inventory, and that inventory is assessed at $4
billion.
The industry has also accelerated its investments in new plants and equipment. KDA members
reported capital spending of $1.9 billion over the last five years, almost equally split between
construction and other items, such as machinery, equipment, and furnishings. Moreover, they
plan to spend $3.3 billion over the next five years. Every KDA member, whether a large Heritage
producer or a small Craft producer, reported significant investments. (It should be noted the
KDA reached out to non-member distilleries in Kentucky to provide data for this study; several
participated, especially those applying to become members.)
T

The Distilling Industry in Kentucky, 2021 37
These large investments suggest we will see even more growth in traditional measures of
economic activity, such as jobs, payroll, and tax payments. Growing at the rate we have
observed over the last 12 years, Kentucky’s distilling industry could support over 24,000 jobs by
2023, with payroll of $1.3 billion, and total direct and indirect tax payments to state and local
governments of more than $286 million (including taxes from spirits consumption).
Employment Payroll Output
Production-related Taxes Paid to State
and Local Governments
2008 3,200 9,848 $441,850,386 $5,400,000,000 $61,359,5522011 3,100 10,311 $413,031,151 $5,600,000,000 $60,639,7782013 3,594 15,416 $707,232,584 $7,586,622,907 $91,539,1532015 4,300 15,229 $796,562,933 $8,547,398,340 $105,986,6712017 4,953 20,124 $1,003,819,284 $8,585,971,924 $135,059,3332020 6,000 22,538 $1,232,105,626 $8,935,256,608 $166,623,524
potential2023 6,323 24,148 $1,342,030,334 $9,318,223,763 $181,088,481
Total Estimated Economic and Fiscal Impact in KentuckyDirect
Employment by Distilling
Industry
Reference Year of Studies
Summary of Estimated Growth in Distilling Industry Since 2008
Source: prior studies, using sucessive versions of IMPLAN regional input-output models of Kentucky. The potential for 2023 is based on a projection using the compound average growth rate from 2008 to 2020 in each category.
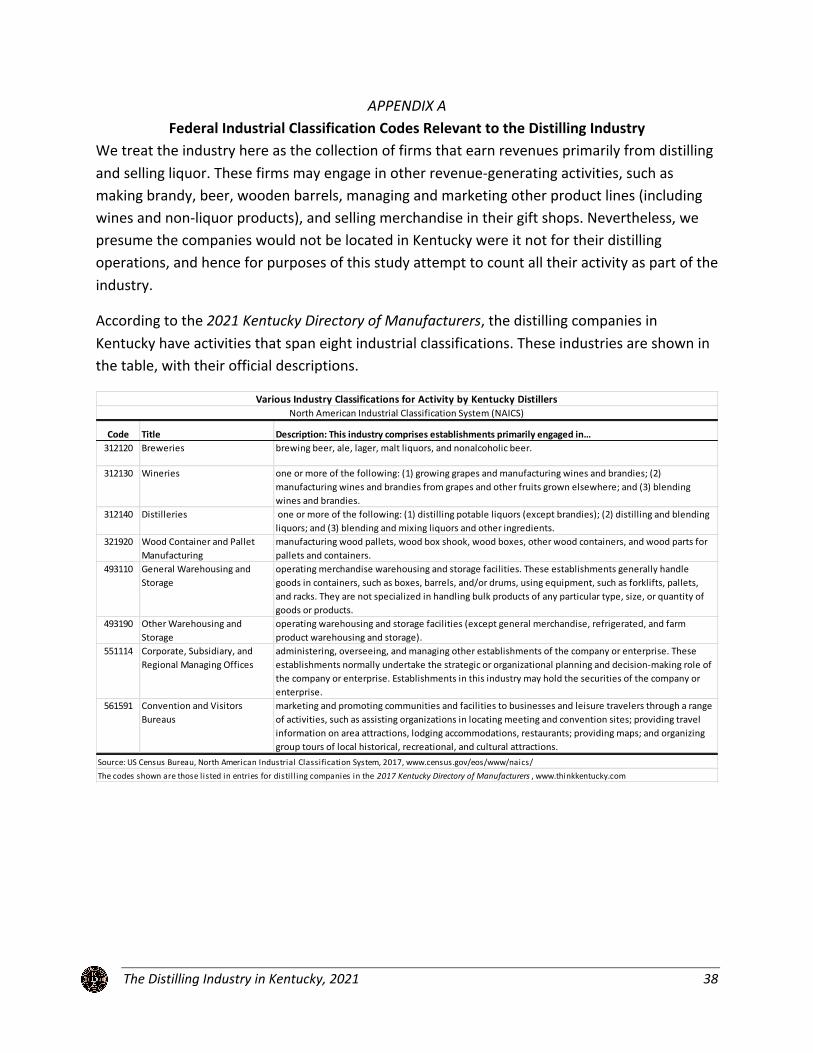
The Distilling Industry in Kentucky, 2021 38
APPENDIX A Federal Industrial Classification Codes Relevant to the Distilling Industry
We treat the industry here as the collection of firms that earn revenues primarily from distilling
and selling liquor. These firms may engage in other revenue-generating activities, such as
making brandy, beer, wooden barrels, managing and marketing other product lines (including
wines and non-liquor products), and selling merchandise in their gift shops. Nevertheless, we
presume the companies would not be located in Kentucky were it not for their distilling
operations, and hence for purposes of this study attempt to count all their activity as part of the
industry.
According to the 2021 Kentucky Directory of Manufacturers, the distilling companies in
Kentucky have activities that span eight industrial classifications. These industries are shown in
the table, with their official descriptions.
Code Title Description: This industry comprises establishments primarily engaged in…312120 Breweries brewing beer, ale, lager, malt liquors, and nonalcoholic beer.
312130 Wineries one or more of the following: (1) growing grapes and manufacturing wines and brandies; (2) manufacturing wines and brandies from grapes and other fruits grown elsewhere; and (3) blending wines and brandies.
312140 Distilleries one or more of the following: (1) distilling potable liquors (except brandies); (2) distilling and blending liquors; and (3) blending and mixing liquors and other ingredients.
321920 Wood Container and Pallet Manufacturing
manufacturing wood pallets, wood box shook, wood boxes, other wood containers, and wood parts for pallets and containers.
493110 General Warehousing and Storage
operating merchandise warehousing and storage facilities. These establishments generally handle goods in containers, such as boxes, barrels, and/or drums, using equipment, such as forklifts, pallets, and racks. They are not specialized in handling bulk products of any particular type, size, or quantity of goods or products.
493190 Other Warehousing and Storage
operating warehousing and storage facilities (except general merchandise, refrigerated, and farm product warehousing and storage).
551114 Corporate, Subsidiary, and Regional Managing Offices
administering, overseeing, and managing other establishments of the company or enterprise. These establishments normally undertake the strategic or organizational planning and decision-making role of the company or enterprise. Establishments in this industry may hold the securities of the company or enterprise.
561591 Convention and Visitors Bureaus
marketing and promoting communities and facilities to businesses and leisure travelers through a range of activities, such as assisting organizations in locating meeting and convention sites; providing travel information on area attractions, lodging accommodations, restaurants; providing maps; and organizing group tours of local historical, recreational, and cultural attractions.
Various Industry Classifications for Activity by Kentucky DistillersNorth American Industrial Classification System (NAICS)
Source: US Census Bureau, North American Industrial Classification System, 2017, www.census.gov/eos/www/naics/
The codes shown are those listed in entries for distil l ing companies in the 2017 Kentucky Directory of Manufacturers , www.thinkkentucky.com

The Distilling Industry in Kentucky, 2021 39
APPENDIX B Licensed Distillers in Kentucky
Distiller Name Class City CountyAge International A Frankfort Franklin
Alltech's Lexington Brewing and Distilling Company A Lexington Fayette
Barton 1792 Distillery (Sazerac Distillers LLC) A Bardstown Nelson
Brown-Forman Corporation, 2921 Dixie Highway A Louisville Jefferson
Brown-Forman Corporation, 850 Dixie Highway A Louisville Jefferson
Buffalo Trace Distillery A Frankfort Franklin
Castle & Key (Peristyle LLC) A Frankfort Franklin
Copper & Kings American Brandy Company A Louisville Jefferson
Diageo Americas Supply Inc A Shelbyville Shelby
Diageo Americas Supply Inc (Stitzel Weller) A Louisville Jefferson
Diageo Lebanon Distillery A Lebanon Marion
Evan Williams Bourbon Experience (Heaven Hill Distilleries Inc) A Louisville Jefferson
Four Roses Distillery A Lawrenceburg Anderson
Glenmore Distillery (Sazerac Distillers LLC) A Owensboro Daviess
Green River Distilling Company A Owensboro Daviess
Heaven Hill Distilleries Inc. A Louisville Jefferson
Heaven Hill Distilleries Inc. A Bardstown Nelson
Jim Beam Brands A Clermont Bullitt
Jim Beam Brands A Frankfort Franklin
Jim Beam Brands A Louisville Jefferson
Jim Beam Brands A Boston Nelson
Kentucky Artisan Distillery (Copperhead Distillery Company) A Crestwood Oldham
Kentucky Bourbon Distillers Ltd (The Willett Distillery) A Bardstown Nelson
Kentucky Peerless Distilling Company A Louisville Jefferson
Louisville Spirits Group (Louisville Distilling Company LLC) A Louisville Jefferson
Lux Row Distillers A Bardstown Nelson
Maker's Mark Distillery Inc A Loretto Marion
Michter’s Distillery A Louisville Jefferson
New Riff Distilling - 2 locations and licenses in Newport A Newport Campbell
Old Forester Distilling Co (Brown-Forman Corporation) A Louisville Jefferson
Rabbit Hole Distilling A Louisville Jefferson
Six Mile Creek Distillery A Pleasurefille Henry
The Bardstown Bourbon Company A Bardstown Nelson
Wild Turkey Distillery (Campari America LLC) A Lawrenceburg Anderson
Wilderness Trail Distillery A Danville Boyle
Woodford Reserve Distillers (Brown-Forman Corporation) A Versailles Woodford
Large Volume Distiller Licensees, April 2021
Sources: Kentucky Department of Alcoholic Beverage Control. Class A distillers are licensed to produce more than 50,000
gallons per year; Class B less than 50,000 gallons. Company names in parentheses when they differ substantially from
the distillery names.
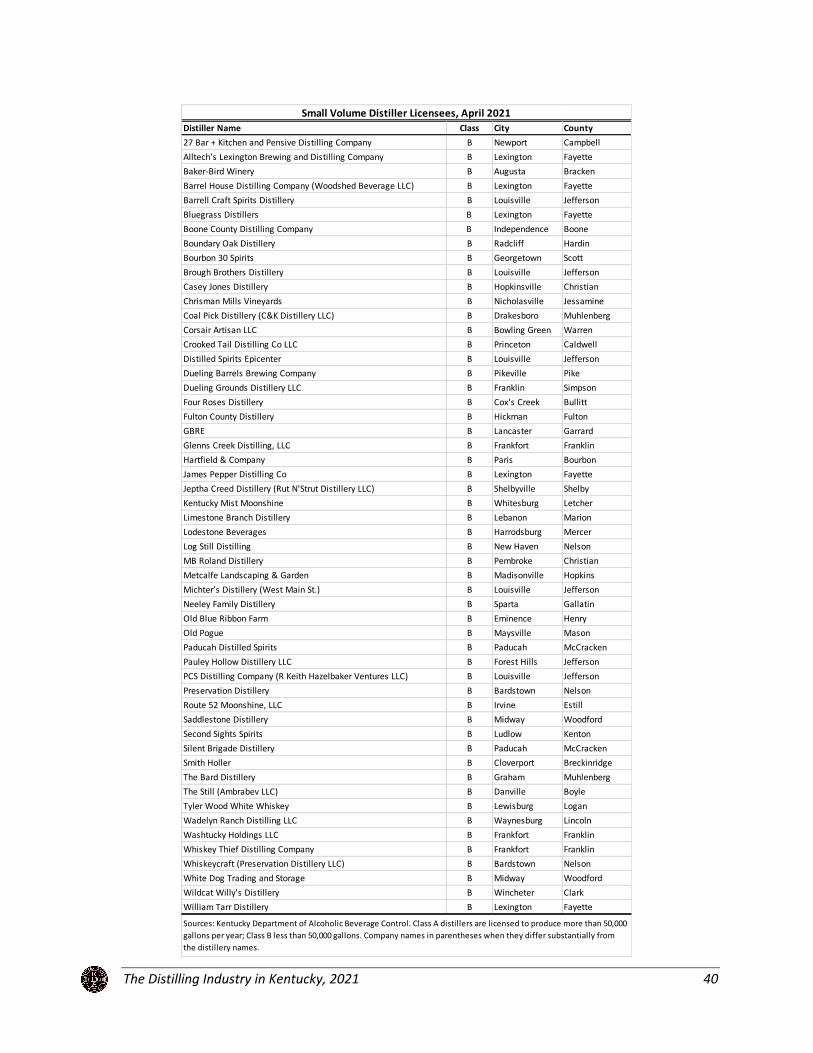
The Distilling Industry in Kentucky, 2021 40
Distiller Name Class City County27 Bar + Kitchen and Pensive Distilling Company B Newport CampbellAlltech's Lexington Brewing and Distilling Company B Lexington FayetteBaker-Bird Winery B Augusta BrackenBarrel House Distilling Company (Woodshed Beverage LLC) B Lexington FayetteBarrell Craft Spirits Distillery B Louisville JeffersonBluegrass Distillers B Lexington FayetteBoone County Distilling Company B Independence BooneBoundary Oak Distillery B Radcliff HardinBourbon 30 Spirits B Georgetown ScottBrough Brothers Distillery B Louisville JeffersonCasey Jones Distillery B Hopkinsville ChristianChrisman Mills Vineyards B Nicholasville JessamineCoal Pick Distillery (C&K Distillery LLC) B Drakesboro MuhlenbergCorsair Artisan LLC B Bowling Green WarrenCrooked Tail Distilling Co LLC B Princeton CaldwellDistilled Spirits Epicenter B Louisville JeffersonDueling Barrels Brewing Company B Pikeville PikeDueling Grounds Distillery LLC B Franklin SimpsonFour Roses Distillery B Cox's Creek BullittFulton County Distillery B Hickman FultonGBRE B Lancaster GarrardGlenns Creek Distilling, LLC B Frankfort FranklinHartfield & Company B Paris BourbonJames Pepper Distilling Co B Lexington FayetteJeptha Creed Distillery (Rut N'Strut Distillery LLC) B Shelbyville ShelbyKentucky Mist Moonshine B Whitesburg LetcherLimestone Branch Distillery B Lebanon MarionLodestone Beverages B Harrodsburg MercerLog Still Distilling B New Haven NelsonMB Roland Distillery B Pembroke ChristianMetcalfe Landscaping & Garden B Madisonville HopkinsMichter’s Distillery (West Main St.) B Louisville JeffersonNeeley Family Distillery B Sparta GallatinOld Blue Ribbon Farm B Eminence HenryOld Pogue B Maysville MasonPaducah Distilled Spirits B Paducah McCrackenPauley Hollow Distillery LLC B Forest Hills JeffersonPCS Distilling Company (R Keith Hazelbaker Ventures LLC) B Louisville JeffersonPreservation Distillery B Bardstown NelsonRoute 52 Moonshine, LLC B Irvine EstillSaddlestone Distillery B Midway WoodfordSecond Sights Spirits B Ludlow KentonSilent Brigade Distillery B Paducah McCrackenSmith Holler B Cloverport BreckinridgeThe Bard Distillery B Graham MuhlenbergThe Still (Ambrabev LLC) B Danville BoyleTyler Wood White Whiskey B Lewisburg LoganWadelyn Ranch Distilling LLC B Waynesburg LincolnWashtucky Holdings LLC B Frankfort FranklinWhiskey Thief Distilling Company B Frankfort FranklinWhiskeycraft (Preservation Distillery LLC) B Bardstown NelsonWhite Dog Trading and Storage B Midway WoodfordWildcat Willy's Distillery B Wincheter ClarkWilliam Tarr Distillery B Lexington Fayette
Small Volume Distiller Licensees, April 2021
Sources: Kentucky Department of Alcoholic Beverage Control. Class A distillers are licensed to produce more than 50,000 gallons per year; Class B less than 50,000 gallons. Company names in parentheses when they differ substantially from the distillery names.
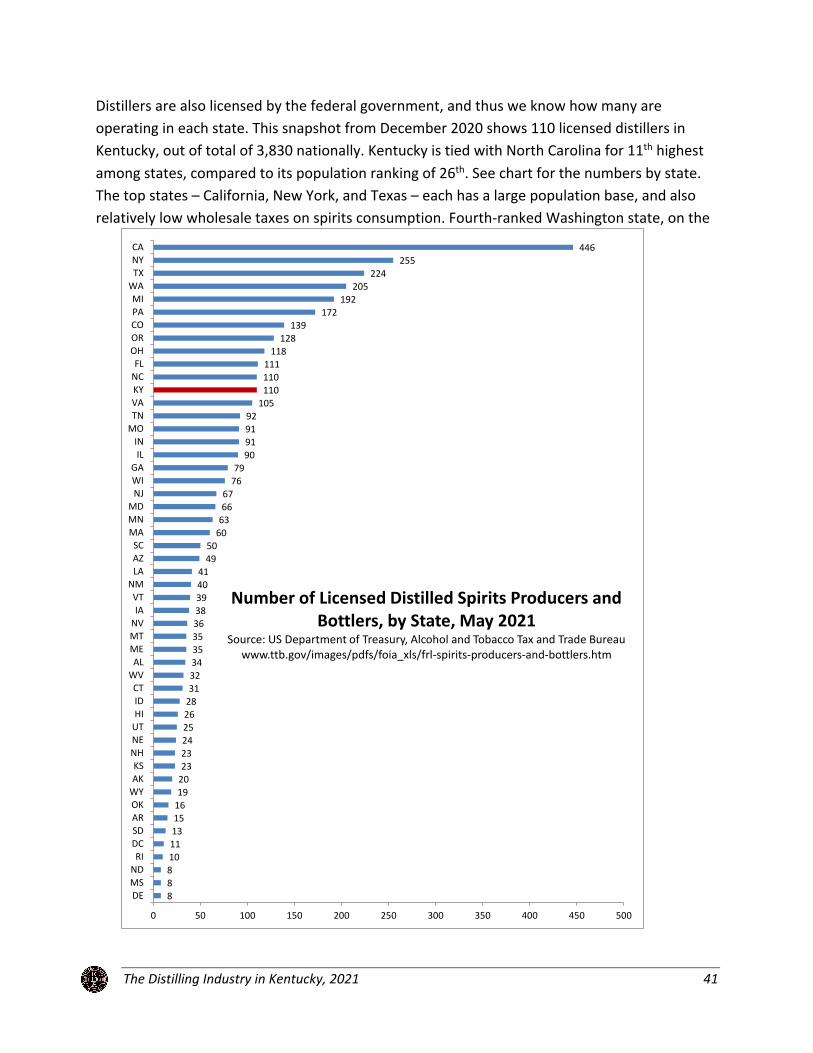
The Distilling Industry in Kentucky, 2021 41
Distillers are also licensed by the federal government, and thus we know how many are
operating in each state. This snapshot from December 2020 shows 110 licensed distillers in
Kentucky, out of total of 3,830 nationally. Kentucky is tied with North Carolina for 11th highest
among states, compared to its population ranking of 26th. See chart for the numbers by state.
The top states – California, New York, and Texas – each has a large population base, and also
relatively low wholesale taxes on spirits consumption. Fourth-ranked Washington state, on the
8881011131516192023232425262831323435353638394041
4950
60636667
7679
90919192
105110110111
118128
139172
192205
224255
446
0 50 100 150 200 250 300 350 400 450 500
DEMSND
RIDCSDAROKWYAKKS
NHNEUTHIIDCT
WVAL
MEMTNVIA
VTNM
LAAZSC
MAMNMD
NJWIGA
ILIN
MOTNVAKYNCFL
OHORCOPAMI
WATXNYCA
Number of Licensed Distilled Spirits Producers and Bottlers, by State, May 2021
Source: US Department of Treasury, Alcohol and Tobacco Tax and Trade Bureau www.ttb.gov/images/pdfs/foia_xls/frl-spirits-producers-and-bottlers.htm
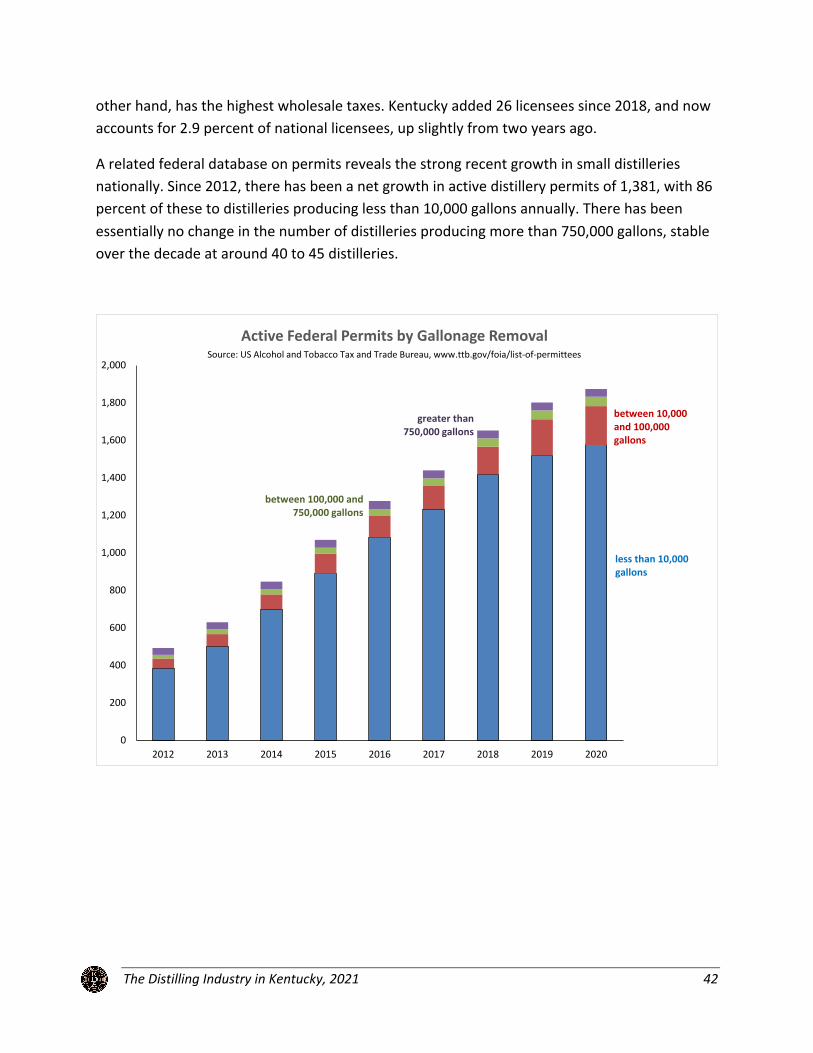
The Distilling Industry in Kentucky, 2021 42
other hand, has the highest wholesale taxes. Kentucky added 26 licensees since 2018, and now
accounts for 2.9 percent of national licensees, up slightly from two years ago.
A related federal database on permits reveals the strong recent growth in small distilleries
nationally. Since 2012, there has been a net growth in active distillery permits of 1,381, with 86
percent of these to distilleries producing less than 10,000 gallons annually. There has been
essentially no change in the number of distilleries producing more than 750,000 gallons, stable
over the decade at around 40 to 45 distilleries.
0
200
400
600
800
1,000
1,200
1,400
1,600
1,800
2,000
2012 2013 2014 2015 2016 2017 2018 2019 2020
Active Federal Permits by Gallonage Removal
less than 10,000 gallons
between 100,000 and 750,000 gallons
greater than 750,000 gallons
between 10,000 and 100,000 gallons
Source: US Alcohol and Tobacco Tax and Trade Bureau, www.ttb.gov/foia/list-of-permittees
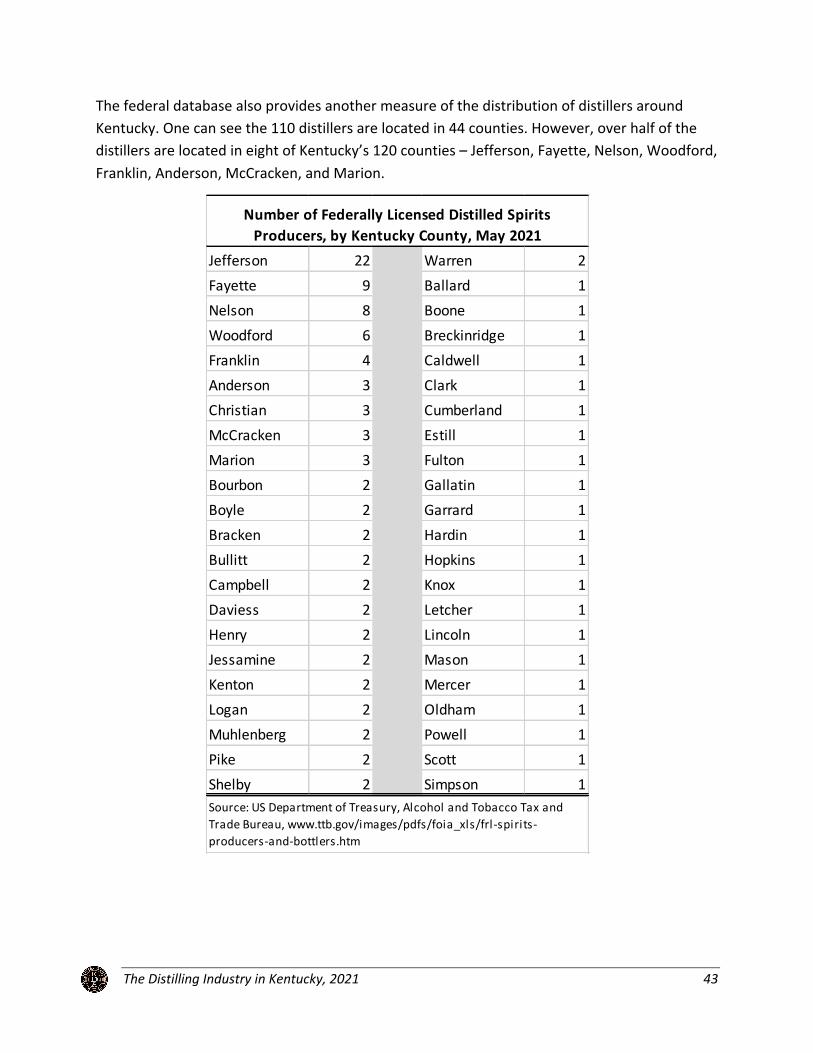
The Distilling Industry in Kentucky, 2021 43
The federal database also provides another measure of the distribution of distillers around
Kentucky. One can see the 110 distillers are located in 44 counties. However, over half of the
distillers are located in eight of Kentucky’s 120 counties – Jefferson, Fayette, Nelson, Woodford,
Franklin, Anderson, McCracken, and Marion.
Jefferson 22 Warren 2Fayette 9 Ballard 1Nelson 8 Boone 1Woodford 6 Breckinridge 1Franklin 4 Caldwell 1Anderson 3 Clark 1Christian 3 Cumberland 1McCracken 3 Estill 1Marion 3 Fulton 1Bourbon 2 Gallatin 1Boyle 2 Garrard 1Bracken 2 Hardin 1Bullitt 2 Hopkins 1Campbell 2 Knox 1Daviess 2 Letcher 1Henry 2 Lincoln 1Jessamine 2 Mason 1Kenton 2 Mercer 1Logan 2 Oldham 1Muhlenberg 2 Powell 1Pike 2 Scott 1Shelby 2 Simpson 1
Number of Federally Licensed Distilled Spirits Producers, by Kentucky County, May 2021
Source: US Department of Treasury, Alcohol and Tobacco Tax and Trade Bureau, www.ttb.gov/images/pdfs/foia_xls/frl-spirits-producers-and-bottlers.htm
The Distilling Industry in Kentucky, 2021 44
APPENDIX C Measures of Employment and Payroll for Kentucky’s Distilling Industry
There are several government sources of data on employment and/or payroll for Kentucky’s
distilling industry, and the estimates differ by statistical program due to different definitions,
timeframes, geographic detail, and disclosure rules. In this section, we display the various
estimates and discuss their differences. First, we mention some general measurement issues to
keep in mind when dealing with official economic data.
All federal statistical programs use an industrial classification scheme based on the primary
source of revenues to the business establishment. Thus, if distilling accounts for the largest
source of revenue for a company that also sells wine, food, merchandise in gift shops, etc., all
the business’s economic activity is counted under the distilling industry, NAICS 31214.
Moreover, most employment and payroll measures for the industry simply lump production
and management personnel under one industry estimate. So, a Kentucky distiller with a large
international headquarters operation is counted the same as a distilling operation that only
produces Bourbon. There are obviously large differences in occupations and average pay
between a headquarters and an actual distillery. We delve into this subject below in our
discussion of the Economic Census, the one federal program that distinguishes production from
supervisory personnel.
Finally, the payroll data discussed do not include any fringe benefits. Employee benefits take
the form of Social Security and Medicare taxes paid by the employer, contributions to private
pensions plans, subsidies of health and life insurance plans, payments into the unemployment
insurance systems, and the value of clothing and meals. Employer-provided benefits to
employees can range from 20 to 50 percent of actual wages and salaries paid.
Quarterly Census of Employment and Wages (QCEW)
The QCEW is produced by the U.S. Bureau of Labor Statistics, and covers nearly all
nonagricultural wage and salary employment. The government receives the raw data from
employer reports as part of each state’s mandatory unemployment insurance program; and
thus, the estimates are based on a census, not a survey. Data are published on a monthly basis
for employment and a quarterly basis for wages. Data are released with about a six-month lag.
Thus, full 2020 data were available in June 2021. Note that QCEW data do not cover business
proprietors or otherwise self-employed persons, and hence will not capture some of the
business owners involved in craft distilling. BLS publishes QCEW data at the county level,
though federal confidentiality laws limit the amount of industry detail that can be released,
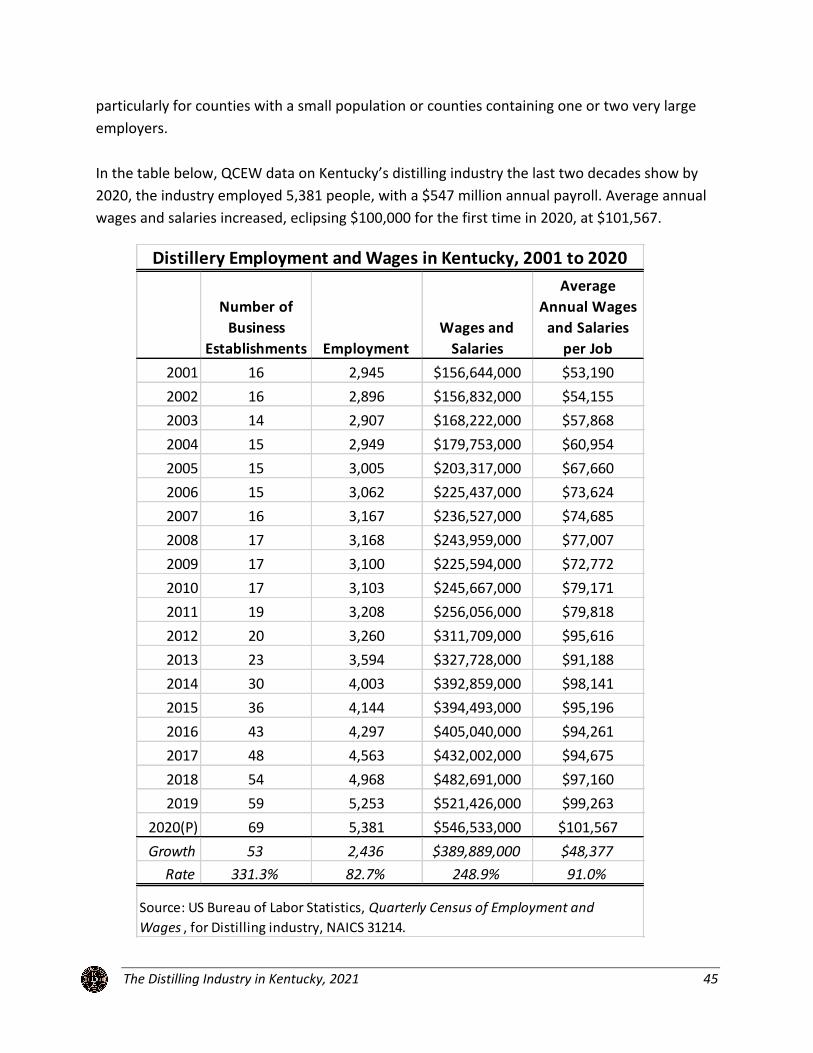
The Distilling Industry in Kentucky, 2021 45
particularly for counties with a small population or counties containing one or two very large
employers.
In the table below, QCEW data on Kentucky’s distilling industry the last two decades show by
2020, the industry employed 5,381 people, with a $547 million annual payroll. Average annual
wages and salaries increased, eclipsing $100,000 for the first time in 2020, at $101,567.
Number of Business
Establishments EmploymentWages and
Salaries
Average Annual Wages
and Salaries per Job
2001 16 2,945 $156,644,000 $53,1902002 16 2,896 $156,832,000 $54,1552003 14 2,907 $168,222,000 $57,8682004 15 2,949 $179,753,000 $60,9542005 15 3,005 $203,317,000 $67,6602006 15 3,062 $225,437,000 $73,6242007 16 3,167 $236,527,000 $74,6852008 17 3,168 $243,959,000 $77,0072009 17 3,100 $225,594,000 $72,7722010 17 3,103 $245,667,000 $79,1712011 19 3,208 $256,056,000 $79,8182012 20 3,260 $311,709,000 $95,6162013 23 3,594 $327,728,000 $91,1882014 30 4,003 $392,859,000 $98,1412015 36 4,144 $394,493,000 $95,1962016 43 4,297 $405,040,000 $94,2612017 48 4,563 $432,002,000 $94,6752018 54 4,968 $482,691,000 $97,1602019 59 5,253 $521,426,000 $99,263
2020(P) 69 5,381 $546,533,000 $101,567Growth 53 2,436 $389,889,000 $48,377
Rate 331.3% 82.7% 248.9% 91.0%
Distillery Employment and Wages in Kentucky, 2001 to 2020
Source: US Bureau of Labor Statistics, Quarterly Census of Employment and Wages , for Distilling industry, NAICS 31214.

The Distilling Industry in Kentucky, 2021 46
While we view the QCEW as the most comprehensive accounting of the distilling industry, these
estimates actually understate the size of the industry in Kentucky a bit because the distilled
spirits industry here is represented by larger and more vertically integrated companies than
elsewhere.
Because most economic data are collected on an establishment basis, it is possible for two
facilities of the same company involved in different aspects of the production process to be
classified into different industries, even if they are on adjacent parcels of land. This is the case
for a few bottling and shipping facilities in Kentucky. Because this is an integral part of the
business, we fold these facilities into the industry for our economic analysis.2 Our economic
impact analysis assumes employment of roughly 6,000 people with annual wages totaling $600
million.
2 Additionally, the U.S. Census Bureau dataset, County Business Patterns, which tends to be most stricter in terms
of only counting direct production facilities as part of a manufacturing industry, shows a much higher increase in distilling industry employment from 2018 to 2019 for both Kentucky and the US, than does the QCEW. Historically normal ratios between the CBP and QCEW data indicate that the latest QCEW data may be underestimating the size of the industry in Kentucky.
60
80
100
120
140
160
180
200
Index of Employment Growth Since 2001, Distilling and Other Manufacturing Industries
Distilling
Other Manufacturing
Source: US Bureau of Labor Statistic, Quarterly Census of Employment and Wages. In 2020, distilling had 5,381 jobs, a growth of 83 percent since 2001. Other manufacturing had 230,193 jobs, a net decline of 21 percent since 2001.
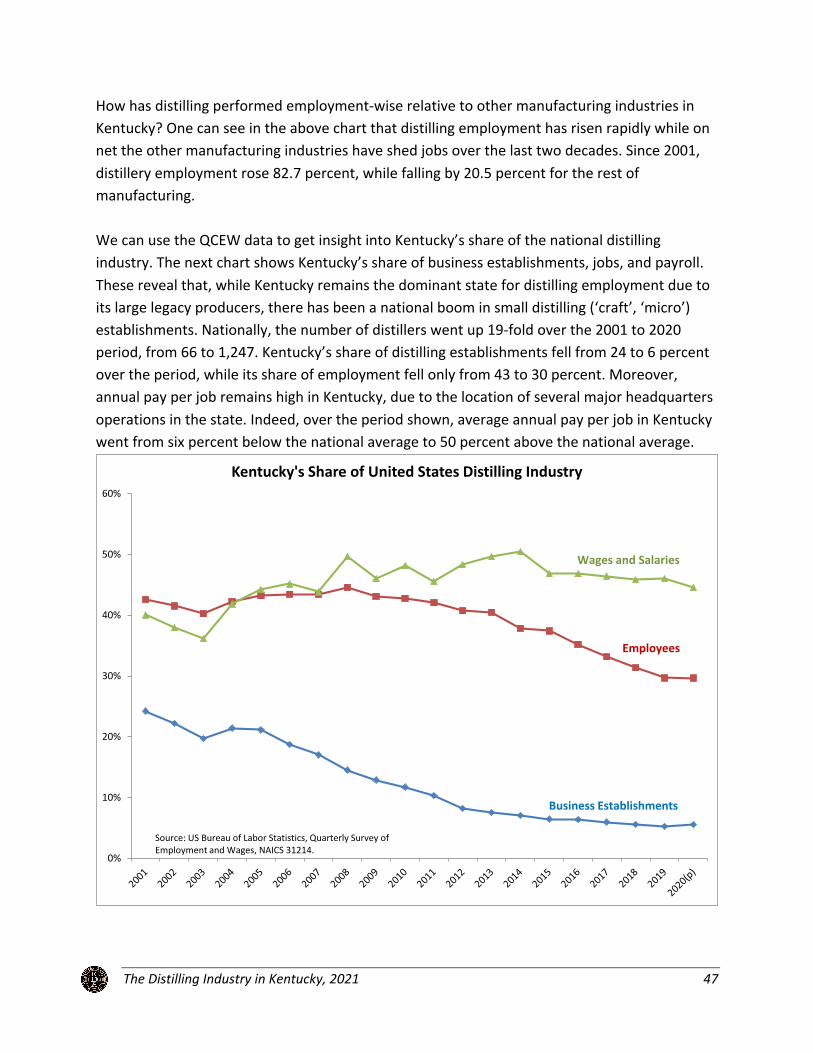
The Distilling Industry in Kentucky, 2021 47
How has distilling performed employment-wise relative to other manufacturing industries in
Kentucky? One can see in the above chart that distilling employment has risen rapidly while on
net the other manufacturing industries have shed jobs over the last two decades. Since 2001,
distillery employment rose 82.7 percent, while falling by 20.5 percent for the rest of
manufacturing.
We can use the QCEW data to get insight into Kentucky’s share of the national distilling
industry. The next chart shows Kentucky’s share of business establishments, jobs, and payroll.
These reveal that, while Kentucky remains the dominant state for distilling employment due to
its large legacy producers, there has been a national boom in small distilling (‘craft’, ‘micro’)
establishments. Nationally, the number of distillers went up 19-fold over the 2001 to 2020
period, from 66 to 1,247. Kentucky’s share of distilling establishments fell from 24 to 6 percent
over the period, while its share of employment fell only from 43 to 30 percent. Moreover,
annual pay per job remains high in Kentucky, due to the location of several major headquarters
operations in the state. Indeed, over the period shown, average annual pay per job in Kentucky
went from six percent below the national average to 50 percent above the national average.
0%
10%
20%
30%
40%
50%
60%
Kentucky's Share of United States Distilling Industry
Source: US Bureau of Labor Statistics, Quarterly Survey of Employment and Wages, NAICS 31214.
Business Establishments
Employees
Wages and Salaries
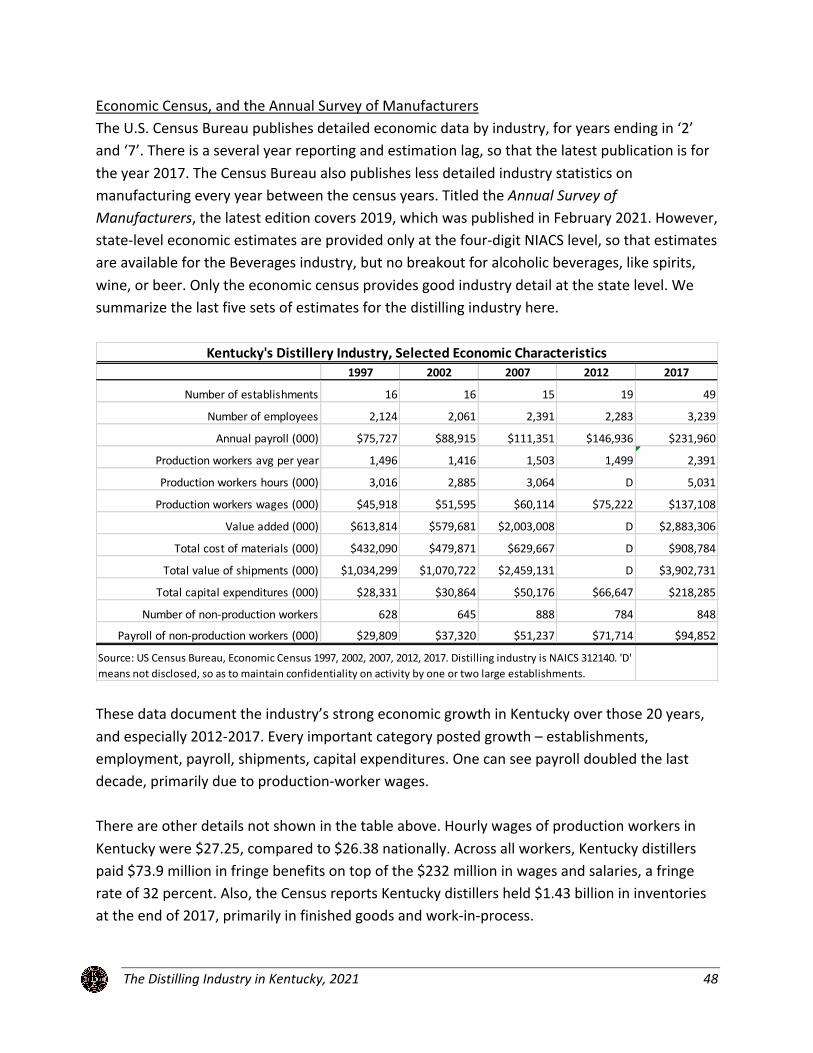
The Distilling Industry in Kentucky, 2021 48
Economic Census, and the Annual Survey of Manufacturers
The U.S. Census Bureau publishes detailed economic data by industry, for years ending in ‘2’
and ‘7’. There is a several year reporting and estimation lag, so that the latest publication is for
the year 2017. The Census Bureau also publishes less detailed industry statistics on
manufacturing every year between the census years. Titled the Annual Survey of Manufacturers, the latest edition covers 2019, which was published in February 2021. However,
state-level economic estimates are provided only at the four-digit NIACS level, so that estimates
are available for the Beverages industry, but no breakout for alcoholic beverages, like spirits,
wine, or beer. Only the economic census provides good industry detail at the state level. We
summarize the last five sets of estimates for the distilling industry here.
These data document the industry’s strong economic growth in Kentucky over those 20 years,
and especially 2012-2017. Every important category posted growth – establishments,
employment, payroll, shipments, capital expenditures. One can see payroll doubled the last
decade, primarily due to production-worker wages.
There are other details not shown in the table above. Hourly wages of production workers in
Kentucky were $27.25, compared to $26.38 nationally. Across all workers, Kentucky distillers
paid $73.9 million in fringe benefits on top of the $232 million in wages and salaries, a fringe
rate of 32 percent. Also, the Census reports Kentucky distillers held $1.43 billion in inventories
at the end of 2017, primarily in finished goods and work-in-process.
1997 2002 2007 2012 2017
Number of establishments 16 16 15 19 49
Number of employees 2,124 2,061 2,391 2,283 3,239
Annual payroll (000) $75,727 $88,915 $111,351 $146,936 $231,960
Production workers avg per year 1,496 1,416 1,503 1,499 2,391
Production workers hours (000) 3,016 2,885 3,064 D 5,031
Production workers wages (000) $45,918 $51,595 $60,114 $75,222 $137,108
Value added (000) $613,814 $579,681 $2,003,008 D $2,883,306
Total cost of materials (000) $432,090 $479,871 $629,667 D $908,784
Total value of shipments (000) $1,034,299 $1,070,722 $2,459,131 D $3,902,731
Total capital expenditures (000) $28,331 $30,864 $50,176 $66,647 $218,285
Number of non-production workers 628 645 888 784 848
Payroll of non-production workers (000) $29,809 $37,320 $51,237 $71,714 $94,852
Kentucky's Distillery Industry, Selected Economic Characteristics
Source: US Census Bureau, Economic Census 1997, 2002, 2007, 2012, 2017. Distilling industry is NAICS 312140. 'D'
means not disclosed, so as to maintain confidentiality on activity by one or two large establishments.

The Distilling Industry in Kentucky, 2021 49
Note that the economic census statistics are lower than those published under the QCEW
program for the same years. For example, the 2017 census shows only 3,239 jobs in distilling
for Kentucky, while QCEW reports 4,563. Similarly, the payroll estimate is much higher in the
QCEW data series than in the economic census or CBP program. We believe this is due to an
inconsistency in how the data programs classify corporate headquarters operations.
Presumably, the QCEW counts distillery headquarters jobs and payroll as part of the distilling
(manufacturing) industry, while the economic census counts headquarters activity under a
management industry category. In our modeling work we will use the larger QCEW figures as a
base, since the headquarters are certainly considered part of the distilling industry in Kentucky.
In the next table, we summarize Kentucky’s share of the national industry for the same
economic variables. One can see Kentucky maintained a lead position in the industry, with most
economic measures holding steady at around one-third of the national totals. The huge share of
U.S. capital expenditures (54 percent) in 2017 bodes well for the future of the industry in
Kentucky. The declining share of establishments is due to the explosion of small craft distilleries
around the country. We examine the growth in craft distilleries in detail in Appendix D.
The 2017 Census also provides a breakout of capital expenditures, as shown below. Of the $218
million invested in 2017 by Kentucky distillers, 46 percent went to buildings and 54 percent to
machinery and equipment. This is almost identical to the national distribution of capital
expenditures by distillers that year, reflecting the nature of production facilities: buildings,
fermenting equipment, warehouses, bottling lines, packaging, and shipping.
1997 2002 2007 2012 2017Number of establishments 26.7% 23.9% 15.6% 7.6% 6.3%
Number of employees 32.5% 36.8% 27.0% 32.7% 29.1%
Annual payroll ($1,000) 30.0% 35.1% 26.9% 34.4% 33.4%
Production workers avg per year 32.0% 38.3% 30.0% 33.2% 32.1%
Production workers hours (1,000) 31.0% 38.1% 30.2% D 34.0%
Production workers wages ($1,000) 29.0% 37.9% 30.1% 32.8% 35.2%
Value added ($1,000) 27.8% 22.9% 42.9% D 33.6%
Total cost of materials ($1,000) 25.2% 30.5% 24.3% D 28.2%
Total value of shipments ($1,000) 26.5% 26.4% 34.7% D 31.7%
Total capital expenditures ($1,000) 37.3% 28.9% 32.2% 37.0% 53.6%
Number of non-production workers 33.6% 33.9% 23.1% 31.7% 23.0%
Payroll of non-production workers 31.7% 31.9% 24.0% 36.3% 31.2%
Source: US Census Bureau, Economic Census 1997, 2002, 2007, 2012, 2017. Distilling industry is NAICS 312140. 'D'
means not disclosed, so as to maintain confidentiality on activity by one or two large establishments.
Kentucky's Share of US Distillery Industry, Selected Economic Characteristics
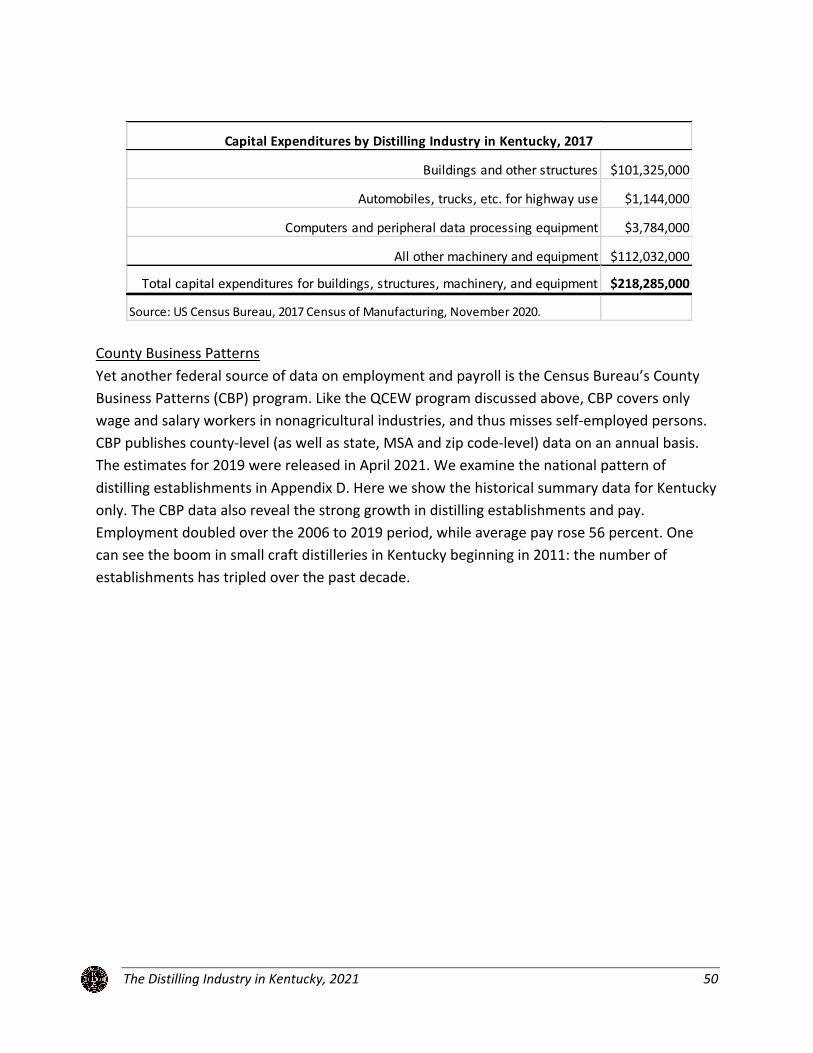
The Distilling Industry in Kentucky, 2021 50
County Business Patterns
Yet another federal source of data on employment and payroll is the Census Bureau’s County
Business Patterns (CBP) program. Like the QCEW program discussed above, CBP covers only
wage and salary workers in nonagricultural industries, and thus misses self-employed persons.
CBP publishes county-level (as well as state, MSA and zip code-level) data on an annual basis.
The estimates for 2019 were released in April 2021. We examine the national pattern of
distilling establishments in Appendix D. Here we show the historical summary data for Kentucky
only. The CBP data also reveal the strong growth in distilling establishments and pay.
Employment doubled over the 2006 to 2019 period, while average pay rose 56 percent. One
can see the boom in small craft distilleries in Kentucky beginning in 2011: the number of
establishments has tripled over the past decade.
Buildings and other structures $101,325,000
Automobiles, trucks, etc. for highway use $1,144,000
Computers and peripheral data processing equipment $3,784,000
All other machinery and equipment $112,032,000
Total capital expenditures for buildings, structures, machinery, and equipment $218,285,000
Source: US Census Bureau, 2017 Census of Manufacturing, November 2020.
Capital Expenditures by Distilling Industry in Kentucky, 2017

The Distilling Industry in Kentucky, 2021 51
How does the CBP data align with the QCEW data discussed above? Note that the number of
distilling establishments is almost the same from the two sources for the last year that common
data are available (2019), with QCEW showing 59 establishments and CBP showing 55. But the
employment counts and payroll estimates are quite different. Recall that for 2019, the QCEW
program estimated Kentucky had 5,253 distilling employees (750 more than CBP) and an annual
payroll of $521 million (almost double that of CBP). We believe the difference is due to the
treatment of some corporate headquarters activity, with the QCEW program including it and
CBP excluding it. The large difference in payrolls is consistent with this explanation, since
corporate office employees typically have advanced educational credentials and skills, and thus
earn much higher salaries than production workers. In 2019, workers covered by the QCEW
program averaged $99,300, while those covered by the CBP program average $73,600.
EstablishmentsPaid
Employees Annual Payroll
Average Annual Pay per
Job2005 15 2,047 $99,498,000 $48,6072006 16 2,207 $103,967,000 $47,1082007 14 1,681 $81,081,000 $48,2342008 17 2,209 $117,439,000 $53,1642009 16 1,903 $104,575,000 $54,9532010 16 1,945 $98,230,000 $50,5042011 18 1,897 $107,441,000 $56,6372012 20 2,340 $131,328,000 $56,1232013 23 2,272 $150,002,000 $66,0222014 27 2,456 $158,480,000 $64,5282015 37 3,020 $205,248,000 $67,9632016 40 3,057 $210,148,000 $68,7432017 47 3,306 $228,086,000 $68,9922018 50 3,646 $277,742,000 $76,1772019 55 4,505 $331,577,000 $73,602
39 2,298 $227,610,000 $26,494243.8% 104.1% 218.9% 56.2%
growth 2006-19
Distilling Establishments, Jobs, and Payroll in Kentucky
Source: US Census Bureau, County Business Patterns, for Distilling industry, NAICS 312140.
The Distilling Industry in Kentucky, 2021 52
Kentucky Directory of Business and Industry
The Kentucky Cabinet for Economic Development maintains a database of business and
industry, containing information by industrial classification. For each business establishment,
the database provides an address, officers, contact information, major products, and full-time
employment (self-reported by the companies). We asked the Cabinet to query the database in
June 2021 to discern information for ‘Distilleries’, NAICS 312140, and related sectors. All major
producers are represented, with entries for a total of 79 establishments, up from 56
represented in the comparable 2018 report. An employment count was provided, and the sum
of employment reported across the industry was 5,630, up from 4,908 in 2018. Most of the
craft distillers listed in Appendix A are not included in the directory.
Summary
As noted above, our economic impact analysis assumes employment of roughly 6,000 people
with annual wages totaling $600 million. The difference between this employment estimate
and the number of jobs reported in the QCEW, Economic Census, County Business Patterns, and
business and industry directory are due to our consideration of the entire process of production
from distilling to barreling to bottling, shipping and marketing compared to the QCEW’s,
Economic Census’, and CBP’s missions of documenting the economy by business establishment.
In practice, this mean that the QCEW, Economic Census, and CBP assign an establishment (and
its employees) to the industry that the majority of the products and/or services produced at the
particular site are most directly related to. Sometimes, even if they are in close physical
proximity, two facilities under the same corporate structure and part of the same overall
production process can be classified under different industries if their functions are different
enough. In the case of the distilling industry in Kentucky, this occurs when facilities are primarily
engaged in bottling and shipping spirits distilled and aged elsewhere and when headquarters-
type functions are the primary work at a particular location. The QCEW, Economic Census, and
CBP classify the former establishments into the wholesale distribution and services industry.
There are several such facilities in Kentucky, some located quite close to distilling facilities, each
bottling the Kentucky-produced spirits of its corporate sibling. The latter establishments get
classified into the management of companies industry. The Directory of Business and Industry
does tend to include both types of those other facilities under the distilling category. With the
additional help of a survey of the state’s distillers, we therefore fold these jobs into the distilling
industry for our economic impact analysis. We have adjusted the IMPLAN models to reflect this
and all the functions of the production process.
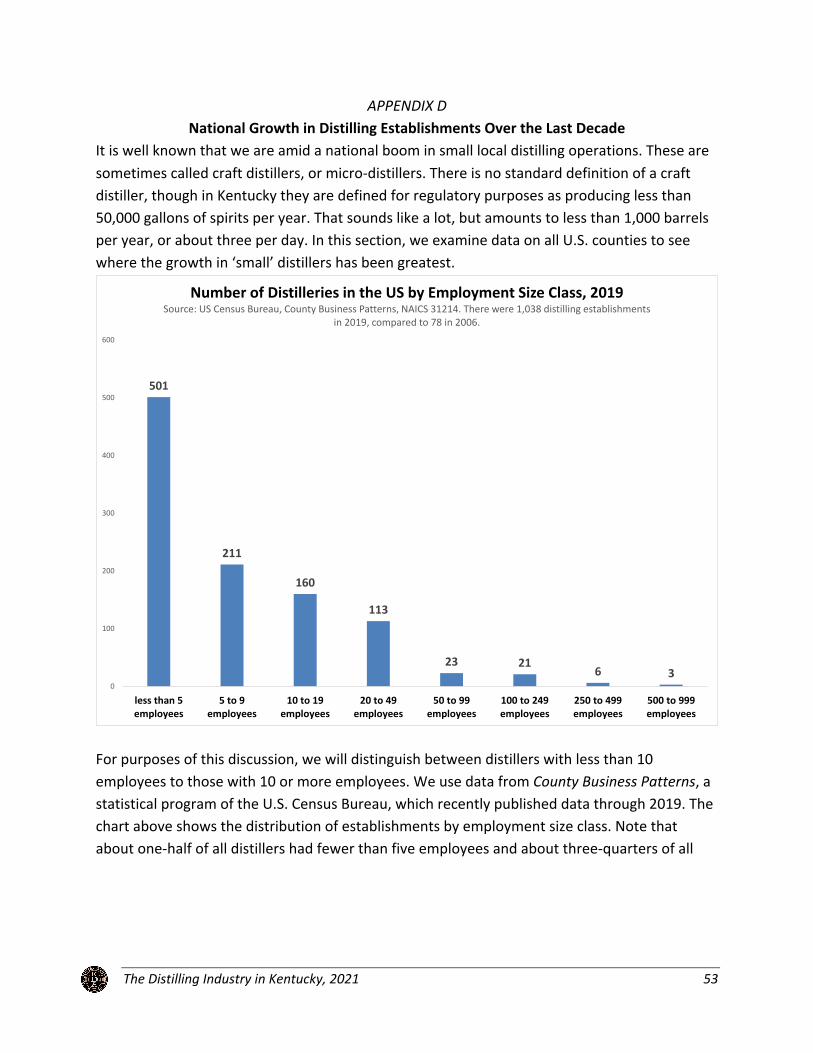
The Distilling Industry in Kentucky, 2021 53
APPENDIX D National Growth in Distilling Establishments Over the Last Decade
It is well known that we are amid a national boom in small local distilling operations. These are
sometimes called craft distillers, or micro-distillers. There is no standard definition of a craft
distiller, though in Kentucky they are defined for regulatory purposes as producing less than
50,000 gallons of spirits per year. That sounds like a lot, but amounts to less than 1,000 barrels
per year, or about three per day. In this section, we examine data on all U.S. counties to see
where the growth in ‘small’ distillers has been greatest.
For purposes of this discussion, we will distinguish between distillers with less than 10
employees to those with 10 or more employees. We use data from County Business Patterns, a
statistical program of the U.S. Census Bureau, which recently published data through 2019. The
chart above shows the distribution of establishments by employment size class. Note that
about one-half of all distillers had fewer than five employees and about three-quarters of all
501
211
160
113
23 21 6 30
100
200
300
400
500
600
less than 5employees
5 to 9employees
10 to 19employees
20 to 49employees
50 to 99employees
100 to 249employees
250 to 499employees
500 to 999employees
Number of Distilleries in the US by Employment Size Class, 2019Source: US Census Bureau, County Business Patterns, NAICS 31214. There were 1,038 distilling establishments
in 2019, compared to 78 in 2006.
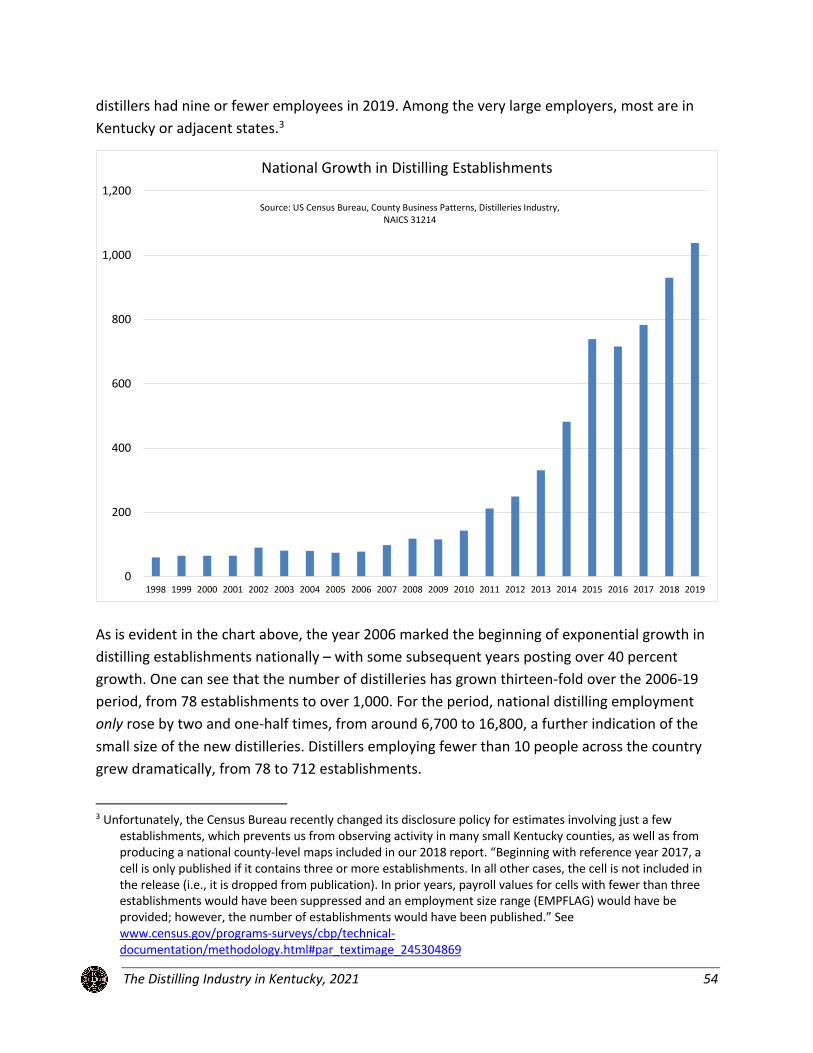
The Distilling Industry in Kentucky, 2021 54
distillers had nine or fewer employees in 2019. Among the very large employers, most are in
Kentucky or adjacent states.3
As is evident in the chart above, the year 2006 marked the beginning of exponential growth in
distilling establishments nationally – with some subsequent years posting over 40 percent
growth. One can see that the number of distilleries has grown thirteen-fold over the 2006-19
period, from 78 establishments to over 1,000. For the period, national distilling employment
only rose by two and one-half times, from around 6,700 to 16,800, a further indication of the
small size of the new distilleries. Distillers employing fewer than 10 people across the country
grew dramatically, from 78 to 712 establishments.
3 Unfortunately, the Census Bureau recently changed its disclosure policy for estimates involving just a few
establishments, which prevents us from observing activity in many small Kentucky counties, as well as from producing a national county-level maps included in our 2018 report. “Beginning with reference year 2017, a cell is only published if it contains three or more establishments. In all other cases, the cell is not included in the release (i.e., it is dropped from publication). In prior years, payroll values for cells with fewer than three establishments would have been suppressed and an employment size range (EMPFLAG) would have be provided; however, the number of establishments would have been published.” See www.census.gov/programs-surveys/cbp/technical-documentation/methodology.html#par_textimage_245304869
0
200
400
600
800
1,000
1,200
1998 1999 2000 2001 2002 2003 2004 2005 2006 2007 2008 2009 2010 2011 2012 2013 2014 2015 2016 2017 2018 2019
National Growth in Distilling Establishments
Source: US Census Bureau, County Business Patterns, Distilleries Industry, NAICS 31214
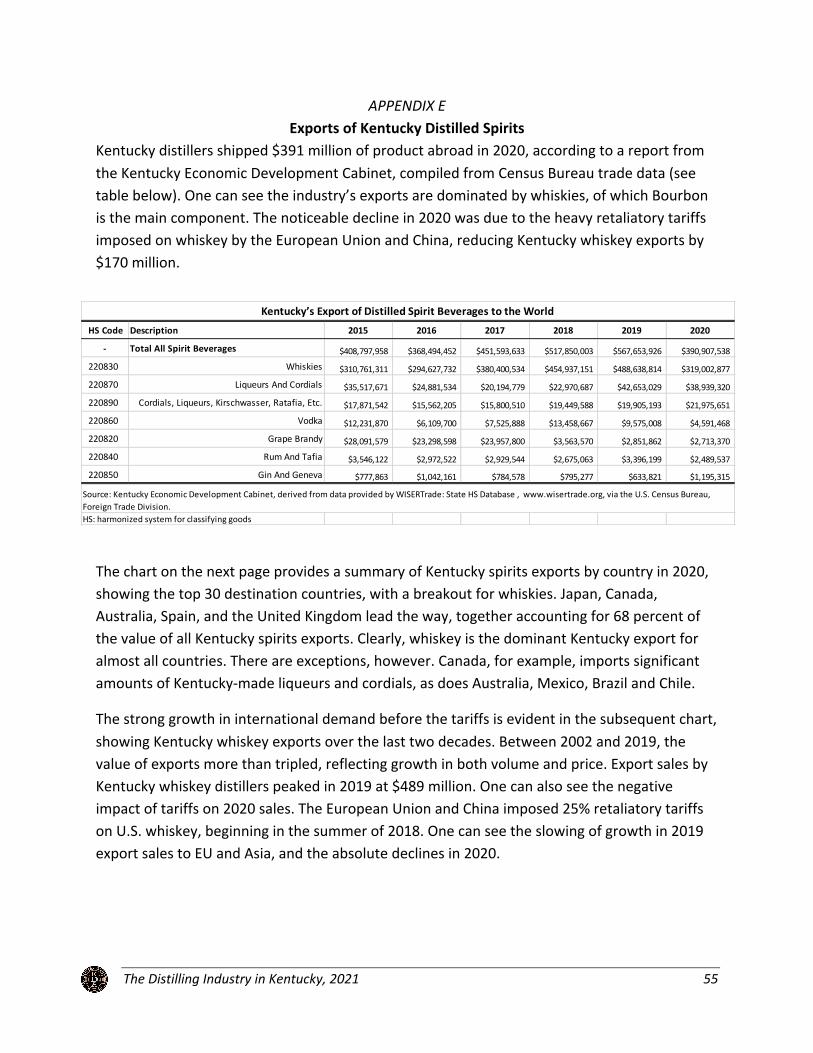
The Distilling Industry in Kentucky, 2021 55
APPENDIX E Exports of Kentucky Distilled Spirits
Kentucky distillers shipped $391 million of product abroad in 2020, according to a report from
the Kentucky Economic Development Cabinet, compiled from Census Bureau trade data (see
table below). One can see the industry’s exports are dominated by whiskies, of which Bourbon
is the main component. The noticeable decline in 2020 was due to the heavy retaliatory tariffs
imposed on whiskey by the European Union and China, reducing Kentucky whiskey exports by
$170 million.
The chart on the next page provides a summary of Kentucky spirits exports by country in 2020,
showing the top 30 destination countries, with a breakout for whiskies. Japan, Canada,
Australia, Spain, and the United Kingdom lead the way, together accounting for 68 percent of
the value of all Kentucky spirits exports. Clearly, whiskey is the dominant Kentucky export for
almost all countries. There are exceptions, however. Canada, for example, imports significant
amounts of Kentucky-made liqueurs and cordials, as does Australia, Mexico, Brazil and Chile.
The strong growth in international demand before the tariffs is evident in the subsequent chart,
showing Kentucky whiskey exports over the last two decades. Between 2002 and 2019, the
value of exports more than tripled, reflecting growth in both volume and price. Export sales by
Kentucky whiskey distillers peaked in 2019 at $489 million. One can also see the negative
impact of tariffs on 2020 sales. The European Union and China imposed 25% retaliatory tariffs
on U.S. whiskey, beginning in the summer of 2018. One can see the slowing of growth in 2019
export sales to EU and Asia, and the absolute declines in 2020.
HS Code Description 2015 2016 2017 2018 2019 2020
- Total All Spirit Beverages $408,797,958 $368,494,452 $451,593,633 $517,850,003 $567,653,926 $390,907,538
220830 Whiskies $310,761,311 $294,627,732 $380,400,534 $454,937,151 $488,638,814 $319,002,877
220870 Liqueurs And Cordials $35,517,671 $24,881,534 $20,194,779 $22,970,687 $42,653,029 $38,939,320
220890 Cordials, Liqueurs, Kirschwasser, Ratafia, Etc. $17,871,542 $15,562,205 $15,800,510 $19,449,588 $19,905,193 $21,975,651
220860 Vodka $12,231,870 $6,109,700 $7,525,888 $13,458,667 $9,575,008 $4,591,468
220820 Grape Brandy $28,091,579 $23,298,598 $23,957,800 $3,563,570 $2,851,862 $2,713,370
220840 Rum And Tafia $3,546,122 $2,972,522 $2,929,544 $2,675,063 $3,396,199 $2,489,537
220850 Gin And Geneva $777,863 $1,042,161 $784,578 $795,277 $633,821 $1,195,315
HS: harmonized system for classifying goods
Source: Kentucky Economic Development Cabinet, derived from data provided by WISERTrade: State HS Database , www.wisertrade.org, via the U.S. Census Bureau, Foreign Trade Division.
Kentucky’s Export of Distilled Spirit Beverages to the World
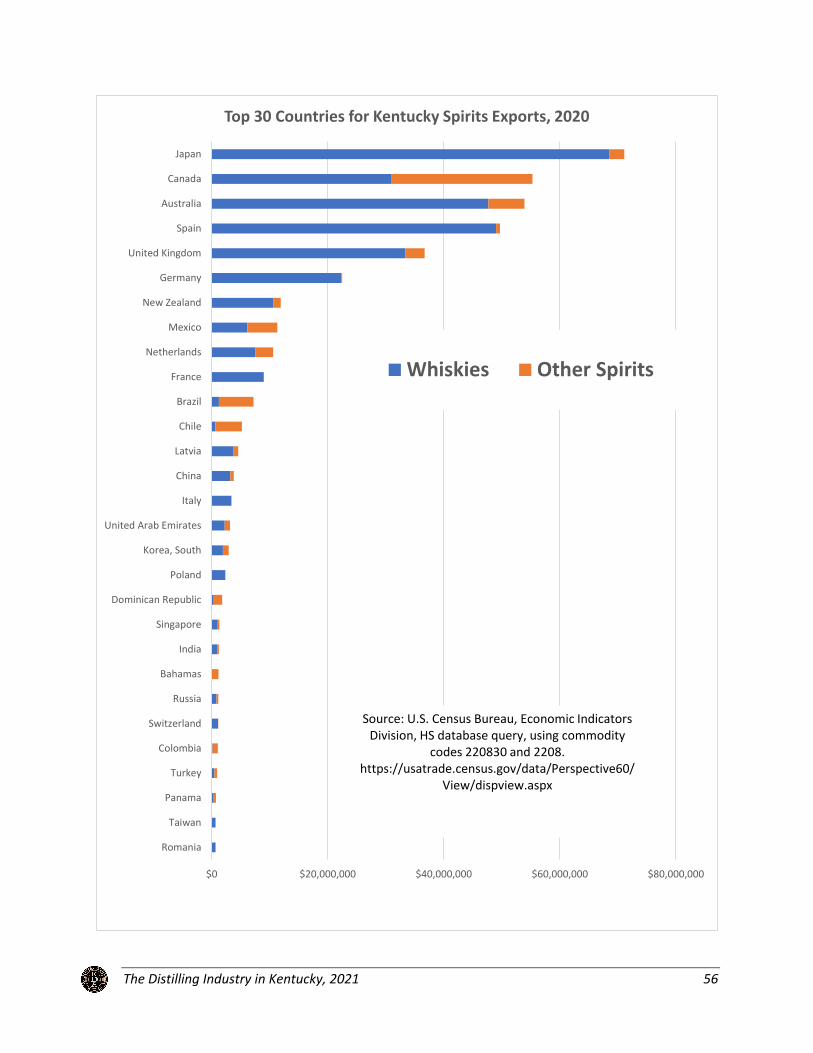
The Distilling Industry in Kentucky, 2021 56
$0 $20,000,000 $40,000,000 $60,000,000 $80,000,000
Romania
Taiwan
Panama
Turkey
Colombia
Switzerland
Russia
Bahamas
India
Singapore
Dominican Republic
Poland
Korea, South
United Arab Emirates
Italy
China
Latvia
Chile
Brazil
France
Netherlands
Mexico
New Zealand
Germany
United Kingdom
Spain
Australia
Canada
Japan
Top 30 Countries for Kentucky Spirits Exports, 2020
Whiskies Other Spirits
Source: U.S. Census Bureau, Economic Indicators Division, HS database query, using commodity
codes 220830 and 2208. https://usatrade.census.gov/data/Perspective60/
View/dispview.aspx
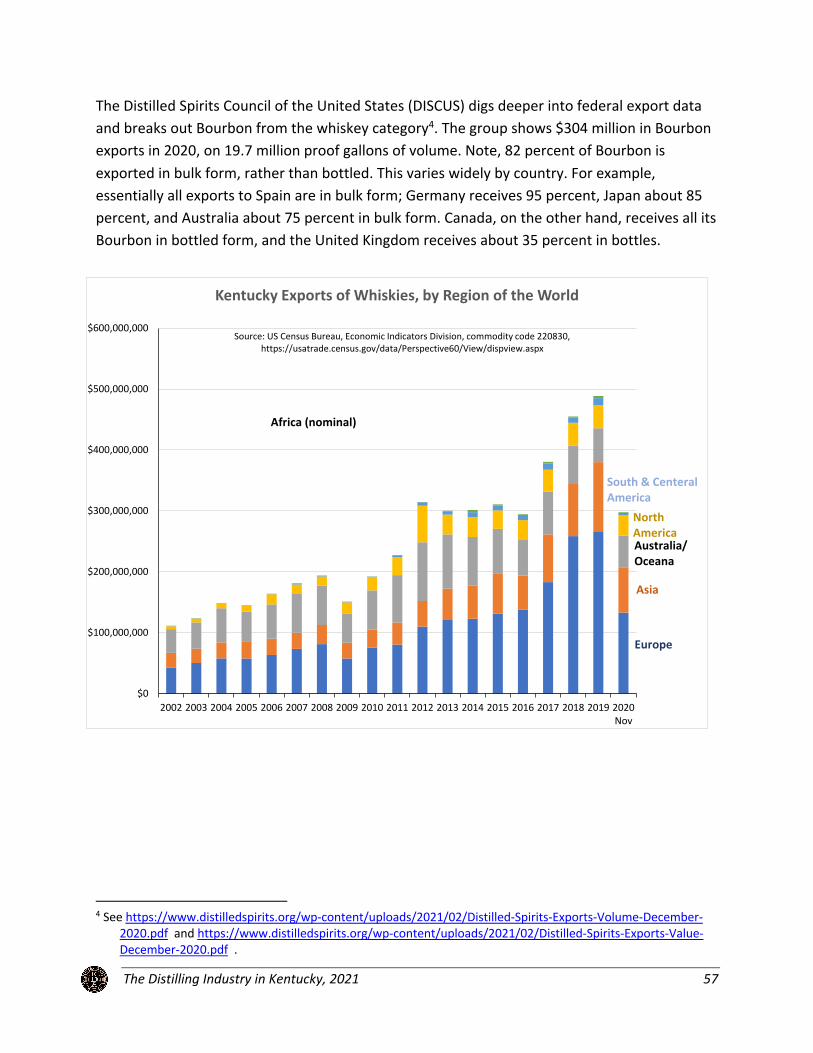
The Distilling Industry in Kentucky, 2021 57
The Distilled Spirits Council of the United States (DISCUS) digs deeper into federal export data
and breaks out Bourbon from the whiskey category4. The group shows $304 million in Bourbon
exports in 2020, on 19.7 million proof gallons of volume. Note, 82 percent of Bourbon is
exported in bulk form, rather than bottled. This varies widely by country. For example,
essentially all exports to Spain are in bulk form; Germany receives 95 percent, Japan about 85
percent, and Australia about 75 percent in bulk form. Canada, on the other hand, receives all its
Bourbon in bottled form, and the United Kingdom receives about 35 percent in bottles.
4 See https://www.distilledspirits.org/wp-content/uploads/2021/02/Distilled-Spirits-Exports-Volume-December-
2020.pdf and https://www.distilledspirits.org/wp-content/uploads/2021/02/Distilled-Spirits-Exports-Value-December-2020.pdf .
$0
$100,000,000
$200,000,000
$300,000,000
$400,000,000
$500,000,000
$600,000,000
2002 2003 2004 2005 2006 2007 2008 2009 2010 2011 2012 2013 2014 2015 2016 2017 2018 2019 2020
Nov
Kentucky Exports of Whiskies, by Region of the World
Europe
Asia
South & Centeral America
Africa (nominal)
North AmericaAustralia/Oceana
Source: US Census Bureau, Economic Indicators Division, commodity code 220830,
https://usatrade.census.gov/data/Perspective60/View/dispview.aspx
The Distilling Industry in Kentucky, 2021 58
APPENDIX F The Distilling Industry’s Linkages to Other Industries
We use a custom input-output model of Kentucky to investigate the linkages between the
distilling industry and other industries in the state. Input-output models are the standard
method for measuring sales among industries in a given economy. Our IMPLAN model of
Kentucky has details on 544 industrial sectors, and can predict how much each industry buys
from every other industry in the state, as well as how much must be imported from outside the
state to support a given level of production.
For the 2018 study we were able to significantly enhance the customization of the IMPLAN
production function for the distilling industry compared to previous reports in this series5. We
received calendar year 2017 accounting data from one of the state’s major distillers from which
we were able to construct a table describing most of the inputs by industry and their
geographic sources. In many ways this table corresponded fairly closely with IMPLAN’s distilling
industry production function, but there were some significant differences. These included the
value of grains purchased (more), the amount of spirits purchased from other suppliers (less),
plastic bottles (much less), and the inclusion of additional industries, most often associated
with food and beverage manufacturing and packaging mechanical equipment.
Two of the larger differences involved aspects of production at opposite ends of the process –
barreling and bottling. The accounting data from the local distiller made it clear that IMPLAN
did not adequately address the peculiarity of the Bourbon industry with respect to its close
relationship with cooperages. IMPLAN had misclassified these inputs into the miscellaneous
wood products industry when they belong in the wood containers and pallets industry, and also
greatly underestimated the value of the distilling industry’s purchases from the wood container
industry. Without the detailed accounting data, we had not been able to adequately address
the issue in reports prior to 2018.
With respect to bottling, IMPLAN’s default recipe expects more of this function to be
outsourced than is the case in Kentucky, where most of the major distillers have their own
bottling facilities. This is reflected in the production function value for the Wholesale Services -
Other nondurable goods merchant wholesalers industry (where bottling is relegated in the
NAICS classification system). Since our impact model folds the large bottling facility plants
located in Bullitt, Daviess, and Franklin counties (and smaller ones elsewhere) into the distilling
industry (while they are separate establishments, they are parts of vertically integrated
corporate structures), we adjust that part of the production function downward.
5 A production function is basically a recipe, showing on average how much must be purchased from every other
industry to produce a unit of output in each industry.
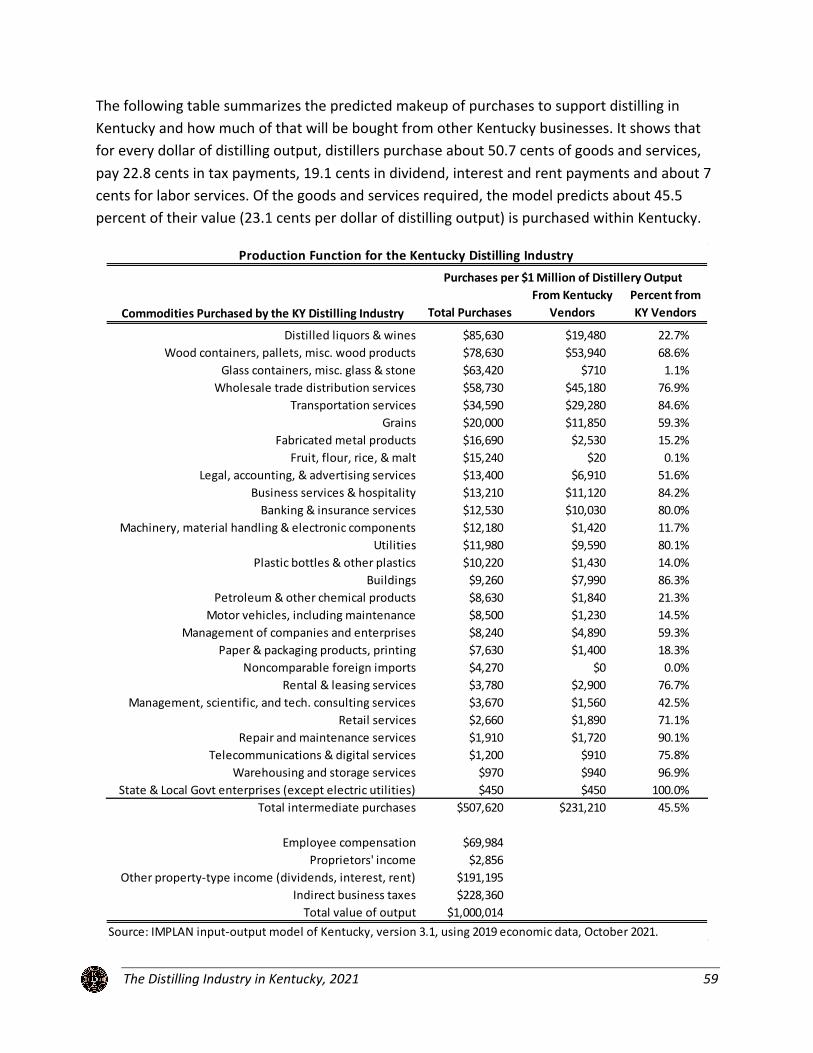
The Distilling Industry in Kentucky, 2021 59
The following table summarizes the predicted makeup of purchases to support distilling in
Kentucky and how much of that will be bought from other Kentucky businesses. It shows that
for every dollar of distilling output, distillers purchase about 50.7 cents of goods and services,
pay 22.8 cents in tax payments, 19.1 cents in dividend, interest and rent payments and about 7
cents for labor services. Of the goods and services required, the model predicts about 45.5
percent of their value (23.1 cents per dollar of distilling output) is purchased within Kentucky.
Commodities Purchased by the KY Distilling Industry Total PurchasesFrom Kentucky
VendorsPercent from KY Vendors
Distilled liquors & wines $85,630 $19,480 22.7%Wood containers, pallets, misc. wood products $78,630 $53,940 68.6%
Glass containers, misc. glass & stone $63,420 $710 1.1%Wholesale trade distribution services $58,730 $45,180 76.9%
Transportation services $34,590 $29,280 84.6%Grains $20,000 $11,850 59.3%
Fabricated metal products $16,690 $2,530 15.2%Fruit, flour, rice, & malt $15,240 $20 0.1%
Legal, accounting, & advertising services $13,400 $6,910 51.6%Business services & hospitality $13,210 $11,120 84.2%
Banking & insurance services $12,530 $10,030 80.0%Machinery, material handling & electronic components $12,180 $1,420 11.7%
Utilities $11,980 $9,590 80.1%Plastic bottles & other plastics $10,220 $1,430 14.0%
Buildings $9,260 $7,990 86.3%Petroleum & other chemical products $8,630 $1,840 21.3%
Motor vehicles, including maintenance $8,500 $1,230 14.5%Management of companies and enterprises $8,240 $4,890 59.3%
Paper & packaging products, printing $7,630 $1,400 18.3%Noncomparable foreign imports $4,270 $0 0.0%
Rental & leasing services $3,780 $2,900 76.7%Management, scientific, and tech. consulting services $3,670 $1,560 42.5%
Retail services $2,660 $1,890 71.1%Repair and maintenance services $1,910 $1,720 90.1%
Telecommunications & digital services $1,200 $910 75.8%Warehousing and storage services $970 $940 96.9%
State & Local Govt enterprises (except electric utilities) $450 $450 100.0%Total intermediate purchases $507,620 $231,210 45.5%
Employee compensation $69,984Proprietors' income $2,856
Other property-type income (dividends, interest, rent) $191,195Indirect business taxes $228,360
Total value of output $1,000,014
Production Function for the Kentucky Distilling IndustryPurchases per $1 Million of Distillery Output
Source: IMPLAN input-output model of Kentucky, version 3.1, using 2019 economic data, October 2021.
The Distilling Industry in Kentucky, 2021 60
Our IMPLAN model shows that the distilling industry stands out from others in terms of the tax
portion of output, with taxes accounting for 21.2 cents per dollar of output. Only three other
industries generate a higher a tax share – wholesale petroleum, commercial fishing, and
tobacco manufacturing – and all are much smaller than distilling in terms of Kentucky
employment and payroll. The wine industry is taxed at 3.1 cents per dollar of output; breweries
are taxed at 8.2 cents per dollar output. For most manufacturing sectors, the portion of each
dollar of output that goes to taxes is less than a penny.
These commodities purchased by the distilling industry, as well as the household income
created, are the basis for regional economic multipliers. Output in one industry lifts output in
supporting industries, which in turn raises output in industries that support them. Generally
speaking, the more an industry purchases in the state, the larger the spinoff impacts of that
industry’s activity. The more it imports its raw materials and services, the smaller the spinoffs in
the state. In this regard, it is important to note that compared to the previous edition of this
study in January 2019, the IMPLAN model expects a larger percentage of purchases to be made
within Kentucky (45.5 percent versus 43.5 percent). In addition, the latest edition of IMPLAN
shows a large drop in indirect business taxes in the distilling industry production function
(primarily in state and local sales and property taxes and federal excise taxes). Combined, these
two differences lead to an expectation of 5 cents more being spent within Kentucky for each
dollar of distilling industry output.
The largest input expense is the purchase of distilled spirits among distillers themselves. There
is a significant amount of mixing and bottling of product that is produced offsite, which includes
non-Bourbon products as well as Bourbon taken from barrels in a warehouse. Some of these
purchases are from out-of-state distillers. There has been a significant expansion of bottling
facilities in the state that process product made elsewhere. The boom in the craft part of the
industry is also a likely factor. Newer craft distillers either buy distilled spirits, lease capacity,
and/or purchase aged barrels from the larger companies in order to build their brands.
It is helpful to think of an input-output table as a set of production recipes, with each industry
column showing how much must be purchased from each industry row to produce its annual
output. For example, the distilling industry nationally is a large purchaser of glass containers,
grain, wood containers and pallets, truck transportation and cardboard. These are identified
from national industry surveys.
These national tables are ‘regionalized’ by IMPLAN using economic data on the presence and
size of industries at the state, metropolitan area, or county level as needed. The resulting
regional models take into account the ability of the regional economy to supply inputs to each
industry. In the case of distilling, for example, IMPLAN predicts that most of the wood
containers and pallets (or rather products from the industry that produces these, which
The Distilling Industry in Kentucky, 2021 61
includes cooperages) needed by the industry can be supplied by Kentucky firms, but that almost
none of the glass bottles can be supplied in-state. The glass bottles must be imported, with the
result that those purchasing dollars leak out to other states (or countries). One of the major
inputs to distilling is grain, in particular corn, wheat and rye. We examine grain purchases in
more detail in the next appendix.
IMPLAN includes the value of fringe benefits (employee provided social security and Medicare
taxes, unemployment insurance and workers’ compensation premiums, health insurance,
pension contributions, etc.) in its compensation estimate, estimating that fringes add about 25
percent to direct wages and salaries in this industry.

The Distilling Industry in Kentucky, 2021 62
APPENDIX G Grain Usage by Distillers
There is a relatively fixed ratio of grain required to produce, say, a barrel of Bourbon. Hence, we
know from production records and our survey of KDA members that Kentucky distillers
purchased about 16.9 million bushels of corn and around 8.4 million bushels of other grains
such as wheat and rye. Survey respondents reported that 74 percent of corn used was
purchased from Kentucky farms, up from 40 percent in our first grain survey in 2014. Only 12
percent of other grains used came from Kentucky. Applying these survey results to total
industry production, we estimate that Kentucky distillers purchased 12.5 million bushels of
corn, and 1.0 million bushels of other grains, from Kentucky farmers6.
6 Our IMPLAN model of Kentucky has a ‘regional purchase coefficient’ for grains of 62.67%. This means that on
average Kentucky farmers provide about two-thirds of grains required by industry and consumers in the state. There is no breakout for corn, soybeans or other grains. According to the model, Kentucky actually produces more total grain than is demanded in the state; however, the mix of grain production is such that much of the grain is exported out of state for use in industries not prevalent in Kentucky. For a technical explanation, see https://implanhelp.zendesk.com/hc/en-us/articles/115009674728-Understanding-the-Social-Accounts-Tables
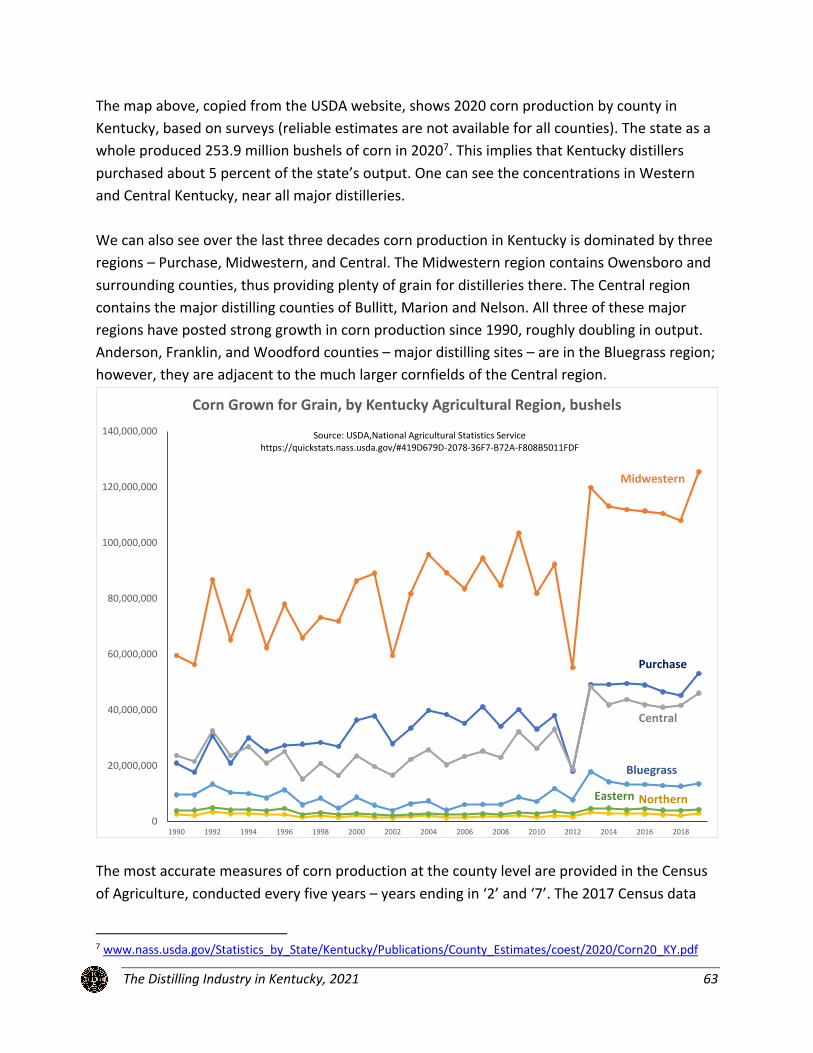
The Distilling Industry in Kentucky, 2021 63
The map above, copied from the USDA website, shows 2020 corn production by county in
Kentucky, based on surveys (reliable estimates are not available for all counties). The state as a
whole produced 253.9 million bushels of corn in 20207. This implies that Kentucky distillers
purchased about 5 percent of the state’s output. One can see the concentrations in Western
and Central Kentucky, near all major distilleries.
We can also see over the last three decades corn production in Kentucky is dominated by three
regions – Purchase, Midwestern, and Central. The Midwestern region contains Owensboro and
surrounding counties, thus providing plenty of grain for distilleries there. The Central region
contains the major distilling counties of Bullitt, Marion and Nelson. All three of these major
regions have posted strong growth in corn production since 1990, roughly doubling in output.
Anderson, Franklin, and Woodford counties – major distilling sites – are in the Bluegrass region;
however, they are adjacent to the much larger cornfields of the Central region.
The most accurate measures of corn production at the county level are provided in the Census
of Agriculture, conducted every five years – years ending in ‘2’ and ‘7’. The 2017 Census data
7 www.nass.usda.gov/Statistics_by_State/Kentucky/Publications/County_Estimates/coest/2020/Corn20_KY.pdf
0
20,000,000
40,000,000
60,000,000
80,000,000
100,000,000
120,000,000
140,000,000
1990 1992 1994 1996 1998 2000 2002 2004 2006 2008 2010 2012 2014 2016 2018
Corn Grown for Grain, by Kentucky Agricultural Region, bushels
Midwestern
Eastern
Central
Northern
Bluegrass
Purchase
Source: USDA,National Agricultural Statistics Service https://quickstats.nass.usda.gov/#419D679D-2078-36F7-B72A-F808B5011FDF
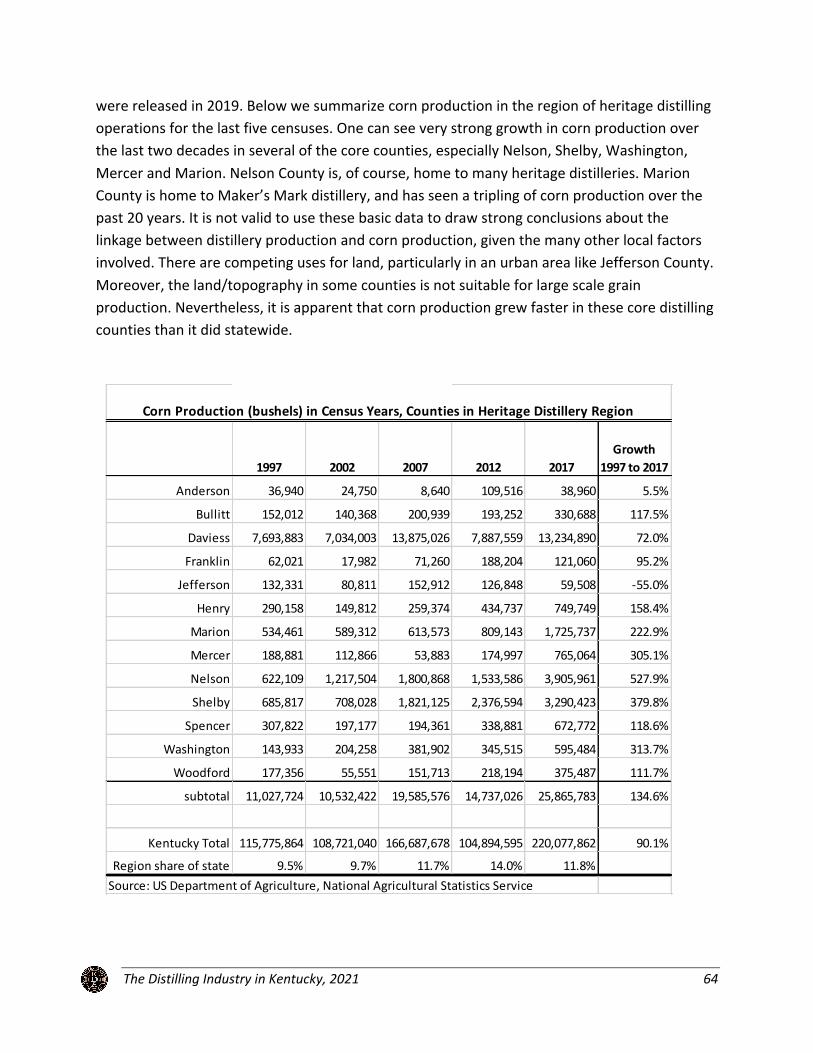
The Distilling Industry in Kentucky, 2021 64
were released in 2019. Below we summarize corn production in the region of heritage distilling
operations for the last five censuses. One can see very strong growth in corn production over
the last two decades in several of the core counties, especially Nelson, Shelby, Washington,
Mercer and Marion. Nelson County is, of course, home to many heritage distilleries. Marion
County is home to Maker’s Mark distillery, and has seen a tripling of corn production over the
past 20 years. It is not valid to use these basic data to draw strong conclusions about the
linkage between distillery production and corn production, given the many other local factors
involved. There are competing uses for land, particularly in an urban area like Jefferson County.
Moreover, the land/topography in some counties is not suitable for large scale grain
production. Nevertheless, it is apparent that corn production grew faster in these core distilling
counties than it did statewide.
1997 2002 2007 2012 2017Growth
1997 to 2017Anderson 36,940 24,750 8,640 109,516 38,960 5.5%
Bullitt 152,012 140,368 200,939 193,252 330,688 117.5%
Daviess 7,693,883 7,034,003 13,875,026 7,887,559 13,234,890 72.0%
Franklin 62,021 17,982 71,260 188,204 121,060 95.2%
Jefferson 132,331 80,811 152,912 126,848 59,508 -55.0%
Henry 290,158 149,812 259,374 434,737 749,749 158.4%
Marion 534,461 589,312 613,573 809,143 1,725,737 222.9%
Mercer 188,881 112,866 53,883 174,997 765,064 305.1%
Nelson 622,109 1,217,504 1,800,868 1,533,586 3,905,961 527.9%
Shelby 685,817 708,028 1,821,125 2,376,594 3,290,423 379.8%
Spencer 307,822 197,177 194,361 338,881 672,772 118.6%
Washington 143,933 204,258 381,902 345,515 595,484 313.7%
Woodford 177,356 55,551 151,713 218,194 375,487 111.7%
subtotal 11,027,724 10,532,422 19,585,576 14,737,026 25,865,783 134.6%
Kentucky Total 115,775,864 108,721,040 166,687,678 104,894,595 220,077,862 90.1%
Region share of state 9.5% 9.7% 11.7% 14.0% 11.8%Source: US Department of Agriculture, National Agricultural Statistics Service
Corn Production (bushels) in Census Years, Counties in Heritage Distillery Region
The Distilling Industry in Kentucky, 2021 65
APPENDIX H Economic Multipliers
The distilling industry’s purchases of intermediate goods and services in Kentucky, as well as its
payments to workers and business owners in the state, cause rounds of re-spending across
other industries. The inter-industry impacts are often referred to as ‘indirect’ effects, since
changes in activity at distilleries will quickly cause changes in activity at suppliers. The
household spending impacts are often referred to as ‘induced’ effects, since changes in
industrial production ultimately hit the regional economy through employees’ wages and the
associated spending on goods and services.
At each round of re-spending, a portion of the dollars leak out due to saving, purchases of
imported goods, and tax payments, so the re-spending ultimately goes to zero. The cumulative
impact of the re-spending is summarized in economic multipliers, which are the ratio of change
in total economic activity to changes in activity by the distilling industry.
The production function in Appendix F applies to the manufacturing of distilled spirits, but the
industry in Kentucky tends to operate almost like two industries in one. On one side are the
distilling, warehousing, and bottling activities, and on the other is the corporate, subsidiary, or
regional managing office. The latter oversee and manage the former, and provide the strategic
and organizational planning for the entire enterprise. Because Brown-Forman and Heaven Hill
are headquartered in Kentucky, and Beam Suntory (Jim Beam and Maker’s Mark), Kirin (Four
Roses), and Sazerac (Buffalo Trace) have significant corporate subsidiary operations here as
well, much of the activity in the broader industry involves functions that belong to the
management of companies sector. These two activities – manufacturing and corporate
headquarters – have very different linkages with the rest of the economy. We created a split
into two industries for modeling purposes.
In our 2018 report, we asked the members of the KDA to provide us with employee figures
divided according to whether the employee was working on the manufacturing or corporate
side of the business. We also have fairly comprehensive employment counts for each distillery,
as published in the 2021 Kentucky Directory of Manufacturers. We were able to combine the
results from these two surveys with other available data to estimate total distilling industry
employment for 2021. After examining the survey numbers along with the figures from the
QCEW, CBP, and Kentucky Directory of Manufacturers, we estimate there are about 6,000
people currently employed in the distilling industry statewide. This includes around 600
employees in bottling facilities in Bullitt, Daviess, and Franklin counties that are not included in
the QCEW and CBP industry statistics, which are based on establishment locations. Of the 6,000
jobs, we believe approximately 1,750 are more properly categorized as working in the
management of companies (NAICS code 551114) in the sector. This estimate of 2021
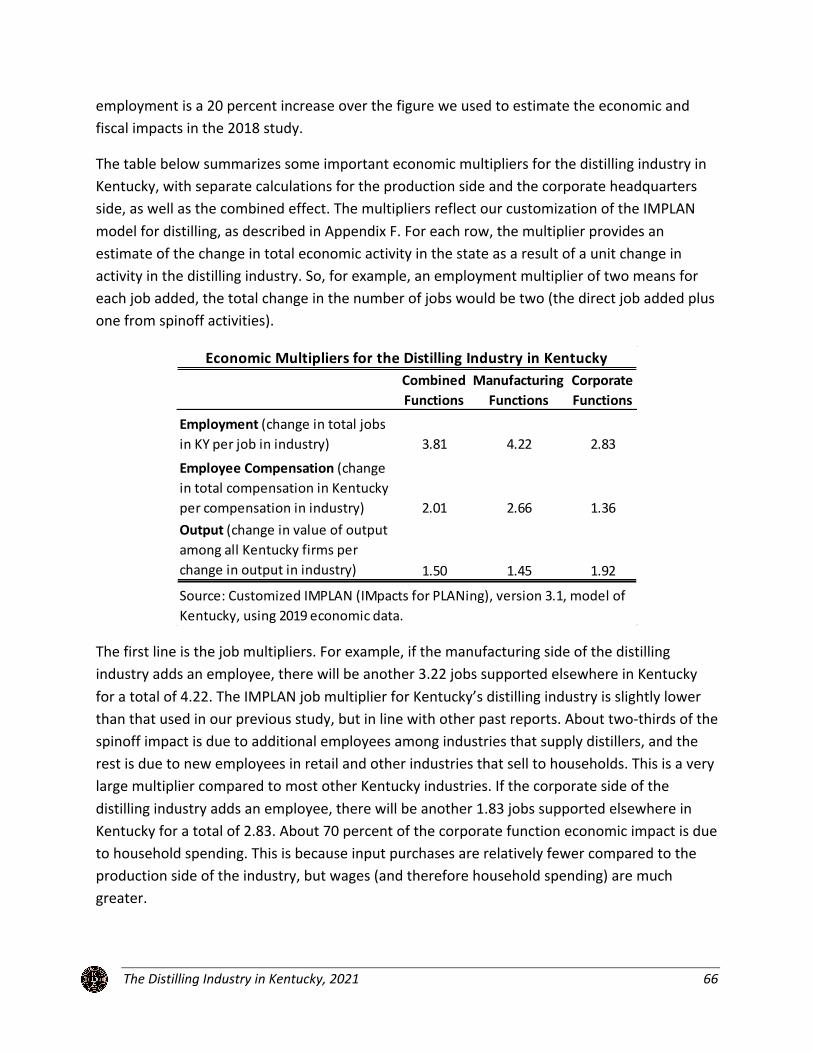
The Distilling Industry in Kentucky, 2021 66
employment is a 20 percent increase over the figure we used to estimate the economic and
fiscal impacts in the 2018 study.
The table below summarizes some important economic multipliers for the distilling industry in
Kentucky, with separate calculations for the production side and the corporate headquarters
side, as well as the combined effect. The multipliers reflect our customization of the IMPLAN
model for distilling, as described in Appendix F. For each row, the multiplier provides an
estimate of the change in total economic activity in the state as a result of a unit change in
activity in the distilling industry. So, for example, an employment multiplier of two means for
each job added, the total change in the number of jobs would be two (the direct job added plus
one from spinoff activities).
The first line is the job multipliers. For example, if the manufacturing side of the distilling
industry adds an employee, there will be another 3.22 jobs supported elsewhere in Kentucky
for a total of 4.22. The IMPLAN job multiplier for Kentucky’s distilling industry is slightly lower
than that used in our previous study, but in line with other past reports. About two-thirds of the
spinoff impact is due to additional employees among industries that supply distillers, and the
rest is due to new employees in retail and other industries that sell to households. This is a very
large multiplier compared to most other Kentucky industries. If the corporate side of the
distilling industry adds an employee, there will be another 1.83 jobs supported elsewhere in
Kentucky for a total of 2.83. About 70 percent of the corporate function economic impact is due
to household spending. This is because input purchases are relatively fewer compared to the
production side of the industry, but wages (and therefore household spending) are much
greater.
Combined Functions
Manufacturing Functions
Corporate Functions
Employment (change in total jobs in KY per job in industry) 3.81 4.22 2.83
Employee Compensation (change in total compensation in Kentucky per compensation in industry) 2.01 2.66 1.36Output (change in value of output among all Kentucky firms per change in output in industry) 1.50 1.45 1.92
Economic Multipliers for the Distilling Industry in Kentucky
Source: Customized IMPLAN (IMpacts for PLANing), version 3.1, model of Kentucky, using 2019 economic data.
The Distilling Industry in Kentucky, 2021 67
In combination, all functions of the distilling industry in Kentucky support 2.81 extra jobs for
each job in the industry (the multiplier in the table reflects the one distilling job plus the 2.81
spinoff jobs), again a bit lower than in our previous study, but in line with other prior reports.
Similar interpretations can be given for the employee compensation and output multipliers. The
employment multipliers are much greater than the other multipliers because output per worker
and average wages in the distilling industry are fairly high. Workers in spinoff industries are not
producing as much output per worker, nor earning as much in wages.
Comparison of distilling industry impacts with other industries
Our IMPLAN model of Kentucky contains detailed estimates of output, employment, payroll,
and value added for 544 detailed industrial sectors in the state. We can use those estimates to
make some observations about the relative importance of the distilling industry. First, consider
manufacturing. IMPLAN provides details for 329 detailed manufacturing industries, of which
302 have operations in Kentucky. Among those 302 industries, the distilling industry ranks 11th
highest in terms of jobs and 21st highest in terms of employment multipliers. However, many of
the manufacturing industries with very high multipliers have relatively few employees and
hence are not as economically significant.
The figure below shows the employment multipliers for major manufacturing industries in the
state, those that employ at least 1,600 people. The only manufacturing industry with both more
jobs and a higher employment multiplier than distilling is light truck and utility vehicle
production.
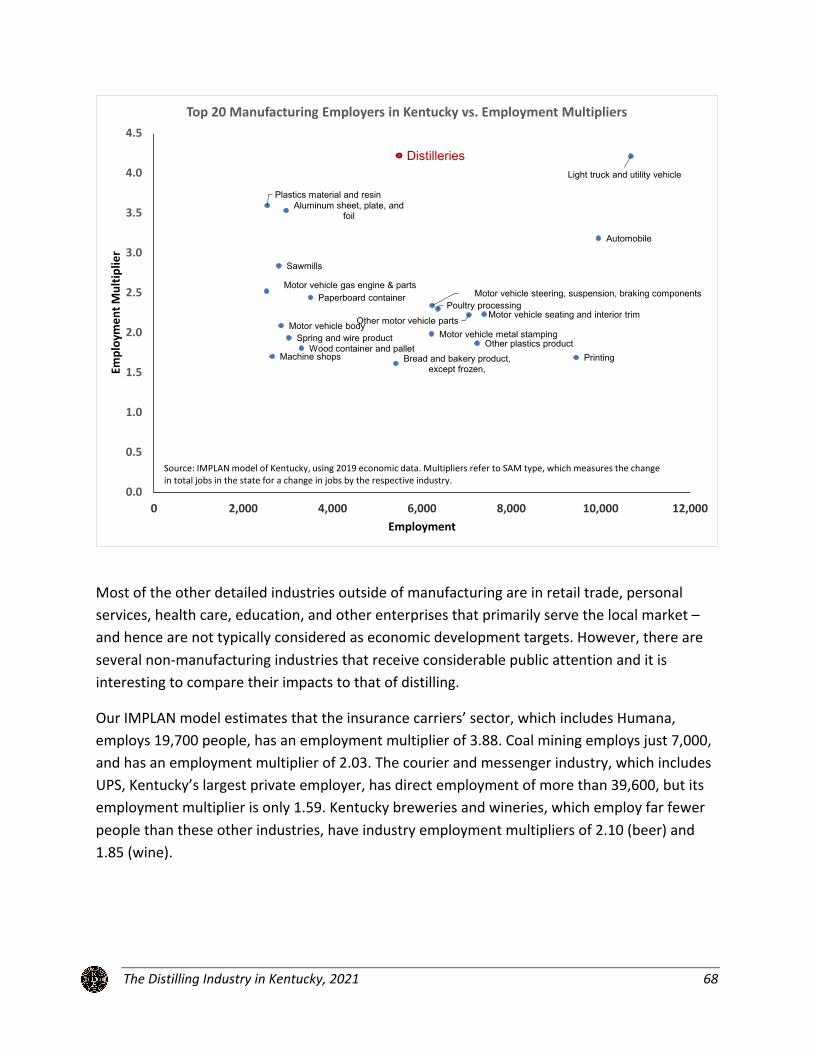
The Distilling Industry in Kentucky, 2021 68
Most of the other detailed industries outside of manufacturing are in retail trade, personal
services, health care, education, and other enterprises that primarily serve the local market –
and hence are not typically considered as economic development targets. However, there are
several non-manufacturing industries that receive considerable public attention and it is
interesting to compare their impacts to that of distilling.
Our IMPLAN model estimates that the insurance carriers’ sector, which includes Humana,
employs 19,700 people, has an employment multiplier of 3.88. Coal mining employs just 7,000,
and has an employment multiplier of 2.03. The courier and messenger industry, which includes
UPS, Kentucky’s largest private employer, has direct employment of more than 39,600, but its
employment multiplier is only 1.59. Kentucky breweries and wineries, which employ far fewer
people than these other industries, have industry employment multipliers of 2.10 (beer) and
1.85 (wine).
Light truck and utility vehicle
Automobile
Printing
Motor vehicle seating and interior trim
Other plastics product
Other motor vehicle partsPoultry processing
Motor vehicle steering, suspension, braking components
Motor vehicle metal stamping
Distilleries
Bread and bakery product, except frozen,
Paperboard container
Wood container and palletSpring and wire product
Aluminum sheet, plate, and foil
Motor vehicle body
Sawmills
Machine shops
Plastics material and resin
Motor vehicle gas engine & parts
0.0
0.5
1.0
1.5
2.0
2.5
3.0
3.5
4.0
4.5
0 2,000 4,000 6,000 8,000 10,000 12,000
Empl
oym
ent M
ultip
lier
Employment
Top 20 Manufacturing Employers in Kentucky vs. Employment Multipliers
Source: IMPLAN model of Kentucky, using 2019 economic data. Multipliers refer to SAM type, which measures the change in total jobs in the state for a change in jobs by the respective industry.
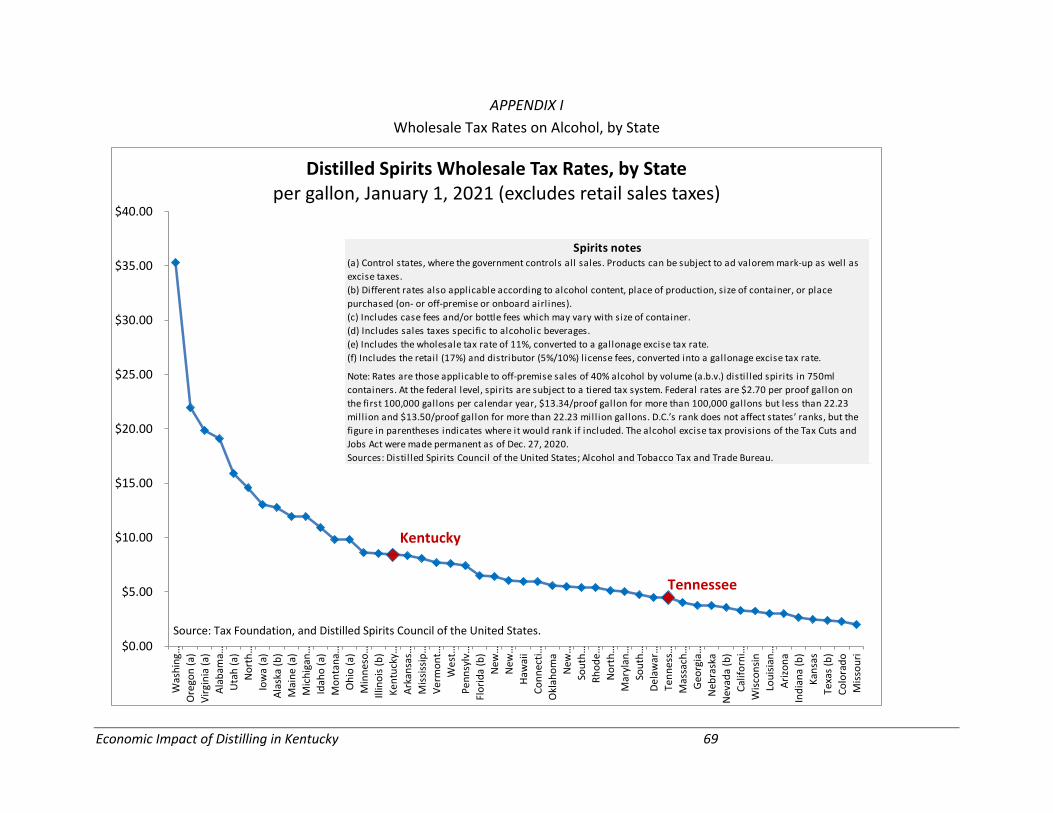
Economic Impact of Distilling in Kentucky 69
APPENDIX I Wholesale Tax Rates on Alcohol, by State
$0.00
$5.00
$10.00
$15.00
$20.00
$25.00
$30.00
$35.00
$40.00
Was
hing
…O
rego
n (a
)V
irgi
nia
(a)
Ala
bam
a…U
tah
(a)
Nor
th…
Iow
a (a
)A
lask
a (b
)M
aine
(a)
Mic
higa
n…Id
aho
(a)
Mon
tana
…O
hio
(a)
Min
neso
…Ill
inoi
s (b
)Ke
ntuc
ky…
Ark
ansa
s…M
issi
ssip
…V
erm
ont…
Wes
t…Pe
nnsy
lv…
Flor
ida
(b)
New
…N
ew…
Haw
aii
Conn
ecti
…O
klah
oma
New
…So
uth…
Rhod
e…N
orth
…M
aryl
an…
Sout
h…D
elaw
ar…
Tenn
ess…
Mas
sach
…G
eorg
ia…
Neb
rask
aN
evad
a (b
)Ca
lifor
ni…
Wis
cons
inLo
uisi
an…
Ari
zona
Indi
ana
(b)
Kans
asTe
xas
(b)
Colo
rado
Mis
sour
i
Distilled Spirits Wholesale Tax Rates, by Stateper gallon, January 1, 2021 (excludes retail sales taxes)
Source: Tax Foundation, and Distilled Spirits Council of the United States.
Kentucky
Tennessee
Spirits notes(a) Control states, where the government controls all sales. Products can be subject to ad valorem mark-up as well as excise taxes.(b) Different rates also applicable according to alcohol content, place of production, size of container, or place purchased (on- or off-premise or onboard airl ines).(c) Includes case fees and/or bottle fees which may vary with size of container.(d) Includes sales taxes specific to alcoholic beverages.(e) Includes the wholesale tax rate of 11%, converted to a gallonage excise tax rate.(f) Includes the retail (17%) and distributor (5%/10%) license fees, converted into a gallonage excise tax rate.
Note: Rates are those applicable to off-premise sales of 40% alcohol by volume (a.b.v.) distil led spirits in 750ml containers. At the federal level, spirits are subject to a tiered tax system. Federal rates are $2.70 per proof gallon on the first 100,000 gallons per calendar year, $13.34/proof gallon for more than 100,000 gallons but less than 22.23 mill ion and $13.50/proof gallon for more than 22.23 mill ion gallons. D.C.’s rank does not affect states’ ranks, but the figure in parentheses indicates where it would rank if included. The alcohol excise tax provisions of the Tax Cuts and Jobs Act were made permanent as of Dec. 27, 2020.Sources: Distil led Spirits Council of the United States; Alcohol and Tobacco Tax and Trade Bureau.

Economic Impact of Distilling in Kentucky 70
$0.00
$0.50
$1.00
$1.50
$2.00
$2.50
$3.00
$3.50Ke
ntuc
k…Al
aska
Flor
ida
(a)
Iow
a (a
)Al
abam
a…Ne
w…
Dela
war
eGe
orgi
a…Vi
rgin
ia…
Mar
ylan
…Ar
kans
as…
Rhod
e…Ill
inoi
s (a)
Haw
aii (
a)So
uth…
Tenn
ess…
Min
neso
…No
rth…
Sout
h…M
onta
n…W
est…
Nort
h…Ne
bras
k…Ne
w…
Was
hing
…Ar
izona
…Co
nnec
ti…Lo
uisia
n…O
klah
o…Ne
vada
…O
rego
n…M
aine
(a)
Mas
sach
…Ve
rmon
t…M
ichi
ga…
Indi
ana
(a)
Idah
o (a
)M
issou
riO
hio
(a)
Colo
rad…
Kans
as (a
)Ne
w Y
ork
Wisc
onsi…
Texa
s (a)
Calif
orni
…
Wine Wholesale Tax Rates by Stateper gallon, January 1, 2021 (excluded retail sales taxes)
Source: Tax Foundation. No estimates available for five states where government controls all sales (and taxes are implicit).
California
New York
KentuckyWine notes
(a) Different rates also applicable to alcohol content, place of production, size of container, place purchased (on- or off-premise or on board airlines), or type of wine (carbonated, vermouth, etc.).(b) Includes case fees and/or bottle fees which may vary with size of container.(c) Includes sales taxes specific to alcoholic beverages.(d) Includes the wholesale tax rate of 10%, converted to a gallonage excise tax rate.
(e) Control states, where the government controls all sales. Products can be subject to ad valorem markup as well as excise taxes. Only l icense state volume-based tax rates are shown.Note: Rates are those applicable to off-premise sales of 11% alcohol by volume (a.b.v.) non-carbonated wine in 750ml containers. Federal rates vary by alcohol content and type of wine, ranging up to $3.15 for 21-24% alcohol and $3.40 for sparkling wine. Federal rates also vary based on number of gallons sold. D.C.’s rank does not affect states’ ranks, but the figure in parentheses indicates where it would rank if included.Sources: Distil led Spirits Council of the United States; Alcohol Tax and Trade Bureau.

Economic Impact of Distilling in Kentucky 71
$0.00
$0.20
$0.40
$0.60
$0.80
$1.00
$1.20
$1.40Te
nnes
see
(e)
Alas
kaHa
wai
i (d)
Kent
ucky
(e)
Sout
h Ca
rolin
aN
orth
…M
aryl
and
(b)
Alab
ama
(a)
Flor
ida
(d)
Geor
gia
(a, d
)M
inne
sota
(d,…
Nor
th D
akot
a…M
ississ
ippi
Uta
h (d
)N
ew M
exic
oLo
uisia
naO
klah
oma
(d)
Mai
neAr
kans
as (b
, c)
Neb
rask
aN
ew…
Sout
h Da
kota
Verm
ont
Dela
war
eW
ashi
ngto
n (d
)Vi
rgin
ia (d
)Co
nnec
ticut
Illin
ois
Mic
higa
nCa
lifor
nia
Texa
s (d)
Iow
a (d
)Ka
nsas
Ohi
o (d
)W
est V
irgin
iaAr
izona
Nev
ada
Idah
o (d
)N
ew Y
ork
Mon
tana
Rhod
e Is
land
…N
ew Je
rsey
Indi
ana
Mas
sach
uset
tsO
rego
nCo
lora
doPe
nnsy
lvan
iaW
iscon
sin (d
)M
issou
riW
yom
ing
Beer Wholesale Tax Rates by Stateper gallon, January 1, 2021 (excluded retail sales taxes)
Source: Tax Foundation.
Colorado
Missouri
Wisconsin
Kentucky
Beer notes(a) Statewide local rates exist in Alabama ($0.52/gallon) and Georgia ($0.53/gallon).
(b) Includes sales taxes specific to alcoholic beverages.
(c) Includes case fees and/or bottle fees which may vary with the size of container.
(d) Different rates also applicable according to alcohol content, place of production, size of container, or place
purchased (on- or off-premise or onboard airl ines).
(e) Includes the wholesale tax rate in Kentucky (10%) and Tennessee ($35.60 per barrel), converted into a gallonage
excise tax rate.
Note: Rates are those applicable to off-premise sales of 4.7% alcohol by volume (a.b.v.) beer in 12-ounce containers
which have been imported from outside the state. At the federal level, beer is subject to differing tax rates. Small
domestic brewers are taxed between $0.11/gallon and $0.516/gallon. All other brewers are taxed at rates between
$0.516/gallon and $0.58/gallon. D.C.’s rank does not affect states’ ranks, but the figure in parentheses indicates where
it would rank if included.
Sources: Distil led Spirits Council of the United States; Alcohol and Tobacco Tax and Trade Bureau; state revenue
departments.
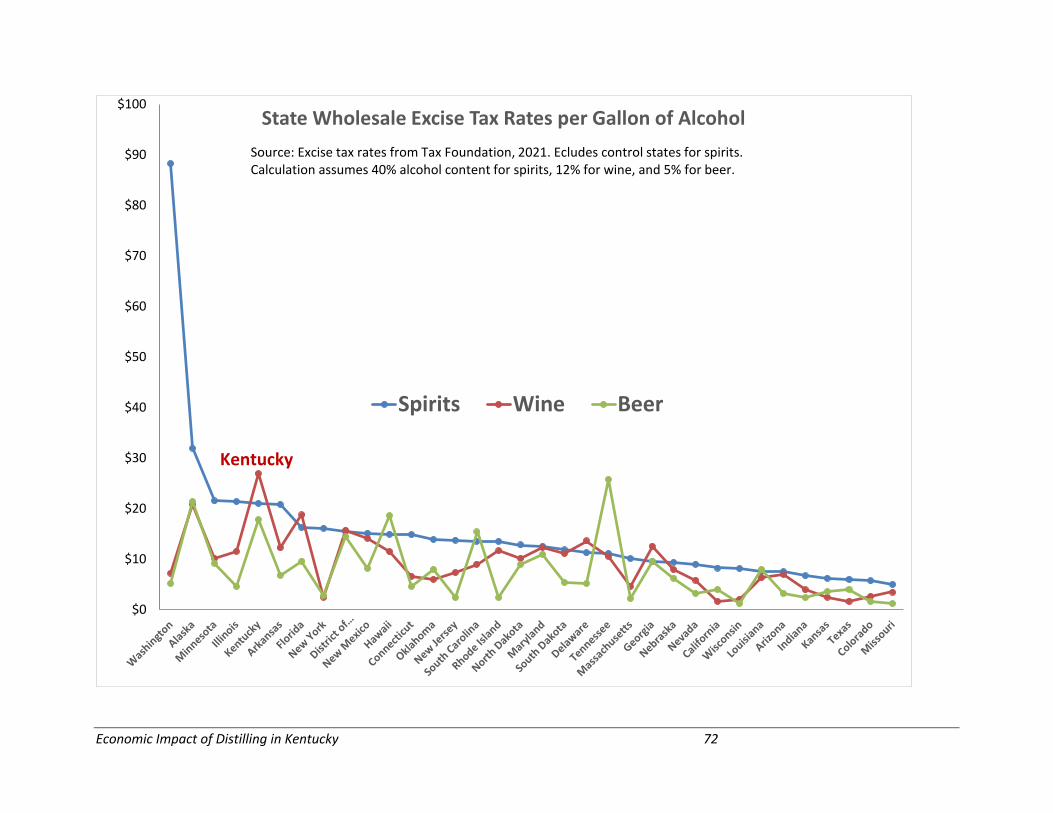
Economic Impact of Distilling in Kentucky 72
$0
$10
$20
$30
$40
$50
$60
$70
$80
$90
$100State Wholesale Excise Tax Rates per Gallon of Alcohol
Spirits Wine Beer
Source: Excise tax rates from Tax Foundation, 2021. Ecludes control states for spirits. Calculation assumes 40% alcohol content for spirits, 12% for wine, and 5% for beer.
Kentucky