military construction appropriations for fiscal year 2001 hearings
Upload
khangminh22Category
view
1download
0
Fiscal Year 2020
ANNUAL REPORT
State of New Hampshire
Department of Administrative Services
Division of Personnel

State of New Hampshire
Department of Administrative Services Division of Personnel
2020 Annual Report
Fiscal Year Ended June 30, 2020
Pursuant to RSA 21-I:42 and RSA 21-I:54
Charles M. Arlinghaus, Commissioner Lorrie A. Rudis, Director of Personnel
Michael J. Moranti, Deputy Director of Personnel
Christopher T. Sununu, Governor Michael J. Cryans, Executive Councilor
Theodore L. Gatsas, Executive Councilor Debora B. Pignatelli, Executive Councilor Russell E. Prescott, Executive Councilor
Andru Volinsky, Executive Councilor
54 Regional Drive, Suite 5 Concord, New Hampshire 03301
https://das.nh.gov/hr

3
TABLE OF CONTENTS
DIVISION OF PERSONNEL ........................................................................................................................................................... 4 GENERAL SUMMARY......................................................................................................................................................................................................... 4 OVERVIEW .......................................................................................................................................................................................................................... 5 COVID-19 RESPONSE ....................................................................................................................................................................................................... 7 ORGANIZATIONAL STRUCTURE ..................................................................................................................................................................................... 9
EMPLOYEE SUGGESTION AND EXTRAORDINARY SERVICE AWARD PROGRAM ............................................................... 11 EXECUTIVE BRANCH AT A GLANCE ....................................................................................................................................... …13
EMPLOYEES BY CATEGORY .......................................................................................................................................................................................... 14 POSITIONS BY CATEGORY ................................................................................................................................................................................................ 14
DEMOGRAPHICS .......................................................................................................................................................................... 15 WORKFORCE CHARACTERISTICS ............................................................................................................................................. 17
DETAILED BREAKDOWN OF STATE OF NEW HAMPSHIRE EMPLOYEES ..................................................................................................................... 18 EMPLOYEES BY GENDER AND EEO CATEGORY .......................................................................................................................................................... 19 EMPLOYEES BY GENERATION .......................................................................................................................................................................................... 20 EMPLOYEES BY AGE .......................................................................................................................................................................................................... 21 EMPLOYEES BY YEARS OF SERVICE .............................................................................................................................................................................. 22 EMPLOYEES BY AGE AND LABOR GRADE...................................................................................................................................................................... 22 EMPLOYEES BY COUNTY ................................................................................................................................................................................................... 23 FULL-TIME EMPLOYEES BY AGENCY .............................................................................................................................................................................. 24 EMPLOYEES BY TYPE AND AGENCY ............................................................................................................................................................................... 26 EMPLOYEE STATISTICS BY AGENCY WITH 10 OR MORE EMPLOYEES .................................................................................................................... 28
EMPLOYEE PAID LEAVE .............................................................................................................................................................. 29 ANNUAL AND SICK LEAVUSAGE BY AGENCY ................................................................................................................................................................ 30 ADDITIONAL LEAVES .......................................................................................................................................................................................................... 31
COMPENSATION .......................................................................................................................................................................... 33 AVERAGE SALARY BY AGENCY ........................................................................................................................................................................................ 34 AVERAGE SALARY BY YEARS OF SERVICE* .................................................................................................................................................................. 36 AVERAGE SALARY BY EEO CATEGORY* ........................................................................................................................................................................ 36 DISTRIBUTION OF EMPLOYEES BY LABOR GRADE STEP* ......................................................................................................................................... 37 COST OF LONGEVITY* ........................................................................................................................................................................................................ 38
POSITION STATISTICS ................................................................................................................................................................ 39 BREAKDOWN OF STATE OF NH POSITIONS BY TYPE AND BRANCH OF GOVERNMENT ................................................................................................................... 40 FILLED AND TOTAL FULL-TIME PERMANENT CLASSIFIED POSITIONS* ................................................................................................................... 41 POSITIONS BY EEO OCCUPATION GROUP ..................................................................................................................................................................... 42 CLASSIFIED FULL-TIME PERMANENT POSITIONS BY AGENCY .................................................................................................................................. 43 FULL-TIME SEASONAL POSITIONS BY AGENCY ............................................................................................................................................................ 44 FULL-TIME TEMPORARY POSITIONS BY AGENCY ........................................................................................................................................................ 45
TURNOVER AND SEPARATION FROM SERVICE ...................................................................................................................... 47 TURNOVER ........................................................................................................................................................................................................................... 48 TURNOVER OF CLASSIFIED EMPLOYEES ...................................................................................................................................................................... 49 DISTRIBUTION OF SEPARATED EMPLOYEES BY LENGTH OF SERVICE* ................................................................................................................. 51 RATE OF SEPARATION BY LENGTH OF SERVICE.......................................................................................................................................................... 52 EMPLOYEE SEPARATION FROM SERVICE BY REASON .............................................................................................................................................. 53
VACANCY ...................................................................................................................................................................................... 55 VACANCY RATE FOR FULL-TIME POSITIONS BY AGENCY .......................................................................................................................................... 56 VACANT FULL-TIME POSITIONS ON JUNE 30, 2020 BY NUMBER OF DAYS VACANT .............................................................................................. 57 VACANT POSITIONS ON JUNE 30, 2020 BY NUMBER OF DAYS VACANT BY POSITION TYPE .............................................................................. 58 VACANCY RATE ON JUNE 30, 2020 BY POSITION TYPE .............................................................................................................................................. 58
RETIREMENT ELIGIBILITY ........................................................................................................................................................... 59 EXECUTIVE BRANCH - GROUP 1 EMPLOYEES .............................................................................................................................................................. 60 EXECUTIVE BRANCH - GROUP 2 EMPLOYEES .............................................................................................................................................................. 63
DIVISION OF PERSONNEL WORK ACTIVITIES .......................................................................................................................... 65 RECRUITMENT AND CERTIFICATION UNIT ..................................................................................................................................................................... 66 CLASSIFICATION UNIT ........................................................................................................................................................................................................ 72 CENTRAL HUMAN RESOURCE PROCESSING UNIT ...................................................................................................................................................... 90 BUREAU OF EMPLOYEE RELATIONS ............................................................................................................................................................................... 92 BUREAU OF EDUCATION AND TRAINING ........................................................................................................................................................................ 96

4
DIVISION OF PERSONNEL
GENERAL SUMMARY
Authority
RSA Chapter 21-I: 42-44, RSA Chapter 21-I: 54-57 Federal Merit System Standards
Mission
Establish and promote best practices in human resources through training and operational efficiency making the State of New Hampshire an employer of choice.
Location
54 Regional Drive, Suite 5 Concord, NH 03301
Staff Composition
21 Full-time classified positions (five vacancies)
7 Part-time positions (three vacancies) 3 Unclassified positions (one vacancy)
Fiscal Year 2020 Appropriation
DOP Appropriation $2,286,107 General Funds $331,270 Agency Income (except BET) BET Appropriation $195,444 General Funds $354,764 Agency Income
Personnel Appeals Board RSA 21-I:45 authorizes the Governor and Executive Council to appoint three members and two alternates to serve three (3) year terms on the New Hampshire Personnel Appeals Board. The Commissioners serving on the Board during Fiscal Year 2020 included Marilee Nihan, Norman Patenaude, Gail Wilson, and Jason Major.

5
OVERVIEW
The Division of Personnel was established in 1989 to manage a centralized State system of personnel administration. As such, the Division is tasked with establishing and enforcing appropriate methods of recruitment, appointment, compensation, promotion, transfer, removal, layoff, evaluation, and discipline of state employees; preparing and overseeing the State classification system and allocating all classified positions to an appropriate classification title based on job duties and level of responsibility; administering all collective bargaining agreements with classified employees; and providing training programs for state agencies. The Division also conducts investigations of complaints of harassment or misconduct, sets statewide human resources policy, and supports the Personnel Appeals Board. In performance of these duties, the Division of Personnel serves a valuable function to maintain a fair, equitable, and comprehensive system of personnel administration for the State and supports the success of each agency and each employee. In Fiscal Year 2020, the Division of Personnel continued its One Workforce initiative, a multi-year effort to review, streamline and modernize all aspects of the NH State Government’s personnel management systems and procedures. DOP made significant progress toward strategic priorities identified for Phase I of One Workforce: 1) Completed its review of the State’s Classification Plan and State’s human resource
management operations and provided recommendations for improvement (see below for more information);
2) Incorporated changes to procedures for reclassification and reallocation reviews based
on findings from the study of the State’s Classification Plan. 3) Established standard human resource management roles and began training agency HR
staff from the State’s largest agencies in these roles, including Classification Coordinators, Leave Management Coordinators, Recruiters, and HR Generalists.
4) Standardized many forms and procedures to increase consistency of practice across all
agencies. 5) Continued to develop a state-level orientation for new hires (Day One Orientation) to
provide a positive, consistent, and comprehensive on-boarding experience and ensure that all-important information is covered.
On February 1, 2020, DOP issued a report to the Governor, the Speaker of the House, and the Senate President on key steps to modernize the State’s personnel management practices: Modernizing New Hampshire State Government’s Personnel Management Practices (February 1, 2020). The report highlights four specific areas for improvement of the State’s current personnel management structures and practices:

6
1) Statewide development of personnel policies and standard operating procedures,
including standard forms and letters, to drive consistency and legal compliance;
2) Reorganization of human resource functions to train staff to a high-level of expertise in certain roles and consolidate resources across smaller agencies to better serve all agencies and employees;
3) Simplify the set of position types and job classifications used in state government and better align with federal job definitions, establish salaried professional and managerial positions in the classified ranks, and allow more flexibility at the agency level in managing positions and hiring/retaining staff; and
4) Review and adjust the legal foundation of the personnel system, namely the collection of state laws, administrative rules, and collective bargaining agreements, to reduce complexity and support the above objectives.
In addition to the above objectives, DOP continues its efforts to improve NH FIRST, the state’s Human Resource Management Information system, to enhance functionality and improve the user experience, to automate standard work processes, and to improve compliance auditing. Finally, DOP increasingly is using metrics to monitor the efficiency of HR operations and determine where additional staffing, improved training, or process evaluation work might be needed to improve timelines or quality at the state and agency level. The state’s personnel system is in the process of evolving to best meet the needs of state agencies and employees. Although change is underway, it takes time, and limited resources affect how quickly changes can be made while maintaining day-to-day operations.

7
COVID-19 RESPONSE
On March 13, 2020, the Governor declared a State of Emergency for COVID-19. This event had a significant impact on our state work force and the work of the Division of Personnel (DOP). DOP played a vital role throughout the State of Emergency in communicating with employees and agencies and guiding them through this unique time. DOP staff were engaged in the development of over 20 separate communications to agency Human Resource staff and the State’s 12,191 full and part-time employees. DOP provided guidance to the Human Resource community on a wide variety of topics including:
Safety protocols;
Shifting workers to different locations, including working remotely, and/or reassigning
them to different job duties;
The allocation and use of Emergency Paid Leave (EPSL and EPFL), and regular paid
sick leave;
New ways to conduct meetings; and
Accommodation and continued compliance under the Family Medical Leave Act (FMLA)
and American Disabilities Act (ADA) during the COVID-19 pandemic.
In addition, the DOP’s Bureau of Education and Training provided several communications with additional learning opportunities to keep employees fully engaged while working remotely, tips on managing staff remotely, and strategies for coping with the added stress during the pandemic, and providing general online training opportunities on a wide variety of topics. DOP also quickly adjusted its own business practices to remote operations to maintain timely processing of employee transactions and ensure that state payroll continued to be processed correctly and on time. Later, DOP worked quickly to establish new positions to support the State’s COVID-19 response and to implement a state hiring freeze. DOP also worked closely with other DAS divisions, including Financial Data Management (FDM), the Budget Office, and the DAS payroll teams, as well as the Department of Justice, to implement new and modified state policies and programs including:
New paid leave programs for both part-time and full-time employees under the Families
First Corona Virus Response Act (FFCRA) (Emergency Paid Sick Leave (EPSL) and
Emergency Paid Family Leave(EPFL));
Changing restrictions on travel, quarantine requirements, and returning to work after
illness or exposure (among others);
Adjustments to work locations and work environments; and
Changes to other state policies, such as use of sick leave and banking of accrued leave
time and floating holidays.
During the early part of the State of Emergency, in addition to communicating actively with agency Human Resources staff, DOP provided direct staff support to the State of New Hampshire’s Emergency Operations Center and to the Department of Employment Security to assist with serving the public during a time of unprecedented unemployment claims filings.

8
Finally, DOP’s Bureau of Education and Training adjusted their ongoing Certified Public Manager program to enable the completion of the program for FY 20 despite cancelling in-person instruction. BET planned an on online graduation ceremony, which was held in July 2020. DOP continues to adapt to and support changes in policies and procedures under the COVID-19 State of Emergency and COVID-19 Safer-at-Home Order into FY 2021.

9
ORGANIZATIONAL STRUCTURE
DIRECTOR
The Director of the Division of Personnel oversees all activities conducted by the Division with the assistance of a Deputy Director, a Manager of Employee Relations, a Training and Education Officer, and a Senior Human Resources Technician. In addition, an investigator, a professional development administrator, and an administrator for the Personnel Appeals Board report directly to the Director.
BUREAU OF HUMAN RESOURCE ADMINISTRATION
The Bureau of Human Resource Administration oversees all aspects of employee and position management and is comprised of three units:
(1) Recruitment and Certification
This Unit develops and implements statewide recruitment initiatives and certification procedures, monitors internal and external job recruitment activities of state agencies, maintains the state recruitment webpage, and manages the online application system for internal and external applicants. This unit also provides career-counseling services to employees and applicants and coordinates the State’s participation and compliance with the Uniformed Services Employment and Reemployment Rights Act (USERRA) and the U.S. Army Partnership for Youth Success (PaYS).
(2) Central HR Processing
This Unit establishes and oversees all personnel records management procedures and audits all personnel actions including hiring, promotions, demotions, transfers, increments, leaves of absence, terminations, retirements, and date adjustments, ensuring that all employee data is correct for the administration of payroll and benefits. This section also administers State examination programs, provides training and testing for changes and upgrades of the State’s human resource management system (NH FIRST), and processes all retroactive corrections affecting employee pay and/or benefits.
(3) Classification
This Unit develops and administers the State Classification Plan, including assigning all classified positions to an appropriate job classification title, which specifies the applicable salary grade, duties and qualification requirements. This Unit also evaluates all requests for reclassification of positions and reallocation of duties, requirements and/or salary of classification titles; and works with State agencies to conduct organizational analyses to realign staffing with agency business needs. This Unit also oversees all position management operations, including setting procedures and auditing for all position modifications, including establishment and abolishment of all types of positions.

10
BUREAU OF EMPLOYEE RELATIONS The Bureau of Employee Relations negotiates and administers all collective bargaining and sub-unit agreements with classified employees. This Bureau represents the State in collective bargaining negotiations and, in coordination with the attorney general, in resolution of all grievance actions related to the collective bargaining agreements. This Bureau also promotes communications between management and employees and seeks to resolve employee and agency concerns prior to formal proceedings.
BUREAU OF EDUCATION AND TRAINING The Bureau of Education and Training provides quality education and training services to enhance the skills, knowledge, and abilities of State and municipal government employees who provide services to the citizens of New Hampshire. Key among these are the Certified Public Manager (2 levels) and Foundations of State Supervision programs. The Bureau coordinates full- and part-time instructors and contract instructors to provide a comprehensive curriculum, including an expanding number of on-line training courses.

11
EMPLOYEE SUGGESTION AND EXTRAORDINARY SERVICE AWARD PROGRAM
Senate Bill 52 (Laws 2005, Chapter 258) became effective on September 14, 2005. This law reorganized the “Employee Incentive and Reward Program” of RSA 99-E and established a fund of $10,000 in the Governor’s Office for implementation of the program. Drafted by members of the State Committee, the new law revitalized and streamlined the program for providing monetary and non-monetary recognition to classified executive branch employees who have performed extraordinary services or provided original suggestions of substantial value to the State. The new RSA 99-E integrates each Department into the process of reviewing employee suggestions and services. Chapter 99-E requires that each Department establish an award evaluation committee consisting of three (3) employees appointed by the agency. The agency committee completes the initial review of suggestions and services submitted for award. Submissions are then forwarded to the Director of Personnel who shares them with the State Committee, which conducts its own review and makes award recommendations to the Governor and Executive Council. During State Fiscal Year 2020, one employee received monetary recognition. Monetary Award Recipients
Glen J Deveau, Administrative Services - $500 Award
The Administrative Services sought recognition for Administrative Services Glen J. Deveau, Security Officer I, for monetary recognition. On October 19, 2019, Mr. Deveau was en route to 64 South Street in Concord when he observed a man slumped over the driver's seat of a car in a parking spot. Fearing a medical emergency, Mr. Deveau requested that dispatch contact Concord Police while he stopped to assist the driver. Upon engaging in conversation with the driver and recognizing possible intoxication, Mr. Deveau requested that the driver turn off the car and relinquish his keys. Concord Police arrived and the driver was arrested for Operating under the Influence of Liquor. Mr. Deveau's actions may have prevented harm to others or saved lives. On Wednesday March 11, the State, with the Governor and Council’s assistance, presented a certificate of recognition and a check for $500 to Glen Deveau for providing service beyond his work performance to the State of New Hampshire.

12

13
EXECUTIVE BRANCH AT A GLANCE
14
EMPLOYEES BY CATEGORY Fiscal Year 2020
Category* Full-Time
Full-Time Temporary
Full-Time Seasonal
Part-Time Regular
Part-Time Seasonal
Per Diem Part-Time
Classified 8,973 131 1 2,076 168 14
Non-Classified 33 1 0 152 0 628
Unclassified 324 0 0 10 0 1
Total 9,461 132 1 2,238 168 643
* Includes employees on extended leave as well as active status; excludes employees expected to work less
than 6 months. * 9 classified, 15 unclassified, and 0 non-classified employees did not meet any group criteria and are
excluded from this report.
Report Generated 6/30/2020 by Employee Matrix Version V6.4
POSITIONS BY CATEGORY Fiscal Year 2020
Category* Full-Time
Full-Time Temporary
Full-Time Seasonal
Part-Time Regular
Part-Time Seasonal
Per Diem Part-Time
Classified 10,437 336 1,159 4,455 1,242 39
Non-Classified 39 N/A N/A 147 N/A 987
Unclassified 376 N/A N/A 9 N/A 3
Total 10,852 336 1159 4,611 1,242 1,029
* Includes both filled and vacant positions expected to last longer than 6 months.
* Report does not contain 1 positions found in error.
Report Generated: 7/21/2020 for data as of 6/30/2020 by Position Matrix Version V6.2

15
DEMOGRAPHICS
New Hampshire State Employees
Fiscal Year 2020
State Government Employees Executive Branch
Class Type Number of Positions**
Classified 10,774 Unclassified 376
TOTAL POSITIONS: 11,150
** Includes only full-time permanent
and temporary positions lasting more than 6 months
The Classified Full-Time State Workforce* is made up of…
53% Female 47% Male
4% Minority 96% White (not of
Hispanic background)
The Average Full-Time Classified Employee*…
Is 47 years old
Has 11 years of service
Earns $56,248
Classified State Employees that are …
Full-Time* …………………..9,105 Part-Time ……………..…….2,258
Classified Full-Time Employees* work in…
Belknap County………...….. 6% Carroll County……….……... 2% Cheshire County………..….. 2% Coos County………..……… 4% Grafton County……..……… 4% Hillsborough County..……. 7% Merrimack County……..….. 67% Rockingham County………. 5% Strafford County…………… 2% Sullivan County……………. 1%
*Full-time employees includes full-time permanent, full-time temporary and full-time seasonal employees working greater than 6 months.

16

17
WORKFORCE CHARACTERISTICS

18
Active
Active
Active
Leave
Leave
Leave
DETAILED BREAKDOWN OF STATE OF NEW HAMPSHIRE EMPLOYEES
Executive Branch All Employees
Report Run Date*: 06/30/2020
Ca
teg
ory
Full-Time
Employees
Full-Time Temporary
Employees
Full-Time Seasonal
Employees
Part-Time Regular
Employees Working >= 30
hours/week but < FT
Part-Time Seasonal
Employees Working >= 30
hours/week but < FT
Part-Time Regular
Employees Working
< 30 hours/week
Part-Time Seasonal
Employees Working
< 30 hours/week
Per Diem
Part-Time
Employees
EXCEPTIONS
Employees that
do not fit into
defined
categories Duration
>= 6 mo
Duration
< 6 mo
Duration
>= 6 mo
Duration
< 6 mo
Duration
>= 6 mo
Duration
< 6 mo
Duration
>= 6 mo
Duration
< 6 mo
Cla
ssif
ied
8,749
224
127
1
1
261
14
15
0
0
2,060
168
14
9
4
0
0
0
0
2
0
0
Un
cla
ssif
ied
323
1
N/A
N/A
N/A
N/A
0
N/A
N/A
N/A
10
N/A
1
15
0
0
0
No
n-c
lassif
ied
33
1
0
N/A
N/A
0
N/A
N/A
N/A
152
N/A
6
0
0
0
0
0
See "Employee Categories Matrix" V 6 . 4 at http://sunspot.nh.gov/hr/CentralHRProcessing.aspx?tab=EmplTransProcessing for rules and exclusions applied.
* Only includes data up to the end of the prior pay period.

19
EMPLOYEES BY GENDER AND EEO CATEGORY
Fiscal Year 2020
EEO Category* Total Percentage
Admin Support 452 5%
Official Administrator 851 9%
Para-professionals 1,308 14%
Professional 3,261 36%
Protective Service 899 10%
Service and Maintenance 1,247 14%
Skilled Craft 243 3%
Technician 844 9%
Total 9,105
* Includes classified full-time permanent, full-time temporary and seasonal full-time employees working more than 6 months as well as employees on extended leave. * Percentage of minority employees included in this report is 4% * 9 classified employees did not meet any group criteria and are excluded from this report.
Report Generated: 6/30/2020 by Employee Matrix Version V6.4
0 500 1000 1500 2000 2500 3000 3500
Admin Support
Of f icial Administrator
Para-prof essionals
Prof essional
Protectiv e Serv ice
Serv ice and Maint
Skilled Craf t
Technician
403
472
1,022
2,239
197
251
30
203
49
379
286
1,022
702
996
213
641
Female
Male
20
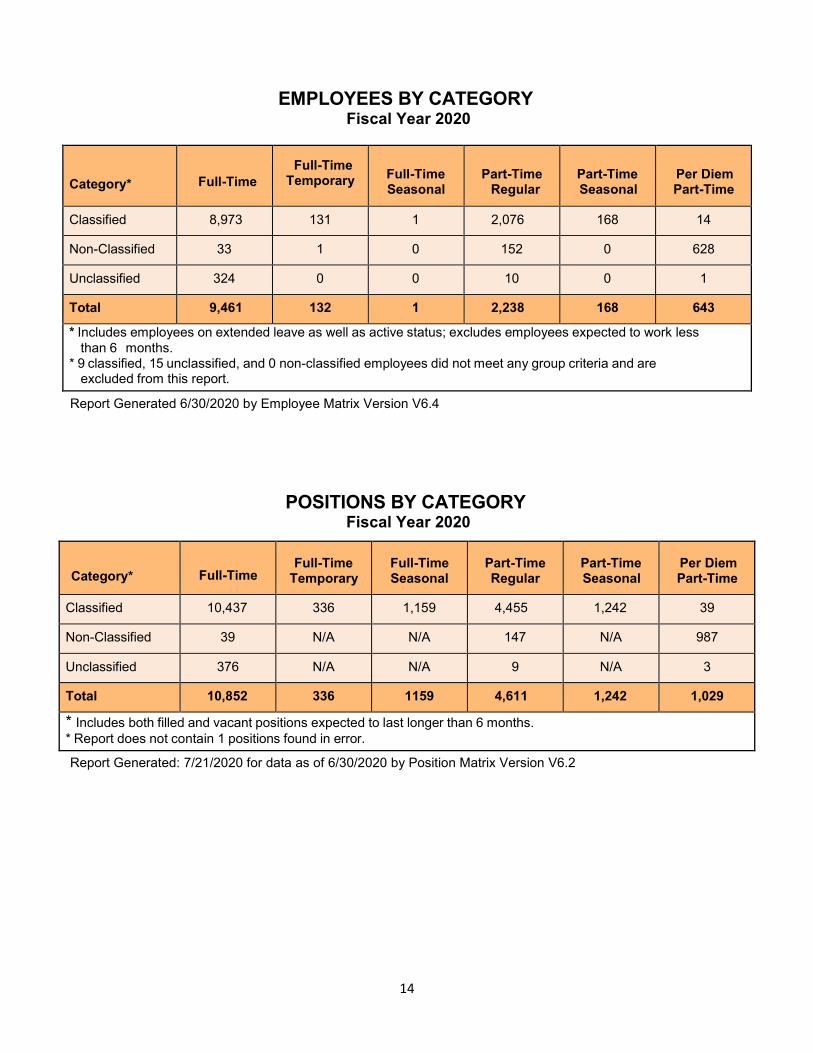
EMPLOYEES BY GENERATION Fiscal Year 2020
Total Number of Employees* = 9,105
* Includes classified full-time permanent, full-time temporary and seasonal full-time employees working more than 6 months as well as employees on extended leave.
* 9 classified employees did not meet any group criteria and are excluded from this report
Report Generated: 6/30/2020 by Employee Matrix Version V6.4
0
200
400
600
800
1000
1200
1400
1600
Gen Z Gen Y Gen X Boomers Early Boomers
214
1,451
1,2441,204
175206
1,4911,415
1,521
184
Male Female
*Generation Z = Born 1995-2012 *Generation Y = Born 1977-1994 *Generation X = Born 1966-1976 *Boomers = Born 1955-1965 *Early Boomers = Born < 1955
21
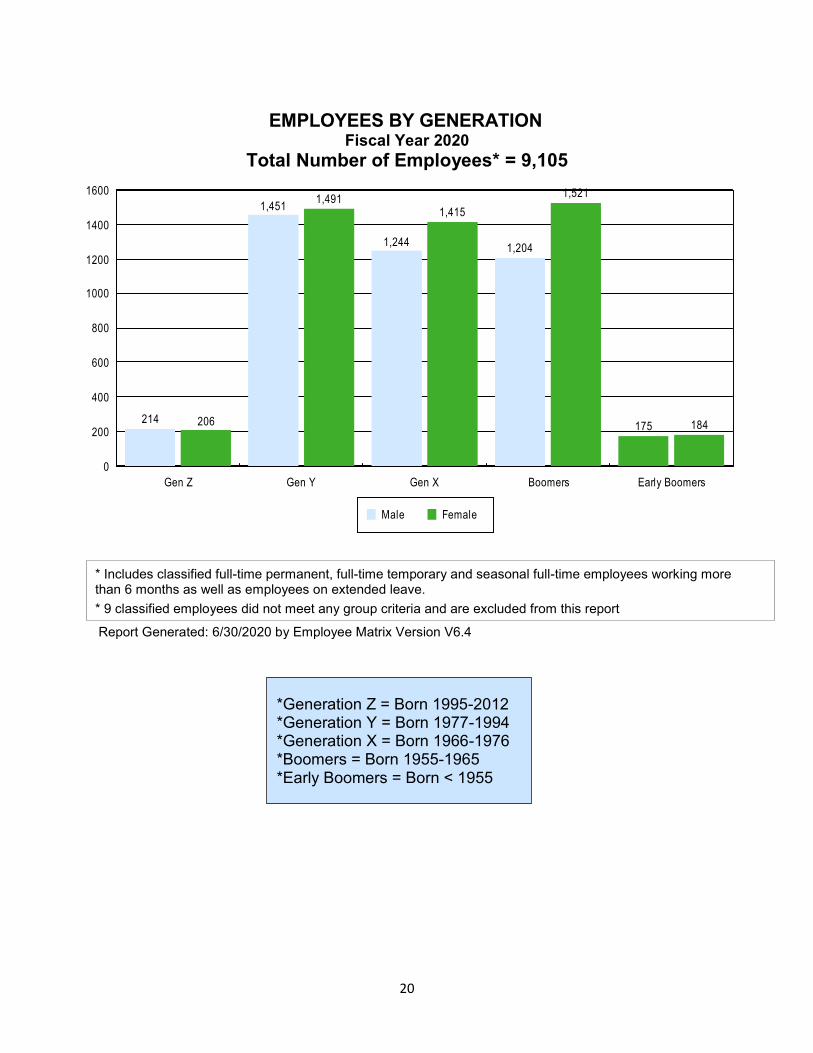
EMPLOYEES BY AGE Fiscal Year 2020
Total Number of Employees* = 9,105 Average Employee Age = 46.9
Report Generated 6/30/2020 by Employee Matrix Version V6.4
0
200
400
600
800
1000
1200
1400
1600
15-19 Years 20-24 Years 25-29 Years 30-34 Years 35-39 Years 40-44 Years 45-49 Years 50-54 Years 55-59 Years 60-64 Years 65+ Years
15
246
668
810
971 959
1,160
1,354
1,494
1,003
425
Female Male
* Includes classified full-time permanent, full-time temporary and seasonal full-time employees working more than 6 months as well as employees on extended leave. * 9 classified employees did not meet any group criteria and are excluded from this report.

22
EMPLOYEES BY YEARS OF SERVICE Fiscal Year 2020
Total Number of Employees* = 9,105
Average Years of Service = 10.93
* Includes classified full-time permanent, full-time temporary and seasonal full-time employees working more than 6 months as well as employees on extended leave.
* 9 classified employees did not meet any group criteria and are excluded from this report.
Report Generated 6/30/2020 by Employee Matrix Version V6.4
EMPLOYEES BY AGE AND LABOR GRADE Fiscal Year 2020
Age Labor Grade*
Total <=20 21-26 27+ Unclassified
<40 1,630 828 252 59 2,769
40-59 2,310 1,626 1,033 191 5,160
60+ 711 404 311 74 1,500
Total 4,651 2,858 1,596 324 9,429
* Includes classified full-time permanent, full-time temporary and seasonal full-time employees working more than 6 months, and full-time unclassified employees, as well as employees on extended leave.
* 9 classified and 15 unclassified employees did not meet any group criteria and are excluded from this report
Report Generated 6/30/2020 by Employee Matrix Version V6.4
0
200
400
600
800
1000
1200
1400
1600
1800
<2 Years 2-4 Years 5-9 Years 10-14 Years 15-19 Years 20-24 Years 25-29 Years 30+ Years
692 765 711 648 580430
218 244
848
958
785
707
631
413
218257
1,540
1,723
1,496
1,355
1,211
843
436501
Female Male

23
HILLSBOROUGH 603
BELKNAP 529
MERRIMACK 6,125 STRAFFORD
225
ROCKINGHAM 427
COOS
378
CHESHIRE 200
EMPLOYEES BY COUNTY
Fiscal Year 2020
Total Number of Employees* = 9,105
GRAFTON 369
CARROLL
146
Report Generated 6/30/2020 by Employee Matrix Version V6.4
SULLIVAN
103
*Includes classified full-time permanent, full-time temporary and seasonal full-time employees
working more than 6 months as well as employees on extended leave.
*9 classified employees did not meet any group criteria and are excluded from this report.
24
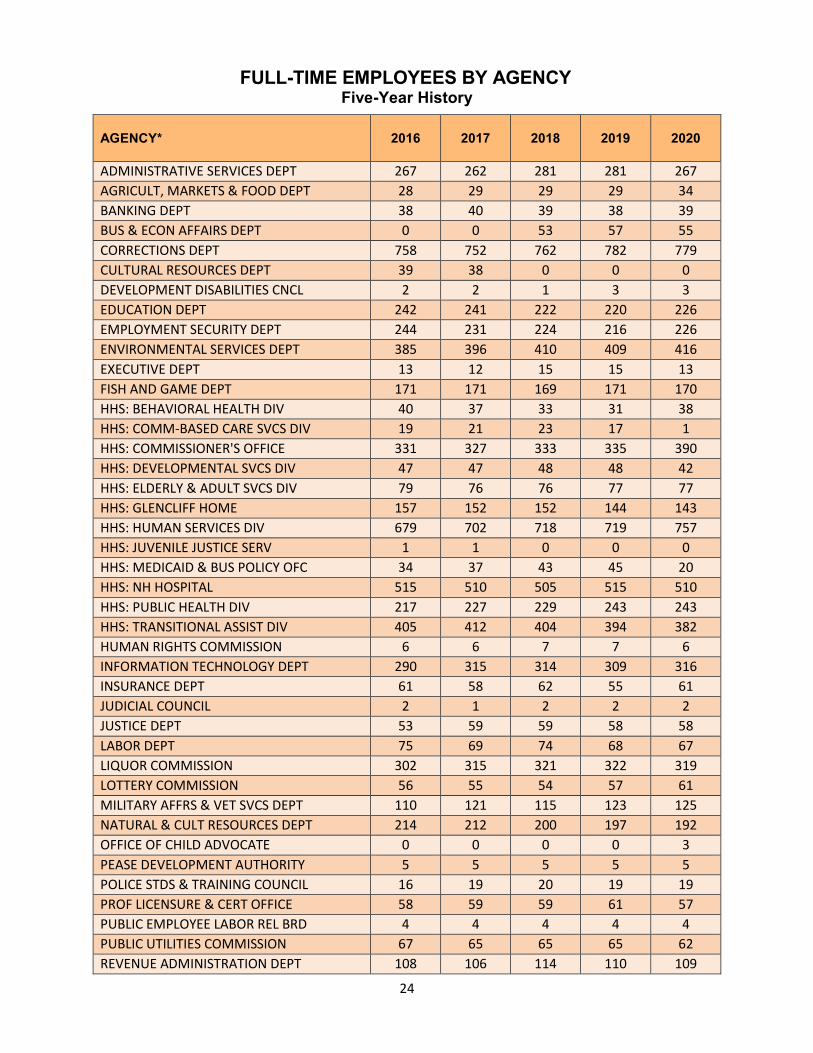
FULL-TIME EMPLOYEES BY AGENCY Five-Year History
AGENCY* 2016 2017 2018 2019
2020
ADMINISTRATIVE SERVICES DEPT 267 262 281 281 267
AGRICULT, MARKETS & FOOD DEPT 28 29 29 29 34
BANKING DEPT 38 40 39 38 39
BUS & ECON AFFAIRS DEPT 0 0 53 57 55
CORRECTIONS DEPT 758 752 762 782 779
CULTURAL RESOURCES DEPT 39 38 0 0 0
DEVELOPMENT DISABILITIES CNCL 2 2 1 3 3
EDUCATION DEPT 242 241 222 220 226
EMPLOYMENT SECURITY DEPT 244 231 224 216 226
ENVIRONMENTAL SERVICES DEPT 385 396 410 409 416
EXECUTIVE DEPT 13 12 15 15 13
FISH AND GAME DEPT 171 171 169 171 170
HHS: BEHAVIORAL HEALTH DIV 40 37 33 31 38
HHS: COMM-BASED CARE SVCS DIV 19 21 23 17 1
HHS: COMMISSIONER'S OFFICE 331 327 333 335 390
HHS: DEVELOPMENTAL SVCS DIV 47 47 48 48 42
HHS: ELDERLY & ADULT SVCS DIV 79 76 76 77 77
HHS: GLENCLIFF HOME 157 152 152 144 143
HHS: HUMAN SERVICES DIV 679 702 718 719 757
HHS: JUVENILE JUSTICE SERV 1 1 0 0 0
HHS: MEDICAID & BUS POLICY OFC 34 37 43 45 20
HHS: NH HOSPITAL 515 510 505 515 510
HHS: PUBLIC HEALTH DIV 217 227 229 243 243
HHS: TRANSITIONAL ASSIST DIV 405 412 404 394 382
HUMAN RIGHTS COMMISSION 6 6 7 7 6
INFORMATION TECHNOLOGY DEPT 290 315 314 309 316
INSURANCE DEPT 61 58 62 55 61
JUDICIAL COUNCIL 2 1 2 2 2
JUSTICE DEPT 53 59 59 58 58
LABOR DEPT 75 69 74 68 67
LIQUOR COMMISSION 302 315 321 322 319
LOTTERY COMMISSION 56 55 54 57 61
MILITARY AFFRS & VET SVCS DEPT 110 121 115 123 125
NATURAL & CULT RESOURCES DEPT 214 212 200 197 192
OFFICE OF CHILD ADVOCATE 0 0 0 0 3
PEASE DEVELOPMENT AUTHORITY 5 5 5 5 5
POLICE STDS & TRAINING COUNCIL 16 19 20 19 19
PROF LICENSURE & CERT OFFICE 58 59 59 61 57
PUBLIC EMPLOYEE LABOR REL BRD 4 4 4 4 4
PUBLIC UTILITIES COMMISSION 67 65 65 65 62
REVENUE ADMINISTRATION DEPT 108 106 114 110 109

25
FULL-TIME EMPLOYEES BY AGENCY (Continued)
Five-Year History
AGENCY* 2016 2017 2018 2019 2020
SAFETY DEPT 1,009 1,001 1,024 1,045 1,009
STATE DEPT 55 53 56 54 54
TAX AND LAND APPEALS BOARD 4 4 3 4 4
TRANSPORTATION DEPT 1,531 1,494 1,500 1,472 1,440
TREASURY DEPT 16 16 13 16 14
VETERANS HOME 328 321 313 298 287
VETERANS SERVICES OFFICE 5 7 7 9 0
Total 9,086 9,088 9,160 9,149 9,105
*Includes classified full-time permanent, full-time temporary and seasonal full-time employees working
more than 6 months including employees on extended leave, as of June 30th each year.
*This report reflects data in NH FIRST on the date the report is generated; historic data will change from year to year due to transactions processed after June 30th.
*9 classified employees did not meet any group criteria and are excluded from this report.
Report Generated 6/30/2020 by Employee Matrix Version V6.4

26
EMPLOYEES BY TYPE AND AGENCY Fiscal Year 2020
AGENCY*
Full-Time Classified (Perm & Temp)
Full-Time Unclassified
and Non-Classified
Full-Time Seasonal
Part-Time Regular
Part-Time Seasonal
Part-Time Per Diem
ADMINISTRATIVE SERVICES DEPT 267 10 0 118 0 4
AGRICULT, MARKETS & FOOD DEPT 34 4 0 4 0 0
BANKING DEPT 39 3 0 0 0 0
BOXING & WRESTLING COMMISSION
0 0 0 6 0 2
BUS & ECON AFFAIRS DEPT 56 3 0 46 0 0
CORRECTIONS DEPT 772 12 0 40 0 10
DEVELOPMENT DISABILITIES CNCL 3 0 0 3 0 0
EDUCATION DEPT 226 4 0 8 1 0
EMPLOYMENT SECURITY DEPT 227 7 0 46 0 3
ENVIRONMENTAL SERVICES DEPT 416 5 0 55 0 2
EXECUTIVE COUNCIL 0 1 0 5 0 0
EXECUTIVE DEPT 13 32 0 2 1 0
FISH AND GAME DEPT 171 1 0 20 16 0
HHS: BEHAVIORAL HEALTH DIV 38 5 0 0 0 0
HHS: COMM-BASED CARE SVCS DIV 1 0 0 0 0 0
HHS: COMMISSIONER'S OFFICE 390 36 0 30 0 2
HHS: DEVELOPMENTAL SVCS DIV 42 3 0 6 0 0
HHS: ELDERLY & ADULT SVCS DIV 76 2 0 1 0 0
HHS: GLENCLIFF HOME 143 1 0 22 0 0
HHS: HUMAN SERVICES DIV 752 7 0 20 0 2
HHS: MEDICAID & BUS POLICY OFC 20 3 0 2 0 0
HHS: NH HOSPITAL 514 12 0 111 0 4
HHS: PUBLIC HEALTH DIV 244 4 0 19 0 0
HHS: TRANSITIONAL ASSIST DIV 382 5 0 10 0 1
HUMAN RIGHTS COMMISSION 6 0 0 2 0 0
INFORMATION TECHNOLOGY DEPT 316 11 0 10 0 0
INSURANCE DEPT 61 14 0 0 0 0
JUDICIAL COUNCIL 2 1 0 3 0 0
JUSTICE DEPT 58 74 0 11 0 0
LABOR DEPT 67 2 0 8 0 30
LIQUOR COMMISSION 319 5 0 907 0 0
LOTTERY COMMISSION 61 1 0 11 0 1
MILITARY AFFRS & VET SVCS DEPT 126 3 0 5 0 0
NATURAL & CULT RESOURCES DEPT 191 6 1 146 136 0
OFFICE OF CHILD ADVOCATE 3 1 0 3 0 0
PEASE DEVELOPMENT AUTHORITY 5 0 0 4 0 0
POLICE STDS & TRAINING COUNCIL 19 1 0 5 0 0
PROF LICENSURE & CERT OFFICE 57 0 0 42 0 179
PUBLIC EMPLOYEE LABOR REL BRD 4 0 0 8 0 2
PUBLIC UTILITIES COMMISSION 62 8 0 5 0 0
REVENUE ADMINISTRATION DEPT 110 31 0 9 0 3
SAFETY DEPT 1,010 10 0 176 13 393

27
EMPLOYEES BY TYPE AND AGENCY (Continued) Fiscal Year 2020
AGENCY*
Full-Time Classified (Perm & Temp)
Full-Time Unclassified
and Non-Classified
Full-Time Seasonal
Part-Time
Regular
Part-Time Seasonal
Part-Time Per
Diem
STATE DEPT 54 14 0 78 0 1
TAX AND LAND APPEALS BOARD 4 3 0 2 0 0
TRANSPORTATION DEPT 1,442 8 0 175 1 0
TREASURY DEPT 14 4 0 0 0 0
VETERANS HOME 287 1 0 54 0 4
Total 9,104 358 1 2,238 168 643
* Excludes employees working less than 6 months.
* 9 classified employees, 15 unclassified employees, and 0 non-classified employees did not meet any group criteria and are excluded from this report.
Report Generated: 6/30/2020 by Employee Matrix Version V6.4

28
EMPLOYEE STATISTICS BY AGENCY WITH 10 OR MORE EMPLOYEES Fiscal Year 2020
AGENCY* Full-Time Employees
Avg. Age
Avg. Salary
Avg. Yrs Service
% Female
% Union Rep
ADMINISTRATIVE SERVICES DEPT 277 51.1 $60,673 11.6 40% 83% AGRICULT, MARKETS & FOOD DEPT 38 45.8 $54,732 11.4 61% 95% BANKING DEPT 42 46.2 $71,376 10.2 64% 93% BUS & ECON AFFAIRS DEPT 59 48.7 $57,113 9.2 61% 98% CORRECTIONS DEPT 784 44.4 $59,730 10.4 35% 97% EDUCATION DEPT 230 48.8 $57,986 9.6 81% 97% EMPLOYMENT SECURITY DEPT 234 53.2 $53,248 12.6 70% 96% ENVIRONMENTAL SERVICES DEPT 421 49.0 $67,613 13.5 44% 98% EXECUTIVE DEPT 45 44.7 $59,358 4.5 51% 53% FISH AND GAME DEPT 172 44.7 $58,044 13.7 33% 97% HHS: BEHAVIORAL HEALTH DIV 43 48.9 $69,945 11.1 81% 100% HHS: COMM-BASED CARE SVCS DIV 1 54.0 $71,916 24.0 100% 100% HHS: COMMISSIONER'S OFFICE 426 50.2 $65,550 12.2 78% 92% HHS: DEVELOPMENTAL SVCS DIV 45 52.2 $59,415 13.4 84% 100% HHS: ELDERLY & ADULT SVCS DIV 78 52.0 $63,186 12.6 85% 100% HHS: GLENCLIFF HOME 144 45.7 $44,890 9.4 78% 99% HHS: HUMAN SERVICES DIV 759 43.2 $55,772 10.3 76% 99% HHS: MEDICAID & BUS POLICY OFC 23 54.6 $83,934 13.7 91% 100% HHS: NH HOSPITAL 526 45.8 $56,258 9.8 64% 98% HHS: PUBLIC HEALTH DIV 248 47.5 $62,647 9.5 75% 100% HHS: TRANSITIONAL ASSIST DIV 387 43.8 $47,650 8.9 91% 100% INFORMATION TECHNOLOGY DEPT 327 52.6 $77,969 12.6 35% 98% INSURANCE DEPT 75 52.5 $78,973 11.0 61% 93% JUSTICE DEPT 132 48.0 $75,619 8.6 61% 56% LABOR DEPT 69 48.3 $53,840 10.5 71% 94% LIQUOR COMMISSION 324 44.7 $47,994 7.8 56% 96% LOTTERY COMMISSION 62 46.2 $54,455 10.0 61% 94% MILITARY AFFRS & VET SVCS DEPT 129 47.1 $49,413 8.7 20% 95% NATURAL & CULT RESOURCES DEPT 198 48.3 $54,417 12.2 44% 98% POLICE STDS & TRAINING COUNCIL 20 52.2 $63,024 13.4 30% 5% PROF LICENSURE & CERT OFFICE 57 52.0 $51,682 8.7 79% 93% PUBLIC UTILITIES COMMISSION 70 53.6 $77,541 10.5 50% 11% REVENUE ADMINISTRATION DEPT 141 47.7 $61,478 11.8 68% 97% SAFETY DEPT 1,020 43.9 $59,874 10.6 46% 99% STATE DEPT 68 53.6 $58,106 13.3 51% 19% TRANSPORTATION DEPT 1,450 47.9 $50,782 12.5 18% 99% TREASURY DEPT 18 52.3 $65,804 13.8 78% 83% VETERANS HOME 288 47.1 $49,591 8.0 82% 97% OVERALL AVERAGE 9,463 47.1 $57,875 10.9 53% 95%
*Includes classified, unclassified, and non-classified full-time permanent, full-time temporary and seasonal full-time employees working more than 6 months including employees on extended leave. Salary includes base pay only. Overtime and longevity pay are excluded.
* 9 classified employees, 15 unclassified employees, and 0 non-classified employees did not meet any group criteria and are excluded from this report
Report Generated: 6/30/2020 by Employee Matrix Version V6.4

29
EMPLOYEE PAID LEAVE

30
ANNUAL AND SICK LEAVUSAGE BY AGENCY Fiscal Year 2020
AGENCY* (Agencies with 10 or more Employees)
Total Annual (Hours)
# Employees
Using Annual Leave
Average Annual Leave
Used Per Employee
(Hours)
Total Sick Leave**
(Hours)
# Employees Using Sick
Leave**
Average Sick Leave Used Per Employee
(Hours)
ADMINISTRATIVE SERVICES DEPT
35,032 297 118 27,316 285 96
AGRICULT, MARKETS & FOOD DEPT
3,421 34 101 2,105 33 64
BANKING DEPT 4,172 42 99 3,415 41 83
BUS & ECON AFFAIRS DEPT 6,599 61 108 6,094 58 105
CORRECTIONS DEPT 99,362 813 122 80,233 802 100
EDUCATION DEPT 27,976 248 113 20,985 245 86
EMPLOYMENT SECURITY DEPT 25,402 235 108 20,244 231 88
ENVIRONMENTAL SERVICES DEPT
49,997 430 116 32,999 427 77
EXECUTIVE DEPT 2,645 27 98 2,416 26 93
FISH AND GAME DEPT 23,649 173 137 14,615 155 94
HHS: BEHAVIORAL HEALTH DIV 3,316 34 98 3,064 33 93
HHS: COMM-BASED CARE SVCS DIV
2,183 19 115 1,657 20 83
HHS: COMMISSIONER'S OFFICE 43,227 388 111 33,268 397 84
HHS: DEVELOPMENTAL SVCS DIV 5,699 51 112 3,654 51 72
HHS: ELDERLY & ADULT SVCS DIV
9,966 80 125 7,244 81 89
HHS: GLENCLIFF HOME 20,175 161 125 16,924 155 109
HHS: HUMAN SERVICES DIV 88,213 786 112 65,856 793 83
HHS: MEDICAID & BUS POLICY OFC
6,189 49 126 4,969 48 104
HHS: NH HOSPITAL 62,383 558 112 50,088 561 89
HHS: PUBLIC HEALTH DIV 26,249 253 104 19,199 252 76
HHS: TRANSITIONAL ASSIST DIV 44,111 464 95 36,376 466 78
INFORMATION TECHNOLOGY DEPT
37,969 325 117 23,696 321 74
INSURANCE DEPT 7,136 61 117 5,825 66 88
JUDICIAL COUNCIL 242 2 121 113 2 56
JUSTICE DEPT 7,461 80 93 6,050 78 78
LABOR DEPT 10,248 75 137 8,546 78 110
LIQUOR COMMISSION 37,933 353 107 34,642 340 102
LOTTERY COMMISSION 6,902 60 115 5,396 62 87
MILITARY AFFRS & VET SVCS DEPT
16,108 141 114 12,320 136 91
NATURAL & CULT RESOURCES DEPT
25,104 202 124 16,721 196 85
POLICE STDS & TRAINING COUNCIL
2,514 21 120 1,076 20 54
PROF LICENSURE & CERT OFFICE
7,649 69 111 6,047 69 88
PUBLIC UTILITIES COMMISSION 8,228 69 119 4,830 68 71
REVENUE ADMINISTRATION DEPT
14,048 122 115 10,428 122 85
SAFETY DEPT 138,615 1,084 128 95,746 1,043 92
STATE DEPT 7,796 66 118 6,324 68 93
TRANSPORTATION DEPT 198,107 1,583 125 144,756 1,534 94
TREASURY DEPT 2,821 17 166 1,828 18 102
VETERANS HOME 36,246 327 111 31,964 327 98
* Includes leave used by all types of eligible employees employed at any point during the Fiscal Year. ** Excludes sick dependent and bereavement leave
Report Generated: 10/10/2020 for data as of 6/30/2020 by Employee Matrix Version V6.4

31
ADDITIONAL LEAVES
Short-Term Disability – Income Protection
Short-Term Disability Income Protection (STD) is provided by the State for eligible full-time employees. It is designed to provide income replacement to eligible employees recovering from a non-work related injury or sickness that has left them totally disabled and unable to perform the immediate duties and responsibilities of their job and who have exhausted their sick leave. The STD program does not provide job protection. Employees must be approved for a leave of absence or other use of leave.
Eligible employees are full-time classified employees employed for one year who are either unrepresented or represented by the State Employees Association, the New England Police Benevolent Association, Teamsters Local 633, or New Hampshire Troopers Association – Command Staff Bargaining Unit. Employees apply through their agency human resources office; approval depends on appropriate medical information being provided. In FY 2020, this program supported 325 requests for an average of 89 days of partially-paid leave per request.
Supplemental Sick Leave (*State Employees Association Bargaining Unit Only)
Effective January 1, 2019, the Supplemental Sick Leave (SSL) program is available only after all benefits approved under the short-term disability income protection plan have been exhausted. Supplemental sick leave provides eligible employees to use additional sick leave donated by other state employees.
Supplemental sick leave is granted only for emergent serious or life-threatening illnesses, injuries, impairments, or mental or physical conditions that have caused, or are likely to cause the employee to take leave without pay. Seriously ill or injured state employees access SSL through an application to the Labor Management Committee; approval depends on appropriate medical information being provided.
In FY 2020, this program processed 4 SSL requests.

32
INCOME PROTECTION PROGRAM Fiscal Year 2020
AGENCY
Applications Submitted
Requests Approved
Total # Calendar Days out on STD-IP
Average # Calendar Days per Application
ADMINISTRATIVE SERVICES 8 8 780 98
AGRICULTURE, MARKETS & FOOD DEPARTMENT
1 1 42 42
BANKING DEPARTMENT 4 3 254 85
BUREAU OF ECONOMIC AFFAIRS 4 3 205 68
CORRECTIONS DEPARTMENT 26 26 2,987 115
EDUCATION DEPARTMENT 8 7 341 49
EMPLOYMENT SECURITY 4 4 472 118
ENVIRONMENTAL SERVICES 11 11 937 85
EXECUTIVE DEPARTMENT 1 1 42 42
FISH & GAME DEPARTMENT 3 3 343 114
HEALTH & HUMAN SERVICES DEPARTMENT
134 131 9,742 74
INFORMATION TECHNOLOGY DEPARTMENT
3 3 209 70
JUSTICE DEPARTMENT 2 2 266 133
LABOR DEPARTMENT 4 3 196 65
LIQUOR COMMISSION 11 11 1,055 96
MILITARY AFFAIRS AND VETERANS SERVICES
10 9 1,209 134
PROFESSIONAL LICENSURE & CERTIFICATION OFFICE
3 3 140 47
REVENUE ADMINISTRATION DEPARTMENT
7 7 451 64
SAFETY DEPARTMENT 19 18 1,831 102
STRATEGIC INITIATIVES 1 1 89 89
TRANSPORTATION DEPARTMENT 52 47 4,619 98
TREASURY DEPARTMENT 1 1 200 200
VETERANS HOME 22 22 2,309 105
TOTAL 337 325 28,719 89
* On January 1, 2020, the SEIU became eligible for the Short-term Disability-Income Protection Plan. * There were 337 Income Protection applications submitted for fiscal year 2020; 245 more than Fiscal Year 2019. * The average number of calendar days an employee was out of work per approved application for Fiscal Year 2020 was 89; on average 37 days more than the prior Fiscal Year.

33
COMPENSATION

34
AVERAGE SALARY BY AGENCY Five-Year History
AGENCY* 2016 2017 2018 2019 2020
ADMINISTRATIVE SERVICES DEPT $53,103 $55,211 $56,194 $58,136 $57,920
AGRICULT, MARKETS & FOOD DEPT $48,022 $48,971 $48,803 $49,638 $49,273
BANKING DEPT $61,924 $60,521 $64,184 $67,291 $68,331
BUS & ECON AFFAIRS DEPT $0 $0 $51,858 $52,883 $54,108
CORRECTIONS DEPT $53,389 $54,516 $56,994 $57,371 $57,549
CULTURAL RESOURCES DEPT $49,445 $49,451 $0 $0 $0
DEVELOPMENT DISABILITIES CNCL $67,187 $70,132 $78,000 $54,984 $57,441
EDUCATION DEPT $52,996 $53,708 $55,456 $57,116 $57,110
EMPLOYMENT SECURITY DEPT $48,008 $49,656 $50,399 $51,506 $51,582
ENVIRONMENTAL SERVICES DEPT $62,687 $64,145 $64,665 $66,987 $66,845
EXECUTIVE DEPT $52,263 $51,288 $50,474 $53,255 $55,730
FISH AND GAME DEPT $53,216 $54,387 $55,184 $56,503 $57,695
HHS: BEHAVIORAL HEALTH DIV $59,776 $57,032 $59,053 $66,126 $65,496
HHS: COMM-BASED CARE SVCS DIV $58,609 $61,383 $64,559 $67,426 $71,916
HHS: COMMISSIONER'S OFFICE $56,851 $57,962 $59,222 $61,793 $62,182
HHS: DEVELOPMENTAL SVCS DIV $51,480 $53,986 $55,331 $56,157 $55,895
HHS: ELDERLY & ADULT SVCS DIV $56,595 $58,789 $59,568 $61,501 $62,107
HHS: GLENCLIFF HOME $41,697 $43,054 $44,946 $45,886 $44,190
HHS: HUMAN SERVICES DIV $51,950 $52,853 $53,836 $55,657 $55,393
HHS: JUVENILE JUSTICE SERV $62,878 $64,106 $0 $0 $0
HHS: MEDICAID & BUS POLICY OFC $69,590 $70,804 $72,049 $75,275 $77,482
HHS: NH HOSPITAL $48,505 $50,238 $52,030 $54,059 $54,415
HHS: PUBLIC HEALTH DIV $57,150 $58,346 $60,072 $61,929 $61,687
HHS: TRANSITIONAL ASSIST DIV $42,061 $43,254 $44,084 $45,694 $46,806
HUMAN RIGHTS COMMISSION $55,702 $54,165 $50,697 $54,001 $58,315
INFORMATION TECHNOLOGY DEPT $70,357 $71,228 $73,082 $75,771 $76,287
INSURANCE DEPT $66,973 $68,813 $71,817 $76,294 $73,534
JUDICIAL COUNCIL $38,961 $45,377 $44,324 $42,218 $43,115
JUSTICE DEPT $47,899 $48,373 $49,802 $51,062 $52,329
LABOR DEPT $46,696 $48,317 $48,964 $50,626 $52,424
LIQUOR COMMISSION $44,036 $44,533 $45,193 $46,595 $46,709
LOTTERY COMMISSION $49,448 $50,075 $51,150 $51,867 $51,795
MILITARY AFFRS & VET SVCS DEPT $46,472 $46,246 $46,265 $47,390 $46,642
NATURAL & CULT RESOURCES DEPT $48,998 $50,476 $50,851 $52,818 $52,404
OFFICE OF CHILD ADVOCATE $0 $0 $0 $0 $61,399
PEASE DEVELOPMENT AUTHORITY $50,274 $50,231 $51,608 $54,063 $54,406
POLICE STDS & TRAINING COUNCIL $66,164 $60,042 $60,110 $61,758 $57,617
PROF LICENSURE & CERT OFFICE $49,463 $50,428 $52,043 $53,365 $51,682
PUBLIC EMPLOYEE LABOR REL BRD $60,963 $63,541 $64,506 $66,987 $68,307
PUBLIC UTILITIES COMMISSION $65,286 $67,999 $70,007 $71,092 $71,410
REVENUE ADMINISTRATION DEPT $48,751 $50,114 $50,145 $51,309 $52,924
SAFETY DEPT $54,851 $56,349 $57,272 $58,846 $58,977
STATE DEPT $46,115 $48,104 $49,121 $51,102 $49,292

35
AVERAGE SALARY BY AGENCY (Continued) Five Year History
AGENCY* 2016 2017 2018 2019 2020
TAX AND LAND APPEALS BOARD $63,273 $62,658 $60,145 $70,575 $71,526
TRANSPORTATION DEPT $45,197 $46,777 $47,637 $49,779 $49,817
TREASURY DEPT $49,144 $52,288 $54,602 $56,016 $56,193
VETERANS HOME $44,398 $46,509 $47,349 $48,084 $48,867
VETERANS SERVICES OFFICE $42,647 $42,800 $40,365 $41,703 $0
* Includes classified full-time permanent, full-time temporary and seasonal full-time employees working more than 6 months as of June 30th each year.
*This report reflects data in NH FIRST on the date the report is generated; historic data will change from year to year due to transactions processed after June 30th.
* 9 classified employee(s) did not meet any group criteria and are excluded from this report.
Report Generated 6/30/2020 by Employee Matrix Version V6.4.

36
AVERAGE SALARY BY YEARS OF SERVICE* Fiscal Year 2020
* Includes classified full-time permanent, full-time temporary and seasonal full-time employees working more than 6 months as well as employees on extended leave. * Excludes up to 9 classified employees that did not meet a defined category. Salary includes base pay only. Overtime and longevity pay are excluded.
Report Generated: 6/30/2020 by Employee Matrix V6.4
AVERAGE SALARY BY EEO CATEGORY* Fiscal Year 2020
* Includes classified full-time permanent, full-time temporary and seasonal full-time employees working more than 6 months as well as employees on extended leave. * Excludes up to 9 classified employees that did not meet a defined category. Salary includes base pay only. Overtime and longevity pay are excluded.
Report Generated: 6/30/2020 by Employee Matrix V6.4
10K
20K
30K
40K
50K
60K
70K
<2 Years 2-4 Years 5-9 Years 10-14 Years 15-19 Years 20-24 Years 25-29 Years 30+ Years
$44,632
$50,525
$54,957
$60,196$62,954
$65,327 $65,161 $65,565
$0 $20,000 $40,000 $60,000 $80,000 $100,000
Admin Support
Official Administrator
Para-professionals
Professional
Protective Service
Service and Maintenance
Skilled Craft
Technician
$37,728
$82,314
$42,903
$63,314
$58,036
$39,733
$46,061
$60,806

37
DISTRIBUTION OF EMPLOYEES BY LABOR GRADE STEP* Fiscal Year 2020
Step
Number of Employees
Step 1 593
Step 2 671
Step 3 687
Step 4 652
Step 5 1,268
Step 6 996
Step 7 890
Step 8 1,357
Step 9 1,682
Total 8,796
Report Generated: 6/30/2020 by Employee Matrix V6.4
* Includes classified full-time permanent, full-time temporary and seasonal full-time employees working more than 6 months as well as employees on extended leave.
* Excludes 9 classified employees that did not meet a defined category. Total does not include 309 employees with salary enhancements.

38
COST OF LONGEVITY* Fiscal Year 2020
*Includes classified, unclassified, non-classified, full-time permanent, full-time temporary and full-time seasonal employees working more than 6 months as of December 31, 2019.
Employees receive $300 a year bonus pay in mid-November for 10-14 years of service and an additional $300 a year for each 5 years of service beyond 10 years. Employees in TEAM633 and NEPBA260 unions receive $350 a year bonus pay in mid-November for 10-14 years of service and an additional $350 a year for each 5 years of service beyond.
46% of employees received a longevity payment in Fiscal Year 2020.
Report Generated: 6/30/2020 for data as of 12/31/2019 by Employee Matrix Version V6.4
0K
100K
200K
300K
400K
500K
600K
700K
800K
300 350.00 600 700.00 900 1,050.00 1,200 1,400.00 1,500 1,800 2,100 2,400
461,700
11,550
718,200
42,000
698,400
15,750
534,000
8,400
523,500
210,600
90,300
16,800
Amount of Payment Received
To
tal C
os
t

39
POSITION STATISTICS

40
BREAKDOWN OF STATE OF NH POSITIONS BY TYPE AND BRANCH OF GOVERNMENT Report Run Date: 07/21/2020 for Data as of 06/30/2020
* See "Position Categories Matrix" V6.2 at: http://sunspot.nh.gov/hr/documents/Classification/Position_Categories_Matrix.pdf
* Only includes data up to the end of the prior pay period.
* This report does not contain 1 positions found in error.

41
FILLED AND TOTAL FULL-TIME PERMANENT CLASSIFIED POSITIONS*
Five-Year History
* Includes full-time permanent classified positions and full-time permanent classified employees
* This report reflects data in NHFIRST on the date the report is generated; historic data will change from year to year due to transactions processed after June 30th
* 9 classified employees did not meet any group criteria and are excluded from this report.
* This report does not contain 1 positions found in error.
Report Generated: 6/30/2020 Employee Matrix Version V6.4 and 07/21/2020 for data as of 6/30/2020 by Position Matrix V6.2
10142 1010010282
10164
10437
9001 8993 9068 8997 8973
8000
8500
9000
9500
10000
10500
11000
2016 2017 2018 2019 2020
Positions Filled Positions

42
POSITIONS BY EEO OCCUPATION GROUP
Fiscal Year 2020
Report Generated: 7/21/2020 for data as of 6/30/2020 by Position Matrix V6.2
Admin Support5%
Official Administrator9%
Para-professionals15%
Professional36%
Protective Service10%
Service and Maintenance13%
Skilled Craft3%
Technician9%
Occupational Group* Number of Positions %Vacant**
Administrative Support 548 15%
Officials/Administrators 971 9%
Para-Professional 1,587 5%
Professionals 3,872 2%
Protective Services 1,087 8%
Service/Maintenance 1,452 6%
Skilled Craft 286 30%
Technicians 970 9%
Total 10,773 16%
*Includes classified full-time permanent and full-time temporary positions expected to last for more than 6 months
as of June 30th
that have an Occupational Group associated with the position.
*This report does not contain 1 positions found in error.
**Percent vacant is calculated as: {the number of employees in EEO} divided by {the number of vacant positions in the EEO category} as of June 30th.

43
CLASSIFIED FULL-TIME PERMANENT POSITIONS BY AGENCY Five-Year History
AGENCY * 2016 2017 2018 2019 2020
ADMINISTRATIVE SERVICES DEPT 309 283 295 291 298
AGRICULT, MARKETS & FOOD DEPT 32 32 34 34 36
BANKING DEPT 52 51 52 47 47
BUS & ECON AFFAIRS DEPT 0 0 65 59 61
CORRECTIONS DEPT 879 881 950 925 964
CULTURAL RESOURCES DEPT 54 53 0 0 0
DEVELOPMENT DISABILITIES CNCL 3 3 3 3 3
EDUCATION DEPT 283 284 289 289 281
EMPLOYMENT SECURITY DEPT 265 263 263 245 250
ENVIRONMENTAL SERVICES DEPT 467 468 468 470 477
EXECUTIVE DEPT 16 16 16 15 15
FISH AND GAME DEPT 188 189 189 177 181
HHS: BEHAVIORAL HEALTH DIV 47 43 40 25 37
HHS: COMM-BASED CARE SVCS DIV 23 22 22 21 0
HHS: COMMISSIONER'S OFFICE 380 378 382 371 444
HHS: DEVELOPMENTAL SVCS DIV 53 54 55 53 52
HHS: ELDERLY & ADULT SVCS DIV 85 83 80 79 79
HHS: GLENCLIFF HOME 168 168 168 167 167
HHS: HUMAN SERVICES DIV 742 764 786 787 889
HHS: MEDICAID & BUS POLICY OFC 38 47 51 48 24
HHS: NH HOSPITAL 573 574 574 587 603
HHS: PUBLIC HEALTH DIV 252 246 247 246 237
HHS: TRANSITIONAL ASSIST DIV 473 429 428 423 446
HUMAN RIGHTS COMMISSION 7 7 7 7 9
INFORMATION TECHNOLOGY DEPT 348 356 356 344 349
INSURANCE DEPT 70 70 70 70 69
JUDICIAL COUNCIL 2 2 2 2 2
JUSTICE DEPT 55 56 58 58 59
LABOR DEPT 92 92 91 87 84
LIQUOR COMMISSION 313 315 339 339 339
LOTTERY COMMISSION 62 62 66 65 71
MILITARY AFFRS & VET SVCS DEPT 135 135 141 141 156
NATURAL & CULT RESOURCES DEPT 205 207 198 195 197
OFFICE OF CHILD ADVOCATE 0 0 0 0 4
PEASE DEVELOPMENT AUTHORITY 6 6 6 6 6
POLICE STDS & TRAINING COUNCIL 20 20 20 20 20
PROF LICENSURE & CERT OFFICE 59 59 59 62 67
PUBLIC EMPLOYEE LABOR REL BRD 4 4 4 4 4
PUBLIC UTILITIES COMMISSION 68 69 71 71 71
REVENUE ADMINISTRATION DEPT 120 120 121 120 122
SAFETY DEPT 1,083 1,081 1,097 1,095 1,108
STATE DEPT 70 63 73 72 72
TAX AND LAND APPEALS BOARD 5 5 5 4 4
TRANSPORTATION DEPT 1,631 1,634 1,635 1,635 1,642
TREASURY DEPT 17 17 17 17 18

44
CLASSIFIED FULL-TIME PERMANENT POSITIONS BY AGENCY
Five-Year History (Continued)
AGENCY* 2016 2017 2018 2019 2020
VETERANS HOME 381 382 383 383 373
VETERANS SERVICES OFFICE 7 7 7 7 0
Total: 10,142 10,100 10,283 10,166 10,437
* Includes both filled and vacant classified full-time permanent positions as of June 30th of each fiscal year.
* This report reflects data in NH FIRST on the date the report is generated; historic data will change from year to year due to transactions processed after June 30th.
* This report does not contain 1 positions found in error in FY20.
Report Generated: 7/21/2020 for data as of 6/30/2020 by Position Matrix Version V6.2
FULL-TIME SEASONAL POSITIONS BY AGENCY
Five-Year History
AGENCY* 2016 2017 2018 2019 2020
ENVIRONMENTAL SERVICES DEPT 46 46 46 46 46
FISH AND GAME DEPT 3 3 4 4 4
NATURAL & CULT RESOURCES DEPT 768 798 843 870 870
SAFETY DEPT 0 28 29 29 29
TRANSPORTATION DEPT 1 1 1 172 190
Total 818 876 923 1,121 1,159
* Includes classified temporary full-time seasonal positions as of June 30th
of each fiscal year.
* This report reflects data in NH FIRST on the date the report is generated; historic data will change from year to year due to transactions processed after June 30th.
* This report does not contain 1 positions found in error in FY20.
Report Generated: 7/21/2020 for data as of 6/30/2020 by Position Matrix V6.2

45
FULL-TIME TEMPORARY POSITIONS BY AGENCY Five-Year History
AGENCY* 2016 2017 2018 2019 2020
ADMINISTRATIVE SERVICES DEPT 10 10 10 12 11
CORRECTIONS DEPT 0 1 1 3 3
EDUCATION DEPT 5 7 7 10 11
EMPLOYMENT SECURITY DEPT 27 24 10 13 22
ENVIRONMENTAL SERVICES DEPT 5 6 11 11 21
FISH AND GAME DEPT 6 6 6 6 6
HHS: BEHAVIORAL HEALTH DIV 1 1 1 8 12
HHS: COMM-BASED CARE SVCS DIV 0 1 1 1 1
HHS: COMMISSIONER'S OFFICE 7 7 16 15 18
HHS: HUMAN SERVICES DIV 14 14 14 14 14
HHS: MEDICAID & BUS POLICY OFC 0 0 0 1 3
HHS: NH HOSPITAL 43 43 46 46 47
HHS: PUBLIC HEALTH DIV 13 23 24 35 50
HHS: TRANSITIONAL ASSIST DIV 1 27 27 40 41
INFORMATION TECHNOLOGY DEPT 1 2 2 2 4
JUSTICE DEPT 4 4 4 6 7
LIQUOR COMMISSION 24 26 2 2 3
LOTTERY COMMISSION 1 1 0 0 0
MILITARY AFFRS & VET SVCS DEPT 0 0 0 0 2
NATURAL & CULT RESOURCES DEPT 32 28 32 47 49
PROF LICENSURE & CERT OFFICE 2 2 2 3 3
PUBLIC UTILITIES COMMISSION 0 0 1 1 1
SAFETY DEPT 11 13 16 15 17
STATE DEPT 3 3 3 4 4
TRANSPORTATION DEPT 26 165 154 120 120
VETERANS HOME 17 28 29 0 0
VETERANS SERVICES OFFICE 0 0 0 2 0
Total 253 442 419 417 470
* Includes classified temporary full-time positions as of June 30th
of each fiscal year.
* This report reflects data in NH FIRST on the date the report is generated; historic data will change from year to year due to transactions processed after June 30th.
* This report does not contain 1 positions found in error.
Report Generated: 7/21/2020 for data as of 6/30/2020 by Position Matrix V6.2

46

47
TURNOVER AND SEPARATION FROM SERVICE

48
TURNOVER Separations from Classified Service
10 Year History
* Turnover is calculated as the number of employees who left full-time state service divided by the number of positions in NH FIRST on the end date of the time period analyzed. Movement within and between state agencies is not considered turnover for the purposes of this report.
* Includes classified full-time permanent and full-time temporary positions expected to last more than 6 months and employee separations for classified full-time permanent and full-time temporary employees working more than 6 months.
Report Generated: 6/30/2020 for data as of 6/30/2020 data using Position Matrix V6.2
8%
11%
8%
9%
10% 10%
9%
8%
9%
8%
0%
2%
4%
6%
8%
10%
12%
2011 2012 2013 2014 2015 2016 2017 2018 2019 2020

49
TURNOVER OF CLASSIFIED EMPLOYEES Fiscal Year 2020
Statewide Turnover Rate = 8.4%
Job Classifications with 50 or more Full-Time Employees With Turnover Rates Greater or Equal to State Average Rate
Turnover Rate*
HIGHWAY MAINTAINER I 41.5%
RETAIL STORE CLERK II 24.2%
HIGHWAY MAINTAINER II 16.9%
CHILD PROTECTIVE SVC WKR II 14.7%
SUPERVISOR III 14.3%
CASH TERMINAL OPERATOR I 13.8%
CHILD PROTECTIVE SVC WKR III 13.3%
TOLL ATTENDANT I 13.3%
ADMINISTRATOR IV 12.6%
RETAIL STORE MANAGER II 11.9%
YOUTH COUNSELOR III DRC 11.3%
FAMILY SERVICES SPECIALIST I 10.8%
MENTAL HEALTH WORKER II 10.6%
CORRECTIONS CORPORAL 9.3%
CHILD PROTECTIVE SVC WKR I 9.3%
LICENSED NURSING ASST III 8/80 9.2%
CHILD SUPPORT OFFICER 8.9%
* Turnover is calculated as the number of employees who left full-time state service divided by the number of positions in NH FIRST on the end date of the time period analyzed. Movement within and between state agencies is not considered turnover for the purposes of this report.
* Includes classified full-time permanent and full-time temporary positions expected to last more than 6 months and employee separations for classified full-time permanent and full-time temporary employees working more than 6 months.
Report Generated: 6/30/2020 for data as of 6/30/2020 using Position Matrix V6.2

50
TURNOVER RATES BY AGENCY Fiscal Year 2020
AGENCY* # of Separations # of Positions Turnover Rate Change from FY 19
ADMINISTRATIVE SERVICES DEPT 23 309 7.4% 1.4%
AGRICULT, MARKETS & FOOD DEPT 2 36 5.6% -0.4%
BANKING DEPT 2 47 4.3% -4.7%
BUS & ECON AFFAIRS DEPT 5 61 8.2% -3.8%
CORRECTIONS DEPT 79 967 8.2% 0.2%
DEVELOPMENT DISABILITIES CNCL 0 3 0.0% 0.0%
EDUCATION DEPT 26 292 8.9% -2.1%
EMPLOYMENT SECURITY DEPT 10 272 3.7% -5.3%
ENVIRONMENTAL SERVICES DEPT 17 497 3.4% -2.6%
EXECUTIVE DEPT 2 15 13.3% 13.3%
FISH AND GAME DEPT 11 187 5.9% -0.1%
HHS: BEHAVIORAL HEALTH DIV 1 49 2.0% -4.0%
HHS: COMM-BASED CARE SVCS DIV 0 1 0.0% -18.0%
HHS: COMMISSIONER'S OFFICE 28 452 6.2% 1.2%
HHS: DEVELOPMENTAL SVCS DIV 3 52 5.8% -15.2%
HHS: ELDERLY & ADULT SVCS DIV 1 79 1.3% -11.7%
HHS: GLENCLIFF HOME 22 167 13.2% -1.8%
HHS: HUMAN SERVICES DIV 72 903 8.0% 0.0%
HHS: MEDICAID & BUS POLICY OFC 7 27 25.9% 23.9%
HHS: NH HOSPITAL 63 650 9.7% -1.3%
HHS: PUBLIC HEALTH DIV 13 285 4.6% -4.4%
HHS: TRANSITIONAL ASSIST DIV 42 487 8.6% -3.4%
HUMAN RIGHTS COMMISSION 1 9 11.1% -31.9%
INFORMATION TECHNOLOGY DEPT 14 353 4.0% -4.0%
INSURANCE DEPT 7 69 10.1% 4.1%
JUDICIAL COUNCIL 0 2 0.0% -50.0%
JUSTICE DEPT 6 66 9.1% -6.9%
LABOR DEPT 12 84 14.3% 6.3%
LIQUOR COMMISSION 48 342 14.0% 5.0%
LOTTERY COMMISSION 3 71 4.2% -3.8%
MILITARY AFFRS & VET SVCS DEPT 19 158 12.0% 0.0%
NATURAL & CULT RESOURCES DEPT 16 245 6.5% -0.5%
OFFICE OF CHILD ADVOCATE 0 4 0.0% 0.0%
PEASE DEVELOPMENT AUTHORITY 0 6 0.0% 0.0%
POLICE STDS & TRAINING COUNCIL 1 20 5.0% -5.0%
PROF LICENSURE & CERT OFFICE 9 70 12.9% -1.1%
PUBLIC EMPLOYEE LABOR REL BRD 0 4 0.0% 0.0%
PUBLIC UTILITIES COMMISSION 6 72 8.3% 0.3%
REVENUE ADMINISTRATION DEPT 6 122 4.9% -3.1%
SAFETY DEPT 102 1,125 9.1% 2.1%
STATE DEPT 4 76 5.3% 0.3%
TAX AND LAND APPEALS BOARD 0 4 0.0% 0.0%
TRANSPORTATION DEPT 171 1,642 10.4% -0.6%
TREASURY DEPT 4 18 22.2% 22.2%
VETERANS HOME
50 373 13.4% -2.6%
TOTAL 908 10,773 8.4% -0.6%
*Turnover is calculated as the number of employees who left full-time state service divided by the number of positions in NH FIRST on end date of the time period analyzed. Movement within and between state agencies is not considered turnover for the purposes of this report. *Includes classified full-time permanent and full-time temporary positions expected to last 6 months or more, and separated classified full-time permanent and full-time temporary employees working more than 6 months. This report does not include 1 positions found in error.
Report Generated: 9/23/2020 for position data as of 6/30/2020 using Position Matrix V6.2 and separations data for 7/01/2019-6/30/2020 (FY 2020) based on Employee Matrix V6.4

51
DISTRIBUTION OF SEPARATED EMPLOYEES BY LENGTH OF SERVICE*
Fiscal Year 2020
*Distribution percentage is calculated as the number of employees that left full-time state service in each length of service category divided by the total number of employees that left full-time state service during the time period analyzed.
*Includes classified full-time permanent employees and classified full-time temporary employees working more than 6 months.
Report Generated: 6/30/2020 for separations data for 7/01/2019-6/30/2020 (FY 2020) based on Employee Matrix V6.4
27%
18%
13%
11%
9%
9%
6%
8%
<2 Years 2-4 Years 5-9 Years 10-14 Years 15-19 Years 20-24 Years 25-29 Years 30+ Years

52
RATE OF SEPARATION BY LENGTH OF SERVICE
Fiscal Year 2020
Length of Service*
(Years) Number of
Separations Number of Employees
% Separated In FY 2020
Change from FY 2019
<2 Years 246 1,340 18% 3%
2-4 Years 166 1,723 10% -1%
5-9 Years 116 1,496 8% 1%
10-14 Years 99 1,355 7% 0%
15-19 Years 78 1,211 6% -3%
20-24 Years 78 843 9% 0%
25-29 Years 54 436 12% 0%
30+ Years 71 501 14% -3%
* Separation rate is calculated by using the number of employees who left full-time state service divided by the number of employees in that length of service category in NH FIRST on the end date of the time period analyzed. * Number of Separations and Number of Employees includes classified full-time permanent and full-time temporary employees working more than 6 months only.
Report Generated: 6/30/2020 for separations data for 7/01/2019-6/30/2020 (FY 2020) based on Employee Matrix V6.4. Employee counts generated 6/30/2020

53
EMPLOYEE SEPARATION FROM SERVICE BY REASON
Fiscal Year 2020
*Distribution percentage is calculated as the number of employees that left full-time state service in each reason code category divided by the total number of employees that left full-time state service during the time period analyzed.
*Includes classified full-time permanent employees and classified full-time temporary employees working more than 6 months.
Report Generated: 6/30/2020 for separations data for 7/01/2019-6/30/2020 (FY 2020) based on Employee Matrix V6.4
2%
56%
3%
34%
1%4%
Death Personal Reasons Medical Retirement Other Termination for Cause

54

55
VACANCY

56
VACANCY RATE FOR FULL-TIME POSITIONS BY AGENCY Fiscal Year 2020
AGENCY* # of Positions # of Vacancies Vacancy Rate
ADMINISTRATIVE SERVICES DEPT 309 42 14%
AGRICULT, MARKETS & FOOD DEPT 36 2 6%
BANKING DEPT 47 8 17%
BUS & ECON AFFAIRS DEPT 61 6 10%
CORRECTIONS DEPT 967 191 20%
DEVELOPMENT DISABILITIES CNCL 3 0 0%
EDUCATION DEPT 292 67 23%
EMPLOYMENT SECURITY DEPT 272 46 17%
ENVIRONMENTAL SERVICES DEPT 497 82 16%
EXECUTIVE DEPT 15 2 13%
FISH AND GAME DEPT 187 16 9%
HHS: BEHAVIORAL HEALTH DIV 49 9 18%
HHS: COMM-BASED CARE SVCS DIV 1 1 100%
HHS: COMMISSIONER'S OFFICE 452 61 13%
HHS: DEVELOPMENTAL SVCS DIV 52 10 19%
HHS: ELDERLY & ADULT SVCS DIV 79 2 3%
HHS: GLENCLIFF HOME 167 22 13%
HHS: HUMAN SERVICES DIV 903 143 16%
HHS: MEDICAID & BUS POLICY OFC 27 8 30%
HHS: NH HOSPITAL 650 130 20%
HHS: PUBLIC HEALTH DIV 285 40 14%
HHS: TRANSITIONAL ASSIST DIV 487 101 21%
HUMAN RIGHTS COMMISSION 9 3 33%
INFORMATION TECHNOLOGY DEPT 353 38 11%
INSURANCE DEPT 69 8 12%
JUDICIAL COUNCIL 2 0 0%
JUSTICE DEPT 66 8 12%
LABOR DEPT 84 17 20%
LIQUOR COMMISSION 342 25 7%
LOTTERY COMMISSION 71 9 13%
MILITARY AFFRS & VET SVCS DEPT 158 32 20%
NATURAL & CULT RESOURCES DEPT 245 56 23%
OFFICE OF CHILD ADVOCATE 4 1 25%
PEASE DEVELOPMENT AUTHORITY 6 1 17%
POLICE STDS & TRAINING COUNCIL 20 1 5%
PROF LICENSURE & CERT OFFICE 70 14 20%
PUBLIC EMPLOYEE LABOR REL BRD 4 0
0%
PUBLIC UTILITIES COMMISSION 72 9
13%
REVENUE ADMINISTRATION DEPT 122 14 11%
SAFETY DEPT 1,125 124 11%
STATE DEPT 76 22 29%
TAX AND LAND APPEALS BOARD 4 0 0%
TRANSPORTATION DEPT 1,642 210 13%
TREASURY DEPT 18 4 22%
VETERANS HOME
373 86 23%
TOTAL 10,773 1,671 16% *Includes classified full-time permanent, and full-time temporary positions expected to last more than 6 months. *Vacancy Rate = Total number of vacancies divided by total number of positions. This report does not contain 1 position found in error.
Report Generated: 7/21/2020 for data as of 6/30/2020 by Position Matrix V6.2

57
VACANT FULL-TIME POSITIONS ON JUNE 30, 2020 BY NUMBER OF DAYS VACANT
AGENCY*
# of Vacancies with Date
# Vacant
<=30 Days
# Vacant
>30-60 Days
# Vacant
>60-90 Days
# Vacant
>90-240 Days
# Vacant > 240 Days
ADMINISTRATIVE SERVICES DEPT 42 1 3 0 15 23
AGRICULT, MARKETS & FOOD DEPT 2 0 0 0 1 1
BANKING DEPT 8 0 0 0 3 5
BUS & ECON AFFAIRS DEPT 6 0 2 1 1 2
CORRECTIONS DEPT 191 11 24 27 70 59
EDUCATION DEPT 67 2 3 1 18 43
EMPLOYMENT SECURITY DEPT 46 1 1 2 14 28
ENVIRONMENTAL SERVICES DEPT 82 4 1 4 31 42
EXECUTIVE DEPT 2 0 1 0 1 0
FISH AND GAME DEPT 16 0 1 1 6 8
HHS: BEHAVIORAL HEALTH DIV 9 0 0 0 7 2
HHS: COMM-BASED CARE SVCS DIV 1 0 1 0 0 0
HHS: COMMISSIONER'S OFFICE 61 6 3 3 26 23
HHS: DEVELOPMENTAL SVCS DIV 10 0 2 1 2 5
HHS: ELDERLY & ADULT SVCS DIV 2 0 1 0 1 0
HHS: GLENCLIFF HOME 22 2 4 2 9 5
HHS: HUMAN SERVICES DIV 143 10 10 52 36 35
HHS: MEDICAID & BUS POLICY OFC 8 0 0 0 3 5
HHS: NH HOSPITAL 130 3 15 10 29 73
HHS: PUBLIC HEALTH DIV 40 1 10 6 8 15
HHS: TRANSITIONAL ASSIST DIV 101 8 5 3 31 54
HUMAN RIGHTS COMMISSION 3 0 1 0 2 0
INFORMATION TECHNOLOGY DEPT 38 1 2 3 11 21
INSURANCE DEPT 8 0 0 0 4 4
JUSTICE DEPT 8 0 0 1 6 1
LABOR DEPT 17 0 1 0 9 7
LIQUOR COMMISSION 25 3 8 9 3 2
LOTTERY COMMISSION 9 0 0 1 5 3
MILITARY AFFRS & VET SVCS DEPT 32 1 1 1 13 16
NATURAL & CULT RESOURCES DEPT 56 2 1 1 26 26
OFFICE OF CHILD ADVOCATE 1 0 0 0 1 0
PEASE DEVELOPMENT AUTHORITY 1 0 0 0 0 1
POLICE STDS & TRAINING COUNCIL 1 0 0 0 1 0
PROF LICENSURE & CERT OFFICE 14 1 1 2 8 2
PUBLIC UTILITIES COMMISSION 9 0 1 0 5 3
REVENUE ADMINISTRATION DEPT 14 2 0 2 8 2
SAFETY DEPT 124 16 12 19 55 22
STATE DEPT 22 0 0 2 5 15
TRANSPORTATION DEPT 210 16 19 16 84 75
TREASURY DEPT 4 0 1 0 2 1
VETERANS HOME 86 3 3 6 18 56
Total 1,671 94 138 176 578 685 *Includes classified full-time permanent and full-time temporary positions expected to last more than 6 months. This report does not contain 1 position found in error.
Report Generated: 7/21/2020 for data as of 6/30/2020 by Position Matrix V6.2

58
VACANT POSITIONS ON JUNE 30, 2020 BY NUMBER OF DAYS VACANT BY POSITION TYPE
POSITION* # Vacant with Date
# Vacant <= 30 days
# Vacant >30-60 days
# Vacant >60-90 days
# Vacant >90-240
days
# Vacant >240 days
FULL-TIME 1,468 93 128 165 543 539
FULL-TIME TEMPORARY 203 1 10 11 35 146
Total 1,671 94 138 176 578 685
% of TOTAL 6% 8% 11% 35% 41%
*Includes classified full-time permanent and full-time temporary positions expected to last more than 6 months. This report does not contain 1 position found in error.
Report Generated: 7/21/2020 for data as of 6/30/2020 by Position Matrix V6.2
VACANCY RATE ON JUNE 30, 2020 BY POSITION TYPE
POSITION* Number of Positions
Number of Vacancies
Vacancy Rate (%)
FULL-TIME 10,437 1,468 14%
FULL-TIME TEMPORARY 336 203 60%
Total 10,773 1,671 16%
*Includes classified full-time permanent and full-time temporary positions expected to last more than 6 months. *Vacancy Rate = Total number of vacancies divided by total number of positions. This report does not contain 1 positions found in error.
Report Generated: 7/21/2020 for data as of 6/30/2020 by Position Matrix V6.2

59
RETIREMENT ELIGIBILITY

60
EXECUTIVE BRANCH - GROUP 1 EMPLOYEES Estimate of Current and Future Eligibility for Retirement & State Health
Insurance Benefit 8,266 Employees* - Based on Current Employees as of 6/30/2020
As of July 1: 2020 % of Total
Pop 2021
% of Total Pop
Eligible Age 65+ (with health ins ben)
202 2% 256 3%
Eligible Age 65+ (w/o health ins ben)
228 3% 300 4%
Eligible Age 60+ (with health ins ben)
429 5% 471 6%
Eligible Age 60+ (w/o health ins ben)
251 3% 272 3%
Early Eligible - 70 rule (with health ins ben)
315 4% 294 4%
Early Eligible - 70 rule (w/o health ins ben)
701 8% 749 9%
Early Eligible - Age 50-59 (with health ins ben)
0 0% 0 0%
Early Eligible - Age 50-59 (w/o health ins ben)
809 10% 756 9%
Total Eligible 2,935 36% 3,097 37%
"Likely to Retire" 65+ or 60+ with health ins ben
859 10% 1,026 12%
*Includes full-time and full-time temporary classified and unclassified employees expected to work more than 6 months. Employees are counted in only the first eligibility group that they qualify for top-to-bottom, even if they qualify under more than category (e.g., employees who qualify under both Early Eligibility Rules are only counted in the “70 Rule” category).
Report generated 7/21/2020 based on employee data for 6/30/2020 by Employee Matrix V6.4 for FY 2020; Report generated 10/28/2020 to estimate eligibility as of July 1, 2021.

61
EXECUTIVE BRANCH - GROUP 1 EMPLOYEES
Estimate of Current Eligibility for Retirement By Agency as of July 1, 2020 8,266 Employees* - Based on Current Employees as of: 6/30/2020
AGENCY
% Eligible 65+
% Elig 60+ w/ health
benefit
% Elig 60+ w/o health
benefit
% Early Eligible 70 Rule
% Early Eligible 50-59
Total % Eligible
% "Likely"
ADMINISTRATIVE SERVICES DEPT
5% 6% 5% 10% 11% 38% 12% AGRICULT, MARKETS & FOOD DEPT
0% 11% 3% 11% 13% 37% 11% BANKING DEPT 5% 0% 0% 2% 17% 24% 5% BUS & ECON AFFAIRS DEPT 12% 2% 2% 7% 12% 34% 14% CORRECTIONS DEPT 7% 4% 4% 12% 13% 40% 11% DEVELOPMENT DISABILITIES CNCL
0% 0% 0% 0% 0% 0% 0% EDUCATION DEPT 6% 7% 4% 8% 5% 30% 13% EMPLOYMENT SECURITY DEPT
11% 9% 6% 12% 13% 51% 21% ENVIRONMENTAL SERVICES DEPT
6% 9% 3% 18% 8% 43% 15% EXECUTIVE COUNCIL 0% 0% 0% 0% 0% 0% 0% EXECUTIVE DEPT 13% 7% 0% 7% 7% 33% 20% FISH AND GAME DEPT 3% 6% 4% 22% 6% 42% 9% HHS: BEHAVIORAL HEALTH DIV
9% 7% 0% 12% 9% 37% 16% HHS: COMM-BASED CARE SVCS DIV
0% 0% 0% 100% 0% 100% 0% HHS: COMMISSIONER'S OFFICE
7% 5% 3% 18% 11% 43% 12% HHS: DEVELOPMENTAL SVCS DIV
7% 9% 0% 13% 13% 42% 16% HHS: ELDERLY & ADULT SVCS DIV
10% 8% 1% 8% 19% 46% 18% HHS: GLENCLIFF HOME 6% 4% 3% 10% 8% 30% 10% HHS: HUMAN SERVICES DIV 3% 3% 2% 10% 7% 26% 6% HHS: MEDICAID & BUS POLICY OFC
22% 9% 0% 9% 4% 43% 30% HHS: NH HOSPITAL 3% 4% 3% 10% 10% 30% 7% HHS: PUBLIC HEALTH DIV 5% 4% 2% 9% 11% 32% 9% HHS: TRANSITIONAL ASSIST DIV
4% 2% 2% 9% 8% 25% 6% HUMAN RIGHTS COMMISSION 0% 0% 0% 0% 0% 0% 0% INFORMATION TECHNOLOGY DEPT
9% 9% 4% 12% 14% 47% 17% INSURANCE DEPT 17% 5% 1% 7% 15% 45% 23% JUDICIAL COUNCIL 0% 0% 0% 33% 0% 33% 0% JUSTICE DEPT 8% 5% 2% 7% 5% 26% 12% LABOR DEPT 1% 4% 6% 7% 16% 35% 6% LIQUOR COMMISSION 2% 2% 2% 9% 8% 22% 4% LOTTERY COMMISSION 2% 2% 6% 11% 10% 31% 3% MILITARY AFFRS & VET SVCS DEPT
4% 6% 5% 11% 15% 41% 11% NATURAL & CULT RESOURCES DEPT
5% 7% 2% 14% 12% 40% 12% OFFICE OF CHILD ADVOCATE 0% 0% 0% 0% 0% 0% 0% PEASE DEVELOPMENT AUTHORITY
33% 0% 33% 0% 0% 67% 33% POLICE STDS & TRAINING COUNCIL
14% 14% 0% 21% 7% 57% 29% PROF LICENSURE & CERT OFFICE
16% 2% 2% 7% 9% 35% 18%
PUBLIC EMPLOYEE LABOR REL BRD
0% 25% 25% 0% 25% 75% 25% PUBLIC UTILITIES COMMISSION
7% 7% 3% 11% 14% 43% 14% REVENUE ADMINISTRATION DEPT
1% 4% 2% 18% 10% 36% 6% SAFETY DEPT 4% 7% 3% 10% 10% 33% 10% STATE DEPT 17% 11% 2% 11% 13% 53% 28% TAX AND LAND APPEALS BOARD
43% 14% 0% 0% 14% 71% 57% TRANSPORTATION DEPT 5% 5% 3% 18% 10% 40% 9% TREASURY DEPT 6% 11% 11% 11% 11% 50% 17% VETERANS HOME 4% 2% 6% 4% 9% 25% 6% TOTAL 5% 5% 3% 12% 10% 36% 10%
* Includes full-time and full-time temporary classified and unclassified employees expected to work more than 6 months. Employees are counted in only first eligibility group that they qualify for left-to-right, even if they qualify under more than one category (e.g. , employees who qualify under both Early Eligibility Rules are only counted in the “70 Rule” category).
Report generated 6/30/2020 based on employee data as of 6/30/2020 by Employee Matrix V6.4 for FY 2020; Report generated 10/28/2020 to estimate eligibility as of July 1, 2021.

62
EXECUTIVE BRANCH - GROUP 1 EMPLOYEES
Estimate of Future Eligibility for Retirement By Agency as of July 1, 2021 8,266 Employees* - Based on Current Employees as of: 6/30/2020
AGENCY
% Eligible 65+
% Elig 60+ w/ health
benefit
% Elig 60+ w/o health
benefit
% Early Eligible
70 Rule
% Early Eligible 50-59
Total % Eligible
% "Likely"
ADMINISTRATIVE SERVICES DEPT
8% 8% 5% 9% 9% 39% 16%
AGRICULT, MARKETS & FOOD DEPT
3% 14% 3% 5% 14% 38% 16%
BANKING DEPT 5% 2% 2% 5% 14% 29% 7%
BUS & ECON AFFAIRS DEPT 14% 4% 0% 9% 12% 39% 18%
CORRECTIONS DEPT 10% 8% 5% 11% 10% 43% 17%
DEVELOPMENT DISABILITIES CNCL
0% 0% 0% 0% 0% 0% 0%
EDUCATION DEPT 7% 7% 4% 8% 3% 29% 13%
EMPLOYMENT SECURITY DEPT
14% 8% 6% 13% 15% 56% 22%
ENVIRONMENTAL SERVICES DEPT
8% 8% 3% 19% 8% 47% 16%
EXECUTIVE COUNCIL 0% 0% 0% 0% 0% 0% 0%
EXECUTIVE DEPT 14% 7% 0% 7% 7% 36% 21%
FISH AND GAME DEPT 5% 6% 3% 21% 8% 44% 12%
HHS: BEHAVIORAL HEALTH DIV
9% 7% 2% 11% 9% 39% 16%
HHS: COMM-BASED CARE SVCS DIV
0% 0% 0% 100% 0% 100% 0%
HHS: COMMISSIONER'S OFFICE
8% 8% 4% 17% 9% 46% 15%
HHS: DEVELOPMENTAL SVCS DIV
7% 11% 0% 11% 13% 41% 17%
HHS: ELDERLY & ADULT SVCS DIV
14% 3% 1% 10% 19% 48% 17%
HHS: GLENCLIFF HOME 7% 4% 2% 10% 7% 31% 11%
HHS: HUMAN SERVICES DIV 4% 3% 1% 11% 7% 27% 7%
HHS: MEDICAID & BUS POLICY OFC
22% 9% 0% 17% 4% 52% 30%
HHS: NH HOSPITAL 4% 5% 3% 9% 8% 30% 9%
HHS: PUBLIC HEALTH DIV 8% 5% 2% 8% 10% 33% 13%
HHS: TRANSITIONAL ASSIST DIV
4% 2% 3% 8% 9% 27% 7%
HUMAN RIGHTS COMMISSION 0% 0% 0% 0% 0% 0% 0%
INFORMATION TECHNOLOGY DEPT
11% 9% 5% 14% 11% 49% 19%
INSURANCE DEPT 15% 3% 5% 8% 10% 41% 18%
JUDICIAL COUNCIL 0% 0% 0% 33% 0% 33% 0%
JUSTICE DEPT 10% 4% 1% 7% 5% 26% 13%
LABOR DEPT 1% 6% 7% 9% 13% 36% 7%
LIQUOR COMMISSION 2% 3% 4% 10% 6% 25% 5%
LOTTERY COMMISSION 3% 5% 6% 9% 9% 32% 8%
MILITARY AFFRS & VET SVCS DEPT
5% 6% 5% 13% 13% 42% 12%
NATURAL & CULT RESOURCES DEPT
9% 7% 1% 14% 12% 43% 16%
OFFICE OF CHILD ADVOCATE 0% 0% 0% 0% 0% 0% 0%
PEASE DEVELOPMENT AUTHORITY
33% 0% 33% 0% 33% 100% 33%
POLICE STDS & TRAINING COUNCIL
8% 17% 0% 25% 8% 58% 25%
PROF LICENSURE & CERT OFFICE
14% 5% 2% 5% 8% 32% 18%
PUBLIC EMPLOYEE LABOR REL BRD
0% 25% 25% 0% 25% 75% 25%
PUBLIC UTILITIES COMMISSION
13% 6% 0% 10% 13% 42% 19%
REVENUE ADMINISTRATION DEPT
2% 7% 2% 18% 10% 38% 9%
SAFETY DEPT 5% 7% 3% 12% 10% 36% 12%
STATE DEPT 19% 11% 3% 17% 5% 55% 30%
TAX AND LAND APPEALS BOARD
43% 14% 0% 0% 14% 71% 57%
TRANSPORTATION DEPT 6% 6% 4% 18% 10% 43% 11%
TREASURY DEPT 6% 11% 11% 11% 11% 50% 17%
VETERANS HOME 8% 2% 5% 6% 9% 30% 10% TOTAL 7% 6% 3% 13% 9% 37% 12% * Includes full-time and full-time temporary classified, unclassified, and non-classified employees expected to work more than 6 months. Employees are counted in only first eligibility group that they qualify for left-to-right, even if they qualify under more than one category (e.g. , employees who qualify under both Early Eligibility Rules are only counted in the “70 Rule” category).
Report generated 7/21/2020 based on employee data as of 6/30/2020 by Employee Matrix V6.4 for FY 2020; Report generated 10/28/2020 to estimate eligibility as of July 1, 2021.

63
EXECUTIVE BRANCH - GROUP 2 EMPLOYEES Estimate of Future Eligibility for Retirement & State Health Insurance Benefit
1,163 Employees - Based on Current Employees as of: 6/30/2020
As of July 1: 2020 % of Total Pop 2021 % of Total Pop
Eligible Age 60+ (with health ins ben)
42 3.6% 47 4.0%
Eligible Age 60+ (without health ins ben)
18 1.5% 23 2.0%
Eligible Age 45+ with 20+ YFS (with health ins ben)
129 11.1% 175 15.0%
Eligible Age 46-52.5 with 25+ YFS (with health ins ben)
0 0.0% 0 0.0%
Eligible Age 50-52.5 with 25+ YFS (without health ins ben)
0 0.0% 0 0.0%
Total Eligible & "Likely" (with health benefit)
171 14.7% 222 19.1%
*Includes full-time and full-time temporary classified and unclassified employees expected to work more
than 6 months. “YFS” = years of full-time service.
Report generated 7/21/2020 based on employee data as of 6/30/2020 by Employee Matrix V6.4

64
EXECUTIVE BRANCH - GROUP 2 EMPLOYEES Estimate of Current Eligibility for Retirement as of July 1, 2020
1,163 Employees* - Based on Current Employees as of: 6/30/2020
AGENCY
Eligible Age 45+ with 20+
YFS (with health
ins ben)
Eligible Age 46-52.5 with
25+ YFS (with health
ins ben)
Eligible Age 60+
(with health ins ben)
Eligible Age 60+
(without health ins
ben)
Total Eligible & "Likely"
(with health benefit)
ADJUTANT GENERAL'S DEPT 0 0 0 0 0
CORRECTIONS DEPT 76 0 38 15 114
FISH AND GAME DEPT 6 0 1 0 7
LIQUOR COMMISSION 0 0 0 0 0
NATURAL & CULT RESOURCES DEPT
3 0 0 0 3
PEASE DEVELOPMENT AUTHORITY
0 0 1 0 1
POLICE STDS & TRAINING COUNCIL
1 0 1 0 2
SAFETY DEPT 43 0 1 3 44
TOTAL 129 0 42 18 171
* Includes full-time and full-time temporary classified and unclassified employees expected to work more than 6 months. “YFS” = years of full-time service
Report generated based on employee data as of 6/30/2020 by Employee Matrix V6.4
EXECUTIVE BRANCH - GROUP 2 EMPLOYEES
Estimate of Future Eligibility for Retirement as of July 1, 2021 1,163 Employees* - Based on Current Employees as of: 6/30/2020
AGENCY
Eligible Age 45+ with 20+
YFS (with health
ins ben)
Eligible Age 46-52.5 with
25+ YFS (with health
ins ben)
Eligible Age 60+
(with health ins ben)
Eligible Age 60+
(without health ins
ben)
Total Eligible & "Likely"
(with health benefit)
ADJUTANT GENERAL'S DEPT 0 0 0 0 0
CORRECTIONS DEPT 118 0 40 20 158
FISH AND GAME DEPT 7 0 1 0 8
LIQUOR COMMISSION 0 0 0 0 0
NATURAL & CULT RESOURCES DEPT
4 0 0 0 4
PEASE DEVELOPMENT AUTHORITY
0 0 1 0 1
POLICE STDS & TRAINING COUNCIL
1 0 1 0 2
SAFETY DEPT 45 0 4 3 49
TOTAL 175 0 47 23 222
* Includes full-time and full-time temporary classified and unclassified employees expected to work more than 6 months. “YFS” = years of full-time service
Report generated based on employee data as of 6/30/2020 by Employee Matrix V6.4

65
DIVISION OF PERSONNEL WORK ACTIVITIES

66
RECRUITMENT AND CERTIFICATION UNIT
The Recruitment and Certification Unit is responsible for performing the following functions:
o Increase the State’s visibility and promote the State of New Hampshire as an employer by implementing recruitment strategies, including but not limited to maintaining a social media presence and promoting the State’s internship programs.
o Inform the public concerning job and career opportunities within the Executive Branch of state government by maintaining the state’s online Job Opportunities page.
o Develop effective performance measures and reports to determine if recruitment
strategies are meeting agency needs.
o Research recruitment best practices and analyze reports and studies to determine best practices as guidance to agencies and human resource staff.
o Manage and coordinate upgrades of the Talent Acquisition module within NH FIRST
including the creating recruitment reports and oversight of the recruitment-landing page.
o Advise, train and assist State agencies’ Human Resource staff with the position posting process. Plan, develop, organize and conduct training sessions to instruct agency human resource personnel to in the creating job requisitions, posting positions, certification of completed applications, hiring processes, and the interpretation of the recruitment and selection standards in the personnel rules to maintain consistency across all state agencies.
o Ensure consistency in the interpretation and evaluation of minimum qualifications in the
evaluation of applications and meeting statewide certification standards. o Consult regarding proposed revisions to agency and statewide minimum qualification
requirements.
o Assists in the development of policy and procedural revisions based upon interpretations of new laws and executive orders in the area of recruitment and selection.
Under the Personnel Rules, a full-time internal job opening within the Executive Branch classified personnel system is posted for a minimum period of five business days and the internal opening is available to all classified state employees (Per 402.01). If no qualified candidates apply or a candidate is not selected during the internal posting process, the position is opened to the public as an external posting (Per 404.01). State employees may also apply during the external recruitment process. The numbers depicted in the following tables display only those positions posted in the State Online Recruitment System. The Personnel Rules do not mandate a posting period for part-time or temporary seasonal positions, and the number of applications does not include candidates that completed paper job applications outside of the State Online Recruitment System.

67
RECRUITMENT OF FULL-TIME AND PART-TIME POSITIONS BY AGENCY Fiscal Year 2020
AGENCY Internal
Postings External Postings
Full-Time Postings
Part-Time Postings
Total Job Postings
Total Applications
Received*
Administrative Services Dept. 57 43 60 40 100 571
Agriculture Department 14 8 18 4 22 175
Banking Department 6 3 9 0 9 108
Business & Economic Affairs 40 34 22 52 74 398
Corrections Department 152 79 205 26 231 1,483
Development Disabilities Council 2 2 0 4 4 23
Education Department 80 53 121 12 133 1,047
Employment Security 67 37 68 36 104 672
Environmental Services Dept. 75 35 104 6 110 567
Executive Department 2 1 3 0 3 8
Fish and Game Department 33 17 32 18 50 398
Health & Human Services Dept. 1,003 676 1,499 180 1,679 12,405
Human Rights Commission 3 1 4 0 4 111
Information Technology Dept. 62 37 89 10 99 518
Insurance Department 28 21 49 0 49 316
Justice Department 15 6 13 8 21 152
Labor Department 24 14 32 6 38 279
Liquor Commission 192 67 142 117 259 1,919
Lottery Commission 13 9 20 2 22 301
Military Affairs and Veterans Svs.
34 28 60 2 62 416
Natural & Cultural Resources 51 46 56 41 97 688
Office of Child advocate 3 2 3 2 5 39
Police Standards & Training 3 2 5 0 5 36
Prof Licensure and Cert. Office 27 15 27 15 43 334
Public Utilities Commission 15 14 29 0 29 98
Revenue Administration Dept. 22 10 32 0 32 142
Safety Department 260 167 254 173 427 3,960
State Department 11 5 12 4 16 138
Tax and Land Appeals Board 1 1 0 2 2 11
Transportation Department 381 259 556 84 640 2,186
Treasury Department 6 0 6 0 6 39
Veterans Home 88 69 107 50 157 487
Total 2,770 1,762 3,637 895 4,532 30,026
*Information reflects NH FIRST applications only.

68
RECRUITMENT OF FULL-TIME AND PART-TIME POSITIONS BY MONTH Fiscal Year 2020
RECRUITMENT OF FULL-TIME AND PART-TIME POSITIONS BY OCCUPATIONAL CATEGORY
Fiscal Year 2020
Month Internal
Postings External Postings
Full-Time Postings
Part-Time Postings
Total Job Postings
Total Applications*
July 252 139 324 67 391 2,703
August 250 160 324 86 410 2,991
September 231 136 292 75 367 2,666
October 275 179 365 89 454 3,329
November 226 157 286 97 383 2,040
December 275 184 363 96 459 2,592
January 302 172 375 99 474 3,312
February 266 164 337 93 430 3,636
March 267 191 366 92 458 2,226
April 92 61 135 18 153 1,033
May 157 115 236 36 272 1,362
June 177 104 234 47 281 2,135
Total 2,770 1,762 3,637 895 4,532 30,026
*Information reflects NH FIRST applications only.
Occupational Category Internal
Postings External Postings
Full-Time Postings
Part-Time Postings
Total Job Postings
Total Applications*
Administrative Support 539 292 495 336 831 7,470
Enforcement Protection & Institution
324 190 470 44 514 3,276
Labor & Trade 514 389 692 211 903 3,177
Other 28 28 38 18 56 443
Professional & Managerial 1,240 782 1,777 245 2,022 14,478
Technical 125 81 165 41 206 1,181
Total 2,770 1,762 3,637 895 4,532 30,026
*Information reflects NH FIRST applications only.

69
CANDIDATE REFERRAL BY SOURCE Fiscal Year 2020
SOURCE # OF APPLICATIONS*
Attached From a Different Requisition 142
Career Fair / Job Fair 458
Current State Employee 2,658
Facebook.com 360
In-House Posting 5850
Indeed.com 10,458
LinkedIn.com 748
Newspaper 166
Division of Personnel 6,512
Radio 91
Other 2,583
TOTAL APPLICATIONS RECEIVED 30,026
*Information reflects NH FIRST applications only.
RECRUITMENT ACTIVITIES CONDUCTED IN FISCAL YEAR 2020
Recruitment and Certification continued to work with DAS’ Financial Data Management (FDM) division to improve the applicant experience by removing application barriers in the online job posting and application process. Additional messaging was added to the recruitment website to assist the applicant in completing the registration process and the requirements needed to successfully complete the online application. Process improvement efforts have reduced the number of paper applications received, led to faster processing of applications, and facilitated hiring. A major improvement in FY 2020 was separating the recruitment landing page from NH FIRST. This ensures that the recruitment page remains live even when NH FIRST is not available and allows the Division of Personnel to make updates as necessary without modifying NH FIRST. This change ensures that the most current information is available and makes it easier for users by mirroring the format of other DAS web pages. Additionally, the Recruitment Unit enhanced its web presence by reducing the number of clicks to the job opportunities page. In FY 2020, the State entered into a Memo of Agreement with the NH National Guard and Reserve ensuring that any member of the NH National Guard and Reserve who meets the minimum qualifications of the position that they are applying to will receive the opportunity to interview as a candidate for the position. Similarly, the State continued with the U.S. Army PaYS Program (Program for Youth Support), where future soldiers and ROTC cadets are guaranteed a job interview upon meeting certification requirements when applying to the State. The PaYS Program is a partnership between the new Army soldier and the State of New Hampshire after completing their first tour of duty with the Army, and receiving an honorable discharge. The PaYS program is an enlistment option and recruiting initiative for first time enlistees. The soldier’s MOS (Military Occupational Specialties) are matched to the State’s classification job description that best meets the requirements of the equal position. This ensures that the education and experience the soldier acquires during their term of enlistment

70
satisfies the minimum qualifications of the position with the State of New Hampshire. This program is not available to soldiers who have chosen to reenlisted and then separated from the U.S. Army. Recruitment continued to maintain the State recruitment social media presence on Linked In, Handshake (a college career platform), and Indeed, following DOIT Policy on Social Media.
In FY 2020, DOP began communications with Employers of National Service regarding
partnership. Employers of National Service is an initiative to connect employers with alumni of
civilian service programs of the Corporation for National and Community Service (CNCS),
Peace Corps, and their affiliates, to encourage increased consideration of program alumni for
state employment. Peace Corps Volunteers work at the grassroots level with local governments, schools, communities, small businesses and entrepreneurs to develop sustainable solutions that
address challenges in education, health, economic development, agriculture, environment and
youth development. When they return home, volunteers bring their knowledge and
experiences—and a global outlook—back to the United States that enriches the lives of those
around them.
As the Division of Personnel (DOP) moved forward with One Workforce, the DOP Recruitment Unit became part of Central HR Processing, connecting all the processes from modifying a position, to requesting to post a position, to requesting to hire in one unit. DOP also continued to work to better define and standardize the steps involved in the recruitment process, which reduces errors in submitted work units for recruitment and hiring. As part of the One Workforce initiative, DOP is defining clear HR roles or specialties, including that of Recruiter. In FY 2020, select agency HR personnel received additional training on recruitment functions, allowing agencies to conduct some HR functions previously handled by DOP. Selected agency HR staff taking on the Recruiter role take a competency test once they complete training to confirm that they have the knowledge to complete required tasks. The expansion of agency HR functions was essential to maintaining efficient operations during the COVID-19 pandemic and state hiring freeze.
EMPLOYEE REDUCTION IN FORCE (RIF) LIST
Effective July 1, 2019, the Legislature passed Chapter 346:171 relative to the rehiring of laid-off state employees. This legislation extended the definition of “laid off” to mean any person in a classified position as described in RSA 21-I:49 who receives written notice of the state’s intent to lay them off or who is laid off between July 1, 2019 and June 30, 2021, as a result of reorganization or downsizing of state government. This legislation mandates that any classified position that becomes available in a department or establishment, as defined in RSA 9:1, shall be filled, if possible, by a state employee laid off, as defined in paragraph I, if such person is not currently employed by the state of New Hampshire, if he or she meets the minimum qualifications for the position, and if they do not receive a promotion as a result of the rehire. The legislation also requires the appointing authority of each department or agency to submit names and classifications of individuals laid off to the Director of Personnel within 10 days of the layoff.

71
There were no actions that took place in connection with the Reduction in Force (RIF) List during Fiscal Year 2020.
REDUCTION IN FORCE ACTIONS Fiscal Year 2020
ACTION NUMBER
Individual Names Submitted to Personnel 0
Names Removed from RIF List:
Placement to State Agencies 0
Recalled/Re-employed by Agency 0
Declined Placement Services 0
Total Number of Names Removed 0
Number of Full Time Vacant Positions Submitted by Agencies 0
Total Number of Positions Released 0
Names Remaining on RIF List * 0
Note: The total number of names on the RIF List may include employees who have been re-employed on a continuing part-time basis at the agency from which they were originally laid off. Other names remaining on the RIF List may include individuals who have retired, are on Workers’ Compensation, or have set their own limitations to re-employment as a full-time employee due to location, salary requirements or other personal reasons.

72
CLASSIFICATION UNIT
The Classification and Compensation Unit is responsible for the development, review, maintenance, and revision of the classification and compensation plan for the State of New Hampshire. The Unit focuses on organizational alignment approaches that meet the unique needs of our state agencies as they develop, classify, and organize their diverse workforce while maintaining consistency and equity throughout the system. The Unit works in partnership with agency human resource staff in the following areas:
Labor market trends and wage analysis, including compensation surveys;
Research, analysis, data, tools, and structures related to position reclassifications and
organizational changes;
On-going development of select agency human resource staff’s competency in
classification related matters and organizational strategies;
Auditing of cases for agency applications of rules, policies, and procedures and ensuring
fair and equitable comparison analysis practices;
Salary analysis and research for reallocation, enhancement, or adjustment
recommendations; and
Modernizing and improving on state classification structures.
Additionally, the Classification Unit engages with the Central HR Processing for metrics, data, and analytics support; and to liaison with Financial Data Management and with the Department of Administrative Services’ Budget Office. Finally, the Classification Unit conducts and participates in various salary and position surveys on a national, regional, and local basis to share and stay abreast of US State Government Compensation trends. Analysts work in tandem with New Hampshire state agencies to review labor market information, educational and certification requirements, and industry changes for comparable state government positions. Additional updates to job titles are make to maintain alignment with national and regional data, with the Equal Employment Opportunity Commission, and with the Fair Labor Standards Act.
MODERNIZATION AND SYSTEM CHANGES: The Classification Unit continues to do extensive research to define proposed short- and long-term changes to the State Classification System. The Section is moving forward with the modernization of our classification system through small targeted and agency-focused projects. Improving alignment with federal taxonomy classification codes and simplifying title series and other classification title elements to mirror modernization efforts taken place in other states and at the Federal level are on the forefront of our goals when reviewing titles. Efforts continue to provide greater flexibility in title definitions and requirements to support recruitment efforts and to reduce the total number of titles, while maintaining equity in the statewide application of the classification system.

73
TECHNICAL ASSISTANCE, AUDITING, AND TRAINING:
The State continued to experience significant changes and turnover within the state human resources staff this year. As a result, the Unit provided training, technical assistance, and explanations of rules, procedures, and standards pertaining to classification and compensation. The oversight and auditing role expanded as part of the establishment of agency Classification Coordinators, where six (6) agency human resources staff received specialized training and completed competencies in Classification and Compensation analysis. The Unit conducted a total number of 159 Audits. For the larger human resources community, the Unit continues to guide the implementation of methodologies for assessing the effectiveness of classification and position management practices, policies, and procedures. Consultation meetings include project planning and classification needs for broader areas of organizational planning, development, and in the forecasting of the workforce.
METRICS/ANALYTICS: For Fiscal Year 2020, the Section reviewed and processed a combined total of 8,238 position actions and transactions.
SJD-REVISN
Filled Vacant Filled Vacant Filled Vacant 8T 9T TMPPT SNL
Corrections 24 2 8 3 10 1
RETURNS/REJECTS -1
DOT 11 3 6 1 1
RETURNS/REJECTS -3
HHS 106 26 13 2 4 3 32 2 10 14
RETURNS/REJECTS -1 -4
Liquor 7 4 2 1
RETURNS/REJECTS
Lottery 2 1 1
RETURNS/REJECTS
Safety 9 1 2 2 4
RETURNS/REJECTS
TOTALS: 159 33 26 0 4 8 3 42 2 15 16 1
Classification Coordinator Work Units Submitted FY 20
RECLASS-V/F RECLASS-TRNS TRNSF EST FT EST PTTOTAL WU's
6019
74555
1195
146 249
0
1000
2000
3000
4000
5000
6000
7000
PositionMovement
Abolished New RevisedPositions
Funded Unfunded
All Transactions Processed in NH FIRST

74
POSITION UPDATES:
This Fiscal Year, the Unit reviewed and approved 555 requests to create new positions. A list of all new Classified, full-time positions expected to last more than six (6) months created in FY 2020 is provided at the end of this section. DOP abolished 20 full-time and over 64 part-time positions and to include 249 unfunded positions in FY 2020. A list of abolished/unfunded full-time positions is provided at the end of this section.
New Positions Established – All Categories Fiscal Year 2020
Full Time Temporary
Part Time Temporary
Full Time Permanent
(7-D)
Full Time Permanent
(Other)
50 138 236 78
Seasonal Mass
Recruitment Unclassified Non-Classified
Total Established
49 3 1 0 555
TEMPORARY CHANGES TO POSITIONS: The Unit follows appropriate RSAs and procedures when approving and processing all position actions involving temporary changes. This includes the monitoring of positions going beyond their expiration date. Actions of this nature, for example, may involve a request to extend an end date for a full-time temporary position beyond its one-year approval timeframe. Special assignments or temporary promotion requests also are examined for compliance with appropriate Administrative Rules of the Division of Personnel. For Fiscal Year 2020, 238 transactions of this nature were performed.
15%
26%
0%8%
45%
5%
0% 1%
FT Temp
PT Temp
FT Perm (7-D)
FT Perm (Other)
Seasonal
Mass Recruit
Unclass
Non-Class

75
POSITION EXTENSIONS/ TEMPORARY CHANGES Fiscal Year 2020
REORGANIZATIONS: Reorganizations occur when an agency seeks to better align business operations or respond to changes in funding or programmatic needs. This year the Classification Unit worked with agency HR on 15 Reorganization Projects. 271 work units were processed that involved an agency reorganization (Reorgs). These included requests for changes in class series, reclassifications, position and employee transfers, organizational changes, and transactional request supporting agency restructuring initiatives. Complex technical assistance involving position movement is provided due to the impact a reorganization can have on agency employees and organizational structures and impact on other structures throughout the state. This Fiscal Year the Unit worked with FDM to develop definitions around Reorg codes so that better metrics could be tracked and distinctions could be made between the transactional and position change requests that are involved.
45%
3%1%1%15%
8%
27%
Extend End Date
Promotional Path
Temporary Reclassification Down
Temporary Reclassification Up and Return
Temporary Promotion and Return
Override Grade and Return
Special Assignments - Promotions andReturn
Action Count
Extend End Date 104
Promotional Path 8
Temporary Reclassification Down 1
Temporary Reclassification Up and Return 2
Temporary Promotion and Return 34
Override Grade and Return 19
Special Assignments - Promotions and Return 61

76
CLASS SPECIFICATION MODIFICATION AND REALLOCATION REQUESTS Fiscal Year 2020
Requested Action #
Submitted #
Approved # Denied/
Incomplete
Revision to Class Title Specification with Labor Grade Change
9 9 0
Revision to Class Specification w/o Labor Grade Change
34 26 0
TOTAL 42 32 0
REALLOCATIONS: The Classification Unit reviews requests to reallocate the labor grade of classification titles or classification series in addition to requests to modify existing class title specifications.
APPROVED REALLOCATION OF CLASSIFICATION TITLES
Fiscal Year 2020
Classification Title Changed Old
Labor Grade
Old Base Salary Step 1
New Labor Grade
New Base Salary Step 1
# Positions Affected*
Estimated Cost of Reallocation
Per Year (all positions)**
Conservation Officer I 18 $48,880 19 $50,835 15 $29,328
Conservation Officer II 19 $50,835 21 $55,182 11 $47,819
CONSERVATION OFFICER SERGEANT
21 $55,182 23 $59,862 6 $28,080
CONSERVATION OFFICER LIEUTENANT
23 $59,862 25 $65,208 6 $32,074
ADMIN CONSV OFFICER LIEUTENANT
23 $59,862 25 $65,208 1 $5,346
CONSERVATION OFFICER CAPTAIN
25 $65,208 27 $71,053 1 $5,845
CONSERVATION OFFICER MAJOR
28 $74,173 29 $77,438 1 $3,266
PHARMACY TECHNICIAN I 10 $28,061 12 $30,225 4 $8,658
PHARMACY TECHNICIAN II 0 $31,337 13 $31,337 3 $0
NET TOTAL - - 48 $160,415
* Includes only permanent classified, full-time and temporary classified full-time positions expected to last more than 6 months established between 7/1/2018 and 6/30/2020.
** Additional cost is estimated based on Step 1 salary difference for all positions (vacant and filled).

77
Reallocations affect all positions assigned to that title in every state agency. The work involves complex assessment of impact and labor market analysis, extensive research, multiple revisions, and edits. In addition, the unit meets with any impacted agencies as changes could result in budgetary and organizational adjustments. In Fiscal Year 2020, the Unit approved 9 reallocations that affected 48 filled and vacant positions.
Reallocation Analysis of Trooper Series Chapter 346:328, I (Laws of 2019) required DAS to do an assessment review of request for reallocation of the Department of Safety’s sworn police trooper positions, from the rank of probationary trooper through the rank of executive major. Chapter 346:328, II (Laws of 2019) appropriated funds to DAS to retain a consultant to assist with the assessment review. As required by this law, DAS took the following action:
1) Reallocation Analysis. Classification Section staff in the DAS, Division of Personnel (DOP) conducted a reallocation analysis, evaluating the characteristic duties, level of responsibility, and required skills and qualifications of each class title in the Trooper position series to assign an appropriate labor grade under the State’s classification system; and
2) Compensation Study. DAS went out to bid and entered into a contract, approved by the
Governor and Executive Council, with an independent consultant, The Segal Company (Segal), to perform a compensation study, comparing the pay and benefits of similar positions in other states and municipalities.
On May 20, 2020, the Classification Section of DOP found that the Trooper I, Trooper II, Sergeant, Lieutenant, and Captain class titles were each entitled to a one labor grade increase.
REALLOCATION ANALYSIS OF TROOPER CLASSIFICATION TITLES Fiscal Year 2020
Position Labor Grade*
# Positions
Change with 1 LG Increase
(@Step 6)
Approximate Cost
Trooper I 19 184 $2,704 $497,536
Trooper II 21 75 $3,536 $265,200
Sergeant 24 70 $3,635 $254,450
Lieutenant 27 17 $3,952 $67,184
Captain 29 6 $5,262 $31,572
Major 31 2 - -
Exec Major 33 1 - -
TOTAL 355 $1,115,942
*Employees serving as detectives and in other specialty units are placed at 2 labor grades higher on a separate pay schedule. These adjustments are not accounted for in this estimate.

78
As required by Chapter 346:328, I (laws of 2019), the Joint Legislative Fiscal Committee approved the appropriation contained in this provision to fund the reallocation of the Trooper series. Usually when a reallocation of a class title is approved by the DOP Classification Unit, the adjustment in labor grade is applied to all positions assigned that class title and employees in those positions upon approval and incumbents’ salaries are increased to the lowest level in the new job class that provides an increase equal to at least one annual increment. In this instance, the chapter law requiring the reallocation review specifically provides that “[r]eallocated pay shall take effect January 1, 2021.” Accordingly, DAS will implement the reallocated pay on January 1, 2021. RECLASSIFICATIONS: The Classification Unit reviews requests to reclassify positions from one job classification title to another, which typically involves a change in labor grade. Organizational changes can result in a reclassification of a position. Reclassification requests also may be combined with other position actions such as transfers, location and supervisor changes, supplemental job description revisions, and organizational structure reconfigurations. Job analysis occurs in order to maintain equitable relationships amongst internal positions with similar requirements; and to maintain uniform administration of salaries across broad occupational groups. Reclassifications are the most frequent and numerous types of requests submitted for review by this Section. Time, analysis, and research vary by type and complexity of each reclassification request. OUT-OF-CLASS SERIES RECLASSIFICATIONS:
Position reclassifications that are considered “out-of-class series” per the existing RSA 21-I: 56, are brought before Governor & Council (G & C) for approval. This Fiscal Year, 133 out of the 311 position reclassifications were submitted to and approved by G & C. The chart at the end of this section lists all out-of-series position reclassifications.
RECLASSIFICATION DECISIONS DIFFERING FROM AGENCY REQUESTS:
This year, 23 decision letters that affected 31 positions and 20 classification titles were sent to agencies explaining the determination of the Classification Unit in regards to reclassification and/or reallocation requests. Decision letters are necessary when the Classification Unit disagrees with an agency request or arrives at an alternative decision based on a review of materials and analysis or when communicating a decision outcome after an agency reorganization that changes functions of a position or affects a position’s role within an organizational structure. The Unit anticipates that as more focused competency training continues to occur, agency human resources staff will be better able to assist employees and supervisors in understanding the purpose of a reclassification. Further, those same agency staff can assist their employees and administration when reviewing materials for reclassification or reallocation requests, and be able to mitigate issues, address concerns, or explain decision outcomes.

79
RECLASSIFICATION REQUESTS FOR FULL-TIME POSITIONS
Fiscal Year 2020
Requested Action* # Submitted # Processed # Returned
Position Reclassification – Vacant 160 136 15
Position Reclassification – Filled 206 166 17
Position Reclassification with Re-Organization
9 9 0
TOTAL 375 311 32
Transaction Type Net or Average Cost**
(Est. Per Year) # Transactions
Per Position Reclassification with Change to Higher Labor Grade
$4,439 278
Per Position Reclassification with Change to Lower Labor Grade
($5,239) 25
Position Reclassification with No Change in Labor Grade
$0 8
Position Reclassification Denied $0 0
All Reclassifications (Estimated Net Cost)
$1,103,022 311
* Includes requests for permanent reclassification of Classified Permanent and Full-time Temporary Positions Lasting More Than 6 Months Only; excludes requests affecting Non-classified and Unclassified Positions and requests for temporary (short-term) position reclassifications.
** Cost is estimated based on Step 1 salary for vacant positions and actual salary for filled positions.

80
OUT-OF-SERIES POSITION RECLASSIFICATIONS APPROVED BY GOVERNOR AND COUNCIL Fiscal Year 2020
DEPARTMENT FROM (TITLE & SALARY GRADE) LG TO (TITLE & SALARY GRADE) LG G & C
Department of Corrections TI College Professor 25 Administrator IV 33 7/10/19 Department of Education Executive Secretary Steno 12 Program Assistant I 12 7/10/19 Department of Employment Security Executive Director Board of Nursing 35 Administrator III 31 7/10/19 Department of Fish and Game Supervisor VI 27 Planning Analyst/Data Systems 24 7/10/19 Department of Health and Human Services Administrator IV 27 Financial Analyst 28 7/10/19 Lottery Commission Data Control Clerk 9 Lottery Marketing Coordinator 19 7/10/19 Department of Health and Human Services Management Analyst 21 Program Specialist IV 25 7/31/19 Department of Health and Human Services Secretary II 9 Case Aide 14 7/31/19 Department of Health and Human Services Health Facilities Cleaner II 7 Assistant Administrator 29 7/31/19 Justice Department Legal Secretary IV 15 Paralegal II 19 7/31/19 Department of Safety Examiner II 16 Cash Terminal Operator II 13 8/14/19 Department of Health and Human Services Secretary II 9 Administrative Secretary 14 8/14/19 Department of Health and Human Services Accountant II 18 Business Administrator II 24 8/14/19 Department of Health and Human Services Business Systems Analyst II 30 Administrator III 31 8/14/19 Department of Health and Human Services Program Specialist I 19 Business Systems Analyst I 28 8/14/19 Department of Health and Human Services Program Specialist III 23 Licensing & Evaluation Coordinator 20 8/14/19 Department of Safety Program Specialist I 12 Program Specialist III 23 8/14/19 Department Environmental Services Superintendent Wastewater Treatment
Plant 31 Administrator III 31 8/14/19
Lottery Commission Program Specialist III 23 Research Analyst 23 8/14/19 Department of Fish and Game Informational Rep II 21 Executive Secretary 11 8/28/19 Department of Health and Human Services Clerk Interviewer 9 Medical Typist II 10 8/28/19 Department of Transportation Electrician Supervisor II 17 Civil Engineer IV 27 8/28/19 Department of Business and Economic Affairs
Data Control Clerk III 12 Program Assistant II 15 9/18/19 Department of Administration Services Supervisor IV 25 Administrator I 27 9/18/19 Department of Administration Services Supervisor IV 25 Administrator I 27 9/18/19 Department of Corrections Corrections Counselor/Case Manager 20 Chaplain II 23 9/18/19 Department of Employment Security Interviewer I 16 Supervisor VII 28 9/18/19 Department of Health and Human Services Mental Health Worker Trainee 7 Registered Nurse I 19 9/18/19 Department of Health and Human Services Child Protective Service Worker IV 24 Supervisor IV 25 9/18/19 Department of Information Technology Supr of Computer Operations 19 Computer Operator II 13 9/18/19 Military and Veterans Affairs Veterans Service Officer 18 Supervisor IV 25 9/18/19 Department of Employment Security Legal Secretary III 13 Paralegal I 16 10/2/19 Department of Health and Human Services Financial Analyst 28 Business Systems Analyst I 28 10/2/19 Department of Health and Human Services Juv Probation & Parole Officer III 22 Attorney III 30 10/2/19

81
DEPARTMENT FROM (TITLE & SALARY GRADE) LG TO (TITLE & SALARY GRADE) LG G & C
Department of Safety Cash Terminal Operator II 13 Supervisor of Cash Terminal Operations
16 10/2/19 Department of Safety Cash Terminal Operator II 13 Supervisor of Cash Terminal
Operations 16 10/2/19
Department of Safety Cash Terminal Operator II 13 Supervisor of Cash Terminal Operations
16 10/2/19 Department of Safety Cash Terminal Operator II 13 Supervisor of Cash Terminal
Operations 16 10/2/19
Department of Safety Cash Terminal Operator II 13 Supervisor of Cash Terminal Operations
16 10/2/19 Department of Education Program Specialist III 23 Program Specialist IV 25 10/23/19 Department of Fish and Game Forester II 21 Engineering Technician IV 19 10/23/19 Department of Revenue Program Assistant III 17 Supervisor III 23 10/23/19 Department of Safety Records Control Clerk 10 Data Control Clerk III 12 10/23/19 Department of Safety Records Control Clerk 10 Data Control Clerk III 12 10/23/19 Department of Safety Clerk IV 12 Data Control Clerk III 12 10/23/19 Department of Veterans Home Chauffeur DRC 7 Medical Records Technician 13 10/23/19 Department of Transportation Toll Attendant I 9 Civil Engineer IV 27 11/6/19 Department Environmental Services Hydrogeologist III 27 Civil Engineer IV 27 11/6/19 Department of Health and Human Services Program Planning and Review Specialist 28 Admin of Planning Coordination 30 11/25/19 Department of Health and Human Services Program Specialist IV 25 Public Health Program Manager 26 11/25/19 Department of Information Technology Systems Development Spec I 18 Technical Support Spec VI 32 11/25/19 Department of Health and Human Services Program Specialist III 23 Administrator I 27 12/18/19 Department of Health and Human Services Systems Development Specialist V 28 Business Systems Analyst II 30 12/18/19 Department of Health and Human Services Case Technician I 14 Program Specialist I 19 12/18/19 Department of Health and Human Services Chief of Prev & Education Services 25 Program Specialist IV 25 12/18/19 Department of Labor Secretary II 9 Paralegal I 16 12/18/19 Department of Transportation Toll Attendant I 9 Tran Management Comm Spec I 12 12/18/19 Department Environmental Services Payroll Officer II 16 Human Resources Technician 17 12/18/19 Department of Health and Human Services Switchboard Operator II 11 Administrative Supervisor 17 1/8/20 Department of Health and Human Services Hospital Unit Assistant 11 Executive Secretary 11 1/8/20 Department of Health and Human Services Hospital Unit Assistant 11 Program Assistant II 15 1/8/20 Department of Health and Human Services Licensing & Eval Coord 20 Supervisor IV 25 1/8/20 Department of Transportation Toll Attendant I 9 Business Systems Analyst I 28 1/8/20 Department of Transportation Toll Attendant I 9 Administrative Supervisor 17 1/8/20 Department of Transportation Toll Attendant I 9 Program Assistant III 17 1/8/20 Department of Transportation Program Specialist II 21 Program Specialist IV 25 1/8/20 Liquor Commission Warehouseman 10 Retail Store Clerk II 12 1/8/20 Liquor Commission Warehouseman 10 Retail Store Clerk II 12 1/8/20 Office of Professional Licensure & Certification
Accounting Technician 12 Accountant I 16 1/8/20 Office of Strategic Initiatives Accountant II 18 Business Administrator I 21 1/8/20 Department of Corrections Clinical Mental Health Counsel 23 Administrator II 29 1/22/20

82
DEPARTMENT FROM (TITLE & SALARY GRADE) LG TO (TITLE & SALARY GRADE) LG G & C
Department of Safety Program Specialist II 21 Cash Terminal Operator I 11 1/22/20 Department of Safety Supervisor II 21 Cash Terminal Operator I 11 1/22/20 Department of Safety Field Rep I Emergency Mgmt/Comm 19 Program Planner II 21 1/22/20 Department of Corrections Internal Affairs Investigator II 21 Nurse Specialist 25 2/5/20 Department of Health and Human Services Program Specialist III 23 Program Specialist IV 25 2/5/20 Department of Health and Human Services Training Coordinator 21 Program Specialist IV 25 2/5/20 Department of Safety Program Assistant II 15 Supervisor I 19 2/5/20 Department of Transportation Engineering Technician III 16 Technical Support Spec II 21 2/5/20 Department Environmental Services Building Service Worker III 8 Treatment Plant Operator I 14 2/5/20 Lottery Commission Lottery Chief Compliance Officer 33 Executive Agency Manager 35 2/5/20 Lottery Commission Administrator IV 33 Executive Agency Manager 35 2/5/20 Lottery Commission Lottery Sale & Product Dev Dir 31 Executive Agency Manager 35 2/5/20 Department of Health and Human Services Warehouse Supervisor 17 Program Planner II 21 2/19/20 Department of Information Technology Systems Development Spec IV 26 Technical Support Spec IV 27 2/19/20 Department of Information Technology Systems Development Spec III 23 Technical Support Spec IV 27 2/19/20 Department of Safety Secretary II 9 Program Assistant II 15 2/19/20 Department of Transportation Equal Employment Oppor Coord 21 Program Specialist IV 25 2/19/20 Department of Transportation Program Assistant II 15 Program Specialist IV 25 2/19/20 Department of Business and Economic Affairs
Administrative Secretary 14 Program Specialist III 21 3/11/20 Department of Health and Human Services Medical Typist II 10 Medical Service Technician 17 3/11/20 Department of Information Technology Systems Development Spec V 28 Technical Support Spec VI 32 3/11/20 Department of Natural and Culture Resources
Librarian II 21 Human Resources Coordinator 21 3/11/20 Department of Natural and Culture Resources
HR Administrator 26 Administrator II 29 3/11/20 Department of Natural and Culture Resources
Librarian II 21 Human Resources Technician 17 3/11/20 Department of Corrections Corrections Officer 14 Training Specialist 18 3/25/20 Department of Corrections Corrections Officer 14 Program Specialist IV 25 3/25/20 Department of Corrections Corrections Officer Trainee 12 Program Specialist IV 25 3/25/20 Department of Transportation Toll Shift Supervisor 13 Supervisor II 21 3/25/20 Department of Transportation Secretary II 9 Clerk IV 12 3/25/20 Department Environmental Services Work Proc Operator I 9 Program Assistant I 12 3/25/20 Liquor Commission Accounting Technician 12 Accountant I 16 3/25/20 Lottery Commission Gaming Enforcement Inves 16 Field Auditor 22 3/25/20 Department of Natural and Culture RespResources
Plumber Supervisor II 17 Maintenance Technician 21 3/25/20 Department of Natural and Culture Resources
Carpentry Supervisor II 17 Plant Maintenance Engineer I 17 3/25/20 Department of Natural and Culture Resources
Carpenter II 14 Plant Maintenance Engineer I 17 3/25/20 Department of Natural and Culture Resources
Electrician Supervisor II 17 Maintenance Technician 21 3/25/20 Department of Health and Human Services Program Assistant III 17 Program Specialist III 23 4/8/20

83
DEPARTMENT FROM (TITLE & SALARY GRADE) LG TO (TITLE & SALARY GRADE) LG G & C
Department of Health and Human Services Nurse Specialist-Public Health 25 Technical Support Spec III 25 4/8/20 Department of Health and Human Services Mental Health Worker I 9 Registered Nurse I Bay Weekday 19 4/8/20 Department of Information Technology Technical Support Spec V 29 Business Systems Analyst II 30 4/8/20 Department of Information Technology Administrative Secretary 14 Procurement Technician 17 4/8/20 Department of Information Technology Systems Development Spec VI 30 Business Systems Analyst II 30 4/8/20 Department Environmental Services Air Pollution Control Eng V 28 Supervisor VII 28 4/8/20 Insurance Department Executive Secretary 11 Program Assistant II 15 4/8/20 Department of Corrections Corrections Officer 14 Supervisor III 21 5/6/20 Department of Health and Human Services Juv Probation & Parole Officer IV 24 Administrator I 27 5/6/20 Department of Health and Human Services Senior Psychiatric Social Worker 26 Social Worker III 19 5/6/20 Department of Health and Human Services Plant Maintenance Engineer V 30 Administrator III 31 5/6/20 Department of Health and Human Services Licensing & Eval Coord 20 Program Specialist III 23 5/6/20 Department of Health and Human Services Administrative Secretary 14 Program Specialist I 19 5/6/20 Department of Transportation Administrative Secretary 14 Administrative Assistant I 16 5/6/20 Liquor Commission Warehouseman 10 Retail Store Clerk II 12 5/6/20 Department of Natural and Cultural Resources
Clerk IV 12 Program Assistant I 12 5/6/20 Department of Education Program Assistant I 12 Internal Auditor I 19 5/20/20 Department of Health and Human Services Licensing & Eval Coord 20 Program Specialist III 23 5/20/20 Department of Transportation Program Specialist III 23 Principal Planner 24 5/20/20 Justice Department Criminal Justice Program Spec 24 Administrator I 27 5/20/20 Department of Natural and Culture Resources
Automotive Mechanic 15 Automotive Equipment Inspector 17 5/20/20 Department of Corrections Business Administrator IV 29 Attorney I 26 6/10/20 Department of Information Technology Systems Development Spec IV 26 Business Systems Analyst I 28 6/10/20 Department of Veterans Home Recreational Assistant II DRC 11 Program Assistant II 15 6/10/20 Department of Veterans Home Program Assistant II 15 Technical Support Spec II 21 6/24/20
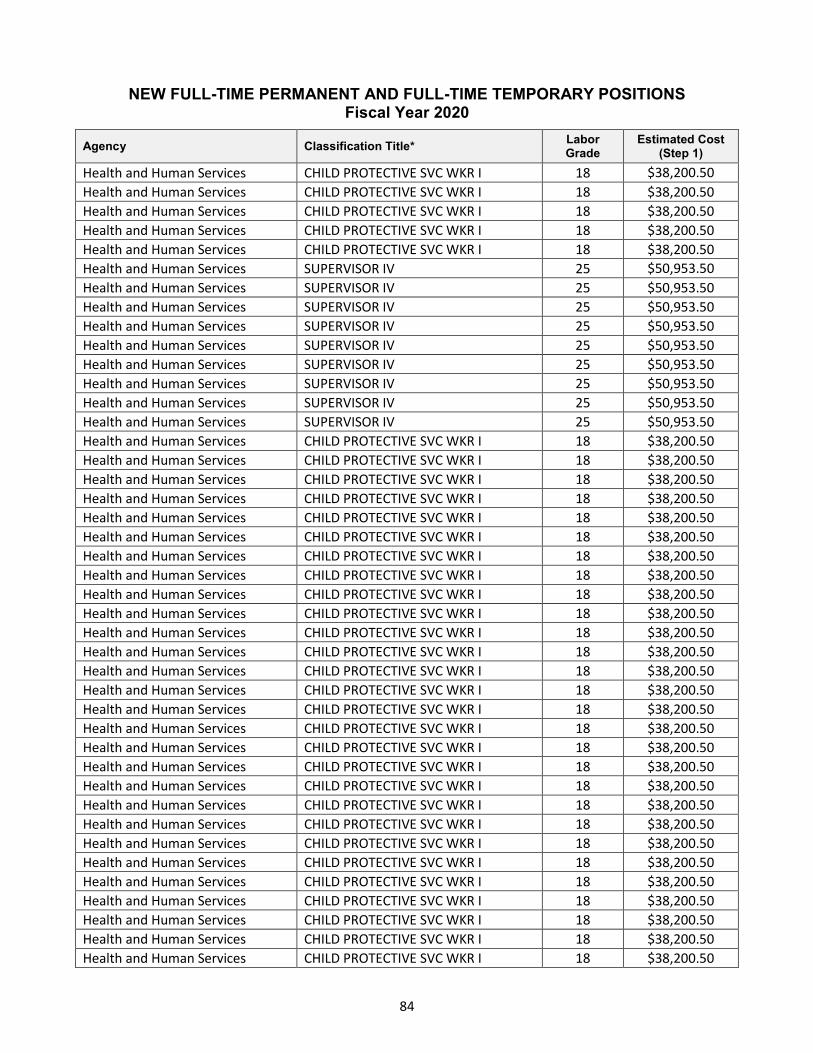
84
NEW FULL-TIME PERMANENT AND FULL-TIME TEMPORARY POSITIONS Fiscal Year 2020
Agency Classification Title* Labor Grade
Estimated Cost (Step 1)
Health and Human Services CHILD PROTECTIVE SVC WKR I 18 $38,200.50 Health and Human Services CHILD PROTECTIVE SVC WKR I 18 $38,200.50
Health and Human Services CHILD PROTECTIVE SVC WKR I 18 $38,200.50
Health and Human Services CHILD PROTECTIVE SVC WKR I 18 $38,200.50
Health and Human Services CHILD PROTECTIVE SVC WKR I 18 $38,200.50
Health and Human Services SUPERVISOR IV 25 $50,953.50 Health and Human Services SUPERVISOR IV 25 $50,953.50
Health and Human Services SUPERVISOR IV 25 $50,953.50
Health and Human Services SUPERVISOR IV 25 $50,953.50
Health and Human Services SUPERVISOR IV 25 $50,953.50
Health and Human Services SUPERVISOR IV 25 $50,953.50
Health and Human Services SUPERVISOR IV 25 $50,953.50
Health and Human Services SUPERVISOR IV 25 $50,953.50
Health and Human Services SUPERVISOR IV 25 $50,953.50
Health and Human Services CHILD PROTECTIVE SVC WKR I 18 $38,200.50
Health and Human Services CHILD PROTECTIVE SVC WKR I 18 $38,200.50
Health and Human Services CHILD PROTECTIVE SVC WKR I 18 $38,200.50
Health and Human Services CHILD PROTECTIVE SVC WKR I 18 $38,200.50
Health and Human Services CHILD PROTECTIVE SVC WKR I 18 $38,200.50
Health and Human Services CHILD PROTECTIVE SVC WKR I 18 $38,200.50
Health and Human Services CHILD PROTECTIVE SVC WKR I 18 $38,200.50
Health and Human Services CHILD PROTECTIVE SVC WKR I 18 $38,200.50
Health and Human Services CHILD PROTECTIVE SVC WKR I 18 $38,200.50
Health and Human Services CHILD PROTECTIVE SVC WKR I 18 $38,200.50
Health and Human Services CHILD PROTECTIVE SVC WKR I 18 $38,200.50
Health and Human Services CHILD PROTECTIVE SVC WKR I 18 $38,200.50
Health and Human Services CHILD PROTECTIVE SVC WKR I 18 $38,200.50
Health and Human Services CHILD PROTECTIVE SVC WKR I 18 $38,200.50
Health and Human Services CHILD PROTECTIVE SVC WKR I 18 $38,200.50
Health and Human Services CHILD PROTECTIVE SVC WKR I 18 $38,200.50
Health and Human Services CHILD PROTECTIVE SVC WKR I 18 $38,200.50
Health and Human Services CHILD PROTECTIVE SVC WKR I 18 $38,200.50
Health and Human Services CHILD PROTECTIVE SVC WKR I 18 $38,200.50
Health and Human Services CHILD PROTECTIVE SVC WKR I 18 $38,200.50
Health and Human Services CHILD PROTECTIVE SVC WKR I 18 $38,200.50
Health and Human Services CHILD PROTECTIVE SVC WKR I 18 $38,200.50
Health and Human Services CHILD PROTECTIVE SVC WKR I 18 $38,200.50
Health and Human Services CHILD PROTECTIVE SVC WKR I 18 $38,200.50
Health and Human Services CHILD PROTECTIVE SVC WKR I 18 $38,200.50
Health and Human Services CHILD PROTECTIVE SVC WKR I 18 $38,200.50
Health and Human Services CHILD PROTECTIVE SVC WKR I 18 $38,200.50
Health and Human Services CHILD PROTECTIVE SVC WKR I 18 $38,200.50

85
Agency Classification Title* Labor Grade
Estimated Cost (Step 1)
Health and Human Services CHILD PROTECTIVE SVC WKR I 18 $38,200.50
Health and Human Services CHILD PROTECTIVE SVC WKR I 18 $38,200.50
Health and Human Services SUPERVISOR IV 25 $50,953.50 Health and Human Services SUPERVISOR IV 25 $50,953.50
Health and Human Services SUPERVISOR IV 25 $50,953.50
Health and Human Services SUPERVISOR IV 25 $50,953.50
Health and Human Services SUPERVISOR IV 25 $50,953.50
Health and Human Services SUPERVISOR IV 25 $50,953.50
Health and Human Services SUPERVISOR IV 25 $50,953.50
Health and Human Services SUPERVISOR IV 25 $50,953.50
Health and Human Services SUPERVISOR IV 25 $50,953.50
Health and Human Services CHILD PROTECTIVE SVC WKR I 18 $38,200.50
Health and Human Services CHILD PROTECTIVE SVC WKR I 18 $38,200.50
Health and Human Services CHILD PROTECTIVE SVC WKR I 18 $38,200.50
Health and Human Services CHILD PROTECTIVE SVC WKR I 18 $38,200.50
Health and Human Services CHILD PROTECTIVE SVC WKR I 18 $38,200.50
Health and Human Services CHILD PROTECTIVE SVC WKR I 18 $38,200.50
Health and Human Services CHILD PROTECTIVE SVC WKR I 18 $38,200.50
Health and Human Services CHILD PROTECTIVE SVC WKR I 18 $38,200.50
Health and Human Services CHILD PROTECTIVE SVC WKR I 18 $38,200.50
Health and Human Services CHILD PROTECTIVE SVC WKR I 18 $38,200.50
Health and Human Services CHILD PROTECTIVE SVC WKR I 18 $38,200.50
Health and Human Services CHILD PROTECTIVE SVC WKR I 18 $38,200.50
Health and Human Services CHILD PROTECTIVE SVC WKR I 18 $38,200.50
Health and Human Services CHILD PROTECTIVE SVC WKR I 18 $38,200.50
Health and Human Services CHILD PROTECTIVE SVC WKR I 18 $38,200.50
Health and Human Services SUPERVISOR IV 25 $50,953.50
Health and Human Services SUPERVISOR IV 25 $50,953.50
Health and Human Services CHILD PROTECTIVE SVC WKR I 18 $38,200.50
Health and Human Services CHILD PROTECTIVE SVC WKR I 18 $38,200.50
Health and Human Services CHILD PROTECTIVE SVC WKR I 18 $38,200.50
Health and Human Services CHILD PROTECTIVE SVC WKR I 18 $38,200.50
Health and Human Services CHILD PROTECTIVE SVC WKR I 18 $38,200.50
Health and Human Services CHILD PROTECTIVE SVC WKR I 18 $38,200.50
Health and Human Services CHILD PROTECTIVE SVC WKR I 18 $38,200.50
Health and Human Services CHILD PROTECTIVE SVC WKR I 18 $38,200.50
Administrative Services EXEC DIR NH COMM AGING 31 $65,949.00
TOTAL 78 positions $3,262,448
* Includes only permanent classified, full-time and temporary classified full-time positions expected to last more than 6 months established between 7/1/2019 and 6/30/2020.

86
POSITIONS UNFUNDED Fiscal Year 2020
Classification Title* Labor Grade Total Positions Estimated Cost** (Step 1)
ACCOUNTANT I 16 2 $70,590.00
ACCOUNTANT II 18 2 $76,401.00
ACCOUNTANT III 21 2 $86,229.00
ACCOUNTING TECHNICIAN 12 2 $60,450.00
ADMINISTRATIVE ASSISTANT I 16 2 $70,590.00
ADMINISTRATIVE ASSISTANT II 19 1 $39,702.00
ADMINISTRATIVE SECRETARY 14 1 $32,623.50
ADMINISTRATIVE SUPERVISOR 17 1 $36,718.50
ADMINISTRATOR I 27 3 $166,666.50
ADMINISTRATOR II 29 1 $60,469.50
ADMINISTRATOR III 31 4 $263,796.00
AGENCY AUDIT MANAGER 25 3 $152,860.50
AGENCY STAFF AUDITOR 22 2 $89,661.00
ASSISTANT HOUSE LEADER 17 1 $36,718.50
ATTORNEY I 26 1 $53,176.50
ATTORNEY II 28 1 $57,954.00
BANK EXAMINER II 21 2 $86,229.00
BANK EXAMINER III 27 3 $166,666.50
BANK EXAMINER TRAINEE 17 2 $73,437.00
BIOLOGIST I 21 1 $43,114.50
BIOLOGIST II 23 1 $46,761.00
BUILDING SERVICE WORKER III 8 1 $25,974.00
BUSINESS ADMINISTRATOR II 24 3 $146,308.50
BUSINESS ADMINISTRATOR IV 29 2 $120,939.00
BUSINESS SYSTEMS ANALYST I 28 3 $173,862.00
BUSINESS SYSTEMS ANALYST II 30 3 $189,540.00
CASE TECHNICIAN I 14 1 $32,623.50
CASE TECHNICIAN TRAINEE 12 1 $30,225.00
CERTIFYING OFFICER I 16 1 $35,295.00
CERTIFYING OFFICER IV 22 1 $44,830.50
CHILD PROTECTIVE SVC WKR II 20 2 $82,641.00
CLAIMS AND HEARINGS CLERK II 12 1 $30,225.00
CLAIMS PROCESSOR I 9 1 $27,027.00
CLAIMS PROCESSOR II 12 1 $30,225.00
CLERK INTERVIEWER 9 3 $81,081.00
CLERK IV 12 2 $60,450.00
COMPUTER OPERATOR II 13 1 $31,336.50
CONSERVATION OFFICER II 21 3 $129,343.50
CONSERVATION OFFICER TRAINEE 16 1 $35,295.00
COOK II DRC 9 1 $27,027.00
CORRECTIONS CORPORAL 16 3 $105,885.00
CORRECTIONS OFFICER 14 12 $391,482.00
CORRECTIONS OFFICER TRAINEE 12 4 $120,900.00
DATA LIBRARIAN II 14 1 $32,623.50
ELECTRICAL/ELECTRONIC SPEC 17 2 $73,437.00

87
Classification Title* Labor Grade Total Positions Estimated Cost** (Step 1)
EMPLOYMENT COUNSELOR 18 1 $38,200.50
EXECUTIVE SECRETARY 11 4 $116,610.00
FAMILY SERVICES SPECIALIST I 17 2 $73,437.00
FIELD AUDIT LEADER DD 1 $63,494.08
FINANCIAL ANALYST 28 1 $57,954.00
FISCAL SPECIALIST I 15 2 $67,743.00
FISCAL SPECIALIST II 17 2 $73,437.00
FOOD SERVICE WORKER II 5 1 $23,712.00
GAMING ENFORCEMENT INVES 16 2 $70,590.00
HEALTH FACILITIES CLEANER II 7 1 $25,096.50
HEARINGS EXAMINER 31 1 $65,949.00
HEARINGS OFFICER 26 1 $53,176.50
HUMAN RESOURCES ASSISTANT II 12 1 $30,225.00
INFORMATION CTR ATTENDANT I 6 2 $48,867.00
INFORMATION CTR ATTENDANT II 8 1 $25,974.00
INFORMATION TECHNOLOGY MGR I 28 1 $57,954.00
INFORMATION TECHNOLOGY MGR V 34 2 $151,203.00
INTERNAL AFFAIRS INVESTGTR II 21 2 $86,229.00
INTERNAL AUDITOR II 21 1 $43,114.50
LABOR INSPECTOR 22 4 $179,322.00
LABOR MARKET ANALYST II 20 1 $41,320.50
LAUNDRY WORKER III 6 1 $24,433.50
LEGAL SECRETARY II 11 2 $58,305.00
LIBRARIAN II 21 2 $86,229.00
LICENSED NURSING ASST I 8/80 9 3 $81,081.00
LICENSED NURSING ASST II 8/80 11 3 $87,457.50
LICENSED NURSING ASST III 8/80 14 2 $65,247.00
LICENSED PRACT NURSE I 8/80 16 3 $105,885.00
LICENSED PRACT NURSE II 8/80 18 1 $38,200.50
MAINTENANCE MECHANIC III 14 1 $32,623.50
MAINTENANCE TECHNICIAN 21 1 $43,114.50
MICROBIOLOGIST IV 29 1 $60,469.50
NURSING COORDINATOR NRS 27 1 $55,555.50
OFFSET PRESS OPERATOR II 12 1 $30,225.00
OFFSET PRESS OPERATOR III 14 2 $65,247.00
PAYROLL OFFICER I 14 1 $32,623.50
PHARMACIST 27 1 $55,555.50
PLANNING ANALYST/DATA SYSTEM 24 1 $48,769.50
PLANT MAINTENANCE ENGINEER I 17 1 $36,718.50
PROGRAM ASSISTANT I 12 4 $120,900.00
PROGRAM ASSISTANT II 15 1 $33,871.50
PROGRAM ASSISTANT III 17 2 $73,437.00
PROGRAM PLANNER I 19 1 $39,702.00
PROGRAM PLANNER II 21 1 $43,114.50
PROGRAM PLANNER III 25 1 $50,953.50
PROGRAM SPECIALIST I 19 2 $79,404.00
PROGRAM SPECIALIST II 21 3 $129,343.50
PROGRAM SPECIALIST III 23 2 $93,522.00

88
Classification Title* Labor Grade Total Positions Estimated Cost** (Step 1)
PROGRAM SPECIALIST IV 25 7 $356,674.50
PSYCHOLOGICAL ASSOCIATE I 24 1 $48,769.50
PSYCHOLOGICAL ASSOCIATE II 27 3 $166,666.50
PSYCHOLOGIST 29 1 $60,469.50
PUBLIC HEALTH NURSE CONSULT 25 2 $101,907.00
REGISTERED NURSE I 8/80 19 1 $39,702.00
REGISTERED NURSE II 21 1 $43,114.50
REGISTERED NURSE III NRS 23 1 $46,761.00
RESEARCH ANALYST 23 2 $93,522.00
SECRETARY II 9 5 $135,135.00
SENIOR MANAGEMENT ANALYST 26 2 $106,353.00
STATISTICIAN I 16 1 $35,295.00
SUPERVISOR I 19 1 $39,702.00
SUPERVISOR II 21 1 $43,114.50
SUPERVISOR III 23 2 $93,522.00
SUPERVISOR V 26 2 $106,353.00
SUPERVISOR VI 27 3 $166,666.50
SWITCHBOARD OPERATOR I 8 2 $51,948.00
SYSTEMS DEVELOPMENT SPEC II 21 1 $43,114.50
SYSTEMS DEVELOPMENT SPEC IV 26 5 $265,882.50
SYSTEMS DEVELOPMENT SPEC VI 30 3 $189,540.00
TAX EXAMINER II 12 1 $30,225.00
TAX REVIEW APPRAISER I 27 1 $55,555.50
TEACHER ASSISTANT DRC 11 2 $58,305.00
TEACHER I DRC 18 5 $191,002.50
TEACHER II DRC 20 2 $82,641.00
TEACHER III DRC 22 3 $134,491.50
TECHNICAL SUPPORT SPEC III 25 2 $101,907.00
TECHNICAL SUPPORT SPEC V 29 2 $120,939.00
TRAINING 16 1 $35,295.00
TRAINING COORDINATOR 21 2 $86,229.00
YOUTH COUNSELOR II DRC 16 3 $105,885.00
YOUTH COUNSELOR III DRC 16 5 $176,475.00
Total 247 $ 10,308,151
* Includes only permanent classified, full-time and temporary classified full-time positions expected to last more than 6 months abolished between 7/1/2019 and 6/30/2020.
** Estimated annual cost per position is based on base salary only (using applicable wage schedule).
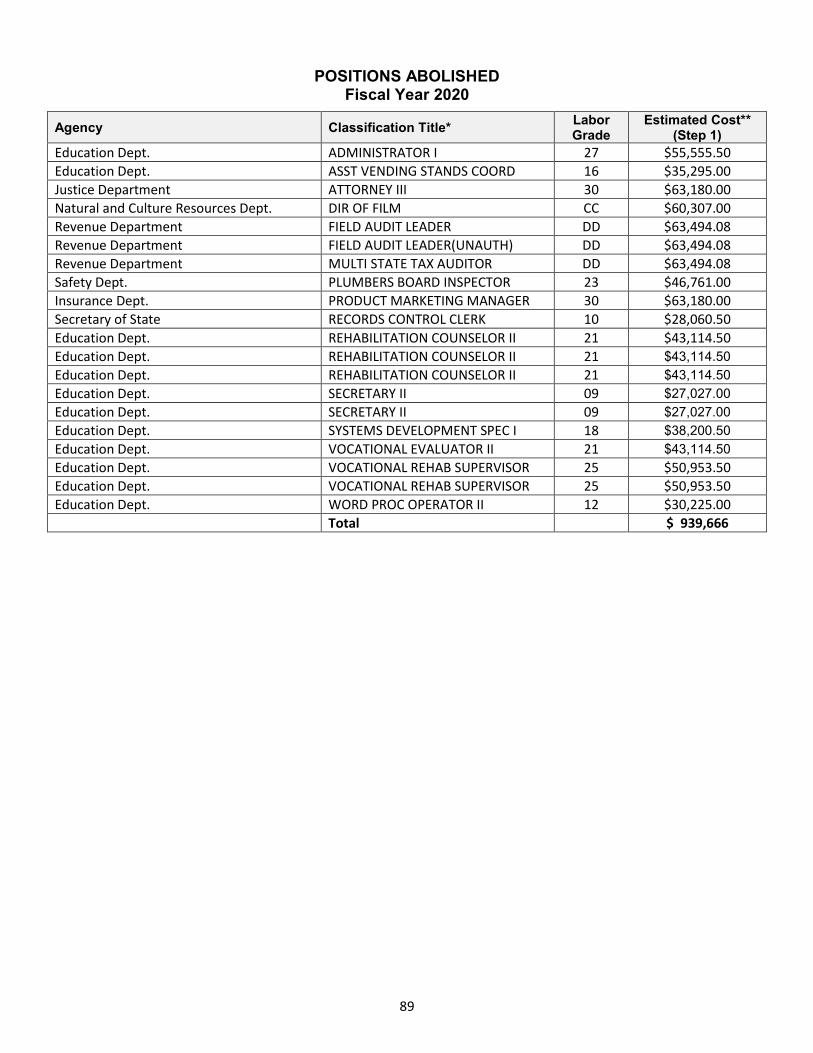
89
POSITIONS ABOLISHED Fiscal Year 2020
Agency Classification Title* Labor Grade
Estimated Cost** (Step 1)
Education Dept. ADMINISTRATOR I 27 $55,555.50
Education Dept. ASST VENDING STANDS COORD 16 $35,295.00
Justice Department ATTORNEY III 30 $63,180.00
Natural and Culture Resources Dept. DIR OF FILM CC $60,307.00
Revenue Department FIELD AUDIT LEADER DD $63,494.08
Revenue Department FIELD AUDIT LEADER(UNAUTH) DD $63,494.08
Revenue Department MULTI STATE TAX AUDITOR DD $63,494.08
Safety Dept. PLUMBERS BOARD INSPECTOR 23 $46,761.00
Insurance Dept. PRODUCT MARKETING MANAGER 30 $63,180.00
Secretary of State RECORDS CONTROL CLERK 10 $28,060.50
Education Dept. REHABILITATION COUNSELOR II 21 $43,114.50
Education Dept. REHABILITATION COUNSELOR II 21 $43,114.50
Education Dept. REHABILITATION COUNSELOR II 21 $43,114.50
Education Dept. SECRETARY II 09 $27,027.00
Education Dept. SECRETARY II 09 $27,027.00
Education Dept. SYSTEMS DEVELOPMENT SPEC I 18 $38,200.50
Education Dept. VOCATIONAL EVALUATOR II 21 $43,114.50
Education Dept. VOCATIONAL REHAB SUPERVISOR 25 $50,953.50
Education Dept. VOCATIONAL REHAB SUPERVISOR 25 $50,953.50
Education Dept. WORD PROC OPERATOR II 12 $30,225.00
Total $ 939,666
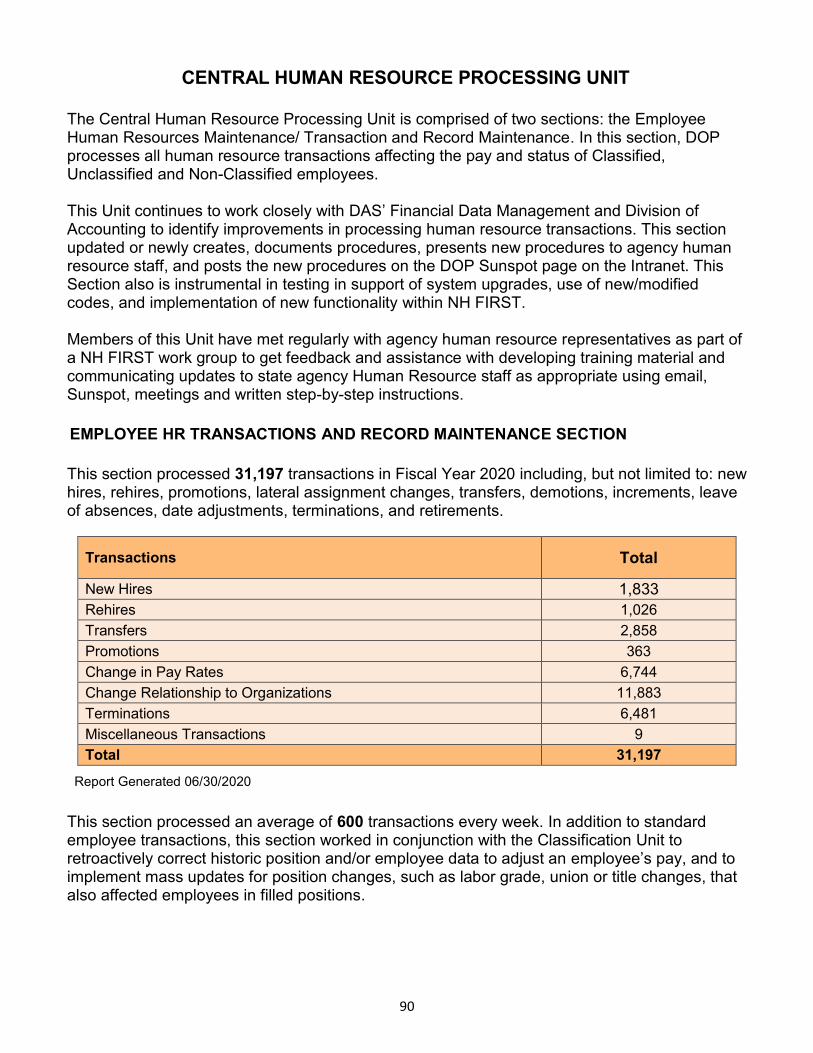
90
CENTRAL HUMAN RESOURCE PROCESSING UNIT
The Central Human Resource Processing Unit is comprised of two sections: the Employee Human Resources Maintenance/ Transaction and Record Maintenance. In this section, DOP processes all human resource transactions affecting the pay and status of Classified, Unclassified and Non-Classified employees. This Unit continues to work closely with DAS’ Financial Data Management and Division of Accounting to identify improvements in processing human resource transactions. This section updated or newly creates, documents procedures, presents new procedures to agency human resource staff, and posts the new procedures on the DOP Sunspot page on the Intranet. This Section also is instrumental in testing in support of system upgrades, use of new/modified codes, and implementation of new functionality within NH FIRST. Members of this Unit have met regularly with agency human resource representatives as part of a NH FIRST work group to get feedback and assistance with developing training material and communicating updates to state agency Human Resource staff as appropriate using email, Sunspot, meetings and written step-by-step instructions.
EMPLOYEE HR TRANSACTIONS AND RECORD MAINTENANCE SECTION
This section processed 31,197 transactions in Fiscal Year 2020 including, but not limited to: new hires, rehires, promotions, lateral assignment changes, transfers, demotions, increments, leave of absences, date adjustments, terminations, and retirements.
Transactions Total
New Hires 1,833
Rehires 1,026
Transfers 2,858
Promotions 363
Change in Pay Rates 6,744
Change Relationship to Organizations 11,883
Terminations 6,481
Miscellaneous Transactions 9
Total 31,197
Report Generated 06/30/2020
This section processed an average of 600 transactions every week. In addition to standard employee transactions, this section worked in conjunction with the Classification Unit to retroactively correct historic position and/or employee data to adjust an employee’s pay, and to implement mass updates for position changes, such as labor grade, union or title changes, that also affected employees in filled positions.

91
In Fiscal Year 2020, this section continued to use the mass upload method, which was developed to process multiple employee/position changes in the NH FIRST system using an excel spreadsheet rather than individual transactions. This method provides efficiency in processing large numbers of transactions such as location changes, address changes, salary enhancements and other data corrections resulting from audits. This year we completed 32 mass uploads, which otherwise would have required agencies and employees in this section to process thousands of individual transactions. This section currently has three full-time positions and two part-time positions, which included two positions that are cross-trained for the Examination Section. One of the part-time positions is dedicated to and funded by the NH State Liquor Commission.
EXAMINATION SECTION
This section works with agency staff from the Department of Safety, the Department of Natural and Cultural Resources and Fish and Game to administer specific examinations in a large quantity at one time for such titles as State Police Troopers, Conservation Officers, Forest Rangers and Marine Patrol Officers. This section also offers field-testing of candidates at New Hampshire Employment Security local offices as alternative examination sites throughout the State. We also continue to provide technical assistance to state agency Human Resource Departments and hiring managers in the preparation and administration of structured interviews. A current list of the positions that require examinations can be found on Sunspot at the following link: http://sunspot.nh.gov/hr/documents/Examinations/State%20of%20NH%20Examinations.pdf

92
BUREAU OF EMPLOYEE RELATIONS
Throughout the State, the Bureau of Employee Relations provides professional support and assistance to the Governor and represents the State in the conduct of negotiations with representatives of classified employees. Negotiations cover all cost items, terms, and conditions of employment to include wages, benefits, hours and other conditions of employment.
Additionally, the Bureau:
o Administers the collective bargaining agreements;
o Represents the State, in cooperation with the Attorney General, in all grievance actions before the Public Employee Labor Relations Board;
o Investigates, prepares and represents the State in grievance, mediation and settlement negotiations; and,
o Provides technical advice and interpretations to all state agencies to ensure consistent policies and practices are followed in compliance with the State’s collective bargaining agreements.
COLLECTIVE BARGAINING
As of the date of this report, the following seven unions represent state employees:
State Employees’ Association (SEA)
The State Employees’ Association of New Hampshire Inc.-SEIU Local 1984 is the exclusive bargaining representative of the majority of classified employees in the state system. Certified bargaining units represented by State Employees’ Association include:
Adjutant General Administrative Services Department Agriculture Department Banking Department Business and Economic Affairs Department Corrections Department (except Probation Parole Officers I-III and Corrections
Officer - Corporal) Education Department Employment Security Environmental Services Department Fish and Game Department (except all Conservation Officers) Health and Human Services Department Human Rights, Commission for Information Technology Department Insurance Department Labor Department Liquor Commission (except Liquor Investigators and Liquor Investigator Sergeants)

93
Lottery Commission Natural and Cultural Resources Department Postsecondary Education Commission Professional Licensure & Certification, Office of Revenue Administration Department Safety Department (except for State Police Troopers, State Police Sgts., and State
Police Command Staff) Supervisory Unit Transportation Department Treasury Department Veterans Home
New Hampshire Troopers Association (NHTA) The sworn non-commissioned employees of the Division of State Police have been represented by the New Hampshire Troopers Association since 1997. This bargaining unit includes the State Police Troopers and State Police Sergeants.
New Hampshire Troopers Association – Command Staff The State Police Command Staff group are represented by the New Hampshire Troopers Association (NHTA). This bargaining unit includes State Police Captains, State Police Lieutenants, and State Police Majors.
New England Police Benevolent Association (NEPBA)
Certified bargaining units represented by the NEPBA currently include: NH Fish and Game Conservation Officers, Local 40 NH Fish and Game Supervisory Officers, Local 45 Liquor Investigators, Local 260
New Hampshire Probation and Parole Command Staff (NHPPCS)
Certified bargaining units represented by the NHPPCS include all Probation and Parole Officers III.
New Hampshire Probation and Parole Officers Association (NHPPOA) Certified bargaining units represented by the NHPPOA include all Department of Corrections Probation/Parole Officers I and II.
Teamsters Local 633 The Teamsters Local 633 represent the following bargaining unit: NH State Corrections Officers and Corrections Officer Corporals

94
EMPLOYEES BY UNION REPRESENTATION*
Fiscal Year 2020
Union # of Represented
Employees
New England Police Benevolent Association Local 40 28
New England Police Benevolent Association Local 45 15
New England Police Benevolent Association Local 260 17
New England Police Benevolent Association Local 265 1
New Hampshire Probation and Parole Officers I & II 61
New Hampshire Probation and Parole Officers III Command 11
New Hampshire Troopers Association 306
New Hampshire Troopers Association-Command Staff 22
The State Employees' Association of NH, SEIU Local 1984 8,654
Teamsters Local 633 294
Total 9,409
* Includes classified full-time permanent and full-time temporary employees, as well as part-time represented employees of the Liquor Commission. Part-time liquor retail store employees who work 26 weeks or more in one year and who average 10 hours per week are considered part of the bargaining unit.
* Confidential employees are excluded. * 6 classified employees did not meet any group criteria and are excluded from this report.
Report Generated 06/30/2020 by Employee Matrix Version V6.4
POSITIONS BY UNION REPRESENTATION*
Fiscal Year 2020
Union # Positions
New England Police Benevolent Association 40 30
New England Police Benevolent Association 45 16
New England Police Benevolent Association 260 17
New England Police Benevolent Association 265 1
New Hampshire Probation and Parole Officers I & II 63
New Hampshire Probation and Parole Officers III Command 11
New Hampshire Troopers Association 330
New Hampshire Troopers Association-Command Staff 23
The State Employees’ Association of NH, SEIU Local 1984 10,364
Teamsters Local 633 421
Total 11,276
*Includes classified full-time permanent and full-time temporary positions expected to last for more than 6 months as
well as part-time represented positions of the Liquor Commission. *This report does not contain 13 positions found in error.
Report Generated 06/30/2020 by Position Matrix V6.2

95
MASTER NEGOTIATIONS Collective Bargaining Agreements between the State and the following unions representing state employees became effective upon execution of their respective agreements through June 30, 2020.
State Employees’ Association (SEA)
New England Police Benevolent Association (NEPBA Locals: 40, 45, 260, 265 and 270)
NH Troopers Association
NHTA – Command Staff
Teamsters Local 633 CHANGES TO 2017-2020 CBA BETWEEN STATE AND ITS UNIONS On June 30, 2020, the State and the Unions were still bargaining. The Collective Bargaining Agreements entered ‘evergreen’ on July 1, 2020. The complete text of the current (2017-2020) Collective Bargaining Agreements with the State Employees’ Association, the NH Troopers Association, New England Police Benevolent Association and the Teamsters can be found on the Division of Personnel’s website under Employee Relations, at the following link: https://das.nh.gov/hr/labor_rel/labor_relations.aspx The 2017-2019 Collective Bargaining Agreements remain in evergreen except with respect to the Teamsters and the NEPBA Liquor Investigators, Local 260 who negotiated changes in the terms of their respective Collective Bargaining Agreements prior to those agreements expiring on June 30, 2019. On October 15, 2020, the State and Unions began negotiations for the 2022-2023 Collective Bargaining Agreements. NEGOTIATED STATE BENEFITS
The Bureau of Employee Relations negotiates on behalf of the State of New Hampshire benefits for Executive Branch employees. Additionally, it is the responsibility of the Bureau to ensure that all of these benefits are implemented in compliance with the respective Collective Bargaining Agreements. These benefits include but are not limited to:
Wages
Overtime and Compensatory Time
Health Insurance
Prescription Drug Plan
Wellness & Health Promotion
Dental Insurance
Life Insurance
Short Term Disability Income Protection
Basic Work Week
Schedules – Flexible or Alternative
Meal Periods and Breaks
Holidays
Annual Leave
Sick Leave
Civil Leave
Safety and Health Protection
Travel Reimbursement

96
BUREAU OF EDUCATION AND TRAINING
The Division of Personnel, Bureau of Education and Training (BET) provides education, training, and resources that enhance the skills, knowledge, and abilities of government employees who service the citizens of New Hampshire, as directed under RSA 21-I:42,XIV-XVII. To fulfill this mission, the Bureau is committed to the following guiding principles:
Deliver cost-effective, quality training using skilled and knowledgeable trainers, facilitators, teachers, and eLearning tools.
Offer a variety of training opportunities designed for adult learners.
Provide training resources and consulting services to state agencies.
Provide training specified by RSA 21-I:42.
BET Program Summary
BET delivered the following programs in FY 2020:
Certified Public Manager (CPM) Program – Level I and Level II
Lean Process Improvement Initiatives and Certificate Programs – Lean White, Yellow, Green, and Black Belts
Foundations of State Supervision and Foundations Review
Professional skill development resources and classes
Sexual Harassment Training (Online)
Respect in the Workplace Training (Online)
State of NH Investigator Training (in collaboration with DOJ)
Newsletter series with training and professional developmental resources for employees and managers during COVID-19 State of Emergency
Employee communication support during COVID-19 State of Emergency BET revenues just exceeded $250,000 for FY 2020, a slight reduction from typical revenues in prior years. However, the total number of students enrolled declined more significantly in FY 20, to just over 900 students from an average of over 1,550 students per year in FY 18-19. The decline in the number of students is partially due to the cancellation of many classes in late FY 20 due to COVID-19 but also, we suspect, due to significant price increases implemented for FY 20. BET plans to evaluate its pricing and expected revenue and costs in FY 21 to ensure that pricing is appropriate to maximize participation in training while fully covering BET’s costs. The COVID-19 pandemic in FY 20 required rapid and significant adjustment to BET’s instruction. Following the departure of two full-time instructors, the remaining part-time instructors quickly adapted remaining coursework under the CPM program to ensure students could finish the year and earn their certificates despite restrictions on gathering for in-person classes. BET further adapted to provide an online graduation ceremony for students. Finally, BET has begun converting all in-person classes from its core curriculum to web-based trainings using the State’s online learning platform, Moodle, and is working to identify ways to maintain revenues in FY 21 despite an anticipated reduced demand for training from State agencies. Moving to online instruction allows BET to continue to serve NH public employees during the pandemic and beyond with greater flexibility for students and also expands BET’s potential reach to students outside of NH state government.

97
BET needs to address staffing concerns going into FY 2021. As our online/eLearning presence grows, so does the demand for support of agencies and our own BET programming. In addition, BET has maximized the capacity of our part-time instructors and needs to expand our instructor and/or contractor pool to continue to offer a full-suite of professional development and public management courses, along with specialized trainings for individual audiences and programs.
New Hampshire Certified Public Manager Program
Since FY 1996, the Bureau has offered a Certified Public Manager Program (CPM) for New Hampshire: state, county, municipal and school district employees, as required by statute (RSA 21-I:42,XVII(a)(3)). The aim of the NH CPM program is to elevate the standard of practice in public management of state and local governments. The program uses a system of competency-based training to measure and then develop participants’ professional competencies in the field of public management.
The Level I program is available to supervisors and individuals who planned to enter a supervisory role. The Level I program takes students one year to complete with over 150 hours of core course work. Successful completion of the program earns participants the designation of Certified Public Supervisor (CPS).
The Level II program is available to supervisors and managers who had already successfully completed Level I. Level II required an additional 120 hours of core course work as well as participation in a team project that required 60 to 100 hours of time. Students that completed the program earned the Certified Public Manager® (CPM) designation. The CPM designation is a registered service mark of the National Certified Public Manager Consortium. The BET Certified Public Manager® program is nationally accredited.
In Fiscal Year 2020, there were 74 graduates from the Level I program and 45 graduates from Level II.
Professional Development Classes
In addition to the CPM program, BET continues to offer a full suite of professional development and applied learning classes. In FY 2020, BET delivered 28 professional development classes to 630 state and 167 local and county employees. A list of classes offered and the number of students in each is provided at the end of this section. State of New Hampshire – Bureau of Education and Training - eLearning
In FY 2020, the Bureau of Education and Training continued to make significant progress in developing the statewide online learning management system (LMS), Moodle, and solidifying BET as the best option to provide centralized online learning management resources for State of New Hampshire employees. During FY 2020, BET accomplished the following:
Facilitated the State of New Hampshire MOT (Moodle Oversight Team) and participated in testing with Department of Information Technology (DoIT);
Developed strategic partnerships with agencies throughout the state around online learning and provided training and technical assistance to several agencies (Env. Services, DHHS, & DAS);

98
Collaborated with DoIT and the Department of Administrative Services’ Financial Data Management (FDM) to ensure a great user experience for our online students, including providing Moodle helpdesk ticket support;
Worked with DoIT and FDM to establish and administer a new externally-facing instance of Moodle to enable state employees and non-state individuals to access BET trainings and other required trainings (e.g., Sexual Harassment, Computer Use Policy, and Respect Trainings) without needing access to the State network;
Started the conversion of all of its core curriculum to a web-based format on the external Moodle instance; and
Continued to provide monthly compliance reporting to participating agencies tracking their employees completion of required material, including working to resolve reporting issues with FDM; and
Continues to collaborate with participating agencies, as well as DoIT and FDM, to secure an Enterprise LMS (e.g., an Enterprise Moodle license or Infor LMS (tied to NH FIRST)). BET submitted a federal grant application as well as an FY 22/23 budget request to support this need. An Enterprise class LMS will equip BET to better support other State agencies that need to provide online training and/or certifications but cannot support their own LMS.
Significant Training Initiatives During FY 2020, DOP/BET staff collaborated with multiple agencies and DAS leadership to create three versions (Executive Leadership, Supervisor/Manager, and All Employee) of the Respect and Civility in the Workplace training that will support Executive Order 2020-1. Making this course content easily available online and trackable is an essential component of the state’s new Respect program, which will roll out in FY 2021.
FY 2020 Professional Development Classes
Non-State
Students
State Employee Students
Total # Students
Business Etiquette 1 13 14
Business Writing 9 16 25
Classification Coordinator 5 5
Coffee & Conversation 83 40 123
Communication Skills 1 14 15
Conflict Resolution 2 5 7
Customer Service 4 8 12
Difficult Conversations I 1 8 9
Employee Investigations 61 61
Excel I 12 31 43
Excel II 7 18 25
Family Medical Leave Act 5 5
Foundations Of Supervision
3 26 29
Foundations Review 40 40
Lean Black Belt 4 3 7
Lean Green Belt 7 9 16
Lean White Belt 6 6
Lean White Belt-Online 2 214 216
Lean Yellow Belt 42 42
Managing-Union Environment
6 3 9
MBTI 1 1
Microsoft Overview 3 10 13
Personnel Rules 4 11 15
PowerPoint I 1 3 4
Prepaid Program 6 6
Proactive Leadership 2 5 7
Project Management 7 6 13
Public Speaking I 3 9 12
Time Management 5 12 17
TOTAL 167 630 797
Copyright © 2022 FDOKUMEN