
Smart Metering and Its Use for Distribution Network Control
200
Smart Metering and Its Use for Distribution Network Control Alasdair H. Burchill School of Engineering Cardiff University Thesis submitted in partial fulfilment of the requirements for the degree of Doctor of Philosophy 2018
-
Upload
khangminh22 -
Category
Documents
-
view
1 -
download
0
Transcript of Smart Metering and Its Use for Distribution Network Control

Smart Metering and Its Use for
Distribution Network Control
Alasdair H. Burchill
School of Engineering
Cardiff University
Thesis submitted in partial fulfilment of the requirements
for the degree of Doctor of Philosophy
2018

ii
This page intentionally left blank

iii
Dedicated to the memory of my dear friend Jess

iv
This page intentionally left blank

v
Abstract
Global energy demand is increasing, with the adoption of electric vehicles, in
particular, representing a significant prospective demand on electricity distribution
networks. The exploitation of renewable generation sources, driven by increased
economic viability, technological maturity, and the need for environmental
sustainability, is expected to play an increasingly important role in meeting this
demand. However, the adoption of such low-carbon technologies necessitates a
significant change in the way that distribution networks are monitored and controlled.
This work examines the state of the art in the impact of low-carbon technologies on
distribution networks, the technical strategies available to mitigate these impacts and
their relative merits, and the architecture of the control systems used to effect such
strategies. Smart metering and advanced metering infrastructure (AMI) are a
fundamental component of these smart grid systems, providing widespread visibility of
conditions at the very periphery of distribution networks which has not previously been
feasible, but where the impact of low-carbon technologies is significant. This work
describes the development of a hardware-in-the-loop test rig incorporating multiple,
custom-built, hardware smart meter test beds, and the use of this test rig to
demonstrate the implementation of real-time voltage control within a simulated low
voltage (LV) distribution network. However, the adoption of smart metering and AMI
inevitably incurs cyber security vulnerabilities which did not exist in the case of meters
with no facility for remote communication. This work examines cyber security issues
pertinent to smart grids and AMI in particular, and describes the analysis of the cyber
security vulnerabilities of a commercially deployed smart electricity meter. The
exploitation of these vulnerabilities in a manner which permits unauthorised electronic
access to the device is also described. Finally, recommendations are made of revisions
to the hardware, firmware and communications protocols used by the compromised
meter which may mitigate the vulnerabilities identified.

vi
This page intentionally left blank

vii
Contents
Page
Acknowledgements xi
Abbreviations xiii
Symbols xvii
1 - Introduction 1
1.1 - Background 1
1.1.1 - Energy demand and renewable generation 1
1.1.2 - Electric vehicles 3
1.1.3 - Smart grids 4
1.1.4 - Smart electricity meters 6
1.2 - Research objectives and structure 9
1.2.1 - Research objectives 9
1.2.2 - Thesis structure 10
2 - Literature review 11
2.1 - Introduction 11
2.2 - Conventional distribution network control 11
2.2.1 - Automatic voltage control 12
2.2.2 - Line drop compensation 14
2.2.3 - Voltage regulators and capacitor banks 14
2.3 - The impact of distributed generation 15
2.3.1 - Voltage regulation 16
2.3.2 - Voltage imbalance 24
2.3.3 - System protection 26
2.3.3.1 - Unintended islanding 26
2.3.3.2 - Protection blinding 28
2.3.3.3 - False tripping 28
2.3.3.4 - Reclosure impediment 29
2.3.4 - The impact of electric vehicle charging 29
2.4 - Strategies for distribution network voltage control 32
2.4.1 - On-load tap changers 33
2.4.2 - Reactive power control of distributed generation 39
2.4.3 - Energy storage 43
2.5 - The architecture of distribution network control 43

Contents
viii
2.5.1 - Centralised vs decentralised control 43
2.5.2 - The architecture of schemes that have been deployed 46
2.6 - Smart meter and AMI security 47
2.6.1 - Conventional electricity meter security 47
2.6.2 - Electricity distribution as a target for attack 48
2.6.3 - Smart meters and AMI as targets for attack 49
2.6.3.1 - Theft of data 51
2.6.3.2 - Theft of energy 51
2.6.3.3 - Denial of energy 52
2.6.3.4 - Disruption of network control 52
2.6.4 - Vulnerabilities and constraints of smart meters and AMI 52
2.6.5 - The security of existing smart meter and AMI schemes 54
2.6.6 - Published smart meter and AMI attacks, and tools 55
3 - Design and development of the smart meter test rig 57
3.1 - Introduction 57
3.2 - Smart meter test bed platform and test rig design 58
3.2.1 - Smart meter test bed platform 58
3.2.2 - Test rig 59
3.3 - Smart meter test bed platform development 61
3.3.1 - Hardware 61
3.3.1.1 - Processor, memory and supporting devices 63
3.3.1.2 - Local interfaces 64
3.3.1.3 - WAN and HAN interfaces 64
3.3.1.4 - ADC and filtering 67
3.3.1.5 – PCB design and assembly 71
3.3.2 - Firmware 71
3.4 - Test rig development 77
3.4.1 - Real Time Digital Simulator 77
3.4.2 - SCADA server 78
3.4.3 - GPRS server 79
3.4.4 - Controller 81
3.4.5 - Physical architecture 81
3.5 - Commissioning 83
3.5.1 - Commissioning test design 83
3.5.2 - Simulated network 84
3.5.3 - Voltage control script 85
3.5.4 - Test setup 86
3.5.5 - Commissioning test results 86
3.6 - Discussion 88

Contents
ix
3.7 - Conclusion 90
4 - Distribution network voltage control using smart meters 91
4.1 - Introduction 91
4.2 - LV network model 92
4.2.1 - Simulation topology 92
4.2.2 - Network source and transformer configuration 93
4.2.3 - Cable modelling 94
4.2.4 - Load/source block design 95
4.2.5 - Dynamic load module control 95
4.2.6 - Power injection subsystem design and control 96
4.3 - Development of the smart meter voltage alarm function 100
4.4 - Development of the automatic voltage controller 101
4.5 - Experimental setup 108
4.5.1 - Configuration of measuring equipment 108
4.5.2 - Telecommunications system 109
4.5.3 - Test parameters 111
4.6 - Test scenarios 111
4.6.1 - Scenario 1: High demand 111
4.6.2 - Scenario 2: High levels of distributed generation 116
4.6.3 - Scenario 3: Heavy, imbalanced loading 120
4.6.4 - Scenario 4: Heavy loading and high levels of distributed generation 124
4.7 - Discussion 128
4.8 - Conclusion 131
5 - Smart meter and AMI security 133
5.1 - Introduction 133
5.2 - Vulnerability analysis 134
5.2.1 - Prior information 134
5.2.2 - Analysis of hardware 135
5.2.3 - Testing of optical interface 136
5.2.4 - Choice of attack methodologies 137
5.3 - Attack toolkit 138
5.3.1 - Architecture 138
5.3.2 - Hardware 138
5.3.3 - Base operating system and software 139
5.4 - Attack procedure 139
5.4.1 - Attack 1 139
5.4.2 - Attack 2 148
5.5 - Attack results analysis 150

Contents
x
5.5.1 - Introduction 150
5.5.2 - Attack 1 150
5.5.3 - Attack 2 151
5.6 - Recommendations 152
5.7 - Conclusion 155
6 - Conclusions and further work 157
6.1 - Conclusions 157
6.1.1 - Distribution network control 157
6.1.2 - Smart meter and AMI security 159
6.1.3 - Further achievements of research 160
6.2 - Further work 161
6.2.1 - Distribution network control 161
6.2.2 - Smart meter and AMI security 161
References 163

xi
Acknowledgements
I am indebted to Prof Nick Jenkins for his unfaltering encouragement, patience, and
meticulous review of my work.
Thanks are also due to Dr Jianzhong Wu, Dr Janaka Ekanayake, Dr Carlos Uglade-Loo
and Dr Lee Thomas, for their academic wisdom and support, to Denley Slade, Paul
Farrugia, Richard Rogers and Bill Whitehouse, for their technical support and good
humour, and to Aderyn Reid, Jeanette Whyte, Chris Lee and Chiara Singh-Fisher, for
their administrative support and free sandwiches.
I am of the opinion that the refectory and the public house are at least as fertile venues
for inspiration as the office and the laboratory, so I thank my colleagues and friends
for their companionship and intellectual discussion, in particular George O'Malley, Dr
Luke Livermore, Dr Marc Rees, Dr Jonathan Stevens, Dr Ben Whitby, Dr Ian Moore, Dr
Dave Clark, Dr Tracy Sweet and Catherine Roderick.
Finally, I would like to thank close friends for their patience and support over the
journey which this thesis represents, in particular Jon Dickerson, Fabian Moore, Sarah
Tatum, Julie Crowley, Tracey Plowman, Dr Davina Darmanin and Dr Edd Lewis. I would
like to thank my mother, for instilling in me a sense of self-belief and confidence which
has served me well, and my partner Claire, for her immense patience and care.

xii
This page intentionally left blank

xiii
Abbreviations
2G Second-Generation cellular technology
AC Alternating Current
ACCM Asynchronous Control Character Map
ADC Analogue to Digital Converter
AES Advanced Encryption Standard
AMI Advanced metering infrastructure
AMR Automatic Meter Reading
ANSI American National Standards Institute
AT Attention
AVC Automatic Voltage Control
AVR Automatic Voltage Regulator
AVRS Automatic Voltage Reference Setting
BEV Battery Electric Vehicle
BPL Broadband over Power Line
CCDF Complementary Cumulative Distribution Function
CCITT Consultative Committee for International Telephony and Telegraphy
CESG Communications-Electronics Security Group
CHAP Challenge Handshake Authentication Protocol
CHP Combined Heat and Power
CIA Confidentiality, Integrity and Availability
CNE Combined Neutral and Earth
COSEM Companion Specification for Energy Metering
CPA Commercial Product Assurance
CPU Central Processing Unit
CRC Cyclic Redundancy Check
CSC Constant Set-Point Control
CTS Clear To Send
DAC Digital to Analogue Converter
DECC Department of Energy & Climate Change
DG Distributed Generation
DH Diffie-Hellman
DLMS Device Language Message Specification
DNO Distribution Network Operator
DNP3 Distributed Network Protocol
DoS Denial of Service
DSA Digital Signature Algorithm
DSM Demand-Side Management
Abbreviations
xiv
DSTATCOM Distribution Static Compensator
DTI Department of Trade and Industry
EEPROM Electrically Erasable Programmable Read-Only Memory
EHP Electric Heat Pump
ENWL Electricity North West Limited
ETX End of Text
EU European Union
EV Electric Vehicle
FIPS Federal Information Processing Standard
FLAG Ferranti and Landis+Gyr
FP7 7th Framework Programme
GNU GNU's Not Unix
GPC Giga Processor Card
GPRS General Packet Radio Service
GSM Global System for Mobile communications
GTAO Giga Transceiver Analogue Output
GTNET Giga Transceiver Network interface
GTWIF Giga Transceiver Workstation Interface
HAN Home Area Network
HDLC High-level Data Link Control
HMI Human Machine Interface
HV High Voltage (36–300 kV)
IDE4L Ideal Grid for All
IEC International Electrotechnical Commission
IEEE Institute of Electrical and Electronics Engineers
IP Internet Protocol
IPCP Internet Protocol Control Protocol
IPsec Internet Protocol security
IRA Irish Republican Army
IRQ Interrupt Request
ISO International Organization for Standardization
JTAG Joint Test Action Group
LAN Local Area Network
LCD Liquid Crystal Display
LCNF Low Carbon Networks Fund
LCP Link Control Protocol
LCT Low-Carbon Technology
LDC Line Drop Compensation
LED Light Emitting Diode
LOVIA Low Voltage Integrated Automation
LV Low Voltage (<1 kV)

Abbreviations
xv
MCU Metrology and Communications Unit
MDC Meter Data Concentrator
MITM Man-In-The-Middle
MOSI Master Out Slave In
MPAN Meter Point Administration Number
MRU Maximum Receive Unit
MV Medium Voltage (1–36 kV)
NAT Network Address Translation
NCSC National Cyber Security Centre
OECD Organisation for Economic Co-operation and Development
OLTC On-Load Tap Changer
OPC Open Platform Communications
OPERA Open PLC European Research Alliance
PAP Password Authentication Protocol
PCB Printed Circuit Board
PDP Packet Data Protocol
PGA Programmable-Gain Amplifier
PHEV Plug-in Hybrid Electric Vehicle
PLC Power Line Carrier
PMIC Programmable Multilevel Interrupt Controller
PPM Parts Per Million
PPP Point-to-Point Protocol
PQ Power Quality
PV Photovoltaic
QoS Quality of Service
R&D Research and Development
RAM Random Access Memory
RF Radio frequency
RMC Remote Monitoring-Based Control
RMS Root Mean Square
RPC Remote Procedure Call
RS-232 Recommended Standard 232
RTC Real-Time Clock
RTDS Real Time Digital Simulator
RTP Room Temperature and Pressure
RTS Ready to Send
RTT Round-Trip Time
RTU Remote Terminal Unit
RX Receive
SAU Substation Automation Unit
SCADA Supervisory Control And Data Acquisition

Abbreviations
xvi
SCK Serial Clock
SDRAM Synchronous Dynamic Random-Access Memory
SHA Secure Hash Algorithm
SIM Subscriber Identity Module
SM Smart Meter
SMETS Smart Metering Equipment Technical Specifications
SPI Serial Peripheral Interface
SRAM Static Random-Access Memory
SSL Secure Sockets Layer
STX Start of Text
TBC Time-Based Control
TC Timer/Counter
TCP Transmission Control Protocol
TIA Telecommunications Industry Association
TLS Transport Layer Security
TX Transmit
UART Universal Asynchronous Receiver Transmitter
UDP User Datagram Protocol
UK United Kingdom
UKERC UK Energy Research Centre
USART Universal Synchronous/Asynchronous Receiver Transmitter
USB Universal Serial Bus
V2G Vehicle-to-Grid
VUF Voltage Unbalance Factor
WAN Wide Area Network

xvii
Symbols
IK,gen Fault current from distributed generation source (p.u.)
IK,grid Fault current from grid (p.u.)
P Real power (p.u.)
PLINE Active power in line (p.u.)
PLOAD Active power to load (p.u.)
PPV Active power from photovoltaic generation source (p.u.)
Q Reactive power (p.u.)
QLINE Reactive power in line (p.u.)
QLOAD Reactive power to load (p.u.)
QPV Reactive power from photovoltaic generation source (p.u)
REF Substation bus reference voltage (p.u.)
RL Feeder resistance (p.u.)
RSET Resistive set-point (p.u.)
S Apparent power (p.u.)
U0 Busbar voltage (p.u.)
ULC Feeder-end load centre voltage (p.u.)
USET Voltage set-point (p.u.)
V1 DG connection point feeder voltage (V)
V2 DG voltage source voltage (V)
VDG Voltage at DG source (p.u.)
VL Voltage at load (p.u.)
VMAX Maximum voltage measured (p.u.)
VMIN Minimum voltage measured (p.u.)
Vpre-set Default reference voltage (p.u.)
Vref Current reference voltage (p.u.)
Vs Sending-end voltage (p.u.)
X DG source series reactance (Ω)
XL Feeder reactance (p.u.)
XSET Reactive set-point (p.u.)
δ1 DG connection point feeder phase angle (rad)
δ2 DG voltage source phase angle (rad)
ϕ Phase angle of DG source (rad)
IK,gen Fault current from distributed generation source (p.u.)
IK,grid Fault current from grid (p.u.)
P Real power (p.u.)
PLINE Active power in line (p.u.)

Symbols
xviii
PLOAD Active power to load (p.u.)
PPV Active power from photovoltaic generation source (p.u.)

1
1 - Introduction
1.1 - Background
Worldwide, electricity systems are undergoing rapid change. As energy demand
increases, renewable generation sources are becoming widely adopted. Smart meters
are a fundamental element of the smart grids needed to accommodate such
developments, and are the subject of this research.
1.1.1 - Energy demand and renewable generation
Global energy consumption in 2050 is predicted to be more than 50 % greater than in
2018. More than half of this increase is expected to be driven by economic
development and growing populations in non-OECD countries, such as India and China
[1]. This is shown in Figure 1.1 [1].
Figure 1.1: World energy consumption [1]
Renewable energy is predicted to be the fastest-growing electricity generation source,
with increased economic viability, technological maturity, and the need for
environmental sustainability expected to result in renewable sources contributing
almost 50 % of world electricity generation in 2050. Of these renewable sources, the
greatest increase is predicted to be in wind and solar generation [1]. This is shown in
Figure 1.2 [1].

1 - Introduction
2
The European Union (EU) has committed to reduce greenhouse gas emissions to 80–
95 % below the levels in 1990, by 2050. In order to achieve this, a greater proportion
of electricity in total energy consumption is proposed, up to 39 % by 2050, of which up
to 97 % is to be generated by renewable sources [2].
Figure 1.2: Global electricity generation [1]
More immediately, the 2009 Renewable Energy Directive [3], a component of the EU’s
2020 climate & energy package, requires member countries to increase the proportion
of renewable energy in their national consumption, with an overall European target of
20 % by 2020. This represents more than double the 2010 proportion of 9.8 %.
Under the Renewable Energy Directive [3], targets for renewable production were based
on member countries’ current capacity, and anticipated scope for growth. In the case
of the UK, the target is 15 %. In response to this, the Government’s 2010 National
Renewable Energy Action Plan for the United Kingdom [4] proposed a target of 30 %
renewable electricity generation by 2020. In 2019, renewables constituted 36.9 % of
total UK electricity generation, with an installed capacity of 47.4 GW at the end of 2019
[5]. This is shown in Figure 1.3 [6].
At the end of May 2020, solar photovoltaic (PV) generation capacity in the UK was
approximately 13 436 MW across 1 036 077 installations, or 28 % of total renewable
generation capacity. Small-scale installations of up to 4 kW represent approximately
20 % of solar PV generation capacity in the UK [7], encouraged by feed-in tariffs
introduced under the Energy Act 2008 [8], and available from 2010.

1 - Introduction
3
Figure 1.3: UK electricity generation by fuel type [6]
1.1.2 - Electric vehicles
The global electric car stock, including both purely electric, battery electric vehicles
(BEVs), and plug-in hybrid electric vehicles (PHEVs), reached 7.2 million vehicles in
2019. The stock of electric buses also increased to approximately 500 000 vehicles,
and the stock of two-wheeled electric vehicles reached 350 million. By 2030, the global
stock of electric cars and commercial vehicles is predicted to be as high as 245 million
[9]. The evolution of the global electric car stock from 2013 to 2017, and now
dominated by China, is shown in Figure 1.4 [9].
Figure 1.4: Evolution of the global electric car stock, 2013–2017 [9]
1 - Introduction
4
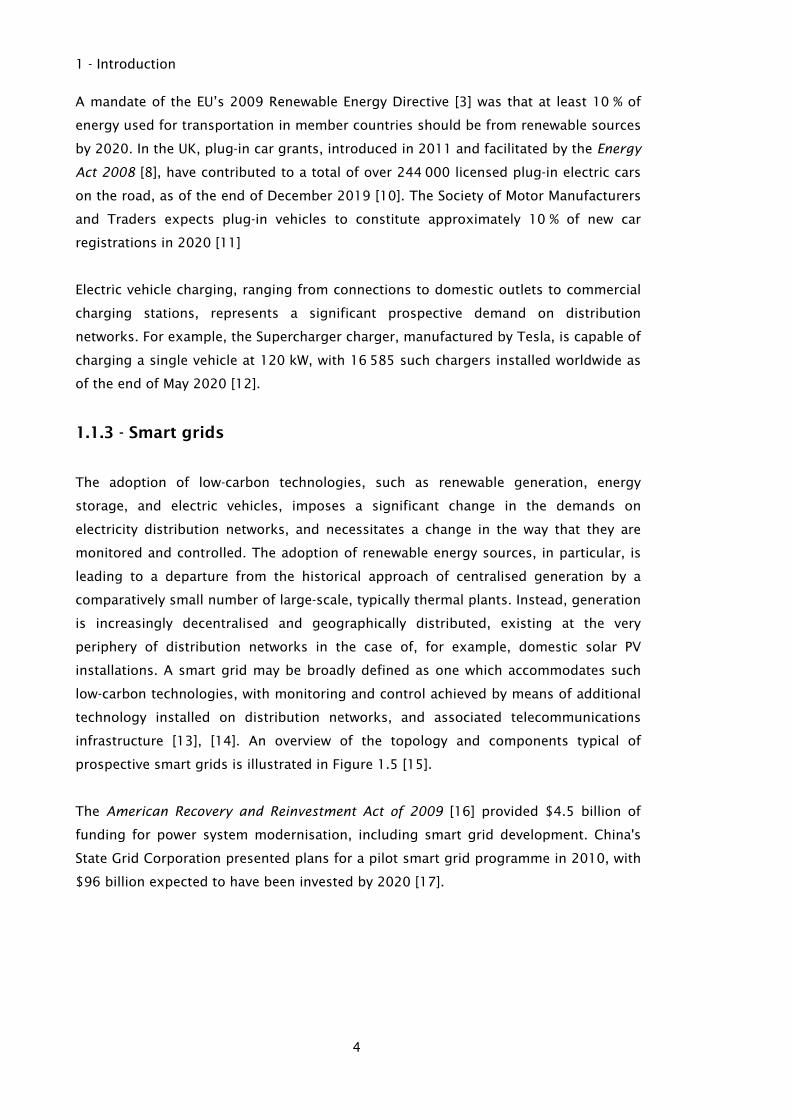
A mandate of the EU’s 2009 Renewable Energy Directive [3] was that at least 10 % of
energy used for transportation in member countries should be from renewable sources
by 2020. In the UK, plug-in car grants, introduced in 2011 and facilitated by the Energy
Act 2008 [8], have contributed to a total of over 244 000 licensed plug-in electric cars
on the road, as of the end of December 2019 [10]. The Society of Motor Manufacturers
and Traders expects plug-in vehicles to constitute approximately 10 % of new car
registrations in 2020 [11]
Electric vehicle charging, ranging from connections to domestic outlets to commercial
charging stations, represents a significant prospective demand on distribution
networks. For example, the Supercharger charger, manufactured by Tesla, is capable of
charging a single vehicle at 120 kW, with 16 585 such chargers installed worldwide as
of the end of May 2020 [12].
1.1.3 - Smart grids
The adoption of low-carbon technologies, such as renewable generation, energy
storage, and electric vehicles, imposes a significant change in the demands on
electricity distribution networks, and necessitates a change in the way that they are
monitored and controlled. The adoption of renewable energy sources, in particular, is
leading to a departure from the historical approach of centralised generation by a
comparatively small number of large-scale, typically thermal plants. Instead, generation
is increasingly decentralised and geographically distributed, existing at the very
periphery of distribution networks in the case of, for example, domestic solar PV
installations. A smart grid may be broadly defined as one which accommodates such
low-carbon technologies, with monitoring and control achieved by means of additional
technology installed on distribution networks, and associated telecommunications
infrastructure [13], [14]. An overview of the topology and components typical of
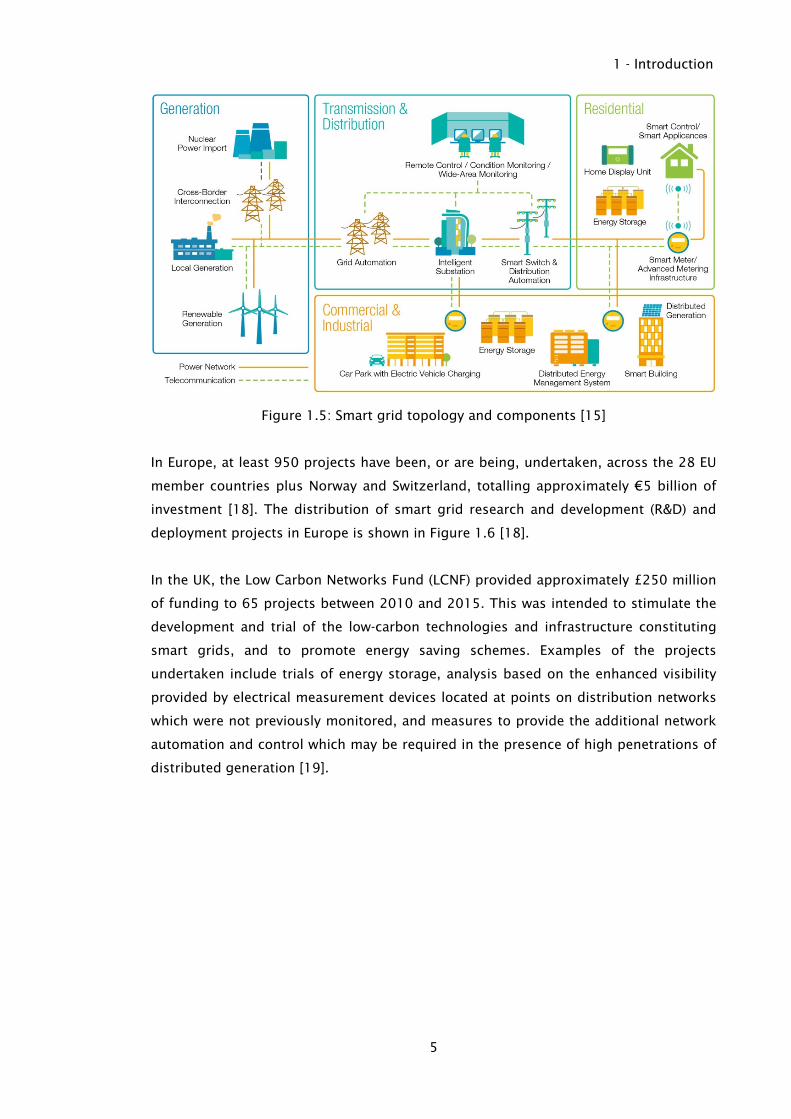
prospective smart grids is illustrated in Figure 1.5 [15].
The American Recovery and Reinvestment Act of 2009 [16] provided $4.5 billion of
funding for power system modernisation, including smart grid development. China's
State Grid Corporation presented plans for a pilot smart grid programme in 2010, with
$96 billion expected to have been invested by 2020 [17].
1 - Introduction
5
Figure 1.5: Smart grid topology and components [15]
In Europe, at least 950 projects have been, or are being, undertaken, across the 28 EU
member countries plus Norway and Switzerland, totalling approximately €5 billion of
investment [18]. The distribution of smart grid research and development (R&D) and
deployment projects in Europe is shown in Figure 1.6 [18].
In the UK, the Low Carbon Networks Fund (LCNF) provided approximately £250 million
of funding to 65 projects between 2010 and 2015. This was intended to stimulate the
development and trial of the low-carbon technologies and infrastructure constituting
smart grids, and to promote energy saving schemes. Examples of the projects
undertaken include trials of energy storage, analysis based on the enhanced visibility
provided by electrical measurement devices located at points on distribution networks
which were not previously monitored, and measures to provide the additional network
automation and control which may be required in the presence of high penetrations of
distributed generation [19].

1 - Introduction
6
Figure 1.6: Smart grid R&D and demonstration projects in Europe [18]
1.1.4 - Smart electricity meters
In their most basic form, smart meters are distinguished from conventional utility
meters by the facility to electronically communicate the values they measure and
record to utilities, for the purpose of billing. This negates the requirement for manual
meter reading, and provides the facility for more granular recording of energy
consumption. Meters which fulfil this requirement are typically referred to as
components of an automatic meter reading (AMR) infrastructure. More advanced smart
electricity meters, capable of high-speed, two-way communication with utilities and
other head-end systems, offer the facility of readings taken on demand, as well as the
potential for demand-side management (DSM), for example by means of real-time
pricing, or electrical measurements taken for the purpose of distribution network
monitoring. Such meters are typically referred to as components of an advanced
metering infrastructure (AMI) [13], [20]. The evolution of smart meter technology is
shown in Figure 1.7 [21].

1 - Introduction
7
Figure 1.7: Smart meter technology evolution [21]
The fundamental elements of a smart meter, from acquisition of measurements of the
electrical network to which it is connected, to communication with the utility or head-
end system via a wide area network (WAN), are illustrated in Figure 1.8 [13].
Figure 1.8: Functional block diagram of a smart meter [13]
AMI is considered to be a foundation investment in smart grids by enabling control at
customer level, for example in the case of DSM, as well as by providing real-time
visibility for the purpose of distribution network control and automation [20], [22].
This is shown in Figure 1.9 [20]
Globally, smart meter penetration is expected to reach approximately 53 % by the end
of 2025 [23]. In Europe, legislation [24] under the EU’s Third Energy Package mandates
that, subject to a positive long-term cost-benefit analysis, member countries should
equip 80 % of consumers with smart electricity meters by 2020. In the UK, there were
approximately 16 485 000 smart meters operating in domestic and small commercial
premises, as of the end of December 2019 [25].
From the perspective of both cyber security and security of supply, the adoption of AMI
incurs significant potential vulnerabilities. These range from the compromise of
consumer privacy by the inference of behaviour from energy consumption patterns, to
the disruptive injection of false data, in the case that measurements from smart meters

1 - Introduction
8
Figure 1.9: Smart metering and smart grid return on investments [20]
are used to inform distribution network control and automation. Where a remote
supply disconnection facility is included within the smart meter, this represents a
critical further vulnerability [26]–[28].
In the United States, the National Institute of Standards and Technology (NIST) has
issued guidelines for security in smart grid infrastructure, including smart meters [29].
In turn, these guidelines cite existing standards for more general cyber security, for
example the Federal Information Processing Standard (FIPS) Minimum Security
Requirements for Federal Information and Information Systems [30], and Security
Requirements for Cryptographic Modules [30], commonly known as FIPS 140-2. Such
standards are readily applicable to AMI, owing to its close relation to existing, security-
critical infrastructure, such as that for smart payment cards.
In 2012, the European Commission issued recommendations outlining the necessity
for the mitigation of risks to privacy, personal data and security in the course of smart
metering deployment [31]. An expert working group established by the European
Commission, within its Smart Grids Task Force [32], has also issued broad cyber
security guidance on smart grids, including AMI [33].
In the UK, the current Smart Metering Equipment Technical Specifications (SMETS 2)
[34], issued by the Department of Energy & Climate Change (DECC), stipulate basic

1 - Introduction
9
security functions required of smart metering equipment, for example the support of
specific cryptographic algorithms, and the secure storage of security credentials. The
specification is supported by companion documents from other UK Government
bodies, for example guidance on achieving certification under the National Cyber
Security Centre’s (NCSC) Commercial Product Assurance (CPA) scheme, issued by the
former Communications-Electronic Security Group (CESG) [35]. This extends the DECC
specification to outline the required behaviour and response of smart metering
equipment in order to mitigate typical vulnerabilities and attacks.
Despite such guidelines and specifications, cyber security attacks have been
demonstrated against commercially deployed smart meters in both the United States
[36] and Europe [37], [38].
1.2 - Research objectives and structure
1.2.1 - Research objectives
The objective of the research described in this thesis was to investigate the impact of
low-carbon technologies such as distributed, renewable generation on distribution
networks, to demonstrate the use of smart metering in mitigating this impact, and to
examine the issue of cyber security in the context of AMI. Particular contributions
include:
• The development of a hardware smart meter test bed platform on which functions
both within the capacity of existing smart meters, and expected to be within the
capacity of future smart meters, may be tested.
• The development of a hardware-in-the-loop test rig, incorporating hardware smart
meter test beds, the infrastructure required for WAN communication with the meters
and for SCADA communication, and a Real Time Digital Simulator (RTDS) simulating
a section of distribution network.
• The demonstration of a closed-loop control system which mitigates the impact of a
high penetration of solar PV generation and electric vehicle charging on a section of
distribution network, informed by real-time measurements from smart meters, and
effected by a distribution transformer equipped with an on-load tap changer (OLTC).
• The demonstration of a cyber security attack in which a security vulnerability present
in a commercially deployed smart meter is analysed, and exploited in a manner
which permits unauthorised electronic access to the device.

1 - Introduction
10
1.2.2 - Thesis structure
Subsequent chapters are structured as follows:
• Chapter 2 examines the state of the art in the impact of low-carbon technologies
such as distributed, renewable generation on distribution networks, the technical
strategies available to mitigate these impacts, and their relative merits, the
architecture of the control systems used to effect such strategies, and the cyber
security issues pertinent to smart grids and AMI in particular.
• Chapter 3 describes the design, development and commissioning of a hardware-in-
the-loop test rig to demonstrate the use of smart meter measurements for
distribution network control, and incorporating multiple hardware smart meter test
beds, the infrastructure required for WAN communication with the meters and for
SCADA communication, and a Real Time Digital Simulator simulating a section of
distribution network. The smart meter test bed platform developed permits the
execution of custom firmware functions, and for the configuration of a wide range of
measurement and communications parameters as required for a particular
experiment.
• Chapter 4 describes the use of the smart meter test rig to demonstrate the
implementation of real-time voltage control within a low voltage (LV) network. This
employs the hardware, and builds on the foundation software and firmware,
described in Chapter 3. A simplified LV network model is developed for execution on
a Real Time Digital Simulator. The development of a voltage alarm firmware function
for the smart meter test bed platform described in Chapter 3, and a voltage
controller, is described. Finally, the operation of the controller is demonstrated in
case studies illustrating scenarios of heavy loading, high levels of distributed
generation, heavy, imbalanced loading, and the conflicting requirements of a
combination of heavy loading and high levels of distributed generation.
• Chapter 5 describes the analysis of the cyber security vulnerabilities of a
commercially deployed smart electricity meter resulting from inadequate provision
for the protection of WAN communication, and for authentication when establishing
connections with the local communications interface of the meter. These
vulnerabilities are exploited, and are demonstrated to permit unauthorised
electronic access to the meter. Recommendations are made of measures to mitigate
the vulnerabilities identified and exploited.
• Chapter 6 provides a conclusion of the research undertaken, and identifies
pertinent, future research avenues, further to this work.

11
2 - Literature review
2.1 - Introduction
The techniques employed for conventional network control, as well as the state of the
art of the impact of distributed generation, strategies to mitigate this impact including
the use of smart metering, and cyber security issues pertinent to smart grids and
advanced metering infrastructure (AMI), are presented.
Subsequent sections are structured as follows:
• Section 2.2 examines the control techniques employed on conventional distribution
networks, in the absence of a high penetration of distributed generation.
• Section 2.3 examines the impact of distributed generation on voltage regulation,
power quality, and system protection, along with the potentially conflicting impact of
electric vehicle (EV) charging.
• Section 2.4 examines control strategies to mitigate the impact of distributed
generation on distribution networks, including the use of smart metering.
• Section 2.5 examines the architecture of schemes to mitigate the impact of
distributed generation on distribution networks.
• Section 2.6 examines the basis for cyber security attacks on smart meters (SMs) and
AMI, as well as the vulnerabilities of such systems, and published attacks.
2.2 - Conventional distribution network control
Voltage control has been employed in conventional distribution network control in
order to provide a voltage at the connection point of customers which is compliant
with applicable standards, for example The Electricity Safety, Quality and Continuity
Regulations 2002 [39] in the UK. Such control is required to accommodate the impact
of varying demand on the voltage drop across transformers and conductors, as power
is conveyed through the distribution network from high voltage (HV), through medium
voltage (MV), to low voltage (LV). This is illustrated in Figure 2.1 [40].

2 - Literature review
12
Figure 2.1: Voltage regulation on MV and LV networks. a: Simplified distribution
network diagram. b: MV and LV network voltage variation [40]
The above figure shows the voltage drop across the MV and LV feeders and the MV/LV
transformer, and the compensatory boost provided by the tap setting of the MV/LV
transformer.
The principal mechanism of voltage control on conventional UK distribution networks
is the variation of transformer tap setting. In the case of HV/MV, or primary
transformers, this is typically achieved by means of on-load tap changers (OLTCs),
operating automatically under load in order to maintain busbar voltage within an
acceptable range. In the case of MV/LV transformers, this is typically achieved by
means of manual, off-load tap selection [40], [41].
2.2.1 - Automatic voltage control
A conventional automatic voltage control (AVC) scheme for the control of OLTC-
equipped HV/MV transformers is illustrated in Figure 2.2 [42].

2 - Literature review
13
Figure 2.2: Basic AVC scheme [42]
Given the voltage set-point USET, the control scheme in the above figure acts to maintain
the busbar voltage Uo within the range:
(2.1)
where the lower boundary ULB is defined as:
(2.2)
and the upper boundary UUB is defined as:
(2.3)
The bandwidth element serves to prevent hunting of the control scheme. This can arise
if a tap change performed to correct for what is deemed to be a low busbar voltage,
results in what is deemed to be a high busbar voltage, or vice versa, resulting in a
continuous sequence of alternate tap-change operations. Accordingly, a bandwidth of
just under twice the transformer tap step is typically employed. The time-delay element
serves to prevent the control scheme performing tap-change operations on the basis of
brief voltage variations, and to limit the total number operations, with the associated
wear on the tap changer mechanism and contacts [40].

2 - Literature review
14
2.2.2 - Line drop compensation
AVC schemes may be extended to account for the resistance and reactance of the
feeder supplied by the transformer, and the current demand, known as line drop
compensation (LDC) [40], [41]. This is illustrated in Figure 2.3 [42]:
Figure 2.3: AVC scheme with LDC [42]
Given the voltage set-point USET, the control scheme in the above figure acts to maintain
the voltage at the feeder-end load centre ULC with the range:
(2.4)
where the lower and upper boundaries are defined as per Equations (2.2) and (2.3)
respectively. In addition to the busbar voltage, the load is also considered under this
scheme, based on measured current, the resistive and reactive set-points RSET and XSET,
derived from the ratios of the voltage and current transformers, and the feeder
resistance and reactance, RL and XL.
2.2.3 - Voltage regulators and capacitor banks
In order to compensate for excessive voltage drop at critical points, voltage regulators
and capacitor banks have sometimes been employed on UK distribution networks. The
voltage regulators are typically autotransformers, equipped with OLTCs. The capacitor
banks may be permanently connected and of a fixed value, or switched in order to

2 - Literature review
15
provide reactive power compensation and boost voltage according to demand [40]–
[43].
2.3 - The impact of distributed generation
The principal impacts of distributed generation (DG) on distribution networks may be
categorised as follows [44]–[50]:
• Voltage regulation: DG may cause a voltage rise at the point of connection. The
additional demand of other low-carbon technologies, for example EV charging or
heat pumps, if these are located elsewhere on a distribution network, may present a
conflicting technical impact, compounding the issue of voltage regulation. Reverse
power flow resulting from a high DG penetration may also result in undesirable
behaviour in voltage regulation control schemes, for example LDC.
• Power quality: Transient voltage events such as dips and swells may result from
sudden variation in the output of DG sources. DG sources interfaced to the network
by means of power electronics may introduce harmonic distortion. Resonance or
other interactions may also occur between DG sources and other elements of the
distribution network, including voltage control systems. The uneven distribution of
single-phase DG sources across phases, particularly on LV feeders, may result in
voltage imbalance.
• Network losses: DG may reduce network losses by offsetting demand with local
generation. However, if generation significantly exceeds local demand, with
associated reverse power flow, losses may be increased. The thermal limits of
distribution transformers and cables may limit the penetration of DG, as a result of
increased power flow.
• System protection: DG may result in increased fault current levels on a distribution
network. Furthermore, adding additional power sources to a distribution network
may alter the pattern of power flow, and power flow in the opposite direction to
conventional operation may occur. DG may also energise a network, or part of it,
which is otherwise expected to be isolated from the upstream network.
Of the impacts listed above, the effect of DG on voltage regulation, the power quality
issue of voltage imbalance, and system protection, along with the potentially
conflicting impact of EV charging on distribution networks, are considered in further
detail in the following sections.

2 - Literature review
16
2.3.1 - Voltage regulation
Injection of real power into a distribution network by a DG source results in a voltage
rise at the point of connection [46], [51]. The regulatory limits prescribing voltage on a
distribution network may result in voltage rise being the limiting factor to the
penetration of DG. In a simple, radial feeder, the voltage rise caused by a DG source at
its point of connection may be approximated as [45], [52], [53]:
(2.5)
where PG and QG are the real and reactive power output of the DG source, PL and QL are
the real and reactive power dissipation of the load, R and X are the resistance and
reactance of the feeder, and V is the line voltage at the connection point of the DG
source [45]. From this, it can be seen that the effect on voltage of DG sources located
further from the substation will be more significant than those located closer to it. It
can also be seen that whilst the injection of active power will result in a voltage rise,
the injection or consumption of reactive power by the DG source will also result in an
increase or decrease in voltage, respectively [46], [51]. At present, however, standards
prescribing the operation and connection of small scale DG sources typically restrict
their power factor to approximately unity, such as 1.00 ± 0.05 in the case of
Engineering Recommendation G83/2 in the UK [54], and an average, lagging power
factor of no less than 0.90, at 50 % load, in the case of IEC 61727 [55].
Real power injected by DG sources serves to offset the power dissipation of local loads
which would otherwise be served by the upstream network. If the power injection of
DG sources exceeds the power dissipation of local loads then reverse power flow,
relative to the direction of flow in the absence of DG, will occur. A simplified, radial
feeder is illustrated in Figure 2.4 [56].

2 - Literature review
17
Figure 2.4: Simplified distribution system model [56]
Given a fixed load, the reduction and subsequent reversal of real power flow in such a
network, as a result of increasing power injection, will cause the voltage at the point of
connection to rise until a limit is reached. This is shown in Figure 2.5 [56].
Figure 2.5: Voltage at the load bus and line current as a function of PLINE [56]
The effect which DG may have on the voltage profile of a radial feeder under different
levels of demand is shown in Figure 2.6 [50].

2 - Literature review
18
Figure 2.6: Voltage profile on an LV feeder. The second column shows the effect of
solar photovoltaic (PV) inverters [50]
In [57], Ingram et al. present a generic, UK distribution network. This model extends
from a 33 kV, three-phase source, to four 400 V, radial feeders, representative of
urban, low voltage distribution systems. A single line, overview diagram of this
network is illustrated in Figure 2.7 [45].
Figure 2.7: Single-line diagram of the UK Generic Network [45]
DG sources were modelled as single-phase, with a rating of 1.1 kW. DG Penetration is
defined as the percentage of customers with these sources installed, such that 100 %
penetration represents all customers having 1.1 kW of generation capacity, and 200 %

2 - Literature review
19
penetration represents all customers having 2.2 kW. A minimum load of 0.16 kVA per
customer was considered. Of the four LV feeders, three were modelled as lumped
loads, with the fourth represented in detail. The simulation study found that, assuming
a uniform distribution of generation, an upper voltage limit of 10 % was exceeded at
between 40 % and 50 % penetration of the 1.1 kW DG sources operating at rated
output, under minimum load conditions, and dependent on whether a constant
impedance or constant power model was used to represent system loads. Results of
the low voltage feeder remote end voltages, for the constant impedance and constant
power load models, are shown in Figure 2.8 and Figure 2.9 respectively [57].
Figure 2.8: Voltage variation at the remote end of a 400 V feeder with increasing
generation penetration, using a constant impedance equivalent load on the MV system
[57]
Figure 2.9: Voltage variation at the remote end of a 400 V feeder with increasing
generation penetration, using a constant power equivalent load on the MV system [57]
The study of [57] further illustrated that local concentration of DG sources on a
particular feeder results in an upper voltage limit being reached at the feeder end at a

2 - Literature review
20
lower level of DG penetration than can be achieved with uniform distribution of DG
sources.
In [45], Trichakis et al. also performed a simulation study, using the generic, UK
distribution network presented in [57] and illustrated in Figure 2.7. This study
concluded that, assuming a uniformly distributed, minimum load of 61.44 kW at unity
power factor, the maximum, uniformly distributed generation which could be
supported by the network was 185 kW, before an upper voltage rise limit of 10 % was
exceeded. The study further found that this voltage rise limited DG penetration before
the cable and transformer thermal limits, and voltage regulation limits, were reached.
Clustering of the DG sources to one of the four LV feeders was found to reduce the
maximum generation which could be accommodated to 48 kW, whilst clustering of the
DG sources at the ends of the LV feeders was found to limit the maximum generation
to 28 kW, before a 10 % voltage rise limit was reached in both cases.
In [45], Trichakis et al. also performed a study based on an existing UK, urban,
underground, LV distribution network. The network was modelled in Manitoba HVDC
Research Centre’s PSCAD. A single line, overview diagram of this network is illustrated
in Figure 2.10 [45].
Figure 2.10: Single-line diagram of the case study public UK network [45]

2 - Literature review
21
The network illustrated in Figure 2.10 hosts 198 single-phase customers, as well as
public street lighting. For the purpose of the study conducted, all demand is attributed
to customer loads, with a minimum demand of 0.375 kW per customer at unity power
factor. The maximum DG which can be accommodated on this network before a
voltage rise limit of 10 % is reached is concluded to be 204 kW, or 1.03 kW per
customer, with generation distributed uniformly across all customers, and under
minimum loading. With the DG sources distributed uniformly across the 107 customers
of the second LV feeder, the maximum generation which could be accommodated
before this voltage rise limit was reached was found to be 85 kW, or 0.79 kW per
customer.
In [58], Barbato et al. present the results of LV network monitoring by means of smart
meters and MV/LV substation sensors, under the European FP7 project IDE4L. The
network is located in the city of Brescia, Northern Italy, and hosted 299 customers, 118
with residential PV installations, across ten feeders. Figure 2.11 [58] shows the voltage
of the second phase of Feeder 1 of this network, as well as the voltage measured at the
connection points of two customers on the same phase, over one day.
Figure 2.11: Voltage of Feeder 1-phase B compared with the voltage measured on
customer 4 and 7 connected on the same phase. October 10th, 2016 [58]
It can be seen that the voltage at the connection point of customer CU04, with a PV
installation, exhibits a significant rise during the afternoon period of maximum solar
irradiance, compared to that of customer CU07, without a PV installation. Figure 2.12
[58] shows the voltages presented in Figure 2.11, over a period of one week. It is
observed in [58] that, whilst PV generation is responsible for a significant voltage rise,
the customer voltages recorded were within the 230 V ± 10 % range of EN 50160 [59].

2 - Literature review
22
Figure 2.12: Histogram of one week of voltage measurements (Oct. 10th – Oct. 16th)
[58]
The Low Voltage Network Solutions project [60], commissioned by distribution network
operator (DNO) Electricity North West (ENWL), monitored substation voltage and
imbalance, as well as a number of other parameters, on 200 substations across the
ENWL network during 2012 and early 2013. Of these substations, 28 comprised pole
mounted transformers, and 172 ground mounted, with a total of over 1000 LV feeders.
With regard to the penetration of PV, the project found that 61 % of the substations
assessed had between 0.2 % and 49 % of customers with PV installations, with an
average PV installation capacity of 3 kW. Notably, the report found that in 7 % of the
substations, busbar voltages were consistently above 253 V (1.1 p.u.), based on ten-
minute sampling. Further to the project, and to estimate the impact of a greater
penetration of PV generation, a probabilistic impact assessment was performed on 25
ENWL LV networks, with a total of 128 feeders [61]. Under this assessment, PV
installations were modelled with random sizes, distributed according to the statistics
of registered PV installations in the UK at the time of the study [62]. Irradiance was
based on actual measurements recorded by Whitworth Meteorological Observatory at
The University of Manchester. In considering the effect of a range of penetration levels
of PV from 0 to 100 %, defined as the percentage of customers with the technology
installed, a five-minute resolution of the PV data was used with a Monte Carlo method,
and 100 simulations per penetration level. In the feeders with more than 25 customers
connected, the percentage of feeders exhibiting technical issues of non-conformance
with the one-week or ten-minute average voltage ranges of EN 50160 [59], or

2 - Literature review
23
exceeding the capacity of the transformer or conductors, at any level of penetration, is
shown in Figure 2.13 [61]. Other technologies considered in the study, including EVs,
are also shown.
Figure 2.13: Feeders with technical problems per technology (more than 25 customers)
[61]
The above figure shows that voltage issues were found in 64 % of the feeders modelled
with up to 100 % of PV penetration. Figure 2.14 [61] shows the percentage of the
occurrence of either voltage or thermal limits as the first issue in the case of increasing
PV penetration on the feeders found to exhibit either technical issue. Again, other
technologies considered in the study, including EVs, are also shown.
Figure 2.14: First technical issue among the feeders with problems per technology [61]

2 - Literature review
24
This above figure shows that, in all cases where a feeder is found to exhibit a technical
issue, the voltage impact of PV generation is a more significant limit than the thermal
constraints of the transformer and conductors.
2.3.2 - Voltage imbalance
The report System Integration of Additional Micro-generation [63], commissioned by
the Department of Trade and Industry (DTI), asserts that the stochastic model
presumed for the distribution of single-phase loads across the population of customers
served by a three-phase feeder may reasonably be applied to the distribution of single-
phase generation sources, such as PV systems, on an LV network. However, where
imbalance in the distribution of single-phase DG sources across phases does exist, this
can cause a voltage imbalance between phases [64]. This effect will be most
pronounced at downstream points on radial feeders [65]–[67]. As well as resulting in
increased losses from neutral conductor heating, a voltage imbalance is a particular
issue for three-phase motors [64], [68] and variable-frequency drives [69].
Furthermore, the same power flow, imbalanced across phases, will result in less
'headroom' between the lowest or highest phase and prescribed limits, compared to a
balanced condition [67], [70].
True voltage imbalance is defined in the UK [71], and Europe [59], as the ratio of the
negative sequence voltage component to the positive sequence voltage component,
expressed as a percentage. This is referred to as the voltage unbalance factor (% VUF):
(2.6)
The IEEE defines an approximation to this, the phase voltage unbalance rate [72], [73]:
(2.7)
In the UK, Engineering Recommendation P29 defines a % VUF limit of 1.3 %, with up to
2 % permitted for less than one minute [71]. EN 50160 defines a range of 2 % for 95 %
of the ten-minute average period over one week [59].
In [57], analysis of the impact of imbalanced connection of DG sources was conducted
by only connecting generation sources to phase A of the 400 V feeder modelled in

2 - Literature review
25
detail. The resulting % VUF, for the constant impedance and constant power load
models, are shown in Figure 2.15 and Figure 2.16 respectively [57].
Figure 2.15: Voltage imbalance results due to connection of generation on one phase
of a 400V feeder, using constant impedance equivalent load on MV system [57]
Figure 2.16: Voltage imbalance results due to connection of generation on one phase
of a 400V feeder, using constant power equivalent load on MV system [57]
It can be seen from the above figure that the % VUF limit of 1.3 % defined by P29 [71] is
exceeded with a penetration of 1.1 kW DG sources of approximately 150 %.
In [45], Trichakis et al. also examined the issue of imbalance, using the generic, UK
distribution network presented in [57] and illustrated in Figure 2.7. It was found that,
in the case of uniformly distributed, unity power factor DG sources, and at minimum,
uniformly distributed unity power factor load conditions of 61.44 kW or 0.16 kW per
customer, a maximum of 47.8 kW of generation could be supported on one phase of
one feeder before a % VUF limit of 1.3 % was exceeded. In the case of the existing UK,
underground, LV distribution network model also considered in [45] and illustrated in
Figure 2.10, the maximum generation which could be supported, uniformly distributed

2 - Literature review
26
on one phase of the second feeder was approximately the same as for the generic, UK
network, at 47.8 kW. This also reflects the maximum penetration of 150 % of 1.1 kW
DG sources found in [57].
2.3.3 - System protection
In addition to the effect it may have on voltage, the introduction of distributed
generation onto a distribution feeder may increase the magnitude of fault current flow
in the feeder to which it is connected, and in adjacent feeders. It may also have the
effect of changing the direction of fault current flow. Such impacts may require the
uprating of assets such as transformers and conductors, and also have the potential to
cause a number of issues with the operation of protection devices. Existing protection
schemes predicated on one-way current flow may no longer be adequate to protect
feeders hosting a high penetration of distributed generation, and an increase in the
use of dedicated communication to coordinate protection may be required [49], [74].
Protection operation issues of particular concern are the following [44], [46], [75], [76]:
• Unintended islanding
• Protection blinding
• False tripping
• Reclosure impediment
These issues are considered in further detail in the following sections.
2.3.3.1 - Unintended islanding
Islanding occurs when a section of distribution network no longer connected to the
upstream network continues to be energised by distributed generation connected to it.
Although circumstances exist under which this may be desirable, it may present
considerable hazards to equipment, those working on the network, and consumers,
particularly if it is unintended. The most fundamental hazard is injury to consumers or
those working on the network arising from an assumption that, since the local
distribution network is no longer connected to the upstream network, it is no longer
energised [49], [76], [77]. In the event that protection devices have isolated the section
of distribution network from the upstream network due to the detection of a fault on
the local network, DG sources may continue to contribute current to the fault, causing
further damage [49]. A compounding issue is that, whilst it may be sufficient to cause
damage, the fault current contribution of individual DG sources may not be sufficient

2 - Literature review
27
to trigger protection which would otherwise isolate the fault, in a timely manner [46],
[74], [76].
Due to what may be a significant, step change in the load presented to DG sources on
a section of network at the point that it becomes islanded, and also dependent on the
control scheme of the individual DG sources, the voltage and frequency of the islanded
network section may deviate rapidly and substantially from their values prior to
disconnection from the upstream network. This presents a power quality issue which
may damage assets and consumer equipment. It also presents a challenge to
resynchronisation with the upstream network, prior to reconnection to it, and a
considerable hazard if reconnection is attempted without resynchronisation. This
requires dedicated protection infrastructure which would not have been required in the
absence of DG sources [49], [74], [76], [77].
Deviation of voltage and frequency values following islanding of a section of network
are currently the principal means by which islanding is detected [49], [77]. Standards
prescribing the operation of DG sources, such as IEC 61727 [55] and IEEE 1547 [78],
require the inclusion of islanding prevention measures in order that the sources
quickly cease to energise a section of network if it becomes islanded. In the event of a
rapid deviation of voltage and frequency values, ‘passive’ protection may be employed
to isolate the DG source from the network when these values fall outside of an
acceptable window. In the event that the match of load and DG capacity on the
islanded network section is sufficiently good that the deviation of voltage and
frequency occurs too slowly for islanding detection to occur in an acceptable time,
‘active’ protection may be employed. Under such a scheme, the control scheme of the
otherwise voltage following DG source is designed to deviate more rapidly from the
voltage and frequency values prior to islanding, by design. This enables the anti-
islanding protection to detect values which fall outside of an acceptable window, and
hence an islanded condition, more quickly than would otherwise be the case [49], [77].
In the case that auto-reclosing is employed, it is imperative that anti-islanding
protection operates quickly enough that temporary faults are not sustained by the fault
current contribution of DG sources during the dead time of the recloser. Such onerous
timing requirements may preclude the use of voltage and frequency deviation to detect
islanding, and instead require the use of dedicated communication between DG
sources and distribution network protection equipment [74], [76].

2 - Literature review
28
2.3.3.2 - Protection blinding
Protection blinding, also known as protection under-reach, occurs as a result of the
contribution of fault current from DG sources to a fault, in addition to the fault current
from the upstream network. Consequently, the total current at the fault location will
increase, while the contribution from the upstream network will decrease [44], [76].
Dependent on the impedance of the upstream network, the DG sources, and assets
such as transformers and conductors, the current contribution of the upstream
network may be reduced to such a degree in the event of a fault that protection does
not detect it [74], [75]. This is illustrated in Figure 2.17 [44].
Figure 2.17: Principle of blinding of protection [44]
2.3.3.3 - False tripping
Where two or more feeders are supplied from a common substation bus, DG sources
on one feeder may contribute fault current to a fault occurring on an adjacent feeder,
via that bus. In addition to increasing the total fault current, the contribution of current
from the feeder on which no fault is present may be sufficient to trigger the protection
of that feeder, isolating it unnecessarily [44], [49], [75], [76], [79]. This is illustrated in
Figure 2.18 [44]. Directional protection may be used to prevent erroneous tripping of
this sort [44], [46], [49], [76], [80].
Figure 2.18: Principle of false tripping [44]

2 - Literature review
29
2.3.3.4 - Reclosure impediment
Since 80 % of faults occurring on distribution networks are temporary in nature,
reclosers are widely employed, particularly to protect overhead circuits [44], [80].
However, DG sources may continue to supply fault current to a fault on a section of
network during the dead time of the recloser protecting it, preventing arc extinction
and sustaining the fault [44], [74]–[76].
In protection coordination schemes under which an upstream recloser is intended to
prevent downstream protection devices such as fuses from operating in the case of
temporary faults, the additional fault current contributed by DG sources may cause the
downstream protection to operate before the recloser can operate [44], [49]. This is
illustrated in Figure 2.19 [49].
Figure 2.19: How fault contributions from other feeder energy sources such as PV can
interfere with fuse and circuit breaker coordination in fuse-saving schemes [49]
Even during the dead time of a recloser, typically in the order of 0.3–0.6 s [81],
significant deviation of voltage and frequency may occur in an islanded section of
network, energised by DG sources present on it. This loss of synchronisation with the
upstream network presents a significant hazard upon reconnection [74], [76], [77].
2.3.4 - The impact of electric vehicle charging
EV charging, not considering future vehicle-to-grid (V2G) technology, represents a
significant potential load on distribution networks. A typical, residential charging point

2 - Literature review
30
has a rating of 16 A or 3.68 kW [82]. In [70], Rodriguez-Calvo et al. conclude that,
since EV charging is expected to take place predominantly at night, during the period
in which demand from other loads is typically lowest, it does not present such an
immediate issue to voltage compliance as PV adoption. In [83], an aggregated charge
profile for plug-in hybrid electric vehicle (PHEVs) is presented which reflects this,
shown in Figure 2.20. However, it is noteworthy that such a profile is approximately an
inverse of daily solar irradiance and, hence, potential PV output, and EV charging does
have the potential to result in under-voltage conditions, particularly at the ends of
long, radial LV feeders, or on already heavily loaded networks [84], [85].
Figure 2.20: PHEV Charge Profile (Hour 1 represents 12:01 a.m. to 1:00 a.m. Hour 24
represents 11:01 p.m. to 12:00 a.m.) [83]
Even if the demand of EV charging does not result in under-voltage conditions on a
distribution network, it has the potential to affect voltage regulation and balance.
In [84], a study of the impact of EV charging was undertaken, based on the generic and
existing UK, LV distribution networks presented in [57] and [45], and illustrated in
Figure 2.7 and Figure 2.10 respectively. Customer load, not including EV charging, was
modelled according to half-hourly data provided by the UK Energy Research Centre
(UKERC). The study considered a slow charging rate of 1.3 kW, and a fast rate of
9.6 kW, with a total of 66 customers using EVs, as per the penetration scenarios
examined in the study. Figure 2.21 [84] shows the load effect of EV charging on a
secondary transformer of the existing UK, LV distribution network, on both weekdays
and weekends.

2 - Literature review
31
Figure 2.21: 100 % home slow-charging scenario for the UK existing LV distribution
network during winter [84]
It can be seen from the above figure that the transformer rating is exceeded by EV
charging under this scenario, on winter evenings. The study further found that EV
charging resulted in transformer overloading in both autumn and winter when the
generic UK network model was employed. Customer voltage was not found to exceed
current UK voltage limits [39] under any of the scenarios considered. Under the worst-
case scenario presented in Figure 2.21, the feeder end customer voltages were found
to be approximately 236 V in the case of the generic UK network, and 239 V in the
case of the existing UK network, with a substation voltage of approximately 250 V.
With regard to voltage regulation, under the worst-case scenario, a voltage difference
of approximately 6 % was found between the substation and feeder end in the case of
the generic UK network, and approximately 4.7 % in the case of the existing UK
network. The study also found that a maximum of approximately 48 kW of charging
load may be accommodated on one phase of one of the 400 V feeders before a % VUF
limit of 1.3 % [71] is exceeded. However, the report concludes that it is transformer
loading which is expected to be the limiting factor with regard to EV penetration,
although brief overloading may be tolerated by distribution transformers without the
requirement for upgrading by the DNO.
Further to the Low Voltage Network Solutions project [60], commissioned by DNO
Electricity North West (ENWL), and to estimate the impact of prospective EV adoption, a
probabilistic impact assessment was performed on 25 ENWL LV networks, with a total
of 128 feeders [61]. Under this assessment, EV profiles were created based on the

2 - Literature review
32
result of a one-year EV field trial conducted in Dublin. In the feeders with more than 25
customers connected, the percentage of feeders exhibiting technical issues of non-
conformance with the one-week or ten-minute average voltage ranges of EN 50160
[59], or exceeding the capacity of the transformer or conductors, at any level of
penetration, is shown in Figure 2.13 [61]. The figure shows that both issues of voltage
non-conformance and issues of thermal overloading of network assets were found in
approximately 25 % of the feeders modelled with up to 100 % of EV penetration. Figure
2.14 [61] shows the percentage of the occurrence of either voltage or thermal limits as
the first issue in the case of increasing EV penetration on the feeders found to exhibit
either technical issue. This figure shows that in this study, in all cases where a feeder
is found to exhibit a technical issue, the thermal impact of EV adoption was slightly
more significant than the voltage impact, presenting the limiting factor to EV
penetration in approximately 65 % of cases.
2.4 - Strategies for distribution network voltage
control
The principal strategies for voltage control in distribution networks hosting a large
penetration of DG, also considering the potentially conflicting impacts of other low-
carbon technologies (LCTs) such as EVs, may be categorised as follows [46], [85]–[90]:
• Network reinforcement: Reduction of the resistance and reactance of distribution
network feeders reduces the effect of real and reactive power flow on voltage, as per
Equation (2.5).
• Curtailment: The real power injection of DG sources may be constrained in order to
limit the resulting voltage rise.
• Demand-side management (DSM): Appliances, domestic and commercial heating and
cooling, and EV charging, may be controlled in order to optimally schedule their
demand.
• On-load tap changers: By changing the distribution transformer tap position under
load, busbar voltage may be controlled to reflect the balance of generation and
demand on a feeder at a given time.
• Reactive power flow control: By absorbing reactive power, DG sources may mitigate
the voltage rise resulting from real power injection, as per Equation (2.5). In the case
that conflicting requirements exist, for example an over-voltage condition on a
feeder resulting from a high penetration of PV and an under-voltage condition on an

2 - Literature review
33
adjacent feeder supplied by the same busbar resulting from high demand, injection
of reactive power by switched capacitors may be employed to raise the voltage on
the feeder exhibiting under-voltage, as per Equation (2.5).
• Storage: Local storage of real power from, for example, PV generation, may be used
to limit the instantaneous real power injection into a feeder. Energy stored and
consumed locally in this way does not contribute to active power flow in the feeder.
In all cases of active control, the distributed measurements offered by smart meters
located at the periphery of the distribution network enhance the scope for, and
effectiveness of, coordinated control [46], [85], [91].
Of the control strategies listed above, the use of OLTCs, reactive power flow control by
DG sources, and energy storage, are considered in further detail in the following
sections.
2.4.1 - On-load tap changers
On-load tap changers have not typically been used at secondary substation level in the
UK and Europe [92], [93]. However, the requirement for voltage control in the presence
of high DG penetration on distribution networks and, in particular, to mitigate the
voltage rise associated with real power injection by these technologies, increasingly
justifies the costs of additional transformer, communications and control
infrastructure, and of the wear of tap-change operations [51], [94]. The implementation
of OLTCs with electronic commutation in addition to [95] or replacing mechanical
commutation [96]–[100], may mitigate these issues by offering faster commutation
without mechanical wear or arcing. The use of decoupled OLTCs, capable of changing
the tap position of each phase independently, has also been proposed [101], [102].
The performance of conventional AVC schemes, based on maintaining a constant
busbar voltage, and LDC, in the presence of high penetrations of DG, have been
examined in literature [42], [46], [49], [103], [104]. However, high penetrations of DG
resulting in low load current and even reverse power flow may adversely affect such
schemes [105]–[109]. Hence, control strategies have been presented which augment or
supplant such control, as well as considering both time of day, significant due to the
daily profile of solar irradiance, and the potential for distributed network voltage
monitoring, even on LV networks, offered by technologies such as smart meters. In
[103], a scheme by which historical voltage data from a feeder is used to augment
more basic LDC control in the absence of real-time voltage measurements is proposed.
In [106], conventional LDC is augmented by considering power flow direction. The use

2 - Literature review
34
of OLTCs in combination with reactive power control from DG sources, capacitors and
distribution static compensators (DSTATCOMs) has also been examined [43], [110],
[111], including with distributed voltage measurements [51], [112].
The DG DemoNet – Smart LV Grid project [113]–[116] considered three levels of OLTC
control: That based only on voltage measurement at the local busbar, control based on
distributed voltage measurements, and reactive power control of DG in addition to the
OLTC. This was demonstrated in field trials on three Austrian LV networks.
In [117], Li et al. propose a scheme whereby voltage measurements from points
distributed along the feeder served by a transformer are used to generate a reference
value for an AVC relay controlling an OLTC. The algorithm for this function is shown in
Figure 2.22 [117], where Vref is the reference voltage provided to the AVC relay.

2 - Literature review
35
Figure 2.22: Automatic Voltage Reference Setting (AVRS) [117]
It can be seen that this scheme considers whether an existing conflict between
concurrent over-voltages and under-voltages exists, and whether a tap-change
operation will result in further voltage violations. In [118], a similar algorithm to that
that proposed in [117] was demonstrated which also considers the effect of multiple
prospective tap-change operations, prior to issuing a new voltage set-point reference.
This scheme was demonstrated on a model of a section of Finnish distribution network
supporting both static loads and controllable DG, simulated on a Real Time Digital
Simulator (RTDS) in order that closed-loop testing of the control algorithm could be
performed on commercial distribution network automation hardware. The operation of
the algorithm is shown in Figure 2.23 [118].

2 - Literature review
36
Figure 2.23: The operation of the control algorithm in minimum loading conditions
when substation voltage is the primary control variable [118]
It can be seen that an increase in DG active power output results in an over-voltage
condition to which the algorithm responds, issuing a voltage set-point which results in
two tap-down operations, restoring the voltage to within limit. The disconnection of
the DG subsequently results in an under-voltage condition to which the algorithm
responds by issuing a voltage set-point which results in a single tap-up operation,
restoring the voltage to within limits.
In [93], Long et al. specifically consider the application of OLTCs to LV feeder control,
with three possible control schemes: constant set-point, time based, and remote
monitoring based. Under the constant set-point scheme, tap changes are made in
order to maintain a busbar voltage as close as possible to the set-point. The time-
based scheme employs two set-points, representing peak and off-peak demand, and
scheduled according to time of day and season. The remote monitoring scheme
employs feeder end voltage readings, and categorises the proximity of these values to
limits as green, orange, or red, representative of their severity. This is shown in Table
2.1 [119]. An OLTC voltage set-point for the next control cycle, Vset i+1, is calculated as
shown below, where Vbusbar i is the current busbar voltage, and ΔVi is a compensating
voltage.
(2.8)

2 - Literature review
37
The compensating voltage ΔVi is the product of the factor corresponding to the
category of the maximum and minimum of all the feeder end voltages, taken from
Table 2.1, and the voltage step of the OLTC.
Table 2.1: Compensating voltage factor according to the voltage zones [119]
In [93], the performance of the remote monitoring scheme was compared to that of the
simpler fixed, and time-based set-point schemes using a model of a real, UK,
residential LV network, operated by ENWL. This consisted of six radial, LV feeders, with
a total of 351 single-phase customers, simulated in EPRI’s OpenDSS and MathWorks’
MATLAB. Customers were modelled with realistic load and PV generation profiles, with
PV penetration defined as the percentage of the total number of customers with a PV
installation. The OLTC bandwidth, the difference between the busbar and set-point
voltage at which the OLTC will operate, was set at 2.2 %. The tap changer delay, the
period for which the bandwidth must be exceeded before the OLTC will operate, was
set at 120 s. With an even penetration of PV, the average, annual effect on voltage
compliance of the remote monitoring-based control (RMC), constant set-point control
(CSC), and time-based control (TBC) schemes, compared to compliance in the case of
only off-load tap changer provision, is shown in Figure 2.24 [93]. The average daily
number of tap changes for this period is shown in Figure 2.25 [93].

2 - Literature review
38
Figure 2.24: Average customers with voltage problems - even PV penetration [93]
Figure 2.25: Daily average number of tap changes - even PV penetration [93]
It can be seen that under all control schemes, the OLTC significantly mitigates the
voltage non-compliance issue of increasing PV penetration, when compared to an off-
load tap changer, and that employing remote monitoring in the control algorithm both
increases the degree of this mitigation and reduces the total number of tap-change
operations required.
The remote monitoring based control scheme presented in [93] was deployed in a trial
conducted by ENWL involving two secondary substations equipped with OLTCs [119].
Both had six feeders, with PV penetration of approximately 30 %. In this case, the OLTC
bandwidth was set at 4.4 %, and the delay at 120 s. The set-point, busbar voltage, and
tap position over the course of a midweek, May day at one of the two substations is
shown in Figure 2.26 [93], [119].

2 - Literature review
39
Figure 2.26: Actual tap operation at Landgate Substation [93], [119]
2.4.2 - Reactive power control of distributed generation
The X/R ratio in LV networks is low in comparison to MV networks, typically by an
order of magnitude [120]–[122]. This reduces the capacity for voltage regulation by
means of reactive power control [123]. The transfer of reactive power also results in
increased system losses and loading of the DG sources [118], [124]. Indeed, the
increased losses resulting from the power transfer associated with the use of reactive
power exchange to limit voltage rise from real power injection may exceed the real
power injection curtailment required to achieve the same effect [120].
In the case of reactive power control of DG sources such as PV inverters for the
purpose of voltage regulation, the reactive power capacity of the DG source is limited
by the total apparent capacity, and the active power output of the device. The
operation envelope of such a DG source is shown in Figure 2.27 [51].
Figure 2.27: PQ-diagram of a generator (generator perspective) [51]

2 - Literature review
40
It can be seen from this figure that the vector sum of the active (P) and reactive (Q)
power flows of the DG source must not exceed the total rating of the device (S). The
limitation of active power export due to the use of reactive power flow for voltage
control may have an undesirable economic impact [51].
In Germany, the capacity for reactive power absorption to aid voltage control is
mandated for LV-connected PV inverters [125]. The standard, local reactive control rule
is shown in Figure 2.28 [124], [125].
Figure 2.28: Standard local reactive control rule [124], [125]
Under this control scheme, above 50 % of rated output, the PV inverter absorbs
reactive power, up to a power factor of 0.95, in order to mitigate the voltage rise at its
point of connection resulting from real power injection.
In [124], [126]–[128], DG control schemes are proposed whereby the reactive power of
a DG source is controlled in order to minimise the voltage rise at the point of
connection. In [129], Carvalho et al. demonstrate such a DG control scheme on a
simple MV feeder model representing a 20 km-long, 30 kV, 50 mm2, aluminium,
overhead line. The feeder is considered both without load, and with a load of 5 MW
and 2 MVAr. In both cases, the effect on voltage of the control of the DG reactive
power by means of the proposed control scheme, as well as the effect of a constant
leading or lagging power factor, is examined for a range of DG active power outputs.
This is shown in Figure 2.29 [129].

2 - Literature review
41
Figure 2.29: Bus voltage VG evolution with generator power for fixed transformer
secondary voltage [129]
The figure shows the effect of fixed leading or lagging power factor, and reactive
power control, Q*, without load in the case of the upper curves, and with load in the
case of the lower curves. It can be seen that, in this scenario, the local control of
generator reactive power can be effective in the mitigation of voltage rise from the real
power injection of DG.
In [43], Liu et al. demonstrate an adverse impact of the use of local voltage control by
means of reactive power control of PV. The study considers a model of an
approximately six mile-long, 12.5 kV representative feeder, employing an OLTC at the
substation, and a voltage regulator approximately two miles from the substation. The
feeder supports a total of 7 lumped loads, totalling approximately 11 MVA, and
representative of a mix of residential and commercial demand. PV penetration is
defined as the percentage of local load. Figure 2.30 [43] shows the feeder voltage with
50 % PV penetration, operating at rated power, and light loading, resulting in reverse
active power flow.

2 - Literature review
42
Figure 2.30: 50 % PV penetration voltage profile with inverters controlling voltage [43]
It can be seen that, despite the state of reverse power flow, voltage is well regulated
along the length of the feeder. However, the absorption of reactive power in order to
mitigate voltage rise results in considerable reactive power import to the feeder, with
the consequence of increased feeder losses and increased reactive power demand from
the upstream network. This is shown in Figure 2.31 [43].
Figure 2.31: 50 % PV penetration power profile with inverters controlling voltage [43]

2 - Literature review
43
2.4.3 - Energy storage
Storage of surplus energy generated by DG at, or close to, the point of generation,
negates the voltage rise that might otherwise result as a result of active power export,
as well as the losses associated with power transfer, and the detrimental impact of, for
example, reverse power flow [130]–[134].
Schemes have been presented in [130], [131], [135], [136] under which local battery
storage is used to increase the PV hosting capacity of a network by mitigating effects
such as voltage rise. In [123], this is achieved by the control of a combination of
storage and PV inverter output. In [137], this is considered in the context of EVs, and
in [138] in the case of public EV charging stations integrating energy storage.
In [139], a scheme under which battery storage is controlled to mitigate voltage rise,
with the priorities of minimising OLTC operations and system losses, is presented. The
scheme was demonstrated using a hardware-in-the-loop test rig in which a controllable
AC source and a battery-based energy storage system were interfaced to an RTDS
simulating a distribution network model.
In [140], a scheme for the integration of storage with a power electronic transformer at
secondary distribution substation level was presented. However, in [141] it was
concluded that placement of energy storage at customer level is more efficient than at
grid level.
In [142], the use of energy storage to mitigate voltage imbalance on a network hosting
PV generation is demonstrated, under simulation, and on a laboratory, hardware test
rig.
2.5 - The architecture of distribution network
control
2.5.1 - Centralised vs decentralised control
The architecture of systems used for distribution network control may be categorised
according to the level of the electrical distribution network at which decisions are
made. Existing networks are characterised by a centralised control architecture, in
which control is effected primarily from a network control centre, or by automation at
primary substations [87], [143], [144]. This is illustrated in Figure 2.32 [143].

2 - Literature review
44
Figure 2.32: Centralised distribution network management system [143]
Under a decentralised control architecture, network monitoring data, for example from
smart meters, is stored and processed, and control decisions effected, at lower levels
of the distribution network than in the case of a centralised architecture, for example
at secondary substation level [87], [143], [144]. This is illustrated in Figure 2.33 [143].
Under autonomous PV inverter control schemes, control is effected at the very
periphery of the distribution network, based on local measurements [123], [124],
[145], [146]. It is important to consider, however, the mutual interaction between
devices effecting autonomous, local control, and between such devices and centralised
control systems [147]. In contrast to such local automation, schemes have been
proposed whereby control is effected by PV inverters, but directed by a more
centralised agent, coordinating a number of sources [110], [128].
In the case of distribution substations with OLTCs, local automation may be employed
which augments or replaces existing control techniques, such as LDC. In [148], the
SuperTAPP n+ scheme demonstrated in a trial by EDF Energy for the control of a
network hosting DG is described. Under this scheme, OLTC control is based on
measurements taken locally to the substation. Similarly, in [106], conventional LDC is
extended to accommodate the potential for reverse power flow caused by DG.
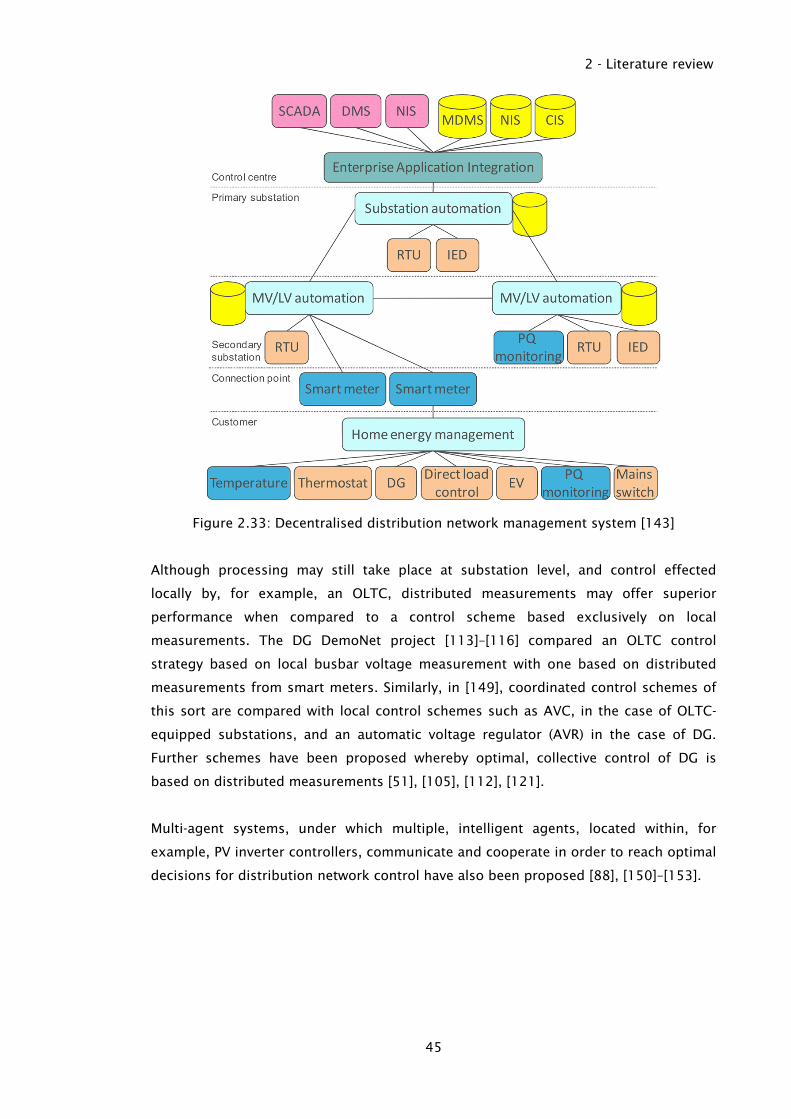
2 - Literature review
45
Figure 2.33: Decentralised distribution network management system [143]
Although processing may still take place at substation level, and control effected
locally by, for example, an OLTC, distributed measurements may offer superior
performance when compared to a control scheme based exclusively on local
measurements. The DG DemoNet project [113]–[116] compared an OLTC control
strategy based on local busbar voltage measurement with one based on distributed
measurements from smart meters. Similarly, in [149], coordinated control schemes of
this sort are compared with local control schemes such as AVC, in the case of OLTC-
equipped substations, and an automatic voltage regulator (AVR) in the case of DG.
Further schemes have been proposed whereby optimal, collective control of DG is
based on distributed measurements [51], [105], [112], [121].
Multi-agent systems, under which multiple, intelligent agents, located within, for
example, PV inverter controllers, communicate and cooperate in order to reach optimal
decisions for distribution network control have also been proposed [88], [150]–[153].

2 - Literature review
46
2.5.2 - The architecture of schemes that have been deployed
In [154], Lu et al. present a control architecture under which LV network data from
smart meters in customer premises and power quality (PQ) meters in street cabinets is
communicated to a substation automation unit (SAU) at a secondary substation via
DLMS/COSEM over OPERA broadband over power line (BPL) [155]. This was
demonstrated under the INTEGRIS project [156]. The architecture of the project trial,
conducted on part of a distribution network of A2A Reti Elettriche SpA (A2A), located in
Brescia, Northern Italy, is illustrated in Figure 2.34 [154].
Figure 2.34: Internal components of SAU (in A2A field trial) [154]
Under this INTEGRIS trial, data was conveyed between secondary substations, and to
the control centre, by means of a combination of fibre optic, BPL, and WiFi interfaces,
and using the IEC 61850 protocol.
Under the LoVIA field trial [119], conducted by ENWL, LV network monitoring and
control was achieved by means of metrology and communications units (MCUs) located
at the mid and end points of LV feeders on the test network. These communicated with
a remote terminal unit (RTU) located at the secondary substation by means of GPRS.
DNP3 was used over a local interface between the RTU and the relay controlling the
OLTC of the secondary substation transformer. This enabled local voltage control to be
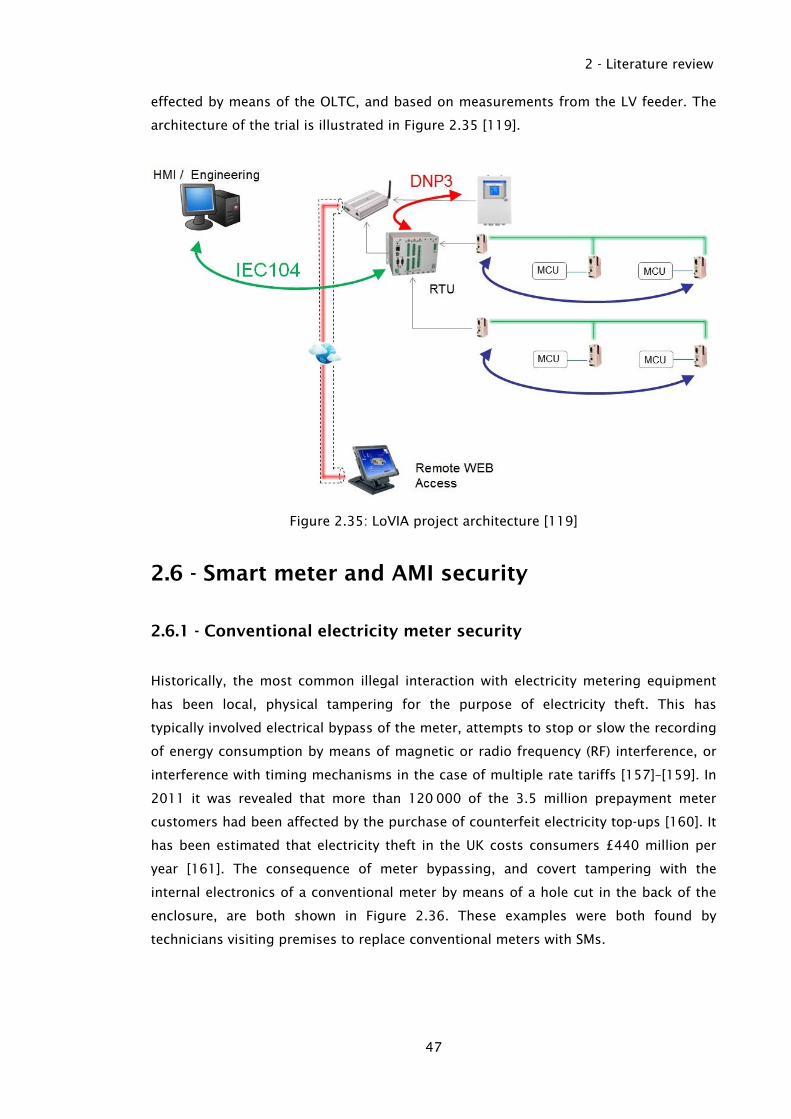
2 - Literature review
47
effected by means of the OLTC, and based on measurements from the LV feeder. The
architecture of the trial is illustrated in Figure 2.35 [119].
Figure 2.35: LoVIA project architecture [119]
2.6 - Smart meter and AMI security
2.6.1 - Conventional electricity meter security
Historically, the most common illegal interaction with electricity metering equipment
has been local, physical tampering for the purpose of electricity theft. This has
typically involved electrical bypass of the meter, attempts to stop or slow the recording
of energy consumption by means of magnetic or radio frequency (RF) interference, or
interference with timing mechanisms in the case of multiple rate tariffs [157]–[159]. In
2011 it was revealed that more than 120 000 of the 3.5 million prepayment meter
customers had been affected by the purchase of counterfeit electricity top-ups [160]. It
has been estimated that electricity theft in the UK costs consumers £440 million per
year [161]. The consequence of meter bypassing, and covert tampering with the
internal electronics of a conventional meter by means of a hole cut in the back of the
enclosure, are both shown in Figure 2.36. These examples were both found by
technicians visiting premises to replace conventional meters with SMs.

2 - Literature review
48
Figure 2.36: Left, conventional meter bypassing, and right, internal tampering
(courtesy Mark Malins)
2.6.2 - Electricity distribution as a target for attack
Electricity distribution networks are an established target of terrorist activity. In 1996,
six IRA members were each sentenced to 35 years imprisonment for plotting to target
substations around London and South East England with explosive devices [162]. In
2006, an Australian man was sentenced to 20 years imprisonment by the New South
Wales Supreme Court for plotting to bomb the electricity network supplying Sydney
[163]. In 2015, the Russian hacker group Sandworm attacked the substations of three
utility companies in Ukraine. By gaining access to SCADA systems, they were able to
open circuit breakers resulting in power loss to more than 225 000 customers [164],
[165].
Electrical systems are also a key strategic target during conflict between nation states.
For example, Operation Desert Storm, conducted during the Gulf War, saw 215 sorties
launched against electricity supply targets in Iraq, reducing generation capacity to less
than 300 MW, and transmission to less than a quarter of its capacity prior to the
conflict [166]. The 2008 Report to Congress of the U.S.-China Economic and Security
Review Commission asserted that:
‘China is targeting U.S. government and commercial computers for espionage …
Internet-connected networks operate the national electric grid and distribution systems

2 - Literature review
49
for fuel ... A successful attack on these Internet-connected networks could paralyze the
United States.’ [167]
Indeed, it may be the case that state-sponsored infiltration of the U.S. electricity
transmission and distribution systems has already occurred [168].
In 2009 the Stuxnet worm was first detected. This malware exploits the use of default
passwords and a Microsoft Windows Server service remote procedure call (RPC)
handling remote code execution vulnerability, amongst others. It specifically targets
Siemens S7 programmable logic controllers, with the United States and Israel
suspected of authoring the worm to attack uranium enrichment facilities in Iran [169]–
[171].
An attack against electricity distribution infrastructure which resulted in widespread
loss of supply for a period of 24 hours in, for example, the UK, has the potential to
cause considerable harm to personal and social welfare. The UK Government’s National
Risk Register Of Civil Emergencies [172] identifies the risk to other utilities, such as gas
and other fuel distribution, water and sewerage, as well as to telecommunications and
financial services, from a widespread loss of electricity supply. Regional risk
assessments [173], [174] identify the primary impacts of such an event, including
fatalities from, for example, hypothermia in the elderly and vulnerable as a result of
inadequate heating, property fires resulting from the use of candles and open fires,
disruption to transport, disruption to the food chain as a result of problems storing,
transporting and cooking food, and increased crime.
2.6.3 - Smart meters and AMI as targets for attack
Advanced metering infrastructure (AMI), as an important component of the smart grid
vision of future energy distribution networks, represents a significant target for attack,
as well as presenting unique vulnerabilities. Examples of the groups who may be
responsible for attacks on smart meters as part of AMI, their motivations, and tools,
are presented in Table 2.2 [175].

2 - Literature review
50
Table 2.2: AMI potential attackers, their motivation and the tools they use [175]
Attacker Motivation Tool
Customers Personal reasons Personal knowledge or assistance from criminals
Criminals Financial, sabotage or terroristic
Creating software and hardware to tamper with AMI
Insiders Various Unethical use of the system’s trust, illegal use of their authority and knowledge
Institutions Using private information for various reasons, denial of service
Using expertise, authority, resources and vulnerabilities of system or its components
In [175], counter-measures against the physical tampering attacks typically employed
against conventional meters, when employed against smart meters, are presented.
However, the advent of advanced meter reading (AMR) and AMI introduces the threat of
attacks which exploit the requirement for communication of SMs with devices outside
of customer premises. These are illustrated in Figure 2.37 [176].
Figure 2.37: Smart grid distribution and corresponding threats [176]
2 - Literature review
51
The principal attacks against AMI systems may be categorised as follows [26], [27]:
• Theft of data: For example, the theft of customer consumption data, or encryption
keys stored within a SM.
• Theft of energy: Energy consumption is inaccurately reported, or falsely attributed.
• Denial of Energy: Malicious use of the remote, electrical disconnect facility of many
SMs.
• Disruption of network control: For example, providing false measurements in the
case that these are used for operational purposes, or generating rapidly fluctuating
load conditions by cyclically operating the remote supply disconnection facility.
These categories are considered in further detail in the following sections.
2.6.3.1 - Theft of data
The interception of data communicated by smart meters may allow an attacker to infer
details of customer behaviour, for example domestic occupancy [177]–[180]. This was
demonstrated in a presentation given by Carluccio and Brinkhaus on an attack on a
domestic smart meter installation in Germany [181], [182]. Here, communication
between the SM and the head-end of the meter operator was intercepted, and customer
behaviour deduced from energy consumption profiles. False consumption data was
also successfully issued to the energy supplier.
The impersonation of another customer or SM, using stolen data, has further
implications for energy theft [183]–[185].
Data encryption is a key element of achieving confidentiality, by preventing
eavesdropping and data tampering. Data integrity is further protected by
authentication techniques, ranging from password authentication to digital
certification [26], [183], [186].
2.6.3.2 - Theft of energy
The mechanisms of electrical bypass of the meter tails employed against conventional
meters apply equally to SMs. Furthermore, SMs present further vulnerabilities as a
result of communication, hardware or firmware compromise, in order to misrepresent
energy consumption. However, approaches have been presented to detect energy theft
by means of identifying anomalies in energy consumption patterns. In [157], a machine

2 - Literature review
52
learning method is presented which identifies anomalies in the consumption profiles of
customers on an individual level. In [187], such anomalies are identified considering
the aggregated energy consumption of a number of customers.
2.6.3.3 - Denial of energy
SMs incorporating a remote supply disconnection facility as mandated in the UK [34],
for example, present a vulnerability not present in conventional meters. An attack in
which control was gained over this facility might result in the denial of energy to a
large number of customers [26], [28], or destabilisation of the distribution, or even
transmission networks, by imposing rapid changes in load across a wide area [188]. If
compromised, the firmware of a meter may be modified or replaced in order to alter
the behaviour of the meter or further infect other devices [28], [178], [183]. This also
has implications for the theft of data and energy.
2.6.3.4 - Disruption of network control
If measurements from smart meters are used to inform distribution network control
decisions, false data injection, for example in the case of a man-in-the-middle (MITM)
attack, may lead to necessary control action not being taken, or unnecessary control
action being taken [189]–[192]. In [188], simulation case studies undertaken by Wei
and Wang illustrate the effect of data-centric attacks on both data exchanged between
smart meters and a control centre, for operational purposes, and SCADA data used for
circuit breaker control. These resulted in power quality issues and erroneous
protection operation in the simulated distribution network. Schemes to detect and
mitigate the effects of false data injection attacks have been proposed [190], [193].
However, Overman et al. [194] assert that whilst such systems must include measures
to identify and prevent cyber security intrusion, they must also be designed to tolerate
such attacks to some extent.
2.6.4 - Vulnerabilities and constraints of smart meters and AMI
The cyber security vulnerabilities of SMs, beyond those applicable to conventional
meters, may be categorised as follows [26], [195]:
• Insecure wide area network (WAN) interface: If not protected by, for example, well-
implemented encryption, communication between the SM and the head-end system
may be intercepted, modified or falsely injected [183], [185].

2 - Literature review
53
• Insecure local interface: For example, access might be gained to a local, optical
interface intended for meter reading and configuration using authentication
credentials or encryption keys captured by bus snooping [178].
• Bus attacks: Data conveyed between components within the SM may be captured,
modified or falsely injected. Data captured might include authentication credentials
or encryption keys. Data related to consumption might be modified or falsely
injected, for the purpose of energy theft. Data related to the identity of the meter
might be modified or falsely injected, for the purpose of impersonation [183]–[185].
• Power or clock glitching: Modulation of the power or clock signals internal to the SM
may result in firmware not behaving as designed, for example skipping instructions
in the course of authentication or encryption [183], [184].
• Poor implementation of cryptography: This might include the use of cyphers with
known vulnerabilities, the use of short or predictable keys, or the use of low-entropy
random number generation. It might also include vulnerability to replay attacks,
under which encrypted data, for example authentication credentials, is captured and
subsequently retransmitted in the course of an attack [183], [185].
• Firmware flaws: For example, vulnerability to buffer overflow or format string
attacks, under which data is written to memory locations in a manner not intended
by the firmware design, or an insufficiently robust mechanism for firmware update
[183], [196].
• Key and password management: For example, keys and passwords stored in non-
volatile memory within components of the smart meters may be exposed by
extracting the firmware from these devices, or captured during transmission
between them. This may expose multiple SMs to attack if common keys or
authentication credentials are used [28], [183], [197].
Constraints of SMs, pertinent to cyber security, include [198]:
• Cost: Commercially deployed SMs are necessarily a mass-produced device and, as
such, are cost-optimised. Accordingly, a compromise is made between cost and
security. This might preclude, for example, the use of dedicated security hardware
such as a cryptoprocessor [199].
• Technical limitations: In addition to being limited by cost, the technical capacity of
SMs may be limited by physical, communications, and power dissipation
requirements. For example, well-established Internet security protocols which might
be applied to AMI systems, such as IPsec or SSL/TLS, or elliptic curve cryptography,

2 - Literature review
54
are not necessarily scalable for implementation on resource-constrained SMs [28],
[200], [201].
• Type approval: SMs may require type approval and/or certification to be used for
legal metrology, for example under The Meters (Certification) Regulations 1998 in
the UK [202]. This may limit the scope for upgrade or modification of the devices,
for example to patch a known security issue.
• Location: The location of SMs, in customer premises, is an uncontrolled, insecure
environment. Access to the meter, for example for the purpose of physical
tampering, is unrestricted and unmonitored.
In addition to those applicable to SMs, limiting factors pertinent to cyber security and
applicable to AMI systems include [198]:
• Limited communications: For example, low available bandwidth over low-power RF
links such as power line carrier (PLC), or high contention for a mobile telephone
network cell. This might preclude the use of security protocols imposing a large
overhead, or the frequent exchange of certificates [203].
• Public communications: For example, the use of the public, cellular telephone
network for communication. As well as limiting the scope for isolation of AMI traffic
from other services, this might mandate the use of specific protocols, for example
GPRS.
• Data management: An AMI system hosting large numbers of SMs will need to
process and store a large volume of data, as well as accommodating the
cryptographic overhead associated with communication with them [197]. In addition,
multiple, geographically disparate parties may require role-based access to AMI
head-end data, for example energy retailers and DNOs. This requires management of
what data is available to which parties, and how it is securely conveyed [183], [204].
2.6.5 - The security of existing smart meter and AMI schemes
A survey by the 7th Framework Programme Meter-ON project [205] examined 15 smart
meter deployment projects across ten European countries, totalling a projected
deployment of approximately 100 million meters by 2020. In the case of five of these
projects, it was found that no encryption of data between the meters, data
concentrators and back-office systems was employed, and in the case of four of these
projects no security event logging was performed. Furthermore, it has been suggested
that the majority of cyber security breaches are not reported by organisations due to

2 - Literature review
55
reputational concerns [206]. However, valuable conclusions regarding cyber security
have been drawn from SM deployments which have already taken place [207].
2.6.6 - Published smart meter and AMI attacks, and tools
The extraction of symmetric AES-128 encryption keys from a commercially deployed
SM was presented by Vidal and Illera [37], [38]. The keys, used to encrypt PLC
communication by the device, were eavesdropped during transmission between
processor and PLC devices at printed circuit board (PCB) level within the device, along
with the unique identification number of the meter. If the same keys are used across
multiple meters, then they may be used to gain illegitimate access to these devices
[197]. Furthermore, access to the bus on which the unique identification number of the
meter is communicated at PCB level may permit a man-in-the-middle (MITM) attack,
under which a false identification number is introduced in order to impersonate
another SM [195]. PCB-level access to a SM also presents the opportunity for other data
manipulation and key extraction attacks [195], [208], though schemes have been
proposed to address the issue of insecure key management, for example [196], [209].
In [36], Lawson presents an attack involving the extraction of firmware from the
microcontroller of a smart water meter radio module. This is achieved by connection to
the unprotected JTAG interface of the device. The defeat of rudimentary tamper
protection is also described. This is shown in Figure 2.38 [36].
Figure 2.38: Attack on a smart water meter by connection to the unprotected JTAG
interface of the microcontroller [36]

2 - Literature review
56
A practical demonstration of a denial-of-service (DoS) attack against two SMs is
presented in [210], and in [211] a DoS attack involving multiple mesh-connected SMs is
simulated.
In [212], Davis presents a worm, an example of self-replicating malware, targeting
mesh-connected SMs. In a simulated attack, this infected over 15 000 meters in under
24 hours.
In [213], communication between the local, optical interface of a commercially
deployed SM and the vendor-specific management software is intercepted and used to
determine the authentication token calculation algorithm. This was demonstrated to
reduce the predicted time required for a brute-force password attack on the
authentication protocol used by the optical interface of the SM of over four years, to
under four hours.
A framework for fuzzing, an attack technique whereby semi-random data is
transmitted to a target in order to expose insecure behaviour or instabilities, designed
to exploit SMs using the DLMS/COSEM protocol, is presented in [214].
A framework and toolkit for exploiting vulnerabilities in Zigbee networks, widely used
for home area network (HAN) communication [215], [216], is publicly available [217].
In [178], Mo et al. propose attack schemes targeting the local interface of a smart
meter. These include data spoofing, under which false data is presented to a smart
meter, a replay attack, under which legitimate traffic is recorded and then replayed to
the meter, and a delay attack, under which traffic is intercepted and then provided to
the meter ‘out of date’. An open source toolkit for penetration testing SMs using the
C12.18 and C12.19 protocols over a local, optical interface, is publicly available [218].

57
3 - Design and development of the smart
meter test rig
3.1 - Introduction
The design, development and commissioning of a hardware-in-the-loop test rig,
incorporating hardware smart meter test beds, the infrastructure required for WAN
communication with the meters by means of GPRS and for SCADA communication, and
a Real Time Digital Simulator (RTDS) simulating a section of distribution network, is
described. The test rig was developed in order to examine the use of AMI as a
component of a distribution network control, or smart grid scheme.
Subsequent sections are structured as follows:
• Section 3.2 outlines the logical design of a smart meter test bed platform, intended
to be representative of smart meter designs which are currently seen, or which
might conceivably be seen, in commercially deployed smart meters in the UK. The
logical design of a test-rig architecture which employs these test beds as part of
distribution network control, or smart grid scheme, is also presented.
• Section 3.3 describes the development of the hardware and foundation firmware for
the smart meter test bed platform, based in the logical architecture presented in
Section 3.2.1.
• Section 3.4 describes the development of the test rig, including configuration of the
RTDS, and of the SCADA server and controller machines, and the software
development of the GPRS server. The physical architecture of the test rig is also
described, based on the logical architecture presented in Section 3.2.2.
• Section 3.5 describes the design and execution of a commissioning test, conducted
to verify the correct operation of all the hardware, firmware and software elements
within the smart meter test rig. This test demonstrates a simple, real-time voltage
control scheme, effected using a transformer equipped with a SCADA-controlled
OLTC within a simulated network, and informed by voltage readings from one of the
smart meter test beds.
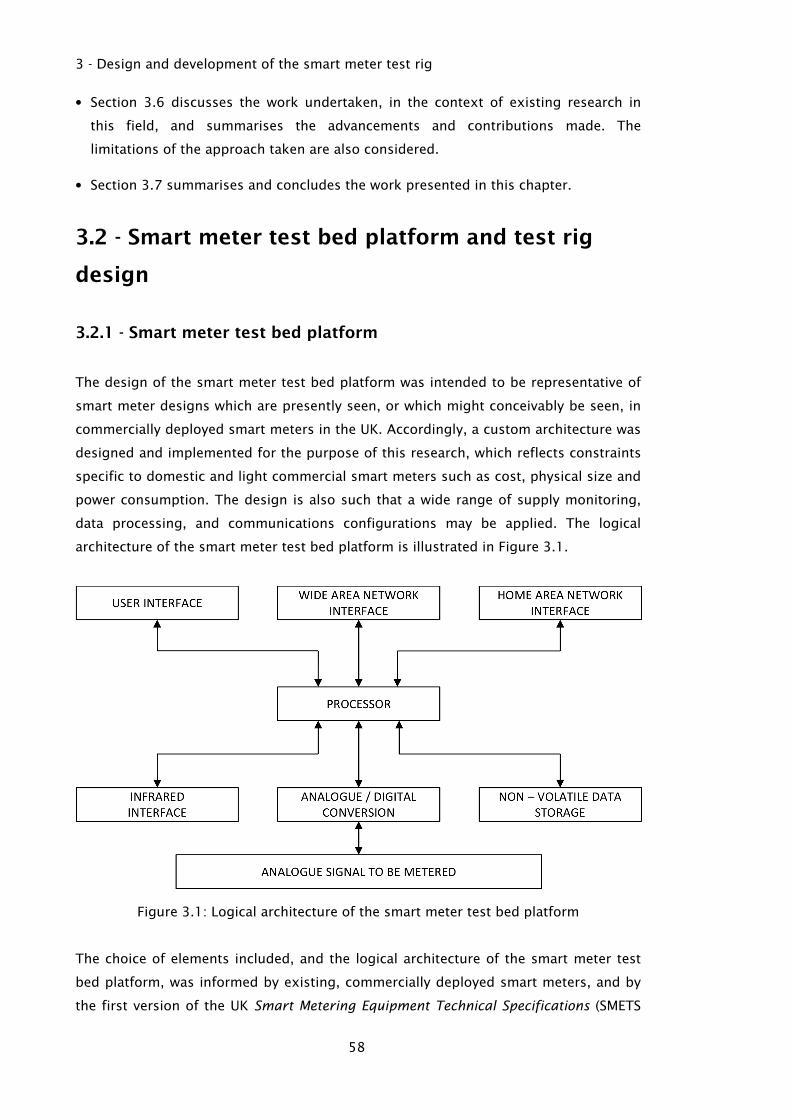
3 - Design and development of the smart meter test rig
58
• Section 3.6 discusses the work undertaken, in the context of existing research in
this field, and summarises the advancements and contributions made. The
limitations of the approach taken are also considered.
• Section 3.7 summarises and concludes the work presented in this chapter.
3.2 - Smart meter test bed platform and test rig
design
3.2.1 - Smart meter test bed platform
The design of the smart meter test bed platform was intended to be representative of
smart meter designs which are presently seen, or which might conceivably be seen, in
commercially deployed smart meters in the UK. Accordingly, a custom architecture was
designed and implemented for the purpose of this research, which reflects constraints
specific to domestic and light commercial smart meters such as cost, physical size and
power consumption. The design is also such that a wide range of supply monitoring,
data processing, and communications configurations may be applied. The logical
architecture of the smart meter test bed platform is illustrated in Figure 3.1.
Figure 3.1: Logical architecture of the smart meter test bed platform
The choice of elements included, and the logical architecture of the smart meter test
bed platform, was informed by existing, commercially deployed smart meters, and by
the first version of the UK Smart Metering Equipment Technical Specifications (SMETS

3 - Design and development of the smart meter test rig
59
1) [219], published by the former Department of Energy & Climate Change. A number
of further elements may be found in commercially deployed meters, and specified in
SMETS 1, for example a contactor for remote supply disconnection, an output signal
for the control of auxiliary load switches, and tamper detection hardware. However,
these elements were not directly relevant to the research conducted using the smart
meter test beds, nor will their absence affect this research, and hence were not
included.
The core of the meter architecture is a single processor. The need for numerous PCB-
level hardware interfaces, such as SPI and UART serial, as well as low power
consumption and relatively modest computational power requirements, make a
microcontroller the typical choice for commercially deployed meters. Microcontrollers
also contain non-volatile memory and RAM, such that external memory may not be
required for operation of the device, although in practice it will typically be required for
the mass storage of data such as meter readings. The architecture presented in Figure
3.1 includes non-volatile storage for this purpose.
A two-channel analogue to digital converter is included for the acquisition of current
and voltage values.
Two radio frequency interfaces are included in the architecture presented in Figure 3.1:
a home area network (HAN) interface and a wide area network (WAN) interface. The
HAN interface was included for local communication with, for example, simulated
controllable loads, for the purpose of DSM. The WAN interface was included for
communication with a remote, head-end system, by means of a cellular telephone
network connection.
The architecture includes two interfaces for local user interaction with the meter test
bed. These are a user interface, comprising an LCD display, feedback LEDs and user-
accessible switches, and an infrared communication interface. Both the user interface
and infrared communication interface are included for the purpose of monitoring and
debugging.
3.2.2 - Test rig
The architecture of the smart meter test rig is intended to represent the fundamental
elements of a distribution network control or smart grid system incorporating AMI. Its
design is informed by the architectures of systems examined in Section 2.4 and Section
2.5. The WAN communication scheme is typical of that employed for smart metering in

3 - Design and development of the smart meter test rig
60
the UK. As such, smart meter test beds individually establish concurrent connections
with a server over the WAN. The closed-loop, logical architecture of the test rig is
illustrated in Figure 3.2.
Figure 3.2: Logical architecture of the smart meter test rig
The simulated power network model is hosted on a Real Time Digital Simulator (RTDS),
manufactured by RTDS Technologies. This hardware device performs electromagnetic
transient simulation, with a minimum time-step of 50 µs. In addition, values from
within the simulated model can be realised as analogue signals using DAC cards
connected to the simulator, and SCADA data exchanged with appropriate devices
within the simulated model over a LAN connection. By means of the DAC cards of the
RTDS, the smart meter test beds are provided with analogue voltage signals
representative of the instantaneous voltage and current at a specific point in the
simulated network. By means of the SCADA interface of the RTDS, control directives
may be issued to appropriate devices within the network via the SCADA server, for
example an OLTC.
The controller is the endpoint of data received from the smart meter test beds, via the
WAN server. On the basis of this data, the controller issues directives to devices within
the RTDS simulated power network model, such as OLTCs, via the SCADA server.
The SCADA server acts as a master station, providing protocol conversion and data
buffering. Translation from one SCADA protocol to another is required for
communication between the RTDS and controller device. It also permits data to be
received from the controller with non-deterministic timing, but buffers this data for

3 - Design and development of the smart meter test rig
61
exchange with the SCADA interface of the RTDS at regular polling intervals, for
example one-second.
The WAN server manages concurrent connections with multiple smart meter test beds,
including performing registration of the devices upon connection, maintaining current
connections, and handling disconnection. The WAN server also issues instructions for
administration, or from the controller, for example a request for voltage readings to be
taken by all connected meters or a sub-set thereof, and buffers data received from
connected meters for transmission to the controller, for example the results of voltage
readings.
3.3 - Smart meter test bed platform development
3.3.1 - Hardware
The hardware design of the smart meter test bed platform was designed and
implemented for the purpose of this research, based on the logical architecture
described in Section 3.2.1 and illustrated in Figure 3.1. Figure 3.3 illustrates the
physical architecture of the smart meter test bed platform including the hardware
elements, the interfaces between them, and which of these interfaces have hardware
interrupts associated with them. These interrupts are used to trigger interrupt service
routines and a return of the microcontroller from a dormant, low power state.
In order to permit alternative communication or sample acquisition devices to be used
with the core hardware of the meter, the design is physically separated into two PCBs:
a motherboard and a daughterboard. Data and power buses are conveyed between the
two boards by means of a header.
The hardware of the processor, memory and supporting devices, the local interfaces,
the WAN and HAN interfaces, and the ADC and associated filtering, are described in
further detail in the following sections.
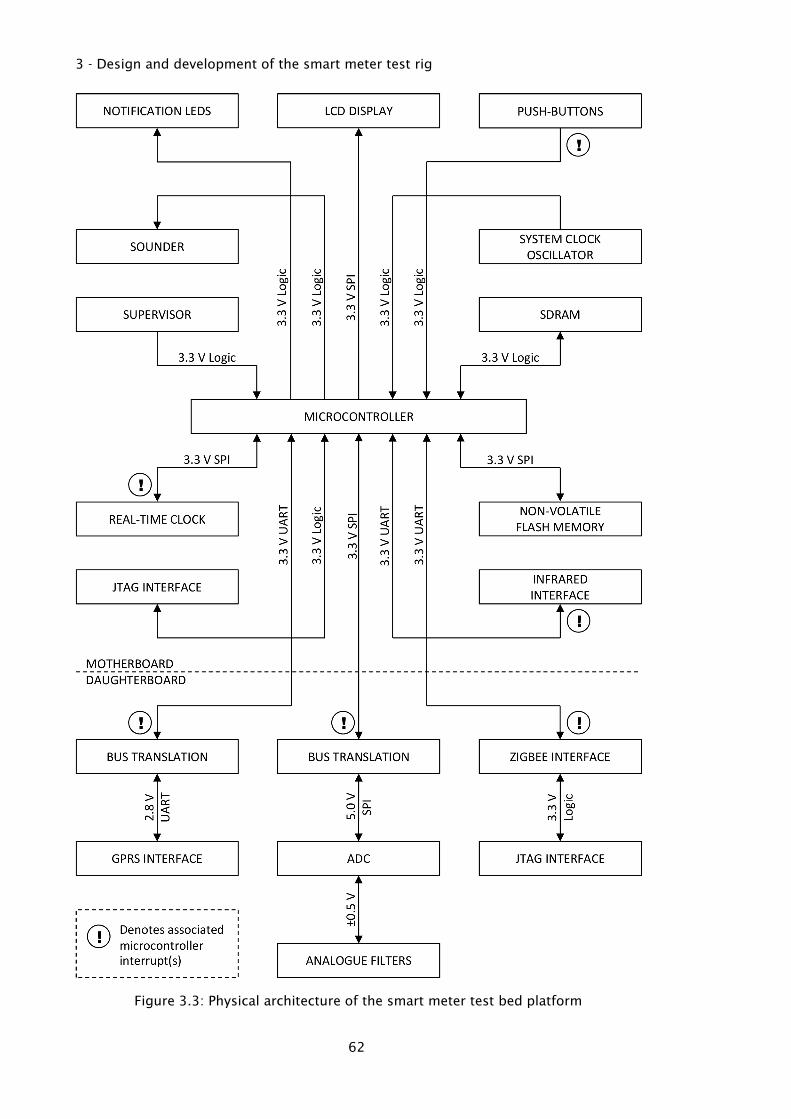
3 - Design and development of the smart meter test rig
62
Figure 3.3: Physical architecture of the smart meter test bed platform

3 - Design and development of the smart meter test rig
63
3.3.1.1 - Processor, memory and supporting devices
The processor used in the design is an 8-bit, Atmel AVR XMEGA microcontroller. This
device contains 128 kB of flash memory for program storage, 8 kB of flash memory for
bootloader storage and 2 kB of EEPROM. It also contains 8 kB of internal SRAM. In
addition to the internal RAM, external SDRAM was used in conjunction with a dedicated
interface within the microcontroller which permits the memory address space used to
address the internal RAM to be extended contiguously into the external RAM.
The RAM used in the design is 3.3 V, synchronous, dynamic memory with a capacity of
64 Mb, arranged as 4 x 4 x 4 Mb, and with a maximum clock speed of 133 MHz.
The microcontroller includes four hardware SPI interfaces. These are allocated to the
LCD controller, the real-time clock, non-volatile memory and the ADC. The clock
prescaler stages within the microcontroller permit an independent serial clock (SCK)
frequency to be assigned to each of the SPI interfaces of up to half of the system clock
frequency. The microcontroller also includes four USARTs. Three of these are allocated
to the infrared interface, WAN interface, HAN interface. The microcontroller provides
multiple levels of interrupt priority for the USART interfaces, if used asynchronously, in
addition to those used for generic logic interrupts.
A processor supervisor device, powered by the 3.3 V bus which also powers the
microcontroller, is used to hold the microcontroller in a state of reset during power-on
or in the event of the 3.3 V bus falling below a lower voltage limit. The supervisor will
assert the reset signal of the microcontroller, a 3.3 V logic level, until the voltage of
the bus has exceeded 2.93 V for a period of at least 200 ms. During operation, the
supervisor will also re-assert the reset signal of the microcontroller if the voltage falls
below the lower voltage limit of 2.93 V.
An external, active, ceramic oscillator provides a 12.000 MHz system clock signal to
the microcontroller with a stability of ±25 ppm at a temperature of 21°c. The oscillator
is powered from the 3.3 V bus and has a 3.3 V logic level output.
A 64 Mb, 3.3 V flash device is used to provide non-volatile storage. This device permits
a maximum SPI clock frequency of 66 MHz and page sizes of 1024 or 1056 bytes.
A real-time clock device, powered from the 3.3 V bus, is used with an external battery
to maintain timekeeping when the meter test bed is not energised. This device has an

3 - Design and development of the smart meter test rig
64
accuracy of ±2 ppm at RTP. In addition to a 3.3 V SPI interface for communication it
provides a logic level interrupt signal to the microcontroller.
3.3.1.2 - Local interfaces
Four LEDs, two pushbuttons, a sounder and a graphic LCD are provided for direct
interaction with the meter test beds by an operator. The LEDs are driven with low
power bipolar transistors, with two controlled by general-purpose logic outputs of the
microcontroller and one each controlled by the WAN and HAN modules. The sounder is
also driven with a low power bipolar transistor controller by a general-purpose logic
output of the microcontroller. The LEDs and sounder are powered from the 5.0 V bus.
The two push buttons drive general-purpose logic inputs of the microcontroller. The
inputs driven by the pushbuttons are also configured to be hardware interrupts. The
LCD used is a 128 x 64-pixel device with an integrated controller, such that it can be
driven by the microcontroller using a 3.3 V SPI interface. The LCD is powered from the
3.3 V bus. An LED backlight for the display, powered from the 5.0 V bus, is driven with
a bipolar transistor controlled by a general-purpose logic output of the microcontroller.
The infrared interface is a bidirectional transceiver module which integrates an
optoelectronic source, detector, buffer and switching devices. It is connected to the
microcontroller with a 3.3 V UART interface and supports a maximum data rate of
115 kb/s. The infrared module is powered from both the 3.3 V bus, supplying the
detector and logic elements, and the 5.0 V bus, supplying the infrared source device.
Since the USART interface of the microcontroller to which the infrared module is
connected is configured asynchronously, a hardware interrupt is also associated with
the receive register of the microcontroller USART interface.
3.3.1.3 - WAN and HAN interfaces
The WAN interface is an integrated GSM and Class 10 GPRS transceiver module
manufactured by Telit, and which can operate at both 900 and 1800 MHz. The WAN
transceiver has a typical sensitivity of -108 dBm at 900 MHz and -107 dBm at
1800 MHz, and a transmission power of 22 dBm at 900 MHz and 30 dBm at 1800 MHz.
The WAN transceiver is powered from a dedicated 3.8 V bus. Since the operating
voltage of the logic interface of the WAN module is 2.8 V, level translation is required
for communication with the 3.3 V microcontroller. This is achieved by means of an
active bus translation device which, in addition to performing voltage level translation,
includes Schmitt triggers which increase the slew rate of logic signal edges. The WAN

3 - Design and development of the smart meter test rig
65
transceiver is connected to the microcontroller, via the bus translation stage, by means
of a bidirectional UART interface which employs RTS/CTS hardware flow control.
Hence, bus translation is performed upon four logic lines, with two in each direction
between the transceiver and microcontroller. A fifth logic signal from the
microcontroller is used to assert the reset signal of the WAN transceiver. This logic
signal is used to drive a low-power bipolar transistor connected to the internally biased
reset line of the WAN transceiver in open-collector configuration. In addition to the
UART interface, two further logic signals are provided by the transceiver module. The
first is an operating state signal which is used to drive one of the notification LEDs.
The second is a logic signal indicating the stability of the power supply to the WAN
transceiver. As the slew rate of this signal is not critical, discrete level translation is
used to convert it to a 3.3 V logic signal for presentation to the microcontroller.
Power, voltage, data and clock signals are conveyed directly from the transceiver
module to a SIM card holder. The RF interface of the transceiver module is connected
to a coaxial PCB antenna connector by means of a controlled impedance trace.
The HAN interface is an integrated, 2.4 GHz transceiver module manufactured by
MeshNetics, which conforms to the IEEE 802.15.4 specifications for physical interface
and media access, and which supports higher communications layers prescribed by the
Zigbee protocol by means of firmware. The HAN transceiver has a typical sensitivity of -
104 dBm and a transmission power of 20 dBm. It is powered from the 3.3 V bus and
has 3.3 V logic interfaces enabling direct electrical connection between the UART
interface of the transceiver and the USART interface of the microcontroller. In addition
to the bidirectional UART interface, RTS/CTS hardware flow control is employed. A
logic signal from the microcontroller is assigned to assert the reset line of the HAN
transceiver. Since this line may also be driven by a programmer or debugger connected
to the JTAG interface of the transceiver module the logic signal for the microcontroller
is connected via a transistor in open-collector configuration in order to prevent
possible contention. Finally, a logic-level status signal is provided by the HAN
transceiver which is used to drive one of the notification LEDs.

3 - Design and development of the smart meter test rig
66
Figure 3.4: Smart meter test bed platform motherboard PCB design
Figure 3.4 shows the design of the smart meter test bed platform motherboard PCB.
Figure 3.5 shows this PCB after manufacture and assembly. The elements indicated in
both of these figures are as follows:
1: Sounder
2: Infrared interface
3: Notification LEDs
4: Microcontroller
5: Real-time clock
6: Non-volatile flash memory
7: LCD display
8: JTAG programming interface
9: Push buttons
10: SIM card holder
11: SDRAM
12: Real-time clock battery
1
2
7
8
9
10
11
12
3
5
6
4

3 - Design and development of the smart meter test rig
67
Figure 3.5: Assembled smart meter test bed motherboard
3.3.1.4 - ADC and filtering
The ADC employed is an Analog Devices ADE7753, a two-channel, 16-bit, second-
order, delta-sigma device with a maximum sampling frequency of 31.25 kHz given a
maximum system clock frequency of 4.0 MHz. It integrates a programmable-gain
amplifier (PGA) for both channels, a temperature sensor and signal processing stages
which include RMS calculation. Both channels have a maximum input voltage of ±0.5 V.
The functional block diagram of the ADC is illustrated in Figure 3.6 [220]. The ADC is
configured with one channel performing acquisition of voltage samples and the other
channel performing acquisition of current samples. Anti-aliasing filters are applied to
the input signals of both ADC channels. These filters are first-order RC networks with
both R and C elements socketed in order that the filter characteristic can be configured
for the sampling rate used in a particular experiment.
4
1
2
7
8
9
10
11
12
3
5
6

3 - Design and development of the smart meter test rig
68
Figure 3.6: ADC functional block diagram [220]
The voltage channel signal path includes an attenuation network, preceding the anti-
aliasing filter. The attenuation network is a resistive potential divider which matches
the peak voltage range of an input signal taken from the phase and neutral bus bars
within the meter, when monitoring a 230 V single-phase supply, to the input range of
the ADC. Both R elements in the attenuation network are socketed in order that the
input range can be configured for a particular experiment. In order that a low voltage
input signal within the input voltage range of the ADC can also be used, for example
from a signal generator or real-time digital simulator, provision is made for this to be
connected directly to the input of the anti-aliasing filter. The voltage channel input
stages are illustrated in Figure 3.7.
In order that a Manganin shunt resistor may be used as a current sensing transducer,
the current channel signal path includes a phase correction filter, preceding the
antialiasing filter. The phase correction filter is a first-order RC network which permits
compensation for the phase shift in an input signal incurred from the parasitic
inductance of a shunt resistor. Both R and C elements of this network are also
socketed in order that they may be configured as required. As in the case of the
voltage channel, provision is made that a low voltage signal within the range of the
ADC input may be connected directly to the antialiasing filter. The current channel
input stages are illustrated in Figure 3.8.

3 - Design and development of the smart meter test rig
69
Figure 3.7: Voltage channel input stages
Figure 3.8: Current channel input stages
An integrated voltage reference is used to provide a 2.5 V reference to the ADC with an
accuracy of ±1 mV and a maximum thermal drift of 3 ppm/°C. Since the operating
voltage of the logic interfaces of the ADC is 5.0 V, level translation is required for
communication with the 3.3 V microcontroller. This is achieved by means of an active
bus translation device which, in addition to performing voltage level translation,

3 - Design and development of the smart meter test rig
70
includes Schmitt triggers which increase the slew rate of logic signal edges. The ADC is
connected to the microcontroller, via the bus translation stage, by means of a
bidirectional SPI interface with a maximum clock rate of 10 MHz. Since this is a
synchronous bus, an additional hardware interrupt line is also used. Hence, bus
translation is performed upon five logic lines. These are clock, chip select and data
from the microcontroller to the ADC, and data and interrupt from the ADC to the
microcontroller.
The main clock of the ADC is derived from a local 3.579 545 MHz crystal.
The digital stages of the ADC are powered from the general 5.0 V bus, whilst the
voltage reference device and analogue stages of the ADC are powered from an isolated
5.0 V bus in order to reduce the acquisition of supply-borne noise.
Figure 3.9: Smart meter test bed platform daughterboard PCB design
Figure 3.9 shows the design of the smart meter test bed platform daughterboard PCB.
Figure 3.10 shows this PCB after manufacture and assembly. The elements indicated in
both of these figures are as follows:
1: Zigbee interface
2: JTAG programming interface
3: GPRS interface
4: Bus translation devices
5: ADC
6: Voltage reference source
1 3
5
2
6
4
4
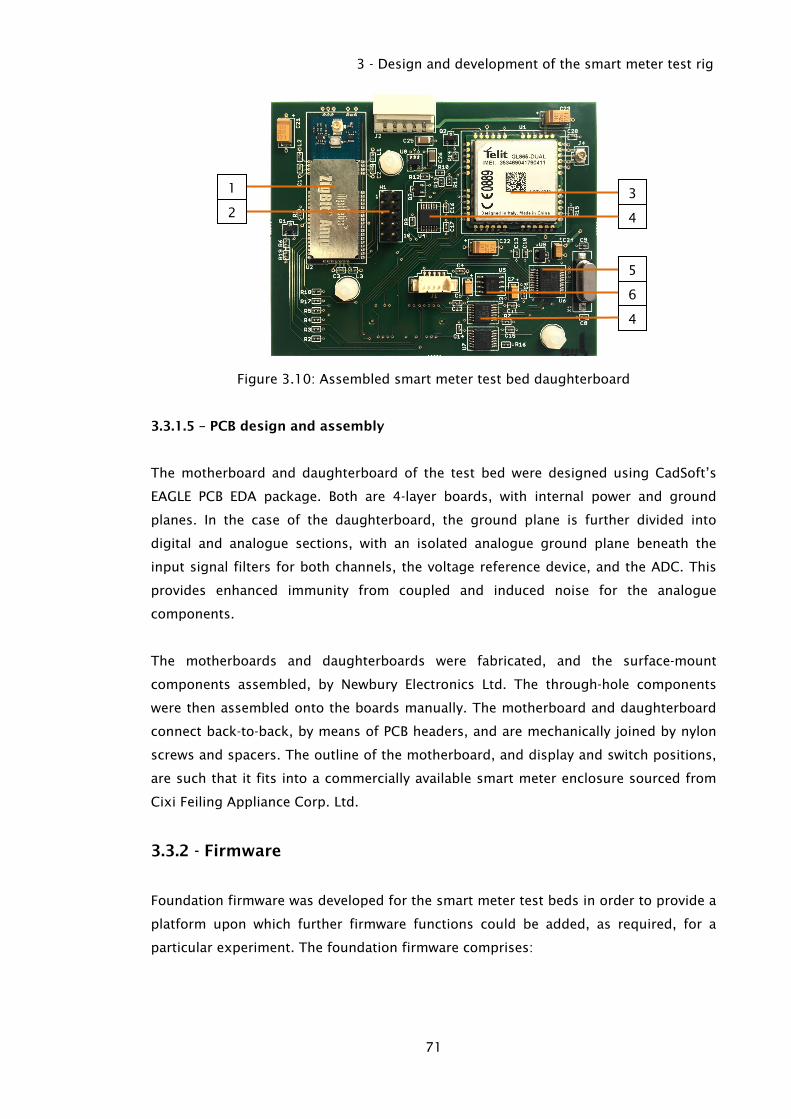
3 - Design and development of the smart meter test rig
71
Figure 3.10: Assembled smart meter test bed daughterboard
3.3.1.5 – PCB design and assembly
The motherboard and daughterboard of the test bed were designed using CadSoft’s
EAGLE PCB EDA package. Both are 4-layer boards, with internal power and ground
planes. In the case of the daughterboard, the ground plane is further divided into
digital and analogue sections, with an isolated analogue ground plane beneath the
input signal filters for both channels, the voltage reference device, and the ADC. This
provides enhanced immunity from coupled and induced noise for the analogue
components.
The motherboards and daughterboards were fabricated, and the surface-mount
components assembled, by Newbury Electronics Ltd. The through-hole components
were then assembled onto the boards manually. The motherboard and daughterboard
connect back-to-back, by means of PCB headers, and are mechanically joined by nylon
screws and spacers. The outline of the motherboard, and display and switch positions,
are such that it fits into a commercially available smart meter enclosure sourced from
Cixi Feiling Appliance Corp. Ltd.
3.3.2 - Firmware
Foundation firmware was developed for the smart meter test beds in order to provide a
platform upon which further firmware functions could be added, as required, for a
particular experiment. The foundation firmware comprises:
1 3
5
2
6
4
4

3 - Design and development of the smart meter test rig
72
1. Drivers for the internal components of the microcontroller, for example the SPI
interfaces.
2. Libraries for the hardware components of the meter which are external to the
microcontroller, for example the ADC.
3. Initialisation routines to enable and configure internal components of the
microcontroller, for example the system clock.
4. Initialisation routines to enable and configure the hardware components of the
meter which are external to the microcontroller, for example the ADC
5. Buffers for the microcontroller USART interface used for communication between
the microcontroller and the WAN hardware module.
6. Interrupt service routines for the microcontroller communications interfaces and
other interrupt triggers, for example the microcontroller timer overflow.
7. A routine for establishing a connection to the WAN server of the test rig using the
WAN interface of the meter.
8. A routine to perform the graceful shutdown of the HAN and WAN interfaces prior to
de-energisation of the meter.
The implementation of these elements is described below:
1. C drivers supplied by the manufacturer of the microcontroller, Atmel, are used to
control the low-level hardware elements of the microcontroller. The drivers used
are:
• CPU: Used to trigger a soft-reset of the microcontroller and provide reset cause
reporting if a reset occurs that was not intentionally triggered.
• PMIC: Used to configure and control the microcontroller Programmable Multilevel
Interrupt Controller.
• SLEEP: Used to configure and enter the low power sleep modes of the
microcontroller.
• SPI: Used to configure and operate the microcontroller SPI interfaces.
• TC: Used to configure and operate the microcontroller Timer/Counter.
• USART: Used to configure and operate the microcontroller USART interfaces.

3 - Design and development of the smart meter test rig
73
In addition to the drivers, a software service module, CLOCK, supplied by Atmel and
written in C, is used to simplify the configuration and control of the system clock.
2. Libraries were written to provide a reference for the registers within hardware
components of the meter, external to the microcontroller. Those included in the
foundation firmware are:
• ade77553.h This contains a reference of the register addresses of the ADC used
in the meter.
• st7565r.h This contains a reference of the internal registers of the LCD
controller used in the meter.
3. The file brazil_board.h assigns identifiers to the microcontroller communications
interfaces used by hardware components of the meter external to the
microcontroller. It also assigns identifiers to the hardware ports of the
microcontroller at pin level. For example, the microcontroller SPI interface used for
communication with the ADC is assigned a designator using the directive #define
ADC_SPI &SPIF, whilst the microcontroller pin used as MOSI within the ADC SPI
interface is assigned a designator using the directive #define ADC_MASTER_MOSI
IOPORT_CREATE_PIN(PORTF,5). The file conf_board.h is used to define the
configuration of the electronic hardware of the smart meter test beds. The
components of the meter which are external to the microcontroller, and which are
enabled as an option in the foundation firmware, are selected by #define directives
within the file conf_board.h. These components are:
• ADC
• LCD display
• GPRS interface
For example, the ADC is enabled using the directive #define CONF_BOARD_ADC.
The file init.c is used to define the parameters of a hardware component required
to initialise it. If a component is enabled in conf_board.h, the function
board_init within init.c, and called from the top-level function main.c,
configures the microcontroller port pins by setting pin direction, initial logic level,
and activating pull-up or pull-down resistors as required. The function board_init
within init.c also configures the microcontroller port pins assigned to the push
buttons, notification LEDs and sounder by default.

3 - Design and development of the smart meter test rig
74
The system clock settings of the microcontroller are configured with #define
directives within the file conf_clock.h. In this way, the system clock source can be
defined and a prescaler applied, if required for a particular experiment. The
foundation firmware defines the system clock source to be the internal 32 MHz RC
oscillator of the microcontroller, with no scaling applied.
4. The microcontroller SPI port assigned to the ADC, defined in brazil_board.h, is
initialised as a bus master within the foundation firmware, with a clock frequency of
1 MHz. It is further configured with a clock polarity of 0 and clock phase of 1, i.e.
the clock signal generated by the microcontroller will have a quiescent state of logic
low and data transfer governed by the clock signal will occur on the falling edge of
the signal. The interrupt enable register within the ADC, IRQEN, is cleared by default
within the foundation firmware and all other ADC registers are left in the default
state.
The microcontroller SPI port assigned to the LCD display, defined in
brazil_board.h, is initialised as a bus master within the foundation firmware, with
a clock frequency of 8 MHz. It is further configured with a clock polarity of 1 and
clock phase of 0, i.e. the clock signal generated by the microcontroller will have a
quiescent state of logic high and data transfer governed by the clock signal will
occur on the rising edge of the clock. Following initialisation of the SPI interface
which drives it, a sequence of configuration commands is sent to the LCD display.
These commands initialize the boost converter within the display, and configure
settings such as contrast, and on which line the first pixel to be addressed resides.
The microcontroller USART port assigned to the GPRS module, defined in
brazil_board.h, is initialized as an asynchronous interface with a bit rate of
9600 b/s, a word size of 8 bits, 1 stop bit and no parity check bit. Following
initialization of the USART interface, a sequence of configuration commands, in the
Hayes/AT format, is sent to the GPRS module. These commands perform the
following functions:
i. Set the AT command echoing policy
ii. Set the flow control policy of the UART interface used to communicate with the
microcontroller of the smart meter
iii. Define a packet data protocol (PDP) context for subsequent GPRS connection.
iv. Configure the socket to be used for subsequent connection, specifying packet
size, socket inactivity timeout, connection timeout (the maximum period to wait

3 - Design and development of the smart meter test rig
75
for the acceptance of a connection before raising an error), and data sending
timeout (the maximum period to wait before transmitting the contents of the
transmit buffer, even if the number of bytes to send is less than the defined
packet size).
v. Activate the PDP context defined by function 3.
The parameters set by these commands in the foundation firmware are given in
Table 3.1.
Table 3.1: Foundation firmware GPRS settings
AT command echoing: Disabled
Flow control: Hardware, mono-directional (CTS only)
PDP type: IP
PDP header compression: Disabled
PDP data compression: Disabled
TCP/UDP packet size: 300 B
Socket inactivity timeout: 90 s
Socket connection timeout: 600 s
Socket sending timeout: 50 s
5. Two dynamically allocated, 1 kB arrays are created in the foundation firmware to
buffer data received from, and awaiting transmission to, the GPRS module. These
arrays are operated as circular buffers. Functions to instantiate the buffer structure
and to perform operations on the buffer, such as adding or removing elements, are
defined within the file ring_buffer.h.
6. Generic, prototype interrupt service routines were implemented to handle data flow
between any of the USART interfaces of the microcontroller, when used
asynchronously, and circular buffers allocated to a hardware module external to the
microcontroller, for example the GPRS module. Separate interrupt service routines
were implemented to handle data awaiting transmission from, and data which has
been received to, the microcontroller. Flow diagrams describing the operation of
both the transmit and receive buffers are illustrated in Figure 3.11.
Upon reception of data by a USART interface of the microcontroller the USART RX
interrupt is triggered, and an instance of the USART RX interrupt service routine
copies the received data to the circular input buffer associated with the USART
interface upon which data has been received. The USART RX interrupt is then
cleared. When the hardware transmission buffer of a USART interface of the
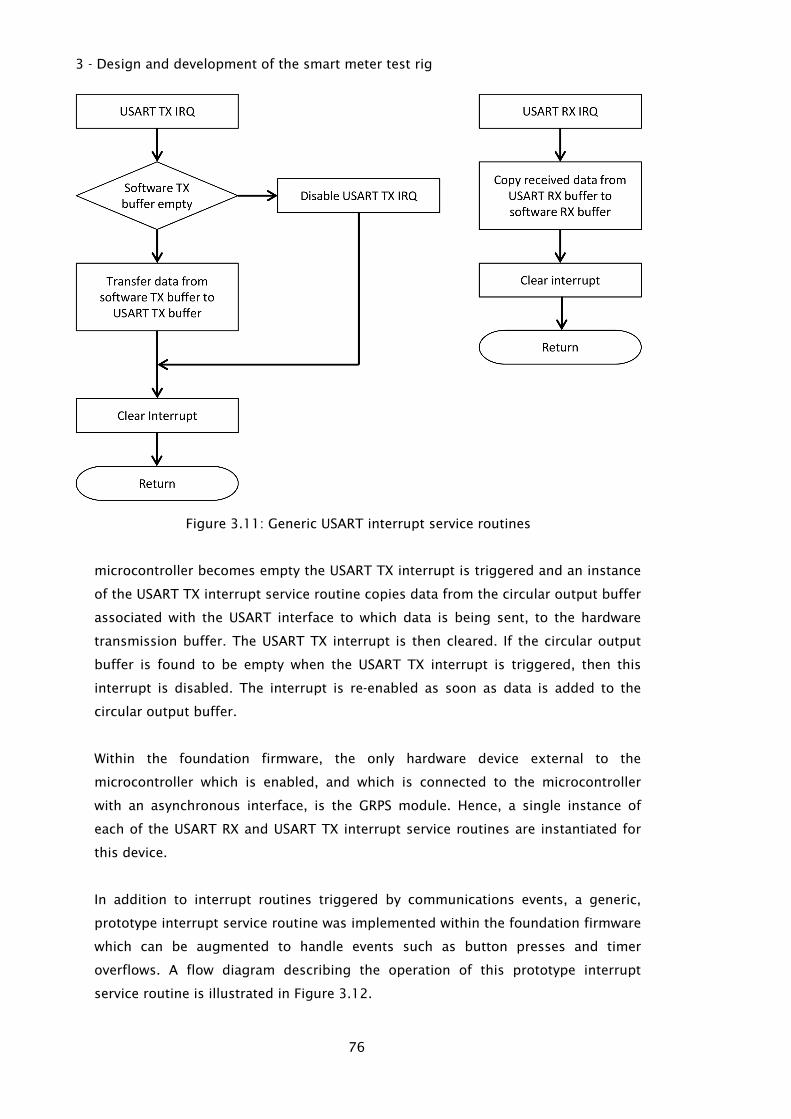
3 - Design and development of the smart meter test rig
76
Figure 3.11: Generic USART interrupt service routines
microcontroller becomes empty the USART TX interrupt is triggered and an instance
of the USART TX interrupt service routine copies data from the circular output buffer
associated with the USART interface to which data is being sent, to the hardware
transmission buffer. The USART TX interrupt is then cleared. If the circular output
buffer is found to be empty when the USART TX interrupt is triggered, then this
interrupt is disabled. The interrupt is re-enabled as soon as data is added to the
circular output buffer.
Within the foundation firmware, the only hardware device external to the
microcontroller which is enabled, and which is connected to the microcontroller
with an asynchronous interface, is the GRPS module. Hence, a single instance of
each of the USART RX and USART TX interrupt service routines are instantiated for
this device.
In addition to interrupt routines triggered by communications events, a generic,
prototype interrupt service routine was implemented within the foundation firmware
which can be augmented to handle events such as button presses and timer
overflows. A flow diagram describing the operation of this prototype interrupt
service routine is illustrated in Figure 3.12.

3 - Design and development of the smart meter test rig
77
Figure 3.12: Generic, prototype interrupt service routine
Within the foundation firmware, this prototype routine is instantiated and
augmented in order to service interrupt requests by the system timer internal to the
microcontroller.
7. Following the successful configuration and initialisation of the GPRS module,
including the creation and activation of a valid PDP context, the foundation firmware
attempts to establish a TCP/IP connection with port 7048 of the GPRS server. The
GPRS interface is left in a state such that further functions and communication may
be performed, as required, for a particular experiment.
8. A function was included within the foundation firmware which terminates an open
TCP/IP connection if one exists, deactivates the associated, active PDP context, and
releases the bound socket.
3.4 - Test rig development
3.4.1 - Real Time Digital Simulator
The Real Time Digital Simulator (RTDS) employed is a physically self-contained machine
manufactured by RTDS Technologies, which contains interchangeable cards for the
real-time simulation of electrical networks as well as peripheral functions such as
supervision of the unit and SCADA communication. A Giga Transceiver Analogue
Output (GTAO) card, manufactured by RTDS Technologies, is used in conjunction with

3 - Design and development of the smart meter test rig
78
the Giga Processor (GPC) cards of the RTDS unit in order to provide analogue signals to
the current and voltage inputs of the smart meters, as described in Section 3.3.1.4.
The analogue outputs of the GTAO card are single-ended with a range of ±10 V. The
values of current and voltage signals from metered points with the simulated network
are therefore scaled in order to fall within this range before being presented to the
GTAO interface. The output values are refreshed on each 50 µs time-step of the
network simulation performed by the RTDS, yielding an effective signal bandwidth of
10 kHz in accordance with the Nyquist–Shannon sampling theorem.
A Giga Transceiver Network Interface (GTNET) card, manufactured by RTDS
Technologies, is used in conjunction with the GPC cards in order to provide a SCADA
interface over Ethernet between hardware external to the RTDS and devices in
networks simulated within the RTDS, such as transformer tap changers.
A Giga Transceiver Workstation Interface Card (GTWIF), manufactured by RTDS
Technologies, is used in conjunction with the manufacturer’s proprietary software
package, RSCAD. This permits the layout and compilation of simulated networks, the
upload of compiled networks to the GPC cards, and the control of a simulation during
execution. The software package runs on a physically separate x86-64 desktop
computer running the 32-bit edition of Debian GNU/Linux.
3.4.2 - SCADA server
The SCADA Server is a physically separate machine which acts as a bridge between the
Giga Transceiver Network Interface (GTNET) card of the RTDS unit and the system
controller. The GTNET card supports DNP3 for SCADA communication as a slave device
only, and hence a DNP3 master station is required in order to connect to, and
exchange data with, the card. The role of DNP3 master station is fulfilled by the
software package PeakHMI, produced by Everest Software. A table of data points is
created within the PeakHMI software which represents values to be read from, or
written to, the GTNET DNP3 slave. These data points are created as required for a
particular experiment. However, examples include a binary value to be written to the
GTNET card to set the state of a circuit breaker, or a floating-point value to be read
from the GTNET card in order to obtain the output value of a current transformer when
these devices are used in a power network simulated within the RTDS. The DNP3
master station exchanges data between the table of data points and the DNP3 slave
device once every second.

3 - Design and development of the smart meter test rig
79
In addition to the DNP3 master station, the PeakHMI software package hosts an OPC
server with access to the table of data points referred to by the DNP3 master station.
The OPC server permits human-readable references to be assigned to points within the
data table, and permits an OPC client connected to the server to request a list of the
data points and to access them for reading, writing or both.
The SCADA server is an x86-64 desktop computer running the 32-bit edition of
Microsoft Windows 7. It also runs the 32-bit edition of version 2.6 of the ActiveState
Python distribution.
3.4.3 - GPRS server
The GPRS server is a physically separate, internet-facing system running a software
server written in Python which accepts connections from the smart meter test beds.
The server employs multithreading in order to support concurrent connections from
multiple smart meter test beds. It also performs basic handling of data streams to and
from the meters to which further functions can be added, as required, for a particular
experiment.
The main process within the server instantiates a TCP/IP listening socket and binds it
to port 7048. Upon receiving a connection request, the main process verifies that the
maximum number of concurrent connections has not been exceeded and, if this is the
case, accepts the connection. If the maximum number of concurrent connections has
been reached, the request for a connection will be declined. Following the acceptance
of a connection, the main process instantiates a new object of the class Meter, which
stores the remote IP address and port of the connected meter as well as its serial
number, a record of the current status of the meter, and a data structure to contain
received data. The main server process adds the Meter object to the list of connected
devices and instantiates a new handler thread to which it passes the Meter object.
The meter handler thread allocated to a particular meter buffers the data stream
received over the connection with the meter and reassembles the data frames
contained within it. STX/ETX frame encapsulation is employed for data transmitted
between the server and connected meter and, as such, the handler thread will discard
any data received until the start of a frame is signalled by the reception of an STX
character. The handler will then reassemble the frame, which may span multiple TCP/IP
packets, until the end of the frame is signalled by reception of the ETX character. Data
subsequent to an ETX character within a TCP/IP packet it not lost, but rather is parsed
for further complete or partial data frames. A default limit of 1 kB is placed on the

3 - Design and development of the smart meter test rig
80
received data frames and frames exceeding this will be considered as malformed and
hence discarded. Occurrences of the frame encapsulation characters within the data
conveyed by a frame are handled in the same manner as the point-to-point protocol
(PPP), a variant of the ISO high-level data link control (HDLC) protocol. Under this
scheme, the instance of the reserved character within the data is replaced by the
escape character 0x7D, followed by the original character bitwise XORed with 0x20.
In order to handle scheduled events, such as requests for readings to be transmitted to
connected meters, the main process instantiates an event scheduler process with a
default clock tick period of 1 s. To prevent connections with meters being closed
unintentionally as a result of timeouts being triggered at any point along the length of
the TCP/IP connection route, a default broadcast is made to all meters in the list of
connected devices on every clock tick.
Figure 3.13 illustrates the execution of the GPRS server. In this example, the main
process first instantiates the event scheduler process. Connections from two meters
are then accepted with a handler process being instantiated for each. One connection
is then lost, whilst one persists beyond the period covered by the figure. The default
poll, broadcast to all connected meters by the event scheduler, is also shown.

3 - Design and development of the smart meter test rig
81
Figure 3.13: GPRS server core processes
The GPRS server is an x86-64 desktop computer running the 64-bit edition of Debian
GNU/Linux. It also runs the 64-bit edition of version 2.7 of Python for Linux.
3.4.4 - Controller
The controller is an x86-64 desktop computer running the 64-bit edition of Debian
GNU/Linux. It also runs the 64-bit edition of version 2.7 of Python for Linux and
version 1.2.0 of OpenOPC. Python control schemes are executed on the controller, as
required, for a particular experiment.
3.4.5 - Physical architecture
The physical architecture of the smart meter test rig is based on the logical
architecture described in Section 3.2.2 and illustrated in Figure 3.2, and is illustrated in
Figure 3.14. The connections between the RTDS GTWIF card and the RTDS workstation,
as well as between the RTDS GTNET card, SCADA server, GPRS server and controller,
are 100 Mb/s Ethernet links using an unmanaged switch. Communication between the
cards within the RTDS unit is by means of optical links. In the case of all interfaces
shown in Figure 3.14, significant protocols are specified, with N/S denoting that a non-
standardised or application-specific protocol is used.

3 - Design and development of the smart meter test rig
82
Figure 3.14: Physical architecture of the smart meter test rig
For the purpose of further research using the test rig, four smart meter test beds were
manufactured. The RTDS unit and these smart meter test beds are shown in Figure
3.15. The mother and daughter boards of the meter are shown installed within
enclosures, and powered from a laboratory power supply. The coaxial BNC leads
conveying the voltage and current signals from the RTDS unit to the meters can also be
seen.

3 - Design and development of the smart meter test rig
83
Figure 3.15: RTDS unit and smart meter test beds
3.5 - Commissioning
In order to verify the correct operation of all the hardware, firmware and software
elements within the smart meter test rig, a commissioning test was implemented. For
the purpose of the test, only one of the four smart meter test beds was used.
3.5.1 - Commissioning test design
A simple, closed-loop test was designed to demonstrate the correct functioning of the
test rig, based on the principle of voltage regulation by means of a transformer
equipped with a SCADA-controlled OLTC. A single smart meter test bed was used to
monitor the bus voltage of this transformer within a network simulated by the RTDS,
using an analogue output. A controller script was written in Python which received
voltage readings from the smart meter test bed via the GPRS server at one-second
intervals and, if the readings violated preset limits, issued tap-change directives to the
OLTC within the simulated network via the SCADA server. This was tested by manually
triggering a step change in the supply voltage of the transformer within the simulated
network.

3 - Design and development of the smart meter test rig
84
3.5.2 - Simulated network
A simple network was created in RSCAD, consisting of a nominal 11 kV supply, a
500 kVA, 11 kV/415 V transformer, and a dynamic load for which real and reactive
demand can be set during runtime. Circuit breakers were also included on both the
primary and secondary sides of the transformer. The transformer incorporated a tap
changer with positions from 0.80 p.u. to 1.25 p.u., with intervals of 0.05 p.u. The
voltage of phase A, relative to neutral, was routed as an analogue output signal from
the RTDS unit. This output was scaled by a ratio of 100:1, such that 500 V within the
simulated network represented a full-scale output of 5 V from the RTDS unit. This
output was provided as an input to the voltage channel of the smart meter test bed. A
DNP3 SCADA slave station with three points was also created within the simulated
network. These points were associated with the input registers ‘TapUp’ and ‘TapDown’,
triggering the OLTC to tap up and down respectively, and the output register ‘TapPos’,
returning the current tap position. The schematic of this network is shown in Figure
3.16.
Figure 3.16: Commissioning test network schematic
In order to control the simulated network during the test, a runtime control screen was
also created in RSCAD. This enabled the supply voltage of the transformer to be varied
in the range 10.5 kV to 11.5 kV, and the real and reactive load on the transformer to
be varied in the ranges 0–500 kW and 0–500 kVA respectively. It also enabled the
circuit breakers within the network to be controlled, and the voltage at the metering
point to be monitored. The runtime control screen is shown in Figure 3.17.
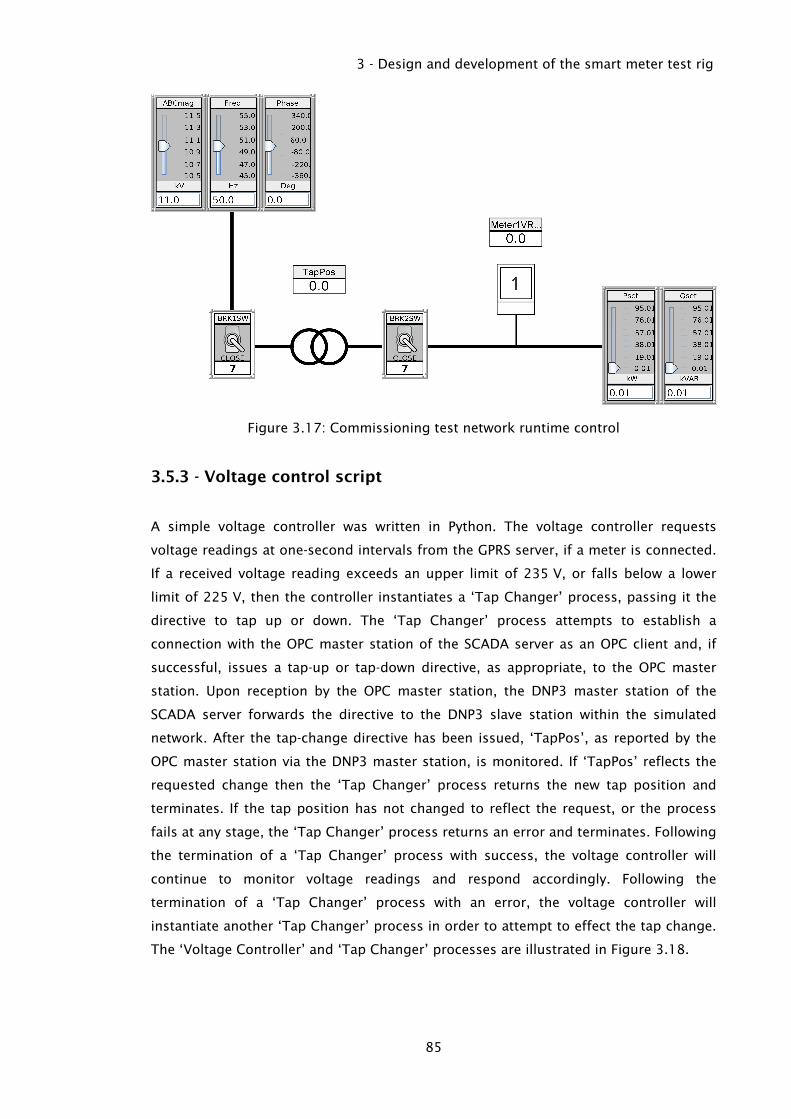
3 - Design and development of the smart meter test rig
85
Figure 3.17: Commissioning test network runtime control
3.5.3 - Voltage control script
A simple voltage controller was written in Python. The voltage controller requests
voltage readings at one-second intervals from the GPRS server, if a meter is connected.
If a received voltage reading exceeds an upper limit of 235 V, or falls below a lower
limit of 225 V, then the controller instantiates a ‘Tap Changer’ process, passing it the
directive to tap up or down. The ‘Tap Changer’ process attempts to establish a
connection with the OPC master station of the SCADA server as an OPC client and, if
successful, issues a tap-up or tap-down directive, as appropriate, to the OPC master
station. Upon reception by the OPC master station, the DNP3 master station of the
SCADA server forwards the directive to the DNP3 slave station within the simulated
network. After the tap-change directive has been issued, ‘TapPos’, as reported by the
OPC master station via the DNP3 master station, is monitored. If ‘TapPos’ reflects the
requested change then the ‘Tap Changer’ process returns the new tap position and
terminates. If the tap position has not changed to reflect the request, or the process
fails at any stage, the ‘Tap Changer’ process returns an error and terminates. Following
the termination of a ‘Tap Changer’ process with success, the voltage controller will
continue to monitor voltage readings and respond accordingly. Following the
termination of a ‘Tap Changer’ process with an error, the voltage controller will
instantiate another ‘Tap Changer’ process in order to attempt to effect the tap change.
The ‘Voltage Controller’ and ‘Tap Changer’ processes are illustrated in Figure 3.18.

3 - Design and development of the smart meter test rig
86
Figure 3.18: Voltage controller processes
3.5.4 - Test setup
The simulated network was compiled and executed on the RTDS with control of the
simulation transferred to the runtime screen shown in Figure 3.17. A balanced load of
100 kW was applied to the transformer in the simulated network with the transformer
tap position at 1.0 p.u. This yielded a voltage of approximately 228 V between the
metered points. The GPRS server and SCADA servers were then started. A single meter
was energised, with its voltage channel input connected to the RTDS GTAO card output
associated with metered points in the test network. Finally, the voltage controller script
was executed.
3.5.5 - Commissioning test results
In the first test, the supply voltage was changed from a starting value of 11.0 kV to
10.5 kV using the runtime control screen. The voltage controller responded to the
metered voltage falling below the lower limit by instantiating a ‘Tap Changer’ process
which, in turn, increased the tap position to 1.05 p.u. and returned the metered
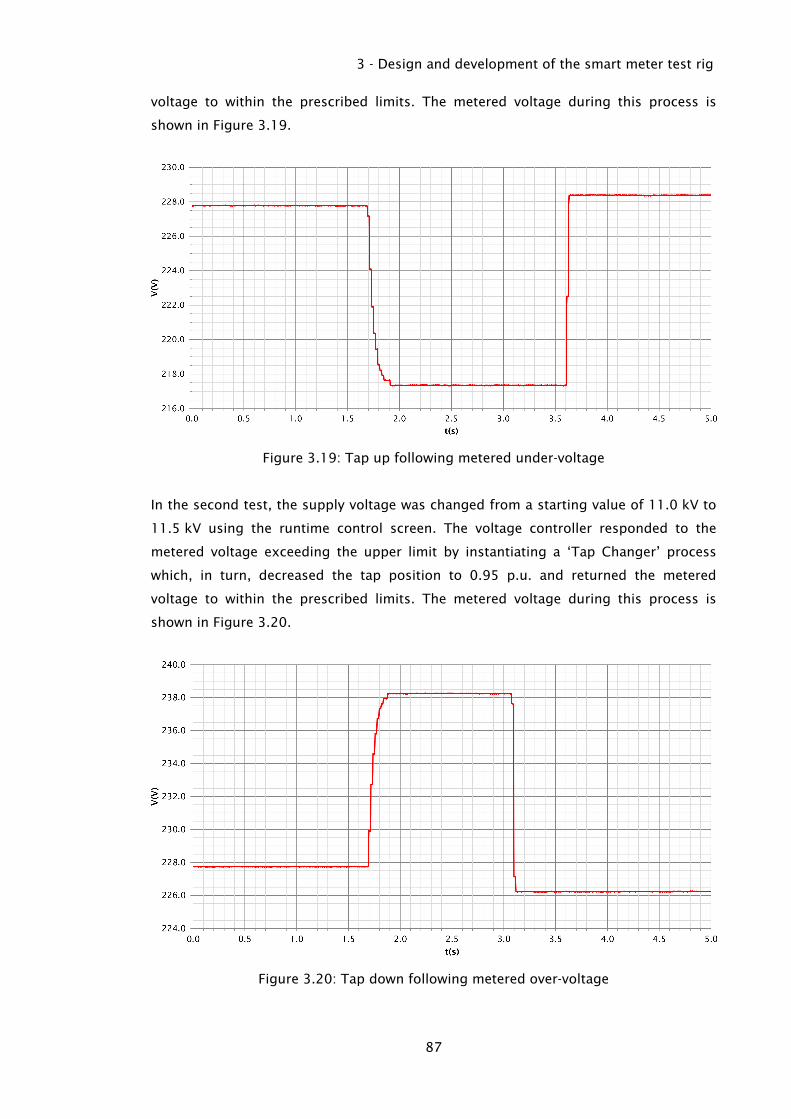
3 - Design and development of the smart meter test rig
87
voltage to within the prescribed limits. The metered voltage during this process is
shown in Figure 3.19.
Figure 3.19: Tap up following metered under-voltage
In the second test, the supply voltage was changed from a starting value of 11.0 kV to
11.5 kV using the runtime control screen. The voltage controller responded to the
metered voltage exceeding the upper limit by instantiating a ‘Tap Changer’ process
which, in turn, decreased the tap position to 0.95 p.u. and returned the metered
voltage to within the prescribed limits. The metered voltage during this process is
shown in Figure 3.20.
Figure 3.20: Tap down following metered over-voltage
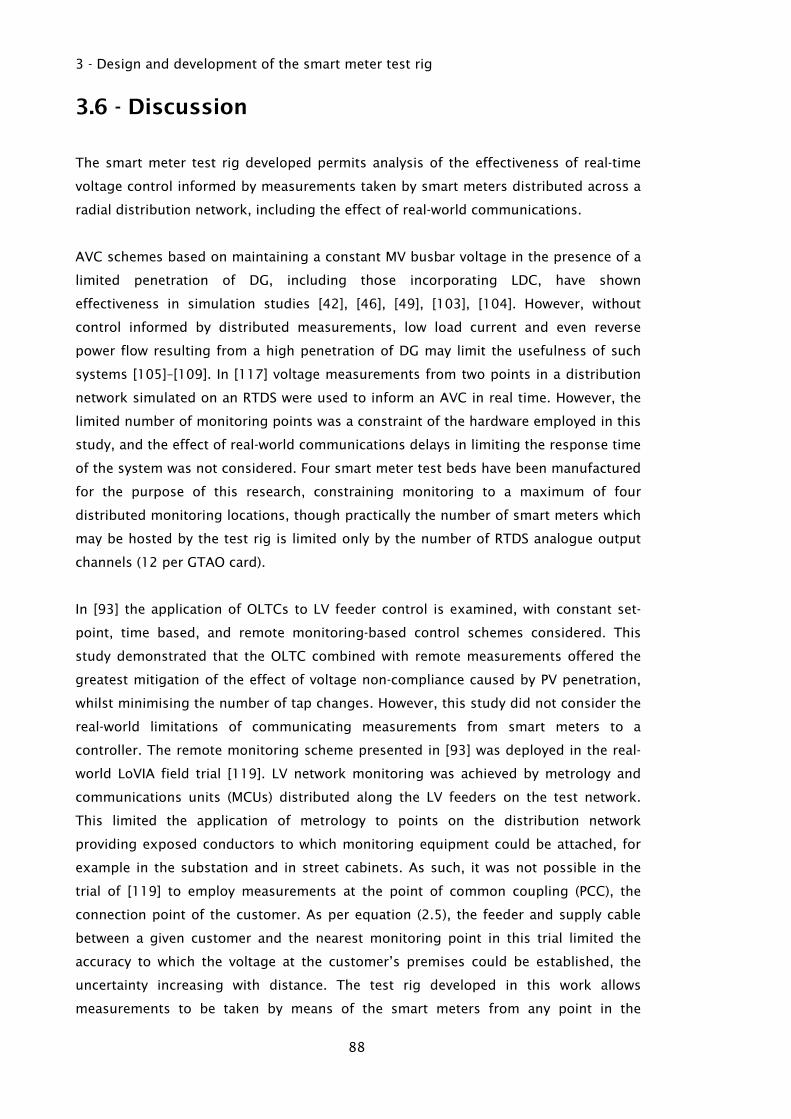
3 - Design and development of the smart meter test rig
88
3.6 - Discussion
The smart meter test rig developed permits analysis of the effectiveness of real-time
voltage control informed by measurements taken by smart meters distributed across a
radial distribution network, including the effect of real-world communications.
AVC schemes based on maintaining a constant MV busbar voltage in the presence of a
limited penetration of DG, including those incorporating LDC, have shown
effectiveness in simulation studies [42], [46], [49], [103], [104]. However, without
control informed by distributed measurements, low load current and even reverse
power flow resulting from a high penetration of DG may limit the usefulness of such
systems [105]–[109]. In [117] voltage measurements from two points in a distribution
network simulated on an RTDS were used to inform an AVC in real time. However, the
limited number of monitoring points was a constraint of the hardware employed in this
study, and the effect of real-world communications delays in limiting the response time
of the system was not considered. Four smart meter test beds have been manufactured
for the purpose of this research, constraining monitoring to a maximum of four
distributed monitoring locations, though practically the number of smart meters which
may be hosted by the test rig is limited only by the number of RTDS analogue output
channels (12 per GTAO card).
In [93] the application of OLTCs to LV feeder control is examined, with constant set-
point, time based, and remote monitoring-based control schemes considered. This
study demonstrated that the OLTC combined with remote measurements offered the
greatest mitigation of the effect of voltage non-compliance caused by PV penetration,
whilst minimising the number of tap changes. However, this study did not consider the
real-world limitations of communicating measurements from smart meters to a
controller. The remote monitoring scheme presented in [93] was deployed in the real-
world LoVIA field trial [119]. LV network monitoring was achieved by metrology and
communications units (MCUs) distributed along the LV feeders on the test network.
This limited the application of metrology to points on the distribution network
providing exposed conductors to which monitoring equipment could be attached, for
example in the substation and in street cabinets. As such, it was not possible in the
trial of [119] to employ measurements at the point of common coupling (PCC), the
connection point of the customer. As per equation (2.5), the feeder and supply cable
between a given customer and the nearest monitoring point in this trial limited the
accuracy to which the voltage at the customer’s premises could be established, the
uncertainty increasing with distance. The test rig developed in this work allows
measurements to be taken by means of the smart meters from any point in the

3 - Design and development of the smart meter test rig
89
distribution network simulated on the RTDS, without limitations of access to
connection points. The performance of the system described in [119] is further limited
by the intrinsic minimum response time of the voltage monitoring ‘nodes’ employed
for the study, which present measurements as one-minute averages. Similarly, in the
DG DemoNet – Smart LV Grid project [113]–[116], field trials of an OLTC controller
informed by commercial smart meters were conducted on three Austrian LV networks.
However, measurement granularity was limited by the commercial meters to a 5-
minute moving-average value. The smart meter test beds developed in this work as
part of the test rig may be configured such that voltage measurements are transmitted
immediately, or averaged over an arbitrary number of samples or period of time,
permitting the response of the system to be examined without limitations imposed by
third-party hardware. The system employed for communication with the smart meters
in the DG DemoNet – Smart LV Grid project was further limited by the fixed broadband
over power line (BPL) communications protocol employed by the commercial meters,
incurring a typical overhead of 1 s. The smart meter test beds developed in this work
employ a cellular network interface, which reflects the preferred communications
system for smart meter deployments in the UK, and permit the real-world
communications and processing delays incurred in a real-time control system
incorporating smart meters to be evaluated. These delays are non-deterministic
factors, not adequately examined in existing studies.
The principal limitations of the test rig developed in this work are those of the
necessary simplification of the distribution network simulated by the RTDS, due to
finite processing capacity, and the small population of meters manufactured. A
simplified power network simulation cannot fully reflect chaotic behaviours of real-
world generation sources and loads, particularly at the level of LV where, at the
periphery of the distribution network, the aggregated power figures based on
diversified generation and demand are a weaker approximation of true power profiles.
An advantage of the simulated distribution network, however, is that smart meters may
always be preferentially allocated to network locations which are expected to
experience the greatest voltage deviations, for example end points on radial feeders or
long radial tees. In this way, the provision of smart meter measurements from all
customers on a distribution network is not required, since a smaller population of
meters may be allocated to such critical locations. However, a small population of
smart meters does have the consequence of limiting the scope for examining the
impact of communications congestion and processing overhead, if a smart metering
head-end system is to support end-to-end communications with a large number of
meters.
3 - Design and development of the smart meter test rig
90
3.7 - Conclusion
A smart meter test bed platform has been developed which permits the control of
sample acquisition, processing and communication parameters. A Real Time Digital
Simulator has been employed to simulate a section of distribution network, and to
provide analogue output signals representative of values within a simulated network in
real-time. A test rig has been assembled which integrates these components in the
form of a closed-loop control system, whereby SCADA-controllable assets within the
simulated network may be directed by a controller informed by readings acquired by
the smart meter test beds. Finally, a simple voltage control application has been
implemented using one of the smart meter test beds, which successfully demonstrated
the correct operation of the test rig, for the purpose of commissioning.
91
4 - Distribution network voltage control
using smart meters
4.1 - Introduction
The use of the smart meter test rig to demonstrate the implementation of real-time
voltage control within an LV network is described. This employs the hardware, and
builds on the foundation software and firmware, described in Chapter 3.
Subsequent sections are structured as follows:
• Section 4.2 describes the development of a simplified LV network model for
execution on a Real Time Digital Simulator (RTDS), and based on an existing generic
distribution network model. The model extends from an 11 kV source to four LV
feeders. The network model includes a distribution transformer equipped with an
on-load tap changer (OLTC), and generation and load blocks which are controllable
in order to simulate variation in the magnitude of generation and demand at
different points within the network. The network also contains metering points
allowing signals from the simulated network to be routed to the smart meter test
beds via the hardware digital to analogue converters of the RTDS.
• Section 4.3 describes the implementation of a voltage alarm function to augment the
foundation firmware of the smart meter test beds described in Chapter 3. This
enables the smart meters to report, by exception, the detection of a measured
voltage which violates prescribed limits.
• Section 4.4 describes the implementation of an automatic voltage controller. This
implements an algorithm to assess the present voltage conditions measured within
the simulated network by the smart meters and estimates the future voltage
conditions if a tap change is performed. Based on the outcome of this algorithm and
the availability of tap positions, the voltage control process will determine if a tap
change should be requested, conduct the tap-change process over SCADA if
necessary, and assess the subsequent network voltage conditions.
• Section 4.5 describes the configuration of instruments used in the experiment to
demonstrate real-time voltage control, and of the telecommunications infrastructure
employed. It also describes the test parameters used.

4 - Distribution network voltage control using smart meters
92
• Section 4.6 presents four test scenarios, illustrating the response of the voltage
control system to voltage excursions on a simulated LV network exhibiting heavy
loading and containing a high penetration of distributed generation. The four
scenarios demonstrate the scope for voltage regulation using the on-load tap
changer in the case of:
1. Heavy loading, for example from a high penetration of electric vehicle charging.
2. High levels of distributed generation, for example from a high penetration of
solar PV installation.
3. Heavy, imbalanced loading.
4. The conflicting requirements of a combination of heavy loading and high levels of
distributed generation.
• Section 4.7 discusses the work undertaken, in the context of existing research in
this field, and summarises the advancements and contributions made. The
limitations of the approach taken are also considered.
• Section 4.8 summarises and concludes the work presented in this chapter.
4.2 - LV network model
4.2.1 - Simulation topology
The LV distribution network model developed was based on the generic, UK
distribution network, presented by Ingram et al. [57]. For the purpose of this research,
a single 11 kV/LV transformer was considered, fed by an 11 kV source. Circuit
breakers are included in the model between the 11 kV source and the transformer, and
between the transformer and the LV bus, as a means of switching the supply to the
simulated network during the process of testing. Four feeders are modelled, diverging
radially from the LV bus. Along each of these feeders a grouped load/source block is
modelled at the centre and end of the feeder. These are separated from each other,
and from the LV bus, by simulated cable sections. The topology of the network is
illustrated in Figure 4.1.
The network model was constructed in RTDS Technologies’ RSCAD software, and
simulated with a time-step of 75 µs. The model permits two cases, each describing the
load and generation power of the individual loads and sources within each load/source

4 - Distribution network voltage control using smart meters
93
block, to exist concurrently. By switching between these cases during runtime the
response of the voltage control system to the effects of a change in power flow within
the simulated network can be observed.
Figure 4.1: LV distribution network topology
4.2.2 - Network source and transformer configuration
The 11 kV source was assigned a rating of 25 MVA. This was simulated using an
infinite bus voltage source combined with a positive sequence impedance. In order to
conserve simulation capacity, a purely resistive series impedance, R, was employed for
each phase, and calculated as follows:
(4.1)
Where V is the line voltage, and P is the source rating.
The transformer was further modelled as ideal, neglecting magnetising inductance and
potential core saturation, with a rating of 500 kVA. It was assigned a Dy11 winding
configuration with a leakage inductance of 0.05 p.u. and no-load losses of 0.001 p.u.
The transformer is equipped with an OLTC, with a range of 87.5 % to 112.5 % in
increments of 2.5 %, and assumed to be electronically-commutated. The tap changer
has inputs which trigger tap changes up or down on the rising edge of a pulse and an
output which return the current tap position. The source and transformer schematic
from RSCAD are shown in Figure 4.2.

4 - Distribution network voltage control using smart meters
94
Figure 4.2: Distribution network source and transformer
4.2.3 - Cable modelling
Two cable section models were used in the simulated network. The first, used between
the LV bus and the first load/source block on each feeder, was modelled as 300 m
length of 185mm2 CNE type cable with an impedance of 0.164 + j0.074 Ω/km for the
phase conductors and 0.164 + j0.014 Ω/km for the neutral conductors, as per [57].
The cable section model was therefore constructed with a phase and neutral series
resistance of 49.2x10⁻³ Ω and series inductance calculated as follows:
Phase conductor:
(4.2)
Neutral conductor:
(4.3)
The second cable section, used between the first and second load/source block on
each feeder, was modelled as a 300 m length of 95mm2 CNE type cable with a cable
impedance is 0.32 + j0.075 Ω/km for the phase conductors and 0.32 + j0.016 Ω/km
for the neutral conductors. The cable section model was therefore constructed with a
phase and neutral series resistance of 96x10-3 Ω and series inductance calculated as
follows:
Phase conductor:
(4.4)

4 - Distribution network voltage control using smart meters
95
Neutral conductor:
(4.5)
The schematic of the cable section models is shown in Figure 4.3.
Figure 4.3: Cable section models
4.2.4 - Load/source block design
The load/source blocks, modelled at the centre and end of each of the four LV feeders
are comprised of single-phase dynamic load models, provided by RSCAD, and power
injection subsystems developed for the purpose of this study. Both the load and source
elements were connected phase-neutral.
Each single-phase load and source within the load/source block was assigned three
inputs. Two of these define set-points for real power flow, designated ‘A’ and ‘B’, and a
third input, designated ‘SCENE’, selects which of ‘A’ and ‘B’ to assign as the current
set-point. In this way, the set-points for two possible cases can be entered for all load
and source elements in the network and a switch made between the two cases,
affecting all load and source elements, controlled by the global variable ‘SCENE’.
4.2.5 - Dynamic load module control
The dynamic load modules are preceded by a selector which, based on the ‘SCENE’
input, defines which of inputs ‘A’ and ‘B’ are provided as the set-points to the module
in the case of real and reactive power. The selectors controlling the real and reactive
power set-points of the red phase load module in load/source block 1A are shown in
Figure 4.4.

4 - Distribution network voltage control using smart meters
96
Figure 4.4: Load module set-point selectors
4.2.6 - Power injection subsystem design and control
Real power injection within the load/source blocks is achieved using a controlled
voltages source connected to each feeder phase via series inductors, as shown in
Figure 4.5.
Figure 4.5: Power injection circuit
The relationship between voltage, phase and reactance in this circuit is defined as
follows:
(4.6)
(4.7)
Where V1 and δ1 are the voltage and phase of the controlled source, V2 and δ2 are the
voltage and phase of the feeder, X is the series reactance, and P and Q are the real and
reactive power flow. Rearranging these equations yields the expressions for real and
reactive power transfer between voltage source and feeder:
(4.8)

4 - Distribution network voltage control using smart meters
97
(4.9)
In order to control active power flow into the feeder, the phase of the controlled source
relative to the feeder is increased, whilst the voltage of the controlled source is
matched to that of the feeder. The phase angle can therefore be expressed as follows:
(4.10)
Where δ is the phase of the controlled source with respect to the feeder, and V is the
matched voltage of the controlled source and feeder. In this application, only active
power flow is controlled, and the reactive power flow is not regulated. As in the case of
the dynamic load modules, the power injection subsystems are also preceded by a
selector which, based on the ‘SCENE’ input, defines which of input ‘A’ and ‘B’ are
provided as the real power set-point to the subsystem. A source capacity of 100 kVA is
used. Hence the reactance is obtained as follows:
(4.11)
The RMS voltage of the feeder phase into which power is to be injected is calculated in
the metering subsystem of the simulation and, hence, is available to reference in this
subsystem. In order to synchronise the controlled source with the feeder, a zero-
crossing detector is used to monitor the voltage of the phase to which is in connected,
relative to neutral, and trigger a ramp generator. A constant is included in the
subsystem to compensate for the simulation time-step delay, ∆t, incurred as a result of
signal exchange between processors used for power system and control simulation
within the RTDS hardware. This is added to the phase of the controlled source. In the
case of the subsystem described here, with a time-step of 75 µs, an average delay of
1.5 time-steps is incurred. The compensation constant is therefore calculated as
follows:
(4.12)
This compensation constant is added to the calculated value of δ and the output of the
ramp generator, and sine of the total angle is calculated. The result of the sine
calculation is then scaled to match the voltage of feeder, and the final value used to

4 - Distribution network voltage control using smart meters
98
control the voltage source. The complete power injection subsystem is shown in Figure
4.6.
Figure 4.6: Power injection subsystem
The schematic of load/source block 1A is shown in Figure 4.7.
Figure 4.7: Load/source block schematic

4 - Distribution network voltage control using smart meters
99
2.6 - LV network simulation control
An RSCAD runtime environment was developed in order to control the simulated
network during testing. The control interface for the 11 kV source and 11 kV/LV
transformer is shown in Figure 4.8. This interface includes controls for the 11 kV
source voltage and circuit breakers on the primary and secondary sides of the
11 kV/LV transformer, monitoring of the OLTC tap position, and monitoring of the LV
bus. It also includes a control for the global variable ‘SCENE’ which sets which of case
‘A’ or ‘B’ is currently in use.
Figure 4.8: Network source, transformer and scene control
The control interface for load/source block 1A is shown in Figure 4.9. This interface
includes controls for the active and reactive power of the dynamic load models, and
the set-points of the active power injection subsystems. These controls are duplicated
for cases ‘A’ and ‘B’, and the current case highlighted in red. The control interface also
includes monitoring of the feeder voltage at the load/source block location and the
delivered current of the active power injection subsystems.
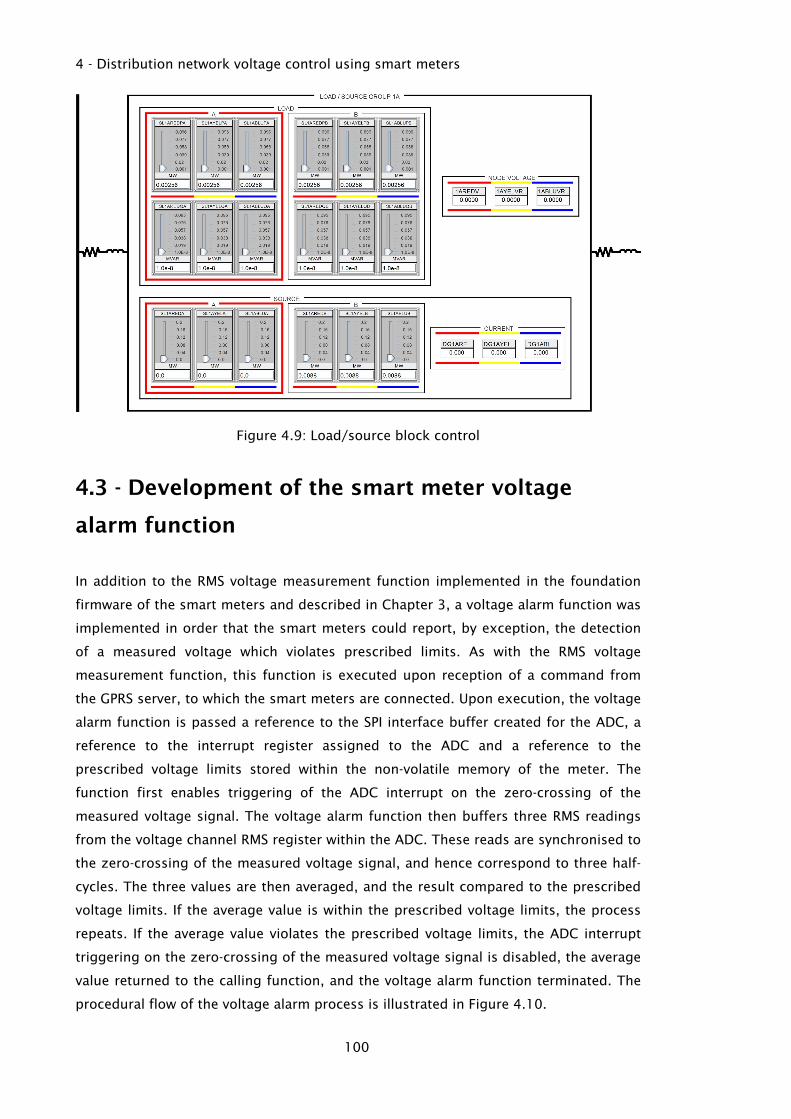
4 - Distribution network voltage control using smart meters
100
Figure 4.9: Load/source block control
4.3 - Development of the smart meter voltage
alarm function
In addition to the RMS voltage measurement function implemented in the foundation
firmware of the smart meters and described in Chapter 3, a voltage alarm function was
implemented in order that the smart meters could report, by exception, the detection
of a measured voltage which violates prescribed limits. As with the RMS voltage
measurement function, this function is executed upon reception of a command from
the GPRS server, to which the smart meters are connected. Upon execution, the voltage
alarm function is passed a reference to the SPI interface buffer created for the ADC, a
reference to the interrupt register assigned to the ADC and a reference to the
prescribed voltage limits stored within the non-volatile memory of the meter. The
function first enables triggering of the ADC interrupt on the zero-crossing of the
measured voltage signal. The voltage alarm function then buffers three RMS readings
from the voltage channel RMS register within the ADC. These reads are synchronised to
the zero-crossing of the measured voltage signal, and hence correspond to three half-
cycles. The three values are then averaged, and the result compared to the prescribed
voltage limits. If the average value is within the prescribed voltage limits, the process
repeats. If the average value violates the prescribed voltage limits, the ADC interrupt
triggering on the zero-crossing of the measured voltage signal is disabled, the average
value returned to the calling function, and the voltage alarm function terminated. The
procedural flow of the voltage alarm process is illustrated in Figure 4.10.

4 - Distribution network voltage control using smart meters
101
Figure 4.10: Voltage alarm procedural flow
4.4 - Development of the automatic voltage
controller
A voltage control process was implemented in Python to execute on the controller
hardware of the test rig, herein referred to as the AVC or Automatic Voltage Controller,
which fulfils the function of ‘controller’ within the test-rig, as described in Chapter 3.

4 - Distribution network voltage control using smart meters
102
This controller directs the operation of the smart meter test beds by means of the
GPRS server, receives measurement from the smart meter test beds, and issues
directives to the OLTC within the RTDS simulated power network model, via the SCADA
server. The core algorithm used to determine what voltage control behaviour, if any,
should be taken within this process is based on that proposed in [221] and [117]. As
such, in the event of a voltage or voltages outside of the prescribed limits being
detected, the algorithm first evaluates whether conflicting voltage issues exist. If this is
the case, it is anticipated that the use of the tap changer to restore the voltage at one
metered point to within the prescribed limit will increase the degree to which the
voltage at one or more of the other metered points violates the opposing limit, and
hence no further action is taken. If no conflicting voltage issues exist, the algorithm
verifies whether the tap changer is already at the highest position, in the case of an
under-voltage condition, or the lowest position, in the case of an over-voltage
condition, in which cases no further action is taken. The algorithm then estimates
whether a change in tap changer position would cause the voltage at other metered
points in the network, currently with the prescribed voltage limits, to violate those
limits. If this would be the case, then no remedial action is attempted. The estimated
voltage at a given point following a tap change is taken as the product of the current
voltage and the ratio of the prospective tap position to the current tap position. For
example, given a current voltage at a meted point of 230.00 V, a prospective tap
position of 95.0 % and a current tap position of 97.5 %, the resulting voltage would be
estimated as follows:
(4.13)
Finally, if it is estimated that a change in tap changer position would not cause the
voltage at other metered points in the network, currently within the prescribed voltage
limits, to violate those limits, then the algorithm will initiate a tap change.
Upon instantiation, the AVC process is passed an array of references to the handler
processes of all connected meters. It is also passed a reference to the socket allocated
to the connection with the OPC SCADA server, references to objects containing the
voltage limits, and the parameters and current position of the OLTC. If the algorithm
determines that a tap change should not take place, then the process returns a failure
and terminates. If the algorithm determines that a tap change should be executed then
a tap-change directive is issued to the OPC SCADA server, the process returns a
success and then terminates. The procedural flow of the AVC process is illustrated in
Figure 4.11 and Figure 4.12.

4 - Distribution network voltage control using smart meters
103
This page intentionally left blank

4 - Distribution network voltage control using smart meters
104
Figure 4.11: AVC process procedural flow (continued in Figure 4.12)

4 - Distribution network voltage control using smart meters
105
Figure 4.12: AVC process procedural flow (co
ntinued
from Figure 4.11)

4 - Distribution network voltage control using smart meters
106
In order to utilise the AVC process, the event scheduler, included in the foundation
firmware, issues a command to all connected meters to enable voltage exception
reporting by executing the voltage alarm function. Upon receiving an alert of a voltage
limit violation from one of the connected meters, the event scheduler sends a
command to all connected meters to disable voltage exception reporting, in order to
prevent multiple further notifications. The event scheduler then requests a read from
all connected meters in order to obtain a current snapshot of the voltages at all
monitored points in the LV distribution network. Once these read requests have been
fulfilled, the event scheduler instantiates the AVC process. Upon termination of the
AVC process, the event scheduler requests a read from all connected meters in order
to obtain a current snapshot of the voltages at all monitored points in the LV
distribution network following AVC execution. Finally, in order to address further
voltage limit violations, the event scheduler sends a command to all connected meters
to enable voltage exception reporting.
An example of the execution sequence of server processes in the case that two meters
are utilised is illustrated in Figure 4.13.

4 - Distribution network voltage control using smart meters
107
Figure 4.13: Example execution sequence of server processes
4 - Distribution network voltage control using smart meters
108
4.5 - Experimental setup
4.5.1 - Configuration of measuring equipment
An 8 channel Yokogawa DLM4038 mixed signal oscilloscope was used to acquire
synchronised measurements of both the voltage at the metered points within the
simulated network and the execution of the server processes. In addition to the voltage
signals taken directly from the metered points within the simulated network and
presented on analogue output (GTAO) channels of the RTDS, the RMS values of these
signals were also calculated within the RTDS simulation and presented on analogue
output channels of the RTDS. This enabled direct recording of the RMS voltage values
using the oscilloscope. In order to measure the timing of server events, a call was
added to the server software to toggle bit 0 of the parallel port interface of the GPRS
server machine on the following events:
A - Voltage limit violation alert received (followed by command sent to all connected
meters to disable voltage exception reporting).
B - Acknowledgment of reset received from all meters (followed by voltage read
command sent to all connected meters).
C - Voltage read received from all meters (followed by instantiation of AVC process and
execution of tap position change, as appropriate).
D - Termination of AVC process (followed by voltage read command sent to all
connected meters).
E - Voltage read received from all meters.
The parallel port pin assigned to bit 0 was connected to the oscilloscope via a pull-
down resistor. The arrangement of measurement connections is illustrated in Figure
4.14.

4 - Distribution network voltage control using smart meters
109
Figure 4.14: Connection of measurement equipment
4.5.2 - Telecommunications system
The GPRS connections between the smart meters and the GPRS server were made using
the Vodafone UK cellular telecommunications network. The base station used was
operating in the 1800 MHz band at Vodafone site reference 31823 and had a
maximum transmission power of 25.8 dBW. The base station antenna was mounted
approximately 41 m above ground level. The smart meters were located in the
basement of the East Building of the Department of Engineering at Cardiff University,
approximately 2 m below ground level. The antennas used on the smart meters were
vertically polarised, quad-band elements with a gain of +4 dBi. The average received
signal strength recorded by the GPRS receivers within the smart meters was -55 dBm.
The locations of the smart meters and the cellular base station are shown in Figure
4.15 [222], indicated in red and green, respectively.

4 - Distribution network voltage control using smart meters
110
Figure 4.15: Locations of smart meters and cellular base station [222]
Figure 4.16 [223] shows an aerial perspective view of the locations of the smart meters
and the cellular base station, indicated in red and green, respectively.

4 - Distribution network voltage control using smart meters
111
Figure 4.16: Aerial perspective view of smart meter and cellular base station locations
[223]
4.5.3 - Test parameters
The voltage limits within the smart meter firmware and server software were set to a
lower limit of 216.2 V and an upper limit of 253.0 V. These represent 230 V -6 % and
+10 % respectively, as per The Electricity Safety, Quality and Continuity Regulations
2002 [39]. All voltage signal values provided to the smart meters were taken between
phase and neutral in the simulated network. Each scenario was tested 50 times in
order that statistical analysis of the timing of server events, and time taken to restore
network voltages to within prescribed limits, could be performed. The experimental
time window for capture of the results presented was between 16:58 and 20:31.
4.6 - Test scenarios
4.6.1 - Scenario 1: High demand
Scenario 1 demonstrates the response of the voltage control system to demand from a
high penetration of electric vehicle charging. Case A represents a base load of
1.3 kW/customer, reflecting maximum nominal customer demand [57], distributed
uniformly across phases and across the extent of the simulated network. Case B
represents the addition of a 10 % penetration of 3.5 kW/customer electric vehicle

4 - Distribution network voltage control using smart meters
112
charging, reflecting the maximum typical domestic electric vehicle charging power
[82], distributed uniformly across phases and across the extent of the simulated
network. The loads at each of the grouped load/source blocks for cases A and B are
shown in Figure 4.17.
Figure 4.17: Scenario 1 load powers
Two smart meter test beds were utilised in this scenario. They were both assigned
connections to the red phase at the locations in the simulated network shown in Figure
4.18.
Figure 4.18: Scenario 1 meter locations
The voltages of all phases at each of the grouped load/source blocks in cases A and B
are shown in Figure 4.19. Since all elements in the modelled network are balanced, the
phase voltages are equal. Voltages which violate the prescribed limits are highlighted.

4 - Distribution network voltage control using smart meters
113
Figure 4.19: Scenario 1 network voltages
As a result of the additional loading added in case B, the voltage at grouped
load/source blocks 1B fell below the lower voltage limit. The predicted voltages at the
metered points as a result of an increase in tap changer position in response to the
under-voltage condition, estimated by the AVC process, are shown in Table 4.1.
Table 4.1: Scenario 1 measured and predicted voltages
Voltage (V)
METER NUMBER: METER LOCATION: CASE B: PREDICTED:
1 1A (RED PHASE) 223.69 229.58
2 1B (RED PHASE) 211.7 217.27
Since the predicted voltages indicated that the tap changer position could be increased
without causing further voltage limit violations, the AVC executed an increase in tap
changer position. The final resulting voltages are shown in Figure 4.19.
The profiles of the voltages at the metered points in scenario 1, with respect to time,
are shown in Figure 4.20. The voltage limit violation at grouped load/source block 1B,
following the transition from case A to case B, occurs at 0.00 s. In addition, the mean,
and lower and upper quartile times of server events A to E, as specified in Section
4.5.1, are shown.
The mean, and lower and upper quartile times to achieve restoration of the voltage at
all metered points to within the prescribed voltage limits are shown in Table 4.2.

4 - Distribution network voltage control using smart meters
114
Table 4.2: Scenario 1 restoration times
L.Q. x U.Q.
Restoration time (s): 2.74 2.89 3.06

4 - Distribution network voltage control using smart meters
115
Figure 4.20: Scen
ario 1 voltag
e profiles an
d server even
ts
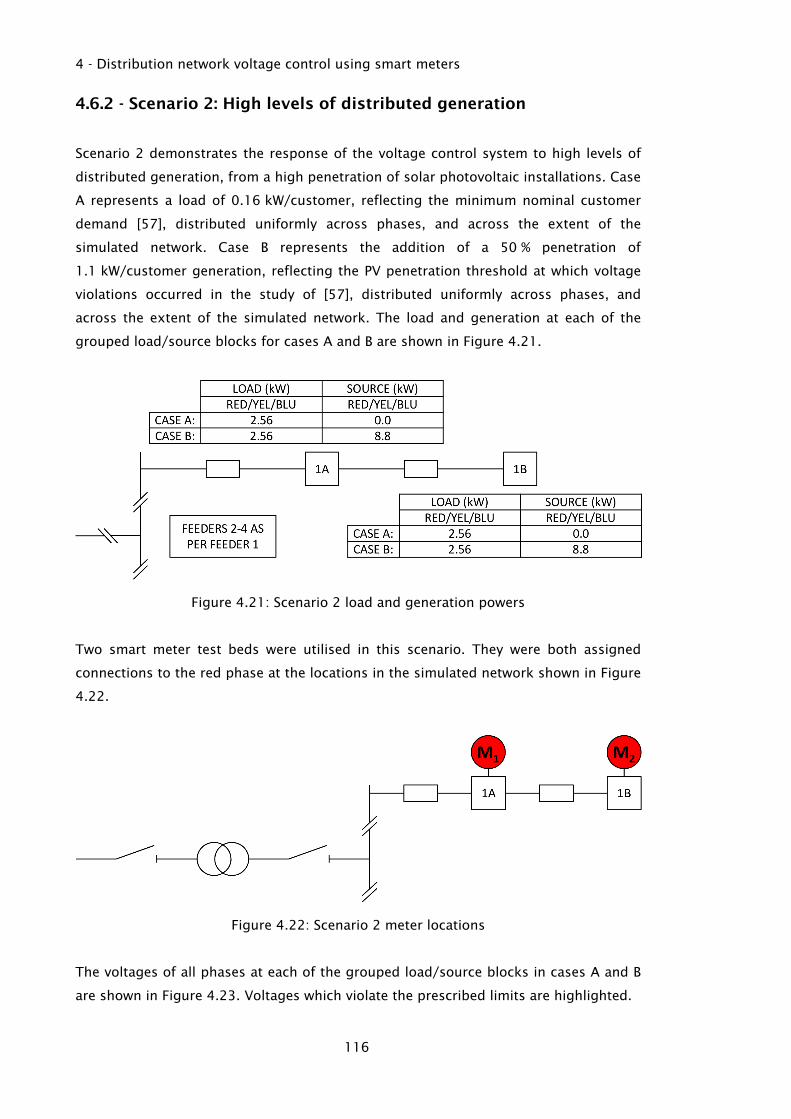
4 - Distribution network voltage control using smart meters
116
4.6.2 - Scenario 2: High levels of distributed generation
Scenario 2 demonstrates the response of the voltage control system to high levels of
distributed generation, from a high penetration of solar photovoltaic installations. Case
A represents a load of 0.16 kW/customer, reflecting the minimum nominal customer
demand [57], distributed uniformly across phases, and across the extent of the
simulated network. Case B represents the addition of a 50 % penetration of
1.1 kW/customer generation, reflecting the PV penetration threshold at which voltage
violations occurred in the study of [57], distributed uniformly across phases, and
across the extent of the simulated network. The load and generation at each of the
grouped load/source blocks for cases A and B are shown in Figure 4.21.
Figure 4.21: Scenario 2 load and generation powers
Two smart meter test beds were utilised in this scenario. They were both assigned
connections to the red phase at the locations in the simulated network shown in Figure
4.22.
Figure 4.22: Scenario 2 meter locations
The voltages of all phases at each of the grouped load/source blocks in cases A and B
are shown in Figure 4.23. Voltages which violate the prescribed limits are highlighted.

4 - Distribution network voltage control using smart meters
117
Figure 4.23: Scenario 2 network voltages
As a result of the additional generation added in case B, the red phase voltage at
grouped load/source blocks 1A and 1B exceeded the upper voltage limit. Despite
being balanced by design, a small imbalance exists between the phase voltages as a
result of the disparity between their fundamental relative phases and the discrete time-
step on which execution of the constituent elements of the source models used for
power injection practically takes place within the RTDS. The predicted voltages at the
metered points as a result of a decrease in tap changer position in response to the
over-voltage condition, estimated by the AVC process, are shown in Table 4.3.
Table 4.3: Scenario 2 measured and predicted voltages
Voltage (V)
METER NUMBER: METER LOCATION: CASE B: PREDICTED:
1 1A (RED PHASE) 253.57 247.07
2 1B (RED PHASE) 255.86 249.30
Since the predicted voltages indicated that the tap changer position could be
decreased without causing further voltage limit violations, the AVC executed a
decrease in tap changer position. The final resulting voltages are shown in Figure 4.23.
The profiles of the voltages at the metered points in scenario 2, with respect to time,
are shown in Figure 4.24. The voltage limit violations at grouped load/source blocks
1A and 1B, following the transition from case A to case B, occur at 0.00 s. In addition,
the mean, and lower and upper quartile times of server events A to E, as specified in
Section 4.5.1, are shown.
The mean, and lower and upper quartile times to achieve restoration of the voltage at
all metered points to within the prescribed voltage limits are shown in Table 4.4.

4 - Distribution network voltage control using smart meters
118
Table 4.4: Scenario 2 restoration times
L.Q. x U.Q.
Restoration time (s): 2.01 2.20 2.27

4 - Distribution network voltage control using smart meters
119
Figure 4.24: Scen
ario 2 voltag
e profiles an
d server even
ts

4 - Distribution network voltage control using smart meters
120
4.6.3 - Scenario 3: Heavy, imbalanced loading
Scenario 3 demonstrates the response of the voltage control system to heavy loading
from a high penetration of electric vehicle charging which is not distributed evenly
across phases. This is based on Scenario 1. Case A represents a load of
1.3 kW/customer, distributed uniformly across phases, and across the extent of the
simulated network. Case B represents the addition of a 5 % penetration of
3.5 kW/customer electric vehicle charging, distributed across the red, yellow and blue
phases with a ratio of 2:2:1, within all load/source blocks. The loads at each of the
grouped load/source blocks for cases A and B are shown in Figure 4.25.
Figure 4.25: Scenario 3 load and generation powers
Three smart meter test beds were utilised in this scenario. They were assigned
connections to the red, yellow and blue phases, respectively, at the location in the
simulated network shown in Figure 4.26.
Figure 4.26: Scenario 3 meter locations
The voltages of all phases at each of the grouped load/source blocks in cases A and B
are shown in Figure 4.27. Voltages which violate the prescribed limits are highlighted.

4 - Distribution network voltage control using smart meters
121
Figure 4.27: Scenario 3 network voltages
As a result of the additional loading added in case B, the voltages of the red and yellow
phases at grouped load/source block 1B fell below the lower voltage limit. The
predicted voltages at the metered points as a result of an increase in tap changer
position in response to the under-voltage condition, estimated by the AVC process, are
shown in Table 4.5.
Table 4.5: Scenario 3 measured and predicted voltages
Voltage (V)
METER NUMBER: METER LOCATION: CASE B: PREDICTED:
1 1B (RED PHASE) 214.18 219.82
2 1B (YEL PHASE) 213.88 219.51
3 1B (BLU PHASE) 218.99 224.75
Since the predicted voltages indicated that the tap changer position could be increased
without causing further voltage limit violations, the AVC executed an increase in tap
changer position. The final resulting voltages are shown in Figure 4.27.
The voltage imbalance caused by the additional imbalanced loading may be expressed
as a percentage figure approximated by the phase voltage unbalance rate, presented in
equation (2.7). The voltage imbalances at locations 1A and 1B as a result of the
additional imbalanced loading are as follows:
Location 1A:
(4.14)

4 - Distribution network voltage control using smart meters
122
Location 1B: (4.15)
The voltage imbalances at locations 1A and 1B following the tap change operation
directed by the AVC are as follows:
Location 1A:
(4.16)
Location 1B: (4.17)
The increase in tap changer position resulted in a reduction in the degree of voltage
imbalance, in addition to restoring all voltages to within limits, and the final imbalance
is within the limits of EN 50160 [59] and the short-term limit of Engineering
Recommendation P29 [71]. However, the final imbalance still slightly exceeds the 1.3 %
long-term limit of Engineering Recommendation P29.
The profiles of the voltages at the metered points in scenario 3, with respect to time
are shown in Figure 4.28. The voltage limit violation at grouped load/source block 1B
following the transition from case A to case B, occurs at 0.00 s. In addition, the mean,
and lower and upper quartile times of server events A to E, as specified in Section
4.5.1, are shown.
The mean, and lower and upper quartile times to achieve restoration of the voltage at
all metered points to within the prescribed voltage limits are shown in Table 4.6.
Table 4.6: Scenario 3 restoration times
L.Q. x U.Q.
Restoration time (s): 2.75 2.90 3.10

4 - Distribution network voltage control using smart meters
123
Figure 4.28: Scen
ario 3 voltag
e profiles an
d server even
ts
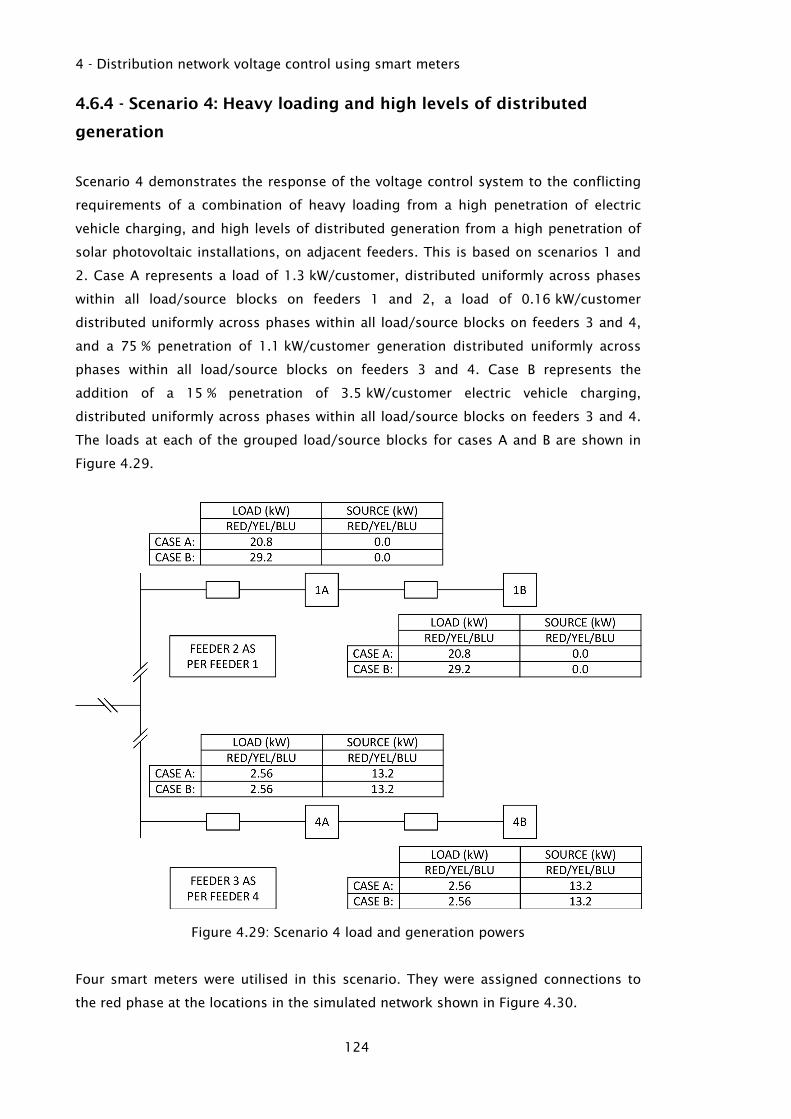
4 - Distribution network voltage control using smart meters
124
4.6.4 - Scenario 4: Heavy loading and high levels of distributed
generation
Scenario 4 demonstrates the response of the voltage control system to the conflicting
requirements of a combination of heavy loading from a high penetration of electric
vehicle charging, and high levels of distributed generation from a high penetration of
solar photovoltaic installations, on adjacent feeders. This is based on scenarios 1 and
2. Case A represents a load of 1.3 kW/customer, distributed uniformly across phases
within all load/source blocks on feeders 1 and 2, a load of 0.16 kW/customer
distributed uniformly across phases within all load/source blocks on feeders 3 and 4,
and a 75 % penetration of 1.1 kW/customer generation distributed uniformly across
phases within all load/source blocks on feeders 3 and 4. Case B represents the
addition of a 15 % penetration of 3.5 kW/customer electric vehicle charging,
distributed uniformly across phases within all load/source blocks on feeders 3 and 4.
The loads at each of the grouped load/source blocks for cases A and B are shown in
Figure 4.29.
Figure 4.29: Scenario 4 load and generation powers
Four smart meters were utilised in this scenario. They were assigned connections to
the red phase at the locations in the simulated network shown in Figure 4.30.

4 - Distribution network voltage control using smart meters
125
Figure 4.30: Scenario 4 meter locations
The voltages of all phases at each of the grouped load/source blocks in cases A and B
are shown in Figure 4.31. Voltages which violate the prescribed limits are highlighted.
Figure 4.31: Scenario 4 network voltages
As a result of the additional loading added to feeders 1 and 2 in case B, the voltages at
grouped load/source block 1B fell below the lower voltage limit. Despite being
balanced by design, a small imbalance exists between the phase voltages as a result of

4 - Distribution network voltage control using smart meters
126
the disparity between their fundamental relative phases and the discrete time-step on
which execution of the constituent elements of the source models used for power
injection practically takes place within the RTDS. The predicted voltages at the metered
points as a result of an increase in tap changer position in response to the under-
voltage condition, estimated by the AVC process, are shown in Table 4.7.
Table 4.7: Scenario 4 measured and predicted voltages
Voltage (V)
METER NUMBER: METER LOCATION: CASE B: PREDICTED:
1 1A (RED PHASE) 227.45 233.44
2 1B (RED PHASE) 214.35 219.99
3 4A (RED PHASE) 244.90 251.34
4 4B (RED PHASE) 249.00 255.55
Since the predicted voltages indicated that an increase in the tap changer position
would result in further voltage limit violations, the AVC did not execute any change to
tap changer position.
The profiles of the voltages at the metered points in scenario 1, with respect to time,
are shown in Figure 4.32. The voltage limit violation at grouped load/source block 1B,
following the transition from case A to case B, occurs at 0.00 s. In addition, the mean,
and lower and upper quartile times of server events A to C, as specified in Section
4.5.1, are shown.

4 - Distribution network voltage control using smart meters
127
Figure 4.32: Scen
ario 4 voltag
e profiles an
d server even
ts

4 - Distribution network voltage control using smart meters
128
4.7 - Discussion
Previous work incorporating real-world smart meter measurements has been subject to
the limitations of data available from existing smart meters. For example, the
European FP7 project IDE4L [58] demonstrated the effectiveness of distributed LV
network monitoring by smart meters as a means of detecting the voltage rise at the
customer connection point resulting from real power injection by a local PV
installation. However, the measurements from these meters were only available with an
update rate of one minute, and the data acquired was not used to inform network
control. This work extends such schemes by implementing closed-loop control based
on the smart meter measurements acquired. By development of a custom smart meter
test bed platform, it has been possible to immediately acquire measurement data from
the smart meters used, and to implement the custom voltage alarm function whereby
the meters report voltage limit violations by exception in order that immediate control
decisions are made. Similarly, in the LoVIA field trial [119], the one-minute average
measurements received by the control algorithm were a constraint of the hardware
used, with the further limitation that it was not possible to take these measurement
directly at the customers point of common coupling (PCC). This work has addressed
these limitations by demonstrating that real-time monitoring by smart meters at critical
points in a distribution network, and connected via end-to-end communication links
with a substation controller, may be effectively used to inform control of an OLTC in
order to rapidly address voltage limit violations. This work further addresses the
limitations of hardware-in-the-loop investigations such as [117], by demonstrating that
a control system may be applied to a LV network incorporating an OLTC within an
RTDS simulation, enhanced by the additional insight of the effect of real-world non-
deterministic communications channels.
The maximum and minimum base demand figures used in the distribution network
simulation used in this study are based on Electricity Association (EA) figures for after-
diversity maximum demand (ADMD) and minimum demand of UK residential
customers (0.16 kVA and 1.3 kVA respectively) [57]. These are the current figures used
to estimate domestic demand for the purpose of planning. The nominal electrical
vehicle charging load of 3.5 kVA per customer is based on the typical maximum single-
phase domestic charging point rating of 16 A [82], with a 10 % penetration reflective of
plug-in electric vehicles as a current proportion of UK car registrations [11]. The 50 %
penetration of 1.1 kVA PV generation sources reflects the 40–50 % PV penetration
thresholds at which voltage violations occurred in the study of [57], the generic LV
network presented in which forms the basis for the simplified network simulated in
this work. This is supported by the findings of [58], in which the high PV penetration

4 - Distribution network voltage control using smart meters
129
area exhibited PV generation of up to approximately 40 % of peak demand, without
exhibiting voltage issues caused by power injection.
The aggregated load and source blocks employed within the simulated distribution
network in this study are both a useful simplification of the system being examined,
and a necessary compromise to accommodate the finite computational capacity of the
RTDS unit. Though it is possible that such aggregated block might conceal localised
behaviour in a real network, for example local reverse power flow and consequent
voltage limit violations, which would otherwise go undetected, they are sufficient to
represent the feeders examined in this study, with smart meter measurements taken at
the nodes of these blocks, and passive cable sections between. The study might be
extended to examine the application of the control system developed to a real-world
distribution network, or section thereof. In this case, it would likely be necessary either
to increase to which an aggregated representation is used in some areas of the
network in order to add detail to other areas, or to augment the computational
capacity of the RTDS unit.
The experimental results presented in this chapter were acquired in a time window of
approximately 3.5 hours. Network latency, typically evaluated by round-trip time (RTT)
impacts both throughput and response time in TCP/IP communications. Factors which
strongly contribute to temporal variability in GPRS RTT include mobility (handover from
one network cell to another), voice call pre-emption (priority allocation of data time-
slots to voice traffic), self-congestion (delay caused by a GPRS terminal device
sustaining multiple concurrent TCP connections), network congestion (high levels of
traffic from other GPRS terminal devices) and radio conditions (for example RF
interference, necessitating data retransmission) [224]. Of these, the factors of mobility,
voice call pre-emption and self-congestion are not applicable to smart meters, and the
factor of radio conditions is assumed to have no strong correlation with time-of-day or
day-of-week in the UHF band, for a given location. Network traffic and congestion is
strongly linked to time-of-day, though weekend variations in network load do not
significantly affect latency [225]. However, only a weak correlation exists between RTT
distribution and network traffic load, as illustrated by the empirical Complementary
Cumulative Distribution Function (CCDF) of RTT for GPRS in four 6 h period, shown in
Figure 4.33 [226]. As such, experimental results taken within a time window of less
than 24-hours are presented as representative of continuous operation at the test site.

4 - Distribution network voltage control using smart meters
130
Figure 4.33: Empirical CCDF of RTT for GPRS in four different 6h periods [226]
The control system implemented in this work does not incorporate a mechanism for
limiting the frequency of tap-change operations, nor for considering multiple
prospective tap-change operations in making control decisions. Whilst the issue of a
high frequency of tap-change operations is largely negated by the assumption that a
deployed implementation of a system such as this would incorporate OLTCs with
electronic commutation [95]–[100], the work presented might be extended by the
inclusion of a means to limit tap-change frequency. Furthermore, the control algorithm
might be augmented as described in [118], in order to anticipate the requirement for
multiple tap change operations. Rather than assessing the effect of each tap-change
operation in isolation, this would allow the algorithm to predict the effect of multiple
successive tap changes and either perform these as a block operation, avoiding the
communications and processing delay associated with multiple independent
operations, or to elect not to perform any operation if the algorithm deemed that such
an action would create a voltage limit violation issue elsewhere in the network.
The issue of voltage limit violation as a result of heavy, imbalanced loading was shown
to be resolved by the action of the control system in this work. However, whilst the
degree of voltage imbalance was reduced as an additional effect of this action, the use
of a conventional coupled OLTC, in which tap changes are applied to all phases
simultaneously, limits the scope for resolution of phase imbalance by means of the
OLTC alone. The control algorithm implemented might be extended to permit control

4 - Distribution network voltage control using smart meters
131
of a decoupled OLTC, as presented in [101] and [102], capable of changing the tap
position of each phase independently.
Whilst, in this study, it was shown that three of the four voltage violation issue
scenarios demonstrated were adequately resolved by means of OLTC control alone, the
control algorithm implemented might be extended to resolve local voltage violations
which the controller was not able to resolve without causing further issues, for
example in scenario 4. In [139], the use of local battery energy storage, in conjunction
with a smart meter and OLTC, was demonstrated to be effective as a means of local
voltage regulation in a simulated network. The study of [139] did not consider multiple
concurrent voltage violation issues in a network, nor distributed voltage measurements
by multiple smart meters, as have been examined in this work. However, the system
presented in this chapter might be extended by the inclusion of energy storage as a
further means of voltage control in this way, with the algorithm adapted to optimise
the multiple objectives of voltage regulation, loss minimisation and longevity of the
energy storage medium. This would increase the scope for the system presented to
address local voltage issues in the context of the complete distribution network.
Similarly, though the low X/R ratio of LV network may limit the scope for voltage
regulation by means of reactive power control [123], simple local reactive control
schemes have been shown to be of value in mitigating the voltage rise effect of LV-
connected PV inverters [124], [125]. The system presented in this chapter might be
further extended to address local voltage issues in the presence of high penetrations
of PV generation by augmenting such local control schemes with an element of
centralised control, in order to optimise the voltage conditions across the network
collectively, whilst considering the real-world limitations of communications between
distributed devices.
4.8 - Conclusion
Implementation of real-time voltage control within an LV network using the smart
meter test rig has been demonstrated. By means of a voltage alarm firmware
component, added to the smart meter firmware system, and a voltage control process,
added to the server software, voltages at metered points in the simulated distribution
network which violate preset limits are detected, and an evaluation process initiated to
determine if remedial action should be taken. In the case that it is determined that
remedial action should be taken, by means of a change OLTC position, this is
automatically executed. The average period between the voltage at a metered point
violating preset limits, and the voltages at all metered points being restored to within
prescribed values, in the cases that action was deemed appropriate, was 2.66 s. In the

4 - Distribution network voltage control using smart meters
132
case that the voltage controller implemented determined that a change in tap changer
position could not be performed, or would result in further voltage limit violations, it
was demonstrated that no remedial action was attempted.

133
5 - Smart meter and AMI security
5.1 - Introduction
Analysis of the cyber security vulnerabilities of a commercially deployed smart
electricity meter, and of the connection of that meter to the head-end infrastructure of
the meter operator, is described. Two attack methodologies are presented, informed
by this analysis, and demonstrated to permit unauthorised electronic access to the
meter. Finally, recommendations are made of measures to mitigate the vulnerabilities
identified and exploited.
The meter and infrastructure examined are the property of a smart meter installer and
operator in the UK. This research was conducted on behalf of the meter operating
company, and is presented herein on the condition of anonymity. Therefore, details
which might identify the operating company or meter have been redacted, where
necessary. The meter evaluated is the default choice for single-phase, domestic
installations by the operating company, and typical of single-phase, domestic meters
being deployed within the UK, at the time of writing. It is compliant with the first
version of the UK Smart Metering Equipment Technical Specifications (SMETS 1) [219],
published by the former Department of Energy & Climate Change.
Subsequent sections are structured as follows:
• Section 5.2 examines the technical information regarding the meter under
examination available in the public domain, and the hardware elements of the device
which represent vulnerabilities and hence the basis of potential attack vectors. It
also describes preliminary testing of the local, optical interface of the meter, and the
selection of attack methodologies.
• Section 5.3 describes the toolkit developed to permit the exfiltration of data in
transit between the metrological and computational core of the meter and the
attached wide area network modem, and to communicate with the local, optical
interface of the meter.
• Section 5.4 Describes the processing and analysis of data captured using this tool
kit, in order to expose vulnerabilities, and to extract security credentials and
configuration information contained within it. It also describes the exploitation of a

5 - Smart meter and AMI security
134
vulnerability whereby extracted security credentials were used to demonstrate
unauthorised access to the meter by means of the local, optical port.
• Section 5.5 provides an analysis of the implications of the vulnerabilities exposed
and attacks demonstrated.
• Section 5.6 provides recommendations of revisions to the hardware and firmware of
the meter, and to the protocols used for communication with the head-end of the
meter operator, which may mitigate the vulnerabilities identified. These
recommendations are made with reference to existing and established security
protocols.
• Section 5.7 summarises the research undertaken.
5.2 - Vulnerability analysis
5.2.1 - Prior information
An Internet search for freely available literature was undertaken using the Google
search engine, in order to determine what technical documentation regarding the
meter under examination was in the public domain. Documents produced by the
manufacturer, but distributed by third parties, were found describing:
• Hardware: This included mechanical dimensions and mounting details of the meter,
images showing the form and location of a tamper detection micro-switch designed
to detect removal of the terminal cover, a description of the RS-232 and power
interface to connect a GSM/GPRS WAN modem, and specification of the optical port
as being FLAG (IEC 62056-21) and ANSI Type 2 (ANSI C12.18) compliant. It also
included a description of the hardware user interface buttons and display.
• Firmware: This included a list of the registers within the meter used for
measurement, configuration and control, access to the bootloader, and direct access
to the non-volatile memory of the meter. It also included the protocol and command
structure for register read and write access via the modem interface and the optical
port.
• Software: This included usage information for the proprietary management software,
produced by the meter manufacturer for use by meter operators.

5 - Smart meter and AMI security
135
5.2.2 - Analysis of hardware
The physical architecture of the meter under test can be considered in two, distinct
sections, as illustrated in Figure 5.1. The first of these sections is a sealed enclosure
containing the metrological and computational core of the device. This enclosure is not
designed to be accessed during the normal course of installation, configuration or use.
The external interfaces for human interaction provided by the sealed section of the
meter are two momentary push button switches, two visible indicator LEDs, and an
LCD display. These interfaces, as described in the manufacturer’s documentation,
permit the local observation of:
• Metrology readings, such as accumulated energy, and instantaneous power.
• The current status of the attached WAN modem, if present, the optical interface, the
internal clock of the meter, and alarms warning of errors such as failure of the
internal battery.
• The serial number and Meter Point Administration Number (MPAN)
The sealed section of the meter also includes an optical communication port which the
manufacturer specifies as compliant to the FLAG (IEC 62056-21) [227] and ANSI Type 2
(ANSI C12.18) [228] protocols. This port, as described in the meter manufacturer’s
documentation, permits a command line session to be established with the meter.
The second, serviceable section of the meter is intended to be accessed for the
purposes of installation and maintenance. Brass receptacles for the termination of
meter tails and an ANSI/TIA-1096-A 8P8C modular jack, for the connection of a WAN
modem, emerge from the sealed section of the meter into this serviceable section. The
WAN modem installed is manufactured by a third party. Documentation free available
on the Internet from the manufacturer of this device specifies that the communications
interface provided on the 8P8C jack is RS-232 compliant. The WAN modem also derives
power from the meter through this connector, and hence is active only when the meter
is energised. The serviceable enclosure of the meter is contained by a moulded plastic
cover which is designed to be readily removable in the course of installation and
maintenance operations. It is secured with a single screw, protected by a tamper
evident tag, and carries a moulded protrusion which, when the cover is installed,
activates a micro-switch. Removal of the cover results in the release of the micro-switch
and, as such, is used as a means of detecting unauthorised physical access. The
response of the meter in the case of this tamper detection device being triggered is
specified in the manufacturer’s documentation as being to log the event, but not to

5 - Smart meter and AMI security
136
take further action, for example supply disconnection, by default. The design of the
cover of the serviceable enclosure is also such that the tamper detection mechanism
may be readily, mechanically defeated, for example by use of a shim to maintain
pressure on the micro-switch when the cover is removed. The tamper evident seal may
also be replaced with readily available crimping tools and seal components, leaving
little physical evidence for forensic examination.
By exploitation of the mechanical vulnerabilities described above, an attacker may
access the link between the metrological and computational core of the meter and the
WAN modem. In addition, an attacker has unrestricted access to the optical port. These
attack vectors, along with an outline of the physical architecture of the meter, are
illustrated in Figure 5.1.
Figure 5.1: Meter and attack vectors
5.2.3 - Testing of optical interface
In order to establish whether the optical port of the meter is enabled and, this being
the case, establish the parameters of the communications protocol, communication
was attempted with the optical port at each of the range of different data rates stated
as supported by the manufacturer. At each data rate, a null message with the framing
characters <STX> and <ETX> (<0x02> and <0x03>) but without any frame content, as
defined by the manufacturer’s documentation, was transmitted to the optical port. At

5 - Smart meter and AMI security
137
the configured data rate, this should generate an acknowledgment of the form
<STX><ACK><ETX> (<0x02><0x06><0x03>).
The hardware used for this test was an x86-64 laptop computer running the 64-bit
edition of Debian GNU/Linux and a USB terminated optical read head. This contains a
USB to UART bridge and an infrared receiver/transmitter pair for bidirectional
communication with the optical interface of a meter.
Upon connection to the laptop computer, the USB to UART bridge within the read head
is recognised as a serial device, and serial device reference to it is created in the /dev
directory of the operating system. The device file was configured using the stty
command. The command string used is shown below.
stty 300 cs8 -cstopb -parenb -F /dev/ttyUSB0
In this command, 300 specifies a rate of 300 b/s, cs8 specifies 8 data bits, -cstopb
specifies 1 stop bit, -parenb specifies no parity check and the -F argument specifies
the serial device to be configured. Using this initial configuration, data was redirected
from the input data file, containing the raw hexadecimal message string, to the USB
interface of the optical head using the echo utility. The Linux cat utility was used to
monitor for a response from the serial device.
It was found that at a data rate of 9600 b/s, an acknowledgment of the expected form
was received.
5.2.4 - Choice of attack methodologies
Informed by the vulnerability analysis, the following attack strategies were chosen for
analysis:
• Eavesdropping of bi-directional data from the RS-232 link between the meter and the
WAN modem, in order to extract security credentials and information which might
be used to impersonate either the meter or the head-end of the meter operating
company.
• Establishment of a command line session with the optical port of the meter, using
extracted security credentials, in a manner which permits unauthorised access to the
internal system of the meter.

5 - Smart meter and AMI security
138
5.3 - Attack toolkit
5.3.1 - Architecture
The attack toolkit consists of hardware and software components which permit the
exfiltration of data transferred between the meter and the WAN modem, and
communication with the optical port of the meter. The logical architecture of the attack
toolkit is illustrated in Figure 5.2.
Figure 5.2: Attack toolkit architecture
5.3.2 - Hardware
For the purpose of eavesdropping on data exchanged between the meter and WAN
modem, a dual RS-232/USB bridge was used. This supports two bidirectional RS-232
interfaces and, hence, the input channel of each of the interfaces was used to capture
data on both the transmit and receive lines of the RS-232 connection under
examination. A USB terminated optical interface head was used for communication
with the optical port of the meter. The serial devices of both the RS-232/USB bridge
and the optical read head were configured with a baud rate of 9600, 8 data bits, no
parity check and one stop bit. The attack toolkit hardware is illustrated in Figure 5.3.
The tamper evident seal of the serviceable enclosure cover was cut in order to permit
access, and the tamper detection micro-switch allowed to trigger upon removal of the
cover. The link cable between the WAN modem and the meter was removed and
replaced by the attack toolkit hardware.

5 - Smart meter and AMI security
139
Figure 5.3: Attack toolkit hardware
5.3.3 - Base operating system and software
The workstation used was an x86-64 laptop computer running the 64-bit edition of
Debian GNU/Linux. The Linux kernel of this distribution natively supported the
integrated USB/serial bridge devices used in the dual RS-232/USB bridge, and the
optical FLAG head. In this way, each of the RS-232 data channels and the optical
interface appeared as serial devices in /dev of the workstation’s filesystem.
5.4 - Attack procedure
5.4.1 - Attack 1
The meter and modem were energised from a fully de-energised state, and allowed to
run for a period of ten minutes. During this time, the data exchanged between the
meter and modem was captured by establishing pipes within the Linux operating
system of the workstation to redirect data from the each of the two serial devices,
capturing data flowing from the modem to the meter, and vice versa, to files. During
the energised period, a connection was established between the meter and the head-
end server of the meter operating company, herein referred to as the ‘operator’,
indicated by the front panel interface of the meter.

5 - Smart meter and AMI security
140
The Linux hexdump utility was used to view the binary, captured data in order that it
could be analysed. The utility represents each byte in the input as a two-digit,
hexadecimal number.
Immediately after energisation, commands from the Hayes AT Command Set, in a
human-readable format, were used by the meter to initialise the modem, as per the
meter manufacturer’s documentation. Two commands used by the meter to configure
the modem with parameters specific to this application were as follows:
AT+CGDCONT=1,”IP”,”## -- REDACTED -- ##”
ATD*99***1#
The first, AT+CGDCONT, is used to define a packet datagram protocol (PDP) context.
This is a data structure which is used to specify configuration information about a
GPRS session before it is initiated. In this case, the command defined the PDP variant
to be used as IPv4, and the access point to connect to as the URL of the meter
operator. The second, ATD, is used to initiate a GRPS session, in this case of type IP,
and using PDP context 1, defined previously. Following the successful establishment of
a GPRS session, data exchanged between the meter and operator passes transparently
through the modem until the escape sequence +++ is transmitted by the meter,
causing the modem to return to accepting Hayes AT commands from the meter.
From the manufacturer’s documentation, it was known that the point-to-point protocol
(PPP), a variant of high-level data link control (HDLC), was being used to encapsulate
the data being exchanged between the meter and the operator. The Linux hexdump
utility was used to view this binary data in order that it could be analysed. The utility
represents each byte in the input as a two-digit, hexadecimal number. An example of
the raw data, in this case the first PPP frame captured following transmission by the
meter operator, and demarcated by 0x7e bytes, is shown in Figure 5.4.
Figure 5.4: Raw PPP frame in hexadecimal
A script was written in Python to remove the escape sequences employed by PPP.
These appear as the byte 0x7d, followed by the result of a bitwise XOR operation on
the original byte and 0x20. The original byte is recovered by repeating the XOR
operation on the escaped byte and 0x20. The raw frame presented in Figure 5.4 is
shown with the escape sequences removed in Figure 5.5.

5 - Smart meter and AMI security
141
Figure 5.5: PPP frame with escape sequences removed
Since PPP is a variant of HDLC for communications between exactly two peers, and
does not use frame numbering, the address and control fields are redundant and may
be disregarded. For the purposes of further analysis, these fields, and the flag bytes
indicating the start and end of a frame, are omitted.
The first exchange of data between the operator and meter following the
establishment of a GPRS connection was a negotiation of the parameters for further
PPP communication. This was performed by means of the link control protocol (LCP),
contained within PPP packets, as shown in Figure 5.6. The operator first transmitted a
configuration request to the meter specifying a maximum frame size of 1500 bytes,
the use of no escape characters, the use of protocol and address/control field
compression, and the use of the password authentication protocol (PAP). The response
of the meter was a rejection of this configuration, specifying the maximum frame size
option as the reason for rejection. The operator then repeated the original request with
the maximum frame size option omitted. This was accepted by the meter with an
Acknowledge response. The meter subsequently transmitted a configuration request to
the operator specifying the use of protocol and address/control field compression, and
the escaping of <XON> and <XOFF> characters for the purpose of software flow control.
This was accepted by the operator with an Acknowledge response.
Following configuration of the PPP connection, the password authentication protocol
was used to authenticate the meter to the operator. This is shown in Figure 5.7. The
protocol requires the username and password credentials to be transmitted in plain
text. In this instance, the name of the meter operator was used as both the username
and password. The authentication was successful, with the operator returning an
Acknowledge response and the message ‘Welcome!’.

5 - Smart meter and AMI security
142
Figure 5.6: LCP negotiation

5 - Smart meter and AMI security
143
Figure 5.7: PAP authentication and IPCP configuration (continued in Figure 5.8)

5 - Smart meter and AMI security
144
Figure 5.8: IPCP configuration (continued from Figure 5.7)
Following successful authentication, the internet protocol control protocol (IPCP) was
used to negotiate the assignment of IP addresses to both the operator and meter in
order that IP communications could be used for further data exchange. This is shown
in Figure 5.7. The operator first transmitted a request to the meter to use the IP
address 192.168.111.111, which was accepted by the meter with an Acknowledge
response. The meter then requested the assignment of an address by the operator.
This was done by requesting the invalid IP address 0.0.0.0, which caused the operator
to respond with a Negative Acknowledge, and a suggested IP address of 10.6.93.123
for the meter. The meter then issued another request, this time using the suggested
address. This was accepted by the operator with an Acknowledge response, as shown
in Figure 5.8. Following configuration of the IP parameters using IPCP, data was
exchanged between the operator and meter using encapsulated within UDP packets,
which are in turn encapsulated by PPP. An example of the encapsulation, in this case
the first UDP packet captured following transmission by the meter operator, is shown
in Figure 5.9.
Figure 5.9: UDP frame
The UDP header information includes the source address, which may not be the
originating device as a result of network address translation (NAT), the destination
address, and the source and destination ports. For the purposes of further analysis,
the UDP header information is omitted.
A proprietary protocol for connecting to the meter for the purpose of command line
communication is described by the meter manufacturer. The first attempt by the
operator to logon to the meter in this manner is shown in Figure 5.10.

5 - Smart meter and AMI security
145
Figure 5.10: Logon attempts to meter by the operator

5 - Smart meter and AMI security
146
As defined by the manufacturer’s command line protocol, command line exchanges
are grouped by means of a sequence number between 0 and 15 conveyed by the
second four bits of the sequence number byte, of which the first four bits are always
‘1’. Secure logon to the meter comprises the transmission of a ‘K’ character, or the
byte 0x4b, followed by an eight-byte encrypted password, and finally the username in
plain text. In the first transmission by the operator in Figure 5.10, the username is
seen to be ‘ADMIN’. However, the logon attempt was unsuccessful, with the meter
returning a time and serial number, as per the manufacturer’s specification. The last
four bytes of the returned string are equal to the serial number of the meter,
211 070 059, expressed as a 32-bit unsigned integer in little endian format. The
preceding four bytes are the current time and date, in the same binary format,
expressed as the number of seconds since the start of the year 1996. In this first case,
the time retuned is equal to 515 501 423 in denary, or a date and time of 10:50:25 on
2nd May 2012. It is noted that the subsequent two logon attempts made by the operator
to the meter were also unsuccessful, with the time field of the meter responses
incrementing by one after each attempt. The fourth attempt by the operator to logon
to the meter was successful, with the response of the meter an Acknowledge byte.
Although the encryption scheme used by the manufacturer to protect the password is
not described in the documentation found, it was inferred that it uses the time as an
element in the encryption. The implication of this is that a given password will be valid
only during the second in which it is generated. On this basis, multiple attempts may
be required before synchronisation of the times used by both meter and operator to
generate the password with sufficient accuracy is achieved, and the latency of the
complete transmission path between the two peers is sufficiently low for the password
to still be valid on arrival.
Following the successful logon attempt, the operator requested the values of two
registers, which were returned by the meter, as shown in Figure 5.11. Subsequent
exchanges were not analysed until the operator requested a logoff from the meter with
the transmission of an ‘X’ character, to which the meter responded with an
Acknowledge byte.

5 - Smart meter and AMI security
147
Figure 5.11: Logon and data access of meter by the operator

5 - Smart meter and AMI security
148
As a result of the eavesdropping of communication between the meter and modem,
and meter and meter operator, the following information was extracted:
• GPRS configuration including operator access point name.
• LCP configuration.
• PAP username and password.
• IPCP configuration, including IP addresses and ports used.
• Username for command line logon to the meter.
• Nature of encrypted password as time-dependent.
5.4.2 - Attack 2
In Section 5.2.3, the optical port of the meter was found to be enabled for command
line communications, and is specified in the manufacturer’s documentation as
supporting the same command line instruction set as is used for communication with
the meter operator, via the WAN modem. Therefore, it was hypothesised that a replay
attack could be effected against the meter, whereby an encrypted password used by
the operator to login to the meter via the WAN modem might be used again to log in to
the meter through the optical interface. In this way, decryption of the password would
not be necessary for the attack. Furthermore, the username was already known due to
being transmitted in plain text. Since the password was determined to be time-
dependent, and subject to change every second, manual analysis of the data stream to
extract the password was not possible whilst retaining the required ‘freshness’ of the
password. Accordingly, a Python script was written to extract the password from a
captured secure logon attempt to the meter by the operator. The Python script first
removes the escape sequences employed by PPP from each raw frame, an example of
which is shown in Figure 5.12, and recovers the original bytes.
Figure 5.12: Raw PPP frame
The script then strips away the encapsulation of PPP and the successive protocol layers
within: IPv4 and UDP, as shown in Figure 5.13.

5 - Smart meter and AMI security
149
Figure 5.13: Escaped PPP frame
The command line string contained within the frame is then analysed. In the case of
this example, the string was found to contain a secure logon attempt. The credentials
from this are shown in Figure 5.14.
Figure 5.14: Credentials from data field of UDP packet
The framing required for communication with the optical interface of the meter is then
added to the secure logon string consisting of a ‘K’ character, or the byte 0x4b,
followed by the encrypted password and username. The <STX> flag is appended to the
start of the string, and a null termination character to the end. Next, the XMODEM
variant of the CRC16-CCITT XMODEM checksum of the frame is calculated, and
appended to the end of the frame. Finally, the <ETX> frame terminating flag is
appended to the end of the frame, as shown in Figure 5.15.
Figure 5.15: Constructed frame for optical port
The meter and modem were energised from a fully de-energised state. During the
energised period, the meter and the head-end server of the metering provider
established a connection, indicated by the front panel interface of the meter. Upon
reception of the secure logon attempt by the meter from the operator, the Python
script successfully parsed the frame, extracted the credentials, formed a frame of the
type required for communication with the optical port, and transmitted it to this port
via the optical head of the attack toolkit. The meter returned an Acknowledge byte via
the optical port, indicating that the connection attempt was successful.

5 - Smart meter and AMI security
150
5.5 - Attack results analysis
5.5.1 - Introduction
The results of the attacks described in Section 5.4 are considered in the context of the
CIA triad model of information security, as defined in ISO/IEC 27002:2013 [229],
namely:
• Confidentiality: Ensuring that information is accessible only to those authorised to
have access.
• Integrity: Safeguarding the accuracy and completeness of information and
processing methods.
• Availability: Ensuring that authorised users have access to information and
associated assets when required.
These tenets are widely employed in the field of information security, and are
considered a simple test of security performance, whereby if any of the three are not
fulfilled then the security of the system under test may be considered compromised.
5.5.2 - Attack 1
The data exchanged between the meter and the WAN modem comprises both the
readings acquired by the meter in the course of monitoring a customer’s supply, and
the operational data exchanged for purposes including mutual authentication,
configuration, and management of the meter by the meter operator. Since the attack
required physical proximity to the meter, it would likely not be effected without the
complicity of the customer. Accordingly, the exfiltration of user data, such as energy
consumption in a given time period, by means of the attack, is not a primary
confidentiality concern. Rather, the issue of confidentiality in this case concerns the
operational data exchanged between the meter and the WAN modem, in particular the
configuration data and authentication credentials. The data used at all stages of the
configuration of the WAN modem by the meter, and the connection and authentication
to the operator by the meter, via the modem, was exchanged in plain text. As such all
the information which would be required to impersonate the meter from the
perspective of the operator, at the stages of authentication and configuration
examined, was obtained. Such an attack would permit energy consumption to be
inaccurately reported, or falsely attributed, for the purpose of energy theft. In the case

5 - Smart meter and AMI security
151
that measurements from smart meters are used to inform distribution network control
decisions, such impersonation would also permit false data injection, which may lead
to necessary network control action not being taken, or unnecessary control action
being taken. Furthermore, an agent impersonating a meter would be able to establish
a connection to the operator through which an attack on the operator’s systems might
be effected.
Since the RS-232 link between the meter and WAN modem was eavesdropped rather
than redirected, neither the integrity nor the availability of the data conveyed across it
were compromised. However, since the data exfiltrated was sufficient to fully
impersonate the meter at the stages of authentication and configuration examined, a
further attack whereby the meter was impersonated would negate any assurance of
data integrity or availability.
5.5.3 - Attack 2
As in the case of Attack 1, in which the confidentiality of data exchanged between the
meter and the WAN modem was compromised, an authenticated terminal connection
to the meter permits access to the registers within the device used to store customer
energy consumption information. However, as in the case of Attack 1, this attack is
unlikely to be effected without the complicity of the consumer. Rather, in addition to
directly modifying the records of energy consumption for the purpose of inaccurately
reporting, or falsely attributing energy consumption, access to the internal registers of
the meter might allow a malicious agent to falsify readings by modifying the variables
on which the calculated demand depends. For example, modification of the stored
value of a current transformer ratio might allow a reduction in metered current, and
hence billed consumption, to be effected. Whilst, under such circumstances,
compromise of the availability of data to the meter operator does not yield an
immediate benefit, compromise of the integrity of data supplied to the operator for the
purpose of billing constitutes a clear motive for an attack.
More critically, the attack exposes data specific to the meter operator, which is stored
in the meter, to compromise. This might include encryption keys or authentication
credentials used for access to, and control of, the meter by the operator, and may
expose multiple meters to attack if common keys or authentication credentials are
used. Compromise of multiple meters in this way would negate any assurance of data
integrity or availability, and constitutes a critical vulnerability in the case that
measurements from smart meters are used to inform distribution network control

5 - Smart meter and AMI security
152
decisions, or if such meters incorporate a remote supply disconnection facility, with
the associated threat of malicious denial of energy
5.6 - Recommendations
The attacks described in Section 5.4 required some physical intrusion into the
enclosure of the meter, albeit only into the serviceable, terminal section. This included
breaking the tamper evident seal, although this is easily restored. It would be
necessary to circumvent the tamper detection micro-switch, if it was required that no
evidence of the attack was to be recorded by the meter. The attacks also required
disconnection of the lead connecting the WAN modem, contained within the
serviceable section, to the meter, in order that the attack hardware could be connected
in its place. No mechanism exists in the meter examined to detect such infiltration.
However, the addition of presence detection signal lines on the interface would
significantly inhibit such an attack by detecting if the electrical link between WAN
modem and meter was lost. Indeed, presence detection signals are included in the UK
Data Communications Company Intimate Communications Hub Interface Specification
[230], for the purpose of mutual detection of the presence of a smart electricity meter
and communications hub, responsible for WAN communications.
Of the data exfiltrated in the eavesdropping attack described in Section 5.4.1, the
security credentials exchanged as plain text using the password authentication
protocol (PAP) are the most significant. The use of the meter operating company’s own
name as both username and password for the process is poor security practice.
Furthermore, the credentials could be protected by employing the, alternative,
challenge handshake authentication protocol (CHAP). Under this protocol, the peer
wishing to perform authentication, in this case the meter operator, transmits a
randomly generated ‘challenge’ string to the peer to be authenticated, in this case the
meter. The peer to be authenticated combines the ‘challenge’ string with a pre-shared
secret using a one-way hashing function, such as the secure hash algorithm (SHA), and
returns the result to the authenticating peer. The authenticating peer compares the
returned result with its own calculation of the hashing function and, if they match,
acknowledges the authentication. Since each result is valid only for one authentication
attempt, the process is immune to replay attacks. The challenge authentication
protocol provides further security by periodically reissuing the authentication challenge
in order that the link is maintained. The protocol is, however, still vulnerable to man-
in-the-middle attacks.
5 - Smart meter and AMI security
153
The replay attack described in Section 5.4.2 could be prevented by prohibiting a secure
connection from being established on one interface using the same credentials
previously used on another interface, or by preventing a secure connection from being
established on one interface within one second of one being established on another.
This would ensure that an encrypted password captured during the establishment of a
secure connection on one interface would have expired before a secure connection
could be established on another interface, and hence could not be reused.
In addition to security compromises made with the level of physical access to the
meter assumed for the attacks demonstrated in Section 5.4, known vulnerabilities of
second-generation (2G) cellular technology security, such as the demonstrated
weakness of the A5/1 stream cipher, evidence the value of effective end-to-end
security between meters of this type and meter operators. Such security should include
both reliable authentication and encryption. A solution which would enable the existing
command line protocol employed between the meter and operator to be used,
following establishment of a secure link, is mutually authenticated transport layer
security (TLS). Under such a scheme, both the meter and operator possess certificates
which enable them to prove their identity during the establishment of a secure link.
The validity of the certificates is verified by means of a trusted, third party certificate
authority. In practice, the third-party certificate authority may be used to verify the
identity of a server which is a local peer of that which the operator wishes to be linked
to a given meter. In this way, the third-party certificate authority generates an
intermediate certificate which is used to verify the identity of the local peer, and this
local server then acts the certificate authority for the purpose of establishing a secure
link. An illustration of the establishment process for a TLS link is shown in Figure 5.16.
Upon receipt of a request from a meter to establish a TLS connection, the meter
operator presents its digital certificate, along with the public key of an asymmetric key
pair, generated for the session, to the meter. The meter verifies the validity of the
operator’s certificate and, finding it to be valid, presents its own digital certificate to
the operator, along with a secret, symmetric encryption key, generated for the session,
and encrypted with the public key supplied by the operator. The operator verifies the
validity of the meter’s certificate and, finding it to be valid, decrypts the secret,
symmetric key supplied by the meter, using the private key of the asymmetric key pair
which it generated earlier in the link establishment process.

5 - Smart meter and AMI security
154
Figure 5.16: TLS link establishment process
The current UK Smart Metering Equipment Technical Specifications (Version 1.58) [34]
specifies that smart electricity meters should be capable of supporting the following
cryptographic algorithms:
• Elliptic Curve DSA
• Elliptic Curve DH
• SHA-256
Furthermore, the document specifies that the electricity meter ‘shall be capable of
generating Public-Private Key Pairs to support the Cryptographic Algorithms’ and ‘shall
be capable of securely storing Security Credentials from Certificates including for use
in the Cryptographic Algorithms’. A meter conforming to the current UK Smart
Metering Equipment Technical Specifications would, therefore, be capable of
supporting the security recommendations made in this section.

5 - Smart meter and AMI security
155
5.7 - Conclusion
A smart electricity meter widely deployed in the UK as part of the smart meter roll-out
programme has been analysed for potential vulnerabilities, and two attack
methodologies chosen. Hardware and software tools have been developed in order to
effect these attacks, and the results analysed in order to determine the degree to
which the security of the smart meter has been compromised, and the potential
consequences of this compromise.
The first of these attacks demonstrated the acquisition of all the information required
to impersonate the meter from the perspective of the operator. With this information,
it would be possible to pose as a different customer in order to falsely attribute energy
consumption, or to inaccurately report energy consumption, for the purpose of energy
theft. If measurements from the meters of this operator were used to inform network
control decisions, impersonation of this or other meters would allow false data to be
injected, disrupting network control and potentially resulting in denial of energy if this
disruption led to a loss of supply. Furthermore, the ability to establish a connection
with the head-end system of the operator, posing as a trusted entity, exposes the
operator’s systems to the threat of further penetration and compromise.
The second of these attacks demonstrated local logon to the meter, posing as the
operator, using intercepted and processed credentials. Connection in this way exposes
data stored within the meter which is not intended to be accessed or modified by those
other than the meter operator. In addition to the modification of the latest energy
consumption data, for the purpose of inaccurate reporting and energy theft, it might
also permit permanent modification of firmware registers used to derive consumption
figures, in order to inaccurately report energy consumption in the future. A critical
further concern is the exposure of encryption keys or authentication credentials which,
if common to other meters of this operator, may allow access to those devices, posing
as the operator. In this way, a widespread denial-of-energy attack may be effected in
which supply disconnection of a large number of meters, by means of their remote
disconnection facility, is directed by a malicious agent. It might also be possible to
effect the widespread disruption of supply, by cyclically operating the remote
disconnection device of a large number of meters in order to generate rapidly
fluctuating load conditions on the distribution network.
Finally, recommendations have been made as to how the security of such a meter
might be improved, including by the employment of established protocols which would

5 - Smart meter and AMI security
156
satisfy both the requirement for robust and secure mutual authentication of a smart
meter and operator, and for encrypted communication between them.

157
6 - Conclusions and further work
6.1 - Conclusions
The research objectives presented in Section 1.2.1 have been fulfilled. Conclusions of
the research conducted on the subjects of distribution network control, and smart
meter and AMI security, as well as further research contributions and pertinent, future
research avenues, are presented in the following sections.
6.1.1 - Distribution network control
Climate change and the unsustainable consumption of fossil fuels have seen a global
policy shift towards low-carbon technologies. However, the adoption of high levels of
renewable generation represents a significant change in the requirements for power
distribution. In contrast to the historical approach of centralised generation,
distributed renewable generation, in particular, necessitates considerably more
advanced distribution network control. This is exacerbated by the additional demands
of other low-carbon technologies, for example electrified transport. Smart metering on
low voltage networks offers the facility for monitoring the very periphery of the
distribution network. This visibility supports an advanced level of control, which in turn
increases the penetration of renewable generation which may be accommodated.
In this work, a low voltage distribution network hosting a high penetration of solar PV
generation, and electric vehicle charging, was considered. The distribution transformer
supplying the network was equipped with an OLTC. This network was simulated on an
RTDS, with the facility to provide real-time measurements of the voltage at critical
points within the network as analogue output signals, and to receive SCADA
commands to control the OLTC as input signals. A hardware smart meter test bed
platform was developed, capable of acquiring electrical measurements and
communicating these over a WAN in real-time. Four of these devices were used to
monitor critical points in the simulated distribution network, by means of the analogue
output signals of the RTDS. The hardware and software infrastructure required for WAN
communication with multiple smart meters, and for SCADA communication, was also
implemented.
A controller was developed to direct the operation of the OLTC, via SCADA, informed
by measurements from the smart meters. This was based on a simple voting

6 - Conclusions and further work
158
algorithm, under which action was taken in response to a voltage measurement taken
by one or more of the smart meters which violated preset limits, if doing so was not
expected to cause a new voltage limit violation elsewhere in the network, or to
exacerbate one which already existed. The operation of the controller was
demonstrated in scenarios of high solar PV generation, high EV charging demand,
imbalance resulting from uneven distribution of generation and demand across
phases, and conflicting generation and demand conditions in adjacent feeders. In the
cases of high generation, high demand, and imbalance, the controller was shown to
respond to voltage limit violations by directing OLTC operation in order to rapidly
restore the voltage at all monitored points to within limits, and without causing further
voltage limit violations. In the case of the conflicting generation and demand
conditions, the controller was shown to determine that any OLTC operation would
result in further voltage limit violations, and so no further action was taken.
Existing work has shown that conventional AVC schemes may be effective in the
presence of a limited penetration of DG power injection and EV charging demand.
However, control in the presence of a high penetration of DG and EV charging requires
visibility of LV networks beyond the secondary substation. Such visibility is made
possible with the deployment of smart meters, but the response speed and flexibility
of commercial meters for network monitoring, as a role secondary to their primary
function of energy consumption reporting, has limited their use in published schemes.
With the development of custom smart meter test beds, as part of a wider closed-loop
smart meter test rig, this work has addressed this limitation. The rig further addresses
the issue of placement of voltage monitoring in real-world trials, by permitting the
smart meters to be deployed on a real-time distribution network simulation, in the
locations most useful for a particular scenario. The evaluation of the automatic voltage
controller developed in this work, accounting for the real-world communications and
processing delays inherent in a real-world system, is therefore a valuable contribution
to understanding in the field. The necessary simplification of the simulated distribution
network and limited number of meters have been recognised as potential limitations of
the system demonstrated. However, the fidelity of the power system simulated, and
the number of smart meter test beds, have been sufficient for the purposes of the
study undertaken.
With the widespread deployment of AMI, and the evolution of OLTC-equipped
distribution transformers, including those employing solid-state commutation or power
electronic conversion, the test rig and voltage controller developed in this work
represents valuable tools in the development of distribution network control to
accommodate high penetrations of low-carbon technologies.

6 - Conclusions and further work
159
6.1.2 - Smart meter and AMI security
The adoption of AMI inevitably incurs cyber security vulnerabilities which did not exist
in the case of meters with no facility for remote communication. The magnitude of the
threat which these constitute is significantly increased by the inclusion of a remote
supply disconnection facility within smart meters. Although authoritative guidance is
available on the issue of AMI security, this is not necessarily heeded by manufacturers.
Approval schemes, such as the National Cyber Security Centre’s (NCSC) CPA scheme,
seek to address this. However, vulnerabilities have been demonstrated in existing AMI
deployments, and the communication technologies typically used in them.
In this work, a cyber security vulnerability of a commercially deployed smart meter was
examined. A hardware tool was constructed to permit the capture of data exchanged
between the processor of the smart meter, and the modem used for WAN
communication. The smart meter was configured in a standard form for domestic and
light commercial metering, and data was captured in the course of communication
between the smart meter and the head-end of the meter operator for the principal
purpose of energy consumption recording.
The data captured was analysed, and the frames of common communication protocols
were extracted. It was established that a weak system for authentication of the smart
meter to the head-end of the operator was employed. As such, the authentication
credentials were extracted. Data made publicly available by the manufacturer of the
smart meter on the Internet provided information on the format of the credentials used
for authentication of the head-end operator to the smart meter, as well as
authentication in the case of communication with the local, optical port of the smart
meter.
By intercepting data including credentials during the connection and authentication
phases between the smart meter and the head-end of the operator, all the information
required to impersonate a smart meter from the perspective of the meter operator was
acquired. This would permit energy theft by impersonation of another meter, and the
false reporting or attribution of consumption data. It might also permit disruption of
network control by false data injection, or more extensive penetration of the head-end
system of the operator by posing as a trusted entity.
A software tool was developed which extracted the credentials used for authentication
of the head-end operator to the smart meter, conveyed over the WAN interface,
reformatted these credentials according to the protocol used for communication with

6 - Conclusions and further work
160
the local, optical port of the smart meter, and issued them to this interface by means
of an optical probe. It was demonstrated that, by means of this technique, local access
was gained to the internal system of the smart meter, using the credentials of the
meter operating company. This access exposes the possibility for the compromise of
registers within the meter used in the process of consumption recording and
reporting, for the purpose of energy theft, or encryption keys and authentication
credentials which facilitate access to other smart meters and wider smart metering
infrastructure.
Recommendations have been made in order to address the vulnerabilities of a specific
smart meter exposed in this work, addressing weaknesses in both the firmware and
protocols employed by the device. However, the attacks described serve to
demonstrate not only vulnerabilities within a specific AMI deployment, but also
highlight the importance of applying the rigorous security practices employed in
existing, security-critical infrastructure, such as that for smart payment cards, in AMI
schemes.
6.1.3 - Further achievements of research
A demonstration rig illustrating smart meter control in response to real-time electricity
pricing for the purpose of DSM, and based on four of the smart meter test beds, was
presented to HRH The Princess Royal, and the former president of the Royal Academy
of Engineering, Sir John Parker FREng, at the 2012 ‘Engineering a better society’ event
of the Royal Academy of Engineering. The smart meter test beds and test rig used in
this research were also presented to both UK and international academic partners, and
to industrial parties, including manufacturers and DNOs.
A period of secondment was taken with a commercial smart meter operator in the UK
during the course of this research. At the time of this appointment, the operator was
both installing smart meters and providing the head-end infrastructure to manage
them. In addition to providing consultancy on cyber security provision, penetration
testing of the infrastructure supplied by the operator was conducted. This formed the
basis for Chapter 5 of this work. A report on cyber security considerations for smart
meter design, including responses to the first iteration of DECC's UK Smart Metering
Equipment Technical Specifications, was produced for DECC's Security Technical
Experts working group.

6 - Conclusions and further work
161
6.2 - Further work
Pertinent, future research avenues, further to this work, are presented in the following
sections.
6.2.1 - Distribution network control
Mechanisms to effect voltage control may be examined to augment, or supplant
control solely by means of an OLTC. Such mechanisms include DSM providing the
facility for the control of demand, generation curtailment, reactive power flow control
by PV inverters, and energy storage.
Realistic time-series profiles may be applied to generation sources and loads in order
to investigate the requirements for the frequency of control operations, as well as their
response time in order to provide satisfactory voltage regulation. This might include
changes to the granularity of power system simulation, with scope for both greater
aggregation and more detailed representation in different areas of the simulated
network as required.
The implications for communication capacity and performance, particularly in the case
of a high penetration of smart metering, may be examined. In particular, optimisation
of the facility for network monitoring against the requirements of communications
performance and cost may be considered, with the rig permitting assessment of the
communications impact of congestion arising from a greater number of concurrent
smart meter connections.
Further, ancillary functions of smart metering, for example phase identification and
outage management, including fault location, may be investigated.
6.2.2 - Smart meter and AMI security
The scope for the application of established security practice from related, security-
critical infrastructure, such as that for smart payment cards, to AMI schemes, may be
examined. This pertains to hardware, firmware and software design, and to
communication protocols.

6 - Conclusions and further work
162
The use of dedicated cryptographic hardware in smart meters, and the scope for
adoption of design practices and techniques employed in such hardware, for example
for the purpose of tamper detection and prevention, may be investigated.
Analysis of the degree to which smart meters and smart metering infrastructure
constitute an element of critical national infrastructure might be conducted. This is
particularly critical if smart meters are equipped with a remote supply disconnection
facility.

163
References
[1] U.S. Energy Information Administration (EIA), “International Energy Outlook
2019,” 2019. [Online]. Available:
https://www.eia.gov/outlooks/ieo/pdf/ieo2019.pdf.
[2] European Commission, “Energy roadmap 2050,” 2012. [Online]. Available:
https://ec.europa.eu/energy/sites/ener/files/documents/2012_energy_roadmap
_2050_en_0.pdf.
[3] “Directive 2009/28/EC of the European Parliament and of the Council of 23 April
2009 on the promotion of the use of energy from renewable sources and
amending and subsequently repealing Directives 2001/77/EC and 2003/30/EC,”
Off. J. Eur. Union, 2009.
[4] Department of Energy & Climate Change, “National Renewable Energy Action
Plan for the United Kingdom,” 2010. [Online]. Available:
https://assets.publishing.service.gov.uk/government/uploads/system/uploads/
attachment_data/file/47871/25-nat-ren-energy-action-plan.pdf.
[5] Department for Business Energy & Industrial Strategy, “UK Energy Statistics,
2019 & Q4 2019,” 2020. [Online]. Available:
https://assets.publishing.service.gov.uk/government/uploads/system/uploads/
attachment_data/file/877047/Press_Notice_March_2020.pdf.
[6] Department for Business Energy & Industrial Strategy, “Energy Trends March
2020,” 2020. [Online]. Available:
https://assets.publishing.service.gov.uk/government/uploads/system/uploads/
attachment_data/file/875381/Energy_Trends_March_2020.pdf.
[7] Department for Business Energy & Industrial Strategy, “Solar photovoltaics
deployment,” 2020. [Online]. Available:
https://www.gov.uk/government/statistics/solar-photovoltaics-deployment.
[Accessed: 13-Jun-2020].
[8] Energy Act 2008. 2008.
[9] International Energy Agency, “Global EV Outlook 2020,” 2020.
[10] Department for Transport, “Licensed cars by propulsion or fuel type: Great
Britain and United Kingdom,” 2020.
[11] Society of Motor Manufacturers and Traders, “SMMT UK new car and LCV
registrations outlook to 2021–January 2020,” 2020.
[12] Tesla, “Supercharger,” 2018. [Online]. Available:
https://www.tesla.com/en_GB/supercharger. [Accessed: 01-Jun-2020].
[13] J. Ekanayake, N. Jenkins, K. Liyanage, J. Wu, and A. Yokoyama, Smart Grid:

References
164
Technology and Applications. John Wiley & Sons, 2012.
[14] Institution of Engineering and Technology, “What is a Smart Grid?,” 2013.
[Online]. Available: https://www.theiet.org/factfiles/energy/smart-grids-
page.cfm.
[15] CLP Power Hong Kong, “Smart Grid,” 2016. [Online]. Available:
https://www.clp.com.hk/en/about-clp/power-transmission-and-
distribution/smart-grid. [Accessed: 28-May-2018].
[16] American Recovery and Reinvestment Act of 2009. 2009.
[17] International Energy Agency, “Technology Roadmap Smart Grids,” 2011.
[Online]. Available:
https://www.iea.org/publications/freepublications/publication/smartgrids_road
map.pdf.
[18] European Commission, “Smart grid projects outlook 2017,” 2017. [Online].
Available:
http://publications.jrc.ec.europa.eu/repository/bitstream/JRC106796/sgp_outlo
ok_2017-online.pdf.
[19] Pöyry, “An Independent Evaluation of the LCNF,” 2016. [Online]. Available:
http://www.poyry.co.uk/sites/www.poyry.co.uk/files/media/related_material/ev
aluation_of_the_lcnf_0.pdf.
[20] H. Farhangi, “The path of the smart grid,” IEEE Power Energy Mag., vol. 8, no. 1,
pp. 18–28, Jan. 2010.
[21] Edison Electric Institute, “Smart Meters and Smart Meter Systems: A Metering
Industry Perspective,” 2011. [Online]. Available: https://aeic.org/wp-
content/uploads/2013/07/smartmetersfinal032511.pdf.
[22] V. C. Gungor, D. Sahin, T. Kocak, S. Ergut, C. Buccella, C. Cecati, and G. P.
Hancke, “A Survey on Smart Grid Potential Applications and Communication
Requirements,” IEEE Trans. Ind. Informatics, vol. 9, no. 1, pp. 28–42, Feb. 2013.
[23] Navigant Research, “Market Data: Smart Meters,” 2016. [Online]. Available:
https://www.navigantresearch.com/research/market-data-smart-meters.
[24] “Directive 2009/72/EC of the European Parliament and of the Council of 13 July
2009 concerning common rules for the internal market in electricity and
repealing Directive 2003/54/EC,” Off. J. Eur. Union, 2009.
[25] Department for Business Energy & Industrial Strategy, “Smart Meter Statistics in
Great Britain: Quarterly Report to end December 2019,” 2020. [Online].
Available:
https://assets.publishing.service.gov.uk/government/uploads/system/uploads/
attachment_data/file/872155/2019_Q4_Smart_Meters_Statistics_Report.pdf.
[26] A. Hansen, J. Staggs, and S. Shenoi, “Security analysis of an advanced metering
infrastructure,” Int. J. Crit. Infrastruct. Prot., vol. 18, pp. 3–19, 2017.

References
165
[27] C. J. Foreman and D. Gurugubelli, “Identifying the Cyber Attack Surface of the
Advanced Metering Infrastructure,” Electr. J., vol. 28, no. 1, pp. 94–103, Jan.
2015.
[28] R. Anderson and S. Fuloria, “Who Controls the off Switch?,” in 2010 First IEEE
International Conference on Smart Grid Communications, 2010, pp. 96–101.
[29] National Institute of Standards and Technology, “Guidelines for Smart Grid
Cybersecurity,” 2014. [Online]. Available:
https://nvlpubs.nist.gov/nistpubs/ir/2014/NIST.IR.7628r1.pdf.
[30] National Institute of Standards and Technology, “Security Requirements for
Cryptographic Modules (FIPS PUB 140-2),” 2006. [Online]. Available:
https://nvlpubs.nist.gov/nistpubs/FIPS/NIST.FIPS.200.pdf.
[31] “2012/148/EU: Commission Recommendation of 9 March 2012 on preparations
for the roll-out of smart metering systems,” Off. J. Eur. Union, 2012.
[32] European Commission, “Smart Grids Task Force,” 2009. [Online]. Available:
https://ec.europa.eu/energy/en/topics/markets-and-consumers/smart-grids-
and-meters/smart-grids-task-force.
[33] European Network and Information Security Agency, “Proposal for a list of
security measures for smart grids,” 2013. [Online]. Available:
https://ec.europa.eu/energy/sites/ener/files/documents/20140409_enisa.pdf.
[34] Department of Energy and Climate Change, “Smart Metering Equipment
Technical Specifications Version 1.58,” 2014. [Online]. Available:
https://assets.publishing.service.gov.uk/government/uploads/system/uploads/
attachment_data/file/381535/SMIP_E2E_SMETS2.pdf.
[35] Communications-Electronics Security Group, “CPA Security Characteristic
Electricity Smart Metering Equipment Version 1.2,” 2016. [Online]. Available:
https://www.ncsc.gov.uk/content/files/protected_files/document_files/SMLT-
SC-0002 ESME v1-2.pdf.
[36] N. Lawson, “Reverse-engineering a smart meter,” rdist, 2010. [Online]. Available:
https://rdist.root.org/2010/02/15/reverse-engineering-a-smart-meter.
[Accessed: 16-May-2018].
[37] K. Jackson Higgins, “Smart Meter Hack Shuts Off The Lights,” DARKReading,
2014. [Online]. Available: https://www.darkreading.com/perimeter/smart-meter-
hack-shuts-off-the-lights/d/d-id/1316242.
[38] A. Garcia Illera and J. Vazquez Vidal, “Lights Off! The Darkness of the Smart
Meters,” Black Hat Europe 2014, 2014. [Online]. Available:
https://www.youtube.com/watch?v=Z_y_vjYtAWM.
[39] The Electricity Safety, Quality and Continuity Regulations 2002. 2002.
[40] E. Lakervi and E. J. Holmes, Electricity Distribution Network Design. Institution of
Engineering and Technology, 2003.

References
166
[41] T. Haggis, “Network Design Manual,” E.ON Central Networks, no. December. pp.
1–194, 2006.
[42] F. A. Viawan, A. Sannino, and J. Daalder, “Voltage control with on-load tap
changers in medium voltage feeders in presence of distributed generation,”
Electr. Power Syst. Res., vol. 77, no. 10, pp. 1314–1322, 2007.
[43] Y. Liu, J. Bebic, B. Kroposki, J. De Bedout, and W. Ren, “Distribution system
voltage performance analysis for high-penetration PV,” in 2008 IEEE Energy 2030
Conference, ENERGY 2008, 2008.
[44] E. J. Coster, J. M. a Myrzik, B. Kruimer, and W. L. Kling, “Integration Issues of
Distributed Generation in Distribution Grids,” Proc. IEEE, vol. 99, no. 1, pp. 28–
39, 2011.
[45] P. Trichakis, P. Taylor, P. F. Lyons, and R. Hair, “Predicting the technical impacts
of high levels of small-scale embedded generators on low-voltage networks,” IET
Renew. Power Gener., vol. 2, no. 4, pp. 249–262, 2008.
[46] N. Jenkins, J. B. Ekanayake, and G. Strbac, Distributed generation. The Institution
of Engineering and Technology, 2010.
[47] T. Ackermann and V. Knyazkin, “Interaction between distributed generation and
the distribution network: operation aspects,” IEEE/PES Transm. Distrib. Conf.
Exhib., vol. 2, no. 40, pp. 12–15, 2002.
[48] M. Thomson and D. G. Infield, “Impact of widespread photovoltaics generation
on distribution systems,” IET Renew. Power Gener., vol. 1, no. 1, p. 33, 2007.
[49] M. Mcgranaghan, T. Ortmeyer, D. Crudele, T. Key, J. Smith, and P. Barker,
“Renewable Systems Interconnection Study: Advanced Grid Planning and
Operations,” 2008. [Online]. Available:
https://www1.eere.energy.gov/solar/pdfs/advanced_grid_planning_operations.p
df.
[50] E. Demirok, D. Sera, R. Teodorescu, P. Rodriguez, and U. Borup, “Clustered PV
inverters in LV networks: An overview of impacts and comparison of voltage
control strategies,” in 2009 IEEE Electrical Power and Energy Conference, EPEC
2009, 2009.
[51] T. Stetz, F. Marten, and M. Braun, “Improved low voltage grid-integration of
photovoltaic systems in Germany,” IEEE Trans. Sustain. Energy, vol. 4, no. 2, pp.
534–542, 2013.
[52] S. Conti, S. Raiti, and G. Tina, “Small-scale embedded generation effect on
voltage profile: an analytical method,” IEE Proc. - Gener. Transm. Distrib., vol.
150, no. 1, p. 78, 2003.
[53] S. Conti, S. Raiti, G. Tina, and U. Vagliasindi, “Distributed Generation in LV
distribution networks: Voltage and thermal constraints,” in 2003 IEEE Bologna
PowerTech - Conference Proceedings, 2003, vol. 2, pp. 413–418.

References
167
[54] Energy Network Association, “Engineering Recommendation G83 Issue 2,” vol. 2,
no. 2, 2012.
[55] International Electrotechnical Commission, “IEC 61727:2004 Photovoltaic (PV)
systems — characteristics of the utility interface.” 2004.
[56] R. A. Shayani and M. A. G. De Oliveira, “Photovoltaic generation penetration
limits in radial distribution systems,” IEEE Trans. Power Syst., vol. 26, no. 3, pp.
1625–1631, 2011.
[57] S. Ingram, S. Probert, and K. Jackson, “The impact of small scale embedded
generation on the operating parameters of distribution networks,” 2003.
[Online]. Available:
http://webarchive.nationalarchives.gov.uk/20100919182407/http://www.ensg.
gov.uk/assets/22_01_2004_phase1b_report_v10b_web_site_final.pdf.
[58] A. Barbato, A. Dedè, D. Della Giustina, G. Massa, A. Angioni, G. Lipari, F. Ponci,
and S. Repo, “Lessons learnt from real-time monitoring of the low voltage
distribution network,” Sustain. Energy, Grids Networks, Jun. 2017.
[59] British Standards Institution, “BS EN 50160:2010+A1:2015 Voltage
characteristics of electricity supplied by public electricity networks.” 2010.
[60] Electricity North West Ltd, “Low Voltage Network Solutions Closedown Report,”
2014. [Online]. Available:
https://www.ofgem.gov.uk/system/files/docs/2017/04/lvns_closedown_report.
pdf.
[61] A. Navarro-Espinosa, D. Randles, and L. F. Ochoa, “Deliverable 3.6 ‘What-if
Scenario Impact Studies based on real LV networks,’” 2014. [Online]. Available:
https://www.enwl.co.uk/globalassets/innovation/lvns/lvns-closedown/uom-
appendices/university-of-manchester-appendix-i-lvns.pdf.
[62] Department of Energy and Climate Change, “Weekly Solar PV Installation and
Capacity based on Registration Date,” 2012. [Online]. Available:
https://www.gov.uk/government/statistical-data-sets/weekly-solar-pv-
installation-and-capacity-based-on-registration-date.
[63] Mott McDonald, “System Integration Of Additional Micro-generation (SIAM),”
2004. [Online]. Available:
http://webarchive.nationalarchives.gov.uk/+/http://www.dti.gov.uk/renewables
/publications/pdfs/dgcg00028rep.pdf.
[64] P. Trichakis, P. C. Taylor, L. M. Cipcigan, P. F. Lyons, R. Hair, and T. Ma, “An
Investigation of Voltage Unbalance in Low Voltage Distribution Networks with
High Levels of SSEG,” in Universities Power Engineering Conference, 2006. UPEC
’06. Proceedings of the 41st International, 2006, vol. 1, pp. 182–186.
[65] F. Shahnia, R. Majumder, A. Ghosh, G. Ledwich, and F. Zare, “Sensitivity analysis
of voltage imbalance in distribution networks with rooftop PVs,” in IEEE PES
References
168
General Meeting, PES 2010, 2010.
[66] Y. Li and P. A. Crossley, “Voltage balancing in low-voltage radial feeders using
Scott transformers,” IET Gener. Transm. Distrib., vol. 8, no. 8, pp. 1489–1498,
2014.
[67] K. Ma, F. Li, and R. Aggarwal, “Quantification of Additional Reinforcement Cost
Driven by Voltage Constraint under Three-Phase Imbalance,” IEEE Trans. Power
Syst., vol. 31, no. 6, pp. 5126–5134, 2016.
[68] N. C. Woolley and J. V. Milanović, “Statistical estimation of the source and level of
voltage unbalance in distribution networks,” IEEE Trans. Power Deliv., vol. 27,
no. 3, pp. 1450–1460, 2012.
[69] A. Von Jouanne and B. Banerjee, “Assessment of voltage unbalance,” IEEE Trans.
Power Deliv., vol. 16, no. 4, pp. 782–790, 2001.
[70] A. Rodriguez-Calvo, R. Cossent, and P. Frías, “Integration of PV and EVs in
unbalanced residential LV networks and implications for the smart grid and
advanced metering infrastructure deployment,” Int. J. Electr. Power Energy Syst.,
vol. 91, pp. 121–134, 2017.
[71] The Electricity Council, “Engineering Recommendation P29. Planning limits for
voltage unbalance in the United Kingdom.” 1990.
[72] P. Pillay and M. Manyage, “Definitions of voltage unbalance,” IEEE Power Eng.
Rev., 2001.
[73] IEEE, IEEE Standard Test Procedure for Polyphase Induction Motors and
Generators. 2017.
[74] L. K. Kumpulainen and K. T. Kauhaniemi, “Analysis of the impact of distributed
generation on automatic reclosing,” in IEEE PES Power Systems Conference and
Exposition, 2004., 2004, pp. 1152–1157.
[75] J. Morren and S. W. H. D. Haan, “Impact of distributed generation units with
power electronic converters on distribution network protection,” in
Developments in Power System Protection, 2008. DPSP 2008. IET 9th
International Conference on, 2008, pp. 664–669.
[76] K. Kauhaniemi and L. Kumpulainen, “Impact of distributed generation on the
protection of distribution networks,” in 2004 Eighth IEE International Conference
on Developments in Power System Protection, 2004, vol. 1, pp. 315-318 Vol.1.
[77] P. P. Barker and R. W. De Mello, “Determining the impact of distributed
generation on power systems. I. Radial distribution systems,” Power Eng. Soc.
Summer Meet. 2000. IEEE, vol. 3, no. c, pp. 1645–1656 vol. 3, 2000.
[78] Institute of Electrical and Electronics Engineers, “IEEE Standard for
Interconnection and Interoperability of Distributed Energy Resources with
Associated Electric Power Systems Interfaces,” IEEE Std 1547-2018 (Revision of
IEEE Std 1547-2003). pp. 1–138, Apr-2018.

References
169
[79] N. Hadjsaid, J. F. Canard, and F. Dumas, “Dispersed generation impact on
distribution networks,” IEEE Comput. Appl. Power, vol. 12, no. 2, pp. 22–28, Apr.
1999.
[80] S. M. Brahma and A. A. Girgis, “Development of Adaptive Protection Scheme for
Distribution Systems With High Penetration of Distributed Generation,” IEEE
Trans. Power Deliv., vol. 19, no. 1, pp. 56–63, 2004.
[81] Alstom Grid, “Network Protection & Automation Guide.” 2011.
[82] International Electrotechnical Commission, “IEC 62196-1:2014 Plugs, socket-
outlets, vehicle connectors and vehicle inlets - Conductive charging of electric
vehicles - Part 1: General requirements.” 2014.
[83] EPRI, “Environmental assessment of plug-in hybrid electric vehicles. Volume 1:
Nationwide Greenhouse Gas Emissions.,” 2007. [Online]. Available:
https://www.energy.gov/sites/prod/files/oeprod/DocumentsandMedia/EPRI-
NRDC_PHEV_GHG_report.pdf.
[84] S. Slater, M. Dolman, P. Taylor, P. Trichakis, and J. Shine, “Strategies for the
uptake of electric vehicles and associated infrastructure implications,” 2009.
[Online]. Available: http://www.element-energy.co.uk/wordpress/wp-
content/uploads/2012/05/EV_infrastructure_report_for_CCC_2009_final.pdf.
[85] S. Borlase, Smart Grids: Infrastructure, Technology, and Solutions. CRC Press,
2012.
[86] R. Tonkoski, L. A. C. Lopes, and T. H. M. El-Fouly, “Coordinated active power
curtailment of grid connected PV inverters for overvoltage prevention,” IEEE
Trans. Sustain. Energy, vol. 2, no. 2, pp. 139–147, 2011.
[87] M. Manbachi, H. Farhangi, A. Palizban, and S. Arzanpour, “Smart grid adaptive
volt-VAR optimization: Challenges for sustainable future grids,” Sustain. Cities
Soc., vol. 28, pp. 242–255, 2017.
[88] M. Manbachi, M. Nasri, B. Shahabi, H. Farhangi, A. Palizban, S. Arzanpour, M.
Moallem, and D. C. Lee, “Real-Time Adaptive VVO/CVR Topology Using Multi-
Agent System and IEC 61850-Based Communication Protocol,” IEEE Trans.
Sustain. Energy, vol. 5, no. 2, pp. 587–597, Apr. 2014.
[89] C. Bucher, G. Andersson, and L. Küng, “INCREASING THE PV HOSTING CAPACITY
OF DISTRIBUTION POWER GRIDS – A COMPARISON OF SEVEN METHODS,” 2013.
[90] S. Koch, F. Ferrucci, A. Ulbig, and M. Koller, “Time-series simulations and
assessment of smart grid planning options of distribution grids,” in 23rd
International Conference on Electricity Distribution, 2015, no. June, pp. 15–18.
[91] N. Markushevich, “The benefits and challenges of the Integrated Volt/Var
Optimization in the smart grid environment,” in 2011 IEEE Power and Energy
Society General Meeting, 2011, pp. 1–8.
[92] C. Reese, C. Buchhagen, and L. Hofmann, “Voltage range as control input for

References
170
OLTC-equipped distribution transformers,” in Proceedings of the IEEE Power
Engineering Society Transmission and Distribution Conference, 2012.
[93] C. Long and L. F. Ochoa, “Voltage control of PV-rich LV networks: OLTC-fitted
transformer and capacitor banks,” IEEE Trans. Power Syst., vol. 31, no. 5, pp.
4016–4025, 2016.
[94] T. Stetz, K. Diwold, M. Kraiczy, D. Geibel, S. Schmidt, and M. Braun, “Techno-
economic assessment of voltage control strategies in low voltage grids,” IEEE
Trans. Smart Grid, vol. 5, no. 4, pp. 2125–2132, 2014.
[95] C. Korner, M. Hennig, R. Schmid, and K. Handt, “Gaining experience with a
regulated distribution transformer in a smart grid environment,” in CIRED 2012
Workshop: Integration of Renewables into the Distribution Grid, 2012, pp. 161–
161.
[96] R. Echavarría, A. Claudio, and M. Cotorogea, “Analysis, design, and
implementation of a fast on-load tap changing regulator,” IEEE Trans. Power
Electron., vol. 22, no. 2, pp. 527–534, 2007.
[97] J. O. Quevedo, J. C. Giacomini, R. C. Beltrame, F. E. Cazakevicius, C. Rech, L.
Schuch, T. B. Marchesan, M. de Campos, P. S. Sausen, and J. R. Kinas, “Smart
distribution transformer applied to Smart Grids,” 2013 Brazilian Power Electron.
Conf., pp. 1046–1053, 2013.
[98] P. Bauer and S. W. H. de Haan, “Electronic tap changer for 500 kVA/10 kV
distribution transformers: design, experimental results and impact in
distribution networks,” in Conference Record of 1998 IEEE Industry Applications
Conference. Thirty-Third IAS Annual Meeting (Cat. No.98CH36242), 1998, vol. 2,
pp. 1530–1537 vol.2.
[99] X. She, A. Q. Huang, and R. Burgos, “Review of solid-state transformer
technologies and their application in power distribution systems,” IEEE J. Emerg.
Sel. Top. Power Electron., vol. 1, no. 3, pp. 186–198, 2013.
[100] R. Pena-Alzola, G. Gohil, L. Mathe, M. Liserre, and F. Blaabjerg, “Review of
modular power converters solutions for smart transformer in distribution
system,” in 2013 IEEE Energy Conversion Congress and Exposition, ECCE 2013,
2013, pp. 380–387.
[101] M. M. Rahman, A. Arefi, G. M. Shafiullah, and S. Hettiwatte, “A new approach to
voltage management in unbalanced low voltage networks using demand
response and OLTC considering consumer preference,” Int. J. Electr. Power
Energy Syst., 2018.
[102] J. Hu, M. Marinelli, M. Coppo, A. Zecchino, and H. W. Bindner, “Coordinated
voltage control of a decoupled three-phase on-load tap changer transformer and
photovoltaic inverters for managing unbalanced networks,” Electr. Power Syst.
Res., 2016.

References
171
[103] S. Weckx, C. Gonzalez, T. De Rybel, and J. Driesen, “LS-SVM-based on-load tap
changer control for distribution networks with rooftop PV’s,” in 2013 4th
IEEE/PES Innovative Smart Grid Technologies Europe, ISGT Europe 2013, 2013.
[104] A. Uchida, S. Watanabe, and S. Iwamoto, “A voltage control strategy for
distribution networks with dispersed generations,” in 2007 IEEE Power
Engineering Society General Meeting, PES, 2007.
[105] Y. P. Agalgaonkar, B. C. Pal, and R. A. Jabr, “Distribution voltage control
considering the impact of PV generation on tap changers and autonomous
regulators,” IEEE Trans. Power Syst., vol. 29, no. 1, pp. 182–192, 2014.
[106] C. Gao and M. A. Redfern, “Automatic compensation voltage control strategy for
on-load tap changer transformers with distributed generations,” in APAP 2011 -
Proceedings: 2011 International Conference on Advanced Power System
Automation and Protection, 2011, vol. 1, pp. 737–741.
[107] M. Thomson, “Automatic voltage-control relays and embedded generation,”
Power Eng. J., vol. 14, no. 3, pp. 93–99, 2000.
[108] M. Fila, G. Taylor, P. Lang, J. Hiscock, and M. Irving, “Modelling and analysis of
the enhanced TAPP scheme for distribution networks,” in 16th Power Systems
Computation Conference, PSCC 2008., 2008.
[109] J. Hiscock, N. Hiscock, and A. Kennedy, “Advanced Voltage Control for Networks
with Distributed Generation,” in 19th International Conference on Electricity
Distribution, 2007.
[110] J. Barr and R. Majumder, “Integration of Distributed Generation in the Volt/VAR
Management System for Active Distribution Networks,” IEEE Trans. Smart Grid,
vol. 6, no. 2, pp. 576–586, Mar. 2015.
[111] D. Geibel, T. Degner, A. Seibel, T. Bülo, C. Tschendel, M. Pfalzgraf, K. Boldt, P.
Müller, F. Sutter, and T. Hug, “Active, intelligent low voltage networks – Concept,
realisation and field test results,” in 22nd International Conference and
Exhibition on Electricity Distribution (CIRED 2013), 2013, pp. 1–4.
[112] B. Blažič, T. Pfajfar, and I. Papič, “Voltage control in networks with distributed
generation — A case study,” in 2009 IEEE PES/IAS Conference on Sustainable
Alternative Energy (SAE), 2009, pp. 1–6.
[113] R. Schwalbe, H. Brunner, M. Stifter, A. Abart, E. Traxler, M. Radauer, and W.
Niederhuemer, “DG-demonet smart LV grid - increasing hosting capacity of LV
grids by extended planning and voltage control,” in 2015 International
Symposium on Smart Electric Distribution Systems and Technologies (EDST),
2015, pp. 63–69.
[114] R. Schwalbe, A. Einfalt, M. Heidl, A. Abart, M. Radauer, and H. Brunner, “DG-
DemoNet Smart LV Grid - Robust Control Architecture to increase DG Hosting
Capacity,” in 23rd International Conference on Electricity Distribution (CIRED

References
172
2015), 2015.
[115] F. Kupzog, R. Schwalbe, W. Prüggler, B. Bletterie, S. Kadam, A. Abart, and M.
Radauer, “Maximising low voltage grid hosting capacity for PV and electric
mobility by distributed voltage control,” e i Elektrotechnik und
Informationstechnik, vol. 131, no. 6, pp. 188–192, Sep. 2014.
[116] A. Einfalt, F. Zeilinger, R. Schwalbe, B. Bletterie, and S. Kadam, “Controlling
active low voltage distribution grids with minimum efforts on costs and
engineering,” in IECON Proceedings (Industrial Electronics Conference), 2013,
pp. 7456–7461.
[117] H. Y. Li and H. Leite, “Increasing distributed generation using automatic voltage
reference setting technique,” in IEEE Power and Energy Society 2008 General
Meeting: Conversion and Delivery of Electrical Energy in the 21st Century, PES,
2008.
[118] A. Kulmala, A. Mutanen, A. Koto, S. Repo, and P. Järventausta, “RTDS verification
of a coordinated voltage control implementation for distribution networks with
distributed generation,” in 2010 IEEE PES Innovative Smart Grid Technologies
Conference Europe (ISGT Europe), 2010, pp. 1–8.
[119] Electricity North West Ltd, “Low Voltage Integrated Automation (LoVIA)
Closedown Report,” 2015. [Online]. Available:
https://www.enwl.co.uk/globalassets/innovation/lovia/lovia-closedown/lovia-
closedown-report.pdf.
[120] R. Tonkoski and L. A. C. Lopes, “Voltage Regulation in Radial Distribution
Feeders with High Penetration of Photovoltaic,” in 2008 IEEE Energy 2030
Conference, 2008, pp. 1–7.
[121] A. G. Madureira and J. A. Pec as Lopes, “Coordinated voltage support in
distribution networks with distributed generation and microgrids,” IET Renew.
Power Gener., vol. 3, no. 4, p. 439, 2009.
[122] A. Madureira, J. P. Lopes, A. Carrapatoso, and N. Silva, “The new role of
substations in distribution network management,” in CIRED 2009 - 20th
International Conference and Exhibition on Electricity Distribution - Part 1, 2009,
pp. 1–4.
[123] G. Mokhtari, A. Ghosh, G. Nourbakhsh, and G. Ledwich, “Smart robust resources
control in lv network to deal with voltage rise issue,” IEEE Trans. Sustain.
Energy, vol. 4, no. 4, pp. 1043–1050, 2013.
[124] S. Weckx and J. Driesen, “Optimal Local Reactive Power Control by PV Inverters,”
IEEE Trans. Sustain. Energy, vol. 7, no. 4, pp. 1624–1633, 2016.
[125] VDE e.V., “VDE-AR-N 4105:2011-08 Power generation systems connected to the
low-voltage distribution network.” 2011.
[126] K. Tanaka, M. Oshiro, S. Toma, A. Yona, T. Senjyu, T. Funabashi, and C.-H. Kim,

References
173
“Decentralised control of voltage in distribution systems by distributed
generators,” IET Gener. Transm. Distrib., vol. 4, no. 11, p. 1251, 2010.
[127] T. Sansawatt, L. F. Ochoa, and G. P. Harrison, “Integrating distributed generation
using decentralised voltage regulation,” in IEEE PES General Meeting, PES 2010,
2010.
[128] R. Caldon, M. Coppo, and R. Turri, “Distributed voltage control strategy for LV
networks with inverter-interfaced generators,” Electr. Power Syst. Res., vol. 107,
pp. 85–92, 2014.
[129] P. M. S. Carvalho, P. F. Correia, and L. a F. Ferreira, “Distributed Reactive Power
Generation Control for Voltage Rise Mitigation in Distribution Networks,” IEEE
Trans. Power Syst., vol. 23, no. 2, pp. 766–772, 2008.
[130] C. a. Hill, M. C. Such, D. Chen, J. Gonzalez, and W. M. Grady, “Battery Energy
Storage for Enabling Integration of Distributed Solar Power Generation,” IEEE
Trans. Smart Grid, vol. 3, no. 2, pp. 850–857, 2012.
[131] L. Wang, D. H. Liang, A. F. Crossland, P. C. Taylor, D. Jones, and N. S. Wade,
“Coordination of Multiple Energy Storage Units in a Low-Voltage Distribution
Network,” IEEE Trans. Smart Grid, vol. 6, no. 6, pp. 2906–2918, 2015.
[132] N. S. Wade, P. C. Taylor, P. D. Lang, and P. R. Jones, “Evaluating the benefits of
an electrical energy storage system in a future smart grid,” Energy Policy, vol.
38, no. 11, pp. 7180–7188, Nov. 2010.
[133] M. A. Kashem and G. Ledwich, “Energy requirement for distributed energy
resources with battery energy storage for voltage support in three-phase
distribution lines,” Electr. Power Syst. Res., vol. 77, no. 1, pp. 10–23, Jan. 2007.
[134] M. J. E. Alam, K. M. Muttaqi, and D. Sutanto, “Distributed energy storage for
mitigation of voltage-rise impact caused by rooftoptoptop solar PV,” in IEEE
Power and Energy Society General Meeting, 2012.
[135] T. Verschueren, K. Mets, B. Meersman, M. Strobbe, C. Develder, and L.
Vandevelde, “Assessment and mitigation of voltage violations by solar panels in
a residential distribution grid,” in 2011 IEEE International Conference on Smart
Grid Communications, SmartGridComm 2011, 2011, pp. 540–545.
[136] Y. Ueda, K. Kurokawa, and T. Tanabe, “Study on the over voltage problem and
battery operation for grid-connected residential PV systems,” 22nd Eur.
Photovolt. Sol. Energy Conf., no. September, pp. 3094–3097, 2007.
[137] S. Ali, N. Pearsall, and G. Putrus, “Using Electric Vehicles To Mitigate Imbalance
Requirements Associated With High Penetration Level Of Grid-Connected
Photovoltaic Systems,” in 22nd International Conference on Electricity
Distribution (CIRED 2013), 2013.
[138] F. Marra, G. Y. Yang, C. Traeholt, E. Larsen, J. Ostergaard, B. Blazic, and W.
Deprez, “EV charging facilities and their application in LV feeders with

References
174
photovoltaics,” IEEE Trans. Smart Grid, vol. 4, no. 3, pp. 1533–1540, 2013.
[139] X. Liu, A. Aichhorn, L. Liu, and H. Li, “Coordinated control of distributed energy
storage system with tap changer transformers for voltage rise mitigation under
high photovoltaic penetration,” IEEE Trans. Smart Grid, vol. 3, no. 2, pp. 897–
906, 2012.
[140] X. Gao, F. Sossan, K. Christakou, M. Paolone, and M. Liserre, “Concurrent
Voltage Control and Dispatch of Active Distribution Networks by Means of Smart
Transformer and Storage,” IEEE Trans. Ind. Electron., vol. 65, no. 8, pp. 6657–
6666, 2018.
[141] J. Fonseca, M. I. Verdelho, and R. Prata, “Impact for the DSO of integrating
storage systems in a low-voltage grid with distributed energy resources,” CIRED -
Open Access Proc. J., vol. 2017, no. 1, pp. 1795–1799, 2017.
[142] K. H. Chua, Y. S. Lim, P. Taylor, S. Morris, and J. Wong, “Energy storage system
for mitigating voltage unbalance on low-voltage networks with photovoltaic
systems,” IEEE Trans. Power Deliv., vol. 27, no. 4, pp. 1783–1790, 2012.
[143] S. Repo, D. Della Giustina, G. Ravera, L. Cremaschini, S. Zanini, J. M. Selga, and
P. Järventausta, “Use case analysis of real-time low voltage network
management,” in 2011 2nd IEEE PES International Conference and Exhibition on
Innovative Smart Grid Technologies, 2011, pp. 1–8.
[144] Y. Kabalci, “A survey on smart metering and smart grid communication,” Renew.
Sustain. Energy Rev., vol. 57, pp. 302–318, May 2016.
[145] K. N. Malamaki and C. S. Demoulias, “A decentralized voltage regulation method
in low-voltage feeders with PV systems and domestic loads,” in International
Conference on Power Engineering, Energy and Electrical Drives, 2013, pp. 461–
467.
[146] T. L. Lee, S. S. Yang, and S. H. Hu, “Design of decentralized voltage control for
PV inverters to mitigate voltage rise in distribution power system without
communication,” in 2014 International Power Electronics Conference, IPEC-
Hiroshima - ECCE Asia 2014, 2014, pp. 2606–2609.
[147] I. Roytelman and V. Ganesan, “Coordinated local and centralized control in
distribution management systems,” IEEE Trans. Power Deliv., vol. 15, no. 2, pp.
718–724, 2000.
[148] M. Fila, D. Reid, G. A. Taylor, P. Lang, and M. R. Irving, “Coordinated voltage
control for active network management of distributed generation,” in 2009 IEEE
Power Energy Society General Meeting, 2009, pp. 1–8.
[149] J. Tuominen, S. Repo, and A. Kulmala, “Comparison of the low voltage
distribution network voltage control schemes,” in IEEE PES Innovative Smart Grid
Technologies, Europe, 2014, pp. 1–6.
[150] H. Fakham, F. Colas, and X. Guillaud, “Real-time simulation of multi-agent

References
175
system for decentralized voltage regulation in distribution network,” in IEEE
Power and Energy Society General Meeting, 2011.
[151] A. Vaccaro, G. Velotto, and A. F. Zobaa, “A decentralized and cooperative
architecture for optimal voltage regulation in smart grids,” IEEE Trans. Ind.
Electron., vol. 58, no. 10, pp. 4593–4602, 2011.
[152] M. E. Baran and I. M. El-Markabi, “A multiagent-based dispatching scheme for
distributed generators for voltage support on distribution feeders,” IEEE Trans.
Power Syst., vol. 22, no. 1, pp. 52–59, 2007.
[153] R. Bottura, A. Borghetti, F. Napolitano, and C. A. Nucci, “ICT-power co-simulation
platform for the analysis of communication-based volt/var optimization in
distribution feeders,” in ISGT 2014, 2014, pp. 1–5.
[154] S. Lu, S. Repo, D. Della Giustina, F. A. C. Figuerola, A. Lof, and M. Pikkarainen,
“Real-Time Low Voltage Network Monitoring - ICT Architecture and Field Test
Experience,” IEEE Trans. Smart Grid, vol. 6, no. 4, pp. 2002–2012, 2015.
[155] “OPERA: Open PLC European Research Alliance,” 2018. [Online]. Available:
http://www.ist-opera.org.
[156] S. Repo, S. Lu, T. Pöhö, D. Della Giustina, G. Ravera, J. M. Selga, and F. A. C.
Figuerola, “Active distribution network concept for distributed management of
low voltage network,” in 2013 4th IEEE/PES Innovative Smart Grid Technologies
Europe, ISGT Europe 2013, 2013.
[157] S. S. S. R. Depuru, L. Wang, and V. Devabhaktuni, “Support vector machine based
data classification for detection of electricity theft,” in 2011 IEEE/PES Power
Systems Conference and Exposition, PSCE 2011, 2011.
[158] A. J. Dick, “Theft of electricity-how UK electricity companies detect and deter,” in
European Convention on Security and Detection, 1995., 1995, pp. 90–95.
[159] M. Anas, N. Javaid, A. Mahmood, S. M. Raza, U. Qasim, and Z. A. Khan,
“Minimizing electricity theft using smart meters in AMI,” in Proceedings - 2012
7th International Conference on P2P, Parallel, Grid, Cloud and Internet
Computing, 3PGCIC 2012, 2012, pp. 176–182.
[160] ActionFraud, “Millions paid to electricity scammers,” 2011. [Online]. Available:
https://www.actionfraud.police.uk/millions-paid-to-electricity-scammers-mar11.
[161] Crimestoppers, “Energy theft costs us all.” [Online]. Available:
https://www.stayenergysafe.co.uk/stories/energy-theft-costs-us-all. [Accessed:
16-May-2018].
[162] M. Streeter and S. Boggan, “IRA team who planned terror blitz on capital given
35 years,” The Independent, 1997.
[163] “Australian jailed for bomb plots,” BBC, 2006. [Online]. Available:
http://news.bbc.co.uk/1/hi/world/asia-pacific/5277010.stm.
[164] Electricity Information Sharing and Analysis Center (E-ISAC), “Analysis of the

References
176
cyber attack on the Ukrainian power grid,” 2016. [Online]. Available:
https://ics.sans.org/media/E-ISAC_SANS_Ukraine_DUC_5.pdf.
[165] V3, “Ukraine power grid attacks continue but BlackEnergy malware ruled out.”
[Online]. Available: https://www.v3.co.uk/v3-uk/news/2440469/ukraine-
investigating-suspected-russian-cyber-attack-on-power-grid. [Accessed: 16-May-
2018].
[166] T. E. Griffith, “Strategic Attack of National Electrical Systems,” Maxwell Air Force
Base, Alabama, 1994.
[167] U.S.-China Economic And Security Review Commission, “Report to Congress,”
2008. [Online]. Available:
https://www.uscc.gov/sites/default/files/annual_reports/2008-Report-to-
Congress-_0.pdf.
[168] S. Gorman, “Electricity Grid in U.S. Penetrated By Spies,” The Wall Street Journal,
08-Apr-2009.
[169] R. Anderson and S. Fuloria, “Smart meter security: a survey,” Univ. Cambridge
Comput. Lab. United Kingdom, 2011.
[170] N. Falliere, L. O. Murchu, and E. Chien, “W32.Stuxnet Dossier,” White Pap.
Symantec Corp., Secur. Response, vol. 5, no. 6, p. 29, 2011.
[171] W. D. Jones, “Declarations of cyberwar,” IEEE Spectrum, vol. 49, no. 8. p. 18,
2012.
[172] Cabinet Office, “National Risk Register of Civil Emergencies,” 2017. [Online].
Available:
https://assets.publishing.service.gov.uk/government/uploads/system/uploads/
attachment_data/file/644968/UK_National_Risk_Register_2017.pdf.
[173] Cambridgeshire & Peterborough Resilience Forum, “Community Risk Register
Supporting Document Version 3.3.” 2006.
[174] South Yorkshire Local Resilience Forum, “Risk Management and Planning Group
Community Risk Register.” 2013.
[175] R. Rashed Mohassel, A. Fung, F. Mohammadi, and K. Raahemifar, “A survey on
Advanced Metering Infrastructure,” Int. J. Electr. Power Energy Syst., vol. 63, pp.
473–484, 2014.
[176] E. Bou-Harb, C. Fachkha, M. Pourzandi, M. Debbabi, and C. Assi,
“Communication security for smart grid distribution networks,” IEEE Commun.
Mag., vol. 51, no. 1, pp. 42–49, 2013.
[177] D. Abbasinezhad-Mood and M. Nikooghadam, “An Ultra-Lightweight and Secure
Scheme for Communications of Smart Meters and Neighborhood Gateways by
Utilization of an ARM Cortex-M Microcontroller,” IEEE Transactions on Smart
Grid, 2017.
[178] Y. Mo, T. H. J. Kim, K. Brancik, D. Dickinson, H. Lee, A. Perrig, and B. Sinopoli,

References
177
“Cyber–Physical Security of a Smart Grid Infrastructure,” Proc. IEEE, vol. 100, no.
1, pp. 195–209, Jan. 2012.
[179] A. Boustani, A. Maiti, S. Y. Jazi, M. Jadliwala, and V. Namboodiri, “Seer Grid:
Privacy and Utility Implications of Two-Level Load Prediction in Smart Grids,” IEEE
Trans. Parallel Distrib. Syst., vol. 28, no. 2, pp. 546–557, 2017.
[180] G. W. Hart, “Nonintrusive Appliance Load Monitoring,” Proc. IEEE, vol. 80, no. 12,
pp. 1870–1891, 1992.
[181] D. Carluccio and S. Brinkhaus, “Smart Hacking For Privacy (Abstract),” 28th
Chaos Communication Congress, 2011. [Online]. Available:
https://events.ccc.de/congress/2011/Fahrplan/events/4754.en.html.
[182] D. Carluccio and S. Brinkhaus, “Smart Hacking for Privacy (Presentation),” 28th
Chaos Communication Congress, 2011. [Online]. Available: http://mirror.fem-
net.de/CCC/28C3/mp4-h264-HQ/28c3-4754-en-
smart_hacking_for_privacy_h264.mp4.
[183] R. Anderson, Security engineering: A Guide to Building Dependable Distributed
Systems. John Wiley & Sons, 2008.
[184] S. H. Weingart, “Physical Security Devices for Computer Subsystems: A Survey of
Attacks and Defenses,” in Cryptographic Hardware and Embedded Systems —
CHES 2000, 2000, pp. 302–317.
[185] Y. Xiao, Security and privacy in smart grids. CRC Press, 2013.
[186] P. Jafary, S. Repo, and H. Koivisto, “Secure communication of smart metering
data in the smart grid secondary substation,” in Proceedings of the 2015 IEEE
Innovative Smart Grid Technologies - Asia, ISGT ASIA 2015, 2016.
[187] C. J. Bandim, J. E. R. Alves, A. V Pinto, F. C. Souza, M. R. B. Loureiro, C. A.
Magalhaes, and F. Galvez-Durand, “Identification of energy theft and tampered
meters using a central observer meter: a mathematical approach,” in 2003 IEEE
PES Transmission and Distribution Conference and Exposition (IEEE Cat.
No.03CH37495), 2003, vol. 1, pp. 163-168 Vol.1.
[188] M. Wei and W. Wang, “Data-centric threats and their impacts to real-time
communications in smart grid,” Comput. Networks, vol. 104, pp. 174–188,
2016.
[189] J. Kim and L. Tong, “On topology attack of a smart grid: Undetectable attacks
and countermeasures,” IEEE J. Sel. Areas Commun., vol. 31, no. 7, pp. 1294–
1305, 2013.
[190] P. Y. Chen, S. Yang, J. A. McCann, J. Lin, and X. Yang, “Detection of false data
injection attacks in smart-grid systems,” IEEE Commun. Mag., vol. 53, no. 2, pp.
206–213, 2015.
[191] D. Kundur, X. Feng, S. Mashayekh, S. Liu, T. Zourntos, and K. L. Butler-Purry,
“Towards modelling the impact of cyber attacks on a smart grid,” Int. J. Secur.

References
178
Networks, vol. 6, no. 1, pp. 2–13, 2011.
[192] Y. Yuan, Z. Li, and K. Ren, “Modeling Load Redistribution Attacks in Power
Systems,” IEEE Trans. Smart Grid, vol. 2, no. 2, pp. 382–390, Jun. 2011.
[193] R. Deng, G. Xiao, R. Lu, H. Liang, and A. V. Vasilakos, “False data injection on
state estimation in power systems-attacks, impacts, and defense: A survey,” IEEE
Trans. Ind. Informatics, vol. 13, no. 2, pp. 411–423, 2017.
[194] T. M. Overman, R. W. Sackman, T. L. Davis, and B. S. Cohen, “High-Assurance
Smart Grid: A Three-Part Model for Smart Grid Control Systems,” Proc. IEEE, vol.
99, no. 6, pp. 1046–1062, Jun. 2011.
[195] M. Carpenter, T. Goodspeed, B. Singletary, E. Skoudis, and J. Wright, “Advanced
metering infrastructure attack methodology,” InGuardians white Pap., 2009.
[196] A. R. Metke and R. L. Ekl, “Security technology for smart grid networks,” IEEE
Trans. Smart Grid, vol. 1, no. 1, pp. 99–107, 2010.
[197] H. Khurana, M. Hadley, N. Lu, and D. A. Frincke, “Smart-grid security issues,”
IEEE Secur. Priv., vol. 8, no. 1, pp. 81–85, 2010.
[198] F. M. Cleveland, “Cyber security issues for Advanced Metering Infrasttructure
(AMI),” 2008 IEEE Power Energy Soc. Gen. Meet. - Convers. Deliv. Electr. Energy
21st Century, pp. 1–5, 2008.
[199] C. H. Gebotys, Security in Embedded Devices. Springer US, 2010.
[200] Y. J. Kim, V. Kolesnikov, and M. Thottan, “Resilient end-to-end message
protection for large-scale cyber-physical system communications,” in 2012 IEEE
3rd International Conference on Smart Grid Communications, SmartGridComm
2012, 2012, pp. 193–198.
[201] S. Uludag, K. S. Lui, W. Ren, and K. Nahrstedt, “Secure and scalable data
collection with time minimization in the smart grid,” IEEE Trans. Smart Grid, vol.
7, no. 1, pp. 43–54, 2016.
[202] The Meters (Certification) Regulations 1998. 1998.
[203] Y. Yan, Y. Qian, and H. Sharif, “A secure and reliable in-network collaborative
communication scheme for advanced metering infrastructure in smart grid,” in
2011 IEEE Wireless Communications and Networking Conference, WCNC 2011,
2011, pp. 909–914.
[204] G. N. Ericsson, “Cyber Security and Power System Communication - Essential
Parts of a Smart Grid Infrastructure,” Power Deliv. IEEE Trans., vol. 25, no. 3, pp.
1501–1507, 2010.
[205] A. Marcoci, S. Raffaelli, J. M. Galan, E. Cagno, E. Cagno, G. J. L. Micheli, G. Mauri,
and R. Urban, “The Meter-ON project: How to support the deployment of
advanced metering infrastructures in Europe?,” in 22nd International Conference
and Exhibition on Electricity Distribution (CIRED 2013), 2013, pp. 1–4.
[206] S. Baker, S. Waterman, and G. Ivanov, “In the Crossfire: Critical Infrastructure in

References
179
the Age of Cyber War,” 2010.
[207] The Commission for Energy Regulation, “Electricity Smart Metering Technology
Trials Findings Report,” 2011. [Online]. Available:
https://www.ucd.ie/t4cms/Electricity Smart Metering Technology Trials Findings
Report.pdf.
[208] R. Anderson and M. Kuhn, “Low cost attacks on tamper resistant devices,” in
International Workshop on Security Protocols, 1997, pp. 125–136.
[209] M. Nabeel, X. Ding, S. H. Seo, and E. Bertino, “Scalable end-to-end security for
advanced metering infrastructures,” Inf. Syst., vol. 53, pp. 213–223, 2015.
[210] K. Shuaib, Z. Trabelsi, M. Abed-Hafez, A. Gaouda, and M. Alahmad, “Resiliency of
Smart Power Meters to Common Security Attacks,” Procedia Comput. Sci., vol.
52, pp. 145–152, Jan. 2015.
[211] P. Yi, T. Zhu, Q. Zhang, Y. Wu, and J. Li, “A denial of service attack in advanced
metering infrastructure network,” in 2014 IEEE International Conference on
Communications, ICC 2014, 2014, pp. 1029–1034.
[212] M. Davis, “SmartGrid Device Security,” in Black Hat USA 2009, 2009.
[213] N. Uto, B. A. P. Botelho, and R. De Simone Cividanes, “A Fast Attack against a
Smart Meter Authentication Protocol,” in 3rd International Conference on
Informatics, Environment, Energy and Applications, 2014.
[214] H. Dantas, Z. Erkin, C. Doerr, R. Hallie, and G. van der Bij, “eFuzz: A Fuzzer for
DLMS/COSEM Electricity Meters,” in Proceedings of the 2nd Workshop on Smart
Energy Grid Security, 2014, pp. 31–38.
[215] V. C. Güngör, D. Sahin, T. Kocak, S. Ergüt, C. Buccella, C. Cecati, and G. P.
Hancke, “Smart grid technologies: Communication technologies and standards,”
IEEE Trans. Ind. Informatics, vol. 7, no. 4, pp. 529–539, 2011.
[216] L. Šastný, L. Franek, and P. Fiedler, “Wireless communications in smart
metering,” IFAC Proc. Vol., vol. 46, no. 28, pp. 330–335, 2013.
[217] J. Wright, R. Speers, and R. Melgares, “KillerBee,” 2009. [Online]. Available:
https://github.com/riverloopsec/killerbee.
[218] S. McIntyre, “termineter,” 2012. [Online]. Available:
https://github.com/securestate/termineter.
[219] Department of Energy and Climate Change, “Smart Metering Equipment
Technical Specifications Version 1.1,” 2014. [Online]. Available:
https://assets.publishing.service.gov.uk/government/uploads/system/uploads/
attachment_data/file/299395/smets.pdf.
[220] Analog Devices, “Single-Phase Multifunction Metering IC with di/dt Sensor
Interface,” 2011. [Online]. Available:
http://www.analog.com/media/en/technical-documentation/data-
sheets/ADE7753.pdf.

References
180
[221] H. Leite, “Modelling and real-time testing of an automatic local voltage controller
to increase the amount of distributed generation,” University of Manchester,
2004.
[222] G. Ordnance Survey, “OS MasterMap Topography Layer [GML geospatial data],”
EDINA Digimap Ordnance Survey Service. [Online]. Available:
http://edina.ac.uk/digimap. [Accessed: 05-Sep-2014].
[223] Microsoft, “Aerial View, Cardiff,” Bing Maps. [Online]. Available:
https://www.bing.com/maps/aerial. [Accessed: 05-Sep-2014].
[224] P. Benko, G. Malicsko, and A. Veres, “A large-scale, passive analysis of end-to-
end TCP performance over GPRS,” in Proceedings - IEEE INFOCOM, 2004.
[225] B. Pfitzinger, T. Baumann, A. Emde, D. Macos, and T. Jestädt, “Network-wide
Measurement of TCP RTT in 2G Networks,” in HICSS, 2018.
[226] F. Vacirca, F. Ricciato, and R. Pilz, “Large-scale RTT measurements from an
operational UMTS/GPRS network,” in Proceedings - First International Conference
on Wireless Internet, WICON 2005, 2005.
[227] International Electrotechnical Commission, “IEC 62056-21:2002 Electricity
metering – Data exchange for meter reading, tariff and load control – Part 21:
Direct local data exchange.” 2002.
[228] American National Standards Institute, “Protocol Specification for ANSI Type 2
Optical Port,” 2006.
[229] International Organization for Standardization and International Electrotechnical
Commission, “ISO/IEC 27002:2013 Information technology -- Security
techniques -- Code of practice for information security controls.” 2013.
[230] Data Communications Company, “Intimate Communications Hub Interface
Specification Version 1.0,” 2014. [Online]. Available:
https://www.smartdcc.co.uk/media/145112/intimate_communications_hub_inte
rface_specifications_dcc_1.0_clean.pdf.

181
This page intentionally left blank

‘Strive for perfection in everything. Take the best that exists and make it better. If
it doesn't exist, create it. Accept nothing nearly right or good enough.’
- Sir Frederick Henry Royce
‘The only thing greater than the power of the mind is the courage of the heart.’
- John Forbes Nash Jr