ENG 450 – Engineering Internship Report Advanced Metering ...
Upload
khangminh22Category
view
1download
0
1
Setting the STANDARD
- Integrating Meter Diagnostics Into Flow Metering Standards
Terry Cousins
Richard Steven
Colorado Engineering Experiment Station Inc.
54043 WCR 37, Nunn, Colorado 80648, USA
1. Introduction
When industry requires to meter a flow, it requires that flow to be metered correctly. A
trusted flow meter which is subsequently found to have given an erroneous flow rate
prediction can cause financial penalties, legal arguments, and / or the process to become
inefficient. Verification of a flow meter’s performance has always been a major aspect of the
flow meter engineer’s art.
Traditional diagnostic methods to verify a flow meter’s serviceability are still widely used
today, such as mass balance checks, and the associated liquid prover / check meter
techniques. However, these methods have long been known to have severe limitations. The
latest generation of flow meters tend to have diagnostic systems that carry out internal checks
on the meter’s health. Although imperfect these diagnostic systems are a great advance over
the traditional check methods. Nevertheless, industry has been very slow on the uptake of
such an obviously beneficial development.
In this paper the authors discuss the history of flow meter verification and the issues that
hinder the permeation of flow meter diagnostic usage throughout industry. It is argued that
the flow meter diagnostic systems have now reached a maturity where they could and should
be discussed in considerably more detail in the flow meter standards. Once included in flow
meter standards, diagnostic techniques for meter verification will become included in
contractual obligations, and applying such techniques which is presently the exception,
should gradually become the general rule.
2. Verification vs. Diagnostics
Operators talk of “verifying” that a flow meter is correctly metering a flow. “Verification” is
described in dictionaries as:
To prove, show, find out, or state that (something) is true or correct.
Diagnostics are the methodology utilized to achieve this verification. “Diagnosis” is
described in dictionaries as either:
The act of identifying a problem by examining something, or,
A statement or conclusion that describes the reason for a problem.
Clearly, the two definitions of diagnostics are quite different propositions to the flow meter
engineer. It is an order of magnitude easier to show that something is wrong, i.e. highlight an
unspecified malfunction, compared to also stating precisely what is wrong.
3. A History of Flow Meter Verification (Diagnostics) Methods
Where there is an industrial requirement to meter a flow there is an inherent requirement to
meter it correctly. This obvious observation leads directly to a very practical and difficult
problem; how does the operator know a flow meter output is trustworthy!?

2
Most flow meter designs require calibration at a test facility prior to being shipped to site and
installed1. However, although a good performance at a calibration laboratory is a prerequisite
to a meter’s acceptance at site it does not guarantee the meter will have the calibration
performance in operation. Many problems can adversely affect a meters performance. If the
rigors of industrial use can create various scenarios that adversely affect a flow meter how
does the operator check the integrity of the meter output? This conundrum has blighted flow
metering since the earliest days.
Early methods of checking a flow meter’s integrity are still used today. These include using
due diligence, i.e. due care in selecting, calibrating, installing and operating a flow meter,
possibly coupled with routine scheduled maintenance.
3.1 Mass Balance Checks
In pipe networks with multiple pipes and flow meters it is possible to check the mass balance
across the system. Mass balance checks inherently require knowledge of the process which is
a recurring theme in flow meter verification / diagnostics up to the modern age. There were,
and still are, severe limitations to the mass balance method. Perceived mass balance issues
can be caused not just by meter malfunctions but by incomplete understanding of a process
(e.g. flow being diverted down other pipe lines, line pack, or leakage). Also, multiple flow
rate uncertainties combine to make a mass balance check across a large pipe network
relatively unprecise. Furthermore, even if a mass balance check identifies a problem, it
doesn’t identify if the problem is loss of fluid from the pipe, or a flow meter error, or which
flow meter is in error. In short, these verification / diagnostic methods are external to the
meters themselves and even if a problem is suspected these methods can do little to pin point
a specific problem. At best, mass balance is too coarse a technique to identify many flow
meter errors.
3.1.1 Check Metering – Two Meters in Series
Fig 1. Gas Ultrasonic Check Meter Upstream of Primary Gas Turbine Meter.
An early attempt to improve on such flow meter integrity checks consisted of using check
meters, i.e. comparing the outputs of two meters in series in close proximity. This is a mass
balance check, but specific to the two meters. However, there are limitations to this approach.
If the two meters are of the same design principle they may encounter a common mode
problem. That is, they may have similar flow rate errors induced by the same underlying
issue thereby masking a flow meter problem instead of highlighting it. A partial solution is to
1 An exception to this is the orifice meter. Orifice meters are very reproducible. Industries massed orifice meter
data has been fitted & ratified by standards boards to create a discharge coefficient prediction in lieu of a
calibration. The standards discharge coefficient prediction is therefore just a data fit to massed calibration data.
Hence, orifice meters are effectively “pre-calibrated” and not exempt from this discussion.

3
use dissimilar meters in series (i.e. meters that operate on different physical principles). It is
less likely that meters operating on different physical principles will encounter a common
mode problem. Figure 1 shows an example of dissimilar flow meters in series; a non-
intrusive ultrasonic meter is installed upstream of the turbine meter. The gas ultrasonic meter
is a check meter to the primary gas turbine meter.
Dissimilar meters in series is still not an ideal check. It still requires two separate meters,
some problems can still affect dissimilar meters in similar ways, and any combination of
meters in series produces a check only as good as the combined uncertainty of the two meters
flow rate outputs. For example, if both meters have a 1% uncertainty, the meters can only be
checked to within their root mean sum uncertainty of √2%. That is, this system has a
relatively low sensitivity to any flow prediction bias. This check can only suggest the meter is
operational to an uncertainty higher than the meter’s uncertainty rating. Unfortunately, this is
a recurring theme with flow meter diagnostics, even for the latest internal diagnostic systems.
Furthermore, check metering only gives the operator a green or red light on meter
serviceability. If there is a problem it should show a discrepancy between the meters, but as a
stand-alone check it gives no information on which meter is in error or why. Nevertheless,
check metering can be described as a basic verification / diagnostic check.
Check metering is a diagnostic method that can identify if there is a metering problem. If the
two meters disagree on the flow rate outside their combined uncertainties, then it is verified
that there is a problem. The converse is not true. If the two meters agree on the flow rate
within their combined uncertainties then it is only probable that the meters are operating
correctly. However, there is still a possibility that both meters are in error together due to
some common mode problem. This issue highlights a fundamental truth about instrument
diagnostics. Diagnostic suites seldom if ever offer absolute proof a meter is fully serviceable,
they simply significantly increase the probability that the meter is fully serviceable. A
consequence of this fact is although diagnostics can be extremely useful, they cannot
completely replace the requirement for due diligence and good metering practice.
3.1.2 Check Metering with Liquid Provers
Liquid flow meter “proving” is a form of
check metering. The great advantage a
liquid prover has over a regular check
meter is that its uncertainty is so small that
the root sum square of the prover and flow
meter being checked is in practical terms
the uncertainty of the meter being checked.
The disadvantages are that it is a spot
check, effectively a periodic re-calibration
of a meter in service, and fundamentally
the process still just produces the basic
diagnostic of showing if the pair of meters
disagree for some unspecified reason.
Furthermore, due to the intermittent nature
of proving, if a discrepancy is found the
Fig 2. A Liquid Prover
operator does not know when in the time period between ‘proves’ the meter malfunction
developed. Proving is also limited to liquid flow meters, it isn’t practically possible to prove

4
gas meters. Hence, whereas liquid provers most certainly have their place in industry they are
not the panacea or benchmark of flow meter diagnostics. As such, industry has been slowly
turning to internal (“integrated”) flow meter diagnostic systems (particularly for gas flow
measurement) to verify a flow meter’s performance.
3.2 Integrated (or ‘Internal’) Diagnostics
Whereas industry still appreciates reductions in flow meter uncertainties for meter designs
operating in ideal conditions, much flow meter research has been leaning towards developing
and improving internal meter diagnostics. Flow meter verification is becoming as important
an aspect of flow metering as the uncertainty of a meter working flawlessly.
In the last twenty years flow meter designs have had great advances in internal diagnostics.
There is a slow acceptance of the inherent truths that a flow meter’s stated uncertainty is only
truly valid when there is a guarantee the meter is operating correctly, and the most assured
and precise way to continually guarantee meter serviceability is to use a diagnostic system
internal to the meter system. Strictly speaking, a flow meter’s uncertainty rating is only as
good as its diagnostic system’s ability to verify the meter is fully serviceable. As no flow
meter’s diagnostic system is perfect, this obvious truth leads to a less spoken truth, the
uncertainty rating of any flow meter is more notional than reality, it is still a faith based
measurement. It is a ‘best estimate’ based on the engineer’s judgement when accounting for
the meters calibration performance, installation & process conditions, and the capability of its
diagnostic system. This is the true state of the art, and the underlying driver for improvements
to diagnostic suites. The better the internal diagnostic system and the better the knowledge of
the process, the less uncertainty in the flow meters output.
A definition of “external meter diagnostics” is a diagnostic system that uses information
external to the meter readings, such as mass balance, the associated method of check meters,
or other process information. A definition of “internal meter diagnostics” is a diagnostic
system that uses information obtained solely from readings that are generated from sensors
internal to the metering system. An internal diagnostic system compares the resulting
readings and parameters to known laws of physics2 and / or known correct performance
criteria (sometimes derived from a calibration baseline). Internal and external methods are
not mutually exclusive and operators can and do combine both methods.
Internal diagnostics have been developed for various flow meters such as the ultrasonic, DP
and Coriolis meters. However, these diagnostics suites tend to be relatively complicated
systems. These diagnostic systems (or ‘suites’) are a great advance in flow metering
verification, are well understood by some meter experts, but as yet they are not well
understood or utilised by the majority of flow meter operating staff.
4. Challenges with Adopting Modern Flow Meter Integral Diagnostics
In order to understand the diagnostic suite of an ultrasonic, DP or Coriolis meter it is
necessary to have a good grounding in the fundamental principles governing the operation of
the basic meter designs. Unfortunately, flow meter designs are based on various combinations
of fluid mechanics, mechanical, electronics and mathematical principles, and this can be quite
2 Examples: 1) Ultrasonic meters can prove path serviceability by inter-comparing the speed of sound (SOS)
measurements across each path because a homogenous fluid at a given thermodynamic condition has a constant
speed of sound regardless of the local path flow velocity. 2) DP meters can prove DP reading integrity by
equating the sum of the recovered & permanent pressure loss DPs with the traditional DP as this relationship is a
consequence of the 1st law of thermodynamics.

5
daunting to the average operator, who is not a meter specialist and has many other duties to
attend to other then checking the flow meters.
Many operators of flow meters see them as ‘black box’ devices and are content to use them
without understanding the details of how the operate. Standard meters predict the flow rate
via a flow computer output the operator can read, believe, and use. They do not need a
detailed understanding of the internal metering system. This level of understanding hinders
the adoption of the present diagnostic suites.
Many operations require (by legal contract) that flow meters are used for fiscal, custody
transfer, and allocation flow metering, and hence the operating staff are obliged to have a
basic working knowledge of them. But, the same is not true of the meter’s associated integral
diagnostic suites.
Legal contracts tend to state that flow metering will be conducted according to some
standards document (e.g. ISO, AGA, API documents etc.). If the stated standards document
does not promote the use of the relevant flow meter diagnostics, then use of diagnostics to
verify the flow meter will not be required by the legal contracts. As much of industry
considers the use of these diagnostics complicated, and they are not being forced by legal
requirements to adopt the use of such diagnostics / meter verification, then it is natural that
many do not pursue their use. However, such an obviously useful and beneficial advance in
technology cannot and will not fail to be adopted in the long term. Obstacles hindering the
general adoption of flow meter diagnostic suites include:
the lack of comment in the standards documents,
o and the associated lack of legal requirement,
the incomplete nature of diagnostic suites,
confusing operator / machine interfaces,
operator lack of understanding coupled with technician resistance
4.1 Meter Diagnostics and Standards Documents
There is passing comments to the ultrasonic meter diagnostic suite in AGA 9 [1] & ISO
17089-1 [2]. However, there is no comprehensive description, nor any concise statements on
the benefits, or necessity, of applying these diagnostics as part of a comprehensive meter
verification process. The DP meter and Coriolis meter standards say significantly less
regarding their respective various diagnostics. Therefore, in this 21st Century world, the
standards, and hence the legal contracts are promoting use of 20th Century technology.
The reasons for this are varied. One reason is the fact that standards traditionally lag the state
of the art (on the grounds that they are meant to discuss mature accepted technology). As yet
there has been no strong drive to update relevant flow meter standards to include the now
matured diagnostic methodologies. Another reason is different manufacturers use different
diagnostic suites (which in reality are very similar) with different user interfaces, which
makes the diagnostics more difficult for operators to understand.
Although different manufacturers do have different diagnostics and interfaces, for a given
meter type (such as ultrasonic or Coriolis meters), or a given meter sub-system (such as DP
transmitters), the diagnostics and user interface tend to be a variation on a common theme.
This perception of difference is in part caused by the meter manufacturers aim to be seen as
different and unique. They tend to want their diagnostics to be seen as different and better
than their competitor for commercial reasons. However, in many cases they are close enough
that a generic description in a standard document is possible. All that is really hindering such

6
a development in the relevant standards is the political will. Such an addition to the standards
would benefit the meter operators, who in the long run would then adopt the very useful tool
of internal diagnostics.
4.2 The Incomplete Nature of Flow Meter Diagnostic Suites
“Part of the problem is when we bring in a new technology we expect it to be perfect in a way
that we don't expect the world that we're familiar with to be perfect.” - Esther Dyson.
Great advances in the diagnostic suites of various flow meter designs have made in the last
twenty years. Further technical developments will undoubtedly be beneficial to further
persuading industry to adopt flow meter diagnostics as a verification tool. However, although
flow meter diagnostic suites are very useful at telling an operator if the meter has a problem
they are not “all seeing”. No developer of a diagnostic suite can guarantee (or will ever
guarantee) that it will see any and all problem/s, from any source, before a flow meter bias in
excess of the meters stated uncertainty is exceeded.
For any given generic flow meter its internal diagnostic system does not have the same
sensitivity to different problems. Different problems can induce different flow rate prediction
biases before the diagnostic system can identify that a problem exists3. Furthermore, no
diagnostic system of any flow meter type can guarantee it will see all potential problems.
The fact that diagnostic systems are inherently imperfect has been cited as one reason they
are not adopted. But this is a weak argument. Such an argument is practically saying, “… if it
cannot tell me everything I’d rather know nothing.” Ignorance is bliss. Such an argument
cannot stand for long when discussing commercially sensitive metering applications.
4.3 Desired Improvements in Meter Diagnostic Suites and Their Operator / Machine Interface
"It takes a lot of hard work to make something simple, to truly understand the underlying
challenges and come up with elegant solutions." – Steve Jobs
A significant problem with industry adopting internal flow meter diagnostics has been that
the advance in flow meter diagnostic suites has not generally been matched with advances in
the machine / operator interface, nor operator training4. It is unreasonable to assume that the
average operator has advanced knowledge of a flow meter operation principle and its
associated diagnostics suite. Hence, just as many flow meter operators wish to simply receive
a flow rate prediction from his “black box” flow meter, he would also appreciate a simple
diagnostic output. Complex diagnostics screens may contain very valuable information, but
it’s of little practical use if the average operator does not understand what it means. Presently,
diagnostic suites make the flow meter far ‘smarter’ but also far more difficult to understand
and use.
Let us consider an “ease of use vs. smartness” graph (as used by the late Steve Jobs of Apple
to discuss smart phones). Figure 3 shows the industry perception of where standard traditional
flow meters are. Not so smart but easy to use. It also shows the industry perception of where
present flow meters with diagnostics are. Quite smart, but difficult to use. The long term goal
3 Can a diagnostic suite guarantee the flow rate prediction to within “x%”? Unfortunately, the answer (as opposed to a salesman’s answer) is always no. There are philosophical arguments that suggest it is a panacea
that is impossible to reach. Improving diagnostics can approach this ideal asymptotically but will never actually
reach that ability. 4 It does go both ways. Whereas the meter manufacturer could simplify the diagnostic output to make it easier
for the end user to understand, there is some onus on the end users to put in some effort to improve their
understanding by actively training on how to read the diagnostic output.

7
Fig 3. Perceived Meter Diagnostics Usefulness vs. Ease of Use
of industry must be to make flow meters with diagnostics very smart and easy to use. This
will only be achieved by both meter manufacturers improving their diagnostic suite,
improving the operator interface (to make it more user friendly), and by training of the
operating staff.
The authors have noted that some meter manufacturers presently think that their diagnostic
interface is just fine, and the onus is on the end users to learn the meaning of their diagnostic
display. After many years of practice and familiarity, some are so used to their diagnostic
display that its meaning is obvious to them. They cannot see a need for a simpler
representation of the diagnostics. They attempt to educate the users on what the complex
display means. However, this is effectively asking the non-specialist end user to become a
specialist. The client is being told to put the effort in to work with their system, rather than
they put the effort in to work with the client’s needs. In reality, the essential long term
requirement of industry is to significantly simplify the diagnostic output display. This of
course is easier said than done. It is difficult to simplify a complex system, and this is why it
is still a major issue. Regardless of difficulty, such is the obvious benefit to industry, and
such is the marketability of user friendly diagnostics, that it is inevitable that this will be
achieved to a certain degree in the long run. The question then, is when, not if these
developments will take place.
Figure 3 indicates that the authors consider it necessary that there is not only an improvement
in the ease of use of diagnostics but an increase in the diagnostic capability. Presently, many
flow meter diagnostic suites can indicate that there is a problem, but few make any serious
effort to tell the operator what that problem is. This is partially as the meter manufacturers are
seldom pushed to do so, and partially as the state of the art of diagnostic suites makes this a
very difficult challenge. Nevertheless, various diagnostic suites allow the operator the ability
to eliminate certain common problems while short listing other common problems. Hence,
the present state of the art potentially allows some diagnostic suites to make at least limited
predictions on the likely causes of a problem. Few however do.
4.4 Psychological Resistance
4.4.1 Technician Resistance – Fear of Change (Resulting in Redundancy)
Technicians providing flow meter maintenance are a mandatory requirement for any
reputable hydrocarbon company. As such, senior technicians in hydrocarbon production and
transmission companies can become the companies flow metering specialists. Any new
metering development is often passed by these company experts for their opinion. However,

8
these metering technicians can perceive diagnostics as a potential threat to their and their
teams livelihood. It is not always in their personal interest to highlight the great benefits, they
can perceive a flow computer with diagnostics as a “technician in a box”. That is, technology
coming to make them redundant. It is only natural that there is resistance.
Many operators have too few flow meter technicians for too large a number of meters, spread
over too far an area. Typically most of these meters have no diagnostics, or if they have
diagnostics they are not monitored as they are not fully understood. As such the technician
can be blind to many problems and is rather inefficient as he carries out routine scheduled
maintenance on meter after meter that did not need maintenance5, while other meters with
unseen problems are untouched. The use of diagnostics would allow this technician to carry
out the philosophy “… if it ain’t broke don’t fix it”, while continually going to the meters that
do need work. That is, diagnostics allow the technician to carry out a Condition Based
Maintenance (“CBM”) scheme. CBM schemes are far more efficient, making the technicians
efforts far more valuable to his employer. CBM also reduces unnecessary staff exposure to
high pressure hydrocarbon systems. If there is proof that a meter does not need maintenance
then there is no need to break containment. Yet, by human nature technicians tend to be
nervous of the introduction of diagnostics, as it is change. Perhaps they are correct, a portion
of them may in the long run be no longer required. But this is the nature of progress, in the
end a good idea cannot be stopped, only delayed.
4.4.2. What You Don’t Know Won’t Hurt You / Plausible Deniability
The vast majority of meter operator staff / technicians naturally want to do a good job, be part
of a good team, and want the meters to operate correctly. They take pride and satisfaction
from their work. But, naturally they also want a quite life and to defend their job function.
Their management too want a quite life. Nobody likes problems. Management like to hear
that all is well. Successful mass balance check across plants, agreement between buyer and
seller metering stations, no metering alarms etc., all lead to a happy management and
harmony among the team. Ignorance is bliss. But, if you have comprehensive flow meter
diagnostic suites, they just might find a problem, a problem you otherwise would have been
ignorant of. To know of a problem, is to give the technician the conundrum of what to do
about it?
The product being flow metered is not the property of the meter operator staff / technicians.
Not at least in a financial sense. The meter operator staff typically get paid regardless of their
employers profit levels. If the operator is losing money by giving product away due to an
under-reading meter, or accidentally over charging due to an over-reading meter, it doesn’t
directly financially affect the metering staff. If a flow meter diagnostic system shows a
problem they otherwise wouldn’t have noticed, the diagnostic system has created a dilemma
they would otherwise not have had to deal with. Now, thanks to the diagnostic suite, if they
admit such a problem they get the satisfaction of doing their job properly and honourably, but
potentially give themselves the pressure of fixing it (while perhaps being unfairly blamed by
a demanding management). If they do not admit such a problem they know they are not doing
their job properly and honourably, but they avoid the pressure of fixing it (and perhaps being
unfairly blamed). However, if they can avoid using flow meter diagnostics in the first place
then “ignorance is bliss”, and they may never face this dilemma. This is a rather cynical
5 Routine scheduled maintenance can cause as many problems as it solves. For example, an orifice meter may
operating correctly before scheduled maintenance and after the maintenance the technician leaves it with a
problem, e.g. a plate re-installed backwards, a not completely re-sealed equalization valve on the 5 way
manifold etc.

9
observation, but it’s also human nature, and therefore undoubtedly a real issue. So, here
again, some technicians responsible for flow meters have natural reasons for not wanting
diagnostic systems. Still, many technicians want flow meter diagnostics regardless of these
problems. Many promote the use of diagnostics to senior management, but find some of their
senior management obstructive.
4.4.3 Resistance from Some Senior Management
“New ideas pass through three periods: 1) It can't be done. 2) It probably can be done, but
it's not worth doing. 3) I knew it was a good idea all along! ” – Arthur C. Clarke
Most operator management who are in charge of, or advise on, flow meter issues served their
time over several decades as instrument technicians or engineers. They are well versed, and
opinionated, on how flow metering should be conducted. However, along with the valuable
experience age brings, it also brings a greater resistance to change, and a tendency to not
follow or understand new technology as well as the younger generation who are brought up
with it. With flow meter diagnostics being one of the latest, most significant and complex
changes in flow meter technology for many years, it is only natural that many (although not
all) senior engineers with the authority to drive flow meter diagnostic use have not been
proactive in doing so.
There is an exception to this. Ultrasonic meters have been extensively marketed for the last
two decades. The ultrasonic meter diagnostic suite was one of several claimed benefits. Many
middle managers of the time ‘hanged their hat’ on the new ultrasonic meter technology, and
these managers are now senior managers. Nevertheless, it is curious that even though they
still promote these claimed benefits, few actively drive the use of ultrasonic meter diagnostics
in practice. For other meter designs, such as Coriolis and DP meters, the proponents of
diagnostics amongst senior instrument / flow meter engineers is significantly less, probably
as fewer have any personal ‘buy in’ to those technologies, and not all fully understand them.
Nevertheless, for hydrocarbon industry flow metering practice to evolve to include the
benefits of diagnostics it is necessary that the senior managers of the major operators support
diagnostic suite use with generic meters. This will be achieved in the long run, by some
senior managers realising their benefit, but also by the natural process described by Max
Planck:
“A new scientific truth does not triumph by convincing it’s opponents and making them see
the light, but rather it’s opponents eventually die, and a new generation grows up that is
familiar with it.”
The hydrocarbon industry has been long used to operating without flow meter diagnostics.
The contracts (and standards) do not tend to demand the use of diagnostics. Adding meter
diagnostics may add capital cost, i.e. in the case where the diagnostics are supplied external
to the basic meter, such as proving or check meters, or a stand-alone optional diagnostics
system procured separately to the basic meter. Diagnostics will add operating costs in the
form of staff training and time. Hence, some managers can resist due to the perceived
increase to the project budget.
In an effort to reduce in-house engineering staff costs many operators now out-source large
engineering projects (such as refineries, platforms, metering stations etc.). This makes the
budget issue more acute. By senior management policy operators do not get involved in
detailed engineering design decisions of these large projects. That is left to the bidding
engineering house contractors. However, such is the competitive nature between these
10
engineering houses, that for fear of losing a contract on price, they will not add any
equipment beyond the basic requirements of the “cookie cutter” specifications specifically
requested by the clients. Hence, the operators tend to trust the engineering houses judgement,
but the engineering house doesn’t use any judgement regarding extra equipment (such as
meter diagnostic considerations) for fear of over bidding and losing the job. Therefore,
metering diagnostics equipment like provers, check metering (including ultrasonic meter Z
configurations), or diagnostic systems not automatically supplied with a flow meter are often
not considered. The operator and the engineering house may both individually think the
addition sensible, but due to the political set up of the relationship neither party has the
authority to add the diagnostics. They both claim it’s the other party’s responsibility.
Inclusion in the standards and therefore contracts would induce operators to specify the
relevant flow meter diagnostic systems in the system specification and therefore help
alleviate this issue.
4.5 The Problems of Selling Insurance Policies
Fundamentally a flow meter diagnostic system is an insurance policy. A diagnostic suite is
not required for the flow meter to be fully functional. Industry has long been using flow
meters with no diagnostics. If there is no flow metering problem, the meter operates without
diagnostics just as well as it does with diagnostics. Hence, you do not need diagnostics to
meter a flow rate correctly. You just require diagnostics to give a significantly greater level of
certainty to the flow rate prediction uncertainty, and to tell you of the occasion when a meter
malfunctions.
The decision to buy into a flow meter diagnostic methodology is inherently a decision to buy
flow meter malfunction insurance. To the neutral 3rd party observer such insurance is
obviously beneficial. It can (and will) reduce the uncertainty in the operators product (and
therefore money) flow. That is, it will reduce exposure to potential large financial losses if a
meter under-reads, or perhaps law suites when the operator has over-charged due to an over-
reading. Nevertheless, selling the concept of insurance to a conservative industry that often
operates on inertia and habit can be difficult.
The application of flow meter diagnostics may take a paradigm shift in the long established
way that some operators think about their needs. Mis-measurement of fiscal, custody transfer
and allocation flows has always periodically occurred, long before comprehensive flow meter
diagnostics were available. Hence, industry has long accepted the inefficiency of finding a
flow metering bias, not knowing when the bias developed, and therefore compromising on a
mis-measurement / reallocation agreement between the affected parties. All parties are
exposed to the uncertainty of a resulting profit or loss. So entrained and routine is this process
in some organisations, that they have become blinded to the fact that this is now becoming an
obsolete methodology of conducting their affairs, a legal artefact from an early period in
technology when there was no alternative.
While inspecting a large high pressure high flow custody transfer meter, one of the authors
enquired about use of diagnostics. The response was: “Why would we need to bother with
that? We check the meter every few months. If there is a problem I just write a mis-
measurement report, they re-allocate funds, and everything is fine.” The facts that:
they may not know the amount of bias induced by the problem found,
they don’t usually know when the problem appeared between checks,
they may not notice a problem without diagnostics even with standard checks,
and hence they don’t know the financial cost of such a mis-measurement,

11
seemed lost on them. As was the fact that with diagnostics they would know immediately
when a problem appeared, and could have fixed it then, before exposure to measurement
uncertainty was an issue. Again, exposure to such mis-measurement usually does not directly
affect the individual meter technician’s personal finances. They get paid regardless, as long
as they follow the antiquated standard procedures. If the industry is to be brought into the 21st
Century, if the industry is to adopt flow meter diagnostics due the obvious advantages they
offer, a paradigm shift is required.
5. Examples of the Present State of the Art of Flow Meter Diagnostic Technologies
Flow meter diagnostics can only be considered as mature enough for general use and
inclusion in standards if they are generally accepted as potentially useful in most metering
applications. Various diagnostic methodologies for ultrasonic and DP meters at least have
been about for many years and can certainly be considered mature.
In this section the authors show a few sample examples from the positive feedback from
certain parts of the industry. (It is difficult to find any negative feedback from any source
from a technical perspective.) It is assumed that the reader has a basic understanding of flow
meter diagnostics. Detailed descriptions of ultrasonic and DP meter diagnostics can be found
throughout the industry literature. Sample documents for further reading are Lansing [3 & 4]
for ultrasonic meter diagnostics, Skelton [5] and Rabone [6] for DP meter diagnostics, and
Wehr [7, 8] for DP transmitter diagnostics. This is a very small sample. There are many more
detailed meter diagnostic documents by multiple authors and organizations that can be found
by rudimentary literature search.
Flow prediction biases tend to be induced by two distinct root causes. One is a meter system
malfunction problem (e.g. a malfunctioning sub-system such as an ultrasonic transducer or
DP transmitter, or wrong geometry or calibration information supplied to the flow computer).
The other is a flow condition induced problem on a correctly operating metering system (e.g.
disturbed flow, contamination, two-phase flow etc.) However, in some cases the flow
condition issue can in turn induce a meter system malfunction (e.g. erosion, contamination
build up, partially blocked flow conditioner, blocked pressure ports etc.) The state of the art
of flow meter diagnostics can typically identify when the meter has a problem. For a given
flow meter diagnostic system it sometimes can identify (or ‘short list’) what that problem is,
and sometimes it cannot identify the possible source of the problem. This issue is one of the
R&D aims of meter manufacturers. Nevertheless, a generic alarm stating the meter has a
problem and is therefore probably misreading is still very valuable. The examples below are a
mixture of these three general cases.
Each generic flow meter type has its own unique diagnostic suite based on the physical
principles of that meter type. It is therefore not possible, or relevant, to try and compare
different meters diagnostic systems. For example, an ultrasonic meter diagnostic suite can see
small changes in velocity profile, while a Venturi DP meter diagnostic suite cannot.
However, ISO 5167-5 indicates that a cone meter flow rate prediction is rather resistant to
this problem, whereas ISO 17089-1 indicates ultrasonic meter flow rate prediction is very
sensitive to the problem. So it can hardly be claimed that an ultrasonic meter’s diagnostic
capability to see small flow disturbances that effect it significantly is any real advantage over
the cone meter’s inability to see this issue that does not significantly affect it. In general,
different flow meter types diagnostic systems cannot be directly compared.
Most flow meter’s diagnostic suite can have the diagnostic checks broken into two categories,
i.e. ‘absolute’ and ‘relative’ diagnostic checks. An absolute diagnostic check consists of

12
comparing a known baseline to a meter result. This known baseline may be set by a physical
law, or by a fixed calibration result. A relative diagnostic check consists of trending a
parameter, i.e. checking the performance of a specific parameter over time, a ‘then’ and now’
comparison. Examples of absolute diagnostic checks are the ultrasonic meter Speed of Sound
(SOS) measurement compared to an external equation of state SOS prediction check, and the
DP meter DP reading integrity check. Both compare the results to known physical laws.
Examples of relative diagnostics is the ultrasonic meter trending of gain, signal to noise ratio,
path performance etc., and the similar diagnostics of the trending of a DP meter’s DP reading
standard deviations. Absolute diagnostic checks tend to be more powerful than relative
diagnostic checks, as they are less subjective, but trending diagnostics are still very useful.
Most flow meter diagnostic suites combine both. In these examples both types are shown.
5.1. A Proving Example – Wax Deposits on a Turbine Meter
Proving on site is a diagnostic that has been available for around 50 years. It shows change in
meter performance, i.e. if there is a shift due either an installation effect, or a change in flow
conditions with time then a proving will demonstrate this not just only qualitatively but also
quantitatively. Furthermore, proving is effectively a periodic re-calibration of the meter
within a resolution that is acceptable at present for custody transfer metering levels. A good
proving system should be able to determine the new calibration to within 0.06-0.1%.
A prover system further acts as a very competent diagnostic for meters such as turbine
meters, where it is known that such a meter should repeat during proving to within a given
value, usually set in practical terms to a spread of 0.05% in 5 runs for a fixed set of flow
conditions. If a turbine meter does not meet this criterion, then it is known that either the
meter has mechanical issues, the flow conditions are bad or have changed, or the prover has a
problem. This combined with a control chart is an excellent method of providing a
“quantitative diagnostic”.
Fig 4. Control Chart for a Turbine Affected by Wax Build-up
Figure 4, shows an example of a turbine meter measuring where the meter has a buildup of
wax. In this example, the problem is inherently a flow condition problem (i.e. it contains
wax) but this problem then causes the meter to mechanically have a problem (as the wax
deposits on the meter). The proving shows the meter calibration change as a quantitative
value, while giving the operator a warning that the meter is experiencing a significant issue.
The prover is a good diagnostic system for identifying something is wrong. However, like
Cleaned Cleaned & Line Heated

13
most diagnostics it does not state what the source of the problem is. It takes process
knowledge, and / or manual intervention, to identify the problem (in this case wax deposits).
Although the prover is a good diagnostic system for liquid flow metering it does have
drawbacks. Prover systems are only available for liquid applications. Provers are expensive,
requiring good operational maintenance and skilled staff to operate. It is not a practical
proposition to run provers continuously, and therefore proving is a “spot check” where the
operator is still blind in-between the periodic proves. When a prove shows a problem has
induced a meter performance shift since the last prove (with a subsequent mis-measurement),
the operator does not know when that problem appeared and at what rate it developed. The
mis-measurement has to be solved retrospectively, and usually with some guess work and
approximations, never a satisfactory situation for a high value product sales meter.
A significant modern issue is the lack of prover compatibility with the modern Coriolis and
ultrasonic liquid flow meters. By the physical principles of how they operate both these meter
types have inferior repeatability compared to turbine meters. Poor repeatability between
proves is a good diagnostic for liquid turbine meters. However, poor repeatability is not a
good diagnostic for liquid Coriolis and ultrasonic meters. The repeatability of these meters
can vary widely and unlike turbine meters repeatability is not a true diagnostic of
performance. In practical terms this results in two issues:
The prover requires a large number of proves, making the mechanical parts, such as
the four way valve, work harder per prove with consequent maintenance issues.
Keeping the repeat proves at constant flow conditions is difficult to achieve on site.
A further issue is several turbine meters can be replaced by one larger ultrasonic meter.
Compared to the prover size required to test one smaller turbine meter at a time, proving a
single larger meter requires a larger prover with the associated larger cost and footprint6.
Proving therefore becomes a practical issue, and in finding some way to resolve this, internal
flow meter diagnostics have come to the forefront. Thus operators hope that the internal
meter diagnostics can identify any metering issue as it arises, so as they can decide whether
maintenance or recalibration is required.
5b. An Ultrasonic Meter Integral Diagnostic Example – Gas Trapped in Transducer Pocket
A liquid test facility calibrated an ultrasonic meter. The ultrasonic meter’s diagnostic output
was recorded during the calibration. The meter was calibrated at a high flow rate first, and
then the flow was reduced. A distinct step in meter factor was found between the high flow
rate and lower flow rates. When the flow rate was subsequently increased again to the high
flow rate, the meter factor remained similar to that found for the lower flow rates. That is,
there was a shift in the high flow rate meter factor between the two high flow calibration
results. Figure 5 shows these results. Note the step calibration change between the original
high flow rate and lower flow rate results. What caused the initial higher meter factor during
the initial high flow rate test?
6 There are always pros and cons to any engineering system. The increase in prover size required to prove large
ultrasonic meters is a disadvantage of using a single large ultrasonic meter instead of a bank of smaller turbine
meters. Ultrasonic meter marketers have responded by claiming ultrasonic meters do not need proved like
turbine or PD meters as they have no moving parts. However, such claims are tantamount to claiming an
ultrasonic meter will never malfunction for any reason. This is obviously not true, ultrasonic meters are
adversely affected by pipe fouling, flow disturbances, flow conditions out with the calibration range etc., and
hence they too benefit from periodic proving.

14
Fig 1. Change in an Ultrasonic Meter Calibration Meter Factor
The ultrasonic meter diagnostic suite has various diagnostic checks. Different diagnostic
checks are more sensitive to specific problems than others. That is, the diagnostic check
within the over-all suite that is most sensitive to any specific problem depends on the specific
problem. In this case study, let us consider the Signal to Noise Ratio (SNR), gain (the drive
voltage to give an acceptable signal strength), and the individual path velocities. Diagnostic
results of interest are:
at the time of meter factor change there was a significant change in the SNR, Gain
and path velocity data,
the top path in particular exhibited a significant difference to the other paths - a
warning from the outset that the meter had a possible issue,
the top path SNR was low, showing a poor signal level compared to the noise,
the top path transducer gain was very high, showing that the meter was trying to push
up the signal level to compensate,
the velocity of the top path was different to its equivalent path.
The meter diagnostics were clearly showing that the top path was experiencing an issue at the
start of the calibration. The diagnostic warnings disappeared at lower flows, suggesting the
problem was only temporary. Process knowledge (external to the meter diagnostics) allows
us to surmise that air could be trapped in the liquid flow. Therefore, a likely reason for such a
diagnostic response is that air, which will gather at the top of the pipe, may have become
trapped in an upper paths transducer port. The flow rate changes are likely to have flushed the
gas free, and hence the problem soon disappeared.
There can be a tendency amongst diagnostic proponents (and ultrasonic meter salesmen) to
claim in such situations that the ultrasonic meter self-diagnosed that there was air tapped in
the transducer port. However, such claims exaggerate the ability of flow meter diagnostics. In
truth, the ultrasonic meter only self-diagnosed that the top chord had a temporary problem. It
was the skill of the operator, coupled with both the process knowledge and ultrasonic meter

15
diagnostics suite output that allowed the operator to come to the conclusion of what the
specific problem was. Nevertheless, the ultrasonic meter diagnostic warning that something
was wrong (and that it was a problem specifically with the top path) was the catalyst for the
problem being found a solved.
This is another example of the problem being inherently a flow condition problem (i.e. gas
entrained in the liquid) but this problem then causing the meter to mechanically have a
problem (i.e. gas trapped in the transducer port causing the transducer a problem due to the
significant difference in gas and liquid acoustic impedance).
5c. An Ultrasonic Meter Integral Diagnostic Example – Flow Profile Issues
An operator was periodically proving a 4 path liquid ultrasonic meter. After several years of
successful quarterly proving the prove indicated a significant shift in meter performance. The
meter factor shift was approximately 0.8%. The operator immediately surmised that there was
a fault with the flow meter.
Figure 6 shows a sketch of the meter installation, flow passes through two bends
approximately 15 diameters upstream if the meter. To mitigate the bends a 19 tube, tube
bundle was mounted upstream, 10 diameters between the tube bundle inlet and meter inlet,
similar to the installation recommended by API 5.8. In this installation there was no access to
log the meters internal diagnostics, it could only be done by taking a laptop to the meter, and
downloading a snapshot. That is, the operator did not monitor the flow meter’s internal
diagnostics.
Fig 6. USM Installation
The auditors first course of action was to review the prover data. The prover was calibrated
with turbine meters by an external US proving company with a generally good record. The
water draw data appeared in order. The turbine master meter calibrations and history were
acceptable. The temperature and pressure calibration certificates were up to date. The records
showed that they had checked the critical valves. The prove appeared correct, not totally
confirmed, but a very high probability. Suspicion turned to the ultrasonic meter.
Due to the unspecified problem identified by the prover, and the assumption that the
ultrasonic meter must have malfunctioned, the ultrasonic meter’s internal diagnostics were
reviewed. Fortunately, the ultrasonic meter had had a diagnostic baseline recorded during its
commissioning. The present results could therefore be compared to this diagnostic baseline.
The majority of the diagnostic checks had not shifted from this baseline significantly. The
SNR, gain & SOS checks had no significant change. The ‘turbulence’ diagnostic showed a
marginal shift. However, the diagnostic check sensitive to this problem was the flow profile.
Figures 7a & 7b shows the difference between the commissioned profile and the profile
during the investigation. At commissioning the profile appears symmetrical (as it should), but
during the investigation the profile was asymmetric. Therefore, the ultrasonic meter’s
diagnostic result showed that there had been a shift in the meters velocity profile. That is, the
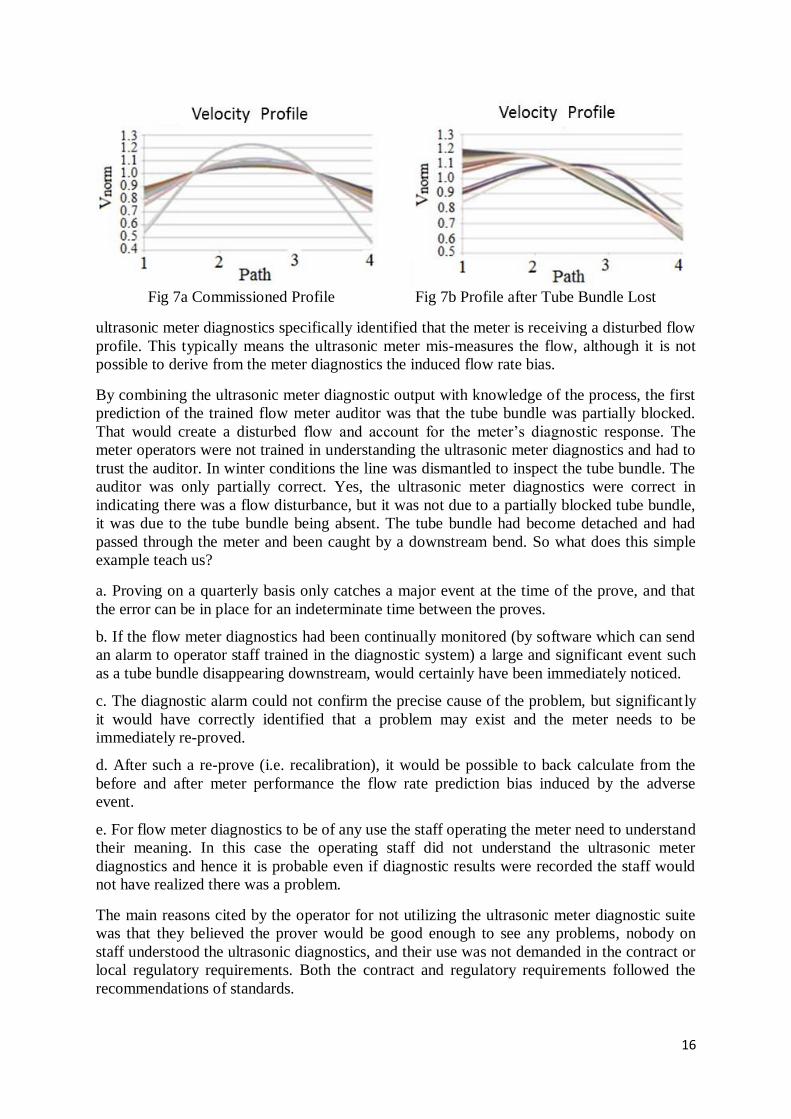
16
Fig 7a Commissioned Profile Fig 7b Profile after Tube Bundle Lost
ultrasonic meter diagnostics specifically identified that the meter is receiving a disturbed flow
profile. This typically means the ultrasonic meter mis-measures the flow, although it is not
possible to derive from the meter diagnostics the induced flow rate bias.
By combining the ultrasonic meter diagnostic output with knowledge of the process, the first
prediction of the trained flow meter auditor was that the tube bundle was partially blocked.
That would create a disturbed flow and account for the meter’s diagnostic response. The
meter operators were not trained in understanding the ultrasonic meter diagnostics and had to
trust the auditor. In winter conditions the line was dismantled to inspect the tube bundle. The
auditor was only partially correct. Yes, the ultrasonic meter diagnostics were correct in
indicating there was a flow disturbance, but it was not due to a partially blocked tube bundle,
it was due to the tube bundle being absent. The tube bundle had become detached and had
passed through the meter and been caught by a downstream bend. So what does this simple
example teach us?
a. Proving on a quarterly basis only catches a major event at the time of the prove, and that
the error can be in place for an indeterminate time between the proves.
b. If the flow meter diagnostics had been continually monitored (by software which can send
an alarm to operator staff trained in the diagnostic system) a large and significant event such
as a tube bundle disappearing downstream, would certainly have been immediately noticed.
c. The diagnostic alarm could not confirm the precise cause of the problem, but significant ly
it would have correctly identified that a problem may exist and the meter needs to be
immediately re-proved.
d. After such a re-prove (i.e. recalibration), it would be possible to back calculate from the
before and after meter performance the flow rate prediction bias induced by the adverse
event.
e. For flow meter diagnostics to be of any use the staff operating the meter need to understand
their meaning. In this case the operating staff did not understand the ultrasonic meter
diagnostics and hence it is probable even if diagnostic results were recorded the staff would
not have realized there was a problem.
The main reasons cited by the operator for not utilizing the ultrasonic meter diagnostic suite
was that they believed the prover would be good enough to see any problems, nobody on
staff understood the ultrasonic diagnostics, and their use was not demanded in the contract or
local regulatory requirements. Both the contract and regulatory requirements followed the
recommendations of standards.

17
5d. An Orifice Meter Integral Diagnostic Example – Contamination
Orifice meters have been used widely throughout industry for a century. As with liquid flow
meter proving, it has long been known there should be site checks for gas orifice meters,
particularly for custody transfer applications. An early form of orifice meter diagnosis was
the creation of the orifice plate fitting which allowed the plate to be periodically removed and
inspected. Instrumentation could be periodically re-calibrated. These processes gave a good
indication of the meter performance. However, as with liquid provers, such techniques are
“spot checks” that leave the operator blind to problems that occur between such checks.
Again, what was needed were internal meter diagnostics that could continually monitor the
orifice meter. Such techniques now exist. DP transmitters (a vital sub-system of DP meters)
now have internal diagnostics that monitor their health. More recently a DP meter diagnostic
system based on pressure field monitoring has been developed. This case study uses the
orifice meter pressure field monitoring diagnostics (and was previously presented at the
North Sea Flow Measurement workshop by Rabone [6] in 2012)
Fig 8. Orifice Meter Run Fig 9. Plate Inspection - Contamination.
Fig 10. Orifice Meter Diagnostic Display Screenshot.
A 6” orifice meter was audited. The DP meter pressure field monitoring diagnostic system
‘Prognosis’ was installed as the initial part of the audit. Figure 8 shows the meter run prior to
the installation of the diagnostic system. Figure 10 shows a screenshot from the diagnostic
display. The diagnostic result immediately showed that the meter had a problem (i.e. note the
two points outside the box in Figure 10). Like the ultrasonic meter diagnostic suite, this DP
meter diagnostic suite cannot always tell the operator what the specific problem is, but from
the diagnostic output pattern coupled with operator process knowledge the problem can be

18
identified. The particular diagnostic pattern was indicative of a few potential problems. This
short list included possible contamination of the meter run. It was known from process
knowledge that contamination was a possibility. The meter was subsequently inspected.
Figure 9 shows a photograph of the plate. The plate was contaminated. A subsequent
borescope investigation of the meter run showed meter run contamination.
Contamination causes all flow meters to mis-measure the flow. The operator was unaware
that the meter flow rate output was in error prior to the installation of the diagnostic system
and the subsequent audit. If the operator had used such a diagnostic system from the outset,
and been trained to understand the diagnostic display, they would not have been blind to the
developing problem and would have known to intervene long before the problem was
accidentally found by a scheduled audit.
This is another example of the problem being inherently a flow condition problem (i.e.
contaminate in the flow) but this problem then causing the meter to mechanically have a
problem (i.e. contamination build up in the meter).
5e. An Orifice Meter Integral Diagnostic Example – DP Reading Error
Three 12” orifice meters are used to meter gas being supplied to a power station (see Rabone
[9]). The operator installed the pressure field monitoring diagnostic system “Prognosis”. On
commission of the meters (with the diagnostic system) two of the three orifice meter
diagnostic systems gave no diagnostic alarm. That is, for these two meters the seven DP
meter diagnostic checks found no issues. The results are represented in the diagnostic display
as seven co-ordinates (giving four points) on a graph. If the points are inside a box there is no
alarm. The meters with no problem showed a diagnostic result like that shown in Figure 11.
However, one of the three meters showed the diagnostic result reproduced in Figure 12. One
of the diagnostic checks is indicating a meter problem.
Fig 11. Normal Operation Result. Fig 12. Abnormal Operation Diagnostic Result.
This DP meter diagnostic pattern shown in Figure 12 specifically indicates that one of the DP
readings is erroneous. The operator checked the DP transmitters and stated that they looked
okay. The DP transmitter internal diagnostics showed no problem. However, the diagnostics
DP integrity check is an absolute diagnostic check, based on the 1st law of thermodynamics.
Hence, a DP reading was wrong, regardless of the initial maintenance check suggesting
otherwise. The operator understood this, and on second review found a minor scaling issue in
the flow computer that was causing an incorrect conversion of the DP signal. The primary DP
reading used to measure the flow rate was being over-predicted by +1.6%. The associated
flow rate prediction bias was +0.8%.
This case study is an example of where the problem was not induced by flow conditions but
by the metering equipment. In this case the diagnostics were very close to identifying the
precise problem and no process knowledge was required.

19
This example shows that internal meter diagnostic suites are sometimes more useful than due
diligence, spot checks, or check metering by external systems. For example, if this orifice
meter had an ultrasonic meter in series as a check meter the problem may still not have been
seen. API 14.3 estimates the typical uncertainty of an orifice meter at about 0.7%. ISO
17089-1 states the typical uncertainty of a custody transfer ultrasonic meter as 0.7%. So the
root mean sum of these meters uncertainties is approximately 1%. That is, these meters in
series could only indicate a metering problem when the discrepancy between them is > 1%.
The discrepancy here was ‘only’ +0.8%, below the threshold of many check metering
systems, but high enough to cause significant financial mis-measurement.
Even after maintenance the initial response of the competent maintenance crew carrying out
standard instrument checks was to say the DP readings were okay. It took their trust in the
meter internal diagnostic system to make them look again, closer. Only due to their trust in
the meter’s internal diagnostic system did they save themselves from mis-measuring the flow.
5f A Venturi Meter Diagnostic Example – Showing the Calibration Report to be Wrong
An 8”, 0.4 beta Venturi meter (Fig 13), was calibrated with natural gas flow. The calibration
included setting the baseline of the pressure field monitoring diagnostic system. After
multiple witnesses had confirmed the calibration was correct and complete, the standard Cd
vs. Re calibration report was written and released. No comments or issues were raised by any
party on the integrity of the calibration report.
Fig 13. 8”, 0.4 Beta Ratio Venturi meter Under Calibration
At a later diagnostic system FAT, the diagnostic system software was checked by entering
the meter geometry, calibration diagnostic parameters, and sample data from the calibration
report. As the diagnostic system had been calibrated to this very data the diagnostic system
should by default show no problem. However, the diagnostic system signaled a malfunction.
Figure 14 shows the resulting diagnostic plot.
There is a short list of possible malfunctions that cause such a Venturi meter pressure field
monitoring diagnostic pattern. The first on the list was incorrect geometry, either too small an
inlet diameter or too large a throat diameter. The geometry in the calibration report was
therefore compared to the actual meter geometry from the manufacturer. The true 8”, 0.4 beta
Venturi meter throat diameter was found to be 73.02mm. The meter had been calibrated with
the correct geometry. However, the calibration report erroneous stated the throat diameter of
73.62mm. The diagnostic system had subsequently been given the wrong geometry read from
the report. The flow computer for this meter in service would most likely have been given the
wrong geometry from the same report. The effect on the meter flow rate prediction would
have been to over-read the flow. The Venturi meter internal diagnostic system saw the
problem before mis-measurement occurred. Conversely, standard practice of due diligence by

20
Fig 14. Diagnostic Result During Factory Acceptance Test of Diagnostic System
multiple experienced competent witnesses checking the report failed to see the problem.
Without diagnostics the problem may have permanently would have gone unnoticed. Further
details of this example are discussed by Rabone [6].
This case study is an example of where the problem was not induced by flow conditions but
by the metering equipment (and more precisely human error). In this case the diagnostics
were very close to identifying the precise problem and no process knowledge was required.
This example shows that internal meter diagnostic suites are sometimes more useful than due
diligence. No matter how diligent operators are they are human and mistakes can creep
through. Automated checks from diagnostic systems do not make such errors.
5g A Coriolis Meter Diagnostic Example – Gas in the Liquid Flow
Coriolis meters have an established diagnostic suite. The Coriolis meter manufacturers talk of
in-situ verification by using the Coriolis meter internal meter checks (i.e. diagnostic suit).
For liquid flow particularly, the Coriolis meter’s density output can be monitored for
fluctuations and compared to the expected liquid density. As the liquid density is usually
know by the operator to a high degree of certainty, and the Coriolis meter liquid density
measurement has a low uncertainty, any significant difference between the values suggests a
problem exists7. (This is another example of how many diagnostics rely on operator process
knowledge.)
The measured stiffness of Coriolis meter vibrating tubes in operation can be compared to the
original factory baseline value. Changes in stiffness can represent corrosion, erosion, or
deformation of the tubes.
Another main Coriolis meter diagnostic check is that of monitoring the drive gain. Drive
Gain is a measure of the amount of power the transmitter requires to keep the tubes
resonating. Drive gain is stated as a percentage of the total power available to the transmitter.
For given fluid properties, it takes a set amount of power to keep the tubes resonating. If the
fluid consistency is constant, and the flow is constant, the drive gain should be constant.
Changes in fluid density and / or two-phase flow cause shifts in drive gain. Therefore, drive
gain can be used to monitor fluid consistency. Shifts in drive gain can indicate qualitative
shifts in fluid properties. However, fluid properties are not the only factor that influences
drive gain. Drive gain is also affected by the physical condition of the vibrating tubes. If these
tubes are damaged or changed (e.g. by erosion, corrosion, overpressure, hydraulic shock,
7 Liquid Coriolis meters give low uncertainty flow density measurement. However, as moderate to low pressure
gas flow has such a small density compared to liquid densities, the gas Coriolis meter density measurement has
a much higher uncertainty. This, coupled with the fact that the independent gas density measurement uncertainty
is also higher than an independently measured liquid density uncertainty, means that this diagnostics is very
useful with liquid flow but less useful with gas flow.

21
contamination deposit etc.) the drive gain required will shift. Most damage or changes to the
vibrating tubes is non-symmetrical in nature, and this can make resonance very difficult to
attain, resulting in an unstable (or possible saturated) drive gain.
A Coriolis meter drive gain value is application dependent. Stable flow conditions produce a
stable drive gain. If the drive gain has significant fluctuations, say 10% or more, the
measurement might be still be acceptable, but the meter uncertainty may higher than the
specified uncertainty rating. A higher drive gain indicates more energy required to overcome
higher damping of the vibrating tubes. Gas entrained in liquid flow is one adverse operating
condition (amongst others) that induces higher tube damping.
Fig 15. Coriolis Diagnostic Showing Gas in the Liquid Flow
Figure 15 shows sample trending data from a liquid Coriolis meter. The primary meter
outputs of mass flow rate and density measurement are shown along with the drive gain, all
plotted against time. The initial conditions are steady. The initial conditions give a density
measurement that can be compared to process knowledge, i.e. an external density
measurement, and shown to be correct, giving confidence in the meters operation and mass
flow prediction. The drive gain is stable (i.e. has a small standard deviation) and low, as
expected. Then trending shows all three outputs to significantly change together. It is
suspected that this particular combination of diagnostic results indicates the liquid flow
becoming a two-phase flow. The mass flow rate and density predictions begin to drop as the
drive gain magnitude and standard deviation significantly increases. Then these effects
magnify. This is suspected to be a two-phase flow, i.e. gas passing. The density measurement
and mass flow rate prediction drop as would be expected with gas in a liquid flow, although
these meter cannot be expected to be the average actual flow values! Then, the meter outputs
return to their original values, indicative of the gas having passed, and the flow being single
phase liquid flow again.
The transient nature of the response (shown by trending) indicates that the issue is likely a
flow condition issue as mechanical problems do not tend to fix themselves. Although
‘absolute’ diagnostic checks are generally more powerful than relative / trending diagnostics
(as they are less subjective), this example shows that relative / trending diagnostics have an
Gas Passing

22
important contribution to make to diagnostic suites. As the trending allows mechanical
problems to be considered unlikely the result strongly suggests two-phase flow.
The precise effect of two-phase flow on any Coriolis meter is design, fluid property and flow
condition dependent. Drive gain is a good qualitative indicator that something has changed.
However, Coriolis meter drive gain is influenced in complex interactive ways by various
considerations and therefore it cannot offer any detail quantitative information.
This case study is an example of where the problem was induced by flow conditions and not
the metering equipment. The flow conditions did not damage the meter in any way.
6. Existing Authoritative Flow Meter Documentation - Comments on Flow Meter Diagnostics
There are limited comments in the authoritative literature promoting the use of flow meter
diagnostics. However, it is interesting to note that although these documents support the use
of meter diagnostics they tend to stop some way short of demanding their use, while they
demand adherence to other good meter practice. As we will see below (in quotes from sample
text) the organization and committees that wrote these authoritative documents clearly
understand that the use of internal flow meter diagnostic systems are as important as adhering
to good standard meter practice if mis-measurement is to be avoided. However, these
documents (which at least address diagnostics – many authoritative documents don’t) only
promote diagnostic use with words like ‘should’ and ‘can’, while other good practice is
described with language like ‘shall’ and ‘must’. In the following examples the bold
underlined italics are added by these authors to highlight the optional aspect of the
suggestions.
DECC “Guidance Notes for Petroleum Measurement, Issue 8”, released in 2012
For DP meters in section 6.7.7 DECC states:
“The use of diagnostic systems based on the use of an additional measurement of the fully-recovered pressure is gradually becoming well established. Experience has shown that this technique enables the Operator to detect significant deviations from normal operating conditions as they arise. It may therefore form the basis of a condition-based maintenance strategy, as described in Chapter 4 of these Guidelines; DECC has already agreed to the adoption of such a strategy at a major UK terminal. Operators of new developments are strongly encouraged to consider the adoption of such a strategy. The provision of an extra pressure tapping costs relatively little at the design and manufacturing stages, but may
permit significant operational savings to be made during the life of the field.”
For ultrasonic meters (called “USFMs”) in section 6.8.12 DECC states:
“…condition-based maintenance (CBM) of gas USFMs may be the most appropriate
strategy in many instances.”
Therefore diagnostic use is optional, while other good practice is not. DECC explain that by
2012 they had agreed to a condition based maintenance strategy on one orifice meter station
and one ultrasonic meter station based on these meters respective internal meter diagnostics.
The Alberta Energy Regulator’s Directive 17, “Measurement Requirements for Oil & Gas
Operations”, released 2015
In section 2.5.2 (on gas meter internal inspection) Canada’s Directive 17 states an exception
(#9) to the demanded routine scheduled maintenance / re-calibration period for a gas meter:

23
“Internal metering diagnostics may be used to determine if the structural integrity of the
primary measurement element is within acceptable operating parameters and checked at the same required intervals as an internal inspection. Then internal inspection is not required
until an alarm or error is generated by the device or as recommended by the manufacturer.”
In section 2.6 (on liquid meters) Directive 17 repeats this statement. In section 12.3 (on
production measurement) Directive 17 states:
“Verification can be achieved using…. internal diagnostics of the measurement device if
present to check the structural integrity of the primary measurement element”
Again, diagnostic use is optional while other good practice is not.
ISO 17089-1 “Measurement of Fluid Flow in Closed Conduits – Ultrasonic Meters for Gas –
Part 1: Meters for Custody Transfer and Allocation Measurement”, 1st Edition.
This ISO standard discusses the use of the meter’s diagnostics in considerably more detail
than most flow meter standards. However, again it is curious to note how much the authors
clearly understand the importance of the internal meter diagnostics and yet hold back from
demanding their use. The language surrounding the diagnostic system is promotional,
whereas the language discussing operation of the primary meter system itself is authoritative.
The text repeatedly alludes to the fact that if the operator is to achieve the minimum flow rate
prediction uncertainty technically achievable he needs to use the meter’s internal diagnostics.
But the text does not take that leap to state this fact outright. Sample text from ISO 17089:
In the scope:
“This part of ISO 17089 specifies requirements and recommendations for ultrasonic gas flowmeters (USMs)…”
That is, in the scope, the scene is set where aspects of use of the ultrasonic meter will be
requirements of the standard, i.e. instructions to the operator, and other aspects of use of the
ultrasonic meter are only recommendations, i.e. suggestions as a good idea. The operators
are free to ignore those recommendations and still claim the meter installation is compliant
with this standard. It is notable that virtually all comments on the universally accepted
ultrasonic meter diagnostics system are all firmly in the recommendation camp, where they
are free to be ignored. For example:
In the Introduction:
“USMs can deliver extended diagnostic information through which it may be possible to
demonstrate the functionality of an USM.” And,
“Due to the extended diagnostic capabilities, this part of ISO 17089 advocates the addition and use of automated diagnostics instead of labour-intensive quality checks.”
In Section 7.4.1:
“… the theoretical speed of sound (TSOS) can be compared with the measured value [MSOS]. The SOS is an excellent tool...”
In Section 7.4.1.1:
“If both MSOS and TSOS are available, they may be compared …”
24
In Section 7.4.1.1:
“Although the SOS is one of the most important parameters to be used in verification, there are many more parameters which may be monitored in order to ensure optimum performance…”
Again, diagnostic use is optional while other good practice is not. This standards document is
one of the best available standards for promoting and discussing the benefits internal flow
meter diagnostics. However, even here, virtually nowhere does this ISO text demand the use
of these diagnostics. Some the wording is deliberately weak. Even if use of the meter
diagnostics are not to be demanded, wordage like “can” and “may” is significantly weaker
than, “should” and “it is highly recommended”.
Why is this? After years of research, development and field experience are the subject
specialists who write flow meter standards really still unsure if such internal meter
diagnostics can demonstrate flow meter functionality!? That is what such text infers.
However, these authors think not. There is now abundant evidence over many years, from
multiple manufacturers, laboratory and field results from multiple independent parties
(including users), to show that flow meter internal diagnostics have come of age. The authors
of the standards are the same individuals that independently publish results for their
respective companies showing flow meter internal diagnostics to be invaluable.
Perhaps this is a legacy issue, with diagnostic suites tending to be newer attributes to the
original meter designs. The standards committees (even those working on current draft
standards) are notoriously conservative and still baulk at demanding adherence to even the
most established meter diagnostics. No flow meter standards committee working on any flow
meter technology as yet has stepped up and made the not so bold step of stating what is now
surely self-evident. That is, flow meter diagnostics have come of age and now should be an
integral part of flow meter best practice. There is no real technical argument against using
modern flow meter internal diagnostics. So surely it is time standards said as much?
Flow meter diagnostics can now be made integral to the meters such that future generations
will automatically see them as integrated vital parts of the core meter system. Today, there is
still a lingering historic perception that somehow these diagnostic systems are superfluous,
not essential to guarantee the correct operation of the meter, but it is fast becoming a false
perception. Technology has moved on, and such an obviously beneficial advance cannot, and
will not be ignored indefinitely. Sooner rather then later, these diagnostic systems will
become engrained in the operators mind as essential to professional flow meter operation
conduct, and they will be automatically used. The sooner the flow meter standards board
grasp this reality and make authoritarian demands about the use of diagnostics the quicker
this change in mind set and practice will occur, to the benefit of all industry.
7. Comments
Under ideal (calibration) flow conditions many modern flow meter types have low
uncertainty, and their internal diagnostic systems are capable of seeing many common
problems before significant flow rate prediction errors occur. As long as the operator applies
the meter’s internal diagnostics flow metering has never been so assured. Time and time
again internal flow meter diagnostics have repeatedly proven themselves invaluable. They are
vital to gain maximum assurance of low uncertainty flow metering. However, the majority of
industry still does not understand or use these internal meter diagnostics. Industry still tends
to run the majority of flow meters “blind”.

25
Various common flow meter designs now have good diagnostic capabilities that are very
capable at identifying when the meter has malfunctioned. They often cannot state what the
problem is, or the size of the flow prediction bias. However, the diagnostic output of many
meters is now good enough that when the pattern of the diagnostic suite output is cross
referenced with process knowledge a competent operator can often deduce the specific flow
condition or meter problem. (Without the diagnostics a competent operator is often
effectively blind, even with good process knowledge, and often cannot even deduce the meter
is in error.)
The authors have not discussed in the paper some further advantages of the use of diagnostics
that are worthy of mention. The active use and collection of diagnostic data allows an auditor
to be able to review the historical performance of metering systems, giving a greater degree
of confidence in the operation. Further, the active use of diagnostics helps streamline the
maintenance and efficient operation of metering, which generally contributes towards the
correct operation, and sustainability of a good uncertainty of measurement.
These diagnostic advances represent a significant improvement in flow meter technology
over the last two decades. However, many operator staff do not understand the physical
principles of these various flow meter internal diagnostic suites, and they do not
understanding the need, or the implications of using these diagnostics. There is a lack of
expertise in interpreting these diagnostics. Even when some do understand the physical
principles, it can still be difficult to understand the various complex ways in which the
different manufacturers present their diagnostic results. These factors all contribute to the
poor uptake of diagnostic use. All these issues are consequences of the core issue: the lack of
standardization.
Without standardization there is no political pressure for operators to even use flow meter
diagnostics, never mind for these issues to be resolved. With standardization, use of internal
meter diagnostics will become included in contracts and fiscal regulators will then enforce
their use. This in turn will drive the permeation of flow meter internal diagnostics into the
main stream of industrial flow metering to the long term benefit of industry and society.
Flow meter internal diagnostics are one of the most guaranteed ways of knowing when a
meter has malfunctioned. (Some traditional external diagnostic methods have significant
limitations.) Internal diagnostic systems of various meters (and sub-systems of meters) are
now mature, and their inclusion in the relevant standards is due. There are two types of
comment in industry standards, requirements and recommendations. To comply with a
standard an operator must follow the requirements, but is not obliged to follow the
recommendations. Therefore, although it is preferable for diagnostics to be recommended in a
standard rather than for them to be not discussed at all, for full impact it is preferable that
internal flow meter diagnostics should be stated as a requirement in standards. Then their
subsequent inclusion in contracts will slowly dismantle the present remaining political
obstacles.
Inclusion in standards, and therefore contracts, would inevitably result in a significant
increase in use. This in turn would offer meter manufacturers commercial incentive to put
more resources into further developing flow meter diagnostics. It would also produce more
scrutiny of the various meter manufacturer’s diagnostic claims and in turn control their
claims. This increase in use would focus the industry into developing better, clearer, simpler
more intuitive user friendly ways of displaying diagnostic outputs. Such a development
would inherently make flow meter diagnostics more accessible and understandable to more

26
meter operators. Standardization of flow meter internal diagnostics and their displays would
also facilitate an increase in formal meter operator training which in turn would further
increase their use.
The authors can only think of a couple of minor potential disadvantages. The first is that as a
diagnostic system is inherently imperfect, of course there will be occasions where it could
give a false alarm (i.e. “cry wolf”). This is inevitable. However, these cases would be
relatively few, especially if the operator is initially pragmatic about choosing the sensitivity
settings of the diagnostic output until he has experience with the system. The second is the
perceived cost of change. Diagnostic systems can add cost to a metering system in some
cases via capital cost, and in most cases due to the required training and duties of the
operators to monitor these diagnostics. However, these capital and training costs are typically
a modest investment, in the hydrocarbon industry they are small relative to the potential
savings by avoiding mis-measurement. Furthermore, nobody would expect an operator to
continually monitor a diagnostic system. Modern diagnostic systems run in the background
unmonitored until the operator chooses to periodically look, or they are alerted of a problem
by the diagnostic system. Therefore, these few claimed disadvantages are more false
perception than reality.
Such is the benefit that modern flow meter diagnostics bring to industry that it is obviously
only a matter of time (although a rather long time) before they are universally adopted. In the
long run operators will come to wonder how they managed without them. The sooner their
use permeates throughout industry the better for industry. A catalyst to accelerating their use
is their inclusion in the industry standards as required practice. This development would help
the conservative hydrocarbon industry depart from its habit of using 20th Century metering
methods and bring its metering methods into the 21st Century.
References
1. AGA Report No. 9, “Measurement of Gas by Multipath Ultrasonic Meters”, 2nd Ed. April
2007.
2. ISO 17089 – 1, “Measurement of Fluid Flow in Closed Conduits – Ultrasonic Meters for
gas, Part 1 – Measurement for Custody Transfer & Allocation Measurement ” 1st Ed. 2010.
3. Lansing J. “Basics of Gas Ultrasonic Meter Diagnostics”, International School of
Hydrocarbon Measurement, OK, USA, Paper / Class # 1400, May 2013.
4. Lansing J. “Advanced Gas Ultrasonic Meter Diagnostics”, International School of
Hydrocarbon Measurement, OK, USA, Paper / Class # 1410, May 2013.
5. Skelton M. et al, “Diagnostics for Large High Volume Flow Orifice Plate Meters”, North
Sea Flow Measurement Workshop, October 2010,UK.
6. Rabone J. et al, “DP Meter Diagnostic Systems – Operator Experience”, North Sea Flow
Measurement Workshop, October 2012, UK.
7. Wehr D. “Detection of Plugged Impulse Lines Using Statistical Process Monitoring
Technology”, Emerson Process Management, Rosemount Inc., White Paper, website:
http://www2.emersonprocess.com/en-us/brands/rosemount/pressure/pressure-
transmitters/3051s-advanced-diagnostics/Pages/index.aspx
8. Wehr D. “Wet Gas Diagnostics with Intelligent Differential Pressure Transmitter”,
Emerson Process Management, Rosemount Inc., White Paper, website:
http://www2.emersonprocess.com/en-us/brands/rosemount/pressure/pressure-
transmitters/3051s-advanced-diagnostics/Pages/index.aspx
9. Rabone J. et al “DP Meter Diagnostics – Multiple Field Results with new Turbulence
Diagnostic Techniques”,North Sea Flow Measurement Workshop, October 2015, Norway.
Copyright © 2022 FDOKUMEN