
Smart Water Metering & Non-Revenue Water Reduction
51
Digitalisation in the Water Sector Smart Water Metering & Non-Revenue Water Reduction 28 October 2021 Kevin Murray (Irish Water) European Investment Bank
-
Upload
khangminh22 -
Category
Documents
-
view
1 -
download
0
Transcript of Smart Water Metering & Non-Revenue Water Reduction

Digitalisation in the Water Sector
Smart Water Metering &
Non-Revenue Water Reduction
28 October 2021
Kevin Murray (Irish Water)
European Investment Bank

Background – Water Services & Metering in Ireland in 2012
Smarter Metering – The Irish Water Domestic Metering Programme (2013-17)
Added Value – Smart opportunities & Leakage Management
Next Generation – Smart Metering and Smart Network Technologies
Future Challenges – Smart Networks, DWD & Sustainability
| Footer2
Content

1 Background

4
Management of
national water assets
Investment and
planningManaging capital
projects
Maintenance of
the water
system
Customer care
and billing
Irish Water

| Footer5
Irish Water – Asset Base

What was the driver for metering?
• EU/IMF
– EU Water Framework Directive (User Pays Principles)
– Introduce domestic water charges by “end of the bail out programme”
• Programme for Government
– Domestic Water Charges
– Based on Metered Consumption
– Pay directly for water services
– Customers can manage their bills if metered
– Fairer way to pay
• Newly conceived Irish Water given responsibility for a domestic metering
programme in April 2012
• Budget €539million (ex. VAT) for phase 1 programme of works of 1.05
million meters by end of 2016.
6

Water Metering in Ireland (2012)
• Domestic Sector– No measured revenue
– Some meters for water conservation
– UFW reliant on estimates
• Non-Domestic Sector– Commercial
– Institutional
– Agricultural
– Over 200,000 non-domestic customers
• Group Water Schemes– Consequence of upgrades
– Response to leakage
7
2 Smarter Metering

Metering Programme
9
Scope – Domestic
Metering
Target of
27,000 meters
installed safely
per month (on
average)
Meters to be
installed outside
the homeowners
property below
ground
Target of 50%
installed before
billing started

Boundary Boxes
• Two Framework Suppliers– Fusion and Mains to Meters
• One Manufacturer (Talis)– Talbot Matrix and Ebco brands
• Features– Manifold; Stop Tap; NRV; Watertight;
– 600mm deep; Telescopic
• Standards– BS5834:2 & WIS 4-37-01
• Covers:– Grade B Metal Option
– Grade C Plastic Option• IW Grade C covers have > 2t load capacity;
• Min Grade C requirement is 0.5 t load capacity.
10

Water Meters
• Two meter types selected
– Diehl Sappel Altair Composite Concentric
• DN 15 & DN20
• Radio Unit – Izar 868 IW (868 MHz) one way
– Itron Aquadis Concentric
• DN15
• Everblu cyble (433 MHz) two way

Radio Units
• “Read” from spinning metal target on top of meter– Each rotation (pulse) = 1 litre
• Store historic reads and alarms
• Low Power Radio Units
• 433 MHz or 868 MHz Frequency
• Battery = 3.4v– Same as iPhone but lasts 12 years without
recharging.
• 1-way and 2-way communication– Data Packages
• “Potted”– Water Proof to IP68
12

Meter Reading Technology
Irish Water sends the meter read
schedule to Data Mgmt. Service
Provider via SFTP to their system -
Temetra
Schedules auto allocated to readers via
Temetra to their handheld device
Meters are read wirelessly using AMR with meter reader driving by.
The reads are stored in handheld
devices
Reads uploaded to Irish Water
system who use the reads to produce bills
Reads are validated and
sent them back into Irish Water
via SFTP
Reads are sent back through handheld to
Temetra system
Data
Management
Service
Provider

Metering Mobilisation & Workflow
- Underpinned by IT Systems
•
Plan Work (GIS Polygons )
Generate Work Packages in Maximo
Monitor Schedulein Click
Company
Setup
Recruitment Procurement of
Regional
Contractors
Training &
Policies
Local Authority
Communications
Customer
CommunicationsMobilisation and
Deployment
Dispatch work to the Field
Syclo
o Site Set-up
o Safety Assessments
o Site Inductions
Execute Work
Work Complete (Data Capture & prove
supply)
Completion Data & Timestamp updated in
Maximo
Payments processed in
Oracle
Reports
Plan work

Public Challenge
15

Domestic Water Metering Programme
• Over 894,000 domestic meters installed between 2013 and 2017;
• 100% Drive-by AMR technology.– RF Clip-on Radios
– Diehl Meters (1-way)
– Itron Meters (2-way)
– Temetra Reading System
| Footer16
Output Data:
• Construction:– Pipe depth & material
– Connection location
• Usage Data:– Current Reading
– Month-end Reads (3)
• Alarms:– Continuous Flow
– Backflow
– Low Battery
– Tamper
• Skip Codes:– Manually collected

3 Added Value

3a Consumption Data

Outputs
• Construction:– Pipe depth & material
– Connection location
• Usage Data:– Current Reading
– Month-end Reads (3)
• Alarms:– Continuous Flow
– Backflow
– Low Battery
– Tamper
• Skip Codes:– Manually collected
| Footer19

• Quarterly Reading Output:– Jan/Feb 2018 (10 vans)
– Attempted to read 884,098 domestic meters;
– Wireless reading from 869,280 meters (98.3%)
– Drive-by = 97.0%; Walk-by = 1.3%;
– Manual Reads = 4,056 (0.5%)
– Skip Codes = 10,759 (1.2%)• Included > 1,000 unread due to adverse weather.
– Continuous Flow Alarms = 65,553 (7.4%)• Top 10 average equivalent of 20 houses each;
• Top 100 average equivalent of 12.5 houses each.
| Footer20
Reading Performance

2015 Consumption per Property (l/prop/day)
Region +/- CFA Yearly Mean Peak
Month
Min
Month
National Gross 364 386 357
(Excl CFA) 248 259 240
Eastern Gross 364 389 358
(Excl CFA) 269 282 263
Southern Gross 374 401 360
(Excl CFA) 227 236 221
Nor/Western Gross 337 356 336
(Excl CFA) 194 196 206
21
NB: Yearly Mean is the applicable figure for leakage calculation.
Peak month is more appropriate to strategic storage and resilience design.

Domestic Use for Leakage Calculation
• Primary Data:
• 365 litres/prop/day
– Includes properties not
permanently occupied
22
• Secondary Data:
• 130 litres/hd/day– Registered Occupied
– Apply only with 2.69-person occupancy.
• 105 litres/hd/day– CFA properties
excluded
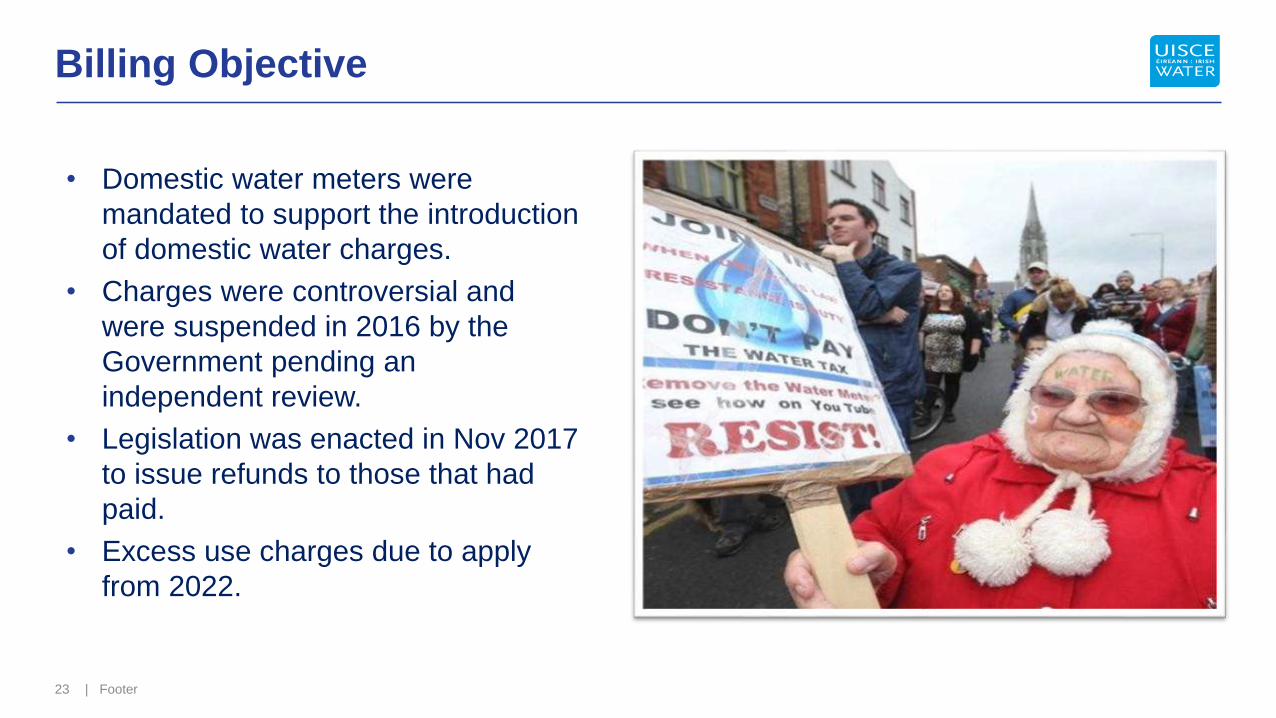
Billing Objective
• Domestic water meters were
mandated to support the introduction
of domestic water charges.
• Charges were controversial and
were suspended in 2016 by the
Government pending an
independent review.
• Legislation was enacted in Nov 2017
to issue refunds to those that had
paid.
• Excess use charges due to apply
from 2022.
| Footer23

Spin-Off Programmes
• First Fix Free Programme– Up to Q2/2017
– 41,431 leak investigations
– 36,524 customer repairs
– 8,097 repairs by IW
• Lead Replacement Programme– 36,000 lead services identified.
• Non-return Valve Replacement– Backflow alarms led to replacement
of NRV’s.
| Footer24
3b Leakage Reduction

Where we started from
No national
approach to leakage
49% Leakage
nationally
(*estimated 2014)
Significant
underinvestment over
many decades. No
dedicated national budget
Broken bulk meters
& missing signals.
DMAs not working
No domestic meters –
no accurate
consumption data
No single view of
leakage. No Leakage
Management System

National Leakage Reduction Programme
27
Find and Fix
Pressure Management
First Fix Free Scheme
Mains Rehabilitation
Service Work (Lead, BYS)
Metering
DMA Establishment
Leakage
Reduction
Programme
2017 – 2021 Plans
Reduction of leakage
from 47% in 2017 to
38% by 2021
Find and repair leaks
on public network
Over €500m to replace
and repair leaking
pipes
To save 166 million
litres of water per day

Achievements to date (2020)
28 | Footer
Private side total leakage savings 138.3 ML/day
Public side total leakage savings 103.5 ML/day
Leakage Awareness Campaign
5,531 backyard services replaced
21,288 public side lead service connections replaced
607km of water mains laid or rehabilitated
Branded Site Signage
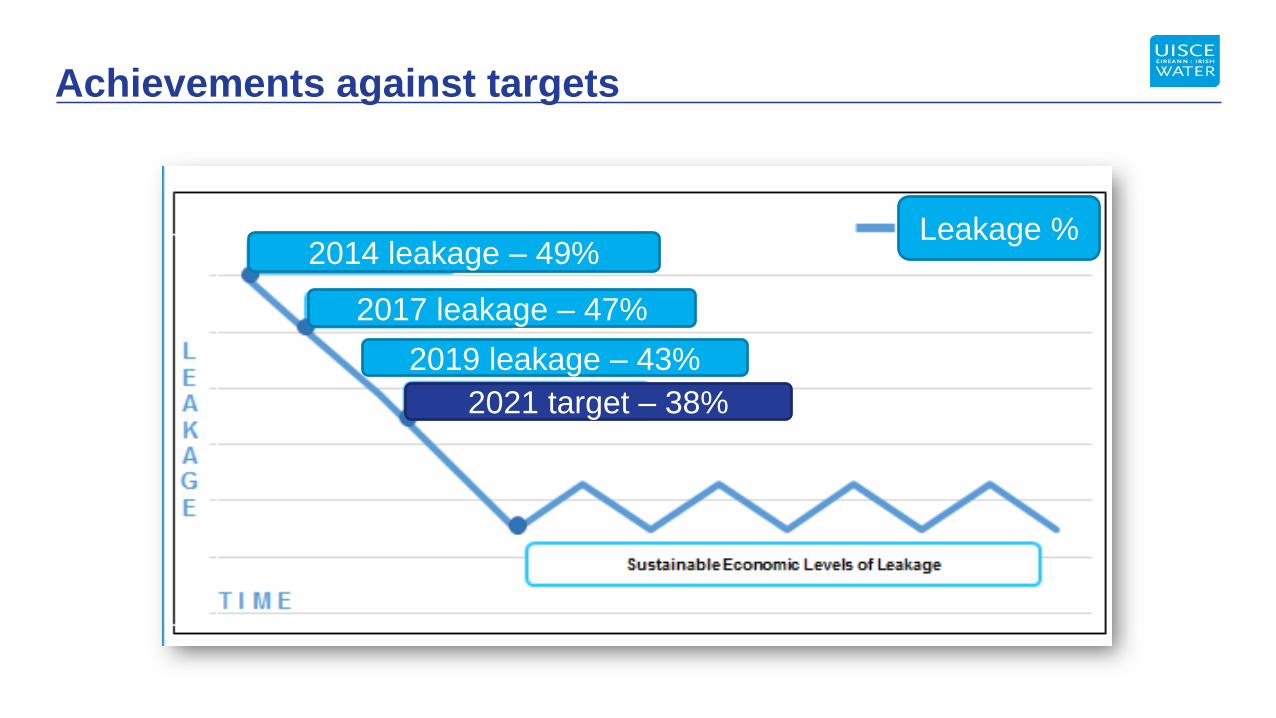
Achievements against targets
2014 leakage – 49%
2017 leakage – 47%
2021 target – 38%
Leakage %
2019 leakage – 43%

Beast from the East & Storm Emma
• Ice & Snow event:– 28th Feb - 4th March 2018
– Bursts & Water Outages
– Supply restrictions in Dublin;
• Meter Reading– Vans deployed 5th March
– Quick results (6th March)
– First batch (5,500) showed leaks increased from 196 to 467 houses
– Top 20 in Dublin used 943 m3/day in 6 days since 1st March (= 3,772 houses)
– Reading continued for 2 weeks nationally
– Results fed into leak repair activities| Footer30

4 Next Generation

4a Apartment Metering Trials

Innovation: Apartment Metering Trials
• CRU (Economic Regulator) Innovation Fund
• Consortia including technology providers
• Apartment Buildings nominated by the consortia
• Pre-installation surveys and design
• Investigate installation challenges
• Fixed-radio systems and data collection solutions (GPRS, Sigfox, LORA)
• Operational phase and data analysis
• Added value services– Access to data
33

Summary
• No installation is easy; even service shafts;
• Technology works generally;
• Data transfer works on all modes;
• Bulk meter and sub-meter comparisons;
• Apartment usage data available;
– Leakage & Consumption trends
• Data presentable to management companies and occupiers
34

4b Smart Network Trial

The project is a Proof of Concept to deploy
a sample number of sensors into Irish
Water’s network to better understand the
functionality of smart networks. The project
will be deployed into a small part of a
water treatment & distribution network.
The scope of the project is to design, install
and decommission a network infrastructure
to gather data from Irish Water’s water
network and assets. The data collected will
be analyzed and visualized for Irish Water.
The primary focus of the project is on the
performance and reliability of the
communication network and the data
presentation. The sensors are of secondary
importance for this trial.
Project partners are Cisco, Connexin,
Davra & Water Control Ireland. The project
is funded through the Cisco Digitisation
Fund.
Project Summary
Smart Water Network Trial

The LoRaWAN® specification is a Low Power, Wide Area (LPWA) networking protocol designed to wirelessly connect battery operated ‘things’ to the internet in regional, national or global networks, and targets key Internet of Things (IoT) requirements such as bi-directional communication, end-to-end security, mobility and localization services.
These Gateways will be installed at high level in a WTP with installation involving a small cabinet and antenna mounting to the roof of the WTP main building.
Gateways
Gateways (LoRa)

At a Pump House, temperature, vibration, occupancy and electrical current sensors will be deployed.
These sensors can indicate patterns that might inform preventative maintenance, failure or fault.
Pump House
Sensors
DMA’s
In kiosks and chambers around the surrounding DMAs, small occupancy/temperature sensors will be attached to the door.
Pressure sensors with LoRa capability will be placed on a number of hydrants around the two DMA’s and a number of acoustic loggers will also be deployed using NB-IoT.

Data Platform

4c Smart Hydrants & Standpipes

Intelligent Hydrant Functionality• Flow and hydrant usage alerts
• Tamper alerts
• 2G/3G Communication
• Leak detection capability
• Secure and discrete
• Simple to use analytics
Smart Hydrant Technology
Real-Time Data and Alerts
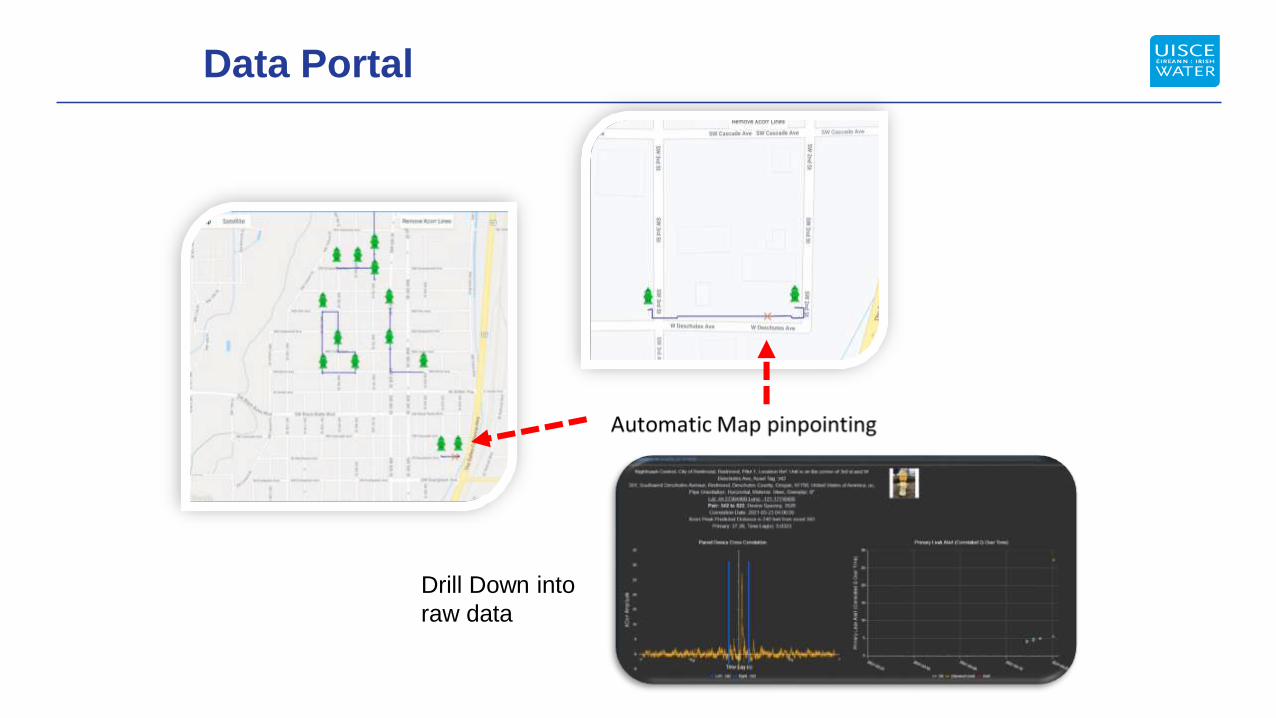
Data Portal
Drill Down into
raw data

Smart StandpipesSmart Standpipes

5 Future Challenges

• Sensors:– Small and cheap sensors
– RF radio units are cheaper and more powerful
• Communications:– Sigfox, LoRa, NB-IoT, etc
• Big Data:– More data sets with powerful
analytics
• Smart Utility Metering:– EU Smart Metering Rollout
• Risks:– Data Security & Protection
(GDPR)
– Hacking and external control
| Footer45
Challenge & Opportunity
Connection metering is no longer “dumb” or an isolated activity.
Smart connection metering is increasingly about leakage control and water network management.
Water Authorities need to plan for smart metering within a wider smart architecture.

Smart Homes & Cities
• Smart Cities Movement– IoT Architecture
– Shared Communications Infrastructure
– Integrate at the cloud
• Data Dashboards– Open source data (anonymised)
– Promote responsible behaviours
| Footer46
• Customer Information (DWD)– Leak Alarms;
– Remote controls;
– Data triggers;
– Water Quality
• Energy (Sustainability)– Hot water costs

Smart Water Networks
1. Physical Assets– Pipes, Valves, Hydrants, etc
2. Sensors– Meters, Acoustic loggers,
pressure loggers, etc
3. Data Collection– LoRa, NB-IoT, etc
4. Data Platform– Collect, store and display
data
– Dashboard
5. Data Analysis– Combine and use the data to
create insight
– Feed into actions.
| Footer47
Smart Water Networks Forum (SWAN)

1. Water companies should recognise that the value in smart water
management has the potential to revolutionise customer
engagement and experience.
2. Water companies need to understand which smart solutions are
most relevant for adoption and be included in their future plans.
Technology requires regular upgrades, replacement and
investment to prevent obsolescence.
3. Using lessons learnt and the best practices of other utilities such
as energy will help in the development of the water utility smart
network infrastructure.
4. Smart network management data can supply end-use information
needs, critical to refining demand forecasting models and
identifying efficiency opportunities.
5. Water companies must work with regulators, customers and
suppliers to ensure that any data harvesting is of positive benefit
and anonymising data provided to external contractors and
organisations.
6. Regulatory bodies and water companies need to
ensure that the broad scale introduction of smart
networks occurs with a focus on the needs of both
customers and water companies in the longer term,
public good must prevail over shorter term profits for
vendors of technology and data.
7. Providing access to live networks as proving
grounds for new technologies can have an early
influence on suppliers in developing new innovative
applicable technologies.
8. Accelerating adoption of data science in the water
sector will provide access to new information and
increase business knowledge and efficiency.
| Footer48
Smart Metering & Smart Networks for
Leakage Management UKWIR 19/WM/08/70

• A vision for smart networks starts with asset knowledge and information.– Maintain Asset Register;
– Live Asset Information;
– Insights & Analysis;
– Predictive, Proactive & Prompt;
– Evidence-based decision making.
• Smart Metering is on a journey that is giving an insight into the possible.– Automatic meter reading with alarms;
– Network benefits leveraged from data;
– Future opportunities to adopt smart technologies.
• Observations:– The connected network is emerging in practice;
– The intermediate communication options are a challenge;
– Smart water networks will integrate with wider smart infrastructure.
| Footer49
Closing Comments

51
More Information
For info or further questions on this webinar please contact the
JASPERS Networking Platform team:
JASPERS Networking Platform: www.jaspersnetwork.org
JASPERS Website: jaspers.eib.org