Advanced and Electronic Metering - Eaton
112
CA08104001E For more information, visit: www.eaton.com/consultants November 2013 Contents Advanced and Electronic Metering 3.0-1 i ii 1 2 3 4 5 6 7 8 9 10 11 12 13 14 15 16 17 18 19 20 21 Sheet 03 001 Advanced and Electronic Metering Advanced and Electronic Metering General Description . . . . . . . . . . . . . . . . . . . . . . . . . . . . . . . . . . . . . . . . . . . 3.0-2 Selection Chart . . . . . . . . . . . . . . . . . . . . . . . . . . . . . . . . . . . . . . . . . . . . . . . 3.0-3 Eaton Advanced Meters Power Xpert Meter 4000/6000/8000 Series . . . . . . . . . . . . . . . . . . . . . . 3.1-1 Power Xpert Meter 2000 Series . . . . . . . . . . . . . . . . . . . . . . . . . . . . . . . 3.1-20 Power Xpert Energy Viewer . . . . . . . . . . . . . . . . . . . . . . . . . . . . . . . . . . 3.1-31 IQ 250/260 Series . . . . . . . . . . . . . . . . . . . . . . . . . . . . . . . . . . . . . . . . . . . 3.1-32 IQ 130/140/150 Series . . . . . . . . . . . . . . . . . . . . . . . . . . . . . . . . . . . . . . . 3.1-35 Eaton Submeter Overview IQ 35M . . . . . . . . . . . . . . . . . . . . . . . . . . . . . . . . . . . . . . . . . . . . . . . . . . . 3.2-1 IQ 150S/250S . . . . . . . . . . . . . . . . . . . . . . . . . . . . . . . . . . . . . . . . . . . . . . 3.2-11 Power Xpert Multi-Point Meter . . . . . . . . . . . . . . . . . . . . . . . . . . . . . . . 3.2-16 IQ Energy Sentinel . . . . . . . . . . . . . . . . . . . . . . . . . . . . . . . . . . . . . . . . . 3.2-27 Molded-Case Circuit Breaker Power Monitoring and Metering Module (PM3) . . . . . . . . . . . . . . . . . . . . . . . . . . . . . . . . . . . . 3.2-33 Eaton Electronic Meters IQ Analyzer 6000 Series . . . . . . . . . . . . . . . . . . . . . . . . . . . . . . . . . . . . . 3.3-1 Accessories IQ Flange . . . . . . . . . . . . . . . . . . . . . . . . . . . . . . . . . . . . . . . . . . . . . . . . . 3.4-1 Panel Mounting Adapter Kit for IQ 100/200 Series and PXM 2000 Meters . . . . . . . . . . . . . . . . . . . . . . . . . . . . . . . . . . . . . 3.4-1 Sub-Network Master Local Display (SMLD) . . . . . . . . . . . . . . . . . . . . . 3.4-2 Enclosed Meters . . . . . . . . . . . . . . . . . . . . . . . . . . . . . . . . . . . . . . . . . . . 3.4-3 Current Transformers . . . . . . . . . . . . . . . . . . . . . . . . . . . . . . . . . . . . . . . 3.4-17 Specifications See Eaton’s Product Specification Guide, available on CD or on the Web. CSI Format . . . . . . . . . . . . . . . . . . . . . . . . 1995 2010 Section 16901 Section 26 27 13.11 Power Xpert Meter 4000/6000/8000 Series . . . . . . . . . . . . Paragraph 2.02.A Paragraph 2.02.A Power Xpert Meter 2000 Series . . . . . Paragraph 2.02.B Paragraph 2.02.B IQ 250/260 Series . . . . . . . . . . . . . . . . . Paragraph 2.02.E Paragraph 2.02.E IQ 100 Series . . . . . . . . . . . . . . . . . . . . . Paragraph 2.02.D Paragraph 2.02.D IQ Energy Sentinel . . . . . . . . . . . . . . . . Paragraph 2.02.G Paragraph 2.02.G IQ 35M . . . . . . . . . . . . . . . . . . . . . . . . . . Paragraph 2.02.I Paragraph 2.02.I Breaker Power Monitoring and Metering Module . . . . . . . . . . . . . . . . Paragraph 2.02.J Paragraph 2.02.J IQ 150S/250S. . . . . . . . . . . . . . . . . . . . . Paragraph 2.02K Paragraph 2.02K Power Xpert Multi-Point Meter . . . . . . Paragraph 2.02L Paragraph 2.02L Metering Products Family
-
Upload
khangminh22 -
Category
Documents
-
view
3 -
download
0
Transcript of Advanced and Electronic Metering - Eaton

CA08104001E For more information, visit:
www.eaton.com/consultants
November 2013
Contents
Advanced and Electronic Metering 3.0-1
i
ii
1
2
3
4
5
6
7
8
9
10
11
12
13
14
15
16
17
18
19
20
21
Sheet
03
001
Ad
van
ced
an
dE
lectr
on
ic M
ete
rin
g
Advanced and Electronic Metering
General Description . . . . . . . . . . . . . . . . . . . . . . . . . . . . . . . . . . . . . . . . . . .
3.0-2
Selection Chart . . . . . . . . . . . . . . . . . . . . . . . . . . . . . . . . . . . . . . . . . . . . . . .
3.0-3
Eaton Advanced Meters
Power Xpert Meter 4000/6000/8000 Series . . . . . . . . . . . . . . . . . . . . . .
3.1-1
Power Xpert Meter 2000 Series . . . . . . . . . . . . . . . . . . . . . . . . . . . . . . .
3.1-20
Power Xpert Energy Viewer . . . . . . . . . . . . . . . . . . . . . . . . . . . . . . . . . .
3.1-31
IQ 250/260 Series. . . . . . . . . . . . . . . . . . . . . . . . . . . . . . . . . . . . . . . . . . .
3.1-32
IQ 130/140/150 Series . . . . . . . . . . . . . . . . . . . . . . . . . . . . . . . . . . . . . . .
3.1-35
Eaton Submeter Overview
IQ 35M . . . . . . . . . . . . . . . . . . . . . . . . . . . . . . . . . . . . . . . . . . . . . . . . . . .
3.2-1
IQ 150S/250S . . . . . . . . . . . . . . . . . . . . . . . . . . . . . . . . . . . . . . . . . . . . . .
3.2-11
Power Xpert Multi-Point Meter . . . . . . . . . . . . . . . . . . . . . . . . . . . . . . .
3.2-16
IQ Energy Sentinel . . . . . . . . . . . . . . . . . . . . . . . . . . . . . . . . . . . . . . . . .
3.2-27
Molded-Case Circuit Breaker Power Monitoring and Metering Module (PM3) . . . . . . . . . . . . . . . . . . . . . . . . . . . . . . . . . . . .
3.2-33
Eaton Electronic Meters
IQ Analyzer 6000 Series . . . . . . . . . . . . . . . . . . . . . . . . . . . . . . . . . . . . .
3.3-1
Accessories
IQ Flange . . . . . . . . . . . . . . . . . . . . . . . . . . . . . . . . . . . . . . . . . . . . . . . . .
3.4-1
Panel Mounting Adapter Kit for IQ 100/200 Series and PXM 2000 Meters . . . . . . . . . . . . . . . . . . . . . . . . . . . . . . . . . . . . .
3.4-1
Sub-Network Master Local Display (SMLD) . . . . . . . . . . . . . . . . . . . . .
3.4-2
Enclosed Meters . . . . . . . . . . . . . . . . . . . . . . . . . . . . . . . . . . . . . . . . . . .
3.4-3
Current Transformers . . . . . . . . . . . . . . . . . . . . . . . . . . . . . . . . . . . . . . .
3.4-17
Specifications
See Eaton’s
Product Specification Guide
, available on CD or on the Web.CSI Format . . . . . . . . . . . . . . . . . . . . . . . . 1995 2010
Section 16901 Section 26 27 13.11
Power Xpert Meter 4000/6000/8000 Series . . . . . . . . . . . .
Paragraph 2.02.A Paragraph 2.02.A
Power Xpert Meter 2000 Series . . . . .
Paragraph 2.02.B Paragraph 2.02.B
IQ 250/260 Series . . . . . . . . . . . . . . . . .
Paragraph 2.02.E Paragraph 2.02.E
IQ 100 Series. . . . . . . . . . . . . . . . . . . . .
Paragraph 2.02.D Paragraph 2.02.D
IQ Energy Sentinel . . . . . . . . . . . . . . . .
Paragraph 2.02.G Paragraph 2.02.G
IQ 35M . . . . . . . . . . . . . . . . . . . . . . . . . .
Paragraph 2.02.I Paragraph 2.02.I
Breaker Power Monitoring and Metering Module . . . . . . . . . . . . . . . .
Paragraph 2.02.J Paragraph 2.02.J
IQ 150S/250S. . . . . . . . . . . . . . . . . . . . .
Paragraph 2.02K Paragraph 2.02K
Power Xpert Multi-Point Meter . . . . . .
Paragraph 2.02L Paragraph 2.02L
Metering Products Family

3.0-2
For more information, visit:
www.eaton.com/consultants
CA08104001E
November 2013
Advanced and Electronic Metering
i
ii
1
2
3
4
5
6
7
8
9
10
11
12
13
14
15
16
17
18
19
20
21
Sheet
03
Overview
General Description
002
General Description
Eaton’s metering products provide solutions needed to monitor and manage all aspects of an electrical distribution system.
When seeking greater reliability, increased productivity and significant cost savings to remain competitive in today’s market, Eaton’s metering products fit the bill. These innovative meters and communications systems, along with Power Management software, make it possible to success-fully take control of the electrical distribution system.
Power Xpert
®
Meters
Power Xpert Meters are the bench-mark for intelligent Web-enabled top-quality metering devices for the power chain. Power Xpert Meters provide measurement of the critical elements found in the power chain whether that be voltage, power, current, transients, harmonics or even time. Power Xpert Meters provide Web-enabled high definition communications for use with the Power Xpert Software. All Power Xpert Meters provide a standard communications protocol for easy integration into other systems.
Greater Reliability
Eaton metering products permit receiving an early warning of potential problems, eliminate unnecessary trips, isolate faults to ensure minimum downtime and shed or equalize loads while a problem is being corrected.
Increased Productivity
Equipment downtime resulting from voltage or frequency variations can be very costly to an operation. Monitoring power quality with Eaton’s metering products throughout the electrical distribution system provides data to identify, isolate and correct problems quickly and efficiently.
Metering Products Family
Reduced Energy and Operating Costs
When we think about meters and power quality, the common thread throughout the basket of solutions is information. Collecting, monitoring, and managing data from the electrical distribution system can help reduce costs for those facilities prepared to define and analyze present electrical energy usage levels and patterns. Data provided by Eaton metering products comprise the data for verifying utility bills for energy management and lowering operating costs. Deregulation in some geograph-ical locations permits energy users to select a utility provider and negotiate rate structures. For large users with heavy utility bills this may be an incentive to verify the utility bill, identify an opportunity for savings, negotiate a better utility rate, and apply the savings directly to the bottom line. Users are also empowered to decrease energy consumption, thereby lowering peak demand charges and decreasing operating costs.
When an Eaton meter is used with Eaton trip units and relays incorporat-ing built-in metering capabilities, the entire electrical distribution system can be cost-effectively managed.
Eaton is an industry leader offering a complete integrated solution to over-see your entire electrical distribution system. As a global manufacturer of low and medium voltage electrical distribution system equipment and components, Eaton is an experienced innovator of Metering Products that incorporate leading-edge technology. These innovations result from our scientific and engineering expertise, physical resources and the ongoing R&D programs at our technology centers.

CA08104001E For more information, visit:
www.eaton.com/consultants
3.0-3
November 2013
Advanced and Electronic Metering
i
ii
1
2
3
4
5
6
7
8
9
10
11
12
13
14
15
16
17
18
19
20
21
Sheet
03
Overview
Selection Chart
003
Table 3.0-1. Metering Selection Chart—Dimensions in Inches (mm)
�
Under typical operating conditions.
�
PXM 2260 only.
�
PXM 2270 only.
�
PXM 2280 only.
�
PXM 2290 only.
�
IQ 260 only.
�
Individual values reported to 85th harmonic; anti-alias filtering prevents higher frequencies from distorting readings (see IEC 61000-4-7).
�
PXM 6000 only.
�
PXM 8000 only.
�
At computer only.
�
Optional.
�
The auxiliary voltage option adds three additional voltage input channels to Power Xpert Meters.
�
Using <10 VA meter sourced 24V power.
Legend:
PG = ProgrammableFS = Full scaleRV = Read value
Auxiliary Voltage (Optional) = Provides three additional
voltage inputs to themeter: Va2, Vb2, Vc2.
Interharmonics = Power Xpert Meter6000/8000 supported.
Device NameAccessoriesSee Page 3.1-18
Power Xpert Meter 4000/6000/8000 Series Power Xpert Meter 2000 Series IQ 250/260 Series
Section Page Number 3.1-1 3.1-20 3.1-32
Electrical Parameters
VoltsAmperesCurrent range (% of nominal)
0.1% of RV + 0.02% FS0.05% of RV + 0.01% FS0.005–20A (400%)
0.1% of RV0.1% of RV0.1–200%
0.1% of RV0.1% of RV0.1–200%
WattsVARsVA
0.1% of RV + 0.0025% FS0.1% of RV + 0.0025% FS0.1% of RV + 0.0025% FS
0.2% of RV0.2% of RV0.2% of RV
0.2% of RV0.2% of RV0.2% of RV
PF-apparentPF-displacementFrequency
0.1%0.1%±0.01 Hz
0.2% of RV—±0.03 Hz
0.2% of RV—±0.03 Hz
THD-voltageTHD-currentWatthours
127th127th±0.2% per ANSI C12.20 0.2 Class
�
40th
����
40th
����
±0.2% per ANSI C12.20 0.2 Class
40th
�
40th
�
±0.2% per ANSI C12.20 0.2 Class
VAR-hoursVA-hoursAmpere-demand
±0.2% per ANSI C12.20 0.2 Class
�
±0.2% per ANSI C12.20 0.2 Class
�
0.05% of RV + 0.01% FS
±0.2% per ANSI C12.20 0.2 Class±0.2% per ANSI C12.20 0.2 Class±0.1% per ANSI C12.20 0.2 Class
±0.2% per ANSI C12.20 0.2 Class±0.2% per ANSI C12.20 0.2 Class±0.1% per ANSI C12.20 0.2 Class
Watt-demandVAR-demandVA-demand
±0.2% per ANSI C12.20 0.2 Class
�
±0.2% per ANSI C12.20 0.2 Class
�
±0.2% per ANSI C12.20 0.2 Class
�
±0.2% per ANSI C12.20 0.2 Class±0.2% per ANSI C12.20 0.2 Class±0.2% per ANSI C12.20 0.2 Class
±0.2% per ANSI C12.20 0.2 Class±0.2% per ANSI C12.20 0.2 Class±0.2% per ANSI C12.20 0.2 Class
Revenue accuracyIndividual ampere harmonicsIndividual voltage harmonics
±0.2% per ANSI C12.20 0.2 Class
�
85th
�
85th
�
ANSI C12.20 (0.2%) 40th
���
40th
���
ANSI C12.20 (0.2%) ——
Interharmonics Yes
��
—
—
Minimum and/or Maximum Values
VoltsCurrentPower
L-L, L-N, N-G, VAUX L-LA, B, C, N, GWatt, VAR, VA
L-L, L-NA, B, C, NWatt, VAR, VA
L-L, L-NA, B, CWatt, VAR, VA
Power factorFrequencyTHD
Apparent/displacementHertzAmperes/volts (L-L, L-N, AUX L-L)
ApparentHertzAmperes/volts
����
ApparentHertzAmperes/volts
�
Demand valuesTrend analysisEvent loggingDisturbance recording
kW, kVAR, kVA, amperes2/4
�
/8
�
GB2/4
�
/8
�
GB 2/4
�
/8
�
GB, 60 cycles per event
kW, kVAR, kVA, amperes256/512
�
/768
���
MB100,000 alarms/events with timestamp768 MB, up to 64 cycles per event
��
kW, kVAR, kVA, amperes
�
128 KB
�
—
Other Features
Storage 2/4
�
/8
�
GB 256/512
�
/768
���
MB 128 KB for logging, up to 8 parameters every 15 minutes for 30 days
�
PG output relaysPG analog outputsDiscrete contact inputsAnalog inputs
5 maximum—8—
Optional (2) Form C, 5 A or (4) Form A, 120 mA Optional (4) 4–20 mA or (4) 0–1 mA Optional (2) or (4) —
Optional (2) Form C, 5 A or (4) Form A, 120 mA Optional (4) 4–20 mA or (4) 0–1 mA Optional (2) or (4) —
Synch-input kW utility Via status input Via end of interval pulse with optional digital inputs
Via end of interval pulse with optional digital inputs
Auxiliary voltage Yes — —
kWh pulse initiatorWaveform displayWaveform capture, samples/cycle Frequency distribution display
YesLocal/computerYes, 512—
Yes
�
Yes, up to 64
�
, up to 512
�
—
Yes ———
Display typeDisplay lines/characterDisplay character height
LCD
�
Graphic (320 x 240 pixels)5.5 mm H x 4 mm W
Red LED3 lines, 4 characters0.56 (14.2) H
Red LED3 lines, 4 characters0.56 (14.2) H
Communications Serial: Modbus RTU, Modbus ASCII,
�
Network: Modbus TCP, Ethernet TCP/IP, HTTP, SNMP, SMTP, FTP, DNP 3.0
Serial: Modbus RTU, Modbus ASCII, DNP 3.0 Network: Modbus TCP, BACnet/IP, Ethernet
TCP/IP, HTTP, HTTPS, SNMP, SMTP,
��
Waveform FTP
Serial: Modbus RTU, Modbus ASCII, DNP 3.0Network: Modbus TCP via
Power Xpert Gateway
Setup configuration Via Web browser/display Via Web browser/display Via configuration software/display
Dimensions inches (mm)
Operating temperature range
Reference literature
Meter: 8.82 (224.0) H x 8.22 (208.8) W x 6.72 (170.7) D
Display: 9.02 (229.1) H x 7.80 (198.1) W x 2.49 (63.2) D
–20° to 60°C display unit–20° to 70°C meter base unit
�
TD02601007E
4.85 (123.2) H x 4.85 (123.2) W x 4.97 (126.2) D(see
Page 3.1-26
)
–20° to 70°C
TD02601017E
4.85 (123.2) H x 4.85 (123.2) W x 4.97 (126.2) D(see
Page 3.1-34
)
–20° to 70°C
TD02601016E

3.0-4
For more information, visit:
www.eaton.com/consultants
CA08104001E
November 2013
Advanced and Electronic Metering
i
ii
1
2
3
4
5
6
7
8
9
10
11
12
13
14
15
16
17
18
19
20
21
Sheet
03
Overview
Selection Chart
004
Table 3.0-1. Metering Selection Chart—Dimensions in Inches (mm) (Continued)
�
From 3–300% of FS.
�
At unity power factory and 5–300% of FS.
�
At a power factor < ±0.5 and 5–300% of FS.
�
At computer only.
�
Relays programmable to operate on any measured function.
�
Optional.
�
The auxiliary voltage option adds three additional voltage input channels to Power Xpert Meters.
�
An IPONI is required.
IQ 230M only.
�
Dimensions in mm = 170.2 W x 261.6 H x 137.2 D
Legend:
PG = ProgrammableFS = Full scaleRV = Read value
Auxiliary Voltage (Optional) = Provides three additional
voltage inputs to themeter: Va2, Vb2, Vc2.
Interharmonics = Power Xpert Meter6000/8000 supported.
Device NameAccessoriesSee Page 3.1-18
IQ Analyzer 6000 Series IQ DP-4000 Series IQ 230 Series
Section Page Number 3.3-1 — —
Electrical Parameters
VoltsAmperesCurrent range (% of nominal)
±0.2% FS
�
±0.2% FS
�
3–800%
±0.3% FS±0.3% FS10–250%
±0.5% FS±0.5% FS1–200%
WattsVARsVA
0.4% FS, 6 RV
�
0.4% FS, 6 RV
�
0.4% FS, 6 RV
�
±0.6% FS±0.6% FS±0.6% FS
±1.0% FS±1.0% FS±1.0% FS
PF-apparentPF-displacementFrequency
0.8% FS
�
0.8% FS
�
0.04%
�
or 0.01 Hz
±1.0% FS±1.0% FS±0.17% FS
±2.0% FS±2.0% FS±0.1% Hz
THD-voltageTHD-currentWatthours
50th50th0.5% RV
�
31st31st±0.6% FS
——±1.0% per ANSI C12
VAR-hoursVA-hoursAmpere-demand
1% RV
�
0.5% RV
�
±0.2% FS
�
±0.6% FS±0.6% FS±0.3%
±1.0% per ANSI C12±1.0% per ANSI C12±0.5% per ANSI C12
Watt-demandVAR-demandVA-demand
±0.4% FS
�
±0.4% FS
�
±0.4% FS
�
±0.6%±0.6%±0.6%
±1.0% per ANSI C12±1.0% per ANSI C12±1.0% per ANSI C12
Revenue accuracyIndividual ampere harmonicsIndividual voltage harmonics
ANSI C12.20 (0.5%)50th50th
———
ANSI C12.1 (1%)——
Interharmonics — — —
Minimum and/or Maximum Values
VoltsCurrentPower
L-L, L-NA, B, C, N, GWatt, VAR, VA
L-L, L-NA, B, C Watt, VAR, VA
L-L, L-NA, B, CWatt, VAR, VA
Power factorFrequencyTHD
Apparent/displacementHertzAmperes/volts
Apparent/displacementHertzAmperes/volts
Apparent/displacementHertz—
Demand valuesTrend analysisEvent loggingDisturbance recording
AllTime/date504 events w/timestamp10 waveform events
All2 Alarms
�
—
All
��
—
Other Features
Storage 90 kB 15 Parameters —
PG output relaysPG analog outputsDiscrete contact inputsAnalog inputs
(4) 10A Form C �(4) 0–10/4–20 mA(3) +30 Vdc Differential(1) 0–20/4–20 mA
(3) 10A Form C �—(1) kW Demand �—
(2) 100 mA Form A —(2) +30 Vdc differential (1) 4–20 mA
Synch-input kW utility At device or via communications At device or via communications � Via communications only
Auxiliary voltage � — — —
kWh pulse initiatorWaveform displayWaveform capture, samples/cycleFrequency distribution display
YesLocal �/computerYes, 128Local �/computer
Yes �———
Yes ———
Display typeDisplay lines/characterDisplay character height
Graphic LCD with LED backlight7 lines, 147 charactersUp to 7 Lines
7 Segment LED1 line, 7 characters1 line
Backlit LCD4 lines, 20 characters1.60 (40.6) H x 0.09 (2.3) W
Communications Serial: INCOM �Network: via Power Xpert Gateway �
Serial: INCOM �Network: via Power Xpert Gateway �
Serial: INCOM, Modbus RTU Network: via Power Xpert Gateway
Setup configuration Via configuration software/display Via configuration software/display Via configuration software/display
Dimensions inches (mm)
Operating temperature rangeReference literature
6.70 (170.2) W x 10.30 (261.6) H x 5.40 (137.2) D �–20° to 70°CTD1702BTE
6.70 (170.2) W x 10.30 (261.6) H x 5.40 (137.2) D �–20° to 70°CTD1703ATE
Refer to TD.17.06.T.E. (see Page 3.2-26)
0° to 50°CTD1706TE

CA08104001E For more information, visit: www.eaton.com/consultants
3.0-5November 2013
Advanced and Electronic Metering
i
ii
1
2
3
4
5
6
7
8
9
10
11
12
13
14
15
16
17
18
19
20
21
Sheet 03
OverviewSelection Chart
005
Table 3.0-1. Metering Selection Chart—Dimensions in Inches (mm) (Continued)
� IQ 140/150.� IQ 150 only.� At computer only.� Optional.� IQ 250S only.� The auxiliary voltage option adds three
additional voltage input channels to Power Xpert Meters.
Legend: PG = ProgrammableFS = Full scaleRV = Read value
Auxiliary Voltage (Optional) = Provides three additional
voltage inputs to themeter: Va2, Vb2, Vc2.
Interharmonics = Power Xpert Meter6000/8000 supported.
Device NameAccessoriesSee Page 3.1-18
IQ 130/140/150 Series IQ 35M IQ 150S/250S Series
Section Page Number 3.1-35 3.2-1 3.2-11
Electrical ParametersVoltsAmperesCurrent range (% of nominal)
0.25% of RV0.25% of RV0.1–200%
0.4% +0.015% per °C deviation from 25°C0.4% (5–100%), 0.8%(1–5%) +0.015% per °C from 25°C1–120%
0.1% of RV0.1% of RV0.1–200%
WattsVARsVA
0.5% of RV �0.5% of RV �0.5% of RV �
0.5% per ANSI C12.20 and IEC 62053-22 Class 0.5S2.0% per IEC 62053-23 Class 2Calculated: vector sum of watts and VARs
0.2% of RV 0.2% of RV 0.2% of RV
PF-apparentPF-displacementFrequency
0.5% of RV �—±0.03 Hz �
Calculated: watts/VAs — ±0.02 Hz
0.2% of RV —±0.03 Hz
THD-voltageTHD-currentWatthours
——±0.5% per ANSI C12.20 0.5 Class �
— — 0.5% per ANSI C12.20 and IEC 62053-22 Class 0.5S
——±0.2% per ANSI C12.20 0.2 Class
VAR-hoursVA-hoursAmpere-demand
±0.5% per ANSI C12.20 0.5 Class �±0.5% per ANSI C12.20 0.5 Class �±0.25% per ANSI C12.20 0.5 Class �
±2.0% per IEC 62053-23 Class 2——
±0.2% per ANSI C12.20 0.2 Class ±0.2% per ANSI C12.20 0.2 Class ±0.1% per ANSI C12.20 0.2 Class
Watt-demandVAR-demandVA-demand
±0.5% per ANSI C12.20 0.5 Class �±0.5% per ANSI C12.20 0.5 Class �±0.5% per ANSI C12.20 0.5 Class �
0.5% per ANSI C12.20 and IEC 62053-22 Class 0.5S2.0% per IEC 62053-23 Class 2Calculated: vector sum of watts and VARs
±0.2% per ANSI C12.20 0.2 Class ±0.2% per ANSI C12.20 0.2 Class ±0.2% per ANSI C12.20 0.2 Class
Revenue accuracyIndividual ampere harmonicsIndividual voltage harmonics
ANSI C12.20 (0.5%) ——
0.5% per ANSI C12.20 and IEC 62053-22 Class 0.5S — —
ANSI C12.20 (0.2%) ——
Interharmonics — — —
Minimum and/or Maximum ValuesVoltsCurrentPower
L-L, L-NA, B, CWatt, VAR, VA �
———
L-L, L-NA, B, C,Watt, VAR, VA
Power factorFrequencyTHD
Apparent �Hertz �—
Apparent (low alert)Hertz (out of range alert)—
Apparent Hertz —
Demand valuesTrend analysisEvent loggingDisturbance recording
kW, kVAR, kVA, amperes ���
—
kW, kVAR, kVA; maximum kW, kVAR, kVA—Logging on demand interval or Modbus command �—
kW, kVAR, kVA, amperes 2 MB �2 MB �—
Other FeaturesStorage — 10 registers (16 bit) by 5760 entries each
(115 KB) �2 MB �
PG output relaysPG analog outputsDiscrete contact inputsAnalog inputs
————
— — 2-pulse inputs with BACnet —
— — — —
Synch-input kW utility — Optional demand synchronization via Modbus —
Auxiliary voltage � — — —
kWh pulse initiatorWaveform displayWaveform captureFrequency distribution display
�
———
Yes — — —
Yes — — —
Display typeDisplay lines/characterDisplay character height
Red LED3 lines, 4 characters0.56 (14.2) H
Backlit LCD 2 lines by 5 characters each (full alphanumeric top row) 7.5 mm
Red LED3 lines, 4 characters0.56 (14.2) H
Communications Serial: Modbus RTU, Modbus ASCII �Network: Modbus TCP �
Serial: Modbus RTU �, BACnet MS/TP �Network: Modbus TCP via Power Xpert Gateway
Serial: Modbus RTU, Modbus ASCII, DNP 3.0 Network: Modbus TCP, wired or wireless
Setup configuration Via configuration software/display Via display/configuration software Via configuration software/display
Dimensions inches (mm)
Operating temperature range
Reference literature
4.85 (123.2) H x 4.85 (123.2) W x 4.97 (126.2) D (see Page 3.1-37)–20° to 70°C
TD02601016E
3.60 (91.4) H x 4.20 (106.7) W x 2.30 (58.4) D (see Page 3.2-4) Meter: –30° to 70°CDisplay: –10° to 50°CTD02601018E
7.90 (200.7) H x 7.50 (190.5) W x 3.10 (78.7) D
–20° to 70°C
TD02601019E

3.0-6
For more information, visit: www.eaton.com/consultants CA08104001E
November 2013
Advanced and Electronic Metering
i
ii
1
2
3
4
5
6
7
8
9
10
11
12
13
14
15
16
17
18
19
20
21
Sheet 03
OverviewSelection Chart
006
Table 3.0-1. Metering Selection Chart—Dimensions in Inches (mm) (Continued)
� At computer only.� The auxiliary voltage option adds three
additional voltage input channels to Power Xpert Meters.
� Optional.
Legend: PG = ProgrammableFS = Full scaleRV = Read value
Auxiliary Voltage (Optional) = Provides three additional
voltage inputs to themeter: Va2, Vb2, Vc2.
Interharmonics = Power Xpert Meter6000/8000 supported.
Device NameAccessoriesSee Page 3.1-18
Power Xpert Multi-Point Meter
Power Monitoring/Metering Module (PM3)
IQ Energy Sentinel
Section Page Number 3.2-16 3.2-33 3.2-27
Electrical ParametersVoltsAmperesCurrent range (% of nominal)
±0.2% RV±0.2% RV—
±0.5% of RV±0.5% of RV—
———
WattsVARsVA
±0.5% RV±0.5% RV±0.5% RV
±1.0% of RV±1.0% of RV±1.0% of RV
±1.0% FS——
PF-apparentPF-displacementFrequency
±0.5% RV—±0.1 Hz
±2.0% of RV—±0.1 Hz
———
THD-voltageTHD-currentWatthours
——±0.5% per ANSI C12.20 0.5 class
——±1.0% per ANSI C12.1
——±1.0% FS
VAR-hoursVA-hoursAmpere-demand
±0.5% per ANSI C12.20 0.5 class±0.5% per ANSI C12.20 0.5 class—
±1.0% of RV±1.0% of RV—
———
Watt-demandVAR-demandVA-demand
±0.5% per ANSI C12.20 0.5 class±0.5% per ANSI C12.20 0.5 class±0.5% per ANSI C12.20 0.5 class
———
±1.0% FS——
Revenue accuracyIndividual ampere harmonicsIndividual voltage harmonics
ANSI C12.20 (0.5%)——
±1.0% per ANSI C12.1——
———
Interharmonics — — —
Minimum and/or Maximum ValuesVoltsCurrentPower
L-L, L-NA, B, CWatts, VAR, VA
———
———
Power factorFrequencyTHD
ApparentHertz—
———
———
Demand values
Trend analysisEvent loggingDisturbance recording
Watts (Delivered & Received), Watts (Q1–Q4),VA (Q1, Q4), VA (Q2, Q3)Interval data20 latest events and historical—
—
———
—
��
—
Other FeaturesStorage 256 MB standard, 2 GB optional — —
PG output relaysPG analog outputsDiscrete contact inputsAnalog inputs
1 standard, 8 each module �—3 standard, 8 each module �—
——Circuit breaker status—
————
Synch-input kW utility Via communications and digital input — Via communications only
Auxiliary voltage � — — —
kWh pulse initiator
Waveform displayWaveform captureFrequency distribution display
Aggregate or main-digital output, LED output on meter modules (accuracy check)———
—
———
—
———
Display typeDisplay lines/characterDisplay character height
LCD color touchscreen �6-inch diagonal Graphics
———
———
Communications Serial: Modbus RTU� Network: Modbus TCP, BACnet/IP, Ethernet TCP/IP, HTTP, HTTPS, SNMP, SMTP, SFTP
Serial: INCOM, Modbus RTUNetwork: via Power Xpert Gateway
Serial: INCOMNetwork: via Power Xpert Gateway
Setup configuration Via PXMP configuration software — Via configuration software
Dimensions inches (mm)Operating temperature rangeReference literature
Refer to TD150006EN (see Page 3.2-25)–20° to 70°CTD150006EN
Refer to IL01219085E–25° to 70°C IL01219085E
Refer to TD.17.07.T.E. (see Page 3.2-32)–25° to 70°CTD1707TE

CA08104001E For more information, visit: www.eaton.com/consultants
3.1-1November 2013
Advanced and Electronic Metering
i
ii
1
2
3
4
5
6
7
8
9
10
11
12
13
14
15
16
17
18
19
20
21
Sheet 03
Eaton Advanced MetersPower Xpert Meter 4000/6000/8000 Series
007
Power Xpert Meter4000/6000/8000 Series
Power Xpert Meter 4000/6000/8000 Series Display and Meter Base
General DescriptionThe Power Xpert Meter 4000/6000/8000 Series monitors the critical aspects of an electrical distribution system. This premier power quality metering instrument is simple to use, powerful, scalable and highly flexible.
The Power Xpert Meter 4000/6000/8000 offers a new level of intuitive user interface design, presenting critical electrical distribution system information in simple-to-navigate and easy-to-understand information architecture. The Power Xpert Meter 4000/6000/8000 Graphic Display visualizes the information from up to 16 meter modules. The embedded Web server displays complex power quality data using standard Internet browsers and allows for device configuration from the browser.
Both the local graphic display and the embedded Web server present real time, historical and event information in a browser-style graphical format to help the user interpret key circuit information, such as:
■ Current loading■ Voltage and power levels■ Power factor■ energy usage■ I/O status■ Power quality measurements■ Harmonic plots■ Disturbance and transient
waveforms■ ITIC disturbance summary screen
The Power Xpert Meter 4000/6000/8000 Series Graphic Display uses a simple “twist and click” navigation control dial to easily navigate the menus and drill down into increasing levels of important detail. A “back” key enhances the browser-like navigation of the graphic display.
The Web server provides the energy and demand readings required to help manage the cost of energy. It also provides critical information regard-ing power quality, such as harmonic distortion, flicker, crest factor, K-Factor and more.
Note: Features and functionality may vary depending on the meter model and options being used. Review the Features and Benefits chart in Table 3.1-2 for details.
Application Description
Identify Power Quality Problems to Help:■ Identify harmonics, sags, swells
and transients damaging or disrupting sensitive, mission-critical IT equipment
■ Boost IT equipment’s service life to the maximum
■ Analyze sequence of events up to 1 millisecond time resolution
■ Protect motors from damage■ Preserve the integrity of processes
and batches■ Prevent blown capacitor bank fuses■ Protect transformers and conductors
from overheating
Detect and Record High-Speed Transients to Help:■ Avoid equipment damage and
disruption■ Identify equipment malfunction
Monitor Circuit Loading to Help:■ Avoid overloads and nuisance
overload trips■ Maximize equipment utilization■ Manage emergency overloads
Manage Energy Utilization to Help:■ Reduce peak demand charges
and power factor penalties■ Identify excessive energy
consumption
Metered/Monitored ParametersNote: See Table 3.1-2.
■ Volts: L-L, L-N, Avg. L-L, Avg. L-N, N-G■ Phase neutral and ground currents■ Power: real, reactive and apparent■ Frequency■ Power factor: apparent and
displacement■ Energy■ Demand■ % THD■ Minimum and maximum values■ Harmonics■ Flicker■ Individual harmonics■ Interharmonics■ % TDD■ ITIC events plot, duration, magnitude■ Energy comparisons■ Demand comparisons■ Event calendar■ Event timeline and sequence■ Number of 9’s of availability■ Phasors■ Sequence components■ Crest factor■ K-Factor■ PQ index
Accuracy■ Currents: 0.05% RV + 0.025%FS■ Voltage: 0.1% RV + 0.025% FS■ Energy, and demand power:
0.2% in accordance with ANSI C12.20■ Frequency: ±0.01 Hz■ Power factor:
❑ 0.10% at Unity PF❑ 0.30% at 0.5 PF

3.1-2
For more information, visit: www.eaton.com/consultants CA08104001E
November 2013
Advanced and Electronic Metering
i
ii
1
2
3
4
5
6
7
8
9
10
11
12
13
14
15
16
17
18
19
20
21
Sheet 03
Eaton Advanced MetersPower Xpert Meter 4000/6000/8000 Series
008
CommunicationsMultiple communications ports including:
Standard■ RS-485 remote display port■ RS-485 Modbus RTU Slave port■ RJ-45 10/100Base-T Local Configuration
Port (local Web server connection)■ HTTP (local), FTP, COMTRADE
Optional■ Communications Expansion Card (CEC)
❑ Selectable 100FX or 10/100Base-T Ethernet network port
❑ RS-485 Modbus RTU Selectable Master/Slave port
❑ RS-232 Modbus RTU Slave port❑ HTTP (remote), Modbus TCP,
SNMP, SMTP, NTP, DNP 3.0
For Optional Graphic DisplayNote: Display ports restrict access to up to 16 Power Xpert Meter 4000/6000/8000 meter modules located on the display RS-485 network.
■ RS-485 meter display network port■ RJ-45 10/100Base-T for access to
Local Display Power Xpert network
Communication Protocols Supported■ Modbus RTU■ Modbus TCP■ Ethernet TCP/IP■ HTML■ NTP (Network Time Protocol)■ FTP (File Transfer Protocol)■ SMTP (Simple Mail Transfer Protocol)■ SNMP (Simple Network
Management Protocol)■ COMTRADE (IEEE C37.111-1999)■ DNP 3.0 over Ethernet (Distributed
Network Protocol)
Figure 3.1-1. RS-485 Network1. When using Modbus RTU over an
RS-485 communications network, the data rate, data protocol (data bit, stop bit and parity) and wiring topology (two-wire or four-wire) must be the same for each of the devices.
2. Connections should be made using communication/control shielded cable equivalent to Belden cable p/n 9463.
Figure 3.1-2. Ethernet Network1. Optional Ethernet Communica-
tions Card must be ordered with the meter.
2. Available Ethernet connections are: 10Base-T and ST fiber.
Power Xpert Meter in Modbus RTU Slave Mode PLC
Modbus Master
eolr
Power Xpert Meter Standard Web Browser
Power XpertEthernet Switch
Physical Characteristics
Two-Piece Design■ Power Xpert Meter 4000/6000/8000
meter module■ Power Xpert Meter 4000/6000/8000
Graphic Display 320 x 240 pixel backlight LCD remote graphics display (supports up to 16 Power Xpert Meter 4000/6000/8000 meter modules)
Display/Meter Mounting Options■ Remotely mount the display up to
2000 ft (1210m) away from 1 to 16 Power Xpert Meter modules
■ Mount the display and Power Xpert Meter module on opposite sides of a panel. 15 additional meter bases can be remotely mounted
Meter Base Unit Characteristics■ Height: 8.88 inches (225.6 mm)■ Width: 9.56 inches (242.8 mm)■ Depth: 6.72 inches (170.8 mm)
including optional wall mounting brackets
■ NEMA rating: NEMA 1, IP3Ø
Display Unit Characteristics■ Height: 9.02 inches (229.0 mm)■ Width: 7.80 inches (198.1 mm)■ Depth:
❑ 1.45 inches (36.8 mm) behind panel surface
❑ 1.04 (26.3 mm) projection in front of panel surface
■ NEMA rating: NEMA 12, IP42 front of panel rating
Standards and Certifications■ Safety: EN61010-1, UL/cUL 61010-1■ Accuracy: IEC/EN60687 0.2 class,
ANSI C12.20 0.2 Class■ EMC: FCC Part 15 Subpart B Class A
EN55011 Class A■ Measurement Canada approval
AE-1898 (4000/6000 meters)■ Immunity IEC 61326■ CE Mark

CA08104001E For more information, visit: www.eaton.com/consultants
3.1-3November 2013
Advanced and Electronic Metering
i
ii
1
2
3
4
5
6
7
8
9
10
11
12
13
14
15
16
17
18
19
20
21
Sheet 03
Eaton Advanced MetersPower Xpert Meter 4000/6000/8000 Series
009
Ease-of-Use—Power Xpert Meter4000/6000/8000 Graphic Display (Option)The Power Xpert Meter 4000/6000/8000 display features a large easy-to-read white backlit graphic LCD. The information presented by the display is organized into an information architecture that is easy-to-navigate and organized for simplicity. Screen navigation is accomplished using a navigation control dial and a “back” button. The user simply twists the knob on the navigation control dial to move between menu selections and drill down links on the screen. When the selection is highlighted, pressing the dial makes the selection. Information is displayed from a single meter or an RS-485 daisychain of up to 16 meters. The display features a rich set of screens including real-time data, trend plots, waveform views and an ITIC Plot. The graphic display allows basic device setup and password protected resets. An audible alarm is available to annunciate alarm conditions.
Power Xpert Meter 4000/6000/8000 Embedded Web ServerThe Power Xpert Meter 4000/6000/8000 embedded Web server offers Eaton customers a new level of accessibility to the critical information required to manage their electrical distribution system. The Web server includes real-time circuit information in both numeric and graphical visual formats to help monitor circuit parameters such as current loading, voltage and power levels, power factor, THD, Flicker and more. The Web server also provides energy and demand readings with graphic usage plots to help analyze energy usage patterns. Energy readings include kWh, kVARh, delivered and received and kVAh with time of use and RTP displays. The interval energy usage plot includes the ability to do week-to-week and month-to-month energy consumption graphical comparisons for benchmarking purposes. The embedded Web server will also display in simplified Chinese if connected to a computer configured for Chinese language.
Both the Power Xpert Meter 4000/6000/8000 embedded Web server and the local graphic display support graphical trend charts of key circuit measurements such as current, voltage, power and energy. The trend chart supports a zoom feature that allows the user to view data over a short period of 16 hours up to 4 years. The trend chart includes zoom in/out buttons and a horizontal slider bar control to manage scrolling forward and backward through the data. Trend charts of basic readings include minimum, maximum and average readings. Trend charts of interval by interval energy data also display peak demand.
Note: For remote access and networking capabilities such as connecting to a LAN/WAN, use the optional Communications Expansion Card (CEC).
Sag/Swell/Transient Capture and Recording60 cycles of waveform are oversampled at 4096 samples per cycle (Power Xpert Meter 4000/6000), filtered through anti-aliasing and recorded at 512 samples per cycle and post event data. The Power Xpert Meter 8000 samples at a rate of 100,000 samples per cycle. Embedded Web server supports viewing of triggered waveforms one channel at a time and includes the ability to zoom and to scroll horizontally using a slider bar.
The Power Xpert Meter 6000/8000 Series have preconfigured (600V and below) trigger settings for sags, swells and transients, and do not require additional setup by the user. Wave-forms are stored in non-volatile flash memory using an industry standard COMTRADE format. Waveforms can be automatically sent out as COMTRADE attachments to an e-mail following an event, or can be retrieved from an FTP (File Transfer Protocol) directory structure in the Power Xpert meter module’s memory.
Historical Trend LoggingThe Power Xpert Meter 4000/6000/8000 records historical data for graphical viewing from the Local display or the embedded Web server. Graphical views of historical data support pan and zoom. 145 standard metering parameters are logged as part of the standard meter functionality including min./max. and average for each parameter. The averages are calculated over the interval period. The minimum and maximum readings are based on 200 ms calculations.
Storage capacity for standard trend plots includes all of the following intervals:
■ Every 5 minutes for 48 hours (2 days)■ Every 15 minutes for 192 hours
(8 days)■ Every hour for 28 days (4 weeks)■ Every 8 hours for 56 weeks■ Every week for 44 months
Note: Trend plot data can be easily exported to third-party applications, such as Microsoft Excel in csv-file format.
In addition, metered parameters are automatically stored on the built-in FTP Servers, where they can be easily copied and imported into third-party applications for benchmarking and analysis. Logs on the FTP Server include the min./max. and average for 145 standard metering parameters at 5-minute intervals.
Storage capacity for trend data:63 days of 5-minute interval trend data. Capacity=18,144 intervals.

3.1-4
For more information, visit: www.eaton.com/consultants CA08104001E
November 2013
Advanced and Electronic Metering
i
ii
1
2
3
4
5
6
7
8
9
10
11
12
13
14
15
16
17
18
19
20
21
Sheet 03
Eaton Advanced MetersPower Xpert Meter 4000/6000/8000 Series
010
Energy Profile DataThe Power Xpert Meter 4000/6000/8000 records Real and Reactive energy forward, reverse, net and absolute sum, as well as Apparent energy (kVAH). Up to eight status inputs can be configured as energy accumulators for counting KYZ pulse inputs (option). These readings are stored over a configurable interval from 1 to 60 minutes, as well as in daily and weekly totals.
With the optional LAN/WAN Ethernet Communication Expansion Card, users can easily configure the meters to send periodic e-mails at user-defined intervals of energy consumption and power demand. E-mails contain a summary of readings per rate structures and also have the actual measurements attached to the e-mail’s body as a CSV file in a ZIP container.
In addition, metered parameters are automatically stored on the built-in FTP Server, where they can be easily copied and imported into third-party applica-tions for benchmarking and analysis. Logs on the FTP Server include energy consumption logs, one for every month in CSV file format, trended measure-ment logs also in CSV file format and waveform captures in COMTRADE file format.
Storage capacity for energy profile data:
■ 62 days of 15 minute interval energy and pulse interval data
■ (Fixed interval capacity = 5952 intervals. Configurable intervals from 1 to 60 min)
■ 372 days of 1 day accumulated energy and pulse interval data
■ 208 weeks of 1 week accumulated energy and pulse interval data
Energy and Demand ComparisonsEnergy and demand usage patterns can be analyzed with the month-to-month, week-to-week comparison chart built into the meter. Raw data can be exported with the “Save Table” option to other applications, such as Excel, for further analysis and graphing.
Power Xpert Meter Profiler—Free DownloadThe Power Xpert Meter Profiler is a free energy-management software download, compatible with the Power Xpert Meter 4000/6000/8000, allowing a comparison of expected or baseline energy consumption patterns to actual usage, and flagging areas of concern using deviations from modeled energy patterns. These deviations point to targets as they hunt for energy consumption offenders in their facility.
By applying pattern analysis techniques and intelligently using color and shape to convey the results, the Power Xpert Meter Profiler provides the user an easy-to-understand visualization of energy usage, thus offering information for proactive energy management.
Calendar Usage View
Features and Benefits■ Develops a baseline of energy
demand for management analysis■ Easily identifies periods of high
energy demand at-a-glance by day, week and month
■ Allows for a daily, weekly, monthly comparison of energy usage compared to baseline
■ Allows for detailed comparison of multi days energy usage
■ Offers multi views of energy usage and baseline comparisons to quickly identify anomalies
Daily Detailed Energy Usage View
Multi-Day Detail Comparison View
The Profiler uses the previous 9 weeks of data for the energy use baseline, but you can manually add more values to the baseline.
The Power Xpert Meter Profiler is also a predictor: It can predict what energy consumption would be expected later in a day. The Real-Time view generates a baseline from the last two months and makes a prediction of the future load. The view represents the current day (today), and shows three graphs: the baseline for the day, the historical data (up to present) and the predicted future data. Instantaneous data is retrieved and averaged to keep the graphs up-to-date. The averaged values are shown as shapes at the current time: Instantaneous, 1-minute average and 15-minute average.
In addition, users can add the data from two different Power Xpert Meter 4000/6000/8000s into one calendar view. The profiler will mathematically combine the two loads into a totalized view. It is also possible to change the percentage contribution of each meter, as well as subtract a portion of one meter from another.
To download the tool, go to www.eaton.com/pxm and click on the link for the Power Xpert Meter Profiler. Registration will be required to download.

CA08104001E For more information, visit: www.eaton.com/consultants
3.1-5November 2013
Advanced and Electronic Metering
i
ii
1
2
3
4
5
6
7
8
9
10
11
12
13
14
15
16
17
18
19
20
21
Sheet 03
Eaton Advanced MetersPower Xpert Meter 4000/6000/8000 Series
011
Eaton Power Xpert Energy Viewer—Free DownloadThe Power Xpert Energy Viewer (PXEV) provides the means to develop an energy usage baseline for energy management programs, comparing interval logged data points. It is a free Web download for compatible Eaton product home pages. This tool allows easy interpretation of the data collected by compatible devices via graphical charts, graphs and reports without having to export the available .csv file into Microsoft® Excel® or another tool. See Page 3.1-31 for more information.
Comparison Summary
Event TriggersThe Power Xpert Meter 4000/6000/8000 supports five types of configurable event triggers:
■ Out of limits (4000/6000/8000)■ Demand overload (4000/6000/8000)■ Sub-cycle disturbance
(4000/6000/8000)■ ITIC (6000/8000)■ Fast transient (8000)
These triggers permit pickup, reset and pickup delay to be configured by the user. When a trigger occurs, actions include Performance Monitoring (#9’s analysis), Capturing Waveform, Capture Parameters, Send E-mail and Operate a Relay Output. The Graphic Display flashes an LED to annunciate the alarm condition. An audible alarm is also available.
Trigger options include:
■ Out of limits: over 100 triggers■ Demand overload: 10 triggers■ ITIC: eight triggers■ Fast transient: dV/dT and absolute
per phase■ Sub-cycle disturbance—dV/dT
and absolute
Event LoggingThe Power Xpert Meter 4000/6000/8000 local graphic display or the embedded Web server both allow the user to view a list of triggered events along with any captured parameters, event details, and triggered wave-forms. In addition, a separate event log includes a variety of activities including acknowledged triggers, new min. and max. events, and system operations such as resets. The size of the event log is virtually unlimited based only on the memory option selected.
E-mail NotificationWith the optional LAN/WAN Ethernet Communication Expansion Card attached to the Power Xpert Meter 4000/6000/8000, the users can easily configure the meters to send periodic e-mails at user-defined intervals for energy consumption and power demand. E-mails contain a summary of readings per rate structures and also have the actual measurements attached to the e-mail’s body as a CSV file in a ZIP container. Prompt alarm e-mails can also be sent for any event condition either standard in the meter or ones set up by the user based on thresholds, dV/dt triggers or IO status changes with the optional IO Card. Alarm e-mails can be configured to have the COMTRADE waveform capture attached to the e-mail’s body.
Periodic E-mail Message
ITIC Analysis PlotThe Power Xpert Meter graphic display (option) and Web server (option) include a graphic representa-tion of the ITIC plot (Power Xpert Meter 6000/8000) with counts of disturbances and transients that have occurred. The ITIC plot organizes events into eight distinct disturbance zones corresponding to severity and a 9th zone for transients. A pass/fail count is displayed to indicate how many events are outside the ITIC limits. Clicking on any counter in the ITIC Web page will link the user to the event view and display all triggered events in the selected zone. This makes it simple to view disturbance waveforms associated with the ITIC plot.
A separate ITIC graph is available to review individual ITIC events. This graph will show the user the event hit position on the graph and the event duration and magnitude.
Inputs and OutputsPower Xpert Meter 4000/6000/8000 is available with an optional digital I/O card that includes:
■ Eight digital inputs—self sourced 24 Vdc
■ Three relay outputs—5A max. continuous, 240 Vac max., 30 Vdc max.
■ Two solid-state outputs—80 mA max. continuous, 30 Vdc max.
Each of the eight inputs are interrupt driven, allowing for 1 ms accuracy of digital events time stamps (1 ms accuracy requires local NTP TimeServer). Inputs can also be configured for demand synch, and pulse counting. Inputs selected for pulse counting can be scaled. Interval by interval pulse recordings are maintained in profile memory and can be displayed graphically. Outputs can be used for KYZ, or alarm annunciation.

3.1-6
For more information, visit: www.eaton.com/consultants CA08104001E
November 2013
Advanced and Electronic Metering
i
ii
1
2
3
4
5
6
7
8
9
10
11
12
13
14
15
16
17
18
19
20
21
Sheet 03
Eaton Advanced MetersPower Xpert Meter 4000/6000/8000 Series
012
Ratings■ Application to 500 kV, no PTs to 600V■ CT ratios selectable from standard
120/600 Vac line■ CT inputs accept 5A secondary■ Power supply: standard 120/240 Vac
or 110/250 Vdc
Storage Capacity
Table 3.1-1. Power Xpert Meter 4000/6000/8000 Estimated Memory and Storage Capacity with 2/4/8 GB Memory Capacity
� The typical and severe power quality event occurrences are estimates and may vary depending on the electrical environment.� Memory is not allocated by event category; memory is used first come, first served.
Model Memory Event File Size(KB)
Occurrence Per Month �
Memory Usage (MB)
Months of Capacity with 8 GB Memory �
Typical Severe Typical Severe Typical Severe
PXM 4000 2 GB Subcycle disturbance 1260 10 60 12.3 73.8 166 28
PXM 6000 4 GB ITIC event 1260 5 20 6.2 24.6 666 166
Subcycle disturbance 1260 10 60 12.3 73.8 333 55
ITIC + subcycle disturbance Total---> 15 80 18.5 98.4 222 42
PXM 8000 8 GB ITIC event 1260 5 20 6.2 24.6 1332 333
Subcycle disturbance 1260 10 60 12.3 73.8 666 111
Transients 2048 3 30 6.0 60.0 1365 137
ITIC + subcycle disturbance + transients Total---> 18 110 24.5 158.4 335 52

CA08104001E For more information, visit: www.eaton.com/consultants
3.1-7November 2013
Advanced and Electronic Metering
i
ii
1
2
3
4
5
6
7
8
9
10
11
12
13
14
15
16
17
18
19
20
21
Sheet 03
Eaton Advanced MetersPower Xpert Meter 4000/6000/8000 Series
013
Power Xpert Meter 4000■ Harmonics■ Disturbance capture■ Low frequency transient detection
and capture■ Standard power quality index■ 2 GB data logging
Power Xpert Meter 6000■ Harmonics, including individual
harmonics■ Flicker calculations■ ITIC performance curve■ Event calendar view■ Events timeline view■ Sequence of events waveform plot■ Enhanced power quality index■ 4 GB data logging
Power Xpert Meter 8000■ Impulsive transient capture at 6 MHz■ 100,000 samples per cycle■ Premium power quality index■ 8 GB data logging
Table 3.1-2. Power Xpert Meter 4000/6000/8000—Features and Benefits
� Delta-Sigma A/D oversampling rate.
Note: These specifications are subject to change without notice and represent the maximum capabilities of the product with all options installed. This is not a complete feature list. Features and functionality may vary depending on selected options, firmware version and product model. Please refer to the technical data sheet and user manual for detailed specifications.
Feature Power Xpert Meter Benefit
4000 6000 8000
GeneralEmbedded Web server ■ ■ ■ Use a standard Web browser to monitor and manage the meter
over the network, Internet.
TOU metering support ■ ■ ■ Time of usage can be set up to support four different schedules.
Firmware flash update support ■ ■ ■ Enables you to flash the meter with the latest firmware updates.
Self-learning capability (characterizes “normal” per circuit)
■ ■ ■ The meter can automatically adjust to the environment and alarm only when “real” events occur.
Power, Energy and DemandVoltage, current: per phase minimum, maximum, average, trend graph analysis, export, print
■ ■ ■ Review voltage and current trends, export, print and analyze parameters right on the meter or external software.
Energy and demand plot comparisons month-to-month, week-to-week
■ ■ ■ Plot two months or two weeks for vivid energy or demand comparison.
Power: power factor, apparent, real, reactive, frequency ■ ■ ■ Review power usage and power factor and avoid potential PF penalties.
Energy, demand: forward, reverse, net, sum, TOU, profile, previous month comparison, graph analysis, export, print
■ ■ ■ Keep track of your energy usage, compare time of usage and usage against previous month, identify peaks to conserve energy usage.
Power Quality AnalysisStatistical analysis (minimum, maximum, average) ■ ■ ■ Review statistical trends, identify past and future problem areas.
Sag and swell monitoring, management and recording ■ ■ ■ Capture electrical sags and swells and analyze the waveforms.
Symmetrical components: zero, negative, positive ■ ■ ■ Analyze possibly unbalanced three-phase power systems.
Low frequency transient detection and capture ■ ■ ■ Capture lower frequency transient waveforms for retrospective analysis or e-mailing.
Sampling rate, maximum samples/cycle 4096 � 4096 � 100,000 Extremely high sampling rate will effectively capture impulsive transients.
“Number of Nines” uptime data (e.g., 6 nines=99.9999%) ■ ■ ■ Review uptime availability per cent.
K-factor ■ ■ ■ Review the ratio of eddy current losses, e.g., when driving non-linear and linear loads.
Crest factor ■ ■ ■ Review the peak-to-average ratio of the waveform.
SecuritySecure 5 level user access privileges ■ ■ ■ Define appropriate security access level per user.

3.1-8
For more information, visit: www.eaton.com/consultants CA08104001E
November 2013
Advanced and Electronic Metering
i
ii
1
2
3
4
5
6
7
8
9
10
11
12
13
14
15
16
17
18
19
20
21
Sheet 03
Eaton Advanced MetersPower Xpert Meter 4000/6000/8000 Series
014
Table 3.1-2. Power Xpert Meter 4000/6000/8000—Features and Benefits (Continued)
� When used with third-party device and I/O option.
Note: These specifications are subject to change without notice and represent the maximum capabilities of the product with all options installed. This is not a complete feature list. Features and functionality may vary depending on selected options, firmware version and product model. Please refer to the technical data sheet and user manual for detailed specifications.
Feature Power Xpert Meter Benefit
4000 6000 8000
Communications and I/OModbus TCP ■ ■ ■ Easy integration with standard protocol to power management
and other software.
Modbus RTU ■ ■ ■ Integrate meters to existing Modbus networks, daisy chain several (1–16) meters together.
HTML ■ ■ ■ Communicate to the meter over the Internet via standard Web browser.
SNMP (Simple Network Management Protocol) ■ ■ ■ Communicate with the meter via Simple Network Protocol; hook to existing NMS system.
SMTP (Simple Mail Transfer Protocol) ■ ■ ■ Send e-mail messages via standard Simple Mail Transfer Protocol.
FTP (File Transfer Protocol) ■ ■ ■ Access, copy, paste, cut waveform capture files on the meter with an FTP Client.
NTP (Network Time Protocol) ■ ■ ■ Network Time Protocol support enables the meter to synchronize time over the network up to the 1 millisecond resolution.
COMTRADE, open IEEE standard file format for waveform capture export
■ ■ ■ Import waveform captures in standard IEEE (C37.111-1999) COMTRADE file format to third-party software.
DNP 3.0 over Ethernet (Distributed Network Protocol) ■ ■ ■ Communicate with the meter via DNP 3.0 over Ethernet, hook to existing utility systems.
Trend measurements CSV file export ■ ■ ■ Easily export trend measurements to third-party applications, e.g., Microsoft Excel in standard CSV file format.
I/O (eight digital inputs, three relay outputs, two solid-state KYZ outputs)
■ ■ ■ The Power Xpert Meter I/O Card is extremely flexible and can be used in a large variety of different applications. Digital inputs and relay outputs can be programmed to interact during various conditions defined by the user. Various third-party devices, such as alarm, pulse meters, trip units, sensors can be easily integrated to the Power Xpert Meter. Triggers and events can be tied to the meters standard functions such as, e.g., e-mail, logs and trends.
Time SynchronizationNTP time synchronization up to 1 millisecond accuracy ■ ■ ■ Network Time Protocol support enables the meter to synchronize
time over the network up to the 1 millisecond resolution
GPS time synchronization up to 1 millisecond accuracy ■ � ■ � ■ � The GPS option allows the meter to synchronize time over the GPS satellite positioning system up to the 1 millisecond resolution
LogsTrend logging ■ ■ ■ Log trend information for easy statistical analysis.
Load profile ■ ■ ■ Review the load profile graph to get a better understanding of your electrical load versus time.
Event logging ■ ■ ■ Log events for retrospective event analysis.
Memory and StorageStandard memory, GB 2 4 8 Store large amounts of waveform captures and events for
historical analysis.
HarmonicsHarmonic levels 127 127 127 Provides extremely fast, high resolution D/A conversion.
Total Harmonic Distortion (THD) ■ ■ ■ Review the total harmonic distortion level directly on the meter.
Delta-Sigma D/A conversion technology ■ ■ ■ Provides extremely fast, high resolution D/A conversion.
Harmonics over-sampling (4096 samples per cycle) ■ ■ ■ Over-sampling enables the usage of Anti-Aliasing technology, increasing accuracy.
Anti-alias filtering ■ ■ ■ Technology to remove out-of-band signal components resulting in more accurate data.
Individual harmonics ■ ■ ■ Review individual harmonic levels directly on the meter.
Total Demand Distortion (TDD) ■ ■ ■ Identify harmful harmonics in, e.g., lightly loaded variable-speed drive environments where THD may be high but not relative.
Interharmonics ■ ■ Interharmonics allow you to see what is going on between the integer multiples of the fundamental. Zoom in on the harmonics trend graph and review frequency content every 5 Hz instead of every 60 Hz.

CA08104001E For more information, visit: www.eaton.com/consultants
3.1-9November 2013
Advanced and Electronic Metering
i
ii
1
2
3
4
5
6
7
8
9
10
11
12
13
14
15
16
17
18
19
20
21
Sheet 03
Eaton Advanced MetersPower Xpert Meter 4000/6000/8000 Series
015
Table 3.1-2. Power Xpert Meter 4000/6000/8000—Features and Benefits (Continued)
Note: These specifications are subject to change without notice and represent the maximum capabilities of the product with all options installed. This is not a complete feature list. Features and functionality may vary depending on selected options, firmware version and product model. Please refer to the technical data sheet and user manual for detailed specifications.
Feature Power Xpert Meter Benefit
4000 6000 8000
HighlightsSubcycle disturbance capturing ■ ■ ■ Capture fast voltage changes/low frequency transient
(e.g., capacitor switching transient).
dV/dt triggers for subcycle oscillatory transients ■ ■ ■ Detect and record a large magnitude oscillation transient resulting in equipment damage.
Absolute threshold and dV/dt triggering ■ ■ ■ Detect and record if a surge suppressor is necessary.
Power quality index—standard (includes dv/dt count, %TDDi and %THDv)
■ ■ ■ Complex power quality data put into simple graphic format.
Power quality index—enhanced (includes standard index plus Sag level, swell level and flicker)
■ ■ Complex power quality data put into simple graphic format (includes ITIC events and flicker calculations).
Flicker calculations ■ ■ Detect and quantify low frequency rms voltage variations causing incandescent lighting flicker.
Automatic trigger setting ■ ■ Trigger thresholds are automatically set according to ITIC (CBEMA) standard, no need to figure this out by yourself.
Automatic event severity analysis ■ ■ Automatically analyze the severity of the event with the ITIC (CBEMA) performance curve plot, see where the event actually hit.
Event severity counters ■ ■ An ITIC (CBEMA) event counter keeps track of the number of all sags, swells and transients.
ITIC (Information Technology Industry Council), previously CBEMA performance curve
■ ■ ITIC (Information Technology Industry Council), previously CBEMA performance curve for easy power problem evaluation.
Custom ITIC (CBEMA) plot with individual event magnitude and duration
■ ■ Review custom ITIC (CBEMA) plots of individual events showing you the actual magnitude, duration and hit are in a simple graphical representation.
Event calendar view ■ ■ The Events Timeline calendar view provides instant insight to the frequency of power events and helps detect reoccurring problems.
Events timeline view ■ ■ View and understand the sequence of events that have occurred during a period of time.
Sequence of events and events plot on waveform ■ ■ Plot color-coded events on a captured waveform to gain insight into the sequence of events cycle per cycle.
Power quality index—premium (includes enhanced index plus counts of impulsive transients)
■ Complex power quality data put into simple graphic format (includes ITIC events and flicker calculations).
High-Speed Transient Capture and Detection6 MHz capture of impulsive transients ■ Capture impulsive transients by taking six samples every
millionth of a second.
Transient capture duration: ~20 ms/6M Hz ~120 ms/1 MHz ■ Record and analyze transients during a longer timeframe.
Waveform recorded at 100,000 samples per cycle ■ High-speed ensures impulsive transients are correctly captured (fast rise time).
Three-phase voltage and neutral-to-ground fast transient capture
■ Capture impulsive transients on all four channels.

3.1-10
For more information, visit: www.eaton.com/consultants CA08104001E
November 2013
Advanced and Electronic Metering
i
ii
1
2
3
4
5
6
7
8
9
10
11
12
13
14
15
16
17
18
19
20
21
Sheet 03
Eaton Advanced MetersPower Xpert Meter 4000/6000/8000 Series
016
Power Xpert Meter 4000/6000/8000 Graphic Display (Option) FeaturesA menu-driven graphical display with information organized into a user-friendly information architecture.
The Homepage (see below) offers:
■ Graphical level indicator based on a statistical analysis for three-phase line-to-line and line-to-neutral voltage and per phase currents to quickly indicate out of normal readings
■ Large easy-to-read average L-L voltage average phase currents and system frequency can be highlighted and selected using the navigation control dial to drill down for additional detail
■ Menu selections for meter, power, quality, events and setup are shown for ease of navigation into display for more detail, or basic device setup
Homepage
Highlighting a field such as the avg. current value and pressing the navigation control dial brings up a detail screen like the one below.
Current Summary
Highlighting an individual reading on the detail summary level screen and selecting it drills down to a level including links to min./max., historical trend plots, triggers, harmonic spectral data, and waveform viewing.
Selecting the trend plot for a given parameter displays a historical graph of the selected parameter over the last 16 hours. The zoom buttons change the time scale to one of several data views based on historical averages with min./max. The Pan button allows scrolling within the selected view.
Trend Plot
Waveforms can be displayed for currents and voltages. The waveforms can be viewed on demand for steady-state conditions. Triggered waveforms can also be displayed to view sag/swell or transient data.
Waveform Viewer
Harmonic Spectrum
The harmonic spectral plot displays both harmonics and interharmonics up to the 85th order. A detailed table also includes individual magnitudes and angles of current and voltage harmonics, as well as a harmonic power calculation at each frequency.
Ethernet Settings
Ethernet and other settings can be input or verified via the Power Xpert LCD Display.
Note: Some of the other settings are specific only to the Web Browser GUI.
ITIC Plot (Power Xpert Meter 6000/8000)
The Power Xpert Meter classifies disturbances and summarizes the results graphically using the ITIC plot. The number of ITIC sags and swells are indicated for each of nine severity levels. A pass/fail summary is shown to indicate how many events are outside the ITIC pass zone.

CA08104001E For more information, visit: www.eaton.com/consultants
3.1-11November 2013
Advanced and Electronic Metering
i
ii
1
2
3
4
5
6
7
8
9
10
11
12
13
14
15
16
17
18
19
20
21
Sheet 03
Eaton Advanced MetersPower Xpert Meter 4000/6000/8000 Series
017
Power Xpert Meter Graphic Display (Option) Screens
Meter Top Level ScreenV-LL avg, V-LN avg, IA, IB, IC, Iavg, Freq.
Meter Detail ScreensPer phase detail L-L, L-N, Symmetrical Comp, Aux. Channels, Min./Max. with date/time of occurrence, Trend Plots, Triggers, Phasors.
Power Top Level ScreenThree-Phase Power Factor, kWHr, kWd, Real-Time kW, kVAR, kVA, Load Profile Link.
Power Detail ScreensPer phase detail, kVA, kVAR, kW, Min./Max. with date/time of occurrence, Trend Plots, Triggers.
Quality Top Level Screen10 min. and 24 hr. PQIndex, THDI, THDV, K-Factor, Crest Factor, Flicker Pst, %9’s of Reliability.
Quality Detail ScreensPer phase detail L-L, L-N,V aux, Odd, Even, Interharmonics, Present, Min/Max, Trend Plots, Harmonic spectrum plots, waveform plots.
Events Top Level ScreenActive/Acknowledged Event list, Trig-ger List, System Log, ITIC Curve Link.
Event Detail ScreensEvent List, Condition, Acknowledge Button, Trigger Date/Time, Trigger description.
Setup Top Level ScreenView setup, Edit setup, Login, Logout.
Setup Detail ScreensQuick Setup, Trigger setup, Detail setting.
Power Xpert Meter 4000/6000/8000 Web Browser Views
Power Xpert Meter 4000/6000/8000 Web Browser Homepage (Note: 4000 does not include flicker, ITIC)
Power Xpert Meter 4000/6000/8000 embedded Web server offers Eaton customers a new level of accessibility to the critical information required to manage the electrical distribution system. The embedded Web server includes real time circuit information in both numeric and graphical formats to help monitor circuit parameters such as current loading, voltage and power levels, power factor.
The Web server also provides the energy and demand readings required to help manage the cost of energy. Readings include kWh, kVARh, delivered and received and kVAh with time-of-use and separate status input controlled energy accumulation to account for energy during special times such as rate alert periods or stand-by generator times of operation.
The Web server also includes critical information regarding Power Quality such as harmonic distortion, flicker (Power Xpert Meter 6000/8000), crest factor, K-Factor and more.
Steady-State Waveform
The Web server allows the user to view waveforms of the voltage and current to spot power quality problems such as notching.
Events Timeline (Power Xpert Meter 6000/8000)
View and understand the sequence of events that have occurred during a period of time. Plot color-coded events on captured waveforms to gain insight into the sequence of events from one single cycle to the next one. This provides the user an excellent vantage point to review and compare multiple events at an unprecedented resolution.
Harmonic Spectral Plot
The harmonic spectral plot displays both harmonics and interharmonics up to the 85th order. A detailed table also includes individual magnitudes and angles of current and voltage harmonics, as well as a harmonic power calculation at each frequency. Even, odd and total THD are displayed for diagnostic purposes. In addition, the Power Xpert Meter 6000/8000 provides interharmonics, which allow users to see what is going on between the integer multiples of the fundamental.

3.1-12
For more information, visit: www.eaton.com/consultants CA08104001E
November 2013
Advanced and Electronic Metering
i
ii
1
2
3
4
5
6
7
8
9
10
11
12
13
14
15
16
17
18
19
20
21
Sheet 03
Eaton Advanced MetersPower Xpert Meter 4000/6000/8000 Series
018
Historical Trend Plot
Graphical Trending of DataThe Power Xpert Meter 4000/6000/8000 embedded Web server supports graphical trend charts of key circuit measurements such as current, voltage, power and energy. The trend chart supports a zoom feature that allows the user to view data over a short period of 16 hours or a longer period of 48 months. The trend chart has a horizontal slider bar control to manage scrolling forward and back-ward through the data. Trend charts of basic readings include minimum, maximum and average readings. Trend charts of energy data also display demand values.
Energy Comparison
Energy usage patterns can be effort-lessly analyzed with the month-to-month, week-to-week comparison chart. Raw data can be easily exported with the “Save Table” option to other applications such as Excel for further analysis or graphing (firmware version 12.x.x and higher only).
Note: All data logging for trend plotting is automatically preconfigured in the Power Xpert Meter 4000/6000/8000. In addition, the 6000 and 8000 Series Meters have sag, swell and transient triggers built-in according to the ITIC (CBEMA) standard.
Demand Comparison
Demand comparison compares power consumption day-to-day, month-to-month or week-to-week. Power Xpert Meters can set to measure demand at 1 to 60 minute intervals. Both sliding and fixed interval windows are supported for maximum flexibility.
Disturbance Recording
Sag/Swell Recording60 cycles of waveform are recorded at 256 samples per cycle including 30 cycles of pre and post trigger data. The Power Xpert Meter 4000/6000/8000 embedded Web server supports viewing of triggered waveforms one channel at a time including the ability to zoom and to scroll horizontally using a slider bar. Waveforms are stored in Power Xpert Meter 4000/6000/8000 non-volatile flash memory using an industry standard Comtrade format. Waveforms can be automati-cally sent out by e-mail following an event, or can be retrieved from an FTP directory structure in the meter module’s memory.
ITIC Analysis Plot (Power Xpert 6000/8000)
The ITIC Web page includes counters to track the occurrence of disturbances and a pass/fail summary. In addition, select-ing any disturbance counter links to a detailed event view of the disturbances in that ITIC category. Disturbance wave-forms can be viewed from the browser.
Events Calendar (Power Xpert Meter 6000/8000)
The Events Timeline calendar view provides instant insight to the frequency of power events and helps detect reoccurring problems. Color-coded events can be filtered to detect specific issues.
Web Server Device ConfigurationSpecial software is not required to configure a Power Xpert Meter 4000/6000/8000. The embedded Web server includes comprehensive device setup capability.

CA08104001E For more information, visit: www.eaton.com/consultants
3.1-13November 2013
Advanced and Electronic Metering
i
ii
1
2
3
4
5
6
7
8
9
10
11
12
13
14
15
16
17
18
19
20
21
Sheet 03
Eaton Advanced MetersPower Xpert Meter 4000/6000/8000 Series
019
PQ Index
Figure 3.1-3. PQ Index
A statistical analysis comparing the last 10 minute and 24 hour periods’ Power Quality to the historical norm for the circuit.
The PQ Index score results in a Power Quality rating of Normal, Caution and Alert for the period.
Flicker (EN61000-4-15; Power Xpert Meter 6000/8000)
Figure 3.1-4. Flicker
Flicker values for Perceptibility, PST and PLT are calculated based on EN61000-4-15 guidelines.
Power at a Glance
Figure 3.1-5. Power at a Glance
Easily Upgrade Your Power Xpert Meter 4000 to a 6000Eaton understands that our customers’ needs change over time. That’s why we’ve developed meters that can grow with you. Once a Power Xpert Meter 4000 is purchased, you have the ability to upgrade to a Power Xpert Meter 6000, with no intervention from Eaton, when needed. All the features of the Power Xpert Meter 4000 that you have been using and depend on remain, however, once updated, all the additional features of the Power Xpert Meter 6000 are available. The self-upgrade is available on Eaton’s Web site. You’ll need a credit card, your Power Xpert Meter 4000 serial number and date code (you will be presented with this information if you are using the upgrade link directly from your Power Xpert Meter) and your e-mail address. Once you have completed the purchase, we will send you your new license key information via e-mail that will allow you to complete the upgrade.
■ High-speed triggering of wave-forms based on events such as breaker trips or static transfers
■ Demand interval timing taken from a master utility meter end of interval pulse
Status inputs are self sourced provid-ing a nominal 24 Vdc (20–30 Vdc) across the circuit.
Names can be configured for each input for ease of use.
Relay OutputsThe optional PXIO-B card includes three 5 A form C relay outputs rated for 240 Vac or 30 Vdc. These outputs can be used for applications such as:
■ Alarm annunciation■ KYZ pulse output
Alarm outputs can be driven from triggers based on metering values. Output modes include:
■ Normal—relay energized during alarm condition
■ Latched—relay energized by event trigger, de-energized by acknowledgement
■ Timed—relay energized by event trigger, maintained for a programmed interval
Auxiliary Voltage OptionThe optional auxiliary voltage selection allows for sensing of another input voltage such as a transformer or UPS and secondary voltage from transformer or UPS output. This option permits waveform or harmonic comparisons across these devices.
Discrete Contact InputsThe optional PXIO-B expansion card offers eight digital inputs that are useful for a variety of applications such as:
■ Status indication with time stamping of transitions (1 ms precision)
■ Pulse Counting of KYZ or other utility pulses such as air, water or gas

3.1-14
For more information, visit: www.eaton.com/consultants CA08104001E
November 2013
Advanced and Electronic Metering
i
ii
1
2
3
4
5
6
7
8
9
10
11
12
13
14
15
16
17
18
19
20
21
Sheet 03
Eaton Advanced MetersPower Xpert Meter 4000/6000/8000 Series
020
Communications Expansion Card (CEC)The optional CEC Card offers two Ethernet connection options, 10/100Base-T and a fiber-optic port that can be used for the following applications:
■ Monitoring, managing and configur-ing the meter remotely using a standard Web Browser interface like Microsoft Internet Explorer
■ Alarm notifications via e-mail, SMTP■ Enabling access to the meter’s
FTP server (energy, trend and waveform logs)
■ Providing Modbus TCP/IP or RTU communications to BMS systems
■ Providing DNP 3.0 over Ethernet to utility systems
■ Providing SNMP communications to NMS systems
■ Synchronizing with an NTP server for 1ms timestamping resolution
■ Asset management via SNMP to Network Management Systems
■ Updating firmware on the meter
Figure 3.1-6. Power Xpert Meter 4000/6000/8000 Module Layout
I/O Card (option)� Digital inputs 1-8.� Solid-state outputs 1-2.� Relay outputs 1-3.CT and Voltage Connections� CT input connections. Standard three-phase voltage phase inputs. Auxiliary channel voltage inputs (option).Communication Expansion Card (LAN/WAN Ethernet Networking) (option)� 100FX ST-type Ethernet (multi-mode).� 10/100Base-T Ethernet.� RS-485 (two-wire w/shield)—24V accessory power (Com 2).� RS-232 (Tx Rx) Modbus RTU (Com 3).Standard Features� Local RJ-45 config. port (non-networkable Ethernet).� RS-485 (two-wire w/shield) Modbus RTU (Com 1).� Meter mounting brackets.� Sealable mode switch cover. Control power (100–240 Vac and 110–250 Vdc) (±20%).� Display RS-485 network port (up to 15 meters)—24V accessory power (Com 0).� Meter base address.� Com reset button.
�
�
�
� �
�
�
�
� ��
�
�
�
�
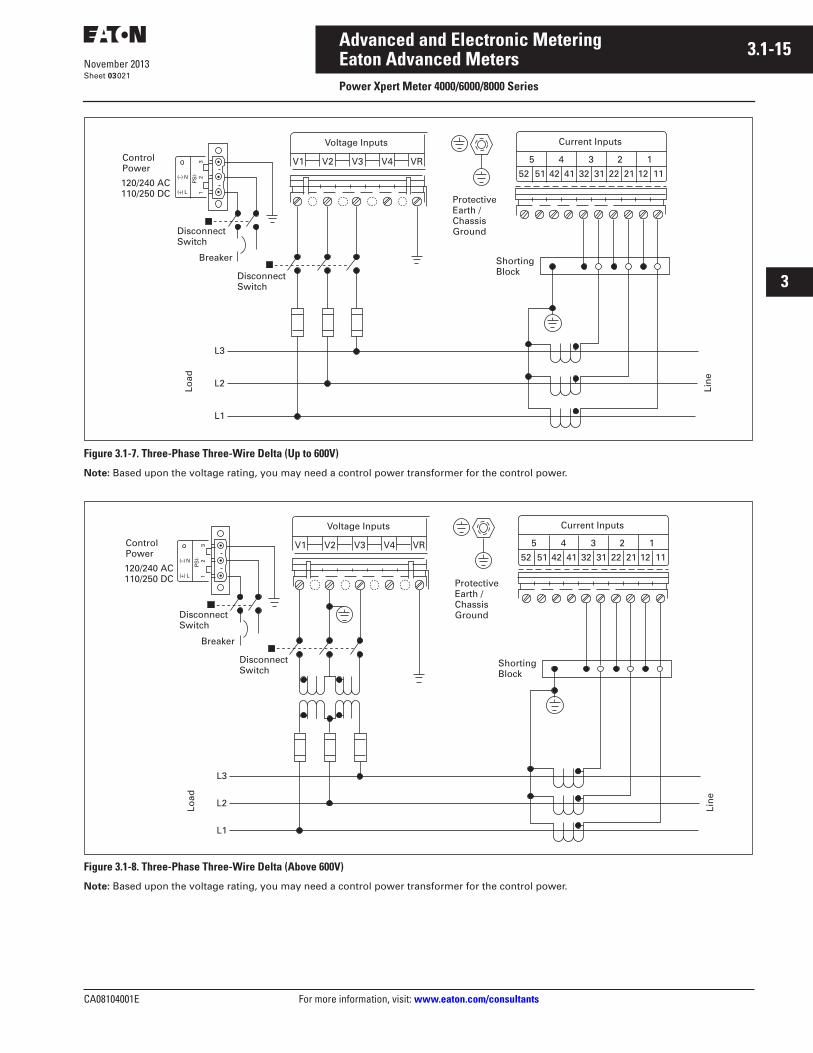
CA08104001E For more information, visit: www.eaton.com/consultants
3.1-15November 2013
Advanced and Electronic Metering
i
ii
1
2
3
4
5
6
7
8
9
10
11
12
13
14
15
16
17
18
19
20
21
Sheet 03
Eaton Advanced MetersPower Xpert Meter 4000/6000/8000 Series
021
Figure 3.1-7. Three-Phase Three-Wire Delta (Up to 600V)
Note: Based upon the voltage rating, you may need a control power transformer for the control power.
Figure 3.1-8. Three-Phase Three-Wire Delta (Above 600V)
Note: Based upon the voltage rating, you may need a control power transformer for the control power.
Voltage Inputs
V1 V2 V3 V4 VR
Disconnect Switch
DisconnectSwitch
Breaker
(+) L
(–) N
12
3ControlPower
L3
L2
L1
Load
Lin
e
ShortingBlock
ProtectiveEarth /ChassisGround
Current Inputs
5 4 3 2 1
52 51 42 41 32 31 22 21 12 11
PS
I-
120/240 AC110/250 DC
Voltage Inputs
V1 V2 V3 V4 VR
Disconnect Switch
DisconnectSwitch
Breaker
(+) L
(–) N
12
3
L3
L2
L1
Load
Lin
e
ShortingBlock
ProtectiveEarth /ChassisGround
Current Inputs
5 4 3 2 1
52 51 42 41 32 31 22 21 12 11
PS
I-
ControlPower
120/240 AC110/250 DC

3.1-16
For more information, visit: www.eaton.com/consultants CA08104001E
November 2013
Advanced and Electronic Metering
i
ii
1
2
3
4
5
6
7
8
9
10
11
12
13
14
15
16
17
18
19
20
21
Sheet 03
Eaton Advanced MetersPower Xpert Meter 4000/6000/8000 Series
022
Figure 3.1-9. Power Xpert Meter 4000/6000/8000 Multimeter Graphic Display (PXD-MMG)—Sold Separately, Supports up to 16 Power Xpert Meter 4000/6000/8000 Modules
Figure 3.1-10. Power Xpert Meter 4000/6000/8000 Module
Turn to Highlight
BACK
Push to Select
Hold in forHelp
PowerXpert EVENTS
DO NOT HIPOT / DIELECTRIC TEST THIS DEVICE COMPLIES WITH PART 15 OF THE FCC RULES. OPERATION IS SUBJECT TO THE FOLLOWING TWO CONDITIONS: 1) THIS DEVICE MAY NOT CAUSE HARMFUL INTERFERENCE, AND
2) THIS DEVICE MUST ACCEPT ANY INTERFERENCE RECEIVED, INCLUDING INTERFERENCE THAT MAY CAUSE UNDESIRED OPERATION.
10/100 T Link
TXD
RX
DG3 -
Power Com 0 3
SH
1234
SHCOM
24+
DG2-
12
DB
DA
DG1-
Display Link24 Vdc Input
Customer Satisfaction for Technical Support
www.eaton.com 1-800-809-2772 or 1-414-449-7100
E18555
G.O.#: XXXXXXXXXX
Catalog#: PX8054A1CB
Model#: PX8000
Serial#: 000042
Style#: 65D8054G010
Power Supply: 24 VDC (+/ -20%)
SELV, 8W MAX.
MADE IN CANADA
Date Code: C050131 Rev: 1
Oper Temp: -20 TO 60°C
4.00 Ref.(101.6)
3.00 Ref.(76.2)
3.00 Ref.(76.2)
1.45(36.8)
1.50(38.1)
5X #8 – 32 ThreadThread Depth 0.31
7.22(183.5)
7.80(198.0)
9.02(229.0)
0.57(14.5)
7.22(183.5)
7.76 Ref.(197.1)
1.04(26.3)
0.46(11.6)
8.20 (208.3)0.42 (10.7) (8.6)
9.56 (242.8)

CA08104001E For more information, visit: www.eaton.com/consultants
3.1-17November 2013
Advanced and Electronic Metering
i
ii
1
2
3
4
5
6
7
8
9
10
11
12
13
14
15
16
17
18
19
20
21
Sheet 03
Eaton Advanced MetersPower Xpert Meter 4000/6000/8000 Series
023
Power Xpert Meters Configuration and Wiring Examples
Figure 3.1-11. Display Link
Figure 3.1-12. Modbus RTU (RS-485)—Non-Web Enabled
Figure 3.1-13. Web Enabled—Browser and Modbus TCP
Figure 3.1-14. Web Enabled—Advanced System Functionality
Figure 3.1-15. Accessories—I/O Card (Option)
Figure 3.1-16. IT Configuration Examples—Accessories—I/O Card (Option)
Display Link (RS-485)
Up to 16 Meters can be Daisy-Chained to aSingle Power Xpert Meter LCD Display
…Upto 16
Display Link (RS-485)
Modbus RTU (RS-485)
Modbus RTU (RS-485)Master
…Upto 16
Display Link (RS-485)
Modbus RTU (RS-485)
Modbus RTU (RS-485)Master
…Upto 16
Modbus TCP Master
Web Browser
Display Link (RS-485)
Modbus RTU (RS-485)
Modbus RTU(RS-485) Master
Modbus TCP Master
Web Browser
Power XpertSoftware
Alarm
Flow Meter(Pulse Count)
• Eight programmable digital inputs• Two solid-state programmable outputs• Three relay programmable outputs
Trip and Sequenceof Events
Rack Monitoring—Open Door/Tamper Switch
Smoke AlarmAlarm
Water Leak and Vibration Sensors
Rack Monitoring— Open Door/Tamper Switch
• Eight programmable digital inputs• Two solid-state programmable outputs• Three relay programmable outputs

3.1-18
For more information, visit: www.eaton.com/consultants CA08104001E
November 2013
Advanced and Electronic Metering
i
ii
1
2
3
4
5
6
7
8
9
10
11
12
13
14
15
16
17
18
19
20
21
Sheet 03
Eaton Advanced MetersPower Xpert Meter 4000/6000/8000 Series
024
Ordering InformationTo order a Power Xpert Meter 4000/6000/8000, the catalog number should be determined using the chart shown in Table 3.1-3. The chart illustrates how to include the desired factory options as part of a catalog number. Option cards that are selected at time of order entry will be installed at the factory. Option cards are also field installable for field upgrades.
If a display is required, it should be ordered separately. The Multi-Meter Graphic Display is capable of display-ing data from an RS-485 daisychain of
up to 16 Power Xpert Meter 4000/6000/8000 meter modules over a distance of up to 2000 ft. Power Xpert meter modules include panel mounting brackets. The Multi-Meter Graphic Display is designed to mount sepa-rately. If back-to-back meter to display panel mounting is desired, a mounting bracket kit is available (PX-PMBA).
Example 1: PXM8251A1BB (PXM 8000 Meter, w/VAUX, Std. Pwr, Com. Exp. and I/O Cards)
Example 2: PXM6251A1BA (PXM 6000 Meter, w/VAUX, Std. Pwr, Com. Exp. Card)
Table 3.1-3. Power Xpert 4000/6000/8000 Meter Catalog Numbering System
Table 3.1-4. Power Xpert Meter 4000/6000/8000 Accessories
� Applicable to PXM 4000 Meters only. Upgrade package to be field loaded by customer.Provides enhanced PXM 6000 functionality in an existing PXM 4000 Meter, including ITIC and calendar functions.
Note: Communication cable (standard Modbus RTU) is not included in the package for meter module connection.
Description CatalogNumber
Digital I/O Card: eight digital input, two solid-state output, three relay outputCommunication expansion card for LAN/WAN Ethernet networking: 100FX fiber-optic, 10/100T, RS-485, RS-232Graphic display module
PXMIO-BPXMCE-B
PXD-MMG
Panel-mounting bracket assembly for back-to-back meter to graphic display mountingPanel-mounting bracket assembly for retrofitting a graphic display to an IQ Analyzer cutoutPanel-mounting bracket assembly for reduced graphic display rear clearance
PX-PMBA
PX-PMBBPX-PMBC
Power Xpert Meter 4000 to 6000 license upgrade key � PXM-4KUPG
PXM 8 0 5 1 A 1 B B
Model Series
4 = 4000 (standardpower quality), 2 GB
6 = 6000 (enhanced power quality), 4 GB
8 = 8000 (premium PQ w/transient capture), 8 GB
Power Supply Configuration
1 = Standard 100–240 Vac or110–250 Vdc power supply
Card Slot 1 Configuration
1 = Standard communications module with RS-485
Card Slot 2 Configuration
A = No card option B = Communication expansion card
for LAN/WAN Ethernet networking w/10/100Base-T,100F, RS-485, RS-232 Ports
Card Slot 3 Configuration
A = No card option B = I/O option card
(eight digital inputs, two solid-state outputs,three relay outputs)
Voltage Input Configuration
0 = Standard (V1, V2, V3, V4)2 = Standard plus auxiliary
(V6, V7, V8)
Example 1: PXM8251A1BB (PXM 8000 Meter, w/VAUX, Std. Pwr, Com. Exp. and I/O Cards)Example 2: PXM6251A1BA (PXM 6000 Meter, w/VAUX, Std. Pwr, Com. Exp. Card)
Technical DataEnvironmental Conditions■ Operating temperature:
❑ Meter: –20° to +70°C❑ Display: –20° to 60°C operating ❑ Storage temperature: –40° to 85°C❑ Operating humidity:
5–95% condensing❑ Device weight: 7.1 lbs—meter
2.1 lbs—display❑ Meter and back of display are
pollution degree 2❑ Elevation to 6562 ft (2000m)
Current Inputs (Each Channel)■ Conversion: 4096 samples per cycle
delta-sigma converter digitally filtered down to 512 samples per cycle
■ CT Input: 4096 rms samples per cycle delta-sigma converter digitally filtered down to 512 samples per cycle for anti-aliasing
■ Burden: less than 10 milliohms■ Overload withstand: 500A for
1 second, non-repeating■ Range: 0.005–20A continuous■ Accuracy: 0.05% or reading plus
0.01% of full scale (from 50 milliamps to 20A)
Voltage Inputs (Each Channel)■ Conversion: 4096 rms samples
per cycle delta-sigma converter digitally filtered down to 512 samples per cycle for anti-aliasing
■ PT input: 120–500,000V primary■ Input range: 600V L-L, 347 L-N
direct connect■ Nominal full scale: 1000V rms■ Input impedance: 2 megohms
Frequency Range ■ 47–63 Hz
Harmonic Response (Voltage, Current)■ 127th harmonic
Accuracy ■ ANSI C12.20 0.2 Class■ IEC 687 0.2 Class
Discrete Inputs■ Self sourced: 24 Vdc
Relay Output Contacts■ 5A maximum, 240 Vac maximum,
30 Vdc maximum■ Lifetime: 1,000,000 no load operations■ 100,000 under rated voltage and load
Solid-State Outputs■ Maximum load: 100 milliamps■ Max. voltage: 30V (externally sourced)
Control Power Input■ Input range AC: 100–240 Vac (±20%)■ Frequency range: 47–63 Hz■ Input range DC: 110–250 Vdc ±20%■ Burden 50 VA■ Ride-through: 1–5s

CA08104001E For more information, visit: www.eaton.com/consultants
3.1-19November 2013
Advanced and Electronic Metering
i
ii
1
2
3
4
5
6
7
8
9
10
11
12
13
14
15
16
17
18
19
20
21
Sheet 03
Eaton Advanced MetersPower Xpert Meter 4000/6000/8000 Series
025
Ethernet-Ready Power Quality & Energy (PQ&E)—Power Xpert Meters
General DescriptionOne or more Ethernet-ready PQ&E Power Xpert Meters may be deployed in various power distribution and motor control applications.
Equipment■ Power Xpert Meter 4000 ■ Power Xpert Meter 6000 ■ Power Xpert Meter 8000
Options■ Ethernet Expansion Card—CEC
(recommended one per meter)■ Local display (one per 16 meters)
Communication Interfaces■ Modbus RTU (RS-485) (standard)■ Display link (RS-485) (standard)■ Modbus TCP/IP (with CEC)■ HTTP (with CEC)■ FTP (with CEC)■ SMTP (with CEC)■ SNMP (with CEC)■ XML/SOAP (with CEC)■ DNP 3.0 (with CEC)
Application Description
Metering/Monitoring Applications■ Identify power quality problems,
view waveforms, monitor circuit loading, and manage energy use via standard Web browser (PXM 4000/6000/8000)
■ View ITIC plots, Enhanced Power Quality Index (PQI), and event/calendar view via Web browser (PXM 6000/8000)
■ Detect and record high-speed transients (PXM 8000)
Installation Applications ■ Low voltage switchgear■ Medium voltage switchgear■ Low voltage motor control centers■ Medium voltage motor starters
Communications Applications■ Building Management System
(BMS)■ Energy Management Systems■ Network Management Systems■ HMI■ Power Xpert Software■ Foreseer Software
Layout Diagrams
Figure 3.1-17. Power Xpert Meter Used in a Modbus RS-485 Network Application
Figure 3.1-18. Power Xpert Meter Used in an Ethernet Network Application
Modbus Master
Modbus RS-458 Networkeolr
Power Xpert Software
Building ManagementSystem
WebBrowser
Network Time Server
XML/SOAP Modbus TCP/IP HTTP NTPEthernet Network

3.1-20
For more information, visit: www.eaton.com/consultants CA08104001E
November 2013
Advanced and Electronic Metering
i
ii
1
2
3
4
5
6
7
8
9
10
11
12
13
14
15
16
17
18
19
20
21
Sheet 03
Eaton Advanced MetersPower Xpert Meter 2000 Series
026
Power Xpert Meter 2000 Series
Power Xpert Meter 2000 Series
General DescriptionThe Power Xpert Meter 2000 Series power quality instrument monitors the most critical aspects of an electrical distribution system. This premier power quality metering instrument uses the latest in advanced technology to make it simple to use, powerful, scalable and highly flexible. The Power Xpert Meter 2000 offers the same level of intuitive user interface design as the Power Xpert Meter 4000/6000/8000, presenting critical electrical distribu-tion system information in a simple to navigate and easy-to-understand information architecture.
The embedded Web server displays comprehensive power quality data using standard Internet browsers and allows for device configuration from the browser. The embedded Web server presents real time, historical, and event information in a browser-style graphical format to help the user interpret information such as current loading, voltage and power levels, power factor, energy usage, I/O status, power quality measurements, as well as harmonic plots. The embedded Web server also allows for waveform capture and for visualizing steady-state harmonic content that is critical for power quality analysis.
The Web server provides the energy and demand readings required to help manage the cost of energy.
Application Description
Identify Power Quality Problems to Help:■ Protect motors from damage■ Preserve the integrity of processes
and batches■ Prevent blown capacitor bank fuses■ Protect transformers and conductors
from overheating
Monitor Circuit Loading to Help:■ Avoid overloads and nuisance
overload trips■ Maximize equipment utilization■ Manage emergency overloads
Manage Energy Utilization to Help:■ Reduce peak demand charges
and power factor penalties■ Identify excessive energy
consumption
Metered/Monitored ParametersNote: See Table 3.1-8.
■ Volts: L-L, L-N, Avg. L-L, Avg. L-N■ Phase and neutral currents■ Power: real, reactive and apparent■ Frequency■ Power factor: apparent■ Energy: real, forward, reverse, sum■ Demand: peak with date and time■ % THD■ Minimum and maximum values■ Harmonics■ Individual harmonics■ Demand comparisons■ Phasors
Accuracy Note: Under typical operating conditions.
■ Currents: 0.1% RV■ Voltage: 0.1% RV■ Energy, and demand power:
0.2% in accordance with ANSI C12.20■ Frequency: ±0.03 hertz■ Power factor: 0.2% RV
CommunicationsMultiple communications ports including:
Standard■ RS-485 Modbus RTU Slave port■ 10/100Base-T Ethernet network port
Communication Protocols Supported■ Modbus RTU■ Modbus TCP■ BACnet/IP■ Ethernet TCP/IP■ HTTP, HTTPS■ NTP (Network Time Protocol)■ SMTP (Simple Mail Transfer
Protocol)■ SNMP (Simple Network
Management Protocol) v1, v3■ DNP 3.0
Physical Characteristics■ Power Xpert Meter 2000 with
integral display■ Power Xpert Meter 2000 transducer
only (no display) meter module■ NEMA rating: NEMA 12, IP42 front
of panel rating
Meter with Integral Display Dimensions■ Height: 4.85 inches (123.2 mm)■ Width: 4.85 inches (123.2 mm)■ Depth:
❑ 3.96 inches (100.5 mm) behind panel surface
❑ 1.01 (25.6 mm) projection in front of panel surface
Standards and Certifications■ UL/cUL Electrical and Electronic
Measuring and Test Equipment 22CZ■ Accuracy: IEC/EN60687 0.2 class,
ANSI C12.20 0.2 Class■ ANSI C62.41 Burst■ CE Mark

CA08104001E For more information, visit: www.eaton.com/consultants
3.1-21November 2013
Advanced and Electronic Metering
i
ii
1
2
3
4
5
6
7
8
9
10
11
12
13
14
15
16
17
18
19
20
21
Sheet 03
Eaton Advanced MetersPower Xpert Meter 2000 Series
027
Power Xpert Meter 2000 Embedded Web ServerThe Power Xpert Meter 2000 embed-ded Web server offers Eaton customers a new level of accessibility to the critical information required to manage their electrical distribution system. The Web server includes real-time information in both numeric and graphical visual formats to help monitor parameters such as current loading, voltage and power levels, power factor, THD, and more. The Web server also provides energy and demand readings with graphic usage plots to help analyze energy usage patterns. Energy read-ings include kWh, kVARh, delivered and received and kVAh with time.
The Power Xpert Meter 2000 embed-ded Web server supports graphical trend charts of key measurements such as current, voltage, power and energy. The trend chart supports a zoom feature that allows the user to view data over predefined ranges from as little as 16 hours to as much as 4 years. The trend chart includes zoom in/out buttons and a horizontal slider bar control to manage scrolling forward and backward through the data. Trend charts of basic readings include minimum, maximum and average readings. Trend charts of interval by interval energy data also display peak demand.
Waveform DisplaySixty cycles of waveform are sampled at 400 samples per cycle. The Power Xpert Meter 2000 embedded Web server offers a view of a single-cycle waveform to visualize steady-state harmonic content. Waveforms are presented via a Web browser. By clicking refresh, the waveform is updated to that period in time.
Waveform Recording The Power Xpert Meter 2000 can record waveforms at up to 512 samples per cycle. Waveform captures are automatically stored on the FTP server in the IEEE standard COMTRADE file format. This allows users to view and analyze the waveforms in any standard free-of-charge or commercial COMTRADE file viewer.
Historical Trend LoggingThe Power Xpert Meter 2000 records historical data for graphical viewing from the embedded Web server. Graphical views of historical data support pan and zoom. Over 100 standard metering parameters are logged as part of the standard meter functionality including min./max. and average for each parameter. The averages are calculated over the interval period.
Energy Profile DataThe Power Xpert Meter 2000 records Real and Reactive energy forward, reverse, net and absolute sum, as well as Apparent energy (kVAH). These readings are stored on a fixed 5 minute interval. Up to 4 status inputs can be configured as energy accumu-lators for counting KYZ pulse inputs.
Demand ComparisonsDemand usage patterns can be analyzed with the month-to-month, week-to-week comparison chart built into the meter. Raw data can be exported as a .csv file with the “Save Table” option to other applications for further analysis and graphing.
Event TriggersThe Power Xpert Meter 2000 has two levels of configurable event triggers:
■ On-board meter limits (PXM 2260/2270/2280/2290)
■ On-board gateway card limits
The on-board meter limits can be set for any measured parameter, for up to 16 limits. If either of the 16 limits are exceeded, an alarm condition will be present and illuminate one of the LEDs on the meter faceplate. The on-board meter out of limits can also be used to energize a relay output, if so equipped.
The on board gateway limits can trigger an alarm off of any measured parameter on any of the PXM 2000 model series. These triggers permit pickup, reset and pickup delay to be configured by the user.
Event LoggingThe Power Xpert Meter 2000 embedded Web server allows the user to view a list of triggered events. In addition, a separate system log records system operations such as resets.
E-mailThe Power Xpert Meter 2000 contains the ability to send e-mails based on an event that has been triggered or cleared along with the option to send an event or data log file. The Power Xpert Meter 2000 also has the ability to send a configurable periodic e-mail with meter information.
Inputs and OutputsPower Xpert Meter 2000 is available with a standard KYZ output. The base meter also includes two expansion slots for plug-in cards. See Figure 3.1-19 on Page 3.1-23 for details. The Power Xpert Meter 2000 embedded Web server card takes up one of these option slots, leaving an additional slot that can be populated by one of the following I/O cards.
■ Two relay outputs/two status inputs■ Four KYZ pulses/four status inputs■ Four analog outputs 0–1 mA■ Four analog outputs 4–20 mA
Inputs can also be configured for demand synch and pulse counting. Inputs selected for pulse counting can be scaled. Accumulated pulse recordings are maintained in profile memory. Outputs can be used for alarm annunciation.
Ratings■ Application to any PT ratio, no PTs
required to 600 Vac■ CT ratios to any CT ratio■ CT inputs available as 5 or 1A
secondary■ Separate Source Control Power
Input:❑ 90–265 Vac or 100–370 Vdc❑ Low voltage 18–60 Vdc
Displayed Information■ Monitored information is available
locally through the display, the Web browser or system power management software
■ True rms values through 40th harmonic
■ ANSI C12.20 Class 0.2% revenue metering specification
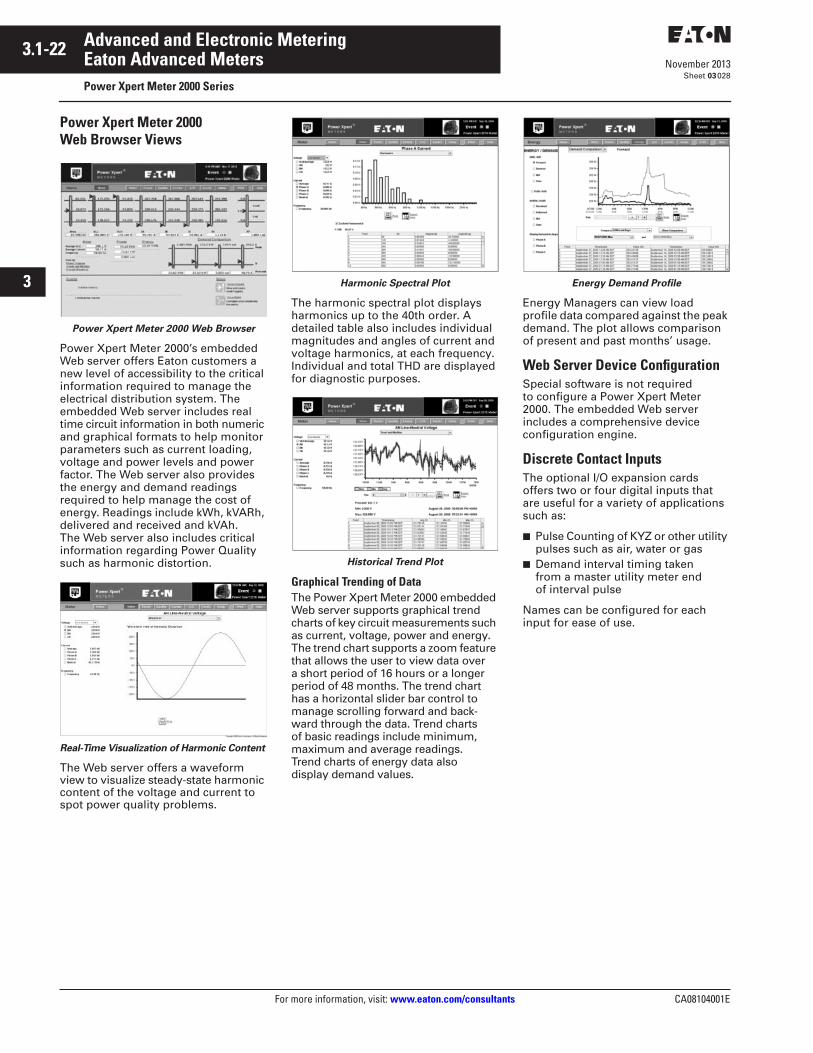
3.1-22
For more information, visit: www.eaton.com/consultants CA08104001E
November 2013
Advanced and Electronic Metering
i
ii
1
2
3
4
5
6
7
8
9
10
11
12
13
14
15
16
17
18
19
20
21
Sheet 03
Eaton Advanced MetersPower Xpert Meter 2000 Series
028
Power Xpert Meter 2000 Web Browser Views
Power Xpert Meter 2000 Web Browser
Power Xpert Meter 2000’s embedded Web server offers Eaton customers a new level of accessibility to the critical information required to manage the electrical distribution system. The embedded Web server includes real time circuit information in both numeric and graphical formats to help monitor parameters such as current loading, voltage and power levels and power factor. The Web server also provides the energy and demand readings required to help manage the cost of energy. Readings include kWh, kVARh, delivered and received and kVAh. The Web server also includes critical information regarding Power Quality such as harmonic distortion.
Real-Time Visualization of Harmonic Content
The Web server offers a waveform view to visualize steady-state harmonic content of the voltage and current to spot power quality problems.
Harmonic Spectral Plot
The harmonic spectral plot displays harmonics up to the 40th order. A detailed table also includes individual magnitudes and angles of current and voltage harmonics, at each frequency. Individual and total THD are displayed for diagnostic purposes.
Historical Trend Plot
Graphical Trending of DataThe Power Xpert Meter 2000 embedded Web server supports graphical trend charts of key circuit measurements such as current, voltage, power and energy. The trend chart supports a zoom feature that allows the user to view data over a short period of 16 hours or a longer period of 48 months. The trend chart has a horizontal slider bar control to manage scrolling forward and back-ward through the data. Trend charts of basic readings include minimum, maximum and average readings. Trend charts of energy data also display demand values.
Energy Demand Profile
Energy Managers can view load profile data compared against the peak demand. The plot allows comparison of present and past months’ usage.
Web Server Device ConfigurationSpecial software is not required to configure a Power Xpert Meter 2000. The embedded Web server includes a comprehensive device configuration engine.
Discrete Contact InputsThe optional I/O expansion cards offers two or four digital inputs that are useful for a variety of applications such as:
■ Pulse Counting of KYZ or other utility pulses such as air, water or gas
■ Demand interval timing taken from a master utility meter end of interval pulse
Names can be configured for each input for ease of use.

CA08104001E For more information, visit: www.eaton.com/consultants
3.1-23November 2013
Advanced and Electronic Metering
i
ii
1
2
3
4
5
6
7
8
9
10
11
12
13
14
15
16
17
18
19
20
21
Sheet 03
Eaton Advanced MetersPower Xpert Meter 2000 Series
029
Relay OutputsThe optional I/O card includes two 5A Form C relay outputs rated for 240 Vac or 30 Vdc or 4 Form A solid-state outputs. These outputs can be used for applications such as
■ Alarm annunciation■ KYZ pulse output
Alarm outputs can be driven from triggers based on metering values.
Analog OutputsThe optional IO card includes either four 4–20 mA outputs or 0–1 mA outputs. These outputs can be used for applications such as:
■ Input to BMS or PLC systems for tracking a measured meter parameter
Standard Communications CardThe standard communications card provides one Ethernet connection and 10/100Base-T port (copper only) that can be used for the following applications:
■ Monitoring, managing and configur-ing the meter remotely using a standard Web Browser interface
■ Alarm notifications via e-mail, SMTP■ Providing Modbus TCP/IP, RTU
and BACnet/IP communications to BMS systems
■ Providing SNMP communications to NMS systems
■ Synchronizing with an NTP server■ Asset management■ Updating firmware on the meter
Figure 3.1-19. PXM 2000 Rear View� Power supply inputs� System voltage inputs� NEMA 12 gasket� RS-485� KYZ out� Meter gateway card� I/O slot
�
�
�
�
�

3.1-24
For more information, visit: www.eaton.com/consultants CA08104001E
November 2013
Advanced and Electronic Metering
i
ii
1
2
3
4
5
6
7
8
9
10
11
12
13
14
15
16
17
18
19
20
21
Sheet 03
Eaton Advanced MetersPower Xpert Meter 2000 Series
030
Figure 3.1-20. Service: Wye or Delta, Four-Wire with No PTs, Two or Three CTs
Note: Based upon the voltage rating, you may need a control power transformer for the control power.
Figure 3.1-21. Service: Delta, Three-Wire with No PTs, 2 CTs
Note: Based upon the voltage rating, you may need a control power transformer for the control power.
GNDL (+)N (–)VRefABC
HI
LO
Ic
HI
LO
Ib
HI
LO
Ia
A B C
A B C
ControlPowerSupply
N
N
GNDL (+)N (–)VRefABx
HI
LO
Ic
HI
LO
Ib
HI
LO
Ia
A B C
A B C
PowerSupply
N
N
C
B A
C
B
A
90–265 Vac100–370 VdcOptional 18–60 Vdc
GNDL (+)N (–)VRefABC
HI
LO
Ic
HI
LO
Ib
HI
LO
Ia
A B C
A B C
ControlPowerSupply
C
B A
or
C
B A
Not Connected to Meter
90–265 Vac100–370 VdcOptional 18–60 Vdc
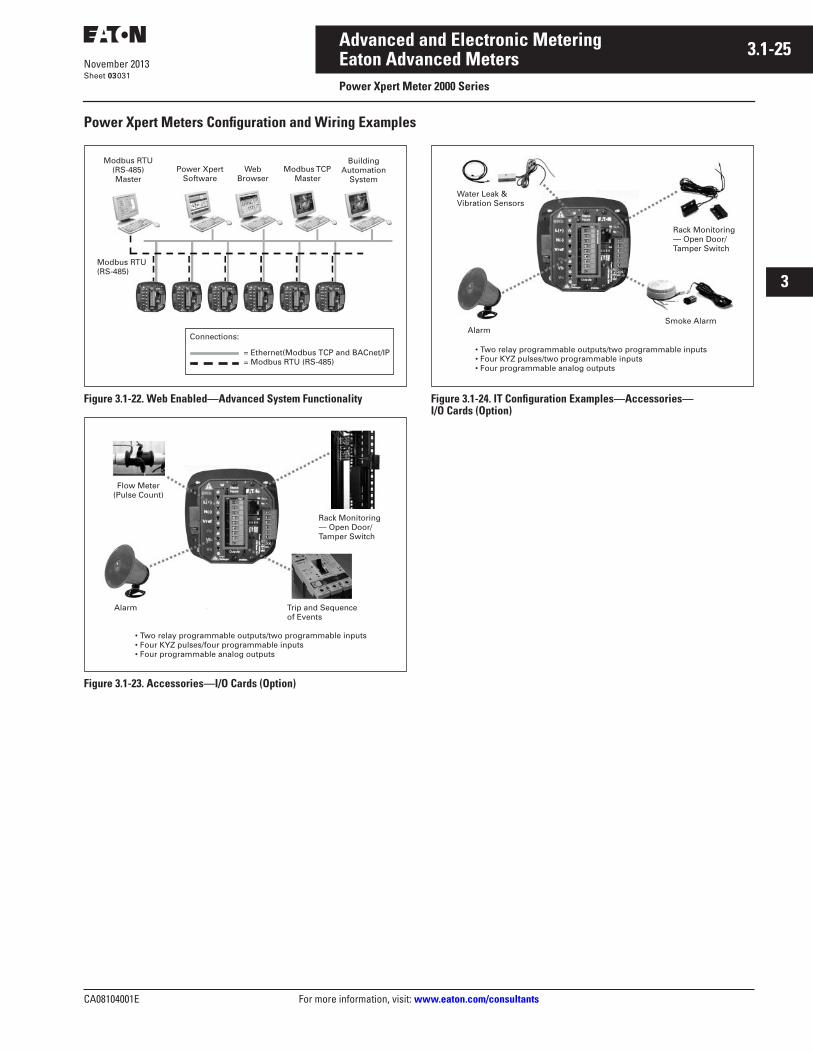
CA08104001E For more information, visit: www.eaton.com/consultants
3.1-25November 2013
Advanced and Electronic Metering
i
ii
1
2
3
4
5
6
7
8
9
10
11
12
13
14
15
16
17
18
19
20
21
Sheet 03
Eaton Advanced MetersPower Xpert Meter 2000 Series
031
Power Xpert Meters Configuration and Wiring Examples
Figure 3.1-22. Web Enabled—Advanced System Functionality
Figure 3.1-23. Accessories—I/O Cards (Option)
Figure 3.1-24. IT Configuration Examples—Accessories—I/O Cards (Option)
Modbus RTU(RS-485)
Modbus RTU(RS-485)Master
Modbus TCP Master
Web Browser
Power XpertSoftware
Connections:
= Ethernet(Modbus TCP and BACnet/IP= Modbus RTU (RS-485)
BuildingAutomation
System
Alarm
Flow Meter(Pulse Count)
• Two relay programmable outputs/two programmable inputs• Four KYZ pulses/four programmable inputs• Four programmable analog outputs
Trip and Sequenceof Events
Rack Monitoring— Open Door/Tamper Switch
Smoke AlarmAlarm
Water Leak & Vibration Sensors
Rack Monitoring— Open Door/Tamper Switch
• Two relay programmable outputs/two programmable inputs• Four KYZ pulses/two programmable inputs• Four programmable analog outputs

3.1-26
For more information, visit: www.eaton.com/consultants CA08104001E
November 2013
Advanced and Electronic Metering
i
ii
1
2
3
4
5
6
7
8
9
10
11
12
13
14
15
16
17
18
19
20
21
Sheet 03
Eaton Advanced MetersPower Xpert Meter 2000 Series
032
PXM 2000 Dimensions
Figure 3.1-25. PXM 2000 Display Front View
Figure 3.1-26. PXM 2000 Meter/Display Side View
Figure 3.1-27. PXM 2000 Transducer Only Side View
Figure 3.1-28. PXM 2000 Rear View Figure 3.1-29. ANSI Mounting Panel Cutout Figure 3.1-30. DIN Mounting Cutout
4.85(123.2)
4.85(123.2)
5.02(127.5)
0.95(24.0) 3.25
(82.6)
0.08(2.0)
0.77(19.6)
4.85(123.2)
0.91(23.1) 3.25
(82.6)
0.77(19.6)
3.54(89.9)
3.54(89.9)
4.0(101.6)
3.38(85.9)
1.69(42.9)
4 x .02(0.5)
3.62(92.0)
3.62(92.0)

CA08104001E For more information, visit: www.eaton.com/consultants
3.1-27November 2013
Advanced and Electronic Metering
i
ii
1
2
3
4
5
6
7
8
9
10
11
12
13
14
15
16
17
18
19
20
21
Sheet 03
Eaton Advanced MetersPower Xpert Meter 2000 Series
033
Ordering InformationTo order a Power Xpert Meter 2000, the catalog number should be determined using the chart shown in Table 3.1-5. The chart illustrates how to include the desired factory options as part of a catalog number. Option cards that are selected at time of order entry will be installed at the factory. Option cards are also field installable for future upgrades.
Power Xpert Meter modules include panel mounting brackets.
Example 1: PXM2270MA65145 (PXM 2270 Meter/Display 60 Hz, 5A, 90–265 Vac/Vdc W/4AO).
Example 2: PXM2250MA65105 (PXM 2250 Meter/Display 60 Hz, 5A, 90–265 Vac/Vdc).
Table 3.1-5. Power Xpert Meter 2000 Catalog Numbering System
� Refer to Table 3.1-8 for model-specific features.
Table 3.1-6. Power Xpert 2000 Meter Accessories
Table 3.1-7. Power Xpert Meter 2000 I/O Cards
Description Catalog Number
Panel-mounting bracket assembly for retrofitting a PXM 2000 to an IQ Analyzer/IQ DP-4000/IQ data cutout
IQ250-PMAK
PXM 2000 gateway card kit to upgrade an IQ 250/260 to a PXM 2000 PXM2000-GCK
Description Catalog Number
PXM 2000 I/O card—2 relay outputs/2 status inputs IQ250/260-IO1
PXM 2000 I/O card—4 KYZ pulses/4 status inputs IQ250/260-IO2
PXM 2000 I/O card—4 analog outputs 0–1 mA IQ250/260-IO3
PXM 2000 I/O card—4 analog outputs 4–20 mA IQ250/260-IO4
PXM 2250 M A 6 5 1 0 5
Frequency
5 = 50 Hz system6 = 60 Hz system
I/O Slot 2
5 = Gateway card
I/O Slot 1
0 = None1 = Two relay outputs/two status inputs2 = Four KYZ pulses/four status inputs3 = Four analog outputs: 0–1 mA4 = Four analog outputs: 4–20 mA
Model Series �
2250 = Energy meter2260 = Power quality meter2270 = Power quality plus meter2280 = Power quality plus with
up to 64 samples/cyclewaveform recording meter
2290 = Power quality plus withup to 512 samples/cyclerecording meter
Example 1: PXM2270MA65145 (PXM 2270 meter/display 60 Hz, 5A, 90–265 Vac/Vdc W/4AO)Example 2: PXM2250MA65105 (PXM 2250 meter/display 60 Hz, 5A, 90–265 Vac/Vdc)
Current Input
1 = 1A secondary5 = 5A secondary
Power Supply
1 = 90–265 Vac/Vdc4 = 24–60 Vdc
Meter Type
M = Meter (with integral display)
T = Transducer only (no display)

3.1-28
For more information, visit: www.eaton.com/consultants CA08104001E
November 2013
Advanced and Electronic Metering
i
ii
1
2
3
4
5
6
7
8
9
10
11
12
13
14
15
16
17
18
19
20
21
Sheet 03
Eaton Advanced MetersPower Xpert Meter 2000 Series
034
Technical Data
PXM 2000 Series Electronic Power Meter Technical Information
Current Inputs■ Class 10: 5A nominal, 10A maximum■ Class 2: 1A nominal, 2A maximum■ Fault current withstand:
❑ 100A for 10 seconds❑ 300A for 3 seconds❑ 500A for 1 second
■ Continuous current withstand: 20A for screw terminated or pass-through connections
■ Programmable current: full scale to any CT ratio
■ Burden: 0.005 VA per phase maximum at 11A
■ Pickup current: 0.1% of nominal❑ Class 10: 5 mA❑ Class 2: 1 mA
■ Connections:❑ Pass-through wire gauge
dimension: 0.177 inches (4.5 mm)❑ Quick connect: 0.25-inch
(6.35 mm) male tab
Voltage Inputs■ Range:
❑ Line-to-neutral 20–576 Vac❑ Line-to-line 0–721 Vac
■ Programmable voltage range: full scale to any PT ratio
■ Supported systems:❑ 3 element wye, 2.5 element wye ❑ 2 element delta, four-wire delta
systems■ Input impedance: 1 megohm/phase ■ Burden: 0.36 VA/phase maximum
at 600V; 0.014 VA at 120V■ Connection: 7-pin 0.400-inch
pluggable terminal block, AWG #12–26 (0.129–3.31 mm2)
Isolation■ All inputs and outputs are galvani-
cally isolated to 2500V
Environmental Ratings■ Operating temperature: –20° to 70°C■ Storage temperature: –20° to 70°C■ Operating humidity: to 95% RH
noncondensing■ Faceplate rating:
❑ NEMA 12❑ Mounting gasket included
Sensing Method■ Voltage, current: true rms■ Power: sampling at over 400
samples per cycle on all channels■ Harmonics Resolution: 40th order
Update Rate■ Watts, VAR and VA: 100 msec at
60 Hz■ All other parameters: 1 second
at 60 Hz
Power Supply■ AC/DC voltage option: 90–265 Vac
at 50/60 Hz or 100–370 Vdc, universal AC/DC supply
■ Low voltage DC voltage option: 18–60 Vdc
■ Burden: 10 VA maximum
Serial Communications Format■ Connection type: RS-485
(through back plate)■ Com port baud rate: 9600–
57,600 bauds■ Com port address: 01–247■ Data format: 8-bit, no parity■ Protocols: Modbus ASCII, RTU
or DNP 3.0
Network Communications Format■ Connection type: RJ-45
10/100Base-T Ethernet Network port■ Protocols: Ethernet TCP/IP,
Modbus TCP, BACnet/IP, HTTP, HTTPS, NTP, SMTP, SNMP
KYZ Pulse■ Contacts: 1 Form A■ On resistance, maximum: 35 ohms■ Peak switching voltage: 350 Vdc■ Continuous load current: 120 mA■ Peak load current: 350 mA (10 ms)■ Off-state leakage current at 350 Vdc:
1 uA■ Opto-isolation: 3750 Vac
Dimensions and Shipping■ Weight: 2 lbs (0.91 kg)■ Basic unit: H 5.00 x W 4.90 x L 5.00
inches (H 127.0 x W 124.5 x L 127.0 mm)
■ PXM 2000 Series: mounts in 3.62-inch (92.0 mm) DIN and ANSI C39.1 round cut-outs
■ Shipping container dimensions: 6.00-inch (152.4 mm) cube
■ Tolerance: ±0.1 inches (2.54 mm)
Compliance■ IEC/EN60687: 0.2% accuracy■ ANSI C12.20: 0.2% accuracy■ ANSI C62.41: burst■ UL/cUL: Electrical & Electronic
Measuring & Test Equipment 22CZ■ CE

CA08104001E For more information, visit: www.eaton.com/consultants
3.1-29November 2013
Advanced and Electronic Metering
i
ii
1
2
3
4
5
6
7
8
9
10
11
12
13
14
15
16
17
18
19
20
21
Sheet 03
Eaton Advanced MetersPower Xpert Meter 2000 Series
035
Power Xpert Meter 2250■ Measures basic meter parameters■ 256 MB for data logging■ Ethernet■ On-board gateway card
limits/alarms
Power Xpert Meter 2260Features of PXM 2250 plus:■ Harmonics■ On-board meter hardware limits to
activate optional relay outputs■ Visual indication of limits exceeded
at meter face■ 512 MB for data logging
Power Xpert Meter 2270Features of PXM 2260 plus:■ Harmonics, including individual■ Waveform view to visualize
steady-state harmonic content■ 768 MB for data logging
Power Xpert Meter 2280Features of 2270 plus:
■ Up to 64 samples per cycle for waveform recording
■ Configuration of total, pre- and post-event cycles.
Power Xpert Meter 2290Features of 2280 plus:
■ Up to 512 samples per cycle for waveform recording
Table 3.1-8. Power Xpert Meters 2250/2260/2270—Features and Benefits
Note: These specifications are subject to change without notice and represent the maximum capabilities of the product with all options installed. This is not a complete feature list. Features and functionality may vary depending on selected options, firmware version and product model. Please refer to the technical data sheet and user manual for detailed specifications.
Feature Power Xpert Meter Benefit
2250 2260 2270 2280 2290
GeneralEmbedded Web Server ■ ■ ■ ■ ■ Use a standard Web browser to monitor and
manage the meter over the network, Internet.
Firmware flash update support ■ ■ ■ ■ ■ Enables you to flash the meter with thelatest firmware updates.
Power, Energy and DemandVoltage, current: per phase minimum, maximum, average, trend graph analysis, export, print
■ ■ ■ ■ ■ Review voltage and current trends, export, print and analyze parameters right on the meter or external software.
Demand plot comparisons month-to-month, week-to-week
■ ■ ■ ■ ■ Plot two months or two weeks for vivid demand comparison.
Power, apparent, real, reactive, power factor ■ ■ ■ ■ ■ Review power usage and power factor and avoid potential PF penalties.
Energy, demand: forward, reverse, net, sum, TOU, profile, export, print
■ ■ ■ ■ ■ Keep track of your energy usage, identify peaks to conserve energy usage.
Power Quality AnalysisStatistical analysis (minimum, maximum, average) ■ ■ ■ ■ ■ Review statistical trends, identify past and
future problem areas.
Sampling rate, maximum samples/cycle 400 400 400 400 400 High sampling rate resulting in high accuracy.
SecuritySecure two level user access privileges ■ ■ ■ ■ ■ Define appropriate security access level per user.
CommunicationsModbus TCP ■ ■ ■ ■ ■ Easy integration with standard protocol to power
management and other software.
Modbus RTU ■ ■ ■ ■ ■ Integrate meters to existing Modbus networks, daisy chain several (1–32) meters together.
HTTP, HTTPS ■ ■ ■ ■ ■ Communicate to the meter over the Internet via standard Web browser.
SNMP (Simple Network Management Protocol) ■ ■ ■ ■ ■ Communicate with the meter via Simple Network Protocol; hook to existing NMS system.
SMTP (Simple Mail Transfer Protocol) ■ ■ ■ ■ ■ Send e-mail messages via standard Simple Mail Transfer Protocol.
NTP (Network Time Protocol) ■ ■ ■ ■ ■ Network Time Protocol support enables the meter to synchronize time over the network.
DNP 3.0 ■ ■ ■ ■ ■ Easy integration with serial DNP networks.
Trend measurements CSV file export ■ ■ ■ ■ ■ Easily export trend measurements to third-party applications, in standard CSV file format.

3.1-30
For more information, visit: www.eaton.com/consultants CA08104001E
November 2013
Advanced and Electronic Metering
i
ii
1
2
3
4
5
6
7
8
9
10
11
12
13
14
15
16
17
18
19
20
21
Sheet 03
Eaton Advanced MetersPower Xpert Meter 2000 Series
036
Table 3.1-8. Power Xpert Meters 2250/2260/2270—Features and Benefits (Continued)
Note: These specifications are subject to change without notice and represent the maximum capabilities of the product with all options installed. This is not a complete feature list. Features and functionality may vary depending on selected options, firmware version and product model. Please refer to the technical data sheet and user manual for detailed specifications.
Feature Power Xpert Meter Benefit
2250 2260 2270 2280 2290
LogsTrend logging ■ ■ ■ ■ ■ Log trend information for easy statistical analysis.
Load profile ■ ■ ■ ■ ■ Review the load profile graph to get a better understanding of your electrical load versus time.
Event logging ■ ■ ■ ■ ■ Log events for retrospective event analysis.
Memory and StorageStandard memory, MB 256 512 768 768 768 Store trend data and events for historical analysis.
HarmonicsHarmonic levels 40th 40th 40th 40th Allows you to identify potential harmful harmonics.
Total Harmonic Distortion (THD) ■ ■ ■ ■ Review the total harmonic distortion level directly on the meter.
Individual harmonics ■ ■ ■ Provides simple metric for power quality viewable from the embedded Web server.
WaveformWaveform display ■ ■ ■ Waveform view on a PC to visualize steady-state harmonic content
through embedded Web server to identify power quality issues.
Waveform recording 64 512 Ability to record waveforms up to specified samples/cycle.
I/OI/OTwo relay outputs/two status inputsFour KYZ pulses/four status inputsFour analog outputs 0–1 mA Four analog outputs 4–20 mA
Optional Optional Optional Optional Optional The Power Xpert Meter 2000 I/O Cards are extremely flexible and can be used in a large variety of different applications. Digital inputs and relay outputs can be programmed to interact during various conditions defined by the user. Various third-party devices, such as alarms, pulse meters, trip units and sensors, can be easily integrated to the Power Xpert Meter 2000. Triggers and events can be tied to the meter’s standard functions such as e-mail, logs and trends. Analog outputs can be programmed to output meter parameters to BMS or PLC systems.

CA08104001E For more information, visit: www.eaton.com/consultants
3.1-31November 2013
Advanced and Electronic Metering
i
ii
1
2
3
4
5
6
7
8
9
10
11
12
13
14
15
16
17
18
19
20
21
Sheet 03
Eaton Advanced MetersPower Xpert Energy Viewer
037
Power Xpert Energy Viewer
General DescriptionThe Power Xpert Energy Viewer (PXEV) provides the means to develop an energy usage baseline for energy management programs, comparing interval logged data points. It is a free Web download for compatible Eaton product home pages. This tool allows easy interpretation of the data collected by compatible devices via graphical charts, graphs and reports without having to export the available .csv file into Microsoft Excel or another tool.
Application DescriptionThe PXEV is a versatile tool suited for a wide range of customer applications. Two basic examples are presented below.
Schools and DormitoriesAn excellent application for the PXEV is a “Schools and/or Dormitory” scenario where each elementary school in a school district or college dorm (building) on a campus has a three-phase main meter. The PXEV could be used to graphically compare each building, thus determining which is the most energy efficient.
Monitoring Secondary TransformersPXEV users can monitor the secondary of three-phase transformers (kVA) to compare transformer loading over time. This determines the unused, available capacity when expansion projects are planned and engineers need to determine if additional power transformers need to be purchased/installed. In the case where more transformers are not necessary to carry the expansion load, the information from the PXEV can assist in providing significant monetary savings.
Features■ Quickly add an Eaton device
specified above using its IP address■ Compare two devices’ energy usage■ Compare last month to the
current month■ Develop an energy baseline■ Customize/specify values from
the source:❑ Invert values❑ Magnitude❑ Resolution❑ Interpolation
■ Customize data range for summary data
The final report consists of four tabs. The first tab, the Power tab, shows the statistics on the raw power data. The Day, Week and Month tabs show the statistics for energy, calculated by integrating the power over the corresponding interval duration. Users can select up to four different devices for energy comparison.
Compatible Devices■ Power Xpert Meter 2000 series■ Power Xpert Meter 4000/6000/
8000 series■ Power Xpert Gateway 600A
(connected devices that capture watt and kWh values, i.e., IQ 100 series)
■ Power Xpert Gateway PDP card■ Power Xpert Gateway
Series 1000 card
Summary Report: Select the different tabs to view the appropriate energy values. The Power tab shows kW or MW power on a 15-minute demand window (normal setting on our devices). The Day/Week/Month tabs show kWh or MWh for those time periods.
Comparison Summary: Users can select up to four different devices for energy comparison. This graphic shows two devices.

3.1-32
For more information, visit: www.eaton.com/consultants CA08104001E
November 2013
Advanced and Electronic Metering
i
ii
1
2
3
4
5
6
7
8
9
10
11
12
13
14
15
16
17
18
19
20
21
Sheet 03
Eaton Advanced MetersIQ 250/260 Series
038
IQ 250/260 Series Electronic Power Meters
IQ 250/260 Electronic Power Meter
General DescriptionThe IQ 250 and IQ 260 meters provide capabilities you would not normally expect in affordable, ultra-compact meters, such as fast sampling rate and accurate metering for a full range of power attributes. Providing the first line of defense against costly power problems, Eaton’s IQ 250 and IQ 260 electronic power meters can perform the work of an entire wall of legacy metering equipment using today’s technology.
When space is at a premium, yet you need ANSI C12.20 accuracy, the IQ 250/ 260 series fit the bill. These meters are ideal for electrical equipment assem-blies, machine control panels, such as panelboard and switchboard mains and feeders, low voltage metal-enclosed switchgear feeders and motor control centers. Requiring far less space than other meters with similar functionality, IQ 250/260 series fit into a standard ANSI or IEC cutout on a panelboard or other electrical equipment, and there-fore fit easily into retrofit applications.
Application Description■ Utility and commercial metering■ Substations, industrial facilities,
power generation sites and campuses■ Submetering■ Load studies and voltage recording■ Analog meter replacement
Features and Benefits■ Measure and display real-time
information about critical power parameters with a sampling rate of 400 samples per cycle
■ Monitor power utilization and quality with ANSI C12.20 accuracy (0.2%)
■ Optional 128 KB for data logging, which guards against loss of historical data
■ Verify meter accuracy with KYZ test pulse self-certification capabilities
■ Standard Modbus RTU communications
■ Available as transducer only or with display
■ Field upgradeable to a Power Xpert Meter 2000
■ Integrate into Eaton’s Power Xpert Architecture for a holistic system-level view
Additional Features
Table 3.1-9. Features of IQ 250 and IQ 260 Electronic Power Meters
� Digital Out with IQ 250 requires external command.� Requires external power supply.
Features IQ 250 IQ 260
InstrumentationCurrent, per phase ■ ■
Current demand ■ ■
Calculated neutral current ■ ■
Voltage, per phase (L-L, L-N) ■ ■
Frequency ■ ■
Power, Energy and DemandReal, reactive and apparent power, total and per phase (kW, kVAR, kVA) ■ ■
Real, reactive and apparent energy, total and per phase (kWh, kVARh, kVAh) ■ ■
Real, reactive and apparent power demand ■ ■
Power factor, total and per phase ■ ■
Min./max. readings, I, V, PF, F, THD (IQ 260), kW, kVAR, kVA ■ ■
Demand MethodsBlock interval (sliding, fixed) ■ ■
Data Logging128 KB for data logging Optional Optional
CommunicationsRS-485 ■ ■
KYZ output ■ ■
Modbus RTU ■ ■
Modbus ASCII ■ ■
DNP 3.0 ■ ■
I/OTwo digital in/two digital out � Optional Optional
Four digital in/four KYZ out Optional Optional
Four analog output (4–20 mA) � Optional Optional
Four analog output (0–1 mA) Optional Optional
Power Quality AnalysisTotal Harmonic Distortion (THD) voltage and current per phase ■
AlarmingSet point driven alarm ■

CA08104001E For more information, visit: www.eaton.com/consultants
3.1-33November 2013
Advanced and Electronic Metering
i
ii
1
2
3
4
5
6
7
8
9
10
11
12
13
14
15
16
17
18
19
20
21
Sheet 03
Eaton Advanced MetersIQ 250/260 Series
039
Technical Data and Specifications
Table 3.1-10. IQ 250/260 Electronic Power Meter Technical Information Description Specifications
Current InputsClass 105 Amp. nominal, 10A maximum
Class 2 1A nominal, 2A maximum
Fault current withstand 100A for: 300A for: 500A for:
10 seconds3 seconds1 second
Continuous current withstand 20A for screw terminated or pass-through connections
Programmable current Full scale to any CT ratio
Burden 0.005 VA per phase maximum at 11A
Pickup current Class 10 Class 2
0.1% of nominal 5 mA1 mA
Connections Pass-through wire gauge dimension Quick connect
0.177 inches (4.5 mm)0.25-inch male tab
Voltage InputsRange Line-to-neutral Line-to-line
20–576 Vac0–721 Vac
Programmable voltage range Full scale to any PT ratio
Supported systems 3 element wye, 2.5 element wye, 2 element delta, four-wire delta systems
Input impedance 1 megohm/phase
Burden 0.36 VA/phase maximum at 600V; 0.014 VA at 120 Volts
Connection 7-pin 0.400-inch pluggable terminal block, AWG #12–26(0.129–3.31 mm2)
IsolationAll inputs and outputs are galvanically isolated to 2500V
Environmental RatingsOperating temperature –20ºC to +70°C
Storage temperature –20º to +70°C
Operating humidity To 95% RH noncondensing
Faceplate rating NEMA 12 mounting gasket included
Description Specifications
Sensing MethodVoltage, current True rms
Power Sampling at over 400 samplesper cycle on all channels
Harmonics resolution 40th order
Update RateWatts, VAR and VA 100 msec at 60 Hz
All other parameters 1 second at 60 Hz
Power SupplyAC/DC voltage option 90–265 Vac at 50/60 Hz or
100–370 Vdc, universal AC/DC supply
DC voltage option 18–60 Vdc
Burden 10 VA maximum
Standard Communications FormatConnection type RS-485 (through back plate)
Com port baud rate 9600–57,600 bauds
Com port address 01–247
Data format 8-bit, no parity
Protocols Modbus ASCII, RTU or DNP 3.0
KYZ PulseContacts 1 Form A
On resistance, maximum 35 Ohms
Peak switching voltage 350 Vdc
Continuous load current 120 mA
Peak load current 350 mA (10 ms)
Off-state leakage current at 350 Vdc 1 uA
Opto-isolation 3750 Vac
Dimensions and ShippingWeight 2 lbs
Basic unit H 5.00 x W 4.90 x L 5.00 inches
IQ 250/260 Mounts in 92 mm DIN and ANSIC39.1 round cut-outs
Shipping container dimensions 6.00-inch cube
Tolerance ±0.1 inches (2.54 mm)
ComplianceIEC 687 0.2% accuracy
ANSI C12.20 0.2% accuracy
ANSI C62.41 Burst
UL/cUL Electrical and electronicmeasuring and testequipment 22CZ
CE Meets EU safety, health and environmental requirements

3.1-34
For more information, visit: www.eaton.com/consultants CA08104001E
November 2013
Advanced and Electronic Metering
i
ii
1
2
3
4
5
6
7
8
9
10
11
12
13
14
15
16
17
18
19
20
21
Sheet 03
Eaton Advanced MetersIQ 250/260 Series
040
IQ 250/260 Meter Dimensions
Figure 3.1-31. IQ 250/260 Meter Dimensions—Face and Side Views
Ordering Information
Table 3.1-11. IQ 250/260 Meter Catalog Numbering System
Table 3.1-12. IQ 250/260 Meter Accessories
Table 3.1-13. Power Xpert Meter 2000 I/O Cards
Description Catalog Number
Panel mounting adapter for retrofitting an IQ 250/260 to an IQ Analyzer/IQ DP-4000/IQ Data cutout
IQ250-PMAK
PXM 2000 Gateway card kit to upgrade an IQ 250/260 to a PXM 2000 PXM2000-GCK
Description Catalog Number
IQ 250/260 I/O card—2 relay outputs/2 status inputs IQ250/260-IO1
IQ 250/260 I/O card—4 KYZ pulses/4 status inputs IQ250/260-IO2
IQ 250/260 I/O card—4 analog outputs 0–1 mA IQ250/260-IO3
IQ 250/260 I/O card—4 analog outputs 4–20 mA IQ250/260-IO4
IQ 250/260M Side IQ 250/260T SideIQ 250/260 Face
IQ 250 M A 6 5 1 1 0
Model Series
250 = Power260 = Power quality
Frequency
5 = 50 Hz system6 = 60 Hz system
I/O Slot 2
0 = None1 = Two relay outputs/
two status inputs2 = Four KYZ pulses/
four status inputs3 = Four analog
outputs: 0–1 mA4 = Four analog
outputs: 4–20 mAPower Supply
1 = 90–265 Vac/Vdc4 = 24–48 Vdc
Current Input
1 = 1A secondary5 = 5A secondary
Meter Type
M = Meter (with integral display)
T = Transducer only (no display)
I/O Slot 1
0 = None1 = Two relay outputs/
two status inputs2 = Four KYZ pulses/
four status inputs3 = Four analog
outputs: 0–1 mA4 = Four analog
outputs: 4–20 mA
Data Logging
A = NoneL = On-board
data logging
Expandable I/O Componentry
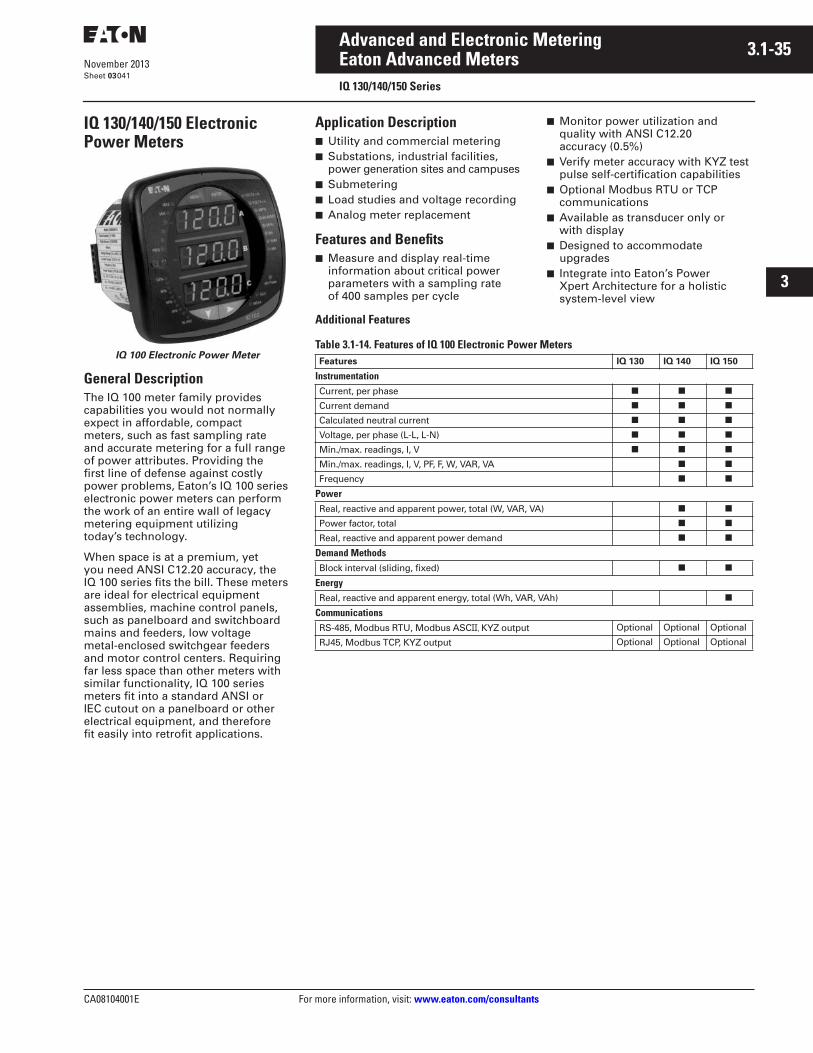
CA08104001E For more information, visit: www.eaton.com/consultants
3.1-35November 2013
Advanced and Electronic Metering
i
ii
1
2
3
4
5
6
7
8
9
10
11
12
13
14
15
16
17
18
19
20
21
Sheet 03
Eaton Advanced MetersIQ 130/140/150 Series
041
IQ 130/140/150 Electronic Power Meters
IQ 100 Electronic Power Meter
General DescriptionThe IQ 100 meter family provides capabilities you would not normally expect in affordable, compact meters, such as fast sampling rate and accurate metering for a full range of power attributes. Providing the first line of defense against costly power problems, Eaton’s IQ 100 series electronic power meters can perform the work of an entire wall of legacy metering equipment utilizing today’s technology.
When space is at a premium, yet you need ANSI C12.20 accuracy, the IQ 100 series fits the bill. These meters are ideal for electrical equipment assemblies, machine control panels, such as panelboard and switchboard mains and feeders, low voltage metal-enclosed switchgear feeders and motor control centers. Requiring far less space than other meters with similar functionality, IQ 100 series meters fit into a standard ANSI or IEC cutout on a panelboard or other electrical equipment, and therefore fit easily into retrofit applications.
Application Description■ Utility and commercial metering■ Substations, industrial facilities,
power generation sites and campuses■ Submetering■ Load studies and voltage recording■ Analog meter replacement
Features and Benefits■ Measure and display real-time
information about critical power parameters with a sampling rate of 400 samples per cycle
■ Monitor power utilization and quality with ANSI C12.20 accuracy (0.5%)
■ Verify meter accuracy with KYZ test pulse self-certification capabilities
■ Optional Modbus RTU or TCP communications
■ Available as transducer only or with display
■ Designed to accommodateupgrades
■ Integrate into Eaton’s Power Xpert Architecture for a holistic system-level view
Additional Features
Table 3.1-14. Features of IQ 100 Electronic Power Meters Features IQ 130 IQ 140 IQ 150
InstrumentationCurrent, per phase ■ ■ ■
Current demand ■ ■ ■
Calculated neutral current ■ ■ ■
Voltage, per phase (L-L, L-N) ■ ■ ■
Min./max. readings, I, V ■ ■ ■
Min./max. readings, I, V, PF, F, W, VAR, VA ■ ■
Frequency ■ ■
PowerReal, reactive and apparent power, total (W, VAR, VA) ■ ■
Power factor, total ■ ■
Real, reactive and apparent power demand ■ ■
Demand MethodsBlock interval (sliding, fixed) ■ ■
EnergyReal, reactive and apparent energy, total (Wh, VAR, VAh) ■
CommunicationsRS-485, Modbus RTU, Modbus ASCII, KYZ output Optional Optional Optional
RJ45, Modbus TCP, KYZ output Optional Optional Optional

3.1-36
For more information, visit: www.eaton.com/consultants CA08104001E
November 2013
Advanced and Electronic Metering
i
ii
1
2
3
4
5
6
7
8
9
10
11
12
13
14
15
16
17
18
19
20
21
Sheet 03
Eaton Advanced MetersIQ 130/140/150 Series
042
Technical Data and Specifications
Table 3.1-15. IQ 100 Electronic Power Meter Technical Information Description Specifications
Current InputsClass 10 5A nominal, 10A maximum
Class 2 1A nominal, 2A maximum
Fault Current Withstand 100A for: 300A for: 500A for:
10 seconds3 seconds1 second
Continuous current withstand 20A for screw terminated or pass-through connections
Programmable current Full scale to any CT ratio
Burden 0.005 VA per phase maximum at 11A
Pickup current 0.1% of nominal
Class 10 5 mA
Class 2 1 mA
Connections Pass-through wire gauge dimension Quick connect
0.177 inches (4.5 mm)0.25-inch male tab
Voltage InputsRange Line-to-neutral Line-to-line
20–576 Vac0–721 Vac
Programmable voltage range Full scale to any PT ratio
Supported systems 3 element wye, 2.5 element wye, 2 element delta, four-wire delta systems
Input impedance 1 megohm/phase
Burden 0.36 VA/phase maximum at 600V; 0.014 VA at 120V
Connection 7-pin 0.400-inch pluggable terminal block, AWG #12–26 (0.129–3.31 mm2)
IsolationAll inputs and outputs are galvanically isolated to 2500V
Environmental RatingsOperating temperature –20º to +70°C
Storage temperature –40º to +85°C
Operating humidity To 95% RH noncondensing
Faceplate rating NEMA 12 water-resistantmounting gasket Included
Description Specifications
Sensing MethodVoltage, current True rms
Power Sampling at over 400 samples per cycle on all channels
Update RateWatts, VAR and VA 100 msec at 60 Hz
All other parameters 1 second at 60 Hz
Power SupplyAC/DC voltage option 90–265 Vac at 50/60 Hz or
100–370 Vdc, universal AC/DC supply
DC voltage option 18–60 Vdc
Burden 10 VA maximum
Optional Communications FormatConnection type RS-485 or RJ45
(through back plate)
Com. port baud rate 9600–57,600 bauds
Com. port address 01–247
Data format 8-bit, no parity
Protocols Modbus ASCII/RTU or TCP
Optional KYZ PulseContacts 1 Form A
On resistance, maximum 35 Ohms
Peak switching voltage 350 Vdc
Continuous load current 120 mA
Peak load current 350 mA (10 ms)
Off-state leakage current at 350 Vdc 1 uA
Opto-isolation 3750 Vac
Dimensions and ShippingWeight 2 lbs
Basic unit H 5.00 x W 4.90 x L 5.00 inches
IQ 100 Mounts in 92 mm DIN and ANSIC39.1 round cut-outs
Shipping container dimensions 6.00-inch cube
Tolerance ±0.10 inches (2.54 mm)
ComplianceIEC 687 0.5% accuracy
ANSI C12.20 0.5% accuracy
ANSI C62.41 Burst
UL/cUL/CE Electrical and electronicmeasuring and testequipment 22CZ

CA08104001E For more information, visit: www.eaton.com/consultants
3.1-37November 2013
Advanced and Electronic Metering
i
ii
1
2
3
4
5
6
7
8
9
10
11
12
13
14
15
16
17
18
19
20
21
Sheet 03
Eaton Advanced MetersIQ 130/140/150 Series
043
IQ 100 Meter Dimensions
Figure 3.1-32. IQ 100 Meter Dimensions—Front and Side Views
Ordering Information
Table 3.1-16. IQ 100 Meter Catalog Numbering System
Table 3.1-17. IQ 100 Meter Accessories Description Catalog
Number
Panel mounting adapter for retrofitting an IQ 100 to an IQ Analyzer/IQ DP-4000/IQ Data cutout
IQ250-PMAK
IQ 100M Side View IQ 100T Side ViewIQ 100M Front View
IQ 150 M A 6 5 1 1
Model Series
130 = Volts/amps140 = Power150 = Energy
Frequency
5 = 50 Hz system6 = 60 Hz system
Power Supply
1 = 90–265 Vac/Vdc4 = 24–48 Vac
Current Input
1 = 1A secondary5 = 5A secondary
Meter Type
M = Meter (with integral display)
T = Transducer only (no display)
Communication
0 = None1 = Modbus RTU
and KYZ pulse2 = Modbus TCP
and KYZ pulse
IQ 100T Transducer Only

3.1-38
For more information, visit: www.eaton.com/consultants CA08104001E
November 2013
Advanced and Electronic Metering
i
ii
1
2
3
4
5
6
7
8
9
10
11
12
13
14
15
16
17
18
19
20
21
Sheet 03044
This page intentionally left blank.

CA08104001E For more information, visit: www.eaton.com/consultants
3.2-1November 2013
Advanced and Electronic Metering
i
ii
1
2
3
4
5
6
7
8
9
10
11
12
13
14
15
16
17
18
19
20
21
Sheet 03
Eaton Submeter OverviewIQ 35M
045
IQ 35M
IQ 35M
General DescriptionThe Eaton IQ 35M Meter is a DIN rail meter that combines exceptional performance and easy installation to deliver a cost-effective solution for energy and power monitoring applications, as well as submetering applications. All models include pulse output and phase alarms for true versatility in all situations. The Modbus output options offer added flexibility for configuration and data analysis.
The IQ 35M allows you to:
■ Verify energy bills■ Make informed load shifting
and shedding decisions■ Fairly and accurately allocate
energy costs to users■ Identify wasteful practices■ Decrease unnecessary usage■ Produce an energy profile■ Secure the optimum utility
rate structure
Application Description■ Commercial submetering■ Energy management■ Industrial monitoring■ Cost allocation
IQ 35M mounted and wired in Eaton panelboard. Closeup photo showing IQ 35M panelboardintegration and deadfront cover.
Note: Please refer to Tab 22 for panelboard information.
Features and Benefits■ DIN rail or surface mounted
watthour meter with demand■ Affordable, lightweight and compact
meter providing watthours energy information
■ Included backlit LCD display for local reading
■ Power and energy readings❑ kW❑ kWh❑ Peak demand available
■ Monitors ❑ Watts, watthours, watt demand❑ Volts, amperes ❑ PF, frequency❑ VARs, VA
■ Optional data logging capability■ Optional serial communications
(Modbus-RTU or BACnet MS/TP)■ Revenue grade, ANSI C12.20 0.5%
accuracy, IEC 62053-22 Class 0.5S■ User-enabled password protection■ On-board diagnostics
IQ 35M in optional NEMA 4X enclosure. Enclosure shipped loose for field mounting of meter. Enclosure only model number: IQ35M-ENC.

3.2-2
For more information, visit: www.eaton.com/consultants CA08104001E
November 2013
Advanced and Electronic Metering
i
ii
1
2
3
4
5
6
7
8
9
10
11
12
13
14
15
16
17
18
19
20
21
Sheet 03
Eaton Submeter OverviewIQ 35M
046
Product Selection
Table 3.2-1. Catalog Number Selection
Accessories■ NEMA 4 enclosure■ Fuse kits■ DIN rail■ Replacement mounting clips■ CTs–solid and split core
Technical Data and Specifications■ Voltage input
UL: 90V (L-N) to 600V (L-L)CE: 90V (L-N) to 300V (L-L)
■ Current inputScaling: 5–32,767AInput range: 0–0.333V or 0–1V (selectable)
■ Control power UL: 90V (L-N) to 600V (L-L)CE: 90V (L-N) to 300V (L-L)
Accuracy■ Real power and energy
0.5% (ANSI C12.20, IEC 62053-22 Class 0.5S)
Outputs■ IQ35MAx1 thru 3:
Real energy pulse: NO static;alarm contacts: NC static
■ IQ35MA11Reactive energy pulse 30 Vac/dc
■ IQ35MAx2, IQ35MAx3RS-485 two-wire Modbus RTU
■ IQ35MA15 RS-485 two-wire BACnet MS/TP
Inputs■ IQ35MA15
Two pulse accumulators
Mechanical■ Mounting
DIN rail or 3-point screwmount
Environmental■ Operating temperature range
Meter: –30° to 70°C (–22° to 158°F)Display: –10° to 50°C (14° to 122°F)
■ Storage temperature rangeMeter: –40° to 85°C (–40° to 185°F)Display: –10° to 60°C (14° to 140°F)
■ Humidity range<95% RH noncondensing
Data Outputs■ kW, kWh: Total■ Current: Three-phase average and
per phase■ Voltage: Three-phase average, per
phase, and line-line and line-neutral■ Power: Real, reactive and apparent;
Three-phase total and per phase■ Power factor: Three-phase average
and per phase■ Frequency■ Power demand: most recent
and peak■ Demand configuration: fixed,
rolling block and external sync■ Data logging (IQ35MAx3)
10 configurable data buffers;configurable demand subinterval (when set at a 15-minute interval, buffers store data for 60 days)
■ Data logging (IQ35MA15) 6 configurable data buffers; configurable demand subinterval (when set at a 15-minute interval, buffers store data for 60 days)
■ Trending requires communication network to retrieve data
IQ35M A 1 1Meter Series
Enclosure Type
1 = Standard energy2 = Four quadrant energy
Output Option
1 = Pulse output only2 = Pulse output + Modbus3 = Pulse output + Modbus +
data logging5 = Pulse inputs + BACnet +
data logging

CA08104001E For more information, visit: www.eaton.com/consultants
3.2-3November 2013
Advanced and Electronic Metering
i
ii
1
2
3
4
5
6
7
8
9
10
11
12
13
14
15
16
17
18
19
20
21
Sheet 03
Eaton Submeter OverviewIQ 35M
047
Figure 3.2-1. IQ 35M Product Diagram
Figure 3.2-2. IQ 35M Advanced Communication—Modbus RTU

3.2-4
For more information, visit: www.eaton.com/consultants CA08104001E
November 2013
Advanced and Electronic Metering
i
ii
1
2
3
4
5
6
7
8
9
10
11
12
13
14
15
16
17
18
19
20
21
Sheet 03
Eaton Submeter OverviewIQ 35M
048
Figure 3.2-3. IQ 35M Advanced Communication—BACnet
Figure 3.2-4. IQ 35M Mechanical Installation

CA08104001E For more information, visit: www.eaton.com/consultants
3.2-5November 2013
Advanced and Electronic Metering
i
ii
1
2
3
4
5
6
7
8
9
10
11
12
13
14
15
16
17
18
19
20
21
Sheet 03
Eaton Submeter OverviewIQ 35M
049
Dimensions
Figure 3.2-5. Dimensional Drawing
Figure 3.2-6. DIN Rail Configuration
Figure 3.2-7. Wall Mount Configuration

3.2-6
For more information, visit: www.eaton.com/consultants CA08104001E
November 2013
Advanced and Electronic Metering
i
ii
1
2
3
4
5
6
7
8
9
10
11
12
13
14
15
16
17
18
19
20
21
Sheet 03
Eaton Submeter OverviewIQ 35M
050
IQ 35M Current TransducersLow Current Ranges5–600A
General DescriptionSolid- and split-core AC current transducers have different hole sizes and current ratings to suit any application. The solid-core models are ideal for new construction projects. Split-core models are perfect for retrofits. Output is fixed at the industry standard of 0–0.333 Vac.
Application Description■ Data logging■ Recording■ Power monitoring■ Energy management ■ Alternative energy monitoring■ Cost allocation
Features■ High accuracy: ±1% at 10% to 130%
of rated current■ 0–0.333 Vac standard output■ Solid-core models have a rugged
epoxy encapsulated construction, giving it outstanding durability
■ Split-core models have interleaving joints for reliability with a self-locking mechanism and no exposed metal; a safe design
Standards and Certifications■ UR■ CE■ RoHS
Technical Data and Specifications
Inputs■ Frequency range: 50–400 Hz■ Accuracy: ±1% at 10% to 130%
of rated current
Outputs■ At rated current: 0.333 Vac
Environmental■ Operating temperature range:
–10° to 55°C (14° to 131°F)■ Storage temperature range:
–40° to 70°C (–40° to 158°F)
Lead Length■ 8-foot twisted pair
Figure 3.2-8. IQ 35M-SO Solid Core CT Dimensions
Figure 3.2-9. IQ 35M-SO Split-Core CT Dimensions
Table 3.2-2. IQ 35M—Dimensions in Inches (mm) Description A B C D E Model Number
Solid CoreIQ 35M CT, 5A:0.33 Vac, 0.30 inch
0.30(8.0)
1.70(44.0)
0.75(19.0)
— — IQ35M-SO-30-5
IQ 35M CT, 20A:0.33 Vac, 0.30 inch
0.30 (8.0)
1.70 (44.0)
0.75 (19.0)
— — IQ35M-SO-030-20
IQ 35M CT, 50A:0.33 Vac, 0.50 inch
0.50 (13.0)
1.90 (49.0)
0.75 (19.0)
— — IQ35M-SO-050-50
IQ 35M CT, 50A:0.33 Vac, 0.75 inch
0.75 (19.0)
2.10 (54.0)
0.75 (19.0)
— — IQ35M-SO-075-50
IQ 35M CT, 100A:0.33 Vac, 1.25 inch
1.25 (32.0)
2.70 (69.0)
0.80 (21.0)
— — IQ35M-SO-125-100
IQ 35M CT, 200A:0.33 Vac, 1.25 inch
1.25 (32.0)
2.70 (69.0)
0.80 (21.0)
— — IQ35M-SO-125-200
IQ 35M CT, 250A:0.33 Vac, 1.25 inch
1.25 (32.0)
2.70 (69.0)
0.80 (21.0)
— — IQ35M-SO-125-250
IQ 35M CT, 300A:0.33 Vac, 1.25 inch
1.25 (32.0)
2.70 (69.0)
0.80(21.0)
— — IQ35M-SO-125-300
IQ 35M CT, 400A:0.33 Vac, 1.25 Inch
1.25(32.0)
2.70 (69.0)
0.80(21.0)
— — IQ35M-SO-125-400
Split CoreIQ 35M CT, 5A:0.33 Vac, 0.75 inch
2.00 (51.0)
2.10 (54.0)
0.61 (16.0)
0.75 (20.0)
0.75 (20.0)
IQ35M-SP-075-5
IQ 35M CT, 30A:0.33 Vac, 0.75 inch
2.00 (51.0)
2.10 (54.0)
0.61 (16.0)
0.75 (20.0)
0.75 (20.0)
IQ35M-SP-075-30
IQ 35M CT, 50A:0.33 Vac, 0.75 inch
2.00 (51.0)
2.10 (54.0)
0.61 (16.0)
0.75 (20.0)
0.75 (20.0)
IQ35M-SP-075-50
IQ 35M CT, 100A:0.33 Vac, 0.75 inch
2.00 (51.0)
2.10 (54.0)
0.61 (16.0)
0.75 (20.0)
0.75 (20.0)
IQ35M-SP-075-100
IQ 35M CT, 200A:0.33 Vac, 0.75 inch
2.00 (51.0)
2.10 (54.0)
0.61 (16.0)
0.75 (20.0)
0.75 (20.0)
IQ35M-SP-075-200
IQ 35M CT, 250A:0.33 Vac, 1.25 inch
3.25 (83.0)
3.35 (86.0)
1.00 (26.0)
1.25(32.0)
1.25 (32.0)
IQ35M-SP-125-250
IQ 35M CT, 300A:0.33 Vac, 1.25 inch
3.25 (83.0)
3.35 (86.0)
1.00 (26.0)
1.25(32.0)
1.25 (32.0)
IQ35M-SP-125-300
IQ 35M CT, 400A:0.33 Vac, 1.25 inch
3.25 (83.0)
3.35 (86.0)
1.00 (26.0)
1.25(32.0)
1.25 (32.0)
IQ35M-SP-125-400
IQ 35M CT, 600A:0.33 Vac, 1.25 inch
3.25 (83.0)
3.35 (86.0)
1.00 (26.0)
1.25(32.0)
1.25 (32.0)
IQ35M-SP-125-600

CA08104001E For more information, visit: www.eaton.com/consultants
3.2-7November 2013
Advanced and Electronic Metering
i
ii
1
2
3
4
5
6
7
8
9
10
11
12
13
14
15
16
17
18
19
20
21
Sheet 03
Eaton Submeter OverviewIQ 35M
051
IQ 35M Current TransducersHigh Current Ranges800–2400A
General DescriptionThe IQ 35M split-core currenttransducers, high current ranges, provide a safe 0–0.333 Vac output for use with the IQ 35M energy meter.
Application Description■ Data logging■ Recording■ Power monitoring■ Energy management■ Alternative energy monitoring■ Cost allocation
Features■ High accuracy: 1% of reading from
10% to 100% of rated current■ 0–0.333V output
Standards and Certifications■ UR■ CE
Technical Data and Specifications
Inputs■ Frequency range: 50/60 Hz■ Accuracy: 1% of reading from
10% to 100% of the rated current of the CTs
Outputs■ At rated current: 0.333
Mechanical■ Installation category: Cat II or Cat III
Environmental■ Operating temperature range:
–15° to 60°C (5° to 140°F)■ Storage temperature range:
–40° to 70°C (–40° to 158°F)■ Humidity range:
0–95% noncondensing
Lead Length■ 6-foot twisted pair
Figure 3.2-10. IQ 35M-SP-25X
Table 3.2-3. IQ 35M—Dimensions in Inches (mm) Description A B C D E F Model Number
Split CoreIQ 35M CT, 800A:0.33 Vac, 2.50 inch
4.90 (125.0)
2.90 (73.0)
2.50 (62.0)
1.20 (30.0)
5.20 (132.0)
5.90 (151.0)
IQ35M-SP-253-800
IQ 35M CT, 1000A:0.33 Vac, 2.50 inch
4.90 (125.0)
5.50(139.0)
2.50 (62.0)
1.20 (30.0)
7.90 (201.0)
6.00 (151.0)
IQ35M-SP-255-1000
IQ 35M CT, 1200A:0.33 Vac, 2.50 inch
4.90 (125.0)
5.50 (139.0)
2.50 (62.0)
1.20 (30.0)
7.90 (201.0)
6.00 (151.0)
IQ35M-SP-255-1200
IQ 35M CT, 1600A:0.33 Vac, 2.50 inch
4.90(125.0)
5.50 (139.0)
2.50 (62.0)
1.20 (30.0)
7.90 (201.0)
6.00 (151.0)
IQ35M-SP-255-1600
IQ 35M CT, 2000A:0.33 Vac, 2.50 inch
4.90 (125.0)
5.50 (139.0)
2.50 (62.0)
1.20 (30.0)
7.90 (201.0)
6.00 (151.0)
IQ35M-SP-255-2000
IQ 35M CT, 2400A:0.33 Vac, 2.50 inch
4.90 (125.0)
5.50 (139.0)
2.50 (62.0)
1.20 (30.0)
7.90(201.0)
6.00 (151.0)
IQ35M-SP-255-2400

3.2-8
For more information, visit: www.eaton.com/consultants CA08104001E
November 2013
Advanced and Electronic Metering
i
ii
1
2
3
4
5
6
7
8
9
10
11
12
13
14
15
16
17
18
19
20
21
Sheet 03
Eaton Submeter OverviewIQ 35M
052
Supported System TypesThe IQ 35M power meters have a number of different possible system wiring configurations (see wiring diagrams on Page 3.2-9). To configure the meter, set the System Type via the User Interface or Modbus register 130 (if so equipped). The System Type tells the meter which of its current and
voltage inputs are valid, which are to be ignored, and whether neutral is connected. Setting the correct System Type prevents unwanted energy accumulation on unused inputs, selects the formula to calculate the Theoretical Maximum System Power, and determines which phase loss algorithm is to be used. The phase
loss algorithm is configured as a percent of the Line-to-Line System Voltage (except when in System Type 10) and also calculates the expected Line to Neutral voltages for system types that have Neutral (12 and 40).
Table 3.2-4. Supported System Types
Table 3.2-5. Wiring
Note: IQ 35MA1x models are not polarity sensitive. No need to observe polarity when wiring. IQ 35MA2x models are polarity sensitive. Observe correct polarity when wiring.
Numberof Wires
CTs Voltage Connections System Type Phase Loss Measurements WiringDiagramFigureNumber
Qty ID Qty ID Type ModbusRegister 130
User Interface:SETUP>S SYS
VLL VLN Balance
Single-Phase Wiring223
112
AAA, B
223
A, NA, BA, B, N
L-NL-LL-L with N
101112
1L + 1n2L2L + 1n
ABAB
AN
AN, BN AN-BN
3.2-113.2-123.2-13
Three-Phase Wiring3 3 A, B, C 3 A, B, C Delta 31 3L AB, BC, CA AB-BC-CA 3.2-14
4 3 A, B, C 4 A, B, C, N Groundedwye
40 3L + 1n AB, BC, CA AN, BN, CN AN-BN-CN and AB-BC-CA
3.2-153.2-16
Symbol Description
Voltage disconnect switch
Fuse (installer is responsible for ensuring compliance with local requirements. No fuses are included with the device.)
Earth ground
Current transducer
Potential transformer
Protection containing a voltage disconnect switch with a fuse or disconnect circuit breaker. The protection device must be rated for the available short-circuit current at the connection point.
S2
S1

CA08104001E For more information, visit: www.eaton.com/consultants
3.2-9November 2013
Advanced and Electronic Metering
i
ii
1
2
3
4
5
6
7
8
9
10
11
12
13
14
15
16
17
18
19
20
21
Sheet 03
Eaton Submeter OverviewIQ 35M
053
Wiring Diagrams
Figure 3.2-11. Single-Phase Line-to-Neutral Two-Wire System, 1 CT
Figure 3.2-12. Single-Phase Line-to-Line Two-Wire System, 1 CT
Figure 3.2-13. Single-Phase Direct Voltage Connection, 2 CTs
Figure 3.2-14. Three-Phase, Three-Wire, 3 CTs, No PT
Figure 3.2-15. Three-Phase, Four-Wire Wye Direct Voltage Connection, 3 CTs
Figure 3.2-16. Three-Phase, Four-Wire Wye Connection, 3 CTs, 3 PTs
X2
X1
ABCN
+–+–+–
A
B
C
Use System Type 10 (1L + ln)
L1N
WhiteBlack
X2
X1
ABCN
+–+–+–
A
B
C
Use System Type 11 (2L) L1 L2
WhiteBlack
X2
X1
X2
X1
ABCN
+–+–+–
A
B
C
Use System Type 12 (2L + ln)
L1 L2N
WhiteBlack
WhiteBlack
X2
X1
ABCN
A
B
C
X2
X1
X2
X1
+–+–+–
Use System Type 31 (3L) L1 L2 L3
WhiteBlack
WhiteBlack
WhiteBlack
Use System Type 40 (3L + ln)
L1 L2 L3N
X2
X1
ABCN
A
B
CX2
X1
X2
X1
+–+–+–
WhiteBlack
WhiteBlack
WhiteBlack
Black
Black
WhiteBlack
L1 L2 L3N
X2
X1
ABCN
A
B
CX2
X1
X2
X1
+–+–+–
White
White

3.2-10
For more information, visit: www.eaton.com/consultants CA08104001E
November 2013
Advanced and Electronic Metering
i
ii
1
2
3
4
5
6
7
8
9
10
11
12
13
14
15
16
17
18
19
20
21
Sheet 03
Eaton Submeter OverviewIQ 35M
054
Control Power
Figure 3.2-17. Direct Connect Control Power (Line-to-Line)Line-to-Line from 90 Vac to 600 Vac (UL) (520 Vac CE). In UL installations, the lines may be floating (i.e., a delta). If any lines are tied to an earth (i.e., a corner grounded delta), see the Line-to-Neutral installation limits. In CE installations, the lines must be neutral (earth) referenced at less than 300 Vac L-N.
Figure 3.2-18. Direct Connect Control Power (Line-to-Neutral)Line-to-Neutral from 90 Vac to 347 Vac (UL) or 300 Vac (CE).
Figure 3.2-19. Direct Connect Control Power (DC)DC control power from 125 Vdc to 300 Vdc (UL and CE max.).
Figure 3.2-20. Control Power Transformer (CPT) ConnectionThe Control Power Transformer may be wired L-N or L-L. Output to meet meter input requirements
Fuse RecommendationsKeep the fuses close to the power source (obey local and national code requirements).
For selecting fuses and circuit breakers, use the following criteria:
■ Current interrupt capacity should be selected based on the installation category and the fault current capability
■ Overcurrent protection should be selected with a time delay
■ The voltage rating should be sufficient for the input voltage applied
■ Provide overcurrent protection and disconnecting means to protect the wiring. For DC installations, the installer must provide external circuit protection (suggested: 0.5A, time delay fuses)
■ The earth connection is required for electromagnetic compatibility (EMC) and is not a protective earth ground
L1 L2 L3
1 2G
L1 L2 L3N1 2G
1 2G
L1 L2 L3N
1 2G

CA08104001E For more information, visit: www.eaton.com/consultants
3.2-11November 2013
Advanced and Electronic Metering
i
ii
1
2
3
4
5
6
7
8
9
10
11
12
13
14
15
16
17
18
19
20
21
Sheet 03
Eaton Submeter OverviewIQ 150S/250S Series
055
IQ 150S/250S Self-Enclosed Electronic Meters
IQ 150S/250S Self-Enclosed Electronic Meter
General DescriptionWith energy costs skyrocketing, you need the ability to verify the accuracy of utility billing and allocation of energy costs among business units, different manufacturing areas or facilities, and tenants. Production equipment and IT systems are vulnerable to power anomalies; therefore, you must ensure that power is always up to specifications. If your infrastructure is an established facility, you may not currently have metering or may have addressed these concerns by deploying a variety of analog gauges and meters—one for volts, one for amperes and so on, with separate meters for each measurement.
If you’re planning an upgrade or a new power infrastructure, no doubt you would like to capitalize on the latest technology to improve upon that cumbersome architecture and its patchwork view.
Application Description■ Industrial and commercial buildings,
metering and submetering■ Government facilities and military■ Universities and airports■ Load studies and voltage recording
Features and Benefits■ Self-enclosed, these meters are an
ideal solution for surface mounting next to a selected piece of equip-ment for energy monitoring
■ NEMA 12 enclosure with a large, easy-to-read faceplate, consistent with other Eaton meter models, designed with “knockouts” for easy installation
■ Ethernet communications option for either wired or wireless setup, allowing for additional ease of installation and integration into existing networks
■ Available data and alarm recording for historical records/trending
■ Integrate into Eaton’s Power Xpert® Architecture for a holistic system-level view
Wireless and High-End Capabilities you would not Expect from a Self-Enclosed, Compact MeterProviding the first line of defense against costly power problems, Eaton’s IQ 150S/250S electronic self-enclosed meters can perform the work of an entire wall of legacy metering equipment using today’s secure wireless technology. Eaton’s IQ 150S/250S meters use 24-bit AD converters that sample at more than 400 samples per cycle and meet IEC 687 (0.2% accuracy) and ANSI C12.20 (0.2% accuracy) standards. With such high-performance measurement capability, these meters can be confidently used for primary revenue metering and submetering applications.
Either model will help you monitor energy demand, while the IQ 250S provides the extra benefit of also monitoring and recording the changes in the characteristics of your power.
Eaton’s IQ 150S/250S meters provide direct-reading metered values for the most critical power aspects, such as watts, watt demand, watthours, voltage amperes (VA), VA-hours, VARs, VAR-hours and power factor. They have high sampling speed and accuracy.
These meters are self-enclosed in a NEMA 12 enclosure with “knockouts” on the bottom for communication and power, providing for an easy installation.
Perhaps you don’t have network drops in all the right places. The IQ 150S/250S offers a wireless communications option. The transmissions are encrypted using 128-bit Wired Equivalent Privacy (WEP) for security.
Industry-Standard Communication Protocols
Standard Modbus RS-485 CommunicationStandard communication includes an RS-485 output speaking Modbus protocol. This allows the unit to be connected to any serial RS-485 bus using the Modbus interface. The unit communicates easily with most building automation, Power Xpert Software or other software systems. Baud rates are up to 57.6K baud to provide fast update times.
Wi-Fi or Land-Based EthernetThe unit offers an Ethernet option—configured either as an RJ45 or Wi-Fi connection. The Wi-Fi configuration allows the 150S/250S to be used on standard Wi-Fi base stations. The unit is assigned an IP address; it communi-cates Modbus protocol over Ethernet TCP/IP. Wireless Ethernet is reliable and easy to integrate, making it the superior solution for mass meter deployment.
KYZ PulseFor applications in which a pulse is needed, the unit also provides a KYZ output that pulses proportional to the amount of energy consumed. This feature is used for pulse counting applications into building management systems where serial or Ethernet protocol is not available.
Verify Energy BillsThe IQ 150S/250S models provide a traceable watthour test pulse (used with a watthour pulse recorder or totalizer), so you can verify the accu-racy of your meter and in turn, the accuracy of billing from your utility company and to internal customers.

3.2-12
For more information, visit: www.eaton.com/consultants CA08104001E
November 2013
Advanced and Electronic Metering
i
ii
1
2
3
4
5
6
7
8
9
10
11
12
13
14
15
16
17
18
19
20
21
Sheet 03
Eaton Submeter OverviewIQ 150S/250S Series
056
Integrated with Eaton’s Power Xpert ArchitectureIQ 150S/250S meters integrate into Eaton’s Power Xpert Architecture, where meters, gateways and monitor-ing devices collaborate to create a uni-fied, centralized view of the end-to-end power and facility infrastructure.
When used in this architecture, either with a Power Xpert Gateway or directly via Ethernet, the meters with the Modbus RTU option can provide Web-based graphics of current power conditions. Simply connect your meter to a Power Xpert Gateway to translate Modbus-based information from the meter into HTML-based Web pages that are accessible from any standard Web browser. If you select a model with the Ethernet option, the meter can easily be monitored remotely via Power Xpert Software or another third-party monitoring system. With access to accurate, real-time informa-tion from IQ 150S/250S meters, Power Xpert Architecture can transform your power system into an integrated, agile system, and an easily managed entity that performs better and costs less.
Designed for the UserWhen space is at a premium, yet you need ANSI C12.20 accuracy, Eaton IQ 150S/250S meters fit the bill. These ultra-compact meters are ideal for sur-face mounting next to a selected piece of equipment for energy monitoring. Requiring far less space than other meters with similar functionality, and offering a NEMA 12 enclosure and a large, easy-to-read faceplate, consistent with other Eaton meter models, these meters are designed with “knockouts” for easy retrofit installation.
Most meters in this class have small or dark displays that can be hard to see, especially from a distance. Eaton’s IQ 150S/250S meters have a large, bright red, three-line LED display, each line more than a half-inch tall. This display is very easy to read, even if the meter is installed at a height or distance. Using the keypad and menus on the local display, users can display a variety of electrical system values or program the meter.
Table 3.2-6. Features of IQ 150S/250S Electronic Power Meters
� Per phase only.� If configured for Ethernet, RS-485 not available.
Features IQ 150S IQ 250S
InstrumentationCurrent, per phase ■ ■
Calculated neutral current ■ ■
Voltage, per phase (L-L, L-N) ■ ■
Frequency ■ ■
Minimum/maximum readings, I �, V �, PF, F, W, VAR, VA Total Total and per phase
PowerReal, reactive and apparent power (W, VAR, VA) Total Total and per phase
Power factor Average Average and per phase
Demand MethodsBlock interval (fixed, sliding) ■ ■
Current demand ■ ■
Real, reactive and apparent power demand Total Total and per phase
EnergyReal, reactive and apparent energy (Wh, VARh, VAh) Total Total and per phase
Real and reactive, net and positive and negative (Wh, VARh) Total Total and per phase
I/OPulse output ■ ■
CommunicationsRS-485, Modbus RTU, DNP 3.0 ■ ■
RJ45 or 802.11b, Modbus TCP � Optional Optional
Data Logging2 MB for data logging ■
AlarmingSet point driven alarm ■

CA08104001E For more information, visit: www.eaton.com/consultants
3.2-13November 2013
Advanced and Electronic Metering
i
ii
1
2
3
4
5
6
7
8
9
10
11
12
13
14
15
16
17
18
19
20
21
Sheet 03
Eaton Submeter OverviewIQ 150S/250S Series
057
Technical Data and Specifications
Table 3.2-7. IQ 150S/250S Electronic Meter Technical Information
Note: Specifications are subject to change without notice and repre-sent the maximum capabilities of the product with all options installed. This is not a complete feature list. Features and functionality may vary depending on selected options, firmware version and product model. Please refer to User Manual for detailed specifications.
Description Specifications
Current InputsClass 10 5A nominal, 10A maximum
Class 2 1A nominal, 2A maximum
Fault Current Withstand 20A for: 60A for: 100A for:
10 seconds3 seconds1 second
Programmable current Full scale to any CT ratio
Burden 0.005 VA per phase maximum at 11A
Pickup Current Class 10 Class 2
0.1% of nominal5 mA1 mA
Connections Screw terminal #6–32 screws
Voltage InputsRange Line-to-neutral
Line-to-line
20–416 Vac (IQ150S), 20–576 Vac (IQ250S)20–721 Vac
Programmable voltage range Full scale to any PT ratio
Supported systems 3 element wye, 2.5 element wye, 2 element delta, four-wire delta systems
Input impedance 1 megohm/phase
Burden 0.36 VA/phase maximum at 600V; 0.014 VA at 120V
Connection 7-pin, 0.400-inch screw terminal block, AWG #12–26 (0.129–3.31 mm2)
IsolationAll inputs and outputs are galvanically isolated to 2500V
Environmental RatingsOperating temperature –20º to +70°C
Storage temperature –20º to +70°C
Operating humidity To 95% RH noncondensing
Faceplate rating NEMA 12
Sensing MethodVoltage, current rms
Power Sampling at over 400 samples per cycle on all channels
Description Specifications
Update RateWatts, VAR and VA 100 msec at 60 Hz
All other parameters 1 second at 60 Hz
Power SupplyAC/DC voltage option 90–400 Vac at 50/60 Hz or
100–370 Vdc, universal AC/DC supply
Burden 16 VA maximum
Standard Serial Communications FormatConnection type RS-485
Communications port baud rate 9600–57,600 Bauds
Communications port address 01–247
Data format 8-bit, no parity
Protocols Modbus ASCII, RTU, DNP 3.0
Optional Ethernet Communications FormatConnection type RJ45 or 802.11b (wireless)
Protocols Modbus TCP
KYZ PulseContacts 1 Form A
On resistance, maximum 35 Ohms
Peak switching voltage 350 Vdc
Continuous load current 120 mA
Peak load current 350 mA (10 ms)
Off-state leakage current at 350 Vdc 1 uA
Opto-isolation 3750 Vac
Dimensions and ShippingWeight 4 lbs
Basic unit H 7.90 x W 7.50 x D 3.10 inches
ComplianceIEC 687 0.2% accuracy
ANSI C12.20 0.2% accuracy
ANSI C62.41 Burst
ANSI (IEEE) C37.90.1 Surge withstand
UL/cUL Electrical and electronic measuring and test equipment 22CZ

3.2-14
For more information, visit: www.eaton.com/consultants CA08104001E
November 2013
Advanced and Electronic Metering
i
ii
1
2
3
4
5
6
7
8
9
10
11
12
13
14
15
16
17
18
19
20
21
Sheet 03
Eaton Submeter OverviewIQ 150S/250S Series
058
Wiring Diagram
Figure 3.2-21. IQ 150S/250S Wiring Diagram
Installation Diagram
Figure 3.2-22. IQ 150S/250S Installation
Dimensions in Inches (mm)
Figure 3.2-23. IQ 150S/250S Meter Dimensions
Three-Phase Four-Wire WYE Direct Three-Phase Four-Wire WYE with PTS
Three-Phase Three-Wire DELTA Direct Three-Phase Three-Wire DELTA Direct
OClosed
LockableRevenue Seal
3.11(79.0)
7.90(200.7)
7.90(200.7)
5.60(142.2)
Antenna Length:4.40 (111.8)
7.53(191.3)
3.70(94.0)
5.95(151.1)
0.50(12.7)
MountingPlate

CA08104001E For more information, visit: www.eaton.com/consultants
3.2-15November 2013
Advanced and Electronic Metering
i
ii
1
2
3
4
5
6
7
8
9
10
11
12
13
14
15
16
17
18
19
20
21
Sheet 03
Eaton Submeter OverviewIQ 150S/250S Series
059
Ordering Information
Table 3.2-8. IQ 150S/250S Meter Catalog Numbering System
IQ 150 S A 6 5 1 1
Model Series
150 = Energy250 = Energy plus Frequency
5 = 50 Hz system6 = 60 Hz system
Power Supply
1 = 90–400 Vac/dc
Current Input
1 = 1A secondary5 = 5A secondary
Meter Type
S = Self-enclosed meter
Communication
1 = Modbus RTU (RS-485)2 = Modbus RTU (RS-485)
or TCP—(RJ45)or 802.11b (Wi-Fi)

3.2-16
For more information, visit: www.eaton.com/consultants CA08104001E
November 2013
Advanced and Electronic Metering
i
ii
1
2
3
4
5
6
7
8
9
10
11
12
13
14
15
16
17
18
19
20
21
Sheet 03
Eaton Submeter OverviewPower Xpert Multi-Point Meter
060
Power Xpert Multi-Point Meter—High-Density Metering
Power Xpert Multi-Point Meter
Eaton’s Power Xpert� Multi-Point Meter is an ANSI C12.20 revenue class Web enabled electronic submetering device that can be mounted in panel-boards, switchboards or enclosures. When mounted in a panelboard or a switchboard, the Power Xpert Multi-Point Meter provides customers with an integrated power distribution and energy metering solution that saves space, reduces installation labor and lowers total cost.
The Eaton Power Xpert Multi-Point Meter (PXMP Meter) offers a highly modular approach to high-density metering applications in electrical power distribution systems. The PXMP Meter is compatible with most three-phase industrial, commercial and single-phase residential low voltage electrical power systems. The PXMP is equipped with two Modbus RTU communication ports for local display and remote serial communications. The PXMP also has optional pulse input and digital output modules along with one standard digital output and three digital inputs. The PXMP Energy Portal Module is Web enabled, making it suitable for use with Ethernet networks and modems.
General DescriptionThe Power Xpert Multi-Point Meter can measure up to any of the following number of circuits:
■ Sixty single-phase, two-wire (single-pole)
■ Thirty single-phase, three-wire (two-pole)
■ Twenty three-phase, four-wire (three-pole)
The circuits listed above can be mixed provided that the total number of current sensors does not exceed 60. The meter provides current; voltage; power factor; demand and active, reactive, and real power (VA, VAR, kW); and active, reactive and real energy (VA, VAR, kWh) measurements for each load. The unit also provides up to two years at 15-minute intervals or eight years at one-hour intervals of demand data logging storage in non-volatile memory for up to 60 submeters.
The Power Xpert Multi-Point Meter can be used with three different ratings of current sensors: 100 mA, 10 mA or 333 mV. Switchboard/ panelboard applications will use the 100 mA current sensors, which are highly accurate, self-protecting in the event of an open circuit condition under load and are supplied with an integral plug-in connector. The PXMP automatically detects the rating of the current sensor that is connected.
The PXMP can also use 10 mA current sensors that were previously installed for IQMESII retrofit applications. Additionally the PXMP can use 333 mV split core current sensors for retrofit applications where metering has not previously existed. The 10 mA and 333 mV current sensors are also self-protecting in the event of an open circuit condition under load.
Application Description The Power Xpert Multi-Point Meter is ideally suited to handle submetering in low voltage power distribution equip-ment applications such as distribution boards in multi-tenant buildings, com-prehensive main and feeder metering in commercial/industrial switchboards or medium voltage distribution equipment with the use of voltage and current transformers.
The Power Xpert Multi-Point Meter provides a cost-effective solution for residential or commercial metering installations. Typical installations include:
■ High-rise buildings■ Government institutions■ K–12, universities and campuses■ Office buildings■ Medical facilities■ Apartment and condominium
complexes■ Airports■ Shopping malls■ Industrial sites■ Mixed-use facilities
Features■ Monitors power and energy for up
to 60 current sensors; spacesaving modular design allows measure-ment from 1 to 60 circuits
■ Built-in communication interfaces■ Monitors single-phase and three-
phase loads from 120 to 600 Vac■ Monitors current, voltage, power
factor, frequency, power and energy■ Stores extensive energy profile data
for each metering point; can be used to identify coincidental peak demand contribution
■ LEDs provide status of unit communication activity and verify sensor connections
■ Meets rigid ANSI C12.20 accuracy specifications for revenue meters
■ Three standard digital inputs and eight pulse inputs per optional module to monitor WAGES (water, air, gas, electric or steam)
■ One standard digital output and eight digital outputs per optional module for alarm indication
■ Three types of meter modules to support 10 mA, 100 mA or 333 mV sensors
■ Can be directly mounted in a UL Listed panelboard, switchboard or enclosure
■ 256 MB of memory in meter base for up to two years of 15-minute interval data (eight years of one-hour interval data) for eight demand values up to 60 submeters
Communication CapabilitiesWith the Power Xpert Multi-Point Meter’s built-in communication capabilities, remote meter reading and monitoring functions can be integrated into both new and retrofit applications.
■ Standard Modbus RTU■ Optional Modbus TCP / BACnet/IP /
SNMP / HTTP / SMTP / NTP / SFTP communications
Software CompatibilityThe Power Xpert Multi-Point Meter:
■ Can be used as part of an electrical energy monitoring and cost allocation system
■ Can be remotely monitored via onboard Web pages with Eaton’s optional Energy Portal Module
■ Is compatible with third-party soft-ware platforms and interface devices

CA08104001E For more information, visit: www.eaton.com/consultants
3.2-17November 2013
Advanced and Electronic Metering
i
ii
1
2
3
4
5
6
7
8
9
10
11
12
13
14
15
16
17
18
19
20
21
Sheet 03
Eaton Submeter OverviewPower Xpert Multi-Point Meter
061
Configuration■ The Power Xpert Multi-Point Meter
is fully configurable using Power Xpert Multi-Point configuration software that can be downloaded free from the Eaton website at www.eaton.com/meters
■ Each Power Xpert Multi-Point Meter module can be configured for up to six metering points in any
combination of single-phase and three-phase metering points corre-sponding to the voltage wiring of the meter base
■ Power Xpert Multi-Point configura-tion software simplifies system commissioning and startup; PXMP configuration software supports both online and offline configurations
Easy to Install■ UL Listed for mounting inside
panelboards (e.g., PRL4), switch-boards, and NEMA 12 enclosures
■ Quick connect terminals for current sensors, Modbus communications, and bus voltages make wiring the unit quick and easy
Table 3.2-9. Power Xpert Multi-Point Meter Features
� Main only.
Product Selection
Table 3.2-10. Meter Selection
� For applications requiring more than 2000A current sensors, use a CS005 with 5A CT in conjunction with PXMP-MM10MA.
Description Main/Aggregate Channel Data Tenant
InstrumentationCurrent, per phase ■ � ■ —
Voltage, per phase (L-L, L-N) ■ ■ —
Frequency — ■ ■
Minimum/maximum readings, V Per phase — —
Minimum/maximum readings, W, VAR, VA Total and per phase — —
Minimum/maximum readings, PF, F Total — —
PowerReal, reactive and apparent power (W, VAR, VA) Total and per phase Total and per phase Total
Power factor — Average Average
DemandBlock interval (fixed, sliding) ■ — —
Real, reactive and apparent power demand Total and per phase — —
Minimum/maximum readings, PF, W, VAR, VA Total and per phase Total —
EnergyReal, reactive and apparent energy (Wh, VARh, VAh) Total — Total
Real, forward and reverse, and total (Wh) ■ — ■
Meter Module Meter Base Typical Applications
Three-Phase Application or Single-Phase with ABCN
Single-Phase Application with ABN
New Switchboards PXMP Current Sensors, Solid Core, PXMP-CSXXX, Ampere Ratings
Retrofit Existing IQMESII Sensors, Solid Core, CS-XXX, Ampere Ratings
Enclosed PXMP 333MV Sensors, Split Core, CS-SP-X-XXXX-333MV, Ampere Ratings
Enclosed PXMP Interface Modules
PXMP-MM100MA PXMP-MB — 125, 250, 400 — — —
PXMP-MM333MV PXMP-MB — — — 100, 200, 300, 400, 600, 800, 1000, 1200, 1600, 2000 �
PXMP-IM333MV
PXMP-MM10MA PXMP-MB — — 5, 50, 70, 125, 200, 400
— —
PXMP-MM100MA-AB — PXMP-MB-AB 125, 250, 400 — — —
PXMP-MM333MV-AB — PXMP-MB-AB — — 100, 200, 300, 400, 600, 800, 1000, 1200, 1600, 2000 �
PXMP-IM333MV
PXMP-MM10MA-AB — PXMP-MB-AB — 5, 50, 70, 125,200, 400
— —

3.2-18
For more information, visit: www.eaton.com/consultants CA08104001E
November 2013
Advanced and Electronic Metering
i
ii
1
2
3
4
5
6
7
8
9
10
11
12
13
14
15
16
17
18
19
20
21
Sheet 03
Eaton Submeter OverviewPower Xpert Multi-Point Meter
062
Technical Data and Specifications
EnvironmentalThe PXMP Meter and current sensors must be housed in a NEMA or UL enclosure that keeps the internal environment within the PXMP’s environmental specification ranges and provides suitable fire and mechanical protection in the end product installation.
■ Temperature range: –20 to +70°C (–4 to +158°F)
■ Storage temperature range: –40 to +85°C
■ Humidity: 5–95% noncondensing environment
■ Pollution degree: II■ Elevation: 0 to 9843 ft (0 to 3000m)■ Housing: IP20■ CE Mark■ EMC EN61326
Emissions Conducted and Radiated■ FCC part 15 class B■ CISPR 11 class B
Table 3.2-11. Electromagnetic Immunity
� 24 Vdc PXMP inputs are for a local bus that is surge level 2. PXG60E AC mains connec-tion will support level 3.
Product Safety■ IEC/EN61010-1■ UL 61010-1 File E185559■ CNL evaluation to CAN/C22.2
No 1010.1.92
Accuracy■ ANSI C12.20—Accuracy Class 0.5%
with either CSXXX or PXMP-CSXXX sensors❑ Measurement Canada
Approval Pending
External Circuit Group Specifications
PXMP-MB (-AB) Meter Base
Discrete Output■ Quantity 1—solid-state relay Form A
NO Bidirectional FET■ Polarity of external source is
not important■ Isolation circuit to ground
2 kV/1 min.■ Maximum external source
voltage 28 Vdc■ Line-to-line TVS clamp across
switching element at 32 Vdc■ Solid-state relay on resistance
35 ohms maximum■ Maximum load current 80 mA■ Minimum pulse width
20 milliseconds■ Fixed 25 milliseconds for pulse
initiator function■ Maximum pulse rate 25 Hz■ Wiring to two-position removable
terminal plug❑ 12–18 AWG (3.31–0.82 mm2),
wire ferrules recommended❑ T1 (polarity not important)❑ T2 (polarity not important)
Discrete Inputs■ Quantity 3, common circuits
inputs 1–3■ Group isolation 2 kV
❑ No input-to-input circuit isolation
■ All inputs per module share acommon external ❑ 24V (±10%) supply❑ 24V externally sourced between
common and inputs❑ Design to interface with external
dry contact❑ Input impedance ~2.2K ohms❑ Input current draw ~10 mA per
input
■ Minimum pulse width 10 milliseconds
■ Maximum pulse rate 20 Hz■ Wiring to four-position removable
terminal plug❑ 12–18 AWG (3.31–0.82 mm2),
wire ferrules recommended❑ T3—Common (connect ext.
24 common here)❑ T4—Input 1 (dry contact to
24V hot)❑ T5—Input 2 (dry contact to
24V hot)❑ T6—Input 3 (dry contact to
24V hot)
COM1 and COM2 RS-485 Serial Ports■ No D+/D– biasing reliance on fail-
safe driver and biasing at Master■ Baud rate configurable between
9600–115K baud (default)■ Use cable designed for RS-485
communications❑ Low L:L capacitance❑ Impedance of ~100–120 ohms❑ Shield—Mylar for high frequency;
Braid for low frequency❑ Separate common and shield for
best noise immunity❑ Maximum cable length is 4000 ft
(1219.2m) with 32 nodes at 19.2K baud increased data rates will reduce maximum cable distance
❑ 2000 ft (609.6m) with 32 total nodes at 115.2K baud
■ Isolation 300V to ground due to TVS diode clamps
■ Modbus RTU slave protocol, address defined by rotary switch
■ Green Rx and Red Tx LEDs per channel
■ Data + > Data—during idle marked, logic 1 state
■ End of Line Termination resistance should match cable impedance (typ. 100–120 ohms)
■ Four-position removable terminal plug 18–22 AWG (0.82–0.33 mm2) typical, wire ferrules recommended❑ COM1
– T7—Shield– T8—RS-485 common– T9—Data –– T10—Data +
❑ COM2– T11—Shield– T12—RS-485 common– T13—Data –– T14—Data +
Standard Description Level
EN61000-4-2 ESD 3
EN61000-4-3 RF radiated 3
EN61000-4-4 Electrical fast transient
3
EN61000-4-5 Surge 3 �
EN61000-4-6 RF conducted 3
EN61000-4-11 Volt sag/swell/variation
—

CA08104001E For more information, visit: www.eaton.com/consultants
3.2-19November 2013
Advanced and Electronic Metering
i
ii
1
2
3
4
5
6
7
8
9
10
11
12
13
14
15
16
17
18
19
20
21
Sheet 03
Eaton Submeter OverviewPower Xpert Multi-Point Meter
063
PXMP-MB Power Supply Input■ 24 Vdc ±20%■ 15W maximum load■ 1 kV isolation barrier internal to
PXMP-MB■ Externally fuse circuit to protect wire■ Green power OK LED■ Three-position terminal block
16–12 AWG (1.31–3.31 mm2), wire ferrules recommended❑ T15—24 Vdc – (common)❑ T16—24 Vdc + (Hot)❑ T17—Shield (optional)
capacitively referenced to chassis ground for enhanced EMC performance
Meter Voltage Inputs■ Overvoltage CAT III■ Maximum voltage rating
❑ 480VL:G (corner grounded delta)❑ 347VL:N❑ 600VL:L
■ Frequency rating 47–63 Hz■ Metering range (temporary
transitions)❑ 30–700VL:N❑ 30–700VL:L
■ Abuse withstand rating 1000V sustained
■ High pot withstand rating 2500V/1min
■ Input impedance 4M ohms■ Fuse inputs rated to protect wiring
to mains. External fuses must be installed between the meter voltage terminal and the mains disconnect switch to the main lines to protect the lines. 600V 1A BUSS type KTK-R-1 Fast Acting or equivalent fuses are recommended.
■ Wiring to removable terminal plug 10–18 AWG (5.26–0.82 mm2), wire ferrules recommended❑ T18—N (VR)❑ T19—C (V3)❑ T20—B (V2)❑ T21—A (V1)
PXMP Meter Modules (PXMP-MMs)Compatible with all PXMP Meter Base slots 1–10 LED indicators:
■ Health and status green, blink to show activity
■ Pulse energy output one red per group of three loads
■ Load energy direction red/green pair per load
All variations support six load inputs.
Current sensor connection is one 2 x 2 connector per load.
Compatible with PXMP-SCXX sensor cables, total cable length to the sensor should not exceed 28 ft (8.5m).
Note that -AB suffix only affects what voltage channels the loads are paired with for metering purposes.
PXMP-MM10MA supports the CSXXX series of 10 mA maximum secondary output current transformers.
PXMP-MM100MA supports the PXMP-CSXXX series of 100 mA maximum secondary output current transformers.
PXMP-MM333MV supports 333 mV maximum secondary output current transformers with the use of the PXMP-IM333MV interface module.
PXMP Digital Output Module (PXMP-DOM)■ Compatible with all PXMP-MB
slots 1–10■ LED indicators
❑ Health and status green, blink to show activity
❑ Output On/Off status one green per output
❑ Eight individual solid-state relay outputs
■ Each circuit rated for 24 Vdc (±20%) with an 80 mA load maximum
■ 24 Vdc is externally sourced■ Group isolation to ground 2 kV■ Each circuit has its own separate
common, circuit-to-circuit isolation 120V
■ 16-position removable terminal plug■ 12–18 AWG (3.31–0.82 mm2), wire
ferrules recommended
PXMP Pulse Input Modules (PXMP-PIMs)■ Compatible with all PXMP-MB
slots 1–10■ LED indicators
❑ Health and status green, blink to show activity
❑ Input On/Off status one green per pulse input
■ Eight pulse inputs to external dry contacts
■ Maximum pulse rate is 20 Hz■ Minimum pulse width is
20 milliseconds■ External circuit groups rated for
24 Vdc (±20%)❑ All circuits share the same
electrical common
■ External supply connects to the module with a two-position remov-able terminal plug
■ The supply is internally fanned out to all circuits
■ Group isolation limited to 300V to ground due to TVS diode clamp
■ Input impedance ~2.2K causing a 10 mA load per input when energized
■ External circuit groups connect with a 16-position removable terminal plug❑ Terminals support 12–18 AWG
(3.31–0.82 mm2), wire ferrules recommended

3.2-20
For more information, visit: www.eaton.com/consultants CA08104001E
November 2013
Advanced and Electronic Metering
i
ii
1
2
3
4
5
6
7
8
9
10
11
12
13
14
15
16
17
18
19
20
21
Sheet 03
Eaton Submeter OverviewPower Xpert Multi-Point Meter
064
PXMP Energy Portal Module (PXMP-EPM)■ Only functionally compatible with
PXMP-MB slot 10■ LED indicators
❑ Top health and status green, blink to show activity
❑ Com. reset button—reset to defaults
❑ Local IP 192/10❑ RJ45 front-facing Ethernet config-
uration port LEDs– Link (Tx/Rx blink)– 10/100 speed
■ LED four-stack for bottom LAN/WAN Ethernet port❑ Link (Tx/Rx blink)❑ 10/100 speed❑ DHCP/Fixed❑ TX active
■ Config. Ethernet RJ45 Cat5 STP/UTP❑ 10Base-T/100Base-Tx❑ Auto crossover capability
supported❑ Java Web browser interface
■ Bottom facing LAN/WAN Ethernet port❑ RJ45 Cat5 STP/UTP 10Base-T/
100Base-Tx❑ STP required for full
electromagnetic immunity❑ Auto crossover capability
supported❑ Supports Modbus TCP and Java
Web browser interface
■ Bottom-facing telephone modem interface❑ Modem type V92/56K baud❑ RJ11 field interface
Table 3.2-12. Power Xpert Multi-Point Meter System—Hardware Specifications
� DC.� AC RMS.
Components Field Circuit
PowerSource
Rated Voltage
Rated Current
Circuit Impedance
Isolation Note 1 Note 2
PXMP-MBPXMP-MB-AB
Digital output External 24 ±20% � 0.080A maximum
35 ohms maximum
2.0 kV — —
Digital input External 24 ±20% � 0.01A 2.22K 2.0 kV Opto drops supply by 2V
Group are electri-cally common
COM1 RS-485 Internal 5V � — 50–60 ohms 300V TVS diode clamped to PE
—
COM2 RS-485 Internal 5V � — 50–60 ohms 300V TVS diode clamped to PE
—
Power supply input
External 24 ±20% � 0.7A maximum
N/A 1.0 kV Installation Class II input
15W maximum
Voltage inputsA (V1)/ B (V2)/ C (V3)/ N (VR)
External mains
480V L:G � 0.12 mA 4M ohms N/A Installation Class III
High pot 2500V/1 minimum
347V L:N � 0.09 mA 4M ohms N/A Installation Class III
High pot 2500V/1 minimum
600V L:L � 0.09 mA 4M ohms N/A Installation Class III
High pot 2500V/1 minimum
PXMP-MM100MA CT secondary External N/A 100 mA 14.6 ohms N/A 20% over-range See sensor for primary isolation
PXMP-MM10MA CT secondary External N/A 10 mA 67 ohms N/A 20% over-range See sensor for primary isolation
PXMP-MM333MV CT secondary External 0.333V � N/A 50,000 ohms N/A 20% over-range See sensor for primary isolation
PXMP-DOM Digital output External 24 ±20% � 0.080A maximum
10 ohms maximum
2 kV group 120V isolation circuit-to-circuit
Isolation dependent on external source
PXMP-PIM Pulse input External 24 ±20% � 0.01A 2.22K ohms 300V to ground
TVS diode clamped to PE; group isolated, all circuits common to 24V external source
Note: Opto creates 2.2V drop sourced by 2.2K ohms; isolation dependent on external source
PXMP-EPM Ethernet 100 Bt Internal — N/A N/A 1 kV — —
POT modem Internal — N/A N/A — — —

CA08104001E For more information, visit: www.eaton.com/consultants
3.2-21November 2013
Advanced and Electronic Metering
i
ii
1
2
3
4
5
6
7
8
9
10
11
12
13
14
15
16
17
18
19
20
21
Sheet 03
aton Submeter OverviewPower Xpert Multi-Point Meter
065
Catalog InformationThe Power Xpert Multi-Point Meter, current sensors and other accessories can be ordered from Eaton distributors. Refer to the following catalog numbers when ordering.
Table 3.2-13. Power Xpert Multi-Point Meter Products
Note: Total sensor lead length must not exceed 28 ft (8.5m).
The Pulse Input Module (PXMP-PIM) can be used to totalize pulse outputs from water meters, gas meters, steam meters, or even old electrical meters with KZ pulse outputs. The PXMP-PIM can also be used for status monitoring in applications where status indication updates of 6 seconds over Modbus satisfies the application requirement.
Support products for the Power Xpert Multi-Point Meter include the HMI display, IMPCABLE and power supplies as described in Table 3.2-14.
Table 3.2-14. Power Xpert Multi-Point Meter Support Products
Product Description
Catalog Number
Meter Bases and Meter Modules with ABCN Voltage InputsPXMP meter base—three-phase with ABCN voltage inputs
PXMP-MB
PXMP meter module with six 100 mA inputs for use with PXMP current sensors
PXMP-MM100MA
PXMP meter module with six 10 mA inputs for use with IQMESII current sensors
PXMP-MM10MA
PXMP meter module with six 333 mV inputs for use with 333 mV current sensors
PXMP-MM333MV
Meter Bases and Meter Modules with ABN Voltage InputsPXMP meter base—single-phase, three-wire with ABN voltage inputs
PXMP-MB-AB
PXMP meter module with six 100 mA inputsfor use with PXMP current sensors
PXMP-MM100MA-AB
PXMP meter module with six 10 mA inputs for use with IQMESII current sensors
PXMP-MM10MA-AB
PXMP meter module with six 333 mV inputs for use with 333 mV current sensors
PXMP-MM333MV-AB
IO ModulesPXMP meter pulse input module with eight inputs PXMP-PIM
PXMP meter digital output module with eight outputs
PXMP-DOM
Communication ModulePXMP meter energy portal module PXMP-EPM
Current Sensor KitsKIT, PXMP CS125 sensor, quantity of 3 PXMP-CS125-3
KIT, PXMP CS250 sensor, quantity of 3 PXMP-CS250-3
KIT, PXMP CS400 sensor, quantity of 3 PXMP-CS400-3
Current Sensor Cable KitsKIT, PXMP sensor cable, 4 ft (1.2m), quantity of 3 PXMP-SC4-3
KIT, PXMP sensor cable, 6 ft (1.8m), quantity of 3 PXMP-SC6-3
KIT, PXMP sensor cable, 8 ft (2.4m), quantity of 3 PXMP-SC8-3
KIT, PXMP sensor cable, 12 ft (3.7m), quantity of 3 PXMP-SC12-3
Current Sensor Extension Cable KitsKIT, PXMP sensor extension cable, 8 ft (2.4m), quantity of 3
PXMP-SCE-8-3
KIT, PXMP sensor extension cable, 16 ft (4.9m), quantity of 3
PXMP-SCE-16-3
Interface ModulesPXMP current sensor interface module for 333 mV, kit X 3
PXMP-IM333MV-3
Product Description
Catalog Number
Communication cable, 1000 ft (305m), 600V insulation
IMPCABLE
PXMP meter display—6-inch color touchscreen (with cable)
PXMP-DISP-6
Power supply—single-phase 90–264 Vac, 24 Vdc at 2.5A
PSG60E
Power supply—three-phase 360–575 Vac, 24 Vdc at 2.5A
PSG60F
Power supply—three-phase 600 Vac, 24 Vdc PSS55D

3.2-22
For more information, visit: www.eaton.com/consultants CA08104001E
November 2013
Advanced and Electronic Metering
i
ii
1
2
3
4
5
6
7
8
9
10
11
12
13
14
15
16
17
18
19
20
21
Sheet 03
Eaton Submeter OverviewPower Xpert Multi-Point Meter
066
Wiring Diagrams
PXMB-MBNote: For all voltage connections—Fuses should be sized in accordance with best practices to protect the instrumentation wire.
Figure 3.2-24. Four-Wire Wye Voltage Connection Inputs
Figure 3.2-25. Three-Phase, Four-Wire Service Current Sensor Connections

CA08104001E For more information, visit: www.eaton.com/consultants
3.2-23November 2013
Advanced and Electronic Metering
i
ii
1
2
3
4
5
6
7
8
9
10
11
12
13
14
15
16
17
18
19
20
21
Sheet 03
Eaton Submeter OverviewPower Xpert Multi-Point Meter
067
Figure 3.2-26. Three-Phase, Four-Wire Service (Ten Single-Phase, Single-Pole) Current Sensor Connections
Figure 3.2-27. Network 120/208 Three-Wire Apartment Service Current Sensor Connections

3.2-24
For more information, visit: www.eaton.com/consultants CA08104001E
November 2013
Advanced and Electronic Metering
i
ii
1
2
3
4
5
6
7
8
9
10
11
12
13
14
15
16
17
18
19
20
21
Sheet 03
Eaton Submeter OverviewPower Xpert Multi-Point Meter
068
PXMB-MB-ABNote: For all voltage connections—Fuses should be sized in accordance with best practices to protect the instrumentation wire.
Figure 3.2-28. Single-Phase, Three-Wire 120/240 Voltage Connection Inputs
Figure 3.2-29. 120/240 Single-Phase, Three-Wire Service Current Sensor Connections

CA08104001E For more information, visit: www.eaton.com/consultants
3.2-25November 2013
Advanced and Electronic Metering
i
ii
1
2
3
4
5
6
7
8
9
10
11
12
13
14
15
16
17
18
19
20
21
Sheet 03
Eaton Submeter OverviewPower Xpert Multi-Point Meter
069
Dimensions in Inches (mm)
Mounting Dimensions
Figure 3.2-30. Single Unit—Front View
Figure 3.2-31. Single Unit—Side View
Figure 3.2-32. Single Unit—Top View
Figure 3.2-33. PXMP Color Touchscreen Display
2 4 5 6 7 8 9 101 3
2 4 5 6 7 8 9 101 3
B1
XX
XX
XX
XX
CTInputs
A1
RX
TX
RX
TX
789
10
11121314
ShieldCommon
ShieldCommon
A
B
C
151617
18
nc
19
nc
20
nc
21
-Vdc+VdcShld
N (VR)
C (V3)
B (V2)
A (V1)
PS Input
6 4
9 10
3
28
7
5
Slave Address
6 4
3
28
7
5
90
1
WARNINGREMOVE POWER BEFORE SERVICING
DO NOT HIPOT / DIELECTRIC TEST
MORE THAN ONE LIVE CIRCUIT. SEE DIAGRAM.
CIRCUITS SOUS TENSION. VOIR LE SCHEMA.AVERTISSEMENT: CET EQUIPEMENT RENFERME PLUSIEURS
Mode
12
3456
CommonInput 1Input 2Input 3
24Vdc Inputs
24Vdc 80mA Output
Delta
Status
Power
Wye/1PH
Health
Config. Port
MeterBase
Voltage InputsMeter
(Com 2)RS-485
(Com 1)RS-485
DD
DD
Rating24Vdc
15W Max
b
Power XpertMultipoint Meter
480V~ L:G Max.347V~ L:N Max.600V~ L:L Max.CAT IIIFreq. 47-63 Hz
See manual for complete ratings
11.67(296.4)
10.67(271.0)0.20
(5.1)
Cat. No. PXMP-MB-XX
Style No. 66D2261GXX
FW Version X.X
Date Code: WYYMMDD
Rev. X
SN: XXXXXX
Made in USA
Com
Health
ModuleMeter
1
-
+A1
100mASensor
Pulse
-
+B1
-
+XX
-
+XX
-
+XX
-
+XX
2Pulse
Com
Health
ModuleMeter
1
-
+A1
100mASensor
Pulse
-
+B1
-
+XX
-
+XX
-
+XX
-
+XX
2Pulse
Com
Health
ModuleMeter
1
-
+A1
100mASensor
Pulse
-
+B1
-
+XX
-
+XX
-
+XX
-
+XX
2Pulse
Com
Health
ModuleMeter
1
-
+A1
100mASensor
Pulse
-
+B1
-
+XX
-
+XX
-
+XX
-
+XX
2Pulse
Com
Health
ModuleMeter
1
-
+A1
100mASensor
Pulse
-
+B1
-
+XX
-
+XX
-
+XX
-
+XX
2Pulse
Com
Health
ModuleMeter
1
-
+A1
100mASensor
Pulse
-
+B1
-
+XX
-
+XX
-
+XX
-
+XX
2Pulse
Com
Health
ModuleMeter
1
-
+A1
100mASensor
Pulse
-
+B1
-
+XX
-
+XX
-
+XX
-
+XX
2Pulse
ModulePulse In
PI1PI2PI3PI4PI5PI6PI7PI8
Com
Health
PI1
PI2
+
-
PI3
PI4
PI5
PI6
PI7
PI8
24
V
12
34
56
78
91
01
11
21
31
41
51
6
24VdcO
1O
2O
3O
4O
5O
6O
7O
8
ModuleOutput
O1O2O3O4O5O6O7O8
Com
Health
12
34
56
78
91
01
11
21
31
41
51
6
24Vdc80mA Max
Status
Health
ComReset
ModulePortal
Modem
LAN
Link
10
/10
0D
HC
PT
X S
T
LAN
Local IP
192/10
10
/10
0Lin
k Local
12.00(304.8)
8.74(222.0)
3.27(83.1)
12.50(317.5)
Cat
. No.
PXM
P-EP
M-X
Seria
l No.
XXX
XXX
FW
X.X
X
Tech
nica
l Sup
port
1-8
00-8
09-2
772
http
://w
ww
.Eat
on.c
om
Styl
e N
o. 6
6D22
50G
0X
Rev
. X
Po
we
r X
pe
rtM
ultip
oin
t M
ete
r
WY
YM
MD
D
Mad
e in
USA
15.63(397.0)
5.21(132.4)
Cut-Out Dimensions
6.79(172.4)
0.12 (3.0) R Typ.6.10
(0.24)
1.54(39.0)0.06~0.12
(1.6~3.0)
Outer
7.25(184.1)
5.67(144.1)

3.2-26
For more information, visit: www.eaton.com/consultants CA08104001E
November 2013
Advanced and Electronic Metering
i
ii
1
2
3
4
5
6
7
8
9
10
11
12
13
14
15
16
17
18
19
20
21
Sheet 03
Eaton Submeter OverviewPower Xpert Multi-Point Meter
070
Figure 3.2-34. Current Sensor Dimensions
Table 3.2-15. Current Sensor Dimensions in Inches (mm)
Figure 3.2-35. Open Interface Module (PXMP-IM333MV)
H
W
ID
Sensor H W ID
PXMP-CS125 2.66 (67.6) 1.66 (42.1) 0.53 (13.5)
PXMP-CS250 2.96 (75.2) 2.42 (61.5) 1.12 (28.4)
PXMP-CS400 3.64 (92.5) 3.03 (73.2) 1.74 (44.2)
Terminal BlockBlue Locator LED
PXMP-SCX Cable Connection
Strain ReliefStrap Holes
333 mV Sensor Secondary Leads

CA08104001E For more information, visit: www.eaton.com/consultants
3.2-27November 2013
Advanced and Electronic Metering
i
ii
1
2
3
4
5
6
7
8
9
10
11
12
13
14
15
16
17
18
19
20
21
Sheet 03
Eaton Submeter OverviewIQ Energy Sentinel
071
IQ Energy Sentinel
IQ Sentinel
IQ SentinelsIQ Sentinels are microprocessor-based submeters, designed to monitor power and energy. They represent an alternative to installing separate wattmeters, watthour meters, and watt demand meters.
The IQ Energy Sentinel monitors watts, watthour and watt demand.
Key advantages include unmatched savings in space, lower installation costs, and the capability to communi-cate data readings in a variety of ways.
IQ Sentinels with built-in CTs and communications have the added benefit of greater overall system accuracy. Conventional metering often is less accurate since external CTs and separate transducers may each haveinaccuracies of 1% or more.
Table 3.2-16. IQ Energy Sentinel Features Features Benefits
■ Monitors (accuracy stated full scale)Kilowatts ±1.0%Kilowatts demand ±1.0%Kilowatt hour ±1.0%
■ Built-in CTs version up to 400A or external CTs version up to 4000A■ Breaker, panel or DIN rail mounted■ Powered directly off the line■ Built-in communication capability
Address set by DIP switchesCommunication at 9600 baudNoise immune INCOM protocol
■ Choice of operator interfacesSubnetwork master local displayBreaker Interface Module (BIM)Power Management Energy Billing softwarePower Management software
■ UL and CSA listed
■ One device replaces multiple meters and/or transducers■ Improved system accuracy■ Savings in product cost■ Savings in space■ Savings in installation cost■ No external power source is needed■ Permits remote monitoring and interconnection with
programmable logic controllers and building management systems. For more information, see section on Power Management Software Systems
■ Designed to interface directly with Power Management Software Energy Billing software
■ Flexibility—displays what is needed where it is needed
■ Power Management Software

3.2-28
For more information, visit: www.eaton.com/consultants CA08104001E
November 2013
Advanced and Electronic Metering
i
ii
1
2
3
4
5
6
7
8
9
10
11
12
13
14
15
16
17
18
19
20
21
Sheet 03
Eaton Submeter OverviewIQ Energy Sentinel
072
IQ Sentinels (Continued)Eaton’s IQ Sentinels provide a unique cost-effective method to implement energy submetering at lower levels in the distribution system.
The ability to monitor power distribution systems down to the machine or process level at an industrial facility has become essential to provide key benefits such as to verify the accuracy of the utility bill, identify and track energy usage to the loads that consume it, develop a facility energy profile to establish a baseline, allocate energy costs to create account-ability and so on.
An optional door-mounted interface, the Subnetwork Master Local Display, is available to display the energy parameters monitored by the IQ Sentinels.
Submetering application examples for the IQ Sentinels include energy demand monitoring, product cost analysis, process machine tool efficiency and productivity improve-ment, and energy-cost allocation or tenant billing for commercial, industrial, recreational and residential facilities.
Note: For customer-billing applications, consult local utility for metering requirements.
Commercial applications include energy-cost allocation within conven-tion halls, office buildings, shopping malls, hospitals, warehouses and storage facilities.
Industrial applications include depart-mental billing and process/assembly line energy cost analysis. IQ Energy Sentinels may be substituted for watt transducers when monitoring machine tool and equipment performance within plants.
Recreational facilities include sports arenas, camping grounds, trailer parks and marinas.
The IQ Sentinel may be applied on three-phase (three- or four-wire), as well as single-phase (three-wire) systems.
IQ Sentinels may be applied on either 50 or 60 Hz systems.
Application DescriptionThe IQ Energy Sentinel is available in three different package versions: breaker mounted, universal breaker with internal CTs, and universal breaker with external CTs.
Designed for mounting on Series C® circuit breakers used in Eaton assem-blies such as:
■ Pow-R-Line four panelboards—feeder circuits
■ Power-R-Line C™ switchboards—feeder circuits
■ Motor control centers and enclosed control with circuit breaker disconnects—starter or feeder circuits
■ Enclosed motor control■ Enclosed circuit breakers■ Pow-R-Way III® Bus Plugs with
circuit breaker disconnects
Breaker Mount ApplicationsNew Equipment
F-Frame Breaker with IQ Sentinel
RetrofittingThe space-saving design characteris-tics of the breaker mount IQ Energy Sentinels allow them to be added to existing Eaton circuit breakers at any time...often with no additional space or modifications required.
Or they may be installed when upgrading from older circuit breakers...often with no additional space or modifications required.
Universal Mount with Internal CTs
Universal Mount ApplicationsThe universal mount IQ Energy Sentinel with internal CTs includes integral 400A CTs and may be applied on loads up to 400A. The universal mount IQ Energy Sentinels with internal CTs may be used wherever breaker mounting is not feasible or possible.
The universal mount IQ Energy Sentinel with provisions for external CTs may be applied on loads up to 4000A. They are usually used for monitoring loads larger than 400A, on power cable sizes larger than 500 kcmil or on circuits containing more than one conductor per phase.

CA08104001E For more information, visit: www.eaton.com/consultants
3.2-29November 2013
Advanced and Electronic Metering
i
ii
1
2
3
4
5
6
7
8
9
10
11
12
13
14
15
16
17
18
19
20
21
Sheet 03
Eaton Submeter OverviewIQ Energy Sentinel
073
Eaton Breaker MountEaton’s breaker mount IQ Energy Sentinel installs in less than 10 minutes on the load side of a Eaton Series C F-Frame (150A), J-Frame (250A), or K-Frame (400A) circuit breakers.
Energy Sentinel Features
Universal Mount with Internal CTs—(UI)The Universal Mount IQ Energy Sentinel with internal CTs may be panel-mounted or DIN rail mounted on disconnects or other circuits up to 400A. A pull-apart terminal block is provided on the device for connection of the system voltage reference wiring.
Note: The location of the ground/neutral connection differs on Breaker Mount IQ Energy Sentinels from the location of the ground/neutral connection on Universal Mount IQ Sentinels. Incorrect wiring to the ground/neutral and communications connections may result in accuracy and communication errors.
Universal Mount for External CTs—(UE)The Universal Mount IQ Energy Sentinel for external CTs may be panel-mounted or DIN rail mounted on circuits up to 4000A.
A pull-apart terminal block is provided on the device for connection of the system voltage reference wiring as well as another terminal block for connection to the user’s existing 5A secondary CTs that may range in standard ratios from 25:5 up to 4000:5.
Note: If the device will be disconnected without interruption of the monitored load, the use of a CT shorting block is advised.
Energy Sentinel Features
DIP SwitchAddress
CommunicationsConnections
Ground/NeutralConnection
VoltageTangs Transmit
LED
CommunicationsConnections
CommunicationsShieldConnection
Voltage Terminal Block
Ground/NeutralConnection
CommunicationsConnections
CommunicationsShieldConnection
Voltage Terminal Block
Ground/NeutralConnection
CTTerminalBlock

3.2-30
For more information, visit: www.eaton.com/consultants CA08104001E
November 2013
Advanced and Electronic Metering
i
ii
1
2
3
4
5
6
7
8
9
10
11
12
13
14
15
16
17
18
19
20
21
Sheet 03
Eaton Submeter OverviewIQ Energy Sentinel
074
Technical Data and Specifications
Table 3.2-17. Energy Sentinel
� 40°C (standard) maximum for Series C® circuit breakers.
� Acceptable for Universal IQ Energy Sentinels only.
Current InputCurrent Range: 1% to 125% of current ratingBurden: 1 VA
Voltage InputVoltage Range: ±20% of voltage rating
Frequency50 or 60 Hz
Power Factor RangeAll (–1 to +1)
CommunicationsProtocol: INCOMSpeed: 9600 baudCompatibility: Power Management Software
compatible
Environmental ConditionsOperating temperature: –25° to 70°C �
(–13° to 158°F)Storage temperature: –40° to 85°C �
(–40° to 185°F)Operating humidity: 5% to 95%
relative humidity noncondensing
Dimensions D x W x H in Inches (mm)F 3.20 x 4.12 x 1.30 (81.3 x 104.6 x 33.0);
CT window size � 0.59 (15.0)J 4.04 x 4.12 x 1.28 (102.6 x 104.6 x 32.5);
CT window size � 0.77 (19.6)K 4.04 x 5.31 x 1.25 (102.6 x 134.9 x 31.8);
CT window size � 0.96 (24.4)UI 4.36 x 5.31 x 3.00 (110.7 x 134.9 x 76.2);
hole clearance 1.17 (29.7)UE 4.36 x 5.31 x 3.00 (110.7 x 134.9 x 76.2)
Weight in Lbs (kg):F 0.65 (0.30)J 0.69 (0.31)K 0.87 (0.39)UI 1.10 (0.50)UE 1.10 (0.50)
Other SpecificationsUL File No. E64983CSA File No. LR106359-1
System Voltage Considerations(Application Note)The Ground (GND) terminal of the IQ Energy Sentinel should be connected to the ground bus or other non-current- carrying ground with 600V rated wire to ensure accuracy.
Figure 3.2-36. Acceptable System Configurations
Phase A
Phase C
Phase A
Phase C
Neutral
Three-Phase Star, Four-Wire, Earthed Neutral.
Three-Phase Star, Four-Wire, Non-Earthed Neutral.
Single-Phase, Three-Wire, Earthed Mid-Point (Connect to A and C Phases).
Two-Phase Star,Three-Wire, Earthed Neutral (Connect to A and C Phases).
Three-Phase Star, Three-Wire
Three-Phase Star, Three-Wire, Earthed Neutral Point.
Three-Phase Delta, Three-Wire
Three-Phase Open Delta, Four-Wire, Earthed Junction.
Note: Acceptable for Universal IQ Energy Sentinels only.

CA08104001E For more information, visit: www.eaton.com/consultants
3.2-31November 2013
Advanced and Electronic Metering
i
ii
1
2
3
4
5
6
7
8
9
10
11
12
13
14
15
16
17
18
19
20
21
Sheet 03
Eaton Submeter OverviewIQ Energy Sentinel
075
Table 3.2-18. IQ Energy Sentinels Catalog Information
Table 3.2-19. Terminal, Cable and Wiring Guidelines
Description Voltage Rating—Vac Current RatingMaximum Amperes
CatalogNumber
For F-Frame breakersFor F-Frame breakersFor F-Frame breakersFor F-Frame breakers
120/240, 240, 208Y/120220/380, 230/400, 240/415480, 480Y/277600, 600Y/347
150 150 150 150
IQESF208IQESF400IQESF480IQESF600
For J-Frame breakersFor J-Frame breakersFor J-Frame breakersFor J-Frame breakers
120/240, 240, 208Y/120220/380, 230/400, 240/415480, 480Y/277600, 600Y/347
250 250 250 250
IQESJ208IQESJ400IQESJ480IQESJ600
For K-Frame breakersFor K-Frame breakersFor K-Frame breakersFor K-Frame breakers
120/240, 240, 208Y/120220/380, 230/400, 240/415480, 480Y/277600, 600Y/347
400 400 400 400
IQESK208IQESK400IQESK480IQESK600
Universal with internal CTsUniversal with internal CTsUniversal with internal CTsUniversal with internal CTs
120/240, 240, 208Y/120220/380, 230/400, 240/415480, 480Y/277600, 600Y/347
400 400 400 400
IQESUI208IQESUI400IQESUI480IQESUI600
Universal for external CTsUniversal for external CTsUniversal for external CTsUniversal for external CTs
120/240, 240, 208Y/120220/380, 230/400, 240/415480, 480Y/277600, 600Y/347
4000400040004000
IQESUE208IQESUE400IQESUE480IQESUE600
Sentinel EatonSeries C Terminal
Wire SizeSingle Conductor
F-FrameJ-FrameK-Frame
624B100G02, G17, G18, G19T250KB, TA250KBT350K, TA350KB
#14–1/0, #4–4/0, #4–4/01, #14–1/0 AWG#4–350 kcmil#250–500 kcmil
Universal with internal CTsSystem voltage reference wiringCurrent transformer wiringGround reference wiringCommunications wiring
#250–500 kcmil#24–#10 AWG#12 AWG (maximum)#22–#12 AWG (minimum 600V rated)Eaton IMPCABLE or Belden 9463 family

3.2-32
For more information, visit: www.eaton.com/consultants CA08104001E
November 2013
Advanced and Electronic Metering
i
ii
1
2
3
4
5
6
7
8
9
10
11
12
13
14
15
16
17
18
19
20
21
Sheet 03
Eaton Submeter OverviewIQ Energy Sentinel
076
Dimensions in Inches (mm)
Figure 3.2-37. IQ Sentinel
Radius
1.17(29.7)Diameter
0.25(6.4) Typical0.25
(6.4)Typical0.25(6.4)Typical
1.10(27.9)
1.25(31.8)
1.25(31.8)
1.28(32.5)
0.75(19.1)
1.30(33.0)
1.17(29.7)
Typical
1.17(29.7)Typical
0.96(24.4)
4.04(102.6)
1.72(43.7)
1.72(43.7)
2.66(67.5)
5.31(134.9)
0.77(19.6)
0.90(22.9)
Typical
1.38(34.9)
1.38(34.9)
2.06(52.3)
4.12(104.6)
0.59(15.0)
1.38(34.9)
4.04(102.6)
3.20(81.3)
1.38(34.9)
1.38(34.9)
2.06(52.3)
4.12(104.6)
1.80(45.7)
1.71(43.4)
1.80(45.7)
0.14(3.6)
2.50(63.5)
3.00(76.2)
2.60(66.0)
1.36(34.5)
1.36(34.5)
5.31(134.9)
1.72(43.7)
2.66(67.5)
4.36(110.7)
1.72(43.7)
Radius
1.80(45.7)
1.71(43.4)
1.80(45.7)
0.14(3.6)
2.50(63.5)
3.00(76.2)
2.60(66.0)
1.36(34.5)
1.36(34.5)
5.31(134.9)
4.36(110.7)
F-Frame Energy Sentinels J-Frame Energy Sentinels K-Frame Energy Sentinels
Universal with Internal CTsEnergy Sentinels
Universal with External CTsEnergy Sentinels

CA08104001E For more information, visit: www.eaton.com/consultants
3.2-33November 2013
Advanced and Electronic Metering
i
ii
1
2
3
4
5
6
7
8
9
10
11
12
13
14
15
16
17
18
19
20
21
Sheet 03
Eaton Advanced MetersMolded-Case Circuit Breaker Power Monitoring and Metering Module
077
Molded-Case Circuit Breaker Power Monitoring and Metering Module (PM3)
Power Monitoring/Metering Module (PM3)
General DescriptionThe Power Monitoring and Metering Module (PM3) is a UL-listed add-on communications module that mounts directly to the load side of three-pole molded-case circuit breakers, similar to an earth leakage module. The PM3 adds revenue accurate power metering and breaker status monitoring to new and/or existing Series C and Series G breakers. Regardless of the type of trip unit (thermal-magnetic or electronic), the PM3 can be applied in applications where power metering, circuit breaker monitoring and/or communications is essential. The PM3 is extremely flexible and can be used in main breaker or feeder breaker applications. The automatic voltage sensing means that the same PM3 module can be used on 208, 240 or 480 Vac applications. It can also be installed in reverse-feed and reverse-phasing (CBA) applications.
Features and FunctionsThe PM3 provides the following metering, monitoring and communications functions:
Metering ■ Phase currents (Ia, Ib, Ic, Iavg)■ Phase-to-phase voltages
(Vab, Vbc, Vca, Vavg)■ Phase-to-neutral voltages
(Van, Vbn, Vcn, Vavg)■ Real power (kW)—total and
per phase■ Reactive power (kVAR)—total and
per phase■ Apparent power (kVA)—total and
per phase■ Power factor—total and per phase■ Real energy (WHr)—forward,
reverse and net■ Reactive Energy (VARHr)—forward,
reverse and net■ Apparent energy (VAHr)—forward,
reverse and net
Accuracy■ Voltage and amperage: 0.5% of
reading■ Watts, VARs, VA: 1% of reading■ Energy: 1% per ANSI C12.1■ Revenue Grade Accuracy: ANSI C12.1
Monitoring■ Breaker status �
❑ Open/close status—thru breaker auxiliary contact
❑ Tripped status—thru breaker bell alarm contact
■ Unit health—flashing status LED when module is powered
� Breaker must include auxiliary contact and bell alarm contact accessory.
Communications■ INCOM and Modbus RTU
communications❑ Shielded-twisted pair
communications❑ Daisy-chaining of multiple units❑ Web-based communications
available through a Power Xpert Gateway
❑ TX and RX communication diagnostic LEDs
Metering Module
Control PowerThe PM3 is powered directly from the circuit breaker voltage for applications 480 Vac and below. External control power is not required for these applications. However, an auxiliary 24 Vdc external power input is included for applications requiring communications capability even when the breaker circuit is de-energized.
Note: For 600V applications, external 24 Vdc auxiliary power is required.
Product SelectionTable 3.2-20. PM3 Product Selection PM3 ModulesFrame
Catalog Number
480V 600V
ModbusFDJGKD and LG
———
PM3FMPM3JMPM3LM
INCOMFDJGKD and LG
PM3FI480PM3JI480PM3LI480
PM3FI600PM3JI600PM3LI600

3.2-34
For more information, visit: www.eaton.com/consultants CA08104001E
November 2013
Advanced and Electronic Metering
i
ii
1
2
3
4
5
6
7
8
9
10
11
12
13
14
15
16
17
18
19
20
21
Sheet 03
Eaton Advanced MetersMolded-Case Circuit Breaker Power Monitoring and Metering Module
078
Technical Data and Specifications
Metered parameters■ Ia, Ib, Ic■ Vab, Vbc, Vca, Van, Vbn, Vcn■ Apparent Energy, Forward Real
Energy, Reverse Real Energy, Net Real Energy, Lagging Reactive Energy, Leading Reactive Energy, Net Reactive Energy
■ Apparent Power A, B, C; Apparent Power Total; Reactive Power A, B, C; Reactive Power Total; Real Power A, B, C; Real Power Total
■ Frequency, Apparent Power Factor, Apparent PFA, Apparent PFB, Apparent PFC
Table 3.2-21. PM3 Power Monitoring and Communications Module Technical Specifications for Modbus RTU Description Specification
Current InputsPickup current 0.3A rms
Maximum reported current FD/JG 250A rmsKD/LD 630A rms
Accuracy 0.5% 0.5% of reading
Voltage InputsRange Line-to-neutral 30–366 Vac
Line-to-line 52–635 Vac
Supported systems Three-element wye, three-element wye + neutralTwo-element delta, four-wire delta systems
Input impedance 996 kiloohm/phase
Burden per phase 0.36 VA/phase max. at 600V;0.014 VA at 120V
Phase voltage connections Internal via screw terminal to busbar. For wye system, a neutral is required to be connected to the PM3 on the right Phoenix connector.
Neutral connection If neutral is not available, the meter will calculate a virtual neutral based on the phase-to-phase rms voltage. The system voltage must be balanced for this to be accurate.
FrequencyFrequency 50/60 Hz
Accuracy ± 0.1 Hz
Resolution 0.1 Hz
Power and EnergyAccuracy 1% of reading (ANSI C12.1)
IsolationAll inputs and outputs are galvanically isolated to 2500V.
Environmental RatingsOperating temperature –20°C to +50°C
Storage temperature –20°C to +50°C
Operating humidity 5 to 95% RH noncondensing
Sensing MethodVoltage, current True rms
Sampling rate 13.02K samples per second
Update RateWatts, VAR and VA 1.03 sec at 60 Hz
All other parameters 1.07 sec at 60 Hz
Power Supply (External)DC voltage 18–30 Vdc
Maximum current 30 mA at 24 Vdc
Burden 0.72W
Standard Communication FormatConnection type Three-wire RS-485 (A, B, Common)
Com port baud rate 9600 or 19,200 bauds Default: 19,200 bauds
Modbus address range 01–247
Data format Selectable (8, N, 1 | 8, N, 2 | 8, Even, 1 | 8, Odd, 1)
Default: 8, N, 2
Protocols Modbus RTU
Internal termination resistorselectable ON or OFF
Via DIP switch Default: Enabled

CA08104001E For more information, visit: www.eaton.com/consultants
3.2-35November 2013
Advanced and Electronic Metering
i
ii
1
2
3
4
5
6
7
8
9
10
11
12
13
14
15
16
17
18
19
20
21
Sheet 03
Eaton Advanced MetersMolded-Case Circuit Breaker Power Monitoring and Metering Module
079
Dimensions and WeightsApproximate Dimensions in Inches (mm)
Figure 3.2-38. FD Three-Pole with PM3 Modbus
Figure 3.2-39. JG Three-Pole with PM3 Modbus
Figure 3.2-40. KD Three-Pole with PM3 Modbus
Figure 3.2-41. LG Three-Pole with PM3 Modbus
Table 3.2-22. PM3 Dimensions and Shipping Weights
1.38(35.1) 0.69
(17.5) Line End
2.88(73.2)
4.50(114.3)
9.53(242.1)
11.00(279.4)
6.00(152.4)
3.63(92.2)
CL Handle
Load End2.06
(52.3)
4.13 (104.9)
3.94 (100.1)
3.42(86.9)
3.34(84.8)
3.50 (88.9)3.39
(86.1)3.19
(81.0)
123456789101112131415
FACTORY
SEALED
O N1 2 3 4 5 6
OnOff
3.63(92.2)
CL Handle
O N 1 2 3 4 5 6
ON
OFF
PUSH TOTRIP
1.38(35.1) 0.69
(17.5) Line End
3.17(80.5)
5.50(139.7)
10.50(266.7)
12.00(304.8)
7.00(177.8)
3.95(100.3)
CL Handle
Load End2.06
(52.3)
4.13 (104.9)
4.41 (112.0)
3.42(86.9)
3.34(84.8)
3.57 (90.7)3.44(87.4)3.34
(84.8)
FACTORY
SEALED
3.95(100.3)
CL Handle
123456789101112131415
123456789101112131415
Power Monitoring/Metering Module Tx Rx STATUS
SettingsNetwork Address
ON
ON1 2 3 4 5 61 2 3 4 5 6
MODBUS
Power
A
B
COMEARTH
24 Vdc (+)24 Vdc (–)
Bell Alarm
Aux. Alarm
COMCOM
V NeutralSee breaker for terminal information.See instruction sheet for high voltage tests.For use on Series G, L-Frame or Series C, K-FrameCircuit Breaker, Switch, Motor Circuit Protector.
1.72(43.7) 0.86
(21.8) Line End
4.92(125.0)
8.44(214.4)
12.14(308.4) 13.83
(351.3)
10.13(257.3)
5.77(146.6)
CL Handle
Load End2.74(69.6)
5.48 (139.2)
4.88 (124.0)
4.06(103.1)
3.98(101.1)
4.31 (109.5)4.06
(103.1)3.81
(96.8)
On/I
Off/O
5.77(146.6)
CL Handle
Power Monitoring/Metering Module Tx Rx STATUS
Settings Network Address
ON
ON1 2 3 4 5 61 2 3 4 5 6
MODBUS
Power
A
B
COM
EARTH
24 Vdc (+)24 Vdc (–)
Bell Alarm
Aux. Alarm
COMCOM
V NeutralSee breaker for terminal information.See instruction sheet for high voltage tests.For use on Series G, L-Frame or Series C, K-FrameCircuit Breaker, Switch, Motor Circuit Protector.
1.72(43.7) 0.86
(21.8) Line End
4.73(120.1)
8.44(214.4)
12.14(308.4) 13.82
(351.0)
10.13(257.3)
5.58(141.7)
CLHandle
Load End2.74(69.6)
5.48 (139.2)
5.43 (137.9)
4.06(103.1)
3.98(101.1)
4.31 (109.5)4.06
(103.1)3.98
(101.1)
5.58(141.7)
CLHandle
Description Frame Dimensions and Weights
Weight in lbs (kg) FD 1.26 (0.57)
JG 1.60 (0.73)
KD/LG 2.25 (1.02)
Basic unit in inches (mm) FD 4.13 W x 5.00 L x 3.39 H (104.9 x 127.0 x 86.1)
JG 4.13 W x 5.00 L x 3.39 H (104.9 x 127.0 x 86.1)
KD/LG 5.48 W x 3.70 L x 4.06 H (139.2 x 94.0 x 103.2)
Shipping container dimensions in inches (mm) FD/JG 8.00 x 5.13 x 5.50 (203.2 x 130.3 x 139.7)
KD/LG 6.25 x 8.25 x 7.00 (158.7 x 209.5 x 177.8)

3.2-36
For more information, visit: www.eaton.com/consultants CA08104001E
November 2013
Advanced and Electronic Metering
i
ii
1
2
3
4
5
6
7
8
9
10
11
12
13
14
15
16
17
18
19
20
21
Sheet 03080
This page intentionally left blank.

CA08104001E For more information, visit: www.eaton.com/consultants
3.3-1November 2013
Advanced and Electronic Metering
i
ii
1
2
3
4
5
6
7
8
9
10
11
12
13
14
15
16
17
18
19
20
21
Sheet 03
Eaton Electronic MetersIQ Analyzer—6000 Series
081
IQ Analyzer 6000 Series—6400 Series without Wave-form Display, 6600 Series with Waveform Display
General Description
Applications■ Monitoring of over 150 electrical
parameters■ Power quality management■ Energy management
Metered/Monitored Parameters■ rms sensing■ Phase, neutral and ground currents■ Volts: L-L, L-N, Avg. L-L, Avg.
L-N, N-G■ Power: real, reactive, apparent
(system and per phase)■ Frequency■ Power factor: apparent and
displacement (system and per phase)
■ Energy and demand (forward, reverse, net) real, reactive apparent at four different utility rates
■ Individual current and voltage harmonics: magnitude, phase angle
■ % THD: current and voltage■ Waveform capture■ Minimum/maximum values■ Event logging/disturbance
recording■ ANSI C12.20 Class 0.5% revenue
metering accuracy, ANSI C12.16, IEC687 Class 0.5%
Accuracy■ Currents and voltages: ±0.20%■ Power, energy and demand: 0.40%■ Frequency: 0.01 Hz■ Power factor: 0.80%■ Accuracy maintained from
3%–800% of full scale and from –0.50 to 1.00 to +0.50 power factor
IQ Analyzer 6600 Series
CommunicationsOptional interface capability to computer network for data collection, storage and/or printout via the Eaton Power Management software.
Physical Characteristics■ Graphical reverse-mode LCD display
with LED backlight■ Up to seven lines of information■ Height: 10.25 inches (260.4 mm)■ Width: 6.72 inches (170.7 mm)■ Depth: 4.70 inches (119.4 mm)
without PONI, 5.83 inches (148.1 mm) with PONI
■ Membrane faceplate NEMA 3R and 12 rated
Listings/Certifications■ UL listed, File E62791, NKCR
File E185559 (CE versions)■ cUL� listed #1010.1 C22.2■ CE mark EN61010-1 EN50082-2■ Measurement Canada Electricity
Meter AE-0782■ CSA approved
Features
IQ Analyzer—Comprehensive Electrical Distribution MonitoringThe IQ Analyzer is a complete solution to monitor and manage all aspects of the electrical distribution system.
Its high-performance metering exceeds ANSI C12.16 (0.5%) specification for revenue meters and meets ANSI C12.20 Class 0.5%, provides quality true rms readings through the 50th harmonic, accurately measures nonsinusoidal waveforms up to a 3.0 crest factor, and displays even and odd multiples of the fundamental current and voltage through the 50th harmonic. Both magnitude and phase angle of the harmonics are displayed.
Note: For definition of power quality terms, see Page 3.3-7.
The unique operator interface, which includes a reverse-mode LCD display, easy-to-use Meter Menu screens and detailed Analysis screens, is designed to allow a wealth of real-time and recorded information to be accessed easily by an operator. All program-ming can be accomplished through the faceplate or the communications port. The comprehensive online Help feature provides useful information on device operation, programming and troubleshooting.

3.3-2
For more information, visit: www.eaton.com/consultants CA08104001E
November 2013
Advanced and Electronic Metering
i
ii
1
2
3
4
5
6
7
8
9
10
11
12
13
14
15
16
17
18
19
20
21
Sheet 03
Eaton Electronic MetersIQ Analyzer—6000 Series
082
Disturbance InformationWith the communications option and Eaton’s Power Management software and Waveform Display software, a Waveform Analysis will construct waveforms of up to 56 cycles of all currents and voltages (including neutral and ground) to help troubleshoot undervoltage/sag and overvoltage/swell conditions. (See CBEMA Trend Logging section.) By programming a reset threshold, the duration of the voltage disturbance can also be indicated.
The IQ Analyzer 6600 series with Graphic Waveform Display offers the ability to view the captured waveform right at the device. The 6600 series also offers the ability to detect and capture sub-cycle voltage disturbances.
Extensive Harmonic Distortion AnalysisCurrent and voltage distortion data are displayed at the device and are accessible through the communications port. This includes % THD, K-Factor, crest factor, CBEMA factor, and both magnitudes and phase angles of all harmonics through the 50th. A snap-shot sample of this information may be activated by user commands, discrete inputs or programmable thresholds to capture distortion data during conditions of real interest. To help eliminate nuisance alarms, harmonic distortion information can be captured and relay outputs activated when THD exceeds a programmable percentage of fundamental or a programmable magnitude (e.g., amperes) threshold.
Time-of-Use MeteringThe IQ Analyzer offers the ability to store energy usage data for time of use revenue metering. It can be programmed for any combination of weekday, Saturday, Sunday, 22 holidays, 8 seasons, 32 schedules, and 10 time periods per schedule. The IQ Analyzer will keep track of the following parameters for four different utility rates:
■ Watthours■ VAR-hours■ VA-hours■ Current demand■ Watt demand■ VA demand■ VAR demand
Historical Trend LoggingThe IQ Analyzer is equipped with on-board logging capability, which includes the ability to log a total of 24 parameters with intervals ranging from 0.13 seconds (every 8 cycles) to twice a week (5040 minutes). The trending function can begin immediately or can be triggered upon receipt of a discrete input into the IQ Analyzer. On-board logging provides a cost-effective means of distributed data storage, where real-time communications may not be feasible or for applications where data storage redundancy is desired. Four trend data logs are stored in non-volatile memory aboard theIQ Analyzer and can be retrieved at the display or via communications for viewing using Eaton software.
■ Up to 24 parameters with storage capacity for up to 90,000 data points
■ Up to 234 days of data can be stored when recording a parameter every 15 minutes
■ Trends 1, 2 and 3 can save data on a discrete contact input
■ Trend 4 can save data on a power quality or meter event
■ Minimum and maximum recording (min./max. three-phase average current, max. IG, min./max. three-phase average VLL and VLN, max. VNG, max. system watts, VARs and VA, min./max. apparent and displacement PF). Using this feature, minimum and maximums reached during each trend interval are recorded
ITIC (formally CBEMA) Trend LoggingThe IQ Analyzer can be configured to store the necessary data so that PowerNet can display a sag or swell voltage event on the industry standard ITIC (formerly CBEMA) curve for predictive maintenance and trouble-shooting. This application uses the IQ Analyzer waveform capture for high-speed events along with historical trend logging for longer term voltage disturbances. Once this data is uploaded to a PC running the Power Management Software Event Viewer, the information is analyzed, displayed and stored. Automatic uploading of ITIC events can be selected in PowerNet. A three-phase event will be correctly displayed as a single point on the ITIC curve.
Event LoggingThe IQ Analyzer will store in non-volatile memory the time and reason for last 504 events. These events can be viewed from the graphical display or accessed via communications. In addition to all of the meter events listed in the Event Conditions paragraph on Page 3.3-4, the following events are entered into the event log.
Time and date of:
■ Alarms■ Meter power up■ All resets■ All setting changes■ Communications established or lost
Event logging is another powerful troubleshooting tool within theIQ Analyzer.
Extensive I/O and Communications CapabilityOne analog and three digital inputs are provided to interface with sensors and transducers. Three analog outputs and four relay contacts are furnished to share data with PLCs and control systems and to actuate alarms and control relays. Terminals are captive clamp type and finger safe. With the communications option, the device can be remotely monitored, controlled and programmed.
Ratings■ Application to 500 kV, no PTs to 600V■ CT ratios selectable from 5: 5A
to 10,000: 5A■ Standard 120/600 Vac line■ Three-phase power supply module,
100–600 Vac■ Separate source power supply
module available, 100–240 Vac or 100–250 Vdc
■ DC only separate source power module also available, 24–48 Vdc

CA08104001E For more information, visit: www.eaton.com/consultants
3.3-3November 2013
Advanced and Electronic Metering
i
ii
1
2
3
4
5
6
7
8
9
10
11
12
13
14
15
16
17
18
19
20
21
Sheet 03
Eaton Electronic MetersIQ Analyzer—6000 Series
083
Displayed Information Features■ All information is accessible at the
device or through the communica-tions port via Eaton’s Power Management Software
■ Quality true rms readings through 50th harmonic
■ Complies with the accuracy portion of ANSI C12.20 Class 0.5% revenue metering specification
■ Accurate readings for nonsinusoidal waveforms with up to 3.0 crest factor
■ Screens display auto ranging units, kilo units, mega units as needed
■ 10-digit energy readings■ Displays multiple parameters at the
same time■ Programmable custom screens
Meter Menu Screens
Meter Menu
Examples of Meter Menu
Custom Screen
Custom Screen
The IQ Analyzer allows a user to view commonly used parameters by scrolling through its LED indicator Meter Menu.
Meter Menu Displayed Information■ Current:
❑ Phases A, B, C, average❑ Neutral❑ Ground (separate CT)
■ Voltage:❑ Phases A-B, B-C, C-A, average❑ Phases A-N, B-N, C-N, average❑ Neutral-ground
■ Power:❑ Real (watts)❑ Reactive (VARs)❑ Apparent (VA)❑ Phases A, B, C and system
■ Energy (forward, reverse and net):❑ Real (kWh)❑ Reactive (kVARh) apparent
(kVAh)—no reverse or net■ Frequency, time and date■ Demand:
❑ System current (amperes)❑ Systems real power (kW)❑ System reactive power (kVAR)❑ System apparent power (kVA)
■ Power factor:❑ Phases A, B, C and system❑ Displacement ❑ Apparent
■ % THD current:❑ Phases A, B, C, N
■ % THD voltage:❑ Phases A-B, B-C, C-A❑ Phases A-N, B-N, C-N
■ K-Factor■ ITIC (CBEMA) derating factor
(displayed as “Z”)■ Crest factor■ Discrete input and output status■ Analog input reading■ Custom—User may program four
screens to show any combination of seven Meter Menu parameters per screen
Harmonic Analysis Screens
Harmonic Spectrum Available with Model 6600
Minimum and Maximum Values■ Current:
❑ Phases A, B, C, N, G
■ Voltage:❑ Phases A-B, B-C, C-A❑ Phases A-N, B-N, C-N, N-G
■ Power:❑ Real (watts)❑ Reactive (VARs)❑ Apparent (VA)❑ Phases A, B, C and system
■ Power factor:❑ Apparent❑ Displacement
(three-phase and system)
■ Frequency.■ THD (amperes, volts, and %):
❑ Current (phases A, B, C, N)❑ Voltage (phases A-B, B-C, C-A,
A-N, B-N, C-N)
All minimum/maximum values may be reset via reset pushbutton on faceplate, discrete input or com-munications command. Values are updated at least once every 16 line cycles.
The F3 function key accesses the Harmonic Analysis screens. Two cycles of data sampled at 128 samples/cycle are simultaneously recorded for:
■ Current:❑ Phases A, B, C, N, G
■ Voltage:❑ Phases A-B, B-C, C-A❑ Phases A-N, B-N, C-N❑ Neutral to ground
Magnitudes (or % of fundamental) of odd and even multiples of the fundamental from 2nd–50th are displayed. The phase angle associated with each multiple of the fundamental is also displayed.

3.3-4
For more information, visit: www.eaton.com/consultants CA08104001E
November 2013
Advanced and Electronic Metering
i
ii
1
2
3
4
5
6
7
8
9
10
11
12
13
14
15
16
17
18
19
20
21
Sheet 03
Eaton Electronic MetersIQ Analyzer—6000 Series
084
Event/Alarm Analysis Screens
Example of Event Analysis Screens
Waveform Screen Available with Model 6600
Pressing the F2 function key accesses the Event Analysis screens. These display the following data for up to ten event/alarm conditions:
■ Description, date, and time of event/alarm with 10 millisecond resolution
■ Current, voltages, power readings, demand readings, frequency and % THD at time of event/alarm
■ Current and voltage distortion information available on Harmonic Analysis screens
Event data is stored in non-volatile memory. If a reset threshold is pro-grammed, the duration of the event (e.g., undervoltage) is also displayed. With Eaton’s PowerNet communica-tions option and Series III software, waveforms and harmonic profiles may be displayed on a PC.
Event ConditionsEvents may be triggered by up to seven of any of the following conditions:
Voltage Disturbances■ Undervoltage/sag—any VL-L, VL-N
(40%–100%)Note: 60% minimum for self-powered unit.■ Overvoltage/swell—any VL-L, VL-N
(100%–750%)
If zero time delay is programmed, any disturbance lasting two cycles (less if magnitude is sufficient to effect rms readings) will trigger a voltage disturbance event/alarm.
■ Sub-cycle transient capture/excess dv/dt on VA-N, VB-N, VC-N
Note: 6600 Series only.■ Sub-cycle voltage interruption
on VA-N, VB-N, VC-NNote: 6600 Series only.
Maximum Threshold Exceeded■ Currents—phases A, B, C, neutral
and ground■ Voltage—neutral to ground■ System power—watts, VA, VARs■ System power factor—displacement
and apparent■ Demand■ Currents—phase A, B, C and AVG■ System power—watts, VARs, VA■ Frequency■ % THD or magnitude total
harmonic distortion❑ Currents
– Phases A, B, C, neutral❑ Voltage
– VA-N, VB-N, VC-N, VA-B, VB-C, VC-A
Minimum Threshold Exceeded■ Currents—phases A, B, C■ System power—watts, VARs, VA■ System power factor—
displacement and apparent■ Frequency
Voltage Phase Unbalance■ Voltage L-L, L-N
Current Phase Unbalance■ Current—Phases A, B, C
Discrete Input Energized■ Input 1, 2, 3
All trigger conditions have program-mable time delays from 0.1 to 60 seconds in 0.1 second increments.
Demand RecordingPeak Demands are date and time stamped for:
■ Current phases A, B, C, average■ System power:
❑ Real (watts)❑ Reactive (VARs)❑ Apparent (VA)
Input/OutputExtensive input/output capability is standard on the IQ Analyzer. In addition to monitoring three-phase currents and voltages, separate inputs are provided for both ground and neutral currents. Voltage of neutral-to-ground is also monitored to indicate the presence of harmonics and potential downstream grounding problems. Analog and digital I/O provide interfaces for transducers, relays, PLCs and control systems.
Current InputsFive ampere secondary CT connections for:
■ Phases A, B, C■ Ground■ Neutral■ Separate ground and neutral
CT inputs■ CT range 5:5 to 10,000:5
(any integer)
Voltage Inputs■ Phases A, B, C (from 120 Vac–
500 kV AC)■ 120/240 Vac control power input
standard—not required with optional line power module
■ Separate ground-to-neutral voltage reference
■ PT range 120:120 to 500,000:120 (any integer)
External 120V secondary PTs are required above 600 Vac, optional from 120–600 Vac.

CA08104001E For more information, visit: www.eaton.com/consultants
3.3-5November 2013
Advanced and Electronic Metering
i
ii
1
2
3
4
5
6
7
8
9
10
11
12
13
14
15
16
17
18
19
20
21
Sheet 03
Eaton Electronic MetersIQ Analyzer—6000 Series
085
Discrete Contact InputsThree dry contact discrete inputs may be programmed by the user to:
■ Trigger Event Analysis—the information described in “Event Analysis Screens,” including Harmonic Analysis information, can be recorded when external devices trip or change state by wiring their auxiliary contacts into these inputs
■ Act as a synch.-pulse input to synchronize power demand windows with utility provided synch pulse
■ Actuate a relay output■ Reset relay output, peak demands,
Trend Analysis records and Event Analysis records
■ With communications option, provide remote status indication on Eaton’s network
Status of input contacts is displayed in the Meter Menu Custom screen.
Relay Output ContactsFour Form C NO/NC relay contacts may be independently programmed to:
■ Act as a kWh, kVARh or kVAh pulse initiator output
■ Actuate on one or more event conditions—including discrete input and Eaton Power Management Software command (through communications port)
■ Reverse sequence alarm
Each Relay may be set for Auto or Manual Reset with 0–30 minute release delay (one second incre-ments). Relays are Form C NO/NC. Relay(s) programmed to actuate on undervoltage also have a programmable 0–30 minute delay on power-up for transfer applications.
Figure 3.3-1. IQ Analyzer—Rear View
Current TransformerConnections
Earth GroundAnalog InputCommon
AnalogOutputs
RemoteInputs
Field ReplaceableFuse
CommunicationConnection
PowerModuleConnection
SeparateSourcePower Supply
Chassis Ground
Relay #1
Relay #2
Relay #3
Relay #4
SystemVoltageConnections
Analog Input and OutputsOne analog input and four analog outputs may be configured as 0–20 or 4–20 mA. The analog input is displayed at the device as a percent-age and is accessible through the communications port. The analog input provides an interface with gas flow meters, temperature transducers or other analog devices.
The analog outputs may be programmed to reflect any of the following:
■ Current—phases A, B, C, average, N, G
■ Voltage—L-L, L-N, N-G■ Power:
❑ Real (watts)❑ Reactive (VARs)❑ Apparent (VA)❑ Phases A, B, C and system
■ % THD:❑ Current (phases A, B, C, N)❑ Voltage (L-L, L-N)
■ Frequency—system■ Power factor:
❑ System displacement PF❑ System apparent PF

3.3-6
For more information, visit: www.eaton.com/consultants CA08104001E
November 2013
Advanced and Electronic Metering
i
ii
1
2
3
4
5
6
7
8
9
10
11
12
13
14
15
16
17
18
19
20
21
Sheet 03
Eaton Electronic MetersIQ Analyzer—6000 Series
086
IQ Analyzer Wiring Diagram
Figure 3.3-2. Sample Wiring Diagram for a Three-Phase, Four-Wire System
H1GH2G
H1NH2N
H1CH2C
H1BH2B
H1AH2A
Line Load
4 CT
3 CT
2 CT
IQ Analyzer
Analog I/OOutputs
1 2 3
Control Power
Separate Source Power Supply Module(Also Available with Control Power Derived from Monitored Line)
(See Label for 120 Vac/125 Vdc Connections)
1 2 3 4
(-)
19 20 21 22 23 24 25
1 2 3 4 5 6 7 8 9 10 11 12
Relay No. 1 Relay No. 2 Relay No. 3 Relay No. 4
AnalogInput
EarthGround
1 CT
5 CT
WyeConnection
OptionalGroundCurrent
Discrete Contact Inputs
1 2 3
13 14
(+) (-)
15 16
(+) (-)
17 18
(+)
N
L3
L2
L1A
B
C
NeutralTerminal
A B C
Fuse
Fuse
Ground4
Three-Phase, Four-Wire (Above 600V)External Potential Transformers and Current Transformers
Note: External PTs Not Required Under 600V

CA08104001E For more information, visit: www.eaton.com/consultants
3.3-7November 2013
Advanced and Electronic Metering
i
ii
1
2
3
4
5
6
7
8
9
10
11
12
13
14
15
16
17
18
19
20
21
Sheet 03
Eaton Electronic MetersIQ Analyzer—6000 Series
087
Definition of Power Quality Terms
Figure 3.3-3. Definition of Power Quality Terms
Displacement Power Factor =
= Fundamental (60 Hz) watts to(60 Hz) VA.
– A ratio of fundamental (60 Hz)real power to apparent power.
Apparent Power Factor =
= Total rms watts to VA.
– A ratio of total real power(including harmonic component) to apparent power.
K-Factor =
– A derating factor that is related to the sum of thesquares of harmonic currents times the squares of their harmonic numbers (multiples of the fundamental).
CBEMA Factor =
– A transformer harmonic derating factor (THDF) defined as a pure sine wave’s crest factor (1.4141) divided by the measured crest factor.
Crest Factor =
– Ratio of peak current to rms current.
W
W2 Var2+---------------------------
WVA-------
Σhn2 In
I1---
2
ΣIn
I1---
2---------------------
2CF------
2 Irms
IPeak
------------------=
IPeak
Irms
-----------
Dimensions in Inches (mm)
Figure 3.3-4. Dimensions and Cutout
Figure 3.3-5. Drilling Pattern Figure 3.3-6. Drilling Pattern for Flange Mounting
6.72(170.7)
10.25(260.4)
Program Help
Down
Up
Normal
Event
Relay
ProgramIQ Analyzer
F1PrevioussLevel
F2 F3 F4 Home
Current
Voltage
Power (Watts)
Power (Vars)
Power (VA)VV
Energy
Demand
Power Factor
Frequency
% THD
Distortion Factor
Custom
Reset
.06 RAD4 Places2.23
4.45
6.68
8.90
2.535.06
2.695.38
.218 DIA10 Places
9.38
4.69
10.41(264.4
8.11(206.0)4.06
(103.1)
.213 (5.4)Typ. for 8 11.03
(280.2)
10.09(256.3)
5.52(140.2).94
(23.9)
7.41(188.2)
CL
CL

3.3-8
For more information, visit: www.eaton.com/consultants CA08104001E
November 2013
Advanced and Electronic Metering
i
ii
1
2
3
4
5
6
7
8
9
10
11
12
13
14
15
16
17
18
19
20
21
Sheet 03
Eaton Electronic MetersIQ Analyzer—6000 Series
088
Technical Data and Specifications
Table 3.3-1. Input/Output Information
Table 3.3-2. Control Power Input
� When directly wired to 480 Vac, IQ Analyzer can ride through a continuous sag that is 20% of rated voltage.
Fuses■ Self-powered units with IQMSSPM have 0.75A, 600V Bus
Type KTK-R-3/4 fuses (three required)■ Separate source dual voltage units with IQMSSPM have a
single 0.20 (5.0) x 0.79 (20.0) 0.25A fuse■ Separate source DC units with IQMDCPM do not have
user-replaceable fuses
Accuracy (in percent full scale)Accuracy from 3–300% of full scale and from –0.5. to 1.00 to 0.5 power factor.Current and voltage: ±0.20%Power, energy, and demand: ±0.40%Frequency: ±0.04%Power factor: ±0.80%THD: ±1.00%Specific current accuracies:±0.20% of full scale to 200% of full scale and 150% crest factor±0.20% of full scale to 150% of full scale and 200% crest factor±0.20% of full scale to 100% of full scale and 300% crest factor±0.40% of reading for currents to 800% of full scalePower and energy: start recording with an average of 3 mA secondary current
Environmental ConditionsOperating temperature: –20° to 70°CStorage temperature: –30° to 85°COperating humidity: 5% to 95%
relativehumidity
Device weight: 5.8 lbs (2.6 kg)
Current Inputs (each channel)Conversion: True rms, 32 sample/cycle (all samples used
in all rms calculations)CT input: 5A secondary (any integer 5:5 to 10,000:5)Burden: 0.05 VAOverload withstand: 40A AC continuous, 300A AC 1 second Range: 8 x CT continuousAccuracy: 0.1% of CT primary rating, 0.2% of reading
above 150% of rating, sinusoidal (see accuracybelow for non-sinusoidal specifications)
Input impedance: 0.002 ohm
Discrete Inputs (dry contact)+30 Vdc differential across each discrete input pair of terminals. Minimum pulse width: 1.6 msecOptically isolated inputs to protect IQ Analyzer circuitry.
Analog Outputs (4)0 to 20 mA/4 to 20 mA into maximum 750 ohm load. Accuracy: 1%.
Analog Input (1)0 to 20 mA/4 to 20 mA into 200 ohm load. Accuracy: 1%.
Voltage Inputs (each channel)Conversion: True rms, 32 samples/cycle (all samples used
in all rms calculations)PT Input: Direct or any integer 120:120 to 500,000:120Range: 30 to 660 Vac (separate source and DC source)Nominal Full Scale: 100–600 VacBurden: 21 VA (self-powered only)Overload Withstand: 635 Vac, continuous
700 Vac, 1 secondInput Impedance: 1 megohm
Relay Output Contacts (4)Form C dry contact: 10A at
120/240 Vac (resistive)10A at 30 Vdc (resistive)30A make (50 ms)at 240 Vac/240 Vdc
Minimum pulse width: Four cycles (68 ms)Withstand Rating: 1000 Vac, 1 minute across contacts 5000 Vac
(contacts to coil, 1 minute) 10,000 Vac (contacts to coil, surge voltage)
Frequency Range20–66 Hz fundamental (up to 50th harmonic)
Relay Response Time (excluding programmed time delays):2 line cycles for discrete input, Power Xpert Software command (communications port)4–5 line cycles for voltage disturbance, voltage unbalance9–10 line cycles for all others
Harmonic Response (voltages, currents)50th harmonic
Description Separate Source Self-Powered � DC Source
Input range, ACFrequency range
110–240 Vac ±10%45–66 Hz
110–600 Vac ±10%45–66 Hz
N/AN/A
Input range, DCBurden
110–250 Vdc ±10%21 VA
N/A21 VA
24–48 Vdc ±20%21 VA

CA08104001E For more information, visit: www.eaton.com/consultants
3.3-9November 2013
Advanced and Electronic Metering
i
ii
1
2
3
4
5
6
7
8
9
10
11
12
13
14
15
16
17
18
19
20
21
Sheet 03
Eaton Electronic MetersIQ Analyzer—6000 Series
089
Table 3.3-3. Catalog Information
� Use three-phase power module if meter electronics are to be powered from the three-phase line voltage of 600V and below. Use separate source power module if the meter electronics is to be powered from a separate 110–240 Vac or 110–250 Vdc source. Use 24–48 Vdc power module if only 24–48 Vdc is available to power electronics.
� Separate power modules can be ordered if an active meter needs to have the existing power supply changed to a different voltage.
Description Catalog Number
IQ Analyzer, separate source power moduleIQ Analyzer, 24–48 Vdc power moduleIQ Analyzer, three-phase power module
IQA6410 �
IQA6420 �
IQA6430 �
IQ Analyzer, separate source power module with waveform display and sub-cycle voltage disturbance captureIQ Analyzer, 24–48 Vdc power module with waveform display and sub-cycle voltage disturbance captureIQ Analyzer, three-phase power module with waveform display and sub-cycle voltage disturbance capture
IQA6610 �
IQA6620 �
IQA6630 �
IQ Flange, to provide extra clearance when mounting36.00-inch (914.4 mm) extension cable for remote mounting of power module45.00-inch (1143.0 mm) extension cable for remote mounting of power module
IQFLANGE �
IQACABLE �
IQA45CABLE �
24–48 Vdc separate source power module100–240 Vac and 100–250 Vdc separate source power moduleThree-phase, self-powered power module
IQMDCPM �
IQMSSPM �
IQM3PPM �
INCOM communication module IPONI �
RS-485 communication module with Modbus protocol MPONI

3.3-10
For more information, visit: www.eaton.com/consultants CA08104001E
November 2013
Advanced and Electronic Metering
i
ii
1
2
3
4
5
6
7
8
9
10
11
12
13
14
15
16
17
18
19
20
21
Sheet 03090
This page intentionally left blank.

CA08104001E For more information, visit: www.eaton.com/consultants
3.4-1November 2013
Advanced and Electronic Metering
i
ii
1
2
3
4
5
6
7
8
9
10
11
12
13
14
15
16
17
18
19
20
21
Sheet 03
AccessoriesIQ Flange/Panel Mounting Adapter Kit
091
IQ Flange
IQ Flange
Retrofit ApplicationsFor applications where extra door- mounting space is required, a flange-mounting unit is available. The IQ Flange provides an extra 2.50 inches (63.5 mm) of clearance for the device.
For use with the following products:■ IQ Analyzer■ IQ DP-4000■ MP-3000■ DT-3000
Product Selection
Table 3.4-1. Ordering Information
Figure 3.4-1. Typical IQ Flange Drilling Pattern
Panel Mounting Adapter Kit for IQ 100/200 Series and PXM 2000 Meters
Panel Mounting Adapter Kit
The flange adapter plate can be installed as follows:
1. Remove the old meter from the panel or door. Many IQ metering products use the typical IQ drilling pattern shown in Figure 3.4-2 for mounting
2. Install the flange adapter plate. Mount it from the rear using the six screws provided in the kit. The flange adapter plate screw hole pattern shown in Figure 3.4-2 should match the typical IQ drilling pattern. If not, perform the next step
3. Drill six holes in the panel or the door to mount the flange adapter plate. Follow the typical IQ drilling pattern. You need only the top, center and bottom sets of holes
4. Install the new IQ 100/200 Series or PXM 2000 meter in the flange adapter plate. Secure it from behind with four flat washers, lock washers and nuts provided with the meter
Product Selection
Table 3.4-2. Ordering Information
Dimensions
Figure 3.4-2. Flange Adapter Plate Screw Hole Pattern
Description CatalogNumber
IQ Flange IQFLANGE
4.69(119.1)
9.38(238.3)
2.23(56.6)
4.45(113.0)
6.68(169.7)
8.90(226.1)
0.218 (5.5) DIA10 Places
2.53(64.3)
5.06(128.5)
0.06 (1.5) RAD4 Places
2.69(68.3)
5.38(136.7)
Description CatalogNumber
Panel mounting adapter kit IQ 100/200 and PXM 2000 Series adapter kit to IQ Analyzer/IQ DP-4000/IQ Data
IQ250-PMAK
6.72(170.7)
5.38(136.7)
4.45(113.0)
10.25(260.4)
4.45(113.0)

3.4-2
For more information, visit: www.eaton.com/consultants CA08104001E
November 2013
Advanced and Electronic Metering
i
ii
1
2
3
4
5
6
7
8
9
10
11
12
13
14
15
16
17
18
19
20
21
Sheet 03
AccessoriesSub-Network Master Local Display
092
Sub-Network Master Local Display (SMLD)
Sub-Network Master Local Display
General DescriptionEaton’s sub-network master local display (SMLD) is an electronic submetering device that provides users the ability to view information from sub-network connected devices locally at switchgear, switchboards, panelboards, motor control centers and control panels, nearby or thousands of feet away. The SMLD has a built-in LCD display with navigations for configuring, as well as monitoring. Auto-learn capabilities complete the configuration requirements, enabling customization by use of user-defined descriptions, as well as adding and deleting meters.
The SMLD can be operated standalone or in parallel with the new FetchIT™ software application or the Power Xpert complete energy monitoring system solution software.
Application Description■ Acquire and display data (no control)
from up to 100 devices that can communicate on Eaton’s INCOM network, used in the PowerNet monitoring system
Features, Benefits and Functions■ Auto-learn connected devices■ Configuration stored in
non-volatile memory■ Host communications arbitration
algorithm enables seamless integration into existing communication networks
■ Functions standalone or networked
■ Following devices are supported:❑ IQ 210/220/230❑ IQ Multipoint Energy Submeter II❑ IQ Energy Sentinel (F, J, K Frames)❑ Universal Internal Energy Sentinel❑ Universal External Energy Sentinel❑ Digitrip OPTIM 1050L
Physical Characteristics■ Keypad functions:
❑ Menu❑ Scroll up❑ Scroll down❑ Enter
■ Backlit LCD, 4-line x 20 character
Standards and Certifications■ Safety standards—UL 61010B-1■ EMC Susceptibility Standards—
IEC 1000-4-3, 1995 Radiated RF Immunity
■ EMC Emissions Standards—FCC Part 15, Class B Radiated Emissions
Product Selection
Table 3.4-3. Ordering Information
Technical Data and Specifications
Frequency Range■ 50/60 Hz
Power■ Power consumption: 200 mA
(maximum) at 24 Vac, 24 Vdc
■ Power connector rating: 24 Vac or 24 Vdc at 1A
■ Power source: 120 Vac or 24 Vdc, UL Class 2 or CSA Class III SELV transformer in accordance with C22.2 No. 1010-1. The voltage range is 18 to 24 Vac or Vdc, 200 mA (maximum)
Ratings■ Operating temperature: 0° to 60°C■ Storage temperature: –20° to 70°C■ Operating humidity: 5 to 90%
maximum noncondensing■ Altitude: 10,000 feet (3048m)
❑ Environment: indoor use only
Mounting Information■ 4.37 H x 4.37 W x 1.50 D inches
(111.0 H x 111.0 W x 38.1 D mm)■ Door mount or panel mount
Communications■ INCOM Frequency Shift Key (FSK)
network compatible 9600 baud■ Non-intrusive arbitration algorithm■ Passive monitoring automatically
enabled by arbitration algorithm while host PC is communicating
■ Master on INCOM network upon data request from front panel if host PC is not communicating
■ Addresses for sub-network devices can be 001–044 hex (1–255 decimals)
DimensionsApproximate dimensions in inches (mm)
Table 3.4-4. Meter Base Unit
Note: DIN (92 mm x 92 mm) access cutout.
Figure 3.4-3. Typical Use Diagram of SMLD
Description Catalog Number
Local display (120 Vac)Local display (24 Vac or Vdc)
LDISP120LDISP24
Width Height Depth
4.37 (111.0) 4.37 (111.0) 1.50 (38.1)
Digitrip OPTIM 1050C
IQES or
PSIQ 210/220/230
Computerwith Power
ManagementSoftware
SMLD
Multiple Units as Required

CA08104001E For more information, visit: www.eaton.com/consultants
3.4-3November 2013
Advanced and Electronic Metering
i
ii
1
2
3
4
5
6
7
8
9
10
11
12
13
14
15
16
17
18
19
20
21
Sheet 03
AccessoriesSingle and Multi Unit Enclosed Meters
093
Single and Multi Unit Enclosed Meters
Single and Multi Unit NEMA 12Enclosed Meters—Front Views
General DescriptionThe Eaton Enclosed Meter line provides a complete energy metering and data acquisition solution in a single enclo-sure. Designed for Eaton’s IQ 35M, IQ 150, IQ 250/260 and Power Xpert 2000/4000/6000/8000 and Multi-Point Meters, Eaton’s Enclosed Meter line offers mounting and installation flexi-bility, especially in retrofit applications where no metering compartment or mounting space is available in the existing electrical distribution equip-ment or where installation time is a premium. Factory designed and wired, Eaton’s Enclosed Meter line offers savings in labor and installation costs because input current and voltage wiring, as well as I/O wiring, is pre-wired to terminal blocks inside the enclosure.
The Enclosed Meter line has two offer-ings; single, prewired unit (specific IQ 150, IQ 250/260 or PXM 2000/4000/6000/8000 or PXMP models) and a multi unit (specific IQ 150, IQ 250/260 or IQ 35M models). Because the multi unit automatically includes Eaton’s Power Xpert Gateway 200E, it facili-tates measurement and verification of the energy usage on processes and in buildings. This provides a convenient way to monitor energy usage from multiple points, collect and log specific energy use parameters, and display and generate logs for historical energy usage reports. Simply put, Eaton’s multi unit enclosed meter solution helps meet any measurement and verification requirement to show energy efficiency improvements and results. In addition to the standard offering, Eaton can also provide an enclosed metering solution tailored around your project needs.
Application DescriptionFactory designed and wired to fit vari-ous Eaton power and energy meters at varying price points, Eaton’s Enclosed Meter line offers savings in labor and installation costs because input current and voltage wiring, as well as I/O wiring, is pre-wired to terminal blocks inside the enclosure. Standalone, enclosed meters are ideal for new metering applications where no metering existed previously, retrofit installations where energy monitoring is a must or where ease of installation is required.
■ Health care facilities■ Educational facilities and campuses■ Industrial facilities■ Commercial facilities■ Government facilities
The multi unit offering consolidates energy-related data available from the meters in the enclosure, but also allows for external meters to be added to the embedded Power Xpert Gateway 200E. Through the Power Xpert Gateway 200E’s embedded Web server, infor-mation can be presented in a variety of ways, a standard Web browser being the most widely used method.
The enclosed product is a standalone solution that is ideal for many infra-structure designs. Further, as needs change and grow, the enclosed product can be integrated through Power Xpert Software into a broader solution that encompasses other intelligent hard-ware and can integrate with third-party network management systems (NMS) or building management systems (BMS) for system-wide monitoring and reporting of energy and power.
Features and Benefits■ Saves installation time and cost■ One part number to order; no need
to worry that any part has been left out
■ Pick the meter or meters you need as it is designed to fit various Eaton power and energy meters, at varying price points
Factory WiredMost electrical contractors are very familiar with wiring meters. However, it does take time to place the disconnect, CT shorting blocks, terminal blocks, control power transformer, etc. and associated wiring. It is not uncommon for errors to be introduced during the installation of multiple meters; it's just inherent in wiring. With Eaton’s Enclosed Meter line, everything is wired at the factory: the shorting block, terminal blocks, etc., assuring that it’s done right. Further, to ensure safety, Eaton’s Enclosed Meter line includes a primary fusible disconnect for line voltage that can be turned off during meter maintenance.
For applications with line voltages above the rated power supply of the meter, an optional control power transformer is supplied in the enclo-sure. Control voltage can also be supplied via a separate source that is wired to the field installation terminal block. CT inputs for the meter are wired directly to shorting terminal blocks for easy field installation. Factory wired products also save on installation time and costs. The meters are flush mounted on the enclosure door with all inputs/outputs factory-wired to terminal blocks.
Note: A meter subpanel assembly is also available, which includes all the internal components of the single-unit enclosed meter for the IQ 150/250/260 and PXM 2000 Meters wired and mounted on a subpanel to be installed into an existing electrical structure. It comes with a 48-inch lead for flexibility in mounting the meters at various distances.

3.4-4
For more information, visit: www.eaton.com/consultants CA08104001E
November 2013
Advanced and Electronic Metering
i
ii
1
2
3
4
5
6
7
8
9
10
11
12
13
14
15
16
17
18
19
20
21
Sheet 03
AccessoriesSingle and Multi Unit Enclosed Meters
094
NEMA RatedNEMA 12 enclosure prevents dust and other materials from entering. Internal gaskets also prevent air irritants from harming the vital equipment inside. This quality enclosure meets most indoor application needs. NEMA 3R enclosure is constructed for either indoor or outdoor use to provide a degree of protection to personnel against access to hazardous parts; to provide a degree of protection of the equipment inside the enclosure against ingress of solid foreign objects (falling dirt); to provide a degree of protection with respect to harmful effects on the equipment due to the ingress of water (rain, sleet, snow); and that will be undamaged by the external formation of ice on the enclo-sure. NEMA 4X enclosure provides the same degree of protection as the NEMA 3R with the additional protection against windblown dust, splashing and hose directed water, and protection against corrosion.
NEMA 3R Single Unit Closed and Open
NEMA 4X Single Unit Closed and Open
NEMA 12 Front View, Door Open, Pre-Wired and Tested
NEMA 12 Multi Unit View, Door Open, Pre-Wired and Tested
NEMA 12 Single-Unit Enclosed Meter Inside View, PXM 4000/6000/8000 Series
Meter Fusing
Fused Disconnect
Neutral,Ground andInput/Output(not shown)TerminalBlocks
Pre-WiredControl Power Transformer
CT Shorting Terminal Block
Control Power, Voltage and CT Inputs
Meter Fusing
Fused Disconnect
PX Gateway
Ground
Fused Control Power Transformer
Control Power, Voltage, CT and CommunicationsInputs
Gateway Power Supply
CT Shorting Blocks
Fused Disconnect Meter Fusing
Prewired Control Power Transformer
Display
CT Shorting Terminal Blocks
Meter Control Power, Voltage and CT Inputs

CA08104001E For more information, visit: www.eaton.com/consultants
3.4-5November 2013
Advanced and Electronic Metering
i
ii
1
2
3
4
5
6
7
8
9
10
11
12
13
14
15
16
17
18
19
20
21
Sheet 03
AccessoriesSingle and Multi Unit Enclosed Meters
095
Multi-Unit Enclosed Meter, Inside View of IQ 35M
Enclosed Power Xpert Multi-Point Meter
Prewired Meter Backpan, Single Unit
■ Prewired panel to save installation time and cost for retro-fits into existing equipment
■ Designed for Eaton’s:❑ IQ 100 Meter Series❑ 250/260❑ Power Xpert Meter 2000 Series
■ With or without CPT, depending on voltage■ Order meters separately
Flex CenterEaton’s Meter Flex Center can provide above and beyond the standard meter enclosure offerings. The Meter Flex Center can tailor the enclosed solution to meet the specification requirements. Special requirements within the enclosures can be size, number of meters, differing meter models, special communication equipment, uninterruptible power supplies, electric heaters, power receptacles, or any other custom need. Below is an example of just a few of the Meter Flex Center capabilities.
NEMA 1 16 Meter Enclosure with PXM 2000 Front View and Door Open
Current Sensor Terminal Strip
Meter Fusing
Fused Disconnect
PX Gateway
Gateway Power Supply
Control Power, Voltage Current Sensor and Communications Inputs
PXMP Power Supply
Fuses
PXMP Meter Base Connections
PXMP Meter Modules (shown but sold separately)
PXMP Meter Base
Fused Disconnect
NEMA 12 Enclosure (30H x 24W x 12D Inches)
6-Inch Color Touchscreen
Meter Fusing
48-Inch Meter Harness
Fused Disconnect
Optional CPT CT Shorting Block
Lifting Rings
PXM 2000 Power Meters
Removable Covers for Future Meters
CommunicationsConnections forOther Meters
PXG-600E CommunicationsGateway
Control PowerTransformer
Single-Pole Touchsafe Fuse Block CT Shorting Blocks
Fuses
Grounding Bar
ELC-PS02 24 Vdc Power Supply
Single-Pole Touchsafe Fuse HolderSwitch for
PXM 2000Incoming Line Circuit Protector
Duplex Receptacle

3.4-6
For more information, visit: www.eaton.com/consultants CA08104001E
November 2013
Advanced and Electronic Metering
i
ii
1
2
3
4
5
6
7
8
9
10
11
12
13
14
15
16
17
18
19
20
21
Sheet 03
AccessoriesSingle and Multi Unit Enclosed Meters
096
Technical Data and Specifications
Table 3.4-5. Enclosed Meters
Note: Specifications are subject to change without notice and represent the maximum capabilities of the product with all options installed. This is not a complete feature list. Features and functionality may vary depending on selected options, firmware version and product model. Please refer to the technical data sheet and user manual for detailed specifications.
Ordering Information
Table 3.4-6. Single Unit Enclosed Meter Catalog Numbering System
Table 3.4-7. Enclosed PXMP Meter Catalog Numbering System
Table 3.4-8. Multi Unit Enclosed Meter Catalog Numbering System
� Not available with IQ 35M.
Description Specification
Enclosure rating
NEMA 12, 3R, 4X
Enclosure operating temperature
–20ºC to +40°CNote: Temperature range of meter is –20ºC to +70ºC. If applied outside, proper precautions should be taken to avoid exceeding the maximum and minimum temperature ratings of the meter.
Dimensions Single unit (IQ 150/250/260 and PXM 2000): NEMA 12 (8.00W x 16.30H x 10.40D inches), NEMA 3R/4X (8.00W x 16.30H x 9.60D inches)Single unit (PXMP): NEMA 12/3R/4X (24.00W x 30.00H x 12.00D inches)Single unit (PXM 4000/6000/8000): NEMA 12 (20.00W x 24.00H x 14.10D inches), NEMA 3R/4X (20.20W x 24.00H x 13.90D inches)Multi unit: NEMA 12 (13.00W x 30.00H x 15.20D inches) NEMA 3R (13.20W x 30.10H x 14.60D inches) NEMA 4X (13.00W x 30.00H x 14.00D inches)
Meters Single unit: IQ 150, IQ 250/260 and PXM 2000/4000/ 6000/8000 and PXMP modelsMulti unit: IQ 35M, IQ 150 and IQ 250/260
Communications(multi unit only)
Power Xpert Gateway 200E
Control voltage
120V–600V (PXMP)—power supply requiredUp to 240V (IQ 35M/150/250/260 and PXM 2000/4000/ 6000/8000)—no CPT requiredGreater than 240V (IQ 150/250/260 and PXM 2000) —CPT requiredSeparate source control—no CPT required
Basic model
Fusible disconnect—primary voltageShorting block(s) not required for IQ 35M or PXMPGround terminal blockNeutral terminal blockEight-point terminal block(s) for input/output modules for IQ 250/260 and PXM 2000
Wiring Wired for three-phase, four-wire applications. Three-phase, three-wire applications—will need to change the wiring for both the voltage and current per the wiring diagram in the meter instruction manual.
Certifications UL 508A and cUL
Source control
No separate source control voltage required for applications below 240 Vac (except PXMP)
Pre-wire Pre-wired current transformer, shorting terminal block(s), neutral, ground, voltage, control power, fusible disconnect and input/output terminal block(s)
Latch Padlocking latch provision
Optional features
Control power transformer—single unit:50 VA (IQ 150/250/260 and 150 VA (PXM 4000/6000/8000); multi unit: 250 VA control power supply for meter where monitored voltage is 480 Vac (IQ 150/250/260 and PXM 2000/4000/6000/8000)
Meter Type
PXM2250MA65105PXM2250MA65115PXM2250MA65145PXM2260MA65105PXM2260MA65115PXM2260MA65145PXM2270MA65105PXM2270MA65115PXM2270MA65145
IQ250MA65100IQ250MA65110IQ250MA65114IQ260MA65100IQ260MA65110IQ260MA65114IQ150MA6511IQ150MA6512
PXM2250MA65105 - 2 B
NEMA Rating
2 = NEMA 123 = NEMA 3R4 = NEMA 4X
CPT Option
A = 120/240 Vac (No CPT)
B = 480 Vac (CPT)
Meter Type
PXMP-MBPXMP-MB-AB
PXMP-MB - 2 B D
NEMA Rating
2 = NEMA 123 = NEMA 3R4 = NEMA 4X Power Supply
A = NoneB = 120/240 VacC = 480 VacD = 600 Vac
Display
A = NoneD = 6-inch color
touchscreen
Meter Type
IQ35MA12IQ150MA6511IQ250MA65100IQ260MA65100
IQ150MA6511 - 2 B 4 C
NEMA Rating
2 = NEMA 12 �3 = NEMA 3R4 = NEMA 4X CPT Option
A = No CPTB = CPT �
Number of Meters
4 = 4 meters
Communications
C = Includes PXG200E

CA08104001E For more information, visit: www.eaton.com/consultants
3.4-7November 2013
Advanced and Electronic Metering
i
ii
1
2
3
4
5
6
7
8
9
10
11
12
13
14
15
16
17
18
19
20
21
Sheet 03
AccessoriesSingle and Multi Unit Enclosed Meters
097
Dimensions in Inches (mm)
Figure 3.4-4. NEMA 12 Single Unit Enclosure
Figure 3.4-5. NEMA 12 Multi Unit Enclosure
Rear View
8.5023.9)
Right Side View Front View
13.00(330.2)

3.4-8
For more information, visit: www.eaton.com/consultants CA08104001E
November 2013
Advanced and Electronic Metering
i
ii
1
2
3
4
5
6
7
8
9
10
11
12
13
14
15
16
17
18
19
20
21
Sheet 03
AccessoriesSingle and Multi Unit Enclosed Meters
098
Figure 3.4-6. NEMA 12 PXM 4000/6000/8000 Unit Enclosure
Figure 3.4-7. NEMA 12 PXMP Unit Enclosure
20.00(508.0)
12.00(304.8)
Left Side View
Bottom View
ight Side View External Rear ViewFront View (Door Removed)
1/4-Turn
22.50(571.5)
MountingHeight
18.50(469.9)
Mounting Width
0.75(19.1)
0.75(19.1)
4xø0.44
24 0021.00
(533.4)Subpanel
Height
16.94(430.3)
Subpanel Width
HMICutout
Top View
12.00(304.8)
Left Side View Front View
Bottom View
Right SideView
Front View(Door Removed)
29.50(749.3)Door
30.00(762.0)
24.00(609.6)
23.63 (600.2)Door
5.25(133.4)
6.79(172.4)

CA08104001E For more information, visit: www.eaton.com/consultants
3.4-9November 2013
Advanced and Electronic Metering
i
ii
1
2
3
4
5
6
7
8
9
10
11
12
13
14
15
16
17
18
19
20
21
Sheet 03
AccessoriesSingle and Multi Unit Enclosed Meters
099
Figure 3.4-8. NEMA 3R/4X Single Unit Enclosure
Figure 3.4-9. NEMA 3R/4X Multi Unit Enclosure
(no door)
This Drip Cap ison NEMA 3R On
Rear View
27.00(685.8)
(NEMA 3R)
28.50(723.9)
(NEMA 4X)
Right Side View Front View Front View(no door)
This Drip Cap ison NEMA 3R Only
13.20(335.3)
(NEMA 3R)
13.00(330.2)
(NEMA 4X)

3.4-10
For more information, visit: www.eaton.com/consultants CA08104001E
November 2013
Advanced and Electronic Metering
i
ii
1
2
3
4
5
6
7
8
9
10
11
12
13
14
15
16
17
18
19
20
21
Sheet 03
AccessoriesSingle and Multi Unit Enclosed Meters
100
Figure 3.4-10. NEMA 3R PXM 4000/6000/8000 Unit Enclosure
Figure 3.4-11. NEMA 4X PXM 4000/6000/8000 Unit Enclosure
Top View
20.20 (513.1)Top Width
20.00 (508.0)Enclosure Width
13.70(348.0)
TopDepth
Left Side View Front View
Bottom View
Right Side View External Rear View
12.00(304.8)
EnclosureDepth
Front View (Door Removed)
Front View (Subpanel Only)
19.63 (498.6)Door
24.00(609.6)
Turnlocking
ch
21.00(533.4)
MountingHeight
4xø0.341.25
(31.8)
17.50(444.5)
Mounting Width
1.50(38.1)
20.00(508.0)
12.00(304.8)
Left Side View Fron
Bottom View
Right Side View External Rear View
24.00(609.6)
1/4-TurnPadlocking
22.50(571.5)
MountingHeight
4xø0.44
(19.1)
18.50(469.9)
Mounting Width
0.75(19.1)

CA08104001E For more information, visit: www.eaton.com/consultants
3.4-11November 2013
Advanced and Electronic Metering
i
ii
1
2
3
4
5
6
7
8
9
10
11
12
13
14
15
16
17
18
19
20
21
Sheet 03
AccessoriesSingle and Multi Unit Enclosed Meters
101
Figure 3.4-12. NEMA 3R PXMP Multi Unit Enclosure
Figure 3.4-13. NEMA 4X PXMP Multi Unit Enclosure
Right Side ViewFront ViewLeft Side View
Top View
Bottom View
12.00(304.8)
24.00(609.6)
23.63 (600.2)Door
30.00(762.0)
Enclosure
30.80(782.3)Overall
5.25(133.4)
6.79(172.5)
HMICutout
Front View(Door Removed)
Front View(Door Removed)
30.00(762.0)
Enclosure
Front View(Door Removed)
Front View(Door Removed)
Right Side ViewFront ViewLeft Side View
Top View
Bottom View
5.25(133.4)
6.79(172.5)
HMICutout
12.00(304.8)
24.00(609.6)
13.07(332.0)Overall
23.63 (600.2)Door
30.00(762.0)Overall

3.4-12
For more information, visit: www.eaton.com/consultants CA08104001E
November 2013
Advanced and Electronic Metering
i
ii
1
2
3
4
5
6
7
8
9
10
11
12
13
14
15
16
17
18
19
20
21
Sheet 03
AccessoriesSingle and Multi Unit Enclosed Meters
102
Wiring Diagrams
Figure 3.4-14. 200–240 Vac, 50/60 Hz, Three-Phase, Four-Wire System with Multi Unit IQ 35M Meters
Figure 3.4-15. 200–240 Vac, 50/60 Hz, Three-Phase, Four-Wire System with Multi Unit IQ 150/250/260 Meters

CA08104001E For more information, visit: www.eaton.com/consultants
3.4-13November 2013
Advanced and Electronic Metering
i
ii
1
2
3
4
5
6
7
8
9
10
11
12
13
14
15
16
17
18
19
20
21
Sheet 03
AccessoriesSingle and Multi Unit Enclosed Meters
103
Figure 3.4-16. 480 Vac, 50/60 Hz, Three-Phase, Four-Wire System with Multi Unit IQ 150/250/260 Meters
Figure 3.4-17. 120–240 Vac, 50/60 Hz, Single-Phase, Three-Wire System with Single PXMP Meter

3.4-14
For more information, visit: www.eaton.com/consultants CA08104001E
November 2013
Advanced and Electronic Metering
i
ii
1
2
3
4
5
6
7
8
9
10
11
12
13
14
15
16
17
18
19
20
21
Sheet 03
AccessoriesSingle and Multi Unit Enclosed Meters
104
Figure 3.4-18. 120–240 Vac, 50/60 Hz, Three-Phase, Four-Wire Wye System with Single PXMP Meter
Figure 3.4-19. 480–600 Vac, 50/60 Hz, Three-Phase, Four-Wire Wye System with Single PXMP Meter

CA08104001E For more information, visit: www.eaton.com/consultants
3.4-15November 2013
Advanced and Electronic Metering
i
ii
1
2
3
4
5
6
7
8
9
10
11
12
13
14
15
16
17
18
19
20
21
Sheet 03
AccessoriesSingle and Multi Unit Enclosed Meters
105
Figure 3.4-20. 200–240 Vac, 50/60 Hz, Three-Phase, Four-Wire System with Single Unit IQ 150/250/260 or PXM 2000 Meter
Figure 3.4-21. 480 Vac, 50/60 Hz, Three-Phase, Four-Wire System with Single Unit IQ 150/250/260 or PXM 2000 Meter

3.4-16
For more information, visit: www.eaton.com/consultants CA08104001E
November 2013
Advanced and Electronic Metering
i
ii
1
2
3
4
5
6
7
8
9
10
11
12
13
14
15
16
17
18
19
20
21
Sheet 03
AccessoriesSingle and Multi Unit Enclosed Meters
106
Figure 3.4-22. 200–240 Vac, 50/60 Hz, Three-Phase, Four-Wire System with Single Unit PXM 4000/6000/8000 Meter
Figure 3.4-23. 480 Vac, 50/60 Hz, Three-Phase, Four-Wire System with Single Unit PXM 4000/6000/8000 Meter

CA08104001E For more information, visit: www.eaton.com/consultants
3.4-17November 2013
Advanced and Electronic Metering
i
ii
1
2
3
4
5
6
7
8
9
10
11
12
13
14
15
16
17
18
19
20
21
Sheet 03
AccessoriesCurrent Transformers
107
Current Transformers
Current Transformers
General DescriptionEaton’s low voltage current transformers are available in both solid core and split core designs. Engineered for electronic metering applications, all solid core designs and selected split core designs offer ANSI metering quality accuracy. The solid core designs also meet ANSI C57.13 relay accuracy requirements including over-ranging capabilities. The current transformer offering has a 5A secondary at the rated primary current.
Split core CTs are specifically designed to be installed around primary conduc-tors without disconnecting wires or breaking the circuit to be monitored. These current transformers are perfect solutions for energy management applications and are manufactured for installation ease.
Application DescriptionFor new construction and retrofit applications where no current transformer exists, Eaton offers a complete selection of low voltage (up to 600V) current transformers. These current transformers can be used in commercial grade applications such as control panels and panel-boards. Additionally, they can be used for most industrial metering and relaying applications in switchboards, switchgear and motor control centers.
Note: Not for use with IQ 35M or IQ MESII.
Product Selection
Table 3.4-9. Solid Core ANSI Metering Accuracy
Table 3.4-10. Split Core ANSI Metering Accuracy
Table 3.4-11. Split Core Current Transformers
PrimaryCurrentRating
ANSI B0.1Metering Classat 60 Hz(Accuracyin %)
WindowSize inInches (mm)Diameter
CatalogNumber
300 400 500 600 750 80010001200
0.3 1.56 (39.6) S050-301S050-401S050-501S050-601S050-751S050-801S050-102S050-122
50 100 150 200
1.20.60.30.3
1.25 (31.8) S060-500S060-101S060-151S060-201
400 500 600 750 80010001200
0.3 3.25 (82.6) S080-401S080-501S080-601S080-751S080-801S080-102S080-122
500 600 750 8001000120015001600200025003000
0.3 4.25 (108.0) S090-501S090-601S090-751S090-801S090-102S090-122S090-152S090-162S090-202S090-252S090-302
600 750 800100012001500160020002500300035004000
0.3 6.31 (160.3) S025-601S025-751S025-801S025-102S025-122S025-152S025-162S025-202S025-252S025-302S025-352S025-402
25 50
0.3 WoundPrimary
W190-025W190-050
PrimaryCurrentRating
ANSI B0.1MeteringClassat 60 Hz(Accuracyin %)
WindowSize inInches (mm)
CatalogNumber
400 500 600 80010001200150016002000
2.42.42.41.21.20.60.60.60.6
2.00 x 5.50(50.8 x 139.7)
M000-401M000-501M000-601M000-801M000-102M000-122M000-152M000-162M000-202
600 750 80010001200150020002500300035004000
4.84.82.42.41.21.20.60.60.60.60.3
4.10 x 7.10(104.1 x 180.3)
M050-601M050-751M050-801M050-102M050-122M050-152M050-202M050-252M050-302M050-352M050-402
PrimaryCurrentRating
Accuracyat 60 Hz(in %)
WindowSize inInches (mm)
CatalogNumber
100 150 200 300 400
5.05.04.02.02.0
0.80 x 1.95(20.3 x 49.5)
M030-101M030-151M030-201M030-301M030-401
100 150 200 300 400
5.04.01.51.51.5
1.42 x 1.53(36.1 x 38.9)
M040-101M040-151M040-201M040-301M040-401
200 300 400 500 600 750 80010001200
1.0 2.60 x 2.75(66.0 x 69.9)
M060-201M060-301M060-401M060-501M060-601M060-751M060-801M060-102M060-122
500 600 8001000120015001600200025003000
1.0 2.60 x 6.25(66.0 x 158.8)
M080-501M080-601M080-801M080-102M080-122M080-152M080-162M080-202M080-252M080-302

3.4-18
For more information, visit: www.eaton.com/consultants CA08104001E
November 2013
Advanced and Electronic Metering
i
ii
1
2
3
4
5
6
7
8
9
10
11
12
13
14
15
16
17
18
19
20
21
Sheet 03
AccessoriesCurrent Transformers
108
Dimensions in Inches (mm)
Figure 3.4-24. S050—Approximate Dimensions
Figure 3.4-25. S060—Approximate Dimensions
H1
X1
LABEL
(4) Open Slots 0.22 x 0.34(5.6 x 8.6)
2.23(56.6)
1.67(42.4)
1.10(27.9)
2.75(69.9)
3.53(90.0)3.00
(76.2)
0.44(11.2)
3.70(94.0)
1.88(47.8)
0.31(7.9)
2.25(57.2)
1.56 Dia.(39.6)H1
X1
(2) Holes 0.20 (5.1) Diameter
S050BRAC
Approximate weight: 1 lb
H1
X1
0.88(22.4)
3.62(91.9)
(2) 0.28 x 0.50 Slots(7.1 x 12.7)
2.88(73.2)
3.10(78.7)
4.00(101.6)
5.25(133.4)
H1
X1
0.44 (11.2)
4.00(101.6)
1.95(49.5)
See Tables
(2) Slots0.28 x 0.50(7.1 x 12.7)
Approximate weight: 5.25 lbs

CA08104001E For more information, visit: www.eaton.com/consultants
3.4-19November 2013
Advanced and Electronic Metering
i
ii
1
2
3
4
5
6
7
8
9
10
11
12
13
14
15
16
17
18
19
20
21
Sheet 03
AccessoriesCurrent Transformers
109
Figure 3.4-26. S080—Approximate Dimensions
Figure 3.4-27. S090—Approximate Dimensions
(8) Open Slots0.47 x 0.22 (11.9 x 5.6)
5.73 (145.5)4.85 (123.2)3.81 (96.8)
2.19(55.6)
H1
X1
LABEL
2.91(73.9)
1.15(29.2)
0.44(11.2)
5.73(145.5)
2.84(72.1)
4.70(119.4)
0.51(13.0)
3.25 (82.6) Dia.H1
X1
0.42 (10.7) Dia.(4) Holes 1.09
(27.7)0.55(14.0)
S080BRAC
Approximate weight: 2.5 lbs
H1
X10
LABEL
5.92 (150.4)4.85 (123.2)3.81 (96.8)
1.15(29.2)
2.91(73.9)
3.50(88.9)
6.17(156.7)
X1
4.25 (108.0) Dia.H1
0.42(10.7)
4.86 (123.4)
2.97(75.4)
(4) 0.28 x 0.63 (7.1 x 16.0) Slots
(8) Open Slots 0.47 x 0.22 (11.9 x 5.6)
2.19(55.6)
S090BRAC
Approximate weight: 3 lbs

3.4-20
For more information, visit: www.eaton.com/consultants CA08104001E
November 2013
Advanced and Electronic Metering
i
ii
1
2
3
4
5
6
7
8
9
10
11
12
13
14
15
16
17
18
19
20
21
Sheet 03
AccessoriesCurrent Transformers
110
Figure 3.4-28. S025—Approximate Dimensions
Figure 3.4-29. W190—Approximate Dimensions
H1
X10
LABEL
4.10(104.1)
1.28(32.5)
6.37(161.8)
2.98(75.7)
0.56(14.2)
8.50(215.9)
0.75(19.1)
0.44(11.2)
8.50(215.9)
6.31(160.3)H16.75
(171.5)
4.25(108.0)
0.88(22.4)
6.75 (171.5)
(4) 0.56 (14.2)Diameter Holes
(4) Slots 0.44 x 1.00 (11.2 x 25.4)
S025BRAC
Approximate weight: 3 lbs
H2 X2
0.38(9.7)
0.50(12.7)
2.75 (69.9)(4) Closed Slots0.21 x 0.50 (5.3 x 12.7)
(4) Open Slots0.44 x 0.50 (11.2 x 12.7)
3.25(82.6)
2.19(55.6)
4.69(119.1)
4.12(104.6)
LABEL
3.50(88.9)
4.50(114.3)
0.75(19.1)
0.44(11.2)
4.88(124.0)
(2) Mounting Holes0.38 (9.7) Diameter
3.48 (88.4)
H1 X1
LABELH1
X2X1
Approximate weight: 4 lbs

CA08104001E For more information, visit: www.eaton.com/consultants
3.4-21November 2013
Advanced and Electronic Metering
i
ii
1
2
3
4
5
6
7
8
9
10
11
12
13
14
15
16
17
18
19
20
21
Sheet 03
AccessoriesCurrent Transformers
111
Figure 3.4-30. M000—Approximate Dimensions Figure 3.4-31. M050—Approximate Dimensions
Figure 3.4-32. M030—Approximate Dimensions
H1X
1 X2
This
End
Rem
ovab
le
2.00(50.8)This End
Removable
LAB
EL
4.25 (108.0)
5.50(139.7)
H1
X1 X2
3.50 (88.9)0.38(9.7)
1.13(28.7)
(2) 0.19 (4.8) Diameter Holes
7.75(196.9)
Approximateweight: 1.5 lbs 0.75
(19.1)
(4) 0.31 (7.9) Dia. Holes
This End Removable
LABEL
4.10(104.1)
H1
X1
1.63(41.4)
0.44(11.2)
LABE
L
This
End
Rem
ovab
le
H1
7.10(180.3)
10.00(254.0)
10.90(276.9)
6.40(162.6)
7.30(185.4)

3.4-22
For more information, visit: www.eaton.com/consultants CA08104001E
November 2013
Advanced and Electronic Metering
i
ii
1
2
3
4
5
6
7
8
9
10
11
12
13
14
15
16
17
18
19
20
21
Sheet 03
AccessoriesCurrent Transformers
112
Figure 3.4-33. M040—Approximate Dimensions
Figure 3.4-34. M060—Approximate Dimensions Figure 3.4-35. M080—Approximate Dimensions
1.42(36.1)
1.20(30.5)
3.38 (85.9)
1.53(38.9)
4.12(104.6)
3.52(89.4)
4.78(121.4)
2.50(63.5)
X2
H1
LAB
EL
X1
Terminal Arrangement for
Ratios 100:5 through 200:5
LAB
EL
X2
H1
H1
H1
H1
H1
2.75 (69.9)
2.70 (68.6)
5.80 (147.3)
1.75(44.5)
X1 - WHITEX2 - BLACK
6.05 (153.7)
LABEL
H1
H1
6.25 (158.8)
9.25 (235.0)
2.60 (66.0)
6.05 (153.7)1.75
(44.5)
X1 - WHITEX2 - BLACK