
Digital Protection Relay Digital Integrated Metering & Control ...
Upload
khangminh22Category
view
2download
0
POWER GENERATION, DISTRIBUTION AND REVENUE METERING
USING REMOTE INTELLIGENT GATEWAY, PI HISTORIAN AND
MONARCH SCADA SYSTEM
A Thesis
Presented to the faculty of the Department of Computer Engineering
California State University, Sacramento
Submitted in partial satisfaction of the requirements for the degree of
MASTER OF SCIENCE
in
Computer Engineering
by
Sweet Henry
SPRING 2013

ii
© 2013
Sweet Henry
ALL RIGHTS RESERVED

iii
POWER GENERATION, DISTRIBUTION AND REVENUE METERING
USING REMOTE INTELLIGENT GATEWAY, PI HISTORIAN AND
MONARCH SCADA SYSTEM
A Thesis
by
Sweet Henry
Approved by: __________________________________, Committee Chair Ahmed Salem, Ph. D __________________________________, Second Reader Jinsong Ouyang, Ph. D __________________________________, Third Reader Mahyar Zarghami, Ph. D ____________________________ Date

iv
Student: Sweet Henry I certify that this student has met the requirements for format contained in the University
format manual, and that this thesis is suitable for shelving in the Library and credit is to
be awarded for the thesis.
_______________________, Department Chair ___________________ Suresh Vadhva, Ph. D Date Department of Computer Engineering

v
Abstract of
POWER GENERATION, DISTRIBUTION AND REVENUE METERING
USING REMOTE INTELLIGENT GATEWAY, PI HISTORIAN AND
MONARCH SCADA SYSTEM
by
Sweet Henry
This research is driven by the largest change ever in Electrical Power generation
business for the whole county of Placer within 50years of its operations. Placer County
Water Agency (PCWA) is the Government agency that generates, processes and
distributes both Water and Electrical Power within Placer County in California. For the
last 50 years, PCWA has been selling the generated electrical power to Pacific Gas and
Electric (PG&E) and then PG&E resells it to the California power grid. The great
majority of the house-holds get water from the agency’s water treatment and distribution
plants all over Placer County. They also get the electrical power generated by PCWA
from the power grid via PG&E.

vi
The current 50-year contract with PG&E expires in 2013 and Placer County
Water Agency is planning to get on its own and sell electrical power directly to the power
grid without having to pay PG&E as the middle-man. That will save the agency and the
people of Placer County millions of dollars in revenue every year which will eventually
benefit the county itself as a whole. In order for the agency to be able to operate on its
own, the major factor is having a reliable, secure and effective SCADA (Supervisory
Control and Data Acquisition) system with Remote Intelligent Gateway (RIGs) and other
networking structures that allow operators to monitor, control and operate Electrical
Power Plants throughout Placer County.
This research is on the design and development of a system that would make the
daily operation/generation most effective in dealing with power generation &
distribution, California ISO (CAISO) reporting, accurate revenue billing, efficient data
archiving and so on, so that the agency could operate on its own without having to
depend on PG&E or any other third party. Intensive work has been required on
researching all the factors that impact SCADA reliability, data accuracy, real-time
efficiency, network security and everything else as a whole.
_____________________, Committee Chair Ahmed Salem, Ph.D ______________________ Date

vii
PREFACE
The main intention of this report is to document the process in which all the
technical research, installation, testing and implementation have been done and to relay
the technical knowledge on how things could be done in similar Controls System projects
using similar SCADA, Database and Historian applications. The author absolutely does
not reveal or release any kind of sensitive or specific information related to technical,
communications or network infrastructure of any of the agencies or companies involved.
The author was the main Controls System Engineer who actually worked on the system
and was involved from initial design phase to the installation and testing phase.
Although there were a lot of details drawings, designs and network/connection diagrams
that the author developed throughout the research, most of them had been excluded from
this report to protect the security of the system. Only the information that is technically
generic or has already been available on the press releases by PCWA, PG&E, FERC,
CAISO or other federal agencies is included. All the credits due have been clearly stated
for every reference which the respective information comes from.
In summary, this report is to document and relay the invaluable technical
knowledge and findings acquired throughout the process to others with the same interest
in Controls System Engineering for a greater benefit of the public.

viii
DEDICATION
I dedicate this project to my beloved husband, Nic for everything that he did for
me when I was so occupied with school work. I would never forget how my heart
jumped with gratitude and loved seeing short text messages from him while working
late…;“Grocery done, laundry loaded, dishes clean and going to cook dinner now…love
you…”.
I am also very thankful to him for inspiring me to pursue the Engineering
Master’s degree as he did and to become a great Engineer as he is. Last, but not the least,
I would like to express my gratitude to my parents, as well as Nic’s parents, whom I also
dearly call ‘mom’ & ‘dad’.

ix
ACKNOWLEDGEMENTS
I would like to sincerely thank Dr. Ahmed Salem, my main advisor, Dr. Jinsong
Ouyang , the Second Reader and Dr. Mahyar Zarghami, the Third Reader for all their
help, guidance and invaluable advices throughout the process.
I also would like to express my gratitude to the Department Chair and the
Graduate Coordinator, Dr. Suresh Vadhva for all the course advices and support that I
have received while pursuing my Engineering Master’s Degree.

x
Page
TABLE OF CONTENTS
Preface ...........................................................................................................................vii
Dedication ....................................................................................................................viii
Acknowledgements ........................................................................................................ix
List of Tables.................................................................................................................xiv
List of Figures............................................................................................................... xv
Chapter
1. INTRODUCTION ...................................................................................................... 1
2. SYSTEM ANALYSIS ................................................................................................ 3
2.1 Site Analysis ................................................................................................. 3
2.2 Design Analysis ........................................................................................... 6
2.2.1 Generating Entity .......................................................................... 7
2.2.2 RIG Provider Certified by CAISO ................................................ 7
2.2.3 Generating Entity .......................................................................... 8
3. HARDWARE ANALYSIS ...................................................................................... 15
3.1 Remote Intelligent Gateway ....................................................................... 19
3.2 CAISO Revenue Meters .............................................................................. 21
3.2.1 GUI ……….................................................................................. 22
3.2.2 CT (Current Transformer) Board .................................................. 23
3.2.3 DPM (Data Processing Module) ................................................... 23

xi
3.2.4 Modem Board ….......................................................................... 24
3.2.5 Meter Programming ..................................................................... 24
3.2.6 Passwords and Security ................................................................ 25
3.2.7 Power Management ...................................................................... 26
3.2.8 Firmware Updates ........................................................................ 28
3.2.9 Data Format .………..................................................................... 28
3.2.10 Outputs ...................................................................................... 28
3.3 SCADA Redundant Servers with auto Fail-over .......................................... 29
3.4 Terminal Servers ........................................................................................ 31
3.5 Fiber Optic Media Convertors ...................................................................... 33
3.6 Serial Multiplexers ..................................................................................... 35
3.7 RS‐232 Modem Splitters................................................................................ 37
3.8 Patton Ethernet Extenders ........................................................................... 37
3.9 KVM Switch .............................................................................................. 39
4. SOFTWARE ANALYSIS ....................................................................................... 42
4.1 Monarch SCADA System ........................................................................... 42
4.2 Remote Intelligent Gateway Database ......................................................... 45
4.3 PI Historian ................................................................................................. 46
4.3.1 Authentication .............................................................................. 48
4.3.2 Other Connections ....................................................................... 51

xii
4.4 Web Implementation of SCADA Data ......................................................... 51
4.4.1 Using PI WebParts ....................................................................... 53
4.4.2 Using PI Coresight ....................................................................... 56
4.4.3 Using OLEDB ............................................................................. 57
4.4.4 Using AF and ACE ..................................................................... 5 8
4.4.5 Other Options ............................................................................. 5 8
4.5 Virtual RTU ................................................................................................ 59
5. NETWORK AND SECURITY ANALYSIS ............................................................ 72
5.1 Communication Protocols ....................................................................... 72
5.2 Sonic Firewalls and VPN ........................................................................ 72
5.3 Existing Bell 202 vs. New Myriad Modems ................................................. 75
5.4 Power Line Carrier Technology .................................................................. 77
6. TESTING AND IMPLEMENTATION ................................................................... 78
6.1 Critical Action Items and Milestones ........................................................... 78
6.2 RIG Commissioning Checklist ..................................................................... 81
6.3 CAISO Revenue Meter Certification ............................................................ 88
6.3.1 Before vs. Now ............................................................................ 89
6.3.2 Revenue vs. RealTime Speed ....................................................... 90
7. PROBLEMS ENCOUNTERED ............................................................................... 92
7.1 Revenue Meter Electrical Break-down ....................................................... 92
7.2 PI SDK and DataLink Errors ...................................................................... 93

xiii
7.3 Monarch SCADA Errors ............................................................................ 96
8. CONCLUSION ........................................................................................................ 98
References ................................................................................................................... 99

xiv
LIST OF TABLES
Tables Page
1. Communication Option-1 for real-time data transfer …………….………...….. 11
2. Communication Option-2 for real-time data transfer ………………………….. 12
3. Communication Option-3 for real-time data transfer ………….…..…….…….. 13
4. Network Components Installation Summary ..……...……………...………….. 15
5. SCADA Server Specifications ……………………………………..………….. 30
6. SCADA Client Specifications ……………………………………...………….. 31
7. Critical Action Items and Milestones ………………………………………….. 78
8. RIG Commission Checklist ………………………………………..………..… 82

xv
LIST OF FIGURES Figures Page 1. Old Server Rack Layout ………………………….……………….……... 4
2. New Server Rack Layout …………….…………………………….……... 5
3. Remote Intelligent Gateway System Connecting SCADA and EMS … .…. .10
4. Some of the communication hardware purchased ……..…...…………..... 19 5. AdvanTech UNO-4672 Remote Intelligent Gateway……….…….……... 20 6. E850 MAXsys Elite Landis + Gyr Meter – Outside ……….…….……... 21
7. E850 MAXsys Elite Landis + Gyr Meter – Inside . .………...…....……... 23
8. VESR902D Terminal Servers ……….…...……………………….……... 32
9. B&B FOSTCDRIPH-SC Fiber Optic Media Converter ………….……... 34
10. DCBNet DCBSR-04 Serial Mux ……………………......………..……... 36
11. B&B 9PMDS Modem Splitter ………………………….…….….…….... 37
12. Patton Ethernet Extender ………………………...…………….….……... 38 13. Patton Ethernet Extender and Cables ………………….……….….……... 38 14. TrippLite KVM Switch ……………………….……………….….….…... 40
15. Monarch SCADA Redundant Design …………………………......……... 44
16. PI SDK – Modules to Install …………………………..……….….……... 46
17. PI SDK – Directory to Install …………………………….……...…...…... 47
18. PI SDK – Server Connection Configuration ………………..….….……... 47 19. PI SDK – Install Successful ………………………….………..….….…... 48

xvi
20. PI SDK – Server Connection Configuration …………………….........…... 49
21. PI SDK – Connection Successful ………………..………………...……... 49 22. PI DataLink Setup- Screen1 ……………………….……….…….…...…... 50
23. PI DataLink Setup- Screen2 ……………………………………….……... 50 24. PI Web Implementation Design Layout ……………………...…………... 52 25. PI WebParts Screen - Trends ………………………….…..……….……... 54 26. PI WebParts Screen – Graphical SVG Display 1 ….……………....……... 54 27. PI WebParts Screen – Graphical SVG Display 2 …………...…….…….... 55 28. PI Coresight Screen – Main Page with Multiple Subscreens ……………... 57
29. PI Asset Framework (AF) Installation …………………………….……... 58 30. Virtual RTU Screen 1 – Main Menu …………...………………….……... 60 31. Virtual RTU Screen 2 – System Parameters ……………………….……... 60 32. Virtual RTU Screen 3 – Channel Detail ………....………………....……... 61 33. Virtual RTU Screen 4 – RTU Statistics ……………………..…….……... 61 34. Virtual RTU Screen 5 – Datalink Statistics ……………….……….……... 62 35. Virtual RTU Screen 6 – Channel Statistics ……….……………….……... 62 36. Virtual RTU Screen 7 – Scan Class Configuration …………………..…... 63 37. Virtual RTU Screen 8 –Point Detail …………………….……...….……... 63 38. Virtual RTU Screen 9 – RTU Summary …………………………...……... 65 39. Virtual RTU Screen 10 – Scale Factor Setup ……………………...……... 65

xvii
40. Virtual RTU Screen 11 – Point Summary ………………………....……... 66 41. Virtual RTU Screen 12 – Point Details1 ……………………….….……... 66 42. Virtual RTU Screen 13 – Point Details2 …………………..…...….……... 67 43. Virtual RTU Screen 14 – Channel Summary ………..………………........ 70 44. Virtual RTU Screen 15 – Channel Configuration ………………………... 70 45. Virtual RTU Screen 16 – Point Configuration1 ……………...…………... 71 46. Virtual RTU Screen 17 – Point Configuration2 ……………...…….……... 71 47. SecureCRT – Port Troubleshooting …………………….……...….……... 71 48. SecureCRT – Traffic Monitoring ………………………………….……... 73 49. Secure CRT – Port Configuration …………………………...…….……... 74
50. Myriad Modem Rack – Front………………………………...…….……... 75 51. Myriad Modem Rack – Back………………………………...…….……... 76 52. FlashPoll Standalone Modem ………………………….……….….……....76
53. FlashPoll Standalone Modem – Dip Switches ….……....….…………...… 76 54. FlashPoll Modem – Cable for Connection……………….………...……... 76
55. PI DataLink Installation Error ………………………….………….…....... 93 56. PISDK Authentication Error ………………………….…...…...…...……. 94 57. PI SDK Host Unknown Error ………………………….…….……...…..... 94 58. Stopping PI Network Manager ………………………….……..….…........ 95

1
Chapter 1
INTRODUCTION
The scope of the research covers different aspects of hardware, software,
database, web application, communications, networking, security, testing and
implementation in regards to power generation, monitoring and revenue billing. The
primary goal is to set up a Remote Intelligent Gateway system with CAISO revenue/real-
time metering and to implement the SCADA system, historical data archiving, web ability and
other technologies to achieve the goal. The main actions taken include advanced RIG
platform research and installation (one primary RIG, one redundant RIG, and auto fail-
over software), network design & research, networking and other device purchases,
applicable software research & purchase, CAISO Requirement and RIG Guidelines
research, sever rack layout and design, CAISO meter research, programming and installs
for powerhouses (14 New Meters with 1 spare), internal data testing for each powerhouse,
CAISO testing & verification for final certification, project coordination with CAISO
(meetings, conference calls, emails, etc.), and the last but not the least, preparing project
documentation and drawings.
The new Power Purchase Agreement between PG&E and PCWA starts taking
effect in 2013. The RIG (Remote Intelligent Gateway) switch-over project is to do the
switch over between the existing RIG at the PG&E facility Powerhouse to the new
RIG at PCWA facility. With the new contract, PCWA is going into the regulation
business with CAISO (California Independent System Operator) which requires that

2
Revenue meters at PCWA provide not only the revenue data but also the real-Time at
CAISO specified speed. To support that, PCWA needed to replace all the existing
meters at all the powerhouses. In this report, in order to make the system design more
generic to the public, PCWA’s powerhouses are referred to with generic names:
PH1 (Powerhouse 1)
PH2 (Powerhouse 2)
PH3 (Powerhouse 3)
PH4 (Powerhouse 4)
PH5 (Powerhouse 5)
PCWA-MCF (Main Control Facility owned by PCWA)
PGE-RIG-CC (RIG Control Center owned by PG&E)
The new meters needed to be installed by this project are as follows:
PH1 Power House - 1 Primary Meter + 1 Auxiliary Meter (no backup exists)
PH2 Power House - 1 Primary Meter + 1 Backup Meter + 1 Aux Meter
PH3 Power House – 2 Primary Meters + 2 Backup Meters + 1 Aux Meter
PH4 Power House – Unit A - 1 Primary Meter + 1 Backup Meter + 1 Aux
Meter
PH4 Power House – Unit B - 1 Primary Meter (no backup or Aux)

3
Chapter 2
SYSTEM ANALYSIS
2.1 Site Analysis
Both Primary and Backup RIGs are to be rack mounted in the main cabinet a t
PCWA-MCF building. A new cabinet is to be put in for future devices. So, any
networking devices needed for PG&E to connect to the new RIG could be accommodated
with enough rack space. PCWA is to supply necessary backup power to the RIG
cabinet. Standard 110 VAC power connections and/or DC 125 & 48VDC will be
supplied to each cabinet. Having a Battery backup power is now enforced by CAISO
for equipment working with CAISO telemetry and metering.
As recommended by CAISO, P C W A also needed to install t h e ECN (Energy
Communication Network) and CAISO router with AT&T. [1] This is a standard
router used at most power plants working with RIG and ECN. This private and
secure network communication will be used to connect to CAISO. The router will
have an “ASYNC” cable with multiple ports and/or Ethernet port for direct meter
connection to the CAISO meter(s) provided by AT&T CAISO group. It will be
necessary to verify the media type and physical connector or adapter type with for each
connection. A troubleshooting modem was also put in so that AT&T could remote in to
the ECN connection and troubleshoots if the circuit were to go down. CAISO is to
provide necessary technical and informational support along the process.

4
Figure 1: Old Server Rack Layout

5
Figure 2: New RIG Server Rack Layout

6
2.2 Design Analysis
A thorough research was conducted on all the different devices/parts that need to
be purchased, installed, and configured; starting with different modems, modem racks
and compatibility with the existing products. The main problem is that different devices
that are out in the field date back to 50 years old or so and have different speed and
specifications. The existing system was using an old-school Bell 202 Modem and 16 slot
modem rack made by Applied System Engineering. And the speed is only 1200 baud-
per-second. A critical problem faced is that since the new California-ISO Revenue
Meters that we want to use are at 9600bps rate. So, the research was conducted on how
to make both work with both hardware and data rate compatible. A few feasible options
with different hardware were found. Based on those options, further research was done
on the stand alone modems in the Power Houses and how to make them talk back to the
server without compromising the quality/efficiency of the data.
California Independent System Operator (CAISO) has also established multiple
guidelines to help Power Generation Entities such as PCWA to follow in installing RIG
and dealing with ECN Network. CAISO requires Investor Owned Utilities (IOU) to
use Remote Intelligent Gateways (RIG) to transfer Automatic Generation Control
(AGC). Unless specifically exempted by the CAISO, an IOU providing AGC must
install both RIG and necessary software applications to interface with CAISO’s Energy
Management System (EMS). [2] RIG could be either a physical device located as
server on its own or could be a software interface installed on another server such as

7
SCADA system. Either way is acceptable as long as it can perform all the functions
of a RIG. The system design, engineering, installation and maintenance of the RIG are
the responsibilities of the Connected Entity, while verifying the correct implementation
of the required data list and appropriate AGC control with each generator is the
responsibilities of CAISO. CAISO is to provide necessary technical and informational
support along the process.
According to CAISO, followings are the responsibilities of each party involved: [2]
2.2.1 Generating Entity (PCWA)
To work with CAISO certified RIG provider to complete equipment and
software procurement, engineering, installation and maintenance
To adhere to Telecom circuit protection standards.
To adhere to ISO standards and procedures.
To procure and install all necessary Telecom circuits.
To prepare O & M of Generator Telecom circuits.
To provide database as specified in ISO standards.
To procure RIG.
To execute RIG O & M plans.
2.2.2 RIG Provider Certified by CASO
To supply Product Overviews (Standard RIG catalog) and quotations.

8
To supply RIG Training packages and costs.
To provide O & M packages and costs.
To construct RIG.
To provide factory acceptance testing in agreement and coordination with
plant.
To participate in Site Acceptance Testing.
To provide technical support and coordination.
2.2.3 Independent System Operator (CAISO)
To maintain and publish standards.
To assist with communication circuit procurement.
To operate, maintain and monitor the ISO telecom network.
To coordinate the interface and monitoring of metering data into RIG.
To provide sample acceptance testing procedures for site installations.
To review and approve plant Engineering proposals and documents.
To review and approve plant interface drawings.
To approve initial RIG database content.
To participate in coordinated testing of installed and configured RIGs.
To implement RIG/ISO database.
To approve plant database changes and corresponding changes to the
master database template for the plant.
To participate in AGC tuning with the Generating Plant
9
To perform A/S Certification tests.
To provide, maintain and distribute security certificates and cards.
To maintain RIG software revision inventories.
To coordinate Database maintenance and point gathering processes in
conjunction with ISO standards.
For PG&E part, they need to connect their SCADA Server at PGE-RIG-CC to
the new PCWA RIGs at PCWA-MCF for PCWA/CAISO related points and to
make all the hardware and software installation and modifications as necessary. For
this, different options of connections were analyzed. Following is the diagram drawn by
the author that shows how RIG, SCADA and EMS works with ISO ECN. [1]

10
Figure 3: Remote Intelligent Gateway System Connecting SCADA and EMS

11
Table 1: Communication Option-1 for real-time data transfer
Description To use “Serial” communication via Adtran Cards (TA1500)
and the Existing Microwave Radio (Harris)
Comms Type Microwave Radio – Serial
Available Speed 9600 bps Max
Additional Notes on
Speed
To see if 9.6kbps speed is good enough for the real time
data transfer
Meter data & control set points from CAISO.
Need to calculate:
o How much data needs to be transferred from
PCWA RIG to PG&E SCADA (in bytes)
o How often SCADA is going to poll the RIG (via
DNP3)
o Based on that, to calculate how much the delay
would be to transfer data 1 round trip
What needs to be
Installed
To decide how many Adtrans cards would be needed
To see if possible (or even want to) disconnect current
Adtran connections for revenue meter data (might want to
reuse them for RIG-SCADA connection)

12
Factors to consider Speed limitation
Amount of data transfer limitation
Meeting CAISO speed & other regulations
Reliability, maintainability
Things to look at Does the other end of the connection also use the same
Adtrans (TA1500) or something else?
To review current Adtrans connections & see if any of
them could be disconnected/recycled
Table 2: Communication Option-2 for real-time data transfer
Option #2
Description To use “T1” via a Router & AT&T T1 Line
Comms Type AT&T - T1
Available Speed 1.544 Mbps Max (without Frame Relays)
1.536 Mbps Max (with Frame Relays)
Additional Notes on
Speed
24 x DS0 64kbps = 1.536 Mbps.
160times faster/more-data than Serial in Option#1
What needs to be
Installed
Need To put in a new AT&T T1 Line on both ends of data

13
transfer
Factors to consider Install & Implementation cost for AT&T T1 at both ends
Monthly fee from AT&T
Reliability, maintainability
Things to look at To decide on the location of the Router
Does the other end of the connection have an
infrastructure to support a direct T1 line without having to
go through the Cloud?
Table 3: Communication Option-3 for real-time data transfer
Option #3
Description To use “T1” via a Router & the Existing Microwave Radio
(Harris)
Comms Type Microwave Radio - T1
Available Speed 1.544 Mbps Max (without Frame Relays)
1.536 Mbps Max (with Frame Relays)
Additional Notes on
Speed
24 x DS0 64kbps = 1.536 Mbps.
160times faster/more-data than Serial in Option#1

14
What needs to be
Installed
Need to see if the existing Radio still has room available
Could put in a new T1 card?
Factors to consider Install & Implementation cost for expanding the existing
T1 at both ends
Reliability, maintainability
Perspective on using “Serial” vs. “T1”; using Adtrans vs.
installing a router
Things to look at More info on outside entities’ Networks (clouds) for
secure data transfer
Security and regulatory perspective on using “Serial” vs.
“T1”; using Adtrans vs. installing a router.
After thorough analysis and discussions, Option #1 came out to be the best
option from security, efficiency and regulatory perspectives.

15
Chapter 3
HARDWARE ANALYSIS
Based on the project design, there were new hardware and software required in the
project to transfer both real-time and revenue data from CAISO meters. Following table
lists the communication hardware components that were required to be able to have real-
time meter data transferred from the each powerhouse to CAISO EMS. The table only
lists the networking components that needed to be installed and excludes Remote
Intelligent Gateway, and other servers or SCADA nodes.
Table 4: Network components Installation Summary
Task
No.
Device to
Install
Model No. Site to
Install
Number of
Items at each
site
Comments
1. Serial
Multiplexer
(Total 2)
DCB SR-
04
PCWA-
MCF.
1 To connect to the new
Modem Rack. To relay
data from PH5 Primary,
PH4 Primary and
Backup meters.
PH4 1 To get data from PH5
Primary, PH4 Primary
and Backup meters.

16
2. Fiber Optic
Media
Converter
(Total 4)
B&B
FOSTCDR
I-PH
PH4 2 Power Supply needs to
be ordered separately. If
there is no existing parts
in stock to be used and if
need to be ordered.
PH5 2
3. Modem
Rack (Total 1)
Raymar
Myriad-
18Slot
Dual
115VAC
PCWA-
MCF.
1 Rack (18
slots)
To replace the existing
16slot Modem Rack at
PCWA-MCF.
4. Rack mount
Modems for
the Modem
Rack (Total 12)
MD9612FP PCWA-
MCF.
(5 to replace
the existing
Bell202
modems, 6 for
the new
connections, 1
spare)
These modems support
variable speed and are
adjustable for applicable
baud rates.
5. Stand-alone
Modems for
Revenue Data
(Total 6)
PH1 1 To get Revenue data
from PH1 Primary
Meter
PH2 2 To get Revenue data
from PH2 Primary and

17
Backup Meters
PH3 2 To get Revenue data
from PH4A Primary and
Backup Meters
PH4 1 To get Revenue data via
SMUX at PH4 (for FM
and PH5 Meters)
6. RS-232
Modem Splitter
(Total 1)
B&B
9PMDS
PH4. 1 To get Real Time data
from PH4 & PH5
Primary Meters and to
relay them to Serial Mux
at PH4.
7. Ethernet
Extender
(Total 2)
Patton
2157
PH1 1 To relay Real Time data
from PH1 Primary
Meter to the Router at
PH2.
PH2 1
8. Terminal
Server
(Total 4)
B&B
VESR902
D
PCWA-
MCF.
1 To relay Real Time data
for PH4 and PH5 from
SMux to the Router.
PH1 1 To get Real Time data
from PH1 Primary meter
PH2 1 To get Real Time data
from PH2 Primary meter

18
The figure below shows some of the hardware that came in with the shipments
from respective vendors for field installation.
PH3 1 To get Real Time data
from PH3-1 Primary
Meter
9. Radio Comm
Cards for new
connections
Adtran
cards
Multiple
sites
(to use the
existing spares)
To transport Revenue
Meter data from
Powerhouses via
microwave
10. Tellabs 4419B
or something
similar that
would be
compatible
with the new
modems
Tellabs
4419B
PH2 (1 new needed) PH1 and PH4 have
already got one each that
they need.
PH5 does not need one.
PH3 (1 new needed)

19
Figure 4: Some of the communication hardware purchased
3.1 Remote Intelligent Gateway
Two RIGs (Remote Intelligent Gateway) were installed at PCWA’s PCWA-MCF
facility. One is to act as Primary and the other is to act as a backup. As of now, the
Backup RIG is to be on cold stand-by; ie. to get physically switched over when the
primary failed. RIGs are to use RTRIG SCADA software with Microsoft Windows
Server for the RIG application and operating system. The new RIGs use the very high
endurance servers with no moving parts (no fan or hard‐drive). This is an advanced
industrial Intel based server platform and uses solid state disk memory “SSD” and
(DC/AC) power adapter. Also, it can tolerate higher/lower operating ranges. No
moving parts eliminate high failure mechanisms. This provides a higher reliability
system – less failures– more uptime and system endurance.
AdvanTech UNO-4672 was put in as a new Remote Intelligent Gateway to the

20
system. The quantity put in was two; one as primary and one as secondary RIGs. UNO-
4672 is powered by Intel Pentium Celeron 1 GHz processor and has one 2.5” SATA hard
drive. Other features include 6 LANs, 10 COMs, 8 DI, 8 DO, 2 RS-232 ports and 8 RS-
232/422/485 ports. Its serial ports are also isolated with automatic flow control. For
added reliability, it has isolation power design with wide AC/DC input range and
isolation between chassis and power ground. [5]
Figure 5: AdvanTech UNO-4672 Remote Intelligent Gateway [5]
PG&E SCADA Server at PGE-RIG-CC is currently connected to the RIG at PGE-
RIG-CC. As of this project, it is to be connected to the PCWA-MCF RIG instead. The
existing radio/microwave infrastructure is to be used by PG&E if it is possible to
accommodate the new connection to the PGE-RIG-CC SCADA Server from PCWA-
MCF. PG&E SCADA Server is to be configured as an actual “RTU” (Remote Telemetry
Unit) connecting to the new PCWA RIG, rather than a “Virtual RTU”. Virtual
RTU uses a different and specific application interface in Monarch SCADA while
“RTU” connection will act as an actual field device with DNP3 protocol.
21
3.2 CAISO Revenue Meters
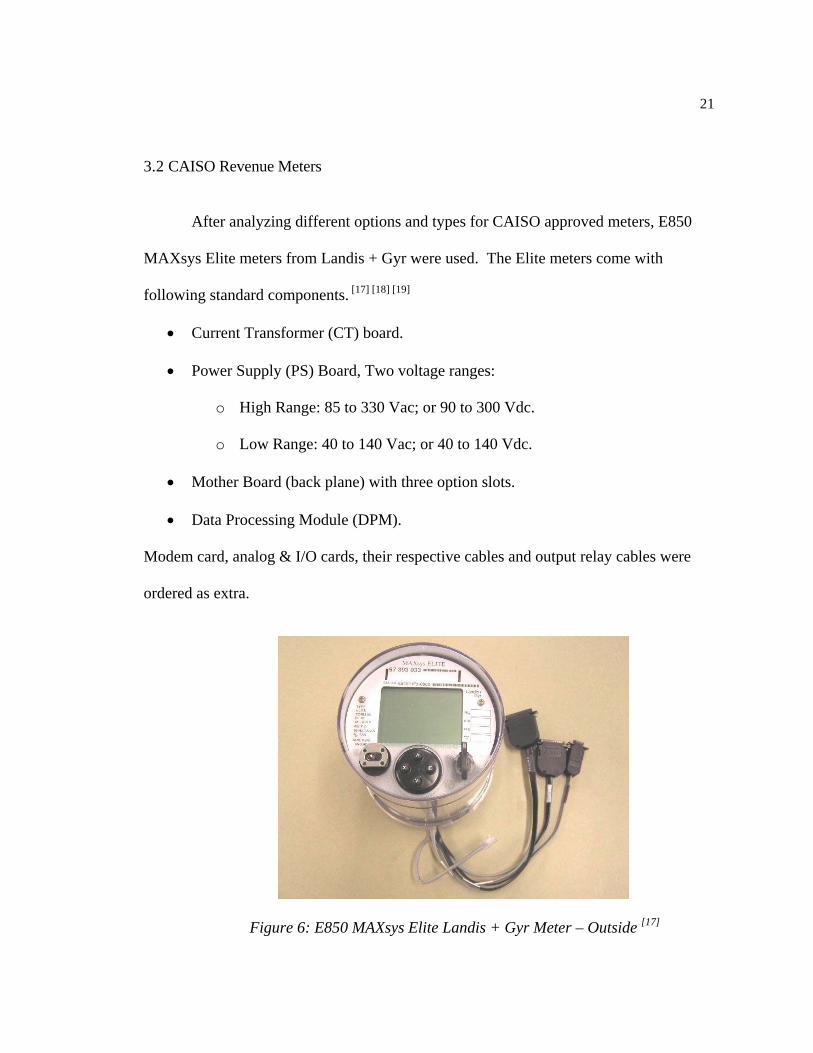
After analyzing different options and types for CAISO approved meters, E850
MAXsys Elite meters from Landis + Gyr were used. The Elite meters come with
following standard components. [17] [18] [19]
Current Transformer (CT) board.
Power Supply (PS) Board, Two voltage ranges:
o High Range: 85 to 330 Vac; or 90 to 300 Vdc.
o Low Range: 40 to 140 Vac; or 40 to 140 Vdc.
Mother Board (back plane) with three option slots.
Data Processing Module (DPM).
Modem card, analog & I/O cards, their respective cables and output relay cables were
ordered as extra.
Figure 6: E850 MAXsys Elite Landis + Gyr Meter – Outside [17]

22
3.2.1 GUI
Three display sequences can be defined using the programming software. For
example, data in engineering units can be displayed continuously in the "customer"
display sequence for customers and meter readers; operating parameters for the meter can
be displayed in the "utility or alternate" sequence for meter installers and for formatting
purposes; other items and engineering units can be displayed in the "test mode" sequence.
Counting all three display sequences together, a maximum limit of unique display items
exists based on table 16 in the firmware version. This limit is usually 200 items. When
table 16 is full, no more unique display items can be added to any of the three display
sequences. The MAXsys Mapper software will provide an error when the limit is
exceeded.
A section of the LCD is reserved for the display of event messages. There are
three different types of event messages:
Permanent – Scrolling
Temporary Warning – Blinking
Temporary information – Non Blinking
Permanent messages will scroll automatically in three second intervals. There is a
separate buffer that will hold the latest 5 permanent events. The history log itself will
hold all messages including the permanent ones with the latest on top of the screen and
reading down to the oldest.

23
3.2.2 CT (Current Transformer) Board
The current transformer (CT) board isolates and conditions the input current from
the grid and then routes it to the DPM analog front end. The CT board is directly
mounted to the meter frame. It also contains surge protection for each of the current
inputs and the inputs for meter power. The display can be controlled by four buttons on
the cover of the meter; “Enter”, “Exit”, and “Up and Down” buttons for scrolling through
the displays. The optical port follows ANSI C12.13 standards and the default baud rate is
9600bps.
Figure 7: E850 MAXsys Elite Landis + Gyr Meter – Inside [18]
3.2.3 DPM (Data Processing Module)
The DPM board is mounted in the front of the meter directly behind the faceplate.
The DPM board contains the following functional circuitry:
¼ VGA Graphic LCD
Serial Communications (4)

24
IRIG‐B input for GPS timing control
KYZ output relays (4)
Navigation buttons
Control switches for controlling resets and Demand Resets
Optical communication port
Current loop port
Visible red LED’s for diagnostics
Two jumpers on the DPM board were used to configure the meters. Four
programmable solid‐state relay outputs are provided on the DPM. An additional eight
outputs are available on the optional Input/Output board. Internally, the relay output
connection is a 12‐pin crimp connector (J15) located in the upper left of the component
side of DPM. Externally, the outputs are available on pigtail leads from the base of the
meter or on connectors depending on configuration. Relay outputs can be programmed
for such uses as a pulse train for kWh, kVAh, kvarh leading, kvarh lagging or as an alarm
for end‐of‐interval and various maximums/minimums threshold demand as well as being
configured for communications and logic control.
3.2.4 Modem Board
The High Speed modem board is a V90 compliant modem that can have its baud
rate fixed at either 1200, 2400 or 9600 baud and auto baud for speeds greater than 9600
baud up to 56K baud. The Elite meter will automatically determine which internal

25
modem is installed at power up and if it is the high speed modem then it will set the
default baud rate to 2400 baud.
3.2.5 Meter Programming
Meter Programming software applications Mapper32 and MAXcom were used.
Customer programs developed in Mapper32 were loaded into the meter using the
Maxcom software program using any of the available communication ports. Maxcom can
also read the programs out of the meter. The meters came from the factory set to “A”
phase power by default. The High Speed modem can be used in one of three modes:
Standalone
Master
Slave
When the meter that the modem is in is defined as a Master or Slave then it will be part of
Multi‐sharing installation where each meter is connected via a custom RS‐485.
3.2.6 Passwords and Security
Data security is maintained not only by the software‐selectable unit ID but also by
user‐defined passwords. In a multiple user environment, the passwords can be used for
two levels of access: read only for all users and read/write for the primary user. This
feature allows one department to obtain interval data from a meter while another
department retains control of the meter for all other functions such as formatting.

26
Read/Write Password ‐ A 4‐character alphanumeric code, stored in the meter,
allows the user to read and/or write information to and from the meter. Default is 0000.
The first two digits (two leftmost digits) allow the user to have access to reading or
viewing any information/data from the meter. The first two digits are sometimes referred
to as the read-only portion of the read/write password. All four digits allow the user to
have total access to the meter; therefore, the user can program the meter and edit data to
and from the meter. The Read/Write Password allows the user to have access to all of the
functions of the utility programs.
Read/Only Password ‐ A separate 2‐character alphanumeric code, stored in the
meter, allows the user to only read information/data from the meter. Default is 00. Once
a password is entered into the meter, the user must maintain the password code. There is
no way to re‐enter a new password code if the existing read/write password is lost or
forgotten, therefore, the meter cannot be accessed to retrieve or view data. To recover
from a bad password, the optical port must be disconnected from the meter and then
reconnected.
Second Recorder Password – This is the same as the Read/Write Password, but
for the second recorder if used.
3.2.7 Power Management
The DPM incorporates a power management scheme that monitors for power fails
and recovery. Watchdog timers and resets are also controlled as part of power

27
management. A high capacity, sealed lead battery, connected to a recharging circuit,
supports the real‐time clock, data memory, and interval marking during ac power
interruptions. The battery will last a minimum of 35 days during power fails for a fully
charged battery. The recharging circuit will deliver 6.75 to 7.0 Vdc at 50 ma to attain a
fully charged condition. It will require a minimum of 10 hours to attain full charge. The
battery in the meter can be tested by the firmware which can set how often the battery test
is performed in number of days at either midnight or 16:00, or disabling battery test. In
addition, the “Battery Low” message can be disabled (default is enabled). If the battery
fails this test, a message appears on the display unless disabled. If so programmed, a
history message will also be written. Additionally, the meter can dial‐back on a battery
test failure event.
During an interruption of ac service, the meter stops collecting data and will not
communicate with incoming transmissions from a data collection system. The meters do
provide the following power fail operations:
Maintenance of data RAM and time‐keeping
Interval marking during power fails
Optional Dial‐in during Power Fail
Optional Dial‐in after Power Fail
A completely top‐charged battery will maintain data registers in RAM and time‐keeping
in the meter for up to 35 days.

28
3.2.8 Firmware Updates
The firmware update is stored in the Nor Flash memory. The file is loaded into
the meter by using a software program called Q4FL on any of the serial ports, including
the optical port. Q4FL incorporates several security features to ensure integrity of a
firmware update. Q4FL is available on the Landis+Gyr e‐Portal website. The unit will be
totally off‐line while flash download is in progress, and no recording/metering will take
place. The LCD display will reflect the status of the data download. If the Format Jumper
is NOT installed, then firmware updates are not possible. If the jumper is installed then
firmware updates are possible through any port. At the completion of the download
(whether successful or not), a cold start will be executed. Since the entire SRAM is used
by the downloader program, all RAM data is lost. The NAND Flash however still
contains a copy of the latest control table values.
3.2.9 Data Format
Data messages consist of a six byte header followed by an optional data packet.
The position and type of the fields in the data packet are known by the receiver. The data
packet has a maximum length of 255 bytes. There are four types of fields that can be
transmitted in the data packet. A status field is always a 16 bit field. If present, this field
is always transmitted first. A time sync field is always 32 bits in length, and contains the
number of seconds. This field always appears immediately after status field if any.
Absolute data is transferred as an eight byte IEEE 754‐1985 floating point number.

29
enabled simply by setting the appropriate field enable bit in table 64. No other setup is
needed. The scale factor is calculated using this formula:
scale = (max_rate_value ‐ min_rate_value) / 4096
3.2.10 Outputs
The analog output option board provides up to four (4) analog outputs. All
outputs are of the same type (e.g., ‐1 to +1 ma). The four outputs are implemented as two
dual‐package D to A converters. Pairs are isolated from each other, that is, pair A1 and
A2 is isolated from pair B1 and B2. A1 and A2 share a common ground; B1 and B2 share
a common ground. Both pairs are isolated from the meter circuitry.
3.3 SCADA Redundant Servers with auto Fail-over
Another factor to consider was regarding the Monarch SCADA to see if it should
be upgraded from the current Monarch Legacy to Monarch .Net version. Upon
conducting the research, it was found that the software upgrade would not work unless
the server hardware was also to be upgraded to make the hardware compatible with the
software. Followings are the hardware detail specifications in order to support the new
.Net system as well as the auto fail over feature between the primary and the secondary
servers. [19]

30
Table 5: SCADA Server Specifications
Brand & Model: Dell PowerEdge R720 Servers
Chassis Type: 2.5"Chassis w/Up to 8 Drives
Processor: Intel Xeon E5-2630 2.3GHz 6 Core Processors
CPU: Performance Optimized 1333MHz RDIMMRAM:8GB
(2x4GB) Dual Ranked
RAID: RAID5 for H710 512MB NV
Hard Drive: 600GB (3x300GB 10k) SAS Hard Drives (2.5")
PCI: Risers w/up to 6, x8 PCle+1, x16PCle Slot
Power Supply: Dual, Hot-Plug, Redundant Power Supply 1100W
Cable Management: NEMA 5-15P to C13 10'
Others: Power Cord Performance BIOS
Sliding Ready Rails w/ Cable Management Arm
Front Bezel
iDRAC7 Express
Integrated IntelI350 QP 1GbE Card
DVD/CD Drives: DVD-ROM, SATA,
Internal Warranty: 3yr Basic Warranty, 5x10 NBD Warranty
OS: Windows Server 2008 R2, or higher

31
Table 6: SCADA Client Specifications
Brand & Model: Dell Precision T3600 Workstations
CPU: 2.8GHz Intel Quad Core Xeon Processors
Hard Drive: 250GB Disk
RAM: 4GB (2x2) GB ECC RDIMM RAM
DVD/CD Drives: 8x DVD+/- RW SATA
ENet, Sound & Graphic Cards: Integrated 100/1000 BaseT Ethernet Card,
Nvidia Quadro 600 Graphics Card
Integrated Sound
Power Supply: 635W Power Supply
MS Office: Microsoft Office 2010 Professional
Warranty: 3YR Standard NBD Warranty
NIC: Intel CT GbE PCle NIC
OS: Windows 7 Professional 64-Bit
3.4 Terminal Servers
Terminal Servers needed to be added at PCWA-MCF location as well as at
applicable power houses to transfer real-time meter data. At this point, one Terminal
Server at PH1 Powerhouse, and one at PH2 Powerhouse are required for their real-time
data from primary meters. For PH3 Powerhouse, the connection was different in such a
way that one Terminal Server is to be installed and connected to both Primary Meter 1

32
and 2. It is then to get Real-Time data out of both meters. Back-up Meters were not
required to be connected to Terminal Servers since the Real-Time data is to come out
only from primary meters. PCWA-MCF building is also to have one new Terminal
Server added. It was connected between the new Serial Multiplexer and the existing
router that goes out to Harris Microwave Transmitters/Receivers. The new PCWA-MCF
Terminal Server is to relay all the real-time meters data from each power house to the
RIGs via the Router. Terminal Server from B&B Electrics with part number VESR902D
was used. The contractor provided 3 Terminal Servers for PH1, PH2 and PH3 Power
Houses while PCWA purchased one for PCWA-MCF.
Figure 8: VESR902D Terminal Servers
Using the Terminal Servers was to solve the problem with transferring meter data
from Serial ports out of the meters and get them over to Ethernet ports at router and
switches. Terminal Servers connect RS-232, RS-422, or RS-485 Serial Devices to LAN
or WAN. Direct IP - IP applications communicate directly with Serial Devices. Virtual
COM Port PC's communicate with Serial Devices as if they were connected to a local

33
COM port. Serial devices exchange data using Ethernet network and via paired mode or
serial tunneling. If desired, it can also be monitored and controlled from anywhere on
PCWA’s Ethernet LAN network. It can even be troubleshot from outside PCWA LAN
using Internet. Vlinx Manager Software is used to configure devices, upgrade firmware
and monitor activity, or configuration changes can also be made using a web browser or
TELNET.
One of the advantages was that VESR902D supports Windows 7 OS and has
drivers for older OS such as 2000, 2003 Server, XP, and Vista. In this project, VCOM
driver was used. It is UL listed and has the ability to auto detect a 10/100 Ethernet port.
Configuring it was easy and straight forward; via web interface as well as with telnet. Its
serial ports work with RS-232/422/485 and it can support multiple TCP client sessions.
The compact size of VESR902D also saves DIN rail space inside the panels. Another
main concern was the varying temperature and the durability since the powerhouses
could have extreme temperatures on both ends of hot or cold depending on the weather.
VESR902D was found to have the temperature range from -34 to 80°C. It takes the input
power of 10 to 48 VDC (58 VDC Maximum). It also has the ability to detect
communication failures and does auto heartbeat reconnections. [8]
3.5 Fiber Optic Media Convertors
Regarding PH5 Power House, due to the existing Fiber connection between PH5
and PH4 Power Houses, a different approach was required to transport both Real-Time
34
and Revenue meter data. Currently, no CAISO meter exists at PH5. One CAISO primary
meter was installed at PH5 switchyard to be able to measure how much data is generated
for revenue calculation purposes as well as Real-Time monitoring for CAISO. One new
CAISO meter cabinet is to be installed at PH5 switchyard (substation, not at Power
House). One Primary Meter is then to be installed inside the cabinet. Two Fiber Optic
Media Converters are to be installed for that meter. One data stream each is required for
Real-Time and Revenue data. When the data from PH5 Fiber Optic Media Converters
arrive at PH4 through fiber lines, the same converters are needed at the other end to
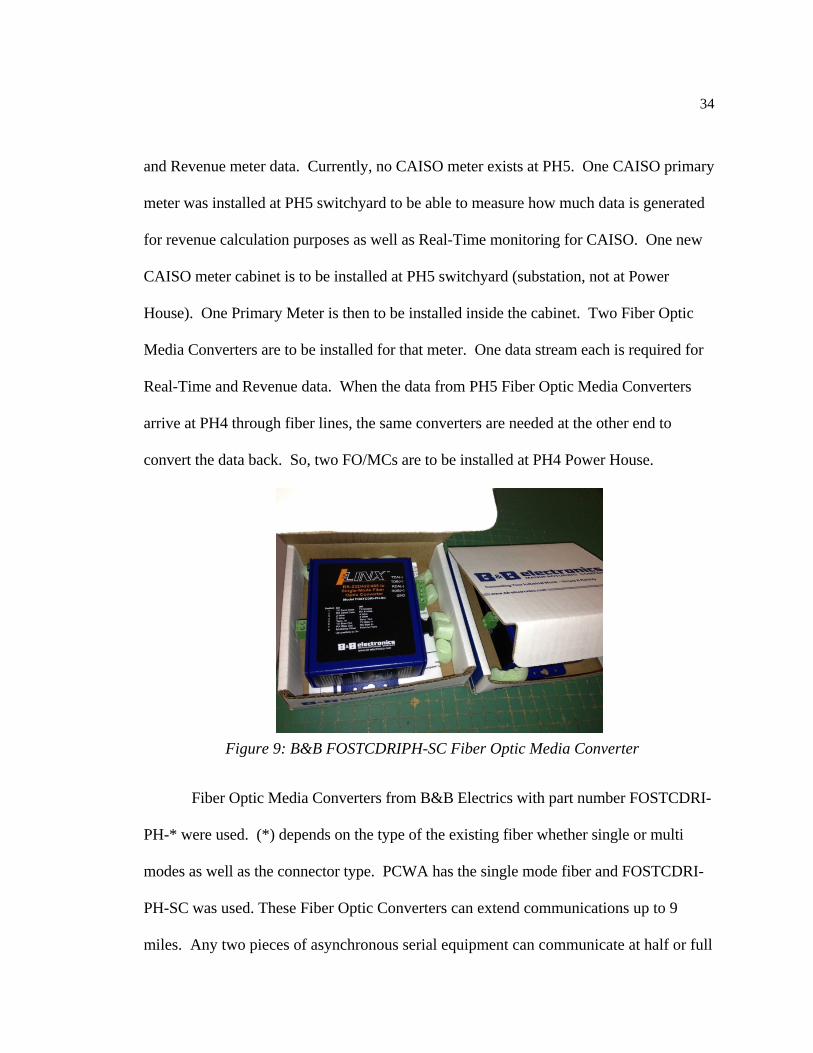
convert the data back. So, two FO/MCs are to be installed at PH4 Power House.
Fiber Optic Media Converters from B&B Electrics with part number FOSTCDRI-
PH-* were used. (*) depends on the type of the existing fiber whether single or multi
modes as well as the connector type. PCWA has the single mode fiber and FOSTCDRI-
PH-SC was used. These Fiber Optic Converters can extend communications up to 9
miles. Any two pieces of asynchronous serial equipment can communicate at half or full
Figure 9: B&B FOSTCDRIPH-SC Fiber Optic Media Converter

35
duplex over two fibers at rates up to 460 kbps for RS-422/485 or 115.2 kbps for RS-232
with a pair of these converters. Fiber lines are inherently resistant to EMI/RFI and
transient surges, so they are ideal for data communications near heavy electrical
equipment and other electrical or radio interference. These Fiber Optic Converters can
extend communications up to 9 miles and industrial models have wide operating
temperature.
Modbus compatible any two pieces of asynchronous serial equipment can
communicate at half or full duplex over two fibers at rates up to 460 kbps for RS-422/485
or 115.2 kbps for RS-232 with a pair of these converters. Fiber lines are inherently
resistant to EMI/RFI and transient surges, so they are ideal for data communications near
heavy electrical equipment and other electrical or radio interference. Standards can be
mixed and matched so RS-232 devices can be connected to RS-422/485 devices,
replacing a converter and isolator. No driver software is required. Serial connections are
on terminal blocks; multimode fiber side has two ST connectors. [6]
3.6 Serial Multiplexers
Hardware Analysis based on the proposed design concludes that Serial
Multiplexors are required to transfer data from PH4 and PH5 Meters due to existing
Power Line Carrier connection. A Serial Mux is to be installed at PH4 Power House to
collect data from 5 different connections:
Real-Time data stream from PH5 Primary Meter

36
Revenue data stream from PH5 Primary Meter (no Back-up meter to be
installed at PH5)
Real-Time data stream from PH4 Primary Meter
Revenue data stream from PH4 Primary Meter
Revenue data stream from PH4 Back-up Meter
Serial Multiplexor from DCBNet with the part number DCBSR‐04 was used. Required
quantity is two; one at PH4 and one at PCWA-MCF.
Figure 10: DCBNet DCBSR-04 Serial Mux
Its features are as follows. DCBSR‐04 has optional internal 56/64 Kbps DSU/CSU
with optional frame relay FRAD firmware. The port speed is 57.6 Kbps with
asynchronous composite to 115.2 Kbps, and synchronous composite to 128 Kbps. It also
has a network management port for remote set up and testing which would be very useful
for future troubleshooting. Composite is full duplex asynchronous, synchronous, analog
modem or digital 4 asynchronous channels. It also works well with spread spectrum

37
radios. It also has the ability to generate test messages and the "Data Scope" functions to
allow monitoring of any data port. "Copy Command" could also be used for remote
training. [12]
3.6 RS‐232 Modem Splitters
At PH4 Power House, Serial Multiplexor that PCWA needed to install only has 4
serial ports when there are going to be 5 different connections coming in. This raises a
need to get a RS232 Serial Modem splitter. The modem splitter from B&B Electrics with
the part number 9PMDS was used. Required quantity was one for PH4 powerhouse. The
splitter provides quick plug and play installation. No specific configuration was
required. Also, since it is port powered, no external power was required. [7]
Figure 11: B&B 9PMDS Modem Splitter [7]
3.7 Patton Ethernet Extenders
The analysis part of the project found the Patton extenders in favor for this
connection because they high speed extension over a single twisted pair of copper. They

38
could also do auto‐rate selection where the units in, and they will determine the maximum
rate possible for the connection. Ethernet port is auto-sensing and could do auto 10 or
100Base‐T and full or half‐duplex Ethernet operations. The extender does transparent
LAN Bridging, passes higher layer protocols and supports 802.1Q VLAN tagging. With
automatic learning, and filtering, the extender only allows packets with addresses outside
the LAN to be forwarded for security.
The detail specifications of the extenders and how they were used in the project
are as follows. The protocol used by the extenders is transparent to higher layer
protocols, and also supports 802.1 Q VLAN tagged packet transmission. The extenders
also does auto‐rate adaptive from 192 kbps to 4.6 Mbps, with the DTE rates of 64k steps
from 192 to 4608 kbps. They also have user friendly GUI and LED status indicators on
the surface for clear display of transmit and receive signals. For connections, there are
RJ‐11 on copper line, RJ‐45 for Ethernet, and a shrouded male IEC320 power connector.
External power is 90 ‐ 260 VAC, 50 ‐ 60 Hz, 10 W. external 40 ‐ 60 VDC, 10W (DC
Figure 13: Patton Ethernet Extender and CablesFigure 12: Patton Ethernet Extender [15]

39
option). The line interface is transformer coupled with 1500 VAC isolation. The
extenders also meet the FCC and low voltage directive compliances. They are UL1950
listed with operating temperature of 32 ‐ 122°F (0 ‐ 50°C). [15]
3.9 KVM Switch
Existing Server rack at PCWA-MCF facility had an old monitor that takes up 10
Unit rack space with 1 Unit space for a keyboard and a mouse which is wasting 11 unit
spaces in total. They were replaced with an all‐in‐one KVM Switch that has a foldable
monitor, keyboard and mouse all built in and takes only 1 Unit rack space. That would
free up 10 unit spaces to use for any other devices that needs to be installed for this project.
The KVM Switch from TrippLite with the part number B020‐U08‐19‐K was used.
Required quantity was one for PCWA-MCF. The KVM switch was selected for this
project mainly because of the 1U rack-mount space. Even if more servers are to be added
to the facility later one, this KVM switch can support multiple computers to be connected
and used at one time. So, it greatly eliminates the need for multiple monitors in future as
well. It has 19" LCD screen, 8-ports, a HD15 port, a keyboard, and a touchpad comes
with (x8) 6 ft. It also comes with USB/PS2 combo KVM cable kits for better
compatibility with older technology. The combo cable kits allow the console to connect
to a USB or PS/2 computer without having to get separate cables or adapters.

40
One of the main reasons in selecting this KVM switch was its performance as
well as its ability to support high resolutions. It can handle video resolutions of up to
1280 x 1024. Another useful feature was having an additional USB 1.1 port for sharing
peripherals. With 8 ports, the switch would support multiple computer connections at one
time for a future use. It has easy switch ports using the on‐console push buttons, On
Screen Display (OSD) or keyboard hot key commands. The port on the back of the unit
provides an extra HD15, (2) USB and (2) PS/2 ports that can be used to connect a Tripp
Lite B051‐000 IP Remote Access Unit or an external console. Two USB ports are
provided on the front of the unit: One for attachment of a separate USB mouse, and the
other USB peripherals, such as a flash drive, external hard drive, etc. to be shared between
connected servers. If multiple servers are to be added/connected, P778‐006 USB/PS2
combo KVM cable kit is required for each.
Figure 14: TrippLite KVM Switch [13]
The switch is also compatible with all major operating systems and can control up
to 504 computers by daisy-chaining up to 31 additional B022‐U16 KVM switches. With

41
the switch, the daisy-chain station position is automatically sensed; which means no need
for manual DIP switch settings. It is constructed of heavy‐duty steel housing and it
should be durable for regular operation conditions. It is also firmware upgradeable which
is critical in keeping up with the ever-changing technology. The switch’s input power is
100‐240VAC, with 50/60Hz and 1A. The power consumption is 120V, 28.5W / 230V,
29.1W. Switching ports can be done easily via on‐console pushbuttons, hotkey keyboard
commands, or the OSD. Another useful feature is the auto scan feature that allows for
continuous scanning of connected computers. Two level password security was also set
up – one for the users and one for the Administrators. [13]

42
Chapter 4
SOFTWARE ANALYSIS
4.1 Monarch SCADA System
Supervisory Control and Data Acquisition (SCADA) which is the OSI-Monarch
based System at PGE-RIG-CC also needed to be modified to accommodate the new
functions required for the regulation business and the new RIGs. This could include
modifying the existing Monarch Screens as well as adding the new ones as applicable.
PCWA will work with PG&E for the Information and coordination needed for SCADA
modifications.
Following steps were taken in replacing the client station. The hostname of the
machine, as well as the initialization string were needed. To find the initialization string,
on the new workstation (assuming the osi tree has been move there), it was needed to run
the following command from a command prompt: “osi_license -n > filename.txt”. That
creates a file called filename.txt in the directory where the command was ran in. The
text file was sent to OSI. OSI then generated a new license key for that particular node.
For example, the hostname of the VM (the name used in the host file) is “pcwaxxxxx”
(IP: 10.xxx.x.xx). After getting the new license key file from OSI (filename.key), it was
put under osi_cust\sys\rc directory on the workstation, and then from a command prompt,
run: “osi_license –a”. It was also made sure that "License is valid” message was retured.
Client started fully working shortly after that.

43
Changes also needed to be made to the shift table for Database 42 (HMC). The
way the database was configured, the R-22 gauge was at Record 13 in the HMC_DATA
object. HMC component values are stored in a separate object called HMC_ENTRIES.
Inside the database via F5 editor, it shows that the R-22 gauge points have startRecord
"85839" and endRecord "86419". The startRecord and end Record values serve as
pointers to records in the HMC_ENTRIES object. In real terms, this means that data
entries for the R-22 gauge are held in these records and any table-lookup references that
are done on gauge R-22 use the entries in records 85839 to 86419. Height and capacity
fields in the HMC_ENTRIES object for these records needed to be modified.
A design to upgrade the existing Monarch SCADA system as well as to put in a
redundant server was proposed. The main concept was to upgrade the existing Monarch
Legacy system to Monarch.Net system with a Redundant server that could do auto fail-
over. Monarch.Net platform uses Microsoft .Net framework and it has more features and
more flexibility working with database management and system maintenance. In this
design, all the SCADA client nodes will also have to be upgraded physically because the
current hardware would not be able to support the much higher resolution of the new
graphic formats. Powerful graphic cards would be needed as well as a faster multi-core
processor.

44
Figure 15: Monarch SCADA Redundant Design

45
4.2 Remote Intelligent Gateway Database
RIG database is programmed into the RIG hardware (both primary and
secondary) using the CAISO point list and all port settings have been configured.
PCWA has prepared and built the new RIG database in coordination with CAISO. And
CAISO did their database update and has merged the new PCWA points into theirs at
the end of 2011. PG&E has been provided with the latest RIG database points that are
already in the CAISO database. PG&E is then to add the new points that are not in the
existing PG&E database yet into the database at PGE-RIG-CC. The new points mainly
come from the Coordinated Control System that PCWA has just put in and is yet to be
fully deployed. These points need to be in PG&E SCADA by the time regulation
scheduling starts.
GROSS MEGAWATTS
GROSS MEGAVARS
POINT OF DELIVERY MEGAWATTS
POINT OF DELIVERY MEGAVARS
PORJECT AGC HIGH OPERATING LIMIT
PROJECT AGC LOW OPERATING LIMIT
GENERATOR TERMINAL VOLTAGE
The RTRIG software runs on the new RIGs, the industrial Intel based server
platform. Data could use serial copper connections with DNP or Modbus protocol. In
this project, DNP 3 was used. PCWA also provided the communication connections to

46
outside parties. Data from the meter can be serial or network connection (IP based
for Modbus, DNP) for RIG connection depending on the port types on the meter. The
new meters that PCWA has put in (Landis + Gyr E850 Elite Model) to replace the old
ones have the ability for both.
4.3 PI Historian
Following steps were taken in connecting Pi-Clients to the Pi-Server. The
TCP/UDP port number for PI-Clients to talk to Pi-Database via firewall is necessary.
While trying to set up a few Pi-Client machines and, it is necessary to know which port to
open up so that it could talk to Pi-Database server through firewall. The PI Server listens
on port 5450. At command line, enter: “dbdump 39 > filename.csv” (DB 39 is the pi_dac
database and this will export pi_dac.db file to a csv).
Figure 16: PI SDK – Modules to Install

47
Figure 17: PI SDK – Directory to Install
Figure 18: PI SDK – Server Connection Configuration
OSISoft manual for PI configuration specifies that Port number ‘5450’ be used to
have PI clients communicate with the server through firewalls. The connection could be
set up as one-way read only for regular users and two-ways read and write for

48
administrators. Only the PI clients initiate the TCP connections to the server and the
server itself does not initiate anything connection to the clients.
Figure 19: PI SDK – Install Successful
4.3.1 Authentication
In addition to using the specific ports for authentication, other features
such as ‘name resolution’ (via NetBIOS, DNS or using the host file) and ‘trusts’
are also used. Setting up trusts makes sure that only the pre-specified and
authorized machine(s) can communicate with the server. It is necessary to run
services that need to ask for data from the server. The clients were then added to
the sonic firewalls for authentication. For PI clients that are virtual machines with
IPs as NAT (Network Address Translation) format, the NAT’ed IP was the one
that PI server sees, and not the actual IP of the host machine. PI also allowed
windows authentication for PI SDK connections. This adds additional security in

49
authenticating client nodes. However, this was applicable only when both PI
server and the clients are in the same domain. Several different trusts were
created mainly to separate PI API and PI SDK connections. PI Server logs were
analyzed after having the Port 5450 opened.
Figure 20: PI SDK – Server Connection Configuration
Figure 21: PI SDK – Connection Successful

50
Figure 22: PI DataLink Setup- Screen1
Figure 23: PI DataLink Setup- Screen2

51
4.3.2 Other Connections
For Synchronizing clocks, it is recommended that PI Server clock is synced with a
NTP (Network Time Protocol) server using Port 123. For complicated calculations, PI
ACE (Advanced Calculation Engine) , one of the advanced features in PI that handles
complicated calculations use ports 5456, or 5480-5490. PI SMT (System Management
Tool) was used to do administration of the server and the database. For other remote
administration options, As OSISoft recommends, following ports were designated for
connection between clients and the server.
Windows Remote desktop: Port 3389
PCAnywhere: Port 5631
VNC: Port 5900
HTML outbound connections: Port 80
PI SNMP: Port 161
4.4 Web Implementation of SCADA Data
Another aspect in modifying and upgrading the existing SCADA system also
included implementation of OSISoft PI Historian Web and Intranet Interfaces in such a way
that data from PI and SCADA is accessible not only on PI Thick and Thin Client machines,
but also on intranet for Agency use as well as on internet for public use. PCWA installed PI
not long ago and it is still at the initial stage of making it accessible at a wider scale.

52
Figure 24: PI Web Implementation Design Layout

53
Currently, the PI Server has been set up as two different VMs; PI-Database and the
PI-Analytics. The PI-Archiver is installed on OSI Monarch SCADA Server archiving data at
specified intervals depending on the importance level of the particular tag. The needs and
the intended use of the users vary from Department to Department; as well as from Inside
to outside of the agency. Power Division will be one of the main users of the PI and
SCADA Data. Currently, Power Operators use OSI Monarch Legacy System with
SCADA Thick Clients at the main Foresthill office and at the Powerhouses. PI Clients
have been set up for each location; with PI ProcessBook and PI DataLink installed and
set up for 32-bit and 64- bit machines.
4.4.1 Using PI WebParts
PI WebParts is one of the applications that can be used to feed PI data to the web.
The drawback about PI WebParts is that it works with Microsfot Sharepoint and
Sharepoint alone; nothing else; no ASP.Net, no PHP, no Java, etc. Depending on the
version of WebParts, its compatibility with the Sharepoint itself also needs to be analyzed
before any implementation. Following discusses the compatibility between different
versions of Microsoft SharePoint and different Web Browsers, in regards to PI use. On
the other hand, PI-WebParts is useful in such a way that .svg files from PI-ProcessBook
can be embedded and displayed rather than having to be recreated all over again.
Browser Support Matrix: SharePoint vs. Different Browsers [20]
• Safari iOS6 is not officially supported, but has gone through limited burn
tests.

54
• Chrome and Firefox on SharePoint 2013 does not support client side connections.
• IE9 and higher on SharePoint 2013 experiences a memory leak when
using PI Trend.
Figure 26: PI WebParts Screen – Graphical SVG Display 1 [20]
Figure 25: PI WebParts Screen - Trends [20]
55
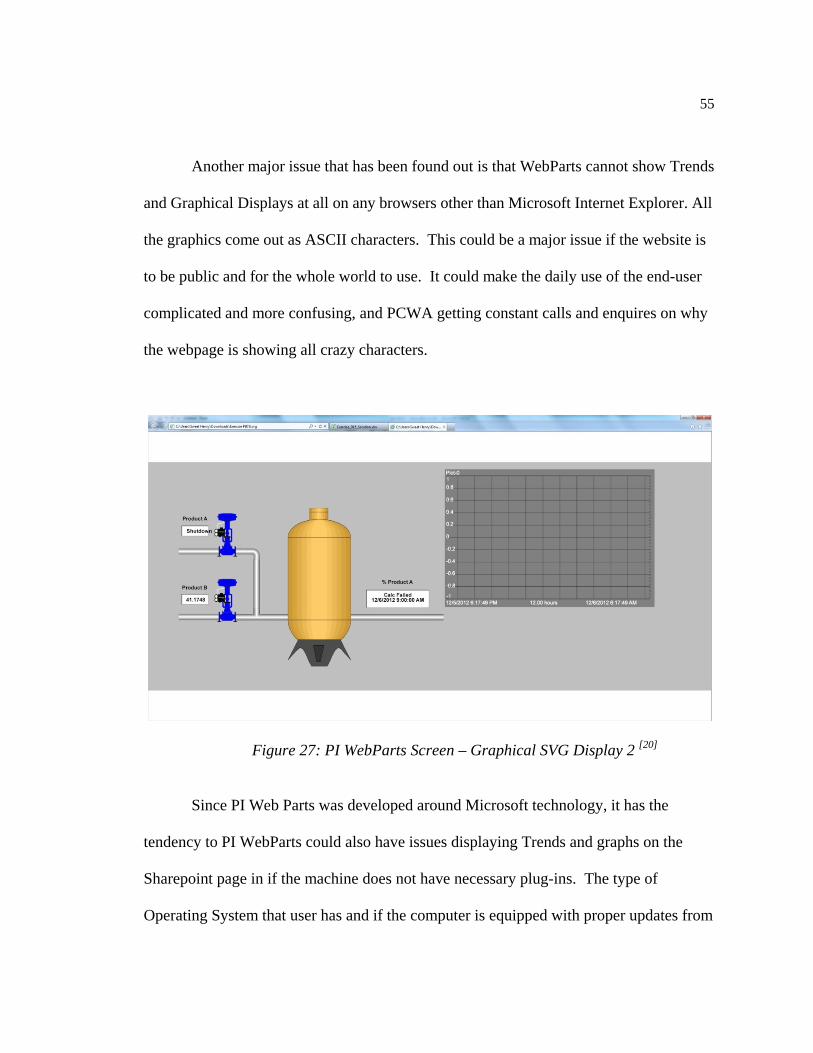
Another major issue that has been found out is that WebParts cannot show Trends
and Graphical Displays at all on any browsers other than Microsoft Internet Explorer. All
the graphics come out as ASCII characters. This could be a major issue if the website is
to be public and for the whole world to use. It could make the daily use of the end-user
complicated and more confusing, and PCWA getting constant calls and enquires on why
the webpage is showing all crazy characters.
Figure 27: PI WebParts Screen – Graphical SVG Display 2 [20]
Since PI Web Parts was developed around Microsoft technology, it has the
tendency to PI WebParts could also have issues displaying Trends and graphs on the
Sharepoint page in if the machine does not have necessary plug-ins. The type of
Operating System that user has and if the computer is equipped with proper updates from

56
Microsoft (if a Windows machine) could play a factor in having things appear properly.
If it is the plug-in issue, missing files could be downloaded from the vendor’s website.
Also, PI-DataLink features can be used and the data can be imported to a Spreadsheet
format. Using PI Data on a Sharepoint environment also has other added advantages such
as file sharing, Active Directory login for individuals, file check-in and out, individual
web page creations, file archiving and using knowledge-based portals.
4.4.2 Using PI Coresight
Another product that OSISoft has to interface with PI is called PI Coresight. The
main difference between PI WebParts and PI Coresight is that PI Coresight is not
SharePoint dependent. It will work with any browser; FireFox, Safari, Google Chrome,
or Internet Explorer. Coresight is very unique in such a way that it lets the user create
items on the Webpage on the fly. Its drag-and-drop feature makes the data analysis more
dynamic. And also, it has a GUI more appealing to the user. However, the ‘on-the-fly’
feature comes with the added complexity in such a way that all the buttons and icons
could be confusing for some users, and some might find it overwhelming if all they need
is a simple data set. For the outside users on the World Wide Web, PI Coresight might
not be an appropriate tool since all they need would be to see some basis trends and
tables. Coresight pages could be set up as “Kiosk” which hides the navigation buttons for
the outside user, if desired. However, this would not be beneficial much since the user
can manipulate the Kiosk link by modifying the site URL.

57
Figure 28: PI Coresight Screen – Main Page with Multiple Subscreens [21]
4.4.3 Using OLEDB
If the decision of which web implementation to choose has something to do with
feeding PI Data to a website other than a Sharepoint, using OLEDB (Object Linking and
Embedding Database) might be another option. It is to use the PI-WebServices package
with SQL and to feed data into any website of choice. The advantage is that it would not
be programming language or environment dependent; PI Data could be fed to a site with
any language; Java, .Net, PHP, etc. This is good for a situation if all we need to have is a
tabular format of the data on a pge. However, the major issue could be displaying Trends
and Graphics since another interface tool might be required to have them display
properly.

58
4.4.4 Using AF and ACE
PI Asset Framework is a very useful tool for PI Content Management. It allows
assets to be created and calculations to be done in a centralized location interfacing with
PI. PCWA currently has AF structure started and intend to use it for various applications.
PI-ACE is the Advanced Calculation Engine that lets the complicated calculations to be
done using PI Data. PCWA might be interested in using PI-ACE for complicated and
more advanced calculations.
Figure 29: PI Asset Framework (AF) Installation
4.4.5 Other Options
Other possible options could be to acquire the PI-SDK (Software Development
Kit) and to rewrite our own interface tool from scratch to feed data to the web. However,
OSISoft notified us that it would void any warranty and tech support from OSISoft once

59
the changes are made to the SDK. This could also be the most time consuming and least
desirable option due to the unknown outcome with length development time and possible
obstacles in programming.
4.5 Virtual RTU
VRTU was needed for the new RIG to communicate with SCADA. Being two
new RIGs (Remote Intelligent Gateway) added at PCWA-MCF, they are to communicate
with the SCADA server and then to CAISO through ECN network. RIG is then to have
a database with the points to talk to SCADA. A Virtual RTU in SCADA is needed to get
the address list for the RIG. Multiple new screens were developed and added to the
existing Monarch SCADA system for controlling, monitoring and maintaining the
Virtual RTU.
VRTU submenus can be navigated from the VRTU Menu screen with 14 buttons
naming: Channel Configuration, Channel Detail, Channel Statistics, Channel Summary,
RTU Configuration, RTU Detail, RTU Statistics, RTU Summary, Point Configuration,
Point Detail, Point Summary, Scan Class Configuration and System Configuration
screens. The screens and the changes made to the SCADA server were also rolled out to
all the client nodes upon successful system built. Being the Monarch Legacy system in
contrast to the new Monarch .Net platform, the system roll-outs could not be done
automatically from the server to the clients. Followings are the some of the VRTU
screens configured and added to SCADA.

60
Figure 30: Virtual RTU Screen 1 – Main Menu
Figure 31: Virtual RTU Screen 2 – System Parameters

61
Figure 32: Virtual RTU Screen 3 – Channel Detail
Figure 33: Virtual RTU Screen 4 – RTU Statistics

62
Figure 34: Virtual RTU Screen 5 – Datalink Statistics
Figure 35: Virtual RTU Screen 6 – Channel Statistics

63
Figure 36: Virtual RTU Screen 7 – Scan Class Configuration
Figure 27: Virtual RTU Screen 8 - Point Detail

64
Following outlines the steps taken on this project to add a Virtual RTU to OSI Monarch
SCADA system.
1. As the first step, a backup of the current VRTU database was saved to the server,
in case for some reason the changes need to be reverted back.
2. Then, the database was dumped out to a .dat file and saved on a separate drive. If
there is any issue adding the new RTU, a simple populate the .dat file that had
been saved would be all that is needed in order to run a build to get back to
normal.
3. Secondly, it is recommended that a test system such as PDS or QAS be used to
always test adding the RTU there first and then copying the change to production.
However, since there was no test system, the best option was to have a plan to 'go
back' to the current database if necessary, which includes having the database
backup described above.
4. As far as adding the new RTU, it was recommended to follow the RTU
Configuration portion of the VRTU Configuration Guide (chapter 5).[19] Once the
guide had been followed and all of the parameters had been added, the next step
was to run a build. The build validates the entire new configuration. This should
not cause a critical because it would validate the new configuration and should
not change what is currently running. Either way, this is the step where it is nice
to have a backup in case there were any issues.

65
Figure 38: Virtual RTU Screen 9 – RTU Summary
Figure 39: Virtual RTU Screen 10 – Scale Factor Setup

66
Figure 40: Virtual RTU Screen 11 – Point Summary
Figure 41: Virtual RTU Screen 12 – Point Creation1

67
Figure 42: Virtual RTU Screen 13 – Point Creation2
Step-by-Step Details:
5. Unzipping the product on both DAC servers
a. Copied the product to the D:\osi\products directory
b. Opened a command prompt and navigate to the D:\osi\monarch directory
c. Ran “unzip ..\products\vrtu_v1.8.3_bv8.2.8p05_2003.zip”
6. Configuring CONFIG database on DAC servers
a. Went to the Database Configuration display in Openview
b. Configured database 51 identical to the SCADA database (10), except the
Database name should be VRTU.
i. NOTE: need to turn the failover flag OFF to change the “Current
Status” column. Need to make sure to change it back to its original
settings.

68
c. Went to the Database Snap display, record 51 (VRTU)
i. Set the Online->Backup and Shared Memory->Disk times to 120s.
7. Configuring CONFIG database on other all other servers and workstations
a. Went to the Database Configuration display in Openview
b. Configured database 51 identical to the SCADA database (10), except the
Database name should be VRTU.
8. Configuring DOMAIN database
a. Went to the Administration Menu -> Domain Configuration display
b. Configured database 51 identical to the SCADA database (10), except the
Database name should be VRTU.
9. Schema VRTU database on online DAC server
a. Opened a command prompt on the online DAC server
b. Went to the D:\osi\monarch\db directory
c. Ran “schema VRTU.SKM”
10. Adding processes to Process Monitor
a. Went to the Administration Menu -> Process Monitor Configuration
display
b. Found the next available blank record
c. Filled in the record with the following:
i. Process Name: vrtu_server
ii. Database: 51 (VRTU)
iii. Timeout: 120

69
iv. Enable Online: ON
v. Enable Backup: ON
vi. Action Taken: Alarm and Restart ON
vii. Command Line Parameters: “-c 1”
11. Adding processes to osi_autostart and osi_shutdown on both DAC servers
a. Added the vrtu_server process to the
D:\osi\osi_cust\scripts\osi_autostart.bat file
i. set list=%list% "vrtu_server,VRTU Server,start /B,-c 1"
b. Added the vrtu_server process to the
D:\osi\osi_cust\scripts\osi_shutdown.bat file
i. set list="vrtu_server,VRTU Server,kill" %list%
12. Populating VRTU states
a. From a command prompt on the online DAC server, ran the following:
i. populate D:\osi\monarch\data\vrtu_states.dat
13. Configured VRTU as described in the VRTU Configuration Guide

70
Figure 43: Virtual RTU Screen 14 – Channel Summary
Figure 44: Virtual RTU Screen 15 – Channel Configuration

71
Figure 45: Virtual RTU Screen 16 – Point Configuration1
14. Figure 46: Virtual RTU Screen 17 – Point Configuration2

72
Chapter 5
NETWORK AND SECURITY ANALYSIS
5.1 Communication Protocols
After analyzing the existing and new networking and communication
infrastructures, DNP3 protocol was found to be the most applicable for the plant DCS
or RTU/PLC to the RIG. It is also because the PG&E SCADA server is to be connected
as a RTU. If a different protocol other than DNP3 is to be used for a specific
reason, PG&E would have to coordinate breaker status, ready to start, and control
points. These points are specific to PCWA site and developed by CAISO. PCWA will
provide these points to the RIG via serial or IP connections. Data points are acquired
from the DCS or plant control, meters, breakers, or other IEDs over either a TCP/IP or
other communication methods.
5.2 Sonic Firewalls and VPN
PCWA assisted PG&E in Communication cabling to the RIG, meters,
router, and plant control DCS/RTU/PLC which is coming to PCWA-MCF. and other
demarcations at PCWA facilities. PCWA will also provide the LAN/WAN CAT‐5
connection from the RIG o r the routers as necessary. Local meter cabling to/from
the meters is done inside the CAISO Metering cabinets by a CAISO certified Meter
Specialist. Communication Install at PG&E facilities is to be done by PG&E personnel

73
and the installs between PCWA and PG&E is to be coordinated by both.
For working with VPN (Virtual Private Network) management and configuration,
Secure CRT software was used to connect to the switches via SSH. (SSH = Secure Shell;
you could also use PuTTy for SSH). SecureCRT + SecureFX – for Windows OS, with
1 year update - $125 for each license was needed. An account to connect to was
configured and the “Connect” button was clicked. When the “New Host Key” message
appeared, it was accepted. If the machine has been set up as an authorized machine to
talk to that switch, Login box will come up. If not, nothing will appear. User would not
even be able to log in.
Figure 47: SecureCRT – Port Troubleshooting

74
Following discusses how to connect to SQL Server. First, “VMWare Sphere
Client” was ran and connected to 10.xxx.x.xx (Physical Server for multiple servers).
Upon log in, there will be multiple VMs displayed on the main menu. SQL server is
called “PCWA Power SCADA”. It is a Linux based Ubuntu machine. Sharepoint server
is also in there. (Note: The SQL Server VM address is “10.xxx.x.xx”. But, for
VMWare vSphere, it is necessary to use the actual computer address 10.xxx.x.xx). To
do MySQL ODBC install and SCADA Spreadsheet useage, followings are the steps:
Step 1. Installed the MySQL ODBC driver on the workstation. This driver is
available from the MySQL website.
Figure 48: SecureCRT – Traffic Monitoring

75
Step 2. Since host files were used for all of the workstations, the following line
was added to the file: 10.xxx.x.xx HIST1 HIST1a
If the host files were not used, the IP address will have to be used in configuration
instead.
Step 3. Added ODBC System DSN.
Step 4. START->CONTROL PANEL->ADMINISTRATOR TOOLS->Data
Sources ODBC
5.3 Existing Bell 202 vs. New Myriad Modems
Existing modems were Bell202T with 1200bps speed. The main issue that
arose with these was that the speed was too slow for real-time data transfer. So,
replacing the Bell202 modems with the new ones of faster speed was necessary.
Raymar FlashPoll modems were selected mainly because they support multiple speed of
Figure 49: Secure CRT – Port Configuration

76
9600/4800 bps as well as the old Bell202T 0-1800 bps technology. By doing so, the
existing architecture did not have to be fully replaced.
Figure 50: Myriad Modem Rack – Front Figure 51: Myriad Modem Rack – Back
Figure 52: FlashPoll Standalone Modem Figure 53: FlashPoll Standalone Modem – Dip switches
Figure 54: FlashPoll Modem –
Cable for Connection

77
5.4 Power Line Carrier Technology
PCWA currently has Digital Power Line Carrier Multiplexing System between
some of the powerhouses with the available speed of 4800 baud per second for meter data
transfer. The device that is being used is RFL ‐9508D‐UCC for Digital PLC –
Multiplexing. Its main function is to extend a Wide‐Area‐Network to a remote location
via a power line with the output power of 50/100W‐PEP (Peak-Envelope-Power) and
20kHz to 500kHz frequency range. Frequency can be programmed to adjust within the
range with no need to make any field device changes. Voice and multiple channels of
data are combined over a PLC link using DSP and digital packetizing multiplexing.
Multiple T1 or E1 data ports with IP traffic are supported. The PLC interface device RFL
9508‐UCC can be accessed via RS‐232 interface or remotely with an optional Ethernet
access port. Items supported for network management are SNMP management via NMS
(Network Management System), Async console port via DB9 male connector auto‐
sensing DTE/DCE and also remote telnet access to command port.

78
Chapter 6
TESTING AND IMPLEMENTATION
6.1 Critical Action Items and Milestones
Following items are the critical tasks and milestones followed in this RIG
(Remote Intelligent Gateway) and Metering project according to California ISO
Association. These guidelines made sure the high visibility and attention from all parties
involved at each phase. These are to be fully completed by the contractual date when the
new legal contract between PCWA and PG&E starts taking affect. It is when the current
PG&E RIG is to be completed disconnected from CAISO ECN Network and the new
PCWA RIG is to be in fully control of the Power Generation Scheduling.
Table 7: Critical Action Items and Milestones [2]
No. Milestone Description
1. Telecom circuit
ordering
Telecom circuit requirements should be determined as
early in the process as possible. Circuits are to be ordered
through CAISO and its approved telecommunication
vendor. Installation of the RIG depends on circuit
availability for downloading of essential software and
configuration items. Testing of the RIG is also highly
dependent on completed telecom circuits.

79
2. High Voltage
Protection Analysis
At the same time as telecom circuits are ordered all high
voltage protection issues for the RIG and telecom circuits
location should be researched and scheduled. PCWA is
to do this according to CAISO guidelines.
3. Database Development PCWA is responsible for this. The internal configuration
of the RIG is highly dependent on the resolution of the
CAISO required points list and successful implementation
of the RIG database. The database is also required for
configuration of the ISO EMS system. The database in
conjunction with researching the plant equipment that the
RIG will be interfacing is a major determining factor on
the RIG configuration. Researching, engineering and
collecting this database require coordination with the
Generator, CAISO and Vendor. Successful database
collection and ISO approval is necessary before
procurement and installation of the RIG can continue.
4. Finalizing the RIG
Database
Once the data points from PCWA and the interface
requirements are determined; CAISO will examine the
data and specify a point list for implementation through
the RIG. This point list is based on the ISO required point
list for AGC control plus convenient data that the ISO

80
requires from the available plant data. A description of
the plant including data available and diagrams of the
plant control equipment is required by CAISO for this
purpose.
5. Protocol Analysis All the plant equipment that the RIG will be interfacing to
requires careful research to determine the protocols that
are necessary for the plant. This requires careful research
to determine a strategy for taking advantage of existing
equipment or upgrades to plant equipment. These defined
protocols for this interface to the plant are used to
determine the class of RIG necessary. Future issues
should also be considered. A careful examination of the
plant will allow leverage of the extensive capabilities of
the RIG.
6. RIG Ordering When placing an order for a RIG coordination with a
vendor is paramount as there is a manufacturing time
requirement.
7. CAISO plant
engineering approval
Coordination and communication with CAISO is critical
to insure that the ISO standards are met. An overall
proposal for a RIG installation is necessary for review by
ISO and subsequent approval or modification.

81
8. RIG Database
approval by CAISO
The data points to be used at PCWA’s AGC control must
be submitted to CAISO for approval along with specific
plant interface design criteria and diagrams. This requires
coordination with CAISO.
9. Test scheduling Both PCWA and CAISO are critical participants in the
testing of a RIG installation. Testing activities should be
coordinated and scheduled accordingly.
10. Certification by
CAISO
Before a RIG can be scheduled for Ancillary Services
CAISO requires a test to certify the plant and RIG
installation. This needs careful scheduling to determine
outages, unit tuning parameters, and optimal use of all
participants time. Certification testing of a RIG
installation is coordinated through CAISO Client
Services. Appropriate procedures are to be followed
scheduling a SLIC for the outage.
6.2 RIG Commissioning Checklist
Following items on this checklist were used throughout RIG installation
and commissioning and are implemented from CAISO guidelines to make sure
that all the CAISO requirements and standards are met.

82
Table 8: RIG Commission Checklist [2]
1.1 Site Introduction
No. Item Description1. ISO Site Visit (if needed)2. Establish Contact List
3. Determine ISO, Owner Representatives, Telecom and key plant
Personnel
4. Obtain addresses & contact numbers
5. Discuss RIG Architecture6. Define ISO Project Engineer role7. Discuss Security, VOIP, interface to revenue meters, etc. 8. Discuss Telecom requirements9. Identify Site PBX interface for VoIP10. Discuss ISO Required Points List11. Genpoints List.xls (for CAISO)
12. Discuss existing RTU(s), DCS(s) or other control and monitoring
equipment and method of interface.
13. Document each interface as to type, protocol, function
1.2 Telecom Survey
No. Item Description1. Schedule telco Pre‐Order for site2. Coordinate local telco representative on site
3. High Voltage Protection on telco circuits (ground rise potential
>600 ft)
4. Multi‐Plex GPS Antenna
1.3 Plant Walkdown
(To Note locations on drawing or sketch)
No. Item Description1. Locate Revenue Meters (if installed)2. Locate Revenue Meter Router (if installed)

83
3. Locate existing telecommunications circuit point of entry and
Equipment
cutover requirements11. Raw Power surge suppression12. Provide RIG Catalog13. Future control system upgrades.
1.4 Post‐Plant Walkdown
No. Item Description1. Roles and Responsibilities2. Reiterate ISO’s role3. Document all work participants and their responsibilities 4. Preliminary Schedule5. Establish milestones (if possible)6. Plant Documentation Request (availability)7. Block diagrams8. Data Flow sheets9. Water Shed Flow sheets10. Single Line Meter and Relay Diagram for Plant and Substation11. Plant plot plans12. Telecom room (or other) floor plan13. RTU, DCS, PLC communications diagrams/documentation
diagrams/documentation (if req’d)
14. Establish Meeting Documentation and Review of Minutes
1.5 Establish RIG Hardware Requirements
No. Item Description1. Finalize the required and desired points availability 2. Determine all interface requirements (RTU(s), EMS, DCS, Historians,
etc.)
3. Finalize power requirements and availability4. Determine need for cabinet UPS5. Determine power requirements for analog points (if req’d) 6. Determine wetting voltage requirements for discrete points (if req’d) 7. Generation owner to determine best cabinet design 8. Determine modem requirements (if necessary)

84
9. Determine need for 8550 Protocol Engine10. Owner determines the need for RTU replacement and phased
1.6 Establish RIG Database Requirements
No. Item Description1. Determine all interface requirements (RTU(s), EMS, DCS,
Historians, etc.)
2. Identify all protocols
‐ Currently available
3. Obtain existing Revenue Metering Documentation (if
applicable) 4. Obtain existing RTU/SCADA/DCS database listings (if available)5. ISO PE & EMS develop initial database with owners 6. Work with owner to fill in standard RIG Database Spreadsheet7. Identify Analog Inputs (eng. units, min./max. scales, resistors,
PT/CT ratios, etc) 8. Identify Analog Outputs (Analog Setpoints, etc.) 9. Identify Digital Inputs (Type, wetting voltage, etc.) 10. Identify Digital Outputs (Type, wetting voltage, relays, etc.) 11. Identify Pulse Width Outputs ( Pulse type, base time, base
multiplier, relays, etc)
12. Identify Accumulators (Type, etc.)13. DCS configuration for optimum AGC tuning parameters and ramp
rates.
14. Reactive curves for units15. EMS reviews and approves16. Send database to RIG vendor17. Work with RIG vendor to determine appropriate mapping for
each point
18. Finalize each port requirement (Type, protocol, etc.) 19. RIG Vendor returns project spreadsheet with mapping and
other comments 20. EMS and PE resolve spreadsheet21. Check final updates with owners and resolve with RIG Vendor

85
22. RIG Engineers sends final spreadsheet to RIG vendor for
production
1.7 RIG Procurement Assistance
No. Item Description1. ISO works with generator owner to establish final RIG hardware
requirements
2. Obtain agreement on RIG database
3. Owner sends database to RIG Vendor for review
4. Owner approves final database and RIG layout design from RIG
Vendor
5. ISO and Owner review RIG Vendor hardware design drawings6. Owner issues purchase order for equipment7. Check with Market Operations for required information in SA
Master File
1.8 Telecom Circuits
No. Item Description1. Provide Owner with Communications Subscriber Guide from IT
Telecommunications
2. Owner orders communication access circuits from AT&T
3. ISO/Owner/AT&T schedule installation (important to include
Owners IT group) 4. ISO/Owner/AT&T schedule testing/commissioning of communication
circuits
5. Owner extends communications circuits from MPOE to RIG
Location

86
1.9 Site Preparation
No. Item Description1. Owner and ISO PE establish site prep work plan 2. Owner designs and installs conduit and cabling where required
(power, communication, field I/O, etc)
3. Owner designs and installs foundation for RIG cabinet where
required
1.10 Factory Acceptance Testing
No. Item Description1. RIG ready for testing (IOC and PE configured), Identify test location
scenario, methods and participants with vendor.
(2 to 7 are not applicable)
8. Phone system connection to control room(s)9. Plant interface circuits connection (DCS, PLC, etc) 10. Owner to complete GPS installation11. Field I/O cable connections (if req’d – phased and/or parallel
circuit approach may be necessary)
12. Owner updates plant drawings13. Wiring diagrams14. Schematics15. Block diagrams
1.11 Site Installation
No. Item Description1. Owner completes RIG cabinet/rack installation2. Vendor completes power and grounding connection 3. Telecommunication Communication circuits connection 4. T1 circuit(s) connection5. ISDN circuit connection6. 1MB circuit connection7. Revenue Metering connection

87
1.12 Site Acceptance Testing
No. Item Description1. Owner and Vendor do preliminary testing of functionality and data
processing.
2. Schedule necessary outages with ISO Operations, Owner EMS’s, etc.
for any point to point testing involving the ISO EMS system.
3. Power up/down testing4. Telecom circuit testing5. T1 circuit(s), ISDN circuit, POTS circuits6. Revenue Meter Verification at Folsom (if req’d)7. Router communication testing8. GPS unit testing9. VOIP testing10. Security testing11. Cabinet sensors testing
12. Hardware Unit Authority Switch testing (if req’d) 13. End‐to‐end checkout of all points (Unit(s) offline) 14. End‐to‐end checkout of all points (Unit(s) online) 15. Site Acceptance Testing Reports
1.13 Site Certification Testing
No. Item Description1. AGC ramp rate testing from all EMS systems2. Data through put timing testing
3. Site Certification Test Report
1.14 Final Turnover Package
No. Item Description1. Final system database2. Protocol documents3. Cabinet layout drawings4. As‐built plant drawings (if req’d)5. Wiring diagrams6. Schematics7. Block diagrams

88
8. As‐built Telecom drawings/documents9. As‐built RIG room floor plan10. As‐built plot plan11. Test reports
1.15 ISO Master File Update
No. Item Description1. Update Master Files with all Documentation at CAISO Folsom
and Alhambra 2. Hardcopy Database Spreadsheet to files for doc on startup
Configuration
6.3 CAISO Revenue Meter Certification
After the final testing of the meters, all of them were found working and CAISO
was notified. The final .HHF files from the meters were downloaded and saved in the
archives on the server. Following is the summary on how the Primary, Backups and Aux
CAISO Meters have been set up. At PH3, software and hardware changes were also made
in additional to the new meter install and testing. “Pulse input cards” (2 in total) were
taken out from G1-Main, G1-Backup and G2-Main meters at PH3 Powerhouse. Acopian
Regulated Power Supply (1 in total) was put in at the same panel. Terminal Servers (4 in
total) were put in at the following powerhouses for real-time data transfer:
PH1 Powerhouse
PH2 Powerhouse
PH3 Powerhouse

89
PCWA-MCF.
The new CAISO meters at Ph3 were set up as follows. 6 Displays on the Meter, but
only 4 are applicable (to our specific type of meter)
Channel #1: Received KVARS (for G1)
Channel #2: Delivered KVARS (for G1)
Channel #3: Received KWatts (for G2)
Channel #4: Delivered KWatts (for G2)
G1-Aux and G2-Aux send their data to G2-Main (it is because G2-Main does not
have any compensation calculations in it)
G2-Main then sends its data to both G1-Main and G1-Backup
G1-Main is the actual Totalizer finalizing all the calculations.
Both G1-Backup and G1-Main data then go to PCWA-MCF via 9600bps Modem
(as Revenue Data).
Currently, only G1-Main is connected to the modem transferring both
main/backup data. (single point of failure)
Eventually, as the network upgrades are done, we intend to set up a separate
connection for the Backup Meter.
6.3.1 Before vs. Now
Before this project, CAISO had to read PH3 meters with 15 sec delays and
other occasional delays. It was slower than desired and might have problems with

90
regulation bidding after RIG switch over. It was found to be due to the Pulses in the
meter program. The slowness in speed was added to the already slow rate of the PH3
meters due to the calculations for 2 units (unlike other sites).
After the project, CAISO can read our MF real time meter data every 1 sec (15
times or more faster now than before). The calculation speed was substantially
increased between G1 and G2 meters.
6.3.2 Revenue vs. RealTime Speed
Realtime data is now at every 1 sec interval for CAISO. And Revenue data stays
at the same rate at every 5 minutes and gets downloaded every day at the end of the
day by CAISO. Terminal Servers needed for real-time meter data transfer of each
meter were put in at CAISO Meter cabinets. B&B VESR902D Terminal Servers (4
in Total) were programmed and installed at PH1, PH2, PH3 and at PCWA-MCF –
one each. PH4 and PH5 did not need it. Specific IPs were assigned for each
Terminal Servers. These Terminal Servers are needed for the Real-Time data
transfer to CAISO via MCF. All the meters in the panel have a connection to the
terminal block on the wall and then to the Terminal Server at each cabinet.
G1-Main, G1-Aux at PH1
G1-Main, G1-Backup, G1-Aux at PH2
G1-Main, G1-Backup, G2-Main, G1-Aux, G2-Aux at PH3
Pin connections are:

91
Connection end Going into Terminal Server ->
o Blue: #2, Blue/White: #3, Green: #5.
Going into the terminal block:
o Blue: #14, Blue/White: #16, Green: #25.

92
Chapter 7
PROBLEMS ENCOUNTERED
Several issues were encountered during the CAISO Meter work at the power
houses ranging from hardware issues such as CAISO meter and a SCADA client node
physically failing to software issues such as Monarch SCADA and PI having errors.
7.1 Revenue Meter Electrical Break-down
This is one of the major issues that occurred G1-Aux Meter at PH3 became non-
functional. It would not power-on at all. To make sure that it was not due to any wiring,
software or any other issues, measured the voltage on the meter socket (~123V). Spare
meter that we initially ordered for PH5 definitely saved us from a potential big trouble. It
was inside PH2 meter cabinet and we took it out to replace the faulted one at PH3. We
definitely should have another spare dedicated for emergency situations like this. I plan
to put in and order for one. Also, I am going to get the faulted one repaired (free-of-
charge) under manufacturer’s warranty. All the 5 meters at PH3 got the data downloaded
before any update was done. (G1-Main, G1-Backup, G2-Main, G1-Aux, G2-Aux). It
was found that having the pulses in the meter program was causing the 15sec and other
additional delays. To resolve the issue, the pulse logic from the program was removed.
Two Pulse Duplicators from the meter panel were also taken out as well as the Pulse
Input Cards from the Meters (G1-Main, G2-Main and G1-Backup). Acopian Regulated
Power Supply was installed after that.

93
7.2 PI SDK and DataLink Errors
There were more issues than expected in dealing with PI SDK and DataLink as
well.
There are 4 areas that were worked on:
Firewalls: Needed to set up trusts and access on multiple firewalls for each of the
user/client-node
On Pi Data Server: Needed to set up Pi-Trust for which exe and which services to
be allowed from each machine and from which account/login
On Pi-Analytical Server: Needed to configure required settings for each
Figure 55: PI DataLink Installation Error

94
On PI Client machine: Needed to install, set up and configure required SDKs and
files. Set up as Excel add-ons for better usability. Set up a data tunnel with
specific ports open.
Figure 56: PISDK Authentication Error
Figure 57: PI SDK Host Unknown Error
To solve the issue, following Software files were re-installed on PI Clients:
PI SDK x32 – 32bit - v1.3.8.388
.Net Framework 2.0/3.5 or higher
Microsoft XML (MSXML)
OSIsoft MS Runtime Redistributables x64
Microsoft Data Access (MDAC)
MS Office Primary Interop Assemblies (for 2010)
Visual Studio Tools
Shared Add-in Extensibility Update for .Net
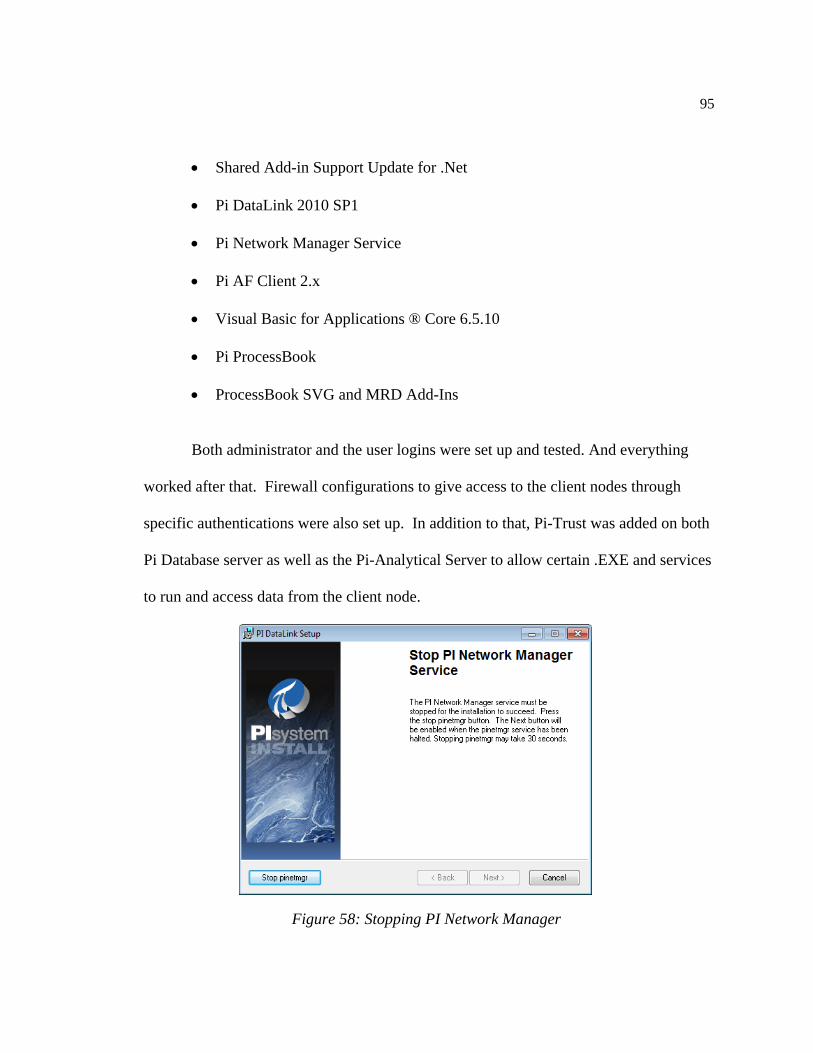
95
Shared Add-in Support Update for .Net
Pi DataLink 2010 SP1
Pi Network Manager Service
Pi AF Client 2.x
Visual Basic for Applications ® Core 6.5.10
Pi ProcessBook
ProcessBook SVG and MRD Add-Ins
Both administrator and the user logins were set up and tested. And everything
worked after that. Firewall configurations to give access to the client nodes through
specific authentications were also set up. In addition to that, Pi-Trust was added on both
Pi Database server as well as the Pi-Analytical Server to allow certain .EXE and services
to run and access data from the client node.
Figure 58: Stopping PI Network Manager

96
7.3 Monarch SCADA Errors
The main error received while working with Monarch SCADA was the message
saying "Unable to dbcopy CONFIG database: Error writing to temp file.” To resolve the
situation, the node was switched to local mode. After that, "Cannot open DB 33" also
appeared. Upon further troubleshooting, it was found that the errors were due to OS
settings and the MS Office settings on the machine. All the errors got resolved at the
end. The main problem was getting the “hist1 down error” on Monarch SCADA server.
While troubleshooting on Monarch server (10.xxx.x.xx), firsts it was tried to ping to SQL
server 10.xxx.x.xx and see if we could ping. Previously, we had not been able to ping.
So, the SQL server on vSphere was checked. The “migration task” was performed and
around that time the hist1 down error came up.
The Migration is the “HAA” function on the VM that was set up to do the
automatic re-allocation of the memory tasks on 4 different virtual CPUs. It does that
whenever it feels that it is necessary. For some reason, when it does that on SQL server
(vm), it seems to break the connection to the power network which causes the “server
down” errors on monarch. As a solution, settings on vSphere were changed to disable
this HAA feature. To see what could be done to exclude this SQL vm from this task. For
now, the setting seems to be “All VMs” or “No VM”. Excluding some VM might not be
possible. It was needed to investigate further. As a follow-up to the issue, the next
attempt was to ping again from Monarch (10.1xx.x.xx) to SQL 10.1xx.x.xx and see if
ping is successful at this time.

97
The issue was found and fixed after several attempts. It was because there was a
mismatch in the virtual switches that did not allow for the IP's to pass. Only the MAC's
were identified at the other hosts. VMOTION's are testing with success. There were
multiple Vswitches on each ESX host. Each of the switches has a trunked connection
back to the HP 5800's. Prior to implementing the switches it was configured based on
routing by virtual port ID. It needed to be modified to be based on IP hash for the 5800's.
After making those changes, vmotions began to work correctly.

98
Chapter 8
CONCLUSION
In conclusion, this paper covers different aspects of the research done in hardware,
software, networking, communications, security and web applications working with
Monarch SCADA system, OSISoft PI Historian, PI Webparts, PI Coresight, Microsoft
Sharepoint, SQL, SecureCRT/SecureFX, Power Line Carrier (PLC), and Remote
Intelligent Gateway (RIG) systems. The paper also describes all the user requirements
and businesses needs to use PI Data as a wider scale without comprising the security and
scalability as a whole. It also covers technical analysis and system modifications that
need to be done to implement PI data on the Web (both internet and intranet) of PCWA.
Modifying and maintaining the system will be done along the way as the technology
evolves over time and as the project evolves into different phases.
The paper does not intend to provide any specific information on any particular
system or application. Due to proprietary restrictions of the software/hardware vendors as
well as the agencies and companies involved, all the proprietary information have been
carefully taken out, replaced with generic information/diagrams or marked up accordingly.
It is merely a sincere intention of the author to make this document a helpful
resource/reference for anyone working with the similar technologies or situations, since
the whole process took the author a significant amount of time and effort to be able to
gather, analyze and imply the knowledge for each item involved.

99
REFERENCES
1. California Independent System Operators. CAISO Metering Telemetry Guidelines.
http://www.caiso.com/market/Pages/MeteringTelemetry/Default.aspx
2. California Independent System Operators. RIG Acceptance Test (RAT) Procedures.
http://www.caiso.com/Documents/RIGAcceptanceTest_RAT_Procedures.pdf
3. North America Electric Reliability Corporation (NERC). Telecommunication Standards
(COM-001-1.1). http://www.nerc.com/files/COM-001-1_1.pdf
4. North America Electric Reliability Corporation (NERC). Communication and
Coordination Standards (COM-002-2a). http://www.nerc.com/files/COM-002-2a.pdf
5. AdvanTech, UNO-4672 Remote Intelligent Gateway (RIG) Datasheet
http://downloadt.advantech.com/ProductFile/Downloadfile3/1-31ZQR3/UNO-
4672_DS.pdf
6. BB-Electric Inc. FOSTCDRI-PH-SC ILinx Hardened Serial Converters and Isolated
Repeaters (Fiber Optic Media Converter, RS-232/422/435 to Fiber), Single Mode with SC
Fiber Connector.
http://www.bb-elec.com/product11.asp?sku=FOSTCDRI-PH-SC http://www.bb-
elec.com/product11.asp?sku=FOSTCDRI-PH-SC
http://www.bb-elec.com/bb-elec/literature/documentation/datasheets/FOSTCDRI-PH-xx-
0812ds.pdf
http://www.bb-elec.com/bb-elec/literature/documentation/quick-start-guides/pn8933R1-
FOSTCDRI-PH-xx-0812qsg.pdf

100
7. BB-Electric Inc. 9PMDS RS-232 Modem Splitter.
http://www.bb-elec.com/bb-elec/literature/documentation/datasheets/pn9149_9PMDS-
0812ds.pdf
http://www.bb-elec.com/product11.asp?sku=9PMDS
8. BB-Electric Inc. VESR902D Terminal Server Datasheets and Manuals
http://www.bb-elec.com/Products/Datasheets/VESR9xx-0712ds.pdf
http://www.bb-elec.com/Products/Quick-Start-Guides/pn8096R003-VESR9xx-
0712qsg.pdf
http://www.bb-elec.com/Products/Manuals/VESR9xx_R003_0413m.pdf
9. Raymar Inc. Myriad 18-Slot Modem Rack Datasheets and Installation Guide
http://www.raymarinc.com/manufactured-products/Telenetics_Myriad.html
http://raymarinc.com/Doc_Control/0049_MANUAL/Telenetics/Active/0049-003-
001C_MDR_Myriad_Install_Guide.pdf
10. Raymar Inc. Raymar Modems Technical Documents.
http://www.raymarinc.com/downloads.php#tel
http://www.raymarinc.com/manufactured-products/manuMain.shtml
http://www.raymarinc.com/manufactured-products/Myriad.shtml
11. Raymar Inc. MD9612FP Rack Mount Modem 1200/4800/9600 bps Manuals.
http://www.raymarinc.com/Doc_Control/0049_MANUAL/Telenetics/Active/0049-0519-
000_D_DSP9612RM_USERS_GUIDE.pdf
http://www.raymarinc.com/Doc_Control/0070_SALES_MARKETING/Telenetics/Active/
0070-0117-001_A_DSP_MOUNTING_OPTIONS.pdf

101
12. Raymar Inc. DSP9612 Stand-alone Modem 1200/4800/9600 bps User Manual.
http://www.raymarinc.com/Doc_Control/0070_SALES_MARKETING/Telenetics/Active/
0070-0117-000_B_DSP9612.pdf
DSP9612 Stand-alone Modem 1200/4800/9600 bps User Guide.
http://www.raymarinc.com/Doc_Control/0049_MANUAL/Telenetics/Active/0049-0117-
100_F1_DSP9612_USERS_GUIDE.pdf
13. DCBNet Inc. DCBNet SR04 Statistical Multiplexer Datasheet.
http://www.dcbnet.com/datasheet/sr4ds.html
14. TrippLite Inc. B020-U08-19-K TrippLite KVM Switch.
http://www.tripplite.com/en/products/model.cfm?txtModelID=4351
15. DC Systems Inc. Notes provided by DC Systems Inc. http://www.dcsystems.com/
16. Patton Inc. Patton 2157 Ethernet Extender Datasheet.
http://patton.com/products/product_detail.asp?id=160
17. Landis+Gyr. E850 MAXsys Elite Landis+Gyr Revenue Meter Data Sheet.
http://style.landisgyr.com/apps/products/data/pdf1/Maxsys_ProductSheet_W.pdf
18. Landis+Gyr. E850 MAXsys Elite Landis+Gyr Revenue Meter Product Details.
http://www.landisgyr.com/na/en/pub/products_na.cfm?eventProducts=products.ProductDe
tails&ID=249&catID=84
19. Landis+Gyr. Event Monitoring Software (EVM).
http://style.landisgyr.com/apps/products/data/pdf1/onlinepowerquality.pdf
20. OSISoft Inc. PI Knowledge Portal and Technical Support documents,
http://techsupport.osisoft.com/NR/exeres/3856FC8A-DCEA-46B5-A59B-93F007502E50

102
21. OSISoft Inc. PI WebParts Technical document,
http://www.osisoft.com/software-support/products/PI_WebParts.aspx
22. OSISoft Inc. PI Coresights Technical document,
http://picoresight.osisoft.com/
http://techsupport.osisoft.com/Products/Client+Products/PI+Coresight/PI+Coresight+Ho
me.htm
23. OSI-Monarch Inc. (Multi-platform Open Network Architecture) datasheets
http://www.osii.com/pdf/platforms/monarch_PS.pdf
24. OSI-Monarch Inc., Technical Support documents and notes
https://support.osii.com/
25. Vandyke Inc. SecureCRT and Secure FX Manuals,
http://www.vandyke.com/pricing/corporate/index.html
26. Press Release: PCWA, PCWA Authorizes Execution of Power Purchase Agreement with
PG&E, April 20th, 2012 http://www.pcwa.net/files/News_Releases/2012/04-20-
2012_PCWA_Authorizes_Execution_of_Power_Purchase_Agreement_with_PG&E.pdf
27. Press Release: Rocklin Today, PCWA will market its hydroelectric energy to PG&E,
under a power purchase agreement authorized for execution, April 19, 2012.
http://www.rocklintoday.com/news/templates/community_news.asp?articleid=10652&zo
neid=4

103
28. Press Release: Environmental Advocates on behalf of the Foothills Water Network,
Contractual Relationships between PG&E, NID and PCWA, by Megan Anderson,
December 7, 2005.
http://www.foothillswaternetwork.org/rights/Contractual%20Relationship%20PGE,%20
NID,%20PCWA%20122106.pdf
29. Press Release: County Executive Office, County of Placer, PCWA/PG&E PH5 Power
Sale Contract, July 21, 2011
http://www.placer.ca.gov/upload/bos/cob/documents/sumarchv/2011Archive/110712A/b
osd_110712_23c__p401_p414.pdf
30. Press Release: United States Federal Energy Regulatory Commission (FERC), Placer
County Water Agency Project No. P-2079-072 Order Granting Approval under Section
22 of the Federal Power Act, February 21, 2013. http://www.ferc.gov/whats-new/comm-
meet/2013/022113/H-3.pdf
Copyright © 2022 FDOKUMEN