Single vs multiple poverty trap
25
1 23 Social Indicators Research An International and Interdisciplinary Journal for Quality-of-Life Measurement ISSN 0303-8300 Soc Indic Res DOI 10.1007/s11205-014-0586-x Identifying Single or Multiple Poverty Trap: An Application to Indian Household Panel Data Swati Dutta
Transcript of Single vs multiple poverty trap

1 23
Social Indicators ResearchAn International and InterdisciplinaryJournal for Quality-of-Life Measurement ISSN 0303-8300 Soc Indic ResDOI 10.1007/s11205-014-0586-x
Identifying Single or Multiple Poverty Trap:An Application to Indian Household PanelData
Swati Dutta

1 23
Your article is protected by copyright and all
rights are held exclusively by Springer Science
+Business Media Dordrecht. This e-offprint
is for personal use only and shall not be self-
archived in electronic repositories. If you wish
to self-archive your article, please use the
accepted manuscript version for posting on
your own website. You may further deposit
the accepted manuscript version in any
repository, provided it is only made publicly
available 12 months after official publication
or later and provided acknowledgement is
given to the original source of publication
and a link is inserted to the published article
on Springer's website. The link must be
accompanied by the following text: "The final
publication is available at link.springer.com”.

Identifying Single or Multiple Poverty Trap:An Application to Indian Household Panel Data
Swati Dutta
Accepted: 16 February 2014� Springer Science+Business Media Dordrecht 2014
Abstract The paper examines the household asset dynamics in India as well as Indian rural
States. The paper contributes to the empirical analysis of poverty trap by investigating the
presence of one potential poverty trap to simultaneous poverty trap. The paper uses the India
Human Development Survey for the year 1993 and 2005. We use the local polynomial regression
with Epanechnikov kernel weights to test the existence of multiple or single equilibrium in asset
poverty dynamics. Moreover, we use the partial linear mixed model to test the impact of illiteracy
trap and under-nutrition trap on asset dynamics process. Across all the States we find only single
dynamic asset equilibrium for rural households. However the nature of the asset dynamics varies
from one state to another. We find that, in most of the States, asset accumulation does not take
place and welfare dynamics is very poor in rural areas. Further, we find under-nutrition trap
uniformly affect the asset accumulation in most of the States. However an illiteracy trap affects
the asset level heterogeneously over the income and regional distribution. We find the most
deprived States (Bihar, Uttar Pradesh, Orissa and Madhya Pradesh) have the multiple poverty
trap compared to richer States. Our result implies that asset dynamics of the household varies in
the long term according to the types of traps. Government and policy makers should take pointed
policy and programme based on whether the poor are trapped and in what ways.
Keywords Poverty trap � Multiple equilibrium � Illiteracy � Under-nutrition � Asset
dynamics � Multidimensional poverty � India
1 Introduction
The distinction between chronic and transient poverty1 is now recognized in discussions on
poverty in the Indian context, although estimates of the incidence of these two types of
S. Dutta (&)Institute for Financial Management and Research, Chennai, Indiae-mail: [email protected]; [email protected]
1 When households are always poor we referred as ‘‘chronic poor’’ and when households are sometimespoor we referred as ‘‘transient poor’’.
123
Soc Indic ResDOI 10.1007/s11205-014-0586-x
Author's personal copy

poverty are not common. Studies of poverty have generally focused on the state of being
poor, rather than on the ‘dynamics of poverty’—movement into and out of poverty and the
processes and factors that determine this. According to planning commission estimates of
poverty, in India rural poverty was 50, 42 and 33 % in 1993–1994, 2004–2005 and
2009–2010 respectively (Planning Commission 2009–2010). However these figures do not
tell us anything about the causes of long term persistence poverty. The purpose of this
study is to analysis the poverty dynamics in rural India and to determine why certain
households are more likely than others to remain poor in the long run. In this study we
focus on household assets, rather than consumption or income which has the stochastic
component. The noise from the stochastic part of the income may generate false positives
and false negatives regarding the incidence of chronic poverty and poverty traps (Barrett
et al. 2006). The phenomenon of chronic poverty can be analyzed by examining the nature
of poverty traps. The analysis of poverty trap helps us to understand the causes of persistent
poverty in a long term.
The poverty trap is defined as a situation in which poverty has effects which act as
causes of poverty. There are thus vicious circles, processes of circular and cumulative
causation, in which poverty outcomes reinforce themselves. Moreover, this gives the idea
of a vicious circle of poverty as a ‘‘constellation of forces tending to act and react upon one
another in such a way as to keep a poor country in a state of poverty’’ (Nurkse 1953).
Recent literature has mainly studied the poverty trap to determine the presence of
multiple equilibriums, which provides an opportunity to implement policies to push an
economy into a self sustaining higher equilibrium (Carter and Barrett 2006). Dynami-
cally, it is possible that a section of households remain persistently poor or in poverty
trap because of shortfall in minimum required assets. It is also possible to identify such
asset poor households who have sufficient asset base to move out of poverty, within some
time through self-motivated strategies. Dynamic asset poverty measure draws a line
(known as Micawber threshold) between those structural poor who are likely to persist in
poverty trap and those who can, through various economic strategies, become asset non-
poor in future. The ones who are in the poverty trap need a big push to move out of it
because they lack relevant assets to even feel motivated to adopt to the strategies that
will bring them out of this poverty trap. Those who are in poverty trap are a subset of the
structural poor. A long term poverty trap arises when poor households are faced with two
distinct equilibriums: one below the poverty line and one above it. Households with a
sufficiently low income or asset endowments are trapped in the poor-equilibrium and
small improvements are not enough to escape such poverty trap. This idea was based on
the big-push theory where countries need a big enough inflow of capital to break the
vicious cycle of poverty (Rosenstein-Rodan 1943). However, previous literature has not
systematically analyzed the incidence of multiple dimension of poverty that can be
mutually reinforcing each other. In particular, the very poor are more likely to be trapped
in more than one of the resources. This paper contributes to the empirical analysis of
poverty traps by investigating the presence of one potential poverty trap to simultaneous
poverty trap. The paper will introduce the concept of illiteracy trap and under nutrition
trap along with asset poverty trap. The paper will try to explore what kinds of poverty
trap exist in Indian States and related policy implication will be proposed to overcome
such poverty trap.
Rest of the paper is organized as follows. Section 2 deals with the empirical literature
review on poverty trap. Section 3 builds the theoretical framework on poverty traps.
Section 4 introduces the data sources. Section 5 describes the methodology of our paper.
Section 6 presents the results. Finally Sect. 7 concludes the paper.
S. Dutta
123
Author's personal copy

2 Empirical Literature Review
Recent literature on poverty has tended to focus on defining poverty in the asset space and
prominent early asset-poverty measures were offered by Oliver and Shapiro (1990) and
Sherraden (1991). Asset-based approaches (ABA) have been developed to address the
causes and dynamics of longer-term persistent structural poverty primarily in rural Africa
and Asia (Giesbert and Schindler 2012; Carter and Barrett 2006; Francisca and David
2007). Carter and May (1999, 2001) identify the asset poverty line as an extension of
income poverty line. The authors argue that the chronically poor were characterized by a
structurally low asset base, and could only escape poverty temporarily due to some
‘positive shock’ or luck before relapsing. The transient poor were temporarily pushed
below the poverty line by negative shocks to their livelihoods. Empirical research on
multiple equilibria in income and asset poverty trap dynamics has begun recently with
contributions by Jalan and Ravallion (2002), Dercon (2004), Lokshin and Ravallion
(2004), Lybbert et al. (2004), Adato et al. (2006), Barrett et al. (2006), Naschold (2005,
2012), Campenhout and Dercon (2009). Both parametric and non-parametric estimation
methods have been used to estimate the poverty traps.
Jalan and Ravallion (2002) use a 6-year panel of income from four rural provinces of
China and present evidence of a geographic poverty trap, meaning that when the con-
sumptions of identical households living in a better-endowed area rise over time, house-
holds trapped in geographic poverty remain isolated from the ‘rising standard of living’.
Dercon (2004) uses six village data from the Ethiopia Rural Household Survey (ERHS)
from 1989 to 1997 to explore the impact of risk on consumption growth paths using a
linearized empirical growth model. He finds a persistence effect of famine and rainfall
shocks on consumption growth. In addition, road infrastructure is a source of divergence in
growth across villages and households. Lokshin and Ravallion (2004) examine the exis-
tence of poverty traps and distribution-dependent growth using a 4-year household panel
from Russia and 6-year household panel from Hungary. In order to resolve endogenous
attrition to shocks, they use a system estimator based on semi-parametric full information
maximum likelihood. They find evidence of concavity of income for both countries, but
they fail to find convincing evidence of a dynamic poverty trap.
Lybbert et al. (2004) use 17-year cattle herd histories in southern Ethiopia to study
stochastic wealth dynamics. The most important asset for households is a livestock in this
pastoral region. The data they use aggregate heterogeneous livestock into ‘‘Tropical
Livestock Units (TLU)’’. They estimate livestock dynamics using a Nadaraya-Watson
estimator.2 Due to the fact that it is a nonparametric local curvature, they can avoid a local
distortion that parametric regression might arise. A limitation, however, is that a local
constant estimator such as the Nadaraya-Watson estimator is known to suffer from
‘‘boundary bias’’. In addition, they don’t use an optimal bandwidth from a data driven
bandwidth selector such as likelihood cross-validation or plug-in method. Further, Lybbert
et al. allow one asset to explain pastoral welfare, but in asset dynamics literature it is
common to create an aggregate, one-dimensional measure that summarizes a household’s
total asset holdings. To aggregate a portfolio comprised of multiple assets, Adato et al.
(2006), Barrett et al.(2006), and Naschold (2012) estimate asset-based wellbeing indices by
either a regression of expenditure on the household’s productive assets or a factor analysis.
Based on the indices, they expect that households that suffer from income poverty tran-
sitions but not asset losses should not fall into poverty trap. Carter and Barrett (2006) argue
2 They have considered Epanechnikov kernel with arbitrary bandwidth.
Single or Multiple Poverty Trap
123
Author's personal copy
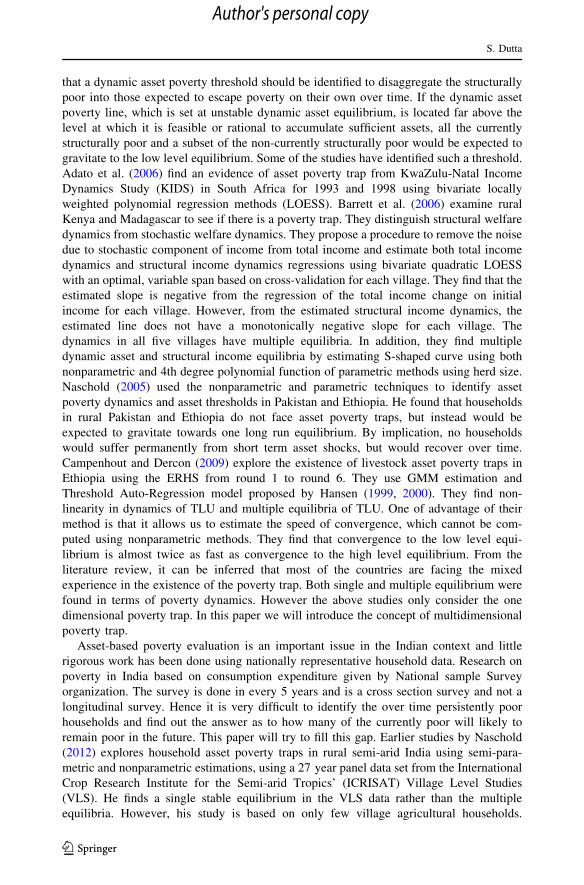
that a dynamic asset poverty threshold should be identified to disaggregate the structurally
poor into those expected to escape poverty on their own over time. If the dynamic asset
poverty line, which is set at unstable dynamic asset equilibrium, is located far above the
level at which it is feasible or rational to accumulate sufficient assets, all the currently
structurally poor and a subset of the non-currently structurally poor would be expected to
gravitate to the low level equilibrium. Some of the studies have identified such a threshold.
Adato et al. (2006) find an evidence of asset poverty trap from KwaZulu-Natal Income
Dynamics Study (KIDS) in South Africa for 1993 and 1998 using bivariate locally
weighted polynomial regression methods (LOESS). Barrett et al. (2006) examine rural
Kenya and Madagascar to see if there is a poverty trap. They distinguish structural welfare
dynamics from stochastic welfare dynamics. They propose a procedure to remove the noise
due to stochastic component of income from total income and estimate both total income
dynamics and structural income dynamics regressions using bivariate quadratic LOESS
with an optimal, variable span based on cross-validation for each village. They find that the
estimated slope is negative from the regression of the total income change on initial
income for each village. However, from the estimated structural income dynamics, the
estimated line does not have a monotonically negative slope for each village. The
dynamics in all five villages have multiple equilibria. In addition, they find multiple
dynamic asset and structural income equilibria by estimating S-shaped curve using both
nonparametric and 4th degree polynomial function of parametric methods using herd size.
Naschold (2005) used the nonparametric and parametric techniques to identify asset
poverty dynamics and asset thresholds in Pakistan and Ethiopia. He found that households
in rural Pakistan and Ethiopia do not face asset poverty traps, but instead would be
expected to gravitate towards one long run equilibrium. By implication, no households
would suffer permanently from short term asset shocks, but would recover over time.
Campenhout and Dercon (2009) explore the existence of livestock asset poverty traps in
Ethiopia using the ERHS from round 1 to round 6. They use GMM estimation and
Threshold Auto-Regression model proposed by Hansen (1999, 2000). They find non-
linearity in dynamics of TLU and multiple equilibria of TLU. One of advantage of their
method is that it allows us to estimate the speed of convergence, which cannot be com-
puted using nonparametric methods. They find that convergence to the low level equi-
librium is almost twice as fast as convergence to the high level equilibrium. From the
literature review, it can be inferred that most of the countries are facing the mixed
experience in the existence of the poverty trap. Both single and multiple equilibrium were
found in terms of poverty dynamics. However the above studies only consider the one
dimensional poverty trap. In this paper we will introduce the concept of multidimensional
poverty trap.
Asset-based poverty evaluation is an important issue in the Indian context and little
rigorous work has been done using nationally representative household data. Research on
poverty in India based on consumption expenditure given by National sample Survey
organization. The survey is done in every 5 years and is a cross section survey and not a
longitudinal survey. Hence it is very difficult to identify the over time persistently poor
households and find out the answer as to how many of the currently poor will likely to
remain poor in the future. This paper will try to fill this gap. Earlier studies by Naschold
(2012) explores household asset poverty traps in rural semi-arid India using semi-para-
metric and nonparametric estimations, using a 27 year panel data set from the International
Crop Research Institute for the Semi-arid Tropics’ (ICRISAT) Village Level Studies
(VLS). He finds a single stable equilibrium in the VLS data rather than the multiple
equilibria. However, his study is based on only few village agricultural households.
S. Dutta
123
Author's personal copy

Therefore, these households would have faced the same kind of shocks. Further, VLS data
only contain few richer households since the VLS covers a poor rural population.
Therefore the analysis was biased towards the poorer households. However our study is a
bigger sample size of 13,000 rural households from all over India for a 10 years time span.
We are using household panel data. Time series data on assets will help us to distinguish
the households from deep-rooted persistent poverty from poverty that decreases over time,
based on the understanding of households continuous asset loss or asset accumulation
process. The objective of this study is to identify whether single or multidimensional
poverty trap exists in rural households in India.
3 Theoretical Framework
Many types of poverty traps are thought to exist. In literature, poverty traps has been
studied within consumption and asset space. In addition, poverty trap may occur in various
dimensions such as education, health, geography or any other dimensions of development
indicators. In this paper we will explore the poverty traps in health and education
dimension along with other productive asset dimension. In development economics liter-
ature poverty trap is considered as vicious circle. In this paper we examine poverty traps in
a multidimensional way, given that poverty has multiple aspects (Anand and Sen 1997;
Smith 2005; Alkire and Foster 2009). The following Fig. 1 is built to test the existence of
single or multidimensional poverty trap in the Indian rural households. The horizontal axis
measures the baseline period asset endowment and vertical axis measure the current period
asset endowment of the household.
If households have the livelihood function like aa0, it illustrates the S-shaped dynamics
of the model with two stable equilibrium (AL and AH) and there is an unstable equilibrium
in-between (which is Am in Fig. 1) a ‘‘threshold at which accumulation dynamics bifur-
cate’’ (Carter and Barrett 2006: 190), also referred to as the Micawber threshold (Lipton
1994) or the dynamic asset poverty line in the literature. A household above this threshold
is predicted to accumulate assets over time as more profitable activities and investments
become accessible to the household. Eventually, the household reaches the stable upper
asset equilibrium (AH) and moves out of poverty. In contrast, households below the
threshold (AL) are too poor to accumulate assets. If they also lack the opportunity to
borrow, those households are trapped at low welfare levels. Hence, the dynamic asset-
based approach identifies not only who is poor at a given moment in time, but also allows
forward-looking projections of what types of households lack the productive assets to
escape poverty in the future. Households whose assets place them above the micawber
threshold would be expected to escape poverty over time, while those below would not.
One needs to identify this dynamic asset poverty threshold in order to disaggregate the
structurally poor into those expected to escape poverty on their own overtime through over
time asset accumulation and those expected to be trapped in poverty indefinitely. The
empirical challenge is to find whether such threshold exists, if so where.
By extending the above logic of multiple equilibrium, we can also explain the situation
of single equilibrium framework. For example, households can have the livelihood func-
tion with a one stable equilibrium. For example, if the household livelihood function is cc0
in that case there is no poverty trap and households converge to the equilibrium point A2
which is above the poverty line. In contrast, if household livelihood functions is like bb0,would be expected to reach at point A1, a single steady-state level of equilibrium located
below the poverty line. However, single low equilibrium in more than one asset or welfare
Single or Multiple Poverty Trap
123
Author's personal copy

indicators may predict more persistence causes of poverty trap. Low level of equilibrium in
more than one dimension implies greater difficulty in moving out of poverty. In particular,
the very poor are more likely to be trapped in more than one of the resources. If house-
holds’ income only fulfills their poverty level of consumption, the households are much
likely to be trapped in income and resources, since the households can’t save to invest for
future resources. Naturally, such multidimensional poverty may result in a stagnant low-
level equilibrium in the income and asset dynamics. In this regard, we expand our one
dimensional simple model of income dynamics to a multidimensional model.
4 Data
The paper uses the secondary information mainly from the India Human Development
Survey (IHDS)3 for the year 1994 and 2005. Our analysis is based on the 14 major States in
India which consists of 13,000 common rural households in both the periods. The assets
used in this paper fall into household durable assets, human assets, natural assets.
Household durable assets or productive assets consist of tractor, sewing machine, and
vehicle. Natural assets include land and livestock. Livestock variables are categorized
under dairy, draft animals and others. Household level human capital is measured by
education year of household head. The squared terms of the several variables are included
in order to incorporate the potential diminishing returns on assets. Additionally, the paper
is also considers the household total income which includes family farm income, agri-
cultural wage, non agricultural wage, salaries and net-business income and government
benefits. Also the income variable is needed to be scaled in adult equivalence terms to
3 IHDS is conducted by National Council for Applied Economic Research (NCAER), a well-known appliedeconomics research institution in ‘‘India’’. It is a nationally representative, multi-topic survey across India.Survey included on health, education, employment, economic status, marriage, fertility, gender relations,and social capital. IHDS was jointly organized by researchers from the University of Maryland and theNational Council of Applied Economic Research (NCAER), New Delhi. Various authors have used thesame data for various purposes (Zimmermann 2012; Singh 2011; Pou and Goli 2013, etc.).
Fig. 1 Long-term asset dynamics of the households (Carter and Barrett 2006)
S. Dutta
123
Author's personal copy

capture the economics of scale among the households (Srivastava and Mohanty 2011).
Following Atkinson et al. (1995) the paper has used OECD modified scale for calculating
the per capita adult equivalence income. The official poverty line for 1993–1994 and
2004–2005 is taken from planning commission report (2009). Further, for calculating
poverty trap in illiteracy, the paper includes year of education of the family member and
school enrolment of the school age child. Years of schooling acts as a proxy for the level of
knowledge and understanding of household members. Note that both years of schooling
and school attendance are imperfect proxies. They do not capture the quality of schooling,
the level of knowledge attained or skills. Yet both are robust indicators, are widely
available and provide the closest feasible approximation to levels of education for
household member. In terms of deprivation cut-offs for this dimension, the MPI requires
that at least one person in the household has completed 5 years of schooling and that all
children of school age are attending grades 1–8 of school. In addition, the paper has used
z-score of BMI-for age to generate under-nutrition trap. BMI indicates the chronic energy
deficiency or obesity of a family member.
5 Methodology
5.1 A Livelihood-Weighted Asset Index
This study uses Adato et al. (2006) by indexing household livelihood List as household
income divided by the money value of the household’s subsistence needs. In this case study
has used the state specific official poverty line given by the planning commission of India.
The coefficients of the regression give the marginal contribution to livelihood of the j
different assets. Households hold various assets. The asset index is estimated using the key
asset variables including human capital, natural capital, productive capital etc. The
regression also includes household characteristics variables like gender, age of the
household head, cast. To control for the location and time specific effect, village and time
dummies are included.
List ¼ aþX
j
bjðAijstÞ þX
j
X
k
bjkðAijstÞðAikstÞ
þ ciHit þ diVis þ DT þ Ui þ eits where Ui�N 0;r2u
� � ð1Þ
List is the poverty line adjusted income of the household i in the state s at time period t. In
other words, if List = 1 then household is exactly on the poverty line, List \ 1 indicates
household is poor and List [ 1 means the household is non-poor. Aijst indicates ownership
of asset j for household i for state s and time period t. Hence bj is the coefficient of asset j
owned by household i in state s. Since returns from an asset also depend on the interaction
between assets, there is an asset interaction term included in the model. It also takes into
account the rate at which returns from the assets are derived. Aikst referrers to ownership of
asset k for household i for state s and time period t. Therefore bjk is the coefficient of asset
interaction term. Hi includes the household specific demographic characteristics. Vi
includes village specific infrastructure variables. T is the time dummy. The above equation
is estimated through a panel regression framework. Ui indicates the household specific
random effect term and e is random error term. a is the intercept term. D is the coefficient
of time dummy and d is the coefficient of village specific variables.
Single or Multiple Poverty Trap
123
Author's personal copy

The asset index is given by the estimated value of the Eq. (1) after controlling for the
household demographic factor.
Kist ¼X
bj Aijst
� �þX
j
X
k
bjk Aijst
� �Aikstð Þ þ ciHit þ diVi þ dT þ Ui ð2Þ
Here asset index (Kist) is expressed in poverty line units (PLUs). It represents the asset
index for household i for state s in time period t. Hence an asset index below 1 indicates
households which have asset below the poverty line, and an asset index above 1 indicates
non-poor households.
5.2 Analysis of Asset Dynamics
Consumption has been the main wellbeing measure in the previous literature. Barrett et al.
(2006) argue that analysis of solely income hinders us from identifying chronic poverty
because consumption/income addresses stochastic part of income. In order to analyze
chronic poverty and poverty traps, they suggest using the structural part of income (i.e.,
assets).4 In addition, using an asset index helps reduce the multiple dimensions of assets to
a single dimension, which can avoid the ‘‘curse of dimensionality’’ problem in non-
parametric estimation. Using the estimated asset index for 1994 and 2005, the paper will
now explore the pattern of asset dynamics in Indian rural states. The relation between the
current and baseline asset level will be estimated using nonparametric technique.
Ait ¼ f Ait�1ð Þ þ ei ei� iid N 0;r2e
� �ð3Þ
where A represents the asset index of household i, t stands for the current period
(2004–2005) and (t - 1) for the baseline period (1994–1995) and the error term e is
assumed to be normally and identically distributed with zero mean and constant variance.
More specifically, a local polynomial regression with Epanechnikov kernel weights is
used for estimating Eq. 3. At each value of Ait-1, a fitted value is estimated by running a
regression in a local neighborhood of Ai,t-1 using weighted least squares. The neighbor-
hoods are defined as a proportion of the total number of observations. The weight is large if
Ait-1 is close to the fitted value and small if it is not. Therefore the points close to Ait-1
play a large role in determination of the fitted value of Ait while the ones further away play
a smaller role. n weighted local regression would be estimated at each value of Ait-1 in
order to find the smoothed value of Ait.
Finally the estimated asset recursion function (3) will be represented graphically to test
for the existence of a poverty trap.
5.3 Analysis of Multidimensional Poverty Trap
For analyzing the multi dimensional poverty trap we use illiteracy trap and under nutrition
trap. Illiteracy trap implies lack of basic education or skills may lead to low income, and
hence neither the financial nor the knowledge resources needed to acquire better education.
Further, under-nutrition trap means poor nutrition leads to low productivity which leads to
4 Barrett et al. (2006) mentioned three reasons why asset dynamics is better than income dynamics forpoverty analyses. Firstly, Income components are stochastic in nature; hence household may be poor in oneperiod and better off in the next period and vice versa because of stochastic factor such as good luck orreceiving a lucky gift. Secondly, stochastic incomes are likely to exaggerate income inequality in crosssectional analysis and thirdly it generates spurious economic mobility in longitudinal analysis.
S. Dutta
123
Author's personal copy

low income available to improve nutrition. If two traps are present simultaneously, we term
this multidimensional poverty trap. In this paper we have defined illiteracy trap as if year of
education of the family member is\5 years in both the years and if one of the child in the
age of attending school are not enrolled in school in both the periods. For under-nutrition
trap we have used z-score for BMI-for -age and is calculated as
z-score BMI/Ageð Þ ¼BMIijk �MedianBMI
reference populationjk
SDreference populationjk
ð4Þ
where BMIijk represents the BMI of an individual i whose age is k and whose gender
(male/female) is j. We define the under-nutrition trapped household if any members of the
households have BMI-for-age z score less than -25 throughout the periods.
Depending on the status of the poverty traps, households have a difference in the asset
index levels. We use simple t test and Epps–Singleton test for both trapped groups.
To evaluate the impact of various poverty trap (illiteracy and under-nutrition) on asset
index we have used mixed method of semi parametric model (partially linear regression
model).
Ait ¼ b0 þ Ui þ oT þ f Ait�1ð Þ þ Xaþ b1P1i þ b2P2i þ eit
Ui� iid N 0;r2u
� �and ei� iid N 0;r2
e
� � ð5Þ
where Ui is a random household effect, Pji, j = 1; 2 represents the illiteracy trap status and
under-nutrition trap status, respectively, T represent time dummies taking account of time
specific effect and X includes gender of head, age of head, number of dependent person.
6 Results
6.1 Livelihood Asset Index
Equation 1 is estimated through panel livelihood regression to construct the asset index
given by Eq. 2. As seen in Appendix Table 3, the F statistics indicates the joint signifi-
cance of the explanatory variables and all estimated coefficients that are individually
statistically significant. Among the various assets, as expected land size has a positive
significant impact on the household livelihood with a coefficient of 0.03 in pooled OLS
(POLS) and 0.05 in random effect model (REM) respectively. It indicates that as house-
hold’s land size increases it has a significant positive impact on the household income
relative to poverty line income. This implies an increase in land size has a direct positive
increase in the household income. However there seems to be diminishing returns to land
when size of the land increases.
The regression results indicate the importance of livestock for maintaining the house-
hold livelihood. As expected livestock also has a positive significant impact on livelihood.
For example, livestock such as sheep and goat generally perceived as easily disposable
assets were found to be positively associated with household livelihood (Liverpool and
Nelson 2010). A REM shows that a 1 % increase in livestock corresponds to a 0.17 %
increase in income relative to the poverty line. It is also noticed that livestock follows an
expected pattern of diminishing marginal returns with significant and negative coefficients
5 It is a common cut-off to identify abnormal anthropometry (WHO 1995).
Single or Multiple Poverty Trap
123
Author's personal copy

on the squared terms. Similar to livestock, draft animals and poultry are also considered as
disposable assets, and have positive impact on the household livelihood. It is also noticed
that draft and poultry also follows diminishing marginal returns with significant and
negative coefficients on the squared terms. One of the reasons for the diminishing returns
for both livestock as well as draft animals could be the high maintenance cost associated
with larger numbers of the same (Lybbert et al. 2004). The interesting observation is that
an additional increase in land size yields a higher increase in income for household having
draft animals or tractor/thresher. In other words, there is a positive interaction effect
between land size and draft animals, land size and tractor/thresher. The paper has found
that year of education of male and female has a positive significant impact on household
income relative to poverty line income.
We found that sex of the household head is insignificant in household livelihood pro-
cess. The negative and significant coefficient on the number of dependent people in the
household indicates widespread unemployment which reduced the per capita availability of
income. Household belonging to schedule caste, schedule tribe and other backward caste
has very limited assets (Sundaram and Tendulkar 2003; Meenakshi et al. 2000). Therefore
household belonging to these caste have negative and significant impact on the household
livelihood process.
The paper also includes the village level variables to control the impact of village
infrastructure on the livelihood pattern of the household (Naschold 2012). The paper finds
that distance of the village from the nearest town, distance of district or primary health care
centre, distance of primary school and distance of post office has negative impact on the
household livelihood pattern. For example, if the village is nearer to the town then the
household has more opportunity and will increase their income level. It is also noticed that
after controlling the village level variables, significance of the other variables also
increases.
Multiple specification tests have applied to identify the consistent and efficient estimator
for this study. With a Chi squared statistic of 435.81 (p value = 0.00), we reject the
Breusch and Pagan Lagrange multiplier test for random effects (RE), which indicates that
the variance of the error term is not zero and the RE model is superior to the POLS. With a
Chi squared statistic of 3.85 (p value = 0.45), the Hausman test also indicates that REM is
more efficient than fixed effect model. Therefore REM will be using for further analysis.
Table 1 reports the descriptive statistics of the asset index values. It is seen that the
mean asset index value has increased in 2004–2005 compared to 1994–1995. There is also
increase in the maximum value of asset index in 2004–2005 compared to 1993–1994.
However it is also noticed that there seems to be increase in asset inequality shown by the
increase in standard deviation.
6.2 Analysis of Asset Dynamics
An estimation of the non-parametric bivariate relation between the asset index in the
current and baseline period is displayed in Figs. 2, 3, 4 and 5. The 45� line represents the
perfectly linear relationship between asset endowments in each period as a reference
points. Both axes are scaled in income PLUs. There are no multiple dynamic equilibrium
points. Across all the States we find only single dynamic asset equilibrium for rural
households. However the nature of the asset dynamics varies from one state to another. For
example; Bihar, Rajasthan, Uttar Pradesh, Assam, and Orissa have experienced asset loss
over a period of time. The major reason for asset loss are due to health related factors or
death of the bread earners. It is seen that on an average heath expenditure is high in these
S. Dutta
123
Author's personal copy

households and some of the bread earners lose their job because of poor health. Asset
loosing households generally have more number of dependent or unemployed family
members. Child dropout rate is also high in these households. Most of the children are
forced to join in the labor force to support their family which actually has a negative
Table 1 Descriptive statistics
Mean SD Maximum Minimum
Asset index 2005 -0.02 1.81 4.06 -1.53
Asset index 1994 -0.30 1.02 2.01 -2.12
-.5
0.5
11.
52
AI_
2005
-2 -1 0 1 2 3
AI_1994
-.5
0.5
11.
52
AI_
2005
-1 -.5 0 .5 1 1.5
AI_1994
-.5
0.5
11.
52
AI_
2005
-1 -.5 0 .5 1
AI_1994
-1 -.5 0 .5 1AI_1994
-.5
0.5
11.
52
AI_
2005
-2 -1 0 1 2 3
AI_1994
-.5
0.5
11.
52
AI_
2005
A B
C
E
D
Fig. 2 Asset losing states. a Asset dynamics_Bihar, b asset dynamics_Uttar Pradesh, c asset dynam-ics_Rajasthan, d asset dynamics_Orissa, e asset dynamics_Assam
Single or Multiple Poverty Trap
123
Author's personal copy

impact on the future human capital formation at the household level. Over time due to low
education level and low skill level these children do not get an opportunity to get formal
employment. Furthermore, the asset loosing households normally depend on a single
source of income mainly from agricultural wage which tends to be seasonal and poor.
Therefore diversification of income source is also not present in these households. These
households usually have a very small amount of land and small number of livestock. In any
critical situation in their life they end up selling their land or livestock and in the long term
they are in no position to build assets because of various constraints like low skill, large
amount of dependent person and/or sudden job loss.
On the contrary Kerala, Himachal Pradesh and Punjab can be termed as asset accu-
mulating states. Asset accumulating households have various skills to build their assets.
These households have multiple sources of income from various homemade enterprises
and formal sector jobs. These households are able to invest more on livestock business or
can diversify their products like shifting the production to new animals, e.g. shifting from
goats to dairy cows etc. Similarly they have large cultivable land size which they use for
producing different crops instead of a single crop such as paddy. Therefore crop diversi-
fication is also a common characteristic of these households.
Moreover, states like West Bengal, Madhya Pradesh, and Andhra Pradesh are mostly in
a stagnant condition. The characteristics of the asset immobile states are almost similar
with asset loosing states. These households are engaged in low paid or low skill job like
-2-1
01
23
AI_
2005
-.5 0 .5 1 1.5 2
AI_1994
-1-.
50
.51
1.5
AI_
2005
-.5 0 .5 1 1.5 2
AI_1994
-10
12
3
AI_
2005
-.5 0 .5 1 1.5 2
AI_1994
A B
C
Fig. 3 Asset accumulating states. a Asset dynamics_Kerala, b asset dynamics_Punjab, c asset dynam-ics_Himachal Pradesh
S. Dutta
123
Author's personal copy

causal labor or seasonal labour. Their income stream is very fluctuating and hence they
cannot expect to invest on new assets. They can only manage their day to day food with
their present income stream.
More strikingly, Gujarat, Maharashtra, Haryana and Tamil Nadu have a mixed expe-
rienced in that they are both asset loosing as well as asset accumulating. These households
have common characteristics of both asset loosing and asset accumulating and hence seem
in a process of transformation.
6.3 Analysis of Multiple Poverty Traps
Depending on the status of the poverty traps, households have a difference in asset index
levels. We use t test and Epps–Singleton test for whether both trapped groups have the same
mean and the same distribution compared with non-trapped group, respectively. We found
that except Gujarat, in all other States, household in the illiteracy trap has lower asset index
compared to non-trapped household. However we note that the distribution of asset index in
Gujarat significantly depends on the illiteracy trap status at any conventional level. Moreover
a household in an under-nutrition trap has the lower asset index regardless of the States. In
addition, we find that the illiteracy and under-nutrition traps are positively correlated.6
Table 2 shows the average asset index value according to the illiteracy and under-nutrition
6 By Chi square test we get, v12 = 20.01 and p = 0.00.
-.5
0.5
1
AI_
2005
-.2 0 .2 .4 .6 .8
AI_1994
-.5
0.5
1
AI_
2005
-.5 0 .5 1 1.5
AI_1994
-.2
0.2
.4.6
.8
AI_
2005
-.5 0 .5 1 1.5
AI_1994
-10
12
AI_
2005
-1 -.5 0 .5 1 1.5
AI_1994
A B
C D
Fig. 4 Mixed experienced states. a Asset dynamics_Maharashtra, b asset dynamics_Gujarat, c assetdynamics_Tamil Nadu, d asset dynamics_Haryana
Single or Multiple Poverty Trap
123
Author's personal copy

trap status. Trapped households have lower asset index than non-trapped households. In
particular, comparing the difference of the average asset index between the illiteracy trapped
group and the non-illiteracy trapped group across States, we found that the difference is
largest in Madhya Pradesh and the lowest is in Gujarat. This finding implies that an illiteracy
trap affects the asset level heterogeneously over the income and regional distribution.
However, comparing the difference of the average asset index between the under-nutrition
trapped group and the non-under nutrition trapped group across states, is less. This implies
that an under nutrition trap affects the asset level uniformly. In addition, comparing the
proportion of households under each poverty trap, we find that Kerala has the lowest pro-
portion of households in each trap and Bihar has the largest proportion in each trap.
In the previous section we find that the asset dynamics differ across states. In this
section we will test the impact of illiteracy trap and under nutrition trap on poverty
dynamics.
6.4 Analyzing the Impact of Poverty Trap Status on Asset Dynamics
We find under-nutrition trap significantly affect the asset accumulation in the relatively
poorer states at 1 % level (Appendix Table 4). For example, Bihar, Madhya Pradesh,
Orissa, Uttar Pradesh has experienced the highest impact of under nutrition trap compared
with other states. In addition, we find evidence that illiteracy trap status only affects the
asset accumulation of the most deprived area, but not that of relatively rich regions. For
example, households residing in relatively rich states may have some assets they can use as
collateral, when they want to invest education even though they don’t have enough current
-.5
0.5
11.
52
AI_
2005
-.5 0 .5 1 1.5 2
AI-1994
-.5
0.5
11.
5
AI_
2005
-.5 0 .5 1 1.5
AI_1994
-2-1
01
23
AI_
2005
-2 -1 0 1 2 3
AI_1994
A B
C
Fig. 5 Asset immobile states. a Asset dynamics_Andhra Pradesh, b asset dynamics_Madhya Pradesh,c asset dynamics_West Bengal
S. Dutta
123
Author's personal copy

Ta
ble
2A
sset
ind
exw
ith
the
stat
us
of
po
ver
tytr
aps
Un
der
nu
trit
ion
trap
Illi
tera
cytr
ap
No
ntr
app
edT
rap
ped
t-v
alu
es*
Ep
ps–
Sin
gle
ton
test
**
P(T
\t)
No
ntr
app
edT
rap
ped
t-v
alu
esE
pp
s–S
ingle
ton
test
P(T
\t)
All
Ind
ia3
.05
(59
%)
-0
.89
(41
%)
6.1
2(0
.00
)0
.00
3.1
4(6
1%
)-
0.9
1(3
9%
)5
.02
(0.0
0)
0.0
0
An
dh
raP
rad
esh
2.1
4(6
3%
)1
.41
(37
%)
2.1
3(0
.00
)0
.00
12
2.0
4(6
1%
)1
.03
(39
%)
3.1
3(0
.00
)0
.000
2
Ass
am1
.81
(59
%)
1.0
5(4
1%
)2
.09
(0.0
0)
0.0
00
31
.76
(56
%)
-0
.90
(44
%)
2.1
9(0
.00
)0
.01
Bih
ar1
.09
(42
%)
0.3
6(5
8%
)2
.13
(0.0
0)
0.0
06
1.9
(45
%)
0.2
0(5
5%
)3
.13
(0.0
0)
0.0
16
Gu
jara
t2
.24
(54
%)
1.9
1(4
6%
)3
.01
(0.0
0)
0.0
12
.22
(49
%)
1.2
1(5
1%
)0
.41
(0.3
5)
0.0
04
Har
yan
a2
.01
(61
%)
1.1
03
(39
%)
5.1
2(0
.00
)0
.00
82
.22
(58
%)
1.2
1(4
2%
)2
.12
(0.0
0)
0.0
10
Him
ach
alP
rad
esh
2.0
5(5
7%
)1
.09
(43
%)
2.0
9(0
.00
)0
.01
2.1
2(6
3%
)1
.09
(37
%)
4.0
9(0
.00
)0
.001
Ker
ala
3.0
1(7
8%
)2
.29
(22
%)
2.1
4(0
.00
)0
.00
23
.21
(90
%)
2.0
9(1
0%
)3
.14
(0.0
0)
0.0
11
Mad
hy
aP
rad
esh
1.9
0(3
9%
)0
.99
(61
%)
2.5
6(0
.00
)0
.03
1.8
7(4
3%
)-
0.8
0(5
7%
)2
.76
(0.0
0)
0.0
00
3
Mah
aras
htr
a2
.10
(65
%)
1.9
7(3
5%
)2
.45
(0.0
0)
0.0
01
2.1
2(6
8%
)1
.02
(32
%)
2.9
5(0
.00
)0
.00
Ori
ssa
1.0
6(5
3%
)0
.89
(47
%)
3.2
3(0
.00
)0
.03
1.1
3(5
7%
)0
.91
(43
%)
3.1
3(0
.00
)0
.001
Pu
nja
b2
.98
(74
%)
2.3
4(2
6%
)3
.12
(0.0
0)
0.0
12
.45
(78
%)
1.0
2(2
2%
)2
.12
(0.0
0)
0.0
00
2
Tam
ilN
adu
2.6
7(6
9%
)1
.89
(31
%)
3.0
9(0
.00
)0
.02
2.8
7(7
3%
)1
.09
(27
%)
3.1
9(0
.00
)0
.01
Single or Multiple Poverty Trap
123
Author's personal copy

Ta
ble
2co
nti
nued
Un
der
nu
trit
ion
trap
Illi
tera
cytr
ap
No
ntr
app
edT
rap
ped
t-v
alu
es*
Ep
ps–
Sin
gle
ton
test
**
P(T
\t)
No
ntr
app
edT
rap
ped
t-v
alu
esE
pp
s–S
ingle
ton
test
P(T
\t)
Raj
asth
an1
.78
(60
%)
1.0
5(4
0%
)2
.45
(0.0
0)
0.0
11
.60
(62
%)
0.5
6(3
8%
)2
.35
(0.0
0)
0.0
2
Utt
arP
rad
esh
1.0
1(5
3%
)0
.34
(47
%)
2.6
7(0
.00
)0
.04
1.3
4(5
3%
)-
0.4
5(4
7%
)2
.77
(0.0
0)
0.0
1
Wes
tB
engal
2.4
5(5
8%
)2
.09
(42
%)
2.4
0(0
.00
)0
.01
2.2
3(5
5%
)1
.12
(45
%)
2.5
0(0
.00
)0
.01
Val
ues
inth
ep
aren
thes
isar
eth
ep
rop
ort
ion
of
each
po
ver
tytr
apst
atu
s
*T
he
nu
llh
yp
oth
esis
isth
atth
em
ean
of
no
n-t
rap
ped
asse
tin
dex
iseq
ual
toth
ato
fth
etr
app
ed.
pv
alu
esin
par
enth
esis
are
for
the
on
e-si
ded
test
**
Itte
sts
wh
eth
erth
ed
istr
ibu
tio
nfu
nct
ions
com
ing
from
two
ind
epen
den
tsa
mp
les
are
iden
tica
l
S. Dutta
123
Author's personal copy

income. However, lower income households in the most deprived states lack assets to use
as collateral, are likely credit constrained, and are more likely to fall into poverty traps.
This may explain why the households in the Bihar, Orissa, Uttar Pradesh, Madhya Pradesh
experience reduced asset accumulation in the presence of an illiteracy trap. Given the
significance of an illiteracy trap and an under-nutrition trap in these states, we infer that the
households in this area sufferer from multidimensional poverty traps.
Comparing the marginal effects of under-nutrition trap and illiteracy trap status, we
found that Bihar has the highest under nutrition trap and Madhya Pradesh has the highest
illiteracy trap. In case of Rajasthan, we found that though illiteracy trap is not significant,
however interaction between under-nutrition trap and illiteracy trap has significant impact
on asset loosing in this state.
7 Conclusion
This paper has examined the household asset dynamics in India as well as Indian rural States.
Naschold (2012) found that no evidence of poverty trap in Indian sample village. However
his study was based on single asset index. In this paper we have used multidimensional
poverty trap framework. The study has used nonparametric regression model to test the
existence of poverty traps in Indian rural states. It is noticed that some of the states like
Rajasthan, Bihar, Uttar Pradesh and Assam continuously losing their assets which was
reflected in sever chronic poverty or high structurally downward mobility. On the other hand,
Kerala, Himachal Pradesh and Punjab have experienced a high asset accumulation because
of that these States are experienced in structurally upward mobility. Maharashtra, Gujarat,
Haryana and Tamil Nadu have experienced both asset loosing and asset accumulation
therefore in these states both structurally downward mobility and structural upward mobility
is high. Moreover, West Bengal, Madhya Pradesh and Andhra Pradesh are almost stagnant in
this 10 years time period. There is no asset dynamics took place. Therefore these states have
the same economic condition in these two periods. From our analysis it is inferred that, in
most of the states, asset accumulation does not take place and welfare dynamics is very poor
in rural areas. As a result households remain at their initial level of the wellbeing. This is
particularly alarming for the large number of households with initial assets holdings below
the poverty line. In addition we have tested the existence of single and multiple poverty traps.
In addition to asset poverty traps, we considered under- nutrition traps as proxies by con-
tinued low BMI-for-age z scores, and illiteracy trap as proxies by continued illiteracy. We
further examined the possibility that there are interlocking traps, in the sense that low levels
of health and education have a negative interaction effect on assets. We find this effect in the
most deprived states (Bihar, Uttar Pradesh, Orissa and Madhya Pradesh). In these states both
illiteracy and under nutrition significantly reduce assets creation; and there is a statistically
significant negative interaction effect of illiteracy and under nutrition on assets. In other
regions a trap has a negative effect on assets, but there is no significant interaction effect. Our
result implies that asset dynamics of the household varies in the long term according to types
of traps. Government and policy makers should take pointed policy and programme based on
whether the poor are trapped and in what ways.
Appendix
See Tables 3 and 4.
Single or Multiple Poverty Trap
123
Author's personal copy

Ta
ble
3L
ivel
ihood
regre
ssio
nto
der
ive
asse
tin
dex
(pan
eldat
am
odel
)
PO
LS
Fix
edef
fect
mod
elR
and
om
effe
ctm
od
el(1
)R
ando
mef
fect
mod
el(2
)
Co
nst
ant
0.3
5(1
.98
)0
.91
(1.6
7)
0.1
2(2
.01
)0
.45
(1.9
8)
Dep
end
ent
var
iab
le:
adu
lteq
uiv
alen
tin
com
e/p
over
tyli
ne
inco
me
House
hold
char
acte
rist
ics
Hea
d’s
age
0.2
1(2
.01
)0
.07
(1.9
8)
0.1
1(2
.02
)0
.16
(2.0
1)
Ag
e2-
0.0
9(-
2.0
2)
-0
.01
(-1
.99)
-0
.13
(-2
.08)
-0
.24
(-2
.11)
Hea
dm
ale
0.0
8(1
.09
)–
0.0
9(1
.08
)0
.01
(1.0
2)
Sch
edu
leca
st-
0.0
3(-
2.0
1)
–-
0.0
8(-
2.0
9)
-0
.13
(-2
.08)
Sch
edu
letr
ibe
-0
.05
(-2
.02)
–-
0.0
6(-
2.1
1)
0.0
9(1
.08
)
OB
C-
0.0
7(-
1.9
9)
–-
0.0
7(-
2.0
1)
-0
.08
(-2
.09)
Pro
po
rtio
no
fd
epen
den
tp
erso
n-
0.1
2(-
2.0
2)
-0
.10
(-1
.89)
-0
.11
(-2
.04)
-0
.06
(-2
.11)
House
hold
educa
tion
Max
imu
my
ear
of
edu
cati
on
mal
e0
.12
(2.6
7)
0.2
1(2
.01
)0
.27
(2.8
7)
-0
.07
(-2
.01)
Max
imu
my
ear
of
edu
cati
on
fem
ale
0.2
5(2
.06
)0
.21
(1.9
8)
0.3
2(2
.10
)-
0.1
1(-
2.0
4)
Ho
use
ho
ldla
nd
and
liv
esto
ck
Lan
dsi
ze0
.03
(2.8
9)
0.0
1(1
.98
)0
.05
(2.9
0)
0.1
1(2
.09
)
Lan
dsi
zesq
uar
e-
0.0
1(-
2.0
8)
-0
.03
(-1
.98)
-0
.06
(-2
.01)
-0
.09
(-1
.90)
Po
ult
ryn
um
ber
s0
.1(1
.98
)0
.05
(1.9
0)
0.2
1(2
.01
)0
.05
(2.9
0)
Dra
ftan
imal
sn
um
ber
s0
.04
(2.0
9)
0.0
08
(1.7
8)
0.9
(2.1
0)
0.0
6(2
.01
)
Mil
chco
ws
nu
mb
ers
0.1
0(2
.01
)0
.05
(1.7
8)
0.1
1(2
.08
)0
.21
(2.0
1)
Oth
erli
ves
tock
nu
mb
ers
0.1
2(1
.98
)0
.001
(1.7
0)
0.1
7(1
.99
)0
.9(2
.10
)
Po
ult
ryn
um
ber
ssq
uar
e-
0.0
4(-
2.0
9)
-0
.000
2(-
1.7
8)
-0
.07
(-2
.10)
-0
.11
(-2
.08)
Dra
ftan
imal
sn
um
ber
ssq
uar
e-
0.0
7(-
2.1
0)
-0
.06
(-1
.79)
-0
.10
(-2
.11)
0.1
7(1
.99
)
Mil
chco
ws
nu
mb
ers
squ
are
-0
.08
(-1
.89)
-0
.007
(-1
.78)
-0
.09
(-1
.90)
-0
.07
(-2
.10)
Oth
erli
ves
tock
nu
mb
ers
squ
are
-0
.05
(-2
.01)
-0
08
(-1
.89)
-0
.10
(-2
.02)
-0
.10
(-2
.11)
Ho
use
ho
ldd
ura
ble
s
Tra
ctor/
thre
sher
0.1
3(2
.01)
0.0
8(1
.89)
0.1
3(2
.05)
0.0
9(-
1.9
0)
S. Dutta
123
Author's personal copy

Ta
ble
3co
nti
nued
PO
LS
Fix
edef
fect
mod
elR
and
om
effe
ctm
od
el(1
)R
ando
mef
fect
mod
el(2
)
Tu
be
wel
l0
.05
(1.9
8)
0.0
2(1
.67
)0
.07
(1.9
9)
0.1
0(2
.02
)
Ele
ctri
city
0.1
3(3
.21
)0
.06
(2.0
5)
0.1
5(3
.22
)0
.13
(2.0
5)
Sew
ing
mac
hin
e0
.10
(2.0
9)
0.7
(2.0
1)
0.1
2(2
.11
)0
.07
(1.9
9)
Veh
icle
0.0
6(2
.11
)0
.03
(2.0
1)
0.0
8(2
.13
)0
.15
(3.2
2)
Ho
use
ho
ldem
plo
ym
ent
Dum
my
for
sala
ried
work
er0.0
2(2
.12)
0.0
7(1
.99)
0.1
3(2
.98)
0.1
4(2
.16)
Du
mm
yfo
rn
on
farm
lab
ou
r0
.12
(2.7
8)
0.0
7(2
.67
)0
.10
(2.7
6)
0.0
8(2
.13
)
Inte
ract
ion
term
Lan
dsi
ze9
dra
ftan
imal
s0
.04
(2.0
8)
0.0
2(1
.89
)0
.07
(2.1
1)
0.0
7(1
.78
)
Lan
dsi
ze9
trac
tor/
thre
sher
0.0
3(2
.11
)0
.01
(2.0
1)
0.0
9(2
.12
)0
.10
(2.7
6)
Vil
lage
char
acte
rist
ics
Vil
lag
ed
ista
nce
ton
eare
stto
wn
-0
.15
(-3
.07)
Vil
lag
ed
ista
nce
top
rim
ary
or
dis
tric
th
ealt
hca
rece
ntr
e-
0.0
6(-
2.9
1)
Vil
lag
ed
ista
nce
top
rim
ary
sch
ool
-0
.13
(-2
.51)
Vil
lag
ed
ista
nce
top
ost
offi
ce-
0.0
7(-
2.0
9)
Tim
ed
um
my
Yes
Yes
Yes
Yes
No
.o
fo
bse
rvat
ion
s2
6,1
61
26
,16
12
6,1
61
26
,16
1
R2
0.3
40
.39
0.4
20
.47
F(s
ign
ifica
nce
of
fix
edef
fect
)6
8.4
**
*
F/W
ald
v2(2
6)
74
.75
**
*
F/W
ald
v2(3
5)
80
.67
**
*
Hau
sman
v2(2
6)
3.8
5
Single or Multiple Poverty Trap
123
Author's personal copy

Ta
ble
4M
ult
idim
ensi
on
alp
ov
erty
trap
anal
ysi
s
All
India
Andhra
Pra
des
hA
ssam
Bih
arG
uja
rat
Har
yan
aH
imac
hal
Pra
des
h
Coef
fici
ent
pval
ue
Coef
fici
ent
pval
ue
Coef
fici
ent
pval
ue
Coef
fici
ent
pval
ue
Coef
fici
ent
pval
ue
Coef
fici
ent
pval
ue
Coef
fici
ent
pval
ue
Const
ant
1.8
40.0
02.8
40.0
02.0
40.0
01.0
40.0
01.1
40.0
01.0
40.0
01.1
40.0
0
Under
-nutr
itio
ntr
ap-
0.1
62
0.0
01
-0.0
62
0.0
51
-0.3
62
0.0
0-
0.5
62
0.0
0-
0.0
06
0.1
0-
0.0
06
0.1
0-
0.1
06
0.1
0
Illi
tera
cytr
ap-
0.0
.15
0.0
06
-0.0
.05
0.0
10
-0.
15
0.0
0-
0.
25
0.0
0-
0.
25
0.3
0-
0.
05
0.1
0-
0.
03
0.1
0
Under
-
nutr
itio
n9
illi
tera
cy
-0.1
30.0
9-
0.0
30.0
7-
0.0
40.2
7-
0.1
40.0
09
-0.1
40.2
19
-0.0
10.1
19
-0.0
70.1
19
Age
of
hea
d0.1
30.0
50.0
30.0
10.1
00.0
10.0
90.0
10.1
90.0
10.0
10.0
50.0
80.0
1
Age2
-003
0.0
4-
0.0
10.1
-0.0
70.1
-0.0
10.1
-0.1
10.1
-0.0
10.6
-0.0
40.1
Gen
der
of
hea
d0.0
13
0.1
34
0.0
03
0.1
34
0.0
23
0.1
04
0.0
13
0.1
04
0.1
13
0.1
04
0.0
03
0.2
04
0.0
13
0.1
04
Pro
port
ion
of
dep
enden
t
per
son
-0.1
20.0
4-
0.3
20.0
2-
0.2
20.0
0-
0.1
20.0
0-
0.2
20.0
0-
0.2
12
0.0
0-
0.1
12
0.0
0
Sch
edule
cast
-0.0
40.0
0-
0.1
40.0
0-
0.0
40.0
0-
0.1
40.0
0-
0.0
40.0
0-
0.0
40.0
0-
0.1
40.0
0
Sch
edule
trib
e-
0.1
30.0
0-
0.1
00.0
0-
0.2
00.0
0-
0.1
00.0
0-
0.1
00.0
0-
0.1
00.0
0-
0.1
10.0
0
OB
C-
0.0
10.0
0-
0.1
00.0
0-
0.3
00.0
0-
0.1
00.0
0-
0.1
10.0
0-
0.0
50.0
0-
0.0
30.0
0
Sig
nifi
cance
test
of
F(A
it-
1)
V=
5.0
5
p[
|V|
=0.0
0
V=
4.0
5
p[
|V|
=0.0
0
V=
6.1
5
p[
|V|
=0.0
0
V=
5.5
5
p[
|V|
=0.0
0
V=
6.5
5
p[
|V|
=0.0
0
V=
4.0
5
p[
|V|
=0.0
0
V=
4.1
5
p[
|V|
=0.0
0
R2
0.4
10.3
50.4
20.4
10.3
80.3
90.3
7
Ker
ala
Mad
hya
Pra
des
hM
ahar
ashtr
aO
riss
aP
unja
bT
amil
Nad
uR
ajas
than
Coef
fici
ent
pval
ue
Coef
fici
ent
pval
ue
Coef
fici
ent
pval
ue
Coef
fici
ent
pval
ue
Coef
fici
ent
pval
ue
Coef
fici
ent
pval
ue
Coef
fici
ent
pval
ue
Const
ant
2.1
40.0
01.0
40.0
01.8
40.0
01.7
00.0
01.6
40.0
01.1
40.0
01.2
40.0
0
Under
-nutr
itio
ntr
ap-
0.1
06
0.0
5-
0.4
06
0.0
0-
0.0
82
0.0
11
-0.2
06
0.0
0-
0.1
06
0.0
4-
0.0
16
0.0
10
-0.2
16
0.0
10
Illi
tera
cytr
ap-
0.
09
0.3
2-
0.
55
0.0
0-
0.0
.05
0.1
10
-0.
25
0.0
0-
0.
05
0.1
3-
0.
01
0.1
0-
0.
01
0.4
0
Under
-nutr
itio
n
9il
lite
racy
-0.0
80.1
19
-0.0
40.0
19
-0.0
30.1
2-
0.0
10.0
09
-0.0
10.1
19
-0.0
70.1
19
-0.1
70.0
19
Age
of
hea
d0.1
80.0
10.0
90.0
50.0
50.0
10.0
40.0
10.0
10.0
50.0
80.0
10.0
80.0
1
Age2
-0.0
40.0
5-
0.0
10.6
-0.0
50.3
-0.0
30.1
-0.0
10.6
-0.0
40.1
-0.0
40.1
S. Dutta
123
Author's personal copy

Ta
ble
4co
nti
nued
Ker
ala
Mad
hya
Pra
des
hM
ahar
ashtr
aO
riss
aP
unja
bT
amil
Nad
uR
ajas
than
Coef
fici
ent
pval
ue
Coef
fici
ent
pval
ue
Coef
fici
ent
pval
ue
Coef
fici
ent
pval
ue
Coef
fici
ent
pval
ue
Coef
fici
ent
pval
ue
Coef
fici
ent
pval
ue
Gen
der
of
hea
d0.0
13
0.1
04
0.1
03
0.5
04
0.0
04
0.1
04
0.2
03
0.5
04
0.0
03
0.2
04
0.0
13
0.1
04
0.0
23
0.1
04
Pro
port
ion
of
dep
enden
t
per
son
-0.3
12
0.0
0-
0.1
20.0
0-
0.3
20.0
2-
0.4
20.0
0-
0.3
12
0.0
0-
0.1
12
0.0
0-
0.2
12
0.0
0
Sch
edule
cast
-0.1
40.0
0-
0.1
40.0
0-
0.1
40.0
0-
0.3
40.0
0-
0.0
40.0
0-
0.2
40.0
0-
0.1
40.0
0
Sch
edule
trib
e-
0.1
10.0
0-
0.2
00.0
0-
0.1
00.0
0-
0.1
00.0
0-
0.1
00.0
0-
0.1
20.0
0-
0.2
20.0
0
OB
C-
0.0
30.0
0-
0.0
10.0
0-
0.1
00.0
0-
0.2
10.0
0-
0.0
50.0
0-
0.0
40.0
0-
0.1
40.0
0
Sig
nifi
cance
test
of
F(A
it-
1)
V=
5.7
5
p[
|V|
=0.0
0
V=
4.5
5
p[
|V|
=0.0
0
V=
4.8
5
p[
|V|
=0.0
0
V=
4.7
5
p[
|V|
=0.0
0
V=
4.9
5
p[
|V|
=0.0
0
V=
5.1
5
p[
|V|
=0.0
0
V=
5.2
5
p[
|V|
=0.0
0
R2
0.4
00.5
20.3
90.4
30.5
10.4
90.4
7
Utt
arP
rades
hW
est
Ben
gal
Coef
fici
ent
pval
ue
Coef
fici
ent
pval
ue
Const
ant
1.8
40.0
02.1
40.0
0
Under
-nutr
itio
ntr
ap-
0.2
62
0.0
0-
0.1
02
0.0
0
Illi
tera
cytr
ap-
0.4
50.0
0-
0.1
50.0
0
Under
-nutr
itio
n9
illi
tera
cy-
0.0
40.0
09
-0.0
40.1
19
Age
of
hea
d0.1
90.0
10.0
90.0
1
Age2
-0.0
10.1
-0.0
10.1
Gen
der
of
hea
d0.0
03
0.1
04
0.1
13
0.1
04
Pro
port
ion
of
dep
enden
tper
son
-0.1
20.0
0-
0.2
20.0
0
Sch
edule
cast
-0.3
40.0
0-
0.2
40.0
0
Sch
edule
trib
e-
0.4
00.0
0-
0.1
00.0
0
OB
C-
0.1
90.0
0-
0.1
00.0
0
Sig
nifi
cance
test
of
F(A
it-
1)
V=
5.2
5p
[|V
|=
0.0
0V
=4.9
5p[
|V|
=0.0
0
R2
0.5
20.4
4
Single or Multiple Poverty Trap
123
Author's personal copy

References
Adato, M., Carter, M. R., & May, J. (2006). Exploring poverty traps and social exclusion in South Africausing qualitative and quantitative data. Journal of Development Studies, 42(2), 226–247.
Alkire, S., & Foster, J. E. (2009). Counting and multidimensional poverty measurement. OPHI WorkingPapers 32, Queen Elizabeth House, University of Oxford.
Anand, A., & Sen, A. (1997). Concepts of human development and poverty: A multidimensional perspective.Human Development Papers (pp. 1–19).
Atkinson, A. (2003). Multidimensional deprivation: Contrasting social welfare and counting approaches.Journal of Economic Inequality, 1(1), 51–65.
Atkinson, A. B., Rainwater, L and Smeeding, T. M. (1995). Income Distribution in OECD Countries, OECDSocial Policy Studies, No. 18, Paris.
Barrett, C. B., Marenya, P. P., McPeak, J. G., Minten, B., Murithi, F., Oluoch-Kosura, W., et al. (2006).Welfare dynamics in rural Kenya and Madagascar. Journal of Development Studies, 42(2), 248–277.
Campenhout, B. V., & Dercon, S. (2009). Non-linearities in the dynamics of livestock assets: Evidence fromEthiopia. Working paper, Insitute of Development Policy and Management (IDPM), The University ofAntwerp.
Carter, M. R., & Barrett, C. (2006). The economics of poverty traps and persistent poverty: An asset basedapproach. Journal of Development Studies, 42(1), 178–199.
Carter, M. R., & May, J. (1999). Poverty, livelihood and class in rural South Africa. World Development,27(1), 1–20.
Carter, M. R., & May, J. (2001). One kind of freedom: The dynamics of poverty in post-apartheid SouthAfrica. World Development, 29(12), 1987–2006.
Dercon, S. (2004). Growth and shocks: Evidence from rural Ethiopia. Journal of Development Economics,74(2), 309–329.
Francisca, A., & David, M. (2007). Poverty traps and nonlinear income dynamics with measurement errorand individual heterogeneity. Journal of Development Studies, 43(6), 1057–1083.
Giesbert, L., & Schindler, K. (2012). Assets, shocks and poverty traps in rural Mozambique. WorldDevelopment, 40(8), 1594–1609.
Hansen, B. E. (1999). Threshold effects in non-dynamic panels: Estimation, testing and inference. Journal ofEconometrics, 93(2), 345–368.
Hansen, B. E. (2000). Sample splitting and threshold estimation. Econometrica, 68(3), 575–603.Jalan, J., & Ravallion, M. (2002). Geographic poverty traps? A micro model of consumption growth in rural
China. Journal of Applied Econometrics, 17(4), 329–346.Lipton, M. (1994). Growing points in poverty research: Labour issues. International Institute for Labour
Studies Discussion Paper, 66.Liverpool, L., & Nelson, A. W. (2010). Asset versus consumption poverty and poverty dynamics in the
presence of multiple equilibria in rural Ethiopia. IFPRI Discussion Paper 00971.Lokshin, M., & Ravallion, M. (2004). Household income dynamics in two transition economies. Studies in
Nonlinear Dynamics & Econometrics, 8(3), 1–31.Lybbert, T. J., Barrett, C. B., Desta, S., & Coppock, D. L. (2004). Stochastic wealth dynamics and risk
management among a poor population. The Economic Journal, 114(498), 750–777.Meenakshi, J. V., Ray, R., & Gupta, S. (2000). Estimates of poverty for SC, ST and female-headed
households. Economic and Political Weekly, 35(31), 2748–2754.Naschold, F. (2005). Identifying asset poverty thresholds—New methods with an application to Pakistan
and Ethiopia. Ithaca: Cornell University. http://www.rrojasdatabank.info/sp05na08.pdf.Naschold, F. (2012). The Poor stay poor: Household asset poverty traps in rural semi-arid India. World
Development, 40(10):2033–2043.Nurkse, R. (1953). Problems of capital-formation in underdeveloped countries (1962nd ed.). New York:
Oxford University Press.Oliver, Melvin. L., & Shapiro, T. M. (1990). Wealth of a nation: A reassessment of asset inequality in
America shows at least one-third of households are asset poor. American Journal of Economics andSociology, 49, 129–151.
Planning Commission. (2009). Report of the expert group to review the methodology for estimation ofpoverty. New Delhi: Planning Commission.
Pou, L. M. A., & Goli, S. (2013). Burden of multiple disabilities among the older population in India: Anassessment of socioeconomic differentials. International Journal of Sociology and Social policy, 33(1/2), 63–76.
S. Dutta
123
Author's personal copy

Rosenstein-Rodan, P. (1943). The problem of industrialization of eastern and south-eastern Europe. Eco-nomics Journal, 53, 202–211.
Sherraden, M. (1991). Assets and the poor. A new American welfare policy. Armonk, NY: M.E. Sharpe.Singh, A. (2011). Family background, academic ability and associated inequality of opportunity in India.
Economics Bulletin, 31(2), 1463–1473.Smith, S. C. (2005). Ending global poverty: A guide to what works. Oxford: Palgrave Macmillan.Srivastava, A., & Mohanty, S. (2011). Poverty among elderly in India. http://www.springerlink.com/
content/y2851477162rur5u/?MUD=MP.Sundaram, K., & Tendulkar, S. D. (2003). Poverty among social and economic groups in India in the
nineteen nineties. Working Paper No. 118, Centre for Development Economics, Delhi School ofEconomics.
World Health Organization (1995). Physical status: The use and interpretation of anthropometry (Vol. 854,pp. 1–452). Report of a WHO Expert Committee. World Health Organization Technical Report Series.
Zimmermann, L. (2012). Reconsidering gender bias in intra-household Allocation in India. Journal ofDevelopment Studies, 48(1), 151–163.
Single or Multiple Poverty Trap
123
Author's personal copy