Single piles under horizontal loads in sand: determination of P – Y curves from the prebored...
19
Abstract Lateral load-deflection behaviour of single piles is often analysed in practice on the basis of methods of load-transfer P–Y curves. The paper is aimed at presenting the results of the interpretation of five full-scale horizontal loading tests of single instrumented piles in two sandy soils, in order to define the parameters of P–Y curves, namely the initial lateral reaction modulus and the lateral soil resistance, in correla- tion with the pressuremeter test parameters. P–Y curve parameters were found varying as a power of lateral pile/soil stiffness, on the basis of which hyperbolic P–Y curves in sand were proposed. The predictive capabilities of the proposed P–Y curves were assessed by predicting the soil/pile response in full-scale tests as well as in centrifuge tests and a very good agreement was found between the computed deflections and bending moments, and the measured ones. Small-sized database of full- scale pile loading tests in sand was built and a comparative study of some commonly used P–Y curve methods was undertaken. Moreover, it was shown that the load-deflection curves of these test piles may be normalised in a practical form for an approximate evaluation of pile deflection in a preliminary stage of pile design. At last, a parametric study undertaken on the basis of the proposed P–Y curves showed the significant influ- ence of the lateral pile/soil stiffness on the non- linear load-deflection response. Keywords Lateral loading test Lateral reaction modulus P–Y curves Pressuremeter test Sand Single pile List of symbols and units B diameter or frontal width of the pile (m) D embedded length of the pile (m) D e effective pile length (m) E elastic soil modulus (MPa) e excentricity of lateral load (m) E c characteristic soil modulus (MPa) E m first load pressuremeter modulus (MPa) E r reload pressuremeter modulus (MPa) E ti initial lateral reaction modulus (MPa) E p I p flexural pile stiffness (MN m 2 ) F tangential lateral reaction (kN/m) F l limit tangential lateral reaction or tangential lateral resistance (kN/m) G r pressuremeter shear modulus (G r = E r / [2(1 + m)]) (MPa) H lateral load applied on the pile top (kN) I d density index (%) K pile/soil compressibility K r lateral pile/soil stiffness L tangential dimension of the pile section (parallel to H) (m) A. Bouafia (&) Department of civil engineering, University of Blida, P.O. Box 270, R. P Blida 09000, Algeria e-mail: bouafi[email protected] Geotech Geol Eng (2007) 25:283–301 DOI 10.1007/s10706-006-9110-7 123 ORIGINAL PAPER Single piles under horizontal loads in sand: determination of P–Y curves from the prebored pressuremeter test Ali Bouafia Received: 11 June 2005 / Accepted: 20 September 2006 / Published online: 27 October 2006 Ó Springer Science+Business Media B.V. 2006
Transcript of Single piles under horizontal loads in sand: determination of P – Y curves from the prebored...
Abstract Lateral load-deflection behaviour of
single piles is often analysed in practice on the
basis of methods of load-transfer P–Y curves.
The paper is aimed at presenting the results of
the interpretation of five full-scale horizontal
loading tests of single instrumented piles in two
sandy soils, in order to define the parameters of
P–Y curves, namely the initial lateral reaction
modulus and the lateral soil resistance, in correla-
tion with the pressuremeter test parameters. P–Y
curve parameters were found varying as a power of
lateral pile/soil stiffness, on the basis of which
hyperbolic P–Y curves in sand were proposed. The
predictive capabilities of the proposed P–Y curves
were assessed by predicting the soil/pile response
in full-scale tests as well as in centrifuge tests and a
very good agreement was found between the
computed deflections and bending moments, and
the measured ones. Small-sized database of full-
scale pile loading tests in sand was built and a
comparative study of some commonly used P–Y
curve methods was undertaken. Moreover, it was
shown that the load-deflection curves of these test
piles may be normalised in a practical form for an
approximate evaluation of pile deflection in a
preliminary stage of pile design. At last, a
parametric study undertaken on the basis of the
proposed P–Y curves showed the significant influ-
ence of the lateral pile/soil stiffness on the non-
linear load-deflection response.
Keywords Lateral loading test Æ Lateral reaction
modulus Æ P–Y curves Æ Pressuremeter test Æ Sand ÆSingle pile
List of symbols and unitsB diameter or frontal width of the pile (m)
D embedded length of the pile (m)
De effective pile length (m)
E elastic soil modulus (MPa)
e excentricity of lateral load (m)
Ec characteristic soil modulus (MPa)
Em first load pressuremeter modulus (MPa)
Er reload pressuremeter modulus (MPa)
Eti initial lateral reaction modulus (MPa)
EpIp flexural pile stiffness (MN m2)
F tangential lateral reaction (kN/m)
Fl limit tangential lateral reaction or
tangential lateral resistance (kN/m)
Gr pressuremeter shear modulus (Gr = Er/
[2(1 + m)]) (MPa)
H lateral load applied on the pile top (kN)
Id density index (%)
K pile/soil compressibility
Kr lateral pile/soil stiffness
L tangential dimension of the pile section
(parallel to H) (m)
A. Bouafia (&)Department of civil engineering, University of Blida,P.O. Box 270, R. P Blida 09000, Algeriae-mail: [email protected]
Geotech Geol Eng (2007) 25:283–301
DOI 10.1007/s10706-006-9110-7
123
ORIGINAL PAPER
Single piles under horizontal loads in sand: determinationof P–Y curves from the prebored pressuremeter test
Ali Bouafia
Received: 11 June 2005 / Accepted: 20 September 2006 / Published online: 27 October 2006� Springer Science+Business Media B.V. 2006
L0 transfer length or elastic length (m)
M bending moment at a given depth (kN m)
M0 bending moment applied to the pile top
(kN m)
NH rate of increase of Eti with depth in
Gibson’s soil (MPa/m)
Nspt N value of the SPT (blow counts/30 cm)
P lateral soil reaction at a given depth
(kN/m)
Pu lateral soil resistance or limit lateral
reaction (kN/m)
pf pressuremeter creep pressure (kPa)
pl limit pressuremeter pressure (kPa)
p* net limit pressuremeter pressure (kPa)
P�le net equivalent limit pressuremeter
pressure (kPa)
p0 at-rest lateral earth pressure (kPa)
Q frontal lateral reaction (kN/m)
qc cone penetration resistance (MPa)
qs limit skin friction along the pile shaft
(kPa)
R least-squares regression coefficient (%)
R0 initial radius of pressuremeter borehole
(m)
DR increase in PMT borehole radius (mm)
Sf, St shape factors
Y lateral displacement or deflection at a
given depth (mm)
Y0 pile deflection at ground level (mm)
Yref. reference deflection or threshold of lateral
soil resistance Pu(mm)
z depth with respect to the ground level (m)
zc critical depth (m)
k rate of linear increase of Em with depth in
Gibson’s soil (MPa/m)
l rate of linear increase of P�l with depth in
Gibson’s soil (kPa/m)
g lateral resistance factor
m Poisson’s ratio
w ratio Eti to Em
n ratio Pu to P�LB
1 Introduction
Pile foundations were initially designed in order
to transmit vertical loads to the soil. When these
foundations were besides horizontally loaded,
inclined piles, often difficult to achieve were to
be added. Due to the progress done in the
knowledge of piles foundation behaviour, it is
nowadays recognised that vertical piles can sus-
tain horizontal loads. Earth pressures on a bridge
abutment piles, lateral displacement of soft clayey
layer underlying an access embankment to a
motorway and wind pressures on slender struc-
tures built on piles are usual examples of hori-
zontal loading of piles. Behaviour of piles under
horizontal loads is a complex soil/pile interaction
problem because of the tridimensional nature of
the phenomenon and its dependence on a multi-
tude of key parameters. This fertile domain of
research was investigated since more than a half
century.
Geotechnical literature contains a wealth of
methods of analysis mainly based on elasticity,
finite/boundary elements or on subgrade reaction
theory. However, It should be emphasised that
the theoretical approaches offer simplistic
schemes of soil/pile response and therefore do
not take into consideration many pile/soil inter-
action parameters such as the pile installation, the
soil/pile interface roughness and the soil com-
pressibility. Furthermore, some particular aspects
of the problem of laterally loaded piles such as
the proximity of a slope, the group effects, and
piles undergoing lateral soil movement are diffi-
cult to be analysed by theoretical methods.
Experimental research may then be considered
as the most adapted way to investigate such a
problem. The last four decades were marked by a
considerable progress in the understanding of the
response of a pile to bending forces by means of
several experimental studies in full-scale as well
as in centrifuge.
Prior to the development of numerical meth-
ods in geotechnical engineering, piles were usu-
ally designed by evaluating the deflections under
working loads on the basis of small displacement
methods such as the elasticity. Subgrade reaction
theory was also used for the linear analysis of pile
deflection by modelling the pile as a beam on
elastic foundations. These approaches were
adapted for simple pile/soil configuration and do
not account for the soil properties heterogeneity
and the non-linear lateral response of the pile/soil
284 Geotech Geol Eng (2007) 25:283–301
123
system. Moreover, foundations of some structures
working under severe lateral loading conditions
are designed on the basis of limit equilibrium
methods. These latter ones are based on approx-
imate mechanisms of soil resistance derived from
the lateral earth pressures theory (Bouafia 1990,
1998; Bouafia et al. 1991).
It is nowadays recognised that the design
methods based on P–Y curves are the most
reliable to the analysis of the behaviour of
laterally loaded single piles with possibility of
taking account of the non-homogeneity of soil
properties as well as of the material non linearity
in lateral pile/soil response. Soil/pile interface is
modelled by infinity of non-linear springs in
which the soil reaction P at a given depth is
undertaken by the spring for a lateral pile
displacement Y.
Full-scale tests on instrumented piles are often
used to investigate the soil/pile response in the
light of load-transfer theory. P–Y curves are
derived from bending moment profiles measured
by strain gauges along the pile. However, a few
full-scale tests on instrumented piles in sand
were reported in the literature with successful
derivation of P–Y curves from double differen-
tiation and integration of the bending moment
profile. The main difficulty in deriving these
curves is due to the high sensitivity of the lateral
soil reaction P to the experimental conditions as
well as to the method of fitting and differenti-
ation of bending moments (Bouafia and Garnier
1991).
This paper is aimed at presenting the results of
an extensive analysis of full-scale horizontal piles
loading tests in quite homogeneous sandy soils.
Test piles were well instrumented, and P–Y
curves were derived from the interpretation of
bending moment distribution along the experi-
mental pile. The experimental results presented
herein are part of an important research pro-
gramme carried out by the LCPC (Laboratoire
Central des Ponts & Chaussees, France) during
more than three decades.
It was shown the existence of fundamental
relationships between the P and Y curves param-
eters namely the lateral soil modulus and the
lateral soil resistance, the parameters of pressure-
meter test (PMT) and the lateral pile/soil stiffness
Kr. Based on these relationships, hyperbolic
functions were proposed to describe P–Y curves.
Validation process was undertaken by comput-
ing the tests piles used to derive such a method as
well as other test piles in sandy soils. Comparative
study showed the good prediction capability of
the proposed soil/pile stiffness dependant P–Y
curve methods compared to the current
approaches based on the PMT test.
2 Brief review of the methods of construction
of P–Y curves
To the knowledge of the author, the first study on
the basis of P–Y curves was due to Reese and
Matlock (1977) by introducing the concept of the
lateral reaction modulus previously defined by
Winkler (1867). The first generation of P–Y
curves was bilinear describing an elastic plastic
behaviour at the pile/soil interface.
The in-situ tests such as the PMT become
usual tools for pile foundations analysis and
design. The PMT test provides an experimental
stress–strain curve describing the borehole
response under radial loads. Some similitude
exists between the expansion of the PMT beor-
ehole and the mobilisation of the frontal lateral
reaction of the soil around a pile (Menard et al.
1969).
Geotechnical literature contains a diversity of
methods for deriving P–Y curves from PMT
parameters, namely the PMT deformation mod-
ulus Em and the limit PMT pressure pl. For
brevity, only the commonly used methods will be
presented hereafter.
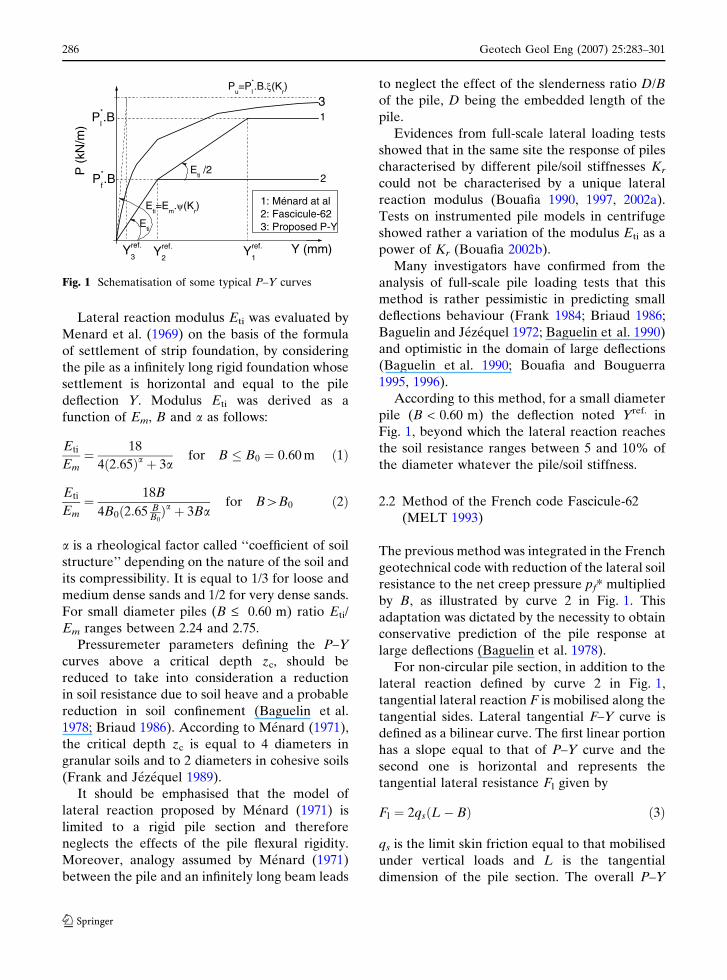
2.1 Method of Menard et al. (1969)
This method was initially suggested by Menard
et al. (1969), and then improved by Gambin
(1979). As illustrated in Fig. 1, the curve 1 is tri-
linear shaped. The first portion has a slope equal
to the initial lateral reaction modulus Eti, the
second one has a slope equal to the Eti/2 and the
third one corresponds to the lateral soil resistance
taken equal to net limit pressure multiplied by the
diameter (or the frontal width) B.
Geotech Geol Eng (2007) 25:283–301 285
123
Lateral reaction modulus Eti was evaluated by
Menard et al. (1969) on the basis of the formula
of settlement of strip foundation, by considering
the pile as a infinitely long rigid foundation whose
settlement is horizontal and equal to the pile
deflection Y. Modulus Eti was derived as a
function of Em, B and a as follows:
Eti
Em¼ 18
4ð2:65Þa þ 3afor B � B0 ¼ 0:60 m ð1Þ
Eti
Em¼ 18B
4B0ð2:65 BB0Þa þ 3Ba
for B[B0 ð2Þ
a is a rheological factor called ‘‘coefficient of soil
structure’’ depending on the nature of the soil and
its compressibility. It is equal to 1/3 for loose and
medium dense sands and 1/2 for very dense sands.
For small diameter piles (B £ 0.60 m) ratio Eti/
Em ranges between 2.24 and 2.75.
Pressuremeter parameters defining the P–Y
curves above a critical depth zc, should be
reduced to take into consideration a reduction
in soil resistance due to soil heave and a probable
reduction in soil confinement (Baguelin et al.
1978; Briaud 1986). According to Menard (1971),
the critical depth zc is equal to 4 diameters in
granular soils and to 2 diameters in cohesive soils
(Frank and Jezequel 1989).
It should be emphasised that the model of
lateral reaction proposed by Menard (1971) is
limited to a rigid pile section and therefore
neglects the effects of the pile flexural rigidity.
Moreover, analogy assumed by Menard (1971)
between the pile and an infinitely long beam leads
to neglect the effect of the slenderness ratio D/B
of the pile, D being the embedded length of the
pile.
Evidences from full-scale lateral loading tests
showed that in the same site the response of piles
characterised by different pile/soil stiffnesses Kr
could not be characterised by a unique lateral
reaction modulus (Bouafia 1990, 1997, 2002a).
Tests on instrumented pile models in centrifuge
showed rather a variation of the modulus Eti as a
power of Kr (Bouafia 2002b).
Many investigators have confirmed from the
analysis of full-scale pile loading tests that this
method is rather pessimistic in predicting small
deflections behaviour (Frank 1984; Briaud 1986;
Baguelin and Jezequel 1972; Baguelin et al. 1990)
and optimistic in the domain of large deflections
(Baguelin et al. 1990; Bouafia and Bouguerra
1995, 1996).
According to this method, for a small diameter
pile (B < 0.60 m) the deflection noted Yref. in
Fig. 1, beyond which the lateral reaction reaches
the soil resistance ranges between 5 and 10% of
the diameter whatever the pile/soil stiffness.
2.2 Method of the French code Fascicule-62
(MELT 1993)
The previous method was integrated in the French
geotechnical code with reduction of the lateral soil
resistance to the net creep pressure pf* multiplied
by B, as illustrated by curve 2 in Fig. 1. This
adaptation was dictated by the necessity to obtain
conservative prediction of the pile response at
large deflections (Baguelin et al. 1978).
For non-circular pile section, in addition to the
lateral reaction defined by curve 2 in Fig. 1,
tangential lateral reaction F is mobilised along the
tangential sides. Lateral tangential F–Y curve is
defined as a bilinear curve. The first linear portion
has a slope equal to that of P–Y curve and the
second one is horizontal and represents the
tangential lateral resistance Fl given by
Fl ¼ 2qsðL� BÞ ð3Þ
qs is the limit skin friction equal to that mobilised
under vertical loads and L is the tangential
dimension of the pile section. The overall P–Y
Yref.
3 Yref.
2
Eti /2
P*
f.B
P (
kN/m
)
Y (mm)
1: Ménard at al2: Fascicule-623: Proposed P-Y
P*
l.B
Pu=P*
l.B.ξ(K
r)
1
2
3
Eti=E
m.ψ(K
r)
Eti
Yref.
1
Fig. 1 Schematisation of some typical P–Y curves
286 Geotech Geol Eng (2007) 25:283–301
123
curve is the superposition of the two lateral
reaction curves.
2.3 Method of Dunand (1981)
This method is based on a bi-linear P–Y curve as
illustrated by curve 2 in Fig. 1. Lateral reaction
modulus was correlated to Em on the basis of an
elastic method whereas the limit lateral reaction
is equal to plB. The concept of critical depth is
introduced as in the previous methods. According
to the author, this method is recommended to the
design of drilled piers supporting transmission
line structures.
2.4 Method of Briaud et al. (1985)
The total lateral reaction P to the deflection Y at
a given depth is the sum of the frontal reaction Q
and the tangential reaction F. As a result, the P–Y
is the addition of the Q–Y curve and the F–Y
curve. Carayannacon et al. (1979) showed by
finite element analysis that the contribution of
the tangential reaction increases with slenderness
of the pile section.
The main assumption in this method is that
radial displacements of a PMT borehole and the
pile deflections are homothetic. Q–Y is directly
built from the expansion curve of the PMT test as
follows:
Q ¼ Sf p�B ð4Þ
Y ¼ BDR
2R0ð5Þ
The shape factor Sf is equal to 1 for square
piles and to p/4 for circular section. R0 and DR are
respectively the initial PMT borehole radius and
the increase in borehole radius under the net
pressure p*.
F–Y curves have a bilinear shape composed of
an initial portion with a slope equal to 2Gr, Gr
being the PMT shear modulus, and a horizontal
asymptote equal to the limit frontal reaction Fl as
follows:
F l ¼ StqsB ð6Þ
The shape factor St is equal to 2 for square piles
and to 1 for circular pile section. Limit skin
friction qs slightly differs from the one mobilised
along the pile shaft under vertical loads and then
may be evaluated with usual bearing capacity
formulae (Smith 1987).
According to the authors, the assessment of
this method with respect to the experimental
evidence of 27 pile loading tests carried out in a
variety of piles and soils showed a good predictive
capability of pile deflections (Briaud 1986).
2.5 Method of Baguelin et al. (1978)
In this method, based on the self-boring pres-
suremeter test (SBPMT), the total P–Y curve is
constructed point by point from the experimental
PMT expansion curve as follows:
F ¼ g p�B ð7Þ
Y ¼ BDV
4V0ð8Þ
V0 and DV are respectively the initial PMT
borehole volume and the increase in borehole
volume under the net pressure p* g is called
lateral resistance factor taking into account the
surface effect and varies form 0.33 to 3 (Baguelin
1982).
2.6 Method of Robertson et al. (1984)
P–Y curve is constructed for a bored pile from a
prebored PMT or a self-boring PMT, and for a
driven pile from a pushed-in PMT test. Formulae
5 and 7 should be used with factor g equal for
sandy soils to 0 at surface and increasing linearly
with depth to 1.5 at the critical depth and below.
The critical depth was estimated to 4 diameters
(Robertson et al. 1985).
Atukoralla and Byrne (1984) analysed by finite
element modelling the lateral displacements of a
rigid disk within an elastic plastic material as well
as those due the cylindrical cavity expansion
within the same material. It was shown that the
ratio of lateral pressures surrounding the disk to
those around the PMT cavity varies between 1.4
and 1.7 with an average value of 1.50, which is in
Geotech Geol Eng (2007) 25:283–301 287
123
accordance with the factor g of this method.
However, results of this study do not account for
the tridimensional response of the pile under
lateral loads.
As summarised in Table 1, the ratio of lateral
soil resistance Pu to PlB proposed by the methods
mentioned above ranges in a wide margin betw-
een 0.3 and 3, which shows some uncertainty in
predicting the soil resistance. As an alternative,
the Experimental analysis of instrumented test
piles will be used in the next section to evaluate
the lateral soil resistance.
3 Presentation of full-scale tests in sand
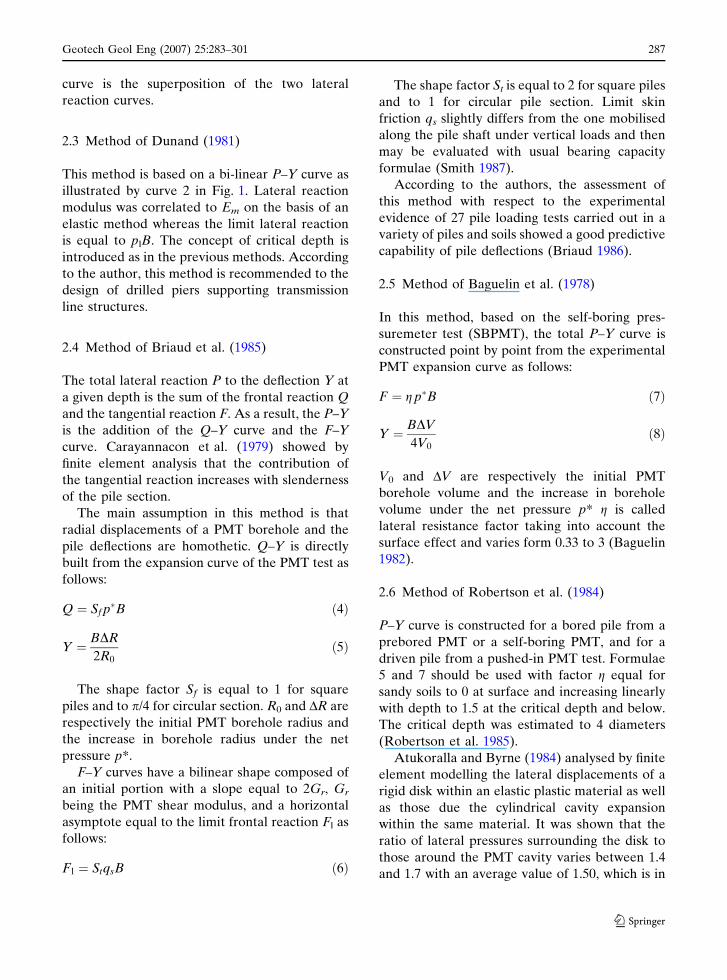
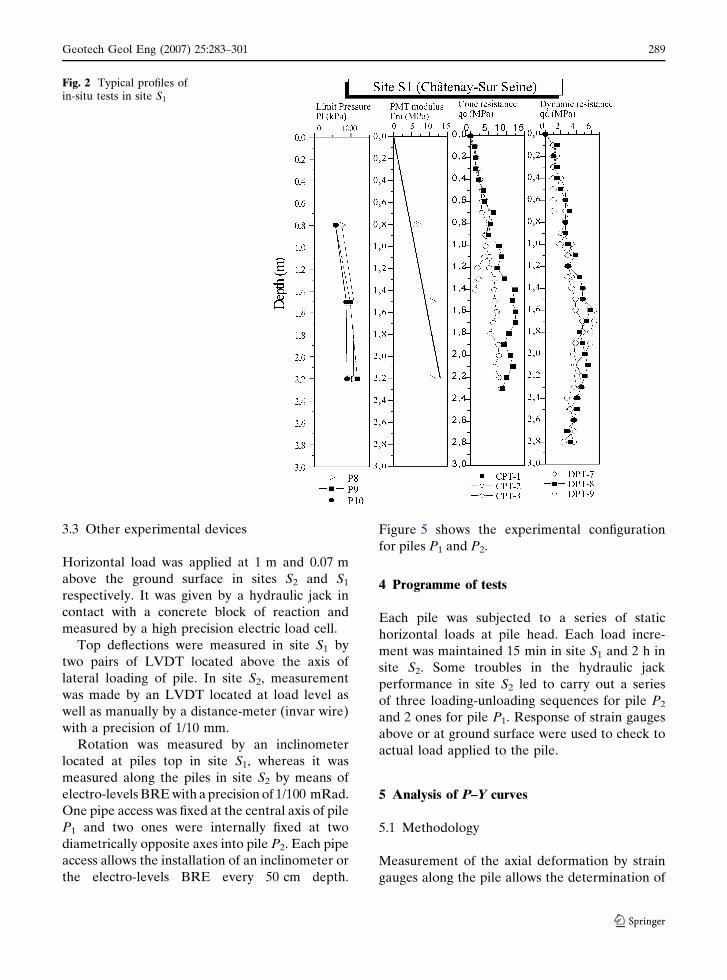
3.1 Sites and geotechnical conditions
The first site, noted S1, is located in Chatenay-sur-
Seine, 70 km south east of Paris (France). A big
pit whose volume is 424 m3 was previously dug to
a depth of 3.20 m in a chalky soil. It was
waterproofed by plastic sheets, and then filled in
by Fontainebleau sand into two medium dense
layers. The underlying layer is 1.40 m thick with a
density index Id = 37% whereas the upper layer
has a thickness of 1.80 m and Id = 57%. Fon-
tainebleau sand is poorly graded sand. In-situ
tests, notably PMT (Menard pre-bored pressure-
meter test), CPT (static cone resistance test) and
DPT (dynamic penetration test) were carried out
and typical profiles are shown in Fig. 2.
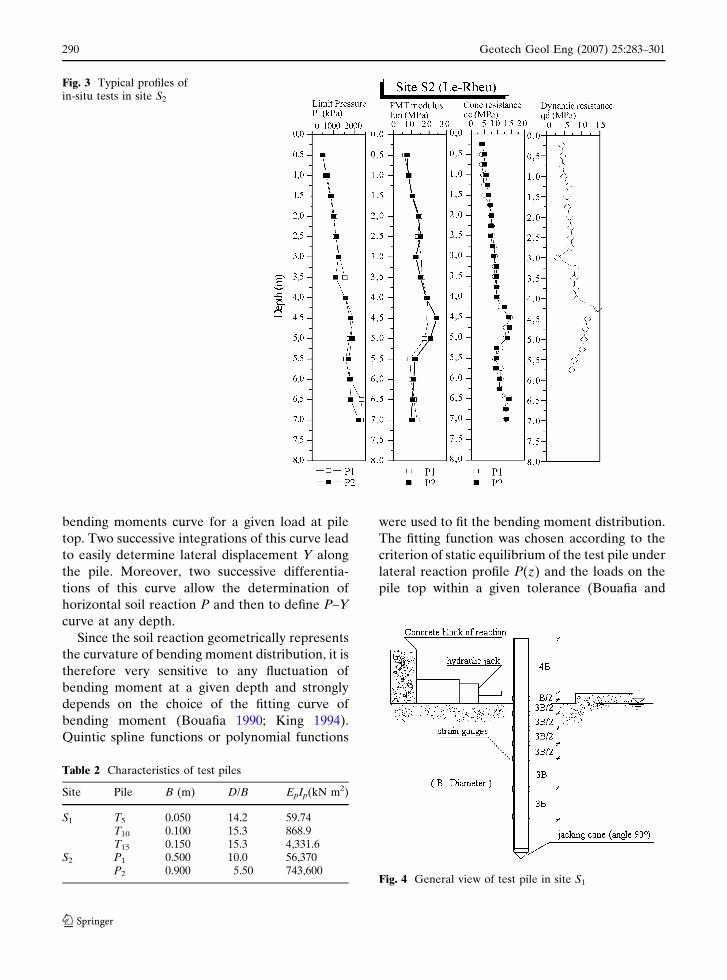
The second site, noted S2, is located in Le-Rheu,
5 km south west of Rennes (France). The soil is
composed of reddish poorly graded clean sand of
marine origin from the Pliocene era. Ground
water table was found at 10 m of depth. The sand
above water table has average water content of
8% corresponding to a saturation degree of 31%.
It was possible to recover some samples with a
150 mm diameter auger sampler up to 4.0 m of
depth. The density index Id measured according
to ASTM standard is 66%. Profiles of PMT, CPT
and DPT tests are illustrated in Fig. 3.
3.2 Test piles
Test piles are steel pipes instrumented by strain
gauges distributed by pairs along two diametri-
cally opposite axes. Table 2 summarises the
main geometrical and mechanical characteristics
of the piles. Three tubes, noted T5, T10 and T15
were tested in site S1 and two piles P1 and P2
tested in site S2. The slenderness ratio (embed-
ded length D/diameter B) varies between 5.5
and 15.3.
Piles in site S1 are externally instrumented by
seven pairs of strain gauges irregularly distributed
along two diametrically opposite axes and pro-
tected by an adhesive papers of aluminium.
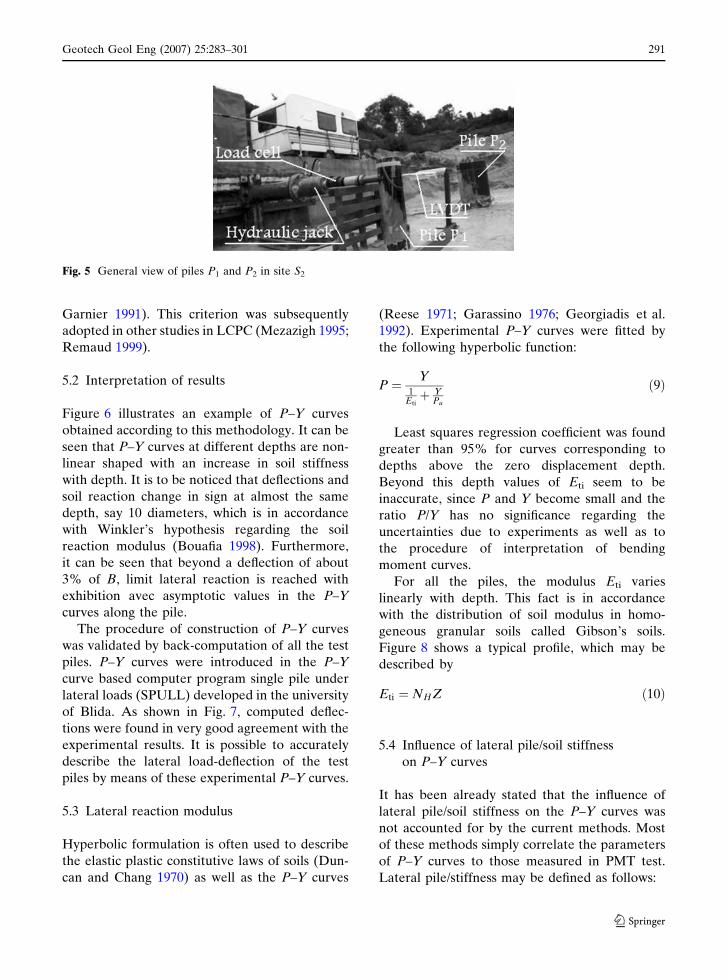
Figure 4 illustrates a general view of piles in site
S1 with the scheme of loading device. Each pile in
this site was connected at its tip by a 90� jacking
cone in order to facilitate the jacking process into
soil. As shown in Fig. 4, the cone has same
diameter as that of the pile. Each pile was jacked
by means of a hydraulic jack in contact with a
reaction beam (Canepa et al. 1987).
Piles P1 and P2 in site S2 are instrumented by
20 and 22 pairs of strain gauges, respectively.
These latter are externally placed along the pile
P1 and protected by steel valley for each axis. For
pile P2, they are internally stuck along two axes
along the pile. For both the piles strain gauges are
regularly spaced of 25 cm and the first one
corresponds to the ground surface. Each pile
was placed into a borehole previously made by a
helical drilling engine 6 m high. Some irregularity
in diameter of borehole within 5 cm was noticed.
It was likely due to a default of verticality of
drilling axis (Jezequel 1988). Each pile in site S1
was filled in with bentonite-cement grout. The
diameter of pile was directly measured at surface
as well as estimated from the volumes of steel and
bentonite-cement. Uniaxial compression tests of
bentonite samples have given a Young’s modulus
of 3,500 MPa at 28 days.
Table 1 Comparison of theoretical ratios Pu/plB
Method Pu/plB Remarks
Menard et al. (1969) 1.00Fascicule-62 0.50 Usual correlation
pf � pl/2Dunand (1981) 1.00Briaud et al. (1982) 0.83 Bored pile in sandBaguelin et al. (1977) 0.3–3.0Robertson et al. (1984, 1985) 1.50 Beyond 4B
288 Geotech Geol Eng (2007) 25:283–301
123
3.3 Other experimental devices
Horizontal load was applied at 1 m and 0.07 m
above the ground surface in sites S2 and S1
respectively. It was given by a hydraulic jack in
contact with a concrete block of reaction and
measured by a high precision electric load cell.
Top deflections were measured in site S1 by
two pairs of LVDT located above the axis of
lateral loading of pile. In site S2, measurement
was made by an LVDT located at load level as
well as manually by a distance-meter (invar wire)
with a precision of 1/10 mm.
Rotation was measured by an inclinometer
located at piles top in site S1, whereas it was
measured along the piles in site S2 by means of
electro-levels BRE with a precision of 1/100 mRad.
One pipe access was fixed at the central axis of pile
P1 and two ones were internally fixed at two
diametrically opposite axes into pile P2. Each pipe
access allows the installation of an inclinometer or
the electro-levels BRE every 50 cm depth.
Figure 5 shows the experimental configuration
for piles P1 and P2.
4 Programme of tests
Each pile was subjected to a series of static
horizontal loads at pile head. Each load incre-
ment was maintained 15 min in site S1 and 2 h in
site S2. Some troubles in the hydraulic jack
performance in site S2 led to carry out a series
of three loading-unloading sequences for pile P2
and 2 ones for pile P1. Response of strain gauges
above or at ground surface were used to check to
actual load applied to the pile.
5 Analysis of P–Y curves
5.1 Methodology
Measurement of the axial deformation by strain
gauges along the pile allows the determination of
Fig. 2 Typical profiles ofin-situ tests in site S1
Geotech Geol Eng (2007) 25:283–301 289
123
bending moments curve for a given load at pile
top. Two successive integrations of this curve lead
to easily determine lateral displacement Y along
the pile. Moreover, two successive differentia-
tions of this curve allow the determination of
horizontal soil reaction P and then to define P–Y
curve at any depth.
Since the soil reaction geometrically represents
the curvature of bending moment distribution, it is
therefore very sensitive to any fluctuation of
bending moment at a given depth and strongly
depends on the choice of the fitting curve of
bending moment (Bouafia 1990; King 1994).
Quintic spline functions or polynomial functions
were used to fit the bending moment distribution.
The fitting function was chosen according to the
criterion of static equilibrium of the test pile under
lateral reaction profile P(z) and the loads on the
pile top within a given tolerance (Bouafia and
Fig. 3 Typical profiles ofin-situ tests in site S2
Table 2 Characteristics of test piles
Site Pile B (m) D/B EpIp(kN m2)
S1 T5 0.050 14.2 59.74T10 0.100 15.3 868.9T15 0.150 15.3 4,331.6
S2 P1 0.500 10.0 56,370P2 0.900 5.50 743,600
Fig. 4 General view of test pile in site S1
290 Geotech Geol Eng (2007) 25:283–301
123
Garnier 1991). This criterion was subsequently
adopted in other studies in LCPC (Mezazigh 1995;
Remaud 1999).
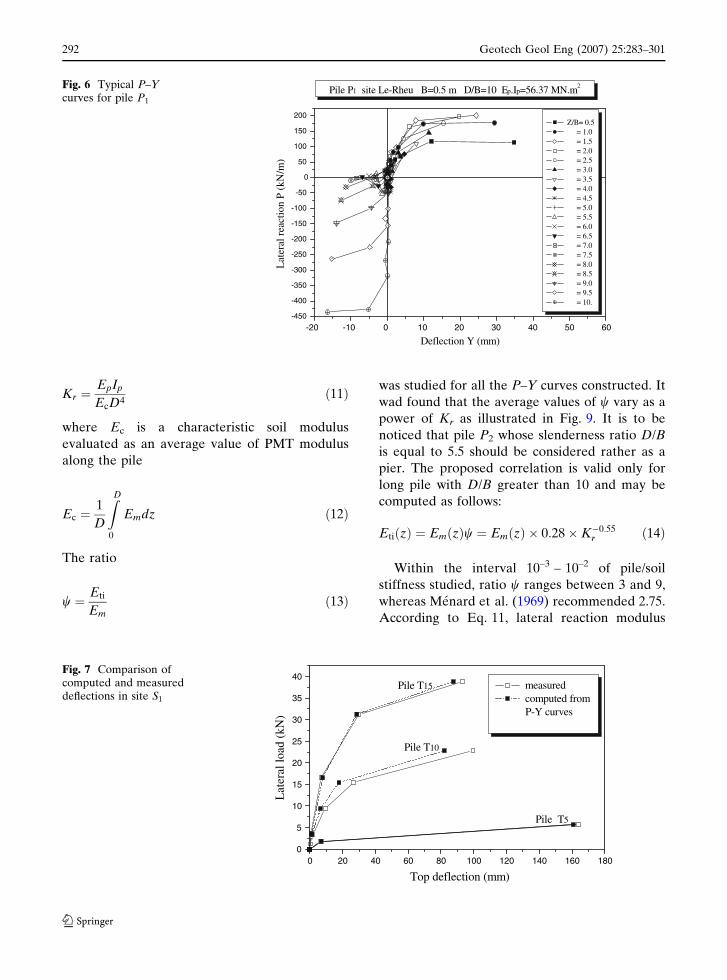
5.2 Interpretation of results
Figure 6 illustrates an example of P–Y curves
obtained according to this methodology. It can be
seen that P–Y curves at different depths are non-
linear shaped with an increase in soil stiffness
with depth. It is to be noticed that deflections and
soil reaction change in sign at almost the same
depth, say 10 diameters, which is in accordance
with Winkler’s hypothesis regarding the soil
reaction modulus (Bouafia 1998). Furthermore,
it can be seen that beyond a deflection of about
3% of B, limit lateral reaction is reached with
exhibition avec asymptotic values in the P–Y
curves along the pile.
The procedure of construction of P–Y curves
was validated by back-computation of all the test
piles. P–Y curves were introduced in the P–Y
curve based computer program single pile under
lateral loads (SPULL) developed in the university
of Blida. As shown in Fig. 7, computed deflec-
tions were found in very good agreement with the
experimental results. It is possible to accurately
describe the lateral load-deflection of the test
piles by means of these experimental P–Y curves.
5.3 Lateral reaction modulus
Hyperbolic formulation is often used to describe
the elastic plastic constitutive laws of soils (Dun-
can and Chang 1970) as well as the P–Y curves
(Reese 1971; Garassino 1976; Georgiadis et al.
1992). Experimental P–Y curves were fitted by
the following hyperbolic function:
P ¼ Y1
Etiþ Y
Pu
ð9Þ
Least squares regression coefficient was found
greater than 95% for curves corresponding to
depths above the zero displacement depth.
Beyond this depth values of Eti seem to be
inaccurate, since P and Y become small and the
ratio P/Y has no significance regarding the
uncertainties due to experiments as well as to
the procedure of interpretation of bending
moment curves.
For all the piles, the modulus Eti varies
linearly with depth. This fact is in accordance
with the distribution of soil modulus in homo-
geneous granular soils called Gibson’s soils.
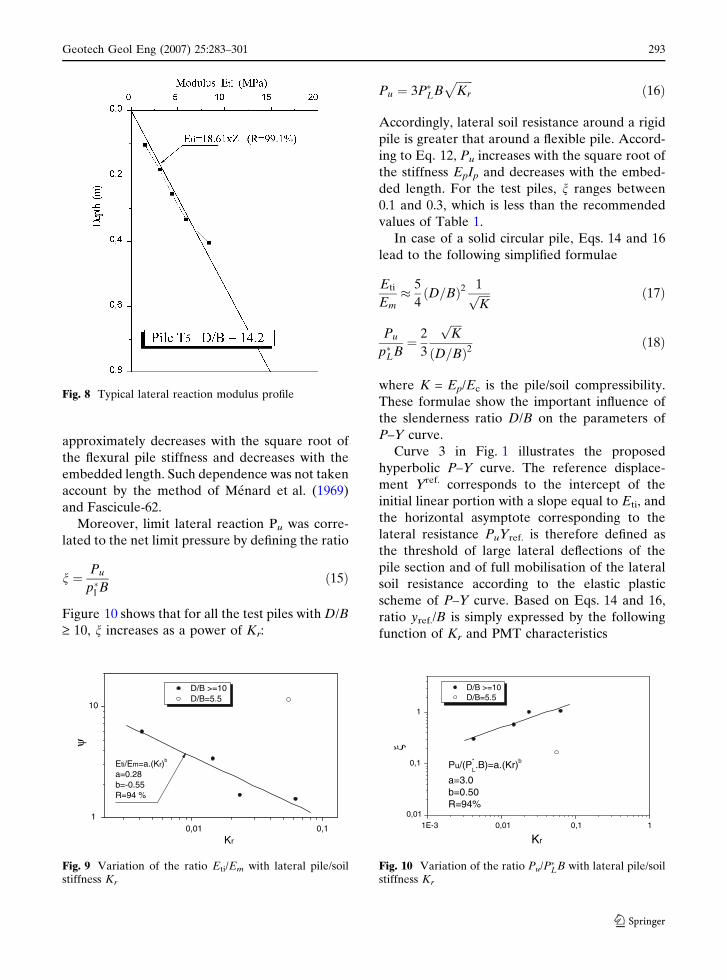
Figure 8 shows a typical profile, which may be
described by
Eti ¼ NHZ ð10Þ
5.4 Influence of lateral pile/soil stiffness
on P–Y curves
It has been already stated that the influence of
lateral pile/soil stiffness on the P–Y curves was
not accounted for by the current methods. Most
of these methods simply correlate the parameters
of P–Y curves to those measured in PMT test.
Lateral pile/stiffness may be defined as follows:
Fig. 5 General view of piles P1 and P2 in site S2
Geotech Geol Eng (2007) 25:283–301 291
123
Kr ¼EpIp
EcD4ð11Þ
where Ec is a characteristic soil modulus
evaluated as an average value of PMT modulus
along the pile
Ec ¼1
D
ZD
0
Emdz ð12Þ
The ratio
w ¼ Eti
Emð13Þ
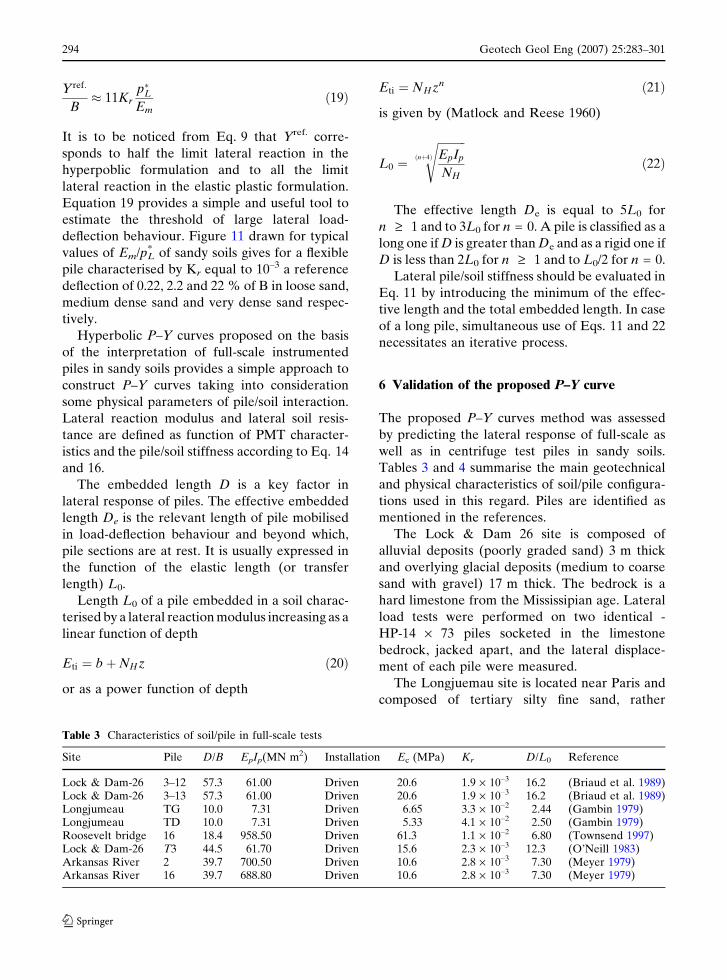
was studied for all the P–Y curves constructed. It
wad found that the average values of w vary as a
power of Kr as illustrated in Fig. 9. It is to be
noticed that pile P2 whose slenderness ratio D/B
is equal to 5.5 should be considered rather as a
pier. The proposed correlation is valid only for
long pile with D/B greater than 10 and may be
computed as follows:
EtiðzÞ ¼ EmðzÞw ¼ EmðzÞ � 0:28�K�0:55r ð14Þ
Within the interval 10–3 – 10–2 of pile/soil
stiffness studied, ratio w ranges between 3 and 9,
whereas Menard et al. (1969) recommended 2.75.
According to Eq. 11, lateral reaction modulus
-20-450
-400
-350
-300
-250
-200
-150
-100
-50
0
50
100
150
200
Pile P1 site Le-Rheu B=0.5 m D/B=10 Ep.Ip=56.37 MN.m2
Z/B= 0.5 = 1.0 = 1.5 = 2.0 = 2.5 = 3.0 = 3.5 = 4.0 = 4.5 = 5.0 = 5.5 = 6.0 = 6.5 = 7.0 = 7.5 = 8.0 = 8.5 = 9.0 = 9.5 = 10.
Lat
eral
rea
ctio
n P
(kN
/m)
Deflection Y (mm)-10 0 10 20 30 40 50 60
Fig. 6 Typical P–Ycurves for pile P1
00
5
10
15
20
25
30
35
40Pile T15
Pile T10
Pile T5
measured computed from
P-Y curves
Lat
eral
load
(kN
)
Top deflection (mm)20 40 60 80 100 120 140 160 180
Fig. 7 Comparison ofcomputed and measureddeflections in site S1
292 Geotech Geol Eng (2007) 25:283–301
123
approximately decreases with the square root of
the flexural pile stiffness and decreases with the
embedded length. Such dependence was not taken
account by the method of Menard et al. (1969)
and Fascicule-62.
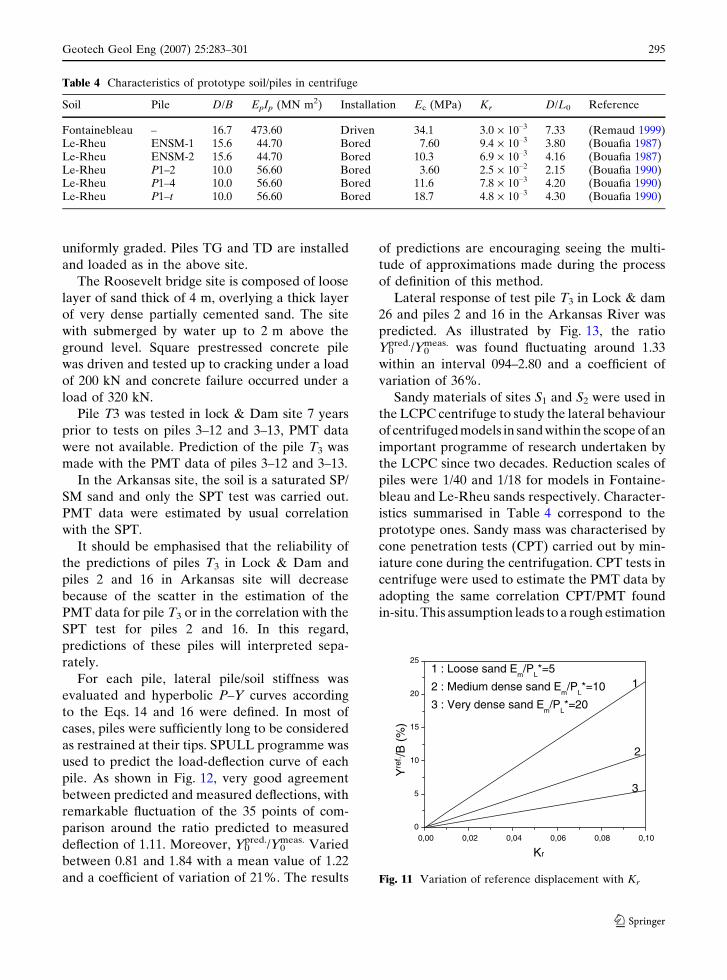
Moreover, limit lateral reaction Pu was corre-
lated to the net limit pressure by defining the ratio
n ¼ Pu
p�l Bð15Þ
Figure 10 shows that for all the test piles with D/B
‡ 10, n increases as a power of Kr:
Pu ¼ 3P�LBffiffiffiffiffiffiKr
pð16Þ
Accordingly, lateral soil resistance around a rigid
pile is greater that around a flexible pile. Accord-
ing to Eq. 12, Pu increases with the square root of
the stiffness EpIp and decreases with the embed-
ded length. For the test piles, n ranges between
0.1 and 0.3, which is less than the recommended
values of Table 1.
In case of a solid circular pile, Eqs. 14 and 16
lead to the following simplified formulae
Eti
Em� 5
4ðD=BÞ2 1ffiffiffiffi
Kp ð17Þ
Pu
p�LB¼ 2
3
ffiffiffiffiKp
ðD=BÞ2ð18Þ
where K = Ep/Ec is the pile/soil compressibility.
These formulae show the important influence of
the slenderness ratio D/B on the parameters of
P–Y curve.
Curve 3 in Fig. 1 illustrates the proposed
hyperbolic P–Y curve. The reference displace-
ment Yref. corresponds to the intercept of the
initial linear portion with a slope equal to Eti, and
the horizontal asymptote corresponding to the
lateral resistance PuYref. is therefore defined as
the threshold of large lateral deflections of the
pile section and of full mobilisation of the lateral
soil resistance according to the elastic plastic
scheme of P–Y curve. Based on Eqs. 14 and 16,
ratio yref./B is simply expressed by the following
function of Kr and PMT characteristics
Fig. 8 Typical lateral reaction modulus profile
0,011
10
Eti/Em=a.(Kr)b
a=0.28b=-0.55R=94 %
D/B >=10 D/B=5.5
ψ
Kr
0,1
Fig. 9 Variation of the ratio Eti/Em with lateral pile/soilstiffness Kr
1E-30,01
0,1
1
Pu/(P*
L.B)=a.(Kr)b
a=3.0b=0.50R=94%
D/B >=10 D/B=5.5
ξ
Kr
0,01 0,1 1
Fig. 10 Variation of the ratio Pu/P�LB with lateral pile/soilstiffness Kr
Geotech Geol Eng (2007) 25:283–301 293
123
Yref:
B� 11Kr
p�LEm
ð19Þ
It is to be noticed from Eq. 9 that Yref. corre-
sponds to half the limit lateral reaction in the
hyperpoblic formulation and to all the limit
lateral reaction in the elastic plastic formulation.
Equation 19 provides a simple and useful tool to
estimate the threshold of large lateral load-
deflection behaviour. Figure 11 drawn for typical
values of Em/pL* of sandy soils gives for a flexible
pile characterised by Kr equal to 10–3 a reference
deflection of 0.22, 2.2 and 22 % of B in loose sand,
medium dense sand and very dense sand respec-
tively.
Hyperbolic P–Y curves proposed on the basis
of the interpretation of full-scale instrumented
piles in sandy soils provides a simple approach to
construct P–Y curves taking into consideration
some physical parameters of pile/soil interaction.
Lateral reaction modulus and lateral soil resis-
tance are defined as function of PMT character-
istics and the pile/soil stiffness according to Eq. 14
and 16.
The embedded length D is a key factor in
lateral response of piles. The effective embedded
length De is the relevant length of pile mobilised
in load-deflection behaviour and beyond which,
pile sections are at rest. It is usually expressed in
the function of the elastic length (or transfer
length) L0.
Length L0 of a pile embedded in a soil charac-
terised by a lateral reaction modulus increasing as a
linear function of depth
Eti ¼ bþNHz ð20Þ
or as a power function of depth
Eti ¼ NHzn ð21Þ
is given by (Matlock and Reese 1960)
L0 ¼
ffiffiffiffiffiffiffiffiffiffiEpIp
NH
ðnþ4Þ
sð22Þ
The effective length De is equal to 5L0 for
n ‡ 1 and to 3L0 for n = 0. A pile is classified as a
long one if D is greater than De and as a rigid one if
D is less than 2L0 for n ‡ 1 and to L0/2 for n = 0.
Lateral pile/soil stiffness should be evaluated in
Eq. 11 by introducing the minimum of the effec-
tive length and the total embedded length. In case
of a long pile, simultaneous use of Eqs. 11 and 22
necessitates an iterative process.
6 Validation of the proposed P–Y curve
The proposed P–Y curves method was assessed
by predicting the lateral response of full-scale as
well as in centrifuge test piles in sandy soils.
Tables 3 and 4 summarise the main geotechnical
and physical characteristics of soil/pile configura-
tions used in this regard. Piles are identified as
mentioned in the references.
The Lock & Dam 26 site is composed of
alluvial deposits (poorly graded sand) 3 m thick
and overlying glacial deposits (medium to coarse
sand with gravel) 17 m thick. The bedrock is a
hard limestone from the Mississipian age. Lateral
load tests were performed on two identical -
HP-14 · 73 piles socketed in the limestone
bedrock, jacked apart, and the lateral displace-
ment of each pile were measured.
The Longjuemau site is located near Paris and
composed of tertiary silty fine sand, rather
Table 3 Characteristics of soil/pile in full-scale tests
Site Pile D/B EpIp(MN m2) Installation Ec (MPa) Kr D/L0 Reference
Lock & Dam-26 3–12 57.3 61.00 Driven 20.6 1.9 · 10–3 16.2 (Briaud et al. 1989)Lock & Dam-26 3–13 57.3 61.00 Driven 20.6 1.9 · 10–3 16.2 (Briaud et al. 1989)Longjumeau TG 10.0 7.31 Driven 6.65 3.3 · 10–2 2.44 (Gambin 1979)Longjumeau TD 10.0 7.31 Driven 5.33 4.1 · 10–2 2.50 (Gambin 1979)Roosevelt bridge 16 18.4 958.50 Driven 61.3 1.1 · 10–2 6.80 (Townsend 1997)Lock & Dam-26 T3 44.5 61.70 Driven 15.6 2.3 · 10–3 12.3 (O’Neill 1983)Arkansas River 2 39.7 700.50 Driven 10.6 2.8 · 10–3 7.30 (Meyer 1979)Arkansas River 16 39.7 688.80 Driven 10.6 2.8 · 10–3 7.30 (Meyer 1979)
294 Geotech Geol Eng (2007) 25:283–301
123
uniformly graded. Piles TG and TD are installed
and loaded as in the above site.
The Roosevelt bridge site is composed of loose
layer of sand thick of 4 m, overlying a thick layer
of very dense partially cemented sand. The site
with submerged by water up to 2 m above the
ground level. Square prestressed concrete pile
was driven and tested up to cracking under a load
of 200 kN and concrete failure occurred under a
load of 320 kN.
Pile T3 was tested in lock & Dam site 7 years
prior to tests on piles 3–12 and 3–13, PMT data
were not available. Prediction of the pile T3 was
made with the PMT data of piles 3–12 and 3–13.
In the Arkansas site, the soil is a saturated SP/
SM sand and only the SPT test was carried out.
PMT data were estimated by usual correlation
with the SPT.
It should be emphasised that the reliability of
the predictions of piles T3 in Lock & Dam and
piles 2 and 16 in Arkansas site will decrease
because of the scatter in the estimation of the
PMT data for pile T3 or in the correlation with the
SPT test for piles 2 and 16. In this regard,
predictions of these piles will interpreted sepa-
rately.
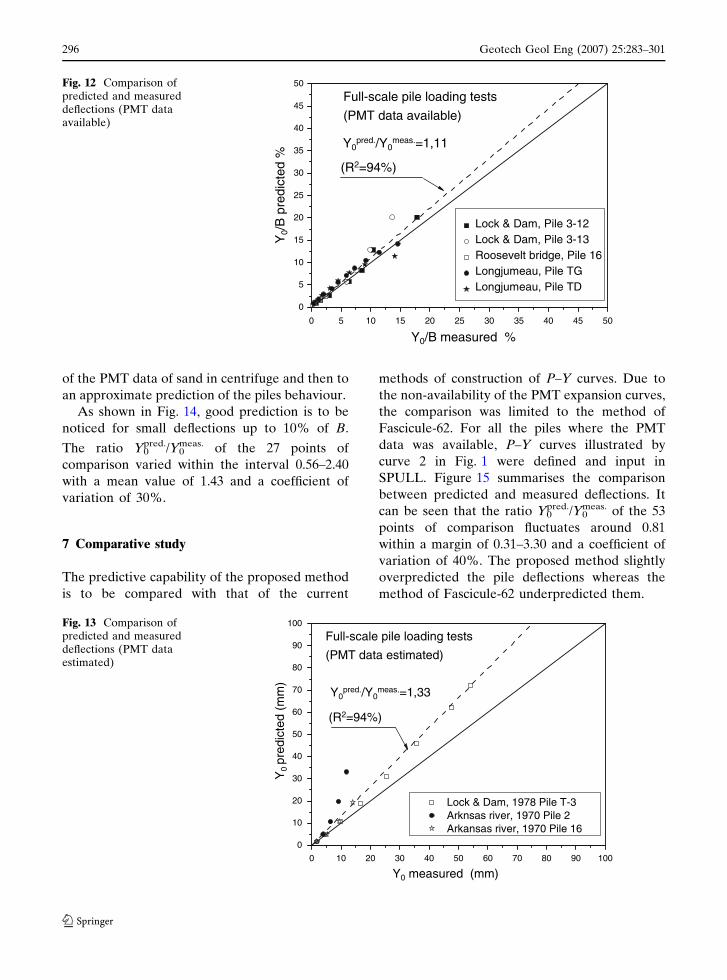
For each pile, lateral pile/soil stiffness was
evaluated and hyperbolic P–Y curves according
to the Eqs. 14 and 16 were defined. In most of
cases, piles were sufficiently long to be considered
as restrained at their tips. SPULL programme was
used to predict the load-deflection curve of each
pile. As shown in Fig. 12, very good agreement
between predicted and measured deflections, with
remarkable fluctuation of the 35 points of com-
parison around the ratio predicted to measured
deflection of 1.11. Moreover, Y0pred./Y0
meas. Varied
between 0.81 and 1.84 with a mean value of 1.22
and a coefficient of variation of 21%. The results
of predictions are encouraging seeing the multi-
tude of approximations made during the process
of definition of this method.
Lateral response of test pile T3 in Lock & dam
26 and piles 2 and 16 in the Arkansas River was
predicted. As illustrated by Fig. 13, the ratio
Y0pred./Y0
meas. was found fluctuating around 1.33
within an interval 094–2.80 and a coefficient of
variation of 36%.
Sandy materials of sites S1 and S2 were used in
the LCPC centrifuge to study the lateral behaviour
of centrifuged models in sand within the scope of an
important programme of research undertaken by
the LCPC since two decades. Reduction scales of
piles were 1/40 and 1/18 for models in Fontaine-
bleau and Le-Rheu sands respectively. Character-
istics summarised in Table 4 correspond to the
prototype ones. Sandy mass was characterised by
cone penetration tests (CPT) carried out by min-
iature cone during the centrifugation. CPT tests in
centrifuge were used to estimate the PMT data by
adopting the same correlation CPT/PMT found
in-situ. This assumption leads to a rough estimation
0,000
5
10
15
20
251 : Loose sand E
m/P
L*=5
2 : Medium dense sand Em/P
L*=10
3 : Very dense sand Em/P
L*=20
Yre
f. /B
(%
)
Kr
1
2
3
0,02 0,04 0,06 0,08 0,10
Fig. 11 Variation of reference displacement with Kr
Table 4 Characteristics of prototype soil/piles in centrifuge
Soil Pile D/B EpIp (MN m2) Installation Ec (MPa) Kr D/L0 Reference
Fontainebleau – 16.7 473.60 Driven 34.1 3.0 · 10–3 7.33 (Remaud 1999)Le-Rheu ENSM-1 15.6 44.70 Bored 7.60 9.4 · 10–3 3.80 (Bouafia 1987)Le-Rheu ENSM-2 15.6 44.70 Bored 10.3 6.9 · 10–3 4.16 (Bouafia 1987)Le-Rheu P1–2 10.0 56.60 Bored 3.60 2.5 · 10–2 2.15 (Bouafia 1990)Le-Rheu P1–4 10.0 56.60 Bored 11.6 7.8 · 10–3 4.20 (Bouafia 1990)Le-Rheu P1–t 10.0 56.60 Bored 18.7 4.8 · 10–3 4.30 (Bouafia 1990)
Geotech Geol Eng (2007) 25:283–301 295
123
of the PMT data of sand in centrifuge and then to
an approximate prediction of the piles behaviour.
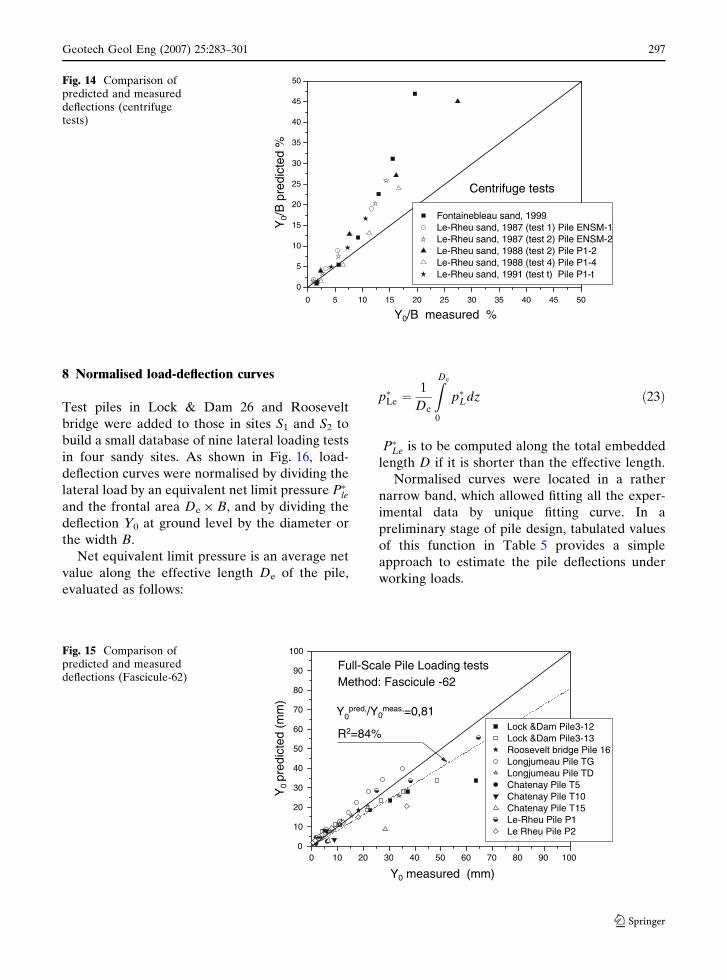
As shown in Fig. 14, good prediction is to be
noticed for small deflections up to 10% of B.
The ratio Y0pred./Y0
meas. of the 27 points of
comparison varied within the interval 0.56–2.40
with a mean value of 1.43 and a coefficient of
variation of 30%.
7 Comparative study
The predictive capability of the proposed method
is to be compared with that of the current
methods of construction of P–Y curves. Due to
the non-availability of the PMT expansion curves,
the comparison was limited to the method of
Fascicule-62. For all the piles where the PMT
data was available, P–Y curves illustrated by
curve 2 in Fig. 1 were defined and input in
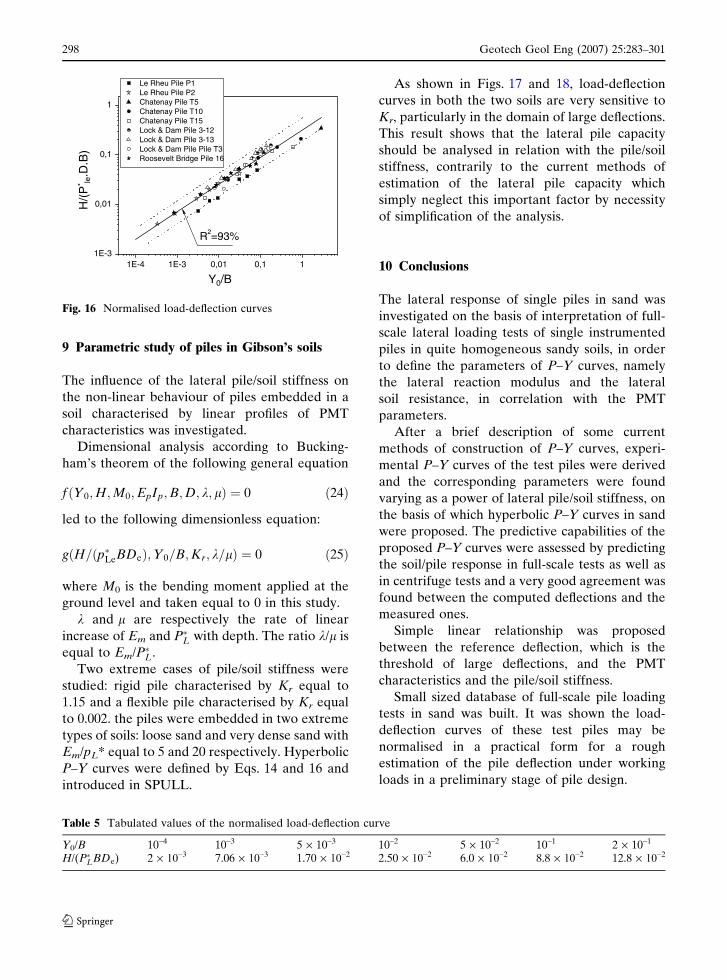
SPULL. Figure 15 summarises the comparison
between predicted and measured deflections. It
can be seen that the ratio Y0pred./Y0
meas. of the 53
points of comparison fluctuates around 0.81
within a margin of 0.31–3.30 and a coefficient of
variation of 40%. The proposed method slightly
overpredicted the pile deflections whereas the
method of Fascicule-62 underpredicted them.
0 5 10 15 20 25 30 35 40 45 50
0
5
10
15
20
25
30
35
40
45
50
Y0/
B p
redi
cted
%
Y0/B measured %
Lock & Dam, Pile 3-12 Lock & Dam, Pile 3-13 Roosevelt bridge, Pile 16 Longjumeau, Pile TG Longjumeau, Pile TD
Full-scale pile loading tests
(PMT data available)
Y0pred./Y0
meas.=1,11
(R2=94%)
Fig. 12 Comparison ofpredicted and measureddeflections (PMT dataavailable)
0 10 20 30 40 50 60 70 80 90 100
0
10
20
30
40
50
60
70
80
90
100
Y0 pr
edic
ted
(mm
)
Y0 measured (mm)
Lock & Dam, 1978 Pile T-3 Arknsas river, 1970 Pile 2 Arkansas river, 1970 Pile 16
Full-scale pile loading tests
(PMT data estimated)
Y0pred./Y0
meas.=1,33
(R2=94%)
Fig. 13 Comparison ofpredicted and measureddeflections (PMT dataestimated)
296 Geotech Geol Eng (2007) 25:283–301
123
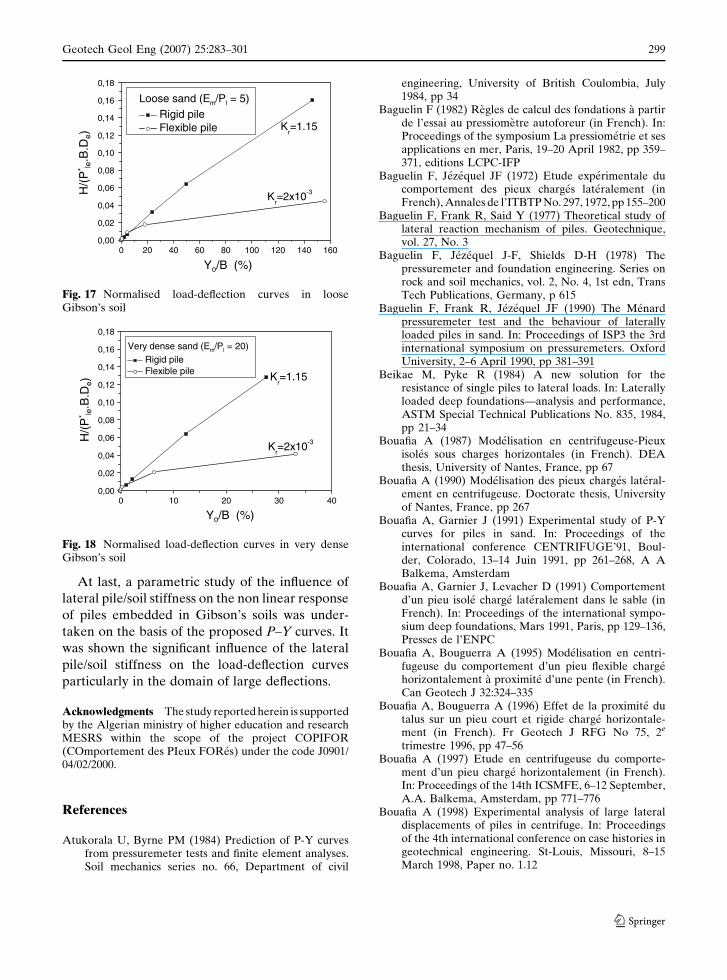
8 Normalised load-deflection curves
Test piles in Lock & Dam 26 and Roosevelt
bridge were added to those in sites S1 and S2 to
build a small database of nine lateral loading tests
in four sandy sites. As shown in Fig. 16, load-
deflection curves were normalised by dividing the
lateral load by an equivalent net limit pressure P�leand the frontal area De · B, and by dividing the
deflection Y0 at ground level by the diameter or
the width B.
Net equivalent limit pressure is an average net
value along the effective length De of the pile,
evaluated as follows:
p�Le ¼1
De
ZDe
0
p�Ldz ð23Þ
P�Le is to be computed along the total embedded
length D if it is shorter than the effective length.
Normalised curves were located in a rather
narrow band, which allowed fitting all the exper-
imental data by unique fitting curve. In a
preliminary stage of pile design, tabulated values
of this function in Table 5 provides a simple
approach to estimate the pile deflections under
working loads.
0 5 10 15 20 25 30 35 40 45 50
0
5
10
15
20
25
30
35
40
45
50
Centrifuge tests
Y0/
B p
redi
cted
%
Y0/B measured %
Fontainebleau sand, 1999 Le-Rheu sand, 1987 (test 1) Pile ENSM-1 Le-Rheu sand, 1987 (test 2) Pile ENSM-2 Le-Rheu sand, 1988 (test 2) Pile P1-2 Le-Rheu sand, 1988 (test 4) Pile P1-4 Le-Rheu sand, 1991 (test t) Pile P1-t
Fig. 14 Comparison ofpredicted and measureddeflections (centrifugetests)
00
10
20
30
40
50
60
70
80
90
100
Y0 pr
edic
ted
(mm
)
Y0 measured (mm)
Lock &Dam Pile3-12 Lock &Dam Pile3-13 Roosevelt bridge Pile 16 Longjumeau Pile TG Longjumeau Pile TD Chatenay Pile T5 Chatenay Pile T10 Chatenay Pile T15 Le-Rheu Pile P1 Le Rheu Pile P2
Full-Scale Pile Loading testsMethod: Fascicule -62
Y0pred,/Y0
meas,=0,81
R2=84%
10 20 30 40 50 60 70 80 90 100
Fig. 15 Comparison ofpredicted and measureddeflections (Fascicule-62)
Geotech Geol Eng (2007) 25:283–301 297
123
9 Parametric study of piles in Gibson’s soils
The influence of the lateral pile/soil stiffness on
the non-linear behaviour of piles embedded in a
soil characterised by linear profiles of PMT
characteristics was investigated.
Dimensional analysis according to Bucking-
ham’s theorem of the following general equation
f ðY0;H;M0;EpIp;B;D; k; lÞ ¼ 0 ð24Þ
led to the following dimensionless equation:
gðH=ðp�LeBDeÞ;Y0=B;Kr; k=lÞ ¼ 0 ð25Þ
where M0 is the bending moment applied at the
ground level and taken equal to 0 in this study.
k and l are respectively the rate of linear
increase of Em and P�L with depth. The ratio k/l is
equal to Em/P�L.
Two extreme cases of pile/soil stiffness were
studied: rigid pile characterised by Kr equal to
1.15 and a flexible pile characterised by Kr equal
to 0.002. the piles were embedded in two extreme
types of soils: loose sand and very dense sand with
Em/pL* equal to 5 and 20 respectively. Hyperbolic
P–Y curves were defined by Eqs. 14 and 16 and
introduced in SPULL.
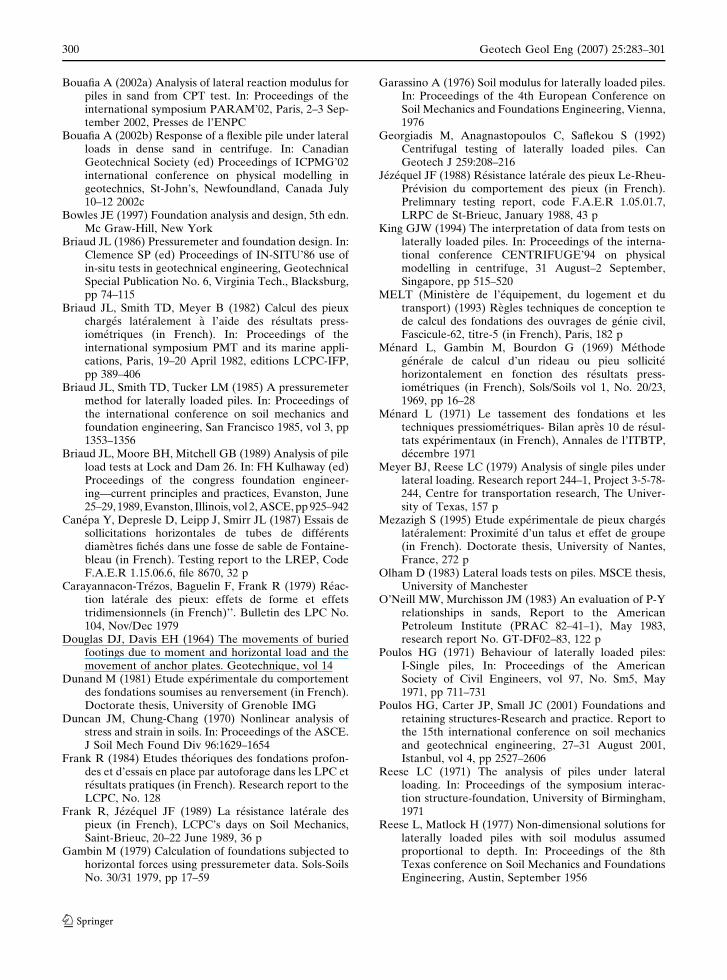
As shown in Figs. 17 and 18, load-deflection
curves in both the two soils are very sensitive to
Kr, particularly in the domain of large deflections.
This result shows that the lateral pile capacity
should be analysed in relation with the pile/soil
stiffness, contrarily to the current methods of
estimation of the lateral pile capacity which
simply neglect this important factor by necessity
of simplification of the analysis.
10 Conclusions
The lateral response of single piles in sand was
investigated on the basis of interpretation of full-
scale lateral loading tests of single instrumented
piles in quite homogeneous sandy soils, in order
to define the parameters of P–Y curves, namely
the lateral reaction modulus and the lateral
soil resistance, in correlation with the PMT
parameters.
After a brief description of some current
methods of construction of P–Y curves, experi-
mental P–Y curves of the test piles were derived
and the corresponding parameters were found
varying as a power of lateral pile/soil stiffness, on
the basis of which hyperbolic P–Y curves in sand
were proposed. The predictive capabilities of the
proposed P–Y curves were assessed by predicting
the soil/pile response in full-scale tests as well as
in centrifuge tests and a very good agreement was
found between the computed deflections and the
measured ones.
Simple linear relationship was proposed
between the reference deflection, which is the
threshold of large deflections, and the PMT
characteristics and the pile/soil stiffness.
Small sized database of full-scale pile loading
tests in sand was built. It was shown the load-
deflection curves of these test piles may be
normalised in a practical form for a rough
estimation of the pile deflection under working
loads in a preliminary stage of pile design.
1E-41E-3
0,01
0,1
1
Le Rheu Pile P1 Le Rheu Pile P2 Chatenay Pile T5 Chatenay Pile T10 Chatenay Pile T15 Lock & Dam Pile 3-12 Lock & Dam Pile 3-13 Lock & Dam Pile Pile T3 Roosevelt Bridge Pile 16
H/(
P* le
.D.B
)
Y0/B
R2=93%
1E-3 0,01 0,1 1
Fig. 16 Normalised load-deflection curves
Table 5 Tabulated values of the normalised load-deflection curve
Y0/B 10–4 10–3 5 · 10–3 10–2 5 · 10–2 10–1 2 · 10–1
H/(P�LBDe) 2 · 10–3 7.06 · 10–3 1.70 · 10–2 2.50 · 10–2 6.0 · 10–2 8.8 · 10–2 12.8 · 10–2
298 Geotech Geol Eng (2007) 25:283–301
123
At last, a parametric study of the influence of
lateral pile/soil stiffness on the non linear response
of piles embedded in Gibson’s soils was under-
taken on the basis of the proposed P–Y curves. It
was shown the significant influence of the lateral
pile/soil stiffness on the load-deflection curves
particularly in the domain of large deflections.
Acknowledgments The study reported herein is supportedby the Algerian ministry of higher education and researchMESRS within the scope of the project COPIFOR(COmportement des PIeux FORes) under the code J0901/04/02/2000.
References
Atukorala U, Byrne PM (1984) Prediction of P-Y curvesfrom pressuremeter tests and finite element analyses.Soil mechanics series no. 66, Department of civil
engineering, University of British Coulombia, July1984, pp 34
Baguelin F (1982) Regles de calcul des fondations a partirde l’essai au pressiometre autoforeur (in French). In:Proceedings of the symposium La pressiometrie et sesapplications en mer, Paris, 19–20 April 1982, pp 359–371, editions LCPC-IFP
Baguelin F, Jezequel JF (1972) Etude experimentale ducomportement des pieux charges lateralement (inFrench), Annales de l’ITBTP No. 297, 1972, pp 155–200
Baguelin F, Frank R, Said Y (1977) Theoretical study oflateral reaction mechanism of piles. Geotechnique,vol. 27, No. 3
Baguelin F, Jezequel J-F, Shields D-H (1978) Thepressuremeter and foundation engineering. Series onrock and soil mechanics, vol. 2, No. 4, 1st edn, TransTech Publications, Germany, p 615
Baguelin F, Frank R, Jezequel JF (1990) The Menardpressuremeter test and the behaviour of laterallyloaded piles in sand. In: Proceedings of ISP3 the 3rdinternational symposium on pressuremeters. OxfordUniversity, 2–6 April 1990, pp 381–391
Beikae M, Pyke R (1984) A new solution for theresistance of single piles to lateral loads. In: Laterallyloaded deep foundations—analysis and performance,ASTM Special Technical Publications No. 835, 1984,pp 21–34
Bouafia A (1987) Modelisation en centrifugeuse-Pieuxisoles sous charges horizontales (in French). DEAthesis, University of Nantes, France, pp 67
Bouafia A (1990) Modelisation des pieux charges lateral-ement en centrifugeuse. Doctorate thesis, Universityof Nantes, France, pp 267
Bouafia A, Garnier J (1991) Experimental study of P-Ycurves for piles in sand. In: Proceedings of theinternational conference CENTRIFUGE’91, Boul-der, Colorado, 13–14 Juin 1991, pp 261–268, A ABalkema, Amsterdam
Bouafia A, Garnier J, Levacher D (1991) Comportementd’un pieu isole charge lateralement dans le sable (inFrench). In: Proceedings of the international sympo-sium deep foundations, Mars 1991, Paris, pp 129–136,Presses de l’ENPC
Bouafia A, Bouguerra A (1995) Modelisation en centri-fugeuse du comportement d’un pieu flexible chargehorizontalement a proximite d’une pente (in French).Can Geotech J 32:324–335
Bouafia A, Bouguerra A (1996) Effet de la proximite dutalus sur un pieu court et rigide charge horizontale-ment (in French). Fr Geotech J RFG No 75, 2e
trimestre 1996, pp 47–56Bouafia A (1997) Etude en centrifugeuse du comporte-
ment d’un pieu charge horizontalement (in French).In: Proceedings of the 14th ICSMFE, 6–12 September,A.A. Balkema, Amsterdam, pp 771–776
Bouafia A (1998) Experimental analysis of large lateraldisplacements of piles in centrifuge. In: Proceedingsof the 4th international conference on case histories ingeotechnical engineering. St-Louis, Missouri, 8–15March 1998, Paper no. 1.12
00,00
0,02
0,04
0,06
0,08
0,10
0,12
0,14
0,16
0,18H
/(P
* le.B
.De)
Yo/B (%)
Loose sand (Em/Pl = 5) Rigid pile Flexible pile K
r=1.15
Kr=2x10⁻³
20 40 60 80 100 120 140 160
Fig. 17 Normalised load-deflection curves in looseGibson’s soil
00,00
0,02
0,04
0,06
0,08
0,10
0,12
0,14
0,16
0,18
H/(
P* le
.B.D
e)
Yo/B (%)
Very dense sand (Em/Pl = 20) Rigid pile Flexible pile K
r=1.15
Kr=2x10⁻³
10 20 30 40
Fig. 18 Normalised load-deflection curves in very denseGibson’s soil
Geotech Geol Eng (2007) 25:283–301 299
123
Bouafia A (2002a) Analysis of lateral reaction modulus forpiles in sand from CPT test. In: Proceedings of theinternational symposium PARAM’02, Paris, 2–3 Sep-tember 2002, Presses de l’ENPC
Bouafia A (2002b) Response of a flexible pile under lateralloads in dense sand in centrifuge. In: CanadianGeotechnical Society (ed) Proceedings of ICPMG’02international conference on physical modelling ingeotechnics, St-John’s, Newfoundland, Canada July10–12 2002c
Bowles JE (1997) Foundation analysis and design, 5th edn.Mc Graw-Hill, New York
Briaud JL (1986) Pressuremeter and foundation design. In:Clemence SP (ed) Proceedings of IN-SITU’86 use ofin-situ tests in geotechnical engineering, GeotechnicalSpecial Publication No. 6, Virginia Tech., Blacksburg,pp 74–115
Briaud JL, Smith TD, Meyer B (1982) Calcul des pieuxcharges lateralement a l’aide des resultats press-iometriques (in French). In: Proceedings of theinternational symposium PMT and its marine appli-cations, Paris, 19–20 April 1982, editions LCPC-IFP,pp 389–406
Briaud JL, Smith TD, Tucker LM (1985) A pressuremetermethod for laterally loaded piles. In: Proceedings ofthe international conference on soil mechanics andfoundation engineering, San Francisco 1985, vol 3, pp1353–1356
Briaud JL, Moore BH, Mitchell GB (1989) Analysis of pileload tests at Lock and Dam 26. In: FH Kulhaway (ed)Proceedings of the congress foundation engineer-ing—current principles and practices, Evanston, June25–29, 1989, Evanston, Illinois, vol 2, ASCE, pp 925–942
Canepa Y, Depresle D, Leipp J, Smirr JL (1987) Essais desollicitations horizontales de tubes de differentsdiametres fiches dans une fosse de sable de Fontaine-bleau (in French). Testing report to the LREP, CodeF.A.E.R 1.15.06.6, file 8670, 32 p
Carayannacon-Trezos, Baguelin F, Frank R (1979) Reac-tion laterale des pieux: effets de forme et effetstridimensionnels (in French)’’. Bulletin des LPC No.104, Nov/Dec 1979
Douglas DJ, Davis EH (1964) The movements of buriedfootings due to moment and horizontal load and themovement of anchor plates. Geotechnique, vol 14
Dunand M (1981) Etude experimentale du comportementdes fondations soumises au renversement (in French).Doctorate thesis, University of Grenoble IMG
Duncan JM, Chung-Chang (1970) Nonlinear analysis ofstress and strain in soils. In: Proceedings of the ASCE.J Soil Mech Found Div 96:1629–1654
Frank R (1984) Etudes theoriques des fondations profon-des et d’essais en place par autoforage dans les LPC etresultats pratiques (in French). Research report to theLCPC, No. 128
Frank R, Jezequel JF (1989) La resistance laterale despieux (in French), LCPC’s days on Soil Mechanics,Saint-Brieuc, 20–22 June 1989, 36 p
Gambin M (1979) Calculation of foundations subjected tohorizontal forces using pressuremeter data. Sols-SoilsNo. 30/31 1979, pp 17–59
Garassino A (1976) Soil modulus for laterally loaded piles.In: Proceedings of the 4th European Conference onSoil Mechanics and Foundations Engineering, Vienna,1976
Georgiadis M, Anagnastopoulos C, Saflekou S (1992)Centrifugal testing of laterally loaded piles. CanGeotech J 259:208–216
Jezequel JF (1988) Resistance laterale des pieux Le-Rheu-Prevision du comportement des pieux (in French).Prelimnary testing report, code F.A.E.R 1.05.01.7,LRPC de St-Brieuc, January 1988, 43 p
King GJW (1994) The interpretation of data from tests onlaterally loaded piles. In: Proceedings of the interna-tional conference CENTRIFUGE’94 on physicalmodelling in centrifuge, 31 August–2 September,Singapore, pp 515–520
MELT (Ministere de l’equipement, du logement et dutransport) (1993) Regles techniques de conception tede calcul des fondations des ouvrages de genie civil,Fascicule-62, titre-5 (in French), Paris, 182 p
Menard L, Gambin M, Bourdon G (1969) Methodegenerale de calcul d’un rideau ou pieu sollicitehorizontalement en fonction des resultats press-iometriques (in French), Sols/Soils vol 1, No. 20/23,1969, pp 16–28
Menard L (1971) Le tassement des fondations et lestechniques pressiometriques- Bilan apres 10 de resul-tats experimentaux (in French), Annales de l’ITBTP,decembre 1971
Meyer BJ, Reese LC (1979) Analysis of single piles underlateral loading. Research report 244–1, Project 3-5-78-244, Centre for transportation research, The Univer-sity of Texas, 157 p
Mezazigh S (1995) Etude experimentale de pieux chargeslateralement: Proximite d’un talus et effet de groupe(in French). Doctorate thesis, University of Nantes,France, 272 p
Olham D (1983) Lateral loads tests on piles. MSCE thesis,University of Manchester
O’Neill MW, Murchisson JM (1983) An evaluation of P-Yrelationships in sands, Report to the AmericanPetroleum Institute (PRAC 82–41–1), May 1983,research report No. GT-DF02–83, 122 p
Poulos HG (1971) Behaviour of laterally loaded piles:I-Single piles, In: Proceedings of the AmericanSociety of Civil Engineers, vol 97, No. Sm5, May1971, pp 711–731
Poulos HG, Carter JP, Small JC (2001) Foundations andretaining structures-Research and practice. Report tothe 15th international conference on soil mechanicsand geotechnical engineering, 27–31 August 2001,Istanbul, vol 4, pp 2527–2606
Reese LC (1971) The analysis of piles under lateralloading. In: Proceedings of the symposium interac-tion structure-foundation, University of Birmingham,1971
Reese L, Matlock H (1977) Non-dimensional solutions forlaterally loaded piles with soil modulus assumedproportional to depth. In: Proceedings of the 8thTexas conference on Soil Mechanics and FoundationsEngineering, Austin, September 1956
300 Geotech Geol Eng (2007) 25:283–301
123

Remaud D (1999) Pieux sous charges laterales-Etudeexperimentale de l’effet du groupe (in Franch).Doctorate thesis, University of Nantes, France, 303 p
Robertson PK, Hughes JMO, Campanella RG (1984)Design of laterally loaded displacement piles using adriven pressuremeter. In: Laterally loaded deepfoundations—analysis and performance, ASTM Spe-cial Technical Publications No. 835, 1984, pp 229–238
Robertson PK, Campanella RG, Brown PT (1985) Designof axially and laterally loaded piles using in-situ tests:a case history. Can Geotech J 22:518–527
Townsend F, Mc Vay (1997) Prediction and evaluation of alaterally loaded pile group at Roosevelt bridge.Report submitted to Florida department of transpor-tation, No. WPI 0510663, March 1997, 381 p
Smith TD (1987) Friction mobilisation F-Y curves forlaterally loaded piles from the pressuremeter. In:Proceedings of the international symposium on pre-dictions and performance in geotechnical engineering,Calgary, Canada, 17–19 June 1987, A. A. Balkema,Amsterdam, pp 89–95
Geotech Geol Eng (2007) 25:283–301 301
123