Single electrode micro-stimulation of rat auditory cortex: an evaluation of behavioral performance
10
Single electrode micro-stimulation of rat auditory cortex: an evaluation of behavioral performance Patrick J. Rousche a ; , Kevin J. Otto b;c , Mark P. Reilly d , Daryl R. Kipke b a Department of Bioengineering, University of Illinois at Chicago, 851 So. Morgan St., Room 218, Chicago, IL 60607, USA b Department of Biomedical Engineering, University of Michigan, Ann Arbor, MI 48109, USA c Department of Bioengineering, Arizona State University, Tempe, AZ 85287, USA d Department of Psychology, Arizona State University, Tempe, AZ 85287, USA Received 24 October 2002; accepted 28 February 2003 Abstract A combination of electrophysiological mapping, behavioral analysis and cortical micro-stimulation was used to explore the interrelation between the auditory cortex and behavior in the adult rat. Auditory discriminations were evaluated in eight rats trained to discriminate the presence or absence of a 75 dB pure tone stimulus. A probe trial technique was used to obtain intensity generalization gradients that described response probabilities to mid-level tones between 0 and 75 dB. The same rats were then chronically implanted in the auditory cortex with a 16 or 32 channel tungsten microwire electrode array. Implanted animals were then trained to discriminate the presence of single electrode micro-stimulation of magnitude 90 WA (22.5 nC/phase). Intensity generalization gradients were created to obtain the response probabilities to mid-level current magnitudes ranging from 0 to 90 WA on 36 different electrodes in six of the eight rats. The 50% point (the current level resulting in 50% detections) varied from 16.7 to 69.2 WA, with an overall mean of 42.4 ( ɔ 8.1) WA across all single electrodes. Cortical micro-stimulation induced sensory-evoked behavior with similar characteristics as normal auditory stimuli. The results highlight the importance of the auditory cortex in a discrimination task and suggest that micro-stimulation of the auditory cortex might be an effective means for a graded information transfer of auditory information directly to the brain as part of a cortical auditory prosthesis. ȣ 2003 Elsevier Science B.V. All rights reserved. Key words: Auditory cortex ; Micro-stimulation ; Neuroprosthetics ; Neuroscience ; Sensory perception 1. Introduction Knowledge of the structure^function organization of the rat auditory cortex has been obtained primarily through traditional single electrode electrophysiological mapping and/or lesion techniques. Early reports sug- gested that an intact auditory cortex was not necessary in the adult rat for the completion of auditory behav- iors such as frequency discrimination and sound local- ization (Birt et al., 1978; Kelly and Glazier, 1978; Kelly, 1990). More recently, however, Talwar et al. (2001) reported careful new observations that expanded on those studies. They demonstrated that temporary inactivation of the auditory cortex with muscimol (a GABAergic receptor agonist) leads to immediate and temporary tone ‘deafness’ in awake animals previously trained to detect pure tones. Thus, while animals may be able to eventually recover auditory function origi- nally ascribed to the auditory cortex, it remains that immediate deactivation of the auditory cortex can lead to dramatic, nearly instantaneous, de¢cits in auditory behavior. In an e¡ort to further uncover the role of the auditory cortex in auditory processing and behavior, we now pose the reverse question: Is the precise and immediate activation (via electrical micro-stimulation) of the auditory cortex su⁄cient to induce normal sensory-evoked behavior? The question has implica- 0378-5955 / 03 / $ ^ see front matter ȣ 2003 Elsevier Science B.V. All rights reserved. doi :10.1016/S0378-5955(03)00081-9 * Corresponding author. Tel.: +1 (312) 996 2333; Fax: +1 (312) 996 5921. E-mail address: [email protected] (P.J. Rousche). Abbreviations: LED, light-emitting diode Hearing Research 179 (2003) 62^71 R Available online at www.sciencedirect.com www.elsevier.com/locate/heares
Transcript of Single electrode micro-stimulation of rat auditory cortex: an evaluation of behavioral performance
Single electrode micro-stimulation of rat auditory cortex:an evaluation of behavioral performance
Patrick J. Rousche a;�, Kevin J. Otto b;c, Mark P. Reilly d, Daryl R. Kipke b
a Department of Bioengineering, University of Illinois at Chicago, 851 So. Morgan St., Room 218, Chicago, IL 60607, USAb Department of Biomedical Engineering, University of Michigan, Ann Arbor, MI 48109, USA
c Department of Bioengineering, Arizona State University, Tempe, AZ 85287, USAd Department of Psychology, Arizona State University, Tempe, AZ 85287, USA
Received 24 October 2002; accepted 28 February 2003
Abstract
A combination of electrophysiological mapping, behavioral analysis and cortical micro-stimulation was used to explore theinterrelation between the auditory cortex and behavior in the adult rat. Auditory discriminations were evaluated in eight ratstrained to discriminate the presence or absence of a 75 dB pure tone stimulus. A probe trial technique was used to obtain intensitygeneralization gradients that described response probabilities to mid-level tones between 0 and 75 dB. The same rats were thenchronically implanted in the auditory cortex with a 16 or 32 channel tungsten microwire electrode array. Implanted animals werethen trained to discriminate the presence of single electrode micro-stimulation of magnitude 90 WA (22.5 nC/phase). Intensitygeneralization gradients were created to obtain the response probabilities to mid-level current magnitudes ranging from 0 to 90 WAon 36 different electrodes in six of the eight rats. The 50% point (the current level resulting in 50% detections) varied from 16.7 to69.2 WA, with an overall mean of 42.4 ( ; 8.1) WA across all single electrodes. Cortical micro-stimulation induced sensory-evokedbehavior with similar characteristics as normal auditory stimuli. The results highlight the importance of the auditory cortex in adiscrimination task and suggest that micro-stimulation of the auditory cortex might be an effective means for a graded informationtransfer of auditory information directly to the brain as part of a cortical auditory prosthesis.< 2003 Elsevier Science B.V. All rights reserved.
Key words: Auditory cortex; Micro-stimulation; Neuroprosthetics; Neuroscience; Sensory perception
1. Introduction
Knowledge of the structure^function organization ofthe rat auditory cortex has been obtained primarilythrough traditional single electrode electrophysiologicalmapping and/or lesion techniques. Early reports sug-gested that an intact auditory cortex was not necessaryin the adult rat for the completion of auditory behav-iors such as frequency discrimination and sound local-ization (Birt et al., 1978; Kelly and Glazier, 1978;
Kelly, 1990). More recently, however, Talwar et al.(2001) reported careful new observations that expandedon those studies. They demonstrated that temporaryinactivation of the auditory cortex with muscimol (aGABAergic receptor agonist) leads to immediate andtemporary tone ‘deafness’ in awake animals previouslytrained to detect pure tones. Thus, while animals maybe able to eventually recover auditory function origi-nally ascribed to the auditory cortex, it remains thatimmediate deactivation of the auditory cortex can leadto dramatic, nearly instantaneous, de¢cits in auditorybehavior. In an e¡ort to further uncover the role of theauditory cortex in auditory processing and behavior,we now pose the reverse question: Is the precise andimmediate activation (via electrical micro-stimulation)of the auditory cortex su⁄cient to induce normalsensory-evoked behavior? The question has implica-
0378-5955 / 03 / $ ^ see front matter < 2003 Elsevier Science B.V. All rights reserved.doi:10.1016/S0378-5955(03)00081-9
* Corresponding author. Tel. : +1 (312) 996 2333;Fax: +1 (312) 996 5921.E-mail address: [email protected] (P.J. Rousche).
Abbreviations: LED, light-emitting diode
HEARES 4680 25-4-03
Hearing Research 179 (2003) 62^71
R
Available online at www.sciencedirect.com
www.elsevier.com/locate/heares
tions both for basic auditory neuroscience and for ap-plied cortical neuroprosthetics. Such a systems level ap-proach begins to allow for an assessment of the indi-vidual contributions to the perception of higher levelprocessing stages within the auditory pathway. If thesecontributions can be accurately determined, it may alsobe possible to shed more light on the use of multi-chan-nel electrical stimulation of the auditory cortex as aneuroprosthetic tool to recreate a sensation of hearingfor patients with certain etiologies of deafness.Adult and infant rats exhibit a substantial range of
complex natural auditory-evoked behavior, are easilytrained, and maintain a reliable tonotopic cortical rep-resentation of the auditory spectrum. Thus, they remainan excellent choice for experimentation in this area(Sachs and Bialy, 2000; Blumberg et al., 2000; Sallyand Kelly, 1988; Kilgard and Merzenich, 1999; Kellyand Masterton, 1977).Cortical micro-stimulation has been employed in
many species as a tool to explore neural organizationin various regions of the brain (for technical review, seeTehovnik, 1996). In the sensory cortex, electrical stim-ulation combined with careful behavioral observationis a particularly e¡ective method for elucidating thestructure^function relationships of neural organization.There is a long history of the use of electrical stimula-tion to map pathways and explore functional organiza-tion of the visual system for both neuroscience andneuroprosthetics in both animals and humans (Ronnerand Lee, 1983; Bartlett and Doty, 1980; Salzman et al.,1990; Bak et al., 1990; Schmidt et al., 1996). There arefar fewer reports on the use of electrical stimulation tostudy the auditory system pathway organization. In hu-mans, electrical stimulation (using surface electrodesplaced on the auditory cortex while patients are underlocal anesthesia) elicits click or warble-like auditorysensations with di¡ering spectral qualities based onthe stimulus location (Dobelle et al., 1973). Micro-stim-ulation with penetrating microelectrodes implanted intothe auditory cortex induces detection behavior in catstrained to lever press in response to auditory stimuli(Rousche and Normann, 1999). In rats, auditory corti-cal micro-stimulation in animals under anesthesia pro-duces physiologically relevant receptive ¢eld changes or,in awake animals, induces behavioral responses (Mal-donado and Gerstein, 1999; Talwar et al., 2001). Thus,electrical activation of the auditory cortex is a validmethod by which to investigate the properties androle of the auditory cortex in auditory processing.There is a common set of questions that users of
electrical stimulation in the auditory cortex for eitherbasic neuroscience or applied neuroprosthetics need toaddress: What are the electrical stimulation parametersthat will evoke behaviorally relevant neural activationin the auditory cortex? Does stimulation of frequency-
speci¢c areas of the tonotopic map elicit frequency-spe-ci¢c sensory perceptions? How do electrically inducedperceptions compare to normal pure tone sensations?En route to answering these questions and investigatingthe behavioral consequences of the auditory cortex ac-tivation, we have completed a preliminary study relat-ing e¡ective stimulus current levels to behavior via sin-gle electrode micro-stimulation of the auditory cortex intrained rats. All experiments were completed in awakeand behaving subjects implanted with custom-madestimulating/recording multi-electrode microwire arrays(Williams et al., 1999).
2. Materials and Methods
2.1. Animals and apparatus
Eight male Sprague^Dawley rats (250^350 g) main-tained at 85% of their free-feeding body weights weretrained to lever press for food in standard operant-con-ditioning chambers (Med-Associates, Mount Vernon,IN, USA) located within a custom-built sound-damp-ened enclosure. Auditory stimuli were presented via acalibrated loudspeaker (Yamaha NS-10M Studio,Yamaha Corporation) located in the enclosure ceiling24 in. above the chamber. Three retractable 1 in. leverspositioned 5^6 in. from the chamber £oor served as themanipulanda. Single 45 mg pellets (P.J. Noyes Co.,Lancaster, NH, USA) were used as reinforcers. Theywere delivered into a V5.0 cm by V5.0 cm food traylocated V10 cm below the center lever. A 24 V bulb inthe upper rear of the chamber provided the only ambi-ent lighting. Rats were housed individually under a re-versed 12 h light/dark schedule.
2.2. Discrimination training
Rats were trained to perform a three lever (left, cen-ter, right) modi¢ed forced choice auditory detectiontask. Complete training took roughly 4 weeks. Ratswere required to depress the center lever two times tobegin each trial. For 2.25 s after center lever press, therats were presented with either a 16 kHz pulsed puretone sequence (the standard auditory stimulus) or si-lence (no stimulus). The 16 kHz standard auditory stim-ulus consisted of ¢ve tone pips of 250 ms duration(separated by 250 ms) delivered at 75 dB. Four cumu-lative responses on the left lever following tone burstpresentation (hit) or four cumulative responses on theright lever following tone absence (correct rejection)resulted in food reward. Incorrect responses, i.e., fourright lever presses following tone presence (miss) orfour left lever presses following tone absence (falsealarm), resulted in a 15^30 s time out in which the
HEARES 4680 25-4-03
P.J. Rousche et al. /Hearing Research 179 (2003) 62^71 63
chamber was darkened. A non-dark intertrial intervalof 10 s occured between all trials. Sessions occurreddaily and were limited to 150 reinforcers to avoid sati-ation.Rats performing above a criterion of s 90% correct
were implanted with 16 or 32 channel microwire elec-trode arrays (as described below). During subsequentelectrical stimulation sessions, the usual present-or-ab-sent auditory stimulus was replaced with a present-or-absent constant current electrical stimulation of a singleimplanted electrode in the auditory cortex. To closelymimic the temporal envelope of the learned auditorystimuli, the electrical stimuli consisted of ¢ve bursts ofelectrical stimulation (250 ms per burst) using biphasicconstant current pairs (cathodic ¢rst, pulse width= 250Ws) delivered at 150 Hz separated by 250 ms. An initialcurrent level of 90 WA (22.5 nC/phase) was chosen toensure suprathreshold neural activation. A return cur-rent pathway was provided via a cranial bone screw ora fully de-insulated 50 Wm diameter microwire with alarge exposed area implanted as part of the array.
2.3. Generalization gradient procedure
2.3.1. Auditory stimuliTo characterize the auditory capabilities of each rat
and the resultant discriminative properties of the audi-tory stimuli, generalization gradients were obtained.Unrewarded probe trials were randomly presented on30% of all trials. On probe trials, the tone frequencywas held constant at 16 kHz with the intensity loweredto one of ¢ve randomly chosen discrete values (70, 65,55, 35, or 20 dB). Each discrete probe level was re-peated at least 10 times per session. Response datawere used to construct intensity generalization gradientsfor each session. Detection rates fell predictably withstimulus intensity. From the ogive gradient curves, in-terpolation was used to calculate the stimulus magni-tude (dB) that resulted in a 50% detection rate (here-after referred to as the 50% point).
2.3.2. Electrical stimuliIntensity generalization gradients were also obtained
for rats trained to discriminate single electrode electricalstimulation. After recovery from implant, rats were re-trained to discriminate the presence or absence of elec-trical stimulation on a single electrode using a ¢xedcurrent amplitude of 90 WA [the standard (or reference)electrical stimulus]. To obtain intensity generalizationgradients, discrete current levels of 72, 54, 36, and 18WA were randomly delivered during unrewarded probetrials (30% of all trials, at least 10 presentations perlevel per session). The resulting curves showed that re-sponse probabilities decreased predictably with stimulusintensity. The gradients obtained with electrical micro-
stimulation were similar to those generated using audi-tory stimuli.
2.4. Electrode arrays, surgical procedure, and neuralrecordings
Details of multi-electrode construction, implant pro-cedures and recording performance are fully describedin detail in another publication (Williams et al., 1999).Brie£y, 16 or 32 channel electrode arrays were fabri-cated in-house using 50 Wm polyimide-insulated tung-sten wire aligned in rows of eight wires, each termi-nating in a small connector (GF-10, Microtech Inc.,Boothwyn, PA, USA) (interrow spacing = 250 Wm,interelectrode spacing = 250 Wm). Ethylene-oxide-steri-lized arrays were implanted using a micromanipulatorunder aseptic surgical conditions. Vascular landmarksand/or stereotaxic coordinates were used to identify theprimary auditory cortex (Sally and Kelly, 1988). In ad-dition, two animals also received identical microwireimplants (but with only four electrodes) in the visualcortex (as determined via stereotaxic coordinates). Neu-ral recordings from the auditory and visual implantswere used to assess electrode response to pure tone,click or light £ash stimuli for several weeks followingrecovery. Recordings were performed in awake animals(signals were simultaneously ampli¢ed, bandpass ¢l-tered (500^7000 Hz), and displayed with a commercialmulti-channel neural recording system (Plexon, Inc.,Dallas, TX, USA). The visual cortex implants weretested with a simple four light-emitting diode (LED)£ashing stimulus. For the auditory implants, a 450 ele-ment set of short duration tone pips (200 ms with 5 msrise and fall, 300 ms intertone interval) spanning 30frequencies (0.5^32 kHz) and 15 intensities (20^90 dBSPL) was delivered and frequency response areas relat-ing the ¢ring rate to the tone frequency and intensitywere created with custom-built software using Mathe-matica1. Peri-stimulus time histograms (Nex software,Plexon, Inc., Dallas, TX, USA) were also used to char-acterize auditory neural activity in response to 50 Wsclicks (100 dB). All experimentation was performedunder the guidance of the Institutional Animal Careand Use Committee of Arizona State University.
3. Results
To investigate the relationship between the auditorycortex, electrical stimulation and behavior, a combina-tion of electrophysiological mapping, pure tone behav-ioral analysis and cortical micro-stimulation behavioralanalysis was performed in a series of eight trained andimplanted rats. Intensity generalization gradient curvesrelating the stimulus strength to the probability of be-
HEARES 4680 25-4-03
P.J. Rousche et al. /Hearing Research 179 (2003) 62^7164
havior were obtained for both pure tone stimuli and forelectrical stimuli in all subjects.
3.1. Pure tone behavioral responses
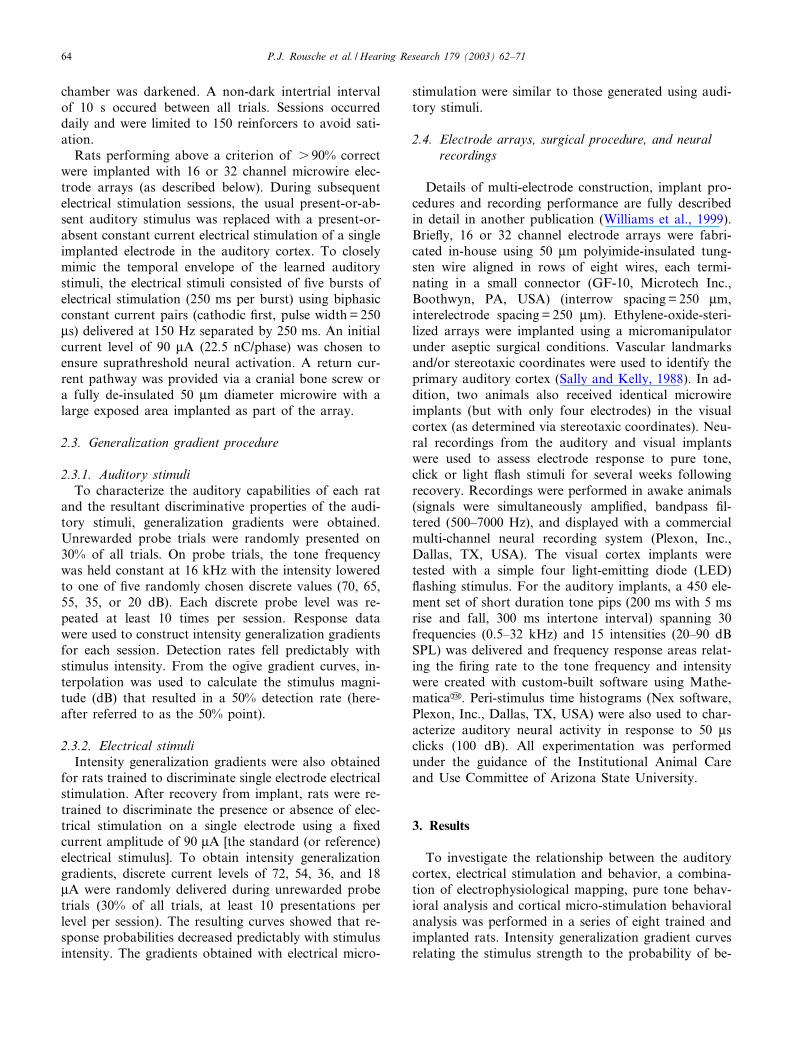
To establish baseline performance in the auditorydetection task, rats were ¢rst trained to detect the pres-ence or absence of a ¢ve pip 16 kHz pure tone stimulus.Following the criterion behavior in discriminating thesestimuli (s 90% performance), intensity generalizationgradient curves were obtained. Gradient curves describeresponse probabilities for tone intensities lower than thestandard auditory stimuli used in training. Fig. 1Ashows an intensity gradient curve for pure tone detec-tion in a single animal recorded in a single extended
session. Each data point is marked with the total num-ber of times it was presented during the course of thetrial. A typical gradient relates increases in detectionpercentages with increases in stimulus magnitude. InFig. 1B, the mean auditory response curves obtainedfrom 23 di¡erent sessions in six di¡erent rats is pre-sented. As in the individual case, the mean curve clearlydemonstrates that rats achieve higher discriminationpercentages for stimulus magnitudes closest to the levelof the training stimulus. This curve shows profoundoverall auditory intensity generalization among the sub-jects.
3.2. Neural recording
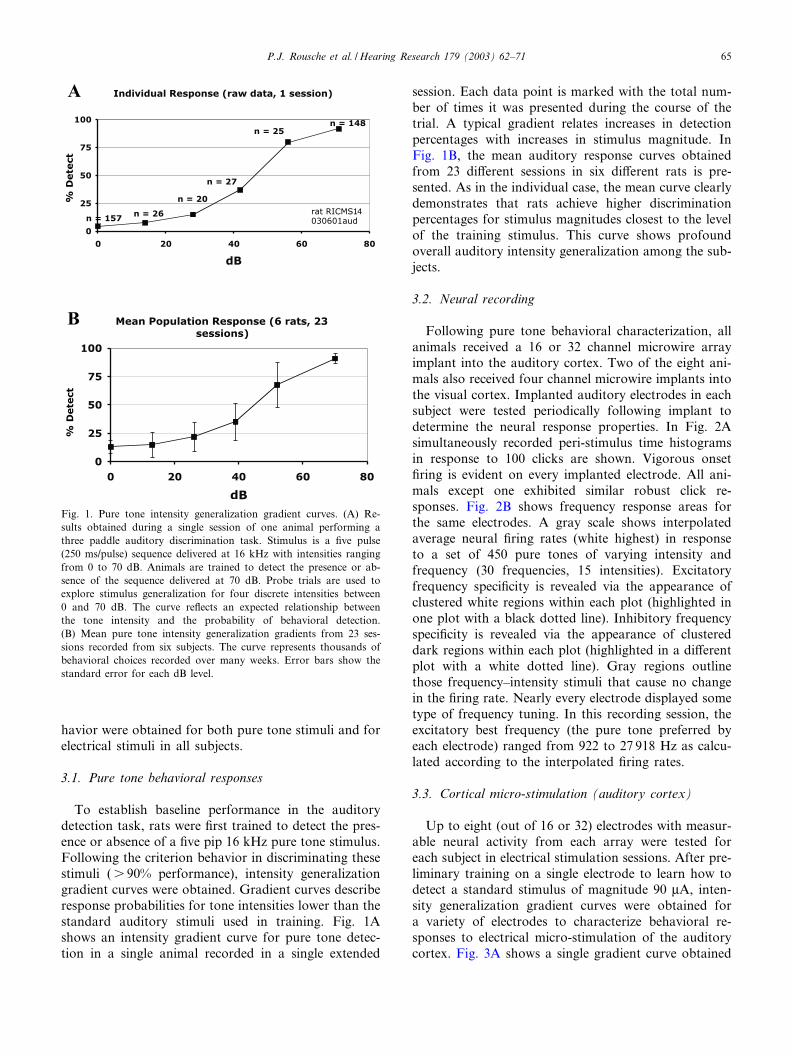
Following pure tone behavioral characterization, allanimals received a 16 or 32 channel microwire arrayimplant into the auditory cortex. Two of the eight ani-mals also received four channel microwire implants intothe visual cortex. Implanted auditory electrodes in eachsubject were tested periodically following implant todetermine the neural response properties. In Fig. 2Asimultaneously recorded peri-stimulus time histogramsin response to 100 clicks are shown. Vigorous onset¢ring is evident on every implanted electrode. All ani-mals except one exhibited similar robust click re-sponses. Fig. 2B shows frequency response areas forthe same electrodes. A gray scale shows interpolatedaverage neural ¢ring rates (white highest) in responseto a set of 450 pure tones of varying intensity andfrequency (30 frequencies, 15 intensities). Excitatoryfrequency speci¢city is revealed via the appearance ofclustered white regions within each plot (highlighted inone plot with a black dotted line). Inhibitory frequencyspeci¢city is revealed via the appearance of clustereddark regions within each plot (highlighted in a di¡erentplot with a white dotted line). Gray regions outlinethose frequency^intensity stimuli that cause no changein the ¢ring rate. Nearly every electrode displayed sometype of frequency tuning. In this recording session, theexcitatory best frequency (the pure tone preferred byeach electrode) ranged from 922 to 27 918 Hz as calcu-lated according to the interpolated ¢ring rates.
3.3. Cortical micro-stimulation (auditory cortex)
Up to eight (out of 16 or 32) electrodes with measur-able neural activity from each array were tested foreach subject in electrical stimulation sessions. After pre-liminary training on a single electrode to learn how todetect a standard stimulus of magnitude 90 WA, inten-sity generalization gradient curves were obtained fora variety of electrodes to characterize behavioral re-sponses to electrical micro-stimulation of the auditorycortex. Fig. 3A shows a single gradient curve obtained
Fig. 1. Pure tone intensity generalization gradient curves. (A) Re-sults obtained during a single session of one animal performing athree paddle auditory discrimination task. Stimulus is a ¢ve pulse(250 ms/pulse) sequence delivered at 16 kHz with intensities rangingfrom 0 to 70 dB. Animals are trained to detect the presence or ab-sence of the sequence delivered at 70 dB. Probe trials are used toexplore stimulus generalization for four discrete intensities between0 and 70 dB. The curve re£ects an expected relationship betweenthe tone intensity and the probability of behavioral detection.(B) Mean pure tone intensity generalization gradients from 23 ses-sions recorded from six subjects. The curve represents thousands ofbehavioral choices recorded over many weeks. Error bars show thestandard error for each dB level.
HEARES 4680 25-4-03
P.J. Rousche et al. /Hearing Research 179 (2003) 62^71 65
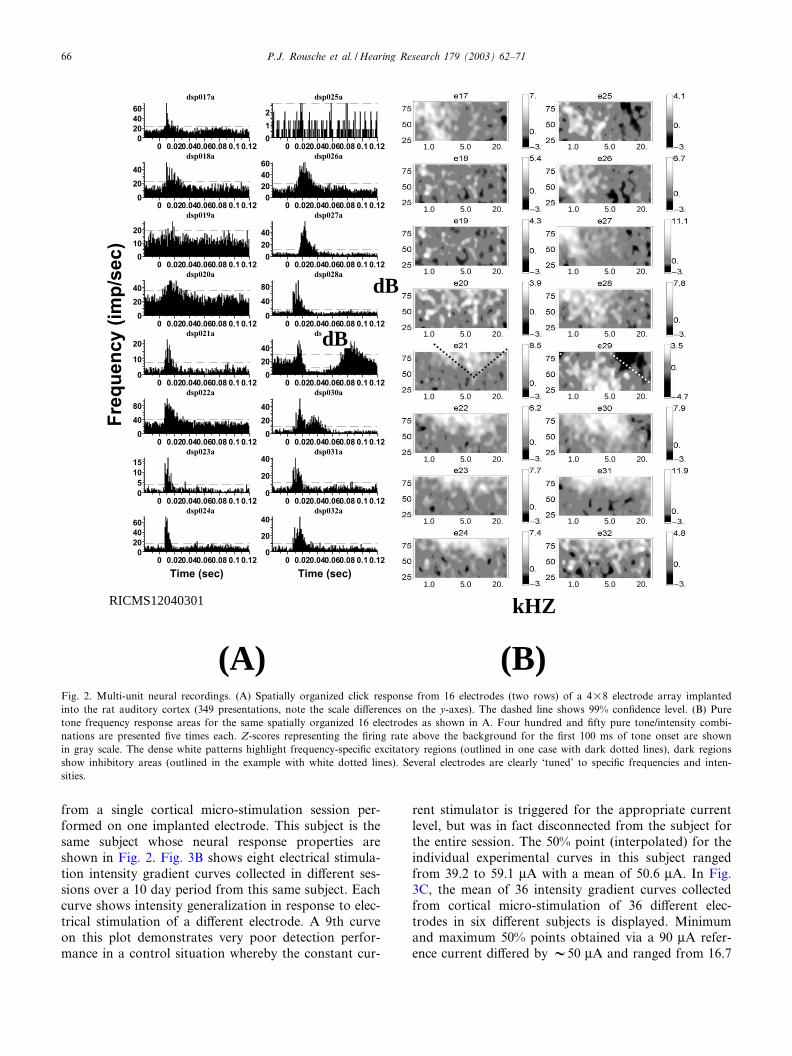
from a single cortical micro-stimulation session per-formed on one implanted electrode. This subject is thesame subject whose neural response properties areshown in Fig. 2. Fig. 3B shows eight electrical stimula-tion intensity gradient curves collected in di¡erent ses-sions over a 10 day period from this same subject. Eachcurve shows intensity generalization in response to elec-trical stimulation of a di¡erent electrode. A 9th curveon this plot demonstrates very poor detection perfor-mance in a control situation whereby the constant cur-
rent stimulator is triggered for the appropriate currentlevel, but was in fact disconnected from the subject forthe entire session. The 50% point (interpolated) for theindividual experimental curves in this subject rangedfrom 39.2 to 59.1 WA with a mean of 50.6 WA. In Fig.3C, the mean of 36 intensity gradient curves collectedfrom cortical micro-stimulation of 36 di¡erent elec-trodes in six di¡erent subjects is displayed. Minimumand maximum 50% points obtained via a 90 WA refer-ence current di¡ered by V50 WA and ranged from 16.7
(B)(A)
0 0.020.040.060.08 0.1 0.120
20
40
60
dsp017a
0 0.020.040.060.08 0.1 0.120
20
40
dsp018a
0 0.020.040.060.08 0.1 0.120
10
20
dsp019a
0 0.020.040.060.08 0.1 0.120
20
40
dsp020a
0 0.020.040.060.08 0.1 0.120
10
20
dsp021a
0 0.020.040.060.08 0.1 0.120
40
80
dsp022a
0 0.020.040.060.08 0.1 0.120
5
10
15
dsp023a
0 0.020.040.060.08 0.1 0.12
Time (sec)
0
20
40
60
dsp024a
0 0.020.040.060.08 0.1 0.120
1
2
dsp025a
0 0.020.040.060.08 0.1 0.120
20
40
60dsp026a
0 0.020.040.060.08 0.1 0.120
20
40
dsp027a
0 0.02 0.1 0.120
40
80
dsp028a
0 0.020.040.060.08 0.1 0.120
20
40
dsp029a
0 0.020.040.060.08 0.1 0.120
20
40
dsp030a
0 0.020.040.060.08 0.1 0.120
20
40dsp031a
0 0.020.040.060.08 0.1 0.12
Time (sec)
0
20
40dsp032a
Fre
qu
en
cy (
imp
/sec)
RICMS12040301
dB
dB
kHZ
0.060.080.04
1.0 5.0 20. 1.0 5.0 20.
1.0 5.0 20. 1.0 5.0 20.
1.0 5.0 20.1.0 5.0 20.
1.0 5.0 20. 1.0 5.0 20.
1.0 5.0 20. 1.0 5.0 20.
1.0 5.0 20. 1.0 5.0 20.
1.0 5.0 20. 1.0 5.0 20.
1.0 5.0 20. 1.0 5.0 20.
Fig. 2. Multi-unit neural recordings. (A) Spatially organized click response from 16 electrodes (two rows) of a 4U8 electrode array implantedinto the rat auditory cortex (349 presentations, note the scale di¡erences on the y-axes). The dashed line shows 99% con¢dence level. (B) Puretone frequency response areas for the same spatially organized 16 electrodes as shown in A. Four hundred and ¢fty pure tone/intensity combi-nations are presented ¢ve times each. Z-scores representing the ¢ring rate above the background for the ¢rst 100 ms of tone onset are shownin gray scale. The dense white patterns highlight frequency-speci¢c excitatory regions (outlined in one case with dark dotted lines), dark regionsshow inhibitory areas (outlined in the example with white dotted lines). Several electrodes are clearly ‘tuned’ to speci¢c frequencies and inten-sities.
HEARES 4680 25-4-03
P.J. Rousche et al. /Hearing Research 179 (2003) 62^7166
Fig. 3. Auditory cortex micro-stimulation intensity generalization gradient curves. (A) Results obtained during a single session (raw percentages,no error bars) of one animal performing a three paddle discrimination task. Stimulus was a ¢ve pulse (250 ms/pulse) sequence of electrical stim-ulation on a single electrode (biphasic pulse pairs delivered at 100 Hz) with current intensities ranging from 0 to 90 WA. Animals were trainedto discriminate the presence or absence of the sequence delivered at 90 WA. Probe trials were used to explore stimulus generalization for fourdiscrete intensities between 0 and 90 WA. The curve re£ects a standard relationship between the stimulus current level and the probability of be-havioral detection. (B) Micro-stimulation intensity generalization gradients for eight di¡erent electrodes tested in the same subject during eightdi¡erent single sessions over a two week period. One electrode was retested but only after disconnecting the rat from the stimulator for the du-ration of the session in a control experiment. (C) Mean micro-stimulation intensity generalization gradients from 36 sessions recorded from sixsubjects. The curve represents thousands of behavioral choices recorded over many weeks. Error bars show the standard error for each currentintensity. The mean 50% detection point, or the point of subjective equality, was 42.4 WA. Compare with the mean pure tone performance ofthe same subjects as reported in Fig. 1B.
HEARES 4680 25-4-03
P.J. Rousche et al. /Hearing Research 179 (2003) 62^71 67
to 69.2 WA, with a mean 50% point of 42.4 WA. Overall,electrical stimulation of 36 electrodes in six rats using a90 WA reference stimulus was e¡ective in its ability toevoke graded and typical behavioral responses as re-vealed by the intensity generalization gradients.It is important to note that behavioral response prob-
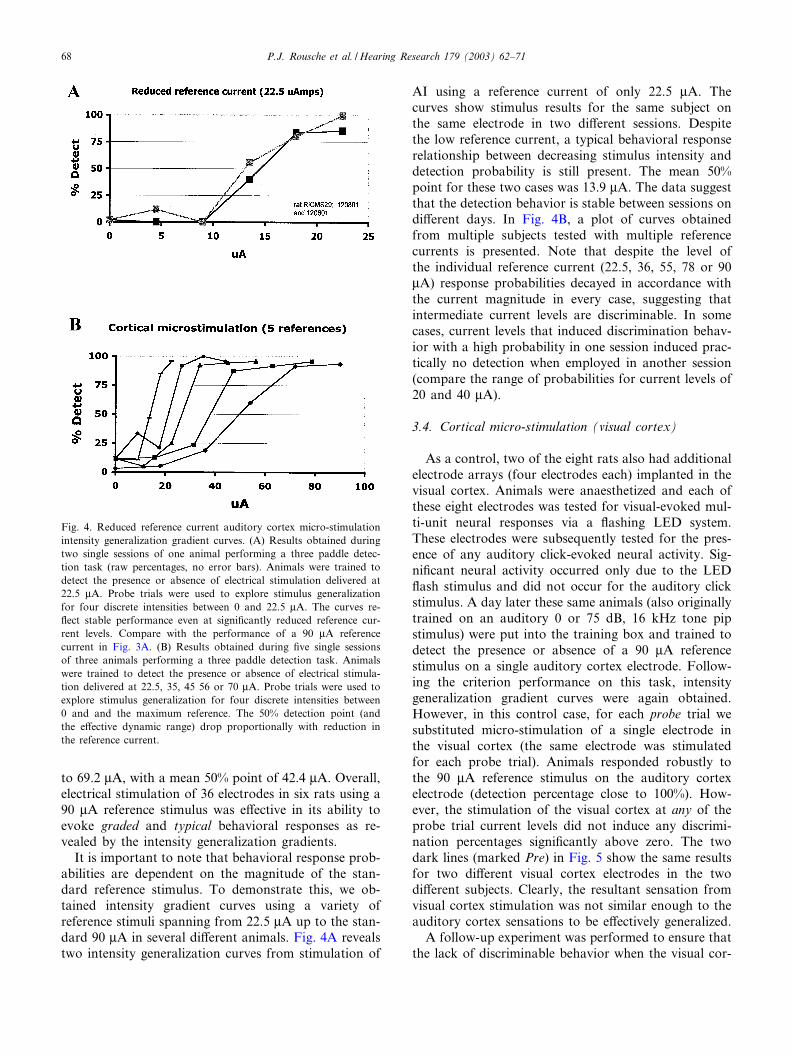
abilities are dependent on the magnitude of the stan-dard reference stimulus. To demonstrate this, we ob-tained intensity gradient curves using a variety ofreference stimuli spanning from 22.5 WA up to the stan-dard 90 WA in several di¡erent animals. Fig. 4A revealstwo intensity generalization curves from stimulation of
AI using a reference current of only 22.5 WA. Thecurves show stimulus results for the same subject onthe same electrode in two di¡erent sessions. Despitethe low reference current, a typical behavioral responserelationship between decreasing stimulus intensity anddetection probability is still present. The mean 50%point for these two cases was 13.9 WA. The data suggestthat the detection behavior is stable between sessions ondi¡erent days. In Fig. 4B, a plot of curves obtainedfrom multiple subjects tested with multiple referencecurrents is presented. Note that despite the level ofthe individual reference current (22.5, 36, 55, 78 or 90WA) response probabilities decayed in accordance withthe current magnitude in every case, suggesting thatintermediate current levels are discriminable. In somecases, current levels that induced discrimination behav-ior with a high probability in one session induced prac-tically no detection when employed in another session(compare the range of probabilities for current levels of20 and 40 WA).
3.4. Cortical micro-stimulation (visual cortex)
As a control, two of the eight rats also had additionalelectrode arrays (four electrodes each) implanted in thevisual cortex. Animals were anaesthetized and each ofthese eight electrodes was tested for visual-evoked mul-ti-unit neural responses via a £ashing LED system.These electrodes were subsequently tested for the pres-ence of any auditory click-evoked neural activity. Sig-ni¢cant neural activity occurred only due to the LED£ash stimulus and did not occur for the auditory clickstimulus. A day later these same animals (also originallytrained on an auditory 0 or 75 dB, 16 kHz tone pipstimulus) were put into the training box and trained todetect the presence or absence of a 90 WA referencestimulus on a single auditory cortex electrode. Follow-ing the criterion performance on this task, intensitygeneralization gradient curves were again obtained.However, in this control case, for each probe trial wesubstituted micro-stimulation of a single electrode inthe visual cortex (the same electrode was stimulatedfor each probe trial). Animals responded robustly tothe 90 WA reference stimulus on the auditory cortexelectrode (detection percentage close to 100%). How-ever, the stimulation of the visual cortex at any of theprobe trial current levels did not induce any discrimi-nation percentages signi¢cantly above zero. The twodark lines (marked Pre) in Fig. 5 show the same resultsfor two di¡erent visual cortex electrodes in the twodi¡erent subjects. Clearly, the resultant sensation fromvisual cortex stimulation was not similar enough to theauditory cortex sensations to be e¡ectively generalized.A follow-up experiment was performed to ensure that
the lack of discriminable behavior when the visual cor-
Fig. 4. Reduced reference current auditory cortex micro-stimulationintensity generalization gradient curves. (A) Results obtained duringtwo single sessions of one animal performing a three paddle detec-tion task (raw percentages, no error bars). Animals were trained todetect the presence or absence of electrical stimulation delivered at22.5 WA. Probe trials were used to explore stimulus generalizationfor four discrete intensities between 0 and 22.5 WA. The curves re-£ect stable performance even at signi¢cantly reduced reference cur-rent levels. Compare with the performance of a 90 WA referencecurrent in Fig. 3A. (B) Results obtained during ¢ve single sessionsof three animals performing a three paddle detection task. Animalswere trained to detect the presence or absence of electrical stimula-tion delivered at 22.5, 35, 45 56 or 70 WA. Probe trials were used toexplore stimulus generalization for four discrete intensities between0 and and the maximum reference. The 50% detection point (andthe e¡ective dynamic range) drop proportionally with reduction inthe reference current.
HEARES 4680 25-4-03
P.J. Rousche et al. /Hearing Research 179 (2003) 62^7168
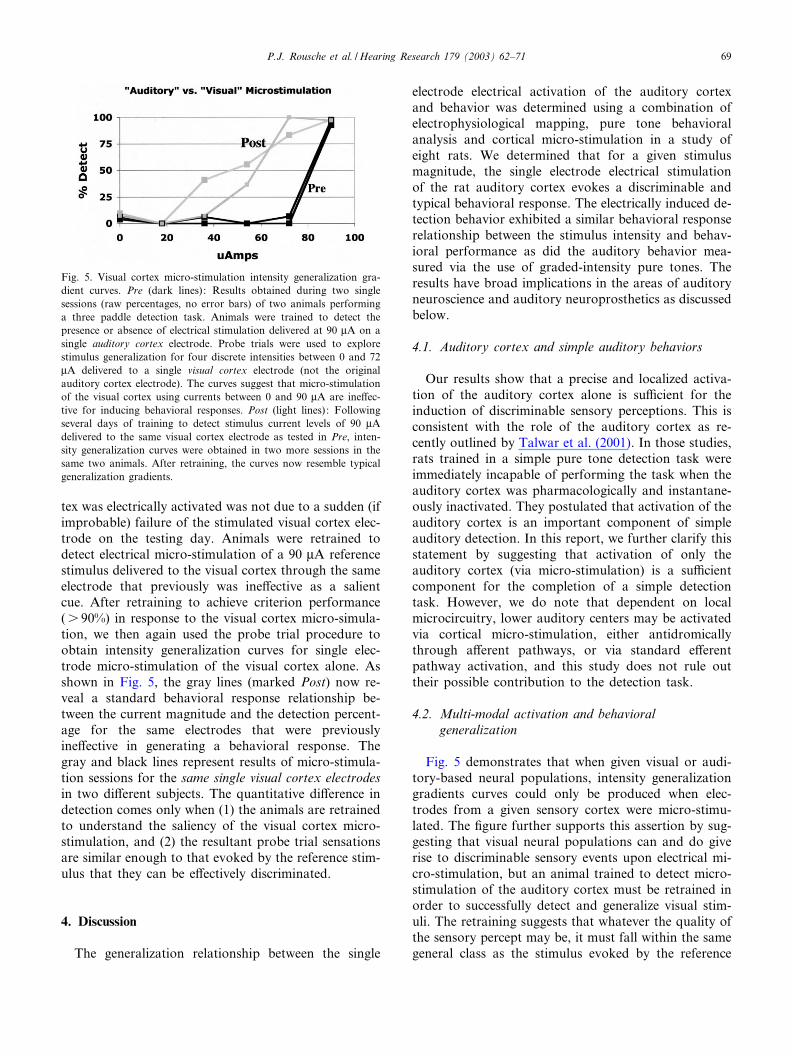
tex was electrically activated was not due to a sudden (ifimprobable) failure of the stimulated visual cortex elec-trode on the testing day. Animals were retrained todetect electrical micro-stimulation of a 90 WA referencestimulus delivered to the visual cortex through the sameelectrode that previously was ine¡ective as a salientcue. After retraining to achieve criterion performance(s 90%) in response to the visual cortex micro-simula-tion, we then again used the probe trial procedure toobtain intensity generalization curves for single elec-trode micro-stimulation of the visual cortex alone. Asshown in Fig. 5, the gray lines (marked Post) now re-veal a standard behavioral response relationship be-tween the current magnitude and the detection percent-age for the same electrodes that were previouslyine¡ective in generating a behavioral response. Thegray and black lines represent results of micro-stimula-tion sessions for the same single visual cortex electrodesin two di¡erent subjects. The quantitative di¡erence indetection comes only when (1) the animals are retrainedto understand the saliency of the visual cortex micro-stimulation, and (2) the resultant probe trial sensationsare similar enough to that evoked by the reference stim-ulus that they can be e¡ectively discriminated.
4. Discussion
The generalization relationship between the single
electrode electrical activation of the auditory cortexand behavior was determined using a combination ofelectrophysiological mapping, pure tone behavioralanalysis and cortical micro-stimulation in a study ofeight rats. We determined that for a given stimulusmagnitude, the single electrode electrical stimulationof the rat auditory cortex evokes a discriminable andtypical behavioral response. The electrically induced de-tection behavior exhibited a similar behavioral responserelationship between the stimulus intensity and behav-ioral performance as did the auditory behavior mea-sured via the use of graded-intensity pure tones. Theresults have broad implications in the areas of auditoryneuroscience and auditory neuroprosthetics as discussedbelow.
4.1. Auditory cortex and simple auditory behaviors
Our results show that a precise and localized activa-tion of the auditory cortex alone is su⁄cient for theinduction of discriminable sensory perceptions. This isconsistent with the role of the auditory cortex as re-cently outlined by Talwar et al. (2001). In those studies,rats trained in a simple pure tone detection task wereimmediately incapable of performing the task when theauditory cortex was pharmacologically and instantane-ously inactivated. They postulated that activation of theauditory cortex is an important component of simpleauditory detection. In this report, we further clarify thisstatement by suggesting that activation of only theauditory cortex (via micro-stimulation) is a su⁄cientcomponent for the completion of a simple detectiontask. However, we do note that dependent on localmicrocircuitry, lower auditory centers may be activatedvia cortical micro-stimulation, either antidromicallythrough a¡erent pathways, or via standard e¡erentpathway activation, and this study does not rule outtheir possible contribution to the detection task.
4.2. Multi-modal activation and behavioralgeneralization
Fig. 5 demonstrates that when given visual or audi-tory-based neural populations, intensity generalizationgradients curves could only be produced when elec-trodes from a given sensory cortex were micro-stimu-lated. The ¢gure further supports this assertion by sug-gesting that visual neural populations can and do giverise to discriminable sensory events upon electrical mi-cro-stimulation, but an animal trained to detect micro-stimulation of the auditory cortex must be retrained inorder to successfully detect and generalize visual stim-uli. The retraining suggests that whatever the quality ofthe sensory percept may be, it must fall within the samegeneral class as the stimulus evoked by the reference
Fig. 5. Visual cortex micro-stimulation intensity generalization gra-dient curves. Pre (dark lines): Results obtained during two singlesessions (raw percentages, no error bars) of two animals performinga three paddle detection task. Animals were trained to detect thepresence or absence of electrical stimulation delivered at 90 WA on asingle auditory cortex electrode. Probe trials were used to explorestimulus generalization for four discrete intensities between 0 and 72WA delivered to a single visual cortex electrode (not the originalauditory cortex electrode). The curves suggest that micro-stimulationof the visual cortex using currents between 0 and 90 WA are ine¡ec-tive for inducing behavioral responses. Post (light lines): Followingseveral days of training to detect stimulus current levels of 90 WAdelivered to the same visual cortex electrode as tested in Pre, inten-sity generalization curves were obtained in two more sessions in thesame two animals. After retraining, the curves now resemble typicalgeneralization gradients.
HEARES 4680 25-4-03
P.J. Rousche et al. /Hearing Research 179 (2003) 62^71 69
stimuli or it will not be generalized at all. By the sametoken, we note that the criterion performance for cor-tical micro-stimulation of the auditory cortex followingthe original pure tone stimulus training was onlyachieved after several sessions of retraining.
4.3. Relationship between neural activation andbehavioral threshold
Although the sigmoidal intensity generalization gra-dient response curves for single electrode micro-stimu-lation exhibited a fairly broad range of 50% point val-ues (16.7 to 69.2 WA), the mean 50% point per subjectwas 42.4 WA with a standard deviation of only 8.1 WA.Despite this consistency across animals and across audi-tory cortex electrodes, this measure is not necessarilyequivalent to a ‘true’ threshold, or a level of currentthat induces a just noticeable sensory event. It is likelythat the actual sensory thresholds are quite lower thanthe current values that induce a 50% point in the gen-eralization task. Interestingly, we note that obtainingthe criterion behavior (s 90% correct detection) wasvirtually impossible using a standard stimulus lessthan 20 WA, suggesting that the actual psychophysicalsensory activation threshold for rats with this micro-stimulation paradigm may be near this level.
4.4. Dynamic range for micro-stimulation
An interesting feature of the micro-stimulation resultsis the range of intensities over which electrical stimula-tion induced some kind of behavior, particularly for therelatively large 90 WA standard stimulus level. The pre-dictable decrease in response probability with a decreas-ing stimulus intensity suggests that micro-stimulationinduces a measurable continuum of discriminable expe-riences. In the case of pure tone stimuli, this behavioralcontinuum is a direct re£ection of stimulus intensity.Although it is impossible to assess exactly what themetric of the continuum is for the parameters of mi-cro-stimulation, this study concludes that such a con-tinuum does in fact exist. Results from this study indi-cate that the dynamic range of this continuum rangesfrom V60 WA for the standard case of a 90 WA refer-ence stimulus (as in Fig. 3C) toV10 WA in the case of a22 WA reference stimulus (Fig. 4B, leftmost curve).When considering the possibility of micro-stimulation
of the auditory cortex as a means for transmitting audi-tory information in a cortical prosthesis, the dynamicrange becomes important. A comparison of the puretone intensity generalization curves and the micro-stim-ulation-induced curves suggests that, with appropriatecompression functions and behavioral training, corticalmicro-stimulation could be used to transfer informationregarding the intensity of a pure tone directly to the
cerebral cortex. Such an approach, when extended tothe simultaneous micro-stimulation of many implantedelectrodes, could form the basis for an auditory neuro-prosthetic system capable of transducing audible stim-uli into recognizable sensations via micro-stimulation.Larger micro-stimulation dynamic ranges would allowfor a lesser compression of the original auditory inputs.Further experimentation in this area is currently under-way.
4.5. Natural vs. electrical cortical activation
Little data exist describing global neural activationpatterns within the rat auditory cortex. In the guineapig, however, optical images of the auditory cortex ac-tivity during a 60 dB tone show that large regions ofcortical area are activated (frequency bands V1000 Wmwide) (Tokioka et al., 2000). In our studies, the mean50% point for electrical stimulation was 42.4 WA, or acharge of 10.25 nC/phase. This is slightly larger than acharge per phase of 8 nC that has been estimated toactivate neurons within a spherical diameter of 340 Wmduring stimulation of the sensory cortex of the cat(Ronner and Lee, 1983). Although the e¡ect of thedirect spread of current remains di⁄cult to quantify,we guardedly postulate that the electrical stimulationof the primary auditory cortex using microelectrodesin our experiment activated signi¢cantly fewer neuronsper stimuli than did the pure tone stimuli. Electricalstimulation is generally considered to be excitatory,but it is possible that micro-stimulation of inhibitoryneurons actually induces overall inhibition. Thus thenet behavioral e¡ect of micro-stimulation depends onthe speci¢c electrode position with respect to both ex-citatory and inhibitory neurons and the extent of thestimulus ¢eld.We conclude that single channel electrical activation
of rat cortical auditory areas can be used as a preciseand e¡ective tool for the interrelational study of neuralinput^output organization, neural coding and behavior.The knowledge of working current levels and associatedbehavioral responses gained in this study can now beapplied to future neuroscience and neuroprostheticsstudies to further investigate the contribution of theauditory cortex to auditory processing and to explorethis tool as a means for developing a cortical auditoryprosthesis.
Acknowledgements
The authors greatly acknowledge Dr. Peter Killeen ofthe Arizona State University Department of Psychologyfor many useful discussions on experimental design andcritical review of the manuscript. We also thank Mr.
HEARES 4680 25-4-03
P.J. Rousche et al. /Hearing Research 179 (2003) 62^7170
Chris Visser, now at the University of Illinois at Chi-cago, for manufacturing the electrodes.
References
Bak, M., Girvin, J.P., Hambrecht, F.T., Kufta, C.V., Loeb, G.E.,Schmidt, E.M., 1990. Visual sensations produced by intracorticalmicro-stimulation of the human occipital cortex. Med. Biol. Eng.Comput. 28, 257^259.
Bartlett, J.R., Doty, R.W., 1980. An exploration of the ability ofmacaques to detect micro-stimulation of striate cortex. Acta Neu-robiol. Exp. Warsz. 40, 713^727.
Birt, D., Nienhuis, R., Olds, J., 1978. E¡ects of bilateral auditorycortex ablation on behavior and unit activity in rat inferior colli-culus during di¡erential conditioning. J. Neurophysiol. 41, 705^715.
Blumberg, M.S., Sokolo¡, G., Kirby, R.F., Kent, K.J., 2000. Distressvocalizations in infant rats: what’s all the fuss about? Psychol. Sci.11, 78^81.
Dobelle, W.H., Stensaas, S.S., Mladejovsky, M.G., Smith, J.B., 1973.A prosthesis for the deaf based on cortical stimulation. Ann. Otol.Rhinol. Laryngol. 82, 445^463.
Kelly, J.B., Glazier, S.J., 1978. Auditory cortex lesions and discrim-ination of spatial location by the rat. Brain Res. 145, 315^321.
Kelly, J.B., Masterton, R.B., 1977. Auditory sensitivity of the albinorat. J. Comp. Physiol. Psychol. 91, 930^936.
Kelly, J.B., 1990. Rat auditory cortex. In: Kolb, B., Tees, R. (Eds.),The Cerebral Cortex of the Rat. MIT Press, Cambridge, MA, pp.381^406.
Kilgard, M.P., Merzenich, M.M., 1999. Distributed representation ofspectral and temporal information in rat primary auditory cortex.Hear. Res. 134, 16^28.
Maldonado, P.E., Gerstein, G.L., 1999. Reorganization in the audi-tory cortex of the rat induced by intracortical micro-stimulation: amultiple single-unit study. Exp. Brain Res. 112, 420^430.
Ronner, S.F., Lee, B.G., 1983. Excitation of visual cortex neurons bylocal intracortical micro-stimulation. Exp. Neurol. 81, 376^395.
Rousche, P.J., Normann, R.A., 1999. Chronic intracortical micro-stimulation (ICMS) of cat sensory cortex using the Utah intra-cortical electrode array. IEEE Trans. Rehabil. Eng. 7, 56^68.
Sachs, B.D., Bialy, M., 2000. Female presence during postejaculatoryinterval facilitates penile erection and 22-kHz vocalization in malerats. Behav. Neurosci. 114, 1203^1208.
Sally, S.L., Kelly, J.B., 1988. Organization of auditory cortex in thealbino rat: sound frequency. J. Neurophysiol. 59, 1627^1638.
Salzman, C.D., Britten, K.H., Newsome, W.T., 1990. Cortical micro-stimulation in£uences perceptual judgements of motion direction.Nature 346, 174^177.
Schmidt, E.M., Bak, M.J., Hambrecht, F.T., Kufta, C.V., O’Rourke,D.K., Vallabhanath, P., 1996. Feasibility of a visual prosthesis forthe blind based on intracortical micro-stimulation of the visualcortex. Brain 119 (2), 507^522.
Talwar, S.K., Musial, P.G., Gerstein, G.L., 2001. Role of mammalianauditory cortex in the perception of elementary sound properties.J. Neurophysiol. 85, 2350^2358.
Tehovnik, E.J., 1996. Electrical stimulation of neural tissue to evokebehavioral responses. J. Neurosci. Methods 65, 1^17.
Tokioka, R., Kawaguchi, H., Fukunishi, K., 2000. Spatio-temporalanalyses of stimulus-evoked and spontaneous stochastic neuralactivity observed by optical imaging in guinea pig auditory cortex.Brain Res. 861, 271^280.
Williams, J.C., Rennaker, R.L., Kipke, D.R., 1999. Long-term neuralrecording characteristics of wire microelectrode arrays implantedin cerebral cortex. Brain Res. Brain Res. Protoc. 4, 303^313.
HEARES 4680 25-4-03
P.J. Rousche et al. /Hearing Research 179 (2003) 62^71 71