Areas of cat auditory cortex as defined by neurofilament proteins expressing SMI32
18
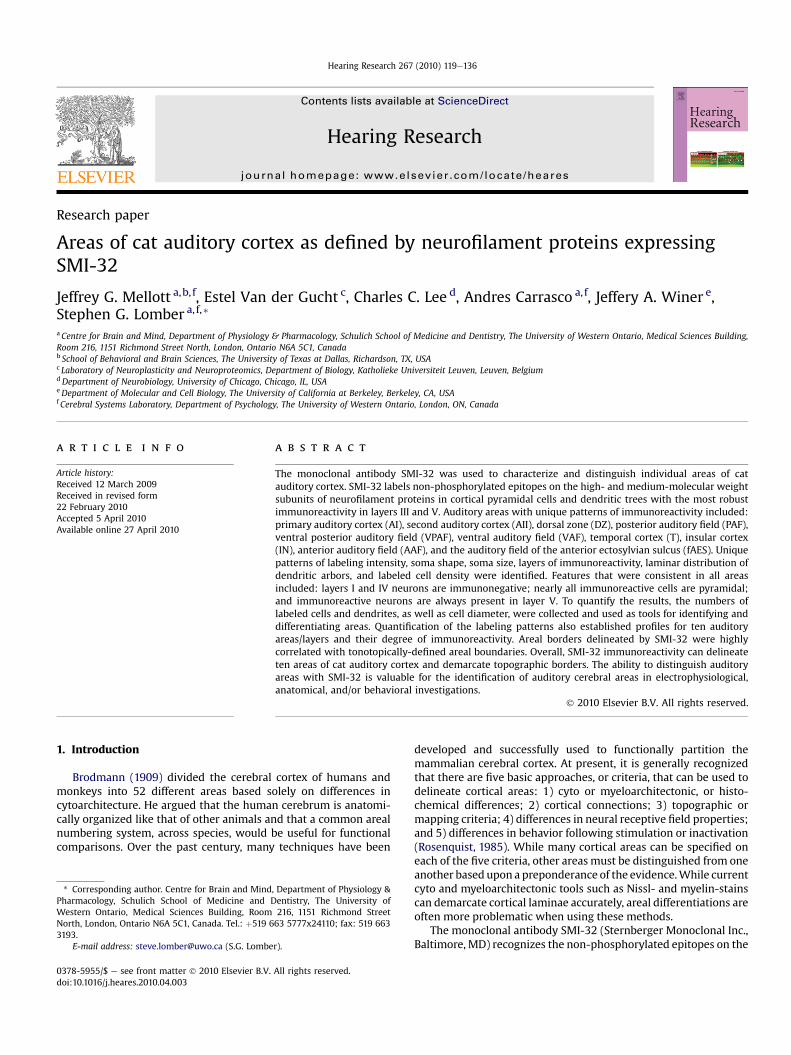
Research paper Areas of cat auditory cortex as defined by neurofilament proteins expressing SMI-32 Jeffrey G. Mellott a, b, f , Estel Van der Gucht c , Charles C. Lee d , Andres Carrasco a, f , Jeffery A. Winer e , Stephen G. Lomber a, f, * a Centre for Brain and Mind, Department of Physiology & Pharmacology, Schulich School of Medicine and Dentistry, The University of Western Ontario, Medical Sciences Building, Room 216,1151 Richmond Street North, London, Ontario N6A 5C1, Canada b School of Behavioral and Brain Sciences, The University of Texas at Dallas, Richardson, TX, USA c Laboratory of Neuroplasticity and Neuroproteomics, Department of Biology, Katholieke Universiteit Leuven, Leuven, Belgium d Department of Neurobiology, University of Chicago, Chicago, IL, USA e Department of Molecular and Cell Biology, The University of California at Berkeley, Berkeley, CA, USA f Cerebral Systems Laboratory, Department of Psychology, The University of Western Ontario, London, ON, Canada article info Article history: Received 12 March 2009 Received in revised form 22 February 2010 Accepted 5 April 2010 Available online 27 April 2010 abstract The monoclonal antibody SMI-32 was used to characterize and distinguish individual areas of cat auditory cortex. SMI-32 labels non-phosphorylated epitopes on the high- and medium-molecular weight subunits of neurofilament proteins in cortical pyramidal cells and dendritic trees with the most robust immunoreactivity in layers III and V. Auditory areas with unique patterns of immunoreactivity included: primary auditory cortex (AI), second auditory cortex (AII), dorsal zone (DZ), posterior auditory field (PAF), ventral posterior auditory field (VPAF), ventral auditory field (VAF), temporal cortex (T), insular cortex (IN), anterior auditory field (AAF), and the auditory field of the anterior ectosylvian sulcus (fAES). Unique patterns of labeling intensity, soma shape, soma size, layers of immunoreactivity, laminar distribution of dendritic arbors, and labeled cell density were identified. Features that were consistent in all areas included: layers I and IV neurons are immunonegative; nearly all immunoreactive cells are pyramidal; and immunoreactive neurons are always present in layer V. To quantify the results, the numbers of labeled cells and dendrites, as well as cell diameter, were collected and used as tools for identifying and differentiating areas. Quantification of the labeling patterns also established profiles for ten auditory areas/layers and their degree of immunoreactivity. Areal borders delineated by SMI-32 were highly correlated with tonotopically-defined areal boundaries. Overall, SMI-32 immunoreactivity can delineate ten areas of cat auditory cortex and demarcate topographic borders. The ability to distinguish auditory areas with SMI-32 is valuable for the identification of auditory cerebral areas in electrophysiological, anatomical, and/or behavioral investigations. Ó 2010 Elsevier B.V. All rights reserved. 1. Introduction Brodmann (1909) divided the cerebral cortex of humans and monkeys into 52 different areas based solely on differences in cytoarchitecture. He argued that the human cerebrum is anatomi- cally organized like that of other animals and that a common areal numbering system, across species, would be useful for functional comparisons. Over the past century, many techniques have been developed and successfully used to functionally partition the mammalian cerebral cortex. At present, it is generally recognized that there are five basic approaches, or criteria, that can be used to delineate cortical areas: 1) cyto or myeloarchitectonic, or histo- chemical differences; 2) cortical connections; 3) topographic or mapping criteria; 4) differences in neural receptive field properties; and 5) differences in behavior following stimulation or inactivation (Rosenquist, 1985). While many cortical areas can be specified on each of the five criteria, other areas must be distinguished from one another based upon a preponderance of the evidence. While current cyto and myeloarchitectonic tools such as Nissl- and myelin-stains can demarcate cortical laminae accurately, areal differentiations are often more problematic when using these methods. The monoclonal antibody SMI-32 (Sternberger Monoclonal Inc., Baltimore, MD) recognizes the non-phosphorylated epitopes on the * Corresponding author. Centre for Brain and Mind, Department of Physiology & Pharmacology, Schulich School of Medicine and Dentistry, The University of Western Ontario, Medical Sciences Building, Room 216, 1151 Richmond Street North, London, Ontario N6A 5C1, Canada. Tel.: þ519 663 5777x24110; fax: 519 663 3193. E-mail address: [email protected] (S.G. Lomber). Contents lists available at ScienceDirect Hearing Research journal homepage: www.elsevier.com/locate/heares 0378-5955/$ e see front matter Ó 2010 Elsevier B.V. All rights reserved. doi:10.1016/j.heares.2010.04.003 Hearing Research 267 (2010) 119e136
Transcript of Areas of cat auditory cortex as defined by neurofilament proteins expressing SMI32
lable at ScienceDirect
Hearing Research 267 (2010) 119e136
Contents lists avai
Hearing Research
journal homepage: www.elsevier .com/locate/heares
Research paper
Areas of cat auditory cortex as defined by neurofilament proteins expressingSMI-32
Jeffrey G. Mellott a,b, f, Estel Van der Gucht c, Charles C. Lee d, Andres Carrasco a,f, Jeffery A. Winer e,Stephen G. Lomber a,f,*aCentre for Brain and Mind, Department of Physiology & Pharmacology, Schulich School of Medicine and Dentistry, The University of Western Ontario, Medical Sciences Building,Room 216, 1151 Richmond Street North, London, Ontario N6A 5C1, Canadab School of Behavioral and Brain Sciences, The University of Texas at Dallas, Richardson, TX, USAc Laboratory of Neuroplasticity and Neuroproteomics, Department of Biology, Katholieke Universiteit Leuven, Leuven, BelgiumdDepartment of Neurobiology, University of Chicago, Chicago, IL, USAeDepartment of Molecular and Cell Biology, The University of California at Berkeley, Berkeley, CA, USAfCerebral Systems Laboratory, Department of Psychology, The University of Western Ontario, London, ON, Canada
a r t i c l e i n f o
Article history:Received 12 March 2009Received in revised form22 February 2010Accepted 5 April 2010Available online 27 April 2010
* Corresponding author. Centre for Brain and MindPharmacology, Schulich School of Medicine and DWestern Ontario, Medical Sciences Building, RoomNorth, London, Ontario N6A 5C1, Canada. Tel.: þ519 63193.
E-mail address: [email protected] (S.G. Lombe
0378-5955/$ e see front matter � 2010 Elsevier B.V.doi:10.1016/j.heares.2010.04.003
a b s t r a c t
The monoclonal antibody SMI-32 was used to characterize and distinguish individual areas of catauditory cortex. SMI-32 labels non-phosphorylated epitopes on the high- and medium-molecular weightsubunits of neurofilament proteins in cortical pyramidal cells and dendritic trees with the most robustimmunoreactivity in layers III and V. Auditory areas with unique patterns of immunoreactivity included:primary auditory cortex (AI), second auditory cortex (AII), dorsal zone (DZ), posterior auditory field (PAF),ventral posterior auditory field (VPAF), ventral auditory field (VAF), temporal cortex (T), insular cortex(IN), anterior auditory field (AAF), and the auditory field of the anterior ectosylvian sulcus (fAES). Uniquepatterns of labeling intensity, soma shape, soma size, layers of immunoreactivity, laminar distribution ofdendritic arbors, and labeled cell density were identified. Features that were consistent in all areasincluded: layers I and IV neurons are immunonegative; nearly all immunoreactive cells are pyramidal;and immunoreactive neurons are always present in layer V. To quantify the results, the numbers oflabeled cells and dendrites, as well as cell diameter, were collected and used as tools for identifying anddifferentiating areas. Quantification of the labeling patterns also established profiles for ten auditoryareas/layers and their degree of immunoreactivity. Areal borders delineated by SMI-32 were highlycorrelated with tonotopically-defined areal boundaries. Overall, SMI-32 immunoreactivity can delineateten areas of cat auditory cortex and demarcate topographic borders. The ability to distinguish auditoryareas with SMI-32 is valuable for the identification of auditory cerebral areas in electrophysiological,anatomical, and/or behavioral investigations.
� 2010 Elsevier B.V. All rights reserved.
1. Introduction
Brodmann (1909) divided the cerebral cortex of humans andmonkeys into 52 different areas based solely on differences incytoarchitecture. He argued that the human cerebrum is anatomi-cally organized like that of other animals and that a common arealnumbering system, across species, would be useful for functionalcomparisons. Over the past century, many techniques have been
, Department of Physiology &entistry, The University of216, 1151 Richmond Street63 5777x24110; fax: 519 663
r).
All rights reserved.
developed and successfully used to functionally partition themammalian cerebral cortex. At present, it is generally recognizedthat there are five basic approaches, or criteria, that can be used todelineate cortical areas: 1) cyto or myeloarchitectonic, or histo-chemical differences; 2) cortical connections; 3) topographic ormapping criteria; 4) differences in neural receptive field properties;and 5) differences in behavior following stimulation or inactivation(Rosenquist, 1985). While many cortical areas can be specified oneach of the five criteria, other areas must be distinguished from oneanother based upon a preponderance of the evidence.While currentcyto and myeloarchitectonic tools such as Nissl- and myelin-stainscan demarcate cortical laminae accurately, areal differentiations areoften more problematic when using these methods.
The monoclonal antibody SMI-32 (Sternberger Monoclonal Inc.,Baltimore, MD) recognizes the non-phosphorylated epitopes on the

Fig. 1. Lateral view of the left hemisphere of the cat brain. The ten auditory corticalareas identified are labeled. For abbreviations, see List. Scale bar ¼ 10 mm.
J.G. Mellott et al. / Hearing Research 267 (2010) 119e136120
medium and heavy molecular weight subunits of the neurofila-ment protein (Sternberger and Sternberger, 1983) and clearly labelscortical somata and dendrites. This antibody has been used tosubdivide cortex of the old-world monkey (e.g. Hof and Morrison,1995; Hof et al., 1995b; Lewis and Van Essen, 2000) and cat visualcortex (Van der Gucht et al., 2001). SMI-32 has also been used toidentify subdivisions within the cerebellum (Riederer et al., 1996),thalamus (Bickford et al., 1998) and superior colliculus (Fuentes-Santamaria et al., 2006).
SMI-32 has not yet been extensively utilized to distinguishmultiple areas within auditory cortex. Earlier studies examiningauditory cortex with SMI-32 have focused on defining primary orcore auditory areas in a variety of species (Hof et al., 1992; Budingeret al., 2000; Lewis and Van Essen, 2000; Hassiotis et al., 2004;Ashwell et al., 2005; Wong and Kaas, 2009). In the cat, electro-physiological, anatomical, and behavioral studies have been used toreveal at least ten functionally distinct areas of auditory cortex(Fig. 1). Physiologically, four cortical areas have been identified tohave a tonotopic/cochleotopic organization (Woolsey,1960; Knight,1977; Reale and Imig, 1980; Phillips and Orman, 1984). Anatomicalstudies have segregated up to 13 areas in cat auditory cortex basedon differences in cytoarchitecture (Rose, 1949; Sanides andHoffman, 1969; Sousa-Pinto, 1973; Kelly and Wong, 1981),thalamic afferents (Imig and Morel, 1983; Morel and Imig, 1987;Clascá et al., 1997; Huang and Winer, 2000; Lee and Winer,2008a), cortical afferents (Imig and Reale, 1980; Lee and Winer,2008c), and afferents from the contralateral hemisphere (Lee andWiner, 2008b). Behaviorally, permanent or reversible deactivationstudies of specific loci in auditory cortex (Strominger, 1969; Kellyand Whitfield, 1971; Neff et al., 1975; Malhotra and Lomber,2007; Lomber et al., 2007; Malhotra et al., 2008; Lomber andMalhotra, 2008) have also confirmed the existence of at least tenauditory areas.
Therefore, the purpose of the present study was to apply SMI-32as a selective marker for an accurate parcellation of the cat auditorycortex. We were particularly interested in the distribution ofneurons containing neurofilament protein in an attempt to delin-eate cortical areas and to determine the architectonic boundariesbetween adjacent areas. We were able to analyze the anatomicalcharacteristics of ten auditory areas regarding the morphologicaland functional features of neurofilament protein-immunopositiveneurons and successfully determine the locations of areal borders.Preliminary results have been reported previously in abstract form(Mellott et al., 2005).
2. Materials and methods
Twenty-one adult (>6 months) domestic cats were examined.All procedures were conducted in accordance with the CanadianCouncil on Animal Care’s Guide to the Care and Use of Experi-mental Animals (Olfert et al., 1993), the US National ResearchCouncil’s Guidelines for the Care and Use of Mammals in Neuro-science and Behavioral Research (2003), and the EuropeanCommunities Council Directive (November 24, 1986; 86/609/EEC). All procedures were approved by the University of WesternOntario Animal Use Subcommittee of the University Council onAnimal Care.
2.1. Tissue preparation
The afternoon prior to perfusion, each cat was fasted, lightlyanesthetized with ketamine (20 mg/kg, i.m.), and an indwellingfeline catheter was inserted into the cephalic vein (to permitadministration of anesthetic the next day). The following day,general anesthesia was induced by intravenous administration ofsodium pentobarbital (40 mg/kg). Heparin (10,000 U), an antico-agulant, and 1% sodium nitrite (1ml), a vasodilator, were then givenintravenously. Each animal was then perfused through theascending aorta with saline for 5 min, followed by 4% para-formaldehyde for 20 min, and finally 10% sucrose was perfused for5 min to help cryoprotect the tissue. All solutions were buffered topH 7.4 with 0.1 Sorenson’s buffer and infused at a rate of 100 ml/min. The net effect of the procedures was to exsanguinate the cat,a method consistent with the recommendations of the AmericanVeterinary Medical Association Panel on Euthanasia (Beaver et al.,2001), and to fix tissue for the identification of SMI-32 immuno-reactivity. The head was then placed in a stereotaxic apparatus, thebrain was exposed, blocked at Horsley and Clarke (1908) coronallevel A22, and removed from the cranium. Each brain was photo-graphed to provide a permanent record and, for cryoprotection,placed in 30% sucrose until it sunk.
Brains were frozen, sectioned (50 mm thick) coronally (n ¼ 18)or sagittally (n ¼ 3), and collected serially for the entire cere-brum and thalamus. The first series of sections, at 250 mmintervals, was processed for SMI-32 immunoreactivity. Series 2was stained with cresyl violet to reveal the presence of Nisslbodies. Series 3 was processed histochemically to demonstratethe presence of cytochrome oxidase (CO) using proceduresdescribed in previous studies (Wong-Riley, 1979; Payne andLomber, 1996). Series 4 was processed for myelin, using thehemotoxylin method of Jebb and Woolsey (1977). Selectedsections from series 5, as needed, were processed using any ofthe previously described methods.
2.2. Immunocytochemistry
Sections were rinsed for 5e10 min (0.01M PBS), reacted for20 min in 0.3% H2O2, rinsed four more times (5 min each), thenpreincubated for 60 min in normal goat serum (NGS/5%). The free-floating sections were then incubated overnight in the primaryantibody (SMI-32; 1/2000 or 1/4000) at 4 �C with 2% NGS. The nextmorning, tissue was rinsed again four times in PBS and thenincubated in biotinylated second antibody, goat anti-mouse IgG (1/200; 30 min) (Vector Laboratories, Burlingame, CA). After furtherrinses, incubation for 60 min with an avidin-biotin-horseradishperoxidase solution followed (Vectastain Elite ABC, Vector, Burlin-game, CA). After a final rinse sections were then mounted ontogelatin-coated slides, air dried, cleared with xylenes andcoverslipped.

J.G. Mellott et al. / Hearing Research 267 (2010) 119e136 121
2.3. Data analysis
Tissue was analyzed using standard light/dark field microscopywith Neurolucida and accompanying NeuroExplorer software (MBFBioscience, Inc., Williston, VT). For somatic and dendritic countsand somata diameter, Nikon E1000M and 80i microscopes, equip-ped with Nomarski DIC imaging and Nikon digital cameras (Nikon,Melville, NY) with accompanying ACT-1 software, were used.Quantitative measures were taken from vertical traverses of sixcases. In each case, five coronal 50 mm sections from the lefthemisphere were sampled from each of the ten areas examined.Layers were identified in adjacent Nissl-stained sections and in theSMI-32 sections. Somata counts were made at 500 mm widesamples, and dendritic counts were made at 50 mm wide samples.In each section, samples were taken at the center of a given area asdetermined by qualitative measures. Statistical significance for thesomatic and dendritic counts was determined using an analysis ofvariance with follow-up t-tests. Within the Results section, unlessotherwise stated, if a difference is described as being significant orreliable, it was �0.01 level of significance.
2.4. Tonotopic mapping
Acoustically-evoked responses were measured in the righthemisphere in three of the twenty-one animals. Twenty-four hoursprior to surgery, all cats were anesthetized with ketamine (20 mg/kg i.m.) and the cephalic vein was cannulated with a felineindwelling catheter. Dexamethasone (1.0 mg/kg i.v.) was adminis-tered to reduce inflammation during surgical and electrophysio-logical recording procedures. All animals were then fastedovernight. On the day of surgery, anesthesia was induced by aninjection of sodium pentobarbital (25 mg/kg i.v.) (Cheung et al.,2001) followed by supplemental doses as needed. Electrocardio-gram and blood oxygen concentration were monitored to ensureproper levels of anesthesia. A second dose of dexamethasone wasgiven, and atropine (0.03 mg/kg s.c.) was administered to reducerespiratory and alimentary secretions. A rectal probe was used tomonitor body temperature. Core temperature was maintained at37 �C using a water-filled heating pad (Gaymar, Orchard Park, NY).Animals were hydrated using an infusion pump supplying 2.5%dextrose/half-strength lactated Ringers (4 ml/kg/h i.v.). In addition,dexamethasone (1.0 mg/kg i.v.) and atropine (0.03 mg/kg s.c.) wereadministered every 12 h for the duration of the experiment(36e84 h). To ensure adequate ventilation, the mucosa of thepharynx was anesthetized with a topical anesthetic (Cetacaine,Cetylite Laboratories, Pennsauken, NJ) to inhibit the gag reflex, andthe trachea was intubated with a cuffed endotracheal tube. Respi-ration was unassisted. The animal was then positioned in a stereo-taxic frame (David Kopf Instruments, Tujunga, CA) and the headwas fixed by palato-orbital restraints and blunt (non-rupture) earbars. Ophthalmic ointment (Neosporin, Kirkland, Quebec) wasapplied to the cornea to prevent desiccation. A midline incisionwasmade in the scalp and the right temporalis muscle was detachedmedially and reflected laterally. A craniotomy was made over theanterior andmiddle ectosylvian gyri. A head holder was attached tothe frontal bone of the skull with dental acrylic and secured to thestereotaxic frame via a carrier. The ear bars and palato-orbitalrestraints were then removed to permit the unobstructed access ofacoustic signals and tominimize pressure points on the animal. Thedura was resected and a layer of silicone oil was applied to thecortex to prevent desiccation. With the aid of a surgical microscopea digital image of the exposed cortical regionwas taken to maintaina record of the position of each penetration in reference to thecerebral vasculature.
2.4.1. Stimulus generation and presentationRecordings took place on an electrically shielded, vibration-free
table (Technical Manufacturing Corporation, Peabody, MA) withina double-walled sound chamber. Pure tones were calibrated usinga 1/4th inch microphone (Brüel and Kjäer, 4944, Naerum,Denmark) and Tucker-Davis SigCal software. Acoustic signals werepresented in the free-field 15 cm from the left ear, measured at thecenter of the head, and were digitally generated with a 24-bit D/Aconverter at 156 kHz (Tucker-Davis Technologies, Alachua, FL).Frequency-intensity receptive fields were obtained at each recor-ded site by presenting 2064 pure tones (5 ms rise and fall times,cosine squared gated, 25 ms total duration) in a pseudo-randomorder chosen from 16 intensities ranging from 0 to 75 dB SPL in 5 dBsteps, and 129 frequencies in 1/16-octave steps ranging from250 Hz to 64,000 Hz. Two sound transducers were utilized; signalswith frequencies less than 24,000 Hz were delivered from a TS-AI072R speaker (Pioneer, Long Beach, CA) and signals withfrequencies ranging from 24,000 Hz to 64,000 Hz were deliveredfrom an EC1 sound transducer (Tucker-Davis Technologies). Thespeakers were placed immediately adjacent to each other duringcalibration and stimulus delivery. Each frequency-intensitycombination was presented once at a rate of 2.5 Hz.
2.4.2. Recording proceduresParylene-coated tungsten microelectrodes with a 2�1 config-
uration and impedances of 1e2 MU at 1000 Hz were utilized (FHC,Bowdoinham, ME). The electrodes were positioned orthogonallyto the cortical surface and lowered into auditory cortex witha hydraulic microdrive (Narashige, MO-95, Tokyo, Japan). Differ-ences in cortical laminae responses were minimized by recordingneuronal responses at w1200 microns from the cortical surface(layer IV/V). In order to increase the likelihood of consistentlaminae recording all microelectrode penetrations were limited tothe gyral surface circumscribed by the banks of the suprasylviansulcus (ss), the anterior ectosylvian sulcus (aes), and the posteriorectosylvian sulcus (pes). Recordings were bandpass filtered(500 Hze5000 Hz), amplified (�10,000) and digitized at25,000 Hz. Data acquisition was performed using Tucker-DavisTechnologies System 3 hardware and software (OpenEx). Duringthe first 24 h of each recording procedure, frequency-intensityreceptive fields were derived at different locations of auditorycortex to delineate the borders of primary auditory cortex (AI) andthe anterior auditory field (AAF). During these recordings, micro-electrode penetration sites were chosen to avoid damage to bloodvessels while generating a complete and evenly spaced corticalmap. A clear distinction between AI and AAF was establishedbased on the reversal of tonotopic organization (Merzenich et al.,1975; Knight, 1977; Reale and Imig, 1980; Imaizumi et al., 2004).At the end of electrophysiological mapping, the animals wereperfused and the brains were histologically processed as describedearlier.
2.4.3. Data analysisAI and AAF were defined on the basis of their short response
latency (8e25ms) and continuous tonotopy (Imaizumi et al., 2004).Their mutual border was delineated by a reversal of tonotopicorganization, with highest frequencies represented at the border.All other boundaries were determined using non-responsive andnon-AI/AAF sites. The recorded receptive fields were randomizedand analyzed by a blind observer to determine characteristicfrequency, which is defined as the tone frequency that evokesa reliable response at the lowest intensity level. Characteristicfrequency maps were constructed by generating Voronoi tessella-tions as we have done in earlier publications (Carrasco and Lomber,2009a,b).

Fig. 2. Macroscopic views of coronal sections showing SMI-32 immunoreactivity. Even at low magnification the areal boundaries between neighboring regions and differingintensities can be identified (filled black circles). A: The anterior-most cortical regions identified (AAF, fAES, IN) and surrounding area (T). Dorsal regions were more heavily reactive,specifically within layer III, than the ventral regions, IN and T. Scale bar ¼ 1 cm and applies to A, B, and C. B: Middle ectosylvian regions (AI, AII, T) and neighboring regions (DZ, IN).C: Posterior ectosylvian regions (PAF, VPAF) along with middle ectosylvian VAF and neighboring regions (DZ, AI). D: Lateral view of the left cerebrum identifying the coronalpositions of sections A, B and C. For abbreviations, see List.
J.G. Mellott et al. / Hearing Research 267 (2010) 119e136122
3. Results
In the first portion of the Results we describe general charac-teristics of SMI-32 immunoreactive auditory cortex and how arealborders are classified. The second portion of the Results focuses onindividual areas of auditory cortex, the borders between them, andthe quantitative results. Each area is discussed beginning withcentrally located AI, those areas that surround AI and, lastly, thoseareas that do not share a border with AI and are more temporallylocated. The borders between two areas are presented after eachindividual area has been described. In the final portion of theResults the tonotopically-defined AI/AAF border is compared to thesame border delineated by SMI-32.
3.1. General features of SMI-32 immunoreactivity
In auditory cortex, cells immunoreactive for SMI-32 can beidentified in both infra and supragranular layers (Fig. 2), particu-larly in layers IIIb and Va, as confirmed in adjacent Nissl-stainedand CO-reacted sections. Many auditory areas have weak tomoderate somata immunoreactivity in layers II, IIIa and VI. Acrossauditory cortex, layers I and IV contain no immunoreactiveneurons. Immunopositive layer V pyramidal cells are observed in allareas of auditory cortex and are consistently the most intensely
reactive cells. Furthermore, it is observed that as soma sizeincreases, so does the immunoreactive intensity of the SMI-32label. These findings were consistent, regardless of which of thethree laboratories prepared the tissue.
A common characteristic observed throughout auditory cortexis the labeling of apical dendrites. Frequently, the first bifurcation oflabeled apical dendrites is evident and serves as a measure todistinguish two neighboring regions. In most areas, label intensityis positively correlated with somata size. The larger and wider a cellor dendrite, the higher the likelihood the cell or dendrite willdisplay a more intense immunoreactivity. The largest cells (>40 mmin diameter) typically reside in the more dorsal areas (AI, DZ, AAF,and PAF).
Following the same theme, the comparison of AAF and VPAFwas the first indication that there is a gradient in non-phosphor-ylation epitopes across auditory cortex. The AAF profile is thedensest and most reactive of all ten profiles (Fig. 2A). AAF alsooccupies the most anterodorsal position within auditory cortex.While AAF is dense with label, VPAF has the weakest immunore-active profile (Fig. 2C). VPAF is located in the most ventroposteriorextent of auditory cortex. Therefore, in auditory cortex, there isa dorsal to ventral gradient of SMI-32 immunoreactivity withdorsal areas having the highest reactivity and ventral areas havingthe lowest reactivity.
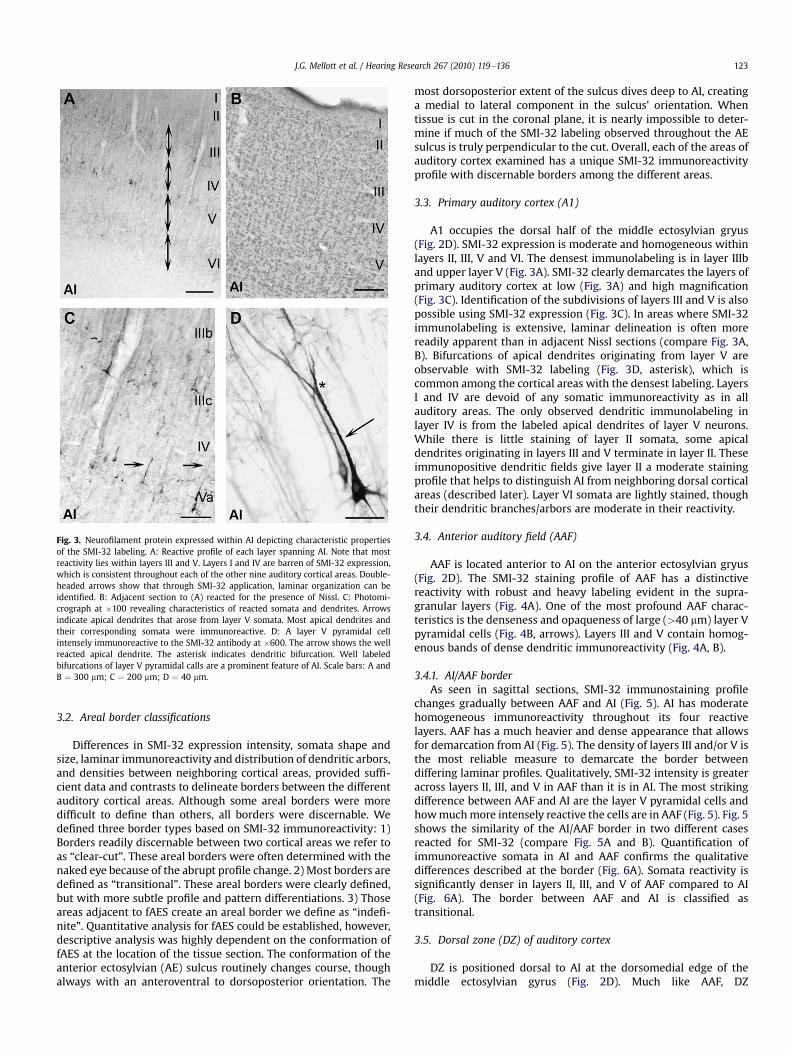
Fig. 3. Neurofilament protein expressed within AI depicting characteristic propertiesof the SMI-32 labeling. A: Reactive profile of each layer spanning AI. Note that mostreactivity lies within layers III and V. Layers I and IV are barren of SMI-32 expression,which is consistent throughout each of the other nine auditory cortical areas. Double-headed arrows show that through SMI-32 application, laminar organization can beidentified. B: Adjacent section to (A) reacted for the presence of Nissl. C: Photomi-crograph at �100 revealing characteristics of reacted somata and dendrites. Arrowsindicate apical dendrites that arose from layer V somata. Most apical dendrites andtheir corresponding somata were immunoreactive. D: A layer V pyramidal cellintensely immunoreactive to the SMI-32 antibody at �600. The arrow shows the wellreacted apical dendrite. The asterisk indicates dendritic bifurcation. Well labeledbifurcations of layer V pyramidal calls are a prominent feature of AI. Scale bars: A andB ¼ 300 mm; C ¼ 200 mm; D ¼ 40 mm.
J.G. Mellott et al. / Hearing Research 267 (2010) 119e136 123
3.2. Areal border classifications
Differences in SMI-32 expression intensity, somata shape andsize, laminar immunoreactivity and distribution of dendritic arbors,and densities between neighboring cortical areas, provided suffi-cient data and contrasts to delineate borders between the differentauditory cortical areas. Although some areal borders were moredifficult to define than others, all borders were discernable. Wedefined three border types based on SMI-32 immunoreactivity: 1)Borders readily discernable between two cortical areas we refer toas “clear-cut”. These areal borders were often determined with thenaked eye because of the abrupt profile change. 2) Most borders aredefined as “transitional”. These areal borders were clearly defined,but with more subtle profile and pattern differentiations. 3) Thoseareas adjacent to fAES create an areal border we define as “indefi-nite”. Quantitative analysis for fAES could be established, however,descriptive analysis was highly dependent on the conformation offAES at the location of the tissue section. The conformation of theanterior ectosylvian (AE) sulcus routinely changes course, thoughalways with an anteroventral to dorsoposterior orientation. The
most dorsoposterior extent of the sulcus dives deep to AI, creatinga medial to lateral component in the sulcus’ orientation. Whentissue is cut in the coronal plane, it is nearly impossible to deter-mine if much of the SMI-32 labeling observed throughout the AEsulcus is truly perpendicular to the cut. Overall, each of the areas ofauditory cortex examined has a unique SMI-32 immunoreactivityprofile with discernable borders among the different areas.
3.3. Primary auditory cortex (A1)
A1 occupies the dorsal half of the middle ectosylvian gryus(Fig. 2D). SMI-32 expression is moderate and homogeneous withinlayers II, III, V and VI. The densest immunolabeling is in layer IIIband upper layer V (Fig. 3A). SMI-32 clearly demarcates the layers ofprimary auditory cortex at low (Fig. 3A) and high magnification(Fig. 3C). Identification of the subdivisions of layers III and V is alsopossible using SMI-32 expression (Fig. 3C). In areas where SMI-32immunolabeling is extensive, laminar delineation is often morereadily apparent than in adjacent Nissl sections (compare Fig. 3A,B). Bifurcations of apical dendrites originating from layer V areobservable with SMI-32 labeling (Fig. 3D, asterisk), which iscommon among the cortical areas with the densest labeling. LayersI and IV are devoid of any somatic immunoreactivity as in allauditory areas. The only observed dendritic immunolabeling inlayer IV is from the labeled apical dendrites of layer V neurons.While there is little staining of layer II somata, some apicaldendrites originating in layers III and V terminate in layer II. Theseimmunopositive dendritic fields give layer II a moderate stainingprofile that helps to distinguish AI from neighboring dorsal corticalareas (described later). Layer VI somata are lightly stained, thoughtheir dendritic branches/arbors are moderate in their reactivity.
3.4. Anterior auditory field (AAF)
AAF is located anterior to AI on the anterior ectosylvian gryus(Fig. 2D). The SMI-32 staining profile of AAF has a distinctivereactivity with robust and heavy labeling evident in the supra-granular layers (Fig. 4A). One of the most profound AAF charac-teristics is the denseness and opaqueness of large (>40 mm) layer Vpyramidal cells (Fig. 4B, arrows). Layers III and V contain homog-enous bands of dense dendritic immunoreactivity (Fig. 4A, B).
3.4.1. AI/AAF borderAs seen in sagittal sections, SMI-32 immunostaining profile
changes gradually between AAF and AI (Fig. 5). AI has moderatehomogeneous immunoreactivity throughout its four reactivelayers. AAF has a much heavier and dense appearance that allowsfor demarcation from AI (Fig. 5). The density of layers III and/or V isthe most reliable measure to demarcate the border betweendiffering laminar profiles. Qualitatively, SMI-32 intensity is greateracross layers II, III, and V in AAF than it is in AI. The most strikingdifference between AAF and AI are the layer V pyramidal cells andhowmuchmore intensely reactive the cells are in AAF (Fig. 5). Fig. 5shows the similarity of the AI/AAF border in two different casesreacted for SMI-32 (compare Fig. 5A and B). Quantification ofimmunoreactive somata in AI and AAF confirms the qualitativedifferences described at the border (Fig. 6A). Somata reactivity issignificantly denser in layers II, III, and V of AAF compared to AI(Fig. 6A). The border between AAF and AI is classified astransitional.
3.5. Dorsal zone (DZ) of auditory cortex
DZ is positioned dorsal to AI at the dorsomedial edge of themiddle ectosylvian gyrus (Fig. 2D). Much like AAF, DZ

Fig. 4. Expression profiles of dorsal regions AAF (A, B) and DZ (C, D) at �40 (A, C) and�100 (B, D). A: SMI-32 reactivity across all cortical layers of AAF. AAF is characterizedby an intense reaction, particularly layers II, III and V. Asterisk indicates layer V. B:Higher magnification (�100) of SMI-32 expression in AAF. Arrows indicate layer Vsomata. Robust labeling of large (>30 mm) pyramidal cells throughout layer V isa unique characteristic of AAF. C: Photomicrograph of SMI-32 expression throughoutall cortical layers of DZ. A distinguishing feature of DZ is the strong reactivitythroughout layers II and III. Note that layer V in AAF was more intensely labeled thanlayer V of DZ (asterisks). D: Higher magnification (�100) of SMI-32 expression in DZ.Arrows indicate layer V somata reactive to SMI-32. Scale bars: A and C ¼ 400 mm; B andD ¼ 100 mm.
Fig. 5. SMI-32 immunoreactivity in sagittal sections through the middle ectosylviangyrus. Layer IV is labeled in each and borders are marked by black lines. A: The AI/AAFborder at �200 in case UT39. B: The AI/AAF border at �200 in case UT45. D ¼ dorsal;A ¼ anterior. Scale bars: A and B ¼ 1000 mm.
J.G. Mellott et al. / Hearing Research 267 (2010) 119e136124
characteristically has heavy immunoreactivity throughout thesupragranular layers (Fig. 4C, D). While neuropil labeling is highlyreactive in DZ, there is also an increased density of dendritic arborsthat when combined, gives the supragranular layers a darkerappearance relative to the other laminae (Fig. 4C). DZ’s averagedendritic number for layer III, per 50 mm swathe (48.6 � 4.4), issignificantly higher than the average across layer III of all auditorycortex (34.5 � 6.7; Table 1). Similar to AAF, DZ is heavily immuno-reactive throughout layer III (Fig. 4C, D). Labeled cells of larger size(>30 mm) are often observed throughout layer V (Fig. 4D, arrows).Immunoreactivity in layer VI is light in somata and moderate indendrites (Fig. 4C). Supragranular dendritic arbors are commonlymore expansive yet, not as intensely reactive as those found withinlayer V (Fig. 4C).
3.5.1. AI/DZ borderThe defining areal contrast between DZ and AI, is the high
density of somata and dendrites labeled throughout layers III and Vof DZ (Fig. 7). The number of dendrites per 50 mm swathe issignificantly higher in DZ (48.6 � 4.4) than in AI (37.1 � 3.8; Table1); and the number of somata per 500 mm swathe is also signifi-cantly higher in DZ (58.7 � 3.9) than that of AI (40.7 � 5.2; Fig. 6B).Somata reactivity is significantly denser in layers II, III, and V of DZcompared to AI (Fig. 6B). Fig. 7 shows the similarity of the AI/DZborder in three different cases reacted for SMI-32 (compare
Fig. 7AeF). Given that the changes between DZ and AI are notabrupt, this border is defined as transitional.
3.5.2. AAF/DZ borderThe dominant feature of AAF that made areal differentiation
between AAF and DZ possible is the density profile in layer V of AAF.When compared to DZ, it is readily observable that layer V of AAF ismore reactive and denser than layer V of DZ (Fig. 4A, C, asterisks).The supragranular layers of AAF have the densest labeling of anyarea within auditory cortex and are more robust than the supra-granular labeling in DZ (compare Fig. 4A and C). Similar to the AI/DZborder, AAF/DZ is also transitional in nature.
3.6. Second auditory cortex (AII)
AII is located at the union of the middle ectosylvian and sylviangyri, situated between the anterior and posterior ectosylvian sulci(Fig. 2D). The dorsal border of AII is AI (Figs.1 and 2B, D). This area isdistinctive for its heavy neuropil labeling throughout layer V andlarger somata labeling (Fig. 8A, C, D). Of the auditory areas, thesecond largest population of immunoreactive pyramidal cells isfound in layer V of AII (Fig. 8A, C; Table 1). Often, the layer Vpyramidal cells are thoroughly labeled by the presence of the SMI-32 antibody (Fig. 8C, D). Large basal and apical dendrites areregularly observed (Fig. 8C, D, arrows). In addition, axon bifurca-tions are routinely labeled (Fig. 8D, asterisk).

Fig. 6. Comparison of somata immunoreactivity between AI and each of its neighbors. A: AAF, B: DZ, C: AII, D: PAF. Each border shown is transitional. Graphs show mean � SEimmunoreactivity in each of the four immunoreactive layers (II, III, V, VI). Asterisks indicate significant difference at p < 0.01.
Table 1Quantification of cell labeling, pyramidal cell diameter and number, and number of apical dendrites in each of the ten areas of cat auditory cortex identified with SMI-32immunoreactivity.
J.G. Mellott et al. / Hearing Research 267 (2010) 119e136 125

Fig. 7. SMI-32 immunoreactivity in coronal sections through AI of three cases. Layer IV is labeled in each and borders are marked by black lines. AeC: Low magnificationphotomicrographs of AI in cases 1560, 1553, and 1602. D: The AI/DZ border at �200 in case 1560. E: The AI/DZ border at �400 in case 1553. F: The AI/DZ border at �400 in case 1602.Scale bars: AeC ¼ 2000 mm; DeF ¼ 1000 mm.
Fig. 8. SMI-32 reactivity in the middle ectosylvian areas AII (A,C,D) and VAF (B,E) A: Border of AII and neighboring cortical region IN. B: Low magnification photomicrograph of SMI-32 expression in VAF. Note heavy reactivity in layer V somata (arrows). C: Magnification (�100) of AII layer V somata. Arrows indicate the characteristic well-labeled apicaldendrites. D: A layer V pyramidal cell in AII at �600 under darkfield illumination. Arrows indicate the well-defined dendrites that were commonly identified. The asterisk indicatesa commonly observed bifurcation in an apical dendrite. E: Layer V somata in VAF at �100. The arrow shows the lack of a well-labeled apical dendrite, which is commonly absentfrom layer V somata in VAF. Scale bars: A and B ¼ 500 mm; C and E ¼ 50 mm; D ¼ 40 mm.
J.G. Mellott et al. / Hearing Research 267 (2010) 119e136126
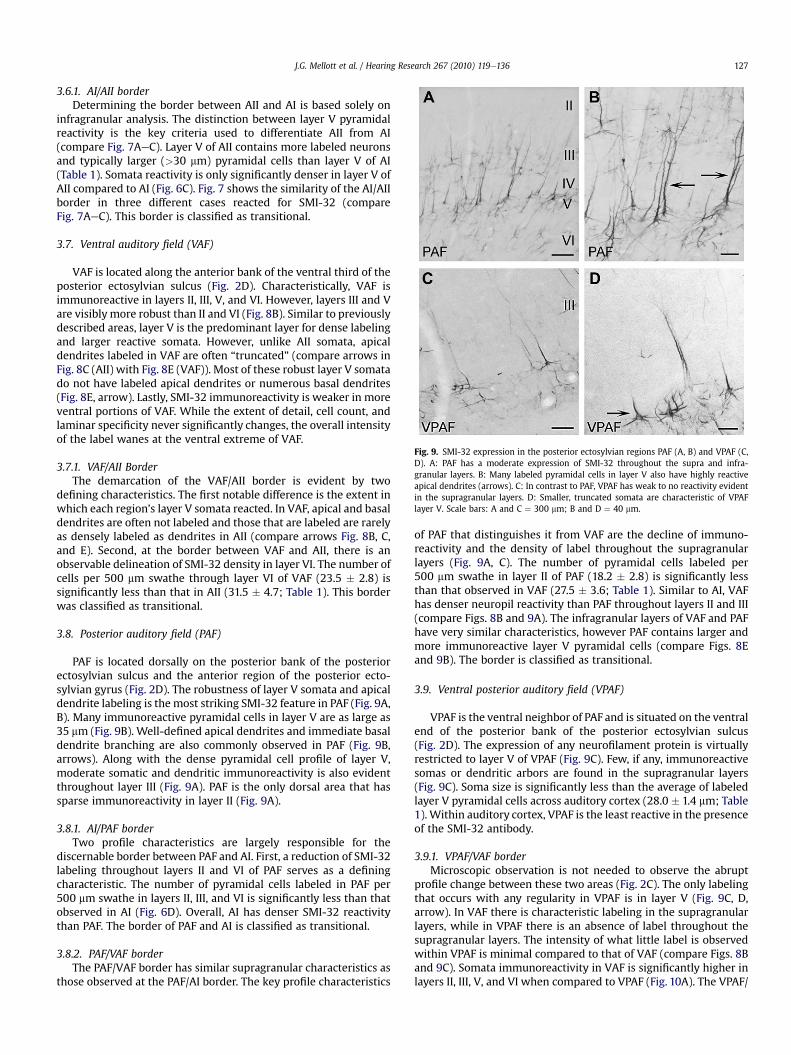
Fig. 9. SMI-32 expression in the posterior ectosylvian regions PAF (A, B) and VPAF (C,D). A: PAF has a moderate expression of SMI-32 throughout the supra and infra-granular layers. B: Many labeled pyramidal cells in layer V also have highly reactiveapical dendrites (arrows). C: In contrast to PAF, VPAF has weak to no reactivity evidentin the supragranular layers. D: Smaller, truncated somata are characteristic of VPAFlayer V. Scale bars: A and C ¼ 300 mm; B and D ¼ 40 mm.
J.G. Mellott et al. / Hearing Research 267 (2010) 119e136 127
3.6.1. AI/AII borderDetermining the border between AII and AI is based solely on
infragranular analysis. The distinction between layer V pyramidalreactivity is the key criteria used to differentiate AII from AI(compare Fig. 7AeC). Layer V of AII contains more labeled neuronsand typically larger (>30 mm) pyramidal cells than layer V of AI(Table 1). Somata reactivity is only significantly denser in layer V ofAII compared to AI (Fig. 6C). Fig. 7 shows the similarity of the AI/AIIborder in three different cases reacted for SMI-32 (compareFig. 7AeC). This border is classified as transitional.
3.7. Ventral auditory field (VAF)
VAF is located along the anterior bank of the ventral third of theposterior ectosylvian sulcus (Fig. 2D). Characteristically, VAF isimmunoreactive in layers II, III, V, and VI. However, layers III and Vare visibly more robust than II and VI (Fig. 8B). Similar to previouslydescribed areas, layer V is the predominant layer for dense labelingand larger reactive somata. However, unlike AII somata, apicaldendrites labeled in VAF are often “truncated” (compare arrows inFig. 8C (AII) with Fig. 8E (VAF)). Most of these robust layer V somatado not have labeled apical dendrites or numerous basal dendrites(Fig. 8E, arrow). Lastly, SMI-32 immunoreactivity is weaker in moreventral portions of VAF. While the extent of detail, cell count, andlaminar specificity never significantly changes, the overall intensityof the label wanes at the ventral extreme of VAF.
3.7.1. VAF/AII BorderThe demarcation of the VAF/AII border is evident by two
defining characteristics. The first notable difference is the extent inwhich each region’s layer V somata reacted. In VAF, apical and basaldendrites are often not labeled and those that are labeled are rarelyas densely labeled as dendrites in AII (compare arrows Fig. 8B, C,and E). Second, at the border between VAF and AII, there is anobservable delineation of SMI-32 density in layer VI. The number ofcells per 500 mm swathe through layer VI of VAF (23.5 � 2.8) issignificantly less than that in AII (31.5 � 4.7; Table 1). This borderwas classified as transitional.
3.8. Posterior auditory field (PAF)
PAF is located dorsally on the posterior bank of the posteriorectosylvian sulcus and the anterior region of the posterior ecto-sylvian gyrus (Fig. 2D). The robustness of layer V somata and apicaldendrite labeling is the most striking SMI-32 feature in PAF (Fig. 9A,B). Many immunoreactive pyramidal cells in layer V are as large as35 mm (Fig. 9B). Well-defined apical dendrites and immediate basaldendrite branching are also commonly observed in PAF (Fig. 9B,arrows). Along with the dense pyramidal cell profile of layer V,moderate somatic and dendritic immunoreactivity is also evidentthroughout layer III (Fig. 9A). PAF is the only dorsal area that hassparse immunoreactivity in layer II (Fig. 9A).
3.8.1. AI/PAF borderTwo profile characteristics are largely responsible for the
discernable border between PAF and AI. First, a reduction of SMI-32labeling throughout layers II and VI of PAF serves as a definingcharacteristic. The number of pyramidal cells labeled in PAF per500 mm swathe in layers II, III, and VI is significantly less than thatobserved in AI (Fig. 6D). Overall, AI has denser SMI-32 reactivitythan PAF. The border of PAF and AI is classified as transitional.
3.8.2. PAF/VAF borderThe PAF/VAF border has similar supragranular characteristics as
those observed at the PAF/AI border. The key profile characteristics
of PAF that distinguishes it from VAF are the decline of immuno-reactivity and the density of label throughout the supragranularlayers (Fig. 9A, C). The number of pyramidal cells labeled per500 mm swathe in layer II of PAF (18.2 � 2.8) is significantly lessthan that observed in VAF (27.5 � 3.6; Table 1). Similar to AI, VAFhas denser neuropil reactivity than PAF throughout layers II and III(compare Figs. 8B and 9A). The infragranular layers of VAF and PAFhave very similar characteristics, however PAF contains larger andmore immunoreactive layer V pyramidal cells (compare Figs. 8Eand 9B). The border is classified as transitional.
3.9. Ventral posterior auditory field (VPAF)
VPAF is the ventral neighbor of PAF and is situated on the ventralend of the posterior bank of the posterior ectosylvian sulcus(Fig. 2D). The expression of any neurofilament protein is virtuallyrestricted to layer V of VPAF (Fig. 9C). Few, if any, immunoreactivesomas or dendritic arbors are found in the supragranular layers(Fig. 9C). Soma size is significantly less than the average of labeledlayer V pyramidal cells across auditory cortex (28.0 � 1.4 mm; Table1). Within auditory cortex, VPAF is the least reactive in the presenceof the SMI-32 antibody.
3.9.1. VPAF/VAF borderMicroscopic observation is not needed to observe the abrupt
profile change between these two areas (Fig. 2C). The only labelingthat occurs with any regularity in VPAF is in layer V (Fig. 9C, D,arrow). In VAF there is characteristic labeling in the supragranularlayers, while in VPAF there is an absence of label throughout thesupragranular layers. The intensity of what little label is observedwithin VPAF is minimal compared to that of VAF (compare Figs. 8Band 9C). Somata immunoreactivity in VAF is significantly higher inlayers II, III, V, and VI when compared to VPAF (Fig. 10A). The VPAF/
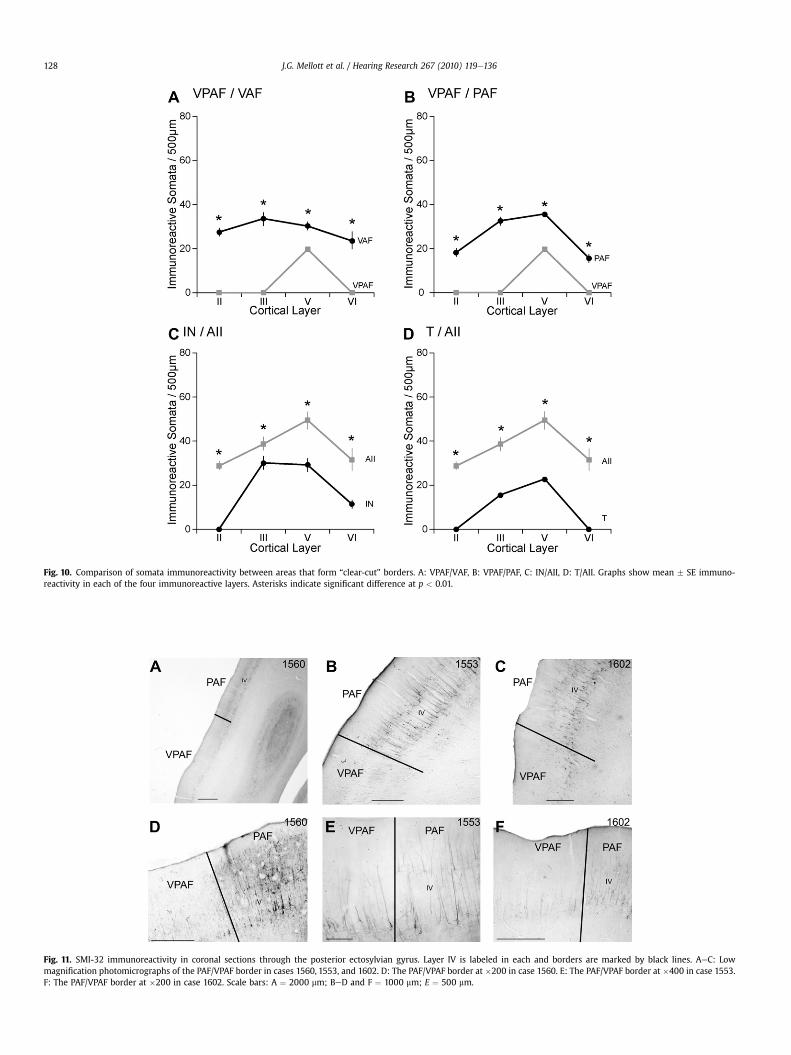
Fig. 10. Comparison of somata immunoreactivity between areas that form “clear-cut” borders. A: VPAF/VAF, B: VPAF/PAF, C: IN/AII, D: T/AII. Graphs show mean � SE immuno-reactivity in each of the four immunoreactive layers. Asterisks indicate significant difference at p < 0.01.
Fig. 11. SMI-32 immunoreactivity in coronal sections through the posterior ectosylvian gyrus. Layer IV is labeled in each and borders are marked by black lines. AeC: Lowmagnification photomicrographs of the PAF/VPAF border in cases 1560, 1553, and 1602. D: The PAF/VPAF border at �200 in case 1560. E: The PAF/VPAF border at �400 in case 1553.F: The PAF/VPAF border at �200 in case 1602. Scale bars: A ¼ 2000 mm; BeD and F ¼ 1000 mm; E ¼ 500 mm.
J.G. Mellott et al. / Hearing Research 267 (2010) 119e136128

Fig. 12. SMI-32 expression profiles in limbic areas IN (A, B) and T (C,D). A, C are coronalsections and B, D are sagittal sections. A, B: Moderate to weak immunoreactivity spansacross area IN, although somata and dendrites are readily visible and defined. In areaIN, somata generally have a smaller stature than the more dorsal auditory regions. C, D:Layer V of area T is the most reactive layer. Traces of reactivity can be identified in layerIII, but layers II and VI are barren. The arrow points to a layer V pyramidal cell in area T.Asterisks identify commonly found dendritic fragments strewn throughout area T.Scale bars ¼ 50 mm.
J.G. Mellott et al. / Hearing Research 267 (2010) 119e136 129
VAF border is one of only a small number of borders that is definedas “clear-cut”.
3.9.2. VPAF/PAF borderSMI-32 is commonly reactive in both the supragranular and
infragranular layers of PAF, while in VPAF the immunoreactivity isrestricted to layer V (Fig. 11). Fig. 11 shows the similarity of theVPAF/PAF border in three different cases reacted for SMI-32(compare Fig. 11AeC). Somata immunoreactivity in PAF is signifi-cantly higher in layers II, III, V, and VI when compared to VPAF(Fig. 10B). The VPAF/PAF border is “clear-cut”.
3.10. Insular cortex (IN)
Area IN resides between the ventral extent of the anteriorectosylvian sulcus and the dorsal extent of the rhinal sulcus(Fig. 2D). Small numbers of weak tomoderately stained neurons areindicative of IN (Fig. 12A, arrows; B, sagittal). SMI-32 labeling isgreatest in layer V, though some SMI-32 reactivity can be identifiedin layers III and VI (Fig. 12A, arrows). Layer II is absent any neuropilor neuronal labeling (Fig. 12A). The presence of elaborate dendriticfields or dense clusters of cells is absent. There is also an absence oflarge (>30 mm), labeled pyramidal cells within layer V (Fig. 12A, B).
3.10.1. IN/AII borderThere are three dramatic differences in the SMI-32 profiles
between areas IN and AII. First, layer II of IN is not immunoreactivewhile layer II of AII is moderately reactive (compare Figs. 7A and9A). Secondly, in area IN, the immunoreactive layer V pyramidalcells are not as intensely stained as in AII (compare Figs. 8C and12A). Lastly, for all cortical layers, the overall somata immunore-activity is significantly lower in area IN compared to AII (Fig. 10C).The border between IN and AII is classified as “clear-cut.”
3.11. Temporal cortex (T)
Area T is located on the posterior sylvian gyrus (Fig. 2D). Area Thas an overall weak immunoreactivity for the SMI-32 antibody andis only reactive for two layers. Layer III is weakly reactive and layerV is moderately reactive (Fig. 12C, arrow; D, sagittal). The averagenumber of labeled somata across layer III per 500 mm swathe(15.6 � 3.3; Table 1) is significantly lower (p < 0.05) than theaverage number of labeled cells across layer III of all auditory areas,(34.5 � 6.7; Table 1). Apical dendrites are typically not visualizedand cell bodies are small (<25 mm; Fig. 12C). Basal dendrites arelabeled, but they are weakly immunoreactive and often truncatedin appearance (Fig. 12C, D). Well-labeled and defined apicaldendrites are rarely observed (Fig. 12C, D). However, apicaldendrites are commonly observed and have a fragmented appear-ance (Fig. 12C, D, asterisks).
3.11.1. T/AII borderThe absence of labeling of layers II and VI in area T is easy to
identify and distinguishes area T from the densely labeled AII. TheT/AII border is one of few areal borders of auditory cortex in whicheach layer compared is of different intensity and every somata anddendritic count examined is significantly different (Table 1).Somata immunoreactivity in AII is significantly higher in layers II,III, V, and VI when compared to T (Fig. 10D). The border between Tand AII is clear-cut.
3.11.2. T/VAF BorderThe posterior border of temporal cortex is VAF. As previously
described, the profile of VAF at its most ventral extent has a weakSMI-32 staining intensity. Both T and VAF have weak immunore-activity at their border. Barren layers II and VI of area T help todefine the T/VAF border. We classify the border as transitional.
3.11.3. T/IN BorderDifferences in SMI-32 immunoreactivity place the border
between area T and area IN at the fundus of the sylvian sulcus.Faintly labeled and scattered immunoreactive pyramidal cells andfragments of dendritic fields can be identified in layer VI of area IN.No such reactivity is present in layer VI of area T. Another profilecharacteristic that changes gradually at the border is apicaldendrite detail. Apical dendrites within layer V of area IN are oftenobserved and bifurcations are seen among labeled apical dendritesof area IN (Fig. 12A, B). However, well-labeled apical dendrites arerarely observed in area T (Fig. 12C, D). There is no abrupt change inprofiles at the T/IN border. Therefore, the border is defined astransitional.
3.12. Auditory field of the anterior ectosylvian sulcus (fAES)
fAES is located at the most posterodorsal aspect of the AE sulcus.Sulcal and gyral patterns of the AE sulcus vary greatly from one caseto another. The characteristic immunoreactivity of layer III and Vsomata and dendrites is prevalent in fAES (Fig. 13). Moderateimmunoreactivity of somata and dendrites defines layers II, III andV of fAES; while layer VI is best described as reacting lightly to theSMI-32 antibody. Apical dendrites of layer V somata are morecommonly observed on the medial aspect of fAES (Fig. 13B,asterisk), whereas the apical dendrites of layer V somata on thelateral aspect of fAES are not usually reactive (Fig. 13C, asterisk).Under lower magnification the lack of apical dendritic reactivity onthe lateral aspect is still apparent (Fig. 13A). Sagittal views of AEsulcus reveal a general “widening” of SMI-32 immunoreactivityacross the supragranular layers in the anterodorsal plane, but not inthe posteroventral plane (Fig. 13D).

Fig. 13. SMI-32 expression in the anterior ectosylvian (AE) sulcus. A: The photomi-crograph shows possible SMI-32 subregions within the AE sulcus, medial and lateral.B: At higher power, a characteristic of the medial portion of the AE sulcus is the morefull and reactive apical dendrites (*). C: The lateral portion of the AE sulcus has a morefragmented SMI-32 reactivity throughout layer V somata. D: Expression profile of theAE sulcus from another brain prepared sagittally. The double-headed arrow points toreactive disparity evident between supragranular layers of the anterior and posteriorregions of the AE sulcus. Scale bars: A ¼ 1000 mm; B and C ¼ 50 mm; D ¼ 2000 mm.
J.G. Mellott et al. / Hearing Research 267 (2010) 119e136130
3.12.1. fAES/AI, AAF and AII bordersBorders that include fAES are defined as indefinite. The confor-
mational changes of AE sulcus between individual cases make itdifficult to discern a true border in any single tissue plane. AI, AAFandAII all have moderate intensities of the SMI-32 antibody across layerVI,while fAESdoes not (compare Figs. 3A, 4A, 8A and13A). Analysis offAES reveals a significantly low average number of labeled somata inlayer VI (15.9 � 3.8) per 500 mm swathe, as compared to the averagenumber of AI, AAF and AII’s layer VI somata count (34.8 � 4.8) per500 mm swathe (Table 1). Therefore, the only measure that canconsistently differentiate fAES from adjacent auditory areas is thesevere reduction in SMI-32 immunoreactivity in layer VI.
3.13. Dorsal and ventral immunoreactive properties of cat auditorycortex
The most striking observation of our immunoreactive labelingacross auditory cortex is the well-illustrated difference betweencortical areas that are more dorsal in the cat cerebrum (AAF, AI, AII,PAF and DZ) and those that are more ventral (VPAF, VAF, T and IN).
The density of immunoreactivity throughout the dorsal regions issubstantially more abundant than that of the ventral regions(Fig. 2AeC). Increased dendritic, neuropil and somata immunore-activity are the contributing factors to the observed densityincrease in the dorsal regions. Dorsally, not only are more dendritessensitive to the antibody, but the average length of immunoreactivedendrites is also increased.
The one “common thread” among all the auditory cortical areaswe identified is the layer V immunoreactivity. Since this charac-teristic is consistent among all areas, it is the somata and dendritesthroughout layer V that we used as another division between“dorsal” and “ventral”. In each of the dorsal cortical areas (AI, AAF,AII, DZ and PAF) the average number of cells labeled is >35/500 mmswathe, while average somata count among the ventral areas (VAF,T, IN, and VPAF) is <35 (Table 1).
3.14. Functional and anatomical comparison of the AI/AAF border
The final portion of the investigation was to determine therelationship between functionally- and anatomically-definedborders in auditory cortex. To do this, we examined the borderbetween A1 and AAF. Consistent with previous reports, both fieldswere tonotopically organized (Knight, 1977; Merzenich et al., 1975;Reale and Imig, 1980). In all three animals examined, a reversal inthe direction of the frequency gradient was observed at the anteriorborder of A1 (Fig. 14AeC). The border between A1 and AAF waslocated dorsal to the anterior ectosylvian sulcus at the region ofhigh frequency representation in A1 and AAF (Fig. 14AeC). Simi-larly, the location of the A1eAAF border, as defined by SMI-32immunoreactivity (Fig.. 14DeF), was identified to be in virtually theidentical position as the tonotopically-defined border (e.g. compareFig. 14B and E). This was consistent for all three cases examined(Fig. 14). Therefore, there is a close correlation between the func-tionally-defined position of an areal border in auditory cortex andthe anatomically-defined border differentiated using SMI-32immunoreactivity.
4. Discussion
4.1. Summary
Non-phosphorylated epitopes are found throughout the centralnervous system and are identified with the SMI-32 antibody. Wehave shown that SMI-32 expression is an excellent tool that can beused to distinguish the auditory areas of the cat cerebrum. Each ofthe examined ten auditory cortical areas has a unique SMI-32staining signature (Fig.15). Common features of all auditory corticalareas are: 1) layers I and IV neurons are immunonegative; 2) nearlyall immunoreactive cells are pyramidal; and 3) immunoreactiveneurons are always present in layer V (Fig. 15).
4.2. SMI-32 antibody as a marker for cat auditory cortex
The current study is a qualitative and quantitative reportdemonstrating the reliability of the SMI-32 antibody when appliedto auditory cortex of the cat. The present study demonstrates theusefulness and feasibility of using SMI-32 staining to delineateareas of the cat auditory cortex in a manner similar to that previ-ously described for the twenty visual areas of the cat cerebrum(Van der Gucht et al., 2001). The application of the SMI-32 antibodyselectively marked and uniquely identified ten auditory corticalareas. The present study emphasizes the two primary features ofSMI-32 staining in the cerebrum; cell type and laminar position.SMI-32 preferentially labels pyramidal cells and their dendrites inall layers, and large pyramidal cells are more strongly

Fig. 14. The right hemisphere of three brains showing the A1eAAF border as defined by tonotopy (AeC) and the A1eAAF border as defined by SMI-32 reactivity (DeF). AeC)Characteristic frequency representation of two auditory cortical fields. Border was defined based on tonotopic organization. Each polygon represents an estimation of the corticalarea with similar response properties as the recording site. The color of each polygon identifies the characteristic frequency at the recorded cortical location. DeF) Location of theA1eAAF border as defined by SMI-32 staining. A1 is shown in light grey and AAF is shown in dark grey. Note the similarities in the position of the border as defined by each method.Sulci are highlighted with thick white lines and indicated by italics: pes, posterior ectosylvian sulcus; ss, suprasylvian sulcus; aes, anterior ectosylvian sulcus. D, dorsal; A, anterior.Scale: 2 mm.
J.G. Mellott et al. / Hearing Research 267 (2010) 119e136 131
immunoreactive than smaller cells. SMI-32 immunoreactivitytargets neurofilament proteins that are found in considerablequantities throughout the neuronal cytoskeleton. The proteins aretypically comprised of three subunits with molecular weights of200,170 and 70 kDa (Liem et al., 1978). Sternberger and Sternberger(1983) showed that heavy (200 kDa) and medium (168 kDa)molecular weight subunits of neurofilament proteins found ondendrites and somata are not phosphorylated, unlike the subunitsfound in axons, which are phosphorylated. These properties, asdefined by Sternberger and Sternberger (1983), permitted us toshow that each cortical area has a distinct neurofilament profileand that the changes in SMI-32 profiles between areas indicate anactual difference in function.
In cat auditory cortex SMI-32 preferentially labeled layers III andV. Medium-size layer III pyramidal cells in primary auditory cortexare typically corticocortical projection neurons (Winer, 1984) whilethe medium-sized layer V pyramidal cells target subcortical nuclei(Winer, 1992; Winer and Prieto, 2001). The larger, more intenselystained layer V pyramidal cells most likely project to the inferiorcolliculus (Winer, 1992). This association between immunopositiveSMI-32 cells and their efferent targets strengthens the notion thatthere is a relation between SMI-32 immunoreactivity within
a particular layer and the functional role of a given neuronalpopulation.
4.3. Parcellation of cat auditory cortex
The mammalian auditory cortex contains many functionallydistinct areas (see Winer, 1992; De Ribaupierre, 1997). Earlierstudies have differentiated auditory cortical areas with connec-tional, functional, physiological, behavioral, pharmacological andmetabolic approaches. Establishing architectonic criteria is vital indetermining the accuracy of electrode placements, tracer injec-tions, or deactivation loci. Common histological stains such as Nissl,cytochrome oxidase and myelin, have advantages, but are limitedwhen it comes to establishing areal differences and borders(Fig. 16). By using the properties of non-phosphorylated epitopesfound throughout cortical (Campbell and Morrison, 1989; Hof et al.,1995b; Nimchinsky et al., 1996; Van der Gucht et al., 2001; Boireet al., 2005) and subcortical (Bickford et al., 1998; Van der Guchtet al., 2001; Boire et al., 2005) structures, SMI-32 has proven tobe a very powerful tool for determining functional borders.
In the present study we utilized additional resources to assist indetermining the exact location of each auditory area and the
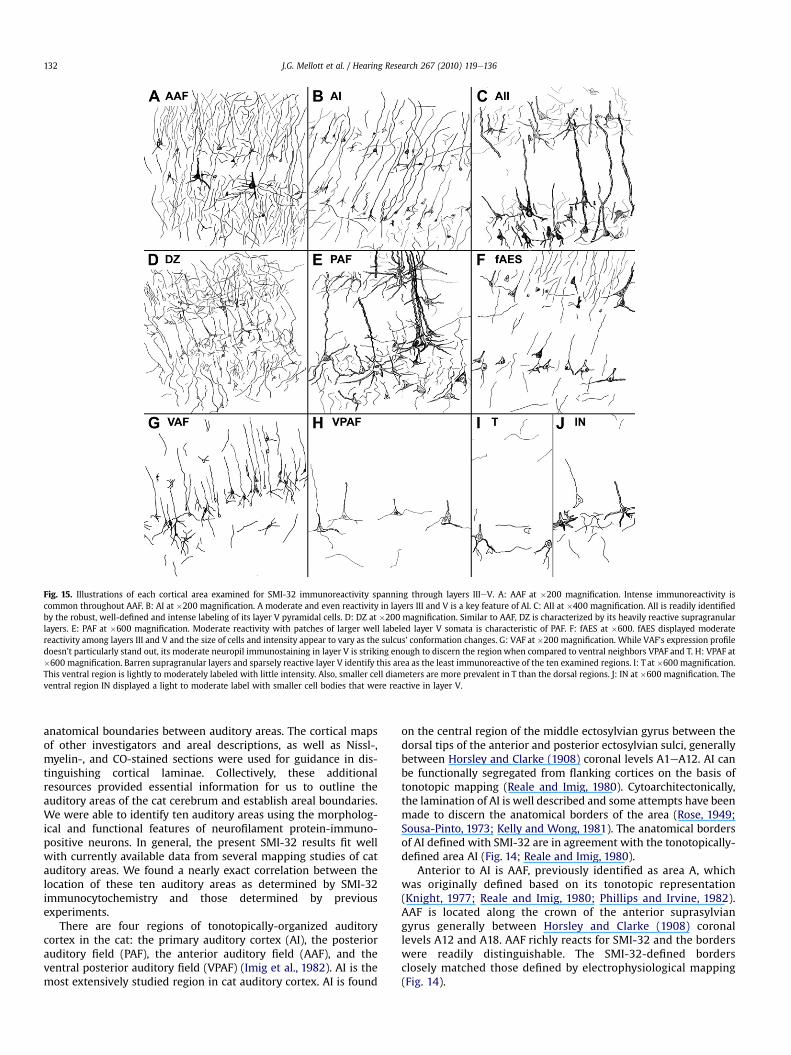
Fig. 15. Illustrations of each cortical area examined for SMI-32 immunoreactivity spanning through layers IIIeV. A: AAF at �200 magnification. Intense immunoreactivity iscommon throughout AAF. B: AI at �200 magnification. A moderate and even reactivity in layers III and V is a key feature of AI. C: AII at �400 magnification. AII is readily identifiedby the robust, well-defined and intense labeling of its layer V pyramidal cells. D: DZ at �200 magnification. Similar to AAF, DZ is characterized by its heavily reactive supragranularlayers. E: PAF at �600 magnification. Moderate reactivity with patches of larger well labeled layer V somata is characteristic of PAF. F: fAES at �600. fAES displayed moderatereactivity among layers III and V and the size of cells and intensity appear to vary as the sulcus’ conformation changes. G: VAF at �200 magnification. While VAF’s expression profiledoesn’t particularly stand out, its moderate neuropil immunostaining in layer V is striking enough to discern the region when compared to ventral neighbors VPAF and T. H: VPAF at�600 magnification. Barren supragranular layers and sparsely reactive layer V identify this area as the least immunoreactive of the ten examined regions. I: T at �600 magnification.This ventral region is lightly to moderately labeled with little intensity. Also, smaller cell diameters are more prevalent in T than the dorsal regions. J: IN at �600 magnification. Theventral region IN displayed a light to moderate label with smaller cell bodies that were reactive in layer V.
J.G. Mellott et al. / Hearing Research 267 (2010) 119e136132
anatomical boundaries between auditory areas. The cortical mapsof other investigators and areal descriptions, as well as Nissl-,myelin-, and CO-stained sections were used for guidance in dis-tinguishing cortical laminae. Collectively, these additionalresources provided essential information for us to outline theauditory areas of the cat cerebrum and establish areal boundaries.We were able to identify ten auditory areas using the morpholog-ical and functional features of neurofilament protein-immuno-positive neurons. In general, the present SMI-32 results fit wellwith currently available data from several mapping studies of catauditory areas. We found a nearly exact correlation between thelocation of these ten auditory areas as determined by SMI-32immunocytochemistry and those determined by previousexperiments.
There are four regions of tonotopically-organized auditorycortex in the cat: the primary auditory cortex (AI), the posteriorauditory field (PAF), the anterior auditory field (AAF), and theventral posterior auditory field (VPAF) (Imig et al., 1982). AI is themost extensively studied region in cat auditory cortex. AI is found
on the central region of the middle ectosylvian gyrus between thedorsal tips of the anterior and posterior ectosylvian sulci, generallybetween Horsley and Clarke (1908) coronal levels A1eA12. AI canbe functionally segregated from flanking cortices on the basis oftonotopic mapping (Reale and Imig, 1980). Cytoarchitectonically,the lamination of AI is well described and some attempts have beenmade to discern the anatomical borders of the area (Rose, 1949;Sousa-Pinto, 1973; Kelly and Wong, 1981). The anatomical bordersof AI defined with SMI-32 are in agreement with the tonotopically-defined area AI (Fig. 14; Reale and Imig, 1980).
Anterior to AI is AAF, previously identified as area A, whichwas originally defined based on its tonotopic representation(Knight, 1977; Reale and Imig, 1980; Phillips and Irvine, 1982).AAF is located along the crown of the anterior suprasylviangyrus generally between Horsley and Clarke (1908) coronallevels A12 and A18. AAF richly reacts for SMI-32 and the borderswere readily distinguishable. The SMI-32-defined bordersclosely matched those defined by electrophysiological mapping(Fig. 14).

Fig. 16. Areal comparisons of sections reacted for the presence of Nissl bodies, SMI-32 reactivity, and cytochrome oxidase (CO) reactivity in auditory cortex. A: Left hemispheremacroscopic views of adjacent coronal sections reacted for Nissl, SMI-32, and CO, respectively. Representative auditory areas are labeled on the middle panel. Borders between areasare indicated with filled black circles. Scale bars ¼ 1 cm. B: Adjacent coronal sections through AI reacted for Nissl, SMI-32, and CO, respectively. Photomicrographs were taken at �40and applies to B, C, and D. Scale bar ¼ 500 mm and applies to B, C, and D. C: Adjacent coronal sections through AAF reacted for Nissl, SMI-32, and CO, respectively. D: Adjacent coronalsections through DZ reacted for Nissl, SMI-32, and CO, respectively.
J.G. Mellott et al. / Hearing Research 267 (2010) 119e136 133
Posterior to AI, on the posterior ectosylvian gyrus, anatomicaland electrophysiological investigations suggest that the gyruscontains three parallel and vertically-oriented “belts” (Woolsey,1960; Reale and Imig, 1980; Updyke, 1986; Bowman and Olson,1988a,b). The anterior belt contains the two tonotopically-orga-nized regions, PAF and VPAF. The middle belt is unimodal andresponds to acoustic stimuli, but lacks a tonotopic organization(Bowman and Olson, 1988a,b). This middle belt has been furthersubdivided into dorsal (dPE), intermediate (iPE), and ventral (vPE)subdivisions based on cytoarchitecture and patterns of extrinsicconnections (Winer, 1992). In the present study we did not tackle
defining borders for the middle belt areas on the basis of SMI-32immunoreactivity. The posterior belt, along the entrance to theposterior suprasylvian sulcus, contains both visually- and acousti-cally-responsive neurons (Updyke, 1986; Bowman and Olson,1988a,b). In our study, we were able to subdivide the anteriorbelt into dorsal (PAF) and ventral (VPAF) halves. Area PAF, or area P,as defined by Imig et al. (1982) and Phillips and Orman (1984), isa region that includes the anterior-dorsal posterior ectosylviangyrus, just caudal to the posterior ectosylvian sulcus and theposterior bank of the posterior ectosylvian sulcus. In this region, theanterior bank of the posterior ectosylvian sulcus contains either AI

J.G. Mellott et al. / Hearing Research 267 (2010) 119e136134
dorsally, or AII ventrally. SMI-32 identified the borders of PAF andconfirmed the anterior border of PAF to be the fundus of theposterior ectosylvian sulcus. VPAF, originally designated area VP, isthe ventral extension of PAF and also contains a tonotopic map(Imig et al., 1982). VPAF is found on a region of the anterior-ventralposterior ectosylvian gyrus, just caudal to the posterior ectosylviangyrus. VPAF extends down the posterior bank of the posteriorectosylvian sulcus to the fundus. This anterior border of VPAF wasconfirmed in the present study utilizing SMI-32.
We examined six regions of non-tonotopically-organizedauditory cortex: the dorsal zone (DZ) of auditory cortex, theauditory field of the anterior ectosylvian sulcus (fAES), the secondauditory cortex (AII), the insular (IN) region, the temporal (T)region, and the ventral auditory field (VAF). DZ was originallydescribed by Middlebrooks and Zook (1983) and occupiesa region dorsal to AI on the medial edge of the middle ectosylviangyrus along the lateral lip of the middle suprasylvian sulcus.Most, if not all, of DZ was previously described as a portion of the“suprasylvian fringe” (Woolsey, 1960; Paula-Barbosa et al., 1975;Niimi and Matsuoka, 1979; Beneyto et al., 1998). Using SMI-32,DZ included the dorsal-most portion the lateral bank of themiddle suprasylvian sulcus. However, DZ did not include eitherthe anterolateral (ALLS) or posterolateral (PLLS) lateral supra-sylvian visual areas (Palmer et al., 1978), which lie just medial toDZ, and have been previously described using SMI-32 (Van derGucht et al., 2001).
The auditory field contained in the AE sulcus occupies a regionat the posterior end of sulcus with the largest portion of the fieldlocated on the dorsal bank and fundus (Mucke et al., 1982; Clareyand Irvine, 1986; Meredith and Clemo, 1989). Dorsal to fAES areportions of SIV (Mori et al., 1996), with AII or the anterior sylvianarea lying ventrally (Clascá et al., 1997, 2000). The posterior two-thirds of AE sulcus contains both auditory and visual representa-tions (Olson and Graybiel, 1983, 1987; Rauschecker and Korte,1993).
In addition to the physical uniqueness of the AE sulcus, func-tionally it is viewed as a multisensory region of cat cortex(Meredith and Clemo, 1989). Multisensory areas are particularlydifficult to define with SMI-32 (Van der Gucht et al., 2001). SMI-32is employed to distinguish differing profiles of what are presumablefunctionally distinct regions. In regions such as the AE sulcus, thosefunctional “boundaries” are blurred because there are a higherpercentage of cells with differing modalities inter-mixedthroughout the region (Meredith and Clemo,1989). Despite varyingdegrees of difficulty when examining SMI-32 expression profilesthere was always at least one characteristic that was not homoge-nous between the two adjacent areas.
AII is a band of cortex across the middle sylvian gyrus, ventral toAI, between the anterior and posterior ectosylvian sulci (Woolsey,1960; Reale and Imig, 1980). Using SMI-32, the borders of AIIwere relatively straight-forward to determine and correlated highlywith the borders previously determined by electrophysiologicalinvestigations (Woolsey, 1960; Reale and Imig, 1980).
The insular (IN) region occupies a swath of cortex on the ante-rior sylvian gyrus, between the anterior ectosylvian and sylviansulci. IN cortex is ventral to AII. Therefore, area IN includes themajority of the anterior sylvian area and the dorsal division of theagranular insular area as defined by Clascá et al. (1997, 2000). UsingSMI-32, we defined the temporal (T) area as a band across theposterior sylvian gyrus from the sylvian sulcus, anteriorly, toa position approximately 2mmanterior to the posterior ectosylviansulcus. Therefore, the temporal area includes area Te of Clascá et al.(2000). The region visible just anterior to the posterior ectosylviansulcus is the ventral auditory field (VAF; Reale and Imig, 1980). VAFhas very low immunoreactivity for SMI-32.
4.4. SMI-32-defined borders within auditory cortex
In the present study, SMI-32 was employed to define thearchitectonic borders of ten recognized auditory cortical areas inthe cat. Along with establishing easily recognizable bordersbetween adjacent cortical areas, each area had a unique profile ofSMI-32 labeling. From these results we classified the architecturalborders of cat auditory cortex into three basic categories: 1) clear-cut; 2) transitional; and 3) indefinite. Of all the areal borders, fourare classified as clear-cut; PAF/VPAF, VAF/VPAF, AII/T, and AII/IN.Wedefined a border as “clear-cut” when it is distinguishable with thenaked eye. There is an obvious and abrupt profile shift from onearea to the next and the border can be detected without micro-scopic investigation. Commonly, the abrupt profile shift is causedby an incongruence of laminar reactivity between two adjacentareas. Transitional borders were defined as a gradual shift in neu-rofilament profile. Often SMI-32 staining characteristics are similarbetween adjacent areas. However, there was always a distinctdifference in at least one of the profile expression characteristics.The transitional borders included; DZ/AI, AAF/DZ, AAF/AI, AI/PAF,IN/T, T/VAF, VAF/VPAF and PAF/AII. Of the present study’s threeborder classifications, this group was the most numerous. The lastborder classification, indefinite, is used to describe borders thatinclude fAES. These borders included fAES/AAF, fAES/AI, and fAES/AII. While fAES is a unimodal field, there are numerous smallerinterdigitated sensory fields throughout the sulcus creating pocketsof alternating function (Meredith and Clemo, 1989). Assuminga high correlation between function and SMI-32 affinity (Hof et al.,1990; Hof and Morrison, 1990) would help explain why discerningfAES borders proved more difficult to define. While many expres-sion profiles across cases were very similar to each other, fAES is thelone area in which there is a lack of genuine consistency acrosscases.
4.5. Other modalities and species
Investigations of the mammalian cerebrum utilizing SMI-32have successfully parsed areas of cortex as a result of labeled non-phosphorylated epitopes on the high- and medium-molecularweight subunits of neurofilament proteins residing in pyramidalcells. These studies have utilized a wide range of species includinghumans (Campbell and Morrison, 1989; Hof et al., 1992, 1995a;Del Rio and DeFelipe, 1994; Vogt et al., 2001), old-worldmonkey (Campbell and Morrison, 1989; Hof and Nimchinsky,1992; Hof and Morrison, 1995; Hof et al., 1995b; Cusick et al.,1995; Nimchinsky et al., 1996; Preuss et al., 1997; Lewis andVan Essen, 2000; Suzuki and Amaral, 2003; Luppino et al.,2005; Saleem et al., 2007), new-world-monkey (Chaudhuriet al., 1996; Duffy and Livingstone, 2003; Baldauf, 2005; Soareset al., 2008), cat (Kaneko et al., 1994; Van der Gucht et al., 2001,2005), dog (Hof et al., 1996), dolphin (Hof et al., 1992), greysquirrel (Wong and Kaas, 2008), hamster (Boire et al., 2005),echidna (Hassiotis et al., 2004, 2005) and gerbil (Budinger et al.,2000). Across all species examined, large and medium sizepyramidal cells are by far the most frequently reactive neuronaltypes. While some cross-species comparisons can be made invisual cortex (Hof and Morrison, 1990; Hayes and Lewis, 1992;Cusick et al., 1995; Hof et al., 1995b; Nimchinsky et al., 1996;Chaudhuri et al., 1996; Van der Gucht et al., 2001), SMI-32 dataconcerning auditory cortex of different species is not available, asthis is the first comprehensive examination of auditory cortexwith SMI-32 in any species. However, as more studies of SMI-32reactivity in auditory cortex are completed, we may be able toobserve shared SMI-32 expression profiles in auditory cortexacross many species.

J.G. Mellott et al. / Hearing Research 267 (2010) 119e136 135
Acknowledgments
We thank Sang Keun (Sam) Yi for assistance in the histologicalpreparation of tissue and Amee J. Hall with assistance in preparingthe manuscript. This work was supported by grants from theCanadian Institutes of Health Research, Natural Sciences andEngineering Research Council of Canada, and the National Instituteon Deafness and Other Communication Disorders.
List of abbreviations
A anteriorAAF anterior auditory fieldAE anterior ectosylvianAES anterior ectosylvian sulcusAI primary auditory cortexAII second auditory cortexD dorsalDZ dorsal zonefAES auditory field of the anterior ectosylvian sulcusIN insular cortexP posteriorPAF posterior auditory fieldpes posterior ectosylvian sulcussss suprasylvian sulcusT temporal cortexV ventralVAF ventral auditory fieldVPAF ventral posterior auditory field
References
Ashwell, K.W.S., Zhang, L.-L., Marotte, L.R., 2005. Cyto and chemoarchitecture of thecortex of the tammar wallaby (Macropus eugenii): areal organization. BrainBehav. Evol. 66, 114e136.
Baldauf, Z.B., 2005. SMI-32 parcellates the visual cortical areas of the marmoset.Neurosci. Lett. 383, 1e2.
Beaver, B.V., Reed, W., Leary, S., McKiernan, B., Bain, F., Schultz, R., Bennett, B.T.,Pascoe, P., Schull, E., Cork, L.C., Francis-Floyd, R., Amass, K.D., Johnson, R.J.,Schmidt, R.H., Underwood, W., Thorton, G.W., Kohn, B., 2001. 2000 report of theAmerican Veterinary Medical association Panel of Euthanasia. J. Am. Vet. Med.Assoc. 218, 669e696.
Beneyto, M., Winer, J.A., Larue, D.T., Prieto, J.J., 1998. Auditory connections andneurochemistry of the sagulum. J. Comp. Neurol. 401, 329e351.
Bickford, M.A., Guido, W., Godwin, D.W., 1998. Neurofilament proteins in Y-cells ofthe cat lateral geniculate nucleus: normal expression and alteration with visualdeprivation. J. Neurosci. 18, 6549e6557.
Boire, D., Desgent, S., Matteau, I., Ptito, M., 2005. Regional analysis of neuro-filament protein immunoreactivity in hamster’s cortex. J. Chem. Neuroanat.29, 193e208.
Bowman, E.M., Olson, C.R., 1988a. Visual and auditory association areas of the cat’sposterior ectosylvian gyrus: thalamic afferents. J. Comp. Neurol. 272, 15e29.
Bowman, E.M., Olson, C.R., 1988b. Visual and auditory association areas of the cat’sposterior ectosylvian gyrus: cortical afferents. J. Comp. Neurol. 272, 30e42.
Brodmann, K., 1909. Vergleichende Lokalisationslehre der Großhirnrinde. (Locali-zation in the Cerebral Cortex). J.A. Barth, Leipzig.
Budinger, E., Heil, P., Scheich, H., 2000. Functional organization of auditory cortex inthe Mongolian gerbil (Meriones unguiculatus). III. Anatomical subdivisions andcorticocortical connections. Eur. J. Neurosci. 12, 2425e2452.
Campbell, M.J., Morrison, J.H., 1989. Monoclonal antibody to neurofilament protein(SMI-32) labels a subpopulation of pyramidal neurons in the human andmonkey neocortex. J. Comp. Neurol. 282, 191e205.
Carrasco, A., Lomber, S.G., 2009a. Differential modulatory influences betweenprimary auditory cortex and the anterior auditory field. J. Neurosci. 29,8350e8362.
Carrasco, A., Lomber, S.G., 2009b. Evidence for hierarchical processing in cat audi-tory cortex: nonreciprocal influence of primary auditory cortex on the posteriorauditory field. J. Neurosci. 29, 14323e14333.
Chaudhuri, A., Zangenehpour, S., Matsubara, J.A., Cynader, M.S., 1996. Differentialexpression of neurofilament protein in the visual system of the vervet monkey.Brain Res. 709, 17e26.
Cheung, S.W., Nagarajan, S.S., Bedenbaugh, P.H., Schreiner, C.E., Wang, X., Wong, A.,2001. Auditory cortical neuron response differences under isoflurane versuspentobarbital anesthesia. Hear. Res. 156, 115e127.
Clarey, J.C., Irvine, D.R.F., 1986. Auditory response properties of neurons in theanterior ectosylvian sulcus of the cat. Brain Res. 386, 12e19.
Clascá, F., Llamas, A., Reinoso-Suárez, F., 1997. Insular cortex and neighboring fieldsin the cat: a redefinition based on cortical microarchitecture and connectionswith the thalamus. J. Comp. Neurol. 384, 456e482.
Clascá, F., Llamas, A., Reinoso-Suárez, F., 2000. Cortical connections of the insularand adjacent parieto-temporal fields in the cat. Cereb. Cortex 4, 371e399.
Cusick, C.G., Seltzer, B., Cola, M., Griggs, E., 1995. Chemoarchitectonics and corti-cocortical terminations within the superior temporal sulcus of the rhesusmonkey: evidence for subdivisions of superior temporal polysensory cortex. J.Comp. Neurol. 360, 513e535.
De Ribaupierre, F., 1997. Acoustical information processing in the auditory thalamusand cerebral cortex. In: Ehret, G., Romand, R. (Eds.), The Central AuditorySystem. Oxford Univ. Press, New York, pp. 317e397.
Del Rio, M.R., DeFelipe, J., 1994. A study of SMI 32-stained pyramidal cells, par-valbumin-immunoreactive chandelier cells, and presumptive thalamocorticalaxons in the human temporal neocortex. J. Comp. Neurol. 342, 389e408.
Duffy, K.R., Livingstone, M.S., 2003. Distribution of non-phosphorylated neurofila-ment in squirrel monkey V1 is complementary to the pattern of cytochrome-oxidase blobs. Cereb. Cortex 13, 722e727.
Fuentes-Santamaria, V., Stein, B.E., McHaffie, J.G., 2006. Neurofilament proteins arepreferentially expressed in descending output neurons of the cat the superiorcolliculus: a study using SMI-32. Neuroscience 138, 55e68.
Hassiotis, M., Paxinos, G., Ashwell, K.W., 2004. Cyto- and chemoarchitecture of thecerebral cortex of the Australian echidna (Tachyglossus aculeatus). I. Arealorganization. J. Comp. Neurol. 475, 493e517.
Hassiotis, M., Paxinos, G., Ashwell, K.W., 2005. Cyto and chemoarchitecture of thecerebral cortex of an echidna (Tachyglossus aculeatus). II. Laminar organizationand synaptic density. J. Comp. Neurol. 482, 94e122.
Hayes, T.L., Lewis, D.A., 1992. Nonphosphorylated neurofilament protein and cal-bindin immunoreactivity in layer III pyramidal neurons of human neocortex.Cereb. Cortex 2, 56e67.
Hof, P.R., Cox, K., Morrison, J.H., 1990. Quantitative analysis of a vulnerable subset ofpyramidal neurons in Alzheimer’s disease: I. Superior frontal and inferiortemporal cortex. J. Comp. Neurol. 301, 44e54.
Hof, P.R., Glezer, I.I., Archin, N., Janssen, W.G., Morgane, P.J., Morrison, J.H., 1992. Theprimary auditory cortex in cetacean and human brain: a comparative analysis ofneurofilament protein-containing pyramidal neurons. Neurosci. Lett.146, 91e95.
Hof, P.R., Mufson, E.J., Morrison, J.H., 1995a. Human orbitofrontal cortex:cytoarchitecture and quantitative immunohistochemical parcellation. J. Comp.Neurol. 359, 48e68.
Hof, P.R., Nimchinsky, E.A., Morrison, J.H., 1995b. Neurochemical phenotype of corti-cocortical connections in themacaquemonkey: quantitative analysis of a subset ofneurofilament protein-immunoreactive projection neurons in frontal, parietal,temporal, and cingulate cortices. J. Comp. Neurol. 362, 109e133.
Hof, P.R., Bogaert, Y.E., Rosenthal, R.E., Fiskum, G., 1996. Distribution of neuronalpopulations containing neurofilament protein and calcium-binding proteins inthe canine neocortex: regional analysis and cell typology. J. Chem. Neuroanat.11, 81e98.
Hof, P.R., Morrison, J.H., 1990. Quantitative analysis of a vulnerable subset of pyra-midal neurons in Alzheimer’s disease: II. Primary and secondary visual cortex. J.Comp. Neurol. 301, 55e64.
Hof, P.R., Morrison, J.H., 1995. Neurofilament protein defines regional patterns ofcortical organization in the macaque monkey visual system: a quantitativeimmunohistochemical analysis. J. Comp. Neurol. 352, 161e186.
Hof, P.R., Nimchinsky, E.A., 1992. Regional distribution of neurofilament andcalcium-binding proteins in the cingulate cortex of the macaque monkey.Cereb. Cortex 2, 456e467.
Horsley, V., Clarke, R.H., 1908. The structure and function of the cerebellumexamined by a new method. Brain 31, 45e124.
Huang, C.L., Winer, J.A., 2000. Auditory thalamocortical projections in the cat:laminar and areal patterns of input. J. Comp. Neurol. 427, 302e331.
Imaizumi, K., Priebe, N.J., Crum, P.A., Bedenbaugh, P.H., Cheung, S.W., Schreiner, C.E.,2004. Modular functional organization of cat anterior auditory field. J. Neuro-physiol. 92, 444e457.
Imig, T.J., Reale, R.A., Brugge, J.F., 1982. The auditory cortex: patterns of cortico-cortical projections related to physiological maps in the cat. In: Woolsey, C.N.(Ed.), Cortical Sensory Organization. Multiple Auditory Areas, vol. 3. HumanaPress, Clifton, New Jersey, pp. 1e41.
Imig, T.J., Morel, A., 1983. Organization of the thalamocortical auditory system in thecat. Annu. Rev. Neurosci. 6, 95e120.
Imig, T.J., Reale, R.A., 1980. Patterns of cortico-cortical connections related totonotopic maps in cat auditory cortex. J. Comp. Neurol. 192, 292e332.
Jebb, A.H., Woolsey, T.A., 1977. A simple stain for myelin in frozen sections:a modification of Mahon’s method. Stain. Technol. 52, 315e318.
Kaneko, T., Caria, M.A., Asanuma, H., 1994. Information processing within the motorcortex. II. Intracortical connections between neurons receiving somatosensorycortical input and motor output neurons of the cortex. J. Comp. Neurol. 345,172e184.
Kelly, J.B., Whitfield, I.C., 1971. Effects of auditory cortical lesions on discriminationsof rising and falling frequency-modulated tones. J. Neurophysiol. 34, 802e816.
Kelly, J.P., Wong, D., 1981. Laminar connections of the cat’s auditory cortex. BrainRes. 212, 1e15.
Knight, P.L., 1977. Representation of the cochlea within the anterior auditory field(AAF) of the cat. Brain Res. 130, 447e467.

J.G. Mellott et al. / Hearing Research 267 (2010) 119e136136
Lee, C.C., Winer, J.A., 2008a. Connections of cat auditory Cortex: I. Thamalocorticalsystem. J. Comp. Neurol. 507, 1879e1900.
Lee, C.C., Winer, J.A., 2008b. Connections of cat auditory cortex: II. Commissuralsystem. J. Comp. Neurol. 507, 1901e1919.
Lee, C.C., Winer, J.A., 2008c. Connections of cat auditory cortex: III. Corticocorticalsystem. J. Comp. Neurol. 507, 1920e1943.
Lewis, J.W., Van Essen, D.C., 2000. Mapping of architectonic subdivisions in themacaque monkey, with emphasis on parieto-occipital cortex. J. Comp. Neurol.428, 79e111.
Liem, R.K.H., Yen, S.-H., Salomon, G.D., Shelanski, M.L., 1978. Intermediate filamentsin nervous tissues. J. Cell. Biol. 79, 637e645.
Lomber, S.G., Malhotra, S., Hall, A.J., 2007. Functional specialization in non-primaryauditory cortex of the cat: areal and laminar contributions to sound localization.Hear. Res. 229, 31e45.
Lomber, S.G., Malhotra, S., 2008. Double dissociation of “what” and “where” pro-cessing in auditory cortex. Nat. Neurosci. 11, 609e616.
Luppino, G., Hamed, S.B., Gamerini, M., Matelli, M., Galletti, C., 2005. Occipital (V6)and parietal (V6A) areas in the anterior wall of the parieto-occipital sulcus ofthe macaque: a cytoarchitecture study. Eur. J. Neurosci. 21, 3056e3076.
Malhotra, S., Stecker, G.C., Middlebrooks, J.C., Lomber, S.G., 2008. Sound localizationdeficits during reversible deactivation of primary auditory cortex and/or thedorsal zone. J. Neurophysiol. 99, 1628e1642.
Malhotra, S., Lomber, S.G., 2007. Sound localization during homotopic and hetero-topic bilateral cooling deactivation of primary and non-primary auditorycortical areas in the cat. J. Neurophysiol. 97, 26e43.
Mellott, J.G., Van der Gucht, E., Lee, C.C., Larue, D.T., Winer, J.A., Lomber, S.G., 2005.Distinguishing Cat Auditory Cortex Areas with SMI-32. Program No. 282.1. 2005Abstract Viewer/Itinerary Planner. Society for Neuroscience, Washington, DC(Online).
Meredith, M.A., Clemo, H.R., 1989. Auditory cortical projection from the anteriorectosylvian sulcus (field AES) to the superior colliculus in the cat: an anatomicaland electrophysiological study. J. Comp. Neurol. 289, 687e707.
Merzenich, M.M., Knight, P.L., Roth, G.L., 1975. Representation of cochlea withinprimary auditory cortex in the cat. J. Neurophysiol. 38, 231e249.
Middlebrooks, J.C., Zook, J.M., 1983. Intrinsic organization of the cat’s medialgeniculate body identified by projections to binaural response-specific bands inthe primary auditory cortex. J. Neurosci. 3, 203e224.
Morel, A., Imig, T.J., 1987. Thalamic projections to fields A, AI, P, and VP in the catauditory cortex. J. Comp. Neurol. 265, 119e144.
Mori, A., Fuwa, T., Kawai, A., Yoshimoto, T., Hiraba, Y., Uchiyama, Y., Minejima, T.,1996. The ipsilateral and contralateral connections of the fifth somatosensoryarea (SV) in the cat cerebral cortex. Neuroreport 7, 2385e2387.
Mucke, L., Norita, M., Benedek, G., Creutzfeldt, O., 1982. Physiologic and anatomicinvestigation of a visual cortical area situated in the ventral bank of the anteriorectosylvian sulcus of the cat. Exp. Brain Res. 46, 1e11.
Neff, W.D., Diamond, I.T., Casseday, J.H., 1975. Behavioral studies of auditorydiscrimination: central nervous system. In: Keidel, W.D., Neff, W.D. (Eds.),Handbook of Sensory Physiology. Auditory System, vol. V/2. Springer-Verlag,New York, pp. 307e400.
Niimi, K., Matsuoka, H., 1979. Thalamocortical organization of the auditory systemin the cat studied by retrograde and axonal transport of horseradish peroxidase.Adv. Anat. Embryol. Cell Biol. 57, 1e56.
Nimchinsky, E.A., Hof, P.R., Young, W.G., Morrison, J.H., 1996. Neurochemical,morphological, and laminar characterization of cortical projection neurons in thecingulate motor areas of the macaque monkey. J. Comp. Neurol. 374, 136e160.
Olfert, E.D., Cross, B.M., McWilliam, A.A., 1993. Guide to the Care and Use ofExperimental Animals. Canadian Council on Animal Care.
Olson, C.R., Graybiel, A.M., 1983. An outlying visual area in the cerebral cortex of thecat. Prog. Brain Res. 58, 239e245.
Olson, C.R., Graybiel, A.M., 1987. Ectosylvian visual area of the cat: location, reti-notopic organization and connections. J. Comp. Neurol. 261, 277e294.
Palmer, L.A., Rosenquist, A.C., Tusa, R.J., 1978. The retinotopic organization of lateralsuprasylvian visual areas in the cat. J. Comp. Neurol. 177, 237e256.
Paula-Barbosa, M.M., Feyo, P.B., Sousa-Pinto, A., 1975. The association connexions ofthe suprasylvian fringe (SF) and other areas of the cat auditory cortex. Exp.Brain Res. 23, 535e554.
Payne, B.R., Lomber, S.G., 1996. Age dependent modification of cytochrome oxidaseactivity in the cat dorsal lateral geniculate nucleus following removal ofprimary visual cortex. Vis. Neurosci. 13, 805e816.
Phillips, D.P., Irvine, D.R., 1982. Properties of single neurons in the anterior auditoryfield (AAF) of cat cerebral cortex. Brain Res. 248, 237e244.
Phillips, D.P., Orman, S.S., 1984. Responses of single neurons in posterior field of catauditory cortex to tonal stimulation. J. Neurophysiol. 51, 147e163.
Preuss, T.M., Stepniewska, I., Jain, N., Kaas, J.H., 1997. Multiple divisions of macaqueprecentral motor cortex identified with neurofilament antibody SMI-32. BrainRes. 767, 148e153.
Rauschecker, J.P., Korte, M., 1993. Auditory compensation for early blindness in catcerebral cortex. J. Neurosci. 13, 4538e4548.
Reale, R.A., Imig, T.J., 1980. Tonotopic organization in auditory cortex of the cat. J.Comp. Neurol. 192, 265e291.
Riederer, B.M., Porchet, R., Marugg, R., 1996. Differential expression and modifica-tion of neurofilament triplet proteins during cat cerebellar development. J.Comp. Neurol. 364, 704e717.
Rose, J.E., 1949. The cellular structure of the auditory region of the cat. J. Comp.Neurol. 91, 409e440.
Rosenquist, A.C., 1985. Connections of visual cortical areas in the cat. In: Peters, A.,Jones, E.G. (Eds.), Cerebral Cortex. Visual Cortex, vol. 3. Plenum Press, New York,pp. 81e117.
Saleem, K.S., Price, J.L., Hashikawa, T., 2007. Cytoarchitectonic and chemo-architectonic subdivisions of the perirhinal and parahipocampal cortices ofmacaque monkeys. J. Comp. Neurol. 500, 973e1006.
Sanides, F., Hoffman, J., 1969. Cyto- and myelo-architecture of the visual cortex ofthe cat and of the surrounding integration cortices. J. Hirnforsch. 11, 79e104.
Soares, J.G., Rosado de Castro, P.H., Fiorani, M., Nascimento-Silva, S., Gattass, R.,2008. Distribution of neurofilament proteins in the lateral geniculate nucleus,primary visual cortex, and area MT of adult Cebus monkeys. J. Comp. Neurol.508, 605e614.
Sousa-Pinto, A., 1973. The structure of the first auditory cortex (AI) in the cat. I. Lightmicroscope observations on its structure. Arch. Ital. Biol. 111, 112e137.
Sternberger, L.A., Sternberger, N.H., 1983. Monoclonal antibodies distinguishphosphorylated and nonphosphorylated forms of neurofilaments in situ. Proc.Natl. Acad. Sci. U.S.A. 80, 6126e6130.
Strominger, N.L., 1969. Subdivisions of auditory cortex and their role in localizationof sound in space. Exp. Neurol. 24, 348e362.
Suzuki, W.A., Amaral, D.G., 2003. Perirhinal and parahippocampal cortices of themacaque monkey: cytoarchitectonic and chemoarchitectonic organization. J.Comp. Neurol. 463, 67e91.
Updyke, B.V., 1986. Retinotopic organization within the cat’s posterior suprasylviansulcus and gyrus. J. Comp. Neurol. 246, 265e280.
Van der Gucht, E., Vandesande, F., Arckens, L., 2001. Neurofilament Protein:a selective marker for the architectonic parcellation of the visual cortex in adultcat brain. J. Comp. Neurol. 441, 345e368.
Van der Gucht, E., Clerens, S., Jacobs, S., Arckens, L., 2005. Light-induced Fosexpression in phosphate-activated glutaminase and neurofilament protein-immunoreactive neurons in cat primary visual cortex. Brain Res. 1035, 60e66.
Vogt, B.A., Vogt, L.J., Hof, P.R., 2001. Cytology of human caudomedial cingulate,retrosplenial, and caudal parahippocampal cortices. J. Comp. Neurol. 438,353e376.
Winer, J.A., 1984. The pyramidal neurons in layer III of cat primary auditory cortex(AI). J. Comp. Neurol. 229, 476e496.
Winer, J.A., 1992. The functional architecture of the medial geniculate body and theprimary auditory cortex. In: Webster, D.B., Popper, A.N., Fay, R.R. (Eds.), TheMammalian Auditory Pathway: Neuroanatomy. Springer-Verlag, New York, pp.222e409.
Winer, J.A., Prieto, J.J., 2001. Layer V in cat primary auditory cortex (AI): cellulararchitecture and identification of projection neurons. J. Comp. Neurol. 434,379e412.
Wong, P., Kaas, J.H., 2008. Architectonic subdivisions of neocortex in the greysquirrel (Sciurus carolinensis). Anat. Rec. 291, 1301e1333.
Wong, P., Kaas, J.H., 2009. Architectonic subdivisions of neocortex in the tree shrew(Tupaia belangeri). Anat. Rec. 292, 994e1027.
Wong-Riley, M., 1979. Changes in the visual system of monocularly sutured orenucleated cats demonstrable with cytochrome oxidase histochemistry. BrainRes. 171, 11e28.
Woolsey, C.N., 1960. Organization of cortical auditory system: a review andsynthesis. In: Rasmussen, G.L., Windle, W.F. (Eds.), Neural Mechanisms of theAuditory and Vestibular Systems. Charles C. Thomas, Springfield, IL, pp.165e180.