Awake and Aware - Shamshir Rai Luthra - inner child magazine
Complex tone processing in primary auditory cortex of theawake monkey. II. Pitch versus critical band representation
Yonatan I. Fishmana)
Department of Neuroscience, Albert Einstein College of Medicine, Rose F. Kennedy Center, Bronx,New York 10461
David H. ReserDepartment of Neuroscience, Albert Einstein College of Medicine, Bronx, New York 10461
Joseph C. Arezzo and Mitchell SteinschneiderDepartments of Neurology and Neuroscience, Albert Einstein College of Medicine, Bronx, New York 10461
~Received 20 September 1999; accepted for publication 20 April 2000!
Noninvasive neurophysiological studies in humans support the existence of an orthogonal spatialrepresentation of pure tone frequency and complex tone pitch in auditory cortex@Langneret al., J.Comp. Physiol. A181, 665–676~1997!#. However, since this topographic organization is based onneuromagnetic responses evoked by wideband harmonic complexes~HCs! of variable fundamentalfrequency (f 0), and thus interharmonic frequency separation (DF), critical band filtering effects dueto differential resolvability of harmonics may have contributed to shaping these responses. To testthis hypothesis, the present study examined responses evoked by three-component HCs of variablef 0 in primary auditory cortex~A1! of the awake monkey. The center frequency of the HCs was fixedat the best frequency~BF! of the cortical site. Auditory evoked potential~AEP!, multiunit activity,and current source density techniques were used to evaluate A1 responses as a function off 0
(5DF). Generally, amplitudes of nearly all response components increased withf 0, such thatmaximal responses were evoked by HCs comprised of low-order resolved harmonics. Statisticallysignificant increases in response amplitude typically occurred atDFs between 10% and 20% ofcenter frequency, suggestive of critical bandlike behavior. Complex tone response amplitudes alsoreflected nonlinear summation in that they could not be predicted by the pure tone frequencysensitivity curves of the cortical sites. A mechanism accounting for the observed results is proposedwhich involves mutual lateral inhibitory interactions between responses evoked by stimuluscomponents lying within the same critical band. As intracortical AEP components likely to bepropagated to the scalp were also strongly modulated byDF, these findings indicate thatnoninvasive recordings of responses to complex sounds may require a consideration of critical bandeffects in their interpretation. ©2000 Acoustical Society of America.@S0001-4966~00!05407-2#
PACS numbers: 43.64.Qh, 43.64.Ri, 43.66.Hg@LHC#
sancho
frlleith
vileth
ch
ca
itchstu-vir-r-4
re-ationedym-
e
f theral
yd-tar-
sed
INTRODUCTION
Harmonic complexes~HCs! comprise an important clasof natural sounds commonly occurring in human speech,mal vocalizations, and music. A distinctive feature of susignals is that their frequency components are harmonicscommon fundamental frequency (f 0). When heard in isola-tion, each of these harmonics has a pitch related to itsquency. HCs, however, are usually perceived not as a cotion of individual pitches, but as a single auditory object wa global pitch corresponding to thef 0. Importantly, this glo-bal pitch persists even when spectral energy at thef 0 is com-pletely absent. This perceptual phenomenon, known as ‘‘tual pitch,’’ suggests that the fundamental pitch of compsounds is ultimately derived via a synthetic operation ofauditory system~Terhardt, 1974; Hartmann, 1996!. In gen-eral, the global pitch of a complex tone and its virtual pitare considered synonymous~Terhardt, 1974, 1978!. Accord-ingly, virtual pitch has served as a foundation for theoreti
a!Electronic mail: [email protected]
247 J. Acoust. Soc. Am. 108 (1), July 2000 0001-4966/2000/108
i-
f a
e-c-
r-xe
l
models describing how the auditory system derives the pof complex sounds. Modern psychoacoustic theories polate the existence of two complementary mechanisms oftual pitch extraction~Houtsma and Smurzynski, 1990; Calyon and Shackleton, 1994; Shackleton and Carlyon, 199!.The first essentially involves a pattern-recognition ofsolved spectral components, i.e., whose frequency separ(DF) exceeds the width of an auditory filter, the so-callcritical bandwidth~CBW!. The perceived pitch is derived bmatching the resolved spectral pattern to a ‘‘harmonic teplate’’ corresponding to thef 0 of which the components arinteger multiples~e.g., Goldstein, 1973; Terhardt, 1974!. Thesecond mechanism relies on a temporal representation of 0 whereby pitch is extracted from the common tempopattern of discharges~interspike intervals! corresponding tothe period of thef 0 across the array of active frequencchannels~e.g., Moore, 1989; Meddis and Hewitt, 1991; Medis and O’Mard, 1997!. Virtual pitch represents the producof an important auditory organizational process whereby hmonically related components of sound mixtures are futogether to form a single perceptual entity~Bregman, 1990;
247(1)/247/16/$17.00 © 2000 Acoustical Society of America
yr-
on
ars
nsteoll
atpor
s-
d
ca
edfth
een
tstleg
vi-puupA1
otioa
nbxon
sanre
th
roree
inge
poo
anddsde-
arethat
i-al
alp-
ine
hat
MFg
ic-
n-the
ns,
ive
rly-m-ial
thethe
ne
nenaarelie
t’’the
dthd
ed
ndein
po-lly,-
of a
Hartmann, 1996!. Its biological importance is suggested bthe demonstration of virtual pitch perception in multiple vetebrate species, including cats, birds, and monkeys~Heffnerand Whitfield, 1976; Cynx and Shapiro, 1986; Tomlinsand Schwarz, 1988!.
Lesion studies in animals and humans implicate primauditory cortex~A1! and surrounding auditory cortical areain encoding the pitch of complex sounds~Whitfield, 1980;Zatorre, 1988!. Given this involvement, the question remaispecifically how the pitch of complex sounds is represenat the cortical level. Regardless of whether pitch is basedspectral or temporal extraction methods, it is generathought that the perceived pitch is ultimately representedrelatively advanced level in the auditory system by a tographic map of stimulusf 0 ~Licklider, 1951, 1956; Schreineand Langner, 1988; Langner, 1997; Langneret al., 1997;Schulze and Langner, 1997!. Several studies in humans uing magnetoencephalography~MEG! examined whether puretones and complex tones of similar pitch are representethe same topographic locations in A1~Pantevet al., 1989,1996!. This hypothesis was tested by comparing the lotions of the derived equivalent current dipole~ECD! corre-sponding to the M100 component of the auditory evokmagnetic field~AEMF! elicited by a 250-Hz pure tone anby a complex tone composed of the third, fourth, and fiharmonics of a missing 250-Hzf 0. The location of the M100ECD evoked by the complex tone was similar to that evokby the 250-Hz pure tone, whereas it was markedly differfrom that of the ECD evoked by a pure tone correspondinga harmonic of the complex tone. These findings suggethat A1 organization reflects the perceived pitch of compsounds rather than their spectral content. In contrast, sinunit and multi-unit investigations in monkeys provided edence against corepresentation of complex tone andtone pitch along the tonotopic axis in A1, and instead sported the classical cochleotopic organization of~Schwarz and Tomlinson, 1990; Fishmanet al., 1998!. It isunclear whether the discrepancy between human and mkey findings is due to species differences, spatial resolulimitations of noninvasive recordings, or other technical fetures.
It is possible, however, that pitch is represented alosome other spatial dimension in A1. Human MEG studiesLangner et al. ~1997! suggest that the pitch of complesounds may be spatially represented orthogonal to the ttopic gradient~i.e., along the iso-frequency axis! in A1.These studies examined changes in the ECD locationseveral components of the AEMF evoked by pure tonesby HCs with f 0s ranging from 50 to 400 Hz. The HCs wefiltered between 400~in some cases 800 Hz! and 5000 Hz, sothat their overall spectral envelopes remained largelysame despite changes inf 0. While the ECD corresponding tothe M100 component moved from posterior/superior to pgressively anterior/inferior locations with increasing putone frequency, that evoked by the HCs moved roughly ppendicularly to the pure tone ECD trajectory with increasf 0. Perpendicular pure tone and complex tone gradients walso reported for the ECD corresponding to the M60 comnent. These findings were interpreted as reflecting an
248 J. Acoust. Soc. Am., Vol. 108, No. 1, July 2000 Fishman
y
dn
ya-
at
-
d
dtoedxle-
re-
n-n-
gy
o-
ofd
e
-
r-
re-r-
thogonal spatial representation of pure tone frequencycomplex tone pitch in auditory cortex, i.e., complex sounactivate different regions along the iso-frequency axispending upon theirf 0. Importantly, unlike the organizationproposed by Pantevet al. ~1989, 1996!, according to whichpure tone pitch and complex tone pitch representationscolocalized, a consequence of the orthogonal model ispure tones and complex tonesof the same pitchare repre-sented indifferent locations in A1.
MEG and other noninvasive techniques suffer from limtations that are particularly relevant to mapping of corticrepresentations. Specifically, components of the screcorded auditory evoked potential~AEP! and AEMF neitherreflect unitary cerebral processes nor uniquely determtheir underlying generators~Wood and Wolpaw, 1982!. Non-invasive and intracranial recordings in humans indicate tmiddle- ~10–80 ms poststimulus onset! and long- (.80 ms!latency components of the scalp-recorded AEP and AEreflect contributions from multiple temporally overlappinbut spatially distinct temporal lobe generators~Wolpaw andPenry, 1975; Wood and Wolpaw, 1982; Naatanen and Pton, 1987; Liegeois-Chauvelet al., 1994; Halgrenet al.,1998; Steinschneideret al., 1999; Howardet al., 2000!. Tocomplicate matters further, intracranial recordings in mokeys support the existence of several auditory areas insuperior temporal gyrus that exhibit tonotopic organizatiosome in mirror-image orientations~Morel et al., 1993; Ko-sakiet al., 1997; Kaas and Hackett, 1998!. The single-dipolemodel of auditory cortical activation assumed in noninvasstudies is therefore highly problematic~see Lutkenhoner andSteinstrater, 1998; Schreiner, 1998! and calls into questionwhether the observed pattern genuinely reflects an undeing orthogonal organization of pure tone frequency and coplex tone pitch. In view of these considerations, intracranrecordings in appropriate animal models can facilitatevalidation of functional topographic maps proposed onbasis of noninvasive recordings.
The results of Langneret al. ~1997! may be complicatedalso by the possibility that they reflect not complex topitch per se, but rather the result of critical band~CB! filter-ing. The concept of an auditory ‘‘filter’’ or CB has beeinvoked to explain a wide range of perceptual phenominvolving complex sounds. For example, tones and noiseeffective in masking tonal signals only when their spectrawithin the same CB as the signal~Greenwood, 1961!. More-over, the perceived loudness and the ability to ‘‘hear ouindividual components of complex sounds increases onceDF between components exceeds a critical bandwi~CBW! ~Zwicker et al., 1957; Plomp, 1964; Plomp anMimpen, 1968; Moore and Ohgushi, 1993!. Virtual pitch isalso most salient for HCs composed of low-order resolvharmonics, i.e., whoseDF exceeds a CBW~Ritsma, 1962,1967; Plomp, 1967; Fastl and Stoll, 1979; Houtsma aSmurzynski, 1990!. Physiological correlates of CBW havbeen described in single-unit studies of A1 in cats andseveral studies examining short- and middle-latency comnents of the surface-recorded AEP in humans. SpecificaEhret and Schreiner~1997! reported an increase in toneevoked responses of single A1 neurons once the width
248et al.: Neural correlates of critical bandwidth in auditory cortex
hthheohe
EPexgeicr
0
gehre
eo
har
uaksop
dec
icp
tcssnsd
s
orllyseinna
sggi
e
aere
edoked
e-of
;
of
ndtion
om-
yossaseak
hein
nc-
en-ere
zn-ude.d
edear-
BFulin,ter-attheead-
t
ere
noise masker was narrowed below the CBW, as psycphysically defined by other investigators using similar meods. Zerlin ~1986! demonstrated an abrupt increase in tamplitude of wave V of the brainstem AEP evoked by twtone complexes once theDF between the tones exceeded tCBW. Similarly, Burrows and Barry~1990! reported aug-mentation of the Na component of the middle-latency Aonce theDF between components of a two-tone complexceeded the CBW. In combination, these findings sugthat a neural representation of CBW is present in A1, whcan potentially be detected at the scalp by noninvasivecordings. Since the complex stimuli used by Langneret al.~1997! were wideband HCs filtered between 400 and 50Hz, changes inf 0 ~and therefore interharmonicDF) wouldnot only change the overall pitch, but would lead to chanin the relative resolvability of harmonics, depending on tCBW at their frequencies. For example, a harmonic centeat 2000 Hz would be resolved when thef 0 of the complextone is 400 Hz, whereas it would be unresolved when thef 0
is 100 Hz. If auditory cortical responses are enhancedtonotopic locations corresponding to spectrally resolvstimulus components, changing the relative resolvabilitythe components by varying stimulusf 0 could also lead tochanges in the location of the ECD. Thus, it is possible tCB effects contributed to shaping the MEG responsescorded by Langneret al. ~1997!.
Given these considerations, the aim of the present stis to examine, using invasive recording techniques in awmacaques, whether neuronal ensemble responses in A1port an orthogonal complex tone pitch representation,rather reflect a representation of CBW. The present parepresents a continuation of the investigations describethe companion paper, in which we examined periodic aspof responses in A1 to three-component HCs of varyingf 0 asthey relate to the encoding of roughness~Fishmanet al.,2000!. Here we describe in the same animals and cortsites changes in the amplitudes of transient response comnents evoked by HCs as a function off 0. Old World mon-keys are suitable animal models for investigating both piand CBW representation in A1, since they not only possesimilar primary auditory cortical anatomy to that of huma~Galaburda and Sanides, 1980; Galaburda and Pan1983!, but are capable of perceiving virtual pitch~Tomlinsonand Schwarz, 1988!, and display psychophysical CB curvethat are nearly identical to those of humans~Gourevitch,1970!. The range off 0s presented~25–4000 Hz! encom-passes the existence region of virtual pitch~Ritsma, 1962;Plomp, 1967!. These stimuli are therefore appropriate finvestigating both pitch and CBW representations. Finathe neuronal ensemble techniques utilized in the prestudy offer the advantage of bridging noninvasive recordtechniques measuring synchronized activity of neuropopulations with more direct physiological approaches.
The specific pattern of neuronal ensemble responseHCs of varying f 0 can provide a basis for distinguishinbetween pitch and CBW representation. An orthogonal ornization of pure tone frequency and complex tone pitchA1 implies that different sites within A1 of similar pure tonbest frequency~BF! would display different ‘‘bestf 0s’’ ~i.e.,
249 J. Acoust. Soc. Am., Vol. 108, No. 1, July 2000 Fishman
o--
-
sthe-
0
sed
indf
te-
dyeup-rerints
alo-
ha
ya,
,ntgl
to
a-n
stimulus f 0s associated with the largest responses!, irrespec-tive of the resolvability of the harmonics. Thus, givensample of sites distributed along the tonotopic gradient, thshould be no statistical correlation between bestf 0 and BF,since sites with the same BF could have different bestf 0s,and sites with different BFs could have the same bestf 0.Alternatively, a representation of CBW would be supportif, on average, the smallest and largest responses are evby HCs composed of unresolved (DF, CBW! and resolved(DF.CBW! harmonics, respectively. For component frquencies above 500 Hz, CBW corresponds to 10%–20%frequency~Zwicker et al., 1957; Moore and Glasberg, 1983Moore and Ohgushi, 1993; Zeraet al., 1993!.
I. METHODS
Neuronal ensemble responses were recorded in A1three adult male monkeys~Macaca fascicularis!. All proce-dures were approved by our institutional Animal Care aUse Committee. Surgical techniques, stimulus generaand delivery, recordings of AEPs, multiunit activity~MUA !,and current source density~CSD!, and histological proce-dures are identical to those described in the preceding cpanion paper~Fishmanet al., 2000!. As in the companionstudy, linear array multi-contact electrodes~14 contacts;150-mm intercontact spacing! were used to simultaneouslrecord neuronal ensemble activity at multiple depths acrthe laminar extent of A1. The BF of the cortical site wdefined as the pure tone frequency eliciting the largest pamplitude MUA within lower lamina III~LLIII ! during thefirst 50 ms following stimulus onset. This period includes ttime of initial activation of thalamorecipient zone cellslamina IV ~LIV ! and LLIII ~Steinschneideret al., 1992,1994!. Response amplitude versus pure tone frequency futions, or frequency response functions~FRFs!, were gener-ated for all cortical sites examined. Pure tones used to gerate the FRFs ranged from 200 Hz to 15 kHz and wtypically separated by 100 Hz below 1 kHz, 200–300 Hbelow 5 kHz, and 500 Hz below 15 kHz. As in the compaion paper, HCs were composed of three equal-amplitconsecutive harmonics off 0s ranging from 25 to 4000 HzCenter frequencies (f cs! of the complex tones correspondeto the BF of the cortical site. All harmonics were combinin sine phase. The highestf 0 presented at a given cortical sitwas that for which the BF corresponded to the second hmonic. Thus, with the exception of the case in which theoccupied the second harmonic position, all complex stimhad ‘‘missing’’ f 0s. Complex tones were 450 ms in duratiowith rise and fall times of 5 ms, and were presented at instimulus intervals of 992 ms. All stimuli were presented60 dB SPL via headphone to the ear contralateral torecorded hemisphere. The frequency response of the hphone was flattened~63 dB! by a graphic equalizer~Rane,Inc.! The complex tone stimulus set invariably includedf 0sof 25, 50, and 100 Hz, onef 0 between 50 and 100 Hz, aleast onef 0 between 100 and 200 Hz, and at least onef 0
between 200 and 400 Hz. Since the complex tones w
249et al.: Neural correlates of critical bandwidth in auditory cortex
erepre
itivity
study.
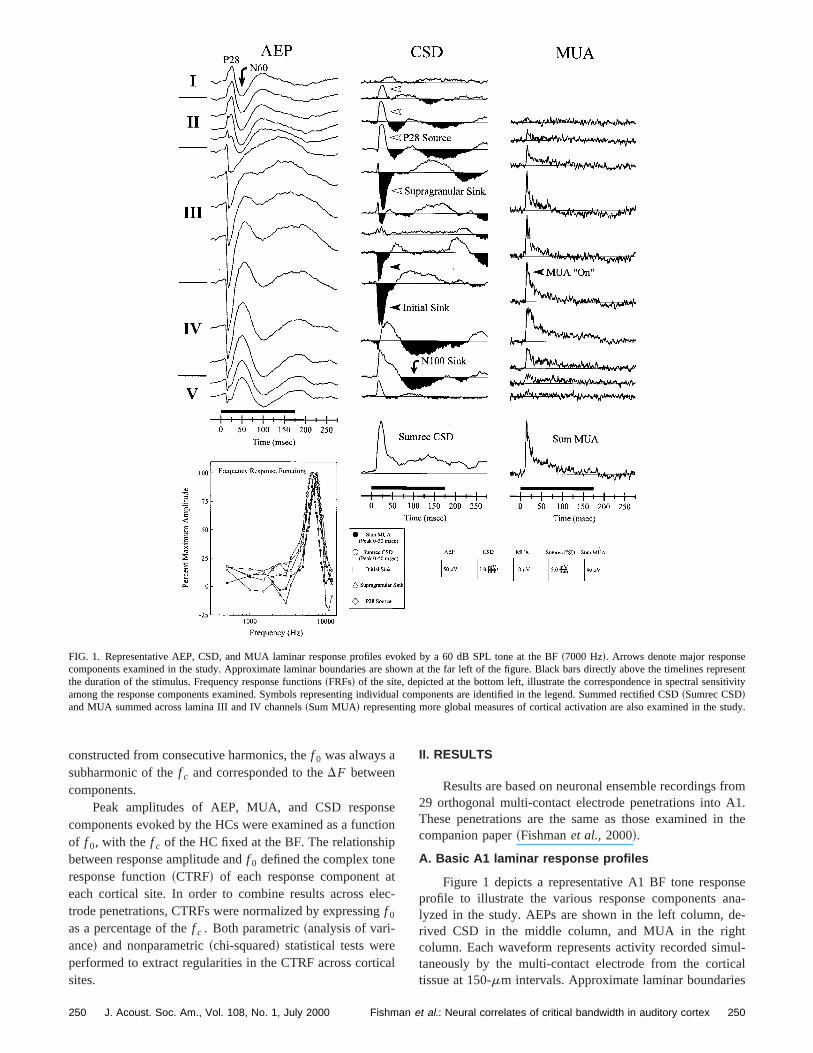
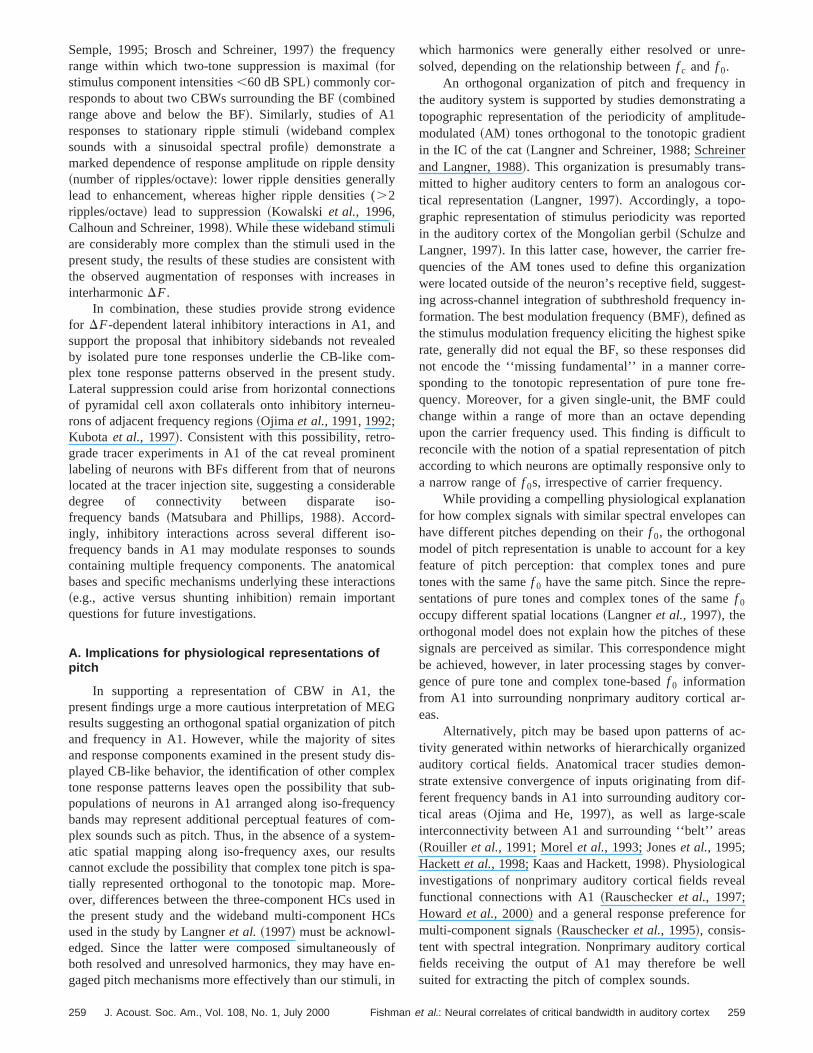
FIG. 1. Representative AEP, CSD, and MUA laminar response profiles evoked by a 60 dB SPL tone at the BF~7000 Hz!. Arrows denote major responscomponents examined in the study. Approximate laminar boundaries are shown at the far left of the figure. Black bars directly above the timelinessentthe duration of the stimulus. Frequency response functions~FRFs! of the site, depicted at the bottom left, illustrate the correspondence in spectral sensamong the response components examined. Symbols representing individual components are identified in the legend. Summed rectified CSD~Sumrec CSD!and MUA summed across lamina III and IV channels~Sum MUA! representing more global measures of cortical activation are also examined in the
setip
atleg
ica
from1.
n the
nsena-e-tul-
cals
constructed from consecutive harmonics, thef 0 was always asubharmonic of thef c and corresponded to theDF betweencomponents.
Peak amplitudes of AEP, MUA, and CSD responcomponents evoked by the HCs were examined as a funcof f 0, with the f c of the HC fixed at the BF. The relationshibetween response amplitude andf 0 defined the complex toneresponse function~CTRF! of each response componenteach cortical site. In order to combine results across etrode penetrations, CTRFs were normalized by expressinf 0
as a percentage of thef c . Both parametric~analysis of vari-ance! and nonparametric~chi-squared! statistical tests wereperformed to extract regularities in the CTRF across cortsites.
250 J. Acoust. Soc. Am., Vol. 108, No. 1, July 2000 Fishman
on
c-
l
II. RESULTS
Results are based on neuronal ensemble recordings29 orthogonal multi-contact electrode penetrations into AThese penetrations are the same as those examined icompanion paper~Fishmanet al., 2000!.
A. Basic A1 laminar response profiles
Figure 1 depicts a representative A1 BF tone respoprofile to illustrate the various response components alyzed in the study. AEPs are shown in the left column, drived CSD in the middle column, and MUA in the righcolumn. Each waveform represents activity recorded simtaneously by the multi-contact electrode from the cortitissue at 150-mm intervals. Approximate laminar boundarie
250et al.: Neural correlates of critical bandwidth in auditory cortex
p
on
at
r-
a
u
rar
s
ki-cnr
ia
sadenelm
omrres
n50th
oorea
nle
ndcinalo
ulo
ectAines
ides
ty.d in
thepo-
e-
etaemsc--
asethe
es-at
ndnd
re-the
in-be-ntire
ra-ectsesese
of
n of
ents.
tsub-
are denoted on the far-left of the figure. Response comnents examined in the study are indicated by arrows~whitearrows, supragranular; black arrows, thalamorecipient zand infragranular!. The AEP elicited by the BF tone~in thiscase, 7.0 kHz! is characterized by a superficial positivity thpeaks at about 28 ms~P28! followed by a negativity~N60!,both of which invert in polarity across the lamina II/III boder. These components are of interest since they mayhomologous to the human surface-recorded AEP P50N100 components~see Arezzoet al., 1986; Vaughan andArezzo, 1988; Steinschneideret al., 1994!, the magneticcounterparts of which were examined by Langneret al.~1997! and reported to vary with stimulusf 0.
The derived CSD represents the laminar pattern of crent sources~above-baseline deflections! and sinks~below-baseline deflections! giving rise to the AEP. BF tones triggea stereotypical sequence of synaptic events in A1. The eest current sinks~‘‘Initial Sink’’ ! occur within the thalamor-ecipient zone~LIV and LLIII: Steinschneideret al., 1992;mean peak latency: 17.3 ms, standard deviation: 5.3 m!.Early sources in mid- and upper lamina III~initial positivedeflections! partially balance the thalamorecipient zone sinto form a current dipole configuration indicative of pyramdal cell activation. Thalamorecipient zone sinks are coindent with increases in MUA, indicating that they represecurrent flow associated with excitatory synaptic events. Eacurrent sinks are followed by slightly later, more superficsinks located in upper lamina III~‘‘Supragranular Sink’’;mean peak latency: 28.5 ms, standard deviation: 9.3 m!,which are balanced by current sources located in lamin~‘‘P28 Source’’; mean peak latency: 28.2 ms, standardviation: 9.3 ms!. This sink-source configuration is consistewith polysynaptic activation of supragranular pyramidal celements. Lamina II current sources represent the predonant generators of the superficially recorded AEP P28 cponent. Since these sources largely reflect passive cureturn for supragranular sinks, they serve as potentially uful measures of polysynaptic cortical cell activation.
To provide a more global measure of cortical activatiothe total stimulus-evoked net current flow during the firstms was evaluated by full-wave rectifying and summingCSD across channels~‘‘Sumrec CSD’’!. Full-wave rectifica-tion and integration of the CSD profile results in the lossinformation regarding both the depth and directionstimulus-evoked current flow. Consequently, the SumCSD measure incorporates both active and passive sinkssources. Nonetheless, it is useful for comparing total tramembrane current flow across stimulus conditions and etrode penetrations.
MUA was evaluated by summing across lamina III aIV channels~‘‘Sum MUA’’ !, as these responses reflect ativity associated with both the initial cortical sink locatedLLIII and LIV, and the later sink located in more superficiregions of lamina III. Measures included peak amplitudesummed MUA during the first 50 ms~‘‘MUA ‘On’’’ ! andarea under summed MUA~‘‘MUA Area’’ ! from stimulusonset until the second zero-crossing of the supragransink. The rationale for this integration interval is based upthe observation~Steinschneideret al., 1998! that early bursts
251 J. Acoust. Soc. Am., Vol. 108, No. 1, July 2000 Fishman
o-
e
bend
r-
li-
s
i-tlyl
II-
tli--nt
e-
,
e
ffcnd
s-c-
-
f
arn
of MUA following the initial ‘‘On’’ response coincide withthe peak of the supragranular sink and therefore likely reflintrinsically generated cortical activity. Area under MUfollowing this interval was not included in the analysisorder to avoid the problematic contribution of responsphase-locked to the waveform envelope of the lowerf 0
stimuli. Thus, in combination, these MUA measures provinformation regarding initial cortical activation as well aslightly later, presumably supragranularly driven activiRepresentative FRFs of response components examinethe study are depicted in the lower left of the figure. Noteclose correspondence in frequency sensitivity among comnents.
B. Modulation of response amplitudes by changesin f 0
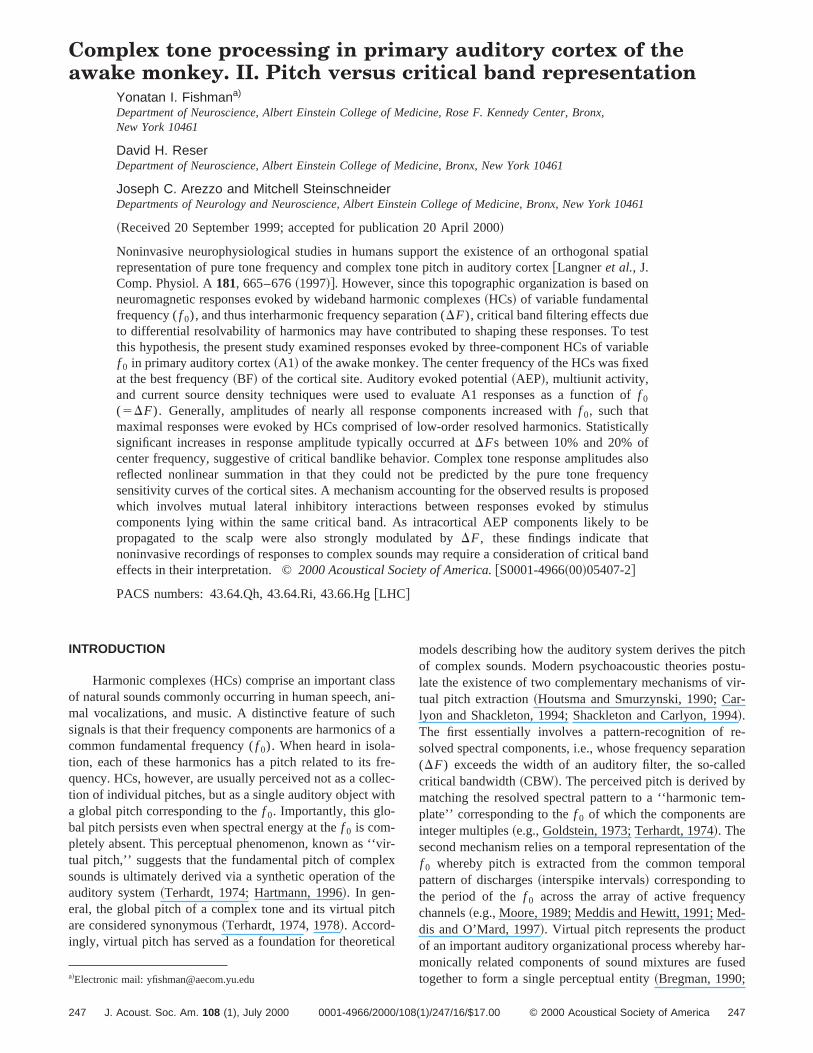
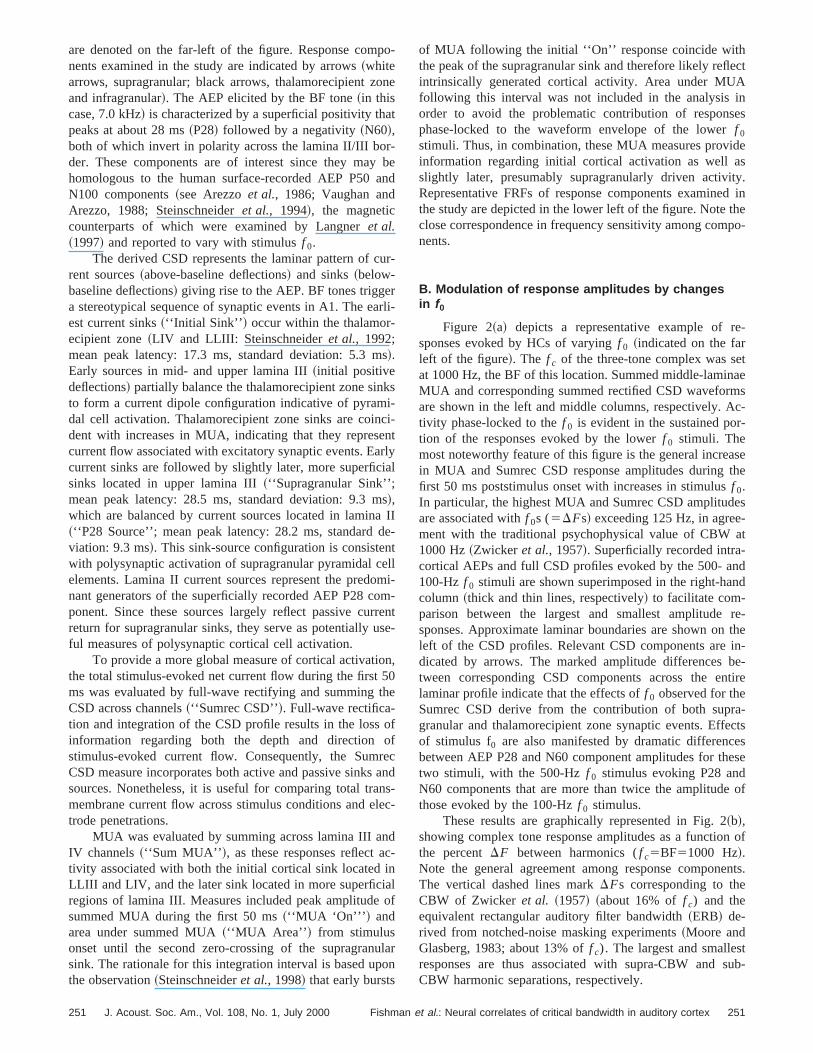
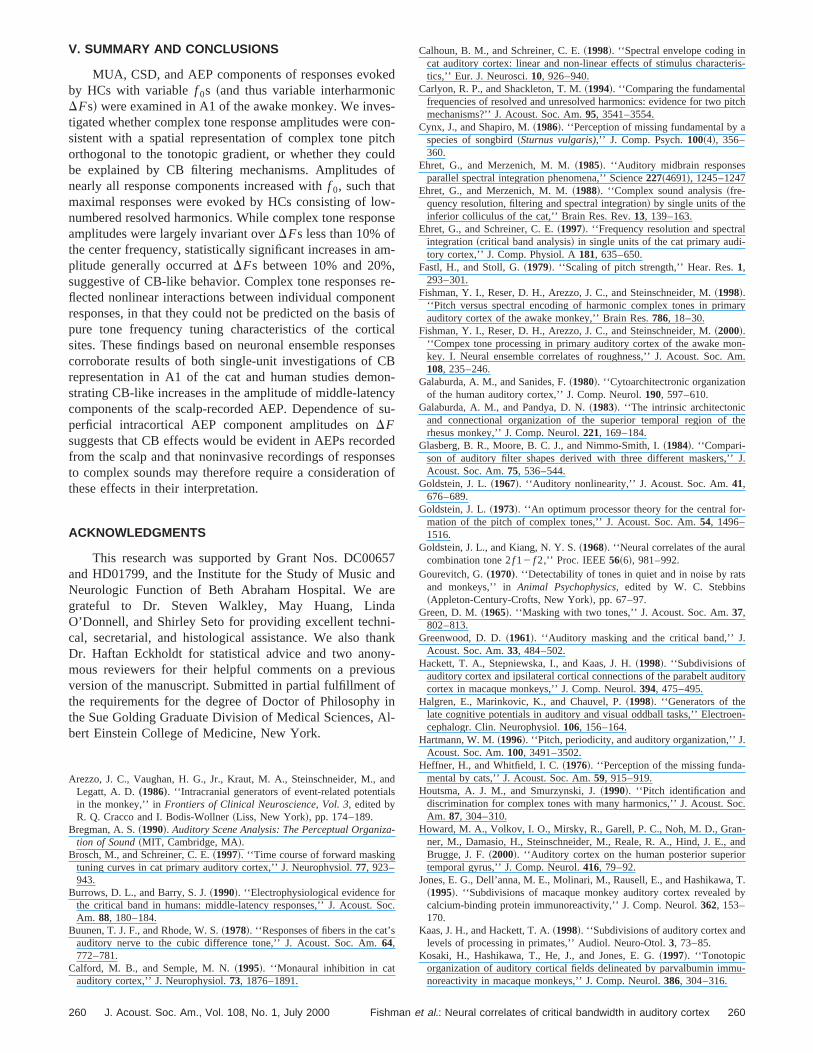
Figure 2~a! depicts a representative example of rsponses evoked by HCs of varyingf 0 ~indicated on the farleft of the figure!. The f c of the three-tone complex was sat 1000 Hz, the BF of this location. Summed middle-laminMUA and corresponding summed rectified CSD waveforare shown in the left and middle columns, respectively. Ativity phase-locked to thef 0 is evident in the sustained portion of the responses evoked by the lowerf 0 stimuli. Themost noteworthy feature of this figure is the general increin MUA and Sumrec CSD response amplitudes duringfirst 50 ms poststimulus onset with increases in stimulusf 0.In particular, the highest MUA and Sumrec CSD amplitudare associated withf 0s (5DFs! exceeding 125 Hz, in agreement with the traditional psychophysical value of CBW1000 Hz~Zwicker et al., 1957!. Superficially recorded intra-cortical AEPs and full CSD profiles evoked by the 500- a100-Hz f 0 stimuli are shown superimposed in the right-hacolumn ~thick and thin lines, respectively! to facilitate com-parison between the largest and smallest amplitudesponses. Approximate laminar boundaries are shown onleft of the CSD profiles. Relevant CSD components aredicated by arrows. The marked amplitude differencestween corresponding CSD components across the elaminar profile indicate that the effects off 0 observed for theSumrec CSD derive from the contribution of both supgranular and thalamorecipient zone synaptic events. Effof stimulus f0 are also manifested by dramatic differencbetween AEP P28 and N60 component amplitudes for thtwo stimuli, with the 500-Hzf 0 stimulus evoking P28 andN60 components that are more than twice the amplitudethose evoked by the 100-Hzf 0 stimulus.
These results are graphically represented in Fig. 2~b!,showing complex tone response amplitudes as a functiothe percentDF between harmonics (f c5BF51000 Hz!.Note the general agreement among response componThe vertical dashed lines markDFs corresponding to theCBW of Zwicker et al. ~1957! ~about 16% off c) and theequivalent rectangular auditory filter bandwidth~ERB! de-rived from notched-noise masking experiments~Moore andGlasberg, 1983; about 13% off c). The largest and smallesresponses are thus associated with supra-CBW andCBW harmonic separations, respectively.
251et al.: Neural correlates of critical bandwidth in auditory cortex
are
proximateinar extensentingt
itudesof pure to
FIG. 2. ~a! Illustrative examples of harmonic complex tone-evoked responses recorded from a site whose BF is 1000 Hz. Thef c ~middle harmonic! wassituated at the BF while thef 0 ~denoted on the far left of the figure! was varied. Waveforms corresponding to summed MUA and summed rectified CSDdepicted in the left-hand and middle columns, respectively. Superficial intracortical AEPs and CSD profiles evoked by the 100 and 500 Hzf 0 complexes areshown superimposed in the right-hand column to facilitate comparison between responses evoked by sub- and supra-CBW complex stimuli. Aplaminar boundaries are shown next to the CSD profiles. Major response components are indicated by black and white arrows. Note the multi-lamtof the differences between the two responses.~b! Complex tone response amplitude as a function of percent harmonic separation. Symbols repreindividual response components are identified in the legend. The right and left vertical dashed lines denote harmonic separations corresponding tohe classicalCBW of Zwicker et al. ~1957! and the equivalent rectangular bandwidth of the auditory filter of Moore and Glasberg~1983!, respectively, at 1000 Hz.Response amplitudes are maximal for supra-CBW harmonic separations.~c! FRFs of the cortical site. The general decrease in pure tone response amplwith increasing spectral separation from the BF indicates that complex tone responses cannot be predicted on the basis of a simple summationneresponses.
hath
A
ie
eatu
nts
a
ses
int-est
The general increase in response amplitudes withmonic separation cannot be predicted on the basis ofsite’s pure tone FRFs. This feature is illustrated in Fig. 2~c!,which depicts FRFs based on peak summed MUA, MUarea, and peak Sumrec CSD. Thef c of the HCs is indicatedby the solid vertical line at 1000 Hz. Side-band frequencof the 500-Hzf 0 stimulus~i.e., f c 6500 Hz! are denoted bythe dotted vertical lines. The falloff of response amplitudwith spectral distance from thef c and the absence of peaksthe6500 Hz side-bands preclude an explanation for the a
252 J. Acoust. Soc. Am., Vol. 108, No. 1, July 2000 Fishman
r-e
s
s
g-
mented responses to the 500-Hzf 0 HC based on a simplesummation of responses to individual frequency componeof the complex tones.
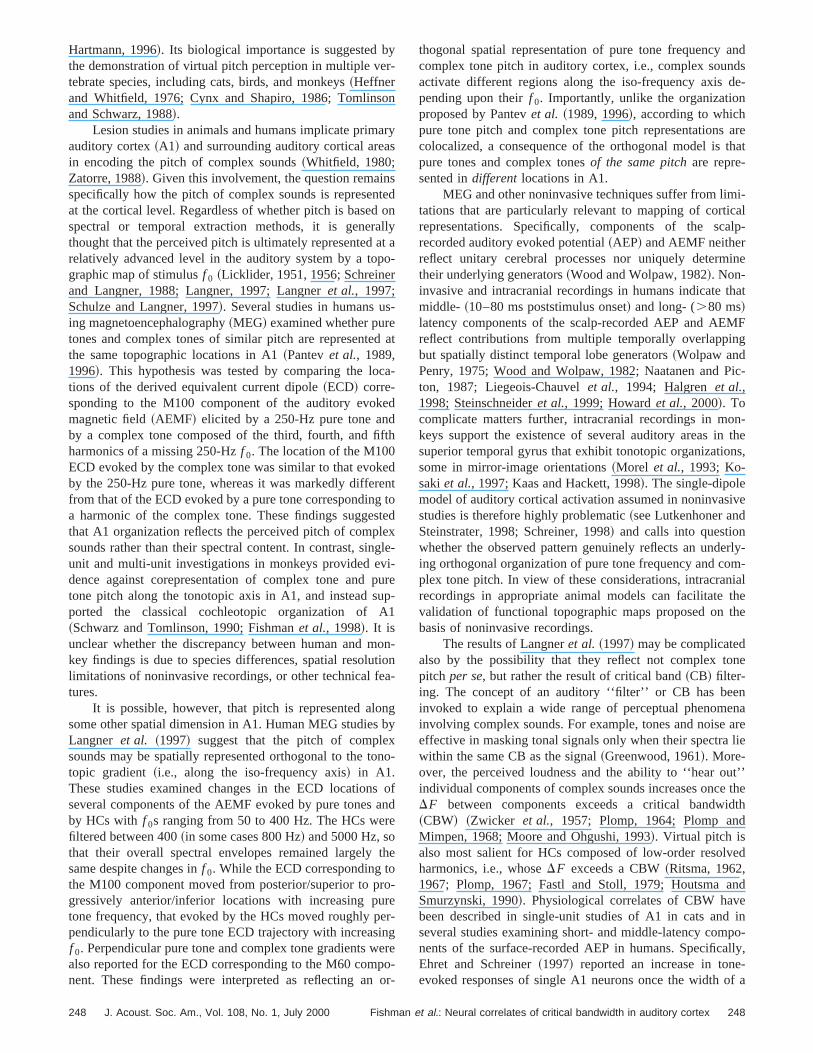
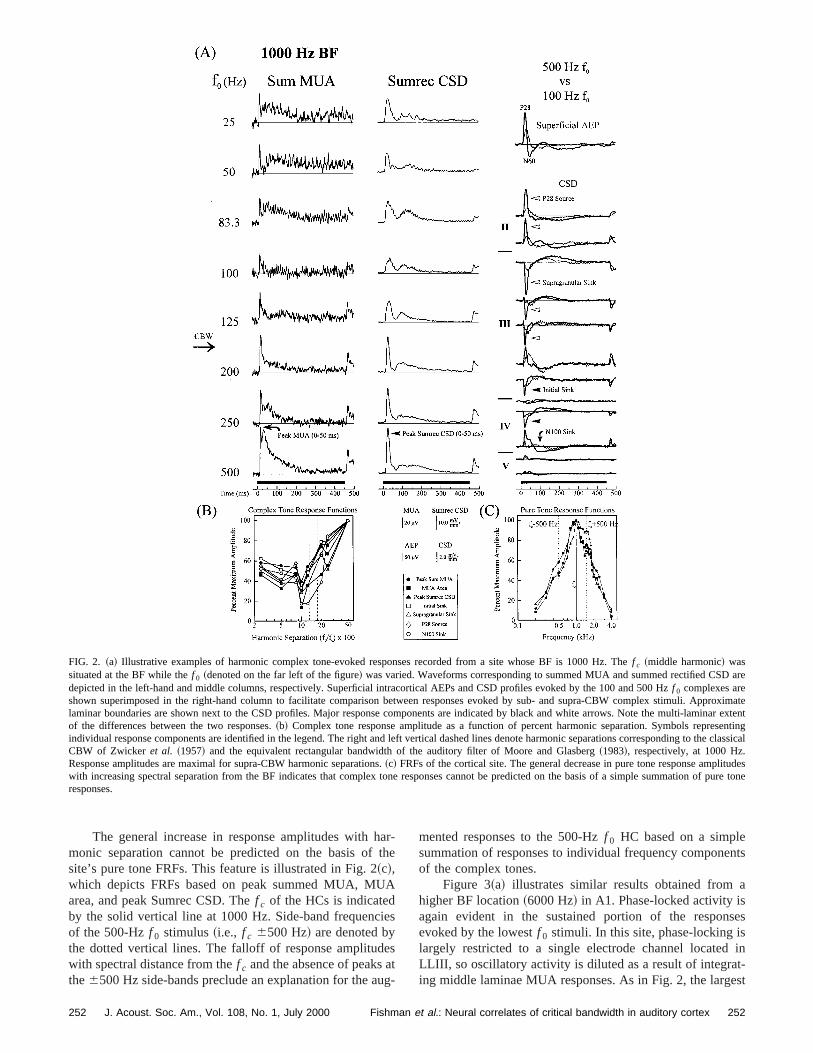
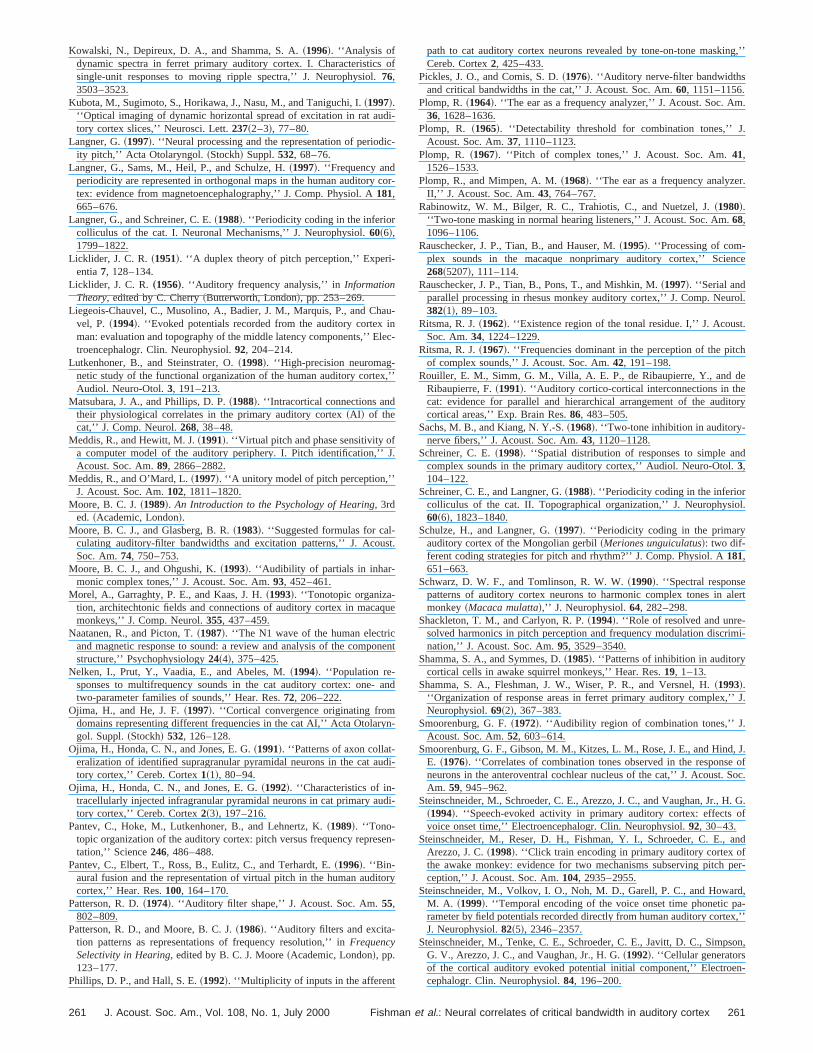
Figure 3~a! illustrates similar results obtained fromhigher BF location~6000 Hz! in A1. Phase-locked activity isagain evident in the sustained portion of the responevoked by the lowestf 0 stimuli. In this site, phase-locking islargely restricted to a single electrode channel locatedLLIII, so oscillatory activity is diluted as a result of integraing middle laminae MUA responses. As in Fig. 2, the larg
252et al.: Neural correlates of critical bandwidth in auditory cortex
ficial AEPsent ofnd leftof
ompl
FIG. 3. ~a! Harmonic complex tone-evoked responses recorded from a site whose BF is 6000 Hz. Same conventions as in Fig. 2. Intracortical superand CSD profiles evoked by the 50- and 3000-Hzf 0 stimuli are shown superimposed in the right-hand column, and again show the multi-laminar extdifferences between sub- and supra- CBW stimuli.~b! Complex tone response amplitude as a function of percent harmonic separation. The right avertical dashed lines denote harmonic separations corresponding to the classical CBW of Zwickeret al. ~1957! and the equivalent rectangular bandwidththe auditory filter of Moore and Glasberg~1983!, respectively, at 6000 Hz. Response amplitudes are maximal for supra-CBW harmonic separations.~c! TheFRFs of the cortical site. The general decrease in pure tone response amplitudes with increasing spectral separation from the BF indicates that cex toneresponses cannot be predicted on the basis on a simple summation of pure tone responses.
Bhesia0
thliroomenonth
odt andBWom-
eally,sing
heof
the
and
and smallest responses are evoked by HCs with supra-Cand sub-CBWf 0s, respectively. In this case, however, tgeneral increase in complex tone response amplitudemore gradual than for the site shown in Fig. 2. Superficintracortical AEPs and full CSD profiles evoked by the 300and 50-Hz f 0 complexes are shown superimposed inright column to facilitate comparison between responses eited by these supra- and sub-CBW stimuli. There is a pnounced difference in amplitude between P28 and N60 cponents of the AEP as well as between CSD componlocated in both supragranular and thalamorecipient zlaminae. These results are graphically illustrated byCTRFs shown in Fig. 3~b!. Similarly to the results obtained
253 J. Acoust. Soc. Am., Vol. 108, No. 1, July 2000 Fishman
W
isl-ec---
tsee
for the lower BF site depicted in Fig. 2, there is a goagreement among response components, with the largessmallest responses evoked by HCs with supra- and sub-CDFs, respectively. Furthermore, the general increase in cplex tone response amplitude withDF cannot be predictedby the FRFs of the site@Fig. 3~c!#, and again demonstrate thnonlinear nature of the complex tone responses. Specificsince pure tone response amplitudes decrease with increaspectral distance from thef c , the enhanced responses to thigher f 0 HCs cannot be based on a simple summationresponses to the individual frequency components ofcomplex tones.
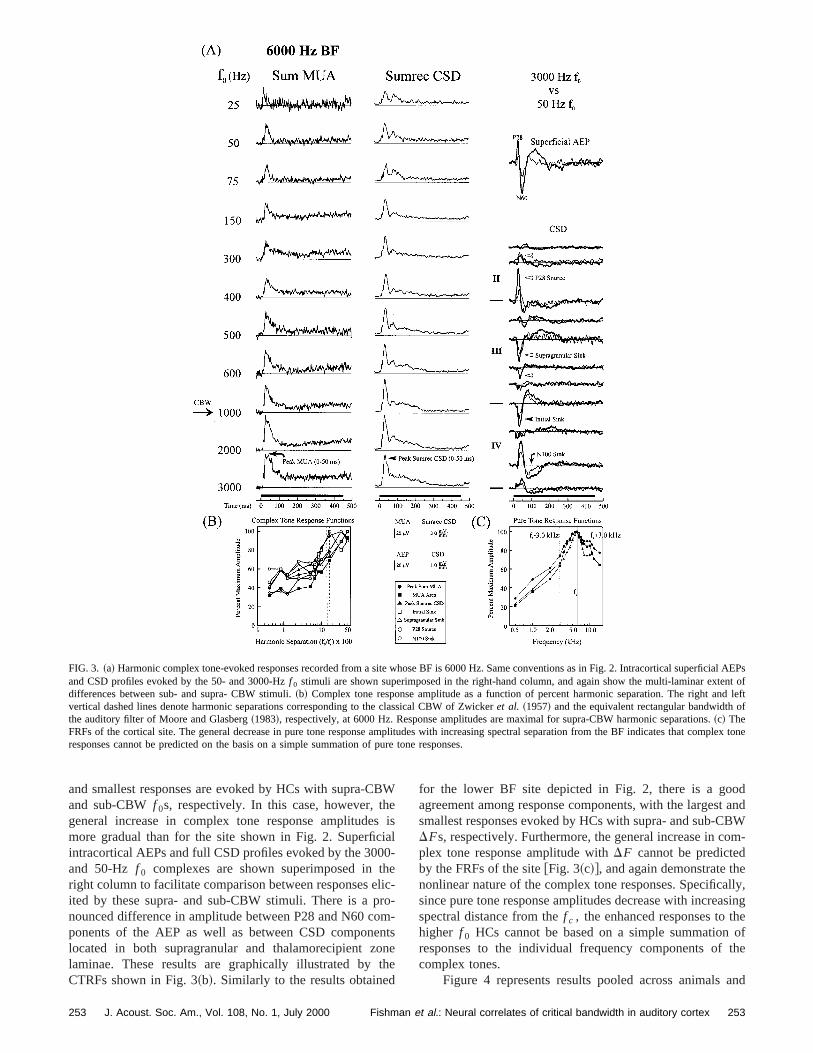
Figure 4 represents results pooled across animals
253et al.: Neural correlates of critical bandwidth in auditory cortex
neashaseth
se
ae
-
0---
chim
nict
setinn-ud
ethb
udy.
7 re-
entses
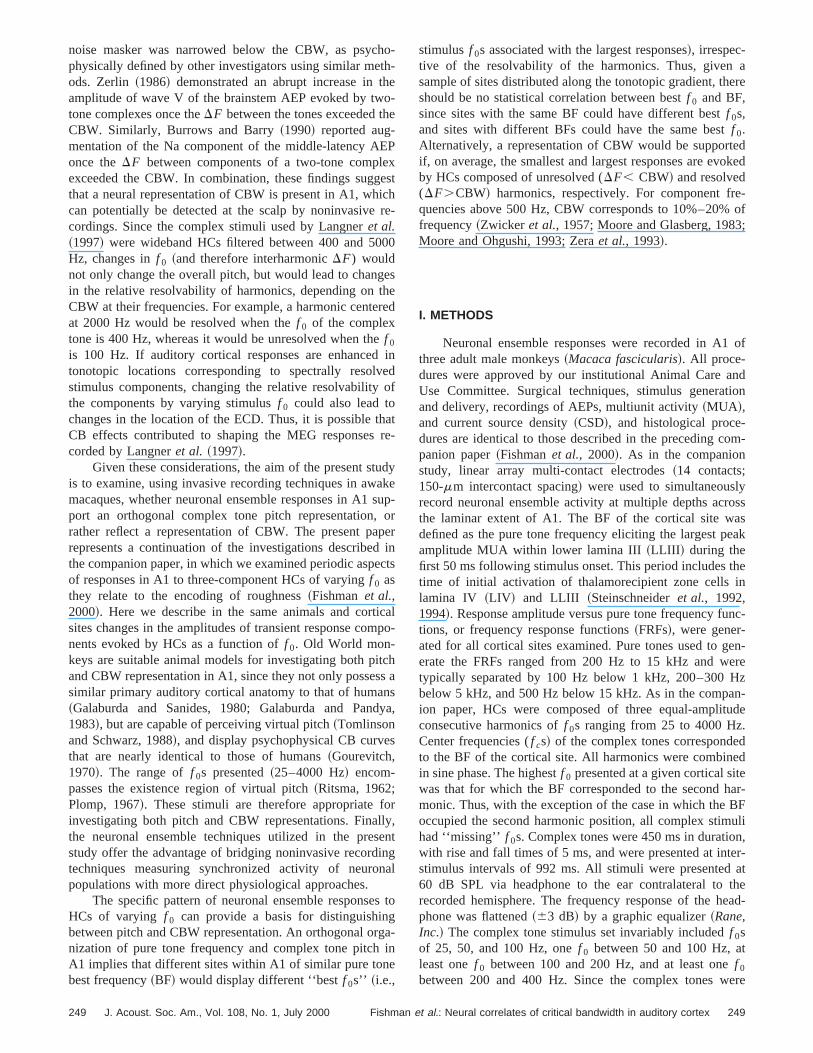
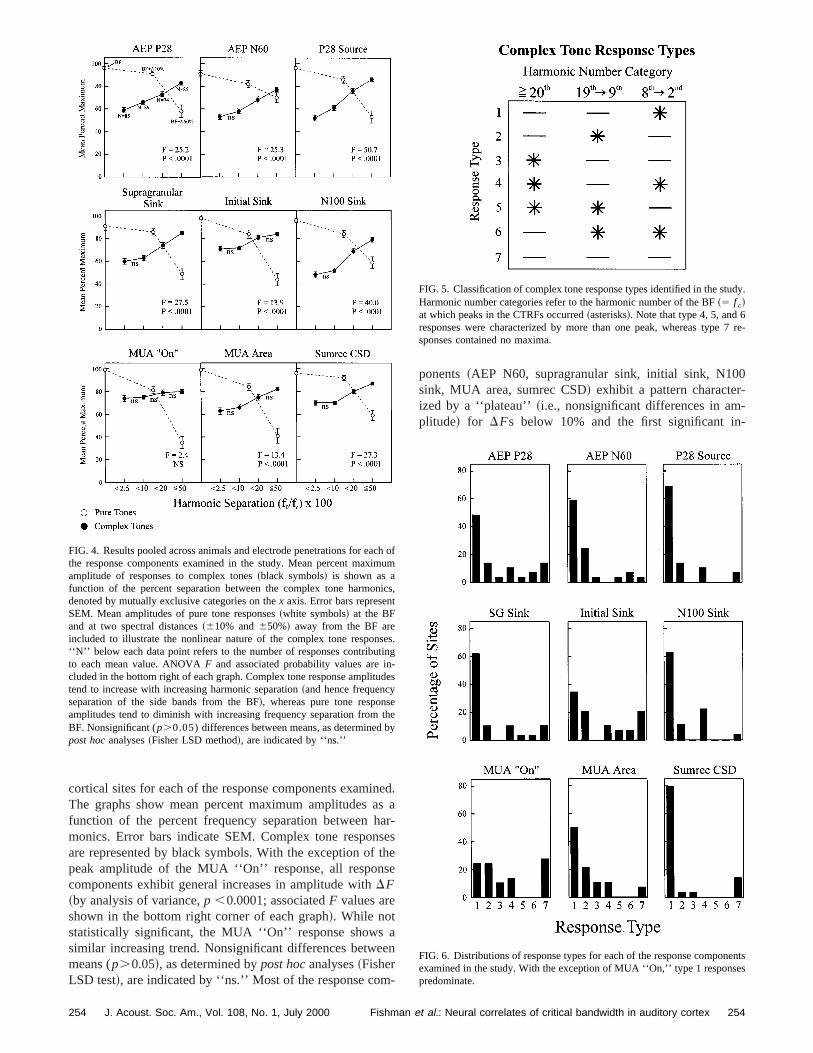
cortical sites for each of the response components examiThe graphs show mean percent maximum amplitudesfunction of the percent frequency separation betweenmonics. Error bars indicate SEM. Complex tone responare represented by black symbols. With the exception ofpeak amplitude of the MUA ‘‘On’’ response, all responcomponents exhibit general increases in amplitude withDF~by analysis of variance,p ,0.0001; associatedF values areshown in the bottom right corner of each graph!. While notstatistically significant, the MUA ‘‘On’’ response showssimilar increasing trend. Nonsignificant differences betwemeans (p.0.05!, as determined bypost hocanalyses~FisherLSD test!, are indicated by ‘‘ns.’’ Most of the response com
FIG. 4. Results pooled across animals and electrode penetrations for eathe response components examined in the study. Mean percent maxamplitude of responses to complex tones~black symbols! is shown as afunction of the percent separation between the complex tone harmodenoted by mutually exclusive categories on thex axis. Error bars represenSEM. Mean amplitudes of pure tone responses~white symbols! at the BFand at two spectral distances~610% and650%! away from the BF areincluded to illustrate the nonlinear nature of the complex tone respon‘‘N’’ below each data point refers to the number of responses contributo each mean value. ANOVAF and associated probability values are icluded in the bottom right of each graph. Complex tone response amplittend to increase with increasing harmonic separation~and hence frequencyseparation of the side bands from the BF!, whereas pure tone responsamplitudes tend to diminish with increasing frequency separation fromBF. Nonsignificant (p.0.05) differences between means, as determinedpost hocanalyses~Fisher LSD method!, are indicated by ‘‘ns.’’
254 J. Acoust. Soc. Am., Vol. 108, No. 1, July 2000 Fishman
d.a
r-se
n
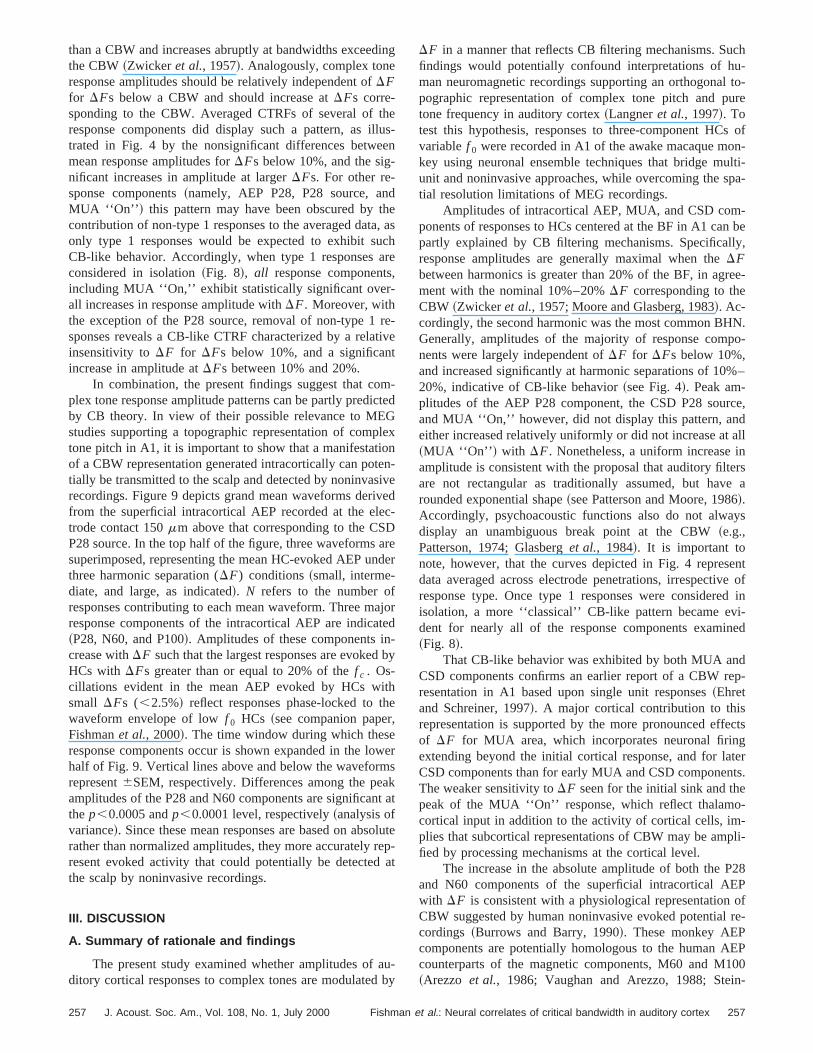
ponents~AEP N60, supragranular sink, initial sink, N10sink, MUA area, sumrec CSD! exhibit a pattern characterized by a ‘‘plateau’’~i.e., nonsignificant differences in amplitude! for DFs below 10% and the first significant in
ofum
s,
s.g
es
ey
FIG. 5. Classification of complex tone response types identified in the stHarmonic number categories refer to the harmonic number of the BF~5 f c!at which peaks in the CTRFs occurred~asterisks!. Note that type 4, 5, and 6responses were characterized by more than one peak, whereas typesponses contained no maxima.
FIG. 6. Distributions of response types for each of the response componexamined in the study. With the exception of MUA ‘‘On,’’ type 1 responspredominate.
254et al.: Neural correlates of critical bandwidth in auditory cortex
,
foistudwae
aw
nsF
a
s.p
csde
paam
epn
t bon
haraerrathi
caaa
f atioth
l tioo
rehate
exictionbth
ple,hen
8,ior.islexid-ture,ca-onicwasof
ossned.hedernre-
o 8.
eir
led
to
site.6havetwoing
es4,
am-ons,s thehar-
ctedtone
ervedbers
creases in amplitude atDFs between 10% and 20%suggestive of critical band-like behavior.
In order to examine whether the patterns observedcomplex tone responses were due to general characterof the pure tone FRFs, mean pure tone response amplitwere calculated at two different frequency separations afrom the BF, 10% and 50%. Thus, for instance, in the casa 5000-Hz BF site, responses to pure tones at BF110%55500 Hz and BF210%54500 Hz were averaged to yieldmean response amplitude corresponding to tones 10% afrom the BF, while responses at BF150%57500 Hz andBF250%52500 Hz were averaged to yield a mean respoamplitude corresponding to tones 50% away from the BPure tone response amplitudes~white symbols! decreasewith increasingDF from the BF, as would be expected forroughly Gaussian-shaped FRF. Increases inf 0 entail in-creases in theDF between the BF and flanking harmonicConsequently, if changes in complex tone response amtudes withf 0 simply reflect pure tone tuning characteristiof the cortical sites, complex tone response amplitushould, on average, decrease withDF. However, the oppo-site is the case. Strikingly, while pure tone response amtudes generally decrease rapidly for frequencies separfrom the BF by more than 10%, complex tone responseplitudes ~for the majority of the response components! in-crease significantly when the harmonic sidebands are srated from the BF by more than 10%. Thus, complex toresponses exhibit nonlinear behavior in that they cannopredicted on the basis of a simple summation of their cstituent pure tone responses.
C. Complex tone response types
The general increase in response amplitudes withmonic separation depicted in Fig. 4 represents the avebehavior of response components across sites. Howevcloser examination of individual CTRFs reveals that sevedifferent complex tone response patterns contribute toaverage trend. The CTRFs were assigned to categoriestially suggested by visual inspection of the data. Classifition was based upon the harmonic number of the BFwhich a peak occurred in the CTRF. A peak was definedthe DF associated with the largest amplitude response othe complex tones presented in a given electrode penetraIn order to count as a peak, we used the criterion thatresponse amplitude at a givenDF had to be at least 20%greater than the mean amplitude of the responses to alcomplex tones presented. This is a conservative critersince repeated presentations of identical pure tone and cplex tone stimuli in the present study yielded corticalsponse averages typically varying in amplitude by less t10%. Similarly, a 20% elevation in spike rate was the cririon used by Ehret and Merzenich~1988! to define physi-ological CBWs in their studies of the inferior colliculus~IC!.DFs corresponding to peaks in the CTRF were thenpressed in terms of the harmonic number of the BF at whthe peaks occurred. Figure 5 summarizes the classificascheme used in the study. Asterisks denote the harmnumber category within which a peak in the CTRF was oserved. The category location of the peak thus defined
255 J. Acoust. Soc. Am., Vol. 108, No. 1, July 2000 Fishman
ricsesy
of
ay
e.
li-
s
li-ted
-
a-ee-
r-ge, ale
ni--tslln.e
hen,m--n-
-honic-e
response type indicated on the left of the table. For examif the amplitude of a given response component peaked wthe harmonic number of the BF was less than or equal tothe component was classified as exhibiting type 1 behavThe significance of the BF having a harmonic number of 8based on the fact that the lower side-band of the comptone would have a harmonic number of 7, which is consered to be spectrally resolved in the psychoacoustic litera~Plomp, 1964; Plomp and Mimpen, 1968!. In some casestwo peaks in the CTRF were identified, leading to classifition as a type 4, 5, or 6 response, depending on the harmnumber category of the peaks. In cases where no peakidentified~i.e., no response greater than 20% of the meanall responses! the response was classified as type 7.
Figure 6 depicts the distribution of response types acrcortical sites for each of the response components examiAlthough there are differences in the distributions for tdifferent components, with the exception of MUA ’’On’’ anthe initial sink, type 1 was the dominant response pattobserved. In other words, for the majority of sites andsponse components, a peak in the CTRF occurred atf 0s forwhich the BF had a harmonic number less than or equal tIn contrast, MUA ‘‘On’’ and the initial sink exhibited manytype 7 ~no peak! response patterns, which accounts for threlative lack of sensitivity toDF evident in Fig. 4. For thesecomponents, fewer than 40% of the cortical sites sampdisplayed type 1 response patterns.
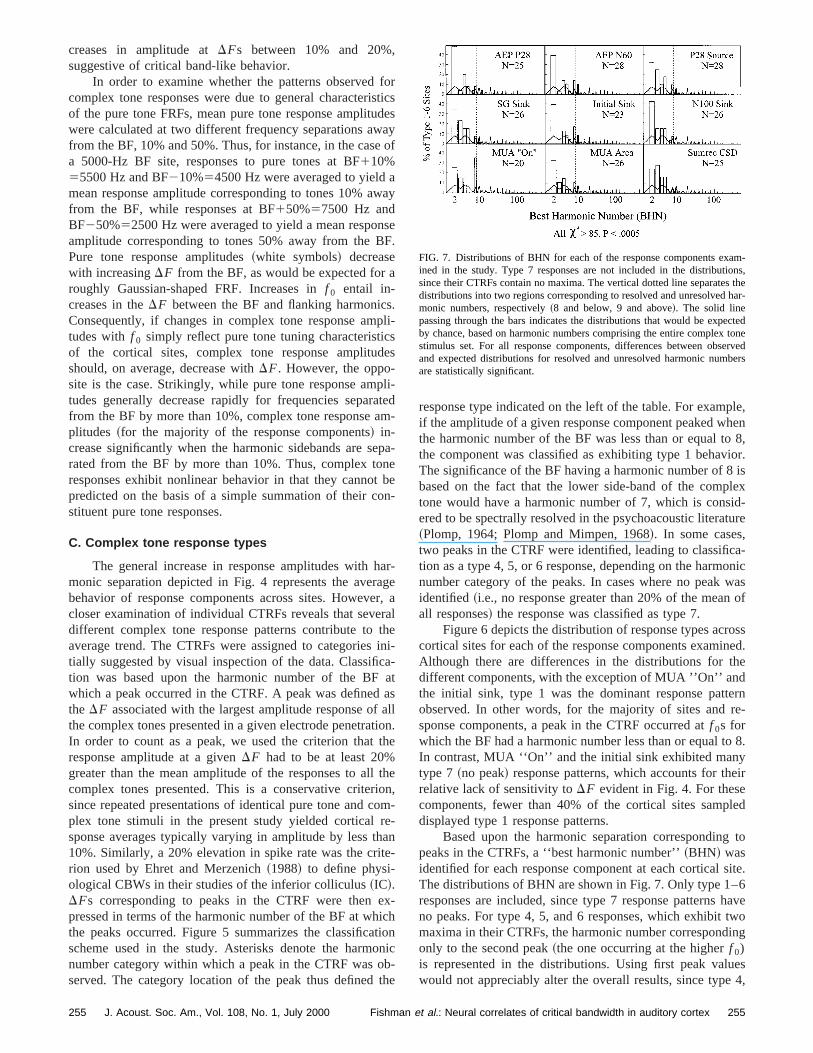
Based upon the harmonic separation correspondingpeaks in the CTRFs, a ‘‘best harmonic number’’~BHN! wasidentified for each response component at each corticalThe distributions of BHN are shown in Fig. 7. Only type 1–responses are included, since type 7 response patternsno peaks. For type 4, 5, and 6 responses, which exhibitmaxima in their CTRFs, the harmonic number correspondonly to the second peak~the one occurring at the higherf 0)is represented in the distributions. Using first peak valuwould not appreciably alter the overall results, since type
FIG. 7. Distributions of BHN for each of the response components exined in the study. Type 7 responses are not included in the distributisince their CTRFs contain no maxima. The vertical dotted line separatedistributions into two regions corresponding to resolved and unresolvedmonic numbers, respectively~8 and below, 9 and above!. The solid linepassing through the bars indicates the distributions that would be expeby chance, based on harmonic numbers comprising the entire complexstimulus set. For all response components, differences between obsand expected distributions for resolved and unresolved harmonic numare statistically significant.
255et al.: Neural correlates of critical bandwidth in auditory cortex
ypnre,,o
esel
tpod
a
fe
on-s at
is-n-ount
t a
w-sss
oneTams.poreud
lec-rentre
f thewnrm
thenifi-
5, and 6 responses are among the minority of response tobserved. The vertical dotted lines divide the distributiointo two regions corresponding to psychoacousticallysolved and unresolved harmonic numbers, 8 and belowand above, respectively~Plomp, 1964; Plomp and Mimpen1968!. Note that for all response components, the majorityBHNs lie within the region of resolved harmonics. The linpassing through the bars of the distributions indicate the rtive proportions of the harmonic numbers correspondingthe f c of all the stimuli presented in the study and thus reresent the distributions that would be expected basedchance. Differences between the observed and expectedtributions for resolved and unresolved harmonic numbersstatistically significant~chi-squared tests,p,0.0005!. TheBHNs were neither significantly related to BF region:,2kHz/2–4 kHz/5–10 kHz~Kruskal-Wallis one-way analysisof variance,p.0.05!, nor with the 6-dB-down bandwidth othe FRF based upon the peak amplitude of MUA ‘‘On,’’ th
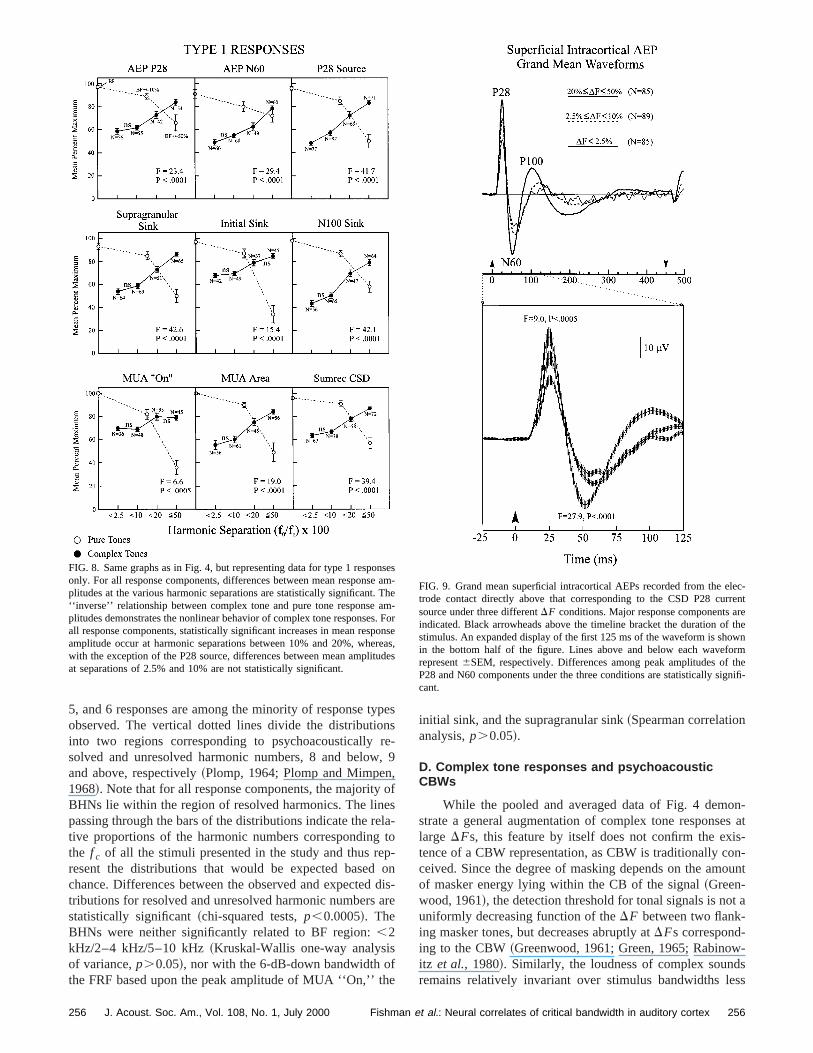
FIG. 8. Same graphs as in Fig. 4, but representing data for type 1 responly. For all response components, differences between mean responsplitudes at the various harmonic separations are statistically significant.‘‘inverse’’ relationship between complex tone and pure tone responseplitudes demonstrates the nonlinear behavior of complex tone responseall response components, statistically significant increases in mean resamplitude occur at harmonic separations between 10% and 20%, whewith the exception of the P28 source, differences between mean amplitat separations of 2.5% and 10% are not statistically significant.
256 J. Acoust. Soc. Am., Vol. 108, No. 1, July 2000 Fishman
ess-9
f
a-o-nis-
re
initial sink, and the supragranular sink~Spearman correlationanalysis,p.0.05!.
D. Complex tone responses and psychoacousticCBWs
While the pooled and averaged data of Fig. 4 demstrate a general augmentation of complex tone responselarge DFs, this feature by itself does not confirm the extence of a CBW representation, as CBW is traditionally coceived. Since the degree of masking depends on the amof masker energy lying within the CB of the signal~Green-wood, 1961!, the detection threshold for tonal signals is nouniformly decreasing function of theDF between two flank-ing masker tones, but decreases abruptly atDFs correspond-ing to the CBW~Greenwood, 1961; Green, 1965; Rabinoitz et al., 1980!. Similarly, the loudness of complex soundremains relatively invariant over stimulus bandwidths le
sesam-he
-Fornseas,es
FIG. 9. Grand mean superficial intracortical AEPs recorded from the etrode contact directly above that corresponding to the CSD P28 cursource under three differentDF conditions. Major response components aindicated. Black arrowheads above the timeline bracket the duration ostimulus. An expanded display of the first 125 ms of the waveform is shoin the bottom half of the figure. Lines above and below each waveforepresent6SEM, respectively. Differences among peak amplitudes ofP28 and N60 components under the three conditions are statistically sigcant.
256et al.: Neural correlates of critical bandwidth in auditory cortex
di
thllue-
dtha,ucar,
retit
mictGpleontesiviveecDand
fate-b
ithher,ews
akt
ore
a
ab
chu-l to-ure
s ofn-
ulti-pa-
-n bely,
ree-
N.o-
%–
rce,dallinerse a
ys
ente ofd ini-
ned
dep-
ectsgterts.
--pli-
28P
ofre-
EP00
n-
than a CBW and increases abruptly at bandwidths exceethe CBW~Zwicker et al., 1957!. Analogously, complex toneresponse amplitudes should be relatively independent ofDFfor DFs below a CBW and should increase atDFs corre-sponding to the CBW. Averaged CTRFs of several ofresponse components did display such a pattern, as itrated in Fig. 4 by the nonsignificant differences betwemean response amplitudes forDFs below 10%, and the significant increases in amplitude at largerDFs. For other re-sponse components~namely, AEP P28, P28 source, anMUA ‘‘On’’ ! this pattern may have been obscured bycontribution of non-type 1 responses to the averaged datonly type 1 responses would be expected to exhibit sCB-like behavior. Accordingly, when type 1 responsesconsidered in isolation~Fig. 8!, all response componentsincluding MUA ‘‘On,’’ exhibit statistically significant over-all increases in response amplitude withDF. Moreover, withthe exception of the P28 source, removal of non-type 1sponses reveals a CB-like CTRF characterized by a relainsensitivity to DF for DFs below 10%, and a significanincrease in amplitude atDFs between 10% and 20%.
In combination, the present findings suggest that coplex tone response amplitude patterns can be partly predby CB theory. In view of their possible relevance to MEstudies supporting a topographic representation of comtone pitch in A1, it is important to show that a manifestatiof a CBW representation generated intracortically can potially be transmitted to the scalp and detected by noninvarecordings. Figure 9 depicts grand mean waveforms derfrom the superficial intracortical AEP recorded at the eltrode contact 150mm above that corresponding to the CSP28 source. In the top half of the figure, three waveformssuperimposed, representing the mean HC-evoked AEP uthree harmonic separation (DF) conditions~small, interme-diate, and large, as indicated!. N refers to the number oresponses contributing to each mean waveform. Three mresponse components of the intracortical AEP are indica~P28, N60, and P100!. Amplitudes of these components increase withDF such that the largest responses are evokedHCs with DFs greater than or equal to 20% of thef c . Os-cillations evident in the mean AEP evoked by HCs wsmall DFs (,2.5%! reflect responses phase-locked to twaveform envelope of lowf 0 HCs ~see companion papeFishmanet al., 2000!. The time window during which thesresponse components occur is shown expanded in the lohalf of Fig. 9. Vertical lines above and below the waveformrepresent6SEM, respectively. Differences among the peamplitudes of the P28 and N60 components are significanthep,0.0005 andp,0.0001 level, respectively~analysis ofvariance!. Since these mean responses are based on absrather than normalized amplitudes, they more accuratelyresent evoked activity that could potentially be detectedthe scalp by noninvasive recordings.
III. DISCUSSION
A. Summary of rationale and findings
The present study examined whether amplitudes ofditory cortical responses to complex tones are modulated
257 J. Acoust. Soc. Am., Vol. 108, No. 1, July 2000 Fishman
ng
es-n
eashe
-ve
-ed
x
n-ed-
reer
jord
y
er
at
lutep-t
u-y
DF in a manner that reflects CB filtering mechanisms. Sufindings would potentially confound interpretations of hman neuromagnetic recordings supporting an orthogonapographic representation of complex tone pitch and ptone frequency in auditory cortex~Langneret al., 1997!. Totest this hypothesis, responses to three-component HCvariablef 0 were recorded in A1 of the awake macaque mokey using neuronal ensemble techniques that bridge munit and noninvasive approaches, while overcoming the stial resolution limitations of MEG recordings.
Amplitudes of intracortical AEP, MUA, and CSD components of responses to HCs centered at the BF in A1 capartly explained by CB filtering mechanisms. Specificalresponse amplitudes are generally maximal when theDFbetween harmonics is greater than 20% of the BF, in agment with the nominal 10%–20%DF corresponding to theCBW ~Zwicker et al., 1957; Moore and Glasberg, 1983!. Ac-cordingly, the second harmonic was the most common BHGenerally, amplitudes of the majority of response compnents were largely independent ofDF for DFs below 10%,and increased significantly at harmonic separations of 1020%, indicative of CB-like behavior~see Fig. 4!. Peak am-plitudes of the AEP P28 component, the CSD P28 souand MUA ‘‘On,’’ however, did not display this pattern, aneither increased relatively uniformly or did not increase at~MUA ‘‘On’’ ! with DF. Nonetheless, a uniform increaseamplitude is consistent with the proposal that auditory filtare not rectangular as traditionally assumed, but havrounded exponential shape~see Patterson and Moore, 1986!.Accordingly, psychoacoustic functions also do not alwadisplay an unambiguous break point at the CBW~e.g.,Patterson, 1974; Glasberget al., 1984!. It is important tonote, however, that the curves depicted in Fig. 4 represdata averaged across electrode penetrations, irrespectivresponse type. Once type 1 responses were considereisolation, a more ‘‘classical’’ CB-like pattern became evdent for nearly all of the response components exami~Fig. 8!.
That CB-like behavior was exhibited by both MUA anCSD components confirms an earlier report of a CBW rresentation in A1 based upon single unit responses~Ehretand Schreiner, 1997!. A major cortical contribution to thisrepresentation is supported by the more pronounced effof DF for MUA area, which incorporates neuronal firinextending beyond the initial cortical response, and for laCSD components than for early MUA and CSD componenThe weaker sensitivity toDF seen for the initial sink and thepeak of the MUA ‘‘On’’ response, which reflect thalamocortical input in addition to the activity of cortical cells, implies that subcortical representations of CBW may be amfied by processing mechanisms at the cortical level.
The increase in the absolute amplitude of both the Pand N60 components of the superficial intracortical AEwith DF is consistent with a physiological representationCBW suggested by human noninvasive evoked potentialcordings ~Burrows and Barry, 1990!. These monkey AEPcomponents are potentially homologous to the human Acounterparts of the magnetic components, M60 and M1~Arezzo et al., 1986; Vaughan and Arezzo, 1988; Stei
257et al.: Neural correlates of critical bandwidth in auditory cortex

d
rab
sb-gn
n’nreseCBnthp
o
tstwbi
-
-r
-ors:
retiopr
u-
esin
secoo,f
fo
-s
uss
aren
uargdi
ip-
ac-ents
ofsen-
e-
foricaly
CB-ion
in-
in, ap-me
ureseral
oneoral
lyinthe
er-lso
pures
m-orypo-
eralarerd-lexre-
n-p-nemul-ingsend
axi-andtheany
schneideret al., 1994!, whose ECD locations were reporteby Langneret al. ~1997! to depend onf 0. In combination,the present data suggest that a CBW representation genewithin A1 can be propagated to the scalp and detectednoninvasive recording techniques such as MEG. Conquently, it is possible that CB effects significantly contriuted to the neuromagnetic responses recorded by Lanet al. ~1997!.
It is important to emphasize that by a ‘‘representatioof CBW we do not mean to suggest that CBW is an orgazational feature of A1, rather that neuronal ensemblesponses to complex tones of the type used in the prestudy behave in accordance with the predictions oftheory. Given this correspondence, the augmented respoto HCs comprised of low-numbered harmonics parallelenhanced perceptual salience of spectrally resolved comnents of complex tones and the increased loudness of cplex sounds with bandwidths exceeding a CBW~Zwickeret al., 1957; Plomp, 1964!.
It is unlikely that aural nonlinear distortion producwere responsible for generating the present results. Themost prominent distortion products arising from the comnation of two primary tones,f1 and f 2 ~with f 2. f 1), aref 22f1, and 2f12f 2. The intensities of the individual complex tone components in this study~51 dB SPL! are wellbelow threshold for detection off 22f1 ~about 50-dB sensation level, i.e., dB above hearing threshold, of the primatones: Plomp, 1965; Goldstein, 1967!. The detection threshold for 2f12f 2, however, is considerably lower than that ff 22 f 1 ~15-dB sensation level of the primary toneSmoorenburg, 1972!. Neural correlates of 2f12f 2, as dem-onstrated by synchronization of auditory nerve fibersponses in the cat to cycles of the predicted combinatone, only begin to emerge when the primary tones aresented at about 50 dB SPL~Goldstein and Kiang, 1968!. Onaverage, similar thresholds were obtained by Smoorenbet al. ~1976! in the anterior cochlear nucleus of the cat. Importantly, since the frequencies of the primary tones in thphysiological studies were chosen so as to produce combtion tones overlapping the characteristic frequency~CF!, andthus to maximize the probability of obtaining a responthese thresholds may actually overestimate the potentialtribution of aural distortion products to the generationresponses recorded in the present study. Furthermorefact that neural and psychophysical detection thresholdscombination tones are, in general, significantly higherlarge than for smallDFs ~Plomp, 1965; Smoorenburget al.,1976; Buunen and Rhode, 1978! is inconsistent with the observed augmentation of responses to HCs with increaseDF. Finally, using identical stimulation equipment, previostudies in our laboratory demonstrated absent responsecomplex tones composed of the third, fourth, and fifth hmonics of a~missing! f 0 when the latter was situated at thBF ~Fishmanet al., 1998!. Distortion products generated ithis situation would have corresponded to thef 0 and thusoverlapped the BF. The fact that the levels of the individharmonics were the same as those in the present study aagainst the possibility that aural combination tones and
258 J. Acoust. Soc. Am., Vol. 108, No. 1, July 2000 Fishman
tedy
e-
er
’i--nt
seseo-
m-
o-
y
-ne-
rg
ea-
,n-ftheorr
in
to-
luess-
tortion products generated by our acoustic stimulation equment contributed significantly to the present results.
IV. PROPOSED MECHANISMS
Complex tone responses in A1 reflect nonlinear intertions between responses to individual frequency componin that they cannot be predicted by a simple summationisolated pure tone responses used to define the spectralsitivity of the cortical sites. Generally, complex tone rsponse amplitudes changed in a directionoppositeto thatexpected based upon the FRF~see Figs. 4 and 8!. This find-ing indicates that such interactions must be consideredany explanation of complex sound processing at the cortlevel. It is unclear at which level of the auditory pathwathese nonlinearities originate to generate the observedlike response patterns. Demonstration of two-tone inhibitin the responses of auditory nerve fibers suggests thevolvement of peripheral cochlear mechanisms~Sachs andKiang, 1968!. On the other hand, Pickles and Comis~1976!reported that effective bandwidths of auditory nerve fibersthe cat, determined by the noise band-expansion methodpreciably underestimated psychophysical CBWs in the saspecies and concluded that more central auditory structare responsible for determining CBW. Accordingly, in thcentral nucleus of the IC of the anesthetized cat, neuCBWs, determined using noise band-narrowing and two-tmasking procedures, were more consistent with behavivalues ~Ehret and Merzenich, 1985, 1988!. Moreover, inagreement with our findings, CBWs could not be reliabpredicted by pure tone excitatory tuning curve bandwidthsthe IC, indicating that responses to complex sounds atlevel of the midbrain are similarly shaped by nonlinear intactions. Single-unit studies in A1 of the anesthetized cat arevealed the lack of a simple correspondence betweentone excitatory tuning curves and physiological CBW~Ehret and Schreiner, 1997!.
One possible mechanism underlying these cortical coplex tone response patterns involves mutual lateral inhibitinteractions between responses evoked by frequency comnents lying within the same CB. In the present case, latsuppression may be most effective when the harmonicsseparated from one another by less than a CBW. Accoingly, the comparatively enhanced responses to comptones with spectrally resolved harmonics may reflect alease from inhibition.
A lateral suppression mechanism which could potetially give rise to CB-like response patterns in A1 is suported by a number of physiological studies using two-tostimuli. Responses to BF tones can be suppressed by sitaneously and nonsimultaneously presented tones lywithin as well as outside the effective excitatory responarea in A1~e.g., Shamma and Symmes, 1985; Phillips aHall, 1992; Shammaet al., 1993; Nelkenet al., 1994; Cal-ford and Semple, 1995; Brosch and Schreiner, 1997!. Impor-tantly, suppression of BF tone responses is generally mmal when the suppressor tone is at or near the BFdiminishes with increasing frequency separation betweentones. Moreover, consistent with the present results, in mof these studies~e.g., Shammaet al., 1993; Calford and
258et al.: Neural correlates of critical bandwidth in auditory cortex
nsy(
ithws
ncdle
omtuonu-
-ennsabo
on
ictio
eEitces
dexsuncoteulparedC
ye
, i
re-
ing ae-nters-or-
ted
e-ionest-in-
ikedid
re-fre-ldingtotch
to
nan
keyuree-e
eseightver-
r-
c-dn-if-
or-
as
al
for
alell
Semple, 1995; Brosch and Schreiner, 1997! the frequencyrange within which two-tone suppression is maximal~forstimulus component intensities,60 dB SPL! commonly cor-responds to about two CBWs surrounding the BF~combinedrange above and below the BF!. Similarly, studies of A1responses to stationary ripple stimuli~wideband complexsounds with a sinusoidal spectral profile! demonstrate amarked dependence of response amplitude on ripple de~number of ripples/octave!: lower ripple densities generalllead to enhancement, whereas higher ripple densities.2ripples/octave! lead to suppression~Kowalski et al., 1996,Calhoun and Schreiner, 1998!. While these wideband stimulare considerably more complex than the stimuli used inpresent study, the results of these studies are consistentthe observed augmentation of responses with increaseinterharmonicDF.
In combination, these studies provide strong evidefor DF-dependent lateral inhibitory interactions in A1, ansupport the proposal that inhibitory sidebands not reveaby isolated pure tone responses underlie the CB-like cplex tone response patterns observed in the present sLateral suppression could arise from horizontal connectiof pyramidal cell axon collaterals onto inhibitory internerons of adjacent frequency regions~Ojima et al., 1991, 1992;Kubota et al., 1997!. Consistent with this possibility, retrograde tracer experiments in A1 of the cat reveal prominlabeling of neurons with BFs different from that of neurolocated at the tracer injection site, suggesting a considerdegree of connectivity between disparate isfrequency bands~Matsubara and Phillips, 1988!. Accord-ingly, inhibitory interactions across several different isfrequency bands in A1 may modulate responses to soucontaining multiple frequency components. The anatombases and specific mechanisms underlying these interac~e.g., active versus shunting inhibition! remain importantquestions for future investigations.
A. Implications for physiological representations ofpitch
In supporting a representation of CBW in A1, thpresent findings urge a more cautious interpretation of Mresults suggesting an orthogonal spatial organization of pand frequency in A1. However, while the majority of sitand response components examined in the present studyplayed CB-like behavior, the identification of other compltone response patterns leaves open the possibility thatpopulations of neurons in A1 arranged along iso-frequebands may represent additional perceptual features of cplex sounds such as pitch. Thus, in the absence of a sysatic spatial mapping along iso-frequency axes, our rescannot exclude the possibility that complex tone pitch is stially represented orthogonal to the tonotopic map. Moover, differences between the three-component HCs usethe present study and the wideband multi-component Hused in the study by Langneret al. ~1997! must be acknowl-edged. Since the latter were composed simultaneouslboth resolved and unresolved harmonics, they may havegaged pitch mechanisms more effectively than our stimuli
259 J. Acoust. Soc. Am., Vol. 108, No. 1, July 2000 Fishman
ity
eithin
e
d-
dy.s
t
le-
-dsalns
Gh
is-
b-ym-m-ts--ins
ofn-n
which harmonics were generally either resolved or unsolved, depending on the relationship betweenf c and f 0.
An orthogonal organization of pitch and frequencythe auditory system is supported by studies demonstratintopographic representation of the periodicity of amplitudmodulated~AM ! tones orthogonal to the tonotopic gradiein the IC of the cat~Langner and Schreiner, 1988; Schreinand Langner, 1988!. This organization is presumably tranmitted to higher auditory centers to form an analogous ctical representation~Langner, 1997!. Accordingly, a topo-graphic representation of stimulus periodicity was reporin the auditory cortex of the Mongolian gerbil~Schulze andLangner, 1997!. In this latter case, however, the carrier frquencies of the AM tones used to define this organizatwere located outside of the neuron’s receptive field, sugging across-channel integration of subthreshold frequencyformation. The best modulation frequency~BMF!, defined asthe stimulus modulation frequency eliciting the highest sprate, generally did not equal the BF, so these responsesnot encode the ‘‘missing fundamental’’ in a manner corsponding to the tonotopic representation of pure tonequency. Moreover, for a given single-unit, the BMF couchange within a range of more than an octave dependupon the carrier frequency used. This finding is difficultreconcile with the notion of a spatial representation of piaccording to which neurons are optimally responsive onlya narrow range off 0s, irrespective of carrier frequency.
While providing a compelling physiological explanatiofor how complex signals with similar spectral envelopes chave different pitches depending on theirf 0, the orthogonalmodel of pitch representation is unable to account for afeature of pitch perception: that complex tones and ptones with the samef 0 have the same pitch. Since the reprsentations of pure tones and complex tones of the samf 0
occupy different spatial locations~Langneret al., 1997!, theorthogonal model does not explain how the pitches of thsignals are perceived as similar. This correspondence mbe achieved, however, in later processing stages by congence of pure tone and complex tone-basedf 0 informationfrom A1 into surrounding nonprimary auditory cortical aeas.
Alternatively, pitch may be based upon patterns of ativity generated within networks of hierarchically organizeauditory cortical fields. Anatomical tracer studies demostrate extensive convergence of inputs originating from dferent frequency bands in A1 into surrounding auditory ctical areas~Ojima and He, 1997!, as well as large-scaleinterconnectivity between A1 and surrounding ‘‘belt’’ are~Rouiller et al., 1991; Morelet al., 1993; Joneset al., 1995;Hackettet al., 1998; Kaas and Hackett, 1998!. Physiologicalinvestigations of nonprimary auditory cortical fields revefunctional connections with A1~Rauscheckeret al., 1997;Howard et al., 2000! and a general response preferencemulti-component signals~Rauscheckeret al., 1995!, consis-tent with spectral integration. Nonprimary auditory corticfields receiving the output of A1 may therefore be wsuited for extracting the pitch of complex sounds.
259et al.: Neural correlates of critical bandwidth in auditory cortex
kecs
coitculo
own
fam,r
enisicanBocs
des
n
65nreai-ayuofi
Al
anls
a-
o
s
ris-
itch
a
l-
ary
on-Am.
the
’ J.
-
l
s
tory
en-
.
oc.
-andr
, T.by
u-
V. SUMMARY AND CONCLUSIONS
MUA, CSD, and AEP components of responses evoby HCs with variablef 0s ~and thus variable interharmoniDFs! were examined in A1 of the awake monkey. We invetigated whether complex tone response amplitudes weresistent with a spatial representation of complex tone porthogonal to the tonotopic gradient, or whether they cobe explained by CB filtering mechanisms. Amplitudesnearly all response components increased withf 0, such thatmaximal responses were evoked by HCs consisting of lnumbered resolved harmonics. While complex tone respoamplitudes were largely invariant overDFs less than 10% othe center frequency, statistically significant increases inplitude generally occurred atDFs between 10% and 20%suggestive of CB-like behavior. Complex tone responsesflected nonlinear interactions between individual componresponses, in that they could not be predicted on the baspure tone frequency tuning characteristics of the cortsites. These findings based on neuronal ensemble respocorroborate results of both single-unit investigations of Crepresentation in A1 of the cat and human studies demstrating CB-like increases in the amplitude of middle-latencomponents of the scalp-recorded AEP. Dependence ofperficial intracortical AEP component amplitudes onDFsuggests that CB effects would be evident in AEPs recorfrom the scalp and that noninvasive recordings of responto complex sounds may therefore require a consideratiothese effects in their interpretation.
ACKNOWLEDGMENTS
This research was supported by Grant Nos. DC00and HD01799, and the Institute for the Study of Music aNeurologic Function of Beth Abraham Hospital. We agrateful to Dr. Steven Walkley, May Huang, LindO’Donnell, and Shirley Seto for providing excellent techncal, secretarial, and histological assistance. We also thDr. Haftan Eckholdt for statistical advice and two anonmous reviewers for their helpful comments on a previoversion of the manuscript. Submitted in partial fulfillmentthe requirements for the degree of Doctor of Philosophythe Sue Golding Graduate Division of Medical Sciences,bert Einstein College of Medicine, New York.
Arezzo, J. C., Vaughan, H. G., Jr., Kraut, M. A., Steinschneider, M.,Legatt, A. D.„1986…. ‘‘Intracranial generators of event-related potentiain the monkey,’’ inFrontiers of Clinical Neuroscience, Vol. 3, edited byR. Q. Cracco and I. Bodis-Wollner~Liss, New York!, pp. 174–189.
Bregman, A. S.~1990!. Auditory Scene Analysis: The Perceptual Organiztion of Sound~MIT, Cambridge, MA!.
Brosch, M., and Schreiner, C. E.~1997!. ‘‘Time course of forward maskingtuning curves in cat primary auditory cortex,’’ J. Neurophysiol.77, 923–943.
Burrows, D. L., and Barry, S. J.~1990!. ‘‘Electrophysiological evidence forthe critical band in humans: middle-latency responses,’’ J. Acoust. SAm. 88, 180–184.
Buunen, T. J. F., and Rhode, W. S.~1978!. ‘‘Responses of fibers in the cat’auditory nerve to the cubic difference tone,’’ J. Acoust. Soc. Am.64,772–781.
Calford, M. B., and Semple, M. N.~1995!. ‘‘Monaural inhibition in catauditory cortex,’’ J. Neurophysiol.73, 1876–1891.
260 J. Acoust. Soc. Am., Vol. 108, No. 1, July 2000 Fishman
d
-n-hdf
-se
-
e-toflses
n-yu-
desof
7d
nk-s
n-
d
c.
Calhoun, B. M., and Schreiner, C. E.~1998!. ‘‘Spectral envelope coding incat auditory cortex: linear and non-linear effects of stimulus charactetics,’’ Eur. J. Neurosci.10, 926–940.
Carlyon, R. P., and Shackleton, T. M.~1994!. ‘‘Comparing the fundamentalfrequencies of resolved and unresolved harmonics: evidence for two pmechanisms?’’ J. Acoust. Soc. Am.95, 3541–3554.
Cynx, J., and Shapiro, M.~1986!. ‘‘Perception of missing fundamental byspecies of songbird~Sturnus vulgaris),’’ J. Comp. Psych.100~4!, 356–360.
Ehret, G., and Merzenich, M. M.~1985!. ‘‘Auditory midbrain responsesparallel spectral integration phenomena,’’ Science227~4691!, 1245–1247
Ehret, G., and Merzenich, M. M.~1988!. ‘‘Complex sound analysis~fre-quency resolution, filtering and spectral integration! by single units of theinferior colliculus of the cat,’’ Brain Res. Rev.13, 139–163.
Ehret, G., and Schreiner, C. E.~1997!. ‘‘Frequency resolution and spectraintegration~critical band analysis! in single units of the cat primary auditory cortex,’’ J. Comp. Physiol. A181, 635–650.
Fastl, H., and Stoll, G.~1979!. ‘‘Scaling of pitch strength,’’ Hear. Res.1,293–301.
Fishman, Y. I., Reser, D. H., Arezzo, J. C., and Steinschneider, M.~1998!.‘‘Pitch versus spectral encoding of harmonic complex tones in primauditory cortex of the awake monkey,’’ Brain Res.786, 18–30.
Fishman, Y. I., Reser, D. H., Arezzo, J. C., and Steinschneider, M.~2000!.‘‘Compex tone processing in primary auditory cortex of the awake mkey. I. Neural ensemble correlates of roughness,’’ J. Acoust. Soc.108, 235–246.
Galaburda, A. M., and Sanides, F.~1980!. ‘‘Cytoarchitectronic organizationof the human auditory cortex,’’ J. Comp. Neurol.190, 597–610.
Galaburda, A. M., and Pandya, D. N.~1983!. ‘‘The intrinsic architectonicand connectional organization of the superior temporal region ofrhesus monkey,’’ J. Comp. Neurol.221, 169–184.
Glasberg, B. R., Moore, B. C. J., and Nimmo-Smith, I.~1984!. ‘‘Compari-son of auditory filter shapes derived with three different maskers,’Acoust. Soc. Am.75, 536–544.
Goldstein, J. L.~1967!. ‘‘Auditory nonlinearity,’’ J. Acoust. Soc. Am.41,676–689.
Goldstein, J. L.~1973!. ‘‘An optimum processor theory for the central formation of the pitch of complex tones,’’ J. Acoust. Soc. Am.54, 1496–1516.
Goldstein, J. L., and Kiang, N. Y. S.~1968!. ‘‘Neural correlates of the auracombination tone 2f 12 f 2,’’ Proc. IEEE56~6!, 981–992.
Gourevitch, G.„1970…. ‘‘Detectability of tones in quiet and in noise by ratand monkeys,’’ in Animal Psychophysics, edited by W. C. Stebbins~Appleton-Century-Crofts, New York!, pp. 67–97.
Green, D. M.~1965!. ‘‘Masking with two tones,’’ J. Acoust. Soc. Am.37,802–813.
Greenwood, D. D.~1961!. ‘‘Auditory masking and the critical band,’’ J.Acoust. Soc. Am.33, 484–502.
Hackett, T. A., Stepniewska, I., and Kaas, J. H.~1998!. ‘‘Subdivisions ofauditory cortex and ipsilateral cortical connections of the parabelt audicortex in macaque monkeys,’’ J. Comp. Neurol.394, 475–495.
Halgren, E., Marinkovic, K., and Chauvel, P.~1998!. ‘‘Generators of thelate cognitive potentials in auditory and visual oddball tasks,’’ Electrocephalogr. Clin. Neurophysiol.106, 156–164.
Hartmann, W. M.~1996!. ‘‘Pitch, periodicity, and auditory organization,’’ JAcoust. Soc. Am.100, 3491–3502.
Heffner, H., and Whitfield, I. C.~1976!. ‘‘Perception of the missing funda-mental by cats,’’ J. Acoust. Soc. Am.59, 915–919.
Houtsma, A. J. M., and Smurzynski, J.~1990!. ‘‘Pitch identification anddiscrimination for complex tones with many harmonics,’’ J. Acoust. SAm. 87, 304–310.
Howard, M. A., Volkov, I. O., Mirsky, R., Garell, P. C., Noh, M. D., Granner, M., Damasio, H., Steinschneider, M., Reale, R. A., Hind, J. E.,Brugge, J. F.~2000!. ‘‘Auditory cortex on the human posterior superiotemporal gyrus,’’ J. Comp. Neurol.416, 79–92.
Jones, E. G., Dell’anna, M. E., Molinari, M., Rausell, E., and Hashikawa~1995!. ‘‘Subdivisions of macaque monkey auditory cortex revealedcalcium-binding protein immunoreactivity,’’ J. Comp. Neurol.362, 153–170.
Kaas, J. H., and Hackett, T. A.~1998!. ‘‘Subdivisions of auditory cortex andlevels of processing in primates,’’ Audiol. Neuro-Otol.3, 73–85.
Kosaki, H., Hashikawa, T., He, J., and Jones, E. G.~1997!. ‘‘Tonotopicorganization of auditory cortical fields delineated by parvalbumin immnoreactivity in macaque monkeys,’’ J. Comp. Neurol.386, 304–316.
260et al.: Neural correlates of critical bandwidth in auditory cortex
o
di-
ic-
co
auinle
x,’
J.
st
qu
on
a
yn
ud
di
se
tor
ng,’’
.
.
r.
nce
rol.
t.
h
e
tory
d
ol.
lert
imi-
’ J.
, J.of
Soc.
. G.of
and
per-
rd,a-x,’’
son,
n-
Kowalski, N., Depireux, D. A., and Shamma, S. A.~1996!. ‘‘Analysis ofdynamic spectra in ferret primary auditory cortex. I. Characteristicssingle-unit responses to moving ripple spectra,’’ J. Neurophysiol.76,3503–3523.
Kubota, M., Sugimoto, S., Horikawa, J., Nasu, M., and Taniguchi, I.~1997!.‘‘Optical imaging of dynamic horizontal spread of excitation in rat autory cortex slices,’’ Neurosci. Lett.237~2–3!, 77–80.
Langner, G.~1997!. ‘‘Neural processing and the representation of periodity pitch,’’ Acta Otolaryngol.~Stockh! Suppl.532, 68–76.
Langner, G., Sams, M., Heil, P., and Schulze, H.~1997!. ‘‘Frequency andperiodicity are represented in orthogonal maps in the human auditorytex: evidence from magnetoencephalography,’’ J. Comp. Physiol. A181,665–676.
Langner, G., and Schreiner, C. E.~1988!. ‘‘Periodicity coding in the inferiorcolliculus of the cat. I. Neuronal Mechanisms,’’ J. Neurophysiol.60~6!,1799–1822.
Licklider, J. C. R.~1951!. ‘‘A duplex theory of pitch perception,’’ Experi-entia7, 128–134.
Licklider, J. C. R.„1956…. ‘‘Auditory frequency analysis,’’ inInformationTheory, edited by C. Cherry~Butterworth, London!, pp. 253–269.
Liegeois-Chauvel, C., Musolino, A., Badier, J. M., Marquis, P., and Chvel, P. ~1994!. ‘‘Evoked potentials recorded from the auditory cortexman: evaluation and topography of the middle latency components,’’ Etroencephalogr. Clin. Neurophysiol.92, 204–214.
Lutkenhoner, B., and Steinstrater, O.~1998!. ‘‘High-precision neuromag-netic study of the functional organization of the human auditory corteAudiol. Neuro-Otol.3, 191–213.
Matsubara, J. A., and Phillips, D. P.~1988!. ‘‘Intracortical connections andtheir physiological correlates in the primary auditory cortex~AI ! of thecat,’’ J. Comp. Neurol.268, 38–48.
Meddis, R., and Hewitt, M. J.~1991!. ‘‘Virtual pitch and phase sensitivity ofa computer model of the auditory periphery. I. Pitch identification,’’Acoust. Soc. Am.89, 2866–2882.
Meddis, R., and O’Mard, L.~1997!. ‘‘A unitory model of pitch perception,’’J. Acoust. Soc. Am.102, 1811–1820.
Moore, B. C. J.~1989!. An Introduction to the Psychology of Hearing, 3rded. ~Academic, London!.
Moore, B. C. J., and Glasberg, B. R.~1983!. ‘‘Suggested formulas for cal-culating auditory-filter bandwidths and excitation patterns,’’ J. AcouSoc. Am.74, 750–753.
Moore, B. C. J., and Ohgushi, K.~1993!. ‘‘Audibility of partials in inhar-monic complex tones,’’ J. Acoust. Soc. Am.93, 452–461.
Morel, A., Garraghty, P. E., and Kaas, J. H.~1993!. ‘‘Tonotopic organiza-tion, architechtonic fields and connections of auditory cortex in macamonkeys,’’ J. Comp. Neurol.355, 437–459.
Naatanen, R., and Picton, T.~1987!. ‘‘The N1 wave of the human electricand magnetic response to sound: a review and analysis of the compstructure,’’ Psychophysiology24~4!, 375–425.
Nelken, I., Prut, Y., Vaadia, E., and Abeles, M.~1994!. ‘‘Population re-sponses to multifrequency sounds in the cat auditory cortex: one-two-parameter families of sounds,’’ Hear. Res.72, 206–222.
Ojima, H., and He, J. F.~1997!. ‘‘Cortical convergence originating fromdomains representing different frequencies in the cat AI,’’ Acta Otolargol. Suppl.~Stockh! 532, 126–128.
Ojima, H., Honda, C. N., and Jones, E. G.~1991!. ‘‘Patterns of axon collat-eralization of identified supragranular pyramidal neurons in the cat atory cortex,’’ Cereb. Cortex1~1!, 80–94.
Ojima, H., Honda, C. N., and Jones, E. G.~1992!. ‘‘Characteristics of in-tracellularly injected infragranular pyramidal neurons in cat primary autory cortex,’’ Cereb. Cortex2~3!, 197–216.
Pantev, C., Hoke, M., Lutkenhoner, B., and Lehnertz, K.~1989!. ‘‘Tono-topic organization of the auditory cortex: pitch versus frequency repretation,’’ Science246, 486–488.
Pantev, C., Elbert, T., Ross, B., Eulitz, C., and Terhardt, E.~1996!. ‘‘Bin-aural fusion and the representation of virtual pitch in the human audicortex,’’ Hear. Res.100, 164–170.
Patterson, R. D.~1974!. ‘‘Auditory filter shape,’’ J. Acoust. Soc. Am.55,802–809.
Patterson, R. D., and Moore, B. C. J.~1986!. ‘‘Auditory filters and excita-tion patterns as representations of frequency resolution,’’ inFrequencySelectivity in Hearing,edited by B. C. J. Moore~Academic, London!, pp.123–177.
Phillips, D. P., and Hall, S. E.~1992!. ‘‘Multiplicity of inputs in the afferent
261 J. Acoust. Soc. Am., Vol. 108, No. 1, July 2000 Fishman
f
r-
-
c-
’
.
e
ent
nd
-
i-
-
n-
y
path to cat auditory cortex neurons revealed by tone-on-tone maskiCereb. Cortex2, 425–433.
Pickles, J. O., and Comis, S. D.~1976!. ‘‘Auditory nerve-filter bandwidthsand critical bandwidths in the cat,’’ J. Acoust. Soc. Am.60, 1151–1156.
Plomp, R.~1964!. ‘‘The ear as a frequency analyzer,’’ J. Acoust. Soc. Am36, 1628–1636.
Plomp, R. ~1965!. ‘‘Detectability threshold for combination tones,’’ JAcoust. Soc. Am.37, 1110–1123.
Plomp, R. ~1967!. ‘‘Pitch of complex tones,’’ J. Acoust. Soc. Am.41,1526–1533.
Plomp, R., and Mimpen, A. M.~1968!. ‘‘The ear as a frequency analyzeII,’’ J. Acoust. Soc. Am.43, 764–767.
Rabinowitz, W. M., Bilger, R. C., Trahiotis, C., and Nuetzel, J.~1980!.‘‘Two-tone masking in normal hearing listeners,’’ J. Acoust. Soc. Am.68,1096–1106.
Rauschecker, J. P., Tian, B., and Hauser, M.~1995!. ‘‘Processing of com-plex sounds in the macaque nonprimary auditory cortex,’’ Scie268~5207!, 111–114.
Rauschecker, J. P., Tian, B., Pons, T., and Mishkin, M.~1997!. ‘‘Serial andparallel processing in rhesus monkey auditory cortex,’’ J. Comp. Neu382~1!, 89–103.
Ritsma, R. J.~1962!. ‘‘Existence region of the tonal residue. I,’’ J. AcousSoc. Am.34, 1224–1229.
Ritsma, R. J.~1967!. ‘‘Frequencies dominant in the perception of the pitcof complex sounds,’’ J. Acoust. Soc. Am.42, 191–198.
Rouiller, E. M., Simm, G. M., Villa, A. E. P., de Ribaupierre, Y., and dRibaupierre, F.~1991!. ‘‘Auditory cortico-cortical interconnections in thecat: evidence for parallel and hierarchical arrangement of the audicortical areas,’’ Exp. Brain Res.86, 483–505.
Sachs, M. B., and Kiang, N. Y.-S.~1968!. ‘‘Two-tone inhibition in auditory-nerve fibers,’’ J. Acoust. Soc. Am.43, 1120–1128.
Schreiner, C. E.~1998!. ‘‘Spatial distribution of responses to simple ancomplex sounds in the primary auditory cortex,’’ Audiol. Neuro-Otol.3,104–122.
Schreiner, C. E., and Langner, G.~1988!. ‘‘Periodicity coding in the inferiorcolliculus of the cat. II. Topographical organization,’’ J. Neurophysi60~6!, 1823–1840.
Schulze, H., and Langner, G.~1997!. ‘‘Periodicity coding in the primaryauditory cortex of the Mongolian gerbil~Meriones unguiculatus!: two dif-ferent coding strategies for pitch and rhythm?’’ J. Comp. Physiol. A181,651–663.
Schwarz, D. W. F., and Tomlinson, R. W. W.~1990!. ‘‘Spectral responsepatterns of auditory cortex neurons to harmonic complex tones in amonkey~Macaca mulatta!,’’ J. Neurophysiol.64, 282–298.
Shackleton, T. M., and Carlyon, R. P.~1994!. ‘‘Role of resolved and unre-solved harmonics in pitch perception and frequency modulation discrnation,’’ J. Acoust. Soc. Am.95, 3529–3540.
Shamma, S. A., and Symmes, D.~1985!. ‘‘Patterns of inhibition in auditorycortical cells in awake squirrel monkeys,’’ Hear. Res.19, 1–13.
Shamma, S. A., Fleshman, J. W., Wiser, P. R., and Versnel, H.~1993!.‘‘Organization of response areas in ferret primary auditory complex,’Neurophysiol.69~2!, 367–383.
Smoorenburg, G. F.~1972!. ‘‘Audibility region of combination tones,’’ J.Acoust. Soc. Am.52, 603–614.
Smoorenburg, G. F., Gibson, M. M., Kitzes, L. M., Rose, J. E., and HindE. ~1976!. ‘‘Correlates of combination tones observed in the responseneurons in the anteroventral cochlear nucleus of the cat,’’ J. Acoust.Am. 59, 945–962.
Steinschneider, M., Schroeder, C. E., Arezzo, J. C., and Vaughan, Jr., H~1994!. ‘‘Speech-evoked activity in primary auditory cortex: effectsvoice onset time,’’ Electroencephalogr. Clin. Neurophysiol.92, 30–43.
Steinschneider, M., Reser, D. H., Fishman, Y. I., Schroeder, C. E.,Arezzo, J. C.~1998!. ‘‘Click train encoding in primary auditory cortex ofthe awake monkey: evidence for two mechanisms subserving pitchception,’’ J. Acoust. Soc. Am.104, 2935–2955.
Steinschneider, M., Volkov, I. O., Noh, M. D., Garell, P. C., and HowaM. A. ~1999!. ‘‘Temporal encoding of the voice onset time phonetic prameter by field potentials recorded directly from human auditory corteJ. Neurophysiol.82~5!, 2346–2357.
Steinschneider, M., Tenke, C. E., Schroeder, C. E., Javitt, D. C., SimpG. V., Arezzo, J. C., and Vaughan, Jr., H. G.~1992!. ‘‘Cellular generatorsof the cortical auditory evoked potential initial component,’’ Electroecephalogr. Clin. Neurophysiol.84, 196–200.
261et al.: Neural correlates of critical bandwidth in auditory cortex
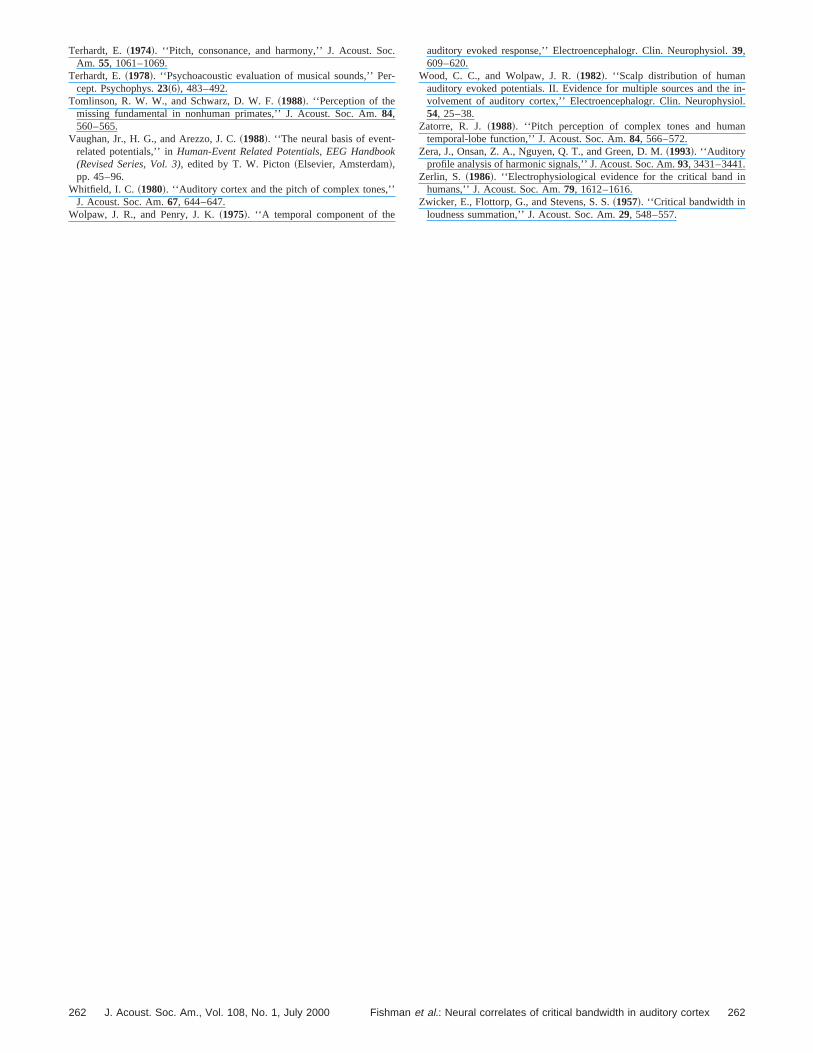
c.
r-
ok
’
in-ol.
n
n
Terhardt, E.~1974!. ‘‘Pitch, consonance, and harmony,’’ J. Acoust. SoAm. 55, 1061–1069.
Terhardt, E.~1978!. ‘‘Psychoacoustic evaluation of musical sounds,’’ Pecept. Psychophys.23~6!, 483–492.
Tomlinson, R. W. W., and Schwarz, D. W. F.~1988!. ‘‘Perception of themissing fundamental in nonhuman primates,’’ J. Acoust. Soc. Am.84,560–565.
Vaughan, Jr., H. G., and Arezzo, J. C.~1988!. ‘‘The neural basis of event-related potentials,’’ inHuman-Event Related Potentials, EEG Handbo(Revised Series, Vol. 3), edited by T. W. Picton~Elsevier, Amsterdam!,pp. 45–96.
Whitfield, I. C. ~1980!. ‘‘Auditory cortex and the pitch of complex tones,’J. Acoust. Soc. Am.67, 644–647.
Wolpaw, J. R., and Penry, J. K.~1975!. ‘‘A temporal component of the
262 J. Acoust. Soc. Am., Vol. 108, No. 1, July 2000 Fishman
auditory evoked response,’’ Electroencephalogr. Clin. Neurophysiol.39,609–620.
Wood, C. C., and Wolpaw, J. R.~1982!. ‘‘Scalp distribution of humanauditory evoked potentials. II. Evidence for multiple sources and thevolvement of auditory cortex,’’ Electroencephalogr. Clin. Neurophysi54, 25–38.
Zatorre, R. J.~1988!. ‘‘Pitch perception of complex tones and humatemporal-lobe function,’’ J. Acoust. Soc. Am.84, 566–572.
Zera, J., Onsan, Z. A., Nguyen, Q. T., and Green, D. M.~1993!. ‘‘Auditoryprofile analysis of harmonic signals,’’ J. Acoust. Soc. Am.93, 3431–3441.
Zerlin, S. ~1986!. ‘‘Electrophysiological evidence for the critical band ihumans,’’ J. Acoust. Soc. Am.79, 1612–1616.
Zwicker, E., Flottorp, G., and Stevens, S. S.~1957!. ‘‘Critical bandwidth inloudness summation,’’ J. Acoust. Soc. Am.29, 548–557.
262et al.: Neural correlates of critical bandwidth in auditory cortex
Copyright © 2022 FDOKUMEN