Tone nucleus modeling for Chinese lexical tone recognition
20
Tone nucleus modeling for Chinese lexical tone recognition Jinsong Zhang * ,1 , Keikichi Hirose Department of Information and Communication Engineering, School of Engineering, University of Tokyo, Bunkyo-ku, Tokyo 113-8656, Japan Received 20 October 2003; received in revised form 20 October 2003; accepted 8 January 2004 Abstract This paper presents a new scheme to deal with variations in fundamental frequency (F0) contours for lexical tone recognition in continuous Chinese speech. We divide F0 contour of a syllable into tone nucleus and adjacent articu- latory transitions. We only use acoustic features of the tone nucleus for tone recognition. Tone nucleus of a syllable is assumed to be the target F0 of the associated lexical tone, and usually conforms more likely to the standard tone pattern than the articulatory transitions. A tone nucleus can be detected from a syllable F0 contour by a two-step algorithm. First, the syllable F0 contour is segmented into several linear F0 loci that serve as candidates for the tone-nucleus using segmental K-means segmentation algorithm. Then, tone nucleus is chosen from a set of candidates by a predictor based on linear discriminant analysis. Speaker dependent tone recognition experiments using tonal HMMs showed our new approach achieved an improvement of up to 6% for tone recognition rate compared with a conventional one. This indicates not only that tone-nucleus keeps important discriminant information for the lexical tones, but also that our tone-nucleus based tone recognition algorithm works properly. Ó 2004 Elsevier B.V. All rights reserved. Keywords: Tone recognition; Underlying-target; Articulatory transition; Tone-nucleus 1. Introduction Chinese (Mandarin or Standard Chinese) is a well-known tonal language in which pitch tones play important phonemic roles. Each syllable in Chinese corresponds to a morpheme (ideographic character) and is associated with a pitch tone (usually referred to as lexical tone). Phonemically, a syllable is divided into two parts: an Initial and a Final. An Initial can be a consonant or none. A Final may be a vowel, a diphthong, or a triph- thong and with an optional nasal ending. There are four basic lexical tones (referred to as Tones 1, 2, 3, 4, respectively) and a neutral tone. The four basic lexical tones are characterized by their per- ceptually distinctive pitch patterns which are conventionally called by linguists as: high-level, high-rising, low-dipping and high-falling tones (Chao, 1968, pp. 25–26). The neutral tone, according to (Chao, 1968), does not have any specific pitch pattern, and is highly dependent on the preceding tone and usually perceived to be * Corresponding author. Present address: ATR Spoken Language Translation Laboratories, 2-2-2 Kansai Science City, Kyoto 619-0288, Japan. Tel.: +81-774-95-1314; fax: +81-774- 95-1308. E-mail address: [email protected] (J. Zhang). 1 This work was done when the author was affiliated with the University of Tokyo. 0167-6393/$ - see front matter Ó 2004 Elsevier B.V. All rights reserved. doi:10.1016/j.specom.2004.01.001 Speech Communication 42 (2004) 447–466 www.elsevier.com/locate/specom
Transcript of Tone nucleus modeling for Chinese lexical tone recognition
Speech Communication 42 (2004) 447–466
www.elsevier.com/locate/specom
Tone nucleus modeling for Chinese lexical tone recognition
Jinsong Zhang *,1, Keikichi Hirose
Department of Information and Communication Engineering, School of Engineering, University of Tokyo,
Bunkyo-ku, Tokyo 113-8656, Japan
Received 20 October 2003; received in revised form 20 October 2003; accepted 8 January 2004
Abstract
This paper presents a new scheme to deal with variations in fundamental frequency (F0) contours for lexical tone
recognition in continuous Chinese speech. We divide F0 contour of a syllable into tone nucleus and adjacent articu-
latory transitions. We only use acoustic features of the tone nucleus for tone recognition. Tone nucleus of a syllable is
assumed to be the target F0 of the associated lexical tone, and usually conforms more likely to the standard tone pattern
than the articulatory transitions. A tone nucleus can be detected from a syllable F0 contour by a two-step algorithm.
First, the syllable F0 contour is segmented into several linear F0 loci that serve as candidates for the tone-nucleus using
segmental K-means segmentation algorithm. Then, tone nucleus is chosen from a set of candidates by a predictor based
on linear discriminant analysis. Speaker dependent tone recognition experiments using tonal HMMs showed our new
approach achieved an improvement of up to 6% for tone recognition rate compared with a conventional one. This
indicates not only that tone-nucleus keeps important discriminant information for the lexical tones, but also that our
tone-nucleus based tone recognition algorithm works properly.
� 2004 Elsevier B.V. All rights reserved.
Keywords: Tone recognition; Underlying-target; Articulatory transition; Tone-nucleus
1. Introduction
Chinese (Mandarin or Standard Chinese) is a
well-known tonal language in which pitch tones
play important phonemic roles. Each syllable in
Chinese corresponds to a morpheme (ideographic
character) and is associated with a pitch tone
*Corresponding author. Present address: ATR Spoken
Language Translation Laboratories, 2-2-2 Kansai Science City,
Kyoto 619-0288, Japan. Tel.: +81-774-95-1314; fax: +81-774-
95-1308.
E-mail address: [email protected] (J. Zhang).1 This work was done when the author was affiliated with the
University of Tokyo.
0167-6393/$ - see front matter � 2004 Elsevier B.V. All rights reserv
doi:10.1016/j.specom.2004.01.001
(usually referred to as lexical tone). Phonemically,
a syllable is divided into two parts: an Initial and a
Final. An Initial can be a consonant or none. A
Final may be a vowel, a diphthong, or a triph-
thong and with an optional nasal ending. There
are four basic lexical tones (referred to as Tones 1,
2, 3, 4, respectively) and a neutral tone. The four
basic lexical tones are characterized by their per-ceptually distinctive pitch patterns which are
conventionally called by linguists as: high-level,
high-rising, low-dipping and high-falling tones
(Chao, 1968, pp. 25–26). The neutral tone,
according to (Chao, 1968), does not have any
specific pitch pattern, and is highly dependent on
the preceding tone and usually perceived to be
ed.

448 J. Zhang, K. Hirose / Speech Communication 42 (2004) 447–466
temporally short and zero pitch range [p. 35].
There are only a very small number of morphemes,
such as suffixes and particles, which are always
uttered in the neutral tone [p. 36]. Fundamentalfrequency (hence F0) contours are the main
acoustic manifestations of pitch tones, and there
seem to be distinctive F0 patterns associated with
the four basic lexical tones as illustrated in Fig. 1.
There are a number of reasons for recognizing
lexical tones using F0 contours. First, while the
total number of phonetically differentiated sylla-
bles in Chinese is about 1282 (Cheng and Wang,1990, p. 45), the number of base syllables, where
only differences in segmental features are con-
tained ignoring those of lexical tones, is only 412.
This means there exist a number of homophone
morphemes in Chinese. Tone recognition offers a
method to discriminate homophone words. Sec-
ond, automatic detection of intonation structure
such as prosodic phrase boundaries, focus, stresslocations, etc. is attracting more and more atten-
tions recently (Wightman and Ostendorf, 1994;
Niemann et al., 1998; Hirose and Iwano, 1999;
Stolcke et al., 1999). This is because it probably
offers an answer to problems residing in sponta-
neous speech like ungrammatical utterances, dis-
fluencies, syntax ambiguities, etc. Similar to the
lexical tones, the intonation structure is alsoacoustically manifested mainly through F0 con-
tours (Fujisaki, 1997). The interplay effects result
in so complex sentential F0 variations that those
F0 cues for intonation structure cannot be clarified
unless those due to the lexical tones are known
F0
Time
Tone 1
Tone 2
Tone 3 Tone 4
Fig. 1. Standard distinctive F0 patterns of the four basic lexical
tones.
(Xu, 1997a). Therefore study on tone recognition
from F0 contours is the first and unavoidable step
in incorporating intonation information process-
ing into Chinese spoken dialogue systems. Third,tone recognition is helpful for developing auto-
matic prosodic labeling system for Chinese speech.
A prosodically labeled database is useful for
prosody analyses and development of data-driven
text-to-speech (TTS) systems (Wightman and Os-
tendorf, 1994). Since syllable tones often change
from their original types in the dictionary due to
various factors such as tone neutralization, mor-phophonemic tone sandhi (Chao, 1968), speaker�sdialect, grammatical structure (Shih, 1990) and
etc., it is necessary to recognize and label the syl-
lable tones according to their real tonalities. An
automatic tone recognizer is preferred because
human labeling is time consuming and expensive.
Fourth, tone recognition is crucial to set up com-
puter aided language learning (CALL) systems forforeigners learning Chinese. Pronouncing lexical
tones is rather difficult for people of non-tonal
languages, where pitch tones usually express dif-
ferent stress or intonation patterns instead of dif-
ferentiation of lexical meanings. Tone recognizer
may offer a diagnosis of a learner�s pronunciation,and show the learner the way to correct his (her)
pitch features. Finally, besides the above men-tioned reasons, there are still many other reasons
of tone recognition such as to improve digit rec-
ognition performance (Wang and Seneff, 1998). In
this paper, we propose a new tone recognition
method, which not only offers a systematic way of
dealing with F0 variations for tone recognition,
but may also help to detect sentential intonation
structure.Previous studies have shown that it is easy to
recognize lexical tones in isolated speech (Yang
et al., 1988; Le et al., 1993), but rather difficult to
recognize them from F0 contours of continuous
speech (Wang et al., 1997; Liu et al., 1999). This
different performances can be ascribed to the rea-
son that the lexical tones show consistent tonal F0
patterns when uttered in isolation, but showcomplex variations in continuous speech. The
complex F0 variations originate from the me-
chanic-physiological realization of the compound
intonation functions including the lexical tones

J. Zhang, K. Hirose / Speech Communication 42 (2004) 447–466 449
and sentential intonation structure (Xu and Wang,
2001). On the one hand, confounded nature of
information in F0 contours may obscure the F0
variation cueing lexical tones. For example, focusis usually related to F0-range-expansion of focused
words that are not in the final position of an
utterance and F0-range-suppression of post-focus
words. When a Tone 1 is related to a focus, whose
F0 contour usually shows high and flat pattern,
may change into a rising or falling shape (Xu,
1999). On the other hand, F0 contours, which re-
flect the periods of the successive human vocalcords� vibrations, are to vary due to articulatoryconstraints. For example, voiced or unvoiced syl-
lable initial segments may lead to quite different
syllable F0 contours even when the lexical tones
are the same (Howie, 1974). The inertial charac-
teristic of the bio-mechanical vibrations makes the
neighboring tones interfere with each other exten-
sively so that early portion of a syllable F0 contourtends to vary according to the carryover effect of
the preceding tone (Xu, 1999).
In order to cope with F0 variations in tone
recognition, some researchers attempted to devel-
op prosody models for intonation functions and
articulatory constraints. However, these attempts
usually modeled only a few specific F0 variations,
thus were lack in generality. Wang et al. (1990)proposed to use the accent command coefficients
of a well-known F0 contour generation model
(Fujisaki and Hirose, 1984) to recognize lexical
tones, assuming prosodic phrasing effects could be
modeled by the phrase command coefficients of the
model. In (Wang and Chen, 1994), Wang and
Chen utilized prosodic phrasing information ex-
tracted from text transcripts to aid tone recogni-tion. A disadvantage of these approaches is that
the assumed prosody information is usually un-
available in a speech recognition system. It is ra-
ther difficult to decompose a Chinese sentential F0
contour into the phrase and accent components of
the generation model without human interference.
And the text transcripts are usually the purpose of
tone recognition except in a database labelingsystem. In (Chen and Wang, 1995), Chen and
Wang investigated to model the sentential into-
nation patterns like declarative or interrogative
utterances by five different states of a neural net.
Wang et al. (1997) adopted context-dependent
HMM models to model coarticulation effects be-
tween neighboring lexical tones. Problems associ-
ated with these attempts are that intonationpatterns and coarticulation effects in continuous
speech are usually much more complex than that
the proposals can model. Thus the proposals did
not show to be very efficient, and performance
improvement was limited: only about 1–2% in-
crease of tone recognition rates. Furthermore, due
to a lack of systematic linguistic considerations,
the above approaches showed to be difficult to befurther improved or extended to detect sentential
intonation structure.
Our study reported in this paper is quite dif-
ferent from the conventional ones mentioned
above. The basic difference lies in that we classify a
syllable F0 contour into segments of underlying
target and articulatory transitions, and only use
acoustic features of the segment of underlyingtarget for tone recognition, whereas nearly all the
conventional approaches used acoustic features of
a whole syllable for tone recognition. The proposal
is also different from the main vowel based ap-
proach by us in (Zhang and Hirose, 1998) and by
Chen in (Chen et al., 2001), in that it does not
assume a consistent alignment between the seg-
mental phones and tonalities. Thus offers a sys-tematic approach to deal with F0 variations
resulting from various factors, such as voiced/un-
voiced syllable initials, coarticulation effects be-
tween neighboring tones, sentential intonation
structure. Although the extracted F0 segments
have potential importance for detection of sen-
tential intonation structure, this paper only pre-
sents their application to tone recognition, leavingother issues for further studies.
The rest of this paper is organized as follows.
Section 2 introduces the representation of syllable
F0 variations by a proposed F0 segmental struc-
ture model (referred to as tone-nucleus model), in
which each syllable F0 contour is divided into tone
nucleus and articulatory transitions. The model is
originated in linguistic studies and shows to beconsistent with diverse linguistic findings. Section
3 gives a general description about the tone rec-
ognition system and the speech database used in
the study. Section 4 addresses the statistical means

450 J. Zhang, K. Hirose / Speech Communication 42 (2004) 447–466
to extract the tone nucleus from a syllable F0
contour, based on segmental K-means segmenta-
tion algorithm (Rabiner and Juang, 1993, pp. 382)
and linear discriminant analysis (LDA). Section 5evaluates the application of proposals through
tone recognition experiments on the continuous
speech database. Finally we conclude in Section 6.
2. Segmental representation of syllable F0 varia-
tions
A consistent account of F0 variations in a syl-
lable F0 contour in various phonetic contexts
is desired for the development of a systematic
method to deal with F0 variations for tone rec-
ognition. Based on a survey on linguistic findings,
we proposed a F0 segmental structure model
which divides a syllable F0 contour into under-
lying target and articulatory transitions, and as-sumes no direct relations between the F0 segments
with the internal structure of a syllable. This pro-
posal results from the continuing convergence of
observations on one basic issue:
• Lexical tone is not evenly distributed in a sylla-
ble.
2.1. Underlying target and articulatory transition
By observation and comparison of isolatedtonal F0 contours of syllables with different seg-
mental structures, especially between those with
voiced and unvoiced syllable initials, Howie (1974)
concluded that the domain of a syllable tone in
Chinese does not spread to the entire voiced part
or the entire vocalic part of the syllable, but rather
is confined to the rhyming part of the syllable
including the vowel and its succeeding voicedsegment [p. 147]. In (Rose, 1988), Rose suggested
that the perceptually valid F0 contour should not
include the period corresponding to the articula-
tory transition between two syllables. Shih (1988)
proposed that different tones have different align-
ments with the syllable: some starting from the
rhyme onset (Tones 1 and 3), but others starting
later, even from the middle of the rhyme (Tone 2).In (Whalen and Xu, 1992), the authors tried to
examine the critical information for tone percep-
tion by extracting small segments from a syllable,
and the experimental results led the authors to
conclude that not every portion of the F0 contourindicates the original tone [p. 25]. Also through
perceptual experiments using stimuli sliced from a
number of isolated syllables, Lin (1995) assumed
that a Chinese tone in isolation is mainly related to
the syllabic vowel and its adjacent transitions,
whereas neither initial consonants and glides nor
final nasals play any tone-carrying roles. Based on
statistical results, Xu and Wang (2001) revealedthat there should be no direct relations between
the segmental structure of a syllable and the tonal
contour, but suggested that the early portion of an
F0 contour always varies with the ending F0 of the
preceding syllable, whereas the later portion con-
verges to the contour that seems to conform to the
purported underlying pitch values.
Although there still exist some differences in theabove-mentioned views, those studies, together
with a number of ones unmentioned here, seem to
converge to one point: a portion of a syllable F0
contour looks to conform to the underlying pitch
better than other portions. If we ignore the issue of
alignment of F0 contour with segmental units,
which received rather diverse views in the litera-
ture, we can reach a general agreement on the factthat tone information is not evenly distributed in a
syllable F0 contour: some segment of a syllable F0
contour may carry more tone information than
other ones. Therefore, we can classify a syllable F0
contour into underlying target and articulatory
transitions:
• Underlying target represents the F0 target andserves as the main acoustic cue for pitch percep-
tion.
• Articulatory transitions are the F0 variations
occurring as the transitions to or from the pitch
targets.
2.2. Tone nucleus model
After arriving at a view that a syllable F0
contour could be divided into underlying target
and articulatory transitions, we proposed a F0segmental structure model of Chinese syllable F0

Table 1
Pitch target features of the four lexical tones
Targets Tone 1 Tone 2 Tone 3 Tone 4
Onset H L L H
Offset H H L L
‘‘H’’, ‘‘L’’ depict high and low targets, respectively.
F0Tone 1
Tone 4
J. Zhang, K. Hirose / Speech Communication 42 (2004) 447–466 451
contours (referred to as tone nucleus model) which
gave a systematic view of variations in a syllable
F0 contour.
As illustrated in Fig. 2, a syllable F0 contourmay be divided into three segments: onset course,
tone nucleus and offset course. Tone nucleus rep-
resents the underlying pitch targets and is obliga-
tory, the onset and the offset courses are the
articulatory transitions and optional. Each F0
segment usually exhibits an asymptotically linear
curve (Xu and Wang, 2001), and one syllable F0
should contain no more than three F0 segmentswith quite different slopes. Based on previous
studies (Xu, 1998), we assume that there should be
no consistent relations between the F0 segmental
structure and the syllable internal structure, but
tone nucleus should reside in the Final portion of a
Chinese syllable.
• Tone nucleus: a portion of F0 contour that rep-resents pitch targets of the lexical tone. It is the
segment containing the most critical informa-
tion for tonality perception, thus called as the
tone-critical segment.
• Onset course: the asymptotic F0 transition
locus to the tone-onset target from a preceding
vocal cords� vibration state.• Offset course: the F0 transition locus from thetone-offset target to a succeeding vocal cords�vibration state.
Tone-onset target and tone-offset target indi-
cate the pitch values, which takes either low (L) or
high (H) value, at the tone onset and offset,
respectively. These pitch values serve as distinctive
Sub-syllabic F0 segments
(1) 2 (3)
Tone onset Tone offset
(Onset course) Tone nucleus (Offset course)
Syllable F0 contour
Fig. 2. Illustrations of the proposed F0 segmental structure
model of Chinese syllable F0 contours. F0 segments in paren-
theses are optional; only the tone nucleus is obligatory.
features characterizing the four basic lexical tones(Table 1) (Xu, 1997b).
Fig. 3 illustrates some frequently observed tonal
F0 variations in continuous speech. Although they
show great deviations from the standard F0 pat-
terns in Fig. 1, we can see that, from the view of
tone nucleus model, the tone nuclei delimited by
the vertical sticks still show the consistent patterns
with the underlying pitch targets, and F0 variationsin the beginning and ending portions of a syllable
belong to articulatory transitions.
Among the four basic lexical tones, Tone 3 is
different from the other three tones, in that the
others are associated with rather stable F0 pat-
terns, i.e. Tone 1 with high and flat F0, Tone 2 with
rising F0 and Tone 4 with falling F0 (hence con-
touricity) (Rose, 1988), whereas Tone 3 is foundwith rather wide variety of F0 patterns. Tone 3 was
conventionally associated with a dipping F0 con-
tour (Chao, 1968, p. 26), but other studies have
shown that the final rise seen is usually absent in
Time
c c c
Tone 2
1 2 3
Fig. 3. Illustration of tonal F0 contours with possible articu-
latory transitions for Tones 1, 2 and 4. The left and right ver-
tical sticks in each contour correspond to the possible tone
onset and offset locations, and the medium F0 segment delim-
ited by the tone onset and offset in each contour represents
tone-nucleus of the tone. c1, c2 and c3 depict the onset courses,the tone-nuclei and the offset courses.

time
F0A
B
C
time
F0A
B
C
(a) (b)
Fig. 4. Illustrations of F0 contours of continua of ‘‘Tone 2 Tone 2’’, with a contrast of voiced initial segment (a) and unvoiced initial
segment (b) in the second syllables. The thin vertical lines indicate the syllable boundaries.
452 J. Zhang, K. Hirose / Speech Communication 42 (2004) 447–466
non-prepausal positions (Xu, 1997b). Therefore,
view about the tone nucleus of Tone 3 may beflexible: either the whole syllable F0 or the falling
segment may be considered as tone nucleus.
2.3. Systematic framework to deal with F0 varia-
tions
Through F0 observations it was found that an
articulatory F0 transition may occupy a largeportion of a syllable F0 contour: 30% in (Howie,
1974), 50–100 ms after the release of the initial
consonant in (Rose, 1988, p. 76) (accounting for
about 40% proportion in the given example [p.
65]), and more than 50% when the rising tone
starting from the middle of the rhyme (Shih, 1988).
Although the substantial F0 variations in articu-
latory transitions exert very few influences onhuman pitch perception, they may confuse an
automatic tone recognizer.
Tone-nucleus model offers a possible systematic
framework to deal with F0 variations that result
from both articulatory constraints and con-
founded intonation functions, for tone recognition
and intonation function detection. Here, we illus-
trate briefly the possible ways to deal with thesubstantial F0 variations due to the following
factors 2 for tone recognition:
(1) Voiced/unvoiced syllable initial segments.
(2) Prosodic phrase boundary.
(3) Focus.
2 There are more other factors such as fast speaking rate that
may lead to significant F0 variations.
2.3.1. Voiced/unvoiced syllable initial segments
Fig. 4 illustrates F0 contours of two continuaof ‘‘Tone 2 Tone 2’’. Due to the voicing (or not) on
the initial segment of the second syllables, F0
contours of the second syllables in the two con-
tinua differ greatly. Since conventional tone rec-
ognizers based on hidden Markov modes (HMMs)
or neural net usually take whole syllable F0 con-
tours as important acoustic cues for the lexical
tones (Wang et al., 1997; Chen and Wang, 1995),such a difference due to voiced and unvoiced syl-
lable initial segments may not only affect the
training of tonal acoustic models, but also easily
lead to recognition errors. The F0 contour of the
second syllable in (a) of Fig. 4 has a dipping shape
like that of Tone 3, and tends to be mis-recognized
as Tone 3. However, according to the tone-nucleus
model, F0 loci ‘‘BC’’ in (a) and (b) of Fig. 4 are thetone nuclei, whereas the F0 locus ‘‘AB’’ in (a) is an
articulatory transition. If the articulatory transi-
tion is ignored in tone recognition, the above
problems may be avoided.
2.3.2. Prosodic phrase boundary
Prosodic phrasing refers to the perceived
groupings of words in speech, and it was suggested
(Zhang and Kawanami, 1999) to have influenceson the laryngeal coarticulatory overlap during
tone production. Although this issue is still lack of
a systematic study, it was found that when there is
a prosodic boundary between two neighboring
tones, F0 contour of the second syllable is usually
free from coarticulation effect from the first sylla-
ble. Given a continuum of Tones 4 and 1, ‘‘H’’
targets in Tone 1 are usually rather lower than thatof the ‘‘H’’ target in the preceding Tone 4 mainly

time
F0
h1
Focus
h2BA
C D
E F
Fig. 6. Illustration of a typical F0 contour for a continuum
‘‘Tone 1 Tone 1 Tone 1’’, with a focus placed on the second
Tone 1 syllable.
J. Zhang, K. Hirose / Speech Communication 42 (2004) 447–466 453
due to the carryover lowering effect from the ‘‘L’’
offset target of Tone 4 (Xu and Wang, 2001) when
the two tones are in one word. But when there
exists a prosodic boundary (such as a phraseboundary) between the two tones, the carryover
lowering effect may be stopped and the ‘‘H’’ tar-
gets of Tone 1 are raised to a higher position, as
illustrated in Fig. 5. This often results in a sub-
stantial rising transition F0 locus ‘‘CD’’ to the
‘‘H’’ targets of Tone 1. However, based on the
tone-nucleus model, the rising ‘‘CD’’ F0 locus is an
articulatory transition, and the tone information ismainly carried by the tone nucleus ‘‘DE’’ whose
shape still conforms to the underlying pitch tar-
gets. Furthermore, if the tone nuclei ‘‘AB’’ and
‘‘DE’’ of the two tones can be detected, then the
F0 range reset h of the Tone 1 will be an importantcue for detecting the prosodic phrasing boundary,
which is very useful in developing spontaneous
speech recognition and understanding systems(Niemann et al., 1998).
2.3.3. Focus
Sentential focus may also bring about sub-
stantial F0 variations to syllable F0 contours.
According to Xu (1999), focus is related with threedistinct pitch ranges: expanded range in non-sen-
tence-final focused words, suppressed in post-focus
words, and neutral in all other words. Fig. 6
illustrates this idea through a continuum of three
Tone 1s with a focus on the second Tone 1. We can
see that the focus lead to a substantial rising and a
falling F0 loci in the early portions of F0 contours
of the second and the third syllable respectively.These kinds of F0 loci are regarded as articulatory
transitions according to the tone-nucleus model,
whereas the segments ‘‘AB’’, ‘‘CD’’ and ‘‘EF’’ are
time
F0A
B C
hD
E
Fig. 5. Illustration of an F0 contour of a continuum of ‘‘Tone 4
Tone 1’’, with an prosodic phrase boundary between them.
the tone nuclei of the three Tone 1s. Compared
with the whole syllable F0 contours, the tone
nuclei show more consistent patterns with the
underlying pitch targets. Also, if the three tone
nuclei can be detected, the range differences rep-
resented by h1 and h2 are estimated as the gapsbetween the preceding tone offsets and succeeding
tone onsets of neighboring tone nuclei. These
range differences may serve as acoustic cues for
focus detection, which is important for interpret-
ing the speaker�s intention for developing sponta-neous dialogue systems.
2.3.4. Tone recognition based on tone nuclei
After the above discussions, we can see that
tone recognition may not be affected by the artic-
ulatory transitions by taking only the tone nuclei
into account. Obviously, segmenting a syllable F0
contour into possible tone nucleus and articula-
tory transitions is the prerequisite for this tone
recognition scheme. Since the tone nucleus issuggested residing in a syllable Final, with the
segmentation of Initial and Final assumed avail-
able from a phoneme recognition process, we
focused on the Final portion to detect the tone
nucleus.
3. System overview and speech database
Having explored the linguistic foundations of
our tone recognition algorithm, we now give an
overview of the basic architecture of the tone rec-
ognition system, as illustrated in Fig. 7. With the
aid of phonetic segmentation of Initial consonantsand Finals which are assumed available from a

Table 2
Token numbers of each tone in the training and testing data set
Data set Tone
1
Tone
2
Tone
3
Tone
4
Neutral
tone
Total
Training 1138 1137 1004 2954 186 6419
Testing 473 430 391 1115 158 2567
TonalHMMs
Tone NucleusDetection
Final' F0Extraction
AcousticMatching
RecognizedLexical Tones
PhoneticSegmentation
F0, EnergyFeatures
DiscriminationCoefficients
+
Tonenuclei
Fig. 7. Block diagram for the tone recognition system.
454 J. Zhang, K. Hirose / Speech Communication 42 (2004) 447–466
phoneme recognition process, only F0 contours
corresponding to the Finals are kept for the tone
recognition from the original F0s. The panels (b)
and (c) of Fig. 11 illustrated the original and the
extracted F0 contours of Finals. Then, a tone-
nucleus is detected for each Final�s F0 contour.Finally, tone recognition is carried out by the
matching between the acoustic features of a tonenucleus and tonal HMMs.
Data of a female speaker (0f) in the speech
corpus HKU96, published by Hong Kong Uni-
versity, was used in the following study. There are
two reasons for selecting the data: the first one is
that the problem dealt here is more on intra-
speaker variation than inter-speaker variation.
Thus testing a speaker-dependent database isnecessary as a first step to show the validity of our
approach. The second one is that the speaker 0f is
a phonetician who was involved in developing the
data corpus HKU96: her speech was much more
natural than that of other speakers whose speech
often sounded more like ‘‘citation’’ style. We took
500 utterances (6419 syllables) labeled from
cs0f0001 to cs0f0500 for tonal acoustic modeltraining, and 200 utterances labeled from cs0f0501
to cs0f700 as testing set (2567 syllables) for tone
recognition. Table 2 gives the details of the data-
base. Average utterance length is 12.8 syllables in
both the training and testing set. The utterances
have average speaking rates ranging from 3.8 to
4.9 syllables per second, and sometimes more than
5 syllables per second.
The corpus offers phoneme, syllable (in Pinyin)and lexical tone labels together with orthographic
transcriptions. All the labels were manually
checked to correct possible errors: spectrograms,
and sometimes together with F0 contours, were
referred to for segmental alignment. A few tone
labels were modified according to their real
tonalities: for example, according to the Tone 3–
Tone 3 tone sandhi rule, the first one was changedto Tone 2. And according to some other mor-
phophonemic tone sandhi rules (Chao, 1968),
syllables like ‘‘yi’’ and ‘‘bu’’ have tonal alterna-
tions depending on its following tones. F0 was
extracted by using the integrated F0 tracking
algorithm (IFTA) (Secrest and Doddington, 1983),
and manual correctness were applied to any sig-
nificant F0 tracking errors such as half and doublefrequency. The window size for log-energy analysis
was 20 ms and frame shift for F0 and log-energy
extraction was set at every 10 ms.
4. Tone-nucleus detection
As the relation between tone nucleus and the
syllable internal segmental structure was not found
to be tight (Xu, 1998), we developed a standard
pattern recognition scheme to detect tone nuclei
from syllable Finals� F0 contours, instead of theheuristic approach to use vowel positions to seg-
ment syllable F0 contours as in (Zhang and Hi-rose, 1998; Chen et al., 2001). The scheme, as
illustrated in Fig. 8, mainly includes two steps:
extracting prosodic features of candidate F0 loci
for tone nucleus, and then discriminating the tone-
nucleus from other candidate F0 loci. However,
the candidate F0 loci are not available beforehand,
they need to be created through automatic seg-
mentation of a Final F0 contour into a concate-nation of asymptotically linear F0 loci.

F0 ContourSegmentation
Tone NucleusSmoothing
PhoneticSegmentation
F0, EnergyFeatures
DiscriminationCoefficients
+ Numberof Segments
=2?
Prosodic FeatureExtration
Discriminate
Tone Nucleus
Yes
No
Fig. 8. The scheme for tone-nucleus detection.
J. Zhang, K. Hirose / Speech Communication 42 (2004) 447–466 455
Some difficulties exist for the segmentation and
discrimination: one is how to robustly segment the
syllable F0 contours into successive linear F0 loci.
Segmentation method based on detecting turning
points like peak and valley points in F0 contours,
as used in (Hsie et al., 1988; Garding and Zhang,
1997), is not a good choice since there are possibleextra-local peak and valley points in F0 contours
due to their temporal fluctuations. Also it is diffi-
cult to find an appropriate threshold to segment an
F0 contour like that of Tone 1 in Fig. 3 since the
slope variation is gradual. Furthermore, number
of linear F0 loci in a syllable F0 contour is
uncertain, it maybe one, two or three. The second
difficulty is that we do not have adequate knowl-edge of acoustic features to discriminate tone nu-
cleus from other F0 loci.
Hence, we proposed to segment F0 contours by
segmental K-means segmentation algorithm (Ra-
biner and Juang, 1993, p. 382), and amalgamate
neighboring segments according whether they can
stand Hypothesis test on equal means of F0 slope
ratios. For the F0 contours that have 2 segments,we collected a number of acoustic features, such as
time, energy and F0 related variables, to do vari-
ance analyses (ANNOVA) with respect to the
position of tone nucleus in order to get an image
about feature distributions of tone nuclei. Then we
exploited the method of linear discriminant anal-ysis (LDA) to design a discriminant function to
predict the position of tone nucleus.
4.1. F0 contour segmentation via segmental K-
means segmentation algorithm
Segmental K-means segmentation algorithm is
a variant of the well-known K-means iterative
procedure for data clustering. The variation lies in
that the re-assignment of samples to the clusters is
achieved by finding the optimum segmental state
sequence via the Viterbi algorithm, and then by
backtracking along the optimal path. The proce-dure is illustrated in Fig. 9.
Let the observation sequence, O ¼ ðo1o2 � � � oNÞto represent a Final�s F0 contour and is dividedinto I , 16 I 6 3, successive segments. The obser-vation vector oj is a two component vector
ðlog F0j;Dlog F0jÞ. The ith, 16 i6 I , segmentcentroid is assumed to have the p.d.f. of the mul-
tivariate Gaussian pðojUiÞ, where the parametervector Ui include the mean-vector li and covari-
ance matrix Ri, which are obtained from the niobservation points of the ith segment by the
maximum likelihood estimates:
l̂i ¼1
ni
Xnik¼1
ok ð1Þ
bRi ¼1
ni
Xnik¼1
ðok � l̂iÞðok � l̂iÞt ð2Þ
In the re-segmentation step, the likelihood
pðojjUiÞ ¼1
2pjbR ij1=2exp
�� 12ðoj � l̂iÞ
t
� bR�1i ðoj � l̂iÞ
�ð3Þ
can be used in the Viterbi search to decide which
segment the point oj belongs to. When a segmen-tation of a Final�s F0 contour becomes available, acheck will be made whether two successive seg-
ments can be amalgamated or not based on thefollowing two principles:

Segmentation Initialization:n = n = n
Maximum LikelihoodEstimate of Centroid
Parameters
Re-segmentation throughViterbi Search Algorithm,Backtracking Along The
Optimal Path.
Converge?
I=3?n < 5
frames?
T-Test OnNeighboring Segment:
Amalgamate?
I=2
Segmentation Results
A SyllableFinal's F0Contour
I=I-1
n , n , n : segmentallength in frames.
I: the number of segments.
No
Yes
Yes
No
Yes
No further amalgamation.
Yes
No
1 2 3
1 2 3
2
Fig. 9. The segmental K-means segmentation procedure used to segment a syllable F0 contour into a possible number of linear F0 loci.
456 J. Zhang, K. Hirose / Speech Communication 42 (2004) 447–466
• Phonetic rule: a tone-nucleus should be longer
than 50 ms. Because pitch perception studies
have revealed a duration threshold of 40–60ms for a F0 contour perception (Rose, 1988,
p. 70).
• Statistical rule: if there is no significant statisti-
cal evidence for distributional differences be-
tween two neighboring F0 loci, they are merged.
When a Final�s F0 contour is divided into 3segments, the medium segment should correspondto tone-nucleus according to the tone nucleus
model, and its length is required to be longer than
50 ms, i.e. n2 P 5 according to the phonetic rule.
Otherwise the number of segments, I , will be re-duced to 2 and the segmentation will be repeated
once more. Next, two successive segments of F0
contour will be checked whether to amalgamate
into one or not based on T -test on the slope ratioK of the linear regression function of logF0 on
time t. For the observation point ðtj; log F0jÞ in thesegment ci:
log F0j ¼ Kitj þ Ci where Ci is a consonant
Ki may be estimated by taking the average of
Dlog F0j for the ni points in ci:
bKi ¼1
ni
Xnij¼1
Dlog F0j
We test the two hypotheses on if any two neigh-
boring segments have the same slope ratio or not,
H0 : Ki ¼ Kiþ1
H1 : Ki 6¼ Kiþ1

J. Zhang, K. Hirose / Speech Communication 42 (2004) 447–466 457
by using a test statistic Ti;iþ1,
Ti;iþ1 ¼bKi � bKiþ1ffiffiffiffiffiffiffiffiffiffiffiffiffiffiffiffiffiffiffiffiffiffiffiffiS 1
niþ 1
niþ1
� �r ð4Þ
S ¼ maxPI
i¼1
Pnij¼1
ðDlog F0ij�bKiÞ2
N�IS0
(
where, S0 is the prescribed minimum allowance formicro-fluctuations, calculated by the average var-iance of D log F 0 of whole utterance; N , number ofvoicing points in the Final�s F0 contour; I , numberof F0 segments.
Ti;iþ1 has a Student T distribution with N � Idegree of freedom. The critical point for the two-
tailed test at a level of significance is
cp ¼ tN�I ;1�a=2
ffiffiffiffiffiffiffiffiffiffiffiffiffiffiffiffiffiffiffiffiffiffiffiffiffiffiffiffiffiS
1
niþ 1
niþ1
� �sð5Þ
where point tN�I;1�a=2 satisfies
P ½�tN�I ;1�a=26 TN�I 6 tN�I;1�a=2� ¼ 1� a
We reject H0 whenever jbKi � bKiþ1j exceeds thecomputed critical point. If H0 cannot be rejected ata level, this means the two neighboring F0 locihave the same slope ratio, and the two segments
will be merged. A Final�s F0 contour may be di-vided into one, two or three segments, from these
segments one is decided as the tone nucleus. For
log
ener
gyF0
t 0
c1
A
syllable sy
t1
w 1
Fig. 10. Illustration of prosodic feature extraction for syllable w2 in cand F0 contours of syllable w2 and its neighbors. Vertical lines indicathin lines indicating syllable boundaries between syllable w1, w2 andindicating F0 segmentation of syllable w2. ‘‘A’’, ‘‘B’’ and ‘‘C’’ indicatew2 into two segments c1 and c2. t0, t1 and t2 are the frames of syllabl
one-segment case, the whole Final�s F0 contouris the tone-nucleus. For three-segment case, the
medium segment is the tone-nucleus. For two-
segment case, the tone-nucleus is chosen by apredictor of linear discriminant function explained
in the following section.
4.2. Tone-nucleus discrimination for two-segment
F0 contour
For the two segments of a divided Final F0
contour, we assume only one of them as the tonenucleus: either the first half or the second half is
the tone nucleus of the syllable. We use Groups )1and 1 to represent them. We collected a number of
prosodic features, including duration and energy
related ones, to study if they have different distri-
butions for the two groups. Then, we use linear
discriminant analysis (LDA) to select a subset of
the prosodic features, and form a linear discrimi-nant function which could do group classification.
4.2.1. Prosodic features
As illustrated in Fig. 10, they are as follows:
4.2.1.1. Duration related features
• Normalized temporal location of points A and
B with respect to the syllable onset:
tA0 ¼tA � t0t2 � t0
T
c2
B
C
llable syllable w w 2 3
t2
ontinuous speech. The upper and lower panels represent energy
te phonetic segmentation and the F0 segmentation result, where
w3, broken lines indicating C–V boundaries, and dotted linethe segmentation points which divide the F0 contour of syllable
e onset, C–V boundary and syllable offset of syllable w2.

458 J. Zhang, K. Hirose / Speech Communication 42 (2004) 447–466
tB0 ¼tB � t0t2 � t0
• Normalized temporal location of points A, B
and C with respect to the Consonant–Vowel
(C–V) boundary:
tA1 ¼tA � t1t2 � t1
tB1 ¼tB � t1t2 � t1
tC1 ¼tC � t1t2 � t1
• Duration of c1 in frame numbers: n1.• Duration of c2 in frame numbers: n2.• Normalized duration of c1: dur1 ¼ tB1 � tA1.• Normalized duration of c2: dur2 ¼ tC1 � tB1.
4.2.1.2. Energy related features
• Energy slope ratio of F0 segments c1 and c2:
DPc1 ¼PtB � PtAn1 � 1
DPc2 ¼PtC � PtBn2 � 1
where Pj, j ¼ tA; tB; tC depict the frame logenergies respectively.
• Segmental energy-sum ratio:
n ¼ energy sum of c2energy sum of c1
¼PtC
j¼tBPjPtB
k¼tAPk
4.2.2. Statistical distributional analysis
Let x represent for any individual prosodicfeatures mentioned-above, and l�1, l1 for themean values of x for Groups )1 and 1. We use themethod ANNOVA (Milton and Arnold, 1992, p.
467–524) to test the hypothesis:
H0 : l�1 ¼ l1
When we got samples ðx�1;1; . . . ; x�1;N�1Þ and
ðx1;1; . . . ; x1;N1Þ for the two groups from the trainingdata respectively, the following sample means
could be calculated:
l̂i ¼1
Ni
XNi
j¼1xi;j; where i ¼ �1; 1 ð6Þ
l̂ ¼ 1
N
Xi¼�1;1
XNi
j¼1xi;j; where N ¼ N�1 þ N1 ð7Þ
The treatment sum of squares St and the
residual sum of squares Se are calculated as:
St ¼Xi¼�1;1
Niðl̂i � l̂Þ2 ð8Þ
Se ¼Xi¼�1;1
XNi
j¼1ðxi;j � l̂iÞ
2 ð9Þ
The test statistic f equals to:
f ¼ StSe=ðN � 2Þ
and is known to have an F distribution with 1 andN � 2 degrees of freedom, and denoted as Fð1;N�2Þ.A larger f value indicates that there are more
significant statistical evidence that the hypothesis
H0 is not correct.In experiment, we took 250 training utterances
for statistical analysis of tone nuclei. After F0
contour segmentation, we got 664 two-segment-
divided Finals� F0 contours. Then we manuallylabel them to either Group )1 or 1. Among them,289 samples belong to Group )1, and the other375 ones to Group 1. Table 3 gives the statistics of
ANNOVA of each prosodic feature for the tone
nuclei with respect to the two groups.
From Table 3, we can see all the features except
tA0 and tA1 have different distributions for the twogroups ‘‘)1’’ and ‘‘1’’ above 0.999 significancelevel. We also can see the temporal location ofpoint B is of the highest importance for discrimi-nating the two groups, and tB1, the normalizedtemporal location to C–V boundary, is a better
discriminating feature than tB0 which is normalizedto the syllable onset. It is also interesting to note
that if the former F0 segment (c1) is tone-nucleus,it tends to have a descending energy slope (DPc1 ¼�0:046), whereas when the latter F0 segment (c2) istone-nucleus, the former segment (c1) tends tohave a rising energy slope (DPc1 ¼ 0:069).

Table 3
ANNOVA statistics for groups ‘‘)1’’ and ‘‘1’’ based on 664 samples in analysis data
Features Group means Group standard deviation F ð1; 662Þ Significant level
)1 1 )1 1
tA0 0.350 0.315 0.121 0.132 12.0 0.001
tA1 0.011 0.038 0.133 0.187 4.3 0.039
tB0 0.756 0.487 0.092 0.150 723.3 0.000
tB1 0.617 0.230 0.141 0.185 873.5 0.000
tC1 0.834 0.765 0.120 0.207 25.2 0.000
n1 10.2 5.0 3.354 1.813 647.0 0.000
n2 3.0 8.5 1.670 3.168 718.9 0.000
dur1 0.705 0.336 0.161 0.166 825.3 0.000
dur2 0.291 0.602 0.118 0.200 549.9 0.000
DPc1 )0.046 0.069 0.077 0.134 171.0 0.000
DPc2 )0.304 )0.085 0.185 0.101 373.5 0.000
n 0.272 2.365 0.241 1.547 519.4 0.000
J. Zhang, K. Hirose / Speech Communication 42 (2004) 447–466 459
4.2.3. Linear discriminant function based tone-
nucleus predicator
We use a linear discriminant function as the
automatic classifier to predict the tone nucleus for
the two-segment divided Final F0 contours. Let xbe the vector consisting of a number of the pro-
sodic features mentioned-above, the function is
like,
y ¼ wTxþ w0 ð10Þ
x 2 Group � 1 y < 0Group 1 y > 0
�ð11Þ
With the training samples ðx�1;1; . . . ; x�1;N�1Þ ofGroup )1, and ðx1;1; . . . ; x1;N1Þ of Group 1, we useFisher ratio JF (Webb, 1999, pp. 104–105) to findthe w of Eq. (10):
JF ¼ jwTðl�1 � l1Þj2
wTSwwð12Þ
where,
li ¼1
Ni
XNi
j¼1xi;j where i ¼ �1; 1
Sw ¼ 1
N � 2 ðN�1bR�1 þ N1bR1Þ and N ¼ N�1 þ N1
ð13Þ
where bR�1 and bR1 represent the maximum likeli-hood estimates of the convariance matrices of
Groups )1 and 1, respectively. Through maxi-
mizing the ratio JF, the optimal weight w is cal-
culated as,
w ¼ S�1w ðl�1 � l1Þ
Furthermore, through feature selection algo-
rithms such as the sub-optimal sequential forward
selection (SFS) (Webb, 1999, pp. 222–223), asubset of prosodic features can be chosen to form a
discriminant function which achieve a good dis-
crimination performance. The SFS works like this:
(1) Initialization: let X , the objective feature set,be null.
(2) JF estimation: for each xi in the candidate fea-ture set, form a new feature set ðX ; xiÞ, and cal-culate the Fisher ratio JFðX ; xiÞ in Eq. (12).
(3) Best candidate: the feature x ¼argmaxJF�ðX ; xiÞ.
(4) Significance check: ðJFðX ; x Þ � JFðX ÞÞ is
checked to see if the improvement is statisti-
cally significant. If yes, include x into X , anddelete x from the candidate feature set, then
go back to 2. Otherwise, output X .(5) End.
In our experiment, we used the manually la-
beled 664 samples (375 of Group )1 and 289 ofGroup 1) to do the feature selection analysis and
design the linear discriminant function. The final
feature set we got only includes 5 of the original 12
listed-up described prosodic features: dur1, dur2,DPc1 , DPc2 , n. The estimated discriminant function

Table 4
Detection performance of tone nuclei for an open set of 50 utterances
1 segment F0 2 segment F0 3 segment F0 Total
Number of tones 247 161 263 671
Number of correct tone nuclei 247 152 255 654
Correct rate of tone nucleus (%) 100 94.4 97.0 97.5
0 0.5 1 1.5 2 2.58000
6000
4000
2000
0
2000
4000
sil er2 zhi2 yuan2 sil yu2 ying1 xun4 shi2 biao3 shi4 sil
ER ZH I VAN V ING X VN SH I B IAO SH I
(a)Speech wave file with Initial/Final and syllable segmentations.
0 0.5 1 1.5 2 2.54
4.5
5
5.5
6(b)Original F0 contours, with the F0 contours of Finals labled.
logF
0 (H
z)
t2 t2 t2 t2 t1 t4 t2 t3 t4
0 0.5 1 1.5 2 2.54
4.5
5
5.5
6
6.5
(c)Illustration of segmentation of the tone nuclei from the Final F0 contours
logF
0 (H
z)
Seg1Seg2Seg3
0 0.5 1 1.5 2 2.54.5
5
5.5
6(d)Extracted F0 contours of the tone nuclei.
logF
0 (H
z)
Time (second)
Fig. 11. Illustration of the extraction of tone nuclei. The panel (a) depicts the speech wave file, with phonetic segmentations of Initials/
Finals and syllables. The panel (b) depicts the original F0 contours, with the tonality and the Finals� boundaries labeled. The panel (c)illustrated the segmentation process for the tone nuclei from the Finals� F0 contours, where the ‘‘Seg1’’ depicts the results of segmentalK-means segmentation, the ‘‘Seg2’’ for the results of segment merge, and the ‘‘Seg3’’ for the tone nuclei. The panel (d) depicts the
extracted F0 contours of tone nuclei.
460 J. Zhang, K. Hirose / Speech Communication 42 (2004) 447–466

J. Zhang, K. Hirose / Speech Communication 42 (2004) 447–466 461
had an accuracy of 95.2% for discriminating the
two groups in the training data.
4.3. Tone nucleus detection performance
To evaluate the performance of the tone nu-
cleus detection method, we manually checked the
extracted tone nuclei of an open set consisting of
50 utterances (cs0f0251–cs0f0300) with 671 sylla-
bles. We regard those tone nuclei as errors only
when they obviously missed the targets. So, if thewhole F0 of a Final is chosen as the tone nucleus,
it is regarded as correct no matter whether it in-
cludes transitory courses or not. Table 4 shows the
number of samples in different segmentation
groups and the correct rate of extracted tone nu-
clei.
4.4. F0 smoothing of tone nucleus
After the tone nucleus is detected from a syl-
lable F0 contour, the other F0 segments will be set
to zero for tone recognition. Exactly in our ap-
proach, small portions of F0 of the onset/offset
neighboring to the tone nucleus are kept to com-
pute delta F0s. Fig. 11 illustrates the main steps ofone nuclei extraction. The panel (d) of Fig. 11
shows the extracted tone nuclei.
5. Tone recognition
Hidden Markov models (HMMs) were found
to be an efficient method for pitch tone recognition
in a number of previous studies (Ljolje and Fall-
side, 1987; Yang et al., 1988; Hirose and Hu, 1995;
Wang et al., 1997). We also used HMMs as the
tonal acoustic models in the tone recognition sys-tem. The difference of our approach from others is
that we only use acoustic features corresponding
to the tone nucleus of a syllable in training and
recognition stages, whereas the conventional ones
all used acoustic features of a whole syllable.
Training of the tonal HMMs were done by the
well-known Baum–Welch re-estimation proce-
dure, and acoustic decoding of recognition periodwas done through Viterbi search algorithm.
5.1. Tonal HMMs structure
The HMM structure for the four basic lexical
tones (Tones 1, 2, 3 and 4) has a left–right con-figuration with 5 states. The beginning and ending
states have 2 mixtures of Gaussian probability
functions each, and the 3 middle states, assumed to
represent tone nuclei, have 6 mixtures each. Since
the neutral tone was regarded to be of short
duration, its HMM has a less number of states 3
and less number of mixtures in the middle state
than the basic tones. The frame acoustic vectorconsists of 6 elements:
• log F0j,
• Dlog F0j ¼ log F0j � log F0j�1,• DDlog F0j ¼ log F0jþ1 þ log F0j�1 � 2logF0j,• Pj � Pave, where Pave is the average log powervalue of Pj at an utterance level.
• DPj ¼ Pj � Pj�1,• DDPj ¼ Pjþ1 þ Pj�1 � 2Pj.
No speaker normalization was conducted since
the system was designed for a speaker dependent
task. To extend it to a speaker independent task,
some considerations for speaker normalization
must be taken into account.
5.2. Tone recognition experiment I
The first tone recognition experiment was doneusing context independent (CI) tonal HMMs. The
number of HMMs is 5, i.e. one HMM for each of
Tones 1, 2, 3, 4 and the neutral tone. The con-
ventional method observing full syllable features
acted as the baseline system. Recognition results of
the two approaches for the test set are shown in
Fig. 12 as tone recognition rates in percentage for
the basic four tones and as the total averageincluding the neutral tone.
From Fig. 12 we can see the new approach
increased the absolute average rate by about 6%
compared with the conventional one. This indi-
cates that observing features only of tone nuclei
yields a better performance than observing full
syllable features. When the performances of indi-
vidual tones were viewed, we found one interestingphenomenon: Recognition rate is improved for

Tone 1 Tone 2 Tone 3 Tone 4 Total average
95
90
85
80
75
70
65
Full
NucleusR
ecog
nitio
n R
ates
(%
)
Fig. 12. Tone recognition rates for the four basic tones and absolute average in the two approaches using CI tonal HMMs. ‘‘Full’’
indicates the conventional approach observing full syllable features and ‘‘Nucleus’’ indicates the proposed tone-nucleus based method.
462 J. Zhang, K. Hirose / Speech Communication 42 (2004) 447–466
Tones 1, 2 and 4, but, for Tone 3, it even decreased
a little (about 2%). We thus turn to the confusion
matrices as in Table 5 (for conventional approach
observing full syllable features) and Table 6 (for
the tone-nucleus approach) to find a reasonable
explanation.By comparing Tables 5 and 6, we can see how
the use of tone nucleus improved tone recognition
rates. Taking Tone 1 recognition as the example,
error rate of mis-recognizing Tone 1 as Tone 4
reduced from 12.8% to 3.9%, and that as Tone 2
reduced from 16.2% to 10.5%. However, that as
Tone 3 or the neutral tone was nearly unchanged.
Since both onset and offset pitch targets of Tone 1are H (high), in continuous speech a rising onset
course and/or a falling offset course may appear in
the F0 contour of a Tone 1 syllable as shown in
Fig. 3. A Tone 1�s F0 contour with a rising onsetcourse may easily lead to an error of Tone 2, while
a Tone 1�s F0 contour with a falling offset coursemay easily leads to an error of Tone 4. But in the
tone-nucleus approach, these two kinds of mis-
Table 5
Confusion matrix for the conventional approach based on CI tonal H
Input tone Recognition rates (%)
Tone 1 Tone 2 T
Tone 1 69.2 16.2
Tone 2 8.5 76.4
Tone 3 0 10.4 7
Tone 4 4.5 3.5
The neutral tone 2.4 11.0 2
takes can be avoided. Similar reasons can also be
given to explain the improvements in the recogni-
tion rates of Tones 2 and 4.
The performance degradation of Tone 3 can
also be clarified from the above tables. The mis-
recognition of Tone 3 as the neutral tone increasedsignificantly from 2.4% to 11.6%. A close check of
the data showed that when the original F0 con-
tours of Tone 3s have lowering-rising dipping
shapes, the extracted tone nuclei usually only had
either the lowering or the rising F0 segments. The
loose of the dipping shape or contouricity may
result in more recognition errors of Tone 3 for the
tone nucleus approach than the original method.Furthermore, as both Tone 3 and the neutral tone
are associated with low pitch values, the confusion
between Tone 3 and the neutral tone increased in
the tone nucleus approach. On the other hand, the
mis-recognitions of Tone 3 as Tone 2 and Tone 4
have still been reduced (from 10.4% to 4.7% as
Tone 2 and from 17.2% to 15.7% as Tone 4). Fu-
ture studies should be conducted to improve the
MMs
one 3 Tone 4 The neutral tone
1.4 12.8 0.5
8.7 4.2 2.1
0.0 17.2 2.4
5.7 85.3 1.0
2.6 33.5 30.5

Table 6
Confusion matrix for the tone-nucleus approach based on CI tonal HMMs
Input tone Recognition rates (%)
Tone 1 Tone 2 Tone 3 Tone 4 The neutral tone
Tone 1 83.6 10.5 1.6 3.9 0.4
Tone 2 7.7 84.5 3.8 1.8 2.2
Tone 3 0 4.7 68.0 15.7 11.6
Tone 4 4.1 0.5 4.2 90.7 0.4
The neutral tone 4.9 9.1 12.8 41.5 31.7
J. Zhang, K. Hirose / Speech Communication 42 (2004) 447–466 463
discrimination between Tone 3 and the neutral
tone. 3
The whole recognition performance for the
neutral tone is notably low: 31.7% in the tone-nu-
cleus approach and 30.5% in the conventional ap-proach. This may be ascribed to the fact that F0 and
energy are not enough to characterize the neutral
tone. Some other studies showed the neutral tone
can be better discriminated based on duration fea-
ture (Hirose and Hu, 1995; Chen and Wang, 1995).
This problem should be dealt with in the future.
5.3. Tone recognition experiment II
The second tone recognition experiment used
context-dependent tonal HMMs, which modeled
the F0 variations due to the coarticulation with
neighboring tones to improve tone recognitionperformance (Chen and Wang, 1995; Wang et al.,
1997). For instance, a tone sequence ‘‘T1T2T3T4’’ isacoustically modeled by context-independent (CI)
or context-dependent (CD) models like:
CI : T1 T2 T3 T4CD : T1 � ðT2Þ ðT1Þ � T2 � ðT3Þ ðT2Þ � T3 � ðT4Þ ðT3Þ � T4
Therefore, coarticulation effects on each tonedue to its neighboring tones can be modeled by
3 In our later study in (Zhang and Hirose, 2000), Tone 3 was
found to be characterized by relative low pitch values, and its
recognition rate could be improved significantly based on an
anchoring based normalized method.
allotone models (CD models): bi-tone models used
to model tones at the beginning and end of an
utterance, and tri-tone models used to model tones
in the middle of an utterance. In the recognition
period, due to the fact that neighboring tones arenot known in advance, tone recognition for all
syllables in an input utterance must be realized
through dynamic search to find a legal pass with
the maximum probabilities across the whole can-
didate tone array, where a legal pass means that if
the pass has an allotone candidate, it must include
the context tones of the allotone as its preceding
and succeeding candidates.The number of CD tonal HMMs is 175: 4 · 5
for tones at the beginning of an utterance (neutral
tone does not appears at the beginning of an
utterance), 5 · 5 · 5 for tones in the middle of anutterance, 5 · 5 for tones at the end of an utter-ance and another 5 for isolated tones. Due to
insufficient training data for the context depen-
dent case, CD HMMs have tied transitionmatrices. They are first copied from CI HMMs,
and then re-estimated according to the trainingdata with tri-tone labels. Table 7 lists the results
of the CD experiments based on the acoustic
features of either the full syllables or only tone
nuclei, together with the results of the previous CI
experiments.
Although there exists an insufficient training
data problem, the slight increase in the recognition
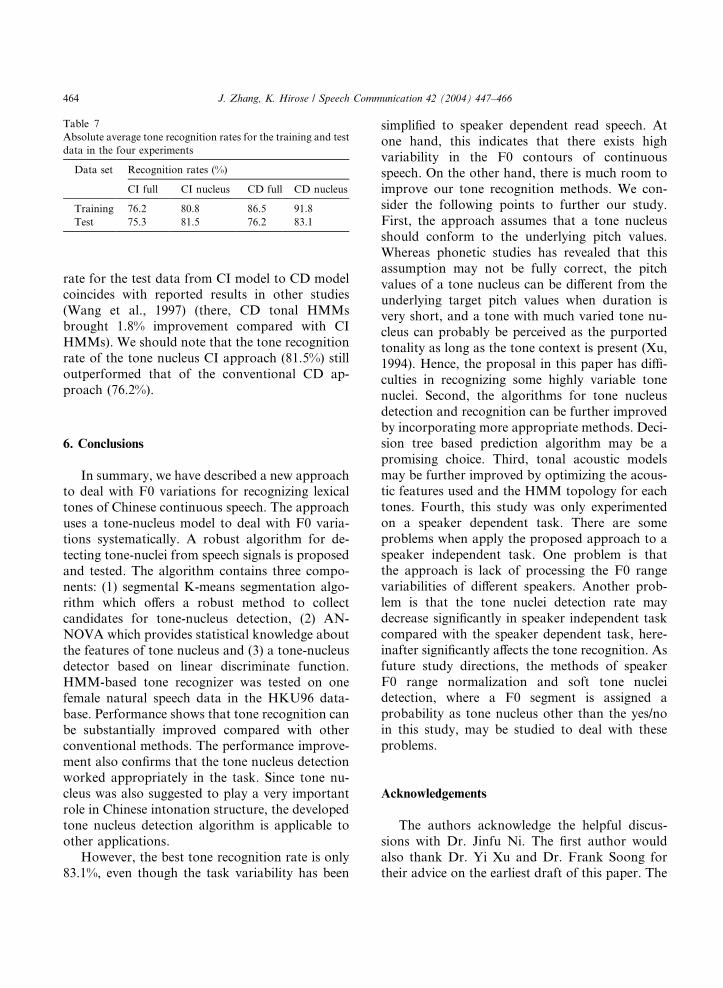
Table 7
Absolute average tone recognition rates for the training and test
data in the four experiments
Data set Recognition rates (%)
CI full CI nucleus CD full CD nucleus
Training 76.2 80.8 86.5 91.8
Test 75.3 81.5 76.2 83.1
464 J. Zhang, K. Hirose / Speech Communication 42 (2004) 447–466
rate for the test data from CI model to CD modelcoincides with reported results in other studies
(Wang et al., 1997) (there, CD tonal HMMs
brought 1.8% improvement compared with CI
HMMs). We should note that the tone recognition
rate of the tone nucleus CI approach (81.5%) still
outperformed that of the conventional CD ap-
proach (76.2%).
6. Conclusions
In summary, we have described a new approachto deal with F0 variations for recognizing lexical
tones of Chinese continuous speech. The approach
uses a tone-nucleus model to deal with F0 varia-
tions systematically. A robust algorithm for de-
tecting tone-nuclei from speech signals is proposed
and tested. The algorithm contains three compo-
nents: (1) segmental K-means segmentation algo-
rithm which offers a robust method to collectcandidates for tone-nucleus detection, (2) AN-
NOVA which provides statistical knowledge about
the features of tone nucleus and (3) a tone-nucleus
detector based on linear discriminate function.
HMM-based tone recognizer was tested on one
female natural speech data in the HKU96 data-
base. Performance shows that tone recognition can
be substantially improved compared with otherconventional methods. The performance improve-
ment also confirms that the tone nucleus detection
worked appropriately in the task. Since tone nu-
cleus was also suggested to play a very important
role in Chinese intonation structure, the developed
tone nucleus detection algorithm is applicable to
other applications.
However, the best tone recognition rate is only83.1%, even though the task variability has been
simplified to speaker dependent read speech. At
one hand, this indicates that there exists high
variability in the F0 contours of continuous
speech. On the other hand, there is much room toimprove our tone recognition methods. We con-
sider the following points to further our study.
First, the approach assumes that a tone nucleus
should conform to the underlying pitch values.
Whereas phonetic studies has revealed that this
assumption may not be fully correct, the pitch
values of a tone nucleus can be different from the
underlying target pitch values when duration isvery short, and a tone with much varied tone nu-
cleus can probably be perceived as the purported
tonality as long as the tone context is present (Xu,
1994). Hence, the proposal in this paper has diffi-
culties in recognizing some highly variable tone
nuclei. Second, the algorithms for tone nucleus
detection and recognition can be further improved
by incorporating more appropriate methods. Deci-sion tree based prediction algorithm may be a
promising choice. Third, tonal acoustic models
may be further improved by optimizing the acous-
tic features used and the HMM topology for each
tones. Fourth, this study was only experimented
on a speaker dependent task. There are some
problems when apply the proposed approach to a
speaker independent task. One problem is thatthe approach is lack of processing the F0 range
variabilities of different speakers. Another prob-
lem is that the tone nuclei detection rate may
decrease significantly in speaker independent task
compared with the speaker dependent task, here-
inafter significantly affects the tone recognition. As
future study directions, the methods of speaker
F0 range normalization and soft tone nucleidetection, where a F0 segment is assigned a
probability as tone nucleus other than the yes/no
in this study, may be studied to deal with these
problems.
Acknowledgements
The authors acknowledge the helpful discus-
sions with Dr. Jinfu Ni. The first author would
also thank Dr. Yi Xu and Dr. Frank Soong fortheir advice on the earliest draft of this paper. The

J. Zhang, K. Hirose / Speech Communication 42 (2004) 447–466 465
valuable comments of three anonymous reviewers,
which considerably improved the quality of this
paper, are appreciated as well.
References
Chao, Y.-R., 1968. A Grammar of Spoken Chinese. University
of California Press, Berkeley.
Chen, S.-H., Wang, Y.-R., 1995. Tone recognition of contin-
uous Mandarin speech based on neural networks. IEEE
Trans. SAP 3 (2), 146–150.
Chen, C.-J. et al., 2001. Recognize tone languages using pitch
information on the main vowel of each syllable. In: Proc. of
ICASSP.
Cheng, Y.-B., Wang, R.-H., 1990. Speech Signal Processing.
University of Science and Technology of China Press (in
Chinese).
Fujisaki, H., 1997. Prosody, models, and spontaneous speech.
In: Sagisaka, Y., Campbell, N., Higuchi, N. (Eds.), Com-
puting Prosody: Computational Models for Processing
Spontaneous Speech. Springer-Verlag, New York, pp. 27–
42.
Fujisaki, H., Hirose, K., 1984. Analysis of voice fundamental
frequency contours for declarative sentences of Japanese. J.
Acoust. Soc. Jpn. (E) 5 (4), 233–242.
Garding, E., Zhang, J.-L., 1997. Tempo effects in Chinese
prosodic patterns. In: ESCA workshop on Intonation:
Theory, Models and Applications, Athens Greece, Septem-
ber 1997, pp. 145–148.
Hirose, K., Hu, X.-H., 1995. HMM-based tone recognition of
Chinese trisyllables using double codebooks on fundamen-
tal frequency and waveform power. In: Proc. 45th European
Conf. on Speech Communication and Technology, Vol. 1,
Mopm2A.5, Madrid, pp. 31–34.
Hirose, K., Iwano, K., 1999. Detecting prosodic word bound-
aries using statistical models of moraic transition and its use
for continuous speech recognition. In: ICASSP99.
Howie, J.M., 1974. On the domain of tone in Mandarin.
Phonetica 30, 129–148.
Hsie, Ch.-T., Furuichi, Ch., Imai, S., 1988. Recognition of four
tones in continuous Chinese speech. J. IEICE, D J71-D (4),
661–668 (in Japanese).
Lee, L.-Sh., Tseng, Ch.-Y., Gu, H.-Y., Liu, F.-H., Chang,
Ch.-H., Lin, Y.-H., Lee, Y.-M., Tu, Sh.-L., Hsieh, Sh.-H.,
Chen, Ch.-H., 1993. Golden Mandarin(I)––A real-time
Mandarin speech dictation machine for Chinese language
with very large vocabulary. IEEE Trans. SAP 1 (2), 158–
179.
Lin, M.-C., 1995. A perceptual study on the domain of tones in
Beijing Mandarin. China Acta Acustica 20 (6), 437–
445.
Liu, J., He, X.-D., Mo, F.-Y., Yu, T.-Ch., 1999. Study on tone
classification of Chinese continuous speech in speech
recognition system. In: Proc. Eurospeech 99, Vol. 2,
Budapest, Hungary, pp. 891–894.
Ljolje, A., Fallside, F., 1987. Recognition of isolated prosodic
patterns using hidden Markov models. Comput. Speech
Lang. 2, 27–33.
Milton, J.S., Arnold, J.C., 1992. Introduction to Probability
and Statistics. McGraw-Hill.
Niemann, H. et al., 1998. Using prosodic cues in spoken dialog
systems. In: Kosarev, Y. (Ed.), Proc. of SPECOM�98Workshop, St-Petersburg, pp. 17–28.
Rabiner, L., Juang, B.-H., 1993. Fundamentals of speech
recognition. Prentice-Hall PTR.
Rose, P.J., 1988. On the non-equivalence of Fundamental
frequency and pitch in tonal description. In: Bradley, D.,
Henderson, E.J.A., Mazaudon, M., (Eds.), Prosodic Anal-
ysis and Asian Linguistics: To honour R.K. Sprigg, Pacific
Linguistics, C-104, pp. 55–82.
Secrest, B.G., Doddington, G.R., 1983. An integrated pitch
tracking algorithm for speech systems. In: Proc. of ICASSP,
pp. 1352–1355.
Shih, Ch.-L., 1988. Tone and Intonation in Mandarin, Vol. 3.
Working Papers, Cornell Phonetics Laboratory, pp. 83–109.
Shih, Ch.-L., 1990. Mandarin third tone sandhi and prosodic
structure. In: Hoekstra, T., van der Hulst, H. (Eds.), Studies
in Chinese Phonology. Mouton de Gruyter Press, pp. 81–
123.
Stolcke, A. et al., 1999. Modeling the prosody of hidden events
for improved word recognition. In: Eurospeech 99, Buda-
pest, Hungary, September 1999.
Wang, Y.-R., Chen, S.-H., 1994. Tone recognition of contin-
uous Mandarin speech assisted with prosodic information.
J. Acoust. Soc. Am. Pt. 1 96 (5), 2637–2645.
Wang, Ch., Seneff, S., 1998. A study of tones and tempo in
continuous Mandarin digit strings and their application in
telephone quality speech recognition. In: Proc. of ICSLP98,
Sydney, Australia, December 1998.
Wang, Ch.-F., Fujisaki, H., Hirose, K., 1990. Chinese four tone
recognition based on the model for process of generating F0
contours of sentences. In: Proc. of ICSLP90, pp. 221–224.
Wang, H.M., Ho, T.-H., Yang, R.-Ch., Shen, J.-L., Bai, B.-R.,
Hong, J.-Ch., Chen, W.-P., Yu, T.-L., Lee, L.-sh., 1997.
Complete recognition of continuous Mandarin speech for
Chinese language with very large vocabulary using limited
training data. IEEE Trans. Speech Audio Process. 5 (2),
195–200.
Webb, A., 1999. Statistical Pattern Recognition. Arnold Press,
London.
Whalen, D.H., Xu, Y., 1992. Information for Mandarin tones
in the amplitude contour and in brief segments. Phonetica
49, 25–47.
Wightman, C.W., Ostendorf, M., 1994. Automatic labeling of
prosodic patterns. IEEE Trans. SAP 2 (4), 469–481.
Xu, Y., 1994. Production and perception of coarticulated tones.
JASA (4), 2240–2253.
Xu, Y., 1997a. What can tone studies tell us about intonation?
In: Proc. from the ESCA Workshop on Intonation: Theory,
Models and Applications, Athens Greece, pp. 337–340.
Xu, Y., 1997b. Contextual tonal variations in Mandarin. J.
Phonetics 25, 61–83.

466 J. Zhang, K. Hirose / Speech Communication 42 (2004) 447–466
Xu, Y., 1998. Consistency of tone-syllable alignment across
different syllable structures and speaking rates. Phonetica
55, 179–203.
Xu, Y., 1999. Effects of tone and focus on the formation and
alignment of F0 contours. J. Phonetics 27 (1), 55–105.
Xu, Y., Wang, Q.E., 2001. Pitch targets and their realization:
evidence from Mandarin Chinese. Speech Commun. 33,
319–337.
Yang, W.-J., Lee, J.-Ch., Chang, Y.-Ch., Wang, H.-Ch., 1988.
Hidden Markov model for Mandarin lexical tone recogni-
tion. IEEE Trans. ASSP 36 (7), 988–992.
Zhang, J.-S., Hirose, K., 1998. A robust tone recognition
method of Chinese based on subsyllabic F0 contours.
proceedings from ICSLP98, Sydney, pp. 703–706.
Zhang, J.-S., Hirose, K., 2000. Anchoring hypothesis and its
application to tone recognition of Chinese continu-
ous speech. In: ICASSP2000, Istanbul, Turkey, June
2000.
Zhang, J.-S., Kawanami, H., 1999. Modeling carryover and
anticipation effects for Chinese tone recognition. In: Proc. of
Eurospeech�99, Budapest, Hungary, September 1999, pp.747–750.