Representing Tone in Levenshtein Distance
18
Edinburgh University Press 22 George Square Edinburgh EH8 9LF www.eupjournals.com Dear Author, Here is a proof of your article to appear in the forthcoming issue of the International Journal of Humanities and Arts Computing. Please check the proof carefully and send any corrections (quoting page and line references) to Charlotte Gooskens, co-editor, at the following email address no later than 5 days after receipt: [email protected] Please note that Sebastian Kürschner should be copied into all correspondence: [email protected] Please remember that you are responsible for correcting your proofs. The proof is sent to you for correction of typographical errors only. Revision of the substance of the text is not permitted, unless discussed with the editor of the journal. Please answer any queries raised by the typesetter. Thank you for your co-operation. Journals Production Department Edinburgh University Press
-
Upload
independent -
Category
Documents
-
view
0 -
download
0
Transcript of Representing Tone in Levenshtein Distance

Edinburgh University Press 22 George Square
Edinburgh EH8 9LF www.eupjournals.com
Dear Author, Here is a proof of your article to appear in the forthcoming issue of the International Journal of Humanities and Arts Computing. Please check the proof carefully and send any corrections (quoting page and line references) to Charlotte Gooskens, co-editor, at the following email address no later than 5 days after receipt: [email protected] Please note that Sebastian Kürschner should be copied into all correspondence: [email protected] Please remember that you are responsible for correcting your proofs. The proof is sent to you for correction of typographical errors only. Revision of the substance of the text is not permitted, unless discussed with the editor of the journal. Please answer any queries raised by the typesetter. Thank you for your co-operation. Journals Production Department Edinburgh University Press

EDINBURGH UNIVERSITY PRESSJOURNAL LIBRARY RECOMMENDATION FORMPlease forward this form to your librarian, library liaison, or serials review committee
Dear Librarian/Library Liaison, I recommend that the library subscribes to the following journal:
Title ____________________________________________________________________________________ ISSN _____________________
My reasons for recommending this journal are: USAGE I will regularly use this journal and recommend articles to colleagues and students. ENHANCEMENT This journal will enhance the Library’s scholarly collection and benefit the research/teaching needs of our institution. CONNECTION I am a member of the editorial board and/or a regular contributing author.
INFORMATION FOR LIBRARIES
FEATURES OF EUP JOURNALS ONLINE
Access for SubscribersIndividual subscribers can access all material they have subscribed to from any computer with Internet access, simply by logging into the site. Institutional subscribers have access controlled by IP range and therefore have automatic access without logging in. Proxy IP authentication is used when users do not connect directly from the IP address of individual computers, but rather use a proxy server for security.
Pay-Per-ViewThe site enables non-subscribers to pay per view, where an article can be accessed for a limited period (48 hours).
Reference Linking and PDF PlusIndividual articles are available as PDF and PDF Plus files. PDF Plus is an enhanced PDF file format which links citations to external abstracting and indexing databases such as CrossRef, so that readers can quickly retrieve abstracts for the articles referenced. Clicking a linked reference in a PDF Plus file will take the reader directly to the abstract for that article on its home publisher website, or to an electronic aggregator website.
Advanced Search FunctionsAbstracts and contents are freely viewable to all users of the website. The search function of the site allows easy access to specific content, and advanced search criteria include Title, Author, Full Text, Keywords, ISSN, Article DOI, Publication Dates and Subject Area. Searches can also be saved for future use.
Additional FeaturesArticle citation trackingBibliographic Information DownloadsTable of Contents Alerting ServiceSupplementary MaterialCrossRef Cited-by Linking (formerly Forward Linking)Featured ArticlesNews and Announcements
•••••••
Trial AccessPlease contact [email protected] to request a free 30-day trial.
Edinburgh University Press provides electronic access to all journals via EUP Journals Online. Electronic access includes the current volume and all back issue content. If an online subscription is cancelled at a future date, all volumes from the years subscribed to will be available in perpetuity.
The following options are available to institutions:Print + Online Subscription: electronic access and a print copy of each issue of the volume.Print Subscription: print copies only at a 20% discount off the combined print + online rate, and does not include electronic access.Online Subscription: electronic access at a 28% discount off the combined print + online rate, and does not include print copies.
•
•
•
Browse EUP Journals Online at www.eupjournals.com
Please include this journal in your next serials review meeting with my recommendation to gain access to this journal for our institution. Thank you.
Signature ____________________________________________ Date _________________________ Tel _______________________
Name ______________________________________________ Position _________________________________________________
Dept ______________________________________________ Email ____________________________________________________
Contact InformationEdinburgh University Press, 22 George Square, Edinburgh EH8 9LF, UK. Tel. +44 (0) 131 650 6207 Fax. +44 (0) 131 662 0053 Email: [email protected]
Free Sample Issues Free Sample Issues of EUP journals are available on EUP Journals Online at www.eupjournals.com. Simply visit a journal’s homepage and click the “All Issues” tab to be directed to the free content.
Additional comments: _________________________________________________________________________________________________
____________________________________________________________________________________________________________________

June 24, 2009 Time: 09:50pm ijhac039.tex
REPRESENTING TONE IN LEVENSHTEIN DISTANCE
CATHRYN YANG AND ANDY CASTRO
Abstract Levenshtein distance, also known as string edit distance, has beenshown to correlate strongly with both perceived distance and intelligibility invarious Indo-European languages (Gooskens and Heeringa, 2004; Gooskens,2006). We apply Levenshtein distance to dialect data from Bai (Allen, 2004),a Sino-Tibetan language, and Hongshuihe (HSH) Zhuang (Castro and Hansen,accepted), a Tai language. In applying Levenshtein distance to languages withcontour tone systems, we ask the following questions: 1) How much variationin intelligibility can tone alone explain? and 2) Which representation of toneresults in the Levenshtein distance that shows the strongest correlation withintelligibility test results? This research evaluates six representations of tone:onset, contour and offset; onset and contour only; contour and offset only;target approximation (Xu & Wang, 2001), autosegments of H and L, and Chao’s(1930) pitch numbers. For both languages, the more fully explicit onset-contour-offset and onset-contour representations showed significantly stronger inversecorrelations with intelligibility. This suggests that, for cross-dialectal listeners,the optimal representation of tone in Levenshtein distance should be at aphonetically explicit level and include information on both onset and contour.
1. introduction
The Levenshtein distance algorithm measures the phonetic distance betweenclosely related language varieties by counting the cost of transforming thephonetic segment string of one cognate into another by means of insertions,deletions and substitutions. After Kessler (1995) first applied the algorithmto dialect data in Irish Gaelic, Heeringa (2004) showed that cluster analysisbased on Levenshtein distances agreed remarkably with expert consensus on
International Journal of Humanities and Arts Computing 2 (1–2) 2008, 205–219DOI: 10.3366/E1753854809000391© Edinburgh University Press and the Association for History and Computing 2009
205
June 24, 2009 Time: 09:50pm ijhac039.tex
Cathryn Yang and Andy Castro
Dutch dialect groupings. In addition, Gooskens and Heeringa (2004) founda significant correlation between Levenshtein distance and perceived distanceamong Norwegian listeners (r = .67, r < .001), and Gooskens (2006) foundan even stronger correlation with intelligibility among Scandinavian languages(r = −.82, p < .001).
Previously, the application of Levenshtein distance has been limited toIndo-European languages. However, Yang (accepted) showed that hierarchicalclustering based on Levenshtein distance paralleled that of historical-comparative analysis in Nisu, a Tibeto-Burman language. Also, Levenshteindistance showed a strong, significant correlation with intelligibility test results(r = −.62, p < .001) in Nisu. This correlation suggests that Levenshteindistance is a good approximation of intelligibility for East Asian tonal languages.We apply Levenshtein distance to word lists from Bai Dialect Survey (Allen,2004) and Hongshuihe Zhuang Dialect Intelligibility Survey (Castro and Hansen,accepted) and correlate the results with intelligibility test scores obtained duringthe respective surveys.
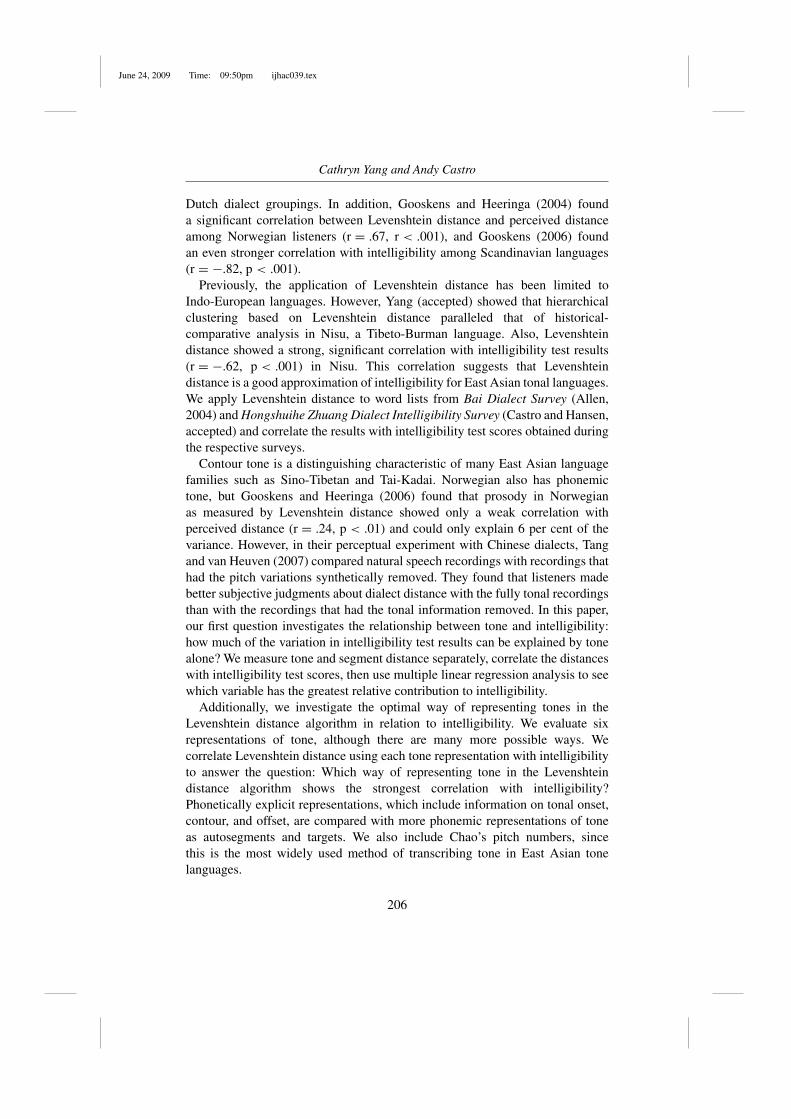
Contour tone is a distinguishing characteristic of many East Asian languagefamilies such as Sino-Tibetan and Tai-Kadai. Norwegian also has phonemictone, but Gooskens and Heeringa (2006) found that prosody in Norwegianas measured by Levenshtein distance showed only a weak correlation withperceived distance (r = .24, p < .01) and could only explain 6 per cent of thevariance. However, in their perceptual experiment with Chinese dialects, Tangand van Heuven (2007) compared natural speech recordings with recordings thathad the pitch variations synthetically removed. They found that listeners madebetter subjective judgments about dialect distance with the fully tonal recordingsthan with the recordings that had the tonal information removed. In this paper,our first question investigates the relationship between tone and intelligibility:how much of the variation in intelligibility test results can be explained by tonealone? We measure tone and segment distance separately, correlate the distanceswith intelligibility test scores, then use multiple linear regression analysis to seewhich variable has the greatest relative contribution to intelligibility.
Additionally, we investigate the optimal way of representing tones in theLevenshtein distance algorithm in relation to intelligibility. We evaluate sixrepresentations of tone, although there are many more possible ways. Wecorrelate Levenshtein distance using each tone representation with intelligibilityto answer the question: Which way of representing tone in the Levenshteindistance algorithm shows the strongest correlation with intelligibility?Phonetically explicit representations, which include information on tonal onset,contour, and offset, are compared with more phonemic representations of toneas autosegments and targets. We also include Chao’s pitch numbers, sincethis is the most widely used method of transcribing tone in East Asian tonelanguages.
206

June 24, 2009 Time: 09:50pm ijhac039.tex
Representing tone in Levenshtein distance
2. material
We used material from two dialect surveys on minority languages in China:Allen (2004) on the Bai language of Yunnan Province, and Castro and Hansen(accepted) on Hongshuihe (HSH) Zhuang in Guangxi Zhuang AutonomousRegion. Both surveys included 500-item wordlists and intelligibility testingusing Recorded Text Testing (RTT) methodology (see Section 3.3).
2.1 Bai
Bai is an ethnic minority language in southwest China with a population ofaround 1.8 million, with the vast majority located in Dali Bai AutonomousPrefecture (Allen, 2004; Yunnan Provincial Statistics Department, 2004).Although Bai is definitely Sino-Tibetan, linguists disagree as to whether itbelongs in the Sinitic or the Tibeto-Burman branch of the family (Wang, 2005;Matisoff, 2003).
Previous research on Bai dialects group varieties into Central, Southern, andNorthern (Xu and Zhao, 1984; Allen, 2004). Northern Bai, known to its speakersas Leimei, is considerably different from Central and Southern Bai, though stillclosely related (Bradley, 2007). Wang (2006) identifies a key tonal innovationthat groups Southern varieties together: the development of a mid-rising tone inProto-Bai *Tone 1a in syllables with *voiceless unaspirated and some *voicedsonorant initials. In other environments, *Tone 1a shows a high tone in SouthernBai dialects. Central and Northern Bai show a high tone in *Tone 1a in allenvironments. Also, Central and Southern Bai share the devoicing of *voicedstops, while Northern Bai retains a voiced stop series.
Allen (2004) collected 500-item word lists in nine locations, includingvarieties from each dialect group. Northern Bai was represented by LushuiLuobenzhuo in Nujiang Prefecture to the west of Dali, while Central Baivarieties were represented by Lanping Jinding (also in Nujiang), JianchuanDiannan, and Heqing Jindun. Southern varieties include Dali Zhoucheng,Dali Qiliqiao, and Xiangyun Hedian. Allen (2004) placed Eryuan Xishanand Yunlong Baishi within the Central Bai group due to their high level ofcomprehension of other Central Bai varieties. However, Eryuan and Yunlongshare the *Tone 1a innovation with other Southern varieties in contrast to CentralBai, so historically they belong to Southern Bai. See Figure 1 for a map of theBai language area.
Allen also recorded personal narratives in seven of the nine locations(excluding Xiangyun and Qiliqiao) and used them to develop intelligibility testsknown as Recorded Text Tests (RTT) (see Section 3.1). We correlate Allen’sRTT scores with the Levenshtein distances based on his wordlists.
207

June 24, 2009 Time: 09:50pm ijhac039.tex
Cathryn Yang and Andy Castro
Source: Adapted from Allen, 2004; reprinted with permission
Figure 1. Bai language area.
2.2 Hongshuihe Zhuang
Hongshuihe (HSH) Zhuang, with a population of over 3 million, is spoken inGuangxi Zhuang Autonomous Region in southern China (National StatisticsDepartment, 2003). HSH Zhuang is a Northern Tai language of the Tai-Kadaifamily. HSH Zhuang is a subgroup of the Zhuang ethnic group, but remainslinguistically distinct from other Zhuang languages. See Figure 2 below for thelocation of Guangxi and HSH Zhuang language area.
208

June 24, 2009 Time: 09:50pm ijhac039.tex
Representing tone in Levenshtein distance
Source: Adapted from Castro and Hansen (accepted); reprinted with permission
B
C A
B1
Figure 2. HSH Zhuang language area.
Very little dialect research has been done on HSH Zhuang varieties, but in2006 Castro and Hansen (accepted) collected 511-item wordlists in 20 locations.Through analysis of the different diachronic developments in the dialect areas’tone systems, they identify three major dialect areas: A, B, and C, seen inFigure 2 below. Using Li’s (1977) reconstruction of Proto-Tai tones, Castro andHansen group the varieties together by tracking their modern reflexes for historictone categories. Li reconstructs three Proto-Tai tone categories for syllablesending in a vowel or nasal (known as ‘unchecked syllables’), which he labels
209
June 24, 2009 Time: 09:50pm ijhac039.tex
Cathryn Yang and Andy Castro
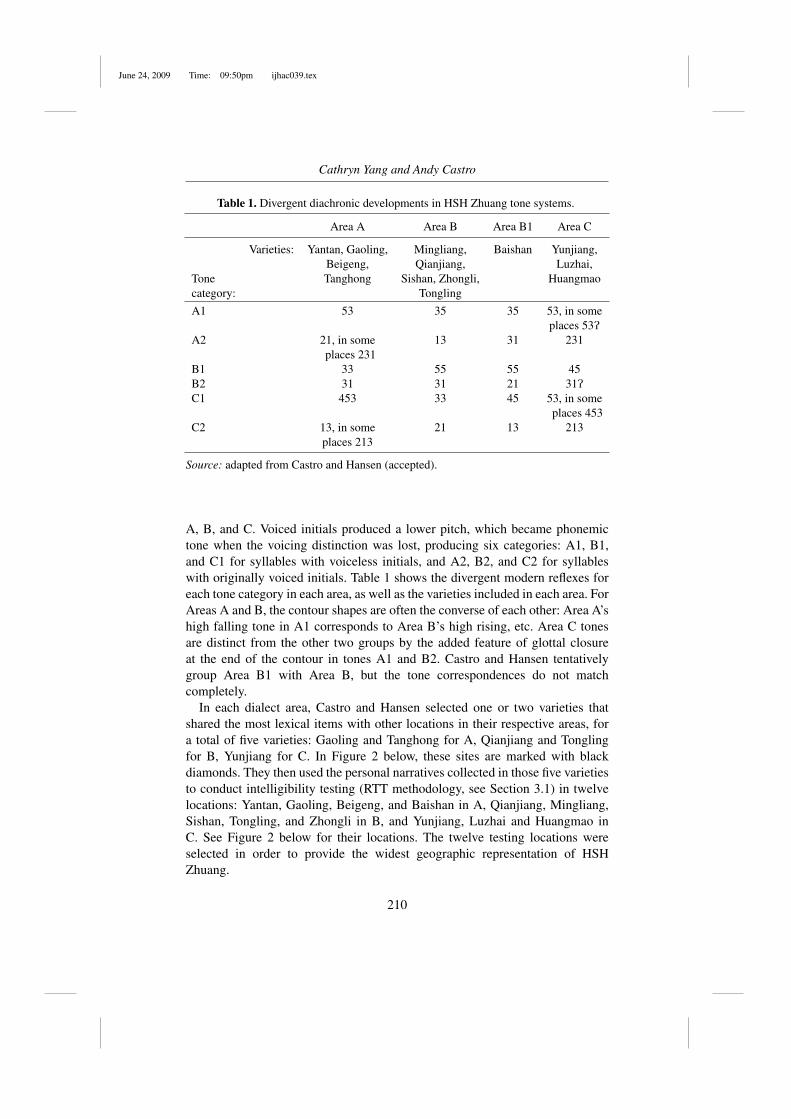
Table 1. Divergent diachronic developments in HSH Zhuang tone systems.
Area A Area B Area B1 Area C
Varieties: Yantan, Gaoling, Mingliang, Baishan Yunjiang,Beigeng, Qianjiang, Luzhai,
Tone Tanghong Sishan, Zhongli, Huangmaocategory: Tongling
A1 53 35 35 53, in someplaces 53P
A2 21, in some 13 31 231places 231
B1 33 55 55 45B2 31 31 21 31PC1 453 33 45 53, in some
places 453C2 13, in some 21 13 213
places 213
Source: adapted from Castro and Hansen (accepted).
A, B, and C. Voiced initials produced a lower pitch, which became phonemictone when the voicing distinction was lost, producing six categories: A1, B1,and C1 for syllables with voiceless initials, and A2, B2, and C2 for syllableswith originally voiced initials. Table 1 shows the divergent modern reflexes foreach tone category in each area, as well as the varieties included in each area. ForAreas A and B, the contour shapes are often the converse of each other: Area A’shigh falling tone in A1 corresponds to Area B’s high rising, etc. Area C tonesare distinct from the other two groups by the added feature of glottal closureat the end of the contour in tones A1 and B2. Castro and Hansen tentativelygroup Area B1 with Area B, but the tone correspondences do not matchcompletely.
In each dialect area, Castro and Hansen selected one or two varieties thatshared the most lexical items with other locations in their respective areas, fora total of five varieties: Gaoling and Tanghong for A, Qianjiang and Tonglingfor B, Yunjiang for C. In Figure 2 below, these sites are marked with blackdiamonds. They then used the personal narratives collected in those five varietiesto conduct intelligibility testing (RTT methodology, see Section 3.1) in twelvelocations: Yantan, Gaoling, Beigeng, and Baishan in A, Qianjiang, Mingliang,Sishan, Tongling, and Zhongli in B, and Yunjiang, Luzhai and Huangmao inC. See Figure 2 below for their locations. The twelve testing locations wereselected in order to provide the widest geographic representation of HSHZhuang.
210

June 24, 2009 Time: 09:50pm ijhac039.tex
Representing tone in Levenshtein distance
Table 2. Cost of operations in Levenshtein distance.
Location Transcription Operation Cost
Eryuan [kje35] kje_MRHke_MRH delete j 1ke_HRH substitute H for M 1
Jianchuan [ke55] ke_HEH substitute E for R 1
total cost 3
normalised cost .23
3. methodology
To answer our first question about the relation between tone and intelligibility,we calculate the Levenshtein distances for tone separately from that of phoneticsegments, correlate the two distances with intelligibility, then use multipleregression analysis to see which variable has the greater contribution tointelligibility. To answer our second question about the optimal representation oftone, we first calculate the Pearson correlation coefficient between intelligibilityand the Levenshtein distances using each of the four representations of tonedescribed below in Section 3.1.1. We then use Meng et al’s (1992) test forcorrelated correlation coefficients to see if the highest coefficient is significantlyhigher than the others.
3.1 Levenshtein distance
Levenshtein distance, also known as edit distance, measures the differencebetween two strings. The Levenshtein distance between phonetic transcriptionsof two cognates is the least number of insertions, deletions and substitutionsneeded to transform one cognate into another (Heeringa, 2004). One of thestrengths of Levenshtein distance is that it always uses the string alignment thatincurs the least cost of transformation. We applied Levenshtein distance to theBai (500-item) and HSH Zhuang (511-item) wordlists using the free RuG-L04software developed by Kleiweg (2004).
Table 2 calculates the Levenshtein distance between two Bai cognates for thegloss ‘chicken,’ pronounced [ke55] in Jianchuan and [kje35] in Eryuan. Tone isrepresented with tone onset, contour, and offset (see 3.1.1). Insertions, deletions,and substitutions are all weighted the same, with the cost of one. Differencesare binary: either the sounds are the same, with no transformation cost, or theyare different, with a cost of one. Heeringa et al (2006) found that using binarysegment differences was equally valid with that of using gradual measures ofdistance between segments.
In order to prevent longer words from having undue weight in the calculationof average distance, a normalisation function was used in which the total cost is
211

June 24, 2009 Time: 09:50pm ijhac039.tex
Cathryn Yang and Andy Castro
Table 3. Sub-lexical variation in HSH Zhuang.
English Proto-Tai Liushui Yantan Gaoling Mingliang
chin khaaN A2 ha:N231 ha:N23 ka:u44 ha:N23pE433 ha:N31 ma31
divided by the sum of length of the two strings. In cases where the two stringshave no segment in common, the Levenshtein distance is proportional to the sumof the length of the two strings (Kleiweg, 2004).
When measuring phonetic distance, lexical variation is filtered out, and onlycognates are accepted as data. However, Bai and HSH Zhuang are isolatinglanguages with many di-syllabic words, in which one syllable may be cognatewith other dialects, but the other syllable may not be. Table 3 shows HSHZhuang words for ‘chin’, Proto-Tai *khaaN A2, in which the first syllable ineach variety is the modern reflex of the Proto-Tai, but the second syllables are notcognate with each other. To filter out this ‘sub-lexical’ variation would place theLevenshtein distance at the morpheme level, not the lexical level, thus removingit even further from the context in which communication occurs. Therefore, wechose not to remove the non-cognate syllables in di-syllabic words. When twowords had no overlapping syllables, we treated them as different lexemes.
3.1.1 Representing tone in Levenshtein distance
Phonologists often represent tone as autosegments of H(igh) and L(ow) attachedto a tone-bearing unit (Duanmu, 1994; Zsiga and Nitisaroj, 2007). Contourtones like rising or falling are represented as a sequence of autosegments, LHfor rising and HL for falling. Xu and Wang (2001), however, propose a TargetApproximation (TA) model, in which targets can be static (register tones, e.g. Hor L), or dynamic (contour tones, e.g. R for rising). We include both autosegmentand target representations of tone in our evaluation.
Autosegments and target representations use salient perceptual cues for nativespeakers, but the listeners in the intelligibility tests described in section 3.2 arenot native speakers of the language they are listening to, but rather speakers ofrelated varieties. Burnham and Francis (1997) suggest that non-native speakersuse multiple cues to identify tone, whereas native speakers have already fine-tuned their perception system down to the most salient features. Therefore, amore explicit way of representing tone is introduced, which includes the tonalonset (H for high, M for mid, L for low), contour shape (R for rising, F forfalling), and tonal offset.
This moves the representation of tone to a more phonetic level, rather than themore abstract, phonemic level used in autosegmental and target representations.The phonetic representation of onset-contour-offset breaks tone down into threeparts, making tone more specified than segments, whose differences are treated
212
June 24, 2009 Time: 09:50pm ijhac039.tex
Representing tone in Levenshtein distance
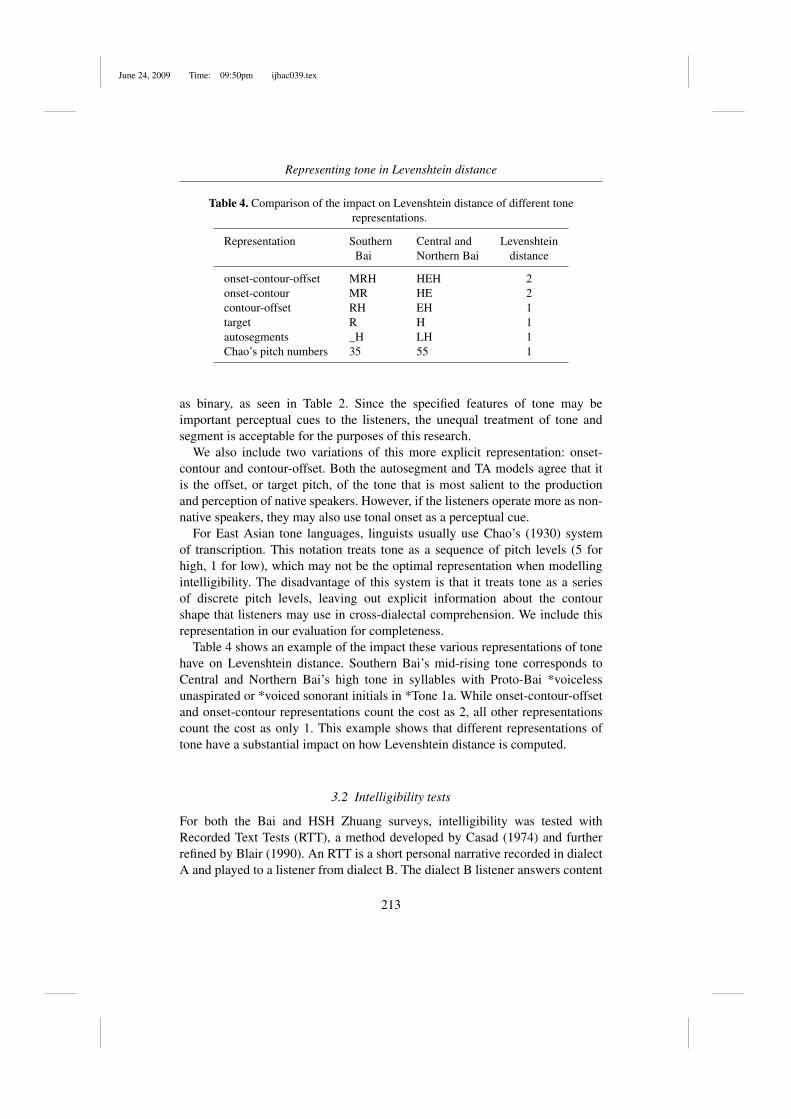
Table 4. Comparison of the impact on Levenshtein distance of different tonerepresentations.
Representation Southern Central and LevenshteinBai Northern Bai distance
onset-contour-offset MRH HEH 2onset-contour MR HE 2contour-offset RH EH 1target R H 1autosegments _H LH 1Chao’s pitch numbers 35 55 1
as binary, as seen in Table 2. Since the specified features of tone may beimportant perceptual cues to the listeners, the unequal treatment of tone andsegment is acceptable for the purposes of this research.
We also include two variations of this more explicit representation: onset-contour and contour-offset. Both the autosegment and TA models agree that itis the offset, or target pitch, of the tone that is most salient to the productionand perception of native speakers. However, if the listeners operate more as non-native speakers, they may also use tonal onset as a perceptual cue.
For East Asian tone languages, linguists usually use Chao’s (1930) systemof transcription. This notation treats tone as a sequence of pitch levels (5 forhigh, 1 for low), which may not be the optimal representation when modellingintelligibility. The disadvantage of this system is that it treats tone as a seriesof discrete pitch levels, leaving out explicit information about the contourshape that listeners may use in cross-dialectal comprehension. We include thisrepresentation in our evaluation for completeness.
Table 4 shows an example of the impact these various representations of tonehave on Levenshtein distance. Southern Bai’s mid-rising tone corresponds toCentral and Northern Bai’s high tone in syllables with Proto-Bai *voicelessunaspirated or *voiced sonorant initials in *Tone 1a. While onset-contour-offsetand onset-contour representations count the cost as 2, all other representationscount the cost as only 1. This example shows that different representations oftone have a substantial impact on how Levenshtein distance is computed.
3.2 Intelligibility tests
For both the Bai and HSH Zhuang surveys, intelligibility was tested withRecorded Text Tests (RTT), a method developed by Casad (1974) and furtherrefined by Blair (1990). An RTT is a short personal narrative recorded in dialectA and played to a listener from dialect B. The dialect B listener answers content
213

June 24, 2009 Time: 09:50pm ijhac039.tex
Cathryn Yang and Andy Castro
questions about the narrative, and the percentage of correct answers is interpretedas their comprehension level of dialect A.
Allen chose seven sites to record personal narratives in, three sites each fromCentral and Southern Bai and one from Northern Bai (see Figure 1 for sitelocations). Castro and Hansen chose five sites, two from dialect area A, twofrom B, and one from C (see Figure 2 for site locations). Sites were selectedto represent speaker population centers, as well as the geographic and linguisticspread of the language. At each site, a native speaker was recorded telling apersonal narrative two to five minutes in length, and then the story was translatedinto the national language (Chinese). The researcher developed 12–20 contentquestions and asked five to ten local speakers to listen to the narratives andanswer the questions. Any question not correctly answered by a local speakerwas deemed to be defective, i.e. an irrelevant question that arose from a faultytranslation of the text. Defective questions were not included in later testing.
After pilot-testing the narrative recordings, the researcher selected test sites.Allen returned to the same sites as the recording locations, except Luobenzhuo inNorthern Bai. Shared vocabulary of less than 60 per cent between Luobenzhuoand all other varieties was deemed a significant enough difference as to makeintelligibility unlikely. Allen tested the other six sites on the Luobenzhuorecording with results indicating very low intelligibility. In total, seven tests wereconducted in six testing locations (see Figure 1). Castro and Hansen tested fivestories at 12 testing sites (see Figure 2); though they did not test every recordingat each testing site, they did obtain results for 44 pairs of varieties.
At each testing site, the researcher asked approximately eight to twelve nativespeakers to listen to the recordings individually using headphones and answercontent questions about the text. The listeners were selected to ensure a balancebetween male and female listeners, between older and younger speakers, andbetween those with more and less education. Listeners were native speakerswho were born and raised in the village, whose parents were both nativespeakers from the village, and who had minimal contact with speakers fromother varieties. Each recording was played twice; the second time, contentquestions were asked after each section using either the listener’s variety orChinese. If listeners responded with an incorrect answer, the relevant sectionwas played again. Most tests consisted of ten questions, each question beingasked immediately after the section that contained the answer. Percentage ofcorrect answers out of the total number of questions constituted the intelligibilitytest score. Correct answers got one point, while answers that were consideredpartially correct got half a point.
Tests were individually and orally administered, which substantially increasedthe time needed for each participant. However, playing the stories for largergroups and asking participants to write down their answers was not viable,since a written test assumes a rate of literacy in Chinese that is unlikely among
214

June 24, 2009 Time: 09:50pm ijhac039.tex
Representing tone in Levenshtein distance
Table 5. Pearson’s correlation and explained variance of tone and segment levels withrespect to intelligibility.
Language Variable Correlation Explained Significance(r) variance
(r2×100, %)
Bai Tone −0.75 56 < 0.0001Segments −0.71 51 < 0.0001
HSH Zhuang Tone −0.66 43 < 0.0001Segments −0.68 46 < 0.0001
Table 6. Results of multiple linear regression analysis, in which intelligibility is thedependent variable and tone and segments are the independent variables.
Language Variable t-value Significance
Bai Tone −2.040 0.049Segments −0.604 0.550
HSH Zhuang Tone −2.255 0.030Segments −2.934 0.005
ethno-linguistic communities in rural China. Allen had an average sample of tenparticipants per site, with a total of 419 participants. Castro and Hansen had anaverage of eight participants, with a total of 372 participants.
4. results
4.1 Multiple regression analysis for tone and segments
The segmental and suprasegmental distances are each correlated separately withintelligibility test scores for Bai and HSH Zhuang. The correlations are given inTable 5. Tone is represented by onset-contour, since that representation showsa stronger correlation with intelligibility (see Section 4.2 below). For bothlanguages, tone and segments both have a strong, significant correlation withintelligibility.
Multiple regression analysis reveals the relative contribution each level makesto intelligibility, seen in Table 6. For Bai, tone is the main predictor ofintelligibility, even more important than the segmental level, which surprisinglyappears as an insignificant variable. In contrast, for HSH Zhuang, both toneand segment levels are significant variables in relation to intelligibility. For bothlanguages, tone makes a significant contribution to intelligibility, but in Bai theresults suggest that tone is more important than segments. These results suggest
215

June 24, 2009 Time: 09:50pm ijhac039.tex
Cathryn Yang and Andy Castro
Table 7. Comparison of tone representations’ correlation with intelligibility for Bai andHSH Zhuang.
Bai Correlation Explained Significantly(r) variance higher than others?
(r2×100, %)
onset-contour −0.75 56 yes, p < .001onset-contour-offset −0.75 56 yes, p < .001contour-offset −0.75 56 yes, p < .01target −0.74 54 noautosegments −0.74 54 noChao’s pitch numbers −0.72 52 no
HSH Zhuang Correlation Explained Significantly(r) variance higher than others?
(r2×100, %)
onset-contour −0.72 52 yes, p < .001onset-contour-offset −0.71 50 yes, p < .05Chao’s pitch numbers −0.68 46 notarget −0.65 42 noautosegments −0.63 40 nocontour-offset −0.62 38 no
that the contribution of tone to intelligibility is significant across East Asian tonelanguages, and for some languages tone may actually be the main predictor ofintelligibility.
4.2 Comparison of different representations of tone
Table 7 shows the Pearson correlation coefficients (r) for the variousrepresentations of tone described in Section 3.1.1 and intelligibility in Baiand HSH Zhuang, as well as the percentage of variance explained (R2). Allcorrelation coefficients are highly significant (p < .0001).
For both Bai and Zhuang, the correlations for onset-contour and onset-contour-offset are significantly higher than other representations. In bothlanguages, onset-contour is higher at a significance level of p < .001, whileonset-contour-offset is higher at a significance level of p < .001 for Bai andof p < .05 for Zhuang. These results suggest that representing tone with onset-contour and onset-contour-offset better approximates intelligibility than otherrepresentations.
In Bai, the correlation for contour-offset was also stronger than others, ata significance level of p < .05. When onset-contour, onset-contour-offset, andcontour-offset were compared to each other, without considering target, Chao,
216

June 24, 2009 Time: 09:50pm ijhac039.tex
Representing tone in Levenshtein distance
or autosegments, none of them was significantly higher. Likewise, for Zhuang,neither onset-contour nor onset-contour-offset was higher than the other.
5. conclusions
We applied Levenshtein distance to Bai dialect data from Allen (2004) andHSH Zhuang dialect data from Castro and Hansen (accepted). We correlatedLevenshtein distance with intelligibility test scores and found significant inversecorrelations in both languages. These findings suggest that Levenshtein distanceis a useful tool for dialectologists working with East Asian tone languages, andthat Levenshtein distance provides a good model for predicting intelligibility inthese languages.
Gooskens and Heeringa (2006) found that the relative contribution of prosodyin Norwegian to perceived distance was negligible, but they did not investigatethe relative contribution to intelligibility. Tang and van Heuven (2007) assertthat in a full-fledged tonal language, like Chinese, the contribution of tone toperceived intelligibility and perceived distance is greater than that found forNorwegian, which only has two tonemes. This research affirms Tang and vanHeuven’s assertion; we find a strong correlation between tonal information andintelligibility, with tone alone able to explain 43 percent of the variance inHSH Zhuang and 56 percent in Bai. This suggests that, in tonal languages,differences in tone have a significant impact on intelligibility. It would beinteresting to compare the relative contributions of consonants, vowels, and tonesto intelligibility to see if tone is the single most salient factor in cross-dialectalcomprehension in tonal languages.
Finally, we used different representations of tone in Levenshtein distanceto see which would show the strongest correlation to intelligibility. Forboth languages, phonetically explicit representations of tone that includedinformation on tonal onset and contour were superior to others. Representationsat a more unspecified, phonemic level such as autosegments and targets showed aweaker correlation with intelligibility. This suggests that cross-dialectal listenersoperate as non-native speakers who use a variety of perceptual cues, rather thanas native speakers who have narrowed in on a subset of salient features.
For Zhuang, onset and contour were essential ingredients for an optimalapproximation of intelligibility, while contour-offset was shown to be less thanoptimal. But for Bai, contour-offset proved superior to autosegment, target,and Chao’s pitch numbers. Thus, at this stage we cannot confirm which ismore perceptually salient to cross-dialectal listeners, the onset or the offset.However, given that both Bai and Zhuang show onset-contour as superior,whereas contour-offset is shown only to be optimal in Bai, preference may begiven to onset-contour representations.
217

June 24, 2009 Time: 09:50pm ijhac039.tex
Cathryn Yang and Andy Castro
One explanation for why onset-contour is optimal can be found by reviewingthe impact of different tone representations illustrated in Table 4 above (seeSection 3.1.1). The distinguishing innovation for Southern Bai is the mid rising(35) tone corresponding to Central and Northern Bai’s high level (55) tone. Bothonset-contour-offset and onset-contour weighs the distance between 35 and 55at least twice the amount of the other representations. Even though these twotones end up at the same pitch level, they begin at different levels and havedifferent contour shapes, making them difficult for cross-dialectal listeners toassimilate into their own system. Thus, the greater the weight assigned to thiskind of difference, the better the inverse correlation with intelligibility.
This research has relevance for the dialectometry of other East Asian tonelanguages, many of which have not yet been the object of serious study. Usingan optimal representation of tone in Levenshtein distance may result in dialectgroupings that are more coherent with the perceptions of listeners, and thereforefrom a more emic perspective. Our findings also have implications for toneperception research, which has mainly focused on native speakers of majorlanguages such as Thai and Chinese (Gandour et al., 2000; Burnham and Francis,1997; Zsiga and Nitisaroj, 2007). Since cross-dialectal listeners are somewhat inbetween native and non-native, perceptual studies of such listeners may revealthat they use a wider range of perceptual cues than native speakers, as suggestedby this research.
acknowledgements
We are grateful to David Bradley and Eric Jackson for comments on this work and to theparticipants at the Methods in Dialectology XIII workshop for their constructive scrutiny. Threeanonymous reviewers also gave insightful and helpful comments.
references
B. Allen (2004), Bai dialect survey, Translated by Zhang Xia. Yunnan Minority LanguageCommission and SIL International Joint Publication Series (Kunming).
F. Blair (1990), Survey on a Shoestring, SIL and UTA Publications in Linguistics 96 (Dallas).D. Bradley (2007), ‘East and South East Asia’, in R. E. Asher and C. Moseley, eds, Atlas of the
World’s Languages (London).D. Burnham and E. Francis (1997), ‘Role of linguistic experience in the perception of Thai
tones’, in A. S. Abramson, ed., Southeast Asian linguistic studies in honor of Vichin Panupong(Bangkok).
E. H. Casad (1974), Dialect intelligibility testing (Dallas).A. Castro and B. Hansen (accepted), ‘Hongshuihe Zhuang dialect intelligibility survey’, SIL
Electronic Survey Reports.Y. Chao (1930), ‘A system of tone letters’, Le Maitre Phonetique, 30, 24–27.S. Duanmu (1994), ‘Against contour tone units’, Linguistic Inquiry, 25.4, 555–608.
218

June 24, 2009 Time: 09:50pm ijhac039.tex
Representing tone in Levenshtein distance
J. Gandour, D. Wong, L. Hsieh, B. Wienzapfel, D. Van Lancker, and G. D. Hutchins (2000),‘A crosslinguistic PET study of tone perception’, Journal of Cognitive Neuroscience, 12, (1),207–222.
C. Gooskens (2006), ‘Linguistic and extra-linguistic predictors of inter-Scandinavianintelligibility’, in J. van de Weijer, and B. Los, eds, Linguistics in the Netherlands 2006(Amsterdam), 101–113.
C. Gooskens and W. Heeringa (2004), ‘Perceptive evaluation of Levenshtein dialect distancemeasurements using Norwegian dialect data’, Language Variation and Change, 16, (03),189–207.
C. Gooskens and W. Heeringa (2006), ‘The relative contribution of pronunciational, lexical, andprosodic differences to the perceived distances between Norwegian dialects’, Literary andLinguistic Computing, 21, (4), 477–492.
W. Heeringa (2004), ‘Measuring pronunciation differences with Levenshtein distance’ (PhDthesis, University of Groningen).
W. Heeringa, P. Kleiweg, C. Gooskens, and J. Nerbonne (2006), ‘Evaluation of string distancealgorithms for dialectology’, in John Nerbonne and Erhard Hinrichs, eds, Linguistic DistancesWorkshop at the joint conference of International Committee on Computational Linguisticsand the Association for Computational Linguistics (Sydney), 51–62.
B. Kessler (1995), ‘Computational dialectology in Irish Gaelic’, Proceedings of the EuropeanACL (Dublin), 60–67.
P. Kleiweg (2004), RuG/L04, software for dialectometrics and cartography [computer program].[2004] <URL: http://www.let.rug.nl/∼kleiweg/indexs.html.> [24 May 2008].
F. Li (1977), A Handbook of Comparative Tai (Honolulu).J. A. Matisoff (2003), Handbook of Proto-Tibeto-Burman: System and Philosophy of Sino-
Tibetan Reconstruction. UC Publications in Linguistics, 135 (Berkeley).X. L. Meng, R. Rosenthal, and D. B. Rubin (1992), ‘Comparing correlated correlation
coefficients’, Psychological Bulletin, 111, (1), 172–175.National Statistics Department (2003), Nian renkou pucha Zhongguo minzu renkou ziliao
[Information on China’s minority population from the 2000 census] (Beijing).C. Tang and V. J. van Heuven. (2007), ‘Mutual inteligibility and similarity of Chinese dialects:
Predicting judgments from objective measures’, in B. Los and M. van Koppen, eds, Linguisticsin the Netherlands (Amsterdam), 223–234.
F. Wang (2005), ‘On the genetic position of the Bai language’, Cahiers de Linguistique – AsieOrientale, 34, 101–127.
F. Wang (2006), Comparison of languages in contact: the distillation method and the case of Bai.Language and Linguistics Monograph Series B: Frontiers in Linguistics III (Taipei).
L. Xu and Y. Zhao (1984), Baiyu Jianzhi [Description of the Bai Language] (Beijing).Y. Xu and Q. E. Wang (2001), ‘Pitch targets and their realization: Evidence from Chinese’, Speech
Communication, 33, 319–337.C. Yang (accepted), ‘Nisu dialect geography’, SIL Electronic Survey Reports.Yunnan Provincial Statistics Department (2004), Yunnan Statistical Yearbook (Beijing).E. Zsiga and R. Nitisaroj (2007), ‘Tone features, tone perception, and peak alignment in Thai’,
Language and Speech, 50, (3), 343–383.
219

June 24, 2009 Time: 09:50pm ijhac039.tex