Cross-modal activation of visual cortex during depth perception using auditory substitution of...
8
Cross-modal activation of visual cortex during depth perception using auditory substitution of vision Laurent Renier, a Olivier Collignon, a Colline Poirier, a Dai Tranduy, a Annick Vanlierde, a Anne Bol, b Claude Veraart, a and Anne G. De Volder a, T a Neural Rehabilitation Engineering Laboratory, Universite ´ Catholique de Louvain, Av Hippocrate, 54, UCL 54-46, B-1200 Brussels, Belgium b Positron Tomography Unit, Universite ´ catholique de Louvain, Brussels, Belgium Received 13 October 2004; revised 3 December 2004; accepted 24 January 2005 Available online 10 March 2005 Previous neuroimaging studies identified multimodal brain areas in the visual cortex that are specialized for processing specific information, such as visual-haptic object recognition. Here, we test whether visual brain areas are involved in depth perception when auditory sub- stitution of vision is used. Nine sighted volunteers were trained blindfolded to use a prosthesis substituting vision with audition both to recognize two-dimensional figures and to estimate distance of an object in a real three-dimensional environment. Using positron emission tomography, regional cerebral blood flow was assessed while the prosthesis was used to explore virtual 3D images; subjects focused either on 2D features (target search) or on depth (target distance comparison). Activation foci were found in visual association areas during both the target search task, which recruited the occipito- parietal cortex, and the depth perception task, which recruited occipito-parietal and occipito-temporal areas. This indicates that some brain areas of the visual cortex are relatively multimodal and may be recruited for depth processing via a sense other than vision. D 2005 Elsevier Inc. All rights reserved. Keywords: Depth perception; Sensory substitution; Brain plasticity; Positron emission tomography; Monocular depth cues; Visual cortex (extrastriate) Introduction Visual depth perception refers to the cognitive processes that lead to the inference of the third dimension from 2D retinal images. Perceiving depth requires the brain to extract and adequately interpret specific monocular and/or binocular cues. Historically, the visual system has been classified into two subsystems, the so- called ventral stream for shape recognition and the dorsal stream for spatial localization (Haxby et al., 1991; Held, 1968; Schneider, 1969; Trevarthen, 1968; Ungerleider and Mishkin, 1982). Because the primary importance of 3D structure is to define spatial layout, one might expect that depth perception recruits mainly brain areas in the dorsal stream (Tsao and Tootell, 2004). However, the cortical network of stereoscopic depth perception (based on binocular disparity) in non-human primates, recruits almost every region of the visual cortex (Adams and Zeki, 2001; Burkhalter and Van Essen, 1986; DeAngelis and Newsome, 1999; Gonzalez and Perez, 1998; Hinkle and Connor, 2001; Poggio, 1995; Sereno et al., 2002; Tsao et al., 2003) including several regions of the temporal lobe (e.g., Janssen et al., 1999, 2000a,b; Maunsell and Van Essen, 1983; Uka et al., 2000). This recruitment of both the ventral and dorsal streams for stereoscopic depth perception was confirmed in human subjects in PET and fMRI brain activation studies (Backus et al., 2001; Cumming, 2002; Gulyas and Roland, 1994; Kourtzi et al., 2003; Ptito et al., 1993; Rutschman and Greenlee, 2004). This wide cerebral network is also recruited when depth perception is based on static (or pictorial) monocular depth cues, such as shading (Inui et al., 2000; Taira et al., 2001). Although depth perception is usually considered to be depend- ent on vision, it can also be accessed through other sensory modalities such as audition (e.g., Bronkhorst and Houtgast, 1999; Kitagawa and Ichihara, 2002) or sensory substitution of vision using tactile (e.g., Bach-y-Rita, 1972) or auditory input. Sensory substitution (Bach-y Rita et al., 1969) refers to the use of one human sense to receive information normally gathered by another sensory organ (Kaczmarek, 1995). Sensory substitution systems aim to provide blind people with coded information related to the lost perception (Veraart, 1989) in a rehabilitation paradigm. However, these systems may also be considered as research tools to explore cognitive and brain mechanisms involved in perceptual phenomena such as optical illusions (Renier et al., 2003a) and depth perception. Despite the growing number of functional imaging studies dealing with sensory substitution and depth perception, nothing is known about the brain regions involved in depth processing when a sensory substitution device is used. If 1053-8119/$ - see front matter D 2005 Elsevier Inc. All rights reserved. doi:10.1016/j.neuroimage.2005.01.047 T Corresponding author. Fax: +32 2 764 94 22. E-mail address: [email protected] (A.G. De Volder). Available online on ScienceDirect (www.sciencedirect.com). www.elsevier.com/locate/ynimg NeuroImage 26 (2005) 573 – 580
Transcript of Cross-modal activation of visual cortex during depth perception using auditory substitution of...

www.elsevier.com/locate/ynimg
NeuroImage 26 (2005) 573–580
Cross-modal activation of visual cortex during depth
perception using auditory substitution of vision
Laurent Renier,a Olivier Collignon,a Colline Poirier,a Dai Tranduy,a Annick Vanlierde,a
Anne Bol,b Claude Veraart,a and Anne G. De Voldera,TaNeural Rehabilitation Engineering Laboratory, Universite Catholique de Louvain, Av Hippocrate, 54, UCL 54-46, B-1200 Brussels, BelgiumbPositron Tomography Unit, Universite catholique de Louvain, Brussels, Belgium
Received 13 October 2004; revised 3 December 2004; accepted 24 January 2005
Available online 10 March 2005
Previous neuroimaging studies identified multimodal brain areas in the
visual cortex that are specialized for processing specific information,
such as visual-haptic object recognition. Here, we test whether visual
brain areas are involved in depth perception when auditory sub-
stitution of vision is used. Nine sighted volunteers were trained
blindfolded to use a prosthesis substituting vision with audition both
to recognize two-dimensional figures and to estimate distance of an
object in a real three-dimensional environment. Using positron
emission tomography, regional cerebral blood flow was assessed while
the prosthesis was used to explore virtual 3D images; subjects focused
either on 2D features (target search) or on depth (target distance
comparison). Activation foci were found in visual association areas
during both the target search task, which recruited the occipito-
parietal cortex, and the depth perception task, which recruited
occipito-parietal and occipito-temporal areas. This indicates that some
brain areas of the visual cortex are relatively multimodal and may be
recruited for depth processing via a sense other than vision.
D 2005 Elsevier Inc. All rights reserved.
Keywords: Depth perception; Sensory substitution; Brain plasticity;
Positron emission tomography; Monocular depth cues; Visual cortex
(extrastriate)
Introduction
Visual depth perception refers to the cognitive processes that
lead to the inference of the third dimension from 2D retinal images.
Perceiving depth requires the brain to extract and adequately
interpret specific monocular and/or binocular cues. Historically, the
visual system has been classified into two subsystems, the so-
called ventral stream for shape recognition and the dorsal stream
1053-8119/$ - see front matter D 2005 Elsevier Inc. All rights reserved.
doi:10.1016/j.neuroimage.2005.01.047
T Corresponding author. Fax: +32 2 764 94 22.
E-mail address: [email protected] (A.G. De Volder).
Available online on ScienceDirect (www.sciencedirect.com).
for spatial localization (Haxby et al., 1991; Held, 1968; Schneider,
1969; Trevarthen, 1968; Ungerleider and Mishkin, 1982). Because
the primary importance of 3D structure is to define spatial layout,
one might expect that depth perception recruits mainly brain areas
in the dorsal stream (Tsao and Tootell, 2004). However, the cortical
network of stereoscopic depth perception (based on binocular
disparity) in non-human primates, recruits almost every region of
the visual cortex (Adams and Zeki, 2001; Burkhalter and Van
Essen, 1986; DeAngelis and Newsome, 1999; Gonzalez and Perez,
1998; Hinkle and Connor, 2001; Poggio, 1995; Sereno et al., 2002;
Tsao et al., 2003) including several regions of the temporal lobe
(e.g., Janssen et al., 1999, 2000a,b; Maunsell and Van Essen, 1983;
Uka et al., 2000). This recruitment of both the ventral and dorsal
streams for stereoscopic depth perception was confirmed in human
subjects in PET and fMRI brain activation studies (Backus et al.,
2001; Cumming, 2002; Gulyas and Roland, 1994; Kourtzi et al.,
2003; Ptito et al., 1993; Rutschman and Greenlee, 2004). This wide
cerebral network is also recruited when depth perception is based
on static (or pictorial) monocular depth cues, such as shading (Inui
et al., 2000; Taira et al., 2001).
Although depth perception is usually considered to be depend-
ent on vision, it can also be accessed through other sensory
modalities such as audition (e.g., Bronkhorst and Houtgast, 1999;
Kitagawa and Ichihara, 2002) or sensory substitution of vision
using tactile (e.g., Bach-y-Rita, 1972) or auditory input. Sensory
substitution (Bach-y Rita et al., 1969) refers to the use of one
human sense to receive information normally gathered by another
sensory organ (Kaczmarek, 1995). Sensory substitution systems
aim to provide blind people with coded information related to the
lost perception (Veraart, 1989) in a rehabilitation paradigm.
However, these systems may also be considered as research tools
to explore cognitive and brain mechanisms involved in perceptual
phenomena such as optical illusions (Renier et al., 2003a) and
depth perception. Despite the growing number of functional
imaging studies dealing with sensory substitution and depth
perception, nothing is known about the brain regions involved in
depth processing when a sensory substitution device is used. If

L. Renier et al. / NeuroImage 26 (2005) 573–580574
similar brain areas are used when perceiving depth with vision and
with a vision sensory substitution device, it would indicate
common cognitive processes. It would also indicate that the
activated brain areas specializing in depth processing are not
specific to vision and/or that perceptions obtained via auditory
substitution of vision are visual in nature.
The purpose of the present study was to investigate the neural
substrates of depth perception when a device substituting vision
with audition was used. More precisely, using positron emission
tomography (PET), we wanted to examine whether 2D and 3D
perception with the sensory substitution device recruited similar
brain areas as in vision. In this perspective, a recruitment of areas
in both the ventral and dorsal streams was specifically expected
during depth perception using sensory substitution.
Materials and methods
Subjects
Nine male volunteers were involved in the study (mean age FSD was 29.4 F 12.4 years). They were without any recorded
history of neurological or psychiatric problems and had a normal
magnetic resonance imaging (MRI) scan. All but two subjects were
right-handed. Subjects underwent an audiometric test to adapt the
Fig. 1. (a) The prosthesis substituting vision with audition, or PSVA (Capelle et al
(attached to glasses) allows on line translation of visual patterns into sounds that ar
used in the PET study. To avoid head movements during the PET study, a joystick
the virtual scenes used in the experimental conditions of the PET study, with the
schematization of the environment in which subjects were trained to perceive dept
be used as depth cues to estimate the distance of the targets (the horizontal bars) a
whereas its central part (the fovea) is mainly used for object recognition and the pe
artificial retina of the PSVAwhen the covered part of the virtual scene (see c) is p
Materials and methods). The larger the stimulus, the greater the activation of the
amplitudes of each sound of the prosthesis to their spectral
sensitivity. Written informed consent was obtained before the
study. The protocol was approved by the Biomedical Ethics
Committee of the school of Medicine of the Universite Catholique
de Louvain.
Sensory substitution equipment
The prosthesis substituting vision with audition (PSVA) has
been described in detail elsewhere (Capelle et al., 1998). Briefly,
black and white images from a miniature head-mounted video
camera (frame rate = 12.5 Hz) are translated in real-time into
sounds that the subject hears through headphones (see Fig. 1a).
The system combines an elementary model of the human retina
with an inverse model of the cochlea. The camera image is
pixelated according to a dual resolution model of the human
retina (see Fig. 1d). This artificial retina consists of a square
matrix of 8 � 8 large pixels with the four central ones replaced
by 8 � 8 smaller pixels representing the fovea. The fovea,
therefore, has four times the resolution of the periphery. A single
sinusoidal tone is assigned to each pixel of the artificial retina
with frequencies increasing from left to right and from bottom to
top; frequencies range between 50 and 12,526 Hz. The greyscale
level of each pixel modulates the amplitude of its corresponding
sine wave. The final auditory output of the PSVA is the real-
, 1998), used in the behavioral experiments. A head-mounted video camera
e transmitted to the subject through headphones. (b) The experimental set-up
is used to control the displacements of the PSVA artificial retina. (c) One of
layout of the artificial retina superimposed (in yellow). This 3D scene is a
h. The perceived size, the height in the image and the linear perspective can
nd to perceive depth. The entire artificial retina is used to explore the image
riphery is usually used for object localization. (d) The activated pixels of the
erceived. The coding scheme is based on a pixel-frequency association (see
corresponding pixels, that is, the darker they are.
L. Renier et al. / NeuroImage 26 (2005) 573–580 575
time weighted sum of all 124 sine waves. The PSVA was further
adapted according to the constraints of the PET technique,
mainly due to the fact that the subjects could not move their
head to explore a scene. Therefore, a new interface was
implemented to control the movements of the artificial retina
relative to the virtual scenes (see Fig. 1c) using a joystick (Fig.
1b). Only the training phase for the joystick and the PET study
were performed with this adapted PSVA interface.
Experimental design
Before the PET study, subjects were involved in several
training sessions aiming at (1) learning the PSVA code and (2)
mastering the use of the PSVA to locate and estimate the distance
to an object, as well as to perceive depth from pictorial monocular
cues. A last training session was dedicated to transferring these
abilities to the adapted PSVA using the joystick (3). Subjects were
always blindfolded during PSVA use, including during the PET
studies.
Learning the PSVA code
This training phase (adapted from Arno et al., 1999) consisted
of five 1-h sessions followed by an evaluation session. Subjects
were taught to recognize two-dimensional figures formed with
vertical, horizontal, or oblique lines and were provided with tactile
feedback; verbal cues were supplied as necessary. The evaluation
procedure was identical to the one used by Arno et al. (1999). After
each trial, subjects re-created their observations with a set of metal
bars. A score ranging from 0 to 1 was then assigned, based on how
well the re-creation matched the stimulus pattern.
Training to depth perception with the PSVA
Subjects were trained to localize and grasp an object in a real
(3D) environment during three learning sessions followed by an
evaluation session. In this training, the subjects were taught
some static (or pictorial) monocular depth cues, such as relative
size, linear perspective, and height in the field of view. During
the three training sessions, subjects were asked to locate a white
cube using the PSVA and then to grasp it. This task required
object localization with egocentric distance estimation in the 3D-
space according to depth cues, which requires depth perception.
During the evaluation phase, subjects only had to localize this
cube in the 3D environment with the PSVA, again basing their
judgment on depth cues. Then, the PSVA was turned off, the
cube was removed, and the subjects had to re-place it by hand
in the 3D environment as accurately as possible. Performance
was assessed by measuring the difference between the depth
position of the cube as replaced by the subject and its initial
position.
Learning to use the joystick with the PSVA
A last training session was dedicated to the transfer of the
PSVA expertise with the head-mounted video-camera to the
joystick version. Subjects explored several virtual 3D scenes with
the joystick to find targets (3 to 5 horizontal bars of different sizes).
They performed the task in a supine position to familiarize them
with the conditions of the PET study. Subjects performed the task
until they succeeded in finding all the targets in less than 90 s.
Although the adaptation to the joystick interface required the
subjects to make some adjustments, they all acquired the requested
skill in less than 1 h.
Stimuli and tasks used in the PET study
A virtual 3D scene was designed with two horizontal bars of
different size (the targets) disposed between a perspective view
made of vertical bars linked with converging oblique lines (see
Fig. 1c). Eight variants of this scene were used in the PET
study. In four of them, the position of the two targets was
congruent with the perspective effect induced by the surround-
ing bars, that is, the smaller target was closer to the vanishing
point than the larger target. In the other four variants, the
position of the targets and the perspective effect were
incongruent. Three monocular depth cues were used in the
congruent scenes: (i) the relative target size, which varies with
its distance from the viewer, (ii) the relative vertical position of
the target (targets closer to the horizon, that is, the horizontal
line passing through the vanishing point of the oblique lines,
appear to be further away), and (iii) the linear perspective. The
position of the targets differed in the four variants of the
bcongruentQ and bincongruentQ categories.
These stimuli were used for each of the three experimental
conditions: target search, target size comparison and target
distance estimation based on depth cues (depth condition). The
stimuli varied across the conditions and the subjects, but only the
stimuli of the bcongruentQ category were used for the depth
condition. In addition, noise stimuli were used in a control
condition. These noise stimuli matched the PSVA sounds for
frequency, duration and intensity ranges but were meaningless
(see also Arno et al. (2001) and De Volder et al. (2001)). All
stimuli were created using a National Instruments LabviewRsoftware.
Familiarization to the experimental procedure
Just before the PET study, a rehearsal session took place in the
gantry to instruct subjects with all conditions, to verify that they
understood the tasks, and to help them to relax during the PET
study.
Positron emission tomography
Experimental conditions during the PET study
Subjects were studied under 5 conditions, each of them
being repeated twice in counterbalanced order across the
subjects: (1) resting state condition (REST); (2) active listening
to noise sounds with blanks detection (SOUND); (3) target
search (here horizontal bars) within the virtual environment
composed of vertical and oblique bars (see Fig. 1c) using the
adapted PSVA (FORM); (4) size comparison of detected targets
using the adapted PSVA (SIZE); (5) distance comparison of
detected targets using the adapted PSVA (DEPTH). The first
and the 10th scans in each subject were always achieved in the
REST condition. Two scans of the same condition were never
consecutive. The design of the REST, SOUND, SIZE and
DEPTH was categorical and hierarchical since each experimen-
tal condition involved the same cognitive processes as the
previous one in the list plus one which was the process of
interest.
During REST, the subjects were instructed to relax without
focusing their mind on anything. No auditory stimulation was
provided. In the SOUND condition, subjects were required to
detect blanks inserted in the sounds sequences and to press the
joystick button upon detection. In the FORM condition, subjects
were instructed to explore the virtual scene using the joystick, and

L. Renier et al. / NeuroImage 26 (2005) 573–580576
to press the joystick button when the horizontal bar targets were
in the fovea of the artificial retina. In the SIZE condition, subjects
were asked to compare the size of the detected targets to
determine which was larger. They responded by pressing the
joystick button when the chosen target lay in the fovea of the
artificial retina of the PSVA. In the DEPTH condition, subjects
were requested to compare the egocentric distance to the detected
targets based on the available depth cues. For this last condition
only, subjects were informed that the virtual scene was a
schematization of the real (3D) environment used in the training
phase.
Data acquisition
Measurements of local radioactivity uptake were made using
an ECAT EXACT-HR PET tomograph (CTI/Siemens), which
allows simultaneous imaging of 47 transaxial slices in three-
dimensional (3D, septa retracted) mode, with an effective
resolution of 8-mm full width at half-maximum (FWHM)
(Wienhard et al., 1994) and a slice thickness of 3.125 mm. All
images were reconstructed, using a standard ECAT software
(3DRP algorithm), including scatter correction, with both a
transaxial Hanning filter (cutoff frequency of 0.30) and an axial
Hanning filter (cutoff frequency of 0.50, i.e., Nyquist frequency).
Correct positioning of the subject in the gantry was ascertained by
aligning two sets of low-power laser beams with the canthomeatal
line and the sagittal line, respectively. Head-restraining adhesive
bands were used. For radiotracer injection, a 22-gauge catheter
was placed in the antecubital vein of the left or right arm. Prior to
tracer administration, each subject underwent a 15-min trans-
mission scan performed with retractable germanium-68 rotating
rod sources, allowing the subsequent correction of emission
images for attenuation. Transmission scans were acquired with a
rod-windowing technique (Jones et al., 1995) producing scatter-
free attenuation correction. Cerebral blood flow measurement was
then performed using a 20-s bolus of oxygen-15-labeled water (8
mCi, 296 MBq). Stimulation sequences and PET acquisition were
started 10 s after the initiation of tracer injection. Integrated
counts accumulated during 90-s scans were used as an index of
regional cerebral blood flow (rCBF) (Mazziotta et al., 1985).
Time interval between successive emission scans was 13 min,
which allowed decay of residual radioactivity.
For each subject, 3D MRI anatomical data were also obtained
on a 1.5-T unit (General Electric Signa) using a spoiled grass
technique. T1-weighted images (TR = 25 ms, TE = 6 ms, flip angle
258, slice thickness 1.5 mm) were obtained in the bicommissural
(AC-PC) orientation.
Image analysis
Individual PET images were aligned to correct for possible
interscan movements and coregistered to the subject’s MRI using
AIR 3.0 (Woods et al., 1998a,b). The resulting matching brain
images (MRI and coregistered PET) were spatially normalized
with statistical parametric mapping (SPM) (Wellcome Department
of Cognitive Neurology), in the referential defined by the atlas of
Talairach and Tournoux (1988) and the MRI template supplied by
the Montreal Neurological Institute (MNI) to allow group analysis
(voxel size: 2 � 2 � 2 mm). The accuracy of realignment and
normalization procedure was assessed with interactive home-made
image display software (Michel et al., 1995) implemented in IDL
language (IDL Research Systems, Inc). Finally, the PET images
were smoothed with an isotropic Gaussian filter (15-mm full-width
at half maximum) and were corrected for differences in global
activity by proportional scaling (Fox et al., 1988). In order to
identify the regions showing significant rCBF changes, statistics
were computed on a voxel-by-voxel basis, using the general linear
model (Friston et al., 1995). The resulting voxels set of each
contrast constitutes a statistical parametric map of the t statistic,
SPM{t}, which was then transformed to the unit normal
distribution SPM{Z}. This allowed the overlay of the obtained t
maps on each spatially normalized MRI. Statistical analysis was
performed using a multi-subject design (with replication) (SPM 99,
Wellcome Department of Cognitive Neurology).
Since a hierarchical design was used, the DEPTH condition
could be contrasted with respect to the other conditions.
Accordingly, (DEPTH � SOUND) subtracted the brain activity
related to auditory stimulation and to the manipulation of the
joystick from the experimental condition, while (DEPTH �FORM) further subtracted the brain activity related to the target
search and form identification. The last contrast (DEPTH � SIZE)
subtracted brain activity related to size judgment from distance
estimation based on depth cues. All contrasts were additionally
masked by the difference between the more complex condition
and the REST condition (e.g., DEPTH � REST was used as
inclusive mask for the contrast DEPTH � SIZE), to ensure that all
activation foci detected with the contrasts were related to
activation well above the basal resting state. Only regions which
were significantly activated at P b 0.001 (uncorrected for multiple
comparisons) or P b 0.05 (corrected for multiple comparisons)
were considered.
Results
Behavioral results
At the end of the training phase to learn the PSVA code,
subjects obtained a mean score of 77% of correct responses (SD =
15) in the pattern recognition task. This performance level was
considered to be high enough to justify continuing the study.
After training for depth perception in a real 3D environment, the
subjects demonstrated a satisfactory level of performance (N90% of
accuracy in object remoteness estimation using the PSVA).
Accordingly, we considered that the subjects were able to perceive
depth with the PSVA and were ready to undergo the PET study.
For the tasks carried out during the PET study, the scores were
respectively 97% (SD = 5) of successful blank detection in the
SOUND condition, 97% (SD = 8) of successful target detection in
the FORM condition, 100% (SD = 0) of correct responses in the
SIZE condition and 94% (SD = 17) of correct responses in the
DEPTH condition. These results indicated an accurate execution of
the tasks performed during the PET acquisitions.
PET results
Main effect of depth perception versus size comparison
When the depth perception condition was contrasted with the
size comparison condition (DEPTH � SIZE masked by DEPTH �REST), six distinct brain areas were found to be active (Table 1):
the fusiform gyrus (BA37, Fig. 2) was bilaterally activated, as well
as the left superior parietal lobule (BA 7), the left (BA 7) and right
precuneus (BA 19), and the left inferior parietal lobule (BA 19 and
BA 40).
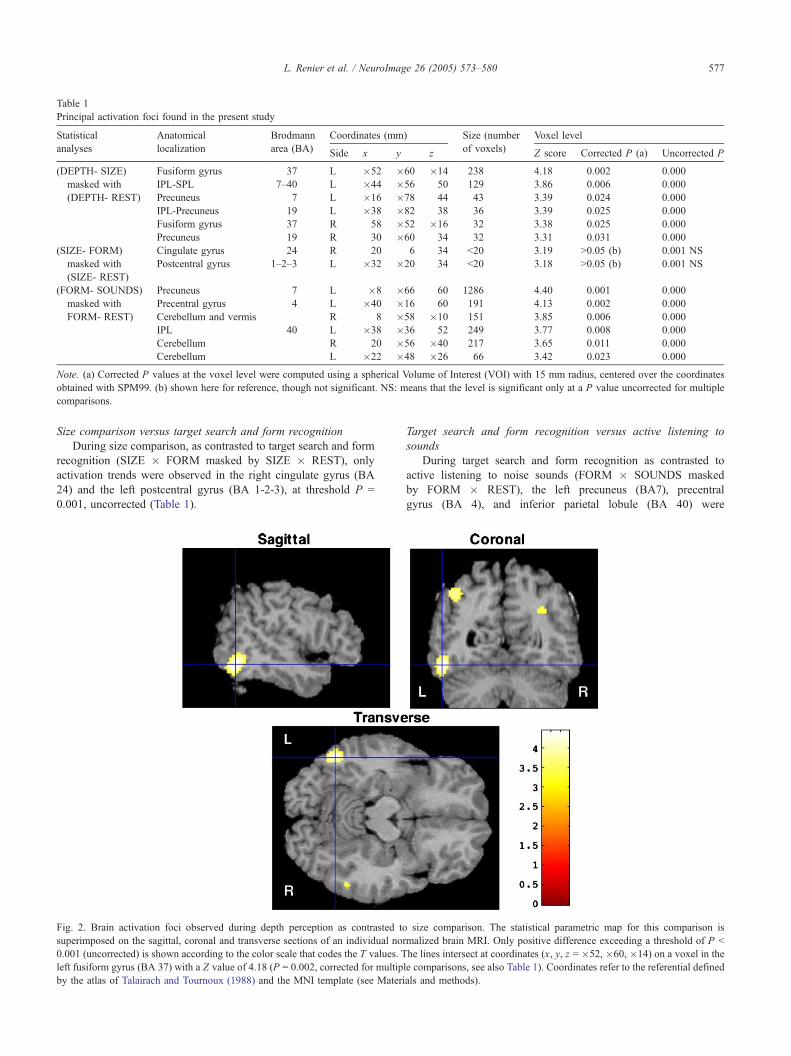
Table 1
Principal activation foci found in the present study
Statistical
analyses
Anatomical
localization
Brodmann
area (BA)
Coordinates (mm) Size (number
of voxels)
Voxel level
Side x y z Z score Corrected P (a) Uncorrected P
(DEPTH- SIZE)
masked with
(DEPTH- REST)
Fusiform gyrus 37 L �52 �60 �14 238 4.18 0.002 0.000
IPL-SPL 7–40 L �44 �56 50 129 3.86 0.006 0.000
Precuneus 7 L �16 �78 44 43 3.39 0.024 0.000
IPL-Precuneus 19 L �38 �82 38 36 3.39 0.025 0.000
Fusiform gyrus 37 R 58 �52 �16 32 3.38 0.025 0.000
Precuneus 19 R 30 �60 34 32 3.31 0.031 0.000
(SIZE- FORM)
masked with
(SIZE- REST)
Cingulate gyrus 24 R 20 6 34 b20 3.19 N0.05 (b) 0.001 NS
Postcentral gyrus 1–2–3 L �32 �20 34 b20 3.18 N0.05 (b) 0.001 NS
(FORM- SOUNDS)
masked with
FORM- REST)
Precuneus 7 L �8 �66 60 1286 4.40 0.001 0.000
Precentral gyrus 4 L �40 �16 60 191 4.13 0.002 0.000
Cerebellum and vermis R 8 �58 �10 151 3.85 0.006 0.000
IPL 40 L �38 �36 52 249 3.77 0.008 0.000
Cerebellum R 20 �56 �40 217 3.65 0.011 0.000
Cerebellum L �22 �48 �26 66 3.42 0.023 0.000
Note. (a) Corrected P values at the voxel level were computed using a spherical Volume of Interest (VOI) with 15 mm radius, centered over the coordinates
obtained with SPM99. (b) shown here for reference, though not significant. NS: means that the level is significant only at a P value uncorrected for multiple
comparisons.
L. Renier et al. / NeuroImage 26 (2005) 573–580 577
Size comparison versus target search and form recognition
During size comparison, as contrasted to target search and form
recognition (SIZE � FORM masked by SIZE � REST), only
activation trends were observed in the right cingulate gyrus (BA
24) and the left postcentral gyrus (BA 1-2-3), at threshold P =
0.001, uncorrected (Table 1).
Fig. 2. Brain activation foci observed during depth perception as contrasted to
superimposed on the sagittal, coronal and transverse sections of an individual nor
0.001 (uncorrected) is shown according to the color scale that codes the T values. T
left fusiform gyrus (BA 37) with a Z value of 4.18 (P = 0.002, corrected for multip
by the atlas of Talairach and Tournoux (1988) and the MNI template (see Materi
Target search and form recognition versus active listening to
sounds
During target search and form recognition as contrasted to
active listening to noise sounds (FORM � SOUNDS masked
by FORM � REST), the left precuneus (BA7), precentral
gyrus (BA 4), and inferior parietal lobule (BA 40) were
size comparison. The statistical parametric map for this comparison is
malized brain MRI. Only positive difference exceeding a threshold of P b
he lines intersect at coordinates (x, y, z = �52, �60, �14) on a voxel in the
le comparisons, see also Table 1). Coordinates refer to the referential defined
als and methods).

L. Renier et al. / NeuroImage 26 (2005) 573–580578
activated, as well as the vermis and the cerebellum bilaterally
(Table 1).
Discussion
The present study demonstrated a selective activation of both
occipito-parietal and occipito-temporal areas in sighted volunteers
who were blindfolded and used an auditory vision substitution
device to perceive depth. Target search and form recognition with
the same device activated occipito-parietal areas and the cerebel-
lum in accordance with a previous study (Arno et al., 2001).
This experiment was undertaken to investigate the neural
network involved in depth perception when a device substituting
vision with audition was used. Due to the methodological
constraints inherent to the PET technique, virtual images were
explored using a joystick. Although those conditions were not very
natural, subjects were familiar with virtual 3D scenes given their
visual experience. They also demonstrated an equivalent level of
mastery of the adapted PSVA with a joystick, as compared to that
of the PSVA head-mounted camera. Furthermore, although head
motion may provide information about distance, such dynamic
cues were not necessary for distance estimation during training,
which was based on static monocular depth cues. Therefore, using
the joystick to explore virtual scenes differs from using head-
movements only in that it is less natural and intuitive. In the
present study, the accurate completion of a distance comparison
task was considered as an indicator of depth perception. The
subjects based their judgment on available pictorial monocular
depth cues. Accordingly, successful completion of the distance
comparison task required a three-dimensional perception of the
scene. Finally, a vision control group was not available for us to
determine the neural substrates of visual depth perception induced
by our stimuli. Therefore, the results are discussed with reference
to the few available neuroimaging studies dealing with visual depth
perception from static monocular depth cues. Although the stimuli
and tasks were obviously different in these studies, the kind of
perception obtained (i.e., depth perception) and the activation foci
(i.e., an activation of both the dorsal and the ventral streams) were
similar in all referenced studies. Notwithstanding these limitations,
the present study provides the first data concerning the neural
substrates of depth perception during a sensory substitution
procedure.
The observed activation of both dorsal (BA 7 and BA 40) and
ventral (BA 37) visual pathways during depth perception via
sensory substitution is quite similar to those obtained in vision
during depth perception from static monocular cues (e.g., Inui et
al., 2000; Taira et al., 2001). These similar activation pattern
indicate either that these brain areas are relatively multimodal and
deal specifically with depth perception whatever the sensory
modality used, or that perception obtained via sensory substitution
of vision may recruit visual processes. These hypotheses are not
mutually exclusive. Some visual brain areas have multimodal
functional properties and may be activated by touch and/or
audition (e.g., Bqchel et al., 1998; Wallace et al., 2004) in
addition to vision. Occipito-temporal regions, especially the lateral
occipital cortex (LOC) are recruited both during visual and haptic
object identification (Amedi et al., 2001, 2002; Deibert et al.,
1999; James et al., 2002; Stoeckel et al., 2003; Zhang et al.,
2004). In the same way, some regions of the dorsal visual stream,
especially the parieto-occipital cortex (POC) are active during
tactile discrimination of grating orientation (Sathian et al., 1997;
Zangaladze et al., 1999) as in vision (Sergent et al., 1992). These
multimodal brain areas may support adaptive brain changes
(plasticity) in case of visual deprivation (Rauschecker, 1995). In
the present study, it is obvious that only visual brain areas were
recruited during depth perception. Furthermore, despite the use of
an arbitrary auditory code, depth perception with the sensory
substitution device was based on specific visual depth cues that
depend on previous visual experience (Gregory and Wallace 1963;
Heller et al., 1996; Renier et al., 2003b). This supports the
concept that perceptions obtained by sensory substitution of
vision are visual in nature. In addition, the observed modulation
of the brain activation between 2D and 3D perception (i.e.,
according to what was perceived) further indicates that sensory
substitution is governed by similar rules as vision since different
patterns of brain activity have been demonstrated in vision when
2D forms and 3D figures were contrasted (e.g., Ptito et al., 1993).
Finally, we cannot exclude the possibility that the recruitment of
visual brain areas was related to some visualization process that
could contribute to the perception with a sensory substitution
device, as was demonstrated for haptic perception (Prather et al.,
2004; Sathian et al., 1997; Zhang et al., 2004). If indeed
visualization plays a major role in successful use of the PSVA
in sighted subjects, a fundamental difference should be found
between early and late blind subjects. Supporting the hypothesis
of visualization, preliminary data obtained in congenitally blind
subjects led us to conclude the absence of any specific brain
activation for depth judgments using the PSVA. Further studies in
early blind subjects and late blind volunteers are needed, however,
to clarify the role of visual experience and of visual deprivation
on this perception.
In the present study, we reported a parietal activation during
target search and form recognition in sighted subjects, and no
recruitment of the ventral visual pathway during this task. The
parietal cortex is known to be involved in visual target search
(Ashbridge et al., 1997, 1999; Corbetta et al., 1995; Coull et al.,
2003; Donner et al., 2000, 2003; Eglin et al., 1991; Friedman-Hill
et al., 1995; Olivers and Humphreys, 2004; Shafritz et al., 2002;
Shimozaki et al., 2003; Walsh et al.,1999) but the absence of
activation in the temporal lobe during form recognition with the
PSVA represents a difference with regard to vision. Visual
perception of 2D figures is usually processed by brain regions in
the ventral visual pathway, especially the inferior temporal cortex
(Felleman and Van Essen, 1991; Logothesis and Sheinberg, 1996;
Pasupathy and Connor, 2001; Schwartz et al., 1983; Tanaka et al.,
1991, 2000; Ungerleider and Mishkin, 1982). However, due to the
characteristics of the PSVA, spatial strategies that mainly recruit
the dorsal visual pathway are predominantly employed when using
the device, even for 2D figure recognition (Arno et al., 2001). This
is due to the fact that perception with the PSVA, as compared to
vision, is mainly analytic and sequential given the small size of the
perceptual field and the limited number of frequencies that can be
transmitted to the user without saturating the auditory channel. In
addition, the targets used in the present study (horizontal bars)
were very simple and maybe too basic or insufficiently detailed to
activate the ventral pathway. In the same way, no additional
activation was obtained in the size condition when contrasted with
target search and form recognition using the prosthesis. This is
probably because the target search and size recognition tasks were
too similar to each other and involved comparable cognitive
processes.

L. Renier et al. / NeuroImage 26 (2005) 573–580 579
The present study showed that perception of a 3D scene with a
sensory substitution system involved spatial strategies that
recruited predominantly occipito-parietal areas and, to a lesser
extent, brain areas of the ventral visual pathway, as in vision. This
cross-modal recruitment of visual association areas could be the
neural substrate of a visual-like perception with auditory sub-
stitution of vision. Additional experiments are needed to verify
whether the same activation patterns may be induced by depth
perception in the absence of vision, that is, in subjects affected by
congenital blindness.
Acknowledgments
The authors wish to acknowledge the cyclotron staff, D. Labar
for isotope preparation, B. Gerard for skillful technical assistance,
Dr. M. Brelen for medical support, R. Bausart for PET data
acquisition and Dr. I. Obeid for his helpful comments. ADV is
senior research associate at the Belgian National Fund for
Scientific Research. This work was supported by the Belgian
FMSR (grant 3.4547.00) and the Commission of European Union
(Quality of Life contract No. QLG3-CT-2000-01797).
References
Adams, D., Zeki, S., 2001. Functional organization of macaque V3 for
stereoscopic depth. J. Neurophysiol. 86, 2195–2203.
Amedi, A., Malach, R., Hendler, T., Peled, S., Zohary, E., 2001. Visuo-
haptic object related activation in the ventral visual pathway. Nat.
Neurosci. 4, 324–330.
Amedi, A., Jacobson, G., Hendler, T., Malach, R., Zohary, E., 2002.
Convergence of visual and tactile shape processing in the human lateral
occipital complex. Cereb. Cortex 12, 1202–1212.
Arno, P., Capelle, C., Wanet-Defalque, M.-C., Catalan-Ahumada, M.,
Veraart, C., 1999. Auditory coding of visual patterns for the blind.
Perception 28, 1013–1029.
Arno, P., De Volder, A.G., Vanlierde, A., Wanet-Defalque, M.-C., Streel, E.,
Robert, A., Sanabria-Bohorquez, S., Veraart, C., 2001. Occipital
activation by pattern recognition in the early blind using auditory
substitution for vision. NeuroImage 13, 632–645.
Ashbridge, E., Walsh, V., Cowey, A., 1997. Temporal aspects of visual
search studied by transcranial magnetic stimulation. Neuropsychologia
35, 1121–1131.
Ashbridge, E., Cowey, A., Wade, A., 1999. Does parietal cortex contribute
to feature binding? Neuropsychologia 37, 999–1004.
Bach-y-Rita, P., 1972. Brain mechanisms in sensory substitution. Academic
Press, San Diego.
Bach-y Rita, P., Collins, C.C., Saunders, F., White, B., Scadden, L., 1969.
Vision substitution by tactile image projection. Nature 221, 963–964.
Backus, B.T., Fleet, D.J., Parker, A.J., Heeger, D.J., 2001. Human cortical
activity correlates with stereoscopic depth perception. J. Neurophysiol.
86, 2054–2068.
Bqchel, C., Price, C., Friston, K., 1998. A multimodal language region in
the ventral visual pathway. Nature 394, 274–277.
Burkhalter, A., Van Essen, D.C., 1986. Processing of color, form and
disparity information in visual areas VP and V2 of ventral extrastriate
cortex in the macaque monkey. J. Neurosci. 6, 2327–2351.
Bronkhorst, A.W., Houtgast, T., 1999. Auditory distance perception in
rooms. Nature 397, 517–520.
Capelle, C., Trullemans, C., Arno, P., Veraart, C., 1998. A real time
experimental prototype for enhancement of vision rehabilitation using
auditory substitution. IEEE Trans. Biomed. Eng. 45, 1279–1293.
Corbetta, M., Shulman, G.L., Miezin, F.M., Petersen, S.E., 1995. Superior
parietal cortex activation during spatial attention shifts and visual
feature conjunction. Science 270, 802–805.
Coull, J.T., Walsh, V., Frith, C.D., Nobre, A.C., 2003. Distinct neural
substrates for visual search amongst spatial versus temporal distractors.
Cogn. Brain Res. 17, 368–379.
Cumming, B., 2002. Stereopsis, where depth is seen. Curr. Biol. 12, 93–95.
DeAngelis, G.C., Newsome, W.T., 1999. Organization of disparity-selective
neurons in macaque area MT. J. Neurosci. 19, 1398–1415.
Deibert, E., Kraut, M., Kremen, S., Hart Jr., J., 1999. Neural pathways in
tactile object recognition. Neurology 52, 1413–1417.
De Volder, A.G., Toyama, H., Kimura, Y., Kiyosawa, M., Nakano, H.,
Vanlierde, A., Wanet-Defalque, M.C., Mishina, M., Oda, K., Ishiwata,
K., Senda, M., 2001. Auditory triggered mental imagery of shape
involves visual association areas in early blind humans. NeuroImage 14,
129–139.
Donner, T.H., Kettermann, A., Diesch, E., Ostendorf, F., Villringer, A.,
Brandt, S.A., 2000. Involvement of the human frontal eye field and
multiple parietal areas in covert visual selection during conjunction
search. Eur. J. Neurosci. 12, 3407–3414.
Donner, T.H., Kettermann, A., Diesch, E., Villringer, A., Brandt, S.A.,
2003. Parietal activation during visual search in the absence of multiple
distractors. NeuroReport 14, 2257–2261.
Eglin, M., Robertson, L.C., Knight, R.T., 1991. Cortical substrates
supporting visual search in humans. Cereb. Cortex 1, 262–272.
Felleman, D.J., Van Essen, D.C., 1991. Distributed hierarchical processing
in the primate cerebral cortex. Cereb. Cortex 1, 1–47.
Fox, P.T., Mintun, M.A., Reiman, E.M., Raichle, M.E., 1988. Enhanced
detection of focal brain response using intersubject avering and change
distribution analysis of subtracted PET images. J. Cereb. Blood Flow
Metab. 8, 642–653.
Friedman-Hill, S.R., Robertson, L.C., Treisman, A., 1995. Parietal
contribution to visual feature binding, evidence from a patient with
bilateral lesions. Science 269, 853–855.
Friston, K.J., Holmes, A.P., Worsley, K.J., Poline, J.B., Frith, C.D.,
Frackowiak, R.S.J., 1995. Statistical parametric maps in functional
imaging, a general linear approach. Hum. Brain Mapp. 2, 189–210.
Gonzalez, F., Perez, R., 1998. Neural mechanisms underlying stereoscopic
vision. Prog. Neurobiol. 55, 191–224.
Gregory, R.L., Wallace, J.G., 1963. Recovery from early blindness: a case
study. Exp. Psychol. Monogr. vol. 2. Heffer, London, pp. 501.
Gulyas, B., Roland, P.E., 1994. Binocular disparity discrimination in human
cerebral cortex, functional anatomy by positron emission tomography.
Proc. Natl. Acad. Sci. U. S. A. 91, 1239–1243.
Haxby, J.V., Grady, C.L., Horwitz, B., Ungerleider, L.G., Mishkin, M.,
Carson, R.E., Herscovitch, P., Schapiro, M.B., Rapoport, S.L., 1991.
Dissociation of objects and spatial visual processing pathway in human
extrastriate cortex. Proc. Natl. Acad. Sci. U. S. A. 88, 1621–1625.
Held, R., 1968. Dissociation of visual functions by deprivation and
rearrangement. Psychol. Forsch. 31, 338–348.
Heller, M.A., Calcaterra, J.A., Tyler, L.A., Burson, L.L., 1996. Production
and interpretation of perspective drawings by blinds an sighted people.
Perception 25, 321–334.
Hinkle, D.A., Connor, C.E., 2001. Disparity tuning in macaque area V4.
NeuroReport 12, 365–369.
Inui, T., Tanaka, S., Okada, T., Nishizawa, S., Katayama, M., Konishi, J.,
2000. Neural substrates for depth perception of the Necker cube; a
functional magnetic resonance imaging study in human subjects.
Neurosci. Lett. 282, 145–148.
James, T.W., Humphrey, G.K., Gati, J.S., Servos, P., Menon, R.S., 2002.
Haptic study of three-dimensional objects activates extrastriate visual
areas. Neuropsychologia 40, 1706–1714.
Janssen, P., Vogels, R., Orban, G., 1999. Macaque inferior temporal
neurons are selective for disparity-defined three-dimensional shapes.
Neurobiology 96, 8217–8222.
Janssen, P., Vogels, R., Orban, G.A., 2000a. Selectivity for 3D shape that
reveals distinct areas within macaque inferior temporal cortex. Science
288, 2054–2056.
L. Renier et al. / NeuroImage 26 (2005) 573–580580
Janssen, P., Vogels, R., Orban, G.A., 2000b. Three-dimensional shape
coding in inferior temporal cortex. Neuron 27, 385–397.
Jones, W.F., Digby, W.M., Luk, W.K., Casey, M.E., Byars, L.G., 1995.
Optimizing rod window width in positron emission tomography. IEEE
Trans. Med. Imag. 14, 266–270.
Kaczmarek, K.A., 1995. Sensory augmentation and substitution. In:
Bronzino, J.D. (Ed.), CRC handbook of biomedical engineering. CRC
Press, Boca Raton, FL, pp. 2100–2109.
Kitagawa, N., Ichihara, S., 2002. Hearing visual motion in depth. Nature
416, 172–174.
Kourtzi, Z., Erb, M., Grodd, W., Bulthoff, H.H., 2003. Representation of
perceived 3-D object shape in the human lateral occipital complex.
Cereb. Cortex 9, 911–920.
Logothesis, N.K., Sheinberg, D.L., 1996. Visual object recognition. Annu.
Rev. Neurosci. 19, 577–621.
Maunsell, J.H., Van Essen, D.C., 1983. Functional properties of neurons in
middle temporal visual area of the macaque monkey: II. Binocular
interactions and sensitivity to binocular disparity. J. Neurophysiol. 49,
1148–1167.
Mazziotta, J.C., Huang, S.C., Phelps, M.E., Carson, R.E., MacDonald,
N.S., Mahoney, K., 1985. A noninvasive positron computed tomog-
raphy technique using oxygen-15-labeled water for the evaluation of
neurobehavioral task batteries. J. Cereb. Blood Flow Metab. 5, 70–78.
Michel, C., Sibomana, M., Bodart, J.-M., Grandin, C., Coppens, A., Bol,
A., De Volder, A., Warscotte, V., Thiran, J.-P., Macq, B., 1995.
Interactive delineation of brain sulci and their merging into functional
PET images. IEEE Med. Imag. Conf. Rec. 3, 1480–1484.
Olivers, C.N., Humphreys, G.W., 2004. Spatiotemporal segregation in
visual search, evidence from parietal lesions. J. Exp. Psychol. Hum.
Percept. 30, 667–688.
Pasupathy, A., Connor, C.E., 2001. Shape representation in area V4:
position-specific tuning for boundary conformation. J. Neurophysiol.
86, 2505–2519.
Prather, S.C., Votaw, J.R., Sathian, K., 2004. Task-specific recruitment of
dorsal and ventral visual areas during tactile perception. Neuro-
psychologia 42, 1079–1087.
Ptito, A., Zatorre, R.J., Petrides, M., Frey, S., Alivisatos, B., Evans, A.C.,
1993. Localization and lateralization of stereoscopic processing in the
human brain. NeuroReport 4, 1155–1158.
Poggio, G.E., 1995. Mechanisms of stereopsis in monkey visual cortex.
Cereb. Cortex 5, 193–204.
Rauschecker, J.P., 1995. Compensatory plasticity and sensory substitution
in the cerebral cortex. Trends Neurosci. 18, 36–43.
Renier, L., Laloyaux, C., Collignon, O., Tranduy, D., Vanlierde, A., De
Volder, A.G., 2003a. Perception of visual illusions with a sensory
substitution system. Perception 32, 9. (Suppl.).
Renier, L., Collignon, O., Tranduy, D., Vanlierde, A., De Volder, A.G.,
2003b. Depth perception with a sensory substitution system in early
blind subjects. Annual Meeting of the Belgian Psychological Society.
Universal Press, p. 36.
Rutschmann, R.M., Greenlee, M.W., 2004. BOLD response in dorsal areas
varies with relative disparity level. NeuroReport 15, 615–619.
Sathian, K., Zangaladze, A., Hoffman, J.M., Grafton, S.T., 1997. Feeling
with the mind’s eye. NeuroReport 8, 3877–3881.
Schneider, G.E., 1969. Two visual systems. Science 163, 895–902.
Schwartz, E.L., Desimone, R., Albright, T.D., Gross, C.G., 1983. Shape
recognition and inferior temporal neurons. Proc. Natl. Acad. Sci. U. S. A.
80, 5776–5778.
Sereno, ME., Trinath, T., Augath, M., Logothesis, NK., 2002. Three-
dimensional shape representation in monkey cortex. Neuron 33,
635–652.
Sergent, J., Ohta, S., MacDonald, B., 1992. Functional neuroanatomy of
face and object processing. A positron emission tomography study.
Brain 115, 15–36.
Shafritz, K.M., Gore, J.C., Marois, R., 2002. The role of the parietal
cortex in visual feature binding. Proc. Natl. Acad. Sci. U. S. A. 99,
10917–10922.
Shimozaki, S.S., Hayhoe, M.M., Zelinsky, G.J., Weinstein, A., Merigan,
W.H., Ballard, D.H., 2003. Effect of parietal lobe lesions on saccade
targeting and spatial memory in a naturalistic visual search task.
Neuropsychologia 41, 1365–1386.
Stoeckel, M.C., Weder, B., Binkofski, F., Buccino, G., Shah, N.J., Seitz,
R.J., 2003. A fronto-parietal circuit for tactile object discrimination: an
event-related fMRI study. NeuroImage 19, 1103–1114.
Taira, M., Nose, I., Inoue, K., Tsutsui, K., 2001. Cortical areas related to
attention to 3D structures based on shading, an fMRI study. Neuro-
Image 14, 959–966.
Talairach, J., Tournoux, P., 1988. Co-planar stereotaxic atlas of the human
brain. Thieme Medical, New York.
Tanaka, K., Saito, H., Fukada, Y., Moriya, M., 1991. Coding visual
images of objects in the inferotemporal cortex. J. Neurophysiol. 66,
170–189.
Tanaka, H., Uka, T., Yoshiyama, K., Kato, M., Fujita, I., 2000. Processing
of shape defined by disparity in monkey inferior temporal cortex.
J. Neurophysiol. 85, 735–744.
Trevarthen, C.B., 1968. Two mechanisms of vision in primates. Psychol.
Forsch. 31, 299–348.
Tsao, D., Tootell, R., 2004. Response to Tyler, representation of stereo-
scopic structure in human and monkey cortex. Trends Neurosci. 27,
118–120.
Tsao, D.Y., Vanduffel, W., Sasaki, Y., Fize, D., Knutsen, T.A., Mande-
ville, J.B., Wald, L.L., Dale, A.M., Rosen, B.R., Van Essen, D.C.,
Livingstone, M.S., Orban, G.A., Tootell, R.B., 2003. Stereopsis
activates V3A and caudal intraparietal areas in macaques and humans.
Neuron 39, 555–568.
Uka, T., Tanaka, H., Yoshiyama, K., Kato, M., Fujita, I., 2000. Disparity
selective neurons in monkey inferior temporal cortex. J. Neurophysiol.
84, 120–132.
Ungerleider, L.G., Mishkin, M., 1982. Two cortical visual systems. In:
Ingle, D.J., Goodale, M.A., Mansfield, R.J.W. (Eds.), Analysis of visual
behavior. MIT Press, Cambridge, pp. 549–586.
Veraart, C., 1989. Neurophysiological approach to the design of
visual prosthesis, a theoretical discussion. J. Med. Eng. Technol. 13,
57–62.
Wallace, M.T., Ramachandran, R., Stein, B.E., 2004. A revised view of
sensory cortical parcellation. Proc. Natl. Acad. Sci. 7, 2167–2172.
Walsh, V., Ellison, A., Ashbridge, E., Cowey, A., 1999. The role of
parietal cortex in visual attention-hemispheric asymetries and the
effects of learning, a magnetic stimulation study. Neuropsychologia 37,
245–251.
Wienhard, K., Dahlbom, M., Eriksson, L., Michel, C., Bruckbauer, T.,
Pietrzyk, V., Heiss, W.D., 1994. The ECAT EXACT HR, performance
of a new high resolution positron scanner. J. Comput. Assist. Tomogr.
18, 110–118.
Woods, R.P., Grafton, S.T., Holmes, C.J., Cherry, S.R., Mazziotta, J.C.,
1998a. Automated Image Registration: I. General methods and
intrasubject, intramodality validation. J. Comput. Assist. Tomogr. 22,
139–152.
Woods, R.P., Grafton, S.T., Watson, J.D.G., Sicotte, N.L., Mazziotta,
J.C., 1998b. Automated Image Registration: II. Intersubject valida-
tion of linear and nonlinear models. J. Comput. Assist. Tomogr. 22,
153–165.
Zangaladze, A., Epstein, C.M., Grafton, S.T., Sathian, K., 1999. Involve-
ment of visual cortex in tactile discrimination of orientation. Nature
401, 587–590.
Zhang, M., Weisser, V.D., Stilla, R., Prather, S.C., Sathian, K., 2004.
Multisensory cortical processing of object shape and its relation to
mental imagery. Cogn. Affect. Behav. Neurosci. 4, 251–259.