Dimensions that shape teacher-scientist collaborations for teacher enhancement
Upload
khangminh22Category
view
1download
0
Trends in Teacher Substitution Central Policy Unit
July 2021
This paper has been prepared by staff in the Department of Education. The views presented in this paper do not represent the official views of the Department or Minister for Education.

Spending Review Paper: Trends in Teacher Substitution
—— 1
1 Individual Education and Training Boards (ETBs) manage the payrolls for the ETB post-primary schools in their respective areas; which accounts for a significant share of post-primary schools. Following the merging of the Vocational Education Committees to ETBs, access to all ETB payroll data is limited presently. ETBs are currently migrating to a payroll shared service that will improve data availability over the coming period.
Summary
C o n t e x t a n d r a t i o n a l e f o r r e v i e w
The schools sector has a staff of roughly 87,000 teachers and Special Needs Assistants; with a paybill
of nearly €5.3 billion, accounting for 72% of total current expenditure. Teaching staff account for 77%
percent of school staff on the Department of Education and ETB payrolls.
The demand for teaching posts is driven by the pupil population, and the various staffing schedules and
circulars. A separate Spending Review paper, ‘Teacher Allocations: Developing a model for
Mainstream Teacher Projections’, sets out a model to project mainstream teaching posts based on
pupil projections.
As well as posts, substitution is driven by overall rates of pay, but also the demography of the staff
population itself.
In addition, statutory and sectoral policy also has implications for substitution demand. For example,
changes in family leave have implications that are particularly pronounced in a large workforce whose
gender and age breakdown gives rise to higher levels family leave than other sectors. Similarly,
Curricular Reform policy measures will also impact staff expenditure.
Understanding the payroll dynamics above and the trend in underlying drivers can be used to inform
expenditure planning as well as to feed into strategic workforce planning discussions.
This paper explores trends in substitution of teachers, its drivers and the costs arising.
T e a c h e r S u b s t i t u t i o n
Substitution arises when a school employs a substitute to cover a short or long term substitutable
absence of a teacher. There are approximately 125 types of leave available to teachers and in the
2019/20 academic year roughly 1.6 million absence days were recorded.
For Primary, Voluntary Secondary, Community and Comprehensive Schools, expenditure on
substitution and part time hours has been increasing from just under €200.6 million in 2015 to €243.5
million in 2019.1 Substitution expenditure for Special Needs Assistants (SNAs) has increased from
€12.8 million in 2015 to just under €21 million in 2019. This paper examines the drivers behind the
increasing teacher substitution expenditure. The paper analyses the trend in the instances and length
of leave to better inform payroll cost estimates.
Teacher absences affect payroll expenditure in different ways depending on whether the type of leave
is substitutable and/or payable. A leave that is substitutable means a substitute teacher can be
employed to fill the absence. A leave that is payable means the teacher on leave will continue to be
paid. The majority of absence days are substitutable and payable. This paper will only examine
leave types that are substitutable.
Teacher absences are recorded on the Online Claims System (OLCS) held by the Department of
Education.
The drivers in substitution demand examined are:
o Teacher numbers
o Leave policy changes
o Demographics of the teacher population
o Teacher professional learning

Spending Review Paper: Trends in Teacher Substitution
—— 2
D r i v e r s i n s u b s t i t u t i o n d e m a n d : 1. Teacher numbers
Teacher numbers at both primary and post primary level have been increasing in recent years, from a
total of just over 60,000 in 2014/15 to around 70,000 in 2019/20.
The higher number of teachers has resulted in an increase in the number of absence days.
The main driver behind increased teacher numbers is increased pupil enrolment. Based on the
Department of Education Statistics Unit’s projections, primary level enrolments peaked in 2018/19 and
post primary level enrolments are expected to peak at 2024/25. Enrolments are expected to decrease
out to 2035/36 and 2038/39 at primary and post primary respectively. Projections of mainstream
teacher allocations have been developed as part the Spending Review paper, ‘Teacher Allocations:
Developing a model for Mainstream Teacher Projections ’.
This projected decrease in pupil enrolment, in the absence of policy change, will reduce teacher
numbers and as a result impact on substitution expenditure arising.
2. Statutory leave policy changes
There have been multiple changes to statutory leave in the last number of years, most notably the
introduction of paternity leave, the extension of parental leave and the introduction of the Public Service
Sick Leave Scheme. These leave policy changes have resulted in more absence days.
3. Demographics of the teacher population
At primary level, there is a peak in the distribution of teachers between 25 and 45 years old (73% of
primary teacher population) and nearly 85% of the teacher population are female. At post primary level,
the age distribution of teachers is relatively more evenly spread across ages and just under 69% of the
teacher population are female.
These demographics of the teacher population where there is currently a large number of young female
teachers, particularly at primary level, are contributing to increased substitution demand as this is an
age where family-related leave is common. For example, maternity leave, parental leave etc.
Teachers aged between 30 and 40 years old account for the largest share of absence days at primary
and post primary level. In 2019/20, roughly 56% and 49% of total absence days at primary and post
primary level respectively were taken by teachers aged between 30 and 40 years old.
As the bubble of the teacher population currently in their 30s grows older, leave types could shift away
from long term leaves such as maternity leave and towards shorter term absences such as certified
illness.
4. Teacher professional learning
Teacher professional learning results in absence days from curriculum and assessment reform and
also teacher Continuing Professional Development (CPD).
Junior Cycle reform introduced on a phased basis from 2014/15 has also contributed to the recent
increase in substitution demand. As the reform of Junior Cycle becomes more established in schools
absence days for Junior Cycle management resources are expected to cease, and absence days
necessary to implement the Junior Cycle, such as professional time and the coordination of Subject
Learning and Assessment Review meetings, are likely to continue but decrease over time.
There has been an increase in the number of absence days taken by teachers for CPD. This is mainly
due to a higher number of courses available to teachers.
S u b s t i t u t i o n e x p e n d i t u r e Substitute teachers are paid a range of different rates depending on whether the leave is long term or
short term and whether the teacher is qualified or unqualified.
Maternity leave accounts for the highest substitution expenditure, with certified illness, parental leave
and additional unpaid maternity leave also accounting for a high level of substitution expenditure.

Spending Review Paper: Trends in Teacher Substitution
—— 3
While increased teacher numbers will have contributed to the rise in substitution expenditure, other
factors such as demographics and policy or curricular reform measures have had an effect also. This is
seen through an increase in the average substitution expenditure per primary and post primary teacher
increasing across the time period.
Leave policy changes have resulted in increased substitution expenditure. The introduction of paternity
leave in 2016 has resulted in nearly €5.6 million in substitution expenditure. Similarly, the introduction
of the Public Service Sick Leave scheme has resulted in around €43.5 million from 2016 – 2020 in
substitution expenditure, from critical illness leave and temporary rehabilitation remuneration leave.
Family related leave types, such as maternity leave, parental leave and paternity leave, accounted for
63% of total substitution expenditure in 2019. An increase in family leave substitution expenditure can
be seen from 2016 – 2020. This can be explained by the high concentration of the current teacher
population moving into their 30s, combined with a large share of the teacher population being female.
The additional types of leave available to teachers for CPD and Junior Cycle reform have resulted in an
increase in substitution expenditure. CPD substitution expenditure increased by 65% from 2016 to
2019. There was also nearly €1.7 million in substitution expenditure in 2019 for Junior Cycle Reform.

Spending Review Paper: Trends in Teacher Substitution
—— 4
1. Introduction
Education is one of the most labour intensive services provided by the State. Teacher pay accounts for
almost 60 per cent of the total education budget.2 The demand for teaching posts is driven by the pupil
population, and the various staffing schedules and circulars. As well as posts, the staff paybill is driven
by overall rates of pay, but also the demography of the staff population itself. In addition, statutory and
sectoral policy also has implications for the staff paybill. Understanding the payroll dynamics and the
trend in underlying drivers can be used to inform expenditure planning as well as to feed into strategic
workforce planning discussions.
Substitution demand is one aspect of payroll dynamics and has been increasing in recent years. This
paper explores trends in substitution of teachers, its drivers and the costs arising.
1.1. Methodology
This paper draws on desk based quantitative analysis using a range of recently compiled and existing
Department of Education administrative data. The main data source used was the Online Claims
System (OLCS). The OCLS consists of administrative data held by the Department and is used by
schools to record all absences for school staff. Only leave types that are substitutable were included in
the data analysis, with career breaks and other forms of non-substitutable leave excluded. Department
of Education payroll data was also used in Section 7. The data provided by the Payroll Unit was
aggregate substitution expenditure by leave type for the years 2016 – 2020. This substitution
expenditure was inclusive of holiday pay to substitutes, but does not include employer’s PRSI.
The data in this paper were extracted from data that had been drawn from the Department’s
administrative datasets for statistical and analytical purposes. All data used for the analysis were
anonymous – only fields necessary for the analysis of substitution were extracted. No data were
transmitted externally.
The OLCS data and payroll data utilized in the paper does not include post primary schools under the
authority of the Educational Training Boards (ETB Schools). However, the age and gender distribution
of teachers in post primary ETB schools is statistically similar to the demographics of the post primary
teacher population in voluntary, secondary and community and comprehensive schools. A Chi Square
test was carried out on the age distribution of the ETB population, compared with the age distribution of
the general post primary teacher population, and was found to have a p-value of 0.99 which indicates a
high level of dependence between the two groups. Similarly, when a Chi Square test was completed on
the gender distribution of the ETB population compared with the gender distribution of the general post
primary teacher population, a p-value of 0.99 was returned, indicating a strong relation between the two
groups. The results from these Chi Square tests allow for extrapolation of results to the ETB sector.
Extrapolation has not been carried out in this paper but would be necessary if the results from this
paper are used to feed into future workforce and expenditure planning.
2 This includes the capital expenditure.

Spending Review Paper: Trends in Teacher Substitution
—— 5
1.2. Quality Assurance (QA)
Quality assurance refers to the concepts of:
Accuracy of the data and other information presented, and
Rigour applied in using analytical techniques and integrity in reporting.
As part of the quality assurance process feedback was sought on the analysis format (structure), clarity
(quality of writing), accuracy (reliability of data), robustness (methodological rigour), and consistency
(between evidence and conclusions). Further detail on the quality assurance process is set out in
Appendix 1. It is important to note that involvement in the QA process does not imply agreement with
the findings of the analysis.

Spending Review Paper: Trends in Teacher Substitution
—— 6
2. Overview and Background
Substitution arises when a school employs a substitute to cover a short or long term substitutable
absence of a teacher from the school or classroom. There were approximately 1.6 million absence days
recorded in the 2019/20 academic year. For the purposes of this paper an absence day is any day a
school is open and a teacher was absent due to a type of leave. This means absence days exclude
weekends and school holidays.
Teacher substitution is important to analyse from an expenditure perspective but also from a work force
planning perspective. A higher number of absence days in an academic year will require a higher
number of teachers to cover these absences. Analysis carried out by the Department of Education’s
Teacher Supply Group examines teacher substitution from a teacher supply perspective.3 In 2019/20,
primary substitute teacher supply panels were established to aid schools in sourcing substitute
teachers. These substitute teacher panels were expanded nationwide in 2020/21, as a temporary Covid
measure. However, this paper will look at the expenditure implications of teacher substitution.
2.1. Expenditure on substitution
Expenditure on substitution has been increasing in recent years, as seen in Figure 1.4 Total expenditure
on substitution was at around €192million in 2016 and has grown quite steadily by roughly 10% year on
year to just over €264 million in 2019. Roughly 92% of this total substitution expenditure in 2019 was
attributed to primary and post primary teachers. The purpose of this spending review paper is to
examine the trends in substitution over the period of 2013/14 – 2019/205,6, in order to identify the drivers
behind this increased substitution expenditure and inform expenditure planning in substitution
expenditure.
There are a number of potential drivers in substitution demand over the period of 2013 – 2019. The
potential drivers that will be examined in this paper are:
Teacher numbers
Leave policy changes
Demographics of the teacher population
Teacher professional learning
3 This work can be found in the ‘Developing a Teacher Demand and Supply Model for Ireland 2021 – 2038’ technical
report.
4 Figure 1 shows expenditure on substitution and part time hours. Part time hours are hours that are due to a school that
are converted to part time hours and claimed on the Online Claims System (OLCS). For example as a result of a teacher retiring or dying in service after the 1st of November and a contracted appointment is not permitted until the start of the next school year.
5 Where an academic year is being referenced in the paper the format 20XX/XX will be used. Where calendar years are
referenced the format 20XX will the used.
6 This time period was chosen as a number of policy changes that occurred in this time can be reflected.

Spending Review Paper: Trends in Teacher Substitution
—— 7
2.2. Recording teacher absences
Primary and post primary teachers can avail of multiple types of leave that will result in absence days
from school or classroom. As explained above, an absence day is any day where the primary or post
primary school was open but a teacher was absent due to a type of leave. This means absence days
do not include weekends or school holidays. There are two main factors that affect substitution
expenditure which are:
whether the absence is payable or not payable;
And whether the absence is substitutable or not substitutable.
A leave that is payable and substitutable (e.g. certified illness) will result in a higher level of expenditure
than a leave that is not payable and substitutable (e.g. parental leave)7 and a leave that is not payable
and not substitutable (e.g. career break8). Just under 46% of all absence days in primary and post
primary schools in 2019/20 were payable and substitutable. Table 1 below shows the number of
absence days at primary and post primary level that were payable and/or substitutable each year from
2017/18 to 2019/20. It can be seen in Table 1 that absence days that are payable and substitutable
account for the largest share of absence days each year, such as maternity leave. Leave types that are
not payable and not substitutable, such as career breaks, account for the second highest share.
7 There is potential that leave that is not payable and substitutable can result in a lower level of expenditure than if the
leave had not taken place, as the wage payable to the substitute could on average be less than the wage that would be paid to the absent teacher if they were not on leave.
8 A career break is for a period of not less than one school year. As such, replacement teachers are offered a temporary
term contract and the absence is paid for via a different mechanism that substitution expenditure.
-
50
100
150
200
250
300
2015 2016 2017 2018 2019
Mill
ion
s (€
)
Primary Post Primary SNAs Total (Inc Employer's PRSI)
Figure 1: Expenditure on substitution and part time hours 2013 – 2019 at primary,
post primary and for Special Needs Assistants (SNAs)
Source: Department of Education Payroll

Spending Review Paper: Trends in Teacher Substitution
—— 8
Table 1: Share of payable/substitutable absence days at primary and post primary 2017/18 – 2019/20
Source: Department of Education OLCS
When a primary or post primary teacher is going on leave the school will record this leave on the Online
Claim System (OLCS).9 If the leave is payable the teacher will continue to be paid whilst on leave. If the
leave is substitutable, the school can arrange for a substitute teacher to replace the post in the
teacher’s absence. This substitute teacher will also be paid a rate for covering the absence days.
Substitute teachers are paid at a casual or a non-casual rate of pay depending on the absence they are
covering and the number of substitute days worked in a school year.10 Substitutes are also paid a
different rate depending on whether they are qualified or unqualified.
Table 2 below shows the number of days in 2017/18 and 2018/19 where a substitute claim was
received.
Table 2: Substitutable days and claimed days
School Year Substitutable
Absence
Days
Number of days
where a
substitute claim
was received
Number of
substitutable days
where no
substitution cover
claimed
% of
substitutable
days where no
substitution
cover claimed
2018/19 Primary 824,457 701,618 122,839 14.8
Post Primary 279,064 249,900 29,164 10.4
2017/18 Primary 750,359 647,137 103,222 13.8
Post Primary 261,461 235,853 25,608 9.8
Source: Department of Education Payroll Unit
Substitutable days where no substitution cover was claimed can occur for a number of reasons. For
example, the school may close for teachers to attend in service training for a new curriculum. Teachers
on leave to learn a new curriculum is substitutable but if the school is closed then this substitute will not
9 For all schools except ETB post primary schools 10 Substitute teachers covering a short term absence, for example sick leave, are paid a casual rate of pay which is a set daily/hourly rate. Substitute teachers covering more than 40 days service in a school year are paid a non-casual rate of pay which is based on their point on the incremental salary scale.
Not Payable Payable Not Payable Payable Not Payable Payable
Not Substitutable 33% 4% 28% 7% 28% 7%
Subsitutable 17% 46% 16% 50% 15% 50%
Not Substitutable 26% 14% 21% 18% 22% 17%
Subsitutable 17% 44% 15% 47% 15% 47%
2017/18
Primary
Post Primary
2019/20 2018/19

Spending Review Paper: Trends in Teacher Substitution
—— 9
need to be claimed. Another example would be teachers who job share. If a job sharing teacher is on
maternity leave, substitution cover will only be required for the time that the job sharing teacher is on
leave, but the leave will be recorded as one block of leave. Alternatively, a substitutable claim may not
have been received as a substitute teacher could not be found to cover the absence.
The following analysis in this paper focuses on substitutable leave only, with career breaks and
other forms of non-substitutable leave excluded.
2.3. Key trends in types of leave
There are approximately 125 types of leave, with 95 of these being substitutable. Figure 2 below shows
the leave types that resulted in the highest number of substitutable days at primary and post primary
level in 2019/20. The ‘other’ column represents the sum of all other types of leave not mentioned in the
graph.
Figure 2: Types of primary and post primary leave with highest substitutable days in 2019/20
It can be seen from Figure 2 that the majority of leave types are family related leaves such as maternity
leave, parental leave and pregnancy related illness. Maternity leave absence days accounted for 40%
of total substitutable absence days at primary level in 2019/20 and 30% at post primary level.
The trends in these leave types from 2013/14 to 2019/20 was examined. Maternity leave absence days
increased by 25% from 2013/14 to 2019/20 at primary and by 6% at post primary. Interestingly,
additional unpaid maternity leave also increased by 25% across the period at primary but increased by
17% at post primary. This implies that more teachers at post primary are availing of additional unpaid
maternity leave than in 2013/14. The number of maternity leave absence days decreased in 2019/20 for
the first time since 2013/14 at both primary and post primary level.11
11 The majority of the leave types shown in Figure 2 experienced a decrease in absence days in 2019/20, with exception of parental leave. This decrease could be explained in part by the closure of schools from the 12th March 2020 due to
-
50,000
100,000
150,000
200,000
250,000
300,000
350,000
MaternityLeave
Certified Illness Parental Leave StatutoryAdditional
UnpaidMaternity
Leave
TemporaryRehabilitationRemuneration
Leave
PregnancyRelated illness
Other
Sub
stit
uta
ble
Ab
sen
e D
ays
Primary Post Primary
Source: Department of Education OLCS

Spending Review Paper: Trends in Teacher Substitution
—— 10
Absence days for parental leave have seen significant growth across the period at primary and post
primary level. At primary level parental leave absence days increased by 158% from 2013/14 to
2019/20, an increase of just over 57,000 absence days. At post primary level parental leave absence
days increase by 98% across the period, an increase of nearly 16,000 absence days.12
Certified illness leave accounts for the second highest number of absence days at both primary and
post primary level. The number of certified illness absence days have been increasing each year since
2015/16, increasing by 18% at both primary and post primary level from 2015/16 to 2018/19. Certified
illness leave saw a decrease in absence days from 2018/19 to 2019/20. This is most likely due to
COVID-19 school closures. When comparing the total number of absence days for certified illness from
September to February 2018/19 with the total number of absence days for certified illness from
September to February 2019/20, the period of that school year prior to school closures due to Covid,
there were just over 3,500 more absence days in 2019/20.
COVID-19. However, some leave types such as maternity leave would not have been expected to be affected by school closures.
12 In 2019/20, parental leave was extended from 18 weeks to 22 weeks. Parental leave was extended again in 2020/21 to 26 weeks. As this leave type entitles teachers to unpaid leave in respect of each child up to the age of 13 years, the effect of this policy change won’t be seen immediately in OLCS data.
Spending Review Paper: Trends in Teacher Substitution
—— 11
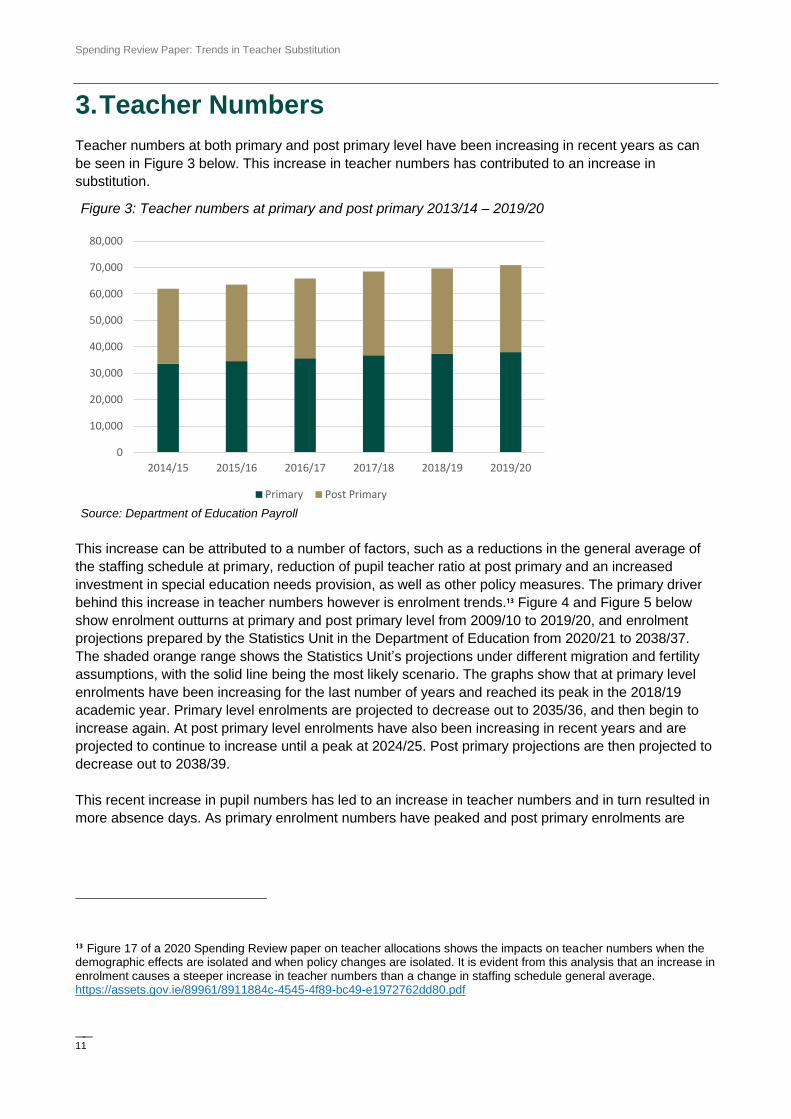
3. Teacher Numbers
Teacher numbers at both primary and post primary level have been increasing in recent years as can
be seen in Figure 3 below. This increase in teacher numbers has contributed to an increase in
substitution.
This increase can be attributed to a number of factors, such as a reductions in the general average of
the staffing schedule at primary, reduction of pupil teacher ratio at post primary and an increased
investment in special education needs provision, as well as other policy measures. The primary driver
behind this increase in teacher numbers however is enrolment trends.13 Figure 4 and Figure 5 below
show enrolment outturns at primary and post primary level from 2009/10 to 2019/20, and enrolment
projections prepared by the Statistics Unit in the Department of Education from 2020/21 to 2038/37.
The shaded orange range shows the Statistics Unit’s projections under different migration and fertility
assumptions, with the solid line being the most likely scenario. The graphs show that at primary level
enrolments have been increasing for the last number of years and reached its peak in the 2018/19
academic year. Primary level enrolments are projected to decrease out to 2035/36, and then begin to
increase again. At post primary level enrolments have also been increasing in recent years and are
projected to continue to increase until a peak at 2024/25. Post primary projections are then projected to
decrease out to 2038/39.
This recent increase in pupil numbers has led to an increase in teacher numbers and in turn resulted in
more absence days. As primary enrolment numbers have peaked and post primary enrolments are
13 Figure 17 of a 2020 Spending Review paper on teacher allocations shows the impacts on teacher numbers when the demographic effects are isolated and when policy changes are isolated. It is evident from this analysis that an increase in enrolment causes a steeper increase in teacher numbers than a change in staffing schedule general average. https://assets.gov.ie/89961/8911884c-4545-4f89-bc49-e1972762dd80.pdf
0
10,000
20,000
30,000
40,000
50,000
60,000
70,000
80,000
2014/15 2015/16 2016/17 2017/18 2018/19 2019/20
Primary Post Primary
Figure 3: Teacher numbers at primary and post primary 2013/14 – 2019/20
Source: Department of Education Payroll

Spending Review Paper: Trends in Teacher Substitution
—— 12
projected to peak in 2024/25, assuming no policy change, we could expect to see a decline in teacher
numbers in the coming years with knock-on impacts for the demand for substitution.
400
420
440
460
480
500
520
540
560
580
20
09
/10
20
10
/11
20
11
/12
20
12
/13
20
13
/14
20
14
/15
20
15
/16
20
16
/17
20
17
/18
20
18
/19
20
19
/20
20
20
/21
20
21
/22
20
22
/23
20
23
/24
20
24
/25
20
25
/26
20
26
/27
20
27
/28
20
28
/29
20
29
/30
20
30
/31
20
31
/32
20
32
/33
20
33
/34
20
34
/35
30
35
/36
20
36
/37
30
37
/38
20
38
/39
Tho
usa
nd
s
300
320
340
360
380
400
420
20
09
/10
20
10
/11
20
11
/12
20
12
/13
20
13
/14
20
14
/15
20
15
/16
20
16
/17
20
17
/18
20
18
/19
20
19
/20
20
20
/21
20
21
/22
20
22
/23
20
23
/24
20
24
/25
20
25
/26
20
26
/27
20
27
/28
20
28
/29
20
29
/30
20
30
/31
20
31
/32
20
32
/33
20
33
/34
20
34
/35
20
35
/36
20
36
/37
20
37
/38
20
38
/39
Tho
usa
nd
s
Key messages from Section 3:
Teacher numbers have been increasing from 2013/14 to 2019/20, largely due to
an increase in enrolment at primary and post primary levels.
This increase in teacher numbers has contributed to an increase in substitution.
Enrolment at primary level peaked in 2018/19 and is projected to decline which
could lead to a subsequent decline in substitution.
Enrolment at post primary level is projected to grow until 2024/25 and decline
thereafter which could lead to a subsequent decline in substitution.
Figure 4: Primary level actual enrolment and enrolment projections 2008/09 – 2038/39
Figure 5: Post primary level actual enrolment and enrolment projections 2008/09 – 2038/39
Source: Department of Education Statistics Unit
Source: Department of Education Statistics Unit

Spending Review Paper: Trends in Teacher Substitution
—— 13
4. Leave Policy Changes
There have been many changes to leave policy during the period 2013 – 2019. A selection of the most
prominent changes can be found in Table 3 below. The leave policy changes seen in Table 3 have
contributed to a recent rise in substitution expenditure. For example, the introduction of 10 days
paternity leave for fathers has resulted in a total of just under 29,000 substitutable absence days at
primary and post primary level from 2016/17 to 2019/20. Similarly, the introduction of the Public Service
Sick Leave scheme resulted in other forms of long term sick leave, such as Critical Illness leave and
Temporary Rehabilitation Remuneration leave, being available to teachers. There have been roughly
145,400 substitutable days for Temporary Rehabilitation Remuneration leave and roughly 123,700
substitutable days for Critical Illness leave since their introduction in 2014/15. More recently, parents
leave was introduced in 2019 and extended again in 2021. There were 577 absence days for parents at
primary level and 100 absence days at post primary level in 2019/20, the year it was introduced.
Key messages from Section 4:
There have been multiple changes to statutory leave in the last number of years, most
notably the introduction of paternity leave, the extension of parental leave and the
introduction of the Public Service Sick Leave Scheme.
These leave policy changes, and any future changes, will impact substitution.

Spending Review Paper: Trends in Teacher Substitution
—— 14
Table 3: Leave Policy Changes 2013 - 2019
Year Type of Leave Old Policy Policy Change
2013 Miscellaneous One and a half hours a week assigned to
supervision and substitution hours at post-
primary level.
With effect from the commencement of the school year
2013/14, the time currently assigned to supervision and
substitution will be increased three hours. In this context, the
additional time may only be used for substitution.
Hours provided under the revised S&S scheme will, in addition to
usage under the existing scheme, be used as follows:
With effect from commencement of 2013/14 school
year – to cover all uncertified sick leave absences,
subject to appropriate alleviation measures in
relation to multiple absences particularly in small
schools.
With effect from commencement of 2014/15 school
year – to cover the first day of force majeure leave
and illness in family leave.
2013 Maternity Leave
in lieu / Adoptive
Leave in lieu
Maternity and adoptive leave in lieu of up to
30 days available to teachers on maternity or
adoptive leave during school holidays.
From May 1st 2013 onwards, no additional day in lieu will be
accrued for maternity/adoptive leave during school holidays.
2014 Sick Leave Prior to September 2014, Critical Illness
leave and Temporary Rehabilitation
Remuneration leave did not exist.
The Public Service Sick Leave scheme was introduced to the
Education Sector from the 1st of September 2014. Long term sick
leaves were introduced such as Critical Illness leave and
Temporary Rehabilitation Remuneration leave.
2016 Paternity Leave The father or relevant parent of the child was
entitled to 3 days paid leave.
Effective from 1st September 2016, a teacher who is the father or
relevant parent of a child can avail of a single period of 2
consecutive weeks paid paternity leave. The leave may

Spending Review Paper: Trends in Teacher Substitution
—— 15
commence at any time from the date of birth of the child up to 26
weeks thereafter.
2016 Carers Leave Prior to summer 2017, teachers on carers
leave were subject to a scaled reduction of
their salaries for summer months, depending
on how much leave had been taken in the
preceding school year.
Teachers are no longer subject to any reduction in their summer
holiday pay, and if they choose to end carers leave at the end of
June, will return to normal salary for the duration of the summer
months.
2019 Parental Leave A teacher was entitled to 18 weeks parental
leave in respect of each child up to the age
of 13 years (or the age of 16 years in the
case of a child with a disability and/or long-
term illness).
Effective from 1st September 2019 a teacher is entitled up to a
maximum of 22 weeks parental leave in respect of each child up
to the age of 13 years (or the age of 16 years in the case of a
child with a disability and/or long-term illness).
Effective from the 1st of September 2020 parents are entitled up
to a maximum of 26 weeks parental leave.
2019 Parents Leave N/A Parent’s Leave is a statutory entitlement to two additional weeks
of leave available to both parents of children born on or after 1
November 2019. These two weeks will be available until the child
turns one.
Parents Leave was extended to 5 weeks leave during the first 2
years of a child’s life, as announced in Budget 2021. This change
came into effect from April 2021.
Spending Review Paper: Trends in Teacher Substitution
—— 16
5. Demographics
The demographics of the teacher population is also impacting the rise in substitution expenditure. This
section will examine the age and gender distribution of the current teacher population and how teacher
demographics influence substitution.
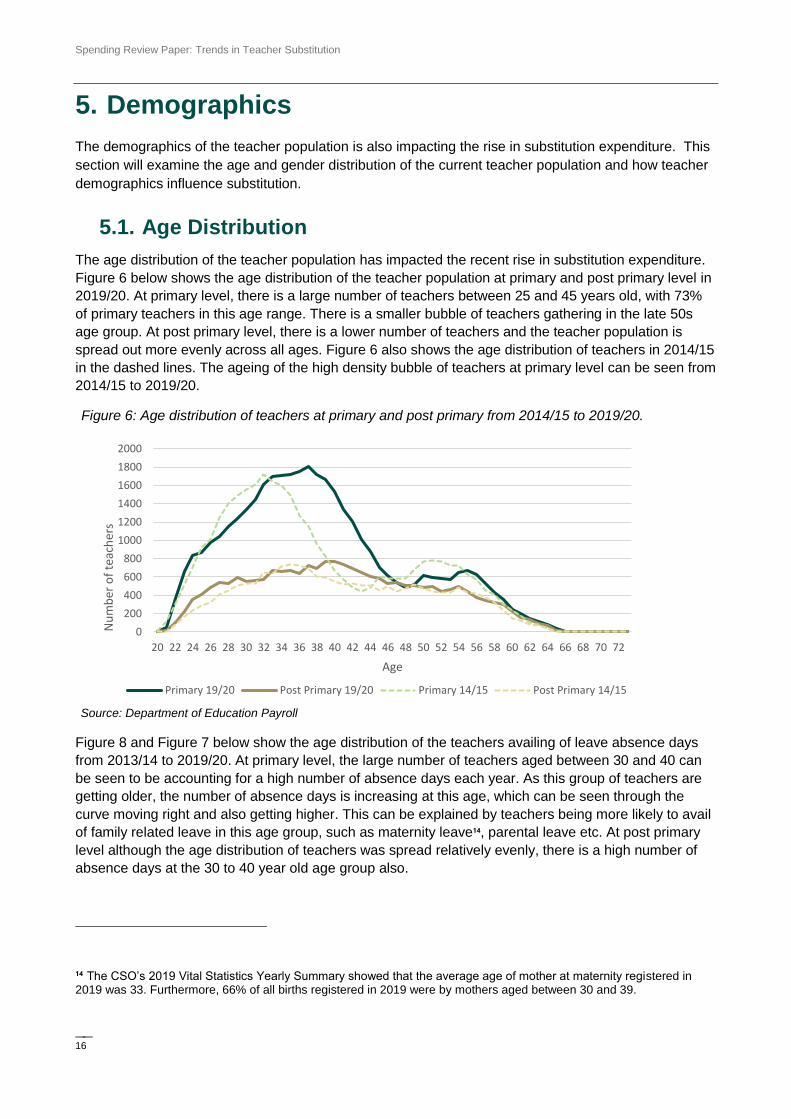
5.1. Age Distribution
The age distribution of the teacher population has impacted the recent rise in substitution expenditure.
Figure 6 below shows the age distribution of the teacher population at primary and post primary level in
2019/20. At primary level, there is a large number of teachers between 25 and 45 years old, with 73%
of primary teachers in this age range. There is a smaller bubble of teachers gathering in the late 50s
age group. At post primary level, there is a lower number of teachers and the teacher population is
spread out more evenly across all ages. Figure 6 also shows the age distribution of teachers in 2014/15
in the dashed lines. The ageing of the high density bubble of teachers at primary level can be seen from
2014/15 to 2019/20.
Figure 8 and Figure 7 below show the age distribution of the teachers availing of leave absence days
from 2013/14 to 2019/20. At primary level, the large number of teachers aged between 30 and 40 can
be seen to be accounting for a high number of absence days each year. As this group of teachers are
getting older, the number of absence days is increasing at this age, which can be seen through the
curve moving right and also getting higher. This can be explained by teachers being more likely to avail
of family related leave in this age group, such as maternity leave14, parental leave etc. At post primary
level although the age distribution of teachers was spread relatively evenly, there is a high number of
absence days at the 30 to 40 year old age group also.
14 The CSO’s 2019 Vital Statistics Yearly Summary showed that the average age of mother at maternity registered in 2019 was 33. Furthermore, 66% of all births registered in 2019 were by mothers aged between 30 and 39.
Figure 6: Age distribution of teachers at primary and post primary from 2014/15 to 2019/20.
0
200
400
600
800
1000
1200
1400
1600
1800
2000
20 22 24 26 28 30 32 34 36 38 40 42 44 46 48 50 52 54 56 58 60 62 64 66 68 70 72
Nu
mb
er o
f te
ach
ers
Age
Primary 19/20 Post Primary 19/20 Primary 14/15 Post Primary 14/15
Source: Department of Education Payroll

Spending Review Paper: Trends in Teacher Substitution
—— 17
As this bubble of primary teachers in the 30-40 age bracket grow older substitution expenditure could
expect to decrease as they avail of less long term substitutable days, such as maternity leave, and
become more likely to avail of other shorter leave types such as certified illness. Figure 9 below shows
the average number of absence days availed of by primary and post primary teachers in 2019/20. This
was calculating by dividing the total number of substitutable absence days at each age by the number
of teachers in the teaching population at each age. It can be seen that teachers in their 30s took more
absence days on average then teachers that were older. The higher number of absence days on
average for primary teachers compared to post primary teachers could be explained by a higher share
of male teachers in the post primary teacher population or a shorter school year at post primary than
primary.
-
10,000
20,000
30,000
40,000
50,000
60,000
70,000
80,000
20 22 24 26 28 30 32 34 36 38 40 42 44 46 48 50 52 54 56 58 60 62 64 66 68
Sub
stit
itab
le A
bse
ne
Day
s
2013/14 2014/15 2015/16 2016/17
2017/18 2018/19 2019/20
-
5,000
10,000
15,000
20,000
25,000
20 22 24 26 28 30 32 34 36 38 40 42 44 46 48 50 52 54 56 58 60 62 64 66 68
Sub
stit
uta
ble
Ab
sen
ce D
ays
2013/14 2014/15 2015/16 2016/17
2017/18 2018/19 2019/20
Figure 8: Primary level substitutable absence days by age
Figure 7: Post primary level substitutable absence days by age
Source: Department of Education OLCS
Source: Department of Education OLCS

Spending Review Paper: Trends in Teacher Substitution
—— 18
5 . 1 . 1 . A g e B r a c k e t s
This section will split the teacher population into age brackets in order to see which age brackets
account for the highest number of absence days and to provide insight into how substitution
expenditure will change as the teacher population ages. To examine the trend in absence days taken
by age, the teacher population was split into 7 age brackets; < 29, 30 – 34, 35 – 39, 40 – 44, 45 – 49,
50 – 54 and +55.
Primary
Figure 10 below shows the percentage share of substitutable absence days that each age bracket
accounts for at primary level. The ageing of the high density of primary teachers in their 30s that can be
seen in Figure 10. The 30 – 34 age bracket accounted from the highest share of absence days in
2013/14, at 39%. This has gradually declined to 33% in 2019/20. Meanwhile, the higher share of
absence days has moved to the 35 – 39 age bracket, increasing from 25% in 2013/14 to 37% in
2019/20. The share of absence days taken by the 40 – 44 age bracket has also increased from nearly
7% in 2013/14 to 12% in 2019/20. This movement in age bracket absence days depicts the larger
-
5
10
15
20
25
30
35
40
45
21 23 25 27 29 31 33 35 37 39 41 43 45 47 49 51 53 55 57 59 61 63 65 67 69
Ave
rage
nu
mb
er a
bse
nce
day
s
Age
Primary Post Primary
Figure 9: Average number of absence days by teacher age at primary and post primary 2019/20.
Source: Department of Education Payroll and OLCS.

Spending Review Paper: Trends in Teacher Substitution
—— 19
number of primary teachers in their 30s getting older. The share of absence days attributable to the <29
age group has been gradually declining from 11% in 2013/14 to 6% in 2019/20.
Post-Primary
Figure 11 below shows the share of total absence days by age brackets at post primary level. As there
is a more even spread of teachers age at post primary level (Figure 6), there is a less obvious
development of the age bracket absence days over time, compared with primary level. The 35 – 39 age
bracket has consistently accounted for the highest share of absence days from 2013/14 to 2019/20.
0%
5%
10%
15%
20%
25%
30%
35%
40%
45%
2013/14 2014/15 2015/16 2016/17 2017/18 2018/19 2019/20
< 29 30 - 34 35 - 39 40 - 44 45 - 49 50 - 54 +55
0%
5%
10%
15%
20%
25%
30%
35%
40%
2013/14 2014/15 2015/16 2016/17 2017/18 2018/19 2019/20
< 29 30 - 34 35 - 39 40 - 44 45 - 49 50 - 54 +55
Figure 10: Percentage of substitutable days by age bracket at primary level
Figure 11: Percentage of substitutable absence days by age bracket at post primary level
Source: Department of Education OLCS
Source: Department of Education OLCS

Spending Review Paper: Trends in Teacher Substitution
—— 20
5 . 1 . 2 . L e a v e T y p e b y A g e B r a c k e t s
Examining the most common leave types associated with each age bracket will give a clearer picture of
what drives absence days at each age bracket. Table 4 below provides a summary of the key types of
leave that occur in each age bracket at primary and post primary level. As enrolment has peaked at
primary and is projected to peak in 2024/25 at post primary, there is likely to be less teacher
recruitment, based on no policy change, and the age distribution of the current teacher population will
shift. This will have implications for payroll dynamics as the types of substitution leave taken by
teachers will change. For example, there may be less long term maternity leave and more short term
and short notice certified illness leave. These issues feed into workforce planning.
Table 4: Key messages of primary and post primary leave types by age bracket.
Age Bracket Key Messages
< 29 Certified Illness highest share at post primary level and maternity leave is
highest at primary level.
Maternity leave decreased over time, increased again in 2019/20.
Pregnancy related leave prevalent.
Professional development leave high share, particularly at post primary.
30 – 44 Family related leave types most prominent (maternity leave, parental leave,
pregnancy related illness, paternity leave).
Maternity leave highest share in 30 – 34 age bracket.
Parental leave highest share in the 40 – 44 age bracket.
Carer’s leave a high share of 40 – 44 age bracket.
> 45 Certified Illness and Temporary Rehabilitation Remuneration Leave highest
share. Other Illness leaves (eg. Critical illness) prominent also. Illness leave
types become higher share as teachers move to older age brackets.
Principal release days account for high proportion of absence days.
Death in family leave and illness in family leave notably higher share.
Source: Department of Education OLCS

Spending Review Paper: Trends in Teacher Substitution
—— 21
5.2. Gender Distribution
The gender distribution of the teacher population is skewed with a much higher proportion of females.15
Figure 12 below shows the percentage of males and females in the primary and post-primary teacher
population in 2019/20. Roughly 85% of the primary teacher population are female, with 15% being
male. At post-primary level the gender distribution is more balanced, with 69% of the teacher population
being female and 31% male. The male share of the population at primary and post-primary level has
slowly been increasing from 2013/14 to 2019/20, but has been roughly 85% female at primary and 69%
female and post primary each year.
Examining whether there is a disparity between the types of leave and the frequency of leave taken by
each gender could inform the increase in substitution expenditure. Figure 13 below shows the
percentage of substitutable days attributed to each gender at primary and post primary in 2019/20. At
primary level, although roughly 85% of the teacher population are female, female teachers account for
around 95% of substitutable days. At post primary level, 69% of the teacher population are female with
female teachers accounting for 87% of substitutable leave.
15 Teacher gender is the gender noted in Department of Education payroll data.
0%
10%
20%
30%
40%
50%
60%
70%
80%
90%
100%
Primary Post primary
Female Male
Figure 12: Gender distribution of teacher population 2019/20
Source: Department of Education Payroll

Spending Review Paper: Trends in Teacher Substitution
—— 22
This disparity is mainly due to the multiple types of leave that are available to females and not males,
such as maternity leave, statutory additional unpaid maternity leave and pregnancy related illness.
There are a number of other leave types that are available to both females and males but the majority
of these leave types substitutable days are usually are taken by females. For example, there were just
over 23,000 substitutable days for carers leave at primary and post primary level in 2019/20 and 65 of
these days were taken by males. Similarly, at primary and post primary there were roughly 125,000
substitutable days for parental leave in 2019/20 and 98% of these days were attributed to females.
5.3. Other factors
The distribution of substitutable days by county was examined in order to determine if this could be a
factor affecting substitution expenditure. It was found that at both primary and post primary level the
percentage of substitutable days in each county in 2019/20 was generally in line with the teacher
population in the county.
The differing effects of school size at primary level on the number of substitutable days taken was also
examined. It was found that the average number of substitutable days availed of by a teacher in a small
school16 was broadly in line with the average number of days availed of by teachers in larger schools in
2019/20.
16 A small school is defined as having 4 or less teachers.
Key messages from Section 5:
The demographics of the current teacher population shows that there is a large
number of female teachers in their 30s, particularly at primary level.
Female teachers in their 30s are more likely to avail of substitutable days such
as maternity leave and parental leave.
As the high concentration of teachers in their 30s ages, the number of
substitutable days could decrease due to a lower number of incidences of
maternity leave. As this bubble of the teacher population currently in their 30s
grows older, leave types could shift away from long term leaves such as
maternity leave and towards shorter term absences such as certified illness.
0%
10%
20%
30%
40%
50%
60%
70%
80%
90%
100%
Primary Post primary
Female Male
Figure 13: Substitutable days by gender at primary and post primary 2019/20
Source: Department of Education OLCS

Spending Review Paper: Trends in Teacher Substitution
—— 23
6. Teacher Professional Learning
6.1. Curriculum and Assessment Reform
Substitutable days arise due to curriculum and assessment reform as teachers can avail of
substitutable days to learn, and thereafter implement, the new curriculum. Throughout the period of
2013/14 to 2019/20, the most significant reform to the school curriculum was Junior Cycle reform at
post primary level. The Junior Cycle was originally outlined in the Framework for Junior Cycle 201217
and the key educational changes that would take place were subsequently published in the Framework
for Junior Cycle 201518. The new Junior Cycle was introduced on a subject by subject phased basis
from 2014/15.
It should be noted that some teacher continuing professional development (CPD) for the Junior Cycle
implementation was delivered through whole school closure which would not have resulted in any
substitutable absence days. School closures are given for subject specific training and substitution
cover was given to teachers that teach a second subject.
There are three types of substitutable leave on the OLCS that are a result of Junior Cycle reform.
These are:
Junior Cycle – Continuing Professional Development (CPD): Extensive programmes of CPD
were made available to teachers.
Junior Cycle – Professional Time: Non-student contact time available to teachers to participate
in a range of professional and collaborative activities to support the implementation of the Junior
Cycle. This leave type includes time for teachers to attend Subject Learning and Assessment
Review (SLAR) meetings which are key to the Junior Cycle process.19
Junior Cycle – Management Resources: Additional paid hours that schools may devote to the
management of activities associated with the implementation of Junior Cycle.
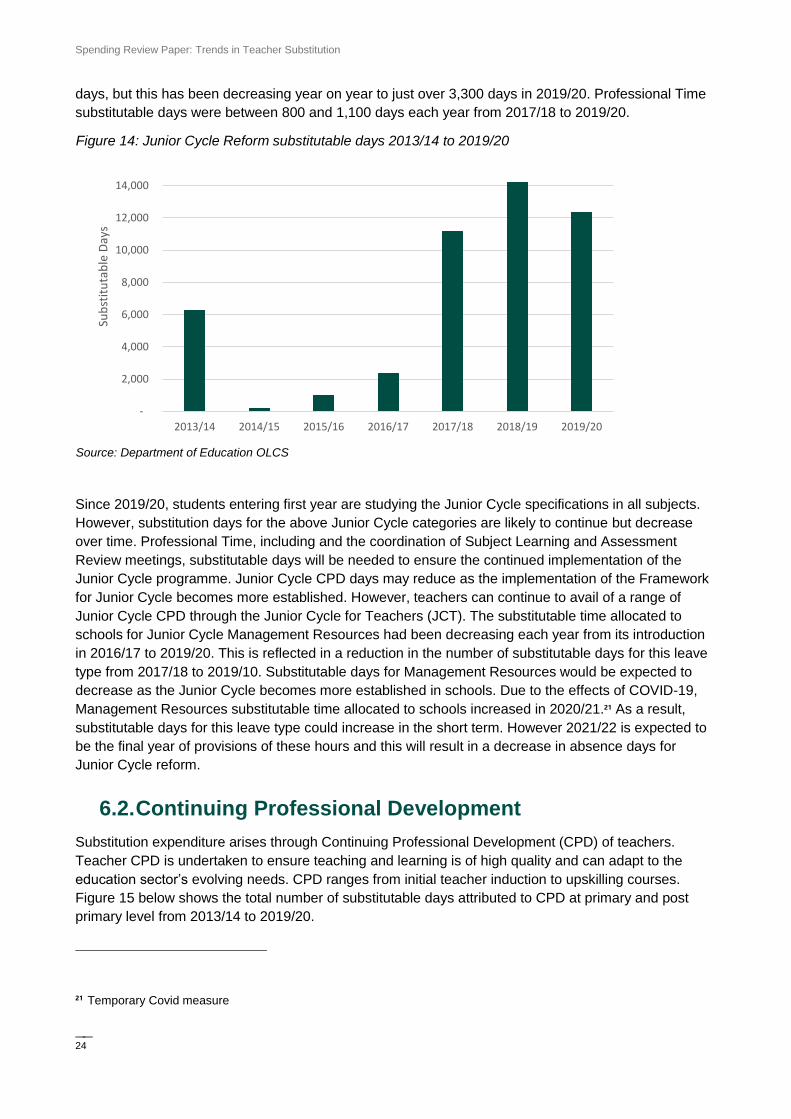
The substitutable days arising from Junior Cycle reform can be seen in Figure 14 below.20 The
substitutable days seen in the years 2013/14 to 2015/16 were days arising from Junior Cycle – CPD. It
can be seen that there was a large initial uptake of CPD for the Junior Cycle in 2013/14 after the
Framework for Junior Cycle was released in 2012. In 2018/19 and 2019/20 there was a large uptake of
Junior Cycle CPD again, at roughly 7,800 days each year. Substitutable absence days for the
Professional Time and Management Resources appeared on the OCLS for the first time 2016/17. A
large number of substitutable days were taken in 2017/18 for Management Resources, at around 7,100
17 https://www.education.ie/en/Publications/Policy-Reports/A-Framework-for-Junior-Cycle-Full-Report.pdf
18 https://www.education.ie/en/Publications/Policy-Reports/Framework-for-Junior-Cycle-2015.pdf
19 Junior Cycle – Professional Time is mainly allocated by teacher allocations through a reduced PTR at post primary level. However, if a teacher is required to attend a SLAR in a different school this will result in a paid substitutable day.
20 The drop in substitutable absence days from 2014/15 to 2016/17 was largely due to industrial relations issues
surrounding the implementation of Junior Cycle Reform.
Spending Review Paper: Trends in Teacher Substitution
—— 24
days, but this has been decreasing year on year to just over 3,300 days in 2019/20. Professional Time
substitutable days were between 800 and 1,100 days each year from 2017/18 to 2019/20.
Since 2019/20, students entering first year are studying the Junior Cycle specifications in all subjects.
However, substitution days for the above Junior Cycle categories are likely to continue but decrease
over time. Professional Time, including and the coordination of Subject Learning and Assessment
Review meetings, substitutable days will be needed to ensure the continued implementation of the
Junior Cycle programme. Junior Cycle CPD days may reduce as the implementation of the Framework
for Junior Cycle becomes more established. However, teachers can continue to avail of a range of
Junior Cycle CPD through the Junior Cycle for Teachers (JCT). The substitutable time allocated to
schools for Junior Cycle Management Resources had been decreasing each year from its introduction
in 2016/17 to 2019/20. This is reflected in a reduction in the number of substitutable days for this leave
type from 2017/18 to 2019/10. Substitutable days for Management Resources would be expected to
decrease as the Junior Cycle becomes more established in schools. Due to the effects of COVID-19,
Management Resources substitutable time allocated to schools increased in 2020/21.21 As a result,
substitutable days for this leave type could increase in the short term. However 2021/22 is expected to
be the final year of provisions of these hours and this will result in a decrease in absence days for
Junior Cycle reform.
6.2. Continuing Professional Development
Substitution expenditure arises through Continuing Professional Development (CPD) of teachers.
Teacher CPD is undertaken to ensure teaching and learning is of high quality and can adapt to the
education sector’s evolving needs. CPD ranges from initial teacher induction to upskilling courses.
Figure 15 below shows the total number of substitutable days attributed to CPD at primary and post
primary level from 2013/14 to 2019/20.
21 Temporary Covid measure
-
2,000
4,000
6,000
8,000
10,000
12,000
14,000
2013/14 2014/15 2015/16 2016/17 2017/18 2018/19 2019/20
Sub
stit
uta
ble
Day
s
Figure 14: Junior Cycle Reform substitutable days 2013/14 to 2019/20
Source: Department of Education OLCS

Spending Review Paper: Trends in Teacher Substitution
—— 25
Figure 15: Teacher CPD Substitutable Days at primary and post primary level 2013/14 to 2019/20.
It can be seen in Figure 15 that teacher CPD substitutable days have been increasing from 2013/14 to
2018/19. The decrease in substitutable days in 2019/20 could be due to COVID-19 school closures22. At
primary level, CPD substitutable days increased from around 23,000 in 2013/14 to just over 49,000 in
2018/19, an increase of 113%. At post primary level, 10,000 CPD substitutable days were availed of in
2013/14 and this increased to just under 15,000 days in 2018/19, an increase of 47%.
This increase in CPD substitutable days has in part been driven by the introduction of a number of new
types of CPD leave across the period. In 2013/14 there were 9 types of substitutable leave on the
OLCS that teachers could avail of for CPD purposes. This has increased to 16 types of leave being
available in 2019/20. Additional substitutable leave for CPD purposes was made available to teachers
in DEIS23 schools through the National Educational Psychological Service (NEPS) and the School
Excellence Fund (SEF) in 2017/18 and 2018/19 respectively. These CPD courses for DEIS schools
accounted for roughly 27% of the total additional CPD days from 2013/14 to 2018/19. Similarly CPD
courses ran by the Centre for School Leadership introduced in 2016/17 accounted for 11% of the total
additional CPD days from 2013/14 to 2018/19. In relation to teacher induction, two new types of teacher
induction leave were introduced in 2016/17, resulting in roughly 11,500 absence days from 2016/17 to
2019/20.
CPD courses organised by the Professional Development Service for Teachers (PDST) accounted for
the highest number of substitutable days at primary and post primary level each year, followed by CPD
courses for Special Educational Needs.
22 In 2018/19, roughly 35% of total teacher CPD days for the year occurred in the months March to June. At post
primary, in 2018/19 around 22% of teacher CPD days occurred in the months March to June. Due to COVID-19 school closures, teacher CPD substitutable days that would usually occur in these months might not have taken place.
23 Delivering Equality of Opportunity in Schools
-
10,000
20,000
30,000
40,000
50,000
60,000
70,000
2013/14 2014/15 2015/16 2016/17 2017/18 2018/19 2019/20
Sub
stit
uta
ble
Day
s
Primary Post Primary Total
Source: Department of Education OLCS

Spending Review Paper: Trends in Teacher Substitution
—— 26
Key messages Section 6:
Junior Cycle reform introduced on a phased basis from 2014/15 has contributed to
the recent increase in substitution.
As of September 2019, students entering first year will be studying all subjects to
Junior Cycle specifications. However, the level of provision of Junior Cycle supports
for professional time and coordination of Subject learning and Assessment Review
meetings is likely to continue for the foreseeable. The level of CPD provision is likely
to be reduced. Substitutable days for Management Resources had been decreasing
in recent years and 2021/22 is expected to be the final year of provision of these
hours.
A higher number of Continuing Professional Development (CPD) courses available to
teachers has contributed to the recent increase in substitution.

Spending Review Paper: Trends in Teacher Substitution
—— 27
7. Substitutes Payroll
Substitute teachers are paid at a casual or a non-casual rate of pay depending on the absence they are
covering and depending on the number of substitute days worked in a school year. If a teacher is
employed in a school and they are covering a short term absence, such as sick leave, they are paid a
casual rate of pay; this is a set amount which is generated based on the absence recorded. Substitutes
on a casual rate of pay are also paid a rate for annual leave and holidays for each day/hour they work.
This daily/hourly rate paid to the substitute also varies depending on whether the substitute teacher is
registered to the Teaching Council and the sector they are working in or unregistered.24
If a teacher is covering a long term absence, for example a maternity absence, they are paid a non-
casual rate of pay which is based on their point on the incremental salary scale. For example, if a
primary teacher is on an annual salary of €40,000, this amount is divided by 183 days which is the
number of days a primary school operates each school year to get the personal daily rate of pay. If a
teacher has completed 40 days service in a school year, they are paid a non-casual rate of pay from
day 41 regardless of the absence they are covering.
The many different rates of pay available to substitutes makes it difficult to apply a single rate of pay to
absence days. Furthermore, linking the substitutable absence days from the OCLS to substitution
expenditure is difficult as the OLCS absence days are recorded on an academic year basis while
substitution expenditure is recorded on a calendar year basis. For this reason, in order to accurately
calculate the cost of a substitutable day, the actual payment made to a substitute teacher to cover a
leave absence will need to be sourced from payroll. Future work should consider linking substitute pay
with OLCS data and decomposing the impact of teacher pay deals on substitution expenditure.
Substitution expenditure data was provided by the Payroll Unit in the Department of Education. The
data provided and used in this section is aggregated substitution expenditure by leave type for the
years 2016 – 2020.25 This substitution expenditure was inclusive of holiday pay to substitutes, but does
not include employer’s PRSI. Substitution expenditure recorded in this section does not include ETB
expenditure. A Chi Squared test was carried out and it was found that the age and gender distribution
of the general teacher population is statistically similar to the ETB teacher population. This strong
relationship between the two groups will allow for extrapolation of results to the ETB sector.
Extrapolation to include ETB schools would be necessary if the results from this paper are used to feed
into future workforce and expenditure planning.
Figure 16 shows the types of leave with the highest substitution expenditure from 2016 – 2020 at
primary and post primary level combined. Substitution expenditure for maternity leave accounts for the
highest level of expenditure each year. Maternity leave expenditure increased from nearly €64 million in
2016 to just under €82 million in 2020. Certified illness accounted for the second highest substitution
expenditure, at €31.3 million in 2019.26 Parental leave accounts for the third largest substitution
24 The rates of pay can be found in Department of Education Circular Letter 0060/2020. https://www.education.ie/en/Circulars-and-Forms/Active-Circulars/cl0060_2020.pdf 25 These are calendar years rather than academic years.
26 Certified illness in 2020 decreased due to COVID-19 school closures and the temporary introduction of ‘Special Leave – Covid 19’. Teachers that previously would have recorded certified illness leave may have recorded ‘Special Leave – Covid 19’ instead.

Spending Review Paper: Trends in Teacher Substitution
—— 28
expenditure and additional unpaid maternity leave accounts for the fourth largest level of substitution
expenditure.27
7.1. Drivers in substitution expenditure
This section of the paper will go through each of the potential drivers discussed and analyse the
subsequent substitute expenditure effects. As mentioned previously, substitution expenditure is
measured on a calendar year basis and the years 2016 – 202028 will be examined. Substitution
expenditure recorded in this section does not include ETB expenditure. Extrapolation to include ETB
schools would be necessary if the results from this paper are used to feed into future workforce and
expenditure planning. Employers PRSI is also not included in the analysis of substitution expenditure by
type of leave.
7 . 1 . 1 . T e a c h e r N u m b e r s
Teacher numbers have been increasing in recent years which have contributed to the overall increase
in substitution expenditure. However, the amount of substitution expenditure per teacher has also
increased across the time period. In order to aid comparison over time, the average cost of substitution
was calculated from total teachers and total substitution costs. Figure 17 shows the average
substitution expenditure, inclusive of employers PRSI, per primary and post primary teacher for the
27 Parental leave and additional unpaid maternity leave are not payable leave types and as a result substitution expenditure may be offset by a reduction in paybill from ceasing payment to the teacher on leave. 28 2020 is included as the 2019/20 academic year examined in the paper spans across 2019 and 2020 financial years. It is worth noting that 2020 expenditure in many of the leave types will be lower than expected due to the effects of COVID-19 in 2019/20 and 2020/21.
Figure 16: Types of leave with highest substitution expenditure 2016 – 2020, primary and post
primary total, exclusive of ETB expenditure and employers PRSI.
-
10
20
30
40
50
60
70
80
90
2016 2017 2018 2019 2020
Mill
ion
s (€
)
Maternity Leave Other Certified Illness Parental Leave Statutory Additional Unpaid Maternity Leave
Source: Department of Education OLCS

Spending Review Paper: Trends in Teacher Substitution
—— 29
years 2016 – 201929. It can be seen that average substitution expenditure per primary teacher
increased by 30%, from €3,534 in 2016 to €4,593 in 2019. At post primary level, average substitution
expenditure per teacher was relatively more consistent across the period. Post primary average
substitution expenditure per teacher increased by 13%, from €2,190 in 2016 to €2,484. This increase in
the average substitution expenditure per teacher shows that while increased teacher numbers have led
to higher total substitution expenditure, other factors such as teacher demographics and policy or
curricular reform measures have had an effect also. Teacher pay deals across the time period will also
have contributed to an increase in average substitution expenditure per teacher.30
7 . 1 . 2 . L e a v e P o l i c y C h a n g e s
The leave policy changes discussed in Section 4 have contributed to a rise in substitution expenditure.
Figure 18 below shows the substitution expenditure related to paternity leave absence days at primary
and post primary level from 2016 to 2020. Paternity leave substitution expenditure increased from just
over €400,000 when it was introduced in 2016 to €1.35 million in 2020. Paternity leave substitution
expenditure increased by roughly 80% at both primary and post primary across the period. The
introduction of paternity leave in 2016 has resulted in nearly €5.6 million substitution expenditure.
Figure 18 shows how the introduction of a statutory leave type can grow substitution expenditure over
time.
29 Teacher numbers per calendar year were calculated using a weighted average of teacher numbers across two academic years. For example, 2019 teachers were calculated by the formula: (2018/19 teacher numbers * 8/12) + (2019/20 teacher numbers * 4/12).
30 The first point on the teacher pay scale, for teachers who entered teaching prior to 2011, increased by roughly 15% from 2016 to 2020. The daily/hourly rate of pay for substitute teachers registered by the teaching council increased by 11% on average across the same period of 2016 to 2020.
-
500
1,000
1,500
2,000
2,500
3,000
3,500
4,000
4,500
5,000
2016 2017 2018 2019
Ave
rage
Su
b E
xpen
dit
ure
(€
)
Primary Post Primary
Figure 17: Increase in average substitution expenditure per primary and post primary teacher
2016 – 2019, inclusive of employers PRSI and exclusive of ETB expenditure.
Source: Department of Education Payroll

Spending Review Paper: Trends in Teacher Substitution
—— 30
Another significant leave policy change was the introduction of the Public Service Sick Leave Scheme.
This scheme resulted in new forms of long term sick leave, such as critical illness leave and temporary
remuneration rehabilitation leave seen in Figure 19. Total substitution expenditure for these long term
sick leave types increased from roughly €7.1 million in 2016 to just over €9.6 million in 2020.
Expenditure for these leave types dropped to around €9 million in 2020, most likely as a result of
COVID-19 school closures. The total expenditure on critical illness leave and temporary remuneration
rehabilitation leave across the time period was roughly €43.5 million.
Figure 18: Rise in paternity leave related substitution expenditure at primary and post primary
2016 – 2020, exclusive of ETB expenditure and employers PRSI.
Figure 19: Increase in substitution expenditure from leave types associated with introduction of
Public Service Sick Leave Scheme, total of primary and post primary level. Exclusive of ETB
expenditure and employers PRSI.
-
200,000
400,000
600,000
800,000
1,000,000
1,200,000
1,400,000
1,600,000
2016 2017 2018 2019 2020
Euro
s (€
)
Primary Post Primary Total
Source: Department of Education Payroll
-
2
4
6
8
10
12
2016 2017 2018 2019 2020
(Mill
ion
s €
)
Critical Illness Temporary Rehabilitation Remuneration Leave TotalSource: Department of Education Payroll

Spending Review Paper: Trends in Teacher Substitution
—— 31
7 . 1 . 3 . D e m o g r a p h i c s
The effects of teacher demographics are harder to isolate from the substitution expenditure. Figure 16
above shows the substitutable leave types that account for the largest share of substitution expenditure
each year. It can be seen that three of the four leave types with the highest expenditure are family
related leave (maternity leave, parental leave and unpaid maternity leave)31. This substitution
expenditure trend reflects the high density of female teachers in their 30s. Figure 20 shows the increase
in substitution expenditure for family related leave compared to all other substitution expenditure, from
2016 to 2020 at primary and post primary level.32 Family leave increased by 43% across the period,
from just under €98.9 million in 2016 to €141.2 million in 2020. In comparison, all other substitution
expenditure increased 29%, from nearly €58.9 million in 2016 to €76 million in 2020. Family leave
substitution expenditure accounted for 63% of total substitution expenditure in 2019. This increase in
family leave substitution expenditure, compared to the increase in all other substitution expenditure,
shows the importance of the demographics of the teacher population in workforce and expenditure
planning.
31 Parental leave and additional unpaid maternity leave are not payable leave types and as a result substitution expenditure may be offset by reduction in pay to teacher on leave. 32 Family related leave in Figure 20 is the sum of substitution expenditure for all maternity leave, paternity leave,
pregnancy related illness, parental leave and ante natal classes.
-
20
40
60
80
100
120
140
160
2016 2017 2018 2019 2020
Mill
ion
s (€
)
Family Leave Other
Figure 20: Increase in family leave substitution expenditure compared with all other leave types
substitution expenditure 2016 – 2020, primary and post primary level combined. Exclusive of ETB
expenditure and employers PRSI.
Source: Department of Education payroll

Spending Review Paper: Trends in Teacher Substitution
—— 32
7 . 1 . 4 . T e a c h e r P r o f e s s i o n a l L e a r n i n g
Curriculum and assessment reform measures and Continuing Professional Development (CPD)
substitution costs have risen in recent years. Figure 21 below shows the corresponding increase in
substitution expenditure associated with the increase in the number of CPD courses available to
teachers.33 Substitution expenditure on CPD at primary and post primary increased from just over €5.7
million in 2016 to roughly €9.3 million in 2019, an increase of 65%. The additional types of CPD leave
created and provided by NEPS and SEF in 2017/18 and 2018/19 can be seen reflected in the
substitution expenditure.
Similarly, Figure 22 shows the substitution expenditure associated with Junior Cycle Reform. The
significant increase in absence days seen in 2017/18 and 2018/19 for Junior Cycle Reform can be seen
translated into substitution expenditure. Junior Cycle Reform substitution expenditure increased from
just under €200,000 in 2016 to nearly €1.7 million in 2019. COVID-19 school closures in the 2019/20
and 2020/21 academic year will have affected the 2020 substitution expenditure.
33 The 2020 fall is likely attributable to COVID-19 school closures as well as change to delivery mode of CPD to online
and not during class contact time.
Figure 21: Increase in teacher CPD substitution expenditure at primary and post primary level,
exclusive of ETB expenditure and employers PRSI.
-
1
2
3
4
5
6
7
8
9
10
2016 2017 2018 2019 2020
Mill
ion
s (€
)
Primary Post Primary Total
Source: Department of Education Payroll

Spending Review Paper: Trends in Teacher Substitution
—— 33
Figure 22: Increase in Junior Cycle Reform related substitution expenditure 2017 to 2020,
exclusive of ETB expenditure and employer PRSI.
-
200,000
400,000
600,000
800,000
1,000,000
1,200,000
1,400,000
1,600,000
1,800,000
2016 2017 2018 2019 2020
Sub
stit
uti
on
Exp
end
itu
re (
€)
Junior Cycle Reform
Key messages from Section 7:
Substitute teachers are paid a range of different rates depending on whether the leave is long
term or short term and whether the teacher is registered with the teaching council or
unregistered.
Maternity leave accounts for the highest substitution expenditure, with certified illness,
parental leave and additional unpaid maternity leave also accounting for a high level of
substitution expenditure.
Average substitution expenditure per teacher at primary and post primary has been
increasing, showing factors other than increased teacher numbers affects teacher substitution.
Statutory leave policy changes will impact substitution expenditure. The introduction of
paternity leave in 2016 has resulted in nearly €5.6 million in substitution expenditure. Similarly,
the introduction of the Public Service Sick Leave scheme has resulted in around €43.5 million
from 2016 – 2020 in substitution expenditure, from critical illness leave and temporary
rehabilitation remuneration leave.
Family related leave types, such as maternity leave, parental leave and paternity leave,
accounted for 63% of total substitution expenditure in 2019. An increase in family leave
substitution expenditure can be seen from 2016 – 2020. This can be explained by the high
concentration of the current teacher population moving into their 30s, combined with a large
share of the teacher population being female.
The additional types of leave available to teachers for CPD and Junior Cycle reform have
results in an increase in substitution expenditure. CPD substitution expenditure increased by
65% from 2016 to 2019. Similarly, there was nearly €1.7 million in substitution expenditure in
2019 for Junior Cycle Reform.
Source: Department of Education Payroll

Spending Review Paper: Trends in Teacher Substitution
—— 34
8. Conclusion
This paper has explored the drivers of demand for substitution and highlighted the trends. This paper
can be used to inform expenditure planning, as well as providing insights for other areas of payroll
dynamics. Teacher substitution is one aspect of payroll dynamics. The demand for posts is driven by
the pupil population, and the various staffing schedules and circulars. As well as posts, the staff paybill
is driven by overall rates of pay, but also the demography of the staff population itself. In addition,
statutory and sectoral policy also has implications for the staff paybill. Understanding the payroll
dynamics and the trend in underlying drivers can be used to inform budgetary discussions on paybill as
well as to feed into strategic workforce planning.
The key findings from the analysis are:
As well as teacher numbers, the staff paybill is driven by overall rates of pay but demographics
of the teacher population and statutory and sectoral policy also has implications for payroll
dynamics. Understanding the payroll dynamics and the trend in underlying drivers can inform
expenditure planning and feed into strategic workforce planning discussions.
Teacher numbers have been increasing in recent years which will have led to a higher number
of absence days. However, the average substitution expenditure per teacher at primary and
post primary has also been increasing indicating that factors other than increased teacher
numbers are influencing substitution expenditure.
Changes to statutory leave policy will effect substitution expenditure. For example, the
introduction the Public Service Sick Leave scheme in 2014 has resulted in roughly €43.5 million
in substitution expenditure from 2016 – 2020, from long term sick leaves introduced by this
scheme.
The demographics of the teacher populations has a significant impact on substitution. At
primary level, a peak in the distribution of teachers aged in their 30s combined with a population
that is nearly 85% female has resulted in a large number of substitutable absence days for
family-related leave. Family leave accounted for 63% of total substitution expenditure in 2019.
As this bubble of the teacher population currently in their 30s grows older, leave types could
shift away from long term leaves such as maternity leave and towards shorter term absences
such as certified illness.
A higher number of leave types available to teachers for teacher professional learning, through
general teacher CPD and also the Junior Cycle Reform, has led to an increase in substitution.
CPD substitution expenditure increased by 65% from 2016 to 2019 and there was nearly €1.7
million in substitution expenditure in 2019 alone for Junior Cycle Reform.
There is potential for further analysis including:
Extending the analysis to include SNAs and also school staff employed by ETBs. As well as
additional detail on the costs arising.
Linking substitute pay with OLCS data to get the actual cost of each absence day. The linking of
these datasets will also allow for the calculation of the net cost of substitution.34
Carrying out econometric analysis to decompose the impacts of individual drivers in
substitution.
34 If a leave is not payable and substitutable, determine if the net cost of the leave is less than if the leave had not taken place as the substitute teacher may be paid a lower rate than the teacher on leave.

Spending Review Paper: Trends in Teacher Substitution
—— 35
Decomposing the impact of teacher pay deals from the drivers in substitution.
Forecasting substitution demand by estimating number of absence days per age and applying
to teacher demographics.
Using the findings from this paper to inform teacher supply and strategic workforce planning.

Spending Review Paper: Trends in Teacher Substitution
—— 36
9. Appendices
9.1. Appendix 1
Quality Assurance Process
To ensure accuracy and methodological rigour, the author engaged in the following quality
assurance process.
✓ Internal/Departmental
✓ Line management
✓ Spending Review Sub-group and Steering group
Other divisions/sections
✓ Peer review (IGEES network, seminars, conferences etc.)
✓ External
✓ Other Government Department
Advisory group
Quality Assurance Group (QAG)
Peer review (IGEES network, seminars, conferences etc.)
External expert(s)
Other (relevant details)
Copyright © 2022 FDOKUMEN