Processing of sounds by population spikes in a model of primary auditory cortex
14
Processing of sounds by population spikes in a model of primary auditory cortex Alex Loebel 1 , Israel Nelken 2 and Misha Tsodyks 1,∗ 1. Department of Neurobiology, Weizmann Institute of Science, Rehovot, Israel. 2. Department of Neurobiology, Silberman Institute of Life Sciences, and The Interdisciplinary Center for Neural Computation, Safra Campus, Givat Ram, Hebrew University, Jerusalem, Israel. Review Editors: Larry Abbott, Center for Neurobiology and Behavior, Columbia University, USA Terry Sejnowsky, Howard Hughes Medical Institute, The Salk Institute for Biological Studies, USA We propose a model of the primary auditory cortex (A1), in which each iso-frequency column is represented by a recurrent neural network with short-term synaptic depression. Such networks can emit Population Spikes, in which most of the neurons fire synchronously for a short time period. Different columns are interconnected in a way that reflects the tonotopic map in A1, and population spikes can propagate along the map from one column to the next, in a temporally precise manner that depends on the specific input presented to the network. The network, therefore, processes incoming sounds by precise sequences of population spikes that are embedded in a continuous asynchronous activity, with both of these response components carrying information about the inputs and interacting with each other. With these basic characteristics, the model can account for a wide range of experimental findings. We reproduce neuronal frequency tuning curves, whose width depends on the strength of the intracortical inhibitory and excitatory connections. Non-simultaneous two- tone stimuli show forward masking depending on their temporal separation, as well as on the duration of the first stimulus. The model also exhibits non-linear suppressive interactions between sub-threshold tones and broad-band noise inputs, similar to the hypersensitive locking suppression recently demonstrated in auditory cortex. We derive several predictions from the model. In particular, we predict that spontaneous activity in primary auditory cortex gates the temporally locked responses of A1 neurons to auditory stimuli. Spontaneous activity could, therefore, be a mechanism for rapid and reversible modulation of cortical processing. Keywords: auditory processing, neural networks, synaptic depression, synchronization INTRODUCTION Neurons in the primary auditory cortex (A1) exhibit pronounced non- linearities in their responses to both simple and complex stimuli. For example, A1 neurons display strong phasic components in responses to many sounds, both in anesthetized (Calford and Semple, 1995; DeWeese et al., 2003; Phillips and Sark, 1991) and in awake (Bendor and Wang, 2005; Chimoto et al., 2002; DeWeese and Zador, 2005) animals; locking to the amplitude envelope of slowly fluctuating noise can be suppressed by sub-threshold pure tones (hypersensitive locking suppression, Las et al., 2005; Nelken et al., 1999); and spectrotemporal receptive fields of A1 neurons poorly predict their responses to natural stimuli (Bar-Yosef et al., 2002; Machens et al., 2004). Machens et al. (2004) have demon- strated that simple non-linear neural mechanisms, such as adaptation to mean sound intensity, rectification, or saturation, are not sufficient to explain their findings. Furthermore, Wehr and Zador (2005) have found that synaptic inhibition, which only lasts for up to 100 ms, is insufficient to fully explain the suppression of responsiveness of A1 neurons that can persist for hundreds of milliseconds following the presentation of a sound ∗ Correspondence: Department of Neurobiology, Weizmann Institute of Science, Rehovot, Israel.e-mail: [email protected] (M. Tsodyks) Abbreviations: A1, Primary auditory cortex; BF, Best frequency; FTC, Frequency tuning curve; PS, Population spike. Received: 15 August 2007; paper pending published: 01 September 2007; accepted: 01 September 2007; published online: 15 October 2007 Full citation: Frontiers in Neuroscience. (2007) vol. 1, iss. 1,197-209. Copyright: © 2007 Loebel, Nelken and Tsodyks. This is an open-access article subject to an exclusive license agreement between the authors and the Frontiers Research Foun- dation, which permits unrestricted use, distribution, and reproduction in any medium, provided the original authors and source are credited. (Brosch and Schreiner, 1997; Creutzfeldt et al., 1980; Eggermont, 1999). They conclude that other intracortical mechanisms, such as short–term synaptic depression (Thomson and Deuchars, 1994), must be involved (see also Elhilali et al., 2004; Fishbach et al., 2003; Las et al., 2005). Existing models of the auditory cortex that consider synaptic depres- sion are feed-forward, focusing on the contribution of the depression of the thalamo-cortical synaptic connections to the output of single A1 neu- rons (Denham, 2001; Elhilali et al., 2004; Schiff and Reyes, 2005). These models, therefore, cannot account for the contribution of the intracortical circuitry to the responses of A1 neurons. In fact, A1 neurons are orga- nized in synaptically interconnected ensembles (Atzori et al., 2001), and the connections between pyramidal neurons exhibit short-term synap- tic depression (Atzori et al., 2001; Berger and Markram, unpublished data). We recently studied the effects of synaptic depression on the dynam- ics of a recurrent neural network model of a cortical column (Loebel and Tsodyks, 2002; Tsodyks et al., 2000). We found that the network can generate sharp transient synchronization of its neurons’ activity, which we termed Population Spike (PS; note that we use the term PS for synchronous firing of large neuronal populations, and not transient field- potential responses that originate from such firing, as commonly used in the hippocampus literature (Andersen et al., 1971)). The synchronous firing results from the recruitment of the network via the excitatory recur- rent connections, which rapidly terminates due to the synaptic depression. When the recurrent connections are strong, the network exhibits a rhyth- mic activity characterized by a periodic train of spontaneous PSs. With weaker connections, we found that PSs can be induced by external inputs, with response features that resemble the responses of A1 neurons to sim- ilar auditory stimuli. For example, the network’s response to a sustained 197 November 2007 | Volume 1 | Issue 1 | www.frontiersin.org
-
Upload
independent -
Category
Documents
-
view
0 -
download
0
Transcript of Processing of sounds by population spikes in a model of primary auditory cortex
Processing of sounds by population spikes in a modelof primary auditory cortex
Alex Loebel1, Israel Nelken2 and Misha Tsodyks1,∗
1. Department of Neurobiology, Weizmann Institute of Science, Rehovot, Israel.2. Department of Neurobiology, Silberman Institute of Life Sciences, and The Interdisciplinary Center for Neural Computation, Safra
Campus, Givat Ram, Hebrew University, Jerusalem, Israel.
Review Editors: Larry Abbott, Center for Neurobiology and Behavior, Columbia University, USATerry Sejnowsky, Howard Hughes Medical Institute, The Salk Institute for Biological Studies, USA
We propose a model of the primary auditory cortex (A1), in which each iso-frequency column is represented by a recurrent neural networkwith short-term synaptic depression. Such networks can emit Population Spikes, in which most of the neurons fire synchronously for ashort time period. Different columns are interconnected in a way that reflects the tonotopic map in A1, and population spikes can propagate
maequarrye ra
orticepasholderivlly l
mod
sion
(Ts(
along the map from one column to the next, in a temporally preciseThe network, therefore, processes incoming sounds by precise sasynchronous activity, with both of these response components cWith these basic characteristics, the model can account for a widtuning curves, whose width depends on the strength of the intractone stimuli show forward masking depending on their temporal salso exhibits non-linear suppressive interactions between sub-threlocking suppression recently demonstrated in auditory cortex. Wespontaneous activity in primary auditory cortex gates the temporaactivity could, therefore, be a mechanism for rapid and reversible
Keywords: auditory processing, neural networks, synaptic depres
INTRODUCTIONNeurons in the primary auditory cortex (A1) exhibit pronounced non-linearities in their responses to both simple and complex stimuli. Forexample, A1 neurons display strong phasic components in responses to
many sounds, both in anesthetized (Calford and Semple, 1995; DeWeeseet al., 2003; Phillips and Sark, 1991) and in awake (Bendor and Wang,2005; Chimoto et al., 2002; DeWeese and Zador, 2005) animals; lockingto the amplitude envelope of slowly fluctuating noise can be suppressedby sub-threshold pure tones (hypersensitive locking suppression, Las etal., 2005; Nelken et al., 1999); and spectrotemporal receptive fields ofA1 neurons poorly predict their responses to natural stimuli (Bar-Yosefet al., 2002; Machens et al., 2004). Machens et al. (2004) have demon-strated that simple non-linear neural mechanisms, such as adaptationto mean sound intensity, rectification, or saturation, are not sufficient toexplain their findings. Furthermore, Wehr and Zador (2005) have foundthat synaptic inhibition, which only lasts for up to 100 ms, is insufficientto fully explain the suppression of responsiveness of A1 neurons that canpersist for hundreds of milliseconds following the presentation of a sound∗ Correspondence: Department of Neurobiology, Weizmann Institute of Science, Rehovot,Israel.e-mail: [email protected] (M. Tsodyks)
Abbreviations: A1, Primary auditory cortex; BF, Best frequency; FTC, Frequency tuningcurve; PS, Population spike.Received: 15 August 2007; paper pending published: 01 September 2007; accepted: 01September 2007; published online: 15 October 2007
Full citation: Frontiers in Neuroscience. (2007) vol. 1, iss. 1,197-209.
Copyright: © 2007 Loebel, Nelken and Tsodyks. This is an open-access article subject toan exclusive license agreement between the authors and the Frontiers Research Foun-dation, which permits unrestricted use, distribution, and reproduction in any medium,provided the original authors and source are credited.
strmcnttd
iTgwspifrWmwwi
nner that depends on the specific input presented to the network.ences of population spikes that are embedded in a continuousing information about the inputs and interacting with each other.nge of experimental findings. We reproduce neuronal frequencyal inhibitory and excitatory connections. Non-simultaneous two-ration, as well as on the duration of the first stimulus. The modeld tones and broad-band noise inputs, similar to the hypersensitivee several predictions from the model. In particular, we predict that
ocked responses of A1 neurons to auditory stimuli. Spontaneousulation of cortical processing.
, synchronization
Brosch and Schreiner, 1997; Creutzfeldt et al., 1980; Eggermont, 1999).hey conclude that other intracortical mechanisms, such as short–termynaptic depression (Thomson and Deuchars, 1994), must be involvedsee also Elhilali et al., 2004; Fishbach et al., 2003; Las et al., 2005).
Existing models of the auditory cortex that consider synaptic depres-ion are feed-forward, focusing on the contribution of the depression ofhe thalamo-cortical synaptic connections to the output of single A1 neu-ons (Denham, 2001; Elhilali et al., 2004; Schiff and Reyes, 2005). Theseodels, therefore, cannot account for the contribution of the intracortical
ircuitry to the responses of A1 neurons. In fact, A1 neurons are orga-ized in synaptically interconnected ensembles (Atzori et al., 2001), andhe connections between pyramidal neurons exhibit short-term synap-ic depression (Atzori et al., 2001; Berger and Markram, unpublishedata).
We recently studied the effects of synaptic depression on the dynam-cs of a recurrent neural network model of a cortical column (Loebel andsodyks, 2002; Tsodyks et al., 2000). We found that the network canenerate sharp transient synchronization of its neurons’ activity, whiche termed Population Spike (PS; note that we use the term PS for
ynchronous firing of large neuronal populations, and not transient field-otential responses that originate from such firing, as commonly used
n the hippocampus literature (Andersen et al., 1971)). The synchronousiring results from the recruitment of the network via the excitatory recur-ent connections, which rapidly terminates due to the synaptic depression.hen the recurrent connections are strong, the network exhibits a rhyth-ic activity characterized by a periodic train of spontaneous PSs. Witheaker connections, we found that PSs can be induced by external inputs,ith response features that resemble the responses of A1 neurons to sim-
lar auditory stimuli. For example, the network’s response to a sustained
197November 2007 | Volume 1 | Issue 1 | www.frontiersin.org
Fupcno
FWoefothtWs
se
afot(
198
L o e b e l e t a l .
excitatory input combines a single onset PS, if the input is stronger than athreshold, with a subsequent increase in the asynchronous activity of thenetwork. Above threshold, the input amplitude is encoded by the latency ofthe PS response, with shorter latencies at higher input amplitudes (Heil,1997; Loebel and Tsodyks, 2002). This temporal pattern matches theresponses of A1 neurons to tonic stimulation, characterized by a tempo-rally locked onset response followed by a sustained increase in the firingrate (Nelken et al., 1999; Ulanovsky et al., 2003). In addition, the ability ofthe network to follow a periodic input with a PS response decreases as theinput frequency increases, in agreement with experimental observations(Kilgard and Merzenich, 1999; Lu et al., 2001).
These findings led us to hypothesize that the temporally locked spik-ing activity of A1 neurons in response to auditory stimuli reflects the nearcoincident activity of ensembles of neurons with similar best frequency(BF); and that this temporal coherence emerges from intrinsic propertiesof the intracortical circuitry, i.e. the expression of short-term depressionat recurrent excitatory connections. Hence, the observed similarity in theresponse features of A1 neurons from the same cortical column (Chen andJen, 2000; Dear et al., 1993; Kilgard and Merzenich, 1999; Shamma et al.,1993; Wallace et al., 2005) is predicted to follow from their participationwithin the same ensemble. We further hypothesize that PS s activity is anessential component of the neural processing in A1 (see e.g. Eggermontand Smith, 1996). Specifically, we propose that in response to auditorystimuli, PS s propagate via lateral connections along A1, mediating reli-able signal transmission between distinct cortical sites with high speedand temporal precision. Recent experimental observations support thepresence of PS s in the auditory cortex. In particular, intracellular record-ings show that A1 neurons receive brief, highly synchronized synapticinputs, which could be the correlate of PSs (Bendor and Wang, 2005;DeWeese and Zador, 2006; Las et al., 2005).
In order to explore our hypothesis, we constructed a model of A1in which our network with short-term synaptic depression is consideredas an iso-frequency column, and several such columns are connectedalong the axis representing the tonotopic gradient in A1 (Merzenich et al.,1975; Zhang et al., 2003). The resulting model supports the propagationof PS s along the tonotopic gradient and reproduces a wide range ofexperimental results. The model makes specific predictions concerningdynamic changes in response thresholds as a function of frequency, onthe role of spontaneous activity in auditory cortex, and on the pattern ofthe thalamo-cortical connections into A1.
MATERIALS AND METHODSModeling a single columnA functional iso-frequency column was simulated by a fully connectedrecurrent network of NE excitatory and NI inhibitory neurons. Theirdynamics was based on the rate model of Wilson and Cowan (1972),in which a neuron is represented by a firing rate variable, as described bythe following equations:
τEdEi
dt=−Ei+(1−τE
refEi )
[J0EE
NE
NE∑Uxj Ej +
J0EI
NI
NI∑Uyj Ij +eE
i +si
]+
j=1 j=1
τi
dIl
d t=−Il + (1 − τI
refIl )
[J0IE
NE
NE∑j=1
Ej +J0II
NI
NI∑j=1
Ij + eIl
]+ (1)
The EI (li) are the excitatory (inhibitory) rate variables, where i (l) is a running index from 1 to NE (Ni); τE (τI ) is the correspondingtime constant; and τE
ref (τIref) determine the neurons’ refractory period.
The total synaptic input received by a neuron was a sum of contributionsfrom local excitatory and inhibitory neurons (with synaptic efficacies J0
EE
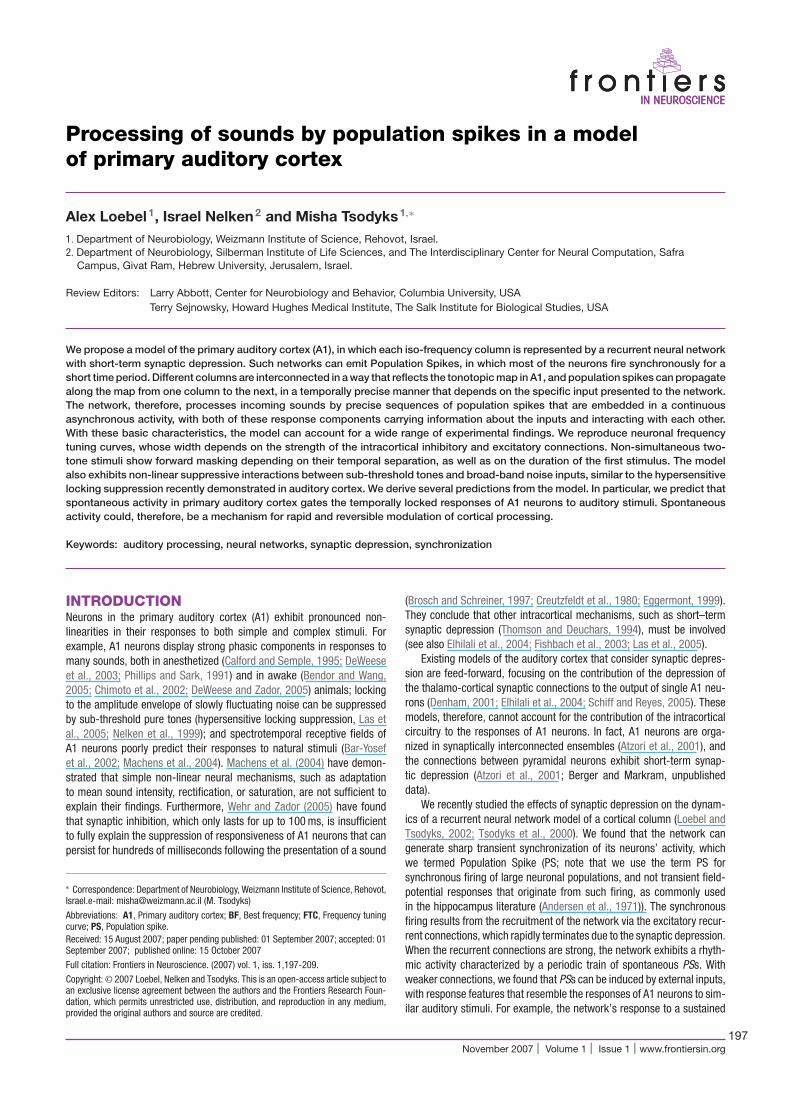
for excitatory to excitatory connections, and correspondingly for otherconnections, see Figure 1A), from background synaptic inputs, eE
i (eIl ),
representing the effects of projections from other brain areas, and fromsensory inputs arriving from the medial geniculate body to excitatory neu-rons, si (its detailed description is presented in the following section).
Wine
s
mw
igure 1. A schematic illustration of the model architecture. (A) Each col-mn of the network is composed of interconnected excitatory and inhibitoryools of neurons. The width of the arrows represents the relative strength of aonnection. (B) The cortical tonotopic axis. Inter-columnar connections origi-ate from neurons of the excitatory pool of a column and target the neuronsf its two nearest neighbour columns.
or simplicity, sensory inputs were not introduced to inhibitory neurons.e checked that the addition of such inputs did not alter the behaviour
f the model. Intracortical connections targeting the excitatory populationxhibited activity-dependent synaptic depression, which was described byactors x and y that were computed from Equation (2) below. The valuesf the background inputs eE
i (eIl ) were drawn from a uniform distribu-
ion, and neurons were labelled such that higher labels corresponded toigher inputs (i.e. eE
1 < eE2 < eE
3 and so forth). For simplicity, we chosehreshold-linear form of the neuronal gain function, [z]+ = max(z, 0).ith this choice of the gain, the units of e and si (t ) were in Hz, and
ynaptic efficacies (J0EE , etc.) were without units.
The dynamics of the factors that governed the activity-dependentynaptic depression was described by the following equations (Abbottt al., 1997; Tsodyks and Markram, 1997):
dxi
dt= 1 − xi
τrec− UxiEi
dyl
dt= 1 − yl
τrec− UylIl
(2)
In short, the model assumes that a given synaptic connection hasfinite amount of resources for synaptic transmission. At any time, a
raction x (y) of the maximal amount of resources is available, of whichnly a portion, determined by the parameter U, is utilized in responseo an action potential, reducing the fraction of available resources by Ux
Uy). The utilized resources recovered with a single time constant, τrec.
e did not introduce synaptic facilitation in the connections targetingnhibitory neurons, since we know from the previous studies that it doesot significantly affect the occurrence of the PS s in the network (Tsodykst al., 2000).
In simulations, the following values of the parameters were used unlesspecified otherwise:
NE , NI =100, τE , τI =10−3 second, τEref, τ
Iref=3 × 10⁻³ second,
τrec=0.8 second, U=0.5, J0EE = 6, J0
EI =−4, J0IE = 0.5,
J0II =−0.5, eE
1 , eI1 = −10 Hz, eE
NE, eI
NI= 10 Hz.
The values of τrec and U were based on experimental data from measure-ents at the somatosensory cortex (Tsodyks and Markram, 1997), andere supported by preliminary measurements from the primary auditory
Frontiers in Neuroscience | November 2007 | Volume 1 | Issue 1
Processing of sounds by population spikes in a modelof primary auditory cortex
xQj
+R +
Fssrai8c
wtQ
swti
t
cortex (Berger and Markram, unpublished data). The values of eE1 , eI
1, eEN
and eIN were selected so that the mean spontaneous activity was sev-
eral Hz (Abeles, 1991); and the values of τE and τ I approximate synapticconductance’s dynamics, following the work of Treves (1993). The val-ues of the synaptic efficacies were set according to the results of (Loebeland Tsodyks, 2002). Specifically, in Loebel and Tsodyks (2002) we haveshown that PSs appear spontaneously if the recurrent excitatory con-nections strength is above a certain critical value that depends on theparameters of the model. In this study, we chose the connection strengthJ 0
EE below this critical value, such that PSs can only appear in responseto external inputs. The values of J 0
EI, J0IE and J 0
II were selected in order toachieve an approximate balance of excitation and inhibition.
Finally, we have previously shown that the qualitative features of thenetwork dynamics do not depend on the precise values of the parameters.We have also shown that our results, obtained with rate equations, weresimilar when we used more realistic, integrate and fire spiking neuronmodel (Tsodyks et al., 2000; Loebel and Tsodyks, 2002).
Modeling A1P columns were labelled from 1 to P, with each label representing acolumns placing along the tonotopic map of A1 with increasing auditoryfrequencies (Figure 1B) (Merzenich et al., 1975; Zhang et al., 2003).An excitatory neuron within column Q has synaptic connections to allof the excitatory (inhibitory) neurons of columns Q ± 1 and Q ± 2 withefficacies of connections J1
EE (J1IE) and J2
EE (J2IE), respectively. As within
a column, synapses targeting excitatory neurons were modelled withactivity-dependent synaptic depression (with the same values for τ rec andU), and synapses targeting inhibitory neurons were modelled without theeffects of short-term plasticity. With the addition of the intercolumnar con-nections, the complete system of equations that describe the dynamicsof the rate variables has the following form (superscripts denote columnslabelling along the map):
τEdE
Qi
d t= −E
Qi + (1 − τE
refEQi )
[2∑
R=−2
J|R|EE
NE
NE∑j=1
U
τI
dIQ
l
d t= −I
Q
l + (1 − τIrefI
Q
l )
[2∑
R=−2
J|R|IE
NE
NE∑j=1
EQj
The complementary equations for the time evolution of the synapticdepression factors (xQ
i , yQ
l ) are as in Equation (2), with the addition of thesuperscripts where appropriate.
The sensory inputs to the cortex were represented by a sum ofiso-frequency contributions, each a product of temporal and spatial com-ponents:
sQ,Mi (t) = ςM (t)hQ,M
i (4)
where sQ,Mi is the sensory input received by the i-th neuron of column Q
when an input was presented with the frequency of column M; ζM(t) repre-
sent its temporal envelope; and the spatial component, hQ,Mi , determined
its amplitude as follows:
hQ,Mi = Ae− |Q−M |
λS (A) (5)
A is the peak magnitude of the input, at column M; and λS (A) is aparameter that determines how localized is its effect over the corticalsheet. The dependency of λS (A) on the amplitude A reflected the increasein the width of frequency tuning with increasing sound level throughout theauditory system (Hudspeth, 2000). For that purpose, the following relationwas chosen:
λS (A) ={
λC A ≤ α
λC + (A − α)δ
A > α(6)
rt1
RBWo
www.frontiersin.org
+RE
Q+Rj + JEI
NI
NI∑j=1
UyQj I
Qj + e
E,Qi +
P∑M=1
sQ,Mi
]+
JII
NI
NI∑j=1
Ij + eI,Q
l
]+ (3)
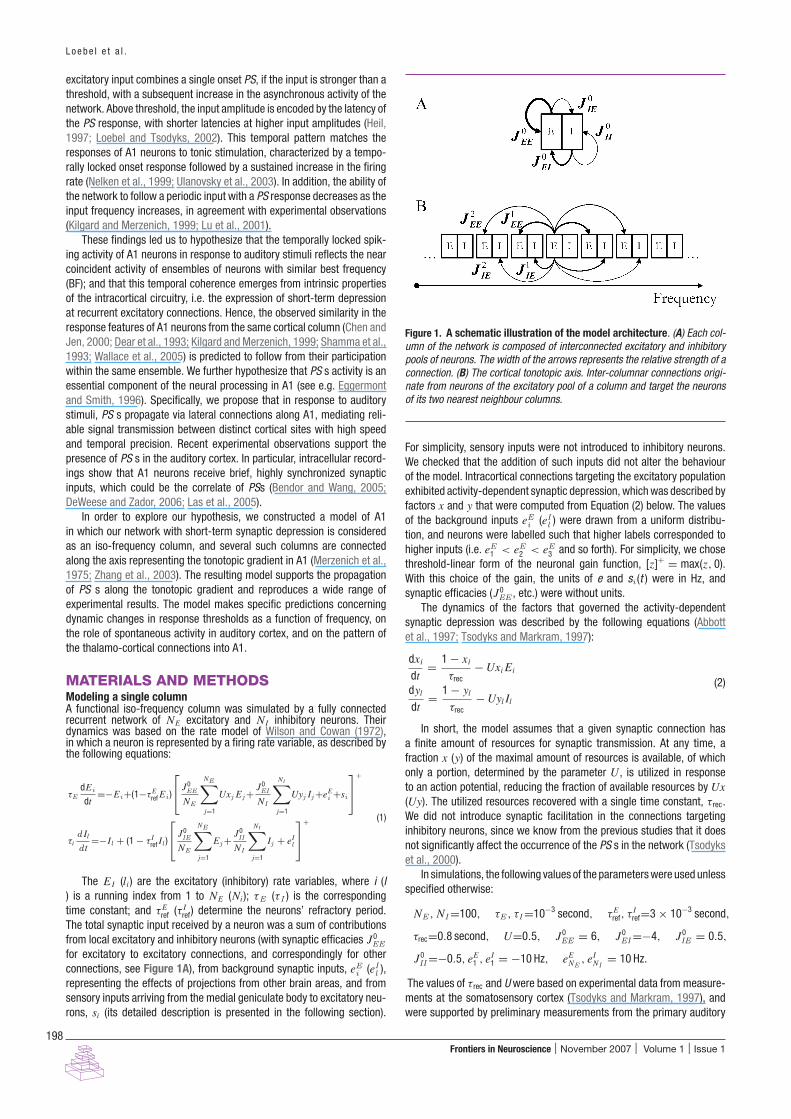
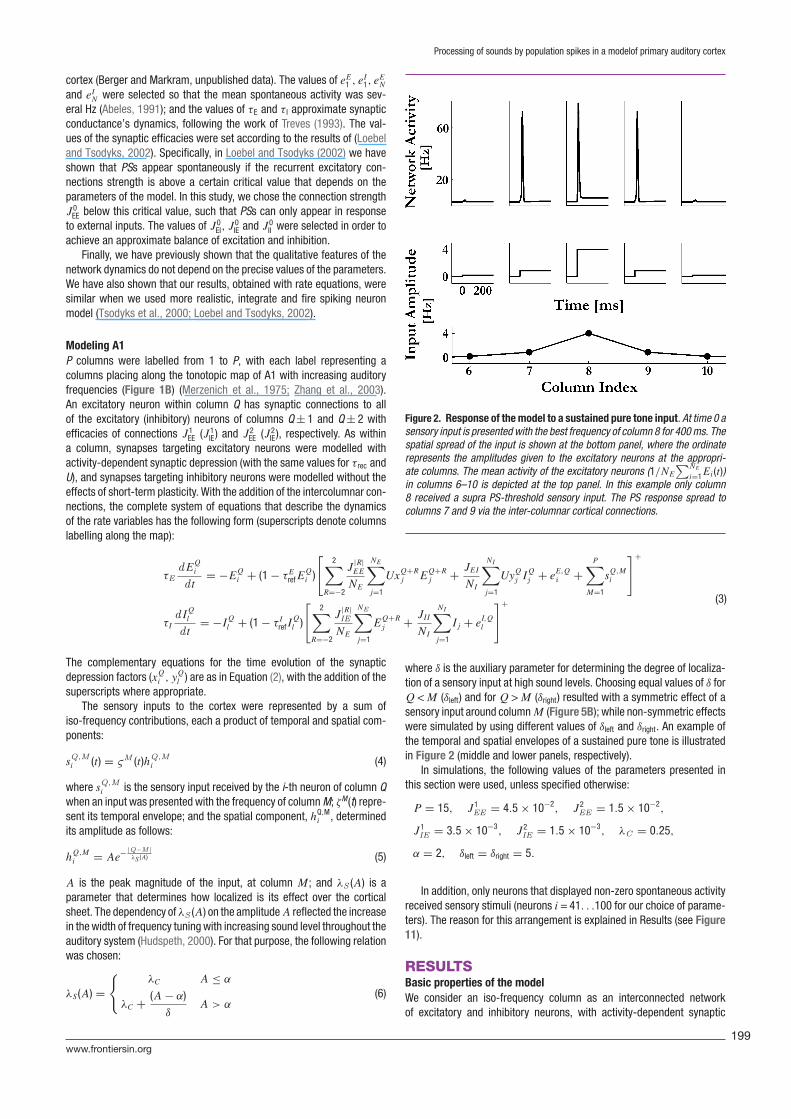
igure 2. Response of the model to a sustained pure tone input. At time 0 aensory input is presented with the best frequency of column 8 for 400 ms. Thepatial spread of the input is shown at the bottom panel, where the ordinateepresents the amplitudes given to the excitatory neurons at the appropri-te columns. The mean activity of the excitatory neurons (1/NE
∑NE
i=1Ei(t))n columns 6–10 is depicted at the top panel. In this example only column
received a supra PS-threshold sensory input. The PS response spread toolumns 7 and 9 via the inter-columnar cortical connections.
here δ is the auxiliary parameter for determining the degree of localiza-ion of a sensory input at high sound levels. Choosing equal values of δ for
< M (δleft) and for Q > M (δright) resulted with a symmetric effect of aensory input around column M (Figure 5B); while non-symmetric effectsere simulated by using different values of δleft and δright. An example of
he temporal and spatial envelopes of a sustained pure tone is illustratedn Figure 2 (middle and lower panels, respectively).
In simulations, the following values of the parameters presented inhis section were used, unless specified otherwise:
1 −2 2 −2
P = 15, JEE = 4.5 × 10 , JEE = 1.5 × 10 ,J1IE = 3.5 × 10⁻³
, J2IE = 1.5 × 10⁻³
, λC = 0.25,
α = 2, δleft = δright = 5.
In addition, only neurons that displayed non-zero spontaneous activityeceived sensory stimuli (neurons i = 41. . .100 for our choice of parame-ers). The reason for this arrangement is explained in Results (see Figure1).
ESULTSasic properties of the modele consider an iso-frequency column as an interconnected network
f excitatory and inhibitory neurons, with activity-dependent synaptic
199
200
L o e b e l e t a l .
depression in the connections onto excitatory neurons. Several suchcolumns are connected along an axis, analogous to the anterior–posterioraxis of the tonotopic mapping of A1 (Figure 1; Merzenich et al., 1975;Zhang et al., 2003). The excitatory neurons of each column project toother columns, with connection strength that is decreasing with the dis-tance between the columns. Every neuron receives randomly distributedbackground input, resulting in the spontaneous population activity withdistribution similar to that observed in A1 (Nelken, unpublished data).In addition, the excitatory neurons receive sensory inputs that representthalamo-cortical activity induced by auditory stimuli. These inputs arecomputed as a product of a spatial component, which represents theextent of the thalamic input into A1, and a temporal component, whichrepresents the temporal structure of the stimuli (see Methods for moredetails).
An example of the temporal and spatial components of the sensoryinputs is illustrated in Figure 2 (middle and lower panels, respectively),together with a typical response of the model: at the steady state, theaverage activity of the neurons at each column is on the order of a few Hz,representing asynchronous spontaneous activity. When a sensory inputthat is strong enough is introduced, the corresponding column emits a
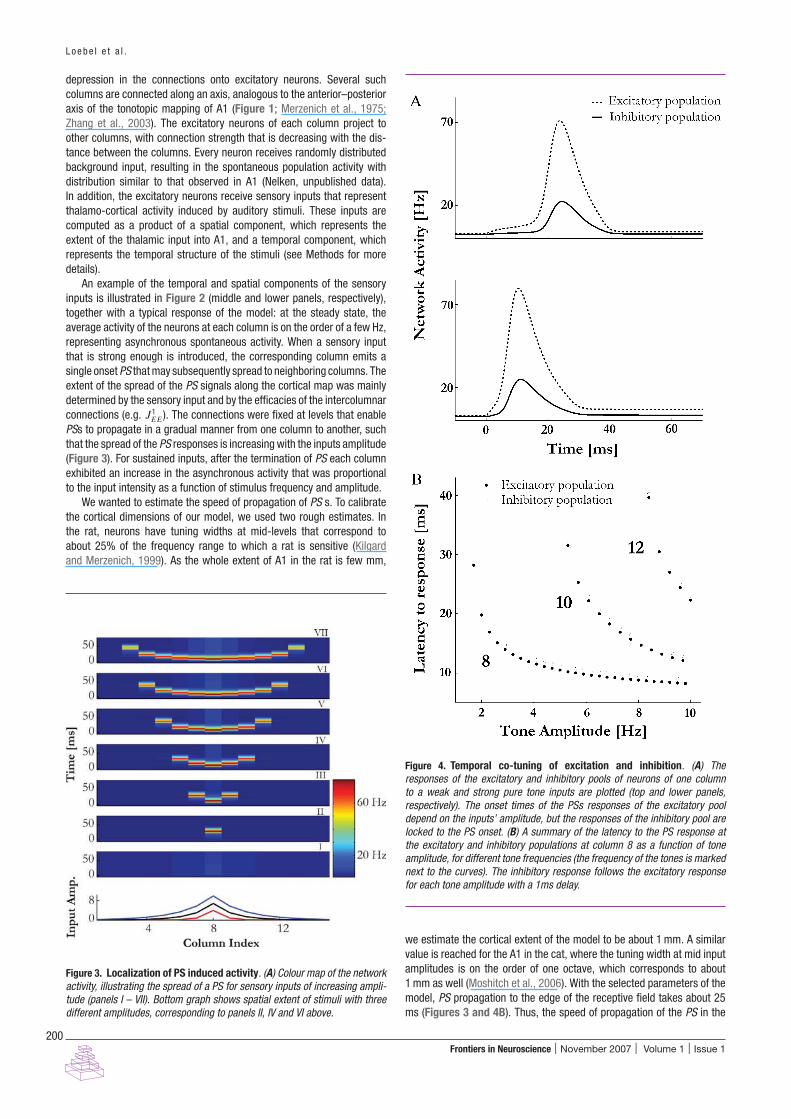
single onset PS that may subsequently spread to neighboring columns. Theextent of the spread of the PS signals along the cortical map was mainlydetermined by the sensory input and by the efficacies of the intercolumnarconnections (e.g. J1EE). The connections were fixed at levels that enablePSs to propagate in a gradual manner from one column to another, suchthat the spread of the PS responses is increasing with the inputs amplitude(Figure 3). For sustained inputs, after the termination of PS each columnexhibited an increase in the asynchronous activity that was proportionalto the input intensity as a function of stimulus frequency and amplitude.
We wanted to estimate the speed of propagation of PS s. To calibratethe cortical dimensions of our model, we used two rough estimates. Inthe rat, neurons have tuning widths at mid-levels that correspond toabout 25% of the frequency range to which a rat is sensitive (Kilgardand Merzenich, 1999). As the whole extent of A1 in the rat is few mm,
Figure 3. Localization of PS induced activity. (A) Colour map of the networkactivity, illustrating the spread of a PS for sensory inputs of increasing ampli-tude (panels I – VII). Bottom graph shows spatial extent of stimuli with threedifferent amplitudes, corresponding to panels II, IV and VI above.
Frtrdltanf
wva1mm
igure 4. Temporal co-tuning of excitation and inhibition. (A) Theesponses of the excitatory and inhibitory pools of neurons of one columno a weak and strong pure tone inputs are plotted (top and lower panels,espectively). The onset times of the PSs responses of the excitatory pool
epend on the inputs’ amplitude, but the responses of the inhibitory pool areocked to the PS onset. (B) A summary of the latency to the PS response athe excitatory and inhibitory populations at column 8 as a function of tonemplitude, for different tone frequencies (the frequency of the tones is markedext to the curves). The inhibitory response follows the excitatory responseor each tone amplitude with a 1ms delay.
e estimate the cortical extent of the model to be about 1 mm. A similaralue is reached for the A1 in the cat, where the tuning width at mid inputmplitudes is on the order of one octave, which corresponds to aboutmm as well (Moshitch et al., 2006). With the selected parameters of theodel, PS propagation to the edge of the receptive field takes about 25s (Figures 3 and 4B). Thus, the speed of propagation of the PS in the
Frontiers in Neuroscience | November 2007 | Volume 1 | Issue 1

Processing of sounds by population spikes in a modelof primary auditory cortex
ithou5)) redula
aipebPbctwiiot
Figure 5. Frequency tuning curves (FTC). (A) FTC in networks with and winput, modelled by selecting different �left and �right (see methods; Equation (inhibition modulation on the shape of FTC. (D) Effects of background input mo
model is 40 mm/second, which is in the order of experimentally estimatedspeed of propagation of intracortical signals (Bringuier et al., 1999).
It has been observed in A1 that the excitatory and inhibitory com-ponents of the synaptic conductance are co-tuned with a stereotypicaltemporal ordering (Las et al., 2005; Wehr and Zador, 2003; Zhang etal., 2003), such that the initial excitatory conductance is accurately fol-lowed by inhibition with a few milliseconds delay. For most A1 neuronsthe delay is independent of frequency and intensity of the auditory stimuli(Las et al., 2005; Wehr and Zador, 2003). Our model easily accounts forthese observations, because PSs are triggered within the excitatory sub-population and subsequently recruit the inhibitory neurons of the samecolumn. Hence, while the latency of a PS response depends on the ampli-tude and frequency of the sensory inputs, the relative timing betweenexcitation and inhibition is determined by the intrinsic dynamics of thenetwork and is therefore independent on the input (Figure 4).
Frequency tuning curvesFTC (FTC) are plots of thresholds to isolated pure tone stimuli as a functionof tone frequency. Most neurons in A1 have FTCs with a stereotypic ‘V’shape showing a single distinct BF (Schreiner et al., 2000; Ulanovsky etal., 2003). Similarly, FTCs in the model were calculated with pure-tonelike inputs (of 50 ms duration) of various amplitudes and frequencies.The stimuli were presented when the network was at the steady-statespontaneous rate, so that the response to a stimulus was not affected byprevious stimulus presentations. The minimum amplitude that induced aPS response at a certain column was determined as a function of the inputfrequency, resulting in a characteristic ‘V’-shaped FTC (Figure 5A; hereand below we use a middle column to illustrate the model behavior).
While frequency selectivity in A1 is primarily inherited from its inputs(unlike the corresponding feature selectivity in other sensory areas, such
lrtpFpBma
dtiae
www.frontiersin.org
t inter-columnar connections. (B) Asymmetric spatial spread of the sensorysult in asymmetric FTCs. �left = 5, with varying �right. (C) Effects of recurrenttion on the shape of FTC.
s the primary visual cortex, Hubel and Wiesel, 1962), experimental find-ngs indicate that at a given cortical site thalamo-cortical and intracorticalathways preferentially mediate responses to BF and non-BF stimuli (Kaurt al., 2004). Indeed, the bandwidth of the model FTC was determinedoth by the spatial spread of the sensory inputs and by the ability ofS s to propagate along the cortical map. This feature of the model cane demonstrated by modifying the efficacies of the lateral intercolumnaronnections (J 1
EE and J 2EE ). Weaker intercolumnar connections reduced
he spread of the PS s to nearby columns, narrowing the FTC. With veryeak intercolumnar connections, the PS responses of the model were
nduced mainly by the sensory input. On the other hand, changing thentercolumnar connection strengths had no impact on PS threshold andnset latency at the BF, since at that frequency it was always evoked byhe sensory input (Figure 5A, see Kaur et al., 2004).
FTCs are often asymmetric, with different slopes of their upper and
ower edges. This feature is at least partially inherited from peripheralesponses. However, cortical tuning curves may be substantially widerhan peripheral tuning curves (Moshitch et al., 2006), and therefore centralrocesses might play a role in determining the symmetry of the corticalTCs. In the model, FTC symmetry could be manipulated by choosing thearameters of the sensory input that control its localization around theF (see Methods, Equation 6), while keeping all other parameters of theodel fixed (Figure 5B). Thus, asymmetry of the sensory input results insymmetry of the cortical FTCs.While the occurrence of the PS s in the model is due to the synaptic
epression of the recurrent excitatory connections, the precise shape ofhe FTCs is also influenced by recurrent inhibition. In particular, reduc-ng the level of recurrent inhibition (J 0
EI and J0II ) results in wider FTCs
nd lower response thresholds (Figure 5C). This is in agreement withxperimental studies showing that microinjections of the GABAA antago-
201
Fpssir8
202
L o e b e l e t a l .
nist bicuculline lead to expansion of FTC of A1 neurons and to decreasedthresholds in response to BF tones, in a columnar-specific manner (Chenand Jen, 2000; Wang et al., 2002). In addition, the PS responses werelarger in amplitude for lower feedback inhibition (results not shown), inagreement with experimental findings of higher neural activity in responseto sounds after bicuculline application (Chen and Jen, 2000; Wang et al.,2002).
Rapid and reversible modulation of network responses by themodulation of spontaneous activityNeurons in A1 exhibit various levels of spontaneous activity, which pre-sumably reflect inputs from other cortical neurons of the same region andfrom distinct brain areas. A novel characteristic property of the model isthe strong influence of spontaneous activity on the ensembles response.In particular, the PS s strongly depend on the strength of the connectionsbetween the neurons of the excitatory pool of a column. A neuron with highspontaneous activity would have weaker effective synaptic connectionssince its synapses would be in a depressed state. Hence, for two identicalsets of absolute synaptic efficacies, different distributions of spontaneousactivity across the excitatory pool of neurons of a column result in differ-ent states of its synaptic connections, and therefore different responseproperties to sensory stimuli.
For example, uniformly reducing the spontaneous activity by shiftingthe distribution of the background inputs toward more negative val-ues (eE,Q
i → eE,Qi − ∆e and e
I,Q
l → eI,Q
l − ∆e for all i,l and Q,seeEquation (3)), leads to stronger effective connectivity between the neu-rons as the synapses are less depressed on average. As a result, thethreshold for PS at best frequency is lower and it can propagate fur-ther, resulting in wider FTCs (Figure 5D). Once the background inputs areshifted back to their default values, so does the spontaneous activity ofthe network, and the FTCs returns to their original form with a time scaleof τrec (data not shown). Thus, appropriately adjusting the spontaneousactivity may represent a mechanism for rapid and reversible modulationof the responses of neuronal circuits.
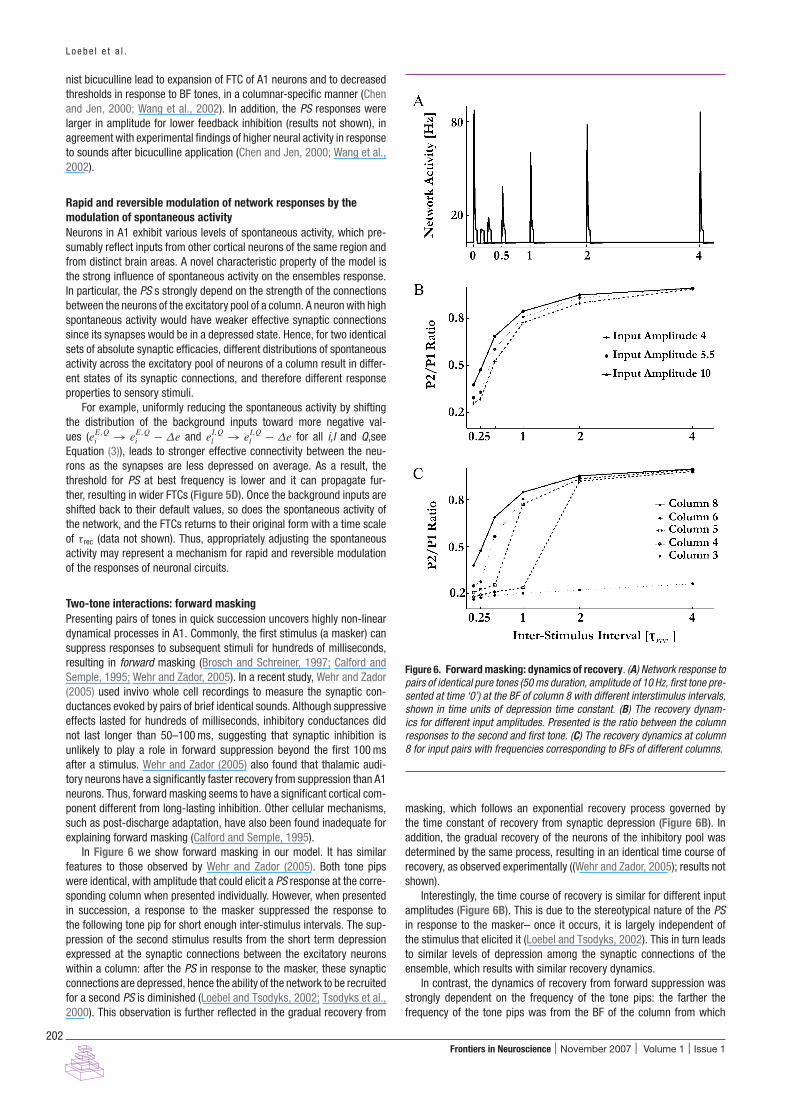
Two-tone interactions: forward maskingPresenting pairs of tones in quick succession uncovers highly non-lineardynamical processes in A1. Commonly, the first stimulus (a masker) cansuppress responses to subsequent stimuli for hundreds of milliseconds,resulting in forward masking (Brosch and Schreiner, 1997; Calford andSemple, 1995; Wehr and Zador, 2005). In a recent study, Wehr and Zador(2005) used invivo whole cell recordings to measure the synaptic con-ductances evoked by pairs of brief identical sounds. Although suppressiveeffects lasted for hundreds of milliseconds, inhibitory conductances didnot last longer than 50–100 ms, suggesting that synaptic inhibition isunlikely to play a role in forward suppression beyond the first 100 msafter a stimulus. Wehr and Zador (2005) also found that thalamic audi-tory neurons have a significantly faster recovery from suppression than A1neurons. Thus, forward masking seems to have a significant cortical com-
ponent different from long-lasting inhibition. Other cellular mechanisms,such as post-discharge adaptation, have also been found inadequate forexplaining forward masking (Calford and Semple, 1995).In Figure 6 we show forward masking in our model. It has similarfeatures to those observed by Wehr and Zador (2005). Both tone pipswere identical, with amplitude that could elicit a PS response at the corre-sponding column when presented individually. However, when presentedin succession, a response to the masker suppressed the response tothe following tone pip for short enough inter-stimulus intervals. The sup-pression of the second stimulus results from the short term depressionexpressed at the synaptic connections between the excitatory neuronswithin a column: after the PS in response to the masker, these synapticconnections are depressed, hence the ability of the network to be recruitedfor a second PS is diminished (Loebel and Tsodyks, 2002; Tsodyks et al.,2000). This observation is further reflected in the gradual recovery from
mtadrs
aitte
sf
igure 6. Forward masking: dynamics of recovery. (A) Network response toairs of identical pure tones (50 ms duration, amplitude of 10 Hz, first tone pre-ented at time ‘0’) at the BF of column 8 with different interstimulus intervals,hown in time units of depression time constant. (B) The recovery dynam-cs for different input amplitudes. Presented is the ratio between the columnesponses to the second and first tone. (C) The recovery dynamics at columnfor input pairs with frequencies corresponding to BFs of different columns.
asking, which follows an exponential recovery process governed by
he time constant of recovery from synaptic depression (Figure 6B). Inddition, the gradual recovery of the neurons of the inhibitory pool wasetermined by the same process, resulting in an identical time course ofecovery, as observed experimentally ((Wehr and Zador, 2005); results nothown).Interestingly, the time course of recovery is similar for different inputmplitudes (Figure 6B). This is due to the stereotypical nature of the PSn response to the masker– once it occurs, it is largely independent ofhe stimulus that elicited it (Loebel and Tsodyks, 2002). This in turn leadso similar levels of depression among the synaptic connections of thensemble, which results with similar recovery dynamics.
In contrast, the dynamics of recovery from forward suppression wastrongly dependent on the frequency of the tone pips: the farther therequency of the tone pips was from the BF of the column from which
Frontiers in Neuroscience | November 2007 | Volume 1 | Issue 1

Processing of sounds by population spikes in a modelof primary auditory cortex
FifP
t9FbiwttiqSfi8PsptaMaspmat
inhibitory sidebands of auditory neurons (Rotman et al., 2001; Shamma et
Figure 7. Recovery dynamics from forward masking depends on the intra-cortical pathway. The response of the model to a masker with the frequency ofcolumn 4 (bottom panel) and the responses to probes with the same frequencyat different inter-stimulus intervals (upper panels) are displayed. The delay inthe recovery of the PS to the probes at column 8 depends on the recovery ofthe intracortical pathway that mediates the propagation of PS activity betweencolumns 4 and 8. The ISI for a given pair of inputs is marked above each panel.
the activity is recorded, the longer was the delay of the recovery fromsuppression of the PS response to the second stimulus at that column(Figure 6C). The reason is that in this case, PS s are generated at acolumn corresponding to the stimulus frequency and then propagate tothe recording site through intracortical connections. For the second PS,this propagation is suppressed both due to depressed intracolumnarconnections and smaller PS amplitudes at the intermediate columns(Figure 7).
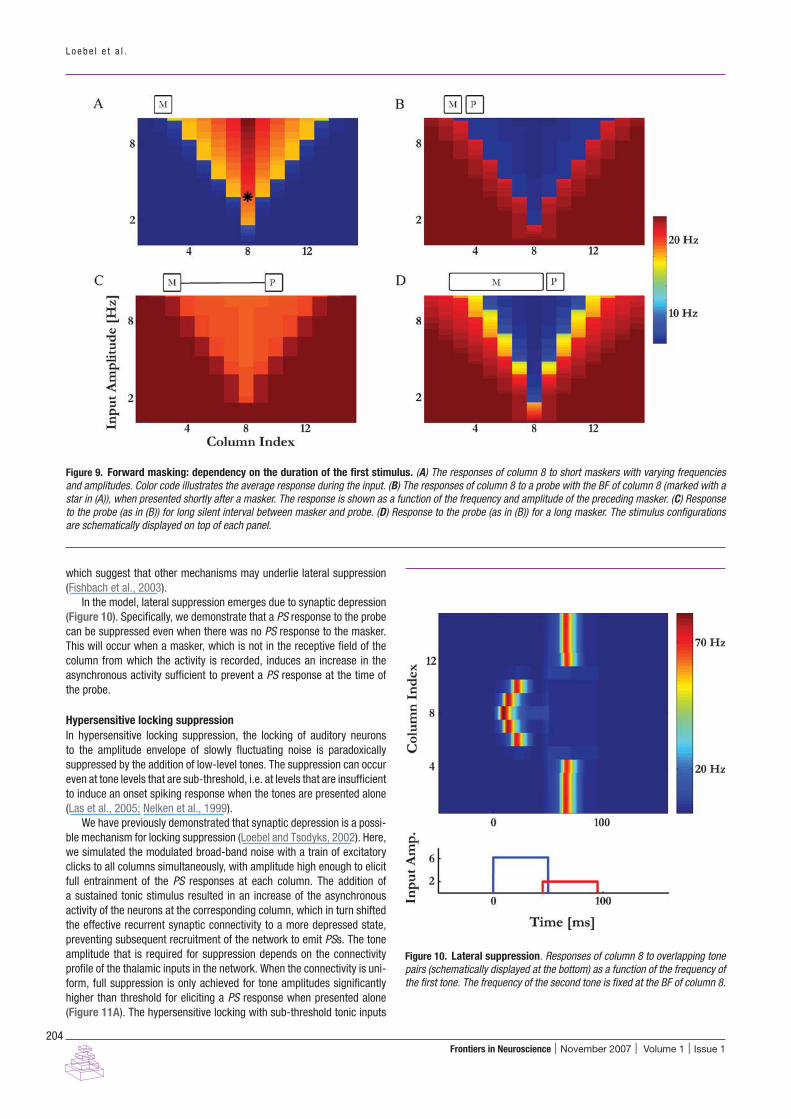
We, therefore, predict that receptive fields of A1 neurons dont recoveruniformly from forward masking. Recovery occurs first at frequenciesnear the neurons’ BF and preferentially at higher amplitudes, followedby a progressive expansion of the receptive fields back to their originalform. We illustrate this prediction in Figure 8. The FTC was measuredusing pairs of identical tone pips of 50 ms duration, separated by varyinginterstimulus-interval. The figure presents the FTC for the first and for thesecond stimuli. As can be observed, for short ISI the FTC in response to
the second stimulus covered only a fraction of the FTC in response to themasker. The FTC in response to the second stimulus recovered with a timeconstant comparable to τrec.Forward masking depends also on the duration of the masker as shownby Brosch and Schreiner (1997). They used maskers of varying frequencyand sound level, and tested their effects on the responses to a near-threshold, short BF tone (a probe). Figure 9A shows the response of themodel to the maskers of different frequencies and amplitudes. As foundin experiments, when the probe was presented just after a masker of ashort duration, a response to a masker induced a complete suppressionof the response to the probe (Figure 9B). When the probe was presentedwith a long delay after the offset of a short masker, there was only minorsuppression of the responses to the probe (Figure 9C). Figure 9D showsthe responses to the probe when the masker duration was selected such
afporwnstFiRtr
www.frontiersin.org
igure 8. The receptive field of a column depends on the history of thenputs. Pairs of identical pure tones were presented with different ISIs. FTCsor the second tone is computed as a minimal amplitude at which the secondS with the strength of 0.6 of the first one is emitted.
hat the time from masker onset to probe onset was the same as in FigureC, but the time from masker offset to probe onset was the same as inigure 9B. If the response to the probe tones would be determined onlyy the time elapsed from masker onset, Figure 9D should have been
dentical to Figure 9C. Alternatively, if the response to the probe tonesould be determined only by the silent interval between the masker and
he probe, Figure 9D should have been identical to Figure 9B. In fact,he results were intermediate: suppression was substantially larger thann Figure 9C, but not as strong as in Figure 9B). These modeling resultsualitatively match the experimental findings (cf. Figure 13 in Brosch andchreiner, 1997). The model accounts for this pattern of responses as
ollows. The suppression of the PS response to the probe (see Figure 9B)s due to the depressed state of the synaptic connections within column
resulting from the PS in response to a masker, and the recovery of theS response to the probe in Figure 9C is due to the recovery of theseynaptic connections during the silent period between the masker and therobe. The long tone used in Figure 9D causes an onset PS response, andhis onset response is now followed by an increase of the asynchronousctivity of the neurons within the ensemble (Loebel and Tsodyks, 2002).askers with frequencies that are closer to the BF of column 8 induce
synchronous activity high enough to maintain the depressed state of theynapses after the onset PS response (in response to the masker onset),reventing a subsequent PS (in response to the probe onset). In contrast,askers with frequencies far from the BF of column 8 induce much less
synchronous activity, and the synapses of column 8 recovered enougho allow the generation of a PS in response to the probe.
Pairs of tones have also been used in a different way, to measure
l., 1993). In these experiments, the first tone pip of each pair had a varyingrequency (similar to the masker at the previous section). The second toneip, the probe, was presented at the neurons’ BF before or just after theffset of the masker, with amplitude close to threshold. It was observed thatesponses to the probe were generally present when the masker frequencyas outside the FTC, and that the probe response was suppressed if theeuron responded to the masker. Interestingly, a response to the probe wasometimes partially or even fully suppressed when there was no responseo the masker; this happened with masker frequencies just outside theTC. This result was, at least in part, attributed to the effects of lateral
nhibition between neurons with adjacent BF (Calford and Semple, 1995;otman et al., 2001; Wallace et al., 2005; Zhang et al., 2003). However,
his view is inconsistent with the co-tuning of the excitatory and inhibitoryeceptive fields of A1 neurons (Wehr and Zador, 2003; Zhang et al., 2003),
203
L o e b e l e t a l .
ulus. (A) The responses of column 8 to short maskers with varying frequencies(B) The responses of column 8 to a probe with the BF of column 8 (marked with aa function of the frequency and amplitude of the preceding masker. (C) Response
) Response to the probe (as in (B)) for a long masker. The stimulus configurations
204
Figure 9. Forward masking: dependency on the duration of the first stimand amplitudes. Color code illustrates the average response during the input.star in (A)), when presented shortly after a masker. The response is shown asto the probe (as in (B)) for long silent interval between masker and probe. (Dare schematically displayed on top of each panel.
which suggest that other mechanisms may underlie lateral suppression(Fishbach et al., 2003).
In the model, lateral suppression emerges due to synaptic depression(Figure 10). Specifically, we demonstrate that a PS response to the probecan be suppressed even when there was no PS response to the masker.This will occur when a masker, which is not in the receptive field of thecolumn from which the activity is recorded, induces an increase in theasynchronous activity sufficient to prevent a PS response at the time ofthe probe.
Hypersensitive locking suppressionIn hypersensitive locking suppression, the locking of auditory neuronsto the amplitude envelope of slowly fluctuating noise is paradoxicallysuppressed by the addition of low-level tones. The suppression can occureven at tone levels that are sub-threshold, i.e. at levels that are insufficientto induce an onset spiking response when the tones are presented alone
(Las et al., 2005; Nelken et al., 1999).We have previously demonstrated that synaptic depression is a possi-ble mechanism for locking suppression (Loebel and Tsodyks, 2002). Here,we simulated the modulated broad-band noise with a train of excitatoryclicks to all columns simultaneously, with amplitude high enough to elicitfull entrainment of the PS responses at each column. The addition ofa sustained tonic stimulus resulted in an increase of the asynchronousactivity of the neurons at the corresponding column, which in turn shiftedthe effective recurrent synaptic connectivity to a more depressed state,preventing subsequent recruitment of the network to emit PSs. The toneamplitude that is required for suppression depends on the connectivityprofile of the thalamic inputs in the network. When the connectivity is uni-form, full suppression is only achieved for tone amplitudes significantlyhigher than threshold for eliciting a PS response when presented alone(Figure 11A). The hypersensitive locking with sub-threshold tonic inputs
Figure 10. Lateral suppression. Responses of column 8 to overlapping tonepairs (schematically displayed at the bottom) as a function of the frequency ofthe first tone. The frequency of the second tone is fixed at the BF of column 8.
Frontiers in Neuroscience | November 2007 | Volume 1 | Issue 1
Processing of sounds by population spikes in a modelof primary auditory cortex
Fwcir(pt(
ftti
uitsc
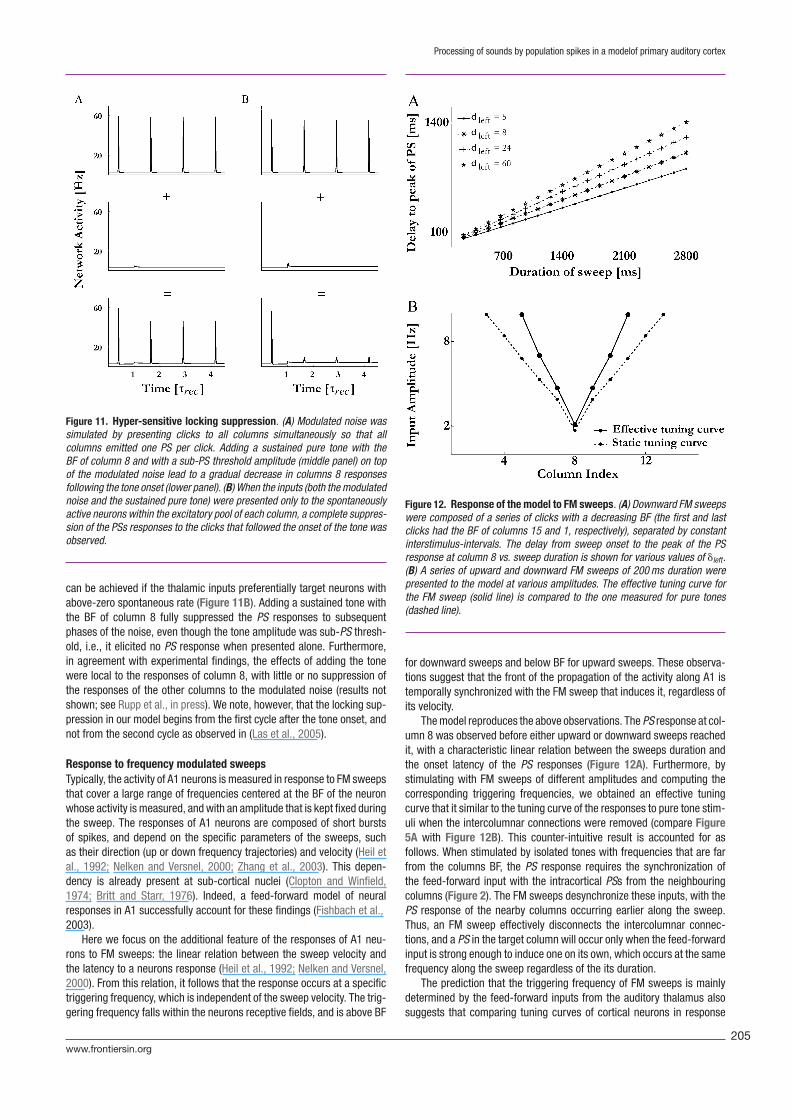
Figure 11. Hyper-sensitive locking suppression. (A) Modulated noise wassimulated by presenting clicks to all columns simultaneously so that allcolumns emitted one PS per click. Adding a sustained pure tone with theBF of column 8 and with a sub-PS threshold amplitude (middle panel) on topof the modulated noise lead to a gradual decrease in columns 8 responsesfollowing the tone onset (lower panel). (B) When the inputs (both the modulatednoise and the sustained pure tone) were presented only to the spontaneouslyactive neurons within the excitatory pool of each column, a complete suppres-sion of the PSs responses to the clicks that followed the onset of the tone wasobserved.
can be achieved if the thalamic inputs preferentially target neurons withabove-zero spontaneous rate (Figure 11B). Adding a sustained tone withthe BF of column 8 fully suppressed the PS responses to subsequentphases of the noise, even though the tone amplitude was sub-PS thresh-old, i.e., it elicited no PS response when presented alone. Furthermore,in agreement with experimental findings, the effects of adding the tonewere local to the responses of column 8, with little or no suppression ofthe responses of the other columns to the modulated noise (results notshown; see Rupp et al., in press). We note, however, that the locking sup-pression in our model begins from the first cycle after the tone onset, andnot from the second cycle as observed in (Las et al., 2005).
Response to frequency modulated sweepsTypically, the activity of A1 neurons is measured in response to FM sweepsthat cover a large range of frequencies centered at the BF of the neuron
whose activity is measured, and with an amplitude that is kept fixed duringthe sweep. The responses of A1 neurons are composed of short burstsof spikes, and depend on the specific parameters of the sweeps, suchas their direction (up or down frequency trajectories) and velocity (Heil etal., 1992; Nelken and Versnel, 2000; Zhang et al., 2003). This depen-dency is already present at sub-cortical nuclei (Clopton and Winfield,1974; Britt and Starr, 1976). Indeed, a feed-forward model of neuralresponses in A1 successfully account for these findings (Fishbach et al.,2003).Here we focus on the additional feature of the responses of A1 neu-rons to FM sweeps: the linear relation between the sweep velocity andthe latency to a neurons response (Heil et al., 1992; Nelken and Versnel,2000). From this relation, it follows that the response occurs at a specifictriggering frequency, which is independent of the sweep velocity. The trig-gering frequency falls within the neurons receptive fields, and is above BF
cu5fftcPTtif
ds
www.frontiersin.org
igure 12. Response of the model to FM sweeps. (A) Downward FM sweepsere composed of a series of clicks with a decreasing BF (the first and last
licks had the BF of columns 15 and 1, respectively), separated by constantnterstimulus-intervals. The delay from sweep onset to the peak of the PSesponse at column 8 vs. sweep duration is shown for various values of �left.B) A series of upward and downward FM sweeps of 200 ms duration wereresented to the model at various amplitudes. The effective tuning curve forhe FM sweep (solid line) is compared to the one measured for pure tonesdashed line).
or downward sweeps and below BF for upward sweeps. These observa-ions suggest that the front of the propagation of the activity along A1 isemporally synchronized with the FM sweep that induces it, regardless ofts velocity.
The model reproduces the above observations. The PS response at col-mn 8 was observed before either upward or downward sweeps reached
t, with a characteristic linear relation between the sweeps duration andhe onset latency of the PS responses (Figure 12A). Furthermore, bytimulating with FM sweeps of different amplitudes and computing theorresponding triggering frequencies, we obtained an effective tuningurve that it similar to the tuning curve of the responses to pure tone stim-
li when the intercolumnar connections were removed (compare FigureA with Figure 12B). This counter-intuitive result is accounted for asollows. When stimulated by isolated tones with frequencies that are farrom the columns BF, the PS response requires the synchronization ofhe feed-forward input with the intracortical PSs from the neighbouringolumns (Figure 2). The FM sweeps desynchronize these inputs, with theS response of the nearby columns occurring earlier along the sweep.hus, an FM sweep effectively disconnects the intercolumnar connec-ions, and a PS in the target column will occur only when the feed-forwardnput is strong enough to induce one on its own, which occurs at the samerequency along the sweep regardless of the its duration.The prediction that the triggering frequency of FM sweeps is mainlyetermined by the feed-forward inputs from the auditory thalamus alsouggests that comparing tuning curves of cortical neurons in response
205

L o e b e l e t a l .
Table 1. A summary of the response characteristics of A1 neurons that the model reproduces.
Experimental observation References Figure
Frequency tuning curves (FTC) e.g., Kilgard and Merzenich (1999),Schreiner et al. (2000)
Figure 5A
Dependency of FTC bandwidth on intra-cortical connectivity Kaur et al. (2004) Figure 5ADependency of FTC bandwidth and threshold at BF on cortical Chen and Jen (2000), Wang et al. (2002) Figure 5C
fuf
eitctts
vttZwbF6nib(
rt
206
inhibitionTemporal ordering of inhibitory and excitatory cortical responses;co-tuning of excitation and inhibitionForward masking: recovery dynamics
Forward masking: dependency on masker duration‘Lateral inhibition’
Hyper-sensitive locking suppressionLinear relation between FM sweeps velocity and response latency
to FM sweeps and to isolated pure tones could be a way to outline theextent of the supra-threshold thalamic inputs into A1 at a given corti-cal site. This follows from the above prediction as it asserts that FMsweeps temporally dissociate the contribution of the thalamic inputs tothe responses of A1 neurons from that of the lateral intracortical inputs theyreceive.
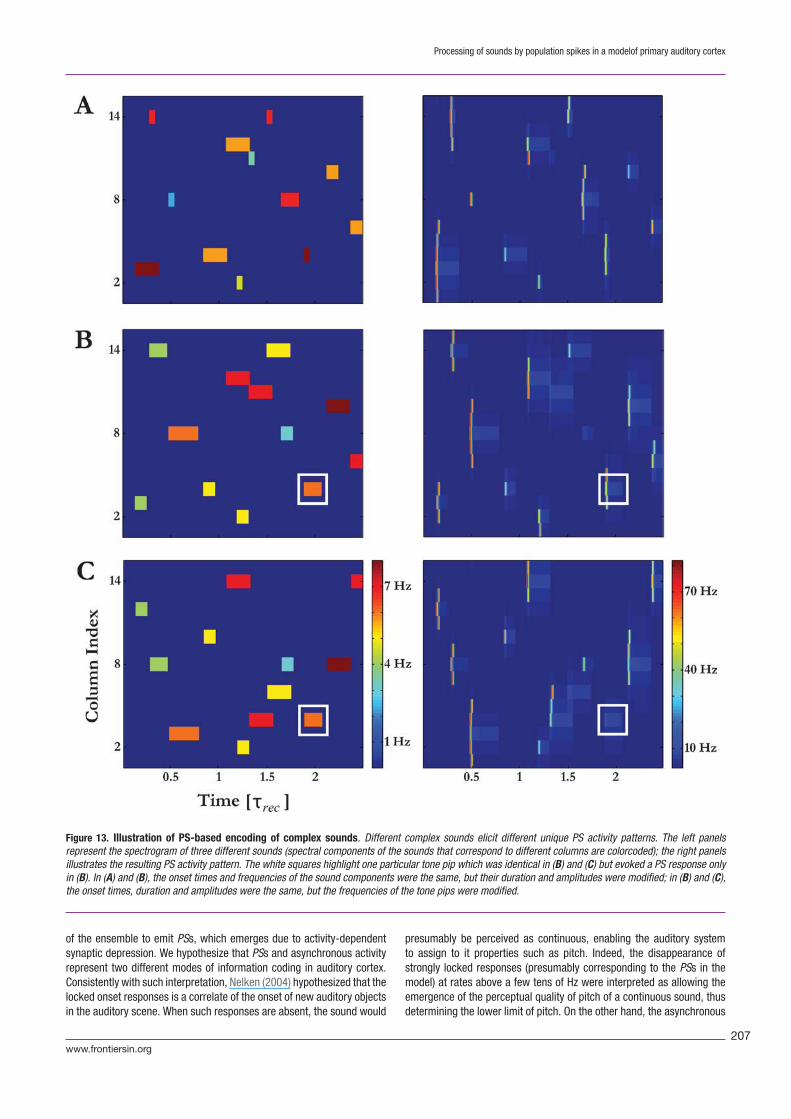
PS-based coding of complex soundsThe constrained propagation of a PS signal along the model tonotopic map,and its sensitivity to the temporal characteristics of the stimuli, suggestsa PS-based encoding scheme for transforming specific input patterns intotemporally precise responses in A1. We illustrate this scheme in Figure 13,where the responses of the model to several streams of complex soundsare presented. Each sound induced a unique pattern of PS activity alongthe model tonotopic map. Furthermore, the responses of the model to thecomplex sounds cannot be inferred from the responses of the columnsto their components (cf. Bar-Yosef et al., 2002; Rotman et al., 2001).For example, a given component will either succeed or fail to elicit a PSresponse at the corresponding columns, depending on the set of inputsthat preceded it. A more subtle effect of the location of an input withinthe complex sound is on the spread of the evoked PS activity around theinput’s frequency, which is not always symmetric (as in Figure 3).
DISCUSSIONIn the current study we presented a neural network model of the primaryauditory cortex (A1). The model is based on three key experimental obser-
vations: (i) A1 neurons tend to exhibit temporally locked onset responsesto sounds (Phillips and Sark, 1991; Calford and Semple, 1995; DeWeeseet al., 2003); (ii) neurons from the same anatomical column have similarresponse properties and share excitatory and inhibitory inputs (Chen andJen, 2000; Dear et al., 1993; Kilgard and Merzenich, 1999; Wallace et al.,2005); and (iii) excitatory synaptic connections between A1 neurons exhibitshort-term synaptic depression (Atzori et al., 2001; Berger and Markram,unpublished data). The main novel feature of the model is the introduc-tion of depressing intracortical synaptic connections. The responses ofthe model to sensory stimuli consist of a combination of increased asyn-chronous activity interspaced with short epochs of synchronized firing inlocal ensembles of neurons, called PSs. The PSs emerge due to the recur-rent connections in the local ensembles, and propagate along the model’stonotopic map via lateral connections in a stimulus-specific manner. Thismechanism of synchronous firing of local neuronal groups is differentabsdtFnliMs
di
Wehr and Zador (2003), Zhang et al. (2003),Las et al. (2005)
Figure 4
Calford and Semple (1995), Brosch andSchreiner (1997), Wehr and Zador (2005)
Figure 6
Brosch and Schreiner (1997) Figure 9e.g. Shamma et al. (1993), Rotman et al.(2001)
Figure 10
Nelken et al. (1999), Las et al. (2005) Figure 11Heil et al. (1992), Nelken and Versnel (2000) Figure 12
rom the Synfire model (Abeles, 1991), where neurons are arranged inni-directionally connected layers that synchronize sequentially due toeed-forward input.
Our model accounts, in a unified manner, for a wide range ofxperimentally observed properties of A1 neurons (see Table 1). They
nclude responses to pure tones under a large number of manipula-ions; the structure and timing of excitatory and inhibitory inputs toortical neurons; the exquisite dependence of cortical responses onhe times and frequencies of pairs of tones; the temporal structure ofhe responses to frequency-modulated tones; and hypersensitive lockinguppression.
The model suggests some new interpretations for a number of obser-ations. The cortical well-locked onset responses are identified here withhe PSs. Their short duration is accounted for by network dynamics ratherhan by the presence of quenching fast inhibition (as e.g., in Wehr andador, 2003). The precise matching between excitation and inhibition,ith the constant short delay between them (Figure 4), is accounted fory the tight intra-columnar coupling between excitation and inhibition.urthermore, inhibition does not participate in forward masking (Figure, as experimentally demonstrated in Wehr and Zador, 2005), and is notecessary for lateral suppression (Figure 10, as was already suggested
n Fishbach et al., 2003). On the other hand, the model suggests that inhi-ition influences the threshold and tuning width of the cortical neuronsFigure 5C).
The model provides a new interpretation to the puzzling, highlyeproducible finding that FM sweeps evoke spikes at a very precise instan-aneous trigger frequency. This high precision can be traced from the
uditory periphery all the way to cortical population responses measuredy magnetoencephalography (Rupp et al., 2002). If one considers thetrong non-linearities in the responses of A1 neurons and the temporalispersion inherent in synaptic transmission, this observation appearso be surprising. The model suggests that when stimulated with anM sweep, the cortical columns are effectively uncoupled. As a result,eurons respond preferably to their sensory input, resulting in the tightink between instantaneous frequency and the PS response. It is tempt-ng to speculate that it is the PS responses that are reflected in the
EG responses, resulting in their apparent linear dependence on thetimulus.
A key feature of the model that enables it to account for the largeiversity of experimental findings in a unified manner is the sensitive
nterplay between the asynchronous neural activity and the propensity
Frontiers in Neuroscience | November 2007 | Volume 1 | Issue 1
Processing of sounds by population spikes in a modelof primary auditory cortex
Figure 13. Illustration of PS-based encoding of complex sounds. Different crepresent the spectrogram of three different sounds (spectral components of the sillustrates the resulting PS activity pattern. The white squares highlight one particuin (B). In (A) and (B), the onset times and frequencies of the sound components wethe onset times, duration and amplitudes were the same, but the frequencies of th
of the ensemble to emit PSs, which emerges due to activity-dependentsynaptic depression. We hypothesize that PSs and asynchronous activityrepresent two different modes of information coding in auditory cortex.Consistently with such interpretation, Nelken (2004) hypothesized that thelocked onset responses is a correlate of the onset of new auditory objectsin the auditory scene. When such responses are absent, the sound would
ptsmed
www.frontiersin.org
omplex sounds elicit different unique PS activity patterns. The left panelsounds that correspond to different columns are colorcoded); the right panelslar tone pip which was identical in (B) and (C) but evoked a PS response onlyre the same, but their duration and amplitudes were modified; in (B) and (C),e tone pips were modified.
resumably be perceived as continuous, enabling the auditory systemo assign to it properties such as pitch. Indeed, the disappearance oftrongly locked responses (presumably corresponding to the PSs in theodel) at rates above a few tens of Hz were interpreted as allowing the
mergence of the perceptual quality of pitch of a continuous sound, thusetermining the lower limit of pitch. On the other hand, the asynchronous
207
B
B
B
B
C
C
C
C
C
D
D
D
D
D
E
E
E
F
F
F
H
H
H
H
K
K
L
L
208
L o e b e l e t a l .
component of the responses may encode different facets of the stimuli.For example the sustained responses to pure tones show strong stimulus-specific adaptation, even at interstimulus intervals that are longer thanthe time constant of synaptic depression (Lu et al., 2001), with fre-quency selectivity that is substantially better than the neuronal tuningcurve.
The strong dependence of PSs on the spontaneous network activitymeans that modulation of the spontaneous spiking activity of neuronswithin an ensemble could represent a novel form of rapid and reversiblemodulation of cortical processing. Spontaneous activity, while a ubiquitousfeature of cortical neurons, is usually considered as a nuisance as faras measuring sensory responses is concerned. However, in our modelspontaneous activity participates in determining the emergence of the PSsin response to sensory stimuli (Loebel and Tsodyks, 2002). Dynamic shiftsin the state of the synaptic connections in response to different patternsof spontaneous activity would result in effective re-wiring of the corticalnetwork. This re-wiring would be reflected in differential responses of theensemble to a particular sensory input, hence forming a complex of top-down and bottom-up interactions that shapes cortical activity. However,the re-wiring only last for as long as the spontaneous activity patternspersist, and may be modified on the time scale of synaptic depression.Such patterns of spontaneous activity could be induced by direct excitatoryand inhibitory inputs from other brain regions, or by the local release ofneuromodulators. Rapid modulation of neural responses has been recentlyreported at the A1 area of ferrets (Fritz et al., 2003, 2005). It was shownthat attending to a target sound induces rapid local modifications in thereceptive fields of A1 neurons. In the majority of the neurons the receptivefields rapidly reverted back to their original form once the task ended (Fritzet al., 2003, 2005). An alternative explanation for these observations is themodulation of the synaptic conductances of A1 neurons in the presenceof neuromodulators (Soto et al., 2006).
The neural network model that we presented in this paper does notattempt to capture the auditory processing in its full details. In particular,we concentrated on the effects of intrinsic dynamics of recurrent corticalcircuits on the responses of auditory neurons. We, therefore, neglected to alarge degree the complex transformations that the auditory inputs undergoin subcortical structures. Instead, we emphasized relatively simple stimu-lus configurations in which more faithful description of the thalamic inputwould probably not change the qualitative aspects of the results. It remainsa challenge for the future work to build a more realistic model where bothaspects of processing are fully accounted for.
CONFLICT OF INTEREST STATEMENTThe authors declare that the research was conducted in the absence ofany commercial or financial relationship that should be constructed as apotential conflict of interest.
ACKNOWLEDGMENTSWe thank Nachum Ulanovsky, Liora Las. and Dina Moshitch for many
valuable discussions on the ideas behind this work. AL thanks AdrienneFairhall for her hospitality and support during the visit in her laboratory,where part of this work was conducted. The work was supported by theIsraeli Science Foundation and by the Irving B. Harris Foundation.REFERENCESAbbott, L. F., Varela, J. A., Sen, K., and Nelson, S. B. (1997). Synaptic depression and
cortical gain control. Science 275, 220–224.Abeles, M. (1991). Corticonics.(Cambridge University Press, New York).Andersen, P., Bliss, T. V. P., and Skrede, K. K. (1971). Unit analysis of hippocampal
population spikes. Exp. Brain Res. 13, 208–221.Atzori, M., Lei, S., P., Evans, D.I., Kanold, P. O., Phillips-Tansey, E., McIntyre, O., and
McBain, C. J. (2001). Differential synaptic processing separates stationary fromtransient inputs to the auditory cortex. Nat. Neurosci. 4, 1230–1237.
Bar-Yosef, O., Rotman, Y., and Nelken, I. (2002). Responses of neurons in cat primaryauditory cortex to bird chirps: effects of temporal and spectral context. J. Neurosci.22, 8619–8632.
L
M
M
M
N
N
N
P
endor, D., and Wang, X. (2005). The neuronal representation of pitch in primate auditorycortex. Nature 436, 1161–1165.
ringuier, V., Chavane, F., Glaeser, L., and Fregnac, Y. (1999). Horizontal propagationof visual activity in the synaptic integration field of area 17 neurons. Science 283,695–699.
ritt, R. and Starr, A. (1976). Synaptic events and discharge patterns of cochlear nucleuscells. II. Frequency-modulated tones. J. Neurophysiol. 39, 179–194.
rosch, M., and Schreiner, C. E. (1997). Time course of forward masking tuning curvesin cat primary auditory cortex. J. Neurophysiol. 77:923–943.
alford, M. B., and Semple, M. N. (1995). Monaural inhibition in cat auditory cortex. J.Neurophysiol. 73, 1876–1897.
hen, Q. C., and Jen, P. H. (2000). Bicuculline application affects discharge patterns,rate-intensity functions, and frequency tuning characteristics of bat auditory corticalneurons. Hear. Res. 150, 161–174.
himoto, S., Kitama, T., Qin, L., Sakayori, S., and Sato, Y. (2002). Tonal response patternsof primary auditory cortex neurons in alert cats. Brain Res. 934, 34–42.
lopton, B. M., and Winfield, J. A. (1974). Unit responses in the inferior colliculus ofrat to temporal auditory patterns of tone sweeps and noise bursts. Exp. Neurol. 42,532–540.
reutzfeldt, O., Hellweg, F. C., and Schreiner, C. (1980). Thalamo-cortical transformationof responses to complex auditory stimuli. Exp. Brain. Res. 39, 87–104.
ear, S.P., Fritz, J., Haresign, T., Ferragamo, M., and Simmons, J. (1993). Tonotopic andfunctional organization in the auditory cortex of the big brown bat, Eptesicus fuscus.J. Neurophysiol. 70, 1988–2009.
enham, S. L. (2001). Cortical synaptic depression and auditory perception. Com-putational Models of Auditory Function, in: S., Greenberg, and M. Slaney (eds.),Amsterdam, NATO ASI Series, IOS Press, pp. 281–296.
eWeese, M. R., and Zador, A. M. (2005). Reliability and representational bandwidth inthe auditory cortex. Neuron 48, 479–488.
eWeese, M. R., and Zador, A. M. (2006) Non-Gaussian membrane potential dynamicsimply sparse, synchronous activity in auditory cortex. J. Neurosci. 26, 12206–12218.
eWeese, M. R., Wehr, M., and Zador, A. M. (2003). Binary spiking in auditory cortex. J.Neurosci. 23, 7940–7949.
ggermont, J. J. (1999). The magnitude and phase of temporal modulation transferfunctions in cat auditory cortex. J. Neurosci. 19, 2780–2788.
ggermont, J. J., and Smith, G. M. (1996). Burst-firing sharpens frequency-tuning inprimary auditory cortex. Neuroreport 7, 753–757.
lhilali, M., Fritz, J. B., Klein, D. J., Simon, J. Z., and Shamma, S. A. (2004). Dynamics ofprecise spike timing in primary auditory cortex. J. Neurosci. 24, 1159–1172.
ishbach, A., Yeshurun, Y., and Nelken, I. (2003). Neural model for physiological responsesto frequency and amplitude transitions uncovers topographical order in the auditorycortex. J. Neurophysiol. 90, 3663–3678.
ritz, J., Shamma, S., Elhilali, M., and Klein, D. (2003). Rapid task-related plasticityof spectrotemporal receptive fields in primary auditory cortex. Nat. Neurosci. 6,1216–1223.
ritz, J., Elhilali, M., and Shamma, S. (2005). Active listening: task-dependent plasticity ofspectrotemporal receptive fields in primary auditory cortex. Hear. Res. 206, 159–176.
eil, P. (1997). Auditory onset responses revisited. I. First-spike timing. J. Neurophysiol.77, 2616–2641.
eil, P., Rajan, R., and Irvine, D. R. (1992). Sensitivity of neurons in cat primary auditorycortex to tones and frequency-modulated stimuli. I: Effects of variation of stimulusparameters. Hear. Res. 63, 108–134.
ubel, D. H., and Wiesel, T. N. (1962). Receptive fields, binocular interaction and functionalarchitecture in the cat’s visual cortex. J. Physiol. 160, 106–154.
udspeth, A.J. (2000). Hearing. Principles of Neural Science, in: E.R., Kandel, J. H.,Schwartz, and T. M., Jessel (eds.), Connecticut, Appleton & Lange, pp. 590–613.
aur, S., Lazar, R., and Metherate, R. (2004). Intracortical pathways determine breadth ofsubthreshold frequency receptive fields in primary auditory cortex. J. Neurophysiol.91, 2551–2567.
ilgard, M. P., and Merzenich, M. M. (1999). Distributed representation of spectral andtemporal information in rat primary auditory cortex. Hear. Res. 134, 16–28.
as, L., Stern, E. A., and Nelken, I. (2005). Representation of tone in fluctuating maskersin the ascending auditory system. J. Neurosci. 25, 1503–1513.
oebel, A., and Tsodyks, M. (2002). Computation by ensemble synchronization in recur-rent networks with synaptic depression. J. Comp. Neurosci. 13, 111–124.
u, T., Liang, L., and Wang, X. (2001). Temporal and rate representations of time-varying
signals in the auditory cortex of awake primates. Nat. Neurosci. 4, 1131–1138.achens, C. K., Wehr, M. S., and Zador, A. M. (2004). Linearity of cortical receptive fieldsmeasured with natural sounds. J. Neurosci. 24, 1089–1100.
erzenich, M. M., Knight, P. L., and Roth, G. L. (1975). Representation of cochlea withinprimary auditory cortex in the cat. J. Neurophysiol. 38, 231–249.
oshitch, D., Las, L., Ulanovsky, N., Bar-Yosef, O., and Nelken, I. (2006). Responses ofneurons in primary auditory cortex (A1) to pure tones in the halothane-anesthetizedcat. J. Neurophysiol. 95, 3756–3769.
elken, I. (2004). Processing of complex stimuli and natural scenes in the auditory cortex.Curr. Opin. Neurobiol. 14, 474–480.
elken, I., and Versnel, H. (2000). Responses to linear and logarithmic frequency-modulated sweeps in ferret primary auditory cortex. Eur. J. Neurosci. 12,549–562.
elken, I., Rotman, Y., and Bar-yosef, O. (1999). Responses of auditory-cortex neuronsto structural features of natural sounds. Nature 397, 154–157.
hillips, D., and Sark, S (1991). Separate mechanisms control spike numbers and inter-spike intervals in transient responses of cat auditory cortex neurons. Hear. Res. 53,17–27.
Frontiers in Neuroscience | November 2007 | Volume 1 | Issue 1
T
Rotman, Y., Bar-Yosef, O., and Nelken, I. (2001). Relating cluster and population responsesto natural sounds and tonal stimuli in cat primary auditory cortex. Hear. Res. 152,110–127.
Rupp, A., Uppenkamp, S., Gutschalk, A., Beucker, R., Patterson, R. D., Dau, T., and Scherg,
M. (2002). The representation of peripheral neural activity in the middle-latencyevoked field of primary auditory cortex in humans. Hear. Res. 174, 19–31.Rupp, A., Las, L., and Nelken, I. (in press). Neuromagentic Representation of Comodula-tion Masking Release in the Human auditory Cortex. Proceedings of the ISH meetingin Oldenburg.
Schiff, M. L., and Reyes, A. D. (2005). Synaptic and membrane properties of thalamo-cortical recipient neurons in AI. Program No. 615.10. 2005 Abstract Viewer/ItineraryPlanner. Washington, DC Society for Neuroscience.
Schreiner, C. E., Read, H. L., and Sutter, M. L. (2000). Modular organization of frequencyintegration in primary auditory cortex. Annu. Rev. Neurosci. 23, 501–529.
Shamma, S. A., Fleshman, J. W., Wiser, P. R., and Versnel, H. (1993). Organizationresponse areas in ferret primary auditory cortex. J. Neurophysiol. 69, 367–383.
Soto, G., Kopell, N., and Sen, K. (2006). Network architecture, receptive fields, and neu-romodulation: computational and functional implications of cholinergic modulationin primary auditory cortex. J. Neurophysiol. 96, 2972–2983.
Thomson, A. M., and Deuchars, J. (1994). Temporal and spatial properties of local circuitsin neocortex. Trends Neurosci. 17, 119–126.
Treves, A. (1993). Mean-field analysis of neuronal spike dynamics. Network 4, 259–284.Tsodyks, M., and Markram, H. (1997). The neural code between neocortical pyramidal
U
W
W
W
W
W
Z
d
www.frontiersin.org
Processing of sounds by population spikes in a modelof primary auditory cortex
neurons depends on neurotransmitter release probability. Proc. Natl. Acad. Sci.,PNAS 94, 719–723.
sodyks, M., Uziel, A., and Markram, H. (2000). Synchorony Generation in RecurrentNetworks with Frequency-Dependent Synapses. J. Neurosci. 20 RC1, 1–5.
lanovsky, N., Las, L., and Nelken, I. (2003). Processing of low probability sounds by
cortical neurons. Nat. Neurosci. 6, 391–398.allace, M. N., Shackleton, T. M., Anderson, L. A., and Palmer, A. R. (2005). Repre-sentation of the purr call in the guinea pig primary auditory cortex. Hear. Res. 204,115–126.
ang, J., McFadden, S. L., Caspary, D., and Salvi, R. (2002). Gamma-aminobutyricacid circuits shape response properties of auditory cortex neurons. Brain. Res. 944,219–231.
ehr, M., and Zador, A. M. (2003). Balanced inhibition underlies tuning and sharpensspike timing in auditory cortex. Nature 426, 442–446.
ehr, M., and Zador, A. M. (2005). Synaptic mechanisms of forward suppression in ratauditory cortex. Neuron 47, 437–445.
ilson, H. R., and Cowan, J. D. (1972). Excitatory and inhibitory interactions in localizedpopulations of model neurons. Biophys. Journal 12, 1–24.
hang, L. I., Tan, A. Y. Y., Schreiner, C. E., and Merzenich, M. M. (2003). Topographyand synaptic shaping of direction selectivity in primary auditory cortex. Nature 424,201–205.
oi: 10.3389/neuro.01.1.1.015.2007
209