The introduction of dengue vaccine may temporarily cause large spikes in prevalence
22
The introduction of dengue vaccine may temporarily cause large spikes in prevalence Abhishek Pandey *† Jan Medlock ‡ June 26, 2014 Summary A dengue vaccine is expected to be available within a few years. Once vaccine is available, policy makers will need to develop suitable policies to allocate the vaccine. Mathematical models of dengue transmission predict complex temporal patterns in prevalence, driven by seasonal oscillations in mosquito abundance. In particular, vaccine introduction may induce a transient period immediately after vaccine introduction where prevalence can spike higher than in the pre-vaccine period. These spikes in prevalence could lead to doubts about the vaccination program among the public and even among decision makers, possibly impeding the vaccination program. Using simple dengue-transmission models, we found that large transient spikes in prevalence are robust phenomena that occur when vaccine coverage and vaccine efficacy are not either both very high or both very low. Despite the presence of transient spikes in prevalence, the models predict that vaccination does always reduce the total number of infections in the 15 years after vaccine introduction. We conclude that policy makers should prepare for spikes in prevalence after vaccine introduction to mitigate the burden of these spikes and to accurately measure the effectiveness of the vaccine program. Keywords: Dengue, Vaccination, Vaccination effectiveness. * Author for correspondence: O-110 Martin Hall, Box 340975, Clemson, SC 29634-0975, USA (Email: ab- [email protected] ) † Department of Mathematical Sciences, Clemson University, Clemson, South Carolina, USA ‡ Department of Biomedical Sciences, Oregon State University, Corvallis, Oregon, USA 1
-
Upload
independent -
Category
Documents
-
view
3 -
download
0
Transcript of The introduction of dengue vaccine may temporarily cause large spikes in prevalence
The introduction of dengue vaccine may temporarily cause
large spikes in prevalence
Abhishek Pandey∗† Jan Medlock‡
June 26, 2014
Summary
A dengue vaccine is expected to be available within a few years. Once vaccine is available,
policy makers will need to develop suitable policies to allocate the vaccine. Mathematical
models of dengue transmission predict complex temporal patterns in prevalence, driven by
seasonal oscillations in mosquito abundance. In particular, vaccine introduction may induce a
transient period immediately after vaccine introduction where prevalence can spike higher than
in the pre-vaccine period. These spikes in prevalence could lead to doubts about the vaccination
program among the public and even among decision makers, possibly impeding the vaccination
program. Using simple dengue-transmission models, we found that large transient spikes in
prevalence are robust phenomena that occur when vaccine coverage and vaccine efficacy are not
either both very high or both very low. Despite the presence of transient spikes in prevalence,
the models predict that vaccination does always reduce the total number of infections in the 15
years after vaccine introduction. We conclude that policy makers should prepare for spikes in
prevalence after vaccine introduction to mitigate the burden of these spikes and to accurately
measure the effectiveness of the vaccine program.
Keywords: Dengue, Vaccination, Vaccination effectiveness.
∗Author for correspondence: O-110 Martin Hall, Box 340975, Clemson, SC 29634-0975, USA (Email: ab-
[email protected])†Department of Mathematical Sciences, Clemson University, Clemson, South Carolina, USA‡Department of Biomedical Sciences, Oregon State University, Corvallis, Oregon, USA
1

Short running head: Spikes in prevalence after vaccine.
1 Introduction
Dengue is an RNA virus in the family Flaviviridae. There are four serotypes of dengue virus, each
of which induces a specific antigenic response in humans. Infection with any of the four serotypes
can cause disease ranging from dengue fever (DF) to dengue hemorrhagic fever (DHF) and dengue
shock syndrome (DSS), in order of increasing severity [1]. Infection with a serotype provides life-
long immunity to that serotype and an increased risk for the severe forms of disease (DHF and DSS)
during subsequent infection with a different serotype [2]. Dengue infection has been recognized in
over 100 countries: DF and DHF are important public-health problems, especially in the tropics
and subtropics, where nearly 2.5 billion people are at risk of infection [1]. An estimated 50 million
cases of DF occur every year, including 500, 000 hospitalizations for DHF [3].
Despite the expansion in geographic range of the virus over past four decades [4], there is
no dengue vaccine licensed for use presently. Dengue vaccine development is an area of active
research: significant advances have occurred in recent years and several vaccine candidates are
showing promise in clinical studies [5]. The most advanced vaccine candidate showed efficacy
of 30% and protection against 3 of the 4 serotypes of dengue [6]. With several dengue vaccine
candidates progressing through clinical trials, a licensed dengue vaccine is expected to be available
in less than 10 years [3].
Once the vaccine becomes available, policy makers will have to decide how to best allocate it.
As a result, it is imperative to carefully examine the effects of vaccine-allocation policies. Math-
ematical models of dengue transmission predict complex temporal patterns in prevalence, driven
by seasonality in mosquito abundance [7], and may include a transient period immediately after
vaccine introduction where prevalence can spike higher than in the pre-vaccine period. An increase
in infections, however brief, can raise doubts about the vaccination program, while the longer-term
outcome may be highly favorable. A temporary increase in infections might lead to public doubts
and refusal to use the vaccine or even policy makers’ ending the vaccination program altogether.
2

Moreover, these spikes can also pose serious problems by overwhelming resources like available
hospital beds. Thus, investigating short- and long-term effects of the vaccination introduction is
important.
In the present study, we found that simple dengue transmission models frequently predict large
transient spikes in prevalence in the years after vaccination is begun. The presence of these spikes
was highly sensitive to the level of vaccination, the efficacy of the vaccine, and the timing of the
vaccination program. Despite the presence or absence of transient spikes, vaccination reduced
dengue infections when averaged over a the first 15 years after vaccine introduction and when
averaged over the very long term.
2 Methods and Approach
Here we briefly describe the mathematical models for dengue transmission that we used in this
study. See Appendices A–C for detailed descriptions of the models.
We developed standard SIR-type deterministic dengue models to explore the short- and long-
term effects of vaccine introduction. In the models, the population was divided into unvaccinated
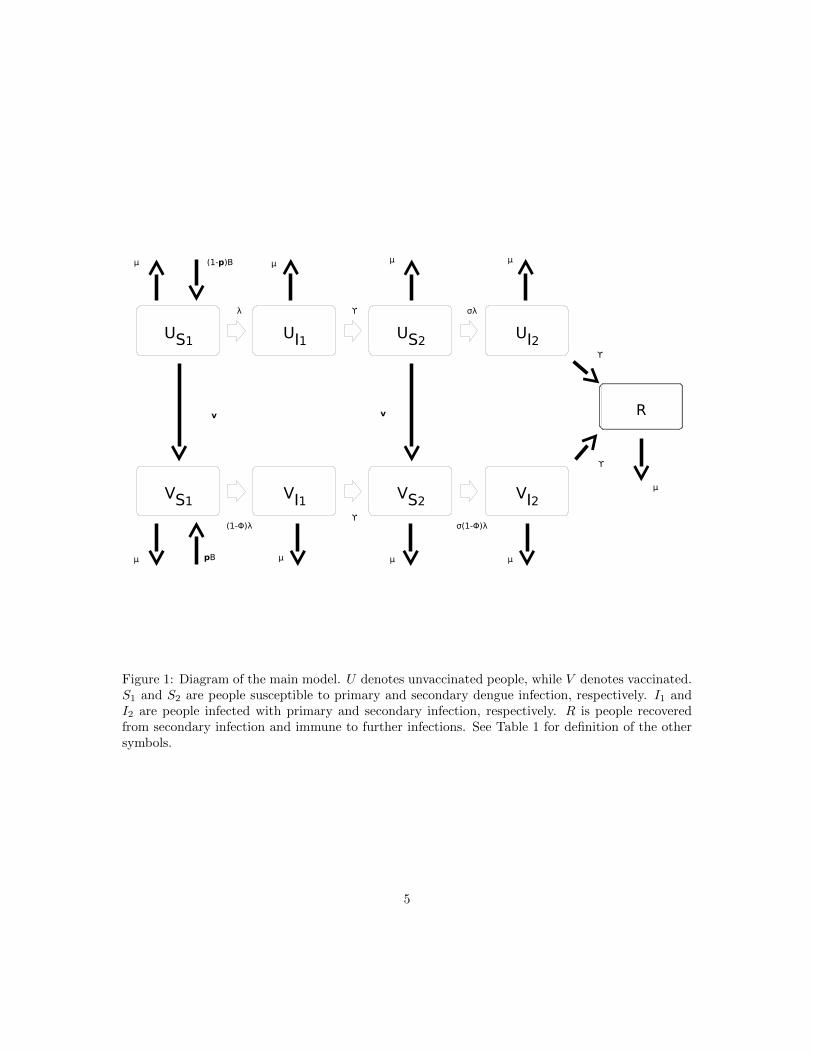
and vaccinated people, and then each of these was further divided by infection history (Figure 1).
In the main model, a person with no prior dengue infection (state S1) can have a primary infection
from any serotype of dengue (I1), recovery from which provides him with life-long immunity to
that serotype (S2). He can then acquire infection from any of the remaining three serotypes, and
enter the secondary-infection class (I2). Third or fourth infection from dengue is very rare [8],
so we assumed that an individual recovering from secondary infection becomes immune to all
serotypes (R). Dengue mortality in humans is at most 1–2% [9] and thus ignored in our model for
simplicity. As we are only interested in infections in humans, we did not model mosquito population
explicitly [10]. We used model parameters consistent with the literature, along with a small level
of seasonal forcing of transmission to capture seasonal oscillations in mosquito population size [11].
We modeled the vaccine as having efficacy φ at preventing infection. The vaccination program
was modeled as having two possible components: one component vaccinates a proportion p of in-
3

fants, and the other component vaccinates people in the general population at rate v. For simplicity,
for the main results we used only vaccination of infants (v = 0).
To simulate vaccine introduction, we computed a solution to the model with no vaccine (p = 0)
from arbitrary initial conditions until it converged to regular periodic oscillations (a stable limit
cycle, in mathematical terms [12]). From a new initial point on this periodic solution, we then
computed the solution to the model with vaccine introduced (p > 0).
3 Results
The model prevalence converged to regular periodic oscillations, with or without vaccination (e.g. Fig-
ure 2). Without vaccination, prevalence oscillates with a period of 2 years. The perturbation caused
by the introduction of vaccine results in a transient period where the prevalence has not yet con-
verged to periodic oscillations. During this transient period, large spikes can occur, to levels above
those present before the vaccine was introduced, and this transient period may last many years.
For example, vaccinating 78% of infants at 30% vaccine efficacy results in an initial period of
about 60 years when prevalence can spike more than twice as high as before vaccine introduction
(Figure 2). After the transient period, prevalence converges to annual oscillations with a smaller
maximum than in the 2-year oscillations prior to vaccine introduction (Figure 2(C)). In contrast,
vaccinating instead 90% of infants results in a transient period of about 70 years, where prevalence
can spike more than three times as high as before vaccine introduction, and prevalence then settles
down to 3-year oscillations with a higher maximum than before vaccine introduction (Figure 3).
These two examples show that the effectiveness of a vaccination program may differ depending
on exactly what is evaluated. Effectiveness may consider individual points in time (e.g. the height
of the spikes in prevalence) or periods of time (e.g. total number of infections in a fixed period).
In addition, effectiveness may be evaluated over the period just after vaccine introduction or, as
is more convenient from a modeling perspective, the period after the prevalence has converged
to periodic oscillations. To capture the transient period over many simulations, we considered
the transient period to be the first 15 years after vaccine introduction. To quantify the severity
4
US1 UI1 US2 UI2
R
λ
(1-Φ)λ
σλ
σ(1-Φ)λ
ϒ
ϒ
ϒ
ϒ
(1-p)B
pB
v v
µ µ µ µ
µ µ µ µ
µVS1 VI1 VS2 VI2
Figure 1: Diagram of the main model. U denotes unvaccinated people, while V denotes vaccinated.S1 and S2 are people susceptible to primary and secondary dengue infection, respectively. I1 andI2 are people infected with primary and secondary infection, respectively. R is people recoveredfrom secondary infection and immune to further infections. See Table 1 for definition of the othersymbols.
5

0 50 100 150Year0
1
2
3
4
5
6VaccinationNo Vaccination
0 3 6 9 12 15Year
0
1
2
3
4
5
Prev
elan
ce p
er th
ousa
nd
135 138 141 144 147 150Year
0
1
2
3
4
5
(A)
(B) (C)
Figure 2: Simulated dengue prevalence after vaccine introduction. Starting at year t = 0, weassume 78% of infants are vaccinated, i.e., p = 0.78, with a 30% vaccine efficacy, i.e., φ = 0.3.The black curves are prevalence after vaccine introduction, while the gray curves are the prevalencehad vaccine not been introduced. (A) shows prevalence for 150 years after vaccine introduction,while (B) & (C) show only the first and last 15 years of this period. See Appendix A for model ¶meter definitions.
6

0 50 100 150Year012345678
VaccinationNo Vaccination
0 3 6 9 12 15Year
0
1
2
3
4
5
Prev
elan
ce p
er th
ousa
nd
135 138 141 144 147 150Year
0
1
2
3
4
5
(A)
(B) (C)
Figure 3: Simulated dengue prevalence after vaccine introduction. The model and parameter valuesare as in Figure 2, but with 90% of infants vaccinated, i.e., p = 0.9.
7
of transient spikes at any point in time, we calculated the maximum prevalence during first 15
years after introduction of the vaccine. To examine the effectiveness over a period of time, we also
calculated the total number of infections during the first 15 years after vaccine introduction. For
the period after prevalence has converged to periodic oscillations, we calculated both the maximum
prevalence and the mean prevalence per year.
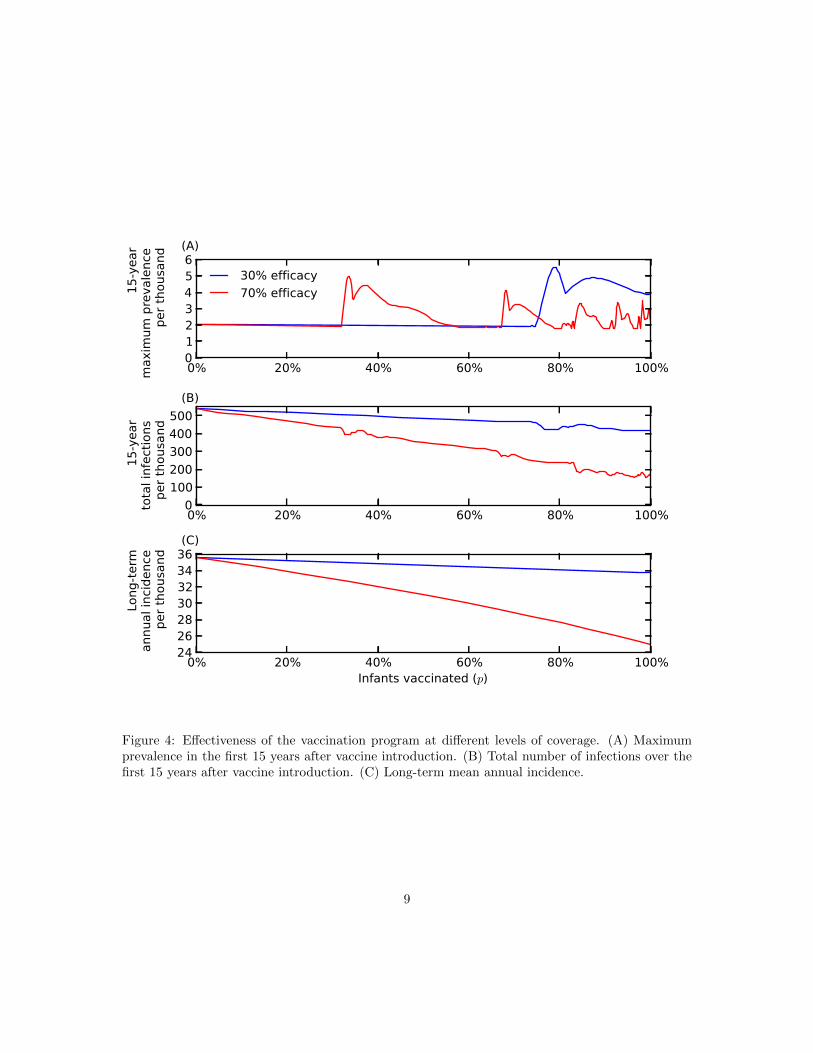
To explore the transient spikes in prevalence, we varied vaccine coverage (p), for low (φ = 0.3)
and high (φ = 0.7) vaccine efficacy (Figure 4(A)). Large transient spikes (i.e. above the pre-vaccine
maximum of about 2 per thousand) were present after vaccine introduction for both levels of vaccine
efficacy. Moreover, for the higher vaccine efficacy, large transient spikes appeared at lower vaccine
coverage.
By varying vaccine efficacy, we found that large transient spikes occur particularly when vaccine
efficacy is neither very low nor very high (Figure 5). For 80% vaccine coverage, when vaccine efficacy
is below 30%, the perturbation caused by vaccine introduction is insufficient to generate transient
spikes. On the other hand, when vaccine efficacy is higher than 97% at 80% vaccine coverage,
vaccination quickly reduces prevalence without large transient spikes. Similarly, with 40% vaccine
coverage, there are no large transient spikes below 58% or above 96% vaccine efficacy.
Since prevalence oscillates with a period of 2 years without vaccination, we varied the time of
vaccine introduction over the 2-year period (Figure 6). The presence or absence of large transient
spikes after vaccine introduction is highly sensitive to the time of vaccine introduction.
Despite the presence of large transient spikes in prevalence, the total number of infections over
the first 15 years was lower with vaccine than without in all of the simulations we performed
(Figure 4(B)). However, we cannot rule out that the initial burden may be higher in some cases,
especially over shorter time spans than 15 years. Moreover, higher vaccine efficacy yields higher drop
in the initial burden at constant vaccine rates. Thus, although the presence of large transient spikes
may pose immediate problems by overwhelming the resources, over a 15-year period, vaccination
reduces infections.
After the transient period caused by vaccine introduction, prevalence converges again to a
regular periodic oscillation, but the oscillation may have a different period and the maximum
8
0% 20% 40% 60% 80% 100%0123456
15-y
ear
max
imum
pre
vale
nce
per t
hous
and
30% efficacy70% efficacy
0% 20% 40% 60% 80% 100%0
100200300400500
15-y
ear
tota
l inf
ectio
nspe
r tho
usan
d
0% 20% 40% 60% 80% 100%Infants vaccinated (p)
24262830323436
Long
-term
a
nnua
l inc
iden
ce
per
thou
sand
(A)
(B)
(C)
Figure 4: Effectiveness of the vaccination program at different levels of coverage. (A) Maximumprevalence in the first 15 years after vaccine introduction. (B) Total number of infections over thefirst 15 years after vaccine introduction. (C) Long-term mean annual incidence.
9

0% 20% 40% 60% 80% 100%Vaccine efficacy (φ)
1.5
2.0
2.5
3.0
3.5
4.0
4.5
5.0
5.5
6.0
15-yea
r max
imum
preva
lence pe
r tho
usan
d
80 % infants vaccinated40 % infants vaccinated
Figure 5: Maximum prevalence over the 15 years after vaccine introduction for varying vaccineefficacy. 80% (p = 0.8; cyan) and 40% (p = 0.4; magenta) of infants are vaccinated. The dashedgray line is the maximum prevalence prior to vaccine introduction.
10

0.0 0.5 1.0 1.5 2.0Time of vaccine introduction
0
2
4
6
8
10
12
14
15-y
ear m
axim
um p
reva
lenc
e pe
r tho
usan
d
30 % efficacy70 % efficacy
Figure 6: Maximum prevalence over the 15 years after vaccine introduction for varying time ofvaccine introduction. 80% of infants are vaccinated (p = 0.8) with a vaccine of efficacy 30%(φ = 0.3; blue) and 70% (φ = 0.7; red). The time that the vaccination program begins was variedfrom the beginning (t = 0) to the end (t = 2) of the 2-year cycle in prevalence that exists whenthere is no vaccine. The dashed gray line is the maximum prevalence prior to vaccine introduction.
11
prevalence may be lower or higher than prior to vaccine introduction (e.g. Figures 2(C) & 3(C)).
In all of our simulations, we found that in the long-term, the mean annual incidence decreased as
vaccine coverage increased (Figure 4(C)). Although some vaccine introductions did lead to long-
term prevelance with a higher maximum, their period was longer, so that the mean over many years
was always lower than without vaccine. Moreover, as expected, long-term mean annual incidence
was lower for higher vaccine efficacy.
The model also showed large transient spikes in prevalence when we modeled vaccination pro-
grams in the whole population rather than just infants (p = 0 & v > 0) and vaccination programs
that combine the two (p > 0 & v > 0). We also tested simpler and more-complex dengue models.
The simpler model assumed that there are no secondary infections, so that individuals who recover
from their first infections move directly to recovered class (Appendix B). Our more-complex model
included a period of short-term cross-protection after primary infection [13] (Appendix C). Both
models exhibited the potential for large transient spikes (Figure 7).
4 Discussion
Using mathematical models of dengue transmission, we found that vaccine introduction may lead
to a transient period when infection prevalences spike higher than in the pre-vaccine period. These
spikes in infection prevalence may pose serious problems by overwhelming health resources like
hospital beds, as well as create doubt about the efficacy of the vaccination program. In our models,
the presence of large spikes required that vaccine coverage and vaccination efficacy were not both
very low or both very high. The occurrence of large transient spikes for lower vaccine coverage and
higher vaccine efficacy suggests that a sufficiently large perturbation to the system is required in
order for large transient spikes to exist. These perturbations are generated by the combination of
vaccine coverage and vaccine efficacy. When vaccine coverage and efficacy are both very high, the
vaccination program reduces prevalence so quickly that no spikes appear.
We also found that the presence or absence of large transient spikes was highly sensitive to the
time when the vaccine program is first begun. Indeed, the results are so sensitive to introduction
12

0 10 20 30 40 50Year
0
2
4
6
8
10VaccinationNo Vaccination
0 10 20 30 40 50Year
0
1
2
3
4
5
6
7
Prev
elan
ce p
er th
ousa
nd
(A)
(B)
Figure 7: Transient prevalence spikes in simpler (A) and more complex (B) dengue models. (A)80% of infants are vaccinated (p = 0.8) and the remainder of the population is vaccinated at aper-capita rate of v = 0.6 per year. See Appendix B for model & parameter definitions. (B) 60% ofinfants are vaccinated (p = 0.6) and the remainder of the population is vaccinated at a per-capitarate of v = 0.9 per year. Vaccine efficacy is 70% in both models i.e., φ = 0.7. See Appendix C formodel & parameter definitions.
13
time, and likely also to changes in parameter values or model structure, that we do not believe that
model results can be used to minimize the chance of large transient spikes.
Despite the presence of large transient spikes in prevalence, the total number of infections over
the first 15 years after vaccine introduction was always less than in the 15 years prior to vaccine
introduction. The decrease in infections was higher for higher efficacy as well as for higher vaccine
coverage. Likewise, in the long term, the mean number of infection per year was always smaller than
during the pre-vaccine period and decreases with increasing vaccine coverage and vaccine efficacy.
Vaccination reduces the susceptibility of the population, but the short-term interaction of the
change in susceptibility with the seasonal forcing of the mosquito population causes complex results,
including large transient spikes. When averaged over longer times, the impact is as expected: both
the number of infections in the 15-years following vaccine introduction and the long-term annual
mean were always found to be lower after vaccine introduction than before.
Large transient spikes after vaccine introduction were frequent for our main model, along with
simpler and more-complex models that we also tested. In general, we believe that the occurrence
of large transient spikes in response to perturbation is a robust phenomenon of seasonally forced
epidemic models. We are unaware of any theoretical research on the short-time transient behavior
of seasonally forced epidemic models, however there is a rich literature on the long-time behavior
of such models [14–17].
It is possible that interaction between different dengue serotypes may have some impact on the
presence or absence of transient spikes after vaccine introduction. Moreover, antibody-dependent
enhancement (ADE), increased susceptibility to or increased transmission of secondary infection,
has been hypothesized for dengue [2, 13, 18]. Using a mathematical model that included ADE,
Billings et al. [19] showed that if a dengue vaccine does not protect against all serotypes, then
increased transmission of the strain not covered by vaccine could occur. This increase in dengue
transmission could increase the likelihood of large spikes in prevalence after vaccine introduction.
In our models, we have used generic parameter values rather than those for a specific location.
In particular, different parameter values may change the period and maximum amplitude of the pre-
vaccine oscillation [2, 16]. However, because of the robustness of the appearance of large transient
14
spikes in prevalence, we expect that these spikes would continue to appear for different parameter
values. Similarly, we expect large transient spikes would also be present 1.) if the vaccination pro-
gram were modeled as starting gradually rather than instantaneously, 2.) if the human population
were growing rather than remaining constant size and 3.) if the vaccine were introduced at a state
other than regular periodic oscillation.
Introduction of dengue vaccine reduces the overall prevalence in the long term, but at the risk
of large spikes in prevalence immediately after the vaccine introduction. Policy makers may need
to re-evaluate their vaccination program based on their short- and long-term goals for reduction in
total infections. In order to minimize the risk of large spikes in prevalence, it may be necessary
to trade a smaller reduction in short-term burden. For example, in Figure 4(A & B) with vaccine
efficacy of 70%, vaccinating 25% of infants rather than 40% of infants may be a better strategy to
avoid the spikes at the expense of more total infections over 15 years.
We used mathematical models to evaluate the short- and long-term effects of introducing a
dengue vaccine. We found that vaccine introduction may lead to a transient period when infection
prevalences spike higher than in the pre-vaccine period. We believe such transient spikes are robust
to changes in parameters and model structure, and thus must be accounted for in planning vacci-
nation programs because they may overwhelm health resources. Despite the presence of transient
spikes, the vaccination program is likely to be effective at reducing the total number of infections
during the first few years after introduction, as well as decreasing infections in the long term.
Policy makers should be prepared for transient spikes to mitigate their burden and to accurately
understand the effectiveness of the vaccine program.
References
[1] Guzman MG, Kouri G. Dengue: an update. Lancet Infectious Diseases, 2002; 2: 33–42.
[2] Nagao Y, Koelle K. Decreases in dengue transmission may act to increase the incidence of
dengue hemorrhagic fever. Proceedings of the National Academy of Sciences USA, 2008; 105:
2238–2243.
15
[3] Guzman MG, et al. Dengue: a continuing global threat. Nature Reviews Microbiology, 2010;
8: S7–S16.
[4] Beatty M, et al. Assessing the potential of a candidate dengue vaccine with mathematical
modeling. PLoS Neglected Tropical Diseases, 2012; 6: e1450.
[5] Coller BAG, Clements DE. Dengue vaccines: progress and challenges. Current Opinion in
Immunology, 2011; 23: 391–398.
[6] Halstead SB. Dengue vaccine development: a 75% solution? The Lancet, 2012; 380: 1535–
1536.
[7] Reich NG, et al. Interactions between serotypes of dengue highlight epidemiological impact
of cross-immunity. Journal of The Royal Society Interface, 2013; 10: 20130 414.
[8] Halstead SB. Neutralization and antibody-dependent enhancement of dengue viruses. Ad-
vances in Virus Research, 2003; 60: 421–467.
[9] Rajapakse S. Dengue shock. Journal of Emergencies, Trauma and Shock, 2011; 4: 120.
[10] Pandey A, Mubayi A, Medlock J. Comparing vector–host and SIR models for dengue
transmission. Mathematical Biosciences, 2013; 246: 252–259.
[11] Nisalak A, et al. Serotype-specific dengue virus circulation and dengue disease in bangkok,
thailand from 1973 to 1999. The American journal of tropical medicine and hygiene, 2003; 68:
191–202.
[12] Strogatz SH. Nonlinear dynamics and chaos: with applications to physics, biology, chemistry,
and engineering. Westview Press, 1994.
[13] Wearing HJ, Rohani P. Ecological and immunological determinants of dengue epidemics.
Proceedings of the National Academy of Sciences USA, 2006; 103: 11 802–11 807.
[14] King AA, et al. Weakly dissipative predator–prey systems. Bull. Math. Biol, 1996; 58:
835–859.
16

[15] Keeling M, Grenfell B. Disease extinction and community size: modeling the persistence
of measles. Science, 1997; 275: 65–67.
[16] King AA, Schaffer WM. The rainbow bridge: Hamiltonian limits and resonance in predator-
prey dynamics. J. Math. Biol, 1999; 39: 439–469.
[17] Grenfell B, Bjørnstad O, Kappey J. Travelling waves and spatial hierarchies in measles
epidemics. Nature, 2001; 414: 716–723.
[18] Cummings DAT, et al. Dynamic effects of antibody-dependent enhancement on the fitness
of viruses. Proceedings of the National Academy of Sciences USA, 2005; 102: 15 259–15 264.
[19] Billings L, Fiorillo A, Schwartz IB. Vaccinations in disease models with antibody-
dependent enhancement. Mathematical Biosciences, 2008; 211: 265–281.
[20] Gubler DJ. Dengue and dengue hemorrhagic fever. Clinical microbiology reviews, 1998; 11:
480–496.
[21] Keeling M, Rohani P. Modeling infectious diseases in humans and animals. Princeton
University Press, 2011.
A Main model
We developed a simple deterministic model for dengue to explore the short- and long-term effects
of vaccine introduction. The model consists of four unvaccinated (U), four vaccinated (V ) and one
recovered (R) class, the variables for which represent the number of people in that class over time
(Figure 1). An individual with no prior dengue infection (subscript S) can have a primary infection
from any serotype of dengue (I1), recovery from which provides him with life-long immunity to
that serotype (S2). He can then acquire infection from any of the remaining three serotypes, and
enter the secondary-infection class (I2). Third or fourth infection from dengue is very rare [8], so
we assume that an individual recovering from secondary infection becomes immune to all serotypes
(R). Individuals in both primary- and secondary-infection class recover at rate γ = 7/365 y−1 so
17
that the mean infectious period is 7 days [20]. The parameters B and µ are natural birth and death
rates in humans respectively, which were chosen to be B = µ = 1/50 y−1 so that the mean human
lifespan is 50 years and the population size is constant. Dengue-induced mortality in humans is
around 1–2% [9] and thus ignored in our model for simplicity. We were only interested in infections
in humans, so we did not model mosquito population explicitly [10]. Infection occurs when a
susceptible individual comes in contact with individuals from any of the infectious classes through
mosquito bites at the rate given by the force of infection
λ(t) = [1 + ε cos(2πt)]βI(t)
N, (1)
where the total number of people currently infected is
I(t) = UI1(t) + UI2(t) + VI1(t) + VI2(t), (2)
N is the total human population size and β is a composite transmission parameter [10], taken to
be β = 400 y−1 [18]. Seasonality in the mosquito population was captured by the cosine term in
the force of infection, where t is units of years, making transmission most intense at the beginning
of a year (i.e. when t is near an integer 0, 1, 2, ...) and least intense in the middle of a year (t near
0.5, 1.5, 2.5, ...). We used a small amplitude of seasonal forcing, ε = 0.1. The force of infection for
secondary infection was reduced by the factor σ = 34 since they are only susceptible to 3 of the 4
serotypes.
The vaccination program with two components was modeled: a proportion p of infants are
vaccinated and rest of the susceptible population is vaccinated at rate v. The vaccine of efficacy φ
was modeled as reducing the force of infection by the factor 1− φ.
18
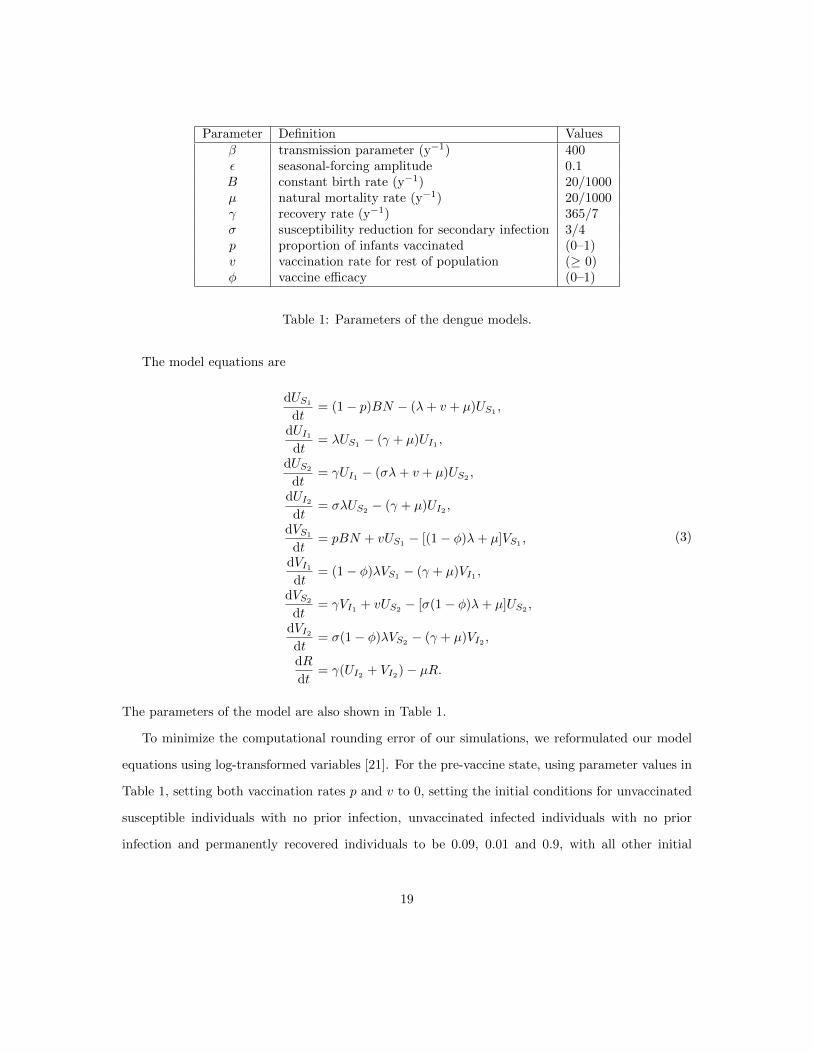
Parameter Definition Valuesβ transmission parameter (y−1) 400ε seasonal-forcing amplitude 0.1B constant birth rate (y−1) 20/1000µ natural mortality rate (y−1) 20/1000γ recovery rate (y−1) 365/7σ susceptibility reduction for secondary infection 3/4p proportion of infants vaccinated (0–1)v vaccination rate for rest of population (≥ 0)φ vaccine efficacy (0–1)
Table 1: Parameters of the dengue models.
The model equations are
dUS1
dt= (1− p)BN − (λ+ v + µ)US1
,
dUI1dt
= λUS1− (γ + µ)UI1 ,
dUS2
dt= γUI1 − (σλ+ v + µ)US2
,
dUI2dt
= σλUS2− (γ + µ)UI2 ,
dVS1
dt= pBN + vUS1 − [(1− φ)λ+ µ]VS1 ,
dVI1dt
= (1− φ)λVS1− (γ + µ)VI1 ,
dVS2
dt= γVI1 + vUS2 − [σ(1− φ)λ+ µ]US2 ,
dVI2dt
= σ(1− φ)λVS2− (γ + µ)VI2 ,
dR
dt= γ(UI2 + VI2)− µR.
(3)
The parameters of the model are also shown in Table 1.
To minimize the computational rounding error of our simulations, we reformulated our model
equations using log-transformed variables [21]. For the pre-vaccine state, using parameter values in
Table 1, setting both vaccination rates p and v to 0, setting the initial conditions for unvaccinated
susceptible individuals with no prior infection, unvaccinated infected individuals with no prior
infection and permanently recovered individuals to be 0.09, 0.01 and 0.9, with all other initial
19
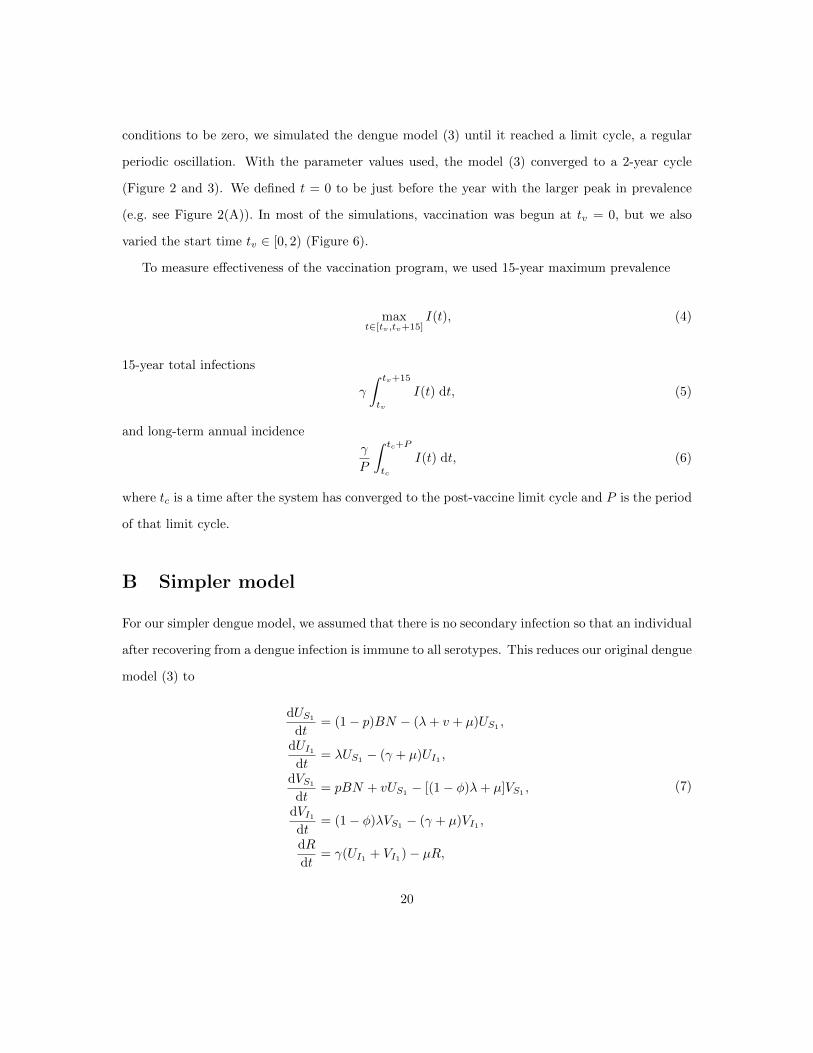
conditions to be zero, we simulated the dengue model (3) until it reached a limit cycle, a regular
periodic oscillation. With the parameter values used, the model (3) converged to a 2-year cycle
(Figure 2 and 3). We defined t = 0 to be just before the year with the larger peak in prevalence
(e.g. see Figure 2(A)). In most of the simulations, vaccination was begun at tv = 0, but we also
varied the start time tv ∈ [0, 2) (Figure 6).
To measure effectiveness of the vaccination program, we used 15-year maximum prevalence
maxt∈[tv,tv+15]
I(t), (4)
15-year total infections
γ
∫ tv+15
tv
I(t) dt, (5)
and long-term annual incidence
γ
P
∫ tc+P
tc
I(t) dt, (6)
where tc is a time after the system has converged to the post-vaccine limit cycle and P is the period
of that limit cycle.
B Simpler model
For our simpler dengue model, we assumed that there is no secondary infection so that an individual
after recovering from a dengue infection is immune to all serotypes. This reduces our original dengue
model (3) to
dUS1
dt= (1− p)BN − (λ+ v + µ)US1
,
dUI1dt
= λUS1− (γ + µ)UI1 ,
dVS1
dt= pBN + vUS1 − [(1− φ)λ+ µ]VS1 ,
dVI1dt
= (1− φ)λVS1− (γ + µ)VI1 ,
dR
dt= γ(UI1 + VI1)− µR,
(7)
20
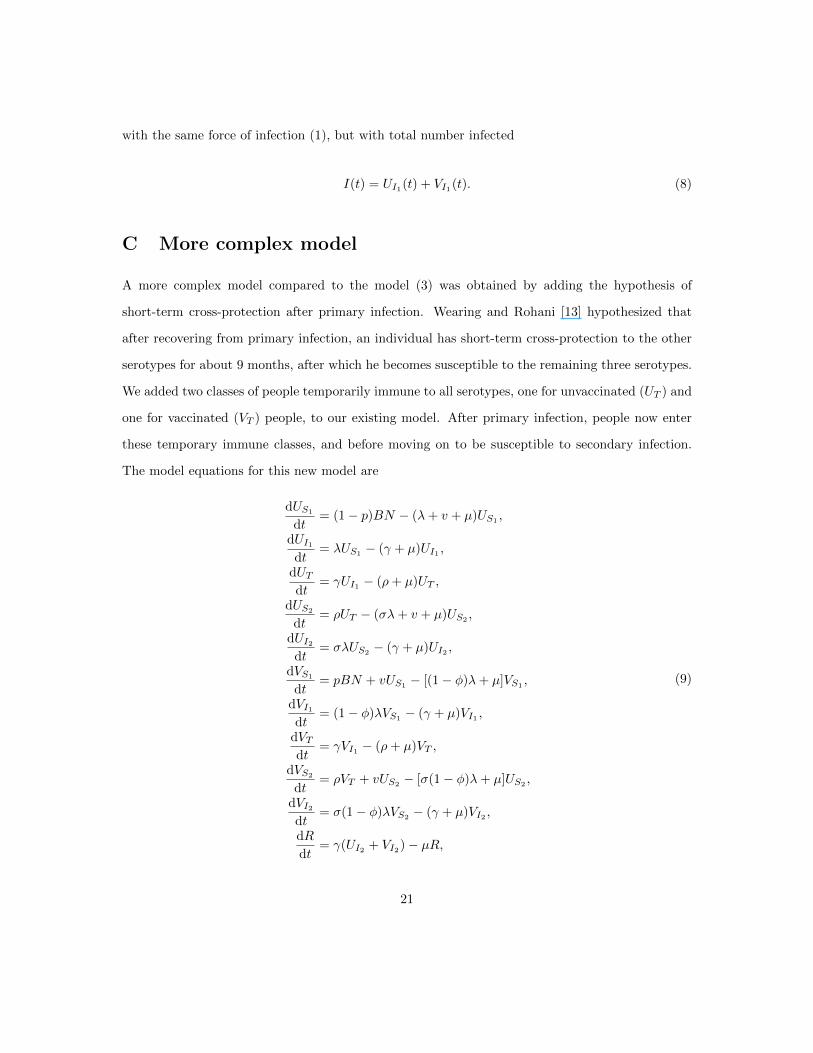
with the same force of infection (1), but with total number infected
I(t) = UI1(t) + VI1(t). (8)
C More complex model
A more complex model compared to the model (3) was obtained by adding the hypothesis of
short-term cross-protection after primary infection. Wearing and Rohani [13] hypothesized that
after recovering from primary infection, an individual has short-term cross-protection to the other
serotypes for about 9 months, after which he becomes susceptible to the remaining three serotypes.
We added two classes of people temporarily immune to all serotypes, one for unvaccinated (UT ) and
one for vaccinated (VT ) people, to our existing model. After primary infection, people now enter
these temporary immune classes, and before moving on to be susceptible to secondary infection.
The model equations for this new model are
dUS1
dt= (1− p)BN − (λ+ v + µ)US1
,
dUI1dt
= λUS1− (γ + µ)UI1 ,
dUTdt
= γUI1 − (ρ+ µ)UT ,
dUS2
dt= ρUT − (σλ+ v + µ)US2
,
dUI2dt
= σλUS2 − (γ + µ)UI2 ,
dVS1
dt= pBN + vUS1
− [(1− φ)λ+ µ]VS1,
dVI1dt
= (1− φ)λVS1− (γ + µ)VI1 ,
dVTdt
= γVI1 − (ρ+ µ)VT ,
dVS2
dt= ρVT + vUS2
− [σ(1− φ)λ+ µ]US2,
dVI2dt
= σ(1− φ)λVS2 − (γ + µ)VI2 ,
dR
dt= γ(UI2 + VI2)− µR,
(9)
21

where 1ρ = 0.75 y is the average duration of short-term cross protection against all serotypes. With
the same force of infection and total number infected as before, (1) & (2).
22