Using the k-Nearest Problems for Adaptive Multicriteria Planning
Upload
khangminh22Category
view
0download
0
RESEARCH ARTICLE
Dengue risk assessment using multicriteria
decision analysis: A case study of Bhutan
Tsheten TshetenID1,2*, Archie C. A. Clements3,4, Darren J. Gray1, Kinley Wangdi1
1 Australian National University, Canberra, Australia, 2 Royal Centre for Disease Control, Ministry of Health,
Thimphu, Bhutan, 3 Telethon Kids Institute, Nedlands, Australia, 4 Curtin University, Perth, Australia
Abstract
Background
Dengue is the most rapidly spreading vector-borne disease globally, with a 30-fold increase
in global incidence over the last 50 years. In Bhutan, dengue incidence has been on the rise
since 2004, with numerous outbreaks reported across the country. The aim of this study
was to identify and map areas that are vulnerable to dengue in Bhutan.
Methodology/Principal findings
We conducted a multicriteria decision analysis (MCDA) using a weighted linear combination
(WLC) to obtain a vulnerability map of dengue. Risk factors (criteria) were identified and
assigned with membership values for vulnerability according to the available literature. Sen-
sitivity analysis and validation of the model was conducted to improve the robustness and
predictive ability of the map. Our study revealed marked differences in geographical vulner-
ability to dengue by location and season. Low-lying areas and those located along the south-
ern border were consistently found to be at higher risk of dengue. The vulnerability extended
to higher elevation areas including some areas in the Capital city Thimphu during the sum-
mer season. The higher risk was mostly associated with relatively high population density,
agricultural and built-up landscapes and relatively good road connectivity.
Conclusions
Using MCDA, our study identified vulnerable areas in Bhutan during specific seasons when and
where the transmission of dengue is most likely to occur. This study provides evidence for the
National Vector-borne Disease Control programme to optimize the use of limited public health
resources for surveillance and vector control, to mitigate the public health threat of dengue.
Author summary
Dengue is an important vector-borne viral disease affecting humans. In Bhutan, dengue inci-
dence is on the rise with increased frequency of outbreaks and spread to new areas. Outbreaks
were reported from places as high as above 900m above sea level in recent years. However,
PLOS NEGLECTED TROPICAL DISEASES
PLOS Neglected Tropical Diseases | https://doi.org/10.1371/journal.pntd.0009021 February 10, 2021 1 / 17
a1111111111
a1111111111
a1111111111
a1111111111
a1111111111
OPEN ACCESS
Citation: Tsheten T, Clements ACA, Gray DJ,
Wangdi K (2021) Dengue risk assessment using
multicriteria decision analysis: A case study of
Bhutan. PLoS Negl Trop Dis 15(2): e0009021.
https://doi.org/10.1371/journal.pntd.0009021
Editor: Elvina Viennet, Australian Red Cross
Lifelood, AUSTRALIA
Received: July 11, 2020
Accepted: November 30, 2020
Published: February 10, 2021
Copyright: © 2021 Tsheten et al. This is an open
access article distributed under the terms of the
Creative Commons Attribution License, which
permits unrestricted use, distribution, and
reproduction in any medium, provided the original
author and source are credited.
Data Availability Statement: All data are fully
available without restriction. All data are in the
manuscript and its supporting information files.
Funding: The author(s) received no specific
funding for this work.
Competing interests: The authors have declared
that no competing interests exist.

dengue control activities in Bhutan are usually initiated at the time of outbreaks. This often
leads to a large number of cases and overburden the health system. To address these issues, we
developed dengue risk maps at a fine spatial resolution by combining risk factors that mediate
the transmission of dengue using a weighted linear combination. Vulnerability to dengue was
spatially heterogeneous and varied by season. Dengue is highly vulnerable in low-lying areas
throughout the season. However, the vulnerability extended to higher geographical elevations
including the nation’s capital during the summer season. The study provides a firm evidence-
base to prioritize areas and seasons for dengue control strategies in Bhutan.
Introduction
The global incidence of dengue has increased over the last few decades from over 8.3 million
reported infections in 1990 [1] to approximately 80 million dengue cases in 2015 (representing
a ten-fold increase) [2]. The number of deaths also increased from 12,300 in 2005 to 18,400 in
2015 [3]. Before 1970, only nine countries experienced severe dengue epidemics. Today, more
than 120 countries have endemic dengue virus (DENV) transmission, with severe dengue
resulting in 21,000 deaths annually [4]. There are now estimated 390 million dengue infections
worldwide every year (95% credible interval [CrI] 284–528 million), of which 96 million (95%
CrI 67–136 million) manifest clinically with varying degree of severity [5]. Dengue is the lead-
ing cause of hospitalization and death among children in the South East Asia region [6].
Implementing effective interventions for dengue involves identification of priority areas and
times of the year that are most vulnerable to the disease. However, this presents a challenge in
developing countries without adequate data [7]. Misdiagnosis and asymptomatic infections
impede the detection of cases, resulting in delayed responses [5]. Moreover, surveillance systems
do not provide adequate information for instituting informed dengue control activities, in partic-
ular, due to massive under-reporting [8, 9]. Identifying areas at risk of dengue is of paramount
importance to prioritize resources and provide effective responses to dengue outbreaks [10].
In the 2019 dengue epidemic, dengue cases were reported from 19 of the 20 districts in Bhu-
tan, including many districts that had never previously had dengue. Unfortunately, the current
national surveillance system does not capture information on the source of infection, i.e.
whether it was acquired locally or imported from other districts or countries, and so it is not
known whether all cases of dengue were acquired in the district where they were reported.
This information is crucial to understand the epidemiology of dengue for planning control
activities. Therefore, methods need to be applied to understand whether particular locations
are likely to sustain local dengue transmission.
Recent advances in geographical information systems (GIS) and remote sensing technolo-
gies have been increasingly used to study the spatial relationships between vector-borne dis-
eases and the factors that influence their distribution [11]. These technologies have been
implemented in several ways, including as the basis for spatial decision support tools to
improve resource allocation for disease surveillance and control activities [12] and predicting
high risk locations for these diseases [13]. A GIS-based multi-criteria decision analysis
(MCDA) is one such decision support tool, offering a straightforward approach to conceptual-
izing the complex web of factors and interactions that mediate the transmission of disease
[14]. MCDA integrates multiple factors and weighs their importance by incorporating knowl-
edge and data from diverse sources [15, 16]. This can be operationalised in different ways;
here, we used a Weighted Linear Combination (WLC) algorithm for combining information
to produce a dengue vulnerability map.
PLOS NEGLECTED TROPICAL DISEASES Dengue vulnerability in Bhutan
PLOS Neglected Tropical Diseases | https://doi.org/10.1371/journal.pntd.0009021 February 10, 2021 2 / 17

The aim of this study was to generate dengue vulnerability maps for Bhutan for different
seasons. These maps can be used to visualise dengue vulnerability of different areas for priori-
tizing limited public health resources for controlling dengue in Bhutan.
Methods
Ethics statement
Ethical clearance for this study was approved by the Research Ethics Board of Health (REBH),
Ministry of Health, Bhutan (REBH/Approval/2020/033) and the Australian National Univer-
sity (ANU), Australia (2020/297).
Study setting
Bhutan is one of Asia’s smallest nations, situated in the southern slopes of the eastern Himala-
yas between the People’s Republic of China in the North and India in the South, West and
East. The country has a total area of 38,394 square kilometres and lies between 27˚ 30’ N and
90˚ 30’ E [17]. The country is administratively divided into 20 districts or dzongkhags, which
are further divided into 205 sub-districts or gewogs (Fig 1).
Bhutan has a monsoonal climate with four seasons. The spring season starts in March and
ends in May. The summer season, which commences in June and ends in August, is character-
ized by heavy rain and high temperatures. The rain continues into the autumn season, which
stretches from September to November. From December, the winter sets in with frost covering
much of the country, and it lasts until February [18].
Fig 1. District (with name) and sub-district boundaries (in light grey colour) of Bhutan. The capital city (green triangle with dot inside) lies in Thimphu district,
shown here in light blue.
https://doi.org/10.1371/journal.pntd.0009021.g001
PLOS NEGLECTED TROPICAL DISEASES Dengue vulnerability in Bhutan
PLOS Neglected Tropical Diseases | https://doi.org/10.1371/journal.pntd.0009021 February 10, 2021 3 / 17

Study design
The MCDA process involves the following stages: 1) Defining the objective, 2) Identifying fac-
tors and constraints using different information sources (e.g. expert opinion, a literature
search and analysis of historical data), 3) Defining the relationship between the factors and the
vulnerability of a location for dengue, 4) Transforming or standardizing the values of the fac-
tors on a relative scale to allow comparison between each criterion, 5) Weighting the criteria
on the basis of their relative importance to vulnerability, 6) Combining and aggregating all the
layers/criteria to produce a final weighted estimate of vulnerability in each location and, 7)
Conducting sensitivity analysis and validating the results.
Objective
The objective of MCDA was to identify and prioritize areas for dengue control. Dengue con-
trol activities such as vector control in Bhutan are initiated only during outbreaks and when
the health system is already disrupted. During an outbreak, healthcare facilities are over-
crowded with limited space to care for patients, and staffing is insufficient to meet the patient
load. To avoid such delays and provide prompt intervention measures, identification of areas
at risk of dengue is important. Areas that are vulnerable for dengue might then be sites for sen-
tinel or other targeted surveillance approaches, and protocols and systems can be developed in
advance for mobilization of resources when and where they are required.
Data sources
To validate the model, we used dengue cases between 2016–2019 from the National Early Warn-
ing, Alert, Response and Surveillance (NEWARS) database housed within the Ministry of Health
of Bhutan. NEWARS is an integrated online disease surveillance system of all nationally notifiable
diseases including dengue [19]. Dengue cases are defined as any patients presenting fever with
any two of the following symptoms: headache, retro-orbital pain, rash, muscle/joint pain, positive
tourniquet test and any warning signs of severe dengue, which include abdominal pain, persistent
vomiting, mucosal bleeding, fluid accumulation, liver enlargement and elevated haematocrit
value. These cases were further confirmed by rapid diagnostic test for dengue virus non-struc-
tural protein 1 (NS1), anti-dengue IgM and IgG antibodies. Only confirmed cases were reported
into the NEWARS. Average annual dengue incidence in the districts varies between less than
three cases to more than 21 cases per 10,000 inhabitants (S1 Fig). Dengue is seasonal with maxi-
mum dengue incidence reported during summer than other seasons (S1 Table).
Past studies have demonstrated multiple factors that influence the occurrence of dengue
(S2 Table). We included temperature, rainfall, land use, population density, distance from the
road network and the open water bodies/major rivers, upon which we base the vulnerability
assessment.
Maximum temperature and rainfall variables were obtained from Worldclim (www.
worldclim.org). These raster layers were developed at a spatial resolution of 30 seconds (~1
km2) between 1970 and 2000 [20]. In this study, seasonal averages were generated for both
rainfall and temperature for the following time periods: a) December, January and February
for the winter season; b) March, April and May for the spring season; c) June, July and August
for the summer season; and, d) September, October and November for the autumn season. As
elevation has been already used as a covariate in Worldclim data production, it was not used in
the model construction [21].
Population density was obtained from the Worldpop (www.worldpop.org) global high-res-
olution population denominators project, which provides gridded population counts at 100 m
spatial resolution (3-arc seconds) [22].
PLOS NEGLECTED TROPICAL DISEASES Dengue vulnerability in Bhutan
PLOS Neglected Tropical Diseases | https://doi.org/10.1371/journal.pntd.0009021 February 10, 2021 4 / 17
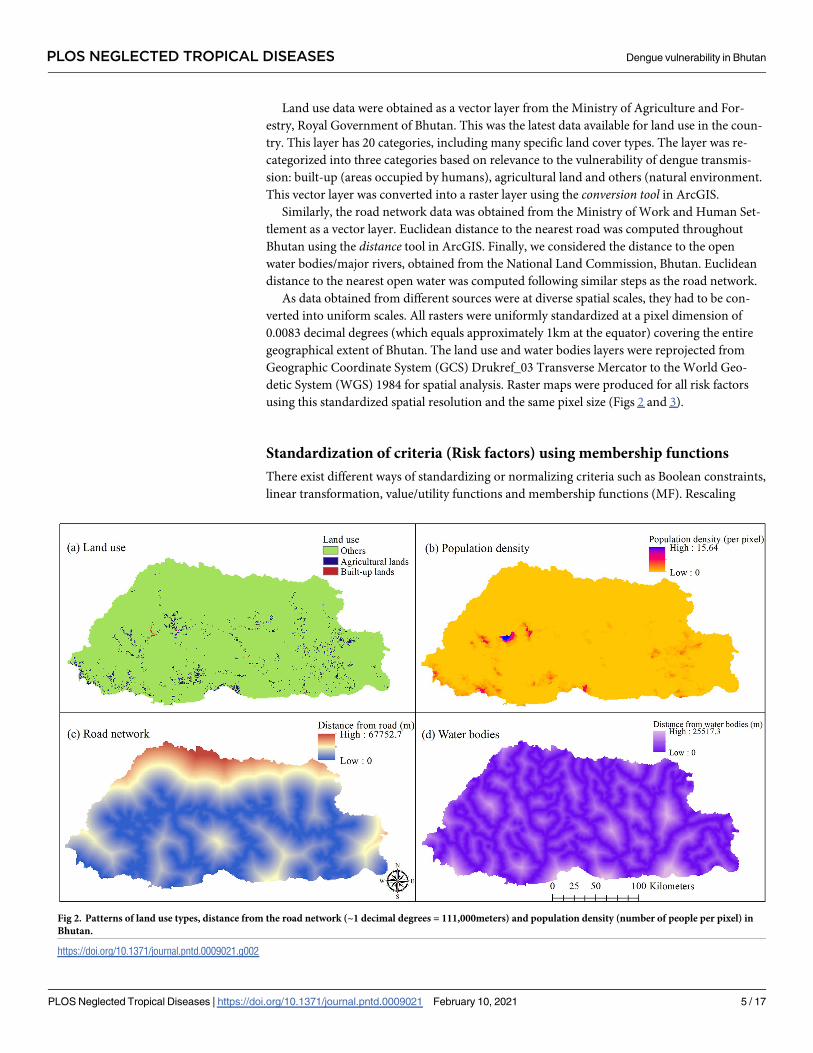
Land use data were obtained as a vector layer from the Ministry of Agriculture and For-
estry, Royal Government of Bhutan. This was the latest data available for land use in the coun-
try. This layer has 20 categories, including many specific land cover types. The layer was re-
categorized into three categories based on relevance to the vulnerability of dengue transmis-
sion: built-up (areas occupied by humans), agricultural land and others (natural environment.
This vector layer was converted into a raster layer using the conversion tool in ArcGIS.
Similarly, the road network data was obtained from the Ministry of Work and Human Set-
tlement as a vector layer. Euclidean distance to the nearest road was computed throughout
Bhutan using the distance tool in ArcGIS. Finally, we considered the distance to the open
water bodies/major rivers, obtained from the National Land Commission, Bhutan. Euclidean
distance to the nearest open water was computed following similar steps as the road network.
As data obtained from different sources were at diverse spatial scales, they had to be con-
verted into uniform scales. All rasters were uniformly standardized at a pixel dimension of
0.0083 decimal degrees (which equals approximately 1km at the equator) covering the entire
geographical extent of Bhutan. The land use and water bodies layers were reprojected from
Geographic Coordinate System (GCS) Drukref_03 Transverse Mercator to the World Geo-
detic System (WGS) 1984 for spatial analysis. Raster maps were produced for all risk factors
using this standardized spatial resolution and the same pixel size (Figs 2 and 3).
Standardization of criteria (Risk factors) using membership functions
There exist different ways of standardizing or normalizing criteria such as Boolean constraints,
linear transformation, value/utility functions and membership functions (MF). Rescaling
Fig 2. Patterns of land use types, distance from the road network (~1 decimal degrees = 111,000meters) and population density (number of people per pixel) in
Bhutan.
https://doi.org/10.1371/journal.pntd.0009021.g002
PLOS NEGLECTED TROPICAL DISEASES Dengue vulnerability in Bhutan
PLOS Neglected Tropical Diseases | https://doi.org/10.1371/journal.pntd.0009021 February 10, 2021 5 / 17

PLOS NEGLECTED TROPICAL DISEASES Dengue vulnerability in Bhutan
PLOS Neglected Tropical Diseases | https://doi.org/10.1371/journal.pntd.0009021 February 10, 2021 6 / 17

factors into a standardized continuous scale allowed them to be compared and combined. In
this study, fuzzy logic MF was used to determine the relationship between each factor and den-
gue vulnerability. Fuzzy set membership is the probability of an element belonging to a class
(here, vulnerable/not vulnerable) in which boundaries between classes are not distinct. Using
this approach can improve the accuracy of the output as the membership score represents a
zone of gradual transition rather than a hard transition. The graded values ranged from 0 (i.e.
complete non-membership or non-vulnerable in a fuzzy set) to 1 (i.e. complete membership
or highly vulnerable in a fuzzy set).
Temperature
Climatic conditions, including temperature and rainfall, play a major role in the local spread of
dengue infection by directly affecting the life cycle, feeding activity, biting rates and incubation
period of the disease [23]. Vector populations increase through processes such as the laying of
eggs, egg hatching and growth of larva and pupa, all of which are favoured by higher tempera-
tures. Higher temperatures reduce the extrinsic incubation period of DENV in Aedes mosqui-
toes and promote viral transmission [24, 25]. Furthermore, higher temperatures increase the
speed of blood meal digestion and thus boost the feeding habits of mosquitoes [26]. The longev-
ity of Aedes mosquitoes increases with an increase in temperature, with the optimum survival
temperature ranging from 27–30˚C, while temperature below 17˚C and above 34˚C are associ-
ated with low mosquito activity and thus lower transmission [25, 27]. Thus we input a symmet-
ric relationship between vulnerability and temperature, with vulnerability rising from 17˚C
(below which the environment is not vulnerable), peaking at 27–30˚C, and falling to 34˚C
(above which the environment is also not vulnerable) (Table 1).
Rainfall
Increased rainfall facilitates vector population growth by providing water required for mos-
quito breeding [28]. The impact of rainfall on vector density and consequent dengue infection
varies across different geographical regions. Cheong et. al had reported the highest dengue
Fig 3. Patterns of seasonal average rainfall (left panel maps) and average maximum temperature (right panel maps) in Bhutan.
Seasonal average data was computed by averaging three months for each season: Winter (December-February), Spring (March-May),
Summer (June-August) and Autumn (September-November).
https://doi.org/10.1371/journal.pntd.0009021.g003
Table 1. Parameters defining membership functions for dengue vulnerability in Bhutan.
Risk factors Function shape Not vulnerable Maximum
vulnerability
Rationale
Temperature (˚C) Symmetric <17 & >34 27–30 Optimum surviving temperature for vector ranges from 27–30˚C, while
temperature <17˚C & >34˚C are associated with low mosquito activity & lower
transmission
Monthly rainfall (mm) Monotonic
increasing (Linear)
<10 mm >167 mm Total monthly rainfall of 167mm is suitable for stable dengue transmission
Population density
(per pixel)
Monotonic
increasing (Linear)
< 1 >16 Populations >1 person per pixel are required for dengue transmission &
vulnerability increases linearly to a maximum at 16 people per pixel
Distance from the road
network (m)
Monotonic
decreasing (Linear)
>5000m <500m Most dengue cases occur within 500m of a road, whilst dengue rarely occurs
>5000m from the road network
Land use types Categorical data Natural
environment
Built-up areas Built-up areas are associated with highest dengue incidence followed by
agricultural land. Natural environments such as forest, snow and barren land are
not associated with dengue
Distance from the
water bodies
Monotonic
decreasing (Linear)
>20,000m <500m Most dengue cases occur within 500m of water bodies, whilst dengue rarely
occurs >20,000m from water bodies
https://doi.org/10.1371/journal.pntd.0009021.t001
PLOS NEGLECTED TROPICAL DISEASES Dengue vulnerability in Bhutan
PLOS Neglected Tropical Diseases | https://doi.org/10.1371/journal.pntd.0009021 February 10, 2021 7 / 17

incidence at a bi-weekly total rainfall between 215–302 mm in Malaysia [29]. In Taiwan, the
relative risk of dengue was found to be significantly correlated with precipitation up to a maxi-
mum of 350mm/day at 70 days lag [30], while the peak dengue risk had been reported at a
monthly cumulative rainfall of 720mm in China [31]. Countries in the World Health Organi-
zation South-East Asia Region (WHO-SEAR) including Bhutan are considered to have stable
Ae. aegypti populations in geographical locations that receive an annual rainfall of greater than
2000mm [7]. Based on this relationship, dengue incidence varies seasonally (following a Sig-
moidal function) with maximum incidence evident the month following a monthly cumulative
rainfall of 167mm. Vulnerability in the current study was, therefore, assumed to increase
monotonically with monthly rainfall above 10mm [32] (Table 1).
Population density
High population density and uncontrolled urbanization have created ideal conditions for
increased transmission of dengue [33]. Dengue incidence is assumed to increase linearly with
increasing population density. Areas with population density <1 person per square km were
standardized to zero, while areas with the maximum population density (i.e., 16) were stan-
dardized to one. A simple linear increasing function was used to describe this relationship
between vulnerability and population density (Table 1).
Land use
Ae. aegypti are commonly found around human dwellings, where female mosquitoes fre-
quently and almost exclusively bite human hosts [26]. Therefore, this mosquito is predomi-
nantly found in high-density urban areas, and is rarely found in vegetated and forested land
[34]. An abundance of Ae. aegypti is also associated with a high coverage of agricultural land
use such as crops and paddy fields in some areas [35, 36]. Fragmentation of natural habitats
can increase the local temperature and increase human-mosquito interactions, favouring the
transmission of dengue [37]. On the continuous scale from 0 to 1, built-up areas were consid-
ered highly vulnerable and rated as “1”, agricultural lands were rated as “0.50”, while all others
areas were considered not vulnerable to dengue and rated as “0”.
Distance from the road network
Using the road network as a measure of urbanization, studies have reported a positive relation-
ship between the distribution of dengue epidemics and density of the road network. Well-
developed road networks facilitate the movement of people and increase the probability of
dengue transmission [38]. The density of the road network is also a proxy measure of the den-
sity of the human population. Cases have been found to concentrate within 500m of the road
network and nearly all cases occur within a distance of 5000m [39]. Accordingly, maximum
vulnerability for dengue was assumed to occur at a distance of up to 500m from the road net-
work, then monotonically decrease to a maximum distance of 5000m, after which the location
was deemed not to be vulnerable (Table 1).
Distance from open water bodies/major rivers
Distribution of mosquitoes and dengue incidence varies in response to the distribution of
open water bodies and rivers. Studies in the past have shown greater dengue incidence [40, 41]
as well as higher prevalence of dengue seropositive residents in areas adjacent open water bod-
ies [42]. Standing water formed as a consequence of rivers can act as breeding sites for mosqui-
toes and enhance the transmission of dengue [43]. As for the road network, maximum
PLOS NEGLECTED TROPICAL DISEASES Dengue vulnerability in Bhutan
PLOS Neglected Tropical Diseases | https://doi.org/10.1371/journal.pntd.0009021 February 10, 2021 8 / 17

vulnerability was assumed to occur at a distance of up to 500m from open water, and then
monotonically decrease to a maximum distance of 20,000m.
Applying decision rules
We used the analytical hierarchy process (AHP) developed by Saaty to generate weights for
each factor using a pairwise comparison matrix [15]. With this method, the relative impor-
tance of each factor was determined through pair-wise comparison by creating a ratio-matrix
using a numerical scale. Each comparison determines which factor is more important and to
what extent on a nine-point scale ranging from extremely less important through equal impor-
tance to extremely more important [15].
Pairs of factors were compared based on the number of studies that reported significant associa-
tions with dengue incidence/outbreaks. To this end, a literature search was conducted to extract rel-
evant publications in the PubMed database. We used the following combination of search terms:
("dengue virus" OR dengue OR "severe dengue") AND (temperature or precipitation or rainfall or
“land use/land cover” road or water or river or "population density") AND (Asia). To retrieve recent
articles, the search was restricted for the time period between 2010 and 2020. Factors that had been
reported more frequently were considered to be more important and rated higher in a pairwise
comparison. A detailed description can be found in S2 Table. The principal eigen vector obtained
from the pairwise matrix was then used to calculate best-fit of weight for each factor [44]. To calcu-
late weights, a normalized comparison matrix was computed from the pairwise comparison matrix
by dividing all elements of each column by their respective column sum. Then the algebraic average
of the six columns of risk factors was computed to generate an approximate weight-vector. The
weights were normalized so that its additive value was equal to one.
To measure the inconsistency associated with the pairwise comparison matrix, a consis-
tency index (CI) was calculated as follows:
CI ¼lmax � pðp � 1ÞRI
where, λmax is the biggest eigenvalue that can be obtained once we have its associated eigenvec-
tor, p is the number of columns of the matrix (i.e., risk factors) and RI is a random index (its
value depend on the size p). If CI<0.10, then ratio indicates a reasonable or acceptable level of
consistency, while CI�0.10 indicates inconsistent judgements [45].
The Pearson correlation coefficient (r) was calculated for each pair of factors. If r> 0.4,
weights of both factors were reduced by 10%, while other weights increased proportionally to
result in the total weight of one [46].
Weights assigned to the factors were considered statistically acceptable with the CI of 0.013,
which is below the threshold level of 0.10 (Table 2). These weights were further adjusted based
on the results of the correlation analysis (S3 Table).
Combination of criteria using weighted linear combination
Weighted linear combination (WLC) was used to aggregate all standardized raster layers. A
low vulnerability score in one factor is compensated by a high vulnerability score in another
factor. WLC has the following expression [47]:
Si ¼Xn
j¼1
wjxij
Where, Si represents the final score, wj represents the weight of the criterion j, and xij
PLOS NEGLECTED TROPICAL DISEASES Dengue vulnerability in Bhutan
PLOS Neglected Tropical Diseases | https://doi.org/10.1371/journal.pntd.0009021 February 10, 2021 9 / 17

represents the standardized score of the jth criterion for the ith pixel. Standardization of risk
factors and WLC were operationalized in the TerrSet Geospatial Monitoring and Modelling
software (in short TerrSet) (Clark Labs, Worcester, MA).
Sensitivity analysis
Sensitivity analysis was conducted by changing the MF (i.e., the structure or the shape) and
weights of the risk factors. To determine the change in MF of the risk factors, following sensitiv-
ity analysis were conducted: a) All linear monotonic relationship were converted into sigmoidal
relationship, b) Symmetric relationship of temperature was converted into a monotonic linear
relationship and c) Rainfall was converted to a symmetric relationship from a monotonic rela-
tionship [32]. In order to assess the sensitivity of the weights, two new weights are applied to
each factor by adding and subtracting 25% from the original weights [46]. We also used equal
weights of 0.167 for all risk factors. Each of the newly constructed weights was individually
incorporated into the model, while holding other factor weights constant. For each combination
of weights obtained, a vulnerability map was created. Vulnerability estimates were extracted
from both the original and new maps at the sub-district level using the zonal statistics tool in
ArcGIS and the mean change in vulnerability was calculated. Average changes in vulnerability
scores for each change in input values were assessed to determine the robustness of the model.
Map validation
The predictive ability of the MCDA was quantified using a Receiver Operating Characteristic
Curve (ROC) constructed in the R software. Predicted values were obtained by averaging the
dengue vulnerability scores of all four seasons at the sub-district level. National surveillance
data from NEWARS were used to identify sub-districts that have reported dengue over the
past five years. These sub-district-level observations were then compared with predicted vul-
nerability derived from the MCDA. The area under the curve (AUC) of the ROC was used to
validate the predictive ability of the MCDA map. Note, using this approach, estimates of both
sensitivity and specificity are dependent on all vulnerable areas of the country having experi-
enced dengue cases during the past five years and all areas reporting dengue having had local
transmission. Both are associated with considerable uncertainty.
Results
Vulnerability maps for dengue
Dengue vulnerability varied by different time periods, as displayed by four different vulnerabil-
ity maps covering the country of Bhutan (Fig 4). The Winter season had the lowest vulnerabil-
ity for dengue up to a maximum vulnerability score of 0.6. With the onset of spring, our model
Table 2. Pairwise comparison of matrix of criteria (risk factors) and weights in analytical hierarchy process with respect to dengue vulnerability.
Risk factors Temperature Rainfall Land use Population Density Road network Water bodies Adjusted weights
Temperature 1 0.290
Rainfall 1/2 1 0.269
Land use 1/3 1/2 1 0.136
Population density 1/4 1/3 1/2 1 0.133
Road network 1/6 1/5 1/3 1/3 1 0.071
Water bodies 1/6 1/5 1/3 1/3 1/2 1 0.101
RI = 1.24, λmax = 6.084, CI = 0.013.
https://doi.org/10.1371/journal.pntd.0009021.t002
PLOS NEGLECTED TROPICAL DISEASES Dengue vulnerability in Bhutan
PLOS Neglected Tropical Diseases | https://doi.org/10.1371/journal.pntd.0009021 February 10, 2021 10 / 17

projected an increase in vulnerability with extension of higher vulnerability to many geograph-
ical regions. Areas with high vulnerability (vulnerability score >0.80) were predominantly
concentrated in low-lying elevations and included Chukha, Samtse, Sarpang, Dagana, Pema-
gatshel and Samdrup Jongkhar districts.
Summer had the highest vulnerability for dengue, with further expansion of vulnerable
areas. Areas of vulnerability even extended to the nation’s capital, where the vulnerability
score was>0.80 in three sub-districts, namely Kawang, Chang and Mewang (Fig 5). Other
places with high vulnerability in summer included Wangdiphodrang, Punakha, Tsirang, Paro,
Trongsa, Mongar, Trashiyangtse, Lhuentse, and Trashigang districts. In autumn, areas vulner-
able for dengue started to decrease, mainly due to declining temperatures.
Sensitivity analysis
Assuming a sigmoidal relationship between risk factors and dengue vulnerability resulted in a
mean change of vulnerability estimates of 0.0067, 0.0057, 0.0018 and 0.0054 for spring, sum-
mer, autumn and winter seasons respectively. Increasing or decreasing the weights of the fac-
tors by 25% whilst holding all other weights constant resulted in a mean change in
vulnerability estimates from as low as 0.0006 to 0.0335. Changing the MF of rainfall from
monotonic to symmetric structure resulted in the highest overall average change in vulnerabil-
ity estimates of 0.0767 (Table 3).
Validation
The predictive performance (AUC) of the MCDA model at the sub-district level was 0.66 (95%
CI: 0.57, 0.76), 0.64 (95%CI: 0.54, 0.73), 0.65 (95%CI: 0.55, 0.75), and 0.72 (95%CI: 0.64, 0.79)
Fig 4. Dengue vulnerability map of Bhutan for winter, spring, summer and autumn seasons. Winter had vulnerability index upto 0.60, while all other seasons have
>0.80. The geographical coverage of vulnerability index>0.80 was observed maximum in summer.
https://doi.org/10.1371/journal.pntd.0009021.g004
PLOS NEGLECTED TROPICAL DISEASES Dengue vulnerability in Bhutan
PLOS Neglected Tropical Diseases | https://doi.org/10.1371/journal.pntd.0009021 February 10, 2021 11 / 17

for spring, summer autumn and winter seasons, respectively. The overall average performance
of the model was AUC = 0.66 (95% CI: 0.57, 0.75).
Discussion
We implemented a knowledge-driven MCDA model using WLC to develop vulnerability
maps for dengue, by season, in Bhutan. Areas with high vulnerability were predominantly
located along the southern international boundary with India and in the river valleys project-
ing into the interior of the country. In agreement with the prediction map, dengue outbreaks
in the past were predominantly reported from the southern border region. These areas are
generally characterized by lower elevations, built-ups areas, high population densities and
Fig 5. Dengue vulnerability at Thimphu sub-districts. Vulnerability index>0.80 were observed in Kawang (1), Mewang (2) and Chang (3) sub-districts during
summer.
https://doi.org/10.1371/journal.pntd.0009021.g005
PLOS NEGLECTED TROPICAL DISEASES Dengue vulnerability in Bhutan
PLOS Neglected Tropical Diseases | https://doi.org/10.1371/journal.pntd.0009021 February 10, 2021 12 / 17

favourable climatic conditions for dengue transmission. People living in these areas can freely
cross the international border in both directions, increasing their exposure to dengue virus
infection. Other regions also reported an increasing incidence of dengue in places where there
is free cross-border movement of people [48].
Vulnerability was entirely restricted to lower-elevation areas during the winter season,
whereas many additional areas had enhanced risk in the other seasons, even including some
higher-elevation areas. Areas found to be vulnerable during the summer season included the
Thimphu (where capital city is located), Wangdiphodrang, Punakha, Tsirang, Paro, Trongsa,
Mongar, Trashiyangtse, Lhuentse, and Trashigang districts. These are built-up areas, sur-
rounded by agricultural land, with better road facilities and a high population density. High
dengue incidence in built-up areas might be related to human activities such as using water
tanks, plastic bottles, discarded tyres, ornamental ponds, metal drums, flower pots, buckets,
trays and pots, which increases breeding habitats for immature mosquitoes [49]. Similarly, set-
tlements with more gasoline stations and workshops, rice paddies and marshy or swampy land
have been shown to have more dengue vectors [36]. As predicted by the model, a remote vil-
lage in Trashiyangtse district reported its first-ever dengue outbreak in 2019. This area is
located at an elevation of 915m above sea level, that few in the community expected to be vul-
nerable to dengue (Entomologist, Vector-borne Disease Control Programme, oral communi-
cation, 2nd March 2020). The method developed here could be extended to explore the effects
of future global warming given that there are no actual data currently in existence that can
enable an empirical analysis.
MCDA is still growing in public health applications, although it is widely practised in other
disciplines [50, 51]. Using national surveillance data, validation of our model produced an
average ROC-AUCs of 0.67. This shows that our model for generating vulnerability maps is
reasonably reliable without the need for additional data to refine the parameters. Sensitivity
analysis revealed higher mean differences in vulnerability estimates in all the vulnerability
maps when varying the shape of the MF as compared to varying the weights. This indicates the
Table 3. Average change in vulnerability scores generated by subtracting scores of the original map and the newly created maps.
Weights/Structural variation Spring Summer Autumn Winter Overall change
Temperature (variation in weight) " 25% 0.0021 0.0013 0.0040 0.0048 0.0030
# 25% 0.0059 0.0110 0.0045 0.0024 0.0060
Rainfall " 25% 0.0098 0.0205 0.0109 0.0083 0.0124
# 25% 0.0197 0.0335 0.0127 0.0065 0.0181
Land use " 25% 0.0157 0.0211 0.0117 0.0051 0.0134
# 25% 0.0088 0.0134 0.0125 0.0024 0.0093
Pop. Density " 25% 0.0164 0.0219 0.0125 0.0058 0.0142
# 25% 0.0092 0.0136 0.0129 0.0031 0.0097
Road " 25% 0.0049 0.0081 0.0009 0.0019 0.0040
# 25% 0.0028 0.0006 0.0010 0.0049 0.0023
Water " 25% 0.0056 0.0013 0.0097 0.0144 0.0078
# 25% 0.0135 0.0103 0.0098 0.0174 0.0128
Equal weights 0.0344 0.0939 0.0320 0.0671 0.0568
Linear to sigmoidal 0.0067 0.0057 0.0018 0.0054 0.0049
Rainfall symmetric 0.0109 0.2312 0.0232 0.0415 0.0767
Temperature monotonic 0.0496 0.0649 0.0529 0.0101 0.0444
� Calculated by taking arithmetic mean of all four seasons.
https://doi.org/10.1371/journal.pntd.0009021.t003
PLOS NEGLECTED TROPICAL DISEASES Dengue vulnerability in Bhutan
PLOS Neglected Tropical Diseases | https://doi.org/10.1371/journal.pntd.0009021 February 10, 2021 13 / 17

importance of defining the shape of the relationship between the risk factors and the vulnera-
bility outcome [46]. Given that greater certainty exists around the shape of relationships than
the values of the specific weightings, this increases our confidence in the model.
This study is subjected to several limitations. Factors such as literacy rate, poverty index,
sanitation and hygiene could not be mapped as they were only available at coarse resolution
(i.e. the district level) [52]. Up-to-date meteorological data were not available at higher resolu-
tion, and the classification of the road network into different types such as national highway or
secondary road was not available. Dengue cases from the NEWARS were used to validate the
model. However, those not captured by the surveillance systems who were asymptomatic or
mild cases and did not seek care in public health facilities were not accounted for. Additionally,
validating the vulnerability maps against data on locations where dengue had occurred doesn’t
account for areas that are vulnerable for dengue but where the disease has not yet reached, or
for areas where dengue was reported but no local transmission had actually occurred (i.e., all
cases were imported).
Overall, our study revealed peak season and areas of vulnerability to dengue at specific loca-
tions for prioritizing intervention strategies. The findings have implications for the develop-
ment of surveillance and early warning systems for dengue, allowing identification of high-risk
areas to mitigate public health effects of dengue in the country.
Supporting information
S1 Table. Seasonal dengue incidence per 10,000 inhabitants between 2016 and 2019, Bhu-
tan (Data source: NEWARS).
(DOCX)
S2 Table. Total number of publications reporting association between dengue incidence
and selected risk factors in the Asian countries.
(DOCX)
S3 Table. Pearson Correlation Coefficient (r) for pair of risk factors associated with occur-
rence of dengue transmission.
(DOCX)
S1 Fig. Average annual dengue incidence per 10,000 inhabitants between in 2016–2019,
Bhutan. We calculated the incidence by dividing the average number of dengue cases reported
to dengue surveillance (NEWARS) between 2016 and 2019 by the average district population.
(Data source: NEWARS).
(TIFF)
Acknowledgments
Authors would like to acknowledge the Ministry of Agriculture and Forest and Ministry of
Health, Royal Government of Bhutan for providing data on land cover/land use and dengue
case in Bhutan.
Author Contributions
Conceptualization: Tsheten Tsheten, Archie C. A. Clements, Kinley Wangdi.
Data curation: Tsheten Tsheten.
Formal analysis: Tsheten Tsheten.
Methodology: Tsheten Tsheten, Archie C. A. Clements, Darren J. Gray, Kinley Wangdi.
PLOS NEGLECTED TROPICAL DISEASES Dengue vulnerability in Bhutan
PLOS Neglected Tropical Diseases | https://doi.org/10.1371/journal.pntd.0009021 February 10, 2021 14 / 17
Supervision: Archie C. A. Clements, Darren J. Gray, Kinley Wangdi.
Validation: Kinley Wangdi.
Visualization: Tsheten Tsheten.
Writing – original draft: Tsheten Tsheten.
Writing – review & editing: Archie C. A. Clements, Darren J. Gray, Kinley Wangdi.
References1. Stanaway JD, Shepard DS, Undurraga EA, Halasa YA, Coffeng LE, Brady OJ, et al. The global burden
of dengue: an analysis from the Global Burden of Disease Study 2013. Lancet Infect Dis. 2016; 16:712–
23. https://doi.org/10.1016/S1473-3099(16)00026-8 PMID: 26874619
2. Global, regional, and national incidence, prevalence, and years lived with disability for 310 diseases
and injuries, 1990–2015: a systematic analysis for the Global Burden of Disease Study 2015. Lancet.
2016; 388:1545–602. https://doi.org/10.1016/S0140-6736(16)31678-6 PMID: 27733282
3. Global, regional, and national life expectancy, all-cause mortality, and cause-specific mortality for 249
causes of death, 1980–2015: a systematic analysis for the Global Burden of Disease Study 2015. Lan-
cet. 2016; 388:1459–544. https://doi.org/10.1016/S0140-6736(16)31012-1 PMID: 27733281
4. Thomas SJ, Endy TP. Vaccines for the prevention of dengue: development update. Human vaccines.
2011; 7:674–84. https://doi.org/10.4161/hv.7.6.14985 PMID: 21508679
5. Bhatt S, Gething PW, Brady OJ, Messina JP, Farlow AW, Moyes CL, et al. The global distribution and
burden of dengue. Nature. 2013; 496:504. https://doi.org/10.1038/nature12060 PMID: 23563266
6. Dash AP, Bhatia R, Sunyoto T, Mourya DT. Emerging and re-emerging arboviral diseases in Southeast
Asia. J Vector Borne Dis. 2013; 50:77–84. PMID: 23995308
7. World Health Organization. Comprehensive guideline for prevention and control of dengue and dengue
haemorrhagic fever. 2011.
8. Sharmin S, Glass K, Viennet E, Harley D. A Bayesian approach for estimating under-reported dengue
incidence with a focus on non-linear associations between climate and dengue in Dhaka, Bangladesh.
Stat Methods Med Res. 2018; 27:991–1000. https://doi.org/10.1177/0962280216649216 PMID:
27177886
9. Adrizain R, Setiabudi D, Chairulfatah A. Hospital-based Surveillance: Accuracy, Adequacy, and Timeli-
ness of Dengue Case Report in Bandung, West Java, Indonesia of 2015. J Glob Infect Dis. 2018;
10:201–5. https://doi.org/10.4103/jgid.jgid_108_17 PMID: 30581261
10. de Lima LMM, de Sa LR, Dos Santos Macambira AFU, de Almeida Nogueira J, de Toledo Vianna RP,
de Moraes RM. A new combination rule for Spatial Decision Support Systems for epidemiology. Int J
Health Geogr. 2019; 18:25. https://doi.org/10.1186/s12942-019-0187-7 PMID: 31706302
11. Simoonga C, Utzinger J, Brooker S, Vounatsou P, Appleton CC, Stensgaard AS, et al. Remote sensing,
geographical information system and spatial analysis for schistosomiasis epidemiology and ecology in
Africa. Parasitology. 2009; 136:1683–93. https://doi.org/10.1017/S0031182009006222 PMID:
19627627
12. Clements AC, Lwambo NJ, Blair L, Nyandindi U, Kaatano G, Kinung’hi S, et al. Bayesian spatial analy-
sis and disease mapping: tools to enhance planning and implementation of a schistosomiasis control
programme in Tanzania. Trop Med Int Health. 2006; 11:490–503. https://doi.org/10.1111/j.1365-3156.
2006.01594.x PMID: 16553932
13. Hay SI, Snow RW, Rogers DJ. From predicting mosquito habitat to malaria seasons using remotely
sensed data: practice, problems and perspectives. Parasitology today (Personal ed). 1998; 14:306–13.
https://doi.org/10.1016/s0169-4758(98)01285-x PMID: 17040796
14. Clements ACA, Pfeiffer DU, Martin V. Application of knowledge-driven spatial modelling approaches
and uncertainty management to a study of Rift Valley fever in Africa. International journal of health geo-
graphics. 2006; 5:57–. https://doi.org/10.1186/1476-072X-5-57 PMID: 17156467
15. Ishizaka A, Nemery P. Multi-Criteria Decision Analysis: Methods and Software. New York, UNITED
KINGDOM: John Wiley & Sons, Incorporated; 2013.
16. Boroushaki S, Malczewski J. Using the fuzzy majority approach for GIS-based multicriteria group deci-
sion-making. Computers & Geosciences. 2010; 36:302–12.
17. Royal Society for Protection of Nature. Geography of Bhutan [Accessed on 10/6/2019]. Available from:
http://www.rspnbhutan.org/geography-of-bhutan-2/.
PLOS NEGLECTED TROPICAL DISEASES Dengue vulnerability in Bhutan
PLOS Neglected Tropical Diseases | https://doi.org/10.1371/journal.pntd.0009021 February 10, 2021 15 / 17
18. National Statistical Bureau. Statistical Yearbook of Bhutan 2018. Thimphu2018.
19. Ministry of Health (Bhutan). NEWARS. 2014.
20. Fick SE, Hijmans RJ. WorldClim 2: new 1-km spatial resolution climate surfaces for global land areas.
International journal of climatology. 2017; 37:4302–15.
21. Holt AC, Salkeld DJ, Fritz CL, Tucker JR, Gong P. Spatial analysis of plague in California: niche model-
ing predictions of the current distribution and potential response to climate change. Int J Health Geogr.
2009; 8:38. https://doi.org/10.1186/1476-072X-8-38 PMID: 19558717
22. Tatem AJ. WorldPop, open data for spatial demography. Sci Data. 2017; 4:170004. https://doi.org/10.
1038/sdata.2017.4 PMID: 28140397
23. Murray NE, Quam MB, Wilder-Smith A. Epidemiology of dengue: past, present and future prospects.
Clin Epidemiol. 2013; 5:299–309. https://doi.org/10.2147/CLEP.S34440 PMID: 23990732
24. Wangdi K, Clements ACA, Du T, Nery SV. Spatial and temporal patterns of dengue infections in Timor-
Leste, 2005–2013. Parasit Vectors. 2018; 11:9. https://doi.org/10.1186/s13071-017-2588-4 PMID:
29301546
25. Ramachandran VG, Roy P, Das S, Mogha NS, Bansal AK. Empirical model for estimating dengue inci-
dence using temperature, rainfall, and relative humidity: a 19-year retrospective analysis in East Delhi.
Epidemiol Health. 2016; 38:e2016052. https://doi.org/10.4178/epih.e2016052 PMID: 27899025
26. Scott TW, Morrison AC. Vector dynamics and transmission of dengue virus: implications for dengue sur-
veillance and prevention strategies: vector dynamics and dengue prevention. Current topics in microbi-
ology and immunology. 2010; 338:115–28. https://doi.org/10.1007/978-3-642-02215-9_9 PMID:
19802582
27. Focks DA, Brenner RJ, Hayes J, Daniels E. Transmission thresholds for dengue in terms of Aedes
aegypti pupae per person with discussion of their utility in source reduction efforts. The American journal
of tropical medicine and hygiene. 2000; 62:11–8. PMID: 10761719
28. Das M, Gopalakrishnan R, Kumar D, Gayan J, Baruah I, Veer V, et al. Spatiotemporal distribution of
dengue vectors & identification of high risk zones in district Sonitpur, Assam, India. Indian J Med Res.
2014; 140:278–84. PMID: 25297362
29. Cheong YL, Burkart K, Leitao PJ, Lakes T. Assessing weather effects on dengue disease in Malaysia.
Int J Environ Res Public Health. 2013; 10:6319–34. https://doi.org/10.3390/ijerph10126319 PMID:
24287855
30. Chen MJ, Lin CY, Wu YT, Wu PC, Lung SC, Su HJ. Effects of extreme precipitation to the distribution of
infectious diseases in Taiwan, 1994–2008. PLoS One. 2012; 7:e34651. https://doi.org/10.1371/journal.
pone.0034651 PMID: 22737206
31. Li Q, Ren H, Zheng L, Cao W, Zhang A, Zhuang D, et al. Ecological Niche Modeling Identifies Fine-
Scale Areas at High Risk of Dengue Fever in the Pearl River Delta, China. Int J Environ Res Public
Health. 2017; 14. https://doi.org/10.3390/ijerph14060619 PMID: 28598355
32. Sarfraz MS, Tripathi NK, Faruque FS, Bajwa UI, Kitamoto A, Souris M. Mapping urban and peri-urban
breeding habitats of Aedes mosquitoes using a fuzzy analytical hierarchical process based on climatic
and physical parameters. Geospat Health. 2014; 8:S685–97. https://doi.org/10.4081/gh.2014.297
PMID: 25599639
33. Gubler DJ. Dengue and dengue hemorrhagic fever. Clin Microbiol Rev. 1998; 11:480–96. PMID:
9665979
34. Cox J, Grillet ME, Ramos OM, Amador M, Barrera R. Habitat segregation of dengue vectors along an
urban environmental gradient. Am J Trop Med Hyg. 2007; 76:820–6. PMID: 17488898
35. Romero D, Olivero J, Real R, Guerrero JC. Applying fuzzy logic to assess the biogeographical risk of
dengue in South America. Parasit Vectors. 2019; 12:428. https://doi.org/10.1186/s13071-019-3691-5
PMID: 31488198
36. Sarfraz MS, Tripathi NK, Tipdecho T, Thongbu T, Kerdthong P, Souris M. Analyzing the spatio-temporal
relationship between dengue vector larval density and land-use using factor analysis and spatial ring
mapping. BMC Public Health. 2012; 12:853. https://doi.org/10.1186/1471-2458-12-853 PMID:
23043443
37. Husnina Z, Clements ACA, Wangdi K. Forest cover and climate as potential drivers for dengue fever in
Sumatra and Kalimantan 2006–2016: a spatiotemporal analysis. Trop Med Int Health. 2019; 24:888–
98. https://doi.org/10.1111/tmi.13248 PMID: 31081162
38. Qi X, Wang Y, Li Y, Meng Y, Chen Q, Ma J, et al. The Effects of Socioeconomic and Environmental Fac-
tors on the Incidence of Dengue Fever in the Pearl River Delta, China, 2013. PLoS Negl Trop Dis. 2015;
9:e0004159. https://doi.org/10.1371/journal.pntd.0004159 PMID: 26506616
PLOS NEGLECTED TROPICAL DISEASES Dengue vulnerability in Bhutan
PLOS Neglected Tropical Diseases | https://doi.org/10.1371/journal.pntd.0009021 February 10, 2021 16 / 17

39. Li Q, Cao W, Ren H, Ji Z, Jiang H. Spatiotemporal responses of dengue fever transmission to the road
network in an urban area. Acta Trop. 2018; 183:8–13. https://doi.org/10.1016/j.actatropica.2018.03.026
PMID: 29608873
40. Hsueh Y-H, Lee J, Beltz L. Spatio-temporal patterns of dengue fever cases in Kaoshiung City, Taiwan,
2003–2008. Appl Geogr. 2012; 34:587–94.
41. Reiskind MH, Baisley KJ, Calampa C, Sharp TW, Watts DM, Wilson ML. Epidemiological and ecological
characteristics of past dengue virus infection in Santa Clara, Peru. Trop Med Int Health. 2001; 6:212–8.
https://doi.org/10.1046/j.1365-3156.2001.00703.x PMID: 11299038
42. Russell BM, McBride WJ, Mullner H, Kay BH. Epidemiological significanceof subterranean Aedes
aegypti (Diptera: Culicidae) breeding sites to dengue virus infection in Charters Towers, 1993. J Med
Entomol. 2002; 39:143–5. https://doi.org/10.1603/0022-2585-39.1.143 PMID: 11931248
43. World Health Organization. Flooding and communicable diseases fact sheet. Weekly Epidemiological
Record = Releve epidemiologique hebdomadaire. 2005; 80:21–8. PMID: 15715138
44. Malczewski J. GIS and multicriteria decision analysis: John Wiley & Sons; 1999.
45. Boroushaki S, Malczewski J. Implementing an extension of the analytical hierarchy process using
ordered weighted averaging operators with fuzzy quantifiers in ArcGIS. Computers & Geosciences.
2008; 34:399–410.
46. Stevens KB, Gilbert M, Pfeiffer DU. Modeling habitat suitability for occurrence of highly pathogenic
avian influenza virus H5N1 in domestic poultry in Asia: a spatial multicriteria decision analysis approach.
Spat Spatiotemporal Epidemiol. 2013; 4:1–14. https://doi.org/10.1016/j.sste.2012.11.002 PMID:
23481249
47. Gorsevski PV, Jankowski P, Gessler PE. An heuristic approach for mapping landslide hazard by inte-
grating fuzzy logic with analytic hierarchy process. Control and Cybernetics. 2006; 35:121–46.
48. Sharmin S, Glass K, Viennet E, Harley D. Geostatistical mapping of the seasonal spread of under-
reported dengue cases in Bangladesh. PLoS Negl Trop Dis. 2018; 12:e0006947. https://doi.org/10.
1371/journal.pntd.0006947 PMID: 30439942
49. Mutsuddy P, Tahmina Jhora S, Shamsuzzaman AKM, Kaisar SMG, Khan MNA. Dengue Situation in
Bangladesh: An Epidemiological Shift in terms of Morbidity and Mortality. Can J Infect Dis Med Micro-
biol. 2019; 2019:3516284. https://doi.org/10.1155/2019/3516284 PMID: 30962860
50. Firozjaei MK, Nematollahi O, Mijani N, Shorabeh SN, Firozjaei HK, Toomanian A. An integrated GIS-
based Ordered Weighted Averaging analysis for solar energy evaluation in Iran: Current conditions and
future planning. Renewable Energy. 2019; 136:1130–46.
51. Goleiji E, Hosseini SM, Khorasani N, Monavari SM. Forest fire risk assessment-an integrated approach
based on multicriteria evaluation. Environ Monit Assess. 2017; 189:612. https://doi.org/10.1007/
s10661-017-6225-7 PMID: 29110111
52. Dickin SK, Schuster-Wallace CJ, Elliott SJ. Developing a vulnerability mapping methodology: applying
the water-associated disease index to dengue in Malaysia. PLoS One. 2013; 8:e63584. https://doi.org/
10.1371/journal.pone.0063584 PMID: 23667642
PLOS NEGLECTED TROPICAL DISEASES Dengue vulnerability in Bhutan
PLOS Neglected Tropical Diseases | https://doi.org/10.1371/journal.pntd.0009021 February 10, 2021 17 / 17
Copyright © 2022 FDOKUMEN