Silicon in the dust formation zone of IRC+ 10216 as observed with PACS and SPIRE on board Herschel
12
arXiv:1005.4675v1 [astro-ph.SR] 25 May 2010 Astronomy & Astrophysics manuscript no. 14562 c ESO 2013 March 13, 2013 Letter to the Editor Silicon in the dust formation zone of IRC +10216 as observed with PACS and SPIRE on board Herschel ⋆ L. Decin 1,2 , J. Cernicharo 3 , M.J. Barlow 4 , P. Royer 1 , B. Vandenbussche 1 , R. Wesson 4 , E.T. Polehampton 5,6 , E. De Beck 1 , M. Ag ´ undez 3,10 , J.A.D.L. Blommaert 1 , M. Cohen 8 , F. Daniel 3 , W. De Meester 1 , K. Exter 1 , H. Feuchtgruber 11 , J.P. Fonfr´ ıa 7 , W.K. Gear 12 , J.R. Goicoechea 3 , H.L. Gomez 12 , M.A.T. Groenewegen 13 , P.C. Hargrave 12 , R. Huygen 1 , P. Imhof 14 , R.J. Ivison 15 , C. Jean 1 , F. Kerschbaum 17 , S.J. Leeks 5 , T. Lim 5 , M. Matsuura 4,18 , G. Olofsson 16 , T. Posch 17 , S. Regibo 1 , G. Savini 4 , B. Sibthorpe 15 , B.M. Swinyard 5 , B. Tercero 3 , C. Waelkens 1 , D.K. Witherick 4 , and J.A. Yates 4 (Affiliations can be found after the references) Received / accepted Abstract The interstellar medium is enriched primarily by matter ejected from evolved low and intermediate mass stars. The outflows from these stars create a circumstellar envelope in which a rich gas-phase and dust-nucleation chemistry takes place. We observed the nearest carbon-rich evolved star, IRC +10216, using the PACS (55-210 µm) and SPIRE (194-672 µm) spectrometers on board Herschel. We find several tens of lines from SiS and SiO, including lines from the v=1 vibrational level. For SiS these transitions range up to J=124–123, corresponding to energies around 6700 K, while the highest detectable transition is J=90–89 for SiO, which corresponds to an energy around 8400 K. Both species trace the dust formation zone of IRC +10216, and the broad energy ranges involved in their detected transitions permit us to derive the physical properties of the gas and the particular zone in which each species has been formed. This allows us to check the accuracy of chemical thermodynamical equilibrium models and the suggested depletion of SiS and SiO due to accretion onto dust grains. Key words. Stars: AGB and post-AGB, Stars: mass loss, Stars: circumstellar matter, Stars: carbon, Stars: individual: IRC +10216 1. Introduction IRC +10216 (CW Leo) is the brightest non-Solar System object in the sky at 5 µm. It is the nearest (D∼150 pc, Crosas & Menten 1997) carbon-rich evolved star, and it serves as an archetype for the study of mass loss on the asymptotic giant branch (AGB). The star is losing mass at a rate of ∼1–3 × 10 −5 M ⊙ /yr (Crosas & Menten 1997; Sch¨ oier & Olofsson 2000), producing a dense, dusty circumstellar envelope (CSE). To date, more than 60 molecules have been detected in the CSE of IRC +10216 (e.g., Cernicharo et al. 2000; He et al. 2008). Thermodynamic equilibrium and non-equilibrium reactions, photochemical re- actions, ion-molecule reactions, and the condensation of dust grains establish the abundance stratifications throughout the en- velope. It is likely that IRC +10216 is in an advanced evolu- tionary stage, marking the transition from an AGB to a plane- tary nebula (Skinner et al. 1998). A detailed study of its infrared emission spectrum can yield unique information on the thermo- physical and chemical structure of the outflow and on the history of mass loss during this important evolutionary phase. 2. Observations and data reduction Thanks to its high infrared brightness, IRC +10216 is an ideal target for observation with Herschel (Pilbratt et al. 2010). PACS and SPIRE spectroscopic observations were obtained in the con- text of the Guaranteed Time Key Programme “Mass-loss of Evolved StarS” (Groenewegen et al., in prep.). ⋆ Herschel is an ESA space observatory with science instruments pro- vided by European-led Principal Investigator consortia and with impor- tant participation from NASA. The PACS instrument, its in-orbit performance and cal- ibration, and its scientific capabilities are described in Poglitsch et al. (2010). The PACS spectroscopic observations of IRC +10216 consist of full SED scans between 52 and 210 µm obtained in a 3×1 raster, i.e. a pointing on the central object, and two pointings 30 ′′ either side. The observations were performed on 2009 Nov 12 (OD 182). The position angle was 110 degrees. The instrument mode was a non-standard version of the chop- nod PACS-SED AOT, used with a large chopper throw (6 ′ ). The spectral resolving power varies between 1000 and 4500. A de- scription of the observing mode and of the data reduction process can be found in Royer et al. (2010). The only difference with the data reduction of VY CMa as presented in Royer et al. (2010) is that the ground-based calibration was used for IRC +10216. The estimated calibration uncertainty on the line fluxes is 50 %. The SPIRE FTS measures the Fourier transform of the source spectrum across short (SSW, 194–313 µm) and long (SLW, 303–671µm) wavelength bands simultaneously. The FWHM beamwidths of the SSW and SLW arrays vary between 17-19 ′′ and 29-42 ′′ respectively. The source spectrum, including the continuum, is restored by taking the inverse transform of the observed interferogram. The absolute flux calibration uncer- tainty is 15-20% in the SSW band and 20-30% in the SLW band above 20 cm −1 (up to 50% below 20 cm −1 ). For more details on the SPIRE FTS and its calibration see Griffin et al. (2010) and Swinyard et al. (2010). IRC +10216 was observed with the high-resolution mode of the SPIRE FTS on the 2009 Nov 19 (OD 189). Twenty repeti- tions were used, each of which consisted of one forward and one reverse scan of the FTS, with each scan taking 66.6s. The total on-source integration time was therefore 2664s. The unapodized
-
Upload
independent -
Category
Documents
-
view
3 -
download
0
Transcript of Silicon in the dust formation zone of IRC+ 10216 as observed with PACS and SPIRE on board Herschel
arX
iv:1
005.
4675
v1 [
astr
o-ph
.SR
] 25
May
201
0Astronomy & Astrophysicsmanuscript no. 14562 c© ESO 2013March 13, 2013
Letter to the Editor
Silicon in the dust formation zone of IRC +10216 as observed w ithPACS and SPIRE on board Herschel ⋆
L. Decin1,2, J. Cernicharo3, M.J. Barlow4, P. Royer1, B. Vandenbussche1, R. Wesson4, E.T. Polehampton5,6, E. DeBeck1, M. Agundez3,10, J.A.D.L. Blommaert1, M. Cohen8, F. Daniel3, W. De Meester1, K. Exter1, H. Feuchtgruber11,J.P. Fonfrıa7, W.K. Gear12, J.R. Goicoechea3, H.L. Gomez12, M.A.T. Groenewegen13, P.C. Hargrave12, R. Huygen1, P.Imhof14, R.J. Ivison15, C. Jean1, F. Kerschbaum17, S.J. Leeks5, T. Lim5, M. Matsuura4,18, G. Olofsson16, T. Posch17, S.
Regibo1, G. Savini4, B. Sibthorpe15, B.M. Swinyard5, B. Tercero3, C. Waelkens1, D.K. Witherick4, and J.A. Yates4
(Affiliations can be found after the references)
Received/ accepted
Abstract
The interstellar medium is enriched primarily by matter ejected from evolved low and intermediate mass stars. The outflows from these stars createa circumstellar envelope in which a rich gas-phase and dust-nucleation chemistry takes place. We observed the nearest carbon-rich evolved star,IRC+10216, using the PACS (55-210µm) and SPIRE (194-672µm) spectrometers on board Herschel. We find several tens of lines from SiS andSiO, including lines from the v=1 vibrational level. For SiS these transitions range up to J=124–123, corresponding to energies around 6700 K,while the highest detectable transition is J=90–89 for SiO, which corresponds to an energy around 8400 K. Both species trace the dust formationzone of IRC+10216, and the broad energy ranges involved in their detected transitions permit us to derive the physical properties ofthe gas andthe particular zone in which each species has been formed. This allows us to check the accuracy of chemical thermodynamical equilibrium modelsand the suggested depletion of SiS and SiO due to accretion onto dust grains.
Key words. Stars: AGB and post-AGB, Stars: mass loss, Stars: circumstellar matter, Stars: carbon, Stars: individual: IRC+10216
1. Introduction
IRC+10216 (CW Leo) is the brightest non-Solar System objectin the sky at 5µm. It is the nearest (D∼150pc, Crosas & Menten1997) carbon-rich evolved star, and it serves as an archetypefor the study of mass loss on the asymptotic giant branch(AGB). The star is losing mass at a rate of∼1–3× 10⁻⁵ M⊙/yr(Crosas & Menten 1997; Schoier & Olofsson 2000), producinga dense, dusty circumstellar envelope (CSE). To date, more than60 molecules have been detected in the CSE of IRC+10216(e.g., Cernicharo et al. 2000; He et al. 2008). Thermodynamicequilibrium and non-equilibrium reactions, photochemical re-actions, ion-molecule reactions, and the condensation of dustgrains establish the abundance stratifications throughoutthe en-velope. It is likely that IRC+10216 is in an advanced evolu-tionary stage, marking the transition from an AGB to a plane-tary nebula (Skinner et al. 1998). A detailed study of its infraredemission spectrum can yield unique information on the thermo-physical and chemical structure of the outflow and on the historyof mass loss during this important evolutionary phase.
2. Observations and data reduction
Thanks to its high infrared brightness, IRC+10216 is an idealtarget for observation with Herschel (Pilbratt et al. 2010). PACSand SPIRE spectroscopic observations were obtained in the con-text of the Guaranteed Time Key Programme “Mass-loss ofEvolved StarS” (Groenewegen et al.,in prep.).
⋆ Herschel is an ESA space observatory with science instruments pro-vided by European-led Principal Investigator consortia and with impor-tant participation from NASA.
The PACS instrument, its in-orbit performance and cal-ibration, and its scientific capabilities are described inPoglitsch et al. (2010). The PACS spectroscopic observations ofIRC+10216 consist of full SED scans between 52 and 210µmobtained in a 3×1 raster, i.e. a pointing on the central object, andtwo pointings 30′′ either side. The observations were performedon 2009 Nov 12 (OD 182). The position angle was 110 degrees.The instrument mode was a non-standard version of the chop-nod PACS-SED AOT, used with a large chopper throw (6′). Thespectral resolving power varies between 1000 and 4500. A de-scription of the observing mode and of the data reduction processcan be found in Royer et al. (2010). The only difference with thedata reduction of VY CMa as presented in Royer et al. (2010) isthat the ground-based calibration was used for IRC+10216. Theestimated calibration uncertainty on the line fluxes is 50 %.
The SPIRE FTS measures the Fourier transform of thesource spectrum across short (SSW, 194–313µm) and long(SLW, 303–671µm) wavelength bands simultaneously. TheFWHM beamwidths of the SSW and SLW arrays vary between17-19′′and 29-42′′respectively. The source spectrum, includingthe continuum, is restored by taking the inverse transform ofthe observed interferogram. The absolute flux calibration uncer-tainty is 15-20% in the SSW band and 20-30% in the SLW bandabove 20 cm−1 (up to 50% below 20 cm−1). For more details onthe SPIRE FTS and its calibration see Griffin et al. (2010) andSwinyard et al. (2010).
IRC+10216 was observed with the high-resolution mode ofthe SPIRE FTS on the 2009 Nov 19 (OD 189). Twenty repeti-tions were used, each of which consisted of one forward and onereverse scan of the FTS, with each scan taking 66.6s. The totalon-source integration time was therefore 2664s. The unapodized
2 L. Decin et al.: Silicon in the dust formation zone of IRC+10216 as observed with PACS and SPIRE on board Herschel
spectral resolution is 1.4 GHz (0.048cm−1), and this is 2.1 GHz(0.07 cm−1) after apodization (using extended Norton-Beer func-tion 1.5; Naylor & Tahic 2007).
PACS and SPIRE photometry observations of IRC+10216are presented in Ladjal et al. (2010).
3. Results
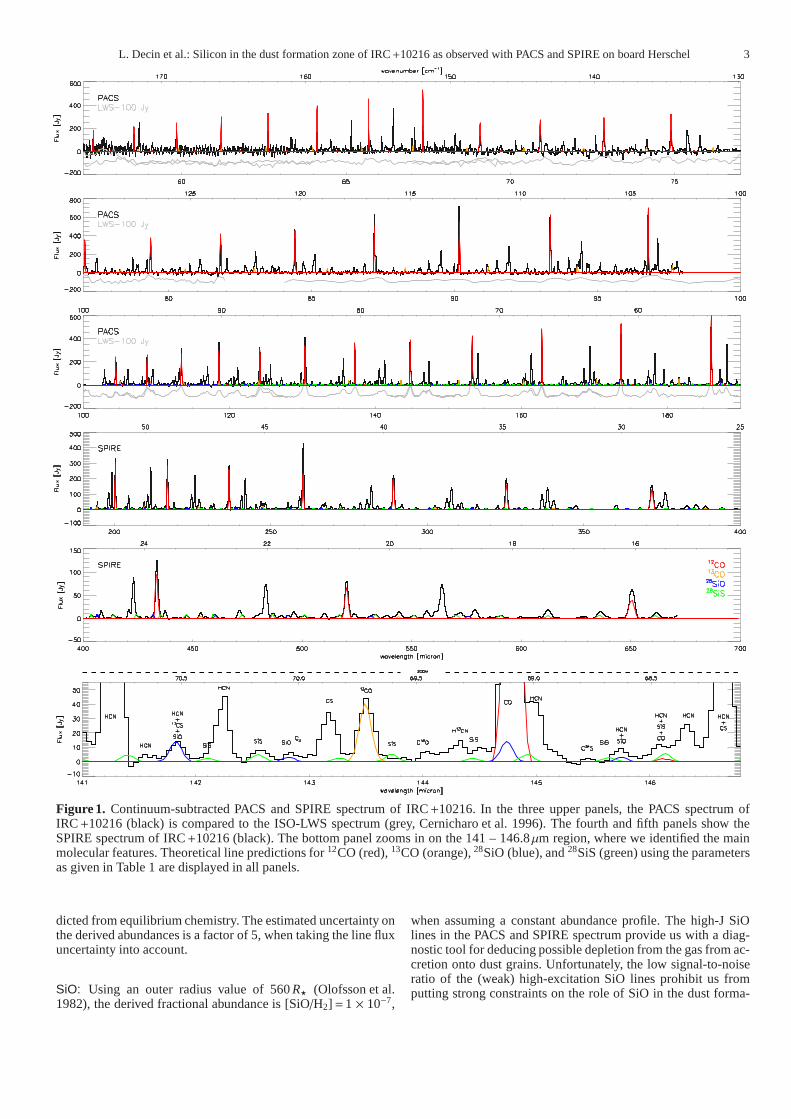
Currently, more than 500 molecular emission lines have beenidentified in the PACS and SPIRE spectra of IRC+10216 (seeFig. 1), belonging to 10 different molecules and their isotopo-logues (12CO, 13CO, C18O, H12CN, H13CN, H2O, NH3, SiS,SiO, CS, C34S, 13CS, C3, C2H, HCl, and H37Cl). The detectionof this last molecule is discussed by Cernicharo et al. (2010).In the ISO-LWS spectrum shown in Fig. 1, 57 lines belongingto CO and HCN were identified by Cernicharo et al. (1996). Thenumber of identified lines increases to 280 in the PACS spectrumthanks to its higher spectral resolution. Most of the lines in thePACS and SPIRE spectrum arise from HCN, with the strongestlines from 12CO. HCN is one of the most abundant molecu-lar species in the CSEs of carbon stars (Willacy & Cherchneff
1998) and it is known to show maser action in various vibra-tional states. The strength of the12CO lines are diagnostics forthe thermophysical structure (see Sect. 3.1). In this paper, wefocus on the silicon-bearing molecules SiS and SiO, two refrac-tory species that are formed in the inner envelope. As soon asthe temperature of the gas falls below a certain critical value, themolecules can start to condense and form dust grains.
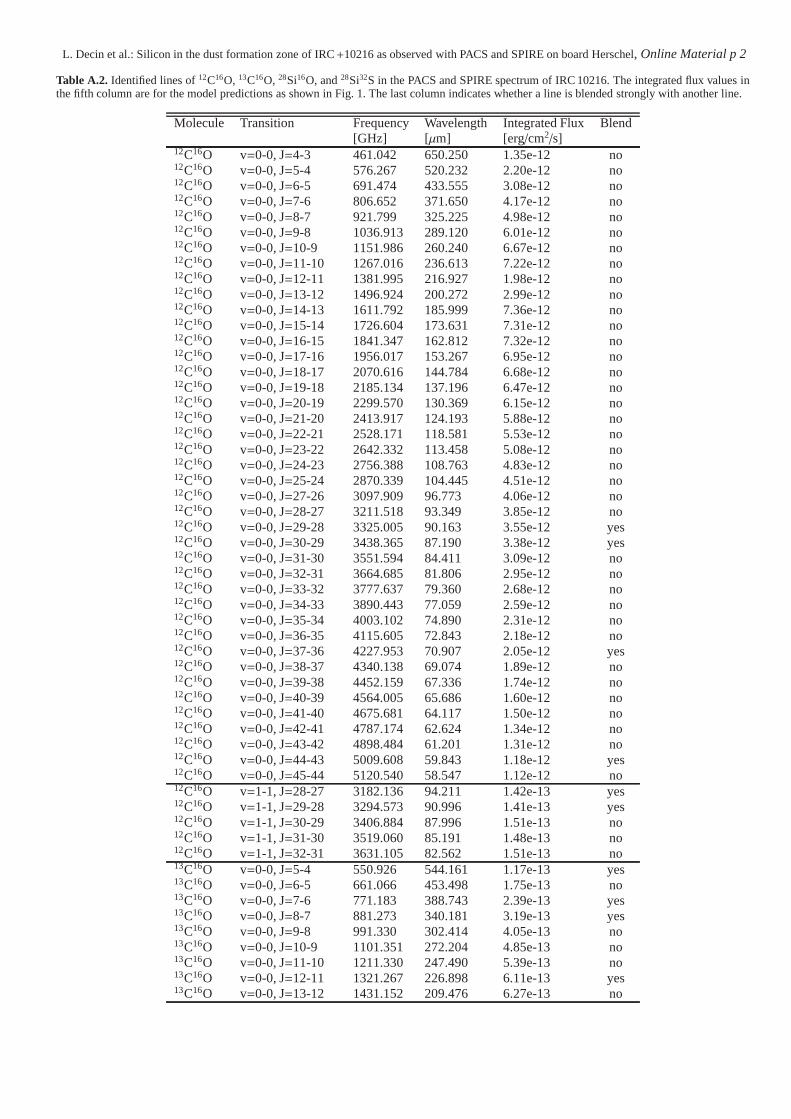
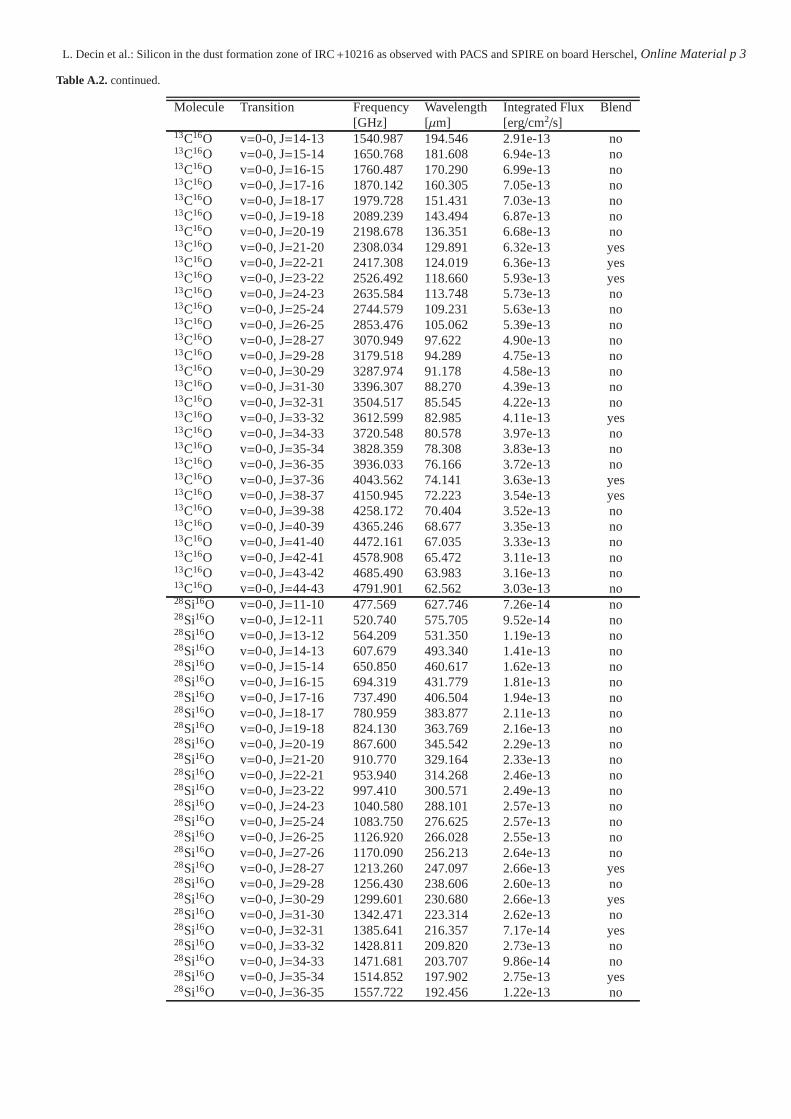
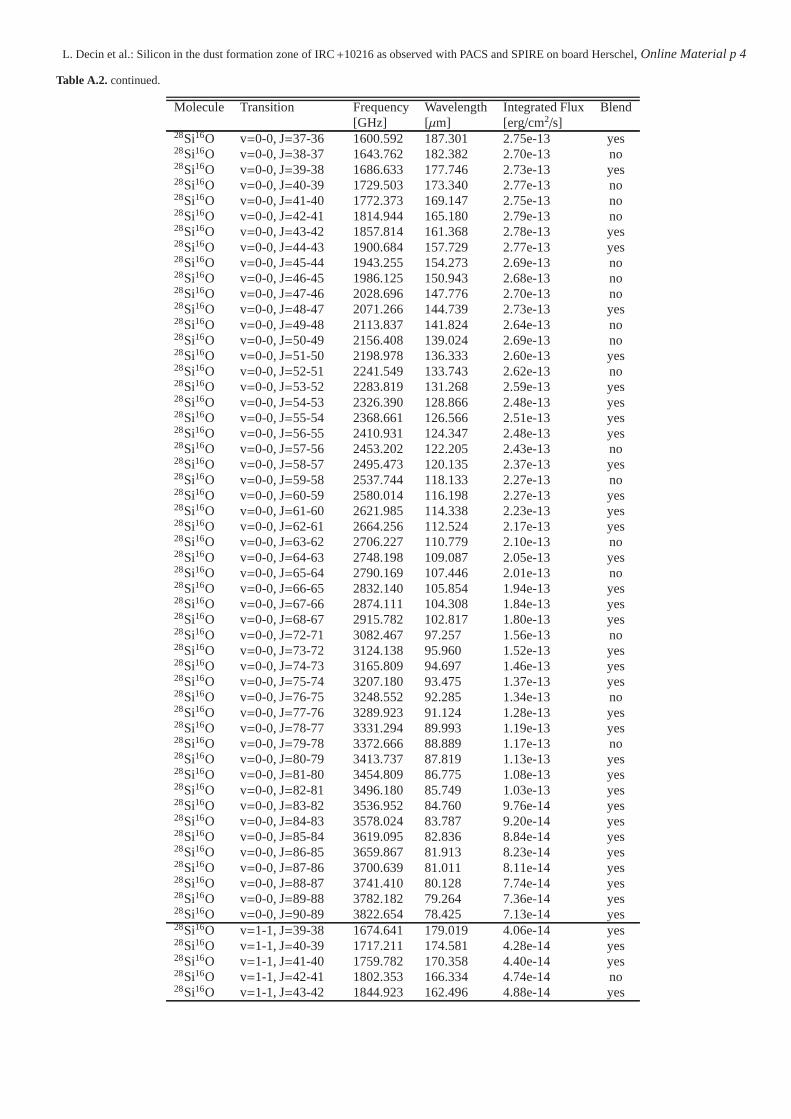
High-J rotational lines have been detected from bothmolecules. For SiO, 80 rotational transitions in the ground-statefrom J= 11–10 to J= 90–89 (Eup = 8432 K), and 99 lines fromJ= 26–25 to J=124–123 (Eup = 6678 K) for SiS are clearly de-tected. From the detected lines,∼45% of both species is un-blended (see Table A.2 in the online Appendix, which also liststhe detected12CO and13CO lines). The emission lines of higher-J transitions and rotational transitions in the first vibrational stateare very weak, but their line contribution can be deduced fromthe theoretical modelling (see Sect. 3.2, and Table A.2). The lineformation region of the highest-J lines of SiO (SiS) is within thefirst 5R⋆ (10R⋆), i.e., tracing the recently identified dust forma-tion region (Fonfrıa et al. 2008).
3.1. Thermophysical structure of the envelope
The large number of optically thick12CO and optically thin13CO lines enabled us to perform a tomographical study of theCSE. Properties of the circumstellar gas, such as the kinetictemperature, velocity, and density structure, were determinedthrough a non-local thermodynamic equilibrium (non-LTE) ra-diative transfer modelling of the12CO lines. The12CO linescover energy levels from J=3 (at 31 K) to J= 47 (at 5853 K)and trace the envelope for radii R< 1 × 1017cm (R<2000R⋆).The GASTRoNOoM code was used to calculate the kinetic tem-perature and velocity structure in the envelope and to solvethenon-LTE radiative transfer equations (Decin et al. 2006, 2010).The rate equations were solved for the ground and first ex-cited vibrational state, with Jup
max=60. The CO line list and col-lisional rates are discussed in Decin et al. (2010). The terminalvelocity was deduced from ground-based observations of low-J 12CO lines (De Beck et al. 2010). The GASTRoNOoM codecomputes the velocity structure by solving the momentum equa-tion and the temperature structure from the equation express-ing the conservation of energy (see Eq. 6 in Decin et al. 2006).However, the resulting temperature was slightly too low beyond
Table 1. Parameters for the best-fit model, where numbers initalics indicate input parameters that have been kept fixed at thegiven value.
Teff[K] 2050a M[M⊙/yr] 1 × 10⁻⁵
R⋆ [1013 cm] 5 Rdust [R⋆] 5.6d
[CO/H2] [10−3] 1b 12CO/13CO 30distance [pc] 150c n(SiO)/n(H2) 1× 10⁻⁷
v∞ [km s−1] 14.5 n(SiS)/n(H2) 4× 10⁻⁶
aGonzalez-Alfonso et al. (2007), bZuckerman & Dyck (1986),cCrosas & Menten (1997),dRidgway & Keady (1988)
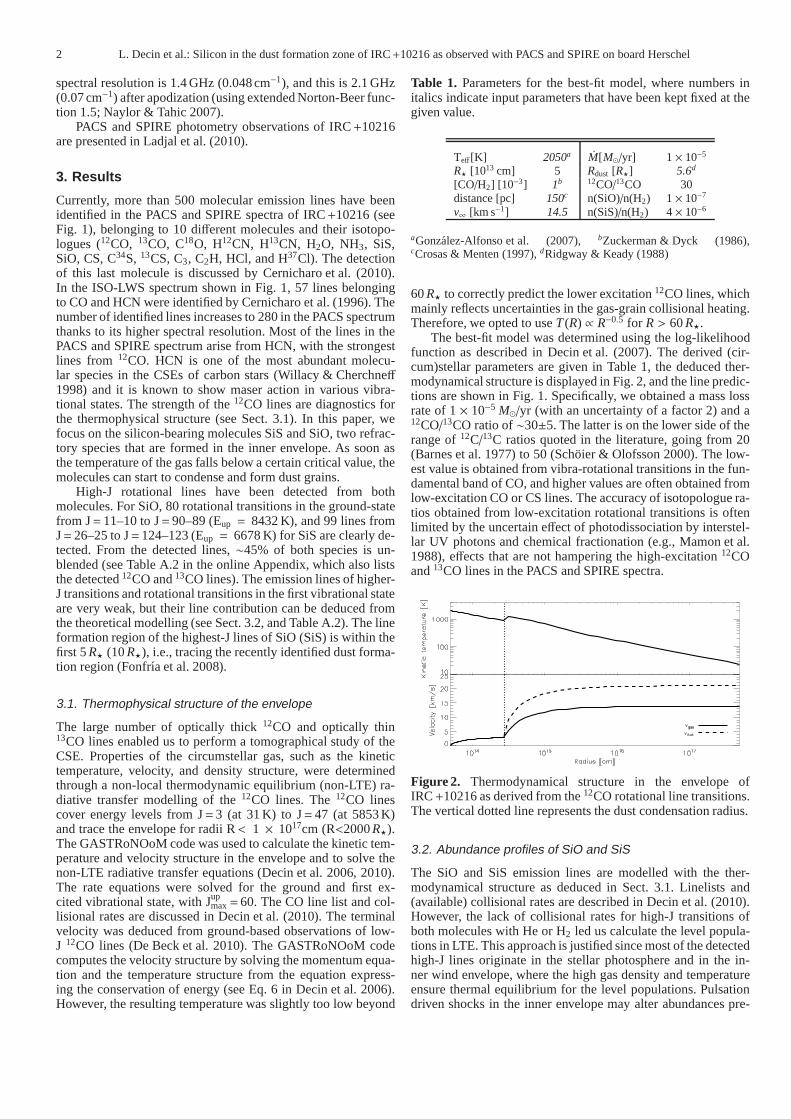
60R⋆ to correctly predict the lower excitation12CO lines, whichmainly reflects uncertainties in the gas-grain collisionalheating.Therefore, we opted to useT (R) ∝ R−0.5 for R > 60R⋆.
The best-fit model was determined using the log-likelihoodfunction as described in Decin et al. (2007). The derived (cir-cum)stellar parameters are given in Table 1, the deduced ther-modynamical structure is displayed in Fig. 2, and the line predic-tions are shown in Fig. 1. Specifically, we obtained a mass lossrate of 1× 10⁻⁵ M⊙/yr (with an uncertainty of a factor 2) and a12CO/13CO ratio of∼30±5. The latter is on the lower side of therange of12C/13C ratios quoted in the literature, going from 20(Barnes et al. 1977) to 50 (Schoier & Olofsson 2000). The low-est value is obtained from vibra-rotational transitions inthe fun-damental band of CO, and higher values are often obtained fromlow-excitation CO or CS lines. The accuracy of isotopologuera-tios obtained from low-excitation rotational transitionsis oftenlimited by the uncertain effect of photodissociation by interstel-lar UV photons and chemical fractionation (e.g., Mamon et al.1988), effects that are not hampering the high-excitation12COand13CO lines in the PACS and SPIRE spectra.
Figure 2. Thermodynamical structure in the envelope ofIRC+10216 as derived from the12CO rotational line transitions.The vertical dotted line represents the dust condensation radius.
3.2. Abundance profiles of SiO and SiS
The SiO and SiS emission lines are modelled with the ther-modynamical structure as deduced in Sect. 3.1. Linelists and(available) collisional rates are described in Decin et al.(2010).However, the lack of collisional rates for high-J transitions ofboth molecules with He or H2 led us calculate the level popula-tions in LTE. This approach is justified since most of the detectedhigh-J lines originate in the stellar photosphere and in thein-ner wind envelope, where the high gas density and temperatureensure thermal equilibrium for the level populations. Pulsationdriven shocks in the inner envelope may alter abundances pre-
L. Decin et al.: Silicon in the dust formation zone of IRC+10216 as observed with PACS and SPIRE on board Herschel 3
Figure 1. Continuum-subtracted PACS and SPIRE spectrum of IRC+10216. In the three upper panels, the PACS spectrum ofIRC+10216 (black) is compared to the ISO-LWS spectrum (grey, Cernicharo et al. 1996). The fourth and fifth panels show theSPIRE spectrum of IRC+10216 (black). The bottom panel zooms in on the 141 – 146.8µm region, where we identified the mainmolecular features. Theoretical line predictions for12CO (red),13CO (orange),28SiO (blue), and28SiS (green) using the parametersas given in Table 1 are displayed in all panels.
dicted from equilibrium chemistry. The estimated uncertainty onthe derived abundances is a factor of 5, when taking the line fluxuncertainty into account.
SiO: Using an outer radius value of 560R⋆ (Olofsson et al.1982), the derived fractional abundance is [SiO/H2] =1 × 10⁻⁷,
when assuming a constant abundance profile. The high-J SiOlines in the PACS and SPIRE spectrum provide us with a diag-nostic tool for deducing possible depletion from the gas from ac-cretion onto dust grains. Unfortunately, the low signal-to-noiseratio of the (weak) high-excitation SiO lines prohibit us fromputting strong constraints on the role of SiO in the dust forma-
4 L. Decin et al.: Silicon in the dust formation zone of IRC+10216 as observed with PACS and SPIRE on board Herschel
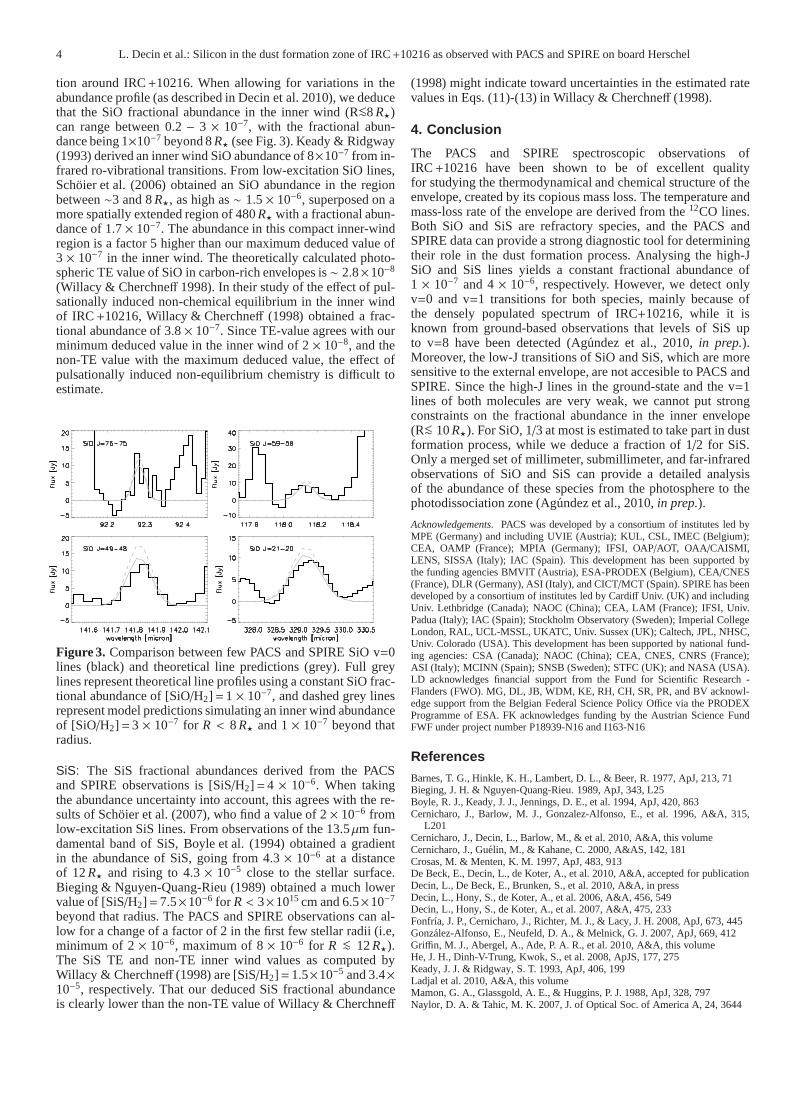
tion around IRC+10216. When allowing for variations in theabundance profile (as described in Decin et al. 2010), we deducethat the SiO fractional abundance in the inner wind (R<∼8R⋆)can range between 0.2 − 3 × 10⁻⁷, with the fractional abun-dance being 1×10⁻⁷ beyond 8R⋆ (see Fig. 3). Keady & Ridgway(1993) derived an inner wind SiO abundance of 8×10⁻⁷ from in-frared ro-vibrational transitions. From low-excitation SiO lines,Schoier et al. (2006) obtained an SiO abundance in the regionbetween∼3 and 8R⋆, as high as∼ 1.5× 10⁻⁶, superposed on amore spatially extended region of 480R⋆ with a fractional abun-dance of 1.7× 10⁻⁷. The abundance in this compact inner-windregion is a factor 5 higher than our maximum deduced value of3 × 10−7 in the inner wind. The theoretically calculated photo-spheric TE value of SiO in carbon-rich envelopes is∼ 2.8×10⁻⁸
(Willacy & Cherchneff 1998). In their study of the effect of pul-sationally induced non-chemical equilibrium in the inner windof IRC+10216, Willacy & Cherchneff (1998) obtained a frac-tional abundance of 3.8× 10⁻⁷. Since TE-value agrees with ourminimum deduced value in the inner wind of 2× 10⁻⁸, and thenon-TE value with the maximum deduced value, the effect ofpulsationally induced non-equilibrium chemistry is difficult toestimate.
Figure 3. Comparison between few PACS and SPIRE SiO v=0lines (black) and theoretical line predictions (grey). Full greylines represent theoretical line profiles using a constant SiO frac-tional abundance of [SiO/H2] =1× 10⁻⁷, and dashed grey linesrepresent model predictions simulating an inner wind abundanceof [SiO/H2] =3 × 10⁻⁷ for R < 8R⋆ and 1× 10⁻⁷ beyond thatradius.
SiS: The SiS fractional abundances derived from the PACSand SPIRE observations is [SiS/H2] =4 × 10⁻⁶. When takingthe abundance uncertainty into account, this agrees with the re-sults of Schoier et al. (2007), who find a value of 2× 10⁻⁶ fromlow-excitation SiS lines. From observations of the 13.5µm fun-damental band of SiS, Boyle et al. (1994) obtained a gradientin the abundance of SiS, going from 4.3 × 10⁻⁶ at a distanceof 12R⋆ and rising to 4.3 × 10⁻⁵ close to the stellar surface.Bieging & Nguyen-Quang-Rieu (1989) obtained a much lowervalue of [SiS/H2] = 7.5×10⁻⁶ for R < 3×1015cm and 6.5×10⁻⁷
beyond that radius. The PACS and SPIRE observations can al-low for a change of a factor of 2 in the first few stellar radii (i.e,minimum of 2× 10⁻⁶, maximum of 8× 10⁻⁶ for R <∼ 12R⋆).The SiS TE and non-TE inner wind values as computed byWillacy & Cherchneff (1998) are [SiS/H2] = 1.5×10⁻⁵ and 3.4×10⁻⁵, respectively. That our deduced SiS fractional abundanceis clearly lower than the non-TE value of Willacy & Cherchneff
(1998) might indicate toward uncertainties in the estimated ratevalues in Eqs. (11)-(13) in Willacy & Cherchneff (1998).
4. Conclusion
The PACS and SPIRE spectroscopic observations ofIRC+10216 have been shown to be of excellent qualityfor studying the thermodynamical and chemical structure oftheenvelope, created by its copious mass loss. The temperatureandmass-loss rate of the envelope are derived from the12CO lines.Both SiO and SiS are refractory species, and the PACS andSPIRE data can provide a strong diagnostic tool for determiningtheir role in the dust formation process. Analysing the high-JSiO and SiS lines yields a constant fractional abundance of1 × 10−7 and 4× 10⁻⁶, respectively. However, we detect onlyv=0 and v=1 transitions for both species, mainly because ofthe densely populated spectrum of IRC+10216, while it isknown from ground-based observations that levels of SiS upto v=8 have been detected (Agundez et al., 2010,in prep.).Moreover, the low-J transitions of SiO and SiS, which are moresensitive to the external envelope, are not accesible to PACS andSPIRE. Since the high-J lines in the ground-state and the v=1lines of both molecules are very weak, we cannot put strongconstraints on the fractional abundance in the inner envelope(R<∼ 10R⋆). For SiO, 1/3 at most is estimated to take part in dustformation process, while we deduce a fraction of 1/2 for SiS.Only a merged set of millimeter, submillimeter, and far-infraredobservations of SiO and SiS can provide a detailed analysisof the abundance of these species from the photosphere to thephotodissociation zone (Agundez et al., 2010,in prep.).
Acknowledgements. PACS was developed by a consortium of institutes led byMPE (Germany) and including UVIE (Austria); KUL, CSL, IMEC (Belgium);CEA, OAMP (France); MPIA (Germany); IFSI, OAP/AOT, OAA/CAISMI,LENS, SISSA (Italy); IAC (Spain). This development has beensupported bythe funding agencies BMVIT (Austria), ESA-PRODEX (Belgium), CEA/CNES(France), DLR (Germany), ASI (Italy), and CICT/MCT (Spain). SPIRE has beendeveloped by a consortium of institutes led by Cardiff Univ. (UK) and includingUniv. Lethbridge (Canada); NAOC (China); CEA, LAM (France); IFSI, Univ.Padua (Italy); IAC (Spain); Stockholm Observatory (Sweden); Imperial CollegeLondon, RAL, UCL-MSSL, UKATC, Univ. Sussex (UK); Caltech, JPL, NHSC,Univ. Colorado (USA). This development has been supported by national fund-ing agencies: CSA (Canada); NAOC (China); CEA, CNES, CNRS (France);ASI (Italy); MCINN (Spain); SNSB (Sweden); STFC (UK); and NASA (USA).LD acknowledges financial support from the Fund for Scientific Research -Flanders (FWO). MG, DL, JB, WDM, KE, RH, CH, SR, PR, and BV acknowl-edge support from the Belgian Federal Science Policy Office via the PRODEXProgramme of ESA. FK acknowledges funding by the Austrian Science FundFWF under project number P18939-N16 and I163-N16
ReferencesBarnes, T. G., Hinkle, K. H., Lambert, D. L., & Beer, R. 1977, ApJ, 213, 71Bieging, J. H. & Nguyen-Quang-Rieu. 1989, ApJ, 343, L25Boyle, R. J., Keady, J. J., Jennings, D. E., et al. 1994, ApJ, 420, 863Cernicharo, J., Barlow, M. J., Gonzalez-Alfonso, E., et al.1996, A&A, 315,
L201Cernicharo, J., Decin, L., Barlow, M., & et al. 2010, A&A, this volumeCernicharo, J., Guelin, M., & Kahane, C. 2000, A&AS, 142, 181Crosas, M. & Menten, K. M. 1997, ApJ, 483, 913De Beck, E., Decin, L., de Koter, A., et al. 2010, A&A, accepted for publicationDecin, L., De Beck, E., Brunken, S., et al. 2010, A&A, in pressDecin, L., Hony, S., de Koter, A., et al. 2006, A&A, 456, 549Decin, L., Hony, S., de Koter, A., et al. 2007, A&A, 475, 233Fonfrıa, J. P., Cernicharo, J., Richter, M. J., & Lacy, J. H.2008, ApJ, 673, 445Gonzalez-Alfonso, E., Neufeld, D. A., & Melnick, G. J. 2007, ApJ, 669, 412Griffin, M. J., Abergel, A., Ade, P. A. R., et al. 2010, A&A, this volumeHe, J. H., Dinh-V-Trung, Kwok, S., et al. 2008, ApJS, 177, 275Keady, J. J. & Ridgway, S. T. 1993, ApJ, 406, 199Ladjal et al. 2010, A&A, this volumeMamon, G. A., Glassgold, A. E., & Huggins, P. J. 1988, ApJ, 328, 797Naylor, D. A. & Tahic, M. K. 2007, J. of Optical Soc. of AmericaA, 24, 3644
L. Decin et al.: Silicon in the dust formation zone of IRC+10216 as observed with PACS and SPIRE on board Herschel 5
Olofsson, H., Johansson, L. E. B., Hjalmarson, A., & Nguyen-Quang-Rieu.1982, A&A, 107, 128
Pilbratt, G. L., Riedinger, J. R., Passvogel, T., et al. 2010, A&A, this volumePoglitsch, A., Waelkens, C., Geis, N., et al. 2010, A&A, thisvolumeRidgway, S. & Keady, J. J. 1988, ApJ, 326, 843Royer, P., Decin, L., & et al. 2010, A&A, this volumeSchoier, F. L., Bast, J., Olofsson, H., & Lindqvist, M. 2007, A&A, 473, 871Schoier, F. L., Fong, D., Olofsson, H., et al. 2006, ApJ, 649, 965Schoier, F. L. & Olofsson, H. 2000, A&A, 359, 586Skinner, C. J., Meixner, M., & Bobrowsky, M. 1998, MNRAS, 300, L29Swinyard, B. M., Ade, P. A. R., Baluteau, J., et al. 2010, A&A,this volumeWillacy, K. & Cherchneff, I. 1998, A&A, 330, 676Zuckerman, B. & Dyck, H. M. 1986, ApJ, 304, 394
1 Instituut voor Sterrenkunde, Katholieke Universiteit Leuven,Celestijnenlaan 200D, 3001 Leuven, Belgiume-mail:[email protected]
2 Sterrenkundig Instituut Anton Pannekoek, University ofAmsterdam, Science Park 904, NL-1098 Amsterdam, TheNetherlands
3 Laboratory of Molecular Astrophysics, Department ofAstrophysics, CAB, INTA-CSIC, Ctra de Ajalvir, km 4, 28850Torrejn de Ardoz, Madrid Spain
4 Dept of Physics & Astronomy, University College London,Gower St, London WC1E 6BT, UK
5 Space Science and Technology Department, Rutherford AppletonLaboratory, Oxfordshire, OX11 0QX, UK
6 Department of Physics, University of Lethbridge, Lethbridge,Alberta, T1J 1B1, Canada
7 Departamento de Astrofsica Molecular e Infrarroja, Instituto deEstructura de la Materia, CSIC, Serrano 121, 28006 Madrid, Spain
8 Radio Astronomy Laboratory, University of California atBerkeley, CA 94720, USA
9 Observatoire de Paris-Meudon, LERMA UMR CNRS 8112, 5place Jules Janssen, 92195 Meudon Cedex, France
10 LUTH, Observatoire de Paris-Meudon, 5 Place Jules Janssen,92190 Meudon, France
11 Max-Planck-Institut fur extraterrestrische Physik,Giessenbachstrasse, 85748, Germany
12 School of Physics and Astronomy, Cardiff University, QueensBuildings, The Parade, Cardiff, CF24 3AA, UK
13 Royal Observatory of Belgium, Ringlaan 3, B-1180 Brussels,Belgium
14 Blue Sky Spectroscopy, 9/740 4 Ave S, Lethbridge, Alberta T1J0N9, Canada
15 UK Astronomy Technology Centre, Royal ObservatoryEdinburgh, Blackford Hill, Edinburgh EH9 3HJ, UK
16 Dept of Astronomy, Stockholm University, AlbaNova UniversityCenter, Roslagstullsbacken 21, 10691 Stockholm, Sweden
17 University of Vienna, Department of Astronomy, Turkenschanzs-traße 17, A-1180 Vienna, Austria
18 Mullard Space Science Laboratory, University College London,Holmbury St. Mary, Dorking, Surrey RH5 6NT, UK

L. Decin et al.: Silicon in the dust formation zone of IRC+10216 as observed with PACS and SPIRE on board Herschel, Online Material p 1
Appendix A: Identified lines of 12C16O, 13C16O,28Si16O, and 28Si32S
L. Decin et al.: Silicon in the dust formation zone of IRC+10216 as observed with PACS and SPIRE on board Herschel, Online Material p 2
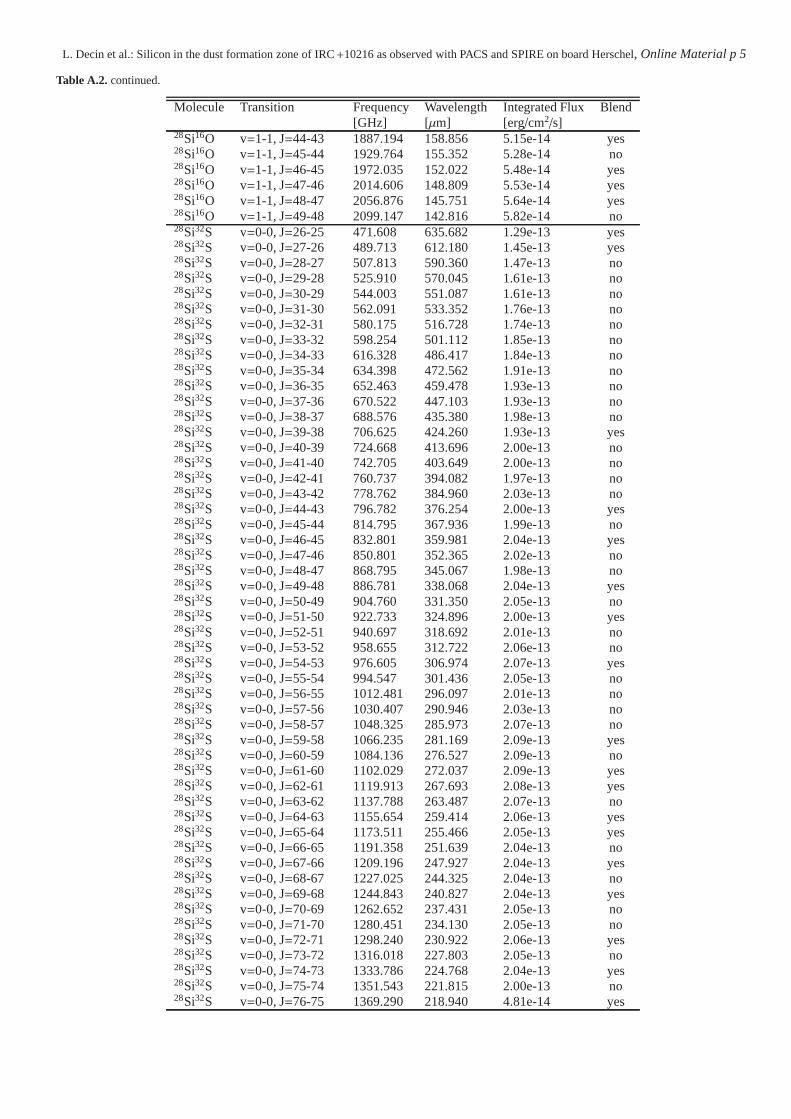
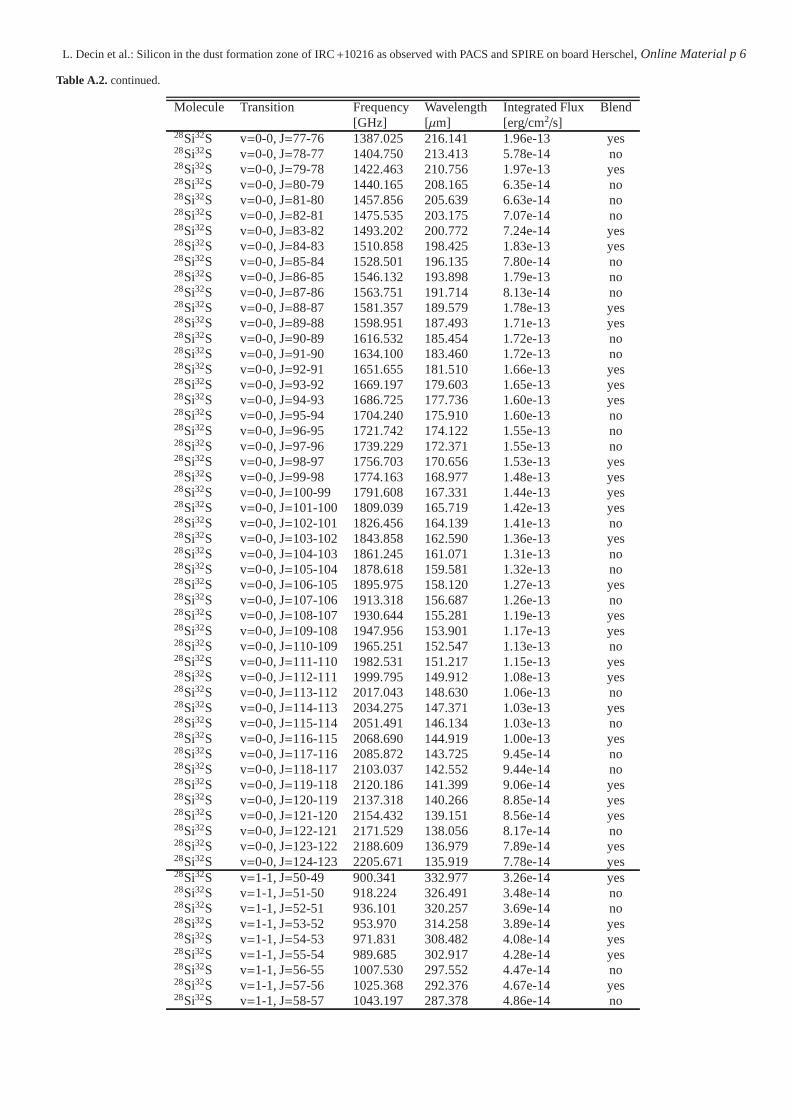
Table A.2. Identified lines of12C16O, 13C16O, 28Si16O, and28Si32S in the PACS and SPIRE spectrum of IRC 10216. The integrated flux values inthe fifth column are for the model predictions as shown in Fig.1. The last column indicates whether a line is blended strongly with another line.
Molecule Transition Frequency Wavelength Integrated FluxBlend[GHz] [µm] [erg/cm2/s]
12C16O v=0-0, J=4-3 461.042 650.250 1.35e-12 no12C16O v=0-0, J=5-4 576.267 520.232 2.20e-12 no12C16O v=0-0, J=6-5 691.474 433.555 3.08e-12 no12C16O v=0-0, J=7-6 806.652 371.650 4.17e-12 no12C16O v=0-0, J=8-7 921.799 325.225 4.98e-12 no12C16O v=0-0, J=9-8 1036.913 289.120 6.01e-12 no12C16O v=0-0, J=10-9 1151.986 260.240 6.67e-12 no12C16O v=0-0, J=11-10 1267.016 236.613 7.22e-12 no12C16O v=0-0, J=12-11 1381.995 216.927 1.98e-12 no12C16O v=0-0, J=13-12 1496.924 200.272 2.99e-12 no12C16O v=0-0, J=14-13 1611.792 185.999 7.36e-12 no12C16O v=0-0, J=15-14 1726.604 173.631 7.31e-12 no12C16O v=0-0, J=16-15 1841.347 162.812 7.32e-12 no12C16O v=0-0, J=17-16 1956.017 153.267 6.95e-12 no12C16O v=0-0, J=18-17 2070.616 144.784 6.68e-12 no12C16O v=0-0, J=19-18 2185.134 137.196 6.47e-12 no12C16O v=0-0, J=20-19 2299.570 130.369 6.15e-12 no12C16O v=0-0, J=21-20 2413.917 124.193 5.88e-12 no12C16O v=0-0, J=22-21 2528.171 118.581 5.53e-12 no12C16O v=0-0, J=23-22 2642.332 113.458 5.08e-12 no12C16O v=0-0, J=24-23 2756.388 108.763 4.83e-12 no12C16O v=0-0, J=25-24 2870.339 104.445 4.51e-12 no12C16O v=0-0, J=27-26 3097.909 96.773 4.06e-12 no12C16O v=0-0, J=28-27 3211.518 93.349 3.85e-12 no12C16O v=0-0, J=29-28 3325.005 90.163 3.55e-12 yes12C16O v=0-0, J=30-29 3438.365 87.190 3.38e-12 yes12C16O v=0-0, J=31-30 3551.594 84.411 3.09e-12 no12C16O v=0-0, J=32-31 3664.685 81.806 2.95e-12 no12C16O v=0-0, J=33-32 3777.637 79.360 2.68e-12 no12C16O v=0-0, J=34-33 3890.443 77.059 2.59e-12 no12C16O v=0-0, J=35-34 4003.102 74.890 2.31e-12 no12C16O v=0-0, J=36-35 4115.605 72.843 2.18e-12 no12C16O v=0-0, J=37-36 4227.953 70.907 2.05e-12 yes12C16O v=0-0, J=38-37 4340.138 69.074 1.89e-12 no12C16O v=0-0, J=39-38 4452.159 67.336 1.74e-12 no12C16O v=0-0, J=40-39 4564.005 65.686 1.60e-12 no12C16O v=0-0, J=41-40 4675.681 64.117 1.50e-12 no12C16O v=0-0, J=42-41 4787.174 62.624 1.34e-12 no12C16O v=0-0, J=43-42 4898.484 61.201 1.31e-12 no12C16O v=0-0, J=44-43 5009.608 59.843 1.18e-12 yes12C16O v=0-0, J=45-44 5120.540 58.547 1.12e-12 no12C16O v=1-1, J=28-27 3182.136 94.211 1.42e-13 yes12C16O v=1-1, J=29-28 3294.573 90.996 1.41e-13 yes12C16O v=1-1, J=30-29 3406.884 87.996 1.51e-13 no12C16O v=1-1, J=31-30 3519.060 85.191 1.48e-13 no12C16O v=1-1, J=32-31 3631.105 82.562 1.51e-13 no13C16O v=0-0, J=5-4 550.926 544.161 1.17e-13 yes13C16O v=0-0, J=6-5 661.066 453.498 1.75e-13 no13C16O v=0-0, J=7-6 771.183 388.743 2.39e-13 yes13C16O v=0-0, J=8-7 881.273 340.181 3.19e-13 yes13C16O v=0-0, J=9-8 991.330 302.414 4.05e-13 no13C16O v=0-0, J=10-9 1101.351 272.204 4.85e-13 no13C16O v=0-0, J=11-10 1211.330 247.490 5.39e-13 no13C16O v=0-0, J=12-11 1321.267 226.898 6.11e-13 yes13C16O v=0-0, J=13-12 1431.152 209.476 6.27e-13 no
L. Decin et al.: Silicon in the dust formation zone of IRC+10216 as observed with PACS and SPIRE on board Herschel, Online Material p 3
Table A.2. continued.
Molecule Transition Frequency Wavelength Integrated FluxBlend[GHz] [µm] [erg/cm2/s]
13C16O v=0-0, J=14-13 1540.987 194.546 2.91e-13 no13C16O v=0-0, J=15-14 1650.768 181.608 6.94e-13 no13C16O v=0-0, J=16-15 1760.487 170.290 6.99e-13 no13C16O v=0-0, J=17-16 1870.142 160.305 7.05e-13 no13C16O v=0-0, J=18-17 1979.728 151.431 7.03e-13 no13C16O v=0-0, J=19-18 2089.239 143.494 6.87e-13 no13C16O v=0-0, J=20-19 2198.678 136.351 6.68e-13 no13C16O v=0-0, J=21-20 2308.034 129.891 6.32e-13 yes13C16O v=0-0, J=22-21 2417.308 124.019 6.36e-13 yes13C16O v=0-0, J=23-22 2526.492 118.660 5.93e-13 yes13C16O v=0-0, J=24-23 2635.584 113.748 5.73e-13 no13C16O v=0-0, J=25-24 2744.579 109.231 5.63e-13 no13C16O v=0-0, J=26-25 2853.476 105.062 5.39e-13 no13C16O v=0-0, J=28-27 3070.949 97.622 4.90e-13 no13C16O v=0-0, J=29-28 3179.518 94.289 4.75e-13 no13C16O v=0-0, J=30-29 3287.974 91.178 4.58e-13 no13C16O v=0-0, J=31-30 3396.307 88.270 4.39e-13 no13C16O v=0-0, J=32-31 3504.517 85.545 4.22e-13 no13C16O v=0-0, J=33-32 3612.599 82.985 4.11e-13 yes13C16O v=0-0, J=34-33 3720.548 80.578 3.97e-13 no13C16O v=0-0, J=35-34 3828.359 78.308 3.83e-13 no13C16O v=0-0, J=36-35 3936.033 76.166 3.72e-13 no13C16O v=0-0, J=37-36 4043.562 74.141 3.63e-13 yes13C16O v=0-0, J=38-37 4150.945 72.223 3.54e-13 yes13C16O v=0-0, J=39-38 4258.172 70.404 3.52e-13 no13C16O v=0-0, J=40-39 4365.246 68.677 3.35e-13 no13C16O v=0-0, J=41-40 4472.161 67.035 3.33e-13 no13C16O v=0-0, J=42-41 4578.908 65.472 3.11e-13 no13C16O v=0-0, J=43-42 4685.490 63.983 3.16e-13 no13C16O v=0-0, J=44-43 4791.901 62.562 3.03e-13 no28Si16O v=0-0, J=11-10 477.569 627.746 7.26e-14 no28Si16O v=0-0, J=12-11 520.740 575.705 9.52e-14 no28Si16O v=0-0, J=13-12 564.209 531.350 1.19e-13 no28Si16O v=0-0, J=14-13 607.679 493.340 1.41e-13 no28Si16O v=0-0, J=15-14 650.850 460.617 1.62e-13 no28Si16O v=0-0, J=16-15 694.319 431.779 1.81e-13 no28Si16O v=0-0, J=17-16 737.490 406.504 1.94e-13 no28Si16O v=0-0, J=18-17 780.959 383.877 2.11e-13 no28Si16O v=0-0, J=19-18 824.130 363.769 2.16e-13 no28Si16O v=0-0, J=20-19 867.600 345.542 2.29e-13 no28Si16O v=0-0, J=21-20 910.770 329.164 2.33e-13 no28Si16O v=0-0, J=22-21 953.940 314.268 2.46e-13 no28Si16O v=0-0, J=23-22 997.410 300.571 2.49e-13 no28Si16O v=0-0, J=24-23 1040.580 288.101 2.57e-13 no28Si16O v=0-0, J=25-24 1083.750 276.625 2.57e-13 no28Si16O v=0-0, J=26-25 1126.920 266.028 2.55e-13 no28Si16O v=0-0, J=27-26 1170.090 256.213 2.64e-13 no28Si16O v=0-0, J=28-27 1213.260 247.097 2.66e-13 yes28Si16O v=0-0, J=29-28 1256.430 238.606 2.60e-13 no28Si16O v=0-0, J=30-29 1299.601 230.680 2.66e-13 yes28Si16O v=0-0, J=31-30 1342.471 223.314 2.62e-13 no28Si16O v=0-0, J=32-31 1385.641 216.357 7.17e-14 yes28Si16O v=0-0, J=33-32 1428.811 209.820 2.73e-13 no28Si16O v=0-0, J=34-33 1471.681 203.707 9.86e-14 no28Si16O v=0-0, J=35-34 1514.852 197.902 2.75e-13 yes28Si16O v=0-0, J=36-35 1557.722 192.456 1.22e-13 no
L. Decin et al.: Silicon in the dust formation zone of IRC+10216 as observed with PACS and SPIRE on board Herschel, Online Material p 4
Table A.2. continued.
Molecule Transition Frequency Wavelength Integrated FluxBlend[GHz] [µm] [erg/cm2/s]
28Si16O v=0-0, J=37-36 1600.592 187.301 2.75e-13 yes28Si16O v=0-0, J=38-37 1643.762 182.382 2.70e-13 no28Si16O v=0-0, J=39-38 1686.633 177.746 2.73e-13 yes28Si16O v=0-0, J=40-39 1729.503 173.340 2.77e-13 no28Si16O v=0-0, J=41-40 1772.373 169.147 2.75e-13 no28Si16O v=0-0, J=42-41 1814.944 165.180 2.79e-13 no28Si16O v=0-0, J=43-42 1857.814 161.368 2.78e-13 yes28Si16O v=0-0, J=44-43 1900.684 157.729 2.77e-13 yes28Si16O v=0-0, J=45-44 1943.255 154.273 2.69e-13 no28Si16O v=0-0, J=46-45 1986.125 150.943 2.68e-13 no28Si16O v=0-0, J=47-46 2028.696 147.776 2.70e-13 no28Si16O v=0-0, J=48-47 2071.266 144.739 2.73e-13 yes28Si16O v=0-0, J=49-48 2113.837 141.824 2.64e-13 no28Si16O v=0-0, J=50-49 2156.408 139.024 2.69e-13 no28Si16O v=0-0, J=51-50 2198.978 136.333 2.60e-13 yes28Si16O v=0-0, J=52-51 2241.549 133.743 2.62e-13 no28Si16O v=0-0, J=53-52 2283.819 131.268 2.59e-13 yes28Si16O v=0-0, J=54-53 2326.390 128.866 2.48e-13 yes28Si16O v=0-0, J=55-54 2368.661 126.566 2.51e-13 yes28Si16O v=0-0, J=56-55 2410.931 124.347 2.48e-13 yes28Si16O v=0-0, J=57-56 2453.202 122.205 2.43e-13 no28Si16O v=0-0, J=58-57 2495.473 120.135 2.37e-13 yes28Si16O v=0-0, J=59-58 2537.744 118.133 2.27e-13 no28Si16O v=0-0, J=60-59 2580.014 116.198 2.27e-13 yes28Si16O v=0-0, J=61-60 2621.985 114.338 2.23e-13 yes28Si16O v=0-0, J=62-61 2664.256 112.524 2.17e-13 yes28Si16O v=0-0, J=63-62 2706.227 110.779 2.10e-13 no28Si16O v=0-0, J=64-63 2748.198 109.087 2.05e-13 yes28Si16O v=0-0, J=65-64 2790.169 107.446 2.01e-13 no28Si16O v=0-0, J=66-65 2832.140 105.854 1.94e-13 yes28Si16O v=0-0, J=67-66 2874.111 104.308 1.84e-13 yes28Si16O v=0-0, J=68-67 2915.782 102.817 1.80e-13 yes28Si16O v=0-0, J=72-71 3082.467 97.257 1.56e-13 no28Si16O v=0-0, J=73-72 3124.138 95.960 1.52e-13 yes28Si16O v=0-0, J=74-73 3165.809 94.697 1.46e-13 yes28Si16O v=0-0, J=75-74 3207.180 93.475 1.37e-13 yes28Si16O v=0-0, J=76-75 3248.552 92.285 1.34e-13 no28Si16O v=0-0, J=77-76 3289.923 91.124 1.28e-13 yes28Si16O v=0-0, J=78-77 3331.294 89.993 1.19e-13 yes28Si16O v=0-0, J=79-78 3372.666 88.889 1.17e-13 no28Si16O v=0-0, J=80-79 3413.737 87.819 1.13e-13 yes28Si16O v=0-0, J=81-80 3454.809 86.775 1.08e-13 yes28Si16O v=0-0, J=82-81 3496.180 85.749 1.03e-13 yes28Si16O v=0-0, J=83-82 3536.952 84.760 9.76e-14 yes28Si16O v=0-0, J=84-83 3578.024 83.787 9.20e-14 yes28Si16O v=0-0, J=85-84 3619.095 82.836 8.84e-14 yes28Si16O v=0-0, J=86-85 3659.867 81.913 8.23e-14 yes28Si16O v=0-0, J=87-86 3700.639 81.011 8.11e-14 yes28Si16O v=0-0, J=88-87 3741.410 80.128 7.74e-14 yes28Si16O v=0-0, J=89-88 3782.182 79.264 7.36e-14 yes28Si16O v=0-0, J=90-89 3822.654 78.425 7.13e-14 yes28Si16O v=1-1, J=39-38 1674.641 179.019 4.06e-14 yes28Si16O v=1-1, J=40-39 1717.211 174.581 4.28e-14 yes28Si16O v=1-1, J=41-40 1759.782 170.358 4.40e-14 yes28Si16O v=1-1, J=42-41 1802.353 166.334 4.74e-14 no28Si16O v=1-1, J=43-42 1844.923 162.496 4.88e-14 yes
L. Decin et al.: Silicon in the dust formation zone of IRC+10216 as observed with PACS and SPIRE on board Herschel, Online Material p 5
Table A.2. continued.
Molecule Transition Frequency Wavelength Integrated FluxBlend[GHz] [µm] [erg/cm2/s]
28Si16O v=1-1, J=44-43 1887.194 158.856 5.15e-14 yes28Si16O v=1-1, J=45-44 1929.764 155.352 5.28e-14 no28Si16O v=1-1, J=46-45 1972.035 152.022 5.48e-14 yes28Si16O v=1-1, J=47-46 2014.606 148.809 5.53e-14 yes28Si16O v=1-1, J=48-47 2056.876 145.751 5.64e-14 yes28Si16O v=1-1, J=49-48 2099.147 142.816 5.82e-14 no28Si32S v=0-0, J=26-25 471.608 635.682 1.29e-13 yes28Si32S v=0-0, J=27-26 489.713 612.180 1.45e-13 yes28Si32S v=0-0, J=28-27 507.813 590.360 1.47e-13 no28Si32S v=0-0, J=29-28 525.910 570.045 1.61e-13 no28Si32S v=0-0, J=30-29 544.003 551.087 1.61e-13 no28Si32S v=0-0, J=31-30 562.091 533.352 1.76e-13 no28Si32S v=0-0, J=32-31 580.175 516.728 1.74e-13 no28Si32S v=0-0, J=33-32 598.254 501.112 1.85e-13 no28Si32S v=0-0, J=34-33 616.328 486.417 1.84e-13 no28Si32S v=0-0, J=35-34 634.398 472.562 1.91e-13 no28Si32S v=0-0, J=36-35 652.463 459.478 1.93e-13 no28Si32S v=0-0, J=37-36 670.522 447.103 1.93e-13 no28Si32S v=0-0, J=38-37 688.576 435.380 1.98e-13 no28Si32S v=0-0, J=39-38 706.625 424.260 1.93e-13 yes28Si32S v=0-0, J=40-39 724.668 413.696 2.00e-13 no28Si32S v=0-0, J=41-40 742.705 403.649 2.00e-13 no28Si32S v=0-0, J=42-41 760.737 394.082 1.97e-13 no28Si32S v=0-0, J=43-42 778.762 384.960 2.03e-13 no28Si32S v=0-0, J=44-43 796.782 376.254 2.00e-13 yes28Si32S v=0-0, J=45-44 814.795 367.936 1.99e-13 no28Si32S v=0-0, J=46-45 832.801 359.981 2.04e-13 yes28Si32S v=0-0, J=47-46 850.801 352.365 2.02e-13 no28Si32S v=0-0, J=48-47 868.795 345.067 1.98e-13 no28Si32S v=0-0, J=49-48 886.781 338.068 2.04e-13 yes28Si32S v=0-0, J=50-49 904.760 331.350 2.05e-13 no28Si32S v=0-0, J=51-50 922.733 324.896 2.00e-13 yes28Si32S v=0-0, J=52-51 940.697 318.692 2.01e-13 no28Si32S v=0-0, J=53-52 958.655 312.722 2.06e-13 no28Si32S v=0-0, J=54-53 976.605 306.974 2.07e-13 yes28Si32S v=0-0, J=55-54 994.547 301.436 2.05e-13 no28Si32S v=0-0, J=56-55 1012.481 296.097 2.01e-13 no28Si32S v=0-0, J=57-56 1030.407 290.946 2.03e-13 no28Si32S v=0-0, J=58-57 1048.325 285.973 2.07e-13 no28Si32S v=0-0, J=59-58 1066.235 281.169 2.09e-13 yes28Si32S v=0-0, J=60-59 1084.136 276.527 2.09e-13 no28Si32S v=0-0, J=61-60 1102.029 272.037 2.09e-13 yes28Si32S v=0-0, J=62-61 1119.913 267.693 2.08e-13 yes28Si32S v=0-0, J=63-62 1137.788 263.487 2.07e-13 no28Si32S v=0-0, J=64-63 1155.654 259.414 2.06e-13 yes28Si32S v=0-0, J=65-64 1173.511 255.466 2.05e-13 yes28Si32S v=0-0, J=66-65 1191.358 251.639 2.04e-13 no28Si32S v=0-0, J=67-66 1209.196 247.927 2.04e-13 yes28Si32S v=0-0, J=68-67 1227.025 244.325 2.04e-13 no28Si32S v=0-0, J=69-68 1244.843 240.827 2.04e-13 yes28Si32S v=0-0, J=70-69 1262.652 237.431 2.05e-13 no28Si32S v=0-0, J=71-70 1280.451 234.130 2.05e-13 no28Si32S v=0-0, J=72-71 1298.240 230.922 2.06e-13 yes28Si32S v=0-0, J=73-72 1316.018 227.803 2.05e-13 no28Si32S v=0-0, J=74-73 1333.786 224.768 2.04e-13 yes28Si32S v=0-0, J=75-74 1351.543 221.815 2.00e-13 no28Si32S v=0-0, J=76-75 1369.290 218.940 4.81e-14 yes
L. Decin et al.: Silicon in the dust formation zone of IRC+10216 as observed with PACS and SPIRE on board Herschel, Online Material p 6
Table A.2. continued.
Molecule Transition Frequency Wavelength Integrated FluxBlend[GHz] [µm] [erg/cm2/s]
28Si32S v=0-0, J=77-76 1387.025 216.141 1.96e-13 yes28Si32S v=0-0, J=78-77 1404.750 213.413 5.78e-14 no28Si32S v=0-0, J=79-78 1422.463 210.756 1.97e-13 yes28Si32S v=0-0, J=80-79 1440.165 208.165 6.35e-14 no28Si32S v=0-0, J=81-80 1457.856 205.639 6.63e-14 no28Si32S v=0-0, J=82-81 1475.535 203.175 7.07e-14 no28Si32S v=0-0, J=83-82 1493.202 200.772 7.24e-14 yes28Si32S v=0-0, J=84-83 1510.858 198.425 1.83e-13 yes28Si32S v=0-0, J=85-84 1528.501 196.135 7.80e-14 no28Si32S v=0-0, J=86-85 1546.132 193.898 1.79e-13 no28Si32S v=0-0, J=87-86 1563.751 191.714 8.13e-14 no28Si32S v=0-0, J=88-87 1581.357 189.579 1.78e-13 yes28Si32S v=0-0, J=89-88 1598.951 187.493 1.71e-13 yes28Si32S v=0-0, J=90-89 1616.532 185.454 1.72e-13 no28Si32S v=0-0, J=91-90 1634.100 183.460 1.72e-13 no28Si32S v=0-0, J=92-91 1651.655 181.510 1.66e-13 yes28Si32S v=0-0, J=93-92 1669.197 179.603 1.65e-13 yes28Si32S v=0-0, J=94-93 1686.725 177.736 1.60e-13 yes28Si32S v=0-0, J=95-94 1704.240 175.910 1.60e-13 no28Si32S v=0-0, J=96-95 1721.742 174.122 1.55e-13 no28Si32S v=0-0, J=97-96 1739.229 172.371 1.55e-13 no28Si32S v=0-0, J=98-97 1756.703 170.656 1.53e-13 yes28Si32S v=0-0, J=99-98 1774.163 168.977 1.48e-13 yes28Si32S v=0-0, J=100-99 1791.608 167.331 1.44e-13 yes28Si32S v=0-0, J=101-100 1809.039 165.719 1.42e-13 yes28Si32S v=0-0, J=102-101 1826.456 164.139 1.41e-13 no28Si32S v=0-0, J=103-102 1843.858 162.590 1.36e-13 yes28Si32S v=0-0, J=104-103 1861.245 161.071 1.31e-13 no28Si32S v=0-0, J=105-104 1878.618 159.581 1.32e-13 no28Si32S v=0-0, J=106-105 1895.975 158.120 1.27e-13 yes28Si32S v=0-0, J=107-106 1913.318 156.687 1.26e-13 no28Si32S v=0-0, J=108-107 1930.644 155.281 1.19e-13 yes28Si32S v=0-0, J=109-108 1947.956 153.901 1.17e-13 yes28Si32S v=0-0, J=110-109 1965.251 152.547 1.13e-13 no28Si32S v=0-0, J=111-110 1982.531 151.217 1.15e-13 yes28Si32S v=0-0, J=112-111 1999.795 149.912 1.08e-13 yes28Si32S v=0-0, J=113-112 2017.043 148.630 1.06e-13 no28Si32S v=0-0, J=114-113 2034.275 147.371 1.03e-13 yes28Si32S v=0-0, J=115-114 2051.491 146.134 1.03e-13 no28Si32S v=0-0, J=116-115 2068.690 144.919 1.00e-13 yes28Si32S v=0-0, J=117-116 2085.872 143.725 9.45e-14 no28Si32S v=0-0, J=118-117 2103.037 142.552 9.44e-14 no28Si32S v=0-0, J=119-118 2120.186 141.399 9.06e-14 yes28Si32S v=0-0, J=120-119 2137.318 140.266 8.85e-14 yes28Si32S v=0-0, J=121-120 2154.432 139.151 8.56e-14 yes28Si32S v=0-0, J=122-121 2171.529 138.056 8.17e-14 no28Si32S v=0-0, J=123-122 2188.609 136.979 7.89e-14 yes28Si32S v=0-0, J=124-123 2205.671 135.919 7.78e-14 yes28Si32S v=1-1, J=50-49 900.341 332.977 3.26e-14 yes28Si32S v=1-1, J=51-50 918.224 326.491 3.48e-14 no28Si32S v=1-1, J=52-51 936.101 320.257 3.69e-14 no28Si32S v=1-1, J=53-52 953.970 314.258 3.89e-14 yes28Si32S v=1-1, J=54-53 971.831 308.482 4.08e-14 yes28Si32S v=1-1, J=55-54 989.685 302.917 4.28e-14 yes28Si32S v=1-1, J=56-55 1007.530 297.552 4.47e-14 no28Si32S v=1-1, J=57-56 1025.368 292.376 4.67e-14 yes28Si32S v=1-1, J=58-57 1043.197 287.378 4.86e-14 no

L. Decin et al.: Silicon in the dust formation zone of IRC+10216 as observed with PACS and SPIRE on board Herschel, Online Material p 7
Table A.2. continued.
Molecule Transition Frequency Wavelength Integrated FluxBlend[GHz] [µm] [erg/cm2/s]
28Si32S v=1-1, J=59-58 1061.018 282.552 5.03e-14 yes28Si32S v=1-1, J=60-59 1078.831 277.886 5.21e-14 yes28Si32S v=1-1, J=61-60 1096.635 273.375 5.37e-14 yes28Si32S v=1-1, J=62-61 1114.430 269.010 5.51e-14 yes28Si32S v=1-1, J=63-62 1132.217 264.784 5.61e-14 yes28Si32S v=1-1, J=64-63 1149.994 260.690 5.68e-14 yes28Si32S v=1-1, J=65-64 1167.763 256.724 5.84e-14 yes28Si32S v=1-1, J=66-65 1185.522 252.878 6.09e-14 yes28Si32S v=1-1, J=67-66 1203.271 249.148 6.29e-14 yes28Si32S v=1-1, J=68-67 1221.011 245.528 6.42e-14 yes28Si32S v=1-1, J=69-68 1238.741 242.014 6.46e-14 yes28Si32S v=1-1, J=70-69 1256.461 238.601 6.40e-14 yes28Si32S v=1-1, J=71-70 1274.171 235.284 6.70e-14 no28Si32S v=1-1, J=72-71 1291.871 232.061 6.87e-14 yes28Si32S v=1-1, J=73-72 1309.561 228.926 6.86e-14 yes28Si32S v=1-1, J=74-73 1327.240 225.877 6.86e-14 yes28Si32S v=1-1, J=75-74 1344.908 222.909 7.11e-14 yes28Si32S v=1-1, J=76-75 1362.566 220.021 1.68e-14 no28Si32S v=1-1, J=77-76 1380.213 217.207 1.84e-14 yes28Si32S v=1-1, J=78-77 1397.849 214.467 2.06e-14 yes28Si32S v=1-1, J=79-78 1415.473 211.797 2.16e-14 yes28Si32S v=1-1, J=80-79 1433.086 209.194 7.36e-14 yes28Si32S v=1-1, J=81-80 1450.688 206.655 2.50e-14 no28Si32S v=1-1, J=82-81 1468.278 204.180 2.65e-14 yes28Si32S v=1-1, J=83-82 1485.857 201.764 2.78e-14 yes28Si32S v=1-1, J=84-83 1503.423 199.407 2.93e-14 yes28Si32S v=1-1, J=85-84 1520.978 197.105 7.32e-14 yes28Si32S v=1-1, J=86-85 1538.520 194.858 3.18e-14 yes28Si32S v=1-1, J=87-86 1556.050 192.662 3.18e-14 no28Si32S v=1-1, J=88-87 1573.567 190.518 7.40e-14 no28Si32S v=1-1, J=89-88 1591.072 188.422 7.36e-14 yes28Si32S v=1-1, J=90-89 1608.564 186.373 7.34e-14 no28Si32S v=1-1, J=91-90 1626.043 184.369 7.26e-14 no28Si32S v=1-1, J=92-91 1643.509 182.410 7.13e-14 yes28Si32S v=1-1, J=93-92 1660.962 180.493 7.07e-14 yes28Si32S v=1-1, J=94-93 1678.402 178.618 7.18e-14 no28Si32S v=1-1, J=95-94 1695.828 176.782 6.93e-14 no28Si32S v=1-1, J=96-95 1713.240 174.986 6.97e-14 no28Si32S v=1-1, J=97-96 1730.639 173.226 6.67e-14 yes28Si32S v=1-1, J=98-97 1748.024 171.504 6.84e-14 no28Si32S v=1-1, J=99-98 1765.394 169.816 6.79e-14 yes28Si32S v=1-1, J=100-99 1782.751 168.163 6.66e-14 yes28Si32S v=1-1, J=101-100 1800.093 166.543 6.38e-14 no28Si32S v=1-1, J=102-101 1817.420 164.955 6.52e-14 no28Si32S v=1-1, J=103-102 1834.733 163.398 6.21e-14 no28Si32S v=1-1, J=104-103 1852.032 161.872 6.32e-14 yes28Si32S v=1-1, J=105-104 1869.315 160.376 6.08e-14 yes28Si32S v=1-1, J=106-105 1886.583 158.908 6.00e-14 yes28Si32S v=1-1, J=107-106 1903.836 157.468 6.00e-14 yes28Si32S v=1-1, J=108-107 1921.074 156.055 5.87e-14 yes28Si32S v=1-1, J=109-108 1938.296 154.668 5.77e-14 yes