Rainfall Measurement on Ship Revisited: The 1997 PACS TEPPS Cruise
16
JUNE 2001 1003 YUTER AND PARKER q 2001 American Meteorological Society Rainfall Measurement on Ship Revisited: The 1997 PACS TEPPS Cruise SANDRA E. YUTER AND WENDY S. PARKER Department of Atmospheric Sciences, University of Washington, Seattle, Washington (Manuscript received 22 December 1999, in final form 5 October 2000) ABSTRACT Fifteen rain measurement instruments were deployed on the National Oceanic and Atmospheric Administration Ship Ronald H. Brown during the 1997 Pan American Climate Studies (PACS) Tropical Eastern Pacific Process Study (TEPPS). To examine differences in rainfall catchment related to instrument design, three types of dis- drometers, an optical rain gauge, a ship rain gauge, and a siphon gauge were clustered in one location to ensure similar exposure. To address exposure effects, eight siphon rain gauges were deployed on different sides of the ship and on several different levels. Cross-ship differences in hourly rainfall accumulation were negligible when relative wind speeds were less than 3 m s 21 and became significant at greater than 5 m s 21 , especially when the relative wind direction was 208 or greater from the bow. Instruments with both horizontal and vertical catchment surfaces yielded a measurable collection advantage over instruments with only horizontal catchment surfaces. Analysis of data collected during TEPPS using a multiple-instrument, multiple-location approach yields the following recommendations for reducing uncertainty in rain measurement at sea. The first two of the four recommendations apply to rain measurements on buoys as well as on ships. 1) Deploy experimental rain mea- surement instrumentation paired with a baseline minimum siphon gauge or other trusted instrument. Comparison of the rain-rate time series between the baseline gauge measurements and the experimental instrument data permits detection of erratic behavior and bias. 2) Apply an appropriate wind correction. To do this step properly, both a wind correction formula derived for the specific gauge type and a nearby measurement of relative wind are needed. These features are already incorporated into the ship rain gauge. 3) Locate gauges where distortion of the airflow by the ship is locally minimized and relative wind speeds are as low as possible. This analysis confirms previous recommendations for placement of rain instrumentation at lower locations as long as the location is protected against direct spray from the sea without being shadowed by higher objects. 4) Place instrumentation on both sides of ship and along centerline. Airflow distortion by the ship itself can induce significant differences between port and starboard accumulations at high wind speeds and high angle of wind attack to the bow. Multiple locations aid in constraining error, because relative wind direction and speed vary during a cruise and there is no one perfect location on ship for rain instrumentation. 1. Introduction Ocean-going ships provide an important platform for collection of surface rainfall data over the open ocean where such measurements are otherwise scarce. Mini- mization of uncertainties in ship-based rain measure- ments is important for global precipitation datasets used in modeling and validation of satellite-derived precip- itation. The goal of the ship-based rain measurement is to estimate the precipitation falling at the ocean surface. However, several factors contribute to differences be- tween the ship-based rain measurement and a theoretical measurement at the sea surface (Roll 1958): R disturbance of the ambient air currents by the ship; R disturbance of the ambient air currents by the instru- ment; Corresponding author address: Prof. Sandra E. Yuter, Dept. of Atmospheric Sciences, University of Washington, Box 351640, Se- attle, WA 98195-1640. E-mail: [email protected] R movement of the instrument from pitch, roll, and vi- bration of the ship; and R intrusion of sea spray. When an object sitting above the surface interacts with the ambient airflow, the airflow deviates around the object, yielding a pattern of turbulence and accel- erated and decelerated flow (Oke 1987). The divergence of the flow acts to divert smaller (lighter) rain drops away from the object’s top, which decreases the rain falling on the object in comparison with what it would be at the surface if the object were not present (Robinson and Rodda 1969; Allerup and Madsen 1980; Sevruk 1982; Folland 1988; Nes ˘por and Sevruk 1999). Addi- tionally, the portion of the airflow that is directed up- ward on the windward side of the object may have an upward velocity of sufficient magnitude to exceed the terminal velocity of the smaller drops (Robinson and Rodda 1969; Folland 1988). Distortion of the airflow occurs both at the scale of the ship and the scale of the instrument (Austin and Geotis 1980; Hasse et al. 1998).
Transcript of Rainfall Measurement on Ship Revisited: The 1997 PACS TEPPS Cruise

JUNE 2001 1003Y U T E R A N D P A R K E R
q 2001 American Meteorological Society
Rainfall Measurement on Ship Revisited: The 1997 PACS TEPPS Cruise
SANDRA E. YUTER AND WENDY S. PARKER
Department of Atmospheric Sciences, University of Washington, Seattle, Washington
(Manuscript received 22 December 1999, in final form 5 October 2000)
ABSTRACT
Fifteen rain measurement instruments were deployed on the National Oceanic and Atmospheric AdministrationShip Ronald H. Brown during the 1997 Pan American Climate Studies (PACS) Tropical Eastern Pacific ProcessStudy (TEPPS). To examine differences in rainfall catchment related to instrument design, three types of dis-drometers, an optical rain gauge, a ship rain gauge, and a siphon gauge were clustered in one location to ensuresimilar exposure. To address exposure effects, eight siphon rain gauges were deployed on different sides of theship and on several different levels.
Cross-ship differences in hourly rainfall accumulation were negligible when relative wind speeds were lessthan 3 m s21 and became significant at greater than 5 m s21, especially when the relative wind direction was208 or greater from the bow. Instruments with both horizontal and vertical catchment surfaces yielded a measurablecollection advantage over instruments with only horizontal catchment surfaces.
Analysis of data collected during TEPPS using a multiple-instrument, multiple-location approach yields thefollowing recommendations for reducing uncertainty in rain measurement at sea. The first two of the fourrecommendations apply to rain measurements on buoys as well as on ships. 1) Deploy experimental rain mea-surement instrumentation paired with a baseline minimum siphon gauge or other trusted instrument. Comparisonof the rain-rate time series between the baseline gauge measurements and the experimental instrument datapermits detection of erratic behavior and bias. 2) Apply an appropriate wind correction. To do this step properly,both a wind correction formula derived for the specific gauge type and a nearby measurement of relative windare needed. These features are already incorporated into the ship rain gauge. 3) Locate gauges where distortionof the airflow by the ship is locally minimized and relative wind speeds are as low as possible. This analysisconfirms previous recommendations for placement of rain instrumentation at lower locations as long as thelocation is protected against direct spray from the sea without being shadowed by higher objects. 4) Placeinstrumentation on both sides of ship and along centerline. Airflow distortion by the ship itself can inducesignificant differences between port and starboard accumulations at high wind speeds and high angle of windattack to the bow. Multiple locations aid in constraining error, because relative wind direction and speed varyduring a cruise and there is no one perfect location on ship for rain instrumentation.
1. Introduction
Ocean-going ships provide an important platform forcollection of surface rainfall data over the open oceanwhere such measurements are otherwise scarce. Mini-mization of uncertainties in ship-based rain measure-ments is important for global precipitation datasets usedin modeling and validation of satellite-derived precip-itation. The goal of the ship-based rain measurement isto estimate the precipitation falling at the ocean surface.However, several factors contribute to differences be-tween the ship-based rain measurement and a theoreticalmeasurement at the sea surface (Roll 1958):
R disturbance of the ambient air currents by the ship;R disturbance of the ambient air currents by the instru-
ment;
Corresponding author address: Prof. Sandra E. Yuter, Dept. ofAtmospheric Sciences, University of Washington, Box 351640, Se-attle, WA 98195-1640.E-mail: [email protected]
R movement of the instrument from pitch, roll, and vi-bration of the ship; and
R intrusion of sea spray.
When an object sitting above the surface interactswith the ambient airflow, the airflow deviates aroundthe object, yielding a pattern of turbulence and accel-erated and decelerated flow (Oke 1987). The divergenceof the flow acts to divert smaller (lighter) rain dropsaway from the object’s top, which decreases the rainfalling on the object in comparison with what it wouldbe at the surface if the object were not present (Robinsonand Rodda 1969; Allerup and Madsen 1980; Sevruk1982; Folland 1988; Nespor and Sevruk 1999). Addi-tionally, the portion of the airflow that is directed up-ward on the windward side of the object may have anupward velocity of sufficient magnitude to exceed theterminal velocity of the smaller drops (Robinson andRodda 1969; Folland 1988). Distortion of the airflowoccurs both at the scale of the ship and the scale of theinstrument (Austin and Geotis 1980; Hasse et al. 1998).

1004 VOLUME 40J O U R N A L O F A P P L I E D M E T E O R O L O G Y
FIG. 1. Ship track of the Brown during the TEPPS cruise. Solidtrack indicates ITCZ portion of track where data were collected forthis study. During the stratocumulus portion of the TEPPS cruise(dashed track), drizzle falling on ship was too light to be measuredby the rain instrumentation onboard. Gray track indicates transitswhen data were not collected. [From Yuter and Houze (2000)].
The combined effects of the airflow divergence on rain-drop trajectories at both the ship and instrument scalesyields a net decrease in rain catch for gauges on shipas compared with those at the sea surface (Skaar 1955).The percentage reduction in rain catch increases withboth increasing wind speed and increasing fraction ofsmall drops (e.g., decreasing rain rate) and varies amongdifferent gauges (Jevons 1861; Symons 1864; Sevruk1982; Groisman and Legates 1994; Strangeways 1996;Folland 1988; Nespor and Sevruk 1999) and ship ge-ometries (Hasse et al. 1998).
Roll (1958) found an average 28.1% difference inmonthly rain catch between gauges on a stationary shipand on a nearby island. In their analysis of data fromsix rain gauges mounted in several locations on the R/VGillis during the Global Atmospheric Research ProgramAtlantic Tropical Experiment (GATE; Kuettner et al.1974), Austin and Geotis (1980) showed that the amountof rain measured on ship is dependent upon the locationand exposure of the measuring instrument and tends todecrease with increasing height. Previously, Skaar’s(1955) multiple gauge deployment on a Norwegianweather ship had yielded similar results and had alsoshowed that mounting a gauge on gimbals to keep itparallel to the sea surface was not important.
The Pan American Climate Studies (PACS) TropicalEastern Pacific Process Study (TEPPS) cruise on theNational Oceanic and Atmospheric Administration(NOAA) Ship Ronald H. Brown from 28 July to 6 Sep-tember 1997 had as its main focus the collection ofsurface-based C-band radar measurements to documentthe three-dimensional structure of precipitation in theeastern Pacific ITCZ where a large discrepancy betweensatellite passive microwave and infrared precipitationestimates exists (Yuter and Houze 2000). As a piggy-back experiment, the location of the ship within theITCZ provided the opportunity to examine the field per-formance of several new rain gauge types and both toconfirm and to amplify upon the body of work sur-rounding shipboard measurements of rainfall.
With the assumption that a gauge is calibrated ac-curately to measure the rainfall it catches, wind effectsconstitute the main source of rain measurement error onships (Skaar 1955; Sevruk 1982). In this paper, we ex-amine variation in rain catch for different instrumentswith the same exposure (design-related differences) andfor identical instruments with different exposures to ad-dress methods of reducing wind-related uncertainty inrainfall measurement on ship.
2. The measurements
The ship track for the Brown during the TEPPS cruiseis shown in Fig. 1. Data used in this study were collectedfrom 1 to 28 August 1997 within the eastern PacificITCZ on the leg from the Panama Canal to San Diego.Rainfall measurements were obtained for 7 days while
the ship was under way1 and for 11 days while nearlystationary (on station) at 7.88N, 1258W from 0345 UTC8 August to 2120 UTC 23 August 1997 under a rangeof wind conditions (Table 1).
Fifteen rain measurement instruments were aboardship during PACS TEPPS: a Joss–Waldvogel disdro-meter, two piezoelectric disdrometers provided by theNational Aeronautics and Space Administration(NASA) Tropical Rainfall Measuring Mission (TRMM)Office, an Institute fur Meereskunde (IfM) optical dis-drometer, an IfM ship rain gauge, two Scientific Tech-nology, Inc., (STI) optical rain gauges, and eight R. M.Young Company siphon gauges (Table 2, Fig. 2). In-strument performance and the variation of collectionefficiency as a function of instrument type in open-seaconditions was studied by clustering three types of raingauges and three types of disdrometers in one locationon the forward port side of the 03 level (designated asthe 03P gauge cluster). To address exposure effects, theeight siphon gauges were distributed over the ship in amanner similar to that used in GATE (Fig. 2). Inde-pendent wind speed measurements were made with the‘‘Improved Meteorology’’ (IMET) system anemometer(Hosom et al. 1995) on a dedicated mast at the bow andwith an IfM-provided anemometer at the 03P gaugecluster (Table 1, Yuter and Houze 2000). Both IfM in-struments utilized data from the anemometer at 03P toadjust measured rain rate for wind-related effects. Amore detailed description of each type of instrument ispresented below.
1 On 3 August 1999, the siphon gauges measured trace amounts;thus, the siphon gauges are considered to have only 6 rain days whileunder way.
JUNE 2001 1005Y U T E R A N D P A R K E R
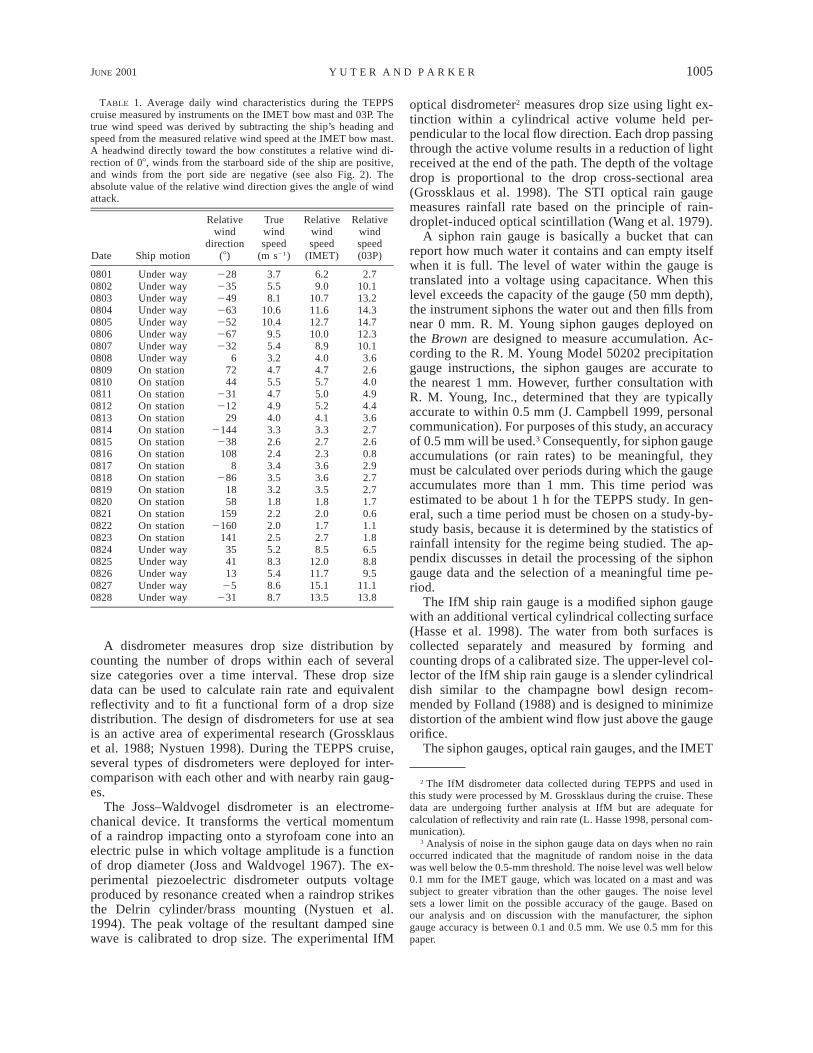
TABLE 1. Average daily wind characteristics during the TEPPScruise measured by instruments on the IMET bow mast and 03P. Thetrue wind speed was derived by subtracting the ship’s heading andspeed from the measured relative wind speed at the IMET bow mast.A headwind directly toward the bow constitutes a relative wind di-rection of 08, winds from the starboard side of the ship are positive,and winds from the port side are negative (see also Fig. 2). Theabsolute value of the relative wind direction gives the angle of windattack.
Date Ship motion
Relativewind
direction(8)
Truewindspeed
(m s21)
Relativewindspeed
(IMET)
Relativewindspeed(03P)
0801080208030804080508060807080808090810081108120813
Under wayUnder wayUnder wayUnder wayUnder wayUnder wayUnder wayUnder wayOn stationOn stationOn stationOn stationOn station
228235249263252267232
67244
231212
29
3.75.58.1
10.610.4
9.55.43.24.75.54.74.94.0
6.29.0
10.711.612.710.0
8.94.04.75.75.05.24.1
2.710.113.214.314.712.310.1
3.62.64.04.94.43.6
081408150816081708180819082008210822082308240825082608270828
On stationOn stationOn stationOn stationOn stationOn stationOn stationOn stationOn stationOn stationUnder wayUnder wayUnder wayUnder wayUnder way
2144238108
8286
1858
1592160
141354113
25231
3.32.62.43.43.53.21.82.22.02.55.28.35.48.68.7
3.32.72.33.63.63.51.82.01.72.78.5
12.011.715.113.5
2.72.60.82.92.72.71.70.61.11.86.58.89.5
11.113.8
A disdrometer measures drop size distribution bycounting the number of drops within each of severalsize categories over a time interval. These drop sizedata can be used to calculate rain rate and equivalentreflectivity and to fit a functional form of a drop sizedistribution. The design of disdrometers for use at seais an active area of experimental research (Grossklauset al. 1988; Nystuen 1998). During the TEPPS cruise,several types of disdrometers were deployed for inter-comparison with each other and with nearby rain gaug-es.
The Joss–Waldvogel disdrometer is an electrome-chanical device. It transforms the vertical momentumof a raindrop impacting onto a styrofoam cone into anelectric pulse in which voltage amplitude is a functionof drop diameter (Joss and Waldvogel 1967). The ex-perimental piezoelectric disdrometer outputs voltageproduced by resonance created when a raindrop strikesthe Delrin cylinder/brass mounting (Nystuen et al.1994). The peak voltage of the resultant damped sinewave is calibrated to drop size. The experimental IfM
optical disdrometer2 measures drop size using light ex-tinction within a cylindrical active volume held per-pendicular to the local flow direction. Each drop passingthrough the active volume results in a reduction of lightreceived at the end of the path. The depth of the voltagedrop is proportional to the drop cross-sectional area(Grossklaus et al. 1998). The STI optical rain gaugemeasures rainfall rate based on the principle of rain-droplet-induced optical scintillation (Wang et al. 1979).
A siphon rain gauge is basically a bucket that canreport how much water it contains and can empty itselfwhen it is full. The level of water within the gauge istranslated into a voltage using capacitance. When thislevel exceeds the capacity of the gauge (50 mm depth),the instrument siphons the water out and then fills fromnear 0 mm. R. M. Young siphon gauges deployed onthe Brown are designed to measure accumulation. Ac-cording to the R. M. Young Model 50202 precipitationgauge instructions, the siphon gauges are accurate tothe nearest 1 mm. However, further consultation withR. M. Young, Inc., determined that they are typicallyaccurate to within 0.5 mm (J. Campbell 1999, personalcommunication). For purposes of this study, an accuracyof 0.5 mm will be used.3 Consequently, for siphon gaugeaccumulations (or rain rates) to be meaningful, theymust be calculated over periods during which the gaugeaccumulates more than 1 mm. This time period wasestimated to be about 1 h for the TEPPS study. In gen-eral, such a time period must be chosen on a study-by-study basis, because it is determined by the statistics ofrainfall intensity for the regime being studied. The ap-pendix discusses in detail the processing of the siphongauge data and the selection of a meaningful time pe-riod.
The IfM ship rain gauge is a modified siphon gaugewith an additional vertical cylindrical collecting surface(Hasse et al. 1998). The water from both surfaces iscollected separately and measured by forming andcounting drops of a calibrated size. The upper-level col-lector of the IfM ship rain gauge is a slender cylindricaldish similar to the champagne bowl design recom-mended by Folland (1988) and is designed to minimizedistortion of the ambient wind flow just above the gaugeorifice.
The siphon gauges, optical rain gauges, and the IMET
2 The IfM disdrometer data collected during TEPPS and used inthis study were processed by M. Grossklaus during the cruise. Thesedata are undergoing further analysis at IfM but are adequate forcalculation of reflectivity and rain rate (L. Hasse 1998, personal com-munication).
3 Analysis of noise in the siphon gauge data on days when no rainoccurred indicated that the magnitude of random noise in the datawas well below the 0.5-mm threshold. The noise level was well below0.1 mm for the IMET gauge, which was located on a mast and wassubject to greater vibration than the other gauges. The noise levelsets a lower limit on the possible accuracy of the gauge. Based onour analysis and on discussion with the manufacturer, the siphongauge accuracy is between 0.1 and 0.5 mm. We use 0.5 mm for thispaper.

1006 VOLUME 40J O U R N A L O F A P P L I E D M E T E O R O L O G Y
TABLE 2. Basic characteristics of rain instrumentation on the Brown during the 1997 PACS TEPPS cruise. Both the IfM ship rain gaugeand IfM optical disdrometer incorporate data from a collocated anemometer to correct rain rate for instrument-induced wind effects.
Instrument TypeCollecting
surface Method Location
Heightabove
waterline(m)
Scientific Technology, Inc., opti-cal rain gauge Model ORG-115-DA (2)
Rain rate Volume orientedperpendicular todirection mounted
Optical scintillation Forward 03 PortWinch house top
12.5713.05
IfM ship rain gauge Rain rate Horizontal and verti-cal
Drop forming andcounting
Forward 03 port 12.17
Joss–Waldvogel disdrometer Raindrop distribu-tion
Horizontal Electromechanical Top of van on 02port
11.84
NASA piezoelectric distrometers(2)
Raindrop distribu-tion
Horizontal Piezoelectric reso-nance
Top of van on 02port
11.79
IfM optical disdrometer Raindrop distribu-tion
Volume orientedperpendicular towind direction
Light extinction 03 Port 12.95
R. M. Young self-siphoning raingauge Model 50202 (7)
Rain accumulation Horizontal Capacitance 02 starboard02 port03 starboard03 port05 starboard05 portWinch house top
10.3110.3112.8312.8317.7317.7313.31
Woods Hole Oceanographic In-stitute–modified R. M. Youngself-siphoning rain gaugeModel 50202
Rain accumulation Horizontal Capacitance IMET mast on bow 13.99
anemometer used the same data logger as the other sur-face meteorological sensors on ship and were logged at10-s intervals. The data from the disdrometers, the IfMship rain gauge, and the 03P anemometer were loggedseparately at 1-min intervals. The rain instrumentationwas calibrated according to manufacturer specificationsprior to and, when applicable, during the cruise.
3. Uncertainty associated with intrusion of seaspray
Sea spray is a source of error in ship measurementsof rainfall and generally decreases with increasingheight of the gauge above the water line (Roll 1958).Quantification of the error requires measurement of theportion of sea spray in the total rain catch, which canbe difficult in practice. Skaar (1955) used salinity mea-surements of the water collected by his gauges to es-timate the contribution of sea spray to total rain catch.Roll (1958) criticized this method on the grounds thatit will not distinguish actual sea spray from rain thatcontains dissolved dry salt previously encrusted on theinstrument. Verploegh (1957) asserted that sea spray canbe neglected when the gauge is located at least 16 mabove the water line.
The rain gauges onboard the Brown were positionedbetween 10.31 and 17.73 m above sea level (Table 2).Using a detailed log of rain events during the TEPPScruise (M. Grossklaus 1997, personal communication),we were able to distinguish time periods when any liquidcollected by the gauges was sea spray from those when
the gauges collected rain. Over the course of eight non-raining days during both the ITCZ and stratocumuluslegs of the cruise (Fig. 1), only two days yielded mea-surable liquid in any of the gauges. On 27 August 1997,the 02P siphon gauge recorded 3.11 mm, the 02S siphongauge recorded 1.65 mm, and the IfM ship rain gaugerecorded 0.5 mm. On 28 August 1997, the 02P siphongauge recorded 1.08 mm. These days also experiencedsome of the largest relative wind speeds recorded duringthe cruise, 15.1 m s21 for 27 August and 13.5 m s21
for 28 August (Table 1). Because for most of the cruiseboth relative and true wind speeds were lower, we willassume that the by-catch of sea spray on days with rainwas negligible.
4. Assessment of rain instrument performance
The Joss–Waldvogel disdrometer, two piezoelectricdisdrometers, the IfM optical disdrometer and ship raingauge, an STI optical rain gauge, and a siphon gaugewere installed on the 03 level port-side area (Fig. 3),close enough to have similar exposure but far enoughapart to minimize blockage of one instrument by an-other. Because a siphon gauge will not catch horizon-tally windblown rain, a calibrated siphon gauge cannotoverestimate rain catch. The siphon gauge data thusprovided a lower limit baseline with which to comparethe accumulations reported by the other instruments inthe cluster. When assessing the instruments clustered onthe 03 level on the port side of the ship, accumulationsless than the 03P siphon gauge accumulation were taken

JUNE 2001 1007Y U T E R A N D P A R K E R
FIG. 2. Positioning of rainfall instrumentation on the Brown for PACS TEPPS. (a) Top view and (b) side view. Ship relativewind directions are indicated in (a). [Adapted from Yuter and Houze (2000)].
to indicate either undersensitivity or undercatch.4 Over-sensitivity also was determined by comparison; if aninstrument accumulation was several times larger thanthe accumulations measured by most of the other col-located instruments, then this significant discrepancywas taken to indicate oversensitivity. Table 3 shows thetotal precipitation accumulations measured by the in-struments in the 03P cluster.
The piezoelectric disdrometer data provide good ex-amples of oversensitivity and undersensitivity. The 03Pcluster included two experimental piezoelectric disdro-
4 Other instruments with vertical or volumetric catchment may ac-curately accumulate more precipitation than a collocated siphongauge.
meter units, w8 and w20. These disdrometers workederratically and appeared to have suffered a manufac-turing problem in the setting of the threshold belowwhich vibrations are not counted as rain (J. Nystuen1997, personal communication). Unfortunately, the in-strument design precluded user adjustment of instrumentsensitivity. Piezoelectric disdrometer w20, the replace-ment for another piezoelectric disdrometer sent backwith other systematic problems, was oversensitive andnearly always reported rainfall, even when tested in-doors. When it was raining, the vibrations caused bythe drops were sometimes interpreted by w20 as rainrates of several hundred millimeters per hour, resultingin exorbitant accumulations. In addition, there is someevidence that high wind gusts may have triggered w20

1008 VOLUME 40J O U R N A L O F A P P L I E D M E T E O R O L O G Y
FIG. 3. Cluster of rain instrumentation on 03 port level during PACS TEPPS. (a) Instruments mounted on 03 level port-side railing. Fromleft to right are the STI optical rain gauge, R. M. Young siphon gauge, IfM anemometer, IfM optical disdrometer, and IfM ship rain gauge.The IMET mast on the bow is visible on the middle far right edge of the picture. (b) The disdrometers were placed just to the right andforward of the instruments in (a) on top of the 02 level port inboard van and mounted in foam-lined plastic housings. From left to rightare the piezoelectric disdrometer w8, the Joss–Waldvogel disdrometer, and the piezoelectric disdrometer w20.
TABLE 3. Daily rainfall accumulation (mm) reported by the instruments in the 03P cluster. The STI optical rain gauge located on the winchhouse is also included in the table. Abbreviations: IfM ship rain gauge (SR), IfM optical disdrometer (OD), piezoelectric disdrometer w8(w8), piezoelectric disdrometer w20 (w20), STI optical rain gauge on 03P (ORG-3), siphon gauge (Siphon), Joss–Waldvogel disdrometer(JW), and STI optical rain gauge on winch house (ORG-T). Date is month and day in 1997.
Date SR OD w8 w20 ORG-3 Siphon JW ORG-T
0801080208030804080508060807080808090810081108120813081408150816
6.80.00.0
14.644.9
7.20.01.7
12.055.711.7
5.55.60.6
43.30.0
13.50.00.1
20.656.0
9.80.02.4
12.967.520.2
5.87.21.3
54.30.0
0.70.00.16.1
38.010.5
0.00.51.15.92.12.50.70.05.80.0
38.90.0
19.359.2
206.941.3
0.09.6
42.6265.4
77.353.823.625.9
212.70.0
4.50.00.1
19.086.917.6
0.02.09.3
41.58.64.54.60.6
37.80.0
2.50.00.01.5
20.03.50.01.08.0
40.58.04.04.0Tr
34.00.0
1.80.00.03.6
18.12.90.01.07.8
47.513.1
5.84.30.7
39.20.0
7.40.00.3
62.2131.6
30.80.01.89.2
45.99.85.04.30.8
33.70.0
08170818081908200821082208230824082508260827Totals
0.022.1
1.20.00.00.0
15.458.217.0
0.00.0
323.5
0.023.9
2.30.00.00.0
18.086.626.5
0.00.0
428.9
0.03.80.10.00.00.00.9
32.914.3
0.00.0
126.0
0.088.011.90.00.00.0
74.1237.2104.2
0.00.0
1591.9
0.014.9
0.90.00.00.0
10.752.016.7
0.00.0
332.2
0.015.0
Tr0.00.00.0
12.544.512.5
0.00.0
211.5
0.013.1
1.10.00.00.0
12.921.1
4.90.00.0
198.9
0.013.0
0.70.00.00.09.6
61.625.6
0.00.0
453.3
when it was not raining (e.g., on 6 August, B. E. Furness1997, personal communication). Over the 1–27 August1997 TEPPS period, disdrometer w20 accumulated1592 mm of rain (Table 3), while the other 14 raincollection instruments on the Brown accumulated lessthan 450 mm (Fig. 4a). For this reason, piezoelectric
disdrometer w20 was excluded in Fig. 4a and from theanalysis that follows. Piezoelectric disdrometer w8, po-sitioned approximately 1 m away from w20, was gen-erally undersensitive, measuring less rainfall than theother instruments. Figure 4a shows that, as a whole, w8accumulated less than each of the other rain collection

JUNE 2001 1009Y U T E R A N D P A R K E R
FIG. 4. Precipitation accumulations for 1–27 Aug 1997 reported by the rainfall instruments onthe Brown. (a) Total accumulations for the 03P cluster instruments. (b) Total accumulations forthe siphon gauges.
TABLE 4. Accumulations reported by instruments in the 03P clusterduring heavy rain between 0440 and 0540 UTC 6 Aug 1997. Duringthis hour, the ship was under way, and the average wind speed mea-sured by the collocated IfM anemometer was 11.5 m s21.
InstrumentAccumulation
(mm)
R. M. Young siphon gaugeSTI optical rain gaugeJoss–Waldvogel disdrometerIfM ship rain gaugeIfM optical disdrometerPiezoelectric disdrometer w8Piezoelectric disdrometer w20
3.024.0
1.32.64.07.9
21.8
instruments on the Brown. Problems with the sensitivityof these disdrometers were detected prior to the cruiseand reported to the instrument supplier. The scheduledship sailing made it necessary to proceed with the par-ticular instruments on ship.
The Joss–Waldvogel disdrometer has been used ex-tensively on land, and an earlier model was used at seaduring GATE. Similar to the findings during GATE(Austin and Geotis 1979), during TEPPS the Joss–Wald-vogel disdrometer tended to underestimate rainfall. Theunderestimation was systematic while under way, whenrelative wind speeds were higher. For example, whenthe ship was under way on 6 August 1997, the hourlyaccumulations reported by the Joss–Waldvogel disdro-meter were significantly smaller than those reported bythe other collocated instruments, including the IfM in-struments (Table 4). When the ship was on station (when
relative wind speeds were generally lower), the Joss–Waldvogel disdrometer still tended to be among the in-struments that measured the least accumulated precip-itation. In contrast to the piezoelectric disdrometer w20for which vibrations lead to an overestimate of rainfall,ship-induced vibrations increased the noise threshold ofthe Joss–Waldvogel disdrometer, suppressing measure-ment of smaller drops (Joss and Gori 1976; Austin andGeotis 1979). Efforts were made to dampen vibrationsusing upholstery foam, however, neither the piezoelec-tric nor Joss–Waldvogel disdrometers could be entirelyisolated from them.
Both while under way and while on station, the STIoptical rain gauge sporadically recorded much higherrain rates than the other collocated instruments. For ex-ample, between 0515 and 0525 UTC on 6 August 1997,the STI gauge reported rain rates nearly an order ofmagnitude larger than those reported by the other in-struments in the 03P instrument cluster (Fig. 5).5 Theresulting accumulations for the period shown in Fig. 5are given in Table 4. Coincidentally, the STI gauge re-ported a similar hourly accumulation for the time periodin Fig. 5 to that of the malfunctioning piezoelectric dis-drometer w20. However, over the cruise as a whole, theSTI optical rain gauge reported 332.2 mm of rain (Fig.4, Table 3), a value similar to that reported by the IfM
5 The 03P siphon gauge rain rates are included in the plot forqualitative comparison. However, 1 min is too short of a time periodover which to calculate accurate rain rates from the siphon gaugesunless the rain rates are 60 mm h21 (i.e., 1 mm min21) or higher.

1010 VOLUME 40J O U R N A L O F A P P L I E D M E T E O R O L O G Y
FIG. 5. Example 1-min rain-rate time series for a 1-h period during a heavy rain event on 6Aug 1997 for rain measurement instruments clustered near 03 level port side: IfM optical dis-drometer (OD), IfM ship rain gauge (SRG), STI optical rain gauge (ORG), siphon gauge (Siphon),Joss–Waldvogel disdrometer (JW), and piezoelectric disdrometer w8 (w8). Table 4 contains ac-cumulation values for each instrument for the 1-h period shown.
ship rain gauge. A comparison of accumulations onlymay not reveal many types of erratic behavior in raininstrumentation. A time series of rain rate at a few-minute interval (e.g., Fig. 5) is a powerful diagnostictool in assessing instrument performance.
The reasons for the occasional, unrealistic rain ratesreported by the STI optical rain gauge remain underinvestigation. The volumetric collection surface of theSTI gauge probably contributed to its reporting a rel-atively larger amount of precipitation in comparisonwith the instruments with horizontal-only catchment.However, because it is difficult to correct for the spu-riously high STI rain rates, it is also difficult to deter-mine to what extent its accumulation resulted from theeffects of design (volumetric collection). Consequently,for purposes of determining the amount of precipitationthat actually fell on the Brown during the TEPPS study,we choose to exclude the STI optical rain gauges fromour consideration.6
The IfM optical disdrometer and ship rain gauge per-formed consistently throughout the cruise. Their rainfall
6 There were two STI optical rain gauges on the Brown. The secondgauge, located on top of the winch house near the stern of the ship,also occasionally reported unrealistically high rain rates in compar-ison with the nearby siphon gauge. The total accumulation reportedby the winch house STI optical rain gauge over the 1–27 AugustTEPPS period is included in the rightmost column of Table 3. Aswith the 03P STI gauge, the total accumulation it reported is muchlarger than that reported by the collocated winch-house siphon gauge.Because the second STI gauge sporadically reported unrealisticallyhigh rain rates, it is not considered to be a reliable estimate of theactual amount of precipitation. It is mentioned here only because itwill not be discussed in later sections of the paper.
estimates did not indicate large over- or undersensitivityrelative to the other collocated instruments. The pro-cessing of the IfM instrument data included correctionsfor wind effects. It is therefore expected that the IfMdata would indicate more precipitation than reported bythe other collocated instruments, which did not incor-porate wind adjustments. Examination of the time seriesof rain rates from the IfM instruments showed that theytended to agree at lower rain rates but often differed athigher rain rates, with the optical disdrometer usuallyreporting larger values. The IfM optical disdrometer onaverage reported 138% of the rain rate reported by theIfM ship rain gauge when the optical distrometer rainrates were .15 mm h21. The ;100 mm difference be-tween IfM ship rain gauge (323.5 mm) and the IfMoptical disdrometer (428.9 mm) total accumulations inTable 3 is primarily due to the accumulated differencesduring heavy rainfall periods. Under higher rain-rateconditions, the optical disdrometer was susceptible tosplashing, which could have degraded the functioningof its optics.
The IfM ship rain gauge data were corrected for windeffects using a relatively simple algorithm (Hasse et al.1998), making it possible to remove the wind correc-tions for the purpose of separating the relative contri-butions of design and wind-correction effects to collec-tion efficiency. Daily IfM ship rain gauge uncorrectedand wind-corrected accumulations are given in Table 5,along with the daily accumulations reported by the col-located 03P siphon gauge and the average daily relativewind speed reported by the collocated 03P anemometer.Over the period as a whole, the wind-corrected data

JUNE 2001 1011Y U T E R A N D P A R K E R
TABLE 5. Accumulations for the 03P siphon gauge and the IfMship rain gauge with and without wind corrections. Average relativewind speeds for each day as measured by the collocated IfM ane-mometer are given. Asterisks indicate days during which the averagerelative wind speed was greater than 9 m s21. On 24 and 25 Aug,average daily wind speeds were larger than average wind speedsduring the hours of heaviest rain.
Date
03P avgwindspeed
(m s21)
03Paccumulated
(mm)
SR accu-mulatedwithout
windcorrection
(mm)
WR wind-corrected
accumulated(mm)
08010804*0805*0806*080808090810081108120813081408150818
2.714.314.712.3
3.62.64.04.94.43.62.72.62.7
2.51.5
20.03.51.08.0
40.58.04.04.0
Trace34.015.0
6.612.838.7
6.31.6
11.252.510.4
4.55.20.6
38.920.0
6.814.644.9
7.21.7
12.055.711.7
5.55.60.6
43.322.1
0819082308240825Total (mm)
2.71.86.58.8
Trace12.544.512.5
211.5
1.215.051.314.3
291.1
1.215.458.217.0
323.5
indicated 323.5 mm of precipitation, while the uncor-rected data indicated only 291.1 mm of precipitation. Aloss of about 32 mm of precipitation was attributed towind effects. The 03P siphon gauge caught only about73% (211.5 mm) of the uncorrected IfM amount, sug-gesting that design-related differences resulted in an;80 mm accumulation difference between the instru-ments over the period.
Design-related differences can be further brokendown into those resulting from the modified champagne-bowl shape of the horizontal collector of the IfM shiprain gauge (Folland 1988; Hasse et al. 1998), and thoseresulting from the gauge’s additional lateral collector.The two collecting surfaces are used to calculate rainrate as follows: when wind speeds are less than 9 ms21, only drops collected from the horizontal collectingsurface are used to calculate rain rate; when wind speedsare greater than 11 m s21, only drops collected fromthe additional vertical collecting surface are used to cal-culate rain rate; when wind speeds are between 9 m s21
and 11 m s21 there is a linear transition in the relativeweighting of the rain rates calculated by the two col-lecting surfaces (Hasse et al. 1998).
On most days during August, the ship was on stationand average relative wind speeds were below 9 m s21.For these days, the IfM ship rain gauge with wind cor-rection removed indicated a total of 233.3 mm of pre-cipitation, while the 03P siphon gauge caught only 80%(186.5 mm) of that amount (Table 5). The 46.8-mm
difference in accumulation between the gauges can beattributed to the collection advantage afforded to theIfM ship rain gauge by its modified champagne-bowl-shaped top collector. This 20% accumulation differencefor the group of light wind days also is fairly represen-tative of the differences on individual days in the group;on average, the 03P siphon gauge accumulated ;74%6 15% of the uncorrected daily IfM ship rain gaugeaccumulation.
From 2 to 6 August 1997, the ship was underway inthe vicinity of Hurricane Guillermo (Yuter and Houze2000). Rain fell on the Brown on 4–6 August, and theIfM anemometer aboard the Brown measured an averagerelative wind speed greater than 9 m s21 (dates indicatedby asterisks in Table 5). The drops collected by thevertical surface of the IfM ship rain gauge contributed(at least in part) to the calculation of the gauge accu-mulation, and the IfM gauge caught much more pre-cipitation than did the 03P siphon gauge. Over the 3-day period, the uncorrected IfM ship rain gauge datareported a total of 57.8 mm of precipitation, while the03P siphon gauge caught only 43% (25 mm) of thatamount. This 32.8-mm difference reflects the collectionadvantage afforded to the IfM ship rain gauge by itsadditional vertical collector.7 On average, both the IfMship rain gauge specially shaped top collector and theadditional vertical collector significantly increased col-lection efficiency. For the IfM disdrometer, it is difficultto separate the effect of the wind correction from theeffect of the instrument design because the wind cor-rections applied to the raw disdrometer data are verycomplex (Grossklaus et al. 1998).
5. Variation of rain catch with rain gauge location
a. Cross-ship variation
Airflow distortion over the ship combined with a lackof a wind correction for the instrument influenced thecatch reported by siphon gauges placed on the port andstarboard sides of the ship and at different heights (Table6, Fig. 4b). At a given ship level, the windward gaugeoften caught less precipitation than did the leewardgauge. If the wind was blowing from the starboard sideof the ship, then the starboard gauge tended to catchless precipitation than the port gauge on the same shiplevel, and vice versa. To some extent, this difference isto be expected, because airflow encountering the sideof the ship will be forced upward, reducing rainfall in-cident on the windward side of the ship deck in com-parison with the lee side. An extreme example occurredon 24 August when the winds were moderately strong(8.5 m s21 on average) from the starboard side (ap-
7 Although some of the time during these days the wind speedswere less than 11 m s21, for a majority of the time the wind speedswere greater than 11 m s21, so the accumulations were determinedto a greater extent by the vertical collection than by the top collection.

1012 VOLUME 40J O U R N A L O F A P P L I E D M E T E O R O L O G Y
TABLE 6. Daily rainfall accumulation (mm) reported by the siphon gauges on the Brown without any wind correction applied.
Date Imet 02S 02P 03S 03P 05S 05P Winch
080108020803080408050806080708080809
5.50.00.09.0
60.03.50.01.06.5
7.50.00.0
28.0105.0
7.00.01.56.5
2.50.00.03.5
30.07.00.01.59.0
7.50.00.0
21.092.0
7.00.0
Trace5.0
2.50.00.01.5
20.03.50.01.08.0
4.50.00.09.5
45.04.50.0
Trace5.0
2.50.00.03.0
27.51.50.01.08.5
5.50.00.0
17.076.0
5.00.0
Trace6.0
0810081108120813081408150816081708180819
58.012.0
5.04.50.0
39.50.00.0
13.01.0
49.514.0
8.03.50.0
46.50.00.0
13.0Trace
54.09.54.04.0
Trace34.5
0.00.0
15.0Trace
37.513.0
7.03.0
Trace45.5
0.00.0
13.01.0
40.58.04.04.0
Trace34.0
0.00.0
15.0Trace
36.010.5
5.52.00.0
38.00.00.0
10.0Trace
49.09.54.54.0
Trace33.5
0.00.0
13.0Trace
41.011.5
6.54.0
Trace44.5
0.00.0
15.01.0
08200821082208230824082508260827Total
0.00.00.0
15.043.011.0
0.00.0
287.5
0.00.00.0
14.017.5
4.00.00.0
325.5
0.00.00.0
14.053.015.5
0.00.0
257.0
0.00.00.0
12.013.5
3.00.00.0
281.0
0.00.00.0
12.544.512.5
0.00.0
211.5
0.00.00.0
11.515.0
3.00.00.0
200.0
0.00.00.0
11.533.0
9.50.00.0
211.5
0.00.00.0
13.027.0
6.00.00.0
279.0Height above
waterline (m) 13.99 10.31 10.31 12.83 12.83 17.73 17.73 13.31
proximately 458 angle of attack relative to the ship’sbow). The port gauges caught 2–3 times as much pre-cipitation as the starboard gauges did (Fig. 6).
Cross-ship differences began to appear at relativewind speeds between 3 and 5 m s21 (Fig. 7b) and weremost significant at wind speeds greater than 5 m s21
(Fig. 7c). When the relative wind speed fell below 3 ms21, differences between port and starboard accumula-tions were small and random (Fig. 7a). For any givenwind direction, the maximum accumulation differencetended to increase with increasing wind speed. For anygiven wind speed, the maximum cross-ship differenceusually occurred for port or starboard relative wind di-rections between 208 and 808 (Fig. 7c). Figure 7c showsthat hourly accumulation differences greater than 5 mmoccurred several times; in fact, hourly differences of14.5, 18, and 28 mm were observed on 5 August 1997,when the Brown experienced high winds and heavy rain-fall in the vicinity of Hurricane Guillermo. The pointsrepresenting these few large differences are beyond therange of accumulation differences shown in Fig. 7c.Analysis of hourly averaged relative wind direction ondays when precipitation fell (Fig. 8) revealed that therelative wind direction was from the port side 60% ofthe time and from the starboard side only 40% of thetime. This distribution of relative wind direction seemsconsistent with the difference between the total accu-mulations reported by the starboard and port-side siphon
gauges at the same levels (Fig. 4b). Despite the con-sistent qualitative relationship between the relative windspeed and direction and the port–starboard accumulationdifferences, we did not attempt to quantify this rela-tionship, given that would be valid only for a specificship with a specific configuration.
b. Variation with height with wind correction
By applying a wind-correction formula to the siphongauge data we can correct for the reduction of rainfallby wind distortion by the instrument and focus on theeffect of the airflow distortion by the ship. Althoughthere is no wind-correction formula currently availablefor the 14-cm diameter (5.5 in) R. M. Young siphongauges, there are numerous formulas available for sim-ilar gauges. Given the complexity of the wind field overthe ship, it is best to place an anemometer at the locationof each rain measurement instrument. Because relativewind speed was measured only on the IMET mast andon the 03P-level locations, we only apply an estimatedwind correction to the siphon gauge data at these lo-cations. The siphon gauge accumulations in Table 6were adjusted using the wind-correction formula re-ported in Yang et al. (1998) for the National WeatherService standard 8 in. nonrecording precipitation gauge.Table 7 gives these adjusted precipitation amounts,which should be interpreted as estimates of the actual

JUNE 2001 1013Y U T E R A N D P A R K E R
FIG. 6. Daily accumulation reported by siphon gauges on 24 Aug 1997. During precipitatingperiods, the average wind angle of attack relative to the ship’s bow was approximately 458, andthe average wind speed was ;8.5 m s21.
amount of precipitation received by the gauges. Ourassumption in applying this correction is that using anapproximate wind correction yields more accurate es-timates of rainfall than do uncorrected gauge readingsknown to be underestimates. With the wind correctionsupplied by Yang et al. (1998), the total corrected ac-cumulations reported by the 03P (250.0 mm) and IMET(349.0 mm) are closer to the accumulations reported bythe wind-corrected IfM ship rain gauge (323.5 mm).
Most of the difference between the IMET and the 03Psiphon gauge wind-corrected accumulations occurred on4–5 August when wind speeds were greater than 10 ms21 and the relative wind direction was more than 508off the bow (Tables 1 and 7). Under wind conditionssuch as seen under way, particularly when the angle ofattack of the wind to the bow is large, the differencesbetween wind-corrected accumulations at two locationsat nearly the same height indicate a difference in inci-dent rainfall between these locations.
6. Conclusions
For weather and climate purposes, the intention ofrain measurement from ship is to estimate the amountof rain falling at the sea surface as if the ship was notthere. Calibration of the rainfall amount, rate, or spectracaught by a rain gauge or disdrometer in a controlledwindless environment, such as a rain tower, only ad-dresses part of the error associated with rain measure-ment on platforms such as ships. Previous studies (Skaar1955; Roll 1958; World Meteorological Organization
1962; Austin and Geotis 1980; Hasse et al. 1998) haveshown that wind-related errors associated with instru-ment exposure and instrument design strongly contrib-ute to rain measurement uncertainty. Wind correctionsdetermined empirically or via numerical simulation typ-ically only account for the distortion of the flow aroundthe instrument (Sevruk 1982; Hasse et al. 1998; Yanget al. 1998; Nespor and Sevruk 1999) and hence correctto the incident rainfall at the location of the measure-ment; they will not always correct fully to the amountone would have obtained had the ship not been there.The effect of wind distortion by the ship itself on raincatch is more likely to be significant for a moving ship(WMO 1962) than a stationary ship (Roll 1958; Austinand Geotis 1980).
When the relative wind speed is high and the angleof attack to the bow is large, the superstructure of theship can yield a sufficient distortion of wind flow toreduce the rainfall incident at the location of the rainmeasurement (section 5). At wind speeds greater than3 m s21, and particularly at speeds greater than 5 m s21,the cross-ship differences in hourly accumulations be-tween identical instruments located on the port and star-board sides of the Brown at the same height becamesignificant.
At a given height above the water line, the windwardsiphon gauge usually caught less precipitation than theleeward gauge (Fig. 7). For a given wind direction, thecross-ship differences in accumulation tended to in-crease in magnitude with increasing wind speed. Head-

1014 VOLUME 40J O U R N A L O F A P P L I E D M E T E O R O L O G Y
FIG. 7. Port–starboard hourly accumulation differences for the siphon for 1–27 Aug 1997. Dif-ferences in (a)–(c) were calculated by subtracting the starboard hourly rain accumulation at a givenlevel from the port accumulation for the same level (e.g., 03P 2 03S). Four points out of rangefor (c) are excluded but are discussed in the text. Differences in port–starboard hourly accumulationsfor wind speeds (a) less than 3 m s21, (b) between 3 and 5 m s21, and (c) greater than 5 m s21.
winds (08 angle of wind attack) produced the least dif-ference between gauge accumulations on different sidesof the ship, independent of wind speed. Once the angleof wind attack exceeded 208 relative to the bow, how-ever, hourly accumulation differences larger than 5 mmwere observed on several occasions. An extreme ex-ample occurred on 4–5 August 1997 during the TEPPScruise when wind-corrected siphon gauge accumula-tions at similar heights but different locations on shipvaried by 62 mm during conditions when the relativewind speed was greater than 10 m s21 and the windangle of attack relative to the bow was greater than 508.
Both proper placement of the instrument (such thatflow distortion by the ship superstructure itself is locallyminimized) and a wind correction for the instrument areneeded to estimate rainfall at the sea surface accuratelyfrom ship. Sea spray also adds uncertainty to the mea-surement but had a negligible effect on the data obtained
in this study. In general, when the ship is pointed intothe wind, a bow mast location will usually experiencethe least air flow distortion caused by the ship and bemost representative of undisturbed conditions in the vi-cinity of the ship (Fairall et al. 1997). However, typicalship operational constraints make it difficult to point theship continuously into the wind, and thus there is nosingle superior gauge location.8 Instead, as was foundin GATE, we conclude that multiple locations outfittedwith identical instruments are needed to constrain raingauge errors. Preferred locations reduce susceptibilityto sea spray and shadowing from above and minimizedistortion of the wind field by the ship. We concur withSkaar (1955) and Austin and Geotis (1980) that loca-
8 Numerical modeling of the flow around the ship would be usefulin qualitatively assessing minimums in flow distortion at various windspeeds and directions but is usually not available.

JUNE 2001 1015Y U T E R A N D P A R K E R
FIG. 8. Distribution of hourly averaged relative wind direction relative to the ship’s bow onrainy days over the PACS TEPPS period of 1–27 Aug 1997. Histogram bin interval is 308 centeredon the value below the bar.
TABLE 7. Daily accumulation (mm) reported by the IMET and 03Psiphon gauges on the Brown with Yang et al. (1998) wind correctionapplied. Data from Table 3 for the IfM ship rain gauge (SR) andoptical disdrometer (OD) are repeated to facilitate comparison.
Date IMET 03P SR OD
08010802080308040805080608070808080908100811081208130814081508160817
6.50.00.0
12.078.5
4.00.01.07.5
69.014.0
6.05.0
Trace44.5
0.00.0
2.50.00.01.5
27.04.50.01.59.0
46.59.04.54.5
Trace38.0
0.00.0
6.80.00.0
14.644.9
7.20.01.7
12.055.711.7
5.55.60.6
43.30.00.0
13.50.00.1
20.656.0
9.80.02.4
12.967.520.2
5.87.21.3
54.30.00.0
0818081908200821082208230824082508260827Total
15.01.00.00.00.0
17.053.514.5
0.00.0
349.0
16.5Trace0.00.00.0
14.055.515.5
0.00.0
250.0
22.11.20.00.00.0
15.458.217.0
0.00.0
323.5
23.92.30.00.00.0
18.086.626.5
0.00.0
428.9
tions with lower relative wind speeds (usually lower onthe ship rather than on top of a mast) are preferable.The quest to improve rain gauge design to minimizewind cross section (Folland 1988; Hasse et al. 1998)has the same underlying assumption: it is better to re-duce the wind effect than to correct for it.
Because the Brown typically makes rain measure-ments both while under way and on station, placementof identical IfM ship rain gauges is recommended atthree locations: on the bow mast at a height9 that jointlyminimizes both strong vibration and sea spray and onthe port and starboard sides of the 02 level. For the 17rain days considered, one of these three locations caughtas much or more precipitation than each of the sevenremaining locations (Table 6).
Several of the newer instruments deployed during theTEPPS cruise behaved erratically. Data from the pie-zoelectric disdrometers supplied by the NASA TRMMOffice and the STI optical rain gauges appeared to bereasonable until compared with other collocated instru-ments. The errors may have been the result of problemsassociated with the specific instruments on the ship orwith systematic problems in design and manufacture.Some STI units have been reported to yield highly ac-curate time series of rainfall (F. Bradley 1999, personal
9 The sensitivity of the IfM ship rain gauge drop counting mech-anism to vibration makes it unsuitable for placement at the top of amast (L. Loewen 1999, personal communication).

1016 VOLUME 40J O U R N A L O F A P P L I E D M E T E O R O L O G Y
communication), but the two units on the Brown duringTEPPS did not. It is important to verify that each unitis working properly. The factory calibrations on boththe piezoelectric disdrometers and STI optical rain gaug-es were not correct, and neither of these instruments ascurrently designed can have their calibration adjustedby the user. Given their current design, it is highly rec-ommended that these instruments be deployed in clus-ters that include baseline instruments such as siphongauges that yield consistent results. The data from theexperimental instruments should be discarded if a com-parison of the time series of their measurements andbaseline gauge measurements reveals significant differ-ences (e.g., Fig. 5).
The IfM ship rain gauge (Hasse et al. 1998) representsa significant improvement over siphon gauges for rainmeasurement in windy conditions. The design featuresof the IfM ship rain gauge, a modified-champagne-bowlhorizontal collector (Folland 1988) and cylindrical ver-tical collector, yielded a measurable collection advan-tage over the R. M. Young siphon gauge. The IfM in-struments also correct for wind effects using input froma collocated anemometer (Grossklaus et al. 1998; Hasseet al. 1998). Since the TEPPS cruise, an IfM ship raingauge has been added as part of the permanent instru-mentation on the Brown. However, during the TEPPScruise, the 03P location experienced sufficient flow dis-tortion by the ship during higher wind conditions toreduce its rain catch when compared with a more pref-erable location.
Based on our analysis, it is recommended that rainfallmeasurements made using siphon gauges, currently themost commonly deployed instrument on volunteer-ob-serving ships, be utilized as minimums rather than‘‘true’’ values until wind corrections can be applied rou-tinely to these data. Without a wind correction, a cali-brated, well-placed siphon gauge will systematicallytend to underestimate the accumulation of precipitation-sized drops falling on ship.
The catchment variation with exposure among in-struments such as the IfM ship rain gauge that havehorizontal and vertical catchment surfaces and built-inwind corrections needs to be studied. It is anticipatedthat such differences will be less than for the horizontal-only catchment of the siphon gauges examined in thisstudy, but further investigation is needed.
Acknowledgments. The authors thank Jonathan Shan-nahof and Larry Loewen of the NOAA Ship Ronald H.Brown for their conscientious efforts in installing, cal-ibrating, maintaining, and operating the rainfall instru-mentation on ship. The authors also thank Principal In-vestigator Robert Houze for his support and encour-agement. The efforts of Warren Keenan and Steve Pio-trowicz of NOAA regarding the rain instrumentation onthe Brown are also greatly appreciated. The IfM shiprain gauge and disdrometer data analyzed in this paperwere supplied courtesy of Martin Grossklaus and Lutz
Hasse of the Institut fur Meereskunde in Kiel, Germany.Otto Thiele of the NASA TRMM Office and Gene Fur-ness of NASA Wallops Island Laboratory supplied thepiezoelectric disdrometers deployed for the TEPPScruise. Candace Gudmundson edited the manuscript andKay Dewar drafted some of the figures. Suggestions byJ. Mark Fair, Chris Folland, and an anonymous reviewercontributed to improvement of the manuscript. Thiswork was supported by NOAA cooperative agreementNA67RJO115 (JISAO contribution 748) and NASATRMM NAG5-4795. This material is based on worksupported under a National Science Foundation Fellow-ship.
APPENDIX
Processing the PACS TEPPS Siphon Gauge Data
A meaningful accumulation period was determinedfor the siphon gauges based on their accumulation ac-curacy of 0.5 mm. In examining subday-scale accu-mulations, care was taken to select a timescale thatwould allow for most of the precipitation to be capturedin meaningful accumulations (i.e., greater than 1 mm).Various time periods were considered (e.g., 1 min, 5min, 1 h, 6 h), and eventually a period of 1 h was chosenon the following basis. Accumulations for each hourduring which some rain occurred were examined. It wasfound that, even though only about 35% of these clockhours had accumulations greater than 1 mm, this 35%accounted for about 90% of the total precipitation mea-sured by the gauges over the period. We considered the90% accounted for by 1-h accumulations to be adequatefor our purposes; in general, the adequate threshold willbe determined on a study-by-study basis based on theprecipitation climate data of the region being sampled.
The processing of the PACS TEPPS siphon rain gaugedata from raw recorded gauge readings to hourly anddaily accumulations was undertaken using the followingsteps:
1) When the accumulation in a siphon rain gaugereached approximately 50 mm, the gauge would si-phon and thereby return to a near-zero reading (Fig.A1a). These siphon events were removed from thedata so that the gauge readings continued beyond 50mm, rather than dropping to near zero (Fig. A1b).This was accomplished by adding the last presiphonreading to all readings following the siphon event.
2) The siphon-removed data contained some spuriousfluctuations. The most common kind of spuriousfluctuation was a sharp rise in gauge accumulationquickly followed by a return to the prerise value(e.g., Fig. A1c, between 0100–0400 UTC). Thesefluctuations were filtered according to the followingmethod. For each gauge accumulation, later valueswere examined, up to 90 10-s time steps ahead. Ifany of these subsequent values was found to be lowerthan the current one, then the current reading was

JUNE 2001 1017Y U T E R A N D P A R K E R
FIG. A1. Steps in the processing of the 03P siphon rain gauge data for 24 Aug 1997. (a) Timeseries of 10-s data as recorded by ship’s computer system, (b) 10-s data after siphon at 0755 UTCwas removed, (c) 10-s data after filtering step was applied, and (d) hourly accumulations derivedfrom filtered 10-s data. Dashed line indicates 1-mm accumulation.
set to the lowest of the subsequent values. However,if this lowest value was lower than the previousgauge reading (the reading just before the currentone), then the current gauge reading was assignedthe value of the previous gauge reading. This filtermethod was developed on the premise that, on time-scales too short for significant evaporation, the trueaccumulation can only stay the same or increase, andon the observation that gauge readings often jumpedspuriously but rarely, if ever, fell spuriously. Theresult of the filtering is shown in Fig. A1c.
3) The hourly rain accumulations were calculated fromthe filtered, siphon-removed data by subtracting thefinal gauge reading during an hour from the firstgauge reading during that hour (Fig. A1d). Hourlyaccumulations less than 1 mm were recorded, but itshould be kept in mind that such accumulations can-not be distinguished from noise. The dotted line inFig. A1d indicates the 1-mm accumulation threshold;accumulations below this line are indistinguishablefrom noise.
4) Daily accumulations (Table 6) were similarly cal-culated by subtracting the first siphon gauge readingfor the day from the last siphon gauge reading forthe day.
REFERENCES
Allerup, P., and H. Madsen, 1980: Accuracy of point precipitationmeasurement. Nord. Hydrol., 11, 57–70.
Austin, P. M., and S. G. Geotis, 1979: Raindrop sizes and relatedparameters for GATE. J. Appl. Meteor., 18, 569–575.
——, and ——, 1980: Precipitation measurements over the ocean.Air–Sea Interaction, F. Dobson, L. Hasse, and R. Davis, Eds.,Plenum Publishing, 523–541.
Fairall, C. W., A. B. White, J. B. Edson, and J. E. Hare, 1997: In-tegrated shipboard measurements of the marine boundary layer.J. Atmos. Oceanic Technol., 14, 338–359.
Folland, C. K., 1988: Numerical models of the raingauge exposureproblem, field experiments and an improved collector design.Quart. J. Roy. Meteor. Soc., 114, 1485–1516.
Groisman, P. V., and D. R. Legates, 1994: The accuracy of UnitedStates precipitation data. Bull. Amer. Meteor. Soc., 75, 215–227.
Grossklaus, M., K. Uhlig, and L. Hasse, 1998: An optical disdrometerfor use in high wind speeds. J. Atmos. Oceanic Technol., 15,1051–1059.
Hasse, L., M. Grossklaus, K. Uhlig, and P. Timm, 1998: A ship raingauge for use in high wind speeds. J. Atmos. Oceanic Technol.,15, 380–386.
Hosom, D., R. A. Weller, R. E. Payne, and K. E. Prada, 1995: TheIMET (Improved Meteorology) ship and buoy systems. J. Atmos.Oceanic Technol., 12, 527–540.
Jevons, W. S., 1861: On the deficiency of rain in an elevated raingauge as caused by wind. Philos. Mag., 22, 421–433.
Joss, J., and A. Waldvogel, 1967: Ein Spektrograph fur Niederschlags-tropfen mit automatischer Auswertung. Pure Appl. Geophys., 68,240–246.
——, and E. G. Gori, 1976: The parameterization of raindrop sizedistributions. Riv. Ital. Geofis., 3, 275–283.
Kuettner, J. P., D. E. Parker, D. R. Rodenhuis, H. Hoefer, H. Kraus,and G. Philander, 1974: GATE final international scientific plans.Bull. Amer. Meteor. Soc., 55, 711–744.
Nespor, V., and B. Sevruk, 1999: Estimation of wind-induced errorof rainfall gauge measurements using a numerical simulation. J.Atmos. Oceanic Technol., 16, 450–464.
Nystuen, J. A., 1998: Temporal sampling requirements for automaticrain gauges. J. Atmos. Oceanic Technol., 15, 1253–1260.

1018 VOLUME 40J O U R N A L O F A P P L I E D M E T E O R O L O G Y
——, J. R. Proni, C. A. Lauter Jr., J. Bufkin, U. Rivero, M. Borland,and J. Wilkerson, 1994: APL disdrometer evaluation. NOAATech. Memo. ERL AOML-83, Atlantic Oceanographic and Me-teorological Laboratory, Miami, FL, 48 pp. [Available from Na-tional Technical Information Service, 5285 Port Royal Road,Springfield, VA 22161.]
Oke, T. R., 1987: Boundary Layer Climates. Cambridge UniversityPress, 435 pp.
Robinson, A. C., and J. C. Rodda, 1969: Rain, wind, and the aero-dynamic characteristics of rain-gauges. Meteor. Mag., 98, 113–120.
Roll, H. U., 1958: Zur Niederschlagmessung auf See: Ergebnisse vonVergleichsmessungen auf Feuerschiffen und benachbarten In-seln. Deutscher Wetterdienst, Seewetteramt Hamburg, Einzelver,16, 15 pp.
Sevruk, B., 1982: Methods of correction for systematic error in pointprecipitation measurement for operational use. Operational Hy-drology Rep. 21, WMO No. 589, Secretariat of the WMO, Ge-neva, Switzerland, 35 pp.
Skaar, J., 1955: On the measurement of precipitation at sea. Geofys.Publ., 19, 1–32.
Strangeways, I. C., 1996: Back to basics: The ‘‘met. enclosure.’’ Part2(b): Rain gauges, their errors. Weather, 51, 298–303.
Symons, G. J., 1864: Rain gauges and hints on observing them. Br.Rainfall, 8–13.
Verploegh, G., 1957: Rainfall measurements aboard the NetherlandsOcean Weather Ships ‘‘Cirrus’’ and ‘‘Cumulus.’’ K. Ned. Met.Inst. Wetenschappelijk, Rapport 57-003 (IV-014). [Availablefrom Het Koninklijk Nederlands Meteorologisch Instituut, Post-bus 201, 3730 AE De Bilt, Netherlands.]
Wang, T., K. B. Earnshaw, and R. S. Lawrence, 1979: Path-averagedmeasurements of rain rate and raindrop size distribution usinga fast-response optical sensor. J. Appl. Meteor., 18, 654–660.
World Meteorological Organization, 1962: Precipitation measure-ments at sea. Tech. Note No. 47, WMO No. 124.TP.55, Secre-tariat of the WMO, Geneva, Switzerland, 18 pp.
Yang, D., B. E. Goodison, J. R. Metcalfe, V. S. Golubev, R. Bates,T. Pangburn, and C. L. Hanson, 1998: Accuracy of NWS 80standard nonrecording precipitation gauge: Results and appli-cation of WMO intercomparison. J. Atmos. Oceanic Technol.,15, 54–68.
Yuter, S. E., and R. A. Houze Jr., 2000: The 1997 Pan AmericanClimate Studies Tropical Eastern Pacific Process Study. Part I:ITCZ region. Bull. Amer. Meteor. Soc., 81, 451–481.