Service Tracking Survey 2011
198
-
Upload
independent -
Category
Documents
-
view
0 -
download
0
Transcript of Service Tracking Survey 2011


i
CONTENTS
CONTENTS .............................................................................................................................................. i
LIST OF TABLES ..................................................................................................................................... iii
LIST OF FIGURES ................................................................................................................................... vi
LIST OF BOXES..................................................................................................................................... viii
ACRONYMS AND ABBREVIATIONS ....................................................................................................... ix
ACKNOWLEDGEMENTS ........................................................................................................................ xi
1 INTRODUCTION ............................................................................................................................. 1
1.1 BACKGROUND ....................................................................................................................... 1
1.2 SURVEY OBJECTIVES .............................................................................................................. 2
1.3 TECHNICAL WORKING COMMITTEE ...................................................................................... 2
1.4 STRUCTURE OF REPORT ........................................................................................................ 2
2 METHODOLOGY ............................................................................................................................ 3
2.1 SAMPLING STRATEGY ............................................................................................................ 3
2.2 QUESTIONNAIRE DESIGN ...................................................................................................... 6
2.3 SELECTION OF SUPERVISORS AND ENUMERATORS .............................................................. 7
2.4 ORIENTATION AND TRAINING ............................................................................................... 8
2.5 IMPLEMENTATION ................................................................................................................ 8
2.6 DATABASE DESIGN, CODING, ENTRY AND CLEANING........................................................... 8
2.7 LIMITATIONS AND CHALLENGES ......................................................................................... 10
3 BACKGROUND CHARACTERISTICS .............................................................................................. 12
3.1 INTRODUCTION ................................................................................................................... 12
3.2 FACILITIES ............................................................................................................................ 12
3.3 CLIENT CHARACTERISTICS ................................................................................................... 14
4 FREE CARE ................................................................................................................................... 21
4.1 INTRODUCTION ................................................................................................................... 21
4.2 RESULTS ............................................................................................................................... 21
4.3 KEY FINDINGS ...................................................................................................................... 26
5 AAMA PROGRAMME .................................................................................................................. 28
5.1 INTRODUCTION ................................................................................................................... 28
5.2 RESULTS ............................................................................................................................... 29
5.3 KEY FINDINGS ...................................................................................................................... 39
6 FINANCIAL MANAGEMENT ......................................................................................................... 40
6.1 INTRODUCTION ................................................................................................................... 40
6.2 RESULTS ............................................................................................................................... 40
6.3 KEY FINDINGS ...................................................................................................................... 50
7 GOVERNANCE AND ACCOUNTABILITY ........................................................................................ 52
7.1 INTRODUCTION ................................................................................................................... 52
7.2 RESULTS ............................................................................................................................... 52
7.3 KEY FINDINGS ...................................................................................................................... 66
8 HUMAN RESOURCES ................................................................................................................... 68
8.1 INTRODUCTION ................................................................................................................... 68

ii
8.2 RESULTS ............................................................................................................................... 69
8.3 KEY FINDINGS ...................................................................................................................... 97
9 DRUG SUPPLY AND STORAGE ................................................................................................... 100
9.1 INTRODUCTION ................................................................................................................. 100
9.2 RESULTS ............................................................................................................................. 100
9.3 KEY FINDINGS .................................................................................................................... 108
10 QUALITY OF CARE ..................................................................................................................... 110
10.1 INTRODUCTION ................................................................................................................. 110
10.2 RESULTS ............................................................................................................................. 111
10.3 KEY FINDINGS .................................................................................................................... 147
11 PROGRESS AGAINST NHSP 2 LOGFRAME TARGETS .................................................................. 150
11.1 INTRODUCTION ................................................................................................................. 150
11.2 RESULTS ............................................................................................................................. 151
11.3 KEY FINDINGS .................................................................................................................... 161
REFERENCES ...................................................................................................................................... 163
Annex 1.1: Members of STS 2011 Technical Working Committee .............................................. 164
Annex 3.1: Categorisation of Caste, Ethnic and other Identity Groups ....................................... 169
Annex 4.1: List of Free/Essential drugs by Level of Health Facility ............................................. 170
Annex 9.1: Percentage of Facilities with Drugs Procured Centrally and Locally ......................... 172
Annex 9.2: Percentage of Facilities with Expired Drugs in Stock at Time of Visit ....................... 174

iii
LIST OF TABLES
Table 0.1: Key indicators from the STS 2011 xvii
Table 2.1: Districts within the 13 sub-regions (STS 2011 districts are given in bold) 3
Table 2.2: Number of facilities by type and district in total and included in STS 2011 5
Table 3.1: Ownership of health facility buildings by level of facility 12
Table 3.2: Additional construction required and availability of separate delivery rooms 13
Table 3.3: Availability of permanent and overnight accommodation by level of facility 13
Table 3.4: Exit interviews by type of facility 14
Table 3.5: Number of exit interviews conducted in each district 15
Table 3.6: Clients’ place of residence: same or different district 15
Table 3.7: Clients’ place of residence: urban or rural 16
Table 3.8: Demographic characteristics of surveyed clients 17
Table 3.9: Purpose of visits to health facilities 18
Table 3.10: Stage of childbirth when maternity clients arrived at facilities 19
Table 3.11: Experience of complications by maternity clients prior to arrival 19
Table 3.12: Mode of delivery, for those who delivered in an STS 2011 facility 20
Table 3.13: Time of delivery of women who delivered in the facilities 20
Table 4.1: Awareness of free care and source of information by caste/ethnicity 22
Table 4.2: Awareness of free care and source of information by topographical zone 23
Table 4.3: Payment for free care by caste and ethnic group 23
Table 4.4: Payment for free care by topological zone 24
Table 4.5: Reasons for payment, by caste/ethnicity 24
Table 4.6: Reasons for payment, by topological zone 25
Table 5.2: Awareness of transport incentives and source of information, by topographical zone 30
Table 5.3: Awareness of transport incentives and source of information, by caste/ethnic group 31
Table 5.4: Awareness of free care and source of information, by topographical zone 32
Table 5.5: Awareness of free care and source of information, by caste and ethnic group 33
Table 5.6: Payment for delivery care and receipt of incentive payments, by caste and ethnicity 34
Table 5.7: Payment for delivery care and receipt of incentive payments, by topographical zone 34
Table 5.8: Types of payments made by maternity clients 36
Table 5.9: Procedures requested by facilities to claim transport incentive 36
Table 5.10: Record keeping of women receiving Aama benefits (incentives & free delivery) 37
Table 5.11: Average number of deliveries by level of facility (FY 2010/11) 37
Table 5.12: Average amount received from Aama Programme by facility type 38
Table 5.13: HDC/HFMC engagement with Aama Programme 38
Table 5.14: Provision of cash incentives to health workers for attending home deliveries 39
Table 6.1: Sources of income for health facilities (FY 2010/2011) (in NPR million and %) 41
Table 6.2: Sources of income for BPKIHS and zonal hospitals (FY 2010/2011) (NPR million and %) 41
Table 6.3: Funding from local communities, FY 2010/2011 43

iv
Table 6.5: Expenditure of MoHP funds and reasons for non-expenditure, FY 2010/11 47
Table 6.6: Statement of revenue and expenditure (fiscal year 2010/11) 48
Table 6.7: Financial reporting by health facilities in previous fiscal year 49
Table 6.8: Internal and final audits and audit recommendations 50
Table 7.1: Social audit practice and use of community scorecards 54
Table 7.2: Availability, location and information included in citizen charters 55
Table 7.3: Transparency and disclosure measures on types of activities and information 57
Table 7.4: Health facility committee findings 58
Table 7.5: Number of members of health facility committees (HFMCs and HDCs) 60
Table 7.6: Frequency of health facility committee (HFMC/HDC) meetings 61
Table 7.7: Reported activeness and frequency of health facility committee (HFMC/HDC) meeting 61
Table 7.8: Main activities of health facility committees (HFMCs/HDCs) in last fiscal year 62
Table 7.9: Complaint/suggestion mechanisms at health facilities 62
Table 7.10: Availability of an emergency contingency plan for women and children 63
Table 7.11: Frequency of staff meetings 64
Table 7.12: Supervisory visits from district, regional and central level authorities 65
Table 7.13: Types of feedback received during supervisory visits 65
Table 8.1: Official number sanctioned posts at higher level hospitals (excl. administrative posts) 71
Table 8.2: Sanctioned and filled posts at higher level hospitals 72
Table 8.3: Official number of sanctioned posts at district hospitals (excl. administrative posts) 73
Table 8.4: Sanctioned and filled posts at district hospitals 73
Table 8.5: Sanctioned and filled posts at PHCCs 75
Table 8.6: Sanctioned and filled posts at health posts 76
Table 8.7: Sanctioned and filled posts at SHPs 77
Table 8.8: Percentage sanctioned posts filled at district hospitals, PHCCs, health posts and SHPs 78
Table 8.9: Staff perceptions regarding number of sanctioned posts 78
Table 8.10: Service-contract mix at health facilities compared to sanctioned posts 82
Table 8.11: Skills mix at district and non-district hospitals 83
Table 8.12: Skills mix of personnel at PHCCs, health posts and SHPs 84
Table 8.13: Percentage of staff trained at hospitals in previous fiscal year 85
Table 8.14: Percentage of staff trained at PHCCs, health posts and SHPs in the last fiscal year 86
Table 8.15: Staff who received skilled birth attendant (SBA), essential newborn care (ENC) or
anaesthesia training in last fiscal year 87
Table 8.16: Turnover of health facility staff in previous fiscal year 88
Table 8.17: Hospital staff trained in anaesthesia and obstetrics in post, and provision of caesarean
sections 97
Table 9.1: Storage of drugs that do not require refrigeration 101
Table 9.2: Access to refrigeration for drug storage 103
Table 9.3: Facility responses to stock-outs of essential drugs 105
Table 9.4: Mean drug expenditure by maternity clients and outpatients (who paid) (NPR) 108

v
Table 10.1: Quality of care components covered in STS 110
Table 10.2: Sources of power by level of health facility 112
Table 10.3: Main source of water by level of health facility 113
Table 10.4: Availability of waiting area, access to phone and toilets by level of health facility 114
Table 10.5: Client perceptions of factors related to comfort in health facilities 115
Table 10.6: Percentage of hospitals with available and functional beds (n=16) 115
Table 10.7: Percentage of PHCCs, health posts and SHPs with available and functional beds 116
Table 10.8: Availability of biomedical waste management facilities by level of health facility 117
Table 10.9: Equipment available and functional at hospitals and PHCCs 118
Table 10.10 Equipment available and functional at health posts and SHPs 120
Table 10.11: Proportion of facilities officially accredited as CEONC, BEONC and birthing centres 122
Table 10.12: Provision of BEONC and CEONC services by type of facility 123
Table 10.13: Provision of maternity servicesin hospitals, PHCCs, health posts and SHPs 126
Table 10.14: Availability of family planning services 128
Table 10.15: Provision of services for infection detection and treatment 130
Table 10.16: Opportunistic infection services and palliative care for people living with HIV 131
Table 10.17: Treatment for acute respiratory infections (facility-based or outreach) 132
Table 10.18: Time taken to transport clients to nearest referral facility (hrs) 133
Table 10.19: Out-referrals for outpatients 133
Table 10.20: Availability of ambulances and stretchers by level of facility 134
Table 10.21: Mean waiting time and client’s perception of waiting time 134
Table 10.22: Companion requested and permitted 135
Table 10.23: Cleanliness of facility 135
Table 10.24: Respect for client privacy and confidentiality 136
Table 10.25: Type of provider (main care provider) 137
Table 10.26: Clients’ perceptions of providers’ explanations and advice 139
Table 10.27: Client perceptions on skills of providers and reasons for classifying as unskilled 139
Table 10.28: Client perception of provider’s attitude and behaviour 140
Table 10.29: Client perception of care given by provider 141
Table 10.30: Client satisfaction 141
Table 10.31: Client recommendations for improvement, by service received 145
Table 10.32: Client recommendations for improvement by type of facility 146
Table 10.33: Quality improvement plans and committees 147
Table 11.1: Logical framework (2012) indicators generated from Service Tracking Survey 151
Table 11.2: Achievement of logframe indicators monitored by STS 2011 against baseline & targets 152

vi
LIST OF FIGURES
Figure 2.1: Map of Nepal showing location of STS 2011 districts ............................................................. 4
Figure 4.1: Clients receiving free services by level of facility (average per facility type) (for fiscal years
2008/09 to 2010/11) ............................................................................................................. 25
Figure 4.2: Clients receiving free services by level of facility (average per topographical zone) (for FYs
2008/09 to 2010-11) ............................................................................................................. 26
Figure 5.1: Official amount, expected amount and amount given for transport incentive, by
topographical zone (in NPR) ................................................................................................. 35
Figure 6.1: Main sources of internal income by topographical zone (% of facilities, n=169) ................. 42
Figure 6.2: Proportion of annual budgeted funds received from MoHP, by health facilities, by
trimester (FY 2010/2011) ...................................................................................................... 44
Figure 6.3: Breakdown of hospital expenditure from funds received from MoHP (FY 2010/2011) ....... 45
Figure 6.4: Breakdown of PHCC expenditure from funds received from MoHP (FY 2010/2011) ........... 46
Figure 6.5: Breakdown of health post expenditure from funds received from MoHP (FY 2010/2011) . 46
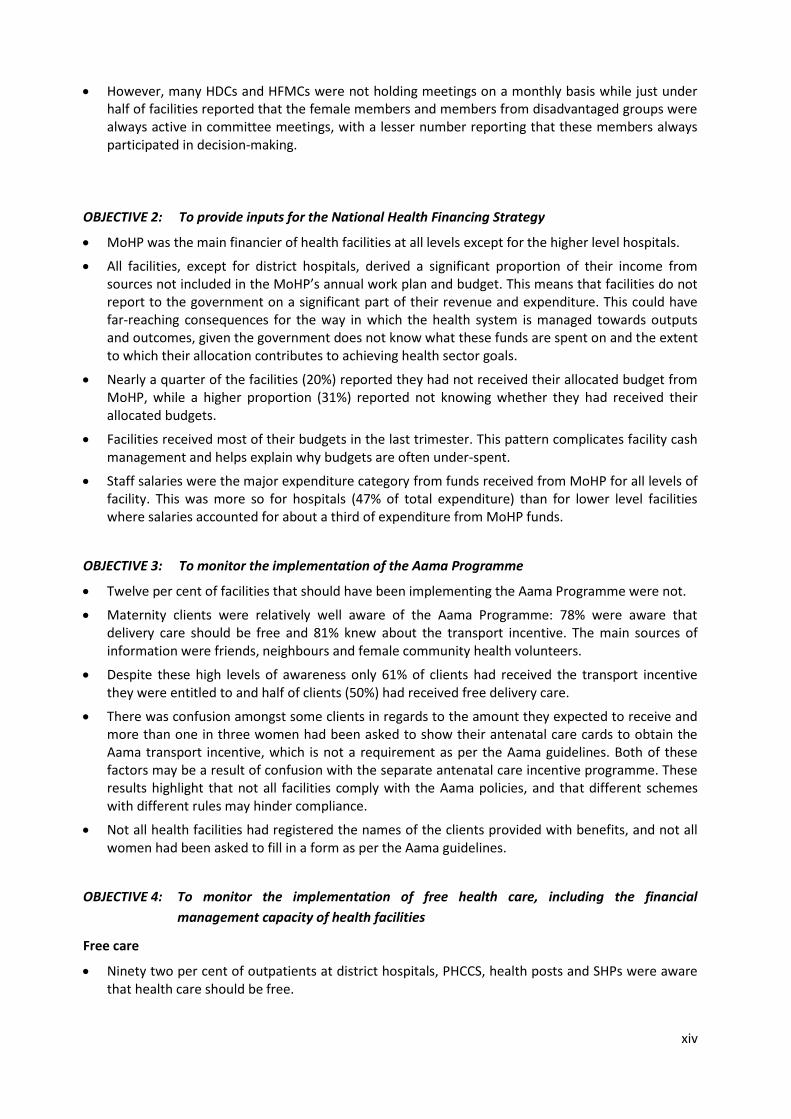
Figure 6.6: Breakdown of SHP expenditure from funds received from MoHP (n=31) (FY 2010/2011) .. 47
Figure 6.7: Disclosed revenue and expenditure to the general public (n=169 facilities) ....................... 48
Figure 7.1: Social audit practices by health facilities in the current or last fiscal year ........................... 54
Figure 7.2: Availability, location and information in citizen’s charters by type of health facility ........... 56
Figure 7.3: Health facility committee (HFMCs and HDCs) ‘activeness’ findings ..................................... 59
Figure 7.4: Capacity building on GESI and participation of marginalised people on health facility
committees ........................................................................................................................... 59
Figure 8.1: Percentage of sanctioned posts filled at district and higher level hospitals......................... 74
Figure 8.2: Percentage of sanctioned posts filled at PHCCs, health posts and SHPs .............................. 75
Figure 8.3: Service-contract mix at higher level hospitals ...................................................................... 79
Figure 8.4: Service-contract mix at district hospitals .............................................................................. 80
Figure 8.5: Service-contract mix at PHCCs .............................................................................................. 80
Figure 8.6: Service-contract mix at health posts .................................................................................... 81
Figure 8.7: Service-contract mix at SHPs ................................................................................................ 81
Figure 8.8: Percentage of facilities where staff received training in previous fiscal year ...................... 85
Figure 8.9: Attendance at district hospitals of staff in last fiscal yr (based on mean no. days).............. 89
Figure 8.10: Attendance at higher level hospitals of staff in last FY (based on mean no. days) .............. 90
Figure 8.11: Attendance at PHCCs of staff in last fiscal yr (based on mean no. days) .............................. 90
Figure 8.12: Attendance at health posts of staff in last fiscal yr (based on mean no. days) .................... 91
Figure 8.13: Attendance at SHPs staff in last fiscal yr (based on mean no. days) .................................... 91
Figure 8.14: Breakdown of hospital staff by sex ....................................................................................... 92
Figure 8.15: Breakdown of PHCC staff by sex ........................................................................................... 93
Figure 8.16: Breakdown of health post staff by sex.................................................................................. 93
Figure 8.17: Breakdown of SHP staff by sex ............................................................................................. 94
Figure 8.18: Hospital staff by caste and ethnicity ..................................................................................... 95
Figure 8.19: PHCC staff by caste and ethnicity ......................................................................................... 95

vii
Figure 8.20: Health post staff by caste and ethnicity ............................................................................... 96
Figure 8.21: SHP staff by caste and ethnicity ............................................................................................ 96
Figure 9.1: Storage of drugs that do not require refrigeration ............................................................. 102
Figure 9.2: Access to refrigeration for drug storage ............................................................................. 103
Figure 9.3: Percentage of facilities with drugs stored using FEFO principles ....................................... 104
Figure 9.4: Facility responses to stock-outs of essential drugs ............................................................. 106
Figure 9.5: Percentage of outpatients paying for drugs and receiving drugs for free .......................... 107
Figure 9.6: Percentage of maternity clients paying for drugs and receiving drugs for free ................. 108
Figure 10.1: Availability of electricity at health facilities (hrs/day) ........................................................ 112
Figure 10.2: Biomedical waste management .......................................................................................... 116
Figure 10.3: Availability of the 9 CEONC signal functions at CEONC facilities ........................................ 124
Figure 10.4: Availability of the 7 BEONC signal functions at BEONC facilities ........................................ 125
Figure 10.5: Availability of abortion services at safe abortion sites ....................................................... 127
Figure 10.6: Availability of antenatal and postnatal care services ......................................................... 129
Figure 10.7: Availability of child health services ..................................................................................... 129
Figure 10.8: Availability of HIV services by type of facility ..................................................................... 131
Figure 10.9: Provision of x-ray, operating theatre, anaesthesia and intensive care unit (ICU) at
hospitals .............................................................................................................................. 132
Figure 10.10: Sex of provider and client comfort with sex of provider .................................................... 137
Figure 10.11: Client dissatisfaction ........................................................................................................... 142
Figure 10.12: Client satisfaction by type of facility ................................................................................... 142
Figure 10.13: Percentage of clients dissatisfied with the care received, by caste and ethnicity.............. 142
Figure 10.14: Top six recommendations for improvement by maternity clients ..................................... 144
Figure 10.15: Top six recommendations for improvement by outpatient clients .................................... 144
Figure 10.16: Top five recommendations for improvement by facility type ............................................ 146
Figure 11.1: Percentage of clients satisfied with their health care at health facilities ........................... 153
Figure 11.2: Percentage of health facility committees with at least 3 female members and 2 Dalit or
Janajati members ................................................................................................................ 154
Figure 11.3: Percentage of sanctioned and filled doctor and nurse posts at hospitals and PHCCs........ 155
Figure 11.4: Percentage of hospitals with at least 1 obstetrician-gynaecologist or MDGP; 5 nurses; and
1 anaesthetic/anaesthetic assistant ................................................................................... 156
Figure 11.5: Percentage of districts with at least one facility providing CEONC signal functions 24/7 .. 157
Figure 11.6: Percentage of PHCCs that provide BEONC signal functions............................................... 158
Figure 11.7: Percentage of health posts that are birthing centres providing deliveries 24/7 ................ 158
Figure 11.8: Percentage safe abortion sites with long-acting family planning services ......................... 159
Figure 11.9: Percentage health posts providing the different types of contraception .......................... 160
Figure 11.10: Percentage health facilities that undertook social audits in current or last fiscal year ...... 161

viii
LIST OF BOXES
Box 4.1: Key STS indicators for free care ....................................................................................... 21
Box 5.1: Key STS indicators for the Aama Programme .................................................................. 29
Box 6.1: Key STS indicators for financial management ................................................................. 40
Box 7.1: Key STS indicators for governance and accountability .................................................... 52
Box 8.1: Definitions ....................................................................................................................... 69
Box 8.2: Key STS indicators for human resources ......................................................................... 69
Box 9.1: Key STS indicators for drug supply and storage ............................................................ 100
Box 10.1: Key STS indicators for quality of care ............................................................................ 111

ix
ACRONYMS AND ABBREVIATIONS
24/7 available 24 hours a day, 7 days a week
AA anaesthetist assistant
AHW auxiliary health worker
ANC antenatal care
ANM auxiliary nurse midwife
ARV antiretroviral
AWPB annual work plan and budget
BEONC basic emergency obstetric and neonatal care
CEONC comprehensive emergency obstetric and neonatal care
D(P)HO district (public) health office
DDC district development committee
DFID Department for International Development
DoHS Department of Health Services
DOTS directly observed treatment short course
EHCS essential health care services
ENC essential newborn care
FCHV female community health volunteer
FEFO first expired, first out
FHD Family Health Division (MoHP)
FY fiscal year
GAAP Governance and Accountability Action Plan
GESI gender equality and social inclusion
GiZ Deutsche Gesellschaft für Internationale Zusammenarbeit, GmbH (German Society for
International Cooperation, Ltd., formerly GTZ)
GoN Government of Nepal
HA health assistant
HDC hospital development committee
HDI Human Development Index
HFMC health facility management committee
HIV human immunodeficiency virus
HMIS Health Management Information System
HP health post
HR human resources
HSRSP Health Sector Reform Support Programme
HuRIC Human Resource Information Centre
I&D set incision and drainage set
INGO international non-government organisation
IUCD intrauterine contraceptive device
M&E monitoring and evaluation

x
MCHW maternal and child health worker
MDGP doctor of medicine, general practitioner
MIS management information system
MoHP Ministry of Health and Population
MTCT mother to child transmission
n sample size
NDHS Nepal Demographic and Health Survey
NHSP 1 First Nepal Health Sector Programme (2004–2010)
NHSP 2 Second Nepal Health Sector Programme (2010–2015)
NHSSP Nepal Health Sector Support Programme
no. number
NPR Nepali rupees
O/G obstetrician-gynaecologist
OC outcome
OP output
OPD outpatient department
ORS oral rehydration solution
PHCC primary health care centre
PLHIV people living with HIV
PMTCT prevention of mother to child transmission
RTI reproductive tract infection
SAHW senior auxiliary health worker
SBA skilled birth attendant
SDIP Safe Delivery Incentive Programme
SHP sub-health post
SLC school leaving certificate
SSMP Support to the Safe Motherhood Programme
STI sexually transmitted infection
STS Service Tracking Survey
TB tuberculosis
USAID United States Agency for International Development
VDC village development committee
VHW village health workers
WHO World Health Organisation

xi
ACKNOWLEDGEMENTS
The authors would like to acknowledge:
All of the respondents who gave their time generously to this study.
Dr Praveen Mishra, Secretary, Ministry of Health and Population (MoHP) and former Secretary
of Health Dr Sudha Sharma.
All the members of the Technical Working Group (see Annex 1).
Government staff at the MoHP: Mr Deependra Kafle, Mr Mohan Thapa, Mr Lila Raj Paudel and
Mr Rajan Adhikari; at the Department of Health Services (DoHS): Mr Dhurba Raj Ghimire, Mr
Jhapindra Pandey, Mr Gopi Bhandari and Mr Krishna Upreti; and in the study districts for their
tireless support throughout the study period.
All advisors of the Nepal Health Sector Support Programme (NHSSP) for their support in tool
design and for the peer review of the draft report, in particular Dr Nancy Gerein (Team Leader),
Greg Whiteside (Senior Quality Assurance Advisor), Dr Laxmi Raj Pathak (Health Policy and
Planning Advisor/National Lead) and Ramchandra Man Singh (Senior Health Systems
Governance Advisor).
The core data collection team:
o Consultants: Dr Rajendra B.C (national consultant) and Syaron Basnet (junior consultant). o District supervisors: Pragya Kandel, Monika Singh Dangol, Puskar Paudel, Manoj Thapa,
Poonam Shah, Sunita Bhattarai, Rajkumar Ghimire, Mausam Guragain, Binod Dulal, Sabin Shrestha, Rajan Adhikari, Batuli Chaudhari, Tika Acharya, Shiva Prasad Subedi and Sheela Shrestha.
o Enumerators: Urmila Pudasaini (Karki), Parbati Rana, Sarmila Shrestha, Sulochana Syangtan, Isap Sapkota, Masina Nepali, Shovanee Shrestha, Rohit Rana Magar, Rubina Paudel, Rani Kumari Pandey, Rajendra Prasad Yadav, Kaminee Kumari Thakur, Sabita Nemang, Samisha Idhingo, Usha Tumbapo, Usha Rai, Mishra Rai, Sajana Basnet, Balkumari Basnet, Binu Shrestha, Indu Maya Kumari Mandal, Dinesh Poudel, Prayash Khadka, Anju Yadav, Rajendra Prasad Bhatta, Govind Giri, Bhagarathi Kumari Ter, Bandana Bhatt, Indu Kumari Chaudhary, Janaki Rawal, Prakash KC, Rupa KC (Dhami), Bimala RC, Padam B Budha, Sarkini Lama, Krishna Sharma, Sangita Malla, Rahika Shahi (Malla), Ratna B Bhandari, Bhim Prasad Sejuwal, Ruchi Singh, Dipa Singh, Ujwal Shrestha, Dipendra Prasad Chaudhary, Hari Prasad Dhakal, Sharmila Paudel, Indira Dhakal Marasini, Shanti Kumari Sharma, Harikala Kandel, Ghanashyam Sharma, Sudarsan Adhikari, Saroj BK, Srijana Ghale and Devi Maya Bogati.
DFID for funding the study, and in particular Mr Matt Gordon and Dr Amit Bhandari for their
valuable inputs throughout the study.
Prof. Tim Ensor and Dr Devi Prasai for inputs into the study design, tool design and training.
Stephen Keeling for editorial support as the document was being finalised.
Options for managerial support, in particular Kate Gray and Dr Kirstan Hawkins.
Oxford Policy Management for technical support throughout the study, in particular Moritz
Piatti.
All NHSSP mentors for technical support, in particular Deborah Thomas.
Representatives of other external development partners for contributing to tool design, in
particular Deepak Paudel (USAID), Susanne Grimm (GiZ) and Albertus Voetberg (World Bank).
All the participants at the preliminary findings workshop, who provided valuable feedback.

xii
EXECUTIVE SUMMARY
A. INTRODUCTION
The second Nepal Health Sector Programme (NHSP 2) provides an overall framework for the
development of Nepal’s health sector between 2010 and 2015. It focuses on increasing access to and
the utilisation of health care services, and aims to address disparities between different income,
gender, caste, ethnic and other groups. The three objectives of NHSP 2 are:
to increase access to and utilisation of quality essential health care services;
to reduce cultural and economic barriers to accessing health care services and harmful cultural practices in partnership with non-state actors; and
to improve the health system to achieve universal coverage of essential health services.
NHSP 2 requires information beyond that collected on a routine basis in order to monitor progress on
the above three objectives. A Service Tracking Survey (STS) was carried out by the Ministry of Health
and Population (MoHP) and the Nepal Health Sector Support Programme (NHSSP) in 2011 to collect
additional facility-based information.
B. METHODOLOGY
The following factors were considered while designing the sampling strategy of the STS: the data
should be nationally representative; key indicators need to be monitored over time; districts need to
be randomly selected for each survey while representing all regions and topographical zones; and all
hospitals within the selected districts should be included, along with a proportion of lower level public
health facilities.
The STS 2011 randomly selected one district from each of 13 sub-regions. A total of 169 health facilities
were assessed across the 13 selected districts covering all the public hospitals and a sample of primary
health care centres (PHCCs) (76%), health posts (41%) and sub-health posts (SHPs) (15%). In addition,
exit interviews were conducted with 1,017 clients: 820 outpatients and 197 women who had recently
delivered or experienced obstetric complications.
C. KEY FINDINGS
The key findings are presented here according to the five objectives of STS 2011.
OBJECTIVE 1: To provide information for monitoring relevant indicators in NHSP 2’s logical
framework and Governance and Accountability Action Plan (GAAP)
NHSP 2 logical framework
In 2011, following consultations within MoHP, it was agreed that the indicators of NHSP 2’s results
framework would be revised in what is now called the logical framework. The findings of STS 2011 have
been compared with the original targets for 2011, which were not revised and are due to be reviewed
in late 2012.
There has been mixed progress towards reaching these targets. The targets have been achieved for
three of the indicators and there was good progress against an additional two indicators for which no

xiii
targets were set for 2011. The 2011 targets were not achieved for six of the indicators and there was
poor progress for two indicators for which no targets were set for 2011.
Achieved target Good progress –
no 2011 target
Not achieved target Poor progress –
no 2011 target
% of health facilities that have undertaken social audits as per MoHP guideline in the last fiscal year;
% of clients satisfied with their health care at hospitals, PHCCs, health posts and SHPs (age, sex and caste/ethnicity);
% of health posts that are birthing centres providing deliveries 24/7.
% of health facilities with at least three females and at least two Dalit and Janajati members in health facility management committees (HFMCs) and hospital development committees (HDC)
% of safe abortion sites with post abortion long acting family planning services.
% of sanctioned posts that are filled — doctors at district hospitals
% of sanctioned posts that are filled - doctors at PHCCs;
% of sanctioned posts that are filled - nurses at district hospitals
% of sanctioned posts that are filled - nurses at PHCCs;
% of PHCCs that provide all basic emergency obstetric and neonatal care (BEONC) signal functions 24/7;
% of health posts providing condoms, pills, injectables, intrauterine contraceptive devices (IUCD) and implants.
% of hospitals that have at least 1 obstetrician-gynaecologist or MDGP (specialist general practitioner), 5 trained nurses, and 1 anaesthetist or anaesthetist assistant;
% of districts that have at least one facility providing all comprehensive emergency obstetric and neonatal care (CEONC) signal functions 24/7.
Governance and accountability
Nearly one third (27%) of the facilities had undertaken a social audit in the current or last fiscal
year. Hospitals were less likely to have, but most of those that did undertake one had produced a
report that was present in their facilities. All Hospitals, 82% of PHCCs, 53% of HPs and 60% of SHPs
that conducted social audits in the previous year, reported that they had incorporated the
recommended actions into their annual work plan and budgets (AWPB).
Most health posts (96%) had a citizen’s charter, followed by hospitals (87%), SHPs (77%) and PHCCs (71%). Nearly four out of five hospitals (79%) had placed the citizen’s charter outside their building in a visible place, while less than a quarter of SHPs (23%) had done so. Of those with a charter, most included information on free drugs, outpatient services and the Aama Programme (if they were implementing the latter).
Hospital development committees (HDCs) had been established in all hospitals and health facility management committees (HFMCs) in all lower level facilities, except for one SHP. Most of these committees were reportedly active and over three-quarters had oriented all their members on their roles and responsibilities. The most common activity by HFMCs and HDCs was infrastructure development and maintenance, and half of the HFMCs and HDCs had recruited health workers.
xiv
However, many HDCs and HFMCs were not holding meetings on a monthly basis while just under half of facilities reported that the female members and members from disadvantaged groups were always active in committee meetings, with a lesser number reporting that these members always participated in decision-making.
OBJECTIVE 2: To provide inputs for the National Health Financing Strategy
MoHP was the main financier of health facilities at all levels except for the higher level hospitals.
All facilities, except for district hospitals, derived a significant proportion of their income from sources not included in the MoHP’s annual work plan and budget. This means that facilities do not report to the government on a significant part of their revenue and expenditure. This could have far-reaching consequences for the way in which the health system is managed towards outputs and outcomes, given the government does not know what these funds are spent on and the extent to which their allocation contributes to achieving health sector goals.
Nearly a quarter of the facilities (20%) reported they had not received their allocated budget from MoHP, while a higher proportion (31%) reported not knowing whether they had received their allocated budgets.
Facilities received most of their budgets in the last trimester. This pattern complicates facility cash management and helps explain why budgets are often under-spent.
Staff salaries were the major expenditure category from funds received from MoHP for all levels of facility. This was more so for hospitals (47% of total expenditure) than for lower level facilities where salaries accounted for about a third of expenditure from MoHP funds.
OBJECTIVE 3: To monitor the implementation of the Aama Programme
Twelve per cent of facilities that should have been implementing the Aama Programme were not.
Maternity clients were relatively well aware of the Aama Programme: 78% were aware that delivery care should be free and 81% knew about the transport incentive. The main sources of information were friends, neighbours and female community health volunteers.
Despite these high levels of awareness only 61% of clients had received the transport incentive they were entitled to and half of clients (50%) had received free delivery care.
There was confusion amongst some clients in regards to the amount they expected to receive and more than one in three women had been asked to show their antenatal care cards to obtain the Aama transport incentive, which is not a requirement as per the Aama guidelines. Both of these factors may be a result of confusion with the separate antenatal care incentive programme. These results highlight that not all facilities comply with the Aama policies, and that different schemes with different rules may hinder compliance.
Not all health facilities had registered the names of the clients provided with benefits, and not all women had been asked to fill in a form as per the Aama guidelines.
OBJECTIVE 4: To monitor the implementation of free health care, including the financial
management capacity of health facilities
Free care
Ninety two per cent of outpatients at district hospitals, PHCCS, health posts and SHPs were aware that health care should be free.

xv
Despite the high levels of awareness about free care more than one tenth of clients (11%) had paid for health care. The most common reason for payment was that it had been a precondition for receiving services.
The number of clients receiving free essential health care services had markedly increased over the three years prior to the STS for all levels of facility. The rate of increase differed by the level of facility with the largest increases at hospitals and PHCCs.
Financial management
Most facilities (94%) had a bank account, but only 85% of mountain facilities had one.
All the hospitals reported having prepared a financial report for the previous fiscal year.
Although three-quarters of hospitals had carried out an internal audit and a final audit in the previous fiscal year, most of the lower level facilities had not. Of those that had conducted a final audit, nearly one-third had been advised to carry out their financial audits in a more timely way.
OBJECTIVE 5: To provide regular information on the functioning (readiness to provide services),
client experiences and quality of priority health services
Human resources
Staff at most facilities (>80%) felt that the number of sanctioned staff was inadequate, especially for maternity services. The official number of sanctioned posts did not always match the actual number. Four key reasons were identified for this: some facilities were being upgraded but the number of sanctioned posts had not yet changed; some existing staff had been promoted into positions not officially sanctioned by that facility; some positions had become defunct but the staff could remain in post until they chose to leave; and some differences reflected the different needs between topographical zones.
At the four higher level hospitals there was no type of cadre for which all posts had been filled. This was largely due to Hetauda hospital only being upgraded to a regional level hospital recently and many of the posts had yet to be filled.
At district hospitals 81% of the sanctioned posts were filled, but less than two thirds of medical officer and health assistant posts were filled. At PHCCs most auxiliary health worker (AHW) and auxiliary nurse midwife (ANM) posts were filled and three-quarters of laboratory assistants, many staff nurse, medical officer and health assistant posts remained unfilled. At health posts most AHW and ANM posts were filled, but only 47% of sanctioned health assistant posts were filled. Overall just over three-quarters of the sanctioned posts at SHPs were filled, including most AHW posts; but only 78% of maternal and child health worker (MCHW) and 61% of village health workers (VHW) posts were filled.
The highest proportions of contract staff was found for medical officers at hospitals and staff nurses at higher level hospitals. HFMCs and HDCs have been responsible for recruiting relatively high proportions of ANMs at the higher level hospitals, AHWs and ANMs at district hospitals, and AHWs and AHWs at health posts.
The shortage of formal anaesthetic and obstetric skills is affecting the provision of caesarean sections. Over half of the hospitals (56%) were unable to provide caesarean sections: 13% had an obstetrician but no anaesthetist and 44% had neither an obstetrician nor anaesthetist.

xvi
Drug supply and storage
Across the 169 facilities, all types of essential drugs were procured from both central and local sources. At hospitals most were procured from central sources, while below hospital most came from local sources.
Only half of the health facilities stored at least some of their drugs in a locked cabinet. However, most facilities stored their drugs in cool and dry locations (87%).
Most hospitals had access to at least two refrigerators, and nearly three-quarters had access to at least one refrigerator 24 hours a day. However, a quarter of PHCCs, over a half of health posts and over three-quarters of SHPs had no access to a refrigerator. Not all of those without constant access to a refrigerator used ice boxes.
Many of the health facilities stored drugs ordered by expiry date; however, nearly one-fifth of hospitals (19%) did not. Less than a half of the facilities (46%) had undertaken a review of their drugs in the previous fiscal year.
A quarter of hospital outpatients and 41% of hospital maternity clients paid for essential drugs that should have been provided free of charge. Maternity clients were more likely to have paid than outpatients, and hospital clients were more likely to have paid than those at lower level facilities. Of those who paid for drugs at hospitals, maternity clients paid an average of Nepali rupees (NPR) 1,892, while outpatients paid an average of NPR 250.
Quality of care
All hospitals and most PHCCs and SHPs had running water with soap; but 18% of health posts did not. There was good availability of bins for biomedical waste disposal.
Most birthing centres were providing routine deliveries (98%), with over three-quarters doing so 24 hours a day (77%). However, less than three-quarters of CEONC facilities (71%) provided all CEONC signal functions on a 24 hour basis and just 39% of districts had at least one facility providing all CEONC functions at all times. Less than half of all BEONC facilities provided all BEONC signal functions 24 hours a day. Just one-fifth of PHCCs provide all BEONC signal functions, with 18% providing all of these on a 24 hour basis (18%). The biggest gaps were seen for the provision of services to remove retained products and to provide assisted deliveries, blood transfusions and caesarean sections.
All selected hospitals and 68% of the PHCCs were officially classified as safe abortion sites. Post abortion care was available at most safe abortion sites (80%), two-thirds provided first trimester abortion care (66%) and over a quarter (26%) provided second trimester abortions. There was good provision of short term hormonal, short-term non-hormonal, long term and permanent methods of family planning at all facility levels (as appropriate) and post-abortion family planning at safe abortion sites.
One-third of clients thought that it was important to improve cleanliness in the facility. However, most clients were satisfied with the care they received with only 4% percent saying they were unsatisfied.
D. 2011 RESULTS AGAINST STS INDICATORS
Table 0.1 presents key indicators from the STS 2011 to reflect each of the key themes. The indicators
that are included in the NHSP 2 logical framework are shaded in tan (darker) colour.

xvii
Table 0.1: Key indicators from the STS 2011
STS 2011 indicators 2011
results
(%)
95% CI
FREE CARE
% of outpatients aware of free care 92.1 83.1-96.6
% of Dalit and Janajati outpatients aware of free care 80.6 50.3-94.3
% of outpatients who paid for care under the free care policy 11.3 6.2-19.7
% of Dalit and Janajati outpatients who paid for care under the free care policy 5.5 2.4-12.4
AAMA PROGRAMME
% of hospitals, PHCCs and health posts implementing Aama 88.0 77.2-94.1
% of maternity clients aware of transport incentive 81.4 54.3-94.2
% of Dalit and Janajati maternity clients aware of transport incentive 82.8 55.2-95.0
% of maternity clients aware of free delivery care 78.3 43.2-94.5
% of Dalit and Janajati maternity clients aware of free delivery care 83.1 47.6-96.4
% of maternity clients who paid for delivery care 50.3 25.2-75.2
% of Dalit and Janajati maternity clients who paid for delivery care 57.3 20.4-84.0
FINANCIAL MANANGEMENT
% of facilities that spent all the money received 26.7 14.1-44.8
% of facilities with a bank account 94.6 74.4-99.1
% of facilities that disclosed their income and expenditure to the public 81.9 67.7-90.8
% of facilities that conducted an internal audit in the last fiscal year 12.7 7.4-21.1
% of facilities that conducted a final audit in the last fiscal year 15.3 9.6-23.5
GOVERNANCE AND ACCOUNTABILITY
% of health facilities that undertook social audits in the current or last fiscal year*
27.4 17.4-40.4
% of facilities that conducted a social audit in the last fiscal year, made findings public and incorporated recommended actions in annual workplan and budget (AWPB)
22.0 15.0-31.0
% of facilities with a citizen’s charter placed in a visible location and included information on free drugs, outpatient services and Aama (if Aama implementing facility)
58.4 43.8-71.8
% of facilities with a health management committee (health facility management committees [HFMCs] and hospital development committees [HDC]) meeting on a monthly basis
37.1 22.3-54.8
% of health facilities with at least three females and at least two Dalit and Janajati members in health facility management committees (HFMCs) and hospital development committees (HDC)*
46.0 36.5-55.8
% of facilities with an emergency contingency plan for women and children 29.4 16.7-46.4
HUMAN RESOURCES
% of sanctioned posts that are filled:

xviii
STS 2011 indicators 2011
results
(%)
95% CI
Doctors at district hospitals* 68.9 46.7-79.6
Doctors at PHCCs* 50.0 35.1-64.9
Nurses at district hospitals* 83.3 74.3-89.6
Nurses at PHCCs* 73.8 60.5-83.8
% of hospitals that have at least 1 obstetrician-gynaecologist or Specialist General Practitioner (MDGP), 5 SBA (skilled birth attendant) trained nurses and 1 anaesthetist or anaesthetist assistant*
31.2 14.5-55.0
% of PHCCs with at least 1 medical officers, 1 health assistant/senior auxiliary health worker (SAHW), 1 staff nurse, 2 AHWs, 3 ANMs and 1 lab assistant in filled post
7.1 0.6-47.8
% of category A health posts with at least 1 health assistant/SAHW, 2 AHW and 1 ANM in filled post
53.3 19.2-84.6
% of category B health posts with at least 1 health assistant/SAHW, 1 AHW and 1 ANM in filled post
20.0 8.7-39.6
% of SHPs with at least 1 AHW, 1 MCHW and 1 VHW in post
50.0 37.8-62.2
DRUG SUPPLY AND STORAGE
% of facilities with drugs stored in a cool and dry place 86.8 64.0-96.1
% of facilities with drugs stored as per first expired, first out (FEFO) principles 87.9 76.5-94.2
% of PHCCs with at least one fridge with guaranteed power 24/7 47.6 24.3-72.0
% of outpatients who paid for essential drugs 40.6 24.0-59.7
% of maternity clients who paid for any drugs 55.0 25.9-81.0
QUALITY OF CARE
% of health facilities with running water and soap 88.0 78.6-93.6
% of facilities with comprehensive biomedical waste management in place (puncture proof bin for needles; bin for disposing of plastics; bin for disposing of blood/fluid stained items; pit for placenta/deep burial)
12.5
8.5-17.9
% of CEONC facilities providing all CEONC signal functions 24/7 71.4 26.4-94.6
% of district hospitals providing all CEONC signal functions 24/7 8.3 0.7-53.2
% of districts with at least one facility providing all CEONC signal functions 24/7* 38.5 21.5-58.8
% of BEONC facilities providing all BEONC signal functions 24/7 40.9 20.1-65.5
% of PHCCs that provide all BEONC signal functions 24/7* 21.1 8.1-45.7
% of health posts that are birthing centres providing deliveries 24/7* 79.2 51.6-93.1
% of safe abortion sites providing post-abortion care, and first trimester abortion 25.7
11.1-48.9
% of safe abortion sites with long acting family planning services* 91.4 77.8-97.0
% of district hospitals providing male and female permanent family planning services 33.3
9.6-70.2
% of health posts providing condoms, pills, injectables, IUCDs and implants* 13.3 5.8-27.9
% of outpatients who thought the facility was overcrowded 30.9 20.2-44.1

xix
STS 2011 indicators 2011
results
(%)
95% CI
% of maternity clients who thought maternity department was overcrowded 23.6 13.9-37.0
% of clients (maternity and outpatients) who thought the facility was clean/very clean 45.4
35.2-56.0
% of clients (maternity and outpatients) who thought the respect for their privacy was good/very good 54.1
37.2-70.0
% of clients (maternity and outpatients) satisfied with their health care* 95.8 91.5-98.0
Note: NHSP 2 logframe indicators are shaded in tan (darker) colour and marked with an asterisk (*).

1
1 INTRODUCTION
1.1 BACKGROUND
The second Nepal Health Sector Programme (NHSP 2) (MoHP 2010a) provides an overall framework for
planning activities within Nepal’s health sector for 2010–2015. NHSP 2 is focused on increasing access
to and the utilisation of health care services, and aims to address disparities between different income,
gender, caste, ethnic and other groups.
The three objectives of NHSP 2 are:
Increase access to and utilisation of quality essential health care services (EHCS).
Reduce cultural and economic barriers to accessing health care services and harmful cultural
practices in partnership with non-state actors.
Improve the health system to achieve universal coverage of essential health services.
NHSP 2 requires information to monitor progress on the above objectives. However, only some of this
information is available from the government’s routine data collection systems including the Health
Management Information System (HMIS). Hence there is a need for additional data collection,
including facility-based and household surveys. Service Tracking Surveys (STS) are therefore being
carried out to gather additional facility-based information to monitor NHSP 2’s objectives. These
surveys are designed to inform health-related programmes at health facility and community levels.
The STS 2011 evolved from previous health facility-based surveys. During the latter part of the first
Nepal Health Sector Programme (NHSP 1, 2004–2009) a health facility survey was conducted three
times per year by the Ministry of Health and Population (MoHP) with support from the Health Sector
Reform Support Programme (HSRSP) to monitor free health care. These surveys were undertaken in
one district in each of 13 sub-regions (see Table 2.1 for these sub-regions). All hospitals within the
selected districts were surveyed along with 44% of primary health care centres (PHCCs), 39% of health
posts (HPs) and 15% of sub-health posts (SHPs). The survey instruments included a facility tool with
questions on the amount of funding received and used for free care; the supply, consumption, and
replenishment of drugs; services provided; referrals; facility monitoring; human resources; the
management of facilities and the quality of care. It also included exit interviews with clients to collect
information on client experiences and characteristics, such as caste and ethnicity.
The Family Health Division (FHD) of MoHP, with the Support to the Safe Motherhood Programme
(SSMP) also undertook facility surveys in 2009 and 2010 to monitor the achievements of the Aama
Programme. This programme provides incentives for mothers to give birth in health facilities. The
instruments used were similar to those used in the HSRSP study although they went into more detail
on quarterly cash flows and services provided.
Given the overlap in previous years in monitoring free care provision and the Aama Programme, from
2011 only one survey is being carried out — an annual STS to that monitors both free care and the
Aama Programme.

2
1.2 SURVEY OBJECTIVES
The objectives of these STSs are as follows:
Provide information for monitoring identified indicators in the NHSP 2 logical framework and
GAAP (Governance and Accountability Action Plan).
Provide inputs for the new National Health Financing Strategy (which is currently under
development).
Monitor the implementation of the Aama Programme.
Monitor the implementation of free health care, including the financial management capacity of
health facilities.
Provide information on the functionality (readiness to provide services), client experiences and
quality of care.
In addition, these surveys aim to provide a detailed accounting of the flow of services and finance,
adherence to annual work plans and budget (AWPB) processes and the availability of human resources.
1.3 TECHNICAL WORKING COMMITTEE
THE STS 2011 was designed and implemented under the guidance of a technical working committee of
government, external development partners and Nepal Health Sector Support Programme (NHSSP)
advisors (see Annex 1.1 for members).
1.4 STRUCTURE OF REPORT
This report has 11 chapters and several annexes. The first part (Chapters 1–3) explains the objectives,
the study methodology and the background characteristics of the 169 health facilities and the 1,017
client respondents covered by the study. Chapters 4 to 10 give the detailed study findings across seven
specified areas linked to monitoring the implementation of NHSP 2. Key STS indicators are presented at
the start of each chapter to summarise the current situation. STS is the source of information for a
number of NHSP 2 logical framework indicators and the final chapter (Chapter 11) presents the
achievements of these indicators against the targets.

3
2 METHODOLOGY
The following factors were considered while designing the sampling strategy for the Service Tracking
Survey 2011 (STS 2011):
the data needs to be nationally representative (but will not provide district level estimates);
the key indicators need to be monitored over time;
the districts will be randomly selected for each survey; but all regions and topographic zones
will be represented in all surveys; and
all hospitals within the selected districts will be included, along with a proportion of primary
health care centres (PHCCs), health posts and sub-health posts (SHPs).
2.1 SAMPLING STRATEGY
District selection — The cluster design for the periodic Nepal Demographic and Health Surveys (NDHS)
stratifies Nepal into three topographic zones (mountain, hill and Tarai), five development regions and
subsequently into 13 sub-regions. Due to their relatively small populations the mountain districts in the
Western, Mid-Western and Far-Western development regions are combined into one sub-region. The
same 13 sub-regional domains were used in the facility surveys conducted by the Ministry of Health
and Population (MoHP)/Health Sector Reform Support Programme (HSRSP) in 2009 and 2010. The STS
2011 took a similar cluster approach to sampling (Table 2.1) by randomly selecting one district from
each of the 13 sub-regions (see Figure 2.1 and the districts in bold in Table 2.1). The advantages of
using this approach are that it is nationally representative and data can potentially be compared with
NDHS data and earlier surveys undertaken by MoHP/HSRSP.
Table 2.1: Districts within the 13 sub-regions (STS 2011 districts are given in bold)
Sub-region (13) Districts (75)
Eastern mountain (3) Taplejung, Sankhuwasabha, Solukhumbu
Central mountain (3) Dolakha, Rasuwa, Sindhupalchowk
Far-/Mid-/Western mountain (10) Bajhang, Bajura, Darchula, Dolpa, Humla, Jumla, Kalikot, Manang, Mugu, Mustang
Eastern hill (8) Bhojpur, Dhankuta, Ilam, Khotang, Okhaldhunga, Panchthar, Terhathum, Udayapur
Central hill (9) Bhaktapur, Dhading, Kavrepalanchowk, Kathmandu, Lalitpur, Makawanpur, Nuwakot,
Ramechhap, Sindhuli
Western hill (11) Arghakhanchi, Baglung, Gorkha, Gulmi, Kaski, Lamjung, Myagdi, Palpa, Parbat, Syangja,
Tanahun
Mid-western hill (7) Dailekh, Jajarkot, Pyuthan, Rolpa, Rukum, Salyan, Surkhet
Far-western hill (4) Achham, Baitadi, Doti, Dadeldhura
Eastern Tarai (5) Jhapa, Morang, Saptari, Siraha, Sunsari
Central Tarai (7) Bara, Chitwan, Dhanusha, Mahottari, Parsa, Rautahat, Sarlahi
Western Tarai (3) Kapilbastu, Nawalparasi, Rupandehi
Mid-western Tarai (3) Bardiya, Banke, Dang
Far-western Tarai (2) Kailali, Kanchanpur

4
Figure 2.1: Map of Nepal showing location of STS 2011 districts
Health facility selection — The sampling approach used to select facilities was designed to produce
nationally-representative but not district-level representative samples. Within the 13 selected districts
a sampling frame was created including all public health facilities divided into hospitals, PHCCs, health
posts and SHPs. The ‘Sampling Manual for Facility Surveys’ (MEASURE Evaluation 2001) was consulted
to identify the number of facilities by type to be sampled. The total number of facilities selected (169)
exceeded the number recommended in the manual (100). Higher-level facilities had a higher
probability of being selected, with all public hospitals in selected districts included. The equal
probability sampling method (EPSEM) was used to select a random sample of PHCCs, health posts and
SHPs.
The number of facilities sampled (169) (see Table 2.2) was similar to previous HSRSP surveys1.
All 16 public hospitals in the study districts, including 12 district level hospitals and four higher
level hospitals, were selected.
Between one and five PHCCs were selected from each of the 13 districts. In districts with one or
two PHCCs, all were selected; in districts with three PHCCs, two were selected; and in districts
with four or more PHCCs, three were selected. This resulted in 28 (76%) of the 38 PHCCs in the
13 districts being selected.
Forty-five of the 110 health posts across the 13 districts were selected, ranging from six to ten
per district. This represented 40% of health posts across the selected districts.
Eighty of the 536 SHPs were selected representing 15% of SHPs in the selected districts.
1 The HSRSP surveys sampled all 15 hospitals (100%), 15 of the 34 PHCCs (44%), 47 of the 120 health posts (39%) and 91 of the
603 SHP (15%). 168 health facilities were sampled from a total of 772 health facilities.

5
Table 2.2: Number of facilities by type and district in total and included in STS 2011
District Population
(census
2011)
HDI*
ranking
(2004)
Hospital PHCC Health post Sub-health
post
No. Sample No. Sample No. Sample No. Sample
Baitadi 252,116 63 1 1 2 2 10 4 55 8
Banke 493,017 29 1 1 3 2 9 4 35 5
Jajarkot 172,565 71 1 1 2 2 7 3 25 4
Kailali 770,279 46 2 2 5 3 7 3 31 5
Kapilbastu 570,612 47 2 2 3 2 7 3 66 10
Mahottari 646,405 59 1 1 3 2 6 2 67 10
Makawanpur 427,494 31 1 1 4 3 10 4 30 5
Mugu 55,311 75 1 1 1 1 8 3 16 2
Panchthar 198,362 24 1 1 2 2 10 4 29 4
Sindhupalchowk 289,455 54 1 1 3 2 10 4 65 10
Solukhumbu 106,772 30 1 1 2 2 9 4 23 3
Sunsari 751,125 16 2 2 5 3 7 3 40 6
Syangja 288,040 7 1 1 3 2 10 4 54 8
n (total facilities) 4,101,042 16 16
(100%)
38 28
(76%)
110 45
(41%)
536 80
(15%)
Note *: HDI = UNDP’s Human Development Index (UNDP, 2004). These rankings, based on 2001 data, are the latest available
district-wise HDI rankings.
Selection procedure for PHCCs, health posts and SHPs:
Step 1: Within each district the PHCCs, health posts and SHPs were listed separately and
arranged in serpentine order commencing at a corner of the sampling frame (for example, the
northwest). Systematic equal probability sampling was used, which gave the same chance of
selection to every facility within the district. Each facility within the district was numbered
following the serpentine order.
Step 2: The sample was selected based on the interval, I = N/n where N is the number of health
facilities in the sampling frame of each district and n is the sample size. For example, four health
posts were selected from among the ten health posts in Makawanpur district — I = 10/4 = 2.5
3. A number between one and three was then selected randomly by lottery. If, for example, 2
was selected, then facility number 2 was selected.
Step 3: The sample interval (3) was then added to the first randomly selected facility (2), i.e. 2 +
3 = 5, meaning that health post 5 was the second selected health post. The third and last health
post to be selected was 5 plus the interval (which is 3), i.e. 5 + 3 = 8, leading to health post 8
being the third selected health post. Following this, the fourth and last selected health post
would have been number 11; but given there are only 10 health posts in Makawanpur district, a
systematic circular procedure indicated that the first health post on the list became the fourth
selected health post.

6
Steps 1 to 3 were repeated to select the other levels of facilities in the district and for the other
twelve districts.
Client selection — Exit interviews were conducted with 820 outpatients and 197 women who had
recently delivered or experienced complications post-delivery. The exit interviews were conducted
with women who were discharged on the day of data collection. The interviewers aimed to interview
all those who left the facility during the time they were conducting the exit interviews.
2.2 QUESTIONNAIRE DESIGN
Questionnaires developed in previous health facility-based surveys provided a basis for developing the
data collection instruments for STS 2011. It was important to ensure that key variables captured in the
earlier surveys were included in the revised instruments to ensure that progress with free care and the
Aama Programme could be tracked.
The following three tools were designed to be administered at health facilities to collect information
for the 2011 survey:
a health facility questionnaire;
exit interviews with outpatients; and
exit interviews with women who had recently given birth at the facility or experienced maternal
complications.
In designing these tools the team referred to other tools to enable comparison, consulted national and
international experts and held review meetings with the STS 2011 technical working committee. The
draft tools were also reviewed by external development partners.
Logical framework indicators — The revised logical framework (2012) of NHSP 2 calls for an STS to be
carried out each year to collect information on the following indicators:
Percentage of clients satisfied with their health care at hospitals, PHCCs, health posts and SHPs.
Percentage of health facilities with at least three females and at least two Dalit and Janajati
members in health facility management committees (HFMCs) and hospital development
committees (HDC).
Percentage of sanctioned posts that are filled - doctors at PHCCs.
Percentage of sanctioned posts that are filled - doctors at district hospitals.
Percentage of sanctioned posts that are filled – nurses at PHCCs.
Percentage of sanctioned posts that are filled - nurses at district hospitals.
Percentage of hospitals that have at least 1 obstetrician-gynaecologist or a specialist general
practitioner (MDGP), 5 SBA (skilled birth attendant) trained nurses and 1 anaesthetist or
anaesthetist assistant.
Percentage of districts with at least one facility providing all comprehensive emergency
obstetric and neonatal care (CEONC) signal functions 24/7.
Percentage of PHCCs that provide all basic emergency obstetric and neonatal care (BEONC)
signal functions.
Percentage of health posts that are birthing centres providing deliveries 24/7.
Percentage of safe abortion sites with post-abortion long-acting family planning services.

7
Percentage of health posts providing condoms, pills, injectables, IUCDs and implants.
Percentage of health facilities that have undertaken social audits as per Government of Nepal
(GoN) guidelines in the last fiscal year.
Tracking resources and activities — The STS 2011 also tracked the financial and human resources of
the health facilities (over Nepali fiscal year 2010/2011 [= mid-July 2010 to mid-July 2011]). The
information collected was of the following four types:
Release of funds covering the date and amount for drugs, free care, transport incentives, free
delivery, training, utilities and other categories.
Expenditure covering monthly spending by spending category/line item.
Staffing — covering filled, deputed and contract (including HFMC and HDC) posts, by staff
category (doctors, health assistants, nurses, auxiliary health workers (AHWs), maternal and
child health workers (MCHWs), village health workers (VHWs) and laboratory assistants.
Receipt of free care (including medicine) and incentive payments.
Service functionality — Information was collected on the readiness of the facilities to provide priority
services; infrastructure; basic and comprehensive emergency obstetric and neonatal care
(BEONC)/CEONC availability and functionality; and the membership and functionality of health facility
management committees (HFMCs).
Translations — Back-to-back translations of the questionnaires (English–Nepali–English) were done to
ensure the quality of the Nepali and English versions prior to pre-testing.
Pre-testing — In mid-August 2011 the questionnaires were pre-tested in Kavre and Sindhupalchowk
districts to validate and finalise the order of questions, and identify any necessary changes. The facility
questionnaire was pre-tested at all four levels of health facilities. Two women who had recently
delivered or had maternal complications and five outpatients were interviewed at each facility. Five
officials from MoHP joined the research team for this exercise. The questionnaire was further modified
during the training of field coordinators and enumerators by taking their feedback into consideration.
2.3 SELECTION OF SUPERVISORS AND ENUMERATORS
Supervisors — One supervisor coordinated data collection in each district. The selection criteria for
coordinators were:
experience in supervising research activities, preferably related to health systems;
experience in conducting facility-based surveys;
good knowledge of the Government of Nepal’s health system;
good writing skills in English and Nepali;
a paramedical background (health assistant, staff nurse) or bachelors degree in medicine, public
health, nursing or social science;
familiarity with local cultural and political situation; and
ability to work as part of a team.
The final criterion was identity, which was considered to achieve a gender, caste and ethnic balance.
Enumerators — Fifty-five enumerators were selected for carrying out the STS 2011, with a further
three enumerators trained as reserves to prevent any interruption to the work. Prospective local

8
enumerators from each district were identified with support from regional health directorates,
international non-governmental organisations (INGOs) and non-governmental organisations (NGOs)
with a presence in the field in the selected districts.
The criteria for the selection of enumerators were as follows:
preferably female;
local residents with familiarity of local language and geographical situation;
educated to least school leaving certificate level;
previous interview or survey experience, ideally related to the health sector;
basic knowledge and experience of the government health system; and
caste and ethnic balance.
2.4 ORIENTATION AND TRAINING
Supervisor orientation — Prior to training, the 13 supervisors took part in a one-day orientation
meeting, which provided an introduction to the questionnaire, fieldwork and code of conduct.
Training — The 65 enumerators and 13 supervisors attended a five-day training workshop in August
2011. The training took place through presentations, role-plays, and group discussions. It covered
survey objectives, approach, ethical issues, research instruments, monitoring and reporting, data
quality assurance and logistical support. Participants were orientated on the three questionnaires with
every question thoroughly discussed and misinterpretations clarified.
2.5 IMPLEMENTATION
Data collection— Enumerators were allocated to all 13 districts in sufficient numbers to ensure that
the fieldwork could be completed within 30 days. Five enumerators were allocated to Makawanpur,
Kapilbastu and Sindhupalchowk districts while four were assigned to all the other districts. Thirteen
district supervisors were assigned. Data collection was undertaken between 12 September and 25
October 2011.
Support and supervision — Monitoring and supervision visits were made by the supervisors soon after
fieldwork started so that any problems could be identified and corrected early on. The research team
planned to visit all 13 districts; but visits were not possible to the remote districts of Mugu and
Solukhumbu. Frequent support was provided to all districts by phone.
Quality assurance — The completed questionnaires were checked by the monitoring team during and
after data collection. Feedback was provided to survey teams during data collection. Supervisors
checked all questionnaires before sending them to Kathmandu for data entry.
2.6 DATABASE DESIGN, CODING, ENTRY AND CLEANING
Database design — Three databases were developed in CS Pro software — one for each tool. The data
entry software was developed to have the same appearance as the questionnaire to minimise data
entry errors. The databases were pre-tested before data entry started, and any errors were fixed.
Coding — Open-ended responses were coded prior to data entry. Completed questionnaires were
assigned unique ID codes.

9
Data entry — The data entry officers received a one-day orientation. The completed questionnaires
were entered into the CS Pro databases. Data entry personnel were hired from among supervisors with
experience in data entry and processing. They were closely monitored by the database designer and
back-up files were created each day to prevent data loss.
Data cleaning — Consistency checks and content cleaning were carried out. Outliers in continuous
variables were checked. Entry errors were cross-checked against hard copies of the completed
questionnaire. Variables were cross-tabulated to check consistency
Data analysis — Statistical analysis software Statistical Product and Service Solutions (SPSS) 16 has
been used for data analysis. Frequency tables of all variables have been produced, along with cross
tabulation with type of facilities for all the facility level information and key socio-demographic (such as
caste/ethnicity, ecological zone, and level of facilities) for exit interview clients.
Weighting Facility data:
In order to produce nationally representative results, when data from all facility levels are
combined, it was necessary to calculate appropriate weights based on the sample design (Annex
2.1). The weighting has eliminated any bias related to the different probabilities of selecting
different levels of facility. Without weighting, the lower level facilities are under-represented, given
the lower proportion selected, and the higher level facilities are over-represented, given the higher
proportion selected. The data were post-stratified, so that the data from each level of facility were
weighted in proportion to the number of facilities at each level of facility, at the national level,
using data from the DoHS Annual Report 2009/10. However, with weighting the total figures are
naturally more reflective of performance at the lower levels given the higher numbers. Given the
large differences in expectations between different levels of facilities for many indicators, a more
accurate picture of performance may be gained by looking at the data for the levels of facility
individually, rather than the combined figure.
The data presented for each level of facility individually were unweighted, as the weight applied to
each level is constant. It was not felt appropriate to give, for example, one PHCC more weighting
than another PHCC just because it was selected from a larger sub-region and so had a lower
probability of being sampled. There is no evidence of greater similarities between facilities within
one sub-region compared to facilities from another, and indeed neighbouring facilities can often be
in stark contrast to one another.
Different weights were applied to assess the functionality of CEONC facilities, BEONC facilities,
birthing centres and Safe Abortion Services. These were calculated based on the distribution of the
different levels of facilities within these categories at the national level (Annex 2.1). Client data:
As with the facility data, it was necessary to calculate appropriate weights for the client exit
interview data based on the sample design, to produce nationally representative results. The
weighting has eliminated any bias related to the different probabilities of selecting different levels
of facility (Annex 2.1).
The client exit interview data were also weighted to eliminate any bias related to the different first
stage probabilities of selecting one district in each sub-region. There are differences in the level of
utilization at each facility level between sub-regions and, without weighting, the characteristics of

10
the larger sub-regions are under-represented and the characteristics of the smaller sub-regions are
over-represented.
The data were post-stratified so that the data from each sub-region and level of facility are
weighted in proportion to the expected utilization of health services, using data from the DoHS
Annual Report 2009/10 for the outpatient exit interview and the Nepal Demographic Health Survey
2011 (NDHS 2011) for the maternity exit interviews.
The weights for both the outpatients and maternity clients were trimmed: any weights greater
than ten were allocated a weighting of ten, and any weights less than 0.1 were allocated a weight
of 0.1 which resulted in ten maternity clients having their weight trimmed.
However in Tables 3.4 and 3.5 unweighted figures are given as our objective there is simply to
describe the sample of clients achieved in terms of facility and district, not to make inference for
clients across Nepal Significance tests and Interval estimation
The sampling design involved the selection of only one PSU (district) within each sub-region (strata),
and also involves post-stratification; such a design cannot be acknowledged precisely in the data
analysis. However, we approximate this design as the selection of districts within strata defined by
ecological zones (mountain, hill, and Terai). We acknowledged the weighting of the data, the
approximate stratification, and the two-level clustering (districts as PSUs and facilities as Secondary
Sampling Units (SSUs)) while computing statistical tests and confidence intervals, using the complex
survey functions of SPSS. Statistical tests were performed for the client data to assess the differences
in utilisation by ecological zone, caste/ethnicity and facility level. However, significance tests were not
performed to assess differences by facility level when using the facility survey data due to the small
number of hospitals sampled and the high sampling fractions of some facility levels, particularly
hospitals.
We have used the complex survey adaptations of the chi-squared test for the categorical variables.
We have reported significance with a p-value of <0.05 (significant at the 5% level).
Confidence intervals were computed for the key variables in each chapter, including all NHSP-2 LF
indicators.
2.7 LIMITATIONS AND CHALLENGES
The main limitations of the methodology of the STS 2011 were as follows:
The STS 2011 is a cross-sectional survey and hence only provides a snapshot of information at
one point in time.
The findings are nationally representative, but the study was not designed to produce sub-
regional or district estimates of the research questions.
Some of the questions relied on the perspective of clients and so their answers may be biased
by subjective interpretations.
Some of the sample sizes, especially when disaggregating the results by caste/ethnicity and
topographical zone are small, and hence further research may be needed to confirm these
observations.
Only descriptive findings and associations have been reported, and no causal relationships have
been deduced between data.
The main challenges faced in carrying out the survey were as follows:

11
Field researchers were unable to meet all representatives from facilities as planned.
Some health workers were uncooperative.
Poor quality record keeping at many health facilities, including inconsistent approaches to
record keeping, facility records kept in locked cupboards with key-holders absent and the
incomplete recording of information and missing pages in record books.

12
3 BACKGROUND CHARACTERISTICS
3.1 INTRODUCTION
This chapter presents the characteristics of the facilities surveyed and clients interviewed. It should be
noted that the characteristics of those interviewed may not be representative of all clients who use the
selected facilities. Infrastructure data is presented at the facility level. Client information is broken
down by type of facility, place of residence, demographic characteristics (sex, age, caste/ethnic group,
religion and education) and services accessed.
3.2 FACILITIES
The Service Tracking Survey 2011 (STS 2011) covered 169 public health facilities: 16 hospitals, 28
primary health care centres (PHCCs), 45 health posts and 80 sub-health posts (SHPs). The 16 hospitals
comprised 1 central level, 1 regional, 2 zonal and 12 district hospitals. (Note the cabinet level decision
to upgrade Hetauda hospital to regional level status [50 beds] was taken just prior to STS 2011 data
collection and upgrading was in process at the time of STS 2011 data collection).
Ownership of health facility buildings — Table 3.1 shows the ownership status of the health facility
buildings. All hospitals surveyed and a high proportion of PHCCs (89%) and health posts (93%) were
self-owned. However, less than two-thirds of SHPs (64%) were self-owned.
Table 3.1: Ownership of health facility buildings by level of facility
Hospital
(%)
PHCC
(%)
Health post
(%)
SHP
(%)
1. Ownership of building
Own building 100 89.3 93.3 63.8
VDC/public building 0.0 3.6 4.4 20.0
Leased/rented 0.0 7.1 2.2 16.3
n (total facilities) 16 28 45 80
2. Length of time rented or leased
1-5 years 0.0 100 100 69.3
> 5 years 0.0 0.0 0.0 30.8
n (total facilities) 0 2 1 13
3. Built by:
Local authority 6.3 15.4 25.0 73.1
MoHP 68.8 69.2 40.9 10.4
INGO/NGO 31.3 19.2 34.1 22.4
Individual 0.0 0.0 2.3 1.5
n (total facilities) 16 26 44 67
Source: STS facility questionnaire
Perceived need for additional construction — The following findings on the need for additional
construction should be interpreted with caution as they are the perspective of health facility
staff and are not derived from a systematic comparable assessment measuring the current

13
situation against government guidelines. Staff at almost all hospitals (94%) reported the need
for additional construction and staff from nearly three-quarters of hospitals (73%) and PHCCs
(71%) reported the need for additional construction of staff quarters (Table 3.2). Likewise, over
half of all staff reported the need for a birthing facility with the need greatest at the lower level
facilities — at 61% of SHPs and 56% of health posts.
Separate delivery room — The likelihood of having a separate delivery room decreased by level
of facility with 89% of PHCCs having a separate room for this purpose compared to 69% of
health posts and only 14% of SHPs.
Table 3.2: Additional construction required and availability of separate delivery rooms
Hospital
(%)
PHCC
(%)
HP
(%)
SHP
(%)
1. Additional construction required 93.8 80.8 81.8 83.6
2. Areas in need of additional construction
Staff quarters 73.3 71.4 58.3 44.6
Birthing unit 40.0 47.6 55.6 60.7
Admin. and finance section 20.0 33.3 47.2 28.6
Outpatient area 46.7 23.8 19.4 37.5
Inpatient ward 73.3 28.6 8.3 7.1
3. Have separate delivery room 100 89.3 68.9 13.8
n (total facilities) 16 28 45 80
Source: STS facility questionnaire
Table 3.3: Availability of permanent and overnight accommodation by level of facility
Hospital
(%)
PHCC
(%)
HP
(%)
SHP
(%)
Permanent accommodation for institution head 100 50.0 35.6 8.8
Permanent accommodation for nurses 93.8 46.4 26.7 5.0
Overnight accommodation for health workers 56.3 35.7 35.6 5.0
Overnight accommodation for nurses 43.8 14.3 8.9 3.8
No accommodation for staff 0.0 35.7 46.7 85.0
n (total facilities) 16 28 45 80
Source: STS facility questionnaire
Staff accommodation — All hospitals had permanent accommodation for the head of the
institution (100%) and most (94%) had permanent accommodation for the nursing staff (Table
3.3). However, the provision of overnight accommodation was less common, with over half
having this for health workers (56%) and less than half for nurses (44%). Permanent and
overnight accommodation was less common at lower-level facilities —just 46% of PHCCs had
permanent accommodation for nurses and 14% had overnight accommodation for nurses.

14
3.3 CLIENT CHARACTERISTICS
A total of 1,017 exit interviews were conducted — 820 (81%) with outpatients and 197 (19%) with
maternity clients. Data are presented separately for maternity clients and outpatients, given that the
services they are accessing differ greatly. When describing the client sample in terms of facility type
and district unweighted percentages are presented, but otherwise to make inference for clients across
Nepal data are weighted to give nationally representative figures (see Section 2.6).
Facility type — Hospitals represented only a small proportion of the facilities surveyed, but their higher
caseloads resulted in most maternity exit interviews being with hospital clients (91%) (Table 3.4).
However, 40% of outpatient exit interviews were conducted with hospital clients. Most of the hospital
exit interviews were conducted at district hospitals (50% of maternity interviews and 25% of outpatient
interviews). More than one quarter (30%) of outpatient interviews were conducted at PHCCs, followed
by 16% at SHPs and 15% at health posts. Of the maternity interviews, 8% were at PHCCs, 1% at health
posts and SHPs.
Table 3.4: Exit interviews by type of facility
Maternity
(%)
Outpatients
(%)
All
(%)
1. Hospital 90.9 40.0 33.3
Central 11.2 3.5 3.3
Regional 9.6 4.4 3.6
Zonal 19.8 7.1 6.4
District 50.3 25.0 19.9
2. PHCC 7.6 29.8 17.0
3. Health post 1.0 14.8 8.1
4. Sub-health post 0.5 15.5 8.4
n (total clients interviewed) 197 820 1,017
Source: STS maternity and outpatient exit interviews
Note: Percentages presented in the table are unweighted
Districts — Most exit interviews were conducted in the four districts with the largest populations —
Mahottari, Sunsari, Makawanpur, and Syangja, which together accounted for 51% of outpatient exit
interviews and 53% of maternity interviews (Table 3.5). The proportion of interviews conducted for
outpatients and maternity cases were similar in each district. Few interviews were conducted in Mugu
owing to the small caseload there.
Place of residence — The maternity clients (14%) were more likely than the outpatients (1.5%) to use a
facility located in a different district from the one in which they normally reside (Table 3.6), suggesting
that maternity clients may be willing to, or need to, travel further than outpatients. For maternity
clients, 82% of PHCC clients interviewed came from the same district, while hospital clients were more
likely to come from a different district (14%). For outpatients, the pattern was similar with all health
post and SHP clients, and 98% of PHCC clients interviewed coming from the same district, and 9% of
hospital clients coming from a different district. The districts with the most non-resident clients were
Sunsari, Banke and Kailali. Sunsari had clients from a wide range of places: Dhankuta, Morang, Saptari,
Bhojpur, Jhapa, Khotang, Saptari, Siraha and India. The non-resident Banke clients came largely from

15
the adjoining district of Bardiya, and non-resident clients in Kailali came largely from the adjoining
district of Kanchanpur. It is not surprising that these districts had the highest proportion of clients
coming from outside their districts given that these districts contain the central and zonal hospitals.
Table 3.5: Number of exit interviews conducted in each district
Maternity
(%)
Outpatients
(%)
All
(%)
Mahottari 15.2 14.6 14.7
Sunsari 15.7 14.6 14.8
Makwanpur 11.7 11.7 11.7
Syangja 10.2 10.0 10.0
Kapilvastu 10.2 9.4 9.5
Kailali 9.6 9.0 9.1
Banke 7.1 7.2 7.2
Panchthar 8.1 7.2 7.4
Jajarkot 1.0 5.1 4.3
Mugu 5.6 4.8 4.9
Baitadi 3.0 3.0 3.0
Sindhupalchowk 2.0 2.4 2.4
Solukhumbu 0.5 0.9 0.8
n (total clients) 197 820 1,017
Source: STS maternity and outpatient exit interviews
Note: Percentages presented in the table are unweighted
Table 3.6: Clients’ place of residence: same or different district
Hospital
(%)
PHCC
(%)
HP
(%)
SHP
(%)
Total
(%)
1. Outpatients
Same district 91.3 97.8 100 100 98.5
Different district 8.7 2.2 0.0 0.0 1.5
n (total clients) 328 244 121 127 820
2. Maternity
Same district 86.4 81.8 100 100 86.1
Different district 13.6 18.2 0.0 0.0 13.9
n (total clients) 179 15 2 1 197
Source: STS maternity and outpatient exit interviews
Urban/rural — Across Nepal 83% of the population resides in rural areas (i.e. village development
committees [VDCs]) (GoN census 2011). To assess whether surveyed clients came from urban or rural
areas, they were asked whether they resided in a municipality or a VDC area. Of the clients interviewed
94% of outpatients resided in rural areas, slightly higher than the national distribution, along with 70%
of maternity clients (Table 3.7). There were very few urban clients in facilities below hospital level, and

16
97% of PHCC outpatients coming from rural areas. At the hospital level 68% of maternity clients and
57% of outpatients were rural.
Table 3.7: Clients’ place of residence: urban or rural
Hospital
(%)
PHCC
(%)
HP
(%)
SHP
(%)
All
(%)
1. Maternity
Rural 68.0 100 100 100 70.3
Urban 30.1 0.0 0.0 0.0 27.9
India 2.0 0.0 0.0 0.0 1.8
n (total clients) 179 15 2 1 197
2. Outpatients
Rural 57.4 96.7 100 100 93.5
Urban 41.7 3.3 0.0 0.0 6.4
India 0.9 0.0 0.0 0.0 0.1
n (total clients) 328 244 121 127 820
Source: STS maternity and outpatient exit interviews
Demographic characteristics — As already stated, the characteristics of clients interviewed may not be
representative of all clients using the facilities. The characteristics of the clients interviewed were as
follows (see Table 3.8):
Sex: 67% of outpatient clients were female and 33% male.
Age: The maternity clients tended to be younger than the outpatient clients with 97% of
maternity clients being under 30 years of age compared to 47% of outpatient clients. Maternity
clients ranged from 16 to 39 years old, with a mean age of 23 years. Male outpatients were
aged between 1 and 85 years with a mean of 37 years while female outpatients were between
1 and 83 years old with a mean of 33 years. (Note that the guardians of child clients were
interviewed.) More than one fifth of maternity clients were under nineteen years old, 3% were
in their thirties and none were over 40 years. In contrast, 35% of outpatients were over 40
years. Nationally, the NDHS 2011 found that 20% of mothers were under 20 years old, 73%
were between the ages of 20 and 34 years and 7% were older than 35 years.
Marital status: All but one of the maternity clients were married (the exception was a widowed
woman), compared to 83% of outpatients. Twelve per cent of outpatients were single, 5%
widowed and 0.5% were separated.
Caste and ethnic group: Thirty per cent of outpatients and 31% of maternity clients were from
the Brahmin and Chhetri castes. Many maternity clients (69%) and outpatients (70%) belong to
castes and ethnic groups that are prioritised for social inclusion initiatives. NHSP 2 classifies
Dalits, Adibasi-Janajati (Newar and Janajati), Madhesi other castes and Muslims as excluded
caste and ethnic groups. Note that the study followed the caste, ethnic and other population
group categorisation as given by Bennett et al. (2008). This has the groups of Brahman/Chhetri,
Terai/Madhesi other castes2, Dalits, Newars, Janajatis (ethnic groups excluding Newars),
Muslims and other (see Annex 3.1).
2 Note that ‘Tarai/Madhesi other castes’ are also referred to as ‘Other Backward Classes’ (OBCs).

17
Table 3.8: Demographic characteristics of surveyed clients
Background characteristics
Maternity
(%)
Outpatients
(%)
All
(%)
1. Sex
Female 100 66.9 72.6
Male - 33.1 27.4
2. Age (years)
<20 21.7 12.7 14.2
20-24 46.9 18.0 23.0
25-29 28.1 16.3 18.3
30-34 2.7 9.6 8.4
35-39 0.7 8.8 7.4
40+ 0 34.7 28.8
Don't know 0 0 0.0
3. Marital status
Married 100 82.5 85.5
Widowed 0.0 5.0 4.1
Separated 0.0 0.5 0.4
Single 0.0 12.0 9.9
4. Caste-ethnic group
Brahmin and Chhetri 30.8 29.8 30.0
Janajati 26.2 30.7 29.9
Terai-Madhesi other castes 22.0 16.7 17.6
Dalits 8.3 15.6 14.3
Muslim 8.4 4.4 5.1
Newar 4.1 2.8 3.0
Other 0.2 0.1 0.1
5. Education
No schooling – illiterate 24.9 50.1 45.8
No schooling – literate 4.1 10.9 9.7
Grade 1-5 14.7 10.6 11.3
Grade 6-9 27.4 14.6 16.8
SLC 14.7 10.4 11.1
Proficiency certificate 5.1 1.9 2.5
Bachelor degree or above 9.1 1.6 2.9
6. Religion
Hindu 86.1 80.4 81.4
Buddhist 2.9 9.4 8.3
Muslim 8.3 5.3 5.8
Christian 0.9 2.3 2.1
Kirat 1.8 2.6 2.5
n (total clients) 197 820 1,017

18
Source: STS maternity and outpatient exit interviews
Education — In general, the maternity clients were more educated than the outpatients, and the
outpatients were more likely to be illiterate (50% compared to 25%). This is largely a reflection of
the differences in the age structure with maternity clients tending to be younger than outpatients
and hence more likely to have a higher level of education. More than half of maternity clients
(56%) had completed up to grade 6-9 at school, and 29% had completed their school leaving
certificate (SLC) or higher (grade 10+). For outpatients, 29% had completed grade 6-9, and 14%
their SLC or higher.
Religion — Most clients were Hindu (86% of maternity clients and 80% of outpatients). There was a
higher proportion of Buddhist clients using outpatient services than maternity services (3%
compared to 9%).
Services accessed — The study found that (Table 3.9):
over four-fifths of exit interviewees were outpatients and the remaining 19% were maternity
clients, reflecting the higher caseload of outpatients at the facilities; and
most outpatients interviewed attended for general curative services (85%), followed by acute
respiratory infections (10%) and diarrhoea (10%).
Note that obstetric clients were interviewed using the outpatient tool if it had been more than
42 days since their delivery.
Table 3.9: Purpose of visits to health facilities
Purpose of visit %
General Curative Services 85.4
Diarrhoea 10.2
ARI 10.1
Antenatal Care 5.2
Family Planning 4.9
Immunization 3.8
Postnatal Care - infant 2.9
Lab test and x-ray 1.8
Postnatal Care - mother 1.5
Delivery care 1.1
TB 0.6
Gynaecological problem 0.5
Other 0.5
n (total clients) 820
Source: STS maternity and outpatient exit interviews
Maternity services — Most of the maternity clients interviewed had delivered at the facility (96%),
with 12% having arrived before labour started, 76% during the first 24 hours of labour and 8% after 24
hours of labour (Table 3.10). The reasons for attending before going into labour included breech
pregnancies and eclampsia.

19
Table 3.10: Stage of childbirth when maternity clients arrived at facilities
Stage %
Before labour 12.2
During first 24 hours of labour 75.7
After 24 hours of labour 8.4
Postpartum 3.7
n (total clients) 197
Source: STS maternity exit interviews
Childbirth complications — Nearly one third (27%) of the surveyed maternity clients reported that
they had experienced a complication prior to arriving at the facility (Table 3.11). This reflects the
2008/09 maternal mortality and morbidity (MMM) study findings, which showed that those
experiencing complications were more likely to go to a facility for delivery (Pradhan et al. 2010). The
most common complication experienced prior to arrival was prolonged or obstructed labour (51%),
followed by antepartum haemorrhage (26%).
Table 3.11: Experience of complications by maternity clients prior to arrival
Experience of complications %
1. Had complication prior to arrival at facility 27.2
n (total clients) 197
2. Complications
Prolonged/obstructed labour 51.2
Antepartum haemorrhage 25.5
Vaginal bleeding during pregnancy 14.3
Retained placenta 6.3
High blood pressure 5.1
Postpartum haemorrhage 3.8
Intrapartum haemorrhage 3.5
Puerperal sepsis/infection 1.3
Eclampsia/pre-eclampsia 0.5
Missing 0.6
n (total clients) 45
Source: STS maternity exit interviews
Mode of delivery — Among the maternity clients interviewed, 92% were seen as inpatients and 8% as
outpatients. Of those who were seen as outpatients, most had arrived within the first 24 hours of
labour (81%). For those who delivered at the facility, most had a normal delivery (96%), with 3% having
an assisted delivery and 0.7% a caesarean section (note that the mode of delivery findings reflect those
who were interviewed and are not necessarily reflective of the population) (Table 3.12). The main
reasons for having an assisted or caesarean delivery were prolonged labour (66%) and foetal distress
(42%).

20
Table 3.12: Mode of delivery, for those who delivered in an STS 2011 facility
Mode of delivery for those who delivered in an STS 2011 facility %
1. Mode of delivery
Normal 96.1
Vacuum aspiration/forceps delivery 3.2
Caesarean section 0.7
n (total clients) 189
2. Reason for assisted/caesarean delivery
Prolonged labour 65.5
Foetal distress 41.6
Multiple pregnancy 3.3
Client requested caesarean section 6.6
n (total clients) 10
Source: STS maternity exit interviews
Time of delivery — The deliveries of those interviewed were not evenly distributed throughout the day
with 40% occurring between 9am and 3pm — the timing most convenient to service providers (Table
3.13).
Table 3.13: Time of delivery of women who delivered in the facilities
Time period %
09:00-14:59 hrs 40.3
15:00-20:59 hrs 15.8
21:00-02:59 hrs 14.9
03:00-08:59 hrs 29.0
n (total clients) 189
Source: STS maternity exit interviews

21
4 FREE CARE
4.1 INTRODUCTION
The interim Constitution of Nepal, 2007 (the current constitution) considers the right to health as a
fundamental right of the people of Nepal and guides the state’s actions. The Government of Nepal
introduced free health care in several stages:
Since 2006, emergency and inpatient services have been provided free of charge to poor
people, people living with disabilities, senior citizens and female community health volunteers
(FCHVs) in district hospitals (of up to 25 beds) and primary health care centres (PHCCs) (as per
government decision of 15 December 2006).
Since January 2008, the provision of free care services has been expanded to all citizens at sub-
health post (SHP) and health post level (as per decision of 8 October 2007).
Since January 2009, all services at district hospitals (of up to 25 beds) have been provided free
of charge for the targeted population groups of poorer people, poor/destitute/helpless people,
people living with disabilities, senior citizens and FCHVs.
Also since January 2009, essential drugs have been made available free of charge to all citizens
(see list of drugs in Annex 4.1) and delivery care (childbirth) services have been provided free of
care (see survey findings on the latter in Chapter 5).
Therefore, according to government policy, primary outpatient care3 consultations, essential drugs,
and institutional deliveries in all public and some private facilities should be provided free of charge to
all citizens, while targeted population groups also benefit from free secondary care.
This chapter presents the findings of the Service Tracking Survey, 2011 (STS 2011) on the situation of
free health care in 169 public sector health facilities. Data are presented from the STS facility
questionnaire and exit interviews conducted with outpatients (N=820). The STS data collection also
reviewed Health Management Information System (HMIS) record forms. Analysis by type of facility,
topological zone and ethnicity is given where relevant.
4.2 RESULTS
Box 4.1: Key STS indicators for free care
Indicators 2011 results
(%)
95%CI
% of outpatients aware of free care 92.1 83.1-96.6
% of Dalit and Janajati outpatients aware of free care 80.6 50.3-94.3
% of outpatients from mountain districts aware of free care 82.6 41.1-96.9
% of outpatients who paid for care under the free care policy 11.3 6.2-19.7
% of Dalit and Janajati outpatients who paid for care under the free care policy 5.5 2.4-12.4
3 In the remainder of this chapter ‘outpatient care’ refers to primary outpatient care, unless stated otherwise.

22
4.2.1 Awareness
Under the free care policy district hospitals, PHCCs, health posts and SHPs should all provide outpatient
care and essential drugs free of charge. Three of the 169 health facilities are referral hospitals (BP
Koirala Institute of Health Sciences, Bheri Zonal Hospital and Seti Zonal Hospital) and were excluded
from the outpatient exit interviews as they are not included in the free care policy.
The STS 2011 found that 92% of outpatients were aware that services should be provided free of
charge. Brahmins and Chhetris (98%) were most aware of free essential health care with the Dalits the
least aware (77%) (Table 4.1). This difference is statistically significant (p=0.004). There was no
significant difference in awareness of the entitlement to free care by topographical zone (Table 4.2).
Most clients had learned about free care from their friends and neighbours (58%), followed by family
members and relatives (41%) and FCHVs (28%) (Table 4.1). There is little difference by caste/ethnicity,
with friends/neighbours being the main source of information on free care for all groups.
Table 4.1: Awareness of free care and source of information by caste/ethnicity
Brahmin/
Chhetri
(%)
Terai/ Madhesi
other castes
(%)
Dalits
(%)
Newar
(%)
Janajati
(%)
Muslim
(%)
Total
(%)
P
1. Aware of entitlement to free care 97.8 91.5 77.2 95.5 94.6 90.6 92.1 0.004
n (total clients) 234 133 105 18 196 47 733
2. Source of information:
Friends/ neighbours 57.8 43.6 47.4 76.3 69.3 42.6 57.7
Family member/ relative 39.8 37.5 58.6 19.9 37.7 41.3 40.8
FCHV 20.1 40.8 35.2 58.2 18.3 68.0 28.1
Facility staff 28.1 25.5 21.8 24.3 21.5 5.1 23.7
Radio 28.9 17.7 9.6 20.5 28.6 9.4 23.3
Health providers 17.2 22.1 17.4 7.9 20.1 11.0 18.5
Posters/ pamphlets 4.0 7.5 7.0 0.0 5.3 0.0 5.1
Television 4.0 7.4 0.5 0.0 3.5 13.3 4.2
Teachers 0.5 0.0 4.6 0.0 0.2 0.0 0.8
n (total clients) 219 106 96 16 180 40 657
Source: STS outpatient exit interviews

23
Table 4.2: Awareness of free care and source of information by topographical zone
Sources
Mountain
(%)
Hill
(%)
Terai
(%)
Total
(%)
P
1. Aware of entitlement to free care 82.6 96.7 89.4 92.2 0.208
n (total clients) 86 247 400 733
2. Source of information:
Friends/ neighbours 62.1 62.0 51.7 57.7
Family member/ relative 29.2 36.5 47.7 40.8
FCHV 22.7 25.8 31.7 28.1
Facility staff 8.2 24.6 25.5 23.7
Radio 33.4 30.9 12.6 23.3
Health providers 35.3 15.6 18.5 18.5
Posters/ pamphlets 2.6 4.8 6.0 5.1
Television 1.8 2.4 6.7 4.2
Teachers 1.6 0.3 1.3 0.8
n (total clients) 78 230 349 657
Source: STS outpatient exit interviews
4.2.2 Client reporting of payment
Although care should have been free and most clients were aware of this (Table 4.1), one in ten (11%)
had paid for their services (Table 4.3). There are some variations by caste/ethnicity, p=0.02, with
Muslims (3%) being the least likely to pay for services, and Brahmin/Chhetris the most likely to (16%).
There was no significant difference in client reporting of payment for services by topographical zone
(Table 4.4). Of those clients who paid for services by giving a tip to health personnel, few did so
voluntary, with no statistically significant difference by caste/ethnicity (Table 4.3) or topographical
zone (Table 4.4).
Table 4.3: Payment for free care by caste and ethnic group
Brahmin/
Chhetri
(%)
Terai/ Madhesi
other castes
(%)
Dalits
(%)
Newar
(%)
Janajati
(%)
Muslim
(%)
Total
(%)
P
1. Paid for services that should be free
16.4 7.6 4.9 9.5 13.0 3.1 11.3
0.021
n (total clients) 234 133 105 18 196 47 733
2. Told to pay tip to health service provider
100 100 100 100 97.2 100 99.0
0.853 3. Voluntarily paid tip to service provider
0.0 0.0 0.0 0.0 2.8 0.0 1.0
n (total clients) 87 45 24 4 57 13 230
Source: STS outpatient exit interviews

24
Table 4.4: Payment for free care by topological zone
Information on free care
Mountain
(%)
Hill
(%)
Terai
(%)
Total
(%)
P
Paid for services that should be free 29.0 13.0 5.9 11.3 0.242
n (total clients) 86 247 400 733
Told to pay a tip to health service provider 100 98.4 100 99.0
0.717 Voluntarily paid tip to health service provider 0.0 1.6 0.0 1.0
n (total clients) 41 82 107 230
Source: STS outpatient exit interviews
Reasons for payment
Overall, more than three quarters of clients (78%) who had paid for services reported that payment
had been a condition for receiving the service (Table 4.5). The second and third most common reason
given by clients had been that the drugs given were not on the essential drug list (i.e. provided free of
charge) (25%) and that the facility had run out of essential/free drugs (8%).
Table 4.5: Reasons for payment, by caste/ethnicity
Brahmin/
Chhetri
(%)
Terai/ Madhesi
other castes
(%)
Dalits
(%)
Newar
(%)
Janajati
(%)
Muslim
(%)
Total
(%)
Would not get treatment unless paid
87.4 92.3 80.3 76.4 63.6 66.9 78.2
Medicine not in free drugs list
14.8 15.9 25.7 0.0 44.7 0.0 25.3
No free drugs in stock 8.9 4.4 2.3 23.6 9.9 0.0 8.0
Facility short of money 0.0 4.4 7.0 0.0 11.7 18.0 5.7
Free services not available at facility
4.7 15.9 8.0 0.0 0.2 15.1 4.6
Not entitled to free services
2.0 1.1 5.0 0.0 1.0 36.0 2.3
n (total clients) 82 45 20 3 57 12 219
Source: STS outpatient exit interviews
The reason given for having to pay for care was more or less similar in different topological zones. The
most commonly reported reason in every region was that the client would not get treatment unless
they paid (67% of Mountain, 82% of Hill and Terai) (Table 4.6).

25
Table 4.6: Reasons for payment, by topological zone
Reason for paying
Mountain
(%)
Hill
(%)
Terai
(%)
Total
(%)
Would not get treatment unless paid 66.8 81.6 82.3 78.2
Medicine not in free drugs list 34.1 25.8 17.6 25.3
No free drugs in stock 11.2 6.4 10.5 8.0
Facility short of money 18.0 0.0 5.7 5.7
Free services not available at facility 2.1 2.3 12.6 4.6
Not entitled to free services 4.1 0.5 4.4 2.3
n (total clients) 41 73 105 219
Source: STS outpatient exit interviews
4.2.3 Facility reporting of provision of free care
The number of clients receiving free health services has markedly increased over time for all levels of
facility (Figure 4.1). The rate of increase, however, differs greatly by facility type. For health posts and
SHPs there has been a small increase for each year since 2008/09. For PHCCs and hospitals4, following
a small increase between 2008/09 and 2009/10 there was a large increase between 2009/10,
especially for the district hospitals, with a 160% increase over three years (Figure 4.1). The lowest
increase was at health post level (a 14% increase).
Figure 4.1: Clients receiving free services by level of facility (average per facility type) (for fiscal
years 2008/09 to 2010/11)
Source: STS facility questionnaire
The rate of increase in the number of clients receiving free care by topographical zone has been
uneven (Figure 4.2). In the Terai districts the number of clients receiving free care saw a large increase
4 Includes Hetauda hospital but not other higher level hospitals

26
from 2008/09 to 2010/11, whereas the hill districts saw a modest increase over this period while the
mountain districts saw a modest increase between 2008/09 and 2009/10 but a decrease between
2009/10 and 2010/11.
Figure 4.2: Clients receiving free services by level of facility (average per topographical zone) (for
FYs 2008/09 to 2010-11)
Source: STS facility questionnaire
4.2.4 Drugs under the free care policy
The government’s free health care policy includes a list of essential drugs that each type of facility
should provide free of charge to clients. Hospitals should provide 40 types of drugs free of charge,
PHCCs, health posts 35 and SHPs 25. Annex 4.1 shows the list of essential drugs while Chapter 9 reports
the detailed survey findings on drug supply.
4.3 KEY FINDINGS
Awareness
Ninety two percent of outpatients at district hospitals, PHCCs, health posts and SHPs were
aware that health care should be free.
Brahmins and Chhetris (98%) were most likely to be aware of free health care and Dalits (77%)
least likely.
Most clients learned about free care through their friends and neighbours (56%), family
members and relatives (41%) and female community health volunteers (28%).
Client reporting of payment
Although care should have been free, and most clients knew it, one in ten clients (11%) had paid
for health care.

27
By far the most common reason why clients had paid for health care that should have been free
was that payment was said to have been a precondition for receiving the services with more than
three-quarters of clients (78%) giving this as a reason. The second and third most common reasons
were that the required drugs were not on the list of essential/free drugs (25%) and that the facility
had run out of essential/free drugs (8%).
Facility reporting of the provision of free care
Data from HMIS shows that the number of clients receiving free essential health care services
has markedly increased over the past three years for all levels of facility.
The rate of increase differs by the level of facility with the largest increases at hospitals and
PHCCs.
There was an uneven rate of increase by topological zone. The number of clients receiving free
care saw a large increase over the three fiscal years 2008/09–2010/11 in the Terai districts, while
the increase was modest in the hill districts and there was a reduction between 2009/10 and
2010/11 in the mountain districts.
The SHPs, health posts and PHCCs reported providing free care to most of their clients, thus
suggesting that the free care policy is being correctly implemented.

28
5 AAMA PROGRAMME
5.1 INTRODUCTION
One of the main objectives of the Aama Programme is to reduce the financial barriers households face
in accessing delivery care and thereby improve maternal and child health outcomes. Through the
programme all women delivering in health facilities that are implementing the Aama Programme (both
public and non-public), receive free delivery care and a transport incentive. Cash incentives were
initiated in July 2005 under the Safe Delivery Incentive Programme (SDIP) with NPR 1,000 paid to
women residing in the mountain and hill districts that ranked the lowest on the human development
index (HDI). Free institutional delivery care was subsequently launched in January 2009, and a separate
programme for antenatal care (providing incentives for women who attend four antenatal care
checkups) began in 2009 funded from pooled donor contributions.
The Aama Programme provides the following:
Transport incentives – all women who deliver in a facility implementing the Aama Programme
receive a cash payment after delivery. The amount received varies by topographical zone, with
women residing in mountain districts receiving NPR 1,500, women in hill districts NPR 1,000 and
women in Terai districts NPR 500.
Free delivery care — all women who deliver in a facility implementing the Aama Programme
are entitled to free delivery, irrespective of the mode of delivery. A payment is made to health
facilities for providing free care. For a normal delivery, health facilities with less than 25 beds
receive NPR 1,000 and facilities with 25 beds or more receive NPR 1,500. For complicated
deliveries health facilities receive NPR 3,000 and for caesarean sections NPR 7,000. These
payments are designed to cover all required drugs, medical supplies and instruments and an
incentive to health workers of NPR 300.
Incentives to health workers for home deliveries – An incentive payment of NPR 300 used to
be paid to health workers who attended home deliveries to encourage deliveries by skilled birth
attendants. This incentive is being phased out to promote institutional delivery and has been
reduced to NPR 200 per delivery.
Previous studies (Powell-Jackson et al. 2010; SSMP and CREHPA 2010) have highlighted the following
challenges associated with the Aama Programme: substantial increases in demand for delivery care
may affect the quality of care; the need for continuously strengthening financial management systems
at all programme levels; the need to monitor the rate of caesarean sections to avoid supply-side
induced demand; and the need to strengthen referral systems.
This chapter reports the findings of the Service Tracking Survey 2011 (STS 2011) on the implementation
of the Aama Programme. Information was gathered from the facility-based questionnaire for 94 of the
169 facilities that were implementing the Aama Programme, with public health nurses and family
planning assistants as respondents. The Health Management Information System (HMIS) recording
forms of the facilities were also accessed as a source of information for the facility questionnaire. Exit
interviews were administered to 197 women who had recently delivered or had experienced
complications in facilities implementing the Aama Programme. This chapter reports the findings from
the facility and exit interview tools on the general implementation of the scheme, the transport
incentives, free delivery care and home delivery incentives.

29
5.2 RESULTS
Box 5.1: Key STS indicators for the Aama Programme
Indicators 2011 results
(%)
95% CI
% of hospitals, PHCCs and health posts implementing Aama 88.0 77.2-94.1
% of maternity clients aware of transport incentive 81.4 54.3-94.2
% of Dalit and Janajati maternity clients aware of transport incentive 82.8 55.2-95.0
% of maternity clients aware of free delivery care 78.3 43.2-94.5
% of Dalit and Janajati maternity clients aware of free delivery care 83.1 47.6-96.4
% of maternity clients who paid for delivery care 50.3 25.2-75.2
% of Dalit and Janajati maternity clients who paid for delivery care 57.3 20.4-84.0
5.2.1 Facilities implementing Aama Programme
All public hospitals, primary health care centres (PHCCs) and health posts are required to implement
the Aama Programme. Most hospitals (94%) and PHCCs (96%) were implementing the Aama
Programme, along with 82% of health posts (Table 5.1). Note that some facilities are counted as ‘not
providing Aama’ because they do not provide delivery care. Sub-health posts (SHPs) can choose to opt
into the Aama Programme if they meet certain criteria and are approved by the Family Health Division
(FHD). Of the surveyed sub-health posts 19% were voluntarily implementing the Aama Programme.
However it should be noted that SHPs with birthing centres were prioritised for selection in the
sampling of SHPs and hence this is not a generalisable figure.
All of the hospitals and PHCCs, 92% of health posts and 67% of sub-health posts that were
implementing the Aama Programme reported provided the incentives (Table 5.1). These figures do not
tally with what the clients report as only 63% of women reported actually receiving the incentives (see
Table 5.6 below). This suggests that facilities over-report on the number of women they provide
transport incentives to, but further research is needed to confirm this.
Table 5.1: Health facilities implementing the Aama Programme
Implementation status
Hospitals
(%)
PHCCs
(%)
HPs
(%)
Total (hospitals, PHCCs, HPs)
(%)
SHPs (optional)
(%)
Implementing Aama Programme
93.8 96.4 82.2 88.8 19.0
n (total facilities) 16 28 45 89 80
Facility reported providing transport incentive to clients 100 100 91.9 96.2 66.7
n (total facilities) 15 27 37 79 15
Source: STS facility questionnaire

30
5.2.2 Client awareness
Transport incentives
Overall 81% of maternity clients were aware of the transport incentive with no significant difference by
caste/ethnicity or topographical zone (Table 5.2 and 5.3). Overall clients’ main sources of information
on the transport incentive were friends and neighbours (53%), followed by female community health
volunteers (FCHVs) (44%) (Table 5.2).
Table 5.2: Awareness of transport incentives and source of information, by topographical zone
Awareness of transport incentives and
source of information
Mountain
(%)
Hill
(%)
Terai
(%)
Total
(%)
P
1. Aware of entitlement to transport incentive 100.0 84.1 78.1 81.3 0.606
n (total clients) 19 55 123 197
2. Sources of information
Friends/neighbours 15.9 51.2 58.0 53.1
FCHVs 72.9 40.0 43.0 43.5
Facility staff 12.8 24.2 31.4 27.6
Health providers 21.9 37.5 14.8 24.0
Family members/relatives 58.7 14.1 41.8 31.9
Radio 2.5 26.8 9.7 16.0
Television 7.5 13.0 5.5 8.5
Posters/pamphlets 0.0 2.2 5.8 4.1
n (total clients) 18 48 100 166
Source: STS maternity exit interviews

31
Table 5.3: Awareness of transport incentives and source of information, by caste/ethnic group
Awareness of transport incentives and
source of information
Brahmin/
Chhetri
(%)
Terai/ Madhesi other
castes
(%)
Dalits
(%)
Newar
(%)
Janajati
(%)
Muslim
(%)
Other
(%)
Total
(%)
P
1. Aware of entitlement to transport incentive
76.5 83.3 84.6 71.4 83.7 92.9 0.0 81.3 0.656
n (total clients) 59 40 18 10 59 10 1 197
2. Sources of information
Friends/neighbours 40.8 59.5 34.2 26.5 69.7 54.0 0.0 53.1
FCHVs 29.4 48.8 57.0 46.5 48.2 49.5 0.0 43.5
Facility staff 18.7 42.1 43.4 0.0 29.1 13.4 0.0 27.6
Health providers 35.6 20.1 13.5 38.7 21.9 8.9 0.0 24.0
Family members/relative 23.5 37.7 28.3 0.0 23.5 82.4 0.0 31.9
Television 19.3 0.0 0.0 3.9 9.9 1.4 0.0 8.5
Radio 22.7 5.4 18.6 0.0 24.2 1.4 0.0 16.0
Posters/pamphlets 0.0 6.3 10.5 20.7 4.0 0.0 0.0 4.1
n (total clients) 48 32 17 8 51 9 0 166
Source: STS maternity exit interviews

32
Free care
Overall 78% of maternity clients were aware that goods and services related to delivery care should be
provided free of charge with no significant difference between topographical zone or caste/ethnicity
(Table 5.4 and 5.5). Of the 155 clients who had been aware that delivery care services should be free,
93% had known this prior to visiting the facility. The main source of information on free delivery care
was friends and neighbours (54%) followed by family members/relatives (44%) and FCHVs (42%) and
(Table 5.4).
Table 5.4: Awareness of free care and source of information, by topographical zone
Awareness of free delivery health care
Mountain
(%)
Hill
(%)
Terai
(%)
Total
(%)
P
1. Aware of free delivery at health facility? 100 81.0 75.0 78.3 0.696
n (total clients) 19 55 123 197
2. When aware of free delivery
2.1. Aware of free delivery prior to going to health facility
100 94.1 91.7 93.1
2.2. Became aware of free delivery only after going to health facility
0.0 5.9 8.3 6.9
n (total clients) 17 45 93 155
3. Sources of information on free care
Friends/neighbours 20.5 58.3 53.6 53.6
Family members/relatives 57.8 29.4 52.2 43.6
FCHVs 65.7 33.4 44.9 41.6
Facility staff 6.5 37.6 26.3 29.6
Health providers 21.2 22.3 18.9 20.3
Radio 6.5 32.7 10.4 18.9
Television 7.6 7.9 5.7 6.6
Posters/pamphlets 0.0 2.7 3.3 5.9
n (total clients) 17 45 93 155
Source: STS maternity exit interviews

33
Table 5.5: Awareness of free care and source of information, by caste and ethnic group
Source of Information Brahmin/ Chhetri
(%)
Terai/ Madhesi other
castes
(%)
Dalits
(%)
Newar
(%)
Janajati
(%)
Muslim
(%)
Others
(%)
Total
(%)
P
1. Aware of free delivery 70.6 81.1 100 42.9 79.1 100.0 0.0 78.3 0.154
n (total clients) 59 40 18 10 59 10 1 197
2. When aware of free delivery
2.1. Aware of free delivery prior to going to health facility
94.4 96.7 84.6 100.0 88.2 100.0 0.0
93.1
2.2. Became aware of free delivery only after going to facility
5.6 3.3 15.4 0.0 11.8 0.0 0.0
6.9
n (total clients) 42 33 17 6 47 10 0 155
3. Sources of information
Friends/neighbours 48.3 48.4 37.8 21.6 69.3 61.3 0.0 53.6
Family members/relatives 38.8 53.6 46.0 0.0 26.8 80.9 0.0 43.6
FCHVs 32.3 56.1 53.2 67.6 42.2 16.6 0.0 41.6
Facility staff 30.8 32.5 21.8 0.0 36.9 15.1 0.0 29.6
Health providers 28.8 8.6 31.3 7.2 14.8 29.1 0.0 20.3
Radio 26.1 8.2 25.0 0.0 26.8 1.3 0.0 18.9
Television 7.9 10.9 0.0 14.4 5.7 1.3 0.0 6.6
Posters/pamphlets 4.4 9.5 0.0 0.0 9.6 0.0 0.0 5.9
n (total clients) 42 33 17 6 47 10 0 155
Source: STS maternity exit interviews

Service Tracking Survey 2011
34
5.2.3 Client receipt
Transport incentives
The STS 2011 found that only 61% of the clients had actually received the transport incentive at the
time of discharge (Table 5.6) despite 81% of them being aware of their entitlement (see Table 5.2).
There were no significant differences in the extent to which clients from the different caste and ethnic
groups or different topographical zones received the transport incentives.
Clients from the mountain districts received NPR 1,500 for the transport incentive — which is the
amount they expected and the amount they should receive (Figure 5.1). However, clients from the hill
and Terai districts expected to receive slightly more than they were entitled to and reported receiving
similar to what they were entitled to. It is possible that women from hill and Terai districts perceive the
4ANC and the Aama transport incentive to come as one incentive package. This casts doubt on the
validity of client responses regarding how much they received for the transport incentive despite being
asked at the time of discharge. Similar, but distinct, policy interventions seem to be causing confusion.
Table 5.6: Payment for delivery care and receipt of incentive payments, by caste and ethnicity
Receipt of Incentive
Brahmin/
Chhetri
(%)
Terai/ Madhesi
other castes
(%)
Dalits
(%)
Newar
(%)
Janajati
(%)
Muslim
(%)
Total
(%)
P
Paid delivery expenses
47.1 40.5 46.2 57.1 55.8 71.4 50.3 0.439
n (total clients) 59 40 18 10 59 10 197
Received incentive 56.9 58.3 84.6 42.9 61.4 85.7 61.4 0.360
n (total clients) 59 40 18 10 59 10 197
Source: STS maternity exit interviews Note: Others category in each row showed zero
Table 5.7: Payment for delivery care and receipt of incentive payments, by topographical zone
Awareness
Mountain
(%)
Hill
(%)
Terai
(%)
Total
(%)
P
Paid delivery expenses 37.5 40.3 57.9 50.3 0.668
n (total clients) 19 55 123 197
Received transport incentive 87.5 61.9 59.4 61.4 0.768
n (total clients) 19 55 123 197
Source: STS maternity exit interviews

Service Tracking Survey 2011
35
Figure 5.1: Official amount, expected amount and amount given for transport incentive, by
topographical zone (in NPR)
1500
1000
500
1500
1188
673
1500
1056
503
0
400
800
1200
1600
Mountain Hill Terai
NP
R
Official
Expected
Received
Source: STS maternity exit interviews (Official amount is as per Aama Guideline)
Free delivery care
Half of the clients (50%) had received delivery care for free (Table 5.6) despite 78% of them being
aware that they are entitled to free delivery care (see Table 5.4). There were no significant differences
by caste/ethnicity or topographical zone.
Types of payment made by clients
The Aama guidelines specify that all the goods and services listed in Table 5.8 should be provided free
of charge, and tips should not be provided to health personnel. However, one out of two of the
maternity clients (50%) paid for goods and/or services at Aama implementing facilities. The most
common costs were for medicine (51%), registration fees (49%), laboratory tests (30%), cord cutting
(22%) and sanitary staff fees (19%).

Service Tracking Survey 2011
36
Table 5.8: Types of payments made by maternity clients
Types of payment
Mountain
(%)
Hill
(%)
Terai
(%)
Total
(%)
Medicine 100.0 16.0 65.5 51.2
Registration fee 0.0 72.0 41.1 49.4
Laboratory tests 0.0 24.0 33.9 29.8
Cord cutting 0.0 56.0 7.3 21.7
Sanitary staff fee 0.0 20.0 20.0 19.3
Delivery/operation fee 0.0 0.0 17.9 11.9
Sanitary pads 0.0 4.0 14.5 10.8
Sanitary staff tips 0.0 0.0 10.7 7.1
Informal payments to providers 0.0 0.0 9.1 6.0
Delivery items required 50.0 12.0 0.0 4.9
Gloves 0.0 0.0 1.8 1.2
Complication management fee 0.0 0.0 0.0 0.0
n (total clients) 14 25 73 112
Source: STS maternity exit interviews
5.2.4 Procedures for paying incentives
The Aama guidelines stipulate that clients are required to fill out a form to claim their transport
incentive. The requirement to fill out a form was followed by 79% of facilities (Table 5.9). More than
one-third of facilities requested clients to show their antenatal care (ANC) card to obtain the transport
incentive, although this is not specified by the Aama guidelines. This may have resulted from confusion
with the guidelines for the ANC incentive programme. These results highlight that not all facilities
comply with the Aama guidelines, and that different systems for different schemes may cause
confusion. A few facilities (4%) reported that women did not have to show any documentation in order
to claim their incentive.
Table 5.9: Procedures requested by facilities to claim transport incentive
Action needed %
Fill out claim form 78.7
Show antenatal care (ANC) card 36.2
Show ID card 6.4
Needed to do nothing (just received incentive) 4.3
Needed VDC recommendation 2.1
n (total clients) 94
Source: STS facility questionnaire
5.2.5 Record keeping
According to the Aama guidelines facilities must record programme beneficiaries (those who receive
free delivery care and a transport incentive). However, 13% of hospitals, 11% of PHCCs, 16% of HPs and

Service Tracking Survey 2011
37
40% of SHPs did not maintain a list (Table 5.10). Furthermore, not all of those who reported that they
kept a list were able to show it to the enumerators, including one-fifth (20%) of the hospitals. The
facilities kept such a list and were able to show the list of beneficiaries, with compliance being greatest
at PHCCs (74%) and lowest at SHPs (60%).
Table 5.10: Record keeping of women receiving Aama benefits (incentives & free delivery)
Questionnaire finding Hospital
(%)
PHCC
(%)
HP
(%)
SHP
(%)
Showed list of beneficiaries 66.7 74.1 70.3 60.0
Reportedly kept list, but not seen 20.0 14.8 13.5 0.0
Did not maintain a list 13.3 11.1 16.2 40.0
n (total facilities) 15 27 37 15
Source: STS facility questionnaire
5.2.6 Number of deliveries
The health facilities’ records revealed that the hospitals had provided services to many more maternity
clients (average 1,188) in the previous fiscal year, for all modes of delivery, than the other types of
facilities (e.g. PHCCs had an average of 121 clients) (Table 5.11). Currently hospitals receive a higher
subsidy (NPR 1,500) for normal deliveries than lower level health facilities (NPR 1,000). As expected
complicated deliveries were more likely to be carried out at hospitals and caesarean sections were only
performed at hospitals.
Table 5.11: Average number of deliveries by level of facility (FY 2010/11)
Hospital PHCC HP SHP
Total women who received service
1,188 136 43 21
Normal deliveries
942 121 41 21
Complicated deliveries 147 14 2 0
Caesarean sections
98 0 0 0
n (total facilities) 15 27 37 15
Source: STS facility questionnaire
5.2.7 Receipt of payments
Hospitals implementing the Aama programme received an average of NPR 3.2 million from the
programme, PHCCs NPR 251,222, health posts NPR 82,010 and SHPs NPR 39,060 (Table 5.12). These
amounts were for paying the incentives and free delivery costs. The same pattern, with hospitals
receiving the most and SHPs the least, holds true for the amounts broken down into the incentives and
free delivery costs.
Hospitals received more than ten times the amount other facilities received. This is the result of both a
price and quantity effect. Hospitals receive a higher subsidy per delivery because they deliver
comparatively more complicated deliveries and caesarean sections; and they also receive a higher unit

Service Tracking Survey 2011
38
subsidy (an additional NPR 500) for normal deliveries. And hospitals deliver more infants across all
types of delivery than other facilities (as shown in Table 5.11).
Table 5.12: Average amount received from Aama Programme by facility type
Aama Fund received
Hospital
(NPR)
PHCC
(NPR)
HP
(NPR)
SHP
(NPR)
Total amount received 3,283,788 251,222 82,010 39,060
Amount for free delivery 1,478,013 133,988 42,759 11,226
Amount for transport incentive 876,366 85,251 34,519 10,300
n (total facilities) 15 27 37 15
Source: STS facility questionnaire
5.2.8 Health management committee engagement with programme
One of the intended consequences of the Aama Programme is that facilities use the subsidies they
receive from the Aama Programme to improve their performance. Anecdotal evidence suggests that
health management committees (hospital development committee [HDCs] and health facility
management committees [HFMCs]) often actively discussed the distribution of the subsidies received
per delivery across the different types of costs of procuring drugs, small-scale facility maintenance and
health worker incentives. The STS found that most facilities (>85% at each level of facilities) with health
management committees reported that the committees discussed the implementation of the Aama
Programme (Table 5.13).
Table 5.13: HDC/HFMC engagement with Aama Programme
Hospital
(%)
PHCC
(%)
HP
(%)
SHP
(%)
HDC/HFMC discussed about Aama Programme
86.7 92.6 86.5 86.7
n (total facilities) 15 27 37 15
Source: STS facility questionnaire
5.2.9 Incentives for home deliveries
Thirteen per cent of hospitals, 19% of PHCCs, 24% of HPs and 27% of SHPs implementing the Aama
Programme did not provide incentives to health workers for attending deliveries at clients’ homes,
despite the programme providing an incentive of NPR 200 per such delivery (Table 5.14). SHPs (27%)
were twice as likely to pay incentives to health workers as hospitals (13%), which corresponds with
expectations, as staff at lower level health facilities are more likely to conduct home deliveries.

Service Tracking Survey 2011
39
Table 5.14: Provision of cash incentives to health workers for attending home deliveries
Hospital
(%)
PHCC
(%)
HP
(%)
SHP
(%)
Provided incentive to health workers 13.3 18.5 24.3 26.7
n (total facilities) 15 27 37 15
Source: STS facility questionnaire
5.3 KEY FINDINGS
Implementation
Not all facilities that should be implementing the Aama Programme were implementing it.
Client awareness
Maternity clients were relatively well aware of the Aama Programme: Nearly four fifths were
aware that delivery care should be free and 84% knew about the transport incentive.
The main source of information on both the transport incentive and free delivery care were
friends, neighbours and FCHVs with information and education materials (radio, television, posters
and pamphlets) playing a relatively minor role.
Client receipt of free delivery care and transport incentive
Only 61% of clients had received their entitled transport incentive and half of clients (50%) had
received free delivery care.
Facility procedures, recording and receipt of payments
More than one in three women had been asked to show their ANC card to obtain the Aama
transport incentive. This is not part of the Aama guidelines and may be the result of confusion with
the antenatal care incentive programme. These results highlight that not all facilities comply with
the Aama policies, and that different schemes with different rules may hinder compliance.
Not all health facilities had registered the names of the clients provided with benefits, and not
all women were asked to fill in the form as per the Aama guidelines.
Hospitals received significantly more Aama funding than other types of facilities.

Service Tracking Survey 2011
40
6 FINANCIAL MANAGEMENT
6.1 INTRODUCTION
Sound financial management is crucial for ensuring that health facilities have adequate funds, receive
funds on time, and spend these funds efficiently to ensure high quality health care. Health facilities in
Nepal receive funding from the central government and a variety of other sources.
This chapter presents the findings of the Service Tracking Survey, 2011 (STS 2011) on the financial
management of 169 health facilities. It describes the sources of revenue and amount of expenditure by
level of facility, and provides information on their financial management procedures for fiscal year
2010/2011. It looks at the extent to which the surveyed health facilities disclose their financial
information to the general public, and the extent to which they carry out their financial reporting and
auditing obligations.
6.2 RESULTS
Box 6.1: Key STS indicators for financial management
Indicators 2011 results
(%)
95% CI
% of facilities that spent all the money received 26.7 14.1-44.8
% of facilities with a bank account 94.6 74.4-99.1
% of facilities that disclosed their income and expenditure to the public 81.9 67.7-90.8
% of facilities that conducted an internal audit in the last fiscal year 12.7 7.4-21.1
% of facilities that conducted a final audit in the last fiscal year 15.3 9.6-23.5
6.2.1 Sources of revenue
The facilities were asked to provide information on their sources of revenue. Primary health care
centres (PHCCs), health posts and sub-health posts (SHPs) are not Ministry of Health and Population
(MoHP) cost centres and therefore do not receive funds directly from MoHP, nor do they have
sanctioned posts responsible for financial management. However, health facilities at all levels do
receive funding to implement specific programmes, for example, the Aama Programme and free care
as well as revenue from local government bodies (village development committees [VDCs] and district
development committees [DDCs]). Eighteen SHPs reported that they did not receive any funds from
MoHP and are therefore excluded from the analysis in this chapter.
The MoHP was the main financier for district hospitals and lower level facilities (Table 6.1). The second
largest source of income for district hospitals was INGOs, for HPs and SHPs it was VDCs and for PHCCs it
was internal income (fees from on-the-job trainees, rental, individual donations and service charges).
Registration fees are also a form of internal income, but this source is listed separately in Table 6.1. The
MoHP’s annual work plan and budget does not capture these internal income sources. Funding from
INGOs does not include the pooled donor funding (which goes directly to the Treasury, and would
therefore be classified as MoHP funding) or INGO commitments that have been rejected in the

Service Tracking Survey 2011
41
government’s Red Book (the government budget). The funding from INGOs in this analysis denotes
their direct funding to health facilities.
Table 6.1: Sources of income for health facilities (FY 2010/2011) (in NPR million and %)
District hospitals PHCCs Health posts SHPs
NPR m
% of total
budget NPR m
% of total
budget NPR m
% of total
budget NPR m
% of total
budget
MoHP 216.2 81.2 11.4 65.7 6.5 61.6 6.5 46.9
VDCs 2.2 0.8 1.9 10.8 2 19.1 3.2 23.4
INGOS 23.1 8.9 0.1 0.8 0.1 0.7 2.5 18.2
DDCs 0.2 0.1 0.4 2.1 0.5 5.2 0.9 6.6
Registration fees 2.3 0.9 0.6 3.6 0.1 0.5 0 0
(Other) internal income 22.1 8.3 2.9 16.8 1.4 13.0 0.7 4.8
Total budget 266.2
17.4 100 10.6 100 13.8 100
n (total facilities) 13 28 45 62
Source: STS facility questionnaire
Table 6.2: Sources of income for BPKIHS and zonal hospitals (FY 2010/2011) (NPR million and %)
BPKIHS Zonal hospitals
NPR m
% of total
budget NPR m
% of total
budget
MoHP 230 20.7 65.9 32.3
VDC 0 0.0 0 0.0
INGOS 0 0.0 0 0.0
DDC 0 0.0 0 0.0
Registration fees 0 0.0 0 0.0
(Other) internal income 880 79.3 137.8 67.6
Total budget 1,110
203.7
n (total facilities) 1 2
Source: STS facility questionnaire
The breakdown of sources of income by the different types of health facilities was as follows:
Internal income was the major source of income for the higher level hospitals (79% for BPKIHS
and 68% for the two zonal hospitals) (Table 6.2). The BP Koirala Institute of Health Science
(BPKIHS), in Dharan, eastern Nepal, is an autonomous academic institution that runs postgraduate
and undergraduate programmes in medicine and allied health sciences. Seventy-nine percent of its
income was from internal sources.
The district hospitals mostly relied on central funding from MoHP (81%) with INGOs providing
the second largest proportion of funding (Table 6.1).
For the primary health care centres (PHCCs), MoHP provided the largest share of income (66%)
followed by internal income (17%) and funds from VDCs (11%).

Service Tracking Survey 2011
42
For health posts, MoHP also provided the largest share of income (62%), followed by VDCs
(19%) and internal income (13%). PHCCs and health posts received less than 1% of their income
from INGOs.
For the sub-health posts (SHPs), the funding pattern was different to that of PHCCs and health
posts. The SHPs received less than half of their income from MoHP (47%), 23% from VDCs and 18%
from INGOs. Internal income was the smallest source for SHPs.
This analysis suggests that facilities across the board received a large part of their income from sources
not included in the MoHP’s annual work plan and budget (AWPB): 53% for SHPs, 38% for health posts,
24% for PHCCs and 19% for district hospitals (Table 6.1). This has potential far-reaching consequences
for the way in which the health system is managed towards outputs and outcomes as facilities are not
reporting to government authorities on a large part of their revenue and expenditure. The government
therefore has limited information on what these other sources of income are spent on and the extent
to which their allocation contributes to achieving health sector goals. Furthermore, INGOs sometimes
provide funding to health facility management committees directly. Figure 6.1 shows the composition
of internal income only (non-MoHP income) by source and topographical zone.
Figure 6.1: Main sources of internal income by topographical zone (% of facilities, n=169)
Source: STS facility questionnaire
Hospitals, PHCCs and health posts receive most of their funding from central government funds. To
supplement this 19% of hospitals, 29% of PHCCs, 20% of HPs and 18% of SHPs had generated funds
from their local communities (Table 6.3). Registration fees were the most common source of internal
funds generated by the hospitals, accounting for 56% of their internal funds, followed by on-the-job
training (50%) where facilities charge people to attend training courses. VDCs were the main source of
funds for 68% of PHCCs, 69% of health posts and 64% of SHPs. Fees from on the job training (OJT) were
an important source of revenue for 50% of hospitals, 32% of PHCCs and 7% of HPs (Table 6.3). INGOs
accounted for 8% and DDCs 6% of non-MoHP funds across all facilities. Many facilities levied

Service Tracking Survey 2011
43
registration fees and these fees accounted for 10% of non-MoHP funds for the Terai (13%) and hill
(11%) district facilities but only 3% of non-MoHP funds for mountain district facilities (Figure 6.1). No
internal funding had been generated by 12% of hospitals, 21% of PHCCs, 27% of health posts and 29%
of SHPs.
Table 6.3: Funding from local communities, FY 2010/2011
Hospitals PHCCs HPs SHPs
No. % No. % No. % No. %
1. Funding generated from local communities 3 18.8 8 28.6 9 20.0 14 17.5
2. Mean amount generated (NPR) from local communities 12,617,229 129,897 54,666 79,752
3. Sources of internally generated funds
VDCs 1 6.3 19 67.9 31 68.9 51 63.8
On-the-job training fees 8 50.0 9 32.1 3 6.7 0 0.0
Registration fees 9 56.3 5 17.9 2 4.4 1 1.3
INGOs 2 12.5 1 3.6 5 11.1 6 7.5
DDCs 1 6.3 2 7.1 1 2.2 6 7.5
No internal source 2 12.5 6 21.4 12 26.7 23 28.8
n (total facilities) 16 28 45 80
Source: STS facility questionnaire
6.2.2 Receipt of MoHP budget
The 169 facilities were asked whether or not they had received their allocated MoHP budget and if not,
why not, and whether or not they had spent the resources they received.
A substantial proportion of facilities (19% of hospitals, 32% of PHCCs, 27% of HPs and 18% of SHPs%)
reported not having received their allocated budget but almost similar proportion of the facilities (19%
of hospitals, 21% of PHCCs, 22% of HPs and 34% of SHPs) reported not knowing whether they had
received their allocated budgets (Table 6.4). Most facilities reported that the main reason for not
receiving all their allocated funds from MoHP was ‘budget deficit’, although 67% of hospitals, 78% of
PHCCs, 58% of HPs and 79% of SHPs also reported delays in financial report submission, which is a
requirement to receive funds. The quality of this data is, however, uncertain because many facilities
had not prepared a financial report nor had an audit report available, which would have provided a
good basis for answering these questions.

Service Tracking Survey 2011
44
Table 6.4: Receipt of MoHP funds and reasons for non-receipt, FY 2010/11
Timing of receipt
Figure 6.2 shows the timing of fund received by facility type. In the first of the three trimesters, all
types of facilities across the board received only a small proportion of their budgeted funds (between
10% and 16% of their budgets). In the second trimesters they received only between 16% and 38% of
their budgeted amounts. Most funds were received in the third trimester (48% to 74%). The
distribution of funds was most even for hospitals, probably because almost half of their funds were for
salaries, and the least even for the health posts. This pattern complicates facility cash management and
could be a large part of the reason why budgets were underspent.
Figure 6.2: Proportion of annual budgeted funds received from MoHP, by health facilities, by
trimester (FY 2010/2011)
Source: STS facility questionnaire
Status Hospital PHCC HP SHP
No. % No. % No. % No. %
1. Received allocated budget:
Yes 10 62.5 13 46.4 23 51.1 39 48.8
No 3 18.8 9 32.1 12 26.7 14 17.5
Don't know 3 18.8 6 21.4 10 22.2 27 33.8
n (number of facilities) 16
28
45
80
2. Reasons for non-receipt of budget:
Budget deficit 2 66.7 7 77.8 7 58.3 11 78.6
Priority to other sector 1 33.3 2 22.2 3 25 4 28.6
Delay in financial report submission 1 33.3 1 11.1 3 25 0 0.0
n (number of facilities) 3 9 12 14

Service Tracking Survey 2011
45
6.2.3 Expenditure of MoHP budget
Facilities were asked to provide information on the major expenditure items for fiscal year 2010/11
from funds received from MoHP. This analysis therefore excludes the substantial amounts received
from other sources. The categories they reported expenditure on were salaries, drugs, equipment,
infrastructure, furniture, training and capacity building, utility costs, monitoring and evaluation,
programme costs (mainly public health programmes) and miscellaneous expenses. The results were as
follows:
For hospitals, salaries accounted for nearly half of total expenditure (47%), miscellaneous
expenses for 20%, construction for 9%, and equipment and utilities for 8% (Figure 6.3).
PHCCs spent a lower proportion on salaries at just over one-third (34%), with miscellaneous
(23%) and construction (21%) as their next largest expenditure categories (Figure 6.4). Three
facilities dominated the PHCC sample with Panchamul, Gaushala and Manahari PHCCs accounting
for 27%, 12% and 10% of total expenditure respectively.
Health post expenditure was similar to that of the PHCCs, with salaries representing just over a
third of the total (35%) followed by miscellaneous expenses (29%). Note that the salaries are those
of locally recruited auxiliary nurse midwife and support staff paid from the Aama, free care-
reimbursement and other sources of income. Construction expenses were comparatively lower at
7%, with ‘programme costs’ being the third largest proportion (14%) (Figure 6.5). About 10% of the
health posts (4 of the 44) accounted for 55% of total health post expenditure.
The SHPs had a slightly different pattern of expenditure compared to the other facility types
with salaries accounting for a third of expenditure (33%), construction for 32% and equipment for
15% (Figure 6.6). Note that 49 of the 80 SHPs (61%) had not reported their expenditure to their
district health offices. PHCCs, health posts and SHPs are responsible for dealing with advances
taken and for submitting receipts to claim this expenditure. The results in Figure 6.6 are therefore
only for the 31 SHPs that had reported.
Figure 6.3: Breakdown of hospital expenditure from funds received from MoHP (FY 2010/2011)
Source: STS facility questionnaire

Service Tracking Survey 2011
46
Figure 6.4: Breakdown of PHCC expenditure from funds received from MoHP (FY 2010/2011)
Source: STS facility questionnaire
Figure 6.5: Breakdown of health post expenditure from funds received from MoHP (FY 2010/2011)
Source: STS facility questionnaire
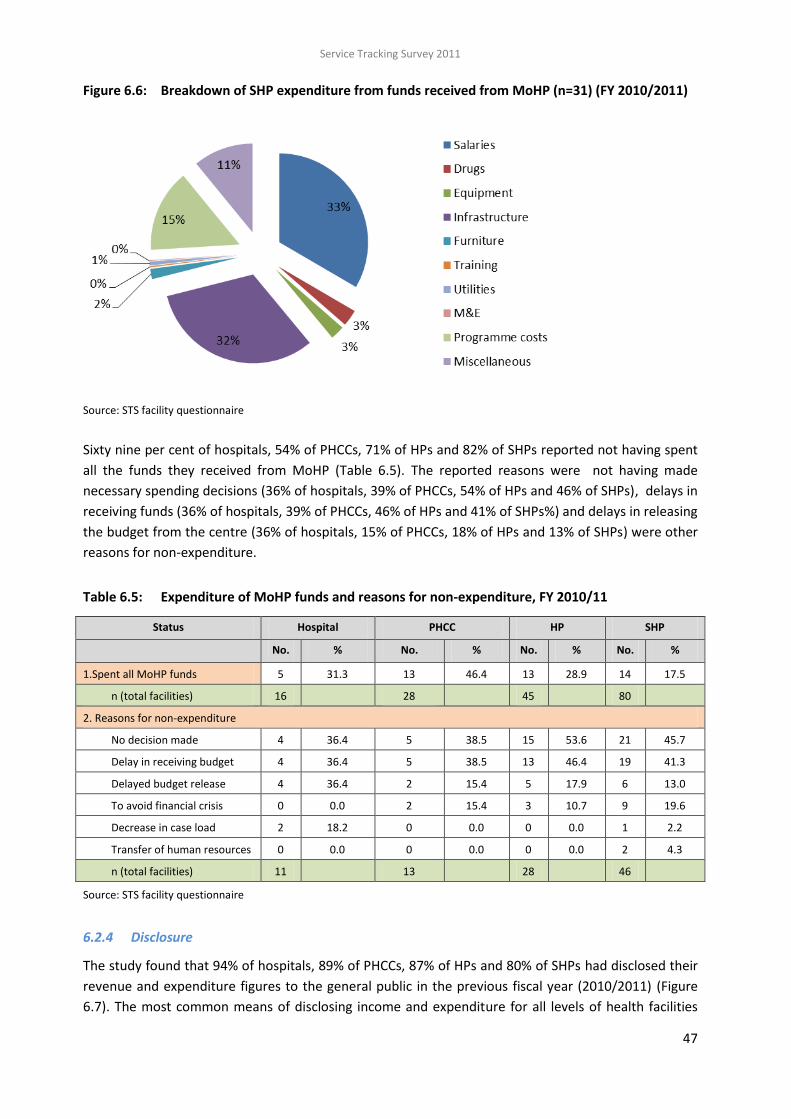
Service Tracking Survey 2011
47
Figure 6.6: Breakdown of SHP expenditure from funds received from MoHP (n=31) (FY 2010/2011)
Source: STS facility questionnaire
Sixty nine per cent of hospitals, 54% of PHCCs, 71% of HPs and 82% of SHPs reported not having spent
all the funds they received from MoHP (Table 6.5). The reported reasons were not having made
necessary spending decisions (36% of hospitals, 39% of PHCCs, 54% of HPs and 46% of SHPs), delays in
receiving funds (36% of hospitals, 39% of PHCCs, 46% of HPs and 41% of SHPs%) and delays in releasing
the budget from the centre (36% of hospitals, 15% of PHCCs, 18% of HPs and 13% of SHPs) were other
reasons for non-expenditure.
Table 6.5: Expenditure of MoHP funds and reasons for non-expenditure, FY 2010/11
Source: STS facility questionnaire
6.2.4 Disclosure
The study found that 94% of hospitals, 89% of PHCCs, 87% of HPs and 80% of SHPs had disclosed their
revenue and expenditure figures to the general public in the previous fiscal year (2010/2011) (Figure
6.7). The most common means of disclosing income and expenditure for all levels of health facilities
Status Hospital PHCC HP SHP
No. % No. % No. % No. %
1.Spent all MoHP funds 5 31.3 13 46.4 13 28.9 14 17.5
n (total facilities) 16 28 45 80
2. Reasons for non-expenditure
No decision made 4 36.4 5 38.5 15 53.6 21 45.7
Delay in receiving budget 4 36.4 5 38.5 13 46.4 19 41.3
Delayed budget release 4 36.4 2 15.4 5 17.9 6 13.0
To avoid financial crisis 0 0.0 2 15.4 3 10.7 9 19.6
Decrease in case load 2 18.2 0 0.0 0 0.0 1 2.2
Transfer of human resources 0 0.0 0 0.0 0 0.0 2 4.3
n (total facilities) 11 13 28 46
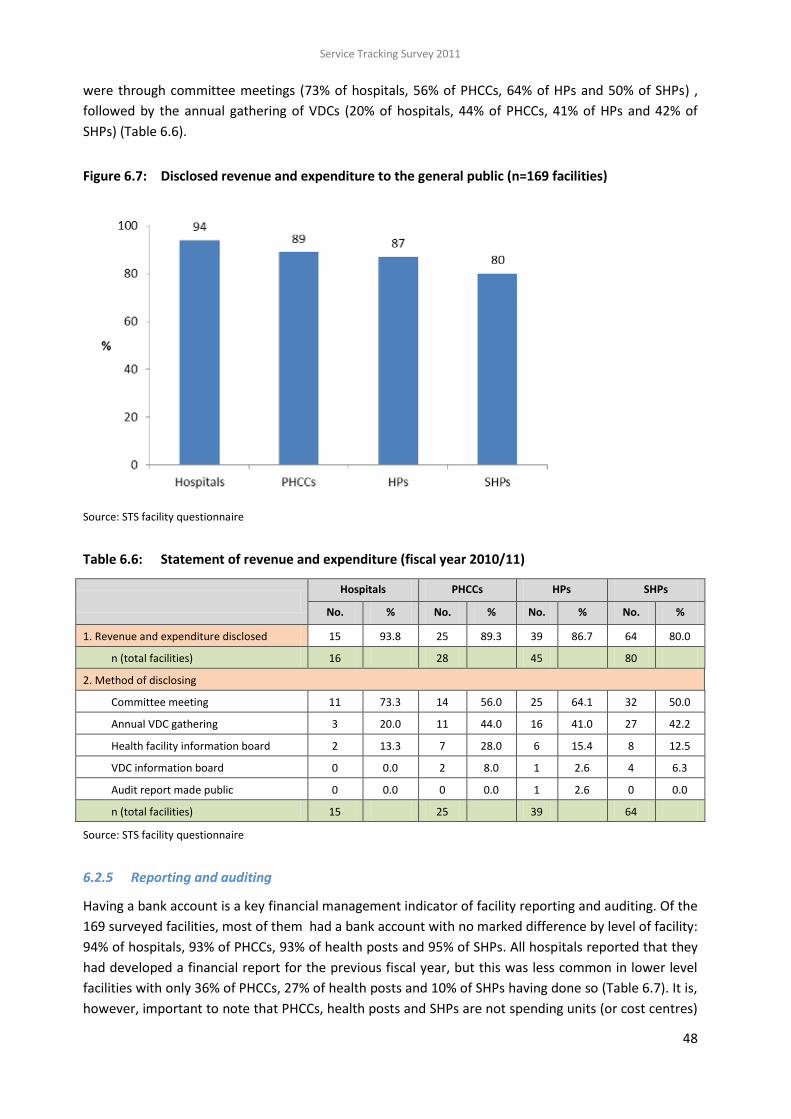
Service Tracking Survey 2011
48
were through committee meetings (73% of hospitals, 56% of PHCCs, 64% of HPs and 50% of SHPs) ,
followed by the annual gathering of VDCs (20% of hospitals, 44% of PHCCs, 41% of HPs and 42% of
SHPs) (Table 6.6).
Figure 6.7: Disclosed revenue and expenditure to the general public (n=169 facilities)
Source: STS facility questionnaire
Table 6.6: Statement of revenue and expenditure (fiscal year 2010/11)
Hospitals PHCCs HPs SHPs
No. % No. % No. % No. %
1. Revenue and expenditure disclosed 15 93.8 25 89.3 39 86.7 64 80.0
n (total facilities) 16 28 45 80
2. Method of disclosing
Committee meeting 11 73.3 14 56.0 25 64.1 32 50.0
Annual VDC gathering 3 20.0 11 44.0 16 41.0 27 42.2
Health facility information board 2 13.3 7 28.0 6 15.4 8 12.5
VDC information board 0 0.0 2 8.0 1 2.6 4 6.3
Audit report made public 0 0.0 0 0.0 1 2.6 0 0.0
n (total facilities) 15 25 39 64
Source: STS facility questionnaire
6.2.5 Reporting and auditing
Having a bank account is a key financial management indicator of facility reporting and auditing. Of the
169 surveyed facilities, most of them had a bank account with no marked difference by level of facility:
94% of hospitals, 93% of PHCCs, 93% of health posts and 95% of SHPs. All hospitals reported that they
had developed a financial report for the previous fiscal year, but this was less common in lower level
facilities with only 36% of PHCCs, 27% of health posts and 10% of SHPs having done so (Table 6.7). It is,
however, important to note that PHCCs, health posts and SHPs are not spending units (or cost centres)

Service Tracking Survey 2011
49
under the government system and as such do not have to produce financial reports. They do, however,
have to submit receipts to clear advances obtained from their district health offices. The most common
reason for lower level for facilities not producing a financial report was because they felt no need (41%
of PHCCs and 67% of SHPs%). A lack of relevant human resources (35% of PHCCs, 21% of HPs and 19%
of SHPs%) and not having a responsible person (12% of PHCCs, 9% of HPs and 16% of SHPs) were other
key reasons. Note that some PHCCs, health posts and SHPs hire administrative staff from their local
resources to carry out tasks such as preparing financial reports. The large numbers of lower level
facilities that had not prepared a financial report hampered the data collection on financial
management.
Table 6.7: Financial reporting by health facilities in previous fiscal year
Status
Hospital PHCC HP SHP
No. % No. % No. % No. %
1. Prepared financial report in previous fiscal year 16 100 10 35.7 12 26.7 8 10.0
n (total facilities) 16
27
45
77
2. Reasons for not preparing a financial report
Need not felt
7 41.2 0 0.0 46 66.7
Lack of relevant human resources
6 35.3 7 21.2 13 18.8
Responsible person not identified
2 11.8 3 9.1 11 15.9
Audit in process
3 17.6 1 3.0 5 7.2
Delay in clearing advances
1 5.9 1 3.0 1 1.4
Transfer of human resources
1 3.0 2 2.9
n (total facilities) 0
17
33
69
Source: STS facility questionnaire Blue (darker) shading = not applicable.
Table 6.8 shows whether or not facilities had conducted an internal or final audit and the major
recommendations from final audits. Most facilities had not conducted an internal audit (25% of
hospitals, 71% of PHCCs, 84% of HPs and 91% of SHPs) or a final audit (25% of hospitals, 61% of PHCCs,
88% of HPs and 90% of SHPs%) in the previous fiscal year. This again hampered data collection for this
chapter as it was difficult to collect reliable financial data from lower level facilities. Of those facilities
that had carried out an audit, 42% of hospitals, 36% of PHCCs, 20% HPs and 25% of SHPs had received
a recommendation to carry out a financial audit in a more timely way, and 25% of hospitals, 27% of
PHCCS and 13% of SHPs were recommended to work on auditing irregularities.

Service Tracking Survey 2011
50
Table 6.8: Internal and final audits and audit recommendations
Status
Hospital PHCC HP SHP
No. % No. % No. % No. %
1. Conducted internal audit in previous fiscal year 12 75.0 8 28.6 7 15.6 7 8.75
2. Conducted final audit in previous fiscal year 12 75.0 11 39.3 10 22.2 8 10.0
n (total facilities) 16 28 45 80
3. Major recommendations from final audits
No recommendation given 4 33.3 4 36.4 6 60.0 4 50.0
Do timely financial auditing 5 41.7 4 36.4 2 20.0 2 25.0
Identified irregularities 3 25.0 3 27.3 0 0.0 1 12.5
Need for transparency of income and expenditure 0 0.0 1 9.1 1 10.0 2 25.0
n (total facilities) 12 11 10 8
Source: STS facility questionnaire
6.3 KEY FINDINGS
Sources of revenue
MoHP was the main financier of health facilities at all levels except for the higher level hospitals.
MoHP provided 81% of district hospitals’ income and 66%, 62% and 47% of the income of PHCCs,
HPs and SHPs respectively in the previous fiscal year (2010/11). Internal income was the largest
source of revenue for the teaching and zonal hospitals. The second largest source of income for
PHCCs was internal income. The SHPs had the most diverse sources of income including significant
amounts from their VDCs (23%) and INGOs (18%).
All facilities except for district hospitals derived a significant proportion of their income from
sources not included in the MoHP’s annual work plan and budget: 24% for PHCCs and 38% for
health post and more than 50% for SHPs. These resources are referred to as ‘non-MoHP funds’.
This has far-reaching consequences for the way in which the health system is managed towards
outputs and outcomes, as facilities are not reporting on a significant part of their revenue and
expenditure to the government. The government is not kept informed about what these non-
MoHP funds are spent on and the extent to which their allocation contributes to achieving health
sector goals.
VDCs were the major source of non-MoHP funds for facilities across all topographical zones,
accounting for 60% of such funds. On-the-job training fees provided 12% of such funds, while 10%
of such funds came from registration fees, 8% from INGOs and 6% from DDCs.
Receipt of MoHP budget
A significant proportion of facilities (19% of hospitals, 32% of PHCCs, 27% of HPs and 18% of
SHPs%) reported not having received their allocated budget funds from MoHP. Likewise almost
similar proportion of the facilities (19% of hospitals, 21% of PHCCs, 22% of HPs and 34% of SHPs)
reported not knowing whether they had received their allocated budgets.
In the first of the three trimester periods, all levels of facilities received only a small proportion
of their budgeted funds (10% to 16% of their budgets). They received more in the second trimester

Service Tracking Survey 2011
51
(16% to 38%) and the most in the third trimester (48% to 74%). The most even distribution of funds
received was at the hospitals while health posts had the most uneven receipt of funds from MoHP.
This pattern complicates facility cash management and helps explain why budgets are often
underspent.
Expenditure of MoHP budget
Staff salaries were the major expenditure category for all facilities from funds received from
MoHP. This was more so for hospitals (47% of their total expenditure) than for lower level facilities
where salaries accounted for about a third of expenditure from MoHP funds. Miscellaneous
expenditure and infrastructure investment were among the higher spending categories.
Disclosure
Almost all hospitals (94%) had made their income and expenditure data available to the general
public, followed by PHCCs (89%), health posts (87%) and SHPs (80%).
Reporting and auditing
Of the 169 surveyed facilities, most (94% of hospitals, 93% of PHCCs, 93% of health posts and
95% of SHPs) had a bank account, with no marked difference between facility types.
All the hospitals reported having developed a financial report for the previous fiscal year. This
was far less widespread in the lower level facilities with only 36% of PHCCs, 27% of health posts
and 10% of SHPs having done so. Note that PHCCs, health posts and SHPs are not government
spending units and so do not have to produce financial reports.
The most common reason for lower level facilities for not preparing a report was that they
hadn’t felt the need (41% of PHCCs and 67% of SHPs). A lack of relevant human resources (35% of
PHCCs, 21% of HPs and 19% of SHPs%) and not having a responsible person (12% of PHCCs, 9% of
HPs and 16% of SHPs) were other key reasons.
Most facilities reported not having carried out an internal audit (25% of hospitals, 71% of
PHCCs, 84% of HPs and 91% of SHPs) or final audit (25% of hospitals, 61% of PHCCs, 88% of HPs and
90% of SHPs%)in the previous fiscal year.
Of those facilities that had carried out an audit, 42% of hospitals, 36% of PHCCs, 20% HPs and
25% of SHPs had received a recommendation to carry out a financial audit in a more timely way,
and 25% of hospitals, 27% of PHCCS and 13% of SHPs were recommended to work on auditing
irregularities.

Service Tracking Survey 2011
52
7 GOVERNANCE AND ACCOUNTABILITY
7.1 INTRODUCTION
NHSP 2 recognises that putting in place a system and resources may not yield the intended results and
impact unless adequate attention is given to improving the governance and accountability of health
service provision. The Ministry of Health and Population (MoHP) is setting up a downward
accountability mechanism for health planning and management through participatory planning with
local stakeholders and by promoting social audits. The move towards more decentralised management
should increase downward accountability and community ownership, which should improve access to
health services for local people, and especially for poor and excluded people. The Local Self-
Governance Act, 1999 authorises local bodies (district development committees, village development
committees [VDCs] and municipalities) to operate and manage health institutions at the local level.
However, the absence of elected officials in local bodies since mid-2002 has hindered the effective
implementation of this act.
In 2010, MoHP produced a governance and accountability action plan (GAAP) (MoHP 2010c), which
incorporates measures to make health services more client-focused and accountable, with a particular
focus on poor and excluded people. However, a lack of clarity about GAAP activities and how they can
be implemented means that it is difficult to assign clear measurable indicators for monitoring and
evaluating achievements against the GAAP. This plan is being revised.
This chapter explores findings from the Service Tracking Survey (STS) 2011 related to governance and
accountability, specifically in regards to the implementation of NHSP 2’s GAAP, to give a picture of the
current situation of governance and accountability in Nepal’s health sector.
7.2 RESULTS
Box 7.1: Key STS indicators for governance and accountability
Indicators 2011 results
(%)
95% CI
% of health facilities that undertook social audits in the current or last fiscal year* 27.4 17.4-40.4
% of facilities that conducted a social audit in the last fiscal year, made findings public and incorporated recommended actions in annual workplan and budget (AWPB)
22.0 15.0-31.0
% of facilities with a citizen’s charter placed in a visible location and included information on free drugs, outpatient services and Aama (if Aama implementing facility)
58.4 43.8-71.8
% of facilities with a health management committee (health facility management committees [HFMCs] and hospital development committees [HDC]) meeting on a monthly basis
37.1 22.3-54.8
% of health facilities with at least three females and at least two Dalit and Janajati members in health facility management committees (HFMCs) and hospital
development committees (HDC). *
46.0 36.5-55.8
% of facilities with an emergency contingency plan for women and children 29.4 16.7-46.4
* NHSP 2 logframe indicators

Service Tracking Survey 2011
53
7.2.1 Social audits and community scorecards
The demand for greater citizen participation in governance is increasing in Nepal. Social accountability
tools, including social audits and community scorecards have been introduced in public and private
organisations and are a key component of the GAAP. Social audits recognise service users as ‘right
holders’ rather than ‘beneficiaries’ and should be instituted as processes rather than one-off events.
The main objectives of social auditing are to monitor how resources are used, to understand who is
benefiting, to increase transparency and to hold service providers and officials to account. Health
sector social audits are a process by which citizens audit government health programmes and services.
They also include the public dissemination of findings at public gatherings where social auditors
present their findings, facilitate community engagement with service providers and officials, and solicit
responses from service providers and officials. This process should result in action plans and
communities rating the performance of health facilities.
Under the Local Authority Financial Administration Regulations, 2007, the government committed to
making social audits mandatory for all programmes within four months of the completion of that fiscal
year. However, this is yet to be fully implemented. In 2009, the Family Health Division (FHD) of the
Department of Health Services (DoHS) developed a model for social auditing linked to the Aama
Programme. A model developed by the Management Division of DoHS in the same year has a broader
scope and covers overall health service provision. The DoHS under the leadership of the Primary Health
Care Revitalization Division (PHCRD) has recently harmonised these two social audit guidelines and
plans to roll out the new social auditing approach to 20 districts in 2012. Recently, in 2012, PHCRCD has
developed social audit guidelines for the whole health sector (Social Audit Guidelines for Health Sector,
2068). According to these guidelines health facilities from SHPs to district hospitals and urban health
clinics should undertake social audits and district (public) health offices need to make action plans to
ensure that social audits are operational in all health facilities in their district within five years.
The STS 2011 asked about the prevalence of social auditing. Nearly one third (27%) of the health
facilities surveyed had conducted a social audit in the current or last fiscal year The practice of social
auditing was less common at hospitals (25%) than at PHCCs (57%), health posts (44%) and SHPs (34%)
(Table 7.1 and Figure 7.1).
A social audit report had been produced by all the hospitals that had conducted social audits in the
current or last fiscal year, however over one third of PHCCs (36%), 12% of health posts and 20% of
SHPs had not produced such reports. Enumerators could not observe social audit reports in 54% of
PHCCs, 41% of health posts and 45% of SHPs that reported conducting social audits.
Of those facilities that conducted social audits 50% of hospital, 91% of PHCCs, 71% of HPs and 90% of
SHPs reported that they had publically disclosed the findings (Table 7.1). Lower level facilities were
less likely to have also displayed the information on an information board. All hospitals, 82% of PHCCs,
53% of HPs and 60% of SHPs that conducted social audits in the previous years, reported that they had
incorporated the recommended actions into their annual work plan and budgets (AWPB).

Service Tracking Survey 2011
54
Table 7.1: Social audit practice and use of community scorecards
Hospitals
(%)
PHCCs
(%)
HPs
(%)
SHPs
(%)
1. Ever conducted a social audit 25.0 57.1 44.4 33.8
n (total facilities) 16 28 45 80
2. Timing of last social audit (fiscal year)
2068/69 (2011/2012 to date) 25.0 25.0 40.0 33.3
2067/68 (2010/2011) 75.0 43.8 45.0 40.7
2066/67 (2009/2010) 0.0 31.3 15.0 25.9
n (total facilities ever conducted social audit) 4 16 20 27
3. Conducted social audit in current or last fiscal year (2067/68 or 2068/69) 25.0 39.3 37.8 25
n (total facilities surveyed) 16 28 45 80
4. Use of social audit etc.
Used a community scorecard 0.0 9.1 17.6 25.0
Produced a report 100 63.6 88.2 80.0
Report available in the facility 100 45.5 58.8 55.0
Report/findings made public 50.0 90.9 70.6 90.0
Made findings public on facility information board 25.0 18.2 0.0 5.0
Made findings public at public meeting 25.0 72.7 70.6 85.0
Included recommended actions in annual work plan and budget (AWPB) 100 81.8 52.9 60.0
n (facilities that conducted social audit in current or last fiscal year) 4 11 17 20
Source: STS facility questionnaire
Figure 7.1: Social audit practices by health facilities in the current or last fiscal year
25
39 38
2525 25
33
2025
1822
1413
36
272325
32
2015
0
20
40
60
80
100
Hospital PHCC HP SHP
%
Conducted Produced Report Report Available Made Public Actions in Plan
Note: Denominator for all variables in Figure 7.1 is all facilities surveyed, and hence percentages differ from Table 7.1
Source: STS facility questionnaire

Service Tracking Survey 2011
55
The use of community scorecards (CSCs) for social accountability is a new practice in Nepal. These
scorecards solicit user perceptions on quality, efficiency and transparency. This helps to compare
performance across facilities, generate feedback between providers and users, build local capacity and
strengthen citizens’ voices and community empowerment. Citizens are often empowered by having
the opportunity to provide immediate feedback to service providers.
The STS 2011 found the use of community scorecards was very low in the facilities that had conducted
social audits in the current or last fiscal year. None of the hospitals and only 9% of PHCCs, 8% of health
posts and 25% of SHPs reported having used a scorecard in their most recent social audits.
7.2.2 Citizen’s charters
Across Nepal, all public organisations, including health facilities, are required to post citizen’s charters
outside their buildings in visible places accessible to the general public. Citizen’s charters inform
citizens about their public service entitlements, service availability, opening hours, service related costs
and procedures and their rights. Sometimes, fines related to citizens' grievances are also listed. Such
charters at health facilities are intended to improve the quality of health care by publishing the
standards that users can expect. Well-informed clients can more easily exert pressure on service
providers to improve their performance, make informed choices and push for greater transparency.
The location of charters, the language used, and literacy, mobility and time constraints can limit the
use of citizen charters, especially for women and poor and excluded people.
The STS 2011 found that 88% of hospitals, 71% of PHCCs, 96% of health posts and 78% of SHPs had a
citizen’s charter. Of those with a charter, only 79% of hospitals, 55% of PHCCs, 33% of HPs and 23% of
SHPs had placed it outside in a visible place. The hospitals were more likely to have their charter
outside their building in a visible place than lower level facilities (Table 7.2 and Figure 7.2).
Table 7.2: Availability, location and information included in citizen charters
Hospitals
(%)
PHCCs
(%)
HPs
(%)
SHPs
(%)
1. Charter available in facilities 87.5 71.4 95.6 77.5
n (total facilities) 16 28 45 80
2. Place where charter located
Inside – visible 14.3 40.0 55.8 69.4
Outside – visible 78.6 55.0 32.6 22.6
Inside - not visible 7.1 5.0 9.3 8.1
Outside - not visible 0.0 0.0 2.3 0.0
3. Charter updated to include
Free drugs 92.9 90.0 97.7 91.9
Out-patient services 100 90.0 93.0 91.9
n (total facilities) 14 20 43 62
4. Charter had info. on Aama Programme 92.3 80.0 62.9 80.0
n (facilities with citizen’s charter implementing Aama Programme) 13 20 35 10
Source: STS facility questionnaire

Service Tracking Survey 2011
56
The researchers checked whether the charters included necessary information on free drugs, the Aama
Programme (if applicable) and outpatient services. Of the 139 facilities with a charter, most included
information on free drugs (94%) and outpatient services (93%). Amongst the 94 surveyed health
facilities implementing the Aama Programme, 78 had a citizen’s charter. Nearly three quarters (74%) of
the 78 facilities with a charter included information on the Aama Programme in their charters.
Figure 7.2: Availability, location and information in citizen’s charters by type of health facility
88
71
96
7881
68
84
71
81
64
93
71
80
59
76
0
20
40
60
80
100
Hospital PHCC HP SHP
%
Available Visible Mentioned Free Drugs Mentioned Aama Prog.
Note: The denominator for all variables in Figure 7.2 is all the facilities surveyed, and hence figures differ from Table 7.2
Source: STS facility questionnaire
7.2.3 Transparency and disclosure measures
Table 7.3 shows STS 2011 findings on the transparency and disclosure measures adopted by health
facilities. Information related to free essential drugs was most likely to be disclosed (79%) along with
information on the facility workforce (77%) and current disease trends and public health interventions
(76%). Gatherings (39%) were most commonly used to provide information on free essential drugs,
followed by public notice boards (32%) and dissemination by female community health volunteers
(FCHVs) (17%). For the other types of information, public gatherings were the most common means of
disclosure. Noticeboards were also commonly used for information on the available workforce, disease
trends and public health interventions. See Chapter 6 on financial management for findings related to
the disclosure of information related to income and expenditure.
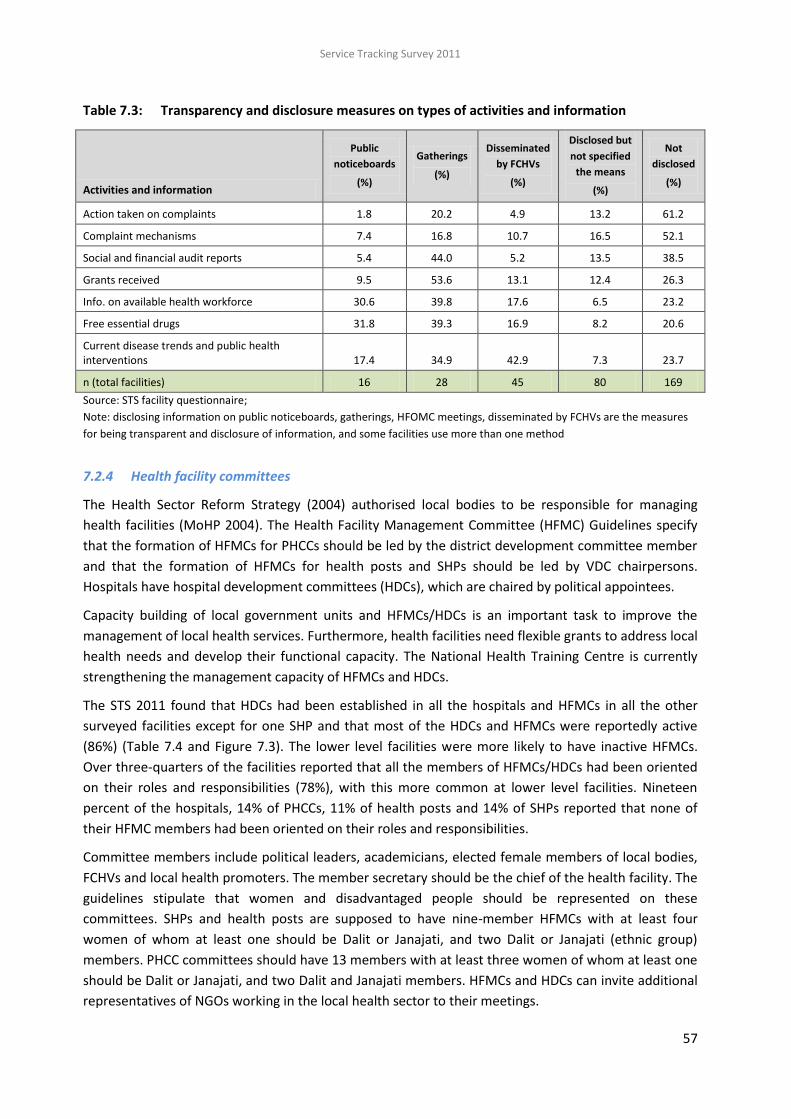
Service Tracking Survey 2011
57
Table 7.3: Transparency and disclosure measures on types of activities and information
Activities and information
Public
noticeboards
(%)
Gatherings
(%)
Disseminated
by FCHVs
(%)
Disclosed but
not specified
the means
(%)
Not
disclosed
(%)
Action taken on complaints 1.8 20.2 4.9 13.2 61.2
Complaint mechanisms 7.4 16.8 10.7 16.5 52.1
Social and financial audit reports 5.4 44.0 5.2 13.5 38.5
Grants received 9.5 53.6 13.1 12.4 26.3
Info. on available health workforce 30.6 39.8 17.6 6.5 23.2
Free essential drugs 31.8 39.3 16.9 8.2 20.6
Current disease trends and public health interventions 17.4 34.9 42.9 7.3 23.7
n (total facilities) 16 28 45 80 169
Source: STS facility questionnaire;
Note: disclosing information on public noticeboards, gatherings, HFOMC meetings, disseminated by FCHVs are the measures
for being transparent and disclosure of information, and some facilities use more than one method
7.2.4 Health facility committees
The Health Sector Reform Strategy (2004) authorised local bodies to be responsible for managing
health facilities (MoHP 2004). The Health Facility Management Committee (HFMC) Guidelines specify
that the formation of HFMCs for PHCCs should be led by the district development committee member
and that the formation of HFMCs for health posts and SHPs should be led by VDC chairpersons.
Hospitals have hospital development committees (HDCs), which are chaired by political appointees.
Capacity building of local government units and HFMCs/HDCs is an important task to improve the
management of local health services. Furthermore, health facilities need flexible grants to address local
health needs and develop their functional capacity. The National Health Training Centre is currently
strengthening the management capacity of HFMCs and HDCs.
The STS 2011 found that HDCs had been established in all the hospitals and HFMCs in all the other
surveyed facilities except for one SHP and that most of the HDCs and HFMCs were reportedly active
(86%) (Table 7.4 and Figure 7.3). The lower level facilities were more likely to have inactive HFMCs.
Over three-quarters of the facilities reported that all the members of HFMCs/HDCs had been oriented
on their roles and responsibilities (78%), with this more common at lower level facilities. Nineteen
percent of the hospitals, 14% of PHCCs, 11% of health posts and 14% of SHPs reported that none of
their HFMC members had been oriented on their roles and responsibilities.
Committee members include political leaders, academicians, elected female members of local bodies,
FCHVs and local health promoters. The member secretary should be the chief of the health facility. The
guidelines stipulate that women and disadvantaged people should be represented on these
committees. SHPs and health posts are supposed to have nine-member HFMCs with at least four
women of whom at least one should be Dalit or Janajati, and two Dalit or Janajati (ethnic group)
members. PHCC committees should have 13 members with at least three women of whom at least one
should be Dalit or Janajati, and two Dalit and Janajati members. HFMCs and HDCs can invite additional
representatives of NGOs working in the local health sector to their meetings.
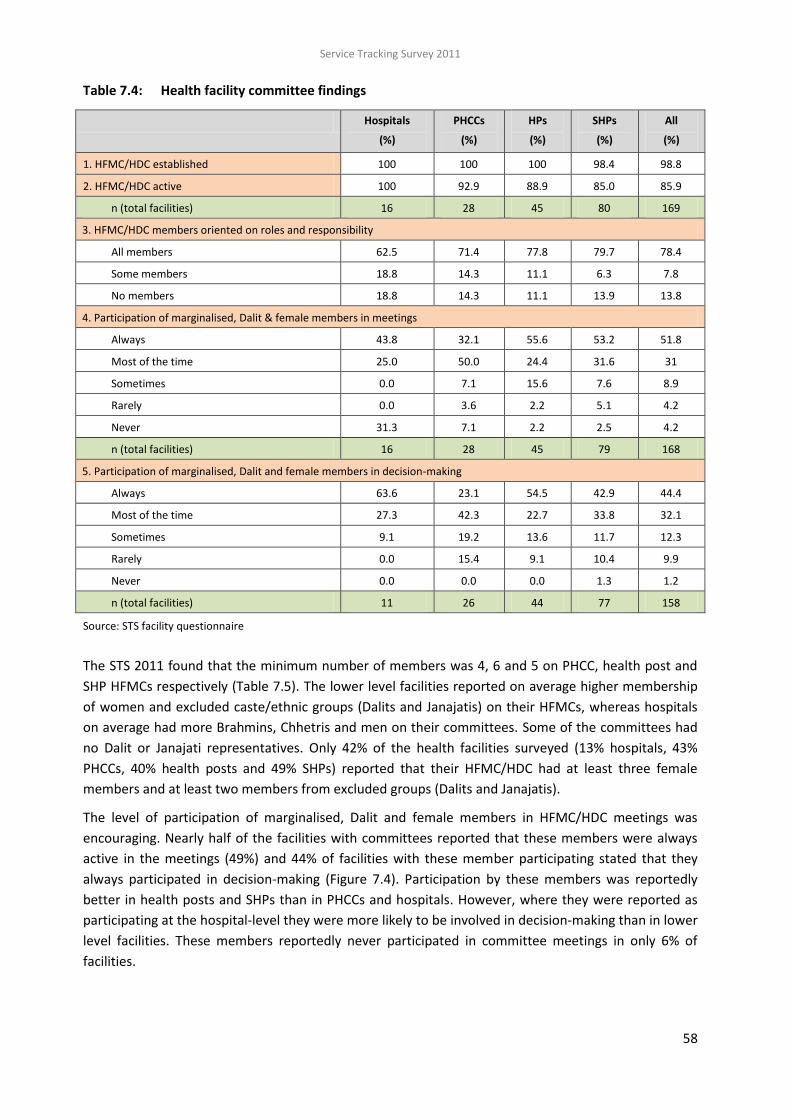
Service Tracking Survey 2011
58
Table 7.4: Health facility committee findings
Hospitals
(%)
PHCCs
(%)
HPs
(%)
SHPs
(%)
All
(%)
1. HFMC/HDC established 100 100 100 98.4 98.8
2. HFMC/HDC active 100 92.9 88.9 85.0 85.9
n (total facilities) 16 28 45 80 169
3. HFMC/HDC members oriented on roles and responsibility
All members 62.5 71.4 77.8 79.7 78.4
Some members 18.8 14.3 11.1 6.3 7.8
No members 18.8 14.3 11.1 13.9 13.8
4. Participation of marginalised, Dalit & female members in meetings
Always 43.8 32.1 55.6 53.2 51.8
Most of the time 25.0 50.0 24.4 31.6 31
Sometimes 0.0 7.1 15.6 7.6 8.9
Rarely 0.0 3.6 2.2 5.1 4.2
Never 31.3 7.1 2.2 2.5 4.2
n (total facilities) 16 28 45 79 168
5. Participation of marginalised, Dalit and female members in decision-making
Always 63.6 23.1 54.5 42.9 44.4
Most of the time 27.3 42.3 22.7 33.8 32.1
Sometimes 9.1 19.2 13.6 11.7 12.3
Rarely 0.0 15.4 9.1 10.4 9.9
Never 0.0 0.0 0.0 1.3 1.2
n (total facilities) 11 26 44 77 158
Source: STS facility questionnaire
The STS 2011 found that the minimum number of members was 4, 6 and 5 on PHCC, health post and
SHP HFMCs respectively (Table 7.5). The lower level facilities reported on average higher membership
of women and excluded caste/ethnic groups (Dalits and Janajatis) on their HFMCs, whereas hospitals
on average had more Brahmins, Chhetris and men on their committees. Some of the committees had
no Dalit or Janajati representatives. Only 42% of the health facilities surveyed (13% hospitals, 43%
PHCCs, 40% health posts and 49% SHPs) reported that their HFMC/HDC had at least three female
members and at least two members from excluded groups (Dalits and Janajatis).
The level of participation of marginalised, Dalit and female members in HFMC/HDC meetings was
encouraging. Nearly half of the facilities with committees reported that these members were always
active in the meetings (49%) and 44% of facilities with these member participating stated that they
always participated in decision-making (Figure 7.4). Participation by these members was reportedly
better in health posts and SHPs than in PHCCs and hospitals. However, where they were reported as
participating at the hospital-level they were more likely to be involved in decision-making than in lower
level facilities. These members reportedly never participated in committee meetings in only 6% of
facilities.

Service Tracking Survey 2011
59
Figure 7.3: Health facility committee (HFMCs and HDCs) ‘activeness’ findings
Source: STS facility questionnaire
Figure 7.4: Capacity building on GESI and participation of marginalised people on health facility
committees
Source: STS facility questionnaire

Service Tracking Survey 2011
60
Table 7.5: Number of members of health facility committees (HFMCs and HDCs)
Hospitals PHCCs HPs SHPs
Total members on HFMC/HDC
Mean 9.7 11.3 9.9 9.8
Min. 5 4 6 5
Max. 17 21 20 15
Total 155 316 446 772
Males Mean 8.2 8.6 7.5 6.9
Min. 4 3 3 3
Max. 15 19 14 13
Total 131 242 337 545
Females Mean 1.5 2.6 2.4 2.9
Min. 0 0 0 1
Max. 3 6 6 7
Total 24 74 109 227
Dalits and Janajatis Mean 1.8 4.2 4.7 4.5
Min. 0 0 0 0
Max. 9 11 11 15
Total 29 118 211 356
Brahmin/Chhetris Mean 7.3 6.9 4.7 4.8
Min. 0 0 0 0
Max. 15 14 13 12
Total 12 33 44 90
Terai/Madhesi other castes
Mean 0.6 0.2 0.5 0.5
Min. 0 0 0 0
Max. 9 6 6 9
Total 9 6 22 36
Source: STS facility questionnaire
Government guidelines specify that Health Facility and Operation Management Committees
(HFOMCs)/hospital development committees (HDCs) should meet once a month. However, only 39% of
PHCCs, 38% of HPs and 38% of SHPs reported that they held a meeting at least once a month. It was
even less common at hospitals, with just 19% doing so (Table 7.6). Further, 69% of hospitals, 75% of
PHCCs, 62% of HPs and 67% of SHPs reported to have held at least one HFMC/HDC meeting in the
current fiscal year (2011/12) prior to the survey. Of the 150 facilities reporting that their HFMC/HDC
was active, only 38% reported holding regular monthly meetings (Table 7.7).

Service Tracking Survey 2011
61
Table 7.6: Frequency of health facility committee (HFMC/HDC) meetings
Hospitals
(%)
PHCCs
(%)
HPs
(%)
SHPs
(%)
1. Frequency of HFMC/HDC meeting
Every month 18.8 39.3 37.8 38.0
Every 2-3 months 31.3 25.0 8.9 11.4
As per need 50.0 35.7 53.3 50.6
2. Last HFMC/HDC meeting (FY)
2068/69 (2011/2012 to date) 68.8 75.0 62.2 67.1
2067/68 (2010/2011) 31.3 25.0 35.6 31.6
2066/67 (2009/2010) 0 0 2.2 1.3
n (total facilities) 16 28 45 79
Source: STS facility questionnaire
Table 7.7: Reported activeness and frequency of health facility committee (HFMC/HDC) meeting
Frequency of meetings
Active
(%)
Not active
(%)
Total
(%)
Every month 38.7 16.7 37.7
Every 2-3 months 16.7 0.0 12.0
According to need 44.7 83.3 50.3
n (total facilities) 150 18 168
Source: STS facility questionnaire
The most common activity undertaken by the HFMCs and HDCs at all levels in the year preceding the
survey was supporting infrastructure development and maintenance as mentioned by 56% of hospitals,
68% of PHCCs, 55% of HPs and 54% of SHPs, followed by health service management (38% of hospitals,
21% of PHCCs, 22% of HPs and 38% of SHPs expansion of services, financial management and human
resources. The PHCC HFMCs were most likely to have focussed on expanding services (50%) and on
logistics (32%). At the health post level activities relating to human resources (33%) and logistics (31%)
were most common as was health service management at the SHP level (38%). Health facility
committees (HFMCs/HDCs) reported that they had recruited health workers (88% of hospitals, 79% of
PHCCs, 49% of HPs and 34% of SHPs) in the last fiscal year.

Service Tracking Survey 2011
62
Table 7.8: Main activities of health facility committees (HFMCs/HDCs) in last fiscal year
Hospitals
(%)
PHCCs
(%)
HPs
(%)
SHPs
(%)
1. Activities undertaken
Infrastructure development and maintenance 56.3 67.9 55.6 54.4
Health service management 37.5 21.4 22.2 38.0
Expansion of services 37.5 50.0 17.8 24.1
Logistics 12.5 32.1 31.1 24.1
Human resources 31.3 25.0 33.3 15.2
Financial management 37.5 10.7 15.6 15.2
Health camps 6.3 7.1 11.1 6.3
No work done 0.0 0.0 8.9 11.4
2. Capacity building on GESI 6.3 17.9 15.6 16.3
3. HFMC/HDC recruited health workers 87.5 78.6 48.9 33.8
n (total facilities) 16 28 45 79
Source: STS facility questionnaire
7.2.5 Complaint/suggestion mechanisms
Although all health facilities should have a mechanism for complaints/suggestions, only 75% of
hospitals, 29% of PHCCs, 9% of HPs and 13% of SHPs had such provision, suggesting that hospitals have
more commonly established a complaint/suggestion mechanism compared to lower level facilities
(Table 7.9).
The enumerators were able to see the complaint/suggestion mechanisms for all hospitals claiming to
have one, but could not for 18% of PHCCs, 9% of HPs and 13% of SHPs.
Table 7.9: Complaint/suggestion mechanisms at health facilities
Hospitals
(%)
PHCCs
(%)
HPs
(%)
SHPs
(%)
1. Yes, seen by researcher 75.0 28.6 28.9 17.5
2. Reportedly, but not seen by researcher 0.0 17.9 8.9 12.5
3. No mechanism in place 25.0 53.6 62.2 70.0
n (total facilities) 16 28 45 80
4. Type of mechanism
Focal person assigned 50.0 84.6 64.7 75.0
Complaint/suggestion box 66.7 15.4 41.2 8.3
In gatherings and committee meetings 8.3 7.7 0.0 16.7
5. Mean no. complaints/suggestions received in last fiscal year 861.3 4.7 6.2 25.1
n (total facilities) 12 13 17 24
Source: STS facility questionnaire

Service Tracking Survey 2011
63
The most common procedure for the lower level facilities was assigning a focal person to receive
complaints (85% of PHCCs, 65% of health posts and 75% of SHPs). Half of hospitals also had focal
persons (50%), but it was more common for them to have complaint/suggestion boxes (67%).
Given the higher caseload, it is not surprising that the mean number of complaints/suggestions
received in the previous year was highest in the hospitals (861). However, the mean number of
complaints/suggestions received by SHPs (25) was higher than for PHCCs (5) and health posts (6)
despite the lower caseload of SHPs.
7.2.6 Emergency plans
A half of the hospitals (50%) and just over half of the PHCCs (54%) had emergency contingency plans
for providing health services to women and children in conflict and emergency situations (Table 7.10).
Such plans were less common at the lower level facilities. Of the facilities with emergency plans, only a
quarter of hospitals (25%) and even fewer lower level facilities (7% of PHCCs, 14% of SHPs and no
health posts) reported that a budget had been allocated to implement their plans. However, some
facilities (25% of hospitals, 20% of PHCCs, 7% of HPs, and 19% of SHPs) reported that their emergency
plans had received funding from local government (VDCs and district development committees) and
local communities. For those that had received funding, the mean amount received by hospitals was
12.6 million rupees, and for PHCCs it was over 100,000 rupees. Half of the facilities reported holding a
meeting (other than a regular staff meeting) related to preparing their emergency plan (50%).
Table 7.10: Availability of an emergency contingency plan for women and children
Hospitals
(%)
PHCCs
(%)
HPs
(%)
SHPs
(%)
1. Have emergency plan 50.0 53.6 33.3 26.3
n (total facilities) 16 28 45 80
2. Budget allocated to implement plan 25.0 6.7 0.0 14.3
3. Plan received funding from local government (VDC, DDC) or community
25.0 20.0 6.7 19.0
n (total facilities) 8 15 15 21
4. Mean amount received (NPR) 1,181,418 151,400 6,000 54,900
n (total facilities) 2 3 1 4
5. Ever had meeting to prepare emergency plan 75.0 64.3 44.4 42.5
n (total facilities) 16 28 45 80
Source: STS facility questionnaire
7.2.7 Staff meetings
Regular staff meetings are important for planning and implementing facility and service delivery
improvements. More than three fourths of the HPs (76%) reported that they held monthly staff
meetings. Nearly one tenth of SHPs only had meetings when it was felt necessary (9%) and nearly one-
fifth of SHPs did not hold any regular staff meetings (19%). PHCCs and SHPs were more likely to never
hold staff meeting in comparison to hospitals and HPs. Almost all facilities (Hospitals 87%, PHCCs 92%,
HPs 91%, SHPs 88%) reported that they had held their last staff meeting in the current fiscal year
(2011/12).
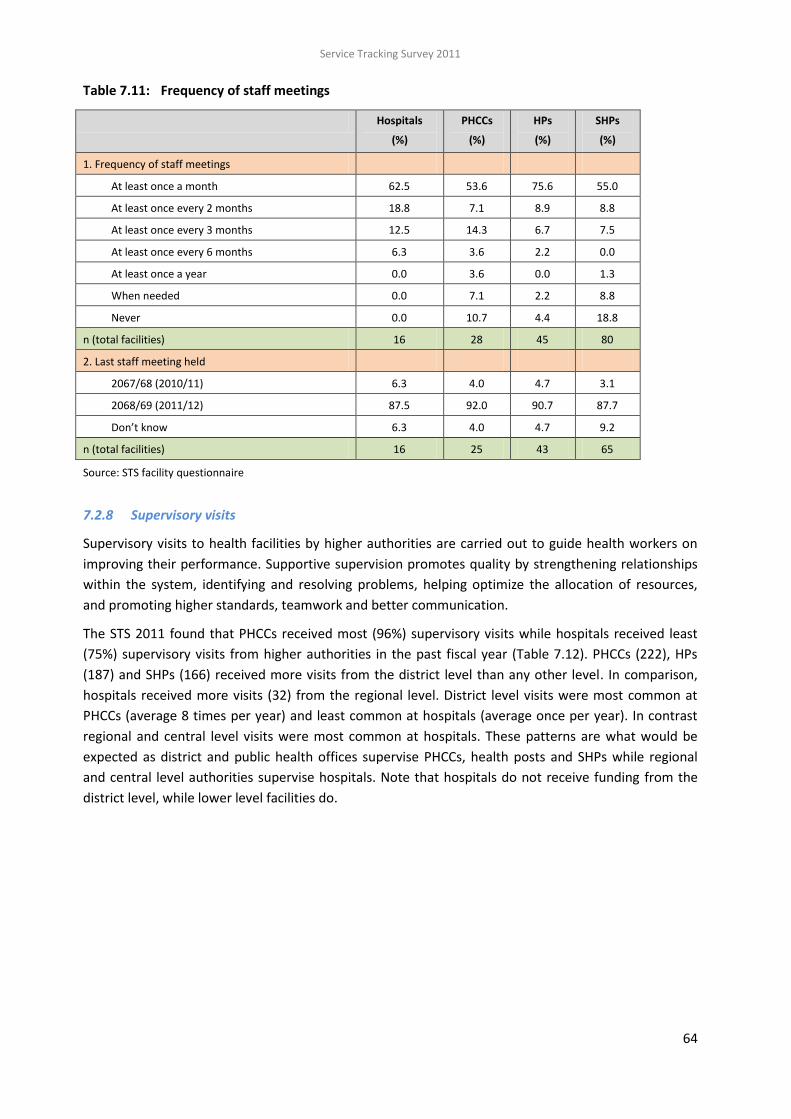
Service Tracking Survey 2011
64
Table 7.11: Frequency of staff meetings
Hospitals
(%)
PHCCs
(%)
HPs
(%)
SHPs
(%)
1. Frequency of staff meetings
At least once a month 62.5 53.6 75.6 55.0
At least once every 2 months 18.8 7.1 8.9 8.8
At least once every 3 months 12.5 14.3 6.7 7.5
At least once every 6 months 6.3 3.6 2.2 0.0
At least once a year 0.0 3.6 0.0 1.3
When needed 0.0 7.1 2.2 8.8
Never 0.0 10.7 4.4 18.8
n (total facilities) 16 28 45 80
2. Last staff meeting held
2067/68 (2010/11) 6.3 4.0 4.7 3.1
2068/69 (2011/12) 87.5 92.0 90.7 87.7
Don’t know 6.3 4.0 4.7 9.2
n (total facilities) 16 25 43 65
Source: STS facility questionnaire
7.2.8 Supervisory visits
Supervisory visits to health facilities by higher authorities are carried out to guide health workers on
improving their performance. Supportive supervision promotes quality by strengthening relationships
within the system, identifying and resolving problems, helping optimize the allocation of resources,
and promoting higher standards, teamwork and better communication.
The STS 2011 found that PHCCs received most (96%) supervisory visits while hospitals received least
(75%) supervisory visits from higher authorities in the past fiscal year (Table 7.12). PHCCs (222), HPs
(187) and SHPs (166) received more visits from the district level than any other level. In comparison,
hospitals received more visits (32) from the regional level. District level visits were most common at
PHCCs (average 8 times per year) and least common at hospitals (average once per year). In contrast
regional and central level visits were most common at hospitals. These patterns are what would be
expected as district and public health offices supervise PHCCs, health posts and SHPs while regional
and central level authorities supervise hospitals. Note that hospitals do not receive funding from the
district level, while lower level facilities do.

Service Tracking Survey 2011
65
Table 7.12: Supervisory visits from district, regional and central level authorities
Hospitals PHCCs HPs SHPs
No. % No. % No. % No. %
1. Had supervisory visit(s) in last fiscal yr 12 75.0 27 96.4 41 91.1 63 78.8
2. Visits from district level:
Total visits 14 222 187 166
Mean number of visits 0.9 7.9 4.2 2.1
3. Visits from regional level:
Total visits 32 21 9 23
Mean number of visits 2.0 0.8 0.2 0.3
4. Visits from central level:
Total visits 21 14 14 15
Mean number of visits 1.3 0.5 0.3 0.2
n (total facilities) 16 28 45 80
Source: STS facility questionnaire
Overall, the facilities were most likely to receive feedback from supervisory visits on the subjects of
service quality improvement (64%) followed by expediting progress particularly for increasing service
coverage (46%) and improving data quality (40%) (Table 7.13). This reflected the pattern for PHCCs,
health posts and SHPs. However, hospitals were more likely to receive feedback on ensuring the
availability of essential drugs (33%) than on data quality. Feedback relating to the need to focus on
reaching the underserved was more common at health posts and SHPs than at higher-level facilities.
Table 7.13: Types of feedback received during supervisory visits
Source: STS facility questionnaire
Feedback received Hospitals
(%)
PHCCs
(%)
HPs
(%)
SHPs
(%)
Service quality improvement 50.0 66.7 68.3 61.9
Expediting progress on activities 50.0 44.4 56.1 39.7
Data quality 25.0 37.0 43.9 41.3
Reaching underserved people 8.3 7.4 22.0 27.0
Availability of essential drugs 33.3 22.2 12.2 20.6
Human resources 25.0 18.5 17.1 17.5
Disclosure of financial statements 8.3 18.5 7.3 6.3
Developing/maintaining infrastructure 8.3 7.4 4.9 9.5
Improving record-keeping/reporting 8.3 3.7 4.9 7.9
No suggestions 16.7 3.7 0.0 3.2
n (total facilities) 12 27 41 63

Service Tracking Survey 2011
66
7.3 KEY FINDINGS
Social audits
More than one fourth (27%) of the facilities had undertaken a social audit in the current or
previous fiscal year. A lesser proportion of hospitals had conducted social audits although all
the hospitals that had conducted one had produced a report on the audit that was available in
their facilities. The lower level facilities were more likely to have made the findings of their
audits public, and to have used a public gathering to do so, while hospitals were less likely to
have made the findings public, and tended to display findings on information boards. Nearly
one fourth of facilities had incorporated recommended actions into their annual plans and
budgets. The use of community scorecards was very low.
Citizen’s charters
The hospitals were most likely to have the charter outside their building in a visible place. Of
those with a charter, most included information on free drugs and outpatient services, and
most of the facilities implementing the Aama Programme and having a citizen charter had
information on the programme in their charters.
Disclosure
The health facilities were most likely to have disclosed information related to free essential
drugs and to have used public noticeboards to do so. The next most common subjects for
information disclosure were current disease trends, public health interventions and information
on the facility workforce. This information was largely disclosed through public gatherings.
Health facility committees
Hospital development committees (HDCs) had been established in all hospitals and health
facility management committees (HFMCs) in all the PHCCs and health posts and all but one of
the SHPs. Most of these committees were reportedly active. Over three-quarters had oriented
all committee members on their roles and responsibilities. More than 50% of facilities held
committee meetings at least every two to three months and almost all facilities (94%) had held
an HFMC meeting in the current fiscal year (2010/2011). The most common activity organised
and supported by the HFMCs/HDCs was infrastructure development and maintenance and half
of facilities reported that their HFMC/HDC had recruited health workers.
More needs to be done to increase the active participation of marginalised and female
members of HFMCs/HDCs. Just under a half of facilities reported that these members were
always active in committee meetings with a lesser proportion reporting that they always
participated in decision-making. Only 6% of facilities reported that these members never
participated in committee meetings. Only a few facilities had specific activities for building the
capacity of their HFMCs/HDCs on gender and social inclusion and this was least common in the
hospitals.
Complaint/suggestion mechanisms
Three-quarters of the hospitals had a complaints/suggestion mechanism, with the likelihood of
having one decreasing by level of facility. The most common procedure for lower level facilities
was to assign a focal person to receive complaints/suggestions. Half of hospitals had a focal
person, but it was more common for them to have complaint/suggestion boxes.

Service Tracking Survey 2011
67
Emergency plans
About half of hospitals and PHCCs and a lower proportion of health posts and SHPs had
emergency contingency plans. Of facilities with plans, only a quarter of hospitals and fewer
lower level facilities reported that a budget had been allocated to implement the plans. Some
facilities reported that their plans had received funding from local government or communities.
Staff meetings
Many facilities held regular staff meetings with 63% of Hospitals, 54% of PHCCs, 76% of HPs and
55% of SHPs% holding them at least once a month.
Supervision
Most facilities had received a supervisory visit in the past fiscal year, which varies from 96%
PHCCs 96% to 25% of hospitals. Supervisory visits from the district level were more common
than from regional and central levels. Higher proportions of district level visits were made to
PHCCs and more regional and central level visits were made to hospitals. Health facilities were
most likely to have received feedback on quality improvement, and feedback related to
reaching the underserved was most common at health posts and SHPs.

Service Tracking Survey 2011
68
8 HUMAN RESOURCES
8.1 INTRODUCTION
Human resources form the epicentre of every health system and play an indispensable part in
producing and delivering high quality health services. However, it is only recently that the development
and strategic management of the health workforce has received the same degree of prominence
globally as other major health issues. Despite this recent acknowledgement, the lack of a concerted
and decisive global effort to tackle the issue has meant that developing nations are struggling to
produce, manage and retain a health workforce that is capable of meeting all the basic health needs of
their populations.
Within Nepal, there is a need to ensure that on-going reforms in the health sector are complemented
by adequate human resources. The Government of Nepal’s Strategic Plan for Human Resources in
Health, 2003-2017 (MoH 2003) puts human resources planning and management at the heart of the
wider health sector reforms in Nepal. Its recommendations aim to help policy-makers decide on and
plan for:
“i) the right number of people ii) in the right place, iii) at the right time, iv) with the right
skills, v) with the right motivation and attitude, vi) at the right cost and vii) doing the right
work.” (MoH 2003:12).
Examples of the commitment of the Nepalese government to developing human resources for health
include the introduction of a mandatory rural service programme for scholarship students in medical
schools (Shanker 2010), training more skilled birth attendants (SBAs), increasing the provision of in-
service training for staff and hiring contractual staff to fill recruitment gaps. However, the extent to
which these strategies are able to deliver the desired results is arguable in light of the findings of the
recent, more comprehensive and critical analysis by the Human Resources for Health Strategic Plan
2010-2015 (MoHP 2012).
There is thus a need to regularly evaluate the human resources situation; and while centrally
controlled databases exist, the information currently held there is not updated regularly. By carrying
out a strategic analysis of current human resources, this Service Tracking Survey 2011 (STS 2011) aims
to help policy-makers:
identify the gaps in current provision — i.e. between sanctioned posts and filled posts;
understand the current employment mix — i.e. between filled, deputed and contract posts; and
identify where to prioritise attention and resources.
The analysis in this chapter only focuses on technical personnel and excludes administrative personnel.
See definitions of different kinds of posts in Box 8.1.

Service Tracking Survey 2011
69
Box 8.1: Definitions
Sanctioned posts are permanent allocated posts approved by the Ministry of Health and Population (MoHP) and
its divisions in consultation with the Ministry of General Administration and the Ministry of Finance.
Filled posts are posts where a member of staff has been recruited to a sanctioned post (i.e. it is a permanent
position). Filled posts do not include temporary postings, such as contract postings (including through health
management committees [HDCs and HFMCs]) or deputations to posts. However, some of those officially
recorded in filled posts at a facility may have been deputed out.
Deputation is the practice of posting staff to a facility different to the one in which they hold or held a sanctioned
post. Note that deputations for less than one month are officially recorded as filled-sanctioned posts at the
facility from which they are deputed from, but are not included in the filled-sanctioned posts of the facility where
they are deputed to. According to government regulations, staff should not be deputed for more than three
months.
Contracted employees are employed in temporary posts for fixed periods of time. These include those employed
by health management committees. At present staff can only receive a contract up to one year; but they are
often given new contracts once their initial contract expires. Multi-year contracting is currently under discussion.
Source: Civil service regulation, 2050 (1993)
8.2 RESULTS
Box 8.2: Key STS indicators for human resources
Indicators 2011 results
(%)
95% CI
% of sanctioned posts that are filled:
Doctors at district hospitals* 68.9 46.7-79.6
Doctors at PHCCs* 50.0 35.1-64.9
Nurses at district hospitals* 83.3 74.3-89.6
Nurses at PHCCs* 73.8 60.5-83.8
% of hospitals that have at least 1 obstetrician-gynaecologist or Specialist General Practitioner (MDGP), 5 SBA (skilled birth attendant) trained nurses, and 1 anaesthetist or anaesthetist assistant*
31.2 14.5-55.0
% of PHCCs with at least 1 medical officers, 1 health assistant/senior auxiliary health worker (SAHW), 1 staff nurse, 2 AHWs, 3 ANMs and 1 lab assistant in filled post
7.1 0.6-47.8
% of category A health posts with at least 1 health assistant/SAHW, 2 AHW and 1 ANM in filled post
53.3 19.2-84.6
% of category B health posts with at least 1 health assistant/SAHW, 1 AHW and 1 ANM in filled post
20.0 8.7-39.6
% of SHPs with at least 1 AHW, 1 MCHW and 1 VHW in post 50.0 37.8-62.2
* NHSP 2 logframe indicators

Service Tracking Survey 2011
70
8.2.1 Sanctioned and filled posts
Having an appropriate number of sanctioned posts is fundamental for the adequate and equitable
distribution of human resources in health facilities. The current sanctioned posts were set out in the
Government of Nepal’s National Health Policy, 1991. However, between 1991 and 2008 the population
of Nepal increased by 35% while the number of health workers increased by only 3% (MoHP 2012).
Furthermore, Nepal’s population is ageing (with a higher percentage of the population in older age-
groups), thus placing additional demands on the health system. One report claims that plans to
increase the number of health workers, as set out in the HRH Strategic Plan in 2003 (MoH 2003), is
unlikely to be achieved due to the large number of sanctioned posts that are unfilled (Kolehmainen-
Aitken and Shrestha 2009). It has been estimated that nearly a third of all government sanctioned
posts for doctors and nurses are unfilled, especially in skill areas that are most needed (MoHP 2012).
Sanctioned posts are particularly difficult to fill in remote and mountainous areas.
Tables 8.1 to 8.7 show the official number of sanctioned posts at each level as stipulated in the DoHS
operating manual (DoHS 2011) and the actual number of sanctioned posts as recorded by the STS
2011. These two sets of data were compared to assess the percentage of facilities that had at least the
number of sanctioned posts. These tables also show the number of filled posts against both the official
(DoHS operating manual) and actual number of sanctioned positions. In most cases the actual number
of posts sanctioned matched the official number of posts sanctioned; although there were a few
exceptions. We identified the following four reasons for the differences between the official
sanctioned posts as per the DoHS operating manual and the actual sanctioned posts at the facilities
visited for the STS 2011:
Upgrading of facilities — Some facilities are in the process of being officially upgraded; but the
number of sanctioned posts has not yet changed to reflect this new status. For example, a
health post in Solukhumbu is in the process of being upgraded to a primary health care centre
(PHCC), but still has the staffing of a health post.
Staff promotion — Some staff in sanctioned posts have been promoted to positions that are
not officially sanctioned for their level of facility but remain in the same facility (e.g. some
maternal and child health workers [MCHWs] at sub-health posts [SHPs] have been promoted to
auxiliary nurse midwife (ANMs), which are only sanctioned at health post level and above).
Defunct positions — Some staff are in posts that were historically sanctioned at that level of
facility but are no longer sanctioned at that level. In these circumstances the staff remain in
post until they choose to leave; but once they leave they are not replaced (e.g. village health
workers [VHWs] at health posts in Banke and Jajarkot).
Differences between topographical zones — Sanctioned posts should take into consideration
what is appropriate for the context and hence some sanctioned posts vary by topographical
zone.
Higher level hospitals
The number of sanctioned posts varies by the level of hospital (zonal, regional, sub-regional, and
district) and also within the same level of hospital. Table 8.1 shows the number of sanctioned posts for
the four higher level hospitals in the STS 2011 as per the DoHS operating manual. It is not surprising

Service Tracking Survey 2011
71
that the number of sanctioned posts varies substantially between the hospitals given that they include
central, regional and zonal hospitals.
Table 8.1: Official number sanctioned posts at higher level hospitals (excl. administrative posts)
Position
Central Regional Zonal Zonal
BP Koirala Institute of
Health Science
Hetauda
Hospital
Bheri Zonal
Hospital
Seti Zonal
Hospital
Obstetrician/gynaecologist (O/G) 19 1 2 1
Paediatrician 22 1 2 1
MDGP 24 0 0 0
Medical officer 157 4 12 7
Anaesthetist assistant 20 0 0 0
Sister/matron/hospital inspector 56 1 3 2
Staff nurse 555 10 25 19
Health assistant (HA) 0 1 0 1
Auxiliary health worker (AHW) 0 5 5 6
Auxiliary nurse midwife (ANM) 92 4 4 5
Laboratory assistant 61 1 6 3
n (total posts) 1006 28 59 45
Source: Department of Health Services, Operating Manual for Department of Health Services 2011.
All four higher level hospitals had at least the number of posts sanctioned as per the operating
manual for most posts (O/Gs, paediatricians, MDGPs, medical officers, anaesthetist assistants,
sister/matrons, staff nurses, health assistants, AHWs and ANMs). However, three of the four
hospitals had at least the number of sanctioned posts for laboratory assistants, which resulted
in 75% of the higher level hospitals having at least the number of posts sanctioned as stated in
the DoHS operating manual (Table 8.2 column b).
There were no cadre for which all higher level hospitals had at least the number of staff in filled
posts as per the number officially sanctioned. Three of the four higher level hospitals had at
least the number filled for O/Gs, MDGPs and anaesthetist assistants. Two of the four hospitals
had at least the number filled for health assistants, AHWs, ANMs and laboratory assistants. Just
one of the four hospitals had at the least the number of filled posts for paediatricians and
medical officers (column c). It should be noted that Hetauda hospital has only recently been
upgraded to a regional hospital and although the sanctioned posts have been changed to
match, many of these have yet to be filled. For example, there are no filled posts for
paediatricians, medical officers, sister/matrons, or health assistants, and only half of the staff
nurse sanctioned posts are filled.
Columns d and e of Table 8.2 aggregate all higher level hospitals together; but it should be
noted that the high number of staff at BPKIHS heavily skews the overall results. The biggest
gaps are seen for medical officers (where just 7% of sanctioned posts are filled) and staff nurses
(where only 16% of sanctioned posts are filled) (Figure 8.1).

Service Tracking Survey 2011
72
Table 8.2: Sanctioned and filled posts at higher level hospitals
(a) (b) (c) (d) (e)
Position
Official no. sanctioned posts
(in DoHS operating manual – see Table
8.1)
Had at least no. officially sanctioned
posts
Had at least
number of (a) in
filled posts
Total no. of sanctioned posts (i.e. ‘actual’ no. for all sampled
hospitals)
% of (actual) sanctioned
posts (d) filled
Range across hospitals % % No. %
Obstetrician/gynaecologist 1-19 100 75 23 65.2
Paediatrician 1-22 100 25 26 34.6
MDGP 0-24 100 75 26 57.7
Medical officer 4-157 100 25 183 6.6
Anaesthetist assistant 0-20 100 75 61 80.3
Sister/matron/hospital inspector
1-56 100 0 21 95.2
Staff nurse 10-555 100 25 613 15.7
Health assistant (HA) 0-1 100 50 3 33.3
AHW 5-6 100 50 24 88.4
ANM 4-92 100 50 121 91.7
Laboratory assistant 1-61 75 50 71 78.9
All 28-1,006 75 0 912 34.3
n (total facilities) 4
Sources: DoHS 2011 Operating Manual and STS facility questionnaire
District hospitals
District hospitals are divided into four categories (A-D) each with a different number of sanctioned
posts, with the number increasing from category A to D (Table 8.3). Two of the district hospitals
sampled in STS 2011 were category A hospitals, one category B, eight category C, with no category D
hospitals. It should be noted that there are no sanctioned anaesthetist assistant (AA) posts in district
hospitals, and no sanctioned obstetrician-gynaecologist posts in categories A–C, which will hamper
progress on all districts having at least one comprehensive emergency obstetric and neonatal care
(CEONC) facility.
The DoHS operating manual stipulates that the official number of sanctioned posts at district
hospitals in categories A to C is one to two medical officers, two to four staff nurses, one health
assistant, two to three AHWs, two ANMs, and one to two laboratory assistants (Table 8.4
column a).
All 12 district hospitals had at least the number of sanctioned posts (as specified in the DoHS
operating manual) for medical officers, health assistants, and ANMs; however, only 83% had at
least the number of sanctioned posts for staff nurses and AHWs and only a quarter (25%) had
at least one to two laboratory assistants. This resulted in just 8% of district hospitals having at
least the number of posts sanctioned as per the DoHS operating manual (Table 8.4 column b).

Service Tracking Survey 2011
73
Table 8.3: Official number of sanctioned posts at district hospitals (excl. administrative posts)
Position
Category A Category B Category C Category D
Solukhumbu,
Mugu
Jajarkot Panchthar, Sunsari, Sindhupalchowk, Mahottari, Baitadi,
Syangja, Kapilbastu, Tikapur (Kailali)
-
Obstetrician/
gynaecologist 1
Paediatrician 1
Medical officer 1 1 2 3
Sister/matron/hospital inspector 1
Health assistant (HA) 1 1 1
Staff nurse 2 3 4 9
AHW 3 2 2 4
ANM 2 2 2 3
Laboratory assistant 1 1 2 2
n (total posts) 9 10 13 25
Source: DoHS operating manual, 2011. Note: The second header row names the STS 2011 district hospitals
In regards to filled posts, all the district hospitals had at least two ANMs, 83% had at least one
health assistant, and 75% had at least one to two medical officers and two to three AHWs. Of
more concern is that only half of the district hospitals had at least the required number of
laboratory assistants in filled posts, while just 42% had two to four staff nurses (Table 8.4
column c).
Table 8.4: Sanctioned and filled posts at district hospitals
Position
(a) (b) (c) (d) (e)
Official no. of sanctioned posts
(in DoHS operating manual – see Table
8.3)
Had at least no. of
officially sanctioned
posts
Had at least the
number of (a) in filled- posts
Total no. of sanctioned posts (i.e. ‘actual’ no. for all STS dist.
hospitals)
% of (actual) sanctioned
posts (d) filled
Range across hospitals
% % No. %
Medical officer 1-2 100 75.0 35 60.0
Staff nurse 2-4 83.3 41.7 48 75.0
Health assistant 1 100 83.3 14 64.3
AHW 2-3 83.3 75.0 27 92.6
ANM 2 100 100 28 92.9
Laboratory assistant 1-2 25.0 50.0 12 76.2–133.3
All (1-2 medical officers, 1 HA, 2-4 staff nurse, 2-3 AHWs, 2 ANMs & 1-2 lab. assts) 9-14 8.3 0 164 81.1
n (total facilities) 12
Sources: DoHS 2011 Operating Manual and STS facility questionnaire

Service Tracking Survey 2011
74
Overall 81% of the 164 sanctioned posts at the 12 district hospitals were filled. The percentage
of these sanctioned posts that are filled varied by position. This is slightly better than PHCCs,
health posts and SHPs (see below). Most ANM posts (93%) and AHWs (93%) were filled (85%),
along with 75% of staff nurses. Of greater concern is the medical officers and health assistant
positions with only 60% and 64% of them filled respectively (Table 8.4 column e and Figure
8.1).
Figure 8.1: Percentage of sanctioned posts filled at district and higher level hospitals
60
69
75
93
64
93
100
63
35
56
7
98
79
16
100
20
100
8085
0
20
40
60
80
100
%
District Hospitals Other Hospitals
Source: STS facility questionnaire
Primary health care centres
The DoHS operating manual stipulates that the official number of sanctioned posts at PHCC
level should be one of each of the following: medical officer, health assistant, staff nurse, and
laboratory assistant, along with two AHWs and three ANMs (Table 8.5, column a).
All PHCCs had at least this number of sanctioned posts (as specified in the DoHS Operating
manual) for medical officers, health assistants/SAHWs, staff nurses, laboratory assistant, and
AHWs; however, only 82% had three sanctioned posts for ANMs (column b). Three quarters of
PHCCs (75%) had at least one laboratory assistant in a filled post, 71% had at least two AHWs in
a filled post, while just 50% of the facilities had at least one medical officer, one health
assistant and three ANMs. This resulted in just 7% of PHCCs having at least one medical officer,
one health assistant, one staff nurse, two AHWs, three ANMs and one laboratory assistant in
filled posts (column c).
Overall just under three quarters of the 247 sanctioned posts at the sampled PHCCs were filled
(73%) — similar to health posts and SHPs (see below). The percentage of these sanctioned
posts that are filled varied by position. Most AHW (93%) and ANM posts were filled (85%) as
were 75% of laboratory assistant posts. Of greater concern are the staff nurse (43%), medical
officer (50%) and health assistant (50%) positions (column e and Figure 8.2).

Service Tracking Survey 2011
75
Table 8.5: Sanctioned and filled posts at PHCCs
Position
(a) (b) (c) (d) (e)
Official no. sanctioned posts
(in DoHS operating manual)
Had at least number of officially
sanctioned posts
Had at least the number of (a) in
filled posts
Total no. sanctioned posts
(i.e. ‘actual’ no. for all sampled PHCCs)
% of (actual) sanctioned
posts (d) filled
No. % % No. %
Medical officer 1 100 50.0 28 50.0
Health assistant 1 100 50.0 28 50.0
Staff nurse 1 100 42.9 28 42.9
AHW 2 100 71.4 28 92.9
ANM 3 82.1 50.0 56 84.8
Laboratory assistant 1 100 75.0 79 75.0
All (1 medical officer, 1 HA, 1 staff nurse, 2 AHWs, 3 ANMs and 1 lab. asst) 82.1 7.1 247 72.9
n (total facilities) 28
Sources: DoHS 2011 Operating Manual and STS facility questionnaire
Figure 8.2: Percentage of sanctioned posts filled at PHCCs, health posts and SHPs
50
43
75
93
85
50
98
88
47
94
78
61
0
20
40
60
80
100
MedicalOfficer
Staff Nurse Lab. Assist. AHW ANM HA MCHW VHW
%
PHCC HP SHP
Source: STS facility questionnaire
Health posts
Health posts are divided by topographical zones into category A (Terai districts) and category B types
(hill and mountain districts). Of the 45 STS health posts, 15 were category A and 30 category B.
The DoHS operating manual stipulates that the official number of sanctioned posts at health
posts should be one health assistant and one ANM with the only difference between the two

Service Tracking Survey 2011
76
categories being that category A health posts should have two AHWs and category B should
just have one AHW (Table 8.6, columns a1 and a2).
All category A health posts had at least this number of sanctioned posts (as per the DoHS
operating manual) for health assistants and ANMs.
All category B health posts had at least this number of sanctioned posts (as per the DoHS
operating manual) for each of these positions, except that three health posts in the Karnali
zone (Mugu district) do not have any sanctioned ANM posts (column b2).
Most category A health posts had at least 2 AHWs (93%) in a filled post and most category B
had at least one (87%). Likewise most had at least one ANM (80% of category A and 83% of
category) in a filled post. However, only two-thirds (67%) of category A health posts had at
least one health assistant in a filled post, and filling these posts in the hill and mountain
districts appears to be even more problematic, with just one-third (37%) of category B health
posts having at least one health assistant in a filled post (columns c1 and c2).
This resulted in just over half of category A health posts (53%) and only one-fifth of category B
(20%) having at least the number of officially sanctioned positions in filled posts.
The total number of sanctioned posts in the health posts was 150, with 60 AHWs and 45 each
health assistant and ANMs, reflecting one of each post in each facility (column d).
Overall, 80% of the 147 sanctioned posts at health posts were filled. The percentage of these
sanctioned posts that were filled varied by position, but most AHWs were filled (98%). Most
ANM sanctioned posts were also filled (88%); but only 47% of sanctioned health assistant posts
were filled (column e and Figure 8.2).
Table 8.6: Sanctioned and filled posts at health posts
Position
Category A Category B All
(a1) (b1) (c1) (a2) (b2) (c2) (d) (e)
Official no.
sanctioned
posts
(in DoHS
operating
manual)
Had at least
no. of
officially
sanctioned
posts
Had
at
least
no. of
(a) in
filled-
posts
Official no.
sanctioned
posts
(in DoHS
operating
manual)
Had at
least no.
of
officially
sanctioned
posts
Had
at
least
no.
of
(a2)
in
filled-
posts
Total no.
sanctioned
posts
(i.e.
‘actual’
no. for all
STS HPs)
% of
(actual)
sanctioned
posts (d)
filled
No. % % No. % % No. %
Health assistant
1 100 66.7 1 100 36.7 45 46.7
AHW 2 100 93.3 1 100 86.7 60 98.3
ANM 1 100 80.0 1 90.0 83.3 42 88.1
All (1 HA, 1 or 2 AHWs, 1 ANM) 4 93.3 53.3 3 90.0 20.0 147 79.6
n (total facilities) 15 30 45
Sources: DoHS 2011 operating manual and STS facility questionnaire

Service Tracking Survey 2011
77
Sub-health posts
The DoHS operating manual stipulates that the official number of sanctioned posts at SHP level
should be one AHW, one MCHW and one VHW (Table 8.7 column a).
All of the sub-health posts had at least this number of sanctioned posts (as per the DoHS
operating manual) for each of these positions (column b).
Most SHPs had at least one (as specified in the DoHS operating manual) AHW (91%) and one
MCHW (90%) in filled-sanctioned posts. However, less than two-thirds (61%) of SHPs had at
least one VHW in a filled-sanctioned position (column c). This resulted in only half of the SHPs
(50%) having one AHW, one MCHW and one VHW in filled posts.
The total number of sanctioned posts in the sampled SHPs was 240, split equally between the
three cadre (AHWs, MCHWs and VHWs) (column d). Overall just over three quarters of the 240
sanctioned posts at sampled SHPs were filled (78%). However, the percentage of these
sanctioned posts that were filled varied by position. Most AHW posts (94%), but only 78% of
MCHW and 61% of VHW posts were filled (column e and Figure 8.2).
Table 8.7: Sanctioned and filled posts at SHPs
Position
(a) (b) (c) (d) (e)
Official no. sanctioned posts
(in DoHS operating manual)
Had at least the no. of officially
sanctioned posts
Had at least the number of (a) in
filled posts
Total no. sanctioned posts
(i.e. ‘actual’ no. for all sampled SHPs)
% of (actual) sanctioned
posts (d) filled
No. % % No. %
AHW 1 100 91.3 80 93.8
MCHW 1 100 77.5 80 77.5
VHW 1 100 61.3 80 61.3
All (1 AHW, 1MCHW and 1 VHW)
3 100 46.3 240 77.5
n (total facilities) 80
Sources: DoHS 2011 operating manual and STS facility questionnaire
All levels (excluding higher level hospitals)
This sub-section presents the percentage of sanctioned posts filled for district hospitals, PHCCs, health
posts and SHPs combined. (Note that the higher level hospitals have been excluded from this analysis
and the sanctioned posts reflect the actual number recorded during STS and not the official number in
the DoHS operating manual). Most sanctioned ANM (93%), AHW (89%), and MCHW (89%) posts were
filled (Table 8.8). The biggest gaps were for medical officers (58% filled), health assistants (65%), and
staff nurses (66%).

Service Tracking Survey 2011
78
Table 8.8: Percentage sanctioned posts filled at district hospitals, PHCCs, health posts and SHPs
Posts %
ANM 92.9
AHW 89.3
MCHW 88.7
Laboratory assistant 83.0
VHW 79.1
Staff nurse 66.2
Health assistant 65.3
Medical officer 58.3
Staff perceptions on number of sanctioned posts
Facility staff were asked whether or not they felt that the number of sanctioned staff was adequate for
the services provided by their facilities (Table 8.9). Staff at PHCCs were most likely to report the
number of sanctioned staff as being inadequate (91%) and hospital staff were the least likely to,
although the proportion was still very high (81%). Nearly two-thirds of those who felt the number of
sanctioned posts was inadequate reported that this was the case for maternity services (65%),
especially among PHCC staff (79%). The number of sanctioned posts in child health services at the
hospital level were deemed to be as inadequate as maternity services (62%).
Table 8.9: Staff perceptions regarding number of sanctioned posts
All
hospitals
(%)
PHCC
(%)
HP
(%)
SHP
(%)
1. No. sanctioned posts are inadequate 81.3 85.7 91.1 86.3
n (total facilities) 16 28 45 80
2. Services for which no. sanctioned staff were perceived to be inadequate:
Surgical 46.2
Maternity 61.5 79.2 63.4 62.3
Medical 53.8 66.7 34.1 49.3
Admin. service 23.1 25.0 31.7 27.5
Child health 61.5 25.0 14.6 17.4
Others 23.1 16.7 24.4 13.0
n (total facilities) 13 24 41 69
Source: STS facility questionnaire
8.2.2 Service contracts
As the creation and filling of sanctioned posts for health care providers is usually a lengthy process,
health facilities frequently recruit temporary staff to meet their urgent needs. Temporary staff can be
recruited through contract posts, including through HFMCs and HDCs, or deputed from another facility.
Such staff are in addition to permanent filled-sanctioned posts. Temporary staff are hired for fixed

Service Tracking Survey 2011
79
lengths of time depending on available budgets. Every year, some of the budget from the Red Book
(the government’s budget) is allocated for recruiting contract staff at any level. Furthermore, usually at
least five percent of village development committee (VDC) budgets are allocated to health costs, with
one possible use of these funds being to contract health workers. HFMC/HDC-recruited staff are
monitored by these committees. Contract staff, including those recruited through HFMCs/HDCs, can be
relocated under certain circumstances to another facility, depending on need, but they are never
deputed.
Figures 8.3-8.7 show the service-contract mix at all facility levels. The highest proportions of contracted
staff (excluding HDC/HFMC) were seen for medical officers at higher level hospitals (72%) and district
hospitals (49%) and for staff nurses at higher level hospitals (79%) (Figures 8.3 and 8.4). HDCs/HFMCs
have been responsible for recruiting a relatively high proportion of ANMs (20%) at higher level
hospitals, AHWs (35%) and ANMs (28%) at district hospitals, and AHWs (48%), and AHWs (18%) at
health posts (Figures 8.3, 8.4 and 8.6). High proportions of deputed posts are seen for health assistants
at higher level hospitals (50%) and district hospitals (27%).
Figure 8.3: Service-contract mix at higher level hospitals
100 100 100
12
100
20
80
50 52
8894
16 1
20
48
136
50
7279
0
20
40
60
80
100
%
Filled Contract HDC Deputed
Source: STS facility questionnaire

Service Tracking Survey 2011
80
Figure 8.4: Service-contract mix at district hospitals
47
95
57 6054
84
2
28
7
35
5
2
9
27
4 5
49
5 7 7 7 5
0
20
40
60
80
100
MO Staff nurse ANM HA AHW Lab. assist.
%
Filled Contract HDC Deputed
Source: STS facility questionnaire
Figure 8.5: Service-contract mix at PHCCs
87
100
74 7884
91
76
10
91314 11
54 6 2
0
20
40
60
80
100
MedicalOfficer
Staff nurse Lab. assist. AHW ANM HA
%
Filled HFMC Contract Deputed
Source: STS facility questionnaire

Service Tracking Survey 2011
81
Figure 8.6: Service-contract mix at health posts
55
8494
18
424
12 23 5
0
20
40
60
80
100
AHW ANM HA
%
Filled HFMC Contract Deputed
Source: STS facility questionnaire
Figure 8.7: Service-contract mix at SHPs
Source: STS facility questionnaire
The STS 2011 also assessed whether or not contracted posts, including HFMC/HDC and deputed posts,
were in addition to filled-sanctioned posts or had been instituted because sanctioned posts were not
filled (Table 8.10). However, it should be noted that some of the filled posts may have been deputed
out, and hence the number in post was smaller. So many staff being deputed will have significant
repercussions for the facilities from which they are deputed.

Service Tracking Survey 2011
82
Table 8.10: Service-contract mix at health facilities compared to sanctioned posts
Posts Staff in post as % of
actual sanctioned posts
(i.e. includes filled,
contract and deputed)
% in post who are:
Filled Contracted –
HFMC/HDC only
Contracted- excl.
HFMC/HDC
Deputed
1. District hospitals (n=12)
Medical officer 128.6 46.7 2.2 48.9 2.2
Staff nurse 79.2 94.7 0.0 5.3 0.0
ANM 164.3 56.5 28.3 6.5 8.7
Health assistant 107.1 60.0 6.7 6.7 26.7
AHW 170.4 54.3 34.8 6.5 4.3
Lab. asst/lab. technician 158.3 84.2 5.3 5.3 5.3
All of the above 127.4 63.6 15.3 15.3 5.7
2. PHCCs (n=28)
Medical officer 57.1 87.5 0.0 12.5 0.0
Staff nurse 42.9 100 0.0 0.0 0.0
ANM 113.9 74.4 6.7 14.4 4.4
Health assistant 64.3 77.8 5.6 11.1 5.6
AHW 110.7 83.9 9.7 4.8 1.6
Lab. assistant 82.1 91.3 8.7 0.0 0.0
All of the above 89.5 81.4 6.8 9.0 2.7
3. Health posts (n=45)
ANM 148.9 55.2 17.9 23.9 3.0
Health assistant 55.6 84.0 4.0 12.0 0.0
AHW 105.0 93.7 0.0 1.6 4.8
All of the above 103.3 75.5 8.4 12.9 3.2
4. SHPs (n=80)
AHW 103.8 90.4 1.2 6.0 2.4
MCHW 85.0 91.2 4.4 1.5 2.9
VHW 68.8 89.1 7.3 0.0 3.6
All of the above 85.8 90.3 3.9 2.9 2.9
Source: STS facility questionnaire
At the district hospitals the addition of contracted and deputed posts means that for all positions,
except for staff nurses, the number of staff in post is higher than the number sanctioned. These posts
need to be reviewed in regards to whether this is in fact over-staffing and not the most efficient use of
additional funds, or whether the number of sanctioned posts is inadequate and needs revising. At
district hospitals the posts with the smallest percentage of sanctioned posts filled were medical officers
(60%) and health assistants (64%) (Table 8.10). Additional contracted and deputed posts help to cover
unfilled sanctioned posts. For medical officers the significant number of contracted posts helps to
address this shortfall, and for health assistants deputed posts do the same. For ANMs and AHWs most
of the additional staff were in HDC appointed posts.

Service Tracking Survey 2011
83
At lower level facilities, despite additional contracted and deputed posts, there were still positions at
some levels with far fewer staff in post than the number sanctioned — namely staff nurses (43%),
medical officers (57%) and AHWs (64%) at PHCCs, ANMs at health post (56%) and VHWs at SHPs (69%)
(Table 8.10). In contrast, for some posts the addition of contracted and deputed posts has resulted in
more staff in post than the number of sanctioned posts. This includes ANMs and laboratory assistants
at PHCCs, AHWs and health assistants at health posts and AHWs at SHPs. Again these posts need to be
reviewed in regards to whether this is over-staffing or whether the number of sanctioned posts is
inadequate and needs to be revised. At SHP level there are still fewer MCHW and VHW posts than
sanctioned despite the additional contracted and deputed posts. Different patterns are seen for the
same positions at different levels of health facility: for example, at health post level there are more
AHWs and health assistants in post than the sanctioned number, but fewer ANM posts, whereas at
PHCC level there are more ANMs in post than the sanctioned number, but fewer AHWs and health
assistants.
8.2.3 Skills mix
A previous analysis of the skills mix at health facilities revealed that 4% of total health care providers
were doctors, 12% nurses (excluding ANMs), 47% paramedics, 1% public health officers and 3%
traditional health care providers (HuRIC 2008 cited in MoHP 2010). The STS 2011 also gathered data on
the skills mix at health facilities (see Tables 8.11 and 8.12). However, this data was not collected for all
positions in the health sector and hence these findings are not directly comparable to the earlier
analysis.
Table 8.11: Skills mix at district and non-district hospitals
District hospitals Higher level hospitals
% of staff in post
(filled, HFMC, contracted & deputed)
% of staff in post
(filled, HFMC, contracted & deputed)
Obstetrician-gynaecologist 0.5 1.6
Paediatrician 0.0 1.0
MDGP 0.9 1.5
Medical officer 21.1 10.9
Sister/matron 0.5 5.4
Staff nurse 17.8 53.0
ANM 21.6 14.7
Health assistant 7.0 0.2
AHW 21.6 4.6
Lab. assistant 8.9 7.0
n (total posts) 213 911
Source: STS facility questionnaire
The STS 2011 findings reveal differences between district hospitals and higher level hospitals. District
hospitals had a far higher percentages of medical officers than the higher level hospitals (21% of staff
compared to 11%) and AHWs (22% compared to 5%), but far lower percentages of staff nurses (18%
compared to 53%) (Table 8.11). At PHCC level 7% of staff were medical officers and 46% were nurses
(5% staff nurses and 41% ANMs) (Table 8.12) while AHWs comprised 28%, lab assistants 10% and

Service Tracking Survey 2011
84
health assistants 8%. At the health posts 43% of staff were ANMs, 41% AHWs and 16% health
assistants. At the SHPs 40% of staff were AHWs, 33% MCHWs and 27% VHWs.
Table 8.12: Skills mix of personnel at PHCCs, health posts and SHPs (filled, HFMC, contracted & deputed)
PHCC
(%)
HP
(%)
SHP
(%)
Medical officer 7.2
Staff nurse 5.4
Lab. assistant 10.4
AHW 28.1 40.6 40.3
ANM 40.7 43.2
Health assistant 8.1 16.1
MCHW 33.0
VHW 26.7
n (total posts) 221 155 206
Source: STS facility questionnaire. Blue (darker) shading = not applicable.
8.2.4 Training
The National Health Training Centre (NHTC) is responsible for training human resources within Nepal’s
health system. In-service training includes:
upgrading training — e.g. training for staff promotion such as training ANMs to become senior
ANMs or AHWs to become senior AHWs;
specialised training — training to enable service providers to take on additional responsibilities
such as skilled birth attendance, anaesthesia and resuscitation;
refresher training — short courses to improve job performance of health workers; and
orientation programmes — to raise awareness of health and non-health workers of the
objectives of programmes and of their roles and responsibilities.
The priority for attending training courses should go to employees who secure the highest marks for
qualification, seniority, experience of serving and work performance. Training participants are paid
their full salaries plus a training allowance. Most facilities reported that some of their staff had
received training in the previous fiscal year (Figure 8.8).

Service Tracking Survey 2011
85
Figure 8.8: Percentage of facilities where staff received training in previous fiscal year
94 93 91 91
0
20
40
60
80
100
Hospital PHCC HP SHP
%
Source: STS facility questionnaire
At the district hospitals over half of the medical officers (57%) and laboratory assistants (56%) in filled
posts had received training in the previous fiscal year, along with more than a third of other staff in
filled posts (Table 8.13). Staff in contracted/deputed posts at district hospitals were less likely to have
received training. Staff in filled posts at higher level hospitals were also less likely to have received
training in the previous fiscal year except for AHWs, of which 86% had received training. Only one
member of contracted/deputed staff at the higher level hospitals had received training.
Table 8.13: Percentage of staff trained at hospitals in previous fiscal year
District hospitals Higher level hospitals
Filled
(%)
Contracted/deputed
(%)
Filled
(%)
Contracted/deputed
(%)
Obstetrician-gynaecologist 6.7 0.0
Paediatrician 11.1 0.0
MDGP 0.0 0.0
Medical officer 57.1 20.8 100 0.0
Sister/matron 0.0 0.0
Staff nurse 47.2 50.0 15.6 0.0
ANM 34.6 15.0 6.5 4.0
Health assistant 44.4 0.0 0.0 0.0
AHW 48.0 14.3 86.4 0.0
Lab. assistant 56.3 0.0 21.4 0.0
Source: STS facility questionnaire. Blue (darker) shading = not applicable.
There was good provision of training at lower levels with 57% of medical officers and health assistants
in filled posts at PHCCs receiving training along with 76% of health assistants and 84% of ANMs at
health posts (Table 8.14). All filled positions at SHP had high percentages of staff receiving training:
73% of MCHW, 80% of VHW and 83% of AHW. Once again at the lower level facilities staff in filled

Service Tracking Survey 2011
86
posts were more likely to have been trained in the last fiscal year, although only 43% of ANMs in
contracted/deputed posts at PHCCs and 43% of the same at health posts had received training.
Table 8.14: Percentage of staff trained at PHCCs, health posts and SHPs in the last fiscal year
PHCC HP SHP
Filled
(%)
Contracted/deputed
(%)
Filled
(%)
Contracted/deputed
(%)
Filled
(%)
Contracted/deputed
(%)
Medical officer 57.1 0.0
Staff nurse 50.0
Lab. asst 33.3 0.0
AHW 38.5 0.0 49.2 0.0 82.7 50.0
ANM 37.3 39.1 83.8 43.3
Health assistant 57.1 50.0 76.2 25
MCHW 72.6 16.7
VHW 79.6 16.7
Source: STS facility questionnaire. Blue shading = not applicable.
In the previous fiscal year skilled birth attendant (SBA) training had been most common for ANMs at
health posts (27%), and staff nurses (17%) and ANMs (10%) at PHCCs (Table 8.15). Essential newborn
care (ENC) training was most common for health assistants at health posts (33%) and PHCCs (29%), and
for AHWs at SHPs (35%). Training in anaesthesia was only reported for one staff member at the STS
facilities in the last fiscal year: a hospital health assistant. Other training included on disaster
management, the birth preparedness package (BPP), intrauterine contraceptive devices (IUCDs), health
management information systems (HMIS), HIV, tuberculosis (TB), laboratory management, malaria and
student health.

Service Tracking Survey 2011
87
Table 8.15: Staff who received skilled birth attendant (SBA), essential newborn care (ENC) or
anaesthesia training in last fiscal year
SBA ENC Anaesthesia Other No. of
staff
(N)
% % % %
1. Hospitals (n=16)
Obstetrician-gynaecologist
Paediatrician
MDGP
Medical officer 3.0 3.0 24.2 33
Sister/matron 2.0 4.0 50
Staff nurse 3.8 1.5 3.0 132
ANM 0.8 1.5 3.0 133
Health assistant 10.0 10.0 20.0 10
AHW 6.4 12.8 47
Lab. assistant 1.4 9.7 72
2. PHCCs (n=28)
Medical officer 57.1 14
Staff nurse 16.7 16.7 16.7 12
Lab. assistant 33.3 21
AHW 7.7 25.0 52
ANM 10.4 4.5 10.4 67
Health assistant 28.6 28.6 14
3. Health posts (n=45)
AHW 13.6 34.7 59
ANM 27.0 18.9 37.8 37
Health assistant 33.3 42.9 21
4. SHPs (n=80)
AHW 34.7 49.3 75
MCHW
VHW
Source: STS facility questionnaire; Blue (darker) shading = not applicable.
8.2.5 Turnover
At district hospitals far more staff joined than were transferred, retired or left for other reasons (Table
8.16). In particular, there had been a notable increase in medical officers and staff nurses. Very few
staff had retired or been transferred from the higher level hospitals. However, many MDGPs, medical
officers and staff nurses had left for other reasons. It was learned that many of these had reached the
end of their contracts, and in most instances had secured new contracts in the same facility. This is
reflected in the similar numbers in the ‘joined’ column. There was also a notable increase in the
number of obstetricians at the higher level hospitals.

Service Tracking Survey 2011
88
At PHCC level it is concerning that twice as many medical officers seem to have left than joined;
although more promisingly there appears to have been an increase in the number of staff nurses. At
health posts more AHWs left than joined, but there was a big increase in the number of ANMs.
Table 8.16: Turnover of health facility staff in previous fiscal year
Number of staff who:
Joined Transferred Retired Left for other
reasons
1. Higher level hospitals (n=4)
Obstetrician-gynaecologist 10 0 0 0
Paediatrician 5 0 0 0
MDGP 11 0 0 29
Medical officer 55 0 0 57
Sister/matron 4 0 2 0
Staff nurse 135 2 0 126
ANM 0 0 0 9
Health assistant 0 0 0 0
AHW 0 0 0 0
Lab. assistant 3 0 0 0
Anaesthetist assistant 5 0 0 0
2. District hospitals (n=12)
Medical officer 10 3 0 3
Staff nurse 10 0 0 1
ANM 1 1 0 0
Health assistant 3 0 0 0
AHW 2 1 0 0
Lab. assistant 2 0 1 0
3. PHCCs (n=28)
Medical officer 5 3 3 4
Staff nurse 7 1 0 0
Lab. assistant 3 2 0 0
AHW 3 1 3 0
ANM 9 2 6 1
Health assistant 1 0 1 0
4. Health posts (n=45)
AHW 3 7 0 1
ANM 16 4 1 1
Health assistant 2 3 1 0
5. SHPs (n=80)
AHW 8 8 1 0
MCHW 0 1 0 2
VHW 2 4 5 0
Source: STS facility questionnaire

Service Tracking Survey 2011
89
8.2.6 Attendance
All types of facilities keep staff attendance records in the same way and collect information for each
employee on the number of days they are:
in attendance at the facility;
on field supervision;
on training;
on deputation;
on public holiday;
on substitute leave (health workers are entitled to receive substitute leave if they work outside
normal working hours, such as during holidays; but such leave must be taken within three
months); and
on home leave (health workers are entitled to one days home leave every 12 days. Employees
are entitled to accumulate up to 180 days of home leave. Employees entitled to winter or
summer leave are not entitled to receive home leave).
The STS 2011 consulted facility attendance records to record the number of days in the previous fiscal
year that staff at all facilities were in attendance and on the different kinds of leave. Figures 8.9 to 8.13
chart this data for each level of facility, based on mean number of days.
The percentage of time in attendance at a facility by staff was higher at hospitals and especially at the
higher level hospitals (Figure 8.10). At higher level hospitals all cadre spent at least 75% of their time in
attendance at the facility, and staff at these facilities were far less likely to be deputed than from the
other levels of facility. In contrast, at district hospitals (Figure 8.9) deputation accounted for over a fifth
of obstetricians’ (21%) and paediatricians’ time (26%). The staff at PHCCs, health posts and SHPs were
more likely to spend a greater proportion of their time on public holidays (Figures 8.11, 8.12 and 8.13).
Figure 8.9: Attendance at district hospitals of staff in last fiscal yr (based on mean no. days)
74 6959
7266
72
57
7670
1
2
5
1
1
11
1
4
3
74
3
34
2126
14
77 5
16
68
31
9
119 12
12
10 11
36
15 4 9
3 55 4 4 1 1 1
0
20
40
60
80
100
%
Attended Field Supervision Training Deputation
Public Holidays Home Leave Substitute Leave
Source: STS facility questionnaire

Service Tracking Survey 2011
90
Figure 8.10: Attendance at higher level hospitals of staff in last FY (based on mean no. days)
84 89 8576 79 75 79 80 79 78
22
2
3 43
142 1
51
2
5 1 2 1
1
5 4
6 54
84 8 10
510 12
1 5 514 8 5 3 32 2 1 3 2 3 2 2 2
0
20
40
60
80
100
%
Attended Field Supervision Training Deputation
Public Holidays Home Leave Substitute Leave
Source: STS facility questionnaire
Figure 8.11: Attendance at PHCCs of staff in last fiscal year (based on mean no. days)
56 6066
5662
53
67
1 11
68
96
105
2
615
13 7 17 1219
6
12 11 1412
14 13 15
5 4 5 3 5 3 44 2 2 1 1 3 1
0
20
40
60
80
100
MedicalOfficer
Staff nurse ANM HA AHW VHW Lab. assist.
%
Attended Field Supervision Training Deputation
Public Holidays Home Leave Substitute Leave
Source: STS facility questionnaire

Service Tracking Survey 2011
91
Figure 8.12: Attendance at health posts of staff in last fiscal yr (based on mean no. days)
64
5258 54
2
32
1
7
95
1
918 14
26
15 1415
15
4 3 5 21 2
0
20
40
60
80
100
ANM HA AHW VHW
%
Attended Field Supervision Training Deputation
Public Holidays Home Leave Substitute Leave
Source: STS facility questionnaire
Figure 8.13: Attendance at SHPs staff in last fiscal year (based on mean no. days)
6660 61 62
2
2 4 2
36 4 3
9 11 13 13
17 18 14 15
3 3 2 32 2
0
20
40
60
80
100
ANM AHW MCHW VHW
%
Attended Field Supervision Training Deputation
Public Holidays Home Leave Substitute Leave
Source: STS facility questionnaire
8.2.7 Demographic characteristics of staff
One of the strategies of NHSP 2 is to increase the proportion of women and people from excluded
caste and ethnic groups in the government health care workforce. Specific strategies include the
recruitment and training of an additional ANM as a rahat (welfare worker) from Dalit or other excluded
groups at health posts in underserved areas. It is planned to recruit 1,000 ANMs as rahats over the five
years of NHSP 2 (200 per year). Furthermore, the 2009 amendment of the Health Services Act states

Service Tracking Survey 2011
92
that 45% of vacant posts should be reserved (however this is yet to be approved), with the breakdown
of these reserved posts being as follows:
33% for women
27% for Janajatis
22% for Terai/Madhesi other castes
9% for Dalits
5% for people with disabilities
4% for people from ‘backward’ areas.
The STS 2011 collected information on the sex and caste/ethnicity of all staff from the 169 facilities.
Sex
The sex of the health workforce differs by staff position. The predominantly male positions were found
to be obstetricians, gynaecologists, paediatricians, MDGPs, medical officers, health assistants, AHWs,
VHWs and laboratory technicians/assistants (see Figures 8.14 to 8.17). The positions predominantly
filled by women were the nursing positions (sisters, matrons, staff nurses and ANMs) and MCHWs. In
the lower level health facilities (PHCCs, health posts and SHPs) all nursing positions were filled by
women; however, 14% of the sister/matron level posts in hospitals were filled by men.
Figure 8.14: Breakdown of hospital staff by sex
1420 21
86100 100
9 104
8680
100
79
14
91 90 96
0
20
40
60
80
100
%
Female Male
Source: STS facility questionnaire

Service Tracking Survey 2011
93
Figure 8.15: Breakdown of PHCC staff by sex
Source: STS facility questionnaire
Figure 8.16: Breakdown of health post staff by sex
Source: STS facility questionnaire

Service Tracking Survey 2011
94
Figure 8.17: Breakdown of SHP staff by sex
Source: STS facility questionnaire
Caste and ethnicity
Ideally an analysis by caste and ethnicity should take into account what proportion these groups
comprise within the total population. However, at the time of the STS analysis the 2011 census data
was unavailable and 2001 data is no longer an accurate reference. See Annex 3.1 for the seven
categories of caste, ethnic and other population groupings used in this study. The STS 2011 data clearly
shows that the staff of the 169 health facilities are mostly people from the Brahmin, Chhetri and
Madhesi-Terai other caste groups (Figures 8.18 to 8.21). This is especially true for higher level facilities
and more senior positions. The excluded groups — Dalits, Janajatis, Muslims, were more likely to
occupy posts at lower level facilities; but even there the proportion was small.

Service Tracking Survey 2011
95
Figure 8.18: Hospital staff by caste and ethnicity
86
6067
5343
63 60 56 58 63
14
4017
28
14
51 9
19
26
179
29 810
4
6 1422
26
18
14112 2 1
181
3 1 3
0
20
40
60
80
100
%
Brahmin/Chhetri Madhesi/Terai Newar Janajati Muslim Dalit
Source: STS facility questionnaire
Figure 8.19: PHCC staff by caste and ethnicity
Source: STS facility questionnaire

Service Tracking Survey 2011
96
Figure 8.20: Health post staff by caste and ethnicity
58 5949
76
5
35
24
6
6
1
620
18
1266 75 1
0
20
40
60
80
100
ANM HA AHW VHW
%
Brahmin/Chhetri Madhesi/Terai Newar Janajati Muslim Dalit
Source: STS facility questionnaire
Figure 8.21: SHP staff by caste and ethnicity
5542
5946
1027
1426
34
3 41612
14 1913 9
9 43 62 2
0
20
40
60
80
100
ANM AHW MCHW VHW
%
Brahmin/Chhetri Madhesi/Terai Newar Janajati Muslim Dalit
Source: STS facility questionnaire
8.2.8 Link between human resources and provision of caesarean sections
Human resources have a direct impact on service provision. This section looks at the availability of
caesarean sections, the carrying out of which requires anaesthesia and obstetric skills. (Note that in
Nepal obstetricians, MDGPs and medical officers with advanced skilled birth attendant training are
trained to conduct caesarean sections) (Table 8.17).
Less than half (44%) of the 16 hospitals were able to provide caesarean section as they had at least one
anaesthetist or anaesthetist assistant (AA) and at least one obstetrician/gynaecologist (O/G) or at least
one MDGP. Thirteen percent of hospitals had staff with obstetric skills, but were unable to provide
caesarean sections due to the lack of anaesthesia skills and a further 44% of hospitals lacked both an

Service Tracking Survey 2011
97
obstetrician and an anaesthetist. This highlights the implications of inadequate staffing for service
provision and the urgent need to ensure that the right skill mix is in place in hospitals to provide
comprehensive emergency obstetric and neonatal care (CEONC) services. As already mentioned, O/Gs,
paediatricians and anaesthetist posts are not sanctioned at district level hospitals below category D
and this is a barrier to achieving the NHSP 2 logframe target of having at least one CEONC facility per
district.
Table 8.17: Hospital staff trained in anaesthesia and obstetrics in post, and provision of caesarean
sections
Hospital name District At least 1
AA/
anaesthetis
t
At least 1
obstetrician
At least 1
MDGP
Provision of caesarean
sections
BP Koirala Institute Sunsari Yes Yes Yes Yes
Bheri Zonal Hospital Banke Yes Yes No Yes
Seti Zonal Hospital Kailali Yes Yes No Yes
Hetauda Hospital Makawanpur Yes Yes Yes Yes
District Hospital Syangja Yes No Yes Yes
Solu Hospital (Paphlu) Solukhumbu Yes No Yes Yes
District Hospital Panchthar Yes Yes No Yes
District Hospital (Gothalapani)
Baitadi No Yes No No
Prithvi Bir Hospital Kapilbastu No Yes Yes No
Jaleshwor Hospital Mahottari No No No No
Tikapur Hospital Kailali No No No No
District Hospital Jajarkot No No No No
Shivaraj Hospital Kapilbastu No No No No
District Hospital Mugu No No No No
District Hospital Sindhupalchowk
No No No No
Inaruwa Hospital Sunsari No No No No
Total hospitals (n) 43.8% 56.3% 43.8%
Source: STS facility questionnaire
8.3 KEY FINDINGS
Sanctioned/filled posts
The official number of sanctioned posts did not always match the actual number. Four key
reasons were identified for this: some facilities were in the process of being upgraded but the
number of sanctioned posts had not yet changed to reflect the new status; some staff had
been promoted into positions not officially sanctioned by that facility but had remained at the
facility; some positions had become defunct but staff could and were remaining in post until
they chose to leave; and some differences reflected the different needs between topographical
zones.

Service Tracking Survey 2011
98
All higher level hospitals had at least the number of officially sanctioned posts, except for
laboratory assistants. However, there were no cadre for which all higher level hospitals had at
least this number in filled posts. This was largely due to Hetauda hospital only being upgraded
to a regional level hospital recently and many of the posts at this new level having yet to be
filled.
All district hospitals had at least the number of officially sanctioned posts, except staff nurses,
AHWs and laboratory assistants. This resulted in just 8% of district hospitals having at least the
number of posts sanctioned as per the DoHS operating manual. All 12 district hospitals had at
least two ANMs, but only half had at least the required number of laboratory assistants and
staff nurses in filled posts. Overall 81% of the sanctioned posts at district hospitals were filled.
Most ANM and AHW posts were filled, along with three-quarters of staff nurse posts. Of
greater concern is that less than two-thirds of medical officer and health assistant posts were
filled.
All PHCCs had at least the official number of sanctioned posts for medical officers, health
assistant/SAHWs, staff nurses, laboratory assistant and AHWs; however, not all had for ANMs.
Just 7% of PHCCs had at least one medical officer, one health assistant, one staff nurse, two
AHWs, three ANMs and one laboratory assistant in filled posts. However, only 73% of the
sanctioned posts at PHCCs were filled. Most AHW and ANM posts and three-quarters of
laboratory assistants were filled. The relatively low number of staff nurse (43%), medical
officer (50%) and health assistant (50%) posts filled is a concern.
All health posts had at least the official number of sanctioned posts for health assistants and
ANMs (except there are no sanctioned ANM posts at health posts in Karnali districts). Most
health posts had at least the officially sanctioned number of AHWs and ANMs in a filled post.
However, only two-thirds of category A health posts had at least one health assistant in a filled
post, and filling these posts in the hill and mountain districts appears to be even more
problematic, with just one-third of category B health posts having at least one health assistant.
This resulted in just over half of category A health posts (53%) and only one-fifth of category B
health posts (20%) having at least the number of officially sanctioned positions in filled posts.
Overall, 80% of the sanctioned posts at health posts were filled. Most AHW and ANM posts
were filled, but only 47% of sanctioned health assistant posts were filled.
All the SHPs had at least the number of official sanctioned posts. Most had at least one AHW
and one MCHW in filled-sanctioned posts. However, less than two-thirds had at least one VHW
in a filled-sanctioned position, this resulted in only half of the SHPs having one AHW, one
MCHW and one VHW in filled posts. Overall just over three quarters of the sanctioned posts at
SHPs were filled. Most AHW, but only 78% of MCHW and 61% of VHW posts were filled.
For district hospitals, PHCCs, health posts and SHPs combined most sanctioned ANM, AHW,
and MCHW posts were filled. The biggest gaps were for medical officer, health assistant and
staff nurse posts.
Staff at most facilities (87%) felt that the number of sanctioned staff was inadequate. Nearly
two-thirds of those who felt sanctioned posts were inadequate reported that this was the case
for maternity services.

Service Tracking Survey 2011
99
Service contracts
The highest proportion of contracted staff (excluding HDC/HFMC-appointed) was for medical
officers at hospitals and staff nurses at higher level hospitals. HFMCs/HDCs were responsible for
recruiting relatively high proportions of ANMs at higher level hospitals; AHWs (35%) and ANMs
(28%) at district hospitals, and AHWs (48%) and AHWs (18%) at health posts. There were high
proportions of deputed posts for medical officers at hospitals and staff nurses at the higher
level hospitals.
Training
Most facilities reported that some of their staff had received training in the last fiscal year.
Training was most common for health posts ANMs, and staff nurses and ANMs at PHCCs.
Essential newborn care training was most common for health assistants at health posts and
PHCCs, and AHWs at SHPs. In the last fiscal year only one staff member at the 169 facilities was
reportedly trained on anaesthesia: one hospital health assistant.
Attendance
The percentage of time spent in attendance at a facility by staff was higher at hospitals,
especially at the higher level hospitals. These hospitals cadre had spent at least 75% of their
time in attendance were far less likely to have been deputed than from the other levels of
facility. In contrast, at district hospitals deputation accounted for over a fifth of obstetricians’
and paediatricians’ time. Staff at PHCC level and below spent a greater proportion of time on
public holiday.
Demographic characteristics of staff
The sex of health providers is closely related to the type of staff position. The predominantly
male positions were obstetricians-gynaecologists, paediatricians, MDGPs, medical officers,
health assistants, AHWs, VHWs and laboratory technicians/assistants. The predominantly
female positions were the nursing positions (sisters, matrons, staff nurses and ANMs) and
MCHWs. At the lower level all nursing positions were filled by women although 14% of
sister/matron posts in hospitals were filled by men. The positions in the health facilities were
dominated by Brahmins, Chhetris and Madhesi-Terai other castes. This was especially true for
higher level facilities and more senior positions. The excluded caste and ethnic groups (Dalit,
Janajati and Muslims) were more likely to be in post at lower level facilities, but even then the
proportion was small.
Link between human resources and service provision
Human resources have a direct effect on the provision of health services. This chapter has
highlighted this in regards to the provision of caesarean sections, with the lack of provision
being linked to the shortage of formal anaesthesia skills and the lack of O/Gs, MDGPs and
medical officers with advanced skilled birth attendant training. Over half of the hospitals (56%)
were unable to provide caesarean sections: 13% had an O/G but no anaesthetist and 44% had
neither an O/G nor an anaesthetist assistant.

Service Tracking Survey 2011
100
9 DRUG SUPPLY AND STORAGE
9.1 INTRODUCTION
The supply and storage of drugs is a core part of any health system, and monitoring this is central to
the implementation of NHSP 2. In Nepal the distribution of drugs is complicated by the limited road
network while the storage of drugs is hampered by a lack of adequate storage facilities and continuous
access to power. The supply and storage of drugs can be a major barrier to the provision of health
services in the country.
The Interim Constitution of Nepal (2007) introduced the right for every citizen to have access to basic
health care free of cost. On 8 October 2007 the government subsequently decided on a free essential
health care service for all citizens at primary health care centre (PHCC), health post, and sub-health
post (SHP) levels. The Ministry of Health and Population (MoHP) implemented this decision from 15
January 2008. The free services include registration, essential health services and essential drugs. This
policy stipulates that essential drugs should be provided free of charge at health facilities, with 40
essential drugs provided at hospital level, 35 essential drugs at PHCCs and health posts, and 25
essential drugs at SHPs (see Annex 4.1 for list).
9.2 RESULTS
Box 9.1: Key STS indicators for drug supply and storage
Indicators 2011
results (%)
95% CI
% of facilities with drugs stored in a cool and dry place 86.8 64.0-96.1
% of facilities with drugs stored as per first expired, first out (FEFO) principles 87.9 76.5-94.2
% of PHCCs with at least one fridge with guaranteed power 24/7 47.6 24.3-72.0
% of outpatients who paid for essential drugs 40.6 24.0-59.7
% of maternity clients who paid for any drugs 55.0 25.9-81.0
9.2.1 Procurement
Drugs for health facilities are procured either centrally or locally. Centrally they are procured through
the Logistic Management Division (LMD) of MoHP and then distributed to district (public) health offices
(D(P)HOs). It should be noted that local procurement includes drugs procured at the district level using
funds provided from the central level.
The Service Tracking Survey 2011 (STS 2011) found that all essential drugs on the list are procured both
centrally and locally (see Annex 9.1). However, most essential drugs procured for hospitals came from
central sources (e.g. 56% of hospitals sourced albendazole from central sources compared to 39% of
PHCCs), while below hospital level a higher percentage of essential drugs are procured locally (e.g. 57%
of PHCCs sourced albendazole locally compared to 19% of hospitals). At hospital level the essential
drugs with the highest percentage procured centrally were albendazole, oral rehydration solutions
(ORS) and clove oil (56%).

Service Tracking Survey 2011
101
9.2.2 Storage
The storage of drugs is a major concern in health facilities, and not just for those drugs that require
refrigeration. Most drugs that do not require refrigeration need to be stored at ‘room temperature’. In
addition to ensuring drugs are stored at the right temperature, they should not be exposed to direct
sunlight, dampness or water. Furthermore, drugs should be stored in locked cabinets and not just
placed on the floor or in unlocked cabinets.
Storage facilities
The STS 2011 found that 19% of hopitals, 46% of PHCCs, 42% of HPs and 66% of SHPs stored at least
some of their drugs in locked cabinets, with many storing them on shelves, in unlocked cabinets or on
raised platforms (Figure 9.1 and Table 9.1). Hospitals were also the least likely to store drugs in locked
cabinets, with just one fifth doing so compared to two-thirds of SHPs. Nearly one fifth of hospitals
(19%) stored some drugs directly on the floor. However, the STS 2011 questionnaire did not capture
whether drugs were kept in separate locked rooms, which may explain why so few hospitals stored
drugs in locked cabinets, as they may be less likely to do so if stored within locked rooms. None of the
facilities stored drugs in a place exposed to direct sunlight and just two SHPs stored them in contact
with dampness or water. Most facilities stored their drugs in cool and dry locations (87%), with all
hospitals doing so.
Table 9.1: Storage of drugs that do not require refrigeration
Hospital
(%)
PHCC
(%)
HP
(%)
SHP
(%)
1. Storage places:
On shelves 87.5 67.9 62.2 33.8
In a locked cabinet 18.8 46.4 42.2 66.3
In an unlocked cabinet 43.8 39.3 35.6 32.5
On a raised platform 37.5 25.0 24.4 23.8
Directly on the floor 18.8 0.0 6.7 1.3
2. Storage conditions:
Stored in cool place 100 96.4 97.8 90.0
Stored in dry place 100 89.3 95.6 93.8
Exposed to damp/water 0.0 0.0 0.0 2.5
Exposed to direct sunlight 0.0 0.0 0.0 0.0
n (total facilities) 16 28 45 80
Source: STS facility questionnaire

Service Tracking Survey 2011
102
Figure 9.1: Storage of drugs that do not require refrigeration
Source: STS facility questionnaire
Refrigeration
Some drugs need to be stored in refrigerators, including oxytocin, which is an essential drug for all
levels of health facility (Annex 4.1). To ensure the required temperature for cold-chain drugs is
maintained, at least one refrigerator at each health facility should have a constant power supply.
According to the caseload, the number of refrigerators required in facilities varies, but a second one is
always beneficial given the risk of one breaking down. As a minimum, every health facility should have
access to at least one refrigerator with a continuous 24 hour power supply. Health facilities that do not
have access to continuous power supplies for their refrigerators should use ice boxes to keep drugs at
the correct temperature.
Most of the hospitals were found to have at least two refrigerators (88%), with nearly three-quarters
having access to at least one with a power supply 24 hours a day (Table 9.2 and Figure 9.2). However,
that still means that one hospital had no refrigerator, and three had to rely on iceboxes when their
power supply cut off. Given the large volume of drugs stored at this level the lack of refrigeration could
have serious implications.

Service Tracking Survey 2011
103
Figure 9.2: Access to refrigeration for drug storage
Source: STS facility questionnaire
Table 9.2: Access to refrigeration for drug storage
Hospital
(%)
PHCC
(%)
HP
(%)
SHP
(%)
1. Availability of refrigerator:
Not available 6.3 25.0 53.3 78.8
1 6.3 25.0 40.0 18.8
2 31.3 28.6 4.4 2.5
3 18.8 14.3 2.2 0.0
4+ 37.5 7.1 0.0 0.0
2. Had at least one fridge with guaranteed power 24/7 75.0 35.7 17.8 10.0
n (total facilities) 16 28 45 80
3. Method of cooling if no power 24/7:
Icebox 100 81.8 76.9 66.7
Nothing 0.0 18.2 23.1 33.3
n (total facilities) 3 11 13 9
Source: STS facility questionnaire
As expected, access to refrigeration decreased by level of facility with three-quarters of PHCCs (75%),
just under half of health posts (47%), and less than a quarter of SHPs (21%) having access (Table 9.2
and Figure 9.2). Most health posts and SHPs with a refrigerator only had one refrigerator, whereas 50%
of PHCCs had access to two or more refrigerators. Only 36% of PHCCs, 18% of health posts and 10% of
SHPs had refrigerators that were powered 24 hours a day. Furthermore, for those that did not, not all
were using ice boxes when the power was off.
Expired drugs
Storing drugs in order of their expiry date is essential to help monitor expired drugs and to reduce
wastage. The STS 2011 assessed whether facilities were placing drugs as per the ‘first expired, first out’

Service Tracking Survey 2011
104
(FEFO) method. The study found that most of the facilities (87%) practiced this with no significant
difference between level of facility (Figure 9.3). However, it is of quite serious concern that some of the
facilities, including nearly one-fifth of the hospitals (19%), were not using the FEFO approach. Given the
larger volume of drugs stored at hospitals the implications on the timely use of drugs are much greater.
As well as storing drugs by expiry date, it is also important to dispose of expired drugs and to replace
them on time, since storing expired drugs increases the risk of them being given to clients. The STS
2011 monitored the presence of expired drugs at the time of its visits. Note that the absence of expired
drug does not necessarily mean the presence of non-expired drugs.
The data presented in Annex 9.2 shows the presence of expired essential drugs in surveyed health
facilities. ‘No expired drugs’ were observed for only six essential drugs (ciprofloxacin, benzoic acid +
salicylic acid, sodium chloride, phenobarbitone, alprazolam, dextrose solution). The drugs most
commonly stored past their expiry dates were amoxyciline, sulfamethoxazole and trimethoprim,
oxytocin, magnesium sulphate, frusemide and atropine, with amoxyciline being found stored past its
expiry date across all levels of facility.
Figure 9.3: Percentage of facilities with drugs stored using FEFO principles
Source: STS facility questionnaire
Overall, the hospitals were less likely to store expired drugs than the lower level facilities (probably due
to their more frequent usage), although 13% of hospitals were found to be storing out-of-date
chloramphenicol, and 6% storing expired amoxyciline, gentamycin, metronidazole, clove oil and
aspirin. The problem was far more widespread at PHCCs, health posts and SHPs. Nearly one-fifth (18%)
of PHCCs were found to have expired magnesium sulphate, frusemide and atropine, and 14% had
expired amoxyciline. Expired sulfamethoxazole and trimethoprim were found at 16% of health posts
and 18% of SHPs. Other drugs commonly stored past their expiry date were amoxyciline (13%) and
frusemide (11%) at health post level, and oxytocin (15%) at SHP level.

Service Tracking Survey 2011
105
9.2.3 Availability
All essential drugs should always be in stock in an adequate quantity. However, although the
government has listed which drugs come under the free care policy by level of facility (see Annex 4.1),
there are currently no guidelines on what quantity of each drug is adequate for each level of facility to
maintain at any time. The standard practice is therefore to supply an amount based on the past
consumption rates of each facility. This is in effect a ‘push’ system (i.e. from central level to
district/facility level). In some parts of Nepal (such as remote or mountainous areas) the use of the
‘push system’ is beneficial. However, there is room for more flexibility where infrastructure is better
and a combination of a ‘push’ and ‘pull’ system (i.e. from peripheral institution to district store) of drug
supply, may be preferred by facility staff. The Logistics Management Information System (LMIS)
database has potential for improving the stock-out situation; but it is currently not being used to its full
potential. Stock-outs of free essential drugs occur.
Strategies — When drugs are out of stock the most common strategy at all levels of health facility was
to advise clients to purchase them themselves (Table 9.3 and Figure 9.4). The second most common
strategy at all levels of health facility was to request additional drugs from the D(P)HO. This strategy
was more common at PHCCs and below than for hospitals. It is more concerning that the third most
common strategy — more common at PHCCs, health posts and SHPs, was just to tell clients that the
facility did not have the required drugs. The hospitals were the most likely to substitute similar
alternative drugs.
Reviews — In Nepal, all health facilities should regularly review their drug supplies. However, STS 2011
found that only 69% of hospitals, 57% of PHCCs, 42% of health posts and 40% of SHPs had undertaken
such a review in the previous fiscal year. The higher the level of facility the more likely the facility was
to have undertaken a review.
Table 9.3: Facility responses to stock-outs of essential drugs
Hospital
(%)
PHCC
(%)
HP
(%)
SHP
(%)
Advised clients to purchase drugs themselves 62.5 60.7 60.0 51.3
Requested additional drugs from D(P)HO 31.3 57.1 40.0 47.5
Said didn’t have the drug 12.5 35.7 37.8 31.3
Substituted similar drugs 18.8 17.9 8.9 13.8
Bought from local fund and distributed 18.8 21.4 13.3 10.0
Provided only part of full course of prescribed drugs (if some available)
0.0 7.1 6.7 8.8
Didn’t know 6.3 3.6 6.7 3.8
n (total facilities) 16 28 45 80
Source: STS facility questionnaire

Service Tracking Survey 2011
106
Figure 9.4: Facility responses to stock-outs of essential drugs
Source: STS facility questionnaire
Community drug schemes — The constant availability of essential drugs throughout the year in health
facilities has been one of the major challenges for the efficient management of primary health care
delivery in Nepal. To improve drug availability in its health facilities the Government of Nepal launched
the Community Drug Programme (CDP) in 1995. This programme aims to improve the year-round
availability of drugs at service delivery points by communities co-managing health facilities, thereby
making health facilities more self-reliant and supplementing government funding. As mentioned
above, essential drugs should be provided free of charge under the free care policy. However, essential
drugs do not meet all demands, and local communities are still encouraged to develop community
drug schemes to purchase drugs not covered by the free care policy. However, most of the 169 health
facilities had no such scheme (96%). Nearly one-fifth of hospitals (19%) were involved in such a
scheme, but it was very uncommon at lower levels with just 4% of PHCCs and health posts, and no
SHPs having community schemes for drugs not covered under the free care policy. The higher
percentage of hospitals with a community drug scheme may reflect the fact that there is a greater
need at hospital level given that they offer a wider range of services and hence are more likely to
prescribe drugs not covered by the free care policy.
9.2.4 Payment by clients
Clients who had been given any drugs or drug prescriptions were asked whether they had purchased
the drugs or had received them free of charge. Figures 9.5 and 9.6 chart the results.
Paid for drugs — Maternity clients were more likely to have paid for drugs than outpatients at
both the hospitals and PHCCs. The difference between the two types of clients was greatest at
PHCCs with 46% of maternity clients paying for drugs compared to only 26% of outpatients.
(Note that results for maternity clients are not given below the PHCC level due to the small
sample sizes). Outpatient and maternity clients at hospitals were more likely to have paid for
drugs than those at lower level facilities: 53% of outpatients at hospitals had paid compared to
26% at PHCCs, 13% at health posts and 9% at SHPs. At the health posts and SHPs there was little

Service Tracking Survey 2011
107
difference between the percentage of outpatients who had paid for essential and non-essential
drugs.
Received free of charge — Despite the relatively high proportion of clients paying for some
drugs, many clients had received drugs free of charge. The outpatients were more likely to have
received free drugs than maternity clients at the PHCCs: 95% compared to 54%. However, the
opposite was true at hospital level with 52% of outpatients compared to 66% of maternity
clients receiving free drugs, although the difference is less stark. Most outpatients had received
at least one essential drug free of charge at PHCC level. Importantly the proportion who had
received free essential drugs was far higher at all levels than those who had paid for them.
Figure 9.5: Percentage of outpatients paying for drugs and receiving drugs for free
Source: STS outpatient exit interviews

Service Tracking Survey 2011
108
Figure 9.6: Percentage of maternity clients paying for drugs and receiving drugs for free
Source: STS maternity exit interviews
Amounts paid — The clients who had paid for drugs were asked how much they had spent in total on
drugs. (The results for health posts and SHPs and maternity clients at PHCCs are not shown here as the
sample sizes were small.) The maternity clients had paid more for drugs than outpatients at hospital
level: with maternity clients (who paid for drugs) paying an average of NPR 1,892, while outpatients
(who paid for drugs) had paid an average of NPR 250 (Table 9.4).
Table 9.4: Mean drug expenditure by maternity clients and outpatients (who paid) (NPR)
Hospitals PHCCs
Maternity
clients
Outpatients Outpatients
Mean NPR 1,892 NPR 250 NPR 103
Standard deviation NPR 3,158 NPR 236 NPR 101
n (total clients) 61 73 18
Source: STS maternity and outpatient exit interviews
9.3 KEY FINDINGS
Procurement
All essential drugs in the official list are procured from both central and local sources. However,
most of the essential drugs available at hospitals are procured from central sources, while
below hospital level a higher percentage of essential drugs come from local sources.
Storage
Hospitals were the least likely to store at least some of their drugs in a locked cabinet (19%).
However, most facilities did store their drugs in cool and dry locations (87%).
Most of the hospitals had access to at least two refrigerators (88%), and nearly three-quarters
had access to at least one refrigerator 24 hours a day. However, a quarter of PHCCs (25%), over

Service Tracking Survey 2011
109
a half of health posts (53%) and over three-quarters of SHPs (79%) had no access to a
refrigerator. While 50% of PHCCs had access to two or more refrigerators, over a third of PHCCs
(36%), 18% of health posts and 10% of SHPs had access to a refrigerator 24 hours a day. Not all
of those facilities without constant access to a working refrigerator used ice boxes in the
absence of a power supply.
Many of the health facilities (88%) stored drugs ordered by expiry date. However, nearly one-
fifth of hospitals (19%) did not. There were only six essential drugs for which no expired drugs
were observed. The hospitals were less likely to store expired drugs than lower level facilities.
Nearly one fifth (18%) of PHCCs were found to have expired magnesium sulphate, frusemide
and atropine. Other commonly expired drugs were amoxyciline, sulfamethoxazole and
timethoprim and oxytocin.
Availability
The data show that the most common strategy used at all levels when drug stock-outs occurred
was to advise clients to purchase the drugs privately, with more than half of facilities resorting
to this (56%). The second most common strategy was to request emergency supplies of the
affected drugs —more common at below hospital level facilities. The third most common
strategy was just to tell clients the facility did not have the drugs with this being reported by
nearly a third of facilities (32%).
Hospitals (69%), PHCCs (57%), health posts (42%), and SHPs (40%) had undertaken a review of
their drugs in the previous fiscal year.
Very few of the health facilities had community drug schemes for drugs not included under the
free care policy. Only about one-fifth of hospitals (19%) and just 4% of PHCCs and health posts,
and no SHPs had such a scheme.
Payment
The proportion of clients who received free essential drugs was far higher in all types of health
facility than those who had paid for them and clients were more likely to have paid for ‘non-
essential’ than ‘essential’ drugs. However, a significant proportion of outpatient clients had paid
for essential drugs, which should be free of charge. The maternity clients were more likely to
have paid for drugs than outpatients at both hospitals and PHCCs; with a greater difference at
PHCCs. Both outpatient and maternity clients at hospitals were more likely to have paid for
drugs than those at lower level facilities. At hospitals, of those who paid for drugs, maternity
clients paid an average of NPR 1,892, while outpatients paid an average of NPR 250.

Service Tracking Survey 2011
110
10 QUALITY OF CARE
10.1 INTRODUCTION
Increasing the utilisation of health services may not improve health outcomes unless the services are
also characterised by excellence in delivery along with benchmarks for good quality. Quality of care can
result in the greater use of health facilities, better uptake of health programmes by individuals and
communities, and lead to better health outcomes for the population. Despite assertions about the
importance of quality, it remains one of the largest challenges for health policy makers (WHO 2006).
With an evolving body of medical science and related technology, and an ever-changing evidence-base
and changes in demographics, there is a need to set standards. It is also necessary to devise evidence-
based guidelines and protocols based on these standards, which can then be monitored by gathering
good quality information on a range of health system indicators.
While the concept of quality is subjective in nature and depends on individual perceptions and
interpretations, the author Donabedian believes an assessment of quality should encompass an
analysis of factors that are structural, process-related and outcome-related (2003). His framework can
help establish the basis by which care can be made safe, effective, patient-centred, timely, efficient,
and equitable (Berwick 2002).
The Service Tracking Survey, 2011 (STS 2011) collected information on a range of quality of care
components from 169 health care facilities in Nepal. These components have been classified as inputs,
processes and outputs (see Table 10.1). Some of these components are covered elsewhere in this
report, (see Table 10.1), and the remaining components are presented in this chapter.
Table 10.1: Quality of care components covered in STS
INPUTS PROCESSES OUTPUTS
Infrastructure (Ch. 1)
Human resources (see Ch. 8)
Drugs (see Ch. 9)
Utilities
Equipment
Governance and Accountability (see Ch. 7)
Provision of services
Client experience

Service Tracking Survey 2011
111
10.2 RESULTS
Box 10.1: Key STS indicators for quality of care
Indicators 2011 results
(%)
95% CI
% of health facilities with running water and soap 88.0 78.6-93.6
% of facilities with comprehensive biomedical waste management in place (puncture proof bin for needles; bin for disposing of plastics; bin for disposing of blood/fluid stained items; pit for placenta/deep burial)
12.5
8.5-17.9
% of CEONC facilities providing all CEONC signal functions 24/7 71.4 26.4-94.6
% of district hospitals providing all CEONC signal functions 24/7 8.3 0.7-53.2
% of districts with at least one facility providing all CEONC signal functions 24/7* 38.5 21.5-58.8
% of BEONC facilities providing all BEONC signal functions 24/7 40.9 20.1-65.5
% of PHCCs that provide all BEONC signal functions* 21.1 8.1-45.7
% of health posts that are birthing centres providing deliveries 24/7* 79.2 51.6-93.1
% of safe abortion sites providing post-abortion care, and first trimester abortion 25.7 11.1-48.9
% of safe abortion sites with long acting family planning services* 91.4 77.8-97.0
% of district hospitals providing male and female permanent family planning services 33.3 9.6-70.2
% of health posts providing condoms, pills, injectables, IUCDs and implants* 13.3 5.8-27.9
% of outpatients who thought the facility was overcrowded 30.9 20.2-44.1
% of maternity clients who thought maternity department was overcrowded 23.6 13.9-37.0
% of clients (maternity and outpatients) who thought the facility was clean/very clean
45.4 35.2-56.0
% of clients (maternity and outpatients) who thought the respect for their privacy was good/very good
54.1 37.2-70.0
% of clients (maternity and outpatients) satisfied with their health care* 95.8 91.5-98.0
* NHSP 2 logframe indicators
10.2.1 Utilities
Power supplies — The availability of electricity increased with the level of facility: 49% of SHPs, 62% of
health posts, 71% of PHCCs and 94% of hospitals had an electricity supply. (The one hospital without
electricity has solar power during the daytime). Although only 38% of hospitals had electricity available
for 24 hours a day (see Figure 10.1), most had a generator (94%). However, in the mountain districts,
and during the frequent times of fuel shortage across the country, facilities may not have access to the
fuel required to run a generator.

Service Tracking Survey 2011
112
Figure 10.1: Availability of electricity at health facilities (hrs/day)
6 6
50
3829
4
57
11
38
13
36
13
51
6
34
9
0
20
40
60
80
100
No Electricity <15 hoursavailable
15-23 hours 24 hours
%
Hospital PHCC HP SHP
Source: STS facility questionnaire
Table 10.2: Sources of power by level of health facility
Hospital
(%)
PHCC
(%)
HP
(%)
SHP
(%)
1. Power supply
Electricity 93.8 71.4 62.2 48.8
Kerosene 50.0 46.4 46.7 48.8
Solar 43.8 21.4 20.0 5.0
Generator 93.8 14.3 2.2 0.0
LP-gas 0.0 7.1 6.7 12.5
Inverter 12.5 21.4 6.7 2.5
Diesel 56.3 10.7 0.0 0.0
Wind 12.5 0.0 2.2 0.0
Biogas 6.3 0.0 2.2 0.0
2. Number of hours of electricity per day
Mean 20 14 12 9
Median 21 19 14 0
Minimum 0 0 0 0
Maximum 24 24 24 24
n (total facilities) 16 28 45 80
Source: STS facility questionnaire
The lack of a continuous electricity supply affects life-saving machines, storage of cold chain drugs, and
provision of an enabling working environment; but promisingly solar panels have been included in the
recently developed standard designs for key areas of hospitals (e.g. operating theatres, delivery rooms,
emergency departments). Of the alternative sources of energy, (solar power, wind power and biogas)

Service Tracking Survey 2011
113
solar power was most common, being available at 44% of hospitals, 21% of PHCCs, 20% of health posts
and 5% of SHPs. See Table 10.2 for more details.
Water supplies — Table 10.3 shows that all of the hospitals had running water with soap, along with
most PHCCs (89%) and SHPs (89%) However, it is concerning that 18% of the health posts did not. Half
of the hospitals surveyed had a piped water supply, with a quarter relying on a tank, 19% a tube well
and 6% a borehole for their water. Thirty nine percent of PHCCs, 29% of health posts and 30% of SHPs
had access to piped water, with many having a tube well or tank as their main source of water. Seven
per cent of PHCCs, 11% of HPs and SHPs reported not having any source of water.
Table 10.3: Main source of water by level of health facility
Hospital
(%)
PHCC
(%)
HP
(%)
SHP
(%)
1. Running water with soap 100 89.3 82.2 88.8
2. Main water source:
Piped 50.0 39.3 28.9 30.0
Tube well 18.8 32.1 28.9 35.0
Tank 25.0 17.9 24.4 16.3
Well 0.0 0.0 0.0 6.3
River, lake, pond 0.0 0.0 6.7 1.3
Borehole 6.3 3.6 0.0 0.0
No water source 0.0 7.1 11.1 11.3
n (total facilities) 16 28 45 80
Source: STS facility questionnaire
Patient waiting areas — Most facilities had a waiting area for their clients, including 94% of hospitals,
82% of PHCCs and 86% of health posts. Most outpatient clients (82% from hospitals, 91% from PHCCs,
88% from HPs and 73% from SHPs) and maternity clients (81% from hospitals, 80% from PHCCs, 100%
from HPs and SHPs) felt there was enough waiting space for clients (Table 10.4).
Telephone — Most hospitals (94%) had access to a telephone 24 hours a day (either a landline or a
mobile). Access to a telephone was less common for lower level facilities, with just 32% of PHCCs and
7% of health posts having 24 hour access to a telephone. Forty six percent of PHCCs, 87% of health
posts and 96% of SHPs had no access to a telephone.
Toilets — All hospitals had an available and functioning toilet, but only three-quarters of them had a
separate functioning one allocated for females only (Table 10.4). Provision of an available and
functioning toilet was less common for lower level facilities, with only 89% of PHCCs, 73% of health
posts and 61% of SHPs having one. They were less likely to have a separate toilet for females with just
54% of PHCCs, 29% of health posts and 10% of SHPs having such a functioning toilet. Most clients (89%
of maternity clients and 81% of outpatients) reported that there was a toilet available for them to use
(Table 10.4).

Service Tracking Survey 2011
114
Table 10.4: Availability of waiting area, access to phone and toilets by level of health facility
Hospital
(%)
PHCC
(%)
HP
(%)
SHP
(%)
1. Waiting space for clients 93.8 82.1 86.7 63.8
2. Phone
Available 24/7 93.8 32.1 6.7 0.0
Available, but not 24/7 6.3 21.4 6.7 3.8
Not available 0.0 46.4 86.7 96.3
3. Toilet facilities
Functional 100 89.3 73.3 61.3
Available but not functional 0.0 0.0 4.4 3.8
Not available 0.0 10.7 22.2 35.0
4. Separate toilet for women
Functional 75.0 53.6 28.9 10.0
Available but not functional 6.3 3.6 2.2 5.0
Not available 18.8 32.1 46.7 50.0
n (total facilities) 16 28 45 80
Source: STS facility questionnaire
Drinking water — Table 10.5 shows that all of the maternity clients in HPs and SHPs and nearly three
quarters of the clients at hospitals (73%) and PHCCs (73%) reported that drinking water was available
for them at the health facility. For outpatient clients 64% reported the availability of drinking water
(53% at hospitals, 72% at PHCCs, 75% at HPs and 67% at SHPs).
Overcrowding — Nearly half of outpatients (44%) considered the facility to be overcrowded and just
under a quarter of maternity clients (23%) considered the maternity ward to be overcrowded (Table
10.5).

Service Tracking Survey 2011
115
Table 10.5: Client perceptions of factors related to comfort in health facilities
Hospital
(%)
PHCC
(%)
HP
(%)
SHP
(%)
Total
(%)
1. Maternity
Maternity dept/unit was overcrowded 23.4 27.3 0.0 23.3
Drinking water available 73.2 72.7 100.0 0.0 73.1
Toilet available 86.4 100.0 100.0 0.0 87.1
Enough waiting space for clients 76.6 90.9 100.0 0.0 77.5
Enough waiting space for companions 68.2 90.9 0.0 0.0 68.9
n (total clients) 179 15 2 1 197
2. Outpatients
Facility was overcrowded 65.2 37.8 24.8 22.7 44.5
Drinking water available 53.0 72.2 75.2 67.4 64.2
Toilet available 86.1 83.3 71.5 60.3 79.1
Enough waiting space for clients 81.0 92.2 84.8 73.8 83.8
Enough waiting space for companions 74.1 78.9 82.4 67.7 75.8
n (total clients) 328 244 121 127 820
Source: STS maternity and outpatient exit interviews
10.2.2 Patient beds
The STS 2011 collected information on the number of inpatient, maternity and emergency beds, and
whether the beds were functional or not. At hospital level most allocated beds were functional with no
non-functional maternity or emergency beds and just 13% of hospitals having some non-functional
inpatient beds (Table 10.6). Most of the hospitals (88%) had at least 11 functional inpatient beds, and a
quarter (25%) had 11 or more functional maternity beds. Less than half of the hospitals had at least six
functional maternity beds (44%) or at least six functional emergency beds. Most concerning was that
13% of hospitals had no maternity beds and 6% had no emergency beds.
Table 10.6: Percentage of hospitals with available and functional beds (N=16)
Number of beds
Inpatients Maternity Emergency
Allocated
(%)
Functional
(%)
Allocated
(%)
Functional
(%)
Allocated
(%)
Functional
(%)
0 0.0 0.0 12.5 12.5 6.3 6.3
1-5 0.0 0.0 43.8 43.8 50.0 50.0
6-10 0.0 12.5 18.8 18.8 31.3 31.3
11-25 75.0 62.5 12.5 12.5 6.3 6.3
26 and above 25.0 25.5 12.5 12.5 6.3 6.3
n (total facilities) 16 16 16 16 16 16
Source: STS facility questionnaire

Service Tracking Survey 2011
116
At the lower level health facilities, again most available beds were functional for inpatient, maternity or
emergency use. However, half of the PHCCs (50%) had no inpatient beds available, 18% had no
maternity beds and 64% no emergency beds (Table 10.7).
Table 10.7: Percentage of PHCCs, health posts and SHPs with available and functional beds
Number of beds
PHCC HP SHP
Allocated
(%)
Functional
(%)
Allocated
(%)
Functional
(%)
Allocated
(%)
Functional
(%)
Inpatient
0 50.0 50.0 84.4 84.4 98.8 98.8
1-3 35.7 35.7 15.6 15.6 1.3 1.3
4-8 14.3 14.3
Maternity 0 14.3 17.9 44.4 44.4 80.0 81.3
1-5 85.7 82.1 55.6 55.6 20.0 18.8
Emergency 0 64.3 64.3 86.7 86.7 93.8 93.8
1-5 35.7 35.7 13.3 13.3 6.3 6.3
n (total facilities) 28 45 80
Source: STS facility questionnaire
10.2.3 Biomedical waste management
Since biomedical waste is hazardous both for the environment and public health, proper management
is critical. Burning was the most common method for the disposal of biomedical waste for all facility
types (84%), followed by burial in a pit (78%). The use of an incinerator was less common and reduced
by level of facility: hospital (50%), PHCC (25%), health post (13%) and SHP (6%) (Figure 10.2). If used
incorrectly, incinerators can be more hazardous than other methods because of the dioxins produced,
but this study did not assess how incinerators were used. Only a few facilities had their waste collected
and transferred to a waste management site, with the incidence decreasing by level of facility.
Figure 10.2: Biomedical waste management
Source: STS facility questionnaire

Service Tracking Survey 2011
117
Enumerators observed whether puncture-proof bins, for disposal of needles and sharps, were present
in facilities (Table 10.8). While all of the Hospitals and PHCC had puncture proof bin for disposing of
needles and sharps, the likelihood decreased for lower level facilities: 91% of HPs and 84% of SHPs.
Bins for disposing of plastics were available in 94% of hospitals, 71% of PHCCs, 76% of HPs and 70% of
SHPs. Bins for disposing of blood/tissue/fluid stained items were available in all hospitals with
likelihood reducing by level of facility (89% of PHCCs, 69% of HPs, and 59% of SHPs). However, this
survey did not access whether the bins were being used correctly where they were available. The
availability of a pit for deep burial of placentas was less common and the likelihood reduced by level of
facility: 94% of hospitals, 79% of PHCCs, 40% of health posts and 4% of SHPs.
Table 10.8: Availability of biomedical waste management facilities by level of health facility
Hospital
(%)
PHCC
(%)
HP
(%)
SHP
(%)
Puncture proof bin for disposing of needles/sharps 100 100 91.1 83.8
Bin for disposing of plastics 93.8 71.4 75.6 70.0
Bin for disposing of blood/ tissue/fluid-stained items 100 89.3 68.9 58.8
Placenta pit/deep burial 93.8 78.6 40.0 3.8
n (total facilities) 16 28 45 80
Source: STS facility questionnaire
10.2.4 Equipment
Annual review — The availability and functionality of health facility equipment should be monitored
regularly and the government recommends that this is done at least once a year by the D(P)HO
storekeeper. The STS found that the higher the level of facility the more likely it is to have undertaken
an equipment review, with 69% of hospitals and 57% of PHCCs, 47% of health posts (47%) and 35% of
SHPs having undertaken a review in the previous fiscal year.
Availability and functionality — The total number available, as well as the number that were
functional, of selected items of equipment in facilities were recorded and compared to a standard list
developed by the MoHP’s Logistical Management Division for equipment reviews, which includes a
recommended quantity. Considerable gaps were found between what is recommended on the LMD list
and what was available at all levels of facility. In many cases this was due to facilities not having the
recommended quantity. The quantities listed need to be reviewed as to whether they are appropriate.
The STS 2011 found that the hospitals had a good provision of many items, such as functional vacuum
extractors (100%), plastic containers for placenta disposal (94%), plastic containers for medical waste
(gauze etc.) (88%) and otoscopes (88%) (Table 10.9). However, no hospital had the required number of
delivery lights, sterile trays, steel bowls, suction pumps, uterine dilators and suction/aspirating devices.
At PHCCs there was again good provision of functional plastic containers for placenta disposal (86%),
plastic containers for medical waste (gauze etc) (82%), microscopes (89%) and syringes and disposable
needles (82%). However, no PHCCs had the minimum required number of many items, including
delivery lights, kidney basins, protective aprons, plastic draw sheets, vaginal speculums, clamps,
thermometers and IV stands.
The study found faulty equipment at all levels of facility that needed repairing or replacing. At the
hospitals this was seen in particular for sphygmomanometers (available in 31% of facilities, but only

Service Tracking Survey 2011
118
functional in 19%), centrifuges (available in 38%, functional in 25%) and microscopes (available in 69%,
functional in 50%). PHCCs were more likely to have non-functioning equipment available than
hospitals, including for delivery tables (available in 68%, functional in 46%); sphygmomanometers
(available in 54%, functional in 29%) centrifuges (available in 11%, not functional in any); steriliser
(available in 50%, functional in 39%); stethoscopes (available in 57%, functional in 43%); suction
devices (available in 86%, functional in 75%).
Table 10.9: Equipment available and functional at hospitals and PHCCs
Hospitals (N=16) PHCCs (N=28)
Instruments
No.
specified in
guidelines
%
had
% had
functional
Instruments
No.
specified in
guidelines
%
had
% had
functional
Vacuum extractor 1 100 100 Microscope 1 92.9 89.3
Plastic container with plastic liner to dispose of placentas 1 93.8 93.8
Plastic container with plastic liner to dispose the placenta 1 89.3 85.7
Plastic containers with a plastic liner for medical waste (gauze, etc.) 1 87.5 87.5
Plastic container with plastic liner for medical waste (gauze, etc.) 1 85.7 82.1
Otoscopes 1 93.8 87.5 Syringes and disposable needles 10 82.1 82.1
Examination gloves 25 81.3 81.3 Suction/aspirating device 1 85.7 75
Syringes and disposable needles 10 81.3 81.3
Newborn resuscitation set 1 71.4 67.9
Hand soap or detergent 10 75 75
ORT corner with equipment (1 lt container, cups and spoons and rehydration guidelines) 1 64.3 60.7
Haemoglobin meter 1 75 75 Examination gloves 25 57.1 57.1
Refrigerator for storing reagents 2 81.3 75 Vacuum extractor 1 64.3 57.1
Sterile towels (one to receive baby, one for active management) 2 68.8 68.8
Suction pump, hand of foot operated 1 78.6 53.6
Stethoscope (adult) 2 62.5 62.5 Children’s weighing scale 2 53.6 50
Sterilizer (autoclave) 2 62.5 56.3 Delivery table 2 67.9 46.4
Height measure scale 1 56.3 56.3
Sterile towels (one to receive the baby, one for active management) 2 46.4 46.4
Umbilical cord clamps or sterile tape or sterile ties 22 50 50 Stethoscope 4 57.1 42.9
Needle holders 5 62.5 50 Sterilizer (autoclave) 2 50 39.3
Vaginal retractors 2 50 50 Height measure scales 1 39.3 39.3
Children’s weighing scales 2 50 50 Refrigerator for storing reagents 2 46.4 39.3
Microscopes 3 68.8 50 Umbilical cord clamp or sterile tape or sterile tie 20 35.7 35.7
Newborn resuscitation 2 50 43.8 Stethoscope, adult 2 39.3 35.7

Service Tracking Survey 2011
119
Hospitals (N=16) PHCCs (N=28)
Instruments
No.
specified in
guidelines
%
had
% had
functional
Instruments
No.
specified in
guidelines
%
had
% had
functional
sets
Clean towels 5 43.8 43.8 Sphygmomanometer 4 53.6 28.6
Adult weighing scales 4 50 43.8 Scissors 5 32.1 25
Oral rehydration therapy (ORT) corner with equipment (1 lt container, cups, spoons & rehydration guidelines) 1 37.5 37.5 Oxygen cylinder 2 25 21.4
Stethoscopes (paediatric) 2 31.3 31.3 I & D set and suture set 10 21.4 21.4
Curette, uterine 5 31.3 31.3 Clean towels 5 17.9 17.9
Fetoscope 7 25 25 Hand soap or detergent 5 21.4 17.9
Newborn weighing scales 2 31.3 25 Needle holder 5 17.9 17.9
Incision and drainage (I&D) set and suture set 12 25 25 Otoscope 2 46.4 17.9
Centrifuge 2 37.5 25 Vaginal retractor 2 17.9 14.3
Aspirator/suction bulb 6 18.8 18.8 Aspirator/suction bulb 2 17.9 10.7
Scissors 13 18.8 18.8 Adult weighing scale 4 25 10.7
Sphygmomanometer 17 31.3 18.8 Stethoscope, paediatric 2 7.1 7.1
Thermometers 32 25 18.8 Newborn weighing scales 2 14.3 7.1
Oxygen cylinders 21 18.8 18.8 Curette, uterine 5 7.1 7.1
IV stand 58 18.8 18.8 Fetoscope 5 3.6 3.6
Tape measure 7 18.8 18.8 Uterine dilator 10 3.6 3.6
Delivery table 4 12.5 12.5 Tape measure 5 3.6 3.6
Guerdal airways-neonatal, child, and adult 4 18.8 12.5 Delivery light (perilight) 10
0.0 0.0
Stethoscope 42 12.5 12.5 Sterile tray 37 0.0 0.0
Kidney basin 50 6.3 6.3 Kidney basin 50 0.0 0.0
Protective apron and plastic draw sheet 22 6.3 6.3 Steel bowl 45
0.0 0.0
Speculum, vaginal 30 6.3 6.3 Protective apron and plastic draw sheet 20
0.0 0.0
Clamps (hemostats) 35 6.3 6.3 Speculum, vaginal 30 0.0 0.0
Torch/flashlight 17 6.3 6.3 Clamps (hemostats) 35 0.0 0.0
Delivery light (perilight) 11
0.0 0.0 Guerdal airways-neonatal, child and adult 4
0.0 0.0
Sterile tray 37 0.0 0.0 Thermometers 20 0.0 0.0
Steel bowl 45 0.0 0.0 IV stand 20 0.0 0.0
Suction pump, hand of foot operated 6
0.0 0.0
Torch/flashlight 11
0.0 0.0
Uterine dilator 56 0.0 0.0 Centrifuge 2 10.7 0.0
Suction/aspirating device 20 0.0 0.0 Haemoglobin meter 4 0.0 0.0
Source: STS facility questionnaire

Service Tracking Survey 2011
120
The health posts had good provision of child (78%) and adult (71%) weighing scales, scissors (71%) and
examination gloves (71%) (Table 10.10). However, there was inadequate provision of much equipment
including functional IV stands (2%), clamps (2%), oxygen cylinders (4%), protective aprons and plastic
draw sheets (4%) and stethoscopes (4%).
Again there were items of equipment that were available but not functional, such as
sphygmomanometer (available in 40%, functional in 9%), sterilisers (available in 38%, functional in
22%) and suction devices (available in 51%, functional in 36%) at health post level. At SHP level non-
functional items included sphygmomanometers (available in 24%, functional in 5%), stethoscopes
(available in 25%, functional in 11%). The presence of non-functioning sphygmomanometers is clearly a
problem at all levels (Table 10.10).
Table 10.10 Equipment available and functional at health posts and SHPs
Health posts (N=45) SHPs (N=80)
Instruments
No.
specified
in
guidelines % had
% had
functional
Instruments
No.
specified
in
guidelines
%
had
% had
functional
Children’s weighing scales 1 77.8 77.8 Adult weighing scale 1 77.5 72.5
Scissors 2 71.1 71.1 Children’s weighing scale 1 71.3 71.3
Examination gloves 5 71.1 71.1 Examination gloves 5 66.3 63.8
Adult weighing scales 1 80 71.1 Scissors 2 63.8 61.3
Plastic container with plastic liner for medical waste (gauze, etc.) 1 66.7 66.7
ORT corner with equip. (1 lt container, cups & spoons & rehydration guidelines) 1 60 58.8
Syringes and disposable needles 12 66.7 64.4
Syringes and disposable needles 12 57.5 55
ORT corner with equipment (1 lt container, cups, spoons & rehydration guidelines) 1 68.9 64.4 Fetoscope 2 52.5 50
Fetoscope 2 71.1 62.2 Clean towels 1 47.5 47.5
Otoscope 1 77.8 60
Plastic container with plastic liner for medical waste 1 46.3 46.3
Newborn resuscitation set 1 57.8 57.8 Newborn weighing scale 1 42.5 42.5
Clean towels 1 57.8 57.8 Otoscope 1 51.3 42.5
Plastic container with plastic liner to dispose the placenta 1 53.3 53.3 Hand soap or detergent 2 43.8 40
Newborn weighing scales 1 53.3 53.3 Kidney basin 2 32.5 31.3
Kidney basin 2 48.9 48.9 Sterile tray 2 23.8 23.8
Hand soap or detergent 2 48.9 46.7 Aspirator/suction bulb 1 20 20
Aspirator/suction bulb 1 44.4 42.2 Newborn resuscitation set 1 21.3 20
Umbilical cord clamp or sterile tape or sterile tie 2 35.6 35.6 Suction/aspirating device 1 21.3 16.3
Sterile tray 2 37.8 35.6
Plastic container with plastic liner to dispose placenta 1 15 15
Speculum, vaginal 2 37.8 35.6 Height measure scale 1 18.8 15

Service Tracking Survey 2011
121
Health posts (N=45) SHPs (N=80)
Instruments
No.
specified
in
guidelines % had
% had
functional
Instruments
No.
specified
in
guidelines
%
had
% had
functional
Suction/aspirating device 1 51.1 35.6 Thermometers 5 17.5 13.8
Refrigerator for storing reagents 1 51.1 33.3
Refrigerator for storing reagents 1 16.3 13.8
Suction pump, hand of foot operated 1 35.6 28.9
Umbilical cord clamp or sterile tape or sterile tie 2 12.5 12.5
Delivery light (Perilight) 1 26.7 26.7 Stethoscope 4 25 11.3
Sterile towels (one to receive the baby, one for active management) 2 26.7 26.7 I & D set and suture set 5 13.8 11.3
Height measure scales 1 33.3 26.7 Sterilizer (Autoclave) 2 15 10
Sterilizer (autoclave) 2 37.8 22.2 Delivery light (perilight) 1 10 8.8
Steel bowl 4 22.2 20 Needle holder 4 8.8 8.8
Thermometers 5 24.4 20
Sterile towels (one to receive baby, one for active management) 2 7.5 7.5
Tape measures 2 20 20 Suction pump, hand of foot operated 1 8.8 7.5
Stethoscopes 4 35.6 15.6 Delivery table 1 5 5
Needle holders 4 13.3 13.3 Guerdal airways-neonatal, child, and adult 1 5 5
Stethoscope, paediatric 1 11.1 11.1 Sphygmomanometer 4 23.8 5
I & D set and suture set 5 13.3 11.1 Stethoscope, adult 4 8.8 2.5
Delivery table 1 13.3 8.9 Stethoscope, Paediatric 1 3.8 2.5
Sphygmomanometer 4 40 8.9 Speculum, vaginal 2 3.8 2.5
Guerdal airways-neonatal, child, and adult 1 6.7 6.7 Torch/Flash light 2 3.8 2.5
Stethoscope, adult 4 8.9 4.4 Steel bowl 4 2.5 1.3
Protective apron and plastic draw sheet 4 4.4 4.4
Protective apron and plastic draw sheet 4 1.3 1.3
Oxygen cylinders 1 13.3 4.4 Oxygen cylinder 1 2.5 1.3
Torch/flashlight 2 8.9 4.4 IV stand 5 1.3 1.3
Clamps (hemostats) 4 4.4 2.2 Tape measure 2 1.3 1.3
IV stand 5 2.2 2.2 Clamps (hemostats) 8 7 1
Source: STS facility questionnaire
10.2.5 Provision of services
Delivery, BEONC and CEONC services — Less than half (44%) of the 16 hospitals visited were officially
accredited as comprehensive emergency obstetric and neonatal care (CEONC) facilities, while 56% of
hospitals and 46% of PHCCs were officially accredited as basic emergency obstetric and neonatal care
(BEONC) centres (Table 10.11). Half of PHCCs (50%), over half of health posts (53%) and 11% of SHPs
were classified as birthing centres.

Service Tracking Survey 2011
122
Table 10.11: Proportion of facilities officially accredited as CEONC, BEONC and birthing centres
Hospital
(%)
PHCC
(%)
HP
(%)
SHP
(%)
CEONC facility 43.8
BEONC facility 56.3 46.4
Birthing centre 50.0 53.3 11.3
None of these 3.6 46.7 88.8
n (total facilities) 16 28 45 80
Source: STS facility questionnaire
Most birthing centres were providing routine deliveries (98%), with over three-quarters providing this
service 24 hours a day (77%) (Table 10.12). Furthermore, 38% of the facilities not yet classified as
birthing centres were already providing routine delivery services.

Service Tracking Survey 2011
123
Table 10.12: Provision of BEONC and CEONC services by type of facility
1. CEONC
facilities
(%)
2. BEONC
facilities
(%)
3. Birthing
centres
(%)
4. None
of 1–3
(%)
5. At least one facility in
district providing service
(%)
Vaginal delivery 100 100 97.9 37.6 100
24hrs 100 95.5 76.6 15.1 100
CEONC and BEONC signal functions
1. Administer parenteral antibiotics 100 90.9 46.8 21.5 100
24hrs 100 81.8 34.0 7.5 100
2. Administer parenteral oxytocic drugs 100 86.4 70.2 23.7 100
24hrs 85.7 72.7 57.4 11.8 100
3. Administer parenteral anticonvulsants for pre-eclampsia/eclampsia
100 81.8 53.2 23.7 92.3
24hrs 85.7 81.8 42.6 12.9 92.3
4. Perform manual removal of placenta 100 95.5 61.7 20.4 100
24hrs 100 90.9 51.1 10.8 100
5. Perform removal of retained products
100 77.3 36.2 3.2 100
24hrs 100 77.3 27.7 3.2 100
6. Perform assisted vaginal delivery (vacuum or forceps)
100 72.7 27.7 6.5 100
24hrs 100 63.6 21.3 6.5 100
7. Neonatal resuscitation 100 86.4 68.1 28.0 92.3
24hrs 100 81.8 57.4 8.6 92.3
All BEONC signal functions 100 45.5 8.5 2.2 84.6
24hrs 85.7 40.9 6.4 1.1 84.6
CEONC only signal functions
8. Perform blood transfusion 71.4 9.1 46.2
24hrs 71.4 38.5
9. Perform surgery (caesarean sections) 100 53.8
24hrs 100 53.8
All CEONC signal functions 71.4 38.5
24hrs 71.4 38.5
n (total facilities) (columns 1-4)
n (total districts) (column 5)
7 22 47 93 13
Source: STS facility questionnaire
STS 2011 looked at the provision of obstetric services by whether the facility was a CEONC or BEONC
facility (Table 10.12). All the CEONC facilities were providing six of the nine CEONC signal functions on a
24 hour basis: administering parenteral antibiotics, manual removal of placenta, removal of retained
products, performing neonatal resuscitation, providing assisted vaginal delivery, and providing
caesarean sections (Figure 10.3). All of the facilities were also providing two further signal functions:
administering parenteral oxytocic drugs and parenteral anticonvulsants, but only 86% provided these

Service Tracking Survey 2011
124
services at all times. The main gap was the provision of blood transfusion services, with 29% of CEONC
facilities not providing these, and hence not truly operating as CEONC sites. CEONC facilities should be
providing all nine CEONC signal functions on a 24 hour basis; however, less than three-quarters (71%)
of CEONC facilities did so.
Figure 10.3: Availability of the 9 CEONC signal functions at CEONC facilities
100 100 100 100 100 100 100 100
71 71
86 86
0
20
40
60
80
100
%
Available
24 Hrs.
Source: STS facility questionnaire
None of the BEONC facilities were providing all seven BEONC signal functions, let alone on a 24 hour
basis (Figure 10.4). The strongest provision was for manual removal of placentas, with 91% of BEONC
facilities providing this at all times, followed by parental antibiotics and neonatal resuscitation (both
available in 82% of facilities 24 hours a day). The weakest provision was for assisted deliveries, with
less than two-thirds (64%) providing this at all times. Less than three-quarters (73%) were
administering parenteral oxytocic at all times. Less than half (46%) of BEONC facilities provided all
BEONC signal functions, while 41% did so on 24 hours a day.
Eighty five percent of the districts had at least one facility providing all BEONC signal functions,
(although in regards to BEONC facilities one would ideally hope to find more than one) (Table 10.12).
However, there was one district without even a single facility administering parenteral anticonvulsants,
and one district without provision for neonatal resuscitation. Only 31% of the 13 districts had a facility
providing all CEONC signal functions. Less than half of the districts (46%) had a facility that provides
caesarean sections or blood transfusions, with even less (39%) doing so at all times.

Service Tracking Survey 2011
125
Figure 10.4: Availability of the 7 BEONC signal functions at BEONC facilities
Source: STS facility questionnaire
This analysis also looked at the provision of obstetric services by level of facility (Table 10.13). Normal
vaginal delivery care was available on a 24 hour basis in all the hospitals, 96% of PHCCs, 89% of health
posts and 28% of SHPs. However, availability on a 24 hour basis at lower level facilities was less (86% of
PHCCs, 58% of health posts and 10% of SHPs). It is very promising that nearly 90% of health posts are
providing normal delivery care, and almost 60% provide it on a 24 hours a day.
Most BEONC signal functions were available at the hospitals on a 24 hour basis, although not all
hospitals were able to administer parenteral oxytocic drugs, parenteral anticonvulsants, remove
retained products and provide neonatal resuscitation, meaning that three-quarters of hospitals (75%)
provided all BEONC signal functions on a 24 hour basis (Table 10.13). The provision of the additional
two CEONC signal functions was even less, with less than one-third of hospitals providing blood
transfusions or caesarean sections on a 24 hour basis. Only a quarter of hospitals provided all CEONC
signal functions on a 24 hour basis. Just over one-fifth of PHCCs were providing all BEONC signal
functions (21%), and just 14% were doing so on a 24 hour basis. The BEONC services that were least
likely to be provided at PHCCs were the removal of retained products (50%) and assisted vaginal
deliveries (39%). Health posts and SHPs are not expected to provide BEONC services, but it is
encouraging to see that many were.

Service Tracking Survey 2011
126
Table 10.13: Provision of maternity services in hospitals, PHCCs, health posts and SHPs
Hospital
(%)
PHCC
(%)
HP
(%)
SHP
(%)
Normal delivery 100 96.4 88.9 27.5
24 hrs 100 85.7 57.8 10.0
CEONC and BEONC signal functions
1. Administer parenteral antibiotics 100 78.5 42.2 15
24 hrs 100 71.4 22.2 2.5
2. Administer parenteral oxytocic drugs 93.8 78.6 68.9 16.3
24 hrs 81.3 64.3 51.1 7.5
3. Administer parenteral anticonvulsants for pre-eclampsia/eclampsia 93.8 71.5 57.8 13.8
24 hrs 87.5 67.9 42.2 5.0
4. Perform manual removal of placenta 100 82.1 57.8 13.8
24 hrs 100 71.4 46.7 5.0
5. Perform removal of retained products 93.8 50 28.8 2.6
24 hrs 93.8 46.4 24.4 1.3
6. Perform assisted vaginal delivery (vacuum or forceps) 100 39.2 33.4 0.0
24 hrs 100 32.1 26.7 0.0
7. Neonatal resuscitation 93.8 82.1 62.2 22.5
24 hrs 93.8 64.3 46.7 7.5
All BEONC signal functions 81.3 21.4 8.9 0.0
24 hrs 75.0 14.3 6.7 0.0
CEONC only signal functions
8. Perform blood transfusion 43.8 7.1
24 hrs 31.3
9. Perform surgery (caesarean sections) 43.8
24 hrs 43.8
All CEONC signal functions 31.3
24 hrs 31.3
n (total facilities) 16 28 45 80
Source: STS facility questionnaire
Abortion services — All the selected hospitals and 68% of the PHCCs visited were officially classified as
safe abortion sites, which means they are certified sites with a certified provider. If the certified
provider is transferred the facility can no longer legally provide safe abortion services. Below PHCC
level medical abortions are allowed in selected health posts. Second trimester abortions are only
available at tertiary level hospitals where there are obstetrician-gynaecologists or MDGPs. Post-
abortion care was available at most safe abortion sites (80%). Two-thirds of the safe abortion sites
were providing first trimester abortion care (66%) and over a quarter (26%) second trimester abortions
(Figure 10.5).

Service Tracking Survey 2011
127
Figure 10.5: Availability of abortion services at safe abortion sites
80
66
26
0
20
40
60
80
100
Post-abortion care First trimester Second trimester
%
Source: STS facility questionnaire
Family planning — According to government guidelines short term hormonal (such as oral
contraceptive pills, and injectables) and non-hormonal family planning services (such as condoms)
should be available at all levels of health facility. PHCCs and health posts can also provide IUCD and
implant services, but these are dependent on the availability of a trained provider and supplies. Mini
laparotomy (minilap) and vasectomy services should be available at the hospital level, but again this
depends on the availability of a trained provider. There was good provision of short term hormonal and
non-hormonal family planning: all PHCCs, all health posts, 96% of SHPs and all but one hospital
provided hormonal and non-hormonal methods of family planning (Table 10.14). For long term
methods, IUCDs were more common than implants and the likelihood of the provision of each of these
decreased by level of facility. IUCDs were available at all hospitals (100%), nearly two-thirds of PHCCs
(64%), one-third of health posts (33%), and just 1% of SHPs. Permanent family planning methods were
only available at the hospitals, with over two-thirds of hospitals surveyed providing vasectomies (69%)
and half providing minilaps (50%). One PHCC reported that it provided vasectomy and minilap services
during camps, but not as a regular service.
As per government guidelines all facilities providing delivery and abortion services should provide their
clients with family planning services. Safe abortion sites should provide short and long term methods
(oral contraceptive pills, condoms, injectables, IUCDs and implants).
Of those facilities providing delivery care, 81% reported providing post-partum family planning: 88% of
hospitals, 75% of PHCCs, 77% of health posts and 100% of SHPs. The exit interviews did not capture
whether maternity clients were being provided with post-partum family planning. Eighty percent of the
safe abortion sites reported providing post-abortion family planning.

Service Tracking Survey 2011
128
Table 10.14: Availability of family planning services
Hospital
(%)
PHCC
(%)
HP
(%)
SHP
(%)
1. Availability of family planning methods:
Short term hormonal 93.8 100 100 96.3
Short term non-hormonal 93.8 100 100 97.5
IUCDs 100 64.3 33.3 1.3
Implants 93.8 35.7 15.6 0.0
IUCDs or implants 100 67.9 35.6 1.3
Vasectomies 68.8 3.6 0.0 0.0
Minilaps 50.0 3.6 0.0 0.0
n (total facilities 16 28 45 80
2. Availability of post-partum family planning: 87.5 75.0 76.9 100
n (facilities that provided delivery services) 16 24 26 8
3. Comprehensive family planning
Had short term hormonal & non-hormonal, long term, permanent, post-partum & post-abortion family planning
62.5 3.6 0.0 0.0
n (total facilities) 16 28 45 80
Source: STS facility questionnaire
Antenatal and postnatal care — The provision of antenatal and postnatal care was high for all levels of
facility, with all hospitals, PHCCs, and health posts providing both antenatal and postnatal care (Figure
10.6). There was also good provision at SHPs with 98% providing antenatal and 90% providing
postnatal care.
Ultrasound — Ultrasound services were available in 69% of the hospitals and at just one PHCC.
Child health — STS 2011 administered three questions relating to the provision of child health services
— on childhood immunisation, growth monitoring, and curative care for children under five. As would
be expected, curative care for children under five was more common at the higher level facilities: with
all hospitals, three quarters of PHCCs (75%) and health posts (76%) and half of SHPs (53%) providing
curative care (Figure 10.7). In contrast, but as expected, the hospitals were less likely to provide
childhood immunisation (94%) and growth monitoring (88%). Childhood immunisation was available at
all PHCCs and health posts and 98% of SHPs and growth monitoring at 96% of PHCCs and health posts.
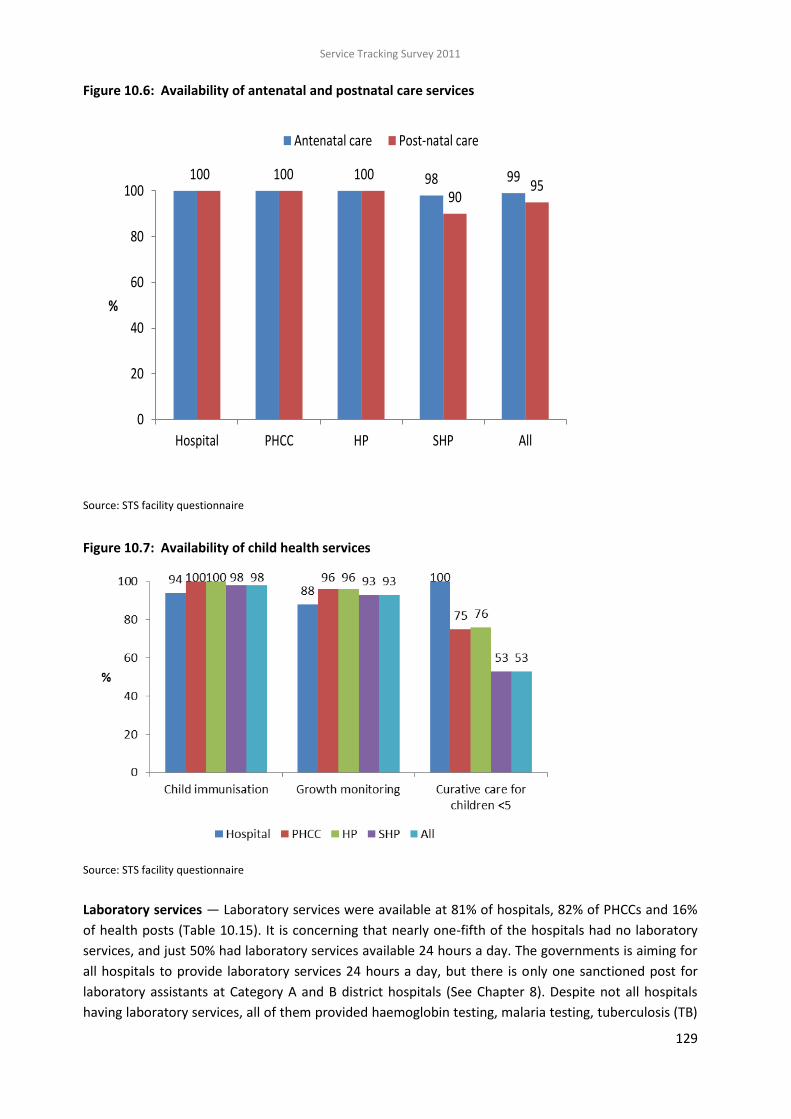
Service Tracking Survey 2011
129
Figure 10.6: Availability of antenatal and postnatal care services
100 100 100 98 99
9095
0
20
40
60
80
100
Hospital PHCC HP SHP All
%
Antenatal care Post-natal care
Source: STS facility questionnaire
Figure 10.7: Availability of child health services
Source: STS facility questionnaire
Laboratory services — Laboratory services were available at 81% of hospitals, 82% of PHCCs and 16%
of health posts (Table 10.15). It is concerning that nearly one-fifth of the hospitals had no laboratory
services, and just 50% had laboratory services available 24 hours a day. The governments is aiming for
all hospitals to provide laboratory services 24 hours a day, but there is only one sanctioned post for
laboratory assistants at Category A and B district hospitals (See Chapter 8). Despite not all hospitals
having laboratory services, all of them provided haemoglobin testing, malaria testing, tuberculosis (TB)

Service Tracking Survey 2011
130
testing and directly observed treatment short course (DOTS), and all but one had diagnosis and
treatment of reproductive tract infections (RTIs)/sexually transmitted infections (STIs). However, most
of these services were not available at hospitals 24 hours a day: haemoglobin testing was most
commonly available (63%), followed by diagnosis and treatment of RTIs/STIs (38%) and malaria testing
(31%). TB testing was only available 24 hours a day at a quarter of hospitals. Infection detection and
treatment reduced by level of facility. DOTS was most commonly available: in 96% of PHCCs and health
posts and 84% of SHPs, followed by the diagnosis and treatment of RTIs/STIs.
Table 10.15: Provision of services for infection detection and treatment
Hospital
(%)
PHCC
(%)
HP
(%)
SHP
(%)
1. Laboratory diagnosis services:
Available 81.0 82.0 16.0 0.0
Available 24/7 50.0
Not available 18.8 17.9 84.4 100
2. Haemoglobin testing:
Available 100 78.6 22.2 10.0
Available 24/7 62.5
Not available 0.0 21.4 77.8 90
3. Diagnosis and treatment of RTIs/STIs:
Available 93.8 85.7 55.5 31.3
Available 24/7 37.5
Not available 6.3 14.3 44.4 68.8
4. Malaria testing:
Available 100 78.6 17.8 11.3
Available 24/7 31.3
Not available 0.0 21.4 82.2 88.8
5. TB testing:
Available 100 85.7 13.3 1.3
Available 24/7 25
Not available 0.0 14.3 86.7 98.8
6. DOTS
Available 100 96.4 95.5 83.8
Not available 0.0 3.6 4.4 16.3
n (total facilities) 16 28 45 80
Source: STS facility questionnaire
HIV— The availability of human immunodeficiency virus (HIV) services decreased by level of facility.
Most hospitals provided HIV counselling and testing (88%) (Figure 10.8), but less than half of the
hospitals (44%) provided antiretroviral (ARV) therapy or prevention of mother to child transmission
(PMTCT) treatment. Three-quarters of the hospitals provided opportunistic infection services and
palliative care for people living with HIV (75%); however, less than one-third provided these services 24
hours a day (Table 10.16).
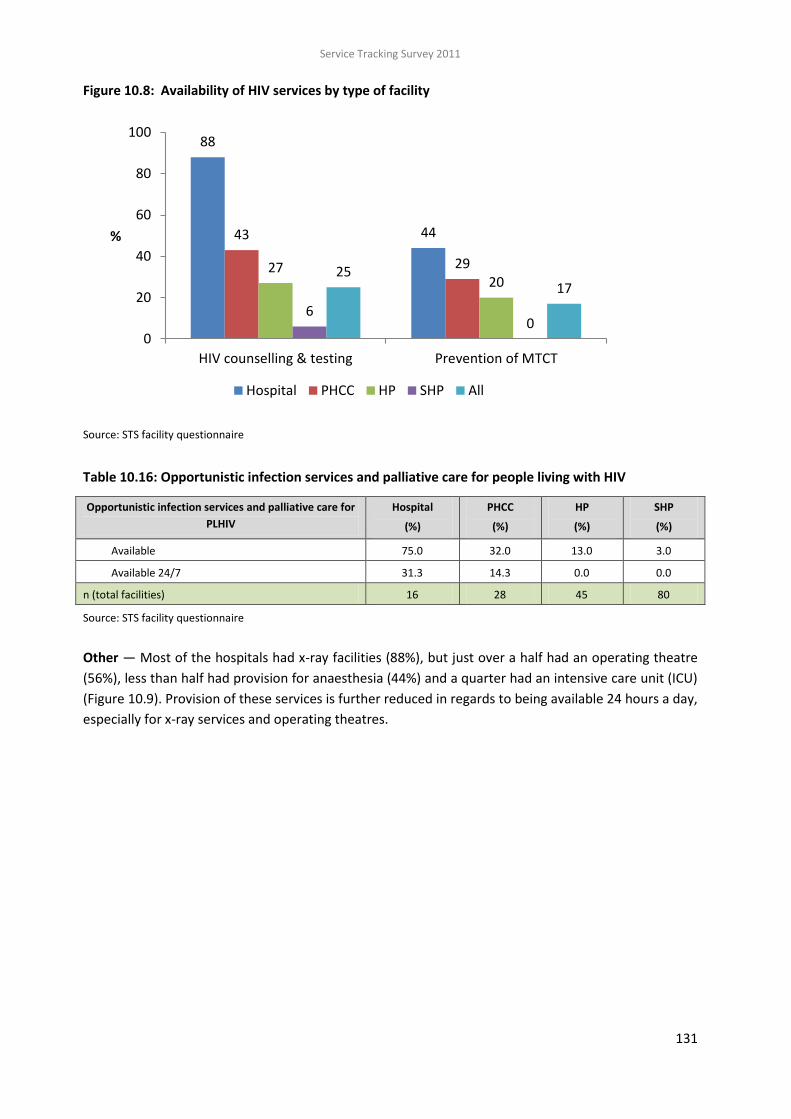
Service Tracking Survey 2011
131
Figure 10.8: Availability of HIV services by type of facility
88
4443
292720
60
2517
0
20
40
60
80
100
HIV counselling & testing Prevention of MTCT
%
Hospital PHCC HP SHP All
Source: STS facility questionnaire
Table 10.16: Opportunistic infection services and palliative care for people living with HIV
Opportunistic infection services and palliative care for
PLHIV
Hospital
(%)
PHCC
(%)
HP
(%)
SHP
(%)
Available 75.0 32.0 13.0 3.0
Available 24/7 31.3 14.3 0.0 0.0
n (total facilities) 16 28 45 80
Source: STS facility questionnaire
Other — Most of the hospitals had x-ray facilities (88%), but just over a half had an operating theatre
(56%), less than half had provision for anaesthesia (44%) and a quarter had an intensive care unit (ICU)
(Figure 10.9). Provision of these services is further reduced in regards to being available 24 hours a day,
especially for x-ray services and operating theatres.

Service Tracking Survey 2011
132
Figure 10.9: Provision of x-ray, operating theatre, anaesthesia and intensive care unit (ICU) at
hospitals
88
56
44
19
56
38 38
13
0
20
40
60
80
100
X-ray Op. theatre Anaesthesia ICU
%
Available Available 24 hrs.
Source: STS facility questionnaire
Most facilities provided treatment for acute respiratory infections: 100% of hospitals, 100% of PHCCs,
96% of health posts and 88% of SHPs (Table 10.17).
Table 10.17: Treatment for acute respiratory infections (facility-based or outreach)
Hospital
(%)
PHCC
(%)
HP
(%)
SHP
(%)
Available 100 100 96 88
Available 24/7 50 39 15.6 6.3
n (total facilities) 16 28 45 80
Source: STS facility questionnaire
10.2.6 Referrals
For those facilities with transport available, many took more than three hours to get to the nearest
referral facility: 25% of hospitals, 43% of PHCCs, and 59% of health posts (Table 10.18). From hospitals
it took a maximum of six hours to reach the nearest referral facility, while for PHCCs and health posts it
took a maximum of two days to reach the nearest one. These long transfers could prove fatal and/or
costly for clients. However, for 50% of hospitals with transport, the referral time was less than one
hour and for three quarters (75%) the maximum referral time was 3 hours.

Service Tracking Survey 2011
133
Table 10.18: Time taken to transport clients to nearest referral facility (hrs)
Hospital
(%)
PHCC
(%)
HP
(%)
SHP
(%)
<1 hour 50.0 19.0 17.2 26.1
1-3 hours 25.0 38.1 24.1 52.2
>3 hours 25.0 42.9 58.6 21.7
n (total facilities with transport available) 12 21 29 46
Mean hrs taken 2 9 8 3
n (total facilities) 12 21 29 46
Source: STS facility questionnaire
Of those outpatients surveyed, 9% had been referred to other facilities (Table 10.19). Most had been
referred to a government hospital (64%) or a private facility, including medical colleges (16%). The
main reasons for referral were clinical examination (61%) and laboratory tests (25%).
Table 10.19: Out-referrals for outpatients
Hospital
(%)
PHCC
(%)
HP
(%)
SHP
(%)
Total
(%)
1. Been referred 7.0 10.1 12.7 8.2 9.2
n (total clients) 328 244 121 127 820
2. Referred to:
Government hospital 37.5 77.8 85.7 54.3 64.4
Private facility (incl. medical colleges) 25.0 22.2 0.0 22.9 16.4
PHCC 0.0 0.0 0.0 11.4 5.5
Health post 0.0 0.0 9.5 0.0 2.7
NGO facility 0.0 0.0 0.0 0.0 0.0
Community hospital 0.0 0.0 0.0 11.4 5.5
Outside Nepal 0.0 0.0 0.0 0.0 0.0
Not specified 37.5 0.0 4.8 0.0 5.5
n (total clients) 23 23 11 9 66
3. Reason for referral:
Clinical examination 50.0 55.6 85.0 51.4 61.1
Laboratory test 37.5 22.2 5.0 34.3 25.0
Surgical 12.5 22.2 0.0 0.0 4.2
Gynaecological problem 0.0 0.0 10.0 0.0 2.8
Neurological problem 0.0 0.0 0.0 14.3 6.9
Don't know 0.0 0.0 0.0 0.0 0.0
n (total clients) 23 23 11 9 66
Source: STS outpatient exit interviews
There was little difference by type of facility in regards to whether outpatients were referred: 7% of
hospital outpatients, 10% of PHCC outpatients, 13% of health post outpatients and 8% of SHP

Service Tracking Survey 2011
134
outpatients. Those referred from hospitals were more likely to have been referred to private facilities,
including medical colleges, while most outpatients from PHCCs (78%) and health posts (86%) were
referred to public hospitals. Over a quarter of outpatients were referred from hospitals for laboratory
tests. The STS did not capture if these clients referred for tests then returned and were treated by the
original facility.
Transportation — Table 10.20 shows that three quarters of the hospitals (75%) had an ambulance,
36% of PHCCs, 9% of health posts and 5% of SHPs. Over half of the lower level facilities had a stretcher:
PHCCs (50%), health posts (60%) and SHPs (54%).
Table 10.20: Availability of ambulances and stretchers by level of facility
Hospital
(%)
PHCC
(%)
HP
(%)
SHP
(%)
Functional ambulance 75.0 35.7 8.9 5.0
Stretcher 31.3 50.0 60.0 53.8
n (total facilities) 16 28 45 80
Source: STS facility questionnaire
10.2.7 Client experiences
Waiting time — A small proportion of clients were seen immediately, 14% of maternity clients and 3%
of outpatients (Table 10.21). Similar proportions of maternity clients (4%) and outpatients (3%) felt
that the waiting time was far too long or were irritated with the length of waiting time while more than
a quarter of maternity clients felt that the waiting time was a little too long.
Table 10.21: Mean waiting time and client’s perception of waiting time
Maternity clients
(%)
Outpatients
(%)
Client rating: waiting time
No need to wait 14.3 2.9
Very pleased 14.5 14.1
Reasonable 40.0 64.6
A little too long 27.2 13.0
Far too long 3.9 3.3
Others 0.2 2.2
n (total clients) 197 820
Source: STS maternity and outpatient exit interviews
Companion — More than half of maternity clients (53%) and more than a quarter of outpatients (27%)
requested to have a companion with them during their care. The provider obliged in 2% of outpatient
cases and in only 9% of maternity cases (76%) (Table 10.22). Most maternity clients requested a
companion during labour (78%).

Service Tracking Survey 2011
135
Table 10.22: Companion requested and permitted
Maternity clients
(%)
Outpatients
(%)
1. Requested a companion at any time 52.7 27.4
2. Provider allowed companion 9.4 1.8
n (total clients) 197 820
3. Stage companion was requested and refused
During labour 77.6
During delivery 53.7
After delivery 55.3
During treatment 36.4
n (total clients) 154
Source: STS maternity and outpatient exit interviews
Cleanliness — One quater of maternity clients (24%) and 11% of outpatients thought the facility was
dirty or very dirty, while 48% of outpatients and 36% of maternity clients considered the facility to
have been clean or very clean (Table 10.23).
Table 10.23: Cleanliness of facility
Maternity clients
(%)
Outpatients
(%)
Very clean 7.3 4.4
Clean 28.4 43.1
Fair 39.2 41.9
Dirty 24.2 10.0
Very dirty 1.0 0.6
n (total clients) 197 820
Source: STS maternity and outpatient exit interviews
Privacy and confidentiality — Over a half of the maternity (57%) and outpatient clients (55%) reported
that the staff has been either good or very good at respecting their privacy (Table 10.24). A small
proportion of maternity clients (9%) and outpatients (7%) reported that the provider had been bad or
very bad at respecting their privacy. Just over half of outpatients had their consultations in a private
room (52%), with 62% receiving treatment in a private room, and most delivery clients delivering in a
private room (92%). However, 37% of outpatients and 16% of maternity clients reported that there had
been at least one unknown person present in the room. Most maternity clients (85%) but only 44% of
outpatients reported that there had been curtains on windows (including windows in doors). In regards
to confidentiality only 1% of outpatients and no maternity clients felt that their confidentiality had not
been maintained.

Service Tracking Survey 2011
136
Table 10.24: Respect for client privacy and confidentiality
Maternity clients
(%)
Outpatients
(%)
1. Privacy facilitated
Consultation in private room 51.6
Delivered/treated in private room 91.5 62.4
Any unknown person allowed in room 15.6 37.4
Curtains on windows 84.8 44.3
Divider between beds 79.9 20.7
Curtain between/around beds 24.3 24.6
Others 2.3 0.0
2. Client perception: respect for client privacy:
Very well 4.7 5.5
Good 51.8 49.0
Satisfactory 34.4 38.9
Bad 7.5 6.1
Very bad 1.7 0.5
Confidentiality not maintained 0.0 1.2
n (total clients) 197 820
Source: STS maternity and outpatient exit interviews
Type of provider — According to the client exit interviews doctors (45%) followed by AHWs (34%) were
reported as being the main care providers for most outpatients surveyed (Table 10.25). However, it is
possible that many clients were not actually aware of the profession of the provider and, for example,
may consider all male health workers to be doctors. There were also more interviews with outpatients
in hospitals than at lower levels and hence more likelihood of clients being seen by a doctor. The
maternity clients surveyed were most likely to have been seen by a nurse or auxiliary nurse midwife
(ANM) (92%).

Service Tracking Survey 2011
137
Table 10.25: Type of provider (main care provider)
Maternity clients
(%)
Outpatients
(%)
Doctor 6.5 44.6
Nurse 76.5 3.5
Health assistant 0.0 7.2
AHW 1.1 33.8
ANM 15.3 4.9
MCHW 0.5 3.2
VHW/lab. assistant 0.0 1.2
Admin. staff 0.0 0.2
Didn't know 0.1 1.3
n (total clients) 197 820
Source: STS maternity and outpatient exit interviews
Sex of provider — Most maternity clients were seen by a female provider (96%), but most female
outpatients were seen by a male provider (70%), as were most male outpatients (74%) (Figure 10.10).
Of those who were seen by a provider of the opposite sex, maternity clients were least likely to report
that they were comfortable with the sex of the provider (72%), compared to female outpatients (80%)
and male outpatients (94%).
Figure 10.10: Sex of provider and client comfort with sex of provider
4
7074 72
80
9496
3026
99 96 94
0
20
40
60
80
100
Maternityclients
Outpatientfemales
Outpatientmales
Maternityclients
Outpatientfemales
Outpatientmales
Sex of provider Comfortable with sex of provider
%
Male Provider Female Provider
Source: STS maternity and outpatient exit interviews
Explanations and advice — Most clients reported that the provider had been good or satisfactory in
providing explanations: 86% of maternity and 88% of outpatients (Table 10.26). Six percent of
maternity clients and 7% of outpatients considered the providers to be poor or very poor in providing
explanations. Specifically related to maternity care, clients were asked if they had received advice
related to important care practices. The clients were most likely to have received advice about the
importance of breastfeeding within the first hour of delivery (86%), but less likely to have received
advice about exclusive breastfeeding (65%) and immunisation (58%). Just over a quarter of maternity
clients received advice about family planning (27%).

Service Tracking Survey 2011
138
Provider skills — Most of the maternity (79%) and outpatient (82%) clients perceived the providers to
be skilled in providing care (Table 10.27). The main reason for maternity clients to perceive the
provider as unskilled was that the provider was frequently consulting with others, although it should
be noted that the sample size was small. Of those outpatients who felt that the provider was unskilled,
most felt it was because they lacked confidence (56%), did not use instruments (46%) or did not
perform a thorough examination (29%).

Service Tracking Survey 2011
139
Table 10.26: Clients’ perceptions of providers’ explanations and advice
Maternity clients
(%)
Outpatients
(%)
1. Client perception of providers’ explanations:
Very good 8.0 5.5
Good 57.0 49.0
Satisfactory 28.7 38.9
Poor 6.0 6.1
Very poor 0.2 0.5
n (total clients) 197 820
2. Client perception of advice received:
Breastfeed within 1 hour 85.5
Exclusive breastfeeding for 6 months 65.0
Immunization 57.7
Family planning 27.1
n (total clients) 197
Source: STS maternity and outpatient exit interviews
Table 10.27: Client perceptions on skills of providers and reasons for classifying as unskilled
Maternity clients
(%)
Outpatients
(%)
1. Client perception of provider skills:
Skilled 78.5 82.0
Unskilled 2.6 5.9
Don’t know 18.9 12.2
n (total clients) 197 820
2. Reason why perceived provider to be unskilled:
Lacked confidence 31.3 56.3
Did not use instruments 0.0 45.8
No thorough examination 0.0 29.2
Client not examined by relevant provider 0.0 8.3
Frequent consultations with others 50.8 6.2
Referred for minor problems 17.4 4.2
Rewrote prescription 0.0 4.2
n (total clients) 6 48
Source: STS maternity and outpatient exit interviews
Attitude and behaviour — Only 5% of maternity clients and 3% of outpatients felt that providers had
been rude or very rude to them (Table 10.28). Most rated providers as being either fair or polite: 84%
of maternity clients and 92% of outpatients. Of those who felt the provider had been rude or very
rude, nearly one-third felt they had been stigmatised for being poor (23% of Maternity clients and 36%
of Outpatients). However, many felt that this behaviour wasn’t linked to anything specific about them

Service Tracking Survey 2011
140
but that the provider simply had not cared about any of their clients, that they were too busy, had a
high caseload or treated everyone the same. Eight percent of maternity clients and 2% of outpatients
reported that they were scolded by the provider. The reasons reported were similar to those given for
providers being rude.
Table 10.28: Client perception of provider’s attitude and behaviour
Maternity clients
(%)
Outpatients
(%)
1. Client perception of provider behaviour:
Very polite 11.1 5.6
Polite 40.8 36.2
Fair 43.5 55.5
Rude 2.9 2.4
Very rude 1.6 0.2
n (total clients) 197 820
2. Clients’ perceived reasons for provider rudeness:
Didn’t care about clients 43.8 36.4
Treated everyone badly 64.4 18.2
Poverty of client 23.0 36.4
Too busy 15.4 27.3
High caseload 0.0 13.6
Gender 5.6 9.1
Ethnicity or caste 12.6 9.1
Age 0.0 9.1
n (total clients) 10 22
3. Scolded by staff:
Don’t care about clients 7.0 25.0
Treat everyone badly 44.8 16.7
Poverty of client 23.9 50.0
Too busy 20.7 25.0
Gender 0.0 16.7
Ethnicity or caste 9.5 8.3
Age 0.0 16.7
Emotional reaction 26.3 0.0
n (total clients) 15 12
Source: STS maternity and outpatient exit interviews. *N.B. Caution should be taken in interpretation as sample size is small
Satisfaction — Overall most clients felt that the care they received from the provider had been good or
very good: 65% of maternity clients and 73s% of outpatients (Table 10.29). The maternity clients were
more likely to rate the care as unsatisfactory or very unsatisfactory (6%) compared to only 2% of
outpatients.

Service Tracking Survey 2011
141
Table 10.29: Client perception of care given by provider
Maternity clients
(%)
Outpatients
(%)
Very good 8.0 8.2
Good 57.0 64.5
Satisfactory 28.7 25.4
Unsatisfactory 6.0 1.6
Very unsatisfactory 0.2 0.3
n (total clients) 197 820
Source: STS maternity and outpatient exit interviews
Client satisfaction is notoriously difficult to measure and therefore three questions were included in
both the outpatient and maternity questionnaires to assess if the responses differed greatly. The first
question asked directly about satisfaction with the care received. Clients were also asked whether they
would come to the facility again and if they would recommend it to others as indirect indications of
their satisfaction with quality of care. The percentages were similar for the different questions (Table
10.30). Overall a slightly higher percentage of clients stated they were unsatisfied (5%) than reported
that they wouldn’t use the facility again (1%) or wouldn’t recommend it to a friend (3%) (Figure 10.11).
This reflected the pattern for outpatients. Among maternity clients, slightly fewer said the services
were unsatisfactory (2%) than said they wouldn’t use it again (3%) or wouldn’t recommend it to a
friend (4%). However, a ‘maybe or don’t know’ response is not very positive, and if combined with the
‘no’ responses the negative results are closer to one in ten.
Table 10.30: Client satisfaction
Maternity clients
(%)
Outpatients
(%)
1. Satisfaction with care received:
Excellent 3.5 5.3
Good 57.8 58.2
Satisfactory 36.5 31.9
Unsatisfactory 2.2 4.6
n (total clients) 197 820
2. Would use facility again:*
Yes 71 92.9
No 2.5 0.7
Maybe/didn’t know 15.2 6.5
n (total clients) 176 820
3. Would recommend to friend
Yes 85.8 91
No 3.5 3.2
Maybe/didn’t know 10.7 5.7
n (total clients) 197 820
Source: STS maternity and outpatient exit interviews. *Excludes those who said they did not intend to have any more children

Service Tracking Survey 2011
142
Figure 10.11: Client dissatisfaction
23
45
1
34
1
3
0
2
4
6
8
10
Unsatisfied Would not use again Would not recommendto friend
%
Maternity Outpatient All
Source: STS maternity and outpatient exit interviews
Looking at levels of satisfaction by type of facility the percentage of clients reporting they were
unsatisfied was small across all types of facility, ranging from 3% to 5% (Figure 10.12). However, more
hospital and SHP clients reported they were unsatisfied.
Figure 10.12: Client satisfaction by type of facility
37 6 6
56
64
56 59
36
2636 31
5 3 3 5
0
20
40
60
80
100
Hospital PHCC HP SHP
%
Excellent Good Satisfactory Unsatisfactory
Source: STS maternity and outpatient exit interviews
Muslims were most likely to report that the care had been unsatisfactory (9%), followed by Brahmins
(6%). Dalits were least likely to report dissatisfaction with the care received (1%). The association
between caste/ethnicity and dissatisfaction was statistically significant (Figure 10.13).

Service Tracking Survey 2011
143
Figure 10.13: Percentage of clients dissatisfied with the care received, by caste and ethnicity
Source: STS maternity and outpatient exit interviews
Recommendations for improvement — All clients were asked to suggest their main recommendations
for improvement. Table 10.31 and Figures 10.14 and 10.15 show all results by maternity and
outpatients. The top recommendation was the same for maternity clients and outpatients, with both
stressing that the provision of free services was the main priority (44% and 36% respectively). This was
followed by need for more helpful staff (32%) for maternity clients and need to increase the number of
beds for outpatient clients (34%) Maternity clients also felt that it was important to provide incentive
payments on time (20%) and to have better skilled staffs (17%)Outpatient clients felt that staff should
be more helpful (27%) and better skilled (22%), the facility should be cleaner (27%) and privacy should
be improved (18%). Increasing the availability of linen and number of beds was also important for
maternity client (25% and 23% respectively).

Service Tracking Survey 2011
144
Figure 10.14: Top six recommendations for improvement by maternity clients
44
3225 23 20 17
0
20
40
60
80
100
Freeservice
Morehelpful
staff
Increaseavailability
of linen
Increasenumber of
beds
Incentiveson time
Betterskilled staff
%
Source: STS maternity exit interviews
Figure 10.15: Top six recommendations for improvement by outpatient clients
36 3427 27
2218
0
20
40
60
80
100
Freeservice
Increasenumber of
beds
Morehelpful
staff
Cleaner Betterskilled staff
Moreprivacy
%
Source: STS outpatient exit interviews

Service Tracking Survey 2011
145
Table 10.31: Client recommendations for improvement, by service received
Maternity clients
(%)
Outpatients
(%)
Provide a free service/do not charge for items or blood transfusions 44.0 36.2
Increase number of beds 22.7 34.2
Staff to be more helpful or improve behaviour 32.1 26.8
Improve cleanliness/levels of hygiene within facility 7.2 26.7
Staff should be better skilled/more competent 17.2 21.5
More privacy 12.3 17.5
Increase availability of linen 24.8 12.1
Make services available closer to home 8.5 13.9
Reduce waiting times 7.2 12.9
More female providers 3.1 13.5
No suggestion for improvement 10.6 4.3
Provide incentives on time 19.7 1.1
Discharge on time 6.3 0.6
More male providers 0.5 0.6
n (total clients) 197 820
Source: STS maternity and outpatient exit interviews
Table 10.32 and Figure 10.16 show the results for maternity and outpatient clients combined by facility
type. The recommendations by facility type were similar. Once again providing a free service was a key
recommendation, being the top one for hospitals (58%), PHCCs (32%) and health posts (36%). The
other recommendations mentioned at all four levels were more helpful staff and better cleanliness and
hygiene, neither of which requires excessive resources. Waiting times were a much bigger issue at the
hospital level (22%) than at lower levels. The need for more skilled and competent providers was
important at all levels (although not in the top five recommendations for SHPs despite them having the
least skilled providers). The proximity of the facilities to people’s homes was a bigger issue for the
PHCC, health post and SHP levels, as were more beds at the health post and SHP levels.

Service Tracking Survey 2011
146
Figure 10.16: Top five recommendations for improvement by facility type
58
40 37
22 2132 29
19 18 18
36 35 32 27 25
45 4430 27 22
0
20
40
60
80
100
Fre
e s
erv
ice
Cle
an
er
Mo
re h
elp
ful
Less
wa
itin
g
Mo
re s
kille
d
Fre
e s
erv
ice
Mo
re h
elp
ful
Mo
re b
ed
s
Mo
re s
kille
d
Cle
an
er
Fre
e s
erv
ice
Co
mp
reh
en
sive
C&
S
Mo
re b
ed
s
Mo
re h
elp
ful
Mo
re s
kille
d
Mo
re b
ed
s
Faci
lity
mg
t.
Cle
an
er
Fre
e s
erv
ice
Mo
re h
elp
ful
Hospital PHCC HP SHP
%
Source: STS maternity and outpatient exit interviews
Table 10.32: Client recommendations for improvement by type of facility
Hospital
(%)
PHCC
(%)
HP
(%)
SHP
(%)
Provide free service/don’t charge for items or blood transfusion 57.9 31.6 35.7 27.1
Staff should be more helpful/improve behaviour 37.1 28.7 26.6 21.9
Improve cleanliness/levels of hygiene in facility 40.1 17.8 21.0 29.7
Staff should be better skilled/more competent 20.8 17.8 24.9 19.7
Reduce waiting time before being seen 22.3 0.0 11.1 4.8
Increase number of beds 17.5 18.8 31.7 45.2
Closer 8.2 16.8 9.6 16.4
Better privacy 12.3 8.9 21.0 19.6
More female providers 7.1 13.9 19.8 11.0
Increase availability of linen 16.4 13.9 8.5 15.5
Provide incentives on time 12.6 3.0 2.7 0.0
Discharge on time 4.5 3.0 0.0 0.2
More male providers 0.7 0.0 0.0 0.6
No suggestion for improvement 7.1 5.9 3.5 4.9
n (total clients) 269 101 166 429
Source: STS maternity and outpatient exit interviews

Service Tracking Survey 2011
147
10.2.8 Quality improvement
The government introduced a health quality assurance policy in 2007 that makes it mandatory for all
health facilities to establish quality improvement committees. These committees are responsible for
revising, updating, implementing, coordinating and monitoring policies and strategies related to the
quality assurance of health services. In fiscal year 2009/10 district (public) health offices (D(P)HOs) in
35 districts received an orientation on health quality improvement committees and the D(P)HOs in the
remaining 40 districts were orientated in 2010/11. It is now the responsibility of D(P)HOs to orientate
facilities and ensure that committees are established and active. STS found that a quarter of the
facilities had established quality improvement committees. This included 38% of hospitals, 25% of
PHCCs, 16% of health posts and 30% of SHPs (Table 10.33).
However, of those facilities with such a committee, 43% did not have a quality improvement plan.
More hospitals (83%) than lower level facilities (43% of PHCCs, 71% of health posts and 50% of SHPs)
had such plans. Half of the facilities (50%) didn’t have the meeting minutes available for either of the
last two meetings, although they were available for both meetings at 34% of facilities. All minutes
accessed from the hospitals, PHCCs and health posts referred to agreed actions from the previous
meeting, as did 83% of SHP minutes.
Table 10.33: Quality improvement plans and committees
Hospital
(%)
PHCC
(%)
HP
(%)
SHP
(%)
Total
(%)
1. Quality improvement committee established 37.5 25.0 15.6 30.0 26.0
n (total facilities) 16 28 45 80 169
2. Quality improvement plan available in the facility 83.3 42.9 71.4 50.0 56.8
3. Availability of minutes of last two meetings:
Yes – both 50.0 57.1 14.3 29.2 34.1
Yes – just last meeting 0.0 14.3 14.3 20.8 15.9
No – neither meeting 50.0 28.6 71.4 50.0 50.0
n (total facilities) 6 7 7 24 44
4. Minutes from last meeting refer to agreed actions in previous meeting
100 100 100 83.3 90.9
n (total facilities) 3 5 2 12 22
Source: STS facility questionnaire
10.3 KEY FINDINGS
Utilities
Although all the hospitals had running water with soap, along with most PHCCs (89%) and SHPs
(89%), it is concerning that 20% of health posts did not. All but one hospital had an electricity
supply, along with 71% of PHCCs, 62% of health posts and 49% of SHPs; but only 38% of
hospitals had electricity available 24 hours a day.
Three-quarters of the hospitals (75%) and one-third of PHCCs (36%) had an ambulance.
For all levels of facility, burning was the most common method for disposing of biomedical
waste, followed by burying in a pit. There was good availability of bins for biomedical waste

Service Tracking Survey 2011
148
disposal: 90% had puncture proof bins for disposing of needles and sharps; 74% for disposing of
plastics and 70% for disposing of blood, tissue and fluid-stained items.
Services
Most birthing centres were providing routine deliveries (98%), with over three-quarters
providing this service on a 24 hour basis (77%).
Less than three-quarters of CEONC facilities (71%) provided all CEONC signal functions on a 24
hour basis, and this proportion was made up of just 31% of hospitals, resulting in just 39% of
districts having at least one facility providing all CEONC functions at all times. Less than half of
all BEONC facilities provided all BEONC signal functions 24 hours a day. Just one-fifth of PHCCs
provide all BEONC signal functions, with 18% providing all of these on a 24 hour basis (18%).
There is a need to improve the provision of services to remove retained products and provide
assisted deliveries at all BEONC facilities, and provide blood transfusions at all CEONC facilities.
All selected hospitals and 68% of the PHCCs visited were officially classified as safe abortion
sites. Post-abortion care was available at most safe abortion sites (80%), two-thirds provided
first trimester abortion care (66%) and over a quarter (26%) provided second trimester
abortions.
There was good provision of short term hormonal and non-hormonal family planning. IUCDs
were available at all hospitals (100%), nearly two thirds of PHCCs (64%), and one-third of health
posts (33%). Two thirds of hospitals provided vasectomies (69%) and half provided minilaps
(50%). Eighty percent of safe abortion sites provided post-abortion family planning. However,
nearly one-fifth of facilities providing delivery care did not provide post-partum family planning
(19%).
The provision of antenatal and postnatal care was high for all levels of facility, with all hospitals,
PHCCs and health posts providing both antenatal and postnatal care.
Referral
Nine percent of outpatients were referred to other facilities, the main reason being referral for
laboratory services. Distances to the nearest referral facility were great, with many clients
taking more than three hours to get to the nearest referral facility: 19% from hospitals, 32%
from PHCCs, and 38% from health posts. From hospitals it took a maximum of six hours to reach
the nearest referral facility, while for PHCCs and health posts it took a maximum of two days.
These long transfers can prove fatal and costly for clients.
Client experiences
Maternity clients were more likely to report that the facility had been dirty: one fifth of
maternity clients (24%) and 11% of outpatients thought that the facility had been dirty or very
dirty. However, when asked their key recommendations to increase quality of care 23% of all
clients thought that it was important to improve cleanliness in the facility.
Five percent of maternity clients and 3% of outpatients felt that the provider had been rude or
very rude to them. Of those who felt the provider had been rude or very rude nearly one-third
felt they had been stigmatised for being poor (23% for maternity clients and 36% for
outpatients); however, many felt that this behaviour hadn’t been linked to anything specific
about them but that the provider simply didn’t care about the clients, were too busy with a high
caseload or treated everyone the same. When specifically asked if the provider had scolded

Service Tracking Survey 2011
149
them, 8% of maternity clients and 2% of outpatients reported that they had been scolded (i.e. a
greater proportion than those reporting that the provider was rude).
Most clients were satisfied with the care they received with only 6% of maternity and 2% of
outpatients reporting dissatisfaction. However, 28% of clients recommended that staff should
improve their behaviour. A slightly higher percentage of hospital clients compared to clients at
lower level facilities were likely to report dissatisfaction. Muslims were most likely to report
that the care had been unsatisfactory (9%) and dalits were least likely to report dissatisfaction
with the care received (1%).

Service Tracking Survey 2011
150
11 PROGRESS AGAINST NHSP 2 LOGFRAME TARGETS
11.1 INTRODUCTION
The successful implementation of the Nepal Health Sector Programme 1 (NHSP 1, 2004–2009) has put
Nepal on track to achieve the Millennium Development Goals (MDG) for child health, maternal health,
HIV/AIDS and tuberculosis. The Nepal Health Sector Programme 2 (NHSP 2, 2010-2015) was developed
as a continuation of NHSP 1. A high level technical advisory committee oversaw the planning process
for NHSP 2 with the support of eight thematic task teams. One of these teams developed a results
framework to monitor the three objectives of NHSP 2, which are:
To increase access to and utilisation of quality essential health care services.
To reduce cultural and economic barriers to accessing health care services and harmful cultural
practices in partnership with non-state actors.
To improve the health system to achieve universal coverage of essential health services.
In 2011, following consultations within MoHP, it was agreed that the results framework should be
reviewed and revised to provide a clearer and sounder basis for monitoring and evaluating NHSP 2.
Following several technical working group meetings and workshops a monitoring and evaluation (M&E)
framework was drafted and shared with the concerned divisions and centres of the Department of
Health Services (DoHS), MoHP and external development partners in 2012. The framework was
developed in line with the Results Based Monitoring and Evaluation Guidelines of Nepal’s National
Planning Commission (NPC 2010). This new framework has been renamed as the logical framework of
NHSP 2 and was endorsed by the government in May 2012.
This chapter presents the achievements of the logical framework indicators for which the Service
Tracking Survey (STS) is cited as a source of data. The findings are disaggregated by gender equality
and social inclusion (GESI) categories, where indicated in the logical framework. It should be noted that
although the original results framework was consulted prior to STS 2011 data collection, the new
logical framework only became available after the STS 2011 data collection was completed. Hence,
necessary data was not collected for all revised indicators where STS is given as a data source and in
some cases data for a similar alternative indicator is presented below. Table 11.1 lists the revised
logical framework indicators, for which STS is a source of information, and whether the data from the
2011 STS can monitor the revised indicator, or whether the indicator needs to be modified.

Service Tracking Survey 2011
151
Table 11.1: Logical framework (2012) indicators generated from Service Tracking Survey
No. Revised logical framework indicators to be measured
by STS
Indicator able to be measured using 2011 STS data
OC 2.6 (outcome)
Percentage of clients satisfied with their health care at hospitals, PHCCs, health posts and SHPs (age, sex and caste/ethnicity)
Same
OP 1.3 (output)
Percentage of health facilities with at least three females and at least two Dalit and Janajati members in health facility management committees (HFMCs) and hospital development committees (HDC).
Same
OP 3.1.1 Percentage of sanctioned posts that are filled - doctors at PHCC
Same
OP 3.1.2 Percentage of sanctioned posts that are filled - doctors at district hospitals
Same
OP 3.1.3 Percentage of sanctioned posts that are filled – nurses at PHCC
Same
OP 3.1.4 Percentage of sanctioned posts that are filled - nurses at district hospitals
Same
OP 3.2 Percentage of hospitals that have at least 1 obstetrician-gynaecologist or a specialist general practitioner (MDGP), 5 SBA (skilled birth attendant) trained nurses and 1 anaesthetist or anaesthetist assistant
Percentage of hospitals that have at least 1 obstetrician-gynaecologist or MDGP; 5 nurses; and 1 anaesthetist or anaesthetist assistant
OP 4.5 Percentage of districts with at least one facility providing all CEONC signal functions 24/7
Same
OP 4.6 Percentage of PHCCs that provide all BEONC signal functions
Same
OP4.7 Percentage of health posts that are birthing centres providing deliveries 24/7
Same
OP 4.8 Percentage of safe abortion sites with long acting family planning services
Same
OP 4.9 Percentage of health posts providing condoms, pills, injectables, IUCDs and implants
Percentage of health posts with short term hormonal (e.g. pills, injectables) and non-hormonal (e.g. condoms) and IUDs and implants
OP 8.1 Percentage of health facilities that have undertaken social audits as per MoHP guideline in the last fiscal year
Percentage of health facilities that have undertaken social audits in the current or last fiscal year
11.2 RESULTS
Table 11.2 presents the findings from STS 2011 for all the indicators in Table 11.1. For comparison, the
2011 findings are presented alongside the 2011, 2013 and 2015 targets where they are available.
Those indicators where the target has been achieved are shaded in green, where targets achieved 90%
of the target they are shaded in amber and if they have not reached 90% of the target they have been
shaded in red. Where no targets are available for 2011 they are shaded in purple. These targets may be
reviewed and revised at the NHSP 2 mid-term review (MTR), which will be carried out in December
2012/January 2013 and hence may change in future STS reports.

Service Tracking Survey 2011
152
Table 11.2: Achievement of logframe indicators monitored by STS 2011 against baseline & targets
Indicator Achieved Target
2011 2011 2013 2015
OC 2.6 Percentage of clients satisfied with their health care provider at public facilities
All 96% 68% 74% 80%
Dalit 98%
Janajati 96%
Tarai/Madhesi other castes 95%
Newar 98% - - -
Brahmin and Chhetri 94% - - -
Muslims 94% - - -
Male 95% - - -
Female 96% - - -
<20 93% - - -
20-29 96% - - -
30-39 98% - - -
40+ 95% - - -
OP 1.3 Percentage of health facilities with at least three females and at least two Dalit and Janajati members in health facility management committees (HFMCs) and hospital development committees (HDC)
46% No target
set 50% 100%
OP 3.1 Percentage of sanctioned doctors and nurses posts at PHCCs and hospitals that are filled
OP 3.1.1
Percentage of sanctioned posts that are filled - doctors at PHCC
50% 85% 88% 90%
OP 3.1.2
Percentage of sanctioned posts that are filled - doctors at district hospitals
69% 85% 88% 90%
OP 3.1.3
Percentage of sanctioned posts that are filled - nurses at PHCC
74% 85% 88% 90%
OP 3.1.4
Percentage of sanctioned posts that are filled - nurses at district hospitals
83% 85% 88% 90%
OP 3.2 Percentage of district hospitals that have at least 1 obstetrician-gynaecologist or MDGP, 5 SBA trained nurses and 1 anaesthetist or anaesthetist assistant
31% No target
set 60% 80%
OP 4.5 Percentage of districts with at least one public facility providing all CEONC signal functions 24/7
38% No target
set 68% 76%
OP 4.6 Percentage of public PHCCs providing all BEONC signal functions 24/7
21% 23% 50% 70%
OP 4.7 Percentage of health posts that are birthing centres providing deliveries 24/7
79% 45% 60% 70%

Service Tracking Survey 2011
153
OP 4.8 Percentage of safe abortion (surgical and medical) sites with long acting family planning services
91% No target
set 60% 80%
OP 4.9 Percentage of health posts with at least five family planning methods
13% 45% 60% 70%
OP 8.1 Percentage of health facilities that have undertaken social audits as per MoHP guidelines in the current or last fiscal year
27% 5% 15% 25%
Green = Achieved 2011 target, Amber = 90% achieved 2011 target, red = <90% achieved 2011 target, Purple = 2011 target not available
11.2.1 Client satisfaction (indicator OC 2.6)
The fact that almost all clients (96%) were satisfied with their health care at health facilities far exceeds
the targets for 2011 (68%), 2013 (74%) and 2015 (80%) (Figure 11.1). All levels of facility have
individually also exceeded the target: hospitals (95%), primary health care centres (PHCCs) (97%),
health posts (97%) and sub-health posts (SHPs) (95%). The baseline for the logframe showed in 2009
satisfaction was reported as 83%, although if those for whom the response was not available had been
excluded the actual figure would have been 94% and hence very similar to the STS 2011 finding. It
should be noted that satisfaction is difficult to measure, and clients commonly under-report
dissatisfaction in exit interviews. However, similar results were achieved from a variety of direct and
indirect questions related to satisfaction (see Chapter 10).
Figure 11.1: Percentage of clients satisfied with their health care at health facilities
95 97 97 95 96
0
20
40
60
80
100
Hospital PHCC HP SHP All
%
2015 Target (80%)
2013 Target (74%)
2011 Target (68%)
Source: STS maternity and outpatient exit interviews
11.2.2 Social inclusion on facility committees (OP 1.3)
The STS 2011 found that 46% of health management committees (HFMCs and HDCs) had at least the
targeted three female members and two members from an excluded caste or ethnic group (Dalit or
Janajati), meaning that this indicator is on track to meet the 2013 target of 50% (Figure 11.2). However,
progress by level of facility was uneven with just 13% of hospital HDCs achieving the targeted

Service Tracking Survey 2011
154
representation, compared to at least 40% of lower level facilities HFMCs. No specific target was set for
2011 for this indicator.
Figure 11.2: Percentage of health facility committees with at least 3 female members and 2 Dalit or
Janajati members
13
43 40
49 46
0
20
40
60
80
100
Hospital PHCC HP SHP All
%
2015 Target (100%)
2013 Target (50%)
Source: STS facility questionnaire
11.2.3 Doctor and nurse posts (OP 3.1.1–3.1.4)
Only 69% of sanctioned doctor posts at district hospitals were filled as were just 50% of doctor posts at
PHCCs (Figure 11.3). The figures were better for nurses with 83% of sanctioned nurses posts filled at
district hospitals and 74% at PHCCs. None of these indicators met the 2011 target of 85%, although the
nurses at district hospitals nearly did. This highlights the urgent need to fill vacancies, especially for
doctors.

Service Tracking Survey 2011
155
Figure 11.3: Percentage of sanctioned and filled doctor and nurse posts at hospitals and PHCCs
69
50
83
74
0
20
40
60
80
100
District Hospital PHCC
%
Doctors Nurses
2015 Target (90%)2013 Target (88%)2011 Target (85%)
Source: STS facility questionnaire
11.2.4 CEONC staff in hospitals (OP 3.2)
The STS 2011 did not collect data on whether or not nurses were trained in skilled birth attendance
(SBA) (a part of indicator OP3.2), and hence this variable was adjusted to only consider whether or not
hospitals had at least five nurses, irrespective of whether they had received skill birth attendance
training. Not surprisingly, all but one hospital had at least five nurses (94%) (Figure 11.4). However,
performance was weaker for the other criteria, with 63% of facilities having at least one obstetrician-
gynaecologist (O/G) or MDGP, and half of the hospitals (50%) having at least one anaesthetist
assistant. There was no target for 2011, but current progress at 31% is a long way off the 2013 target of
60%.

Service Tracking Survey 2011
156
Figure 11.4: Percentage of hospitals with at least 1 obstetrician-gynaecologist or MDGP; 5 nurses;
and 1 anaesthetic/anaesthetic assistant
Source: STS facility questionnaire
11.2.5 Comprehensive emergency obstetric and neonatal care (CEONC) in districts (OP 4.5)
The provision of basic emergency obstetric and neonatal care (BEONC) services was found to be good
at the district level with all districts having at least one facility providing services for the removal of
placentas, removal of retained products, assisted vaginal delivery, administration of parenteral
antibiotics, and the administration of parenteral oxytocic drugs. All but one district had at least one
facility administering parenteral anticonvulsants and neonatal resuscitation. However, provision of the
additional two comprehensive emergency obstetric and neonatal care (CEONC) signal functions was a
lot poorer, with just 46% of districts having at least one facility providing blood transfusion, and 39%
providing this on a 24 hour basis, and 54% of districts having at least one facility providing caesarean
sections 24/7 (Figure 11.5). Only 39% of districts had at least one facility with all signal functions
available on a 24 hour basis. No target was set for 2011, but it is clear that current progress is a long
way off the 2013 target of 68%.

Service Tracking Survey 2011
157
Figure 11.5: Percentage of districts with at least one facility providing CEONC signal functions 24/7
Source: STS facility questionnaire
11.2.6 Basic emergency obstetric and neonatal care (BEONC) at PHCCs (OP 4.6)
Most PHCCs (over 70%) were providing services for removing placentas, neonatal resuscitation,
administering parenteral antibiotics, oxytocics and anticonvulsants, and many of these were doing so
on a 24 hour basis (Figure 11.6). However, the relatively low target of 23% of PHCCs providing all BEOC
signal functions by 2011 has not been reached because of the low proportion of PHCCs removing
retained products (50%) and performing assisted deliveries (39%), with less than one-third providing
the latter service 24 hours a day (32%). It should be noted that assisted deliveries cover either forceps
or vacuum extraction. The lack of these services hinders progress towards achieving the 2013 target,
which is a lot more ambitious at 50% and increases the need for referrals to higher level facilities.

Service Tracking Survey 2011
158
Figure 11.6: Percentage of PHCCs that provide BEONC signal functions
Source: STS facility questionnaire
11.2.7 Health posts that are birthing centres providing deliveries 24/7 (OP 4.7)
Of the health posts visited during the STS, 53% were officially ‘birthing centres’. Of the health posts
that were birthing centres 79% conducted deliveries on a 24 hour basis (Figure 11.7). This far exceeds
the 2011 target of 45%, and exceeds the 2013 and 2015 targets.
Figure 11.7: Percentage of health posts that are birthing centres providing deliveries 24/7
79
21
0
20
40
60
80
100
Available 24/7 Available, but not 24/7
%
2015 Target (70%)
2013 Target (60%)
2011 Target (45%)
Source: STS facility questionnaire

Service Tracking Survey 2011
159
11.2.8 Long acting family planning services at safe abortion sites (OP 4.8)
The STS 2011 collected information on whether safe abortion sites offered long-acting family planning
services. However, it did not specifically ask whether the long-acting family planning services were
offered post-abortion. At facilities classified as safe abortion sites, 91% provided intrauterine
contraceptive device (IUCD) services, and 63% offered implants, with 91% offering at least one of these
(Figure 11.8). However, when health personnel were asked whether their facilities provided post-
abortion family planning, only 80% responded positively suggesting that, although family planning
methods are available, they are not always offered to clients post-abortion.
Figure 11.8: Percentage safe abortion sites with long-acting family planning services
91
63
91
80
0
20
40
60
80
100
IUCD Implant IUCD or Implant Post abortion FP
%
2015 Target (80%)
2013 Target (60%)
Source: STS facility questionnaire
11.2.9 Family planning commodity availability at health posts (OP 4.9)
The revised logical framework indicator for family planning reflects the government guidelines, which
stipulate that the following five forms of contraception should be available at health posts: condoms,
oral contraceptive pills, injectables, intrauterine contraceptive devices (IUCD) and implants (FHD 2007,
p10). The information collected in 2011 was, however, not split by method of contraception for short-
term methods and instead measured whether health posts provided short term non-hormonal
contraceptive methods (e.g. condoms) and short-term hormonal contraceptive methods (e.g. oral
contraceptive pills, injectables), so an alternative way of measuring this indicator was taken. The STS
2011 did, however, collect information on IUCD and implant methods. The STS 2011 found that all its
health posts offered short term hormonal and non-hormonal contraception (Figure 11.9). However,
only just over a third of them provided IUCDs and only 16% provided implants. The absence of these
long-term contraceptive methods meant that just 13% of the health posts were offering short term
hormonal, non-hormonal, IUCD and implants as stipulated in the government guidelines (FHD 2007).
There is an urgent need to increase the provision of long-term methods of contraception at health
posts to meet the NHSP 2 targets. Skilled birth attendants are trained to provide IUCD and implants
and hence, as the number of them increases as targeted by NHSP 2, this indicator should also improve.

Service Tracking Survey 2011
160
Figure 11.9: Percentage health posts providing the different types of contraception
100
33
1613
0
20
40
60
80
100
ST hormonal & non-hormonal
ST hormonal & non-hormonal & IUCD
ST hormonal & non-hormonal & Implant
ST hormonal & non-hormonal & IUCD &
Implant
%
2015 Target (75%)
2013 Target (60%)
2011 Target (45%)
Source: STS facility questionnaire
11.2.10 Social audits of health facilities (OP 8.1)
The wording of the social audit indicator was revised following STS 2011 data collection to include
adherence to the MoHP guideline that it should be undertaken each year. Therefore the findings for
this indicator may be an over-estimate as information on whether or not the guideline was being
followed was not captured in the 2011 questionnaire. The STS also captured the timing of the facility’s
last social audit and therefore if the last one was in the current fiscal year it was not known whether
the facility had conducted one in the last fiscal year (as per the indicator wording). Therefore again the
result here could be an over-estimate as the indicator measures whether an audit was undertaken in
the current or last fiscal year.
The 2011 results as given are good with all four types of health facilities surpassing the 2011 target of
5% of health facilities carrying out social audits. The overall 2011 result (27%), and the results for each
level of facility, surpass the overall targets for 2013 and 2015 (Figure 11.10). Although differences
between the levels of facility suggest that more encouragement should be given to hospitals and sub-
health posts to carry out social audits.

Service Tracking Survey 2011
161
Figure 11.10: Percentage health facilities that undertook social audits in current or last fiscal year
Source: STS facility questionnaire
11.3 KEY FINDINGS
The progress on the NHSP 2 logical framework indicators measured by STS has been mixed with three
of the 2011 targets achieved and six not achieved. Also, no targets were set for four of the indicators
(with good progress made on two of them).
The 2011 targets were achieved for the following three indicators:
Percentage of clients satisfied with their health care at hospitals, PHCCs, health posts and SHPs
(age, sex and caste/ethnicity);
Percentage of health facilities that have undertaken social audits as per MoHP guideline in the
current or last fiscal year.
Percentage of health posts that are birthing centres providing deliveries 24/7.
The progress on social audits has been particularly good, with the 2015 target being surpassed in 2011.
The achievement of the client satisfaction target is not surprising given that clients (especially females)
frequently under-report their dissatisfaction in exit interviews.
The following indicators had no targets for 2011, but were found to be progressing well or had already
achieved towards the 2013 targets:
Percentage of health facilities with at least three females and at least two Dalit and Janajati
members in health facility management committees (HFMCs) and hospital development
committees (HDC).
Percentage of safe abortion sites with long acting family planning services
However, the progress by type of facility for social inclusion in HFMCs and HDCs is uneven with more
emphasis on diversity needed at the hospital level.
The indicators that did not reach their 2011 targets are:
Percentage of sanctioned posts that are filled - doctors at district hospitals;

Service Tracking Survey 2011
162
Percentage of sanctioned posts that are filled - doctors at PHCCs
Percentage of sanctioned posts that are filled - nurses at district hospitals
Percentage of sanctioned posts that are filled - nurses at PHCCs
Percentage of PHCCs that provide all BEONC signal functions
Percentage of health posts providing condoms, pills, injectables, IUCDs and implant
contraceptives.
There is a long way to go before the human resource targets for doctors at district hospitals and PHCCs
are met, whereas progress for nurses at district hospitals only just missed the target. However, as
shown in the human resource write-up (Chapter 8), there are important differences within the doctor
and nurse categories that should not be overlooked.
Many PHCCs were providing most of the BEONC signal functions, although gaps were seen in the
provision of the removal of retained products from childbirth and for assisted delivery, especially given
the poor access to caesarean sections at the district level.
The following two indicators had no target for 2011, and were not progressing well towards the 2013
target:
Percentage of hospitals that have at least 1 obstetrician-gynaecologist or MDGP; 5 SBA trained
nurses; and 1 anaesthetist or anaesthetist assistant.
Percentage of districts that have at least one facility providing all CEONC signal functions 24/7.
These two indicators relate to the provision of CEONC services as the human resources specified in the
first indicator need to be in place to enable the CEONC signal functions included in the second indicator
to be carried out. The 2011 trend indicates that the achievement of the 2013 targets for these
indicators is a long way off.

Service Tracking Survey 2011
163
REFERENCES
Bennett, L., Dahal, D., and Govindasamy, P. (2008) Caste, Ethnic and Regional Identity in Nepal: Further
Analysis of the 2006 Nepal Demographic and Health Survey. Calverton, Maryland, USA: Macro
International Inc.
Berwick, D. (2002) “A User’s Manual for the IoM’s ‘Quality Chasm’ report”. Health Affairs 21 (3): 80-90
DoHS (2011) Department of Health Services, Operating Manual for Department of Health Services.
Donabedian, A. (2003) An Introduction to Quality Assurance in Health Care. Oxford. Oxford University
Press
FHD (2007) National Family Planning Service Delivery Guidelines (2007) Kathmandu: Department of
Health Services, Family Health Division, Ministry of Health and Population.
Kolehmainen-Aitken R.L. and Shrestha I.B. (2009) Human Resource Strategy Options for Safe Delivery.
RTI International.
MEASURE Evaluation (2001) Sampling Manual for Facility Surveys for Population, Maternal Health,
Child Health and STD Programs in Developing Countries. MEASURE Evaluation Manual Series, No.
3. Carolina Population Center, University of North Carolina at Chapel Hill.
MoH (2003) Strategic Plan for Human Resources in Health, 2003-2017. Kathmandu: Ministry of Health
MoHP (2004) Health Sector Reform Strategy. Kathmandu: Ministry of Health and Population.
MoHP (2010a) Nepal Health Sector Programme Implementation Plan II (NHSP -IP 2) 2010–2015.
Kathmandu: Ministry of Health and Population, Government of Nepal
MoHP (2010b) Aama Programme Guidelines. Kathmandu: Ministry of Health and Population
MoHP (2010c) Governance and Accountability Action Plan: Nepal Health Sector Programme 2.
Kathmandu: Ministry of Health and Population.
MoHP (2012) Human Resources for Health Strategic Plan, 2010-2015. Kathmandu: Ministry of Health
and Population
NPC (2010) Results Based Monitoring and Evaluation Guidelines 2067. Kathmandu: Government of
Nepal, National Planning Commission
Powell-Jackson T, Tiwari S, Neupane BD (2010) An Early Evaluation of the Aama Programme. Family
Health Division and SSMP.
Pradhan A, Subedi BK, Barnett S, Sharma S, Puri M, Poudel P, Chitrakar S, Pratap K.C., Hulton L (2010)
Nepal Maternal Mortality and Morbidity Study 2008/2009. Kathmandu: Family Health Division,
MoHP Nepal.
Shanker, P.R. (2010) Attracting and Retaining Doctors in Rural Nepal. Rural Remote Health 10(3): 1420.
SSMP and CREHPA (2010). Rapid Assessment of the Aama Programme. Kathmandu
UNDP (2004) Nepal Human Development Report, 2004: Empowerment and Poverty Reduction.
Kathmandu: United Nations Development Programme.
WHO (2006) Quality of Care: a Process for Making Strategic Choices in Health Systems. Geneva, World
Health Organisation. www.who.int/management/quality/assurance/QualityCare_B.Def.pdf

Service Tracking Survey 2011
164
Annex 1.1: Members of STS 2011 Technical Working Committee
Dr Bal Krishna Suvedi, Chief PPICD/MoHP (chairperson)
Dr Padam Bahadur Chand, Chief PHM&E/MoHP
Mr Padam Raj Bhatta, Chief Finance and Human Resources/MoHP
Dr Babu Ram Marasini
Mr Deependra Kafle, Under-Secretary/PPICD
Dr Naresh Pratap KC, Director FHD/DoHS
Dr Shyam Raj Upreti, Director CHD/DoHS
Dr Bhim Singh Tinkari, Director Revitalizing PHC/DoHS
Mr Pawan Ghimire, Chief/HMIS
Ms Prabha Baral, HEFU/MoHP
Mr Mohan Bahadur Thapa, Finance Section/MoHP
Mr Lila Raj Poudel
Mr Rajan Adhikari
Mr Matt Gordon, DFID
Dr Asha Pun, UNICEF
Mr Deepak Poudel, USAID
Mr Devi Prasai, NHSSP
Mr Ajit Pradhan, NHSSP
Mr Pradeep Poudel, NHSSP
Dr Suresh Tiwari, HF Advisor/NHSSP (member secretary)
Annex 3.1: Categorisation of Caste, Ethnic and other Identity Groups

Service Tracking Survey 2011
165
Annex 2.1 WEIGHTINGS USED IN STS
a. Calculation of health facility weights
Level of facility
Sampling frame*
Sample facility
Sample weight
n % n %
Hospital 117 2.84 16 9.5 0.30
PHCC 208 5.04 28 16.6 0.30
HPs 675 16.36 45 26.6 0.61
SHPs 3125 75.76 80 47.3 1.60
Total 4125 100 169 100 1.00
*Source: Health Management information system: FY 2010/2011
b. Calculation of outpatient weights
Weight - Outpatient exit interview
Users (Population)* Exit (Sample)
Weight N % N %
Eastern mountain hospital 105873 0.44 8 0.98 0.45
Eastern hill hospital 259415 1.08 15 1.83 0.59
Eastern terai hospital 623993 2.60 48 5.85 0.44
Central mountain hospital 37612 0.16 23 2.80 0.06
Central hill hospital 261025 1.09 37 4.51 0.24
Central terai hospital 187283 0.78 30 3.66 0.21
Western hill hospital 821634 3.42 23 2.80 1.22
Western terai hospital 47397 0.20 37 4.51 0.04
Western/mid-western/far-western mountain hospital 193640 0.81 2 0.24 3.30
Mid-western hill hospital 189389 0.79 10 1.22 0.65
Mid-western terai hospital 344596 1.43 30 3.66 0.39
Far-western hill hospital 121475 0.51 17 2.07 0.24
Far-western terai hospital 193128 0.80 48 5.85 0.14
Eastern mountain PHCC 70458 0.29 6 0.73 0.40
Eastern hill PHCC 161197 0.67 11 1.34 0.50
Eastern terai PHCC 498456 2.07 36 4.39 0.47
Central mountain PHCC 71747 0.30 17 2.07 0.14
Central hill PHCC 295941 1.23 24 2.93 0.42
Central terai PHCC 424352 1.77 21 2.56 0.69
Western hill PHCC 337255 1.40 17 2.07 0.68
Western terai PHCC 113082 0.47 28 3.41 0.14
Western/mid-western/far-western mountain PHCC 80250 0.33 3 0.37 0.91
Mid-western hill PHCC 223591 0.93 8 0.98 0.95
Mid-western terai PHCC 162671 0.68 24 2.93 0.23
Far-western hill PHCC 73582 0.31 13 1.59 0.19
Far-western terai PHCC 128370 0.53 36 4.39 0.12
Eastern mountain HP 165191 0.69 3 0.37 1.88
Eastern hill HP 422383 1.76 6 0.73 2.40
Eastern terai HP 577009 2.40 18 2.20 1.09

Service Tracking Survey 2011
166
Weight - Outpatient exit interview
Users (Population)* Exit (Sample)
Weight N % N %
Central mountain HP 120764 0.50 9 1.10 0.46
Central hill HP 505627 2.10 11 1.34 1.57
Central terai HP 509846 2.12 11 1.34 1.58
Western hill HP 655677 2.73 8 0.98 2.80
Western terai HP 167339 0.70 14 1.71 0.41
Western/mid-western/far-western mountain HP 358749 1.49 1 0.12 10.00
Mid-western hill HP 495825 2.06 4 0.49 4.23
Mid-western terai HP 409516 1.70 12 1.46 1.16
Far-western hill HP 298627 1.24 6 0.73 1.70
Far-western terai HP 219934 0.91 18 2.20 0.42
Eastern mountain SHP 280310 1.17 3 0.37 3.19
Eastern hill SHP 1010118 4.20 7 0.85 4.92
Eastern terai SHP 2045484 8.51 18 2.20 3.88
Central mountain SHP 326773 1.36 10 1.22 1.11
Central hill SHP 1205599 5.02 10 1.22 4.11
Central terai SHP 2141148 8.91 12 1.46 6.09
Western hill SHP 1683199 7.00 11 1.34 5.22
Western terai SHP 735965 3.06 17 2.07 1.48
Western/mid-western/far-western mountain SHP 468514 1.95 1 0.12 10.00
Mid-western hill SHP 1279347 5.32 3 0.37 10.00
Mid-western terai SHP 783001 3.26 11 1.34 2.43
Far-western hill SHP 672410 2.80 6 0.73 3.82
Far-western terai SHP 472447 1.97 18 2.20 0.90
Total 24038214 100.00 820 100 1.00
*Source: Health Management information system: FY 2010/2011
c. Calculation of maternity client weights
Weight - Maternity exit interview
Users (Population)* Exit (Sample)
Weight N % N %
Eastern mountain hospital 8 0.57 4 2.03 0.28
Eastern hill hospital 54 3.87 11 5.58 0.69
Eastern terai hospital 195 13.96 29 14.72 0.95
Central mountain hospital 13 0.93 10 5.08 0.18
Central hill hospital 163 11.67 20 10.15 1.15
Central terai hospital 229 16.39 14 7.11 2.31
Western hill hospital 131 9.38 13 6.60 1.42
Western terai hospital 95 6.80 23 11.68 0.58
Western/mid-western/far-western mountain hospital 27 1.93 1 0.51 3.81
Mid-western hill hospital 43 3.08 6 3.05 1.01
Mid-western terai hospital 59 4.22 20 10.15 0.42
Far-western hill hospital 18 1.29 1 0.51 2.54
Far-western terai hospital 56 4.01 29 14.72 0.27
Eastern mountain PHCC 0 0.00 0 0.00

Service Tracking Survey 2011
167
Weight - Maternity exit interview
Users (Population)* Exit (Sample)
Weight N % N %
Eastern hill PHCC 18 1.29 0 0.00
Eastern terai PHCC 14 1.00 1 0.51 1.97
Central mountain PHCC 3 0.21 2 1.02 0.21
Central hill PHCC 1 0.07 0 0.00
Central terai PHCC 13 0.93 5 2.54 0.37
Western hill PHCC 25 1.79 2 1.02 1.76
Western terai PHCC 51 3.65 0 0.00
Western/mid-western/far-western mountain PHCC 1 0.07 0 0.00
Mid-western hill PHCC 31 2.22 0 0.00
Mid-western terai PHCC 13 0.93 0 0.00
Far-western hill PHCC 6 0.43 1 0.51 0.85
Far-western terai PHCC 17 1.22 2 1.02 1.20
Eastern mountain HP 8 0.57 0 0.00
Eastern hill HP 8 0.57 0 0.00
Eastern terai HP 0 0.00 0 0.00
Central mountain HP 2 0.14 1 0.51 0.28
Central hill HP 8 0.57 0 0.00
Central terai HP 6 0.43 0 0.00
Western hill HP 2 0.14 1 0.51 0.28
Western terai HP 8 0.57 0 0.00 0.01
Western/mid-western/far-western mountain HP 4 0.29 0 0.00
Mid-western hill HP 5 0.36 0 0.00
Mid-western terai HP 9 0.64 0 0.00
Far-western hill HP 10 0.72 0 0.00
Far-western terai HP 8 0.57 0 0.00
Eastern mountain SHP 2 0.14 0 0.00
Eastern hill SHP 1 0.07 0 0.00
Eastern terai SHP 3 0.21 0 0.00
Central mountain SHP 0 0.00 1 0.51 0.10
Central hill SHP 5 0.36 0 0.00
Central terai SHP 0 0.00 0 0.00
Western hill SHP 4 0.29 0 0.00
Western terai SHP 1 0.07 0 0.00
Western/mid-western/far-western mountain SHP 3 0.21 0 0.00
Mid-western hill SHP 6 0.43 0 0.00
Mid-western terai SHP 3 0.21 0 0.00
Far-western hill SHP 5 0.36 0 0.00
Far-western terai SHP 2 0.14 0 0.00
Total 1397 100.00 197 100.00 1.00

Service Tracking Survey 2011
168
d. Calculation of CEONC weights
Level of facility CEONC sampling frame* CEONC sample facility CEONC weight n % n %
Higher level hospital 15 40.54 3 42.86 0.95
District level hospital 22 59.46 4 57.14 1.04
PHCC
HPs
SHPs
Total 37 100.00 7 Note: *Annual report 2010/11
e. Calculation of BEONC weights
Level of facility BEONC sampling frame* BEONC sample facility BEONC weight n % n %
Hospital 48 30.0 9.00 40.9 0.73
PHCC 112 70.0 13.00 59.1 1.18
HPs
SHPs
Total 160.0 100.0 22.00 100.0 1.00 Note: *Annual report 2010/11
f. Calculation of birthing centre weights
Level of facility Birthing centre (BC) sampling
frame* Birthing centre sample
facility
BC weight n % n %
Hospital
PHCC 148 14.70 9 21.43 0.69
HPs 533 52.93 24 57.14 0.93
SHPs 326 32.37 9 21.43 1.51
Total 1007 100.00 42 100.00 1.00 Note: *Annual report 2010/11

Service Tracking Survey 2011
169
Annex 3.1: Categorisation of Caste, Ethnic and other Identity Groups
Main Caste/Ethnic
Groupings (7)
Groups with regional divisions (11) and social groups (103)
from 2001 Census
Caste groups
1. Brahman/Chhetri 1.1 Hill Brahman
Hill Brahman
1.2 Hill Chhetri
Chhetri, Takuri, Sanyasi
1.3 Tarai/Madhesi Brahman/Chhetri
Madhesi Brahman, Nurang, Rajput, Kayastha
2. Tarai/Madhesi Other Castes
2.1 Tarai/Madhesi Other Castes
Kewat, Mallah, Lohar, Nuniya, Kahar, Lodha, Rajbhar, Bing, Mali Kamar,
Dhuniya, Yadav, Teli, Koiri, Kurmi, Sonar, Baniya, Kalwar, Thakur/Hazam,
Kanu, Sudhi, Kumhar, Haluwai, Badhai, Barai, Bhediyar/Gaderi
3. Dalits 3.1 Hill Dalit
Kami, Damai/Dholi, Sarki, Badi, Gaine, Unidentified Dalits
3.2 Tarai/Madhesi Dalit
Chamar/Harijan, Musahar, Dushad/Paswan, Tatma, Khatwe, Dhobi, Baantar, Chidimar, Dom, Halkhor
Aadivasi-Janajati groups (ethnic groups)
4. Newar 4 Newar
Newar
5. Janajati 5.1 Hill/Mountain Janajati
Tamang, Kumal, Sunuwar, Majhi, Danuwar, Thami/Thangmi, Darai, Bhote, Baramu/Bramhu, Pahari, Kusunda, Raji, Raute, Chepang/Praja, Hayu, Magar, Chyantal, Rai, Sherpa, Bhujel/Gharti, Yakha, Thakali, Limbu, Lepcha, Bhote, Byansi, Jirel, Hyalmo, Walung, Gurung, Dura
5.2. Tarai Janajati
Tharu, Jhangad, Dhanuk, Rajbanshi, Gangai, Santhal/Satar, Dhimal, Tajpuriya, Meche, Koche, Kisan, Munda, Kusbadiya/Patharkata, Unidentified Adibasi/Janajati
Other
6. Muslim 6 Muslim
Madhesi Muslim, Churoute (Hill Muslim)
7 Other 7 Other
Marwari, Bangali, Jain, Punjabi/Sikh, Unidentified Others
Source: Bennett et al. 2008

Service Tracking Survey 2011
170
Annex 4.1: List of Free/Essential drugs by Level of Health Facility
Name of drug Hospitals PHCCs HPs SHPs
A. For stocking by hospitals, PHCCs, health posts and SHPs (25)
1 Albendazole Tab. X X X X
2 Aluminium hydroxide + Magnesium hydroxide Tab. X X X X
3 Amoxyciline Tab., Cap. X X X X
4 Calamine lotion X X X X
5 Chloramphenicol Applicaps X X X X
6 Chlorpheniramine Tab. X X X X
7 Ciprofloxacin Drops X X X X
8 Ciprofloxacin Ointment X X X X
9 Clove oil X X X X
10 Compound solution of Sodium lactate (Ringers' Lactate) Inj. X X X X
11 Ferrous salt + Folic acid Tab. X X X X
12 Gamma benzene hexachloride cream X X X X
13 Gentamycin Inj. X X X X
14 Hyoscinebutylbromide Tab. X X X X
15 Lignocaine Inj. X X X X
16 Magnesium Sulphate Inj. X X X X
17 Metoclorpropamide Inj. X X X X
18 Metronidazole Tab., Sus. X X X X
19 Oral Rehydration Solution (ORS) Powder X X X X
20 Oxytocin Inj.* X X X X
21 Paracetamol Tab., Inj., Syp. X X X X
22 Pheniramine Inj. X X X X
23 Povidinelodine Solution X X X X
24 Sulfamethoxazole + Trimethoprim Tab., Sus. X X X X
25 Vitamin B complex Tab. X X X X
B. For stocking by hospitals, PHCCS and health posts (10)
26 Atenolol Tab. X X X
27 Atropine Inj.* X X X
28 Benzoic acid + Salicylic acid cream X X X
29 Charcoal activated powder X X X
30 Ciprofloxacin Tab. X X X
31 Dexamethasone Inj. X X X
32 Frusemide Tab. X X X
33 Promethazine Tab. X X X
34 Salbutamol Tab. X X X
35 Sodium chloride Inj.
X X X

Service Tracking Survey 2011
171
Name of drug Hospitals PHCCs HPs SHPs
C. For stocking by hospitals only (5)
36 Alprazolam Tab. X
37 Aspirin Tab. X
38 Chloramphenicol Cap., Powder, Sus. X
39 Dextrose Solution Inj. X
40 Phenobarbitone Tab. X
Total 40 35 35 25
* Drugs that require refrigeration

Service Tracking Survey 2011
172
Annex 9.1: Percentage of Facilities with Drugs Procured Centrally and Locally
Name of drug
Hospitals PHCCs Health posts SHPs
Central Local Both N/A Central Local Both N/A Central Local Both N/A Central Local Both N/A
% % % % % % % % % % % % % % % %
1. For stocking by hospitals, PHCCs, health posts and SHPs
Albendazole 56.3 18.8 6.3 18.8 39.3 57.1 3.6 37.8 51.1 11.1 35.0 63.8 1.3
Aluminium hydroxide + Mag. hydroxide 43.8 18.8 12.5 25.0 32.1 60.7 7.1 37.8 48.9 13.3 32.5 61.3 6.3
Amoxyciline 18.8 25.0 43.8 12.5 39.3 60.7 42.2 53.3 4.4 35.0 63.8 1.3
Calamine lotion 50.0 12.5 6.3 31.3 39.3 57.1 3.6 40.0 48.9 11.1 31.3 56.3 12.5
Chloramphenicol Applicaps 18.8 12.5 12.5 56.3 32.1 53.6 3.6 10.7 28.9 37.8 33.3 30.0 47.5 22.5
Chlorpheniramine 43.8 6.3 18.8 31.3 39.3 57.1 3.6 40.0 53.3 6.7 33.8 62.5 1.3 2.5
Ciprofloxacin drops 43.8 12.5 12.5 31.3 28.6 53.6 17.9 33.3 37.8 28.9 18.8 47.5 33.8
Ciprofloxacin Ointment 25.0 6.3 6.3 62.5 21.4 60.7 3.6 14.3 31.1 33.3 35.6 12.5 40.0 47.5
Clove oil 56.3 6.3 6.3 31.3 39.3 60.7 40.0 51.1 8.9 35.0 60.0 5.0
Compound solution of Sodium lactate (Ringers' Lactate)
50.0 25.0 18.8 6.3 32.1 42.9 3.6 21.4 35.6 48.9 15.6 20.0 46.3 33.8
Ferrous salt + Folic acid 37.5 25.0 12.5 25.0 39.3 60.7 35.6 53.3 11.1 35.0 53.8 11.3
Gamma benzene hexachloride cream 50.0 12.5 6.3 31.3 35.7 60.7 3.6 33.3 51.1 15.6 27.5 55.0 17.5
Gentamycin 50.0 6.3 18.8 25.0 32.1 42.9 3.6 21.4 33.3 40.0 26.7 23.8 41.3 35.0
Hyoscinebutylbromide 25.0 12.5 31.3 31.3 35.7 57.1 7.1 37.8 48.9 13.3 31.3 53.8 15.0
Lignocaine 37.5 31.3 25.0 6.3 32.1 53.6 7.1 7.1 35.6 51.1 2.2 11.1 31.3 51.3 17.5
Magnesium Sulphate 43.8 25.0 12.5 18.8 21.4 46.4 32.1 17.8 24.4 57.8 13.8 26.3 60.0
Metoclorpropamide 31.3 31.3 25.0 12.5 28.6 42.9 28.6 17.8 26.7 55.6 15.0 26.3 58.8
Metronidazole 31.3 25.0 37.5 6.3 39.3 60.7 42.2 53.3 4.4 33.8 63.8 2.5
Oral Rehydration Solutions (ORS) 56.3 12.5 31.3 39.3 60.7 40.0 51.1 8.9 33.8 60.0 6.3
Oxytocin 37.5 25.0 18.8 18.8 35.7 53.6 3.6 7.1 31.1 44.4 24.4 21.3 43.8 35.0
Paracetamol 43.8 18.8 25.0 12.5 32.1 60.7 7.1 42.2 53.3 4.4 33.8 62.5 2.5 1.3

Service Tracking Survey 2011
173
Name of drug
Hospitals PHCCs Health posts SHPs
Central Local Both N/A Central Local Both N/A Central Local Both N/A Central Local Both N/A
% % % % % % % % % % % % % % % %
Pheniramine 50.0 12.5 12.5 25.0 25.0 46.4 28.6 31.1 40.0 28.9 18.8 30.0 51.3
Povidinelodine Solution 43.8 25.0 25.0 6.3 39.3 60.7 37.8 48.9 13.3 32.5 55.0 12.5
Sodium chloride 50.0 25.0 6.3 18.8 32.1 50.0 17.9 22.2 37.8 40.0 8.8 17.5 73.8
Sulfamethoxazole + Trimethoprim 37.5 18.8 25.0 18.8 39.3 60.7 42.2 51.1 6.7 32.5 63.8 3.8
Vitamin B complex 43.8 25.0 12.5 18.8 39.3 60.7 42.2 53.3 4.4 36.3 58.8 5.0
2. For stocking by hospitals, PHCCS and health posts
Atenolol 31.3 25.0 6.3 37.5 3.6 35.7 60.7 4.4 8.9 86.7
Atropine 50.0 18.8 18.8 12.5 21.4 42.9 35.7 4.4 35.6 60.0
Benzoic acid + Salicylic acid 43.8 6.3 6.3 43.8 32.1 57.1 10.7 31.1 42.2 26.7
Charcoal activated powder 12.5 6.3 6.3 75.0 17.9 82.1 2.2 13.3 84.4
Ciprofloxacin 31.3 12.5 12.5 43.8 17.9 39.3 42.9 22.2 37.8 40.0
Dexamethasone 43.8 25.0 12.5 18.8 28.6 50.0 3.6 17.9 28.9 40.0 31.1
Frusemide 43.8 6.3 25.0 25.0 35.7 53.6 10.7 33.3 48.9 17.8
Promethazine 25.0 25.0 50.0 14.3 35.7 50.0 11.1 17.8 71.1
Salbutamol 43.8 18.8 12.5 25.0 39.3 50.0 10.7 42.2 53.3 4.4
3. For stocking by hospitals only
Alprazolam 18.8 25.0 6.3 50.0
Aspirin 31.3 12.5 6.3 50.0
Chloramphenicol 37.5 18.8 6.3 37.5
Dextrose Solution 50.0 18.8 12.5 18.8
Phenobarbitone 31.3 12.5 6.3 50.0
n (total facilities) 16 28 45 80
Source: STS facility questionnaire

Service Tracking Survey 2011 — Background Characteristics
174
Annex 9.2: Percentage of Facilities with Expired Drugs in Stock at Time of Visit
Name of drug Hospitals PHCC HP SHP
% % % %
Amoxyciline 6.3 14.3 13.3 8.8
Sulfamethoxazole + Trimethoprim 7.1 15.6 17.5
Oxytocin 7.1 8.9 15.0
Magnesium Sulphate 17.9 2.2 6.3
Gentamycin 6.3 3.6 6.7 8.8
Metronidazole 6.3 7.1 6.7 3.8
Clove oil 6.3 7.1 2.5
Lignocaine 7.1 2.2 5.0
Ferrous salt + Folic acid 2.2 8.8
Pheniramine 8.9 1.3
Calamine lotion 3.6 4.4 1.3
Chloramphenicol Applicaps 3.6 4.4 1.3
Oral Rehydration Solutions (ORS) 4.4 3.8
Albendazole 3.6 4.4
Metoclorpropamide 7.1
Gamma benzene hexachloride cream 3.6 2.2
Hyoscinebutylbromide 4.4 1.3
Compound solution of Sodium lactate (Ringers' Lactate) 3.6 1.3
Ciprofloxacin Drop 2.2 2.5
Aluminium hydroxide + Magnesium hydroxide 3.8
Vitamin B complex 2.2 1.3
Povidinelodine Solution 2.5
Paracetamol 2.2
Chlorpheniramine 2.2
Ciprofloxacin Ointment 2.2
Frusemide 17.9 11.1
Atropine 17.9 4.4
Charcoal activated Powder 10.7
Dexamethasone 7.1 4.4
Promethazine 7.1 2.2
Atenolol 3.6 2.2
Salbutamol 3.6
Ciprofloxacin
Benzoic acid + Salicylic acid
Sodium chloride
Chloramphenicol 12.5
Aspirin 6.3

Service Tracking Survey 2011 — Background Characteristics
175
Name of drug Hospitals PHCC HP SHP
% % % %
Phenobarbitone
Alprazolam
Dextrose Solution
n (total facilities) 16 28 45 80


![[The 34th report on survey of the adverse reaction to radiopharmaceuticals (the 37th Survey in 2011)]](https://static.fdokumen.com/doc/165x107/6343c841b6b0c9b2390d1b4c/the-34th-report-on-survey-of-the-adverse-reaction-to-radiopharmaceuticals-the.jpg)