Biggins, J. Alan (2011), ‘A Geophysical Survey of St. Leonard’s Medieval Hospital,...
81
A Geophysical Survey of St. Leonard’s Medieval Hospital, Northumberland Park, North Tyneside May 2011
-
Upload
independent -
Category
Documents
-
view
0 -
download
0
Transcript of Biggins, J. Alan (2011), ‘A Geophysical Survey of St. Leonard’s Medieval Hospital,...
A Geophysical Survey of
St. Leonard’s Medieval Hospital,
Northumberland Park, North Tyneside May 2011

A Geophysical Survey of St. Leonard’s Medieval Hospital,
Northumberland Park, North Tyneside
May 2011
Prepared for the North Tyneside Council
& supported by the Heritage Lottery Fund
TTTTTTTTiiiiiiiimmmmmmmmeeeeeeeeSSSSSSSSccccccccaaaaaaaappppppppeeeeeeee SSSSSSSSuuuuuuuurrrrrrrrvvvvvvvveeeeeeeeyyyyyyyyssssssss
AAAAAAAArrrrrrrrcccccccchhhhhhhhaaaaaaaaeeeeeeeeoooooooollllllllooooooooggggggggiiiiiiiiccccccccaaaaaaaallllllll SSSSSSSSuuuuuuuurrrrrrrrvvvvvvvveeeeeeeeyyyyyyyyoooooooorrrrrrrrssssssss
Compiled by:
J. Alan Biggins TD MA MSc MRSC MIBiol FSA FSA Scot
In Association With

TTTTTTTTiiiiiiiimmmmmmmmeeeeeeeeSSSSSSSSccccccccaaaaaaaappppppppeeeeeeee SSSSSSSSuuuuuuuurrrrrrrrvvvvvvvveeeeeeeeyyyyyyyyssssssss
AAAAAAAArrrrrrrrcccccccchhhhhhhhaaaaaaaaeeeeeeeeoooooooollllllllooooooooggggggggiiiiiiiiccccccccaaaaaaaallllllll SSSSSSSSuuuuuuuurrrrrrrrvvvvvvvveeeeeeeeyyyyyyyyoooooooorrrrrrrrssssssss
A Geophysical Survey of St. Leonard’s Medieval Hospital,
Northumberland Park, North Tyneside: May 2011
INDEX
SUMMARY
1. INTRODUCTION 1
2. ARCHAEOLOGICAL BACKGROUND 2
3. LOCATION OF THE SURVEY AND GEOLOGY 9
4. GEOPHYSICAL SURVEY TECHNIQUES 9
4.1 Survey Parameters 9
4.2 Mapping and Set-out 10
4.3 Magnetic Survey 12
4.4 Resistance Survey 14
5. THE SURVEY RESULTS 15
5.1 Introduction 15
5.2 The Magnetometer and Resistance Survey Figures 16
5.3 Magnetic Survey Results 18
5.4 Resistance Survey 27
6. DISCUSSION 32
7. CONCLUSIONS 35
8. PROJECT ARCHIVE 35
10. PUBLICITY, CONFIDENTIALITY AND COPYRIGHT 35
11. STATEMENT OF INDEMNITY 36
12. ACKNOWLEDGEMENTS 36
BIBLIOGRAPHY 36

LIST OF FIGURES (APPENDIX 1) 39-65
1. O.S Location Map 1:50,000 39
2. Wood’s Plan of 1826 40
3. 1856 O.S. Map, Showing Spital Cottage I 41
4. 1861 O.S. Map; 1:2500 Scale 42
5. 1896 O.S. Map 1:500 Scale, Showing St. Leonard’s Foundations 43
6. 1898 O.S. Map Second Edition, Showing St. Leonard’s Foundations 44
7. Modern Map Showing Plan of Northumberland Park 45
8. Digital Map Showing 20m Survey Grid 46
9. Map Showing Archaeological Features 47
Magnetic Survey Figures
10. Magnetic Survey: Grey Scale Plot Overview; Scale 1:1000 48
11. Magnetic Survey: Grey Scale Plot; Scale 1:1000 49
12. Magnetic Survey: Relief Plots; Scale 1:2000 50
13. Magnetic Survey: Trace Plot; Scale 1:1000 51
14. Magnetic Anomaly Plan & Grey Scale Plot; Scale 1:1000 52
15. Magnetic Anomaly Plan - Annotated; Scale 1:500 53
16. Magnetic Anomaly Plan - Annotated Overview; Scale 1:1000 54
Resistance Survey Figures
17. Resistance Survey: Grey Scale Plot Overview; Scale 1:1000 55
18. Resistance Survey: Grey Scale Plot; Scale 1:1000 56
19. Resistance Survey: Relief Plots; Scale 1:2000 57
20. Resistance Survey: Trace Plot; Scale 1:1000 58
21. Resistance Anomaly Plan & Grey Scale Plot; Scale 1:1000 59
22. Resistance Anomaly Plan - Annotated; Scale 1:500 60
23. Resistance Anomaly Plan - Annotated Overview; Scale 1:1000 61
Survey Overviews
24. Magnetic & Resistance Anomaly Plans – Comparative 62
25. Magnetic & Resistance Anomaly Plans – Superimposed 63
26. Magnetic & Resistance Grey Scale Plot – Suggested Trench Locations 64
27. Suggested Trench Locations; Digital Map 65
APPENDIX 2
Geophysical Survey Theory 67-75

A Geophysical Survey of St. Leonard’s Medieval Hospital,
Northumberland Park, North Tyneside: May 2011
SUMMARY
A geophysical survey was undertaken at the location of St. Leonard’s Medieval Hospital,
Tynemouth, North Tyneside. This survey project was co-ordinated by North Tyneside
Council (Client) supported by Heritage Lottery Funding. The survey is part of a much
wider ranging conservation management and heritage strategy for Northumberland Park
forming part of the ‘Parks for People’ project. TimeScape Surveys supervised the
investigation which was conducted by a volunteer group comprised of the Friends of
Northumberland Park.
The objectives of the survey were set out in the County Archaeologist’s project design,
and included the use of local volunteers who were to be taught how to undertake
geophysical survey by an experienced geophysicist. The volunteers were offered on site
training in three survey techniques; EDM mapping, magnetic survey and earth resistance
survey. The geophysical survey was the second stage in a process to evaluate the
medieval hospital of St. Leonard’s and any associated archaeological features. The initial
stage comprised a desktop assessment, followed by the geophysical survey, then the
excavation phase.
The geophysical survey aimed to map subsurface anomalies which might indicate the
presence of features of archaeological significance, particularly those suggesting the
location of St. Leonard’s Hospital. Later excavation of the anomalies allowed a more
comprehensive understanding of the survey results. At the outset it was realised that
with one exception, an area towards the west, the results indicated a poor state of
preservation of the hospital’s foundations. It was obvious that stone robbing and later
landscaping had degraded the immediate area of the hospital. Subsequent excavation
confirmed this analysis.
Other areas of potential archaeological interest were identified which may warrant further
investigation. These are perhaps less spectacular than foundations, but may include
drainage systems and channels. More modern features such as the two temporal phases
of the Spital Cottages were recognised, but the response at the later cottage (1860-1960)
was subject to considerable modern interference.
The geophysical survey succeeded in its objectives, namely to train volunteers and also
determine the degree of preservation of St. Leonard’s Hospital. From this survey data,
appropriate areas to excavate were suggested and the volunteers themselves laid out the
excavation trenches. This project has perhaps laid the foundations for future communal
work in the area.

Geophysical Survey of St. Leonard’s Medieval Hospital Prepared for North Tyneside Council
TimeScape Surveys Report Number 123-11 1 Copyright Reserved
A Geophysical Survey of St. Leonard’s Medieval Hospital,
Northumberland Park, North Tyneside: May 2011
by
J. Alan Biggins - June 2011
with contributions by
Russell Anderson, Sheila Bell, Nina Brown, Martha Brummer, John Caulfield,
Susan Clements, Mike Coates, Isabel Cook, Jessica Currie, Christine Czarnowska,
Sheila Day, Elaine Dermody, Andy Graham, Paul Greenway, Jackie Henderson,
Liz Johnson, Lynn Johnson, Nick Johnson, Cath Mackley, David Mason,
Sarah Matthews, Linda McCann, Mike Morrison, Laura Reid, Jean Richardson,
Rob Shippey, Adrian Smiles, Alex Stevens, Dave Thompson, Mark Thompson,
Sophie Thompson, Susan Thompson & Eilis Weldon
1. INTRODUCTION
A geophysical survey was undertaken at the location of St. Leonard’s Medieval Hospital,
Tynemouth, North Tyneside during May 2011 (fig. 1). This survey project was co-
ordinated by North Tyneside Council (Client) supported by Heritage Lottery Funding. This
survey was part of a much wider ranging conservation management and heritage strategy
for Northumberland Park forming part of the ‘Parks for People’ project. TimeScape
Surveys supervised the geophysical investigation which was conducted by a volunteer
group from the Friends of Northumberland Park. The volunteers were offered on site
training in three survey techniques; EDM mapping, magnetic survey and earth resistance
survey.
The objectives of the survey were set out in the County Archaeologist’s project design
dated 20th December 2010 and include the following objectives:
Volunteers will be taught how to undertake geophysical survey by an experienced
geophysicist.
The geophysical survey aims to map subsurface anomalies which might indicate
the presence of features of archaeological significance, particularly those
suggesting the location of St. Leonard’s Hospital.
A survey grid will be established which will be geo-referenced to an O.S. base map
within 100mm accuracy.

Geophysical Survey of St. Leonard’s Medieval Hospital Prepared for North Tyneside Council
TimeScape Surveys Report Number 123-11 2 Copyright Reserved
The geophysicist will analyse and interpret the results and produce the report
which will identify anomalies and make recommendations for the emplacement of
excavation trenches.
2. ARCHAEOLOGICAL BACKGROUND
St. Leonard’s Hospital
The evidence both documentary and cartographic relating to St. Leonard’s Hospital is
incomplete, and, in some instances, speculative. A summary of the evidence has been
produced in the project design (Morrison 2010), which is reproduced in this section, and
also in the desk based assessment report which is being compiled in conjunction with
volunteers (Carlton 2011 forthcoming). It is thought that the hospital was founded about
1220 (Knowles and Hadcock 1971), with indirect mention made in the Assize Roll of 1293.
Lands belonging to the Hospital of St Leonard are first mentioned as being annexed to the
Benedictine Priory of Tynemouth in 1320.
In January 1539 the prior and convent of Tynemouth surrendered all their possessions,
including ‘Spytel House’ and ‘Spytel Close’ to the Crown. The land was then leased by
Henry VIII to Sir Thomas Hilton for a period of 21 years. The hospital had a considerable
amount of land attached to it. In a terrier1 of 1649, the extent of the hospital demesne was
13 acres, 3 roods and 5 perches lying in 46 rigs in various corners of land in Tynemouth,
Preston and Chirton (Morrison 2010).
The hospital was probably an alternative burial ground to Tynemouth Priory. In 1603,
William Milbank of North Shields left his body to be buried at either Tynemouth Priory or
the Spital. Many people were buried here during the Civil War when access to the priory
church was restricted. The site is listed as a burial place in the parish records in 1645. In
1656 the son of Gabriel Coulson, parish clerk, was buried there. In 1662 Ralph Pearson of
North Shields was buried at Spittle. In the Tynemouth burial registers for 1662, 19 were at
the Spittal. The last recorded burial at the Spittal was on 6th February 1708. This was
Jane, daughter of Anthony Elsdon of Whitley (Morrison 2010). Thompson’s map of
Tynemouth manor, 1757, shows the site of the hospital as ‘Spittle Yards’. By the 18th
century the hospital was in ruins and lying within pasture land.
1 This is a legal term derived from the Latin terrarius liber, i.e., a book belonging or pertaining to
land or landed estates and can be taken to mean;
(a) Formerly, a collection of acknowledgments of the vassals or tenants of a lordship, containing
the rents and services they owed to the lord.
(b) In modern usage, a book or roll in which the lands of private persons or corporations are
described by their site, boundaries, number of acres ([Webster 1913).

Geophysical Survey of St. Leonard’s Medieval Hospital Prepared for North Tyneside Council
TimeScape Surveys Report Number 123-11 3 Copyright Reserved
The ruins could still be traced in 1789 close to the road to Newcastle. In January 1885 the
Duke of Northumberland gave the land for a park and during the laying out of the park the
workmen rediscovered the hospital on the spot indicated by Brand and in Thompson's
Map of the Manor. In the course of the excavations they exhumed two stone coffins, one
or two medieval grave covers and a number of skeletons. They also uncovered a tiled
floor about 18 to 24 inches (0.46 x 0.61m) from the present surface. It measured about 20
feet by 12 feet (6.1 x 3.65m) and was covered up again to prevent it from damage while
the work was being carried out (Adamson 1889, 35). The building appears to have been
of considerable size. Its chambers were said to have been paved with stone. Mouldings
such as window tracery and the base of a cross were in Early English style. It was re-
covered to preserve it from damage. A few skeletons and grave covers were found. The
discovery of a ‘200 year old skeleton’ in Spital Burial Ground was reported in the Shields
Daily News on 5th January 1885 (Morrison 2010).
Plate 1. Relocated stone coffins and the grave slab together with a standing stone which may be
the base of a cross.
The surviving objects on the site include two stone coffins and a few worked stones
(Plates 1 & 2). The most interesting object is a limestone grave slab measuring 5 feet 9
inches x 2 feet 7 inches (0.61 x 1.75m). It depicts a man and his wife and their five
children at their feet. The grave slab is thought to be 15th century in date. The slab would
originally have been covered by brass sheeting but this has been stripped off. The rivets
are still visible. The grave slab was found face down having been reused as part of a floor.
It is now enclosed by modern railings (removed for the survey). The grave slab and coffins
are listed grade 2.
Geophysical Survey of St. Leonard’s Medieval Hospital Prepared for North Tyneside Council
TimeScape Surveys Report Number 123-11 4 Copyright Reserved
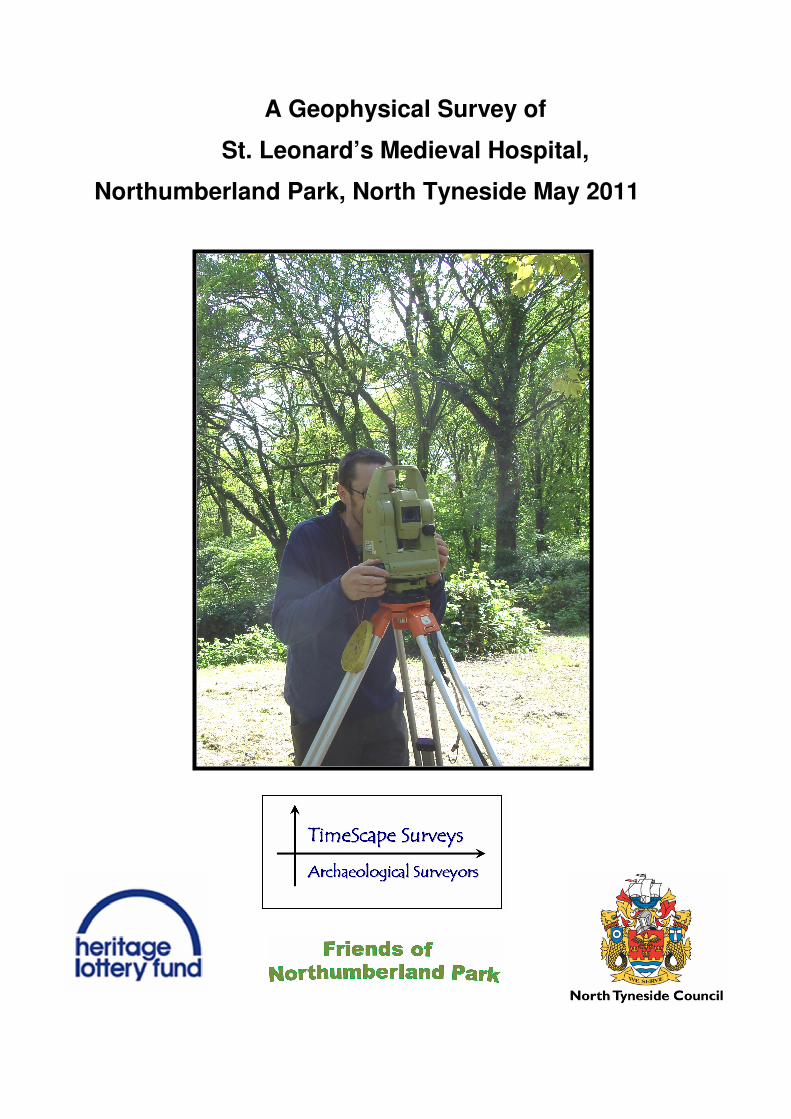
Plate 2. Detail of the matrix (grave cover), which may have had brass inlaid figures. The two larger
figures may be husband and wife, with the smaller inset indicating four sons and a daughter. A 15th
century date is implied on stylistic grounds. A cover like this suggests a high-status burial, possibly
a local dignitary or a benefactor.
The site was partially exposed in 1885 but for a long time has been overgrown. The main
buildings of the hospital are no longer discernable on the ground. Neither the site of the
hospital nor the associated grave slab and coffins are presently signposted or interpreted.
Wider Research Background (by Jennifer Morrison)
Hospitals were a fairly common feature of the medieval landscape, there being over 750
in England in the Middle Ages, but as a group of monuments they are not well
represented in the archaeological record for the period. Little research has been done on
the northern examples and across the country, only half a dozen sites have been
thoroughly researched, most notably St Bartholomew’s Hospital Bristol, which was
extensively excavated in the 1970s. Less extensively, and also in the south of the country
are St Mary Ospring, Kent and St Mary Spital, London, while in the north of England, the
only major excavation has been the hospital of St Giles, at Brompton Bridge, North
Yorkshire, where emergency excavations recorded remains threatened by river erosion.

Geophysical Survey of St. Leonard’s Medieval Hospital Prepared for North Tyneside Council
TimeScape Surveys Report Number 123-11 5 Copyright Reserved
St Giles, in common with a number of hospitals, was located at a river crossing point on a
major thoroughfare, a location also seen at St Leonard’s, which was on the main
Newcastle to Tynemouth road, on the bank of the Powburn stream. This reflects one of
the main functions of these semi-monastic institutions, to provide travellers with a hostel
for overnight accommodation, in addition to the role of providing alms and medical care to
the old and infirm. Run by religious orders or by clergy on behalf of the pious wealthy, they
were funded by grants of land and money in the same way as monasteries and chantry
chapels2, to say prayers for the souls of the benefactors, who would be credited with the
good works done in the institutions.
Plate 3. The hospital of St. Mary’s, Glastonbury viewed from the west, which appears to be of
similar dimensions to the foundations of St. Leonard’s. Although this is in the style of a later
almshouse, this illustration shows an eastern chapel, with a hall attached and separate cubicles
(after Clay 1909, Plate XI).
The specific medical connotation of the word “hospital” had no significance in the Middle
Ages, as these institutions provided little or no medical care, beyond providing
accommodation, food and spiritual guidance. The medical association has developed
primarily because a specific class of hospital cared for victims of leprosy, a disease that
was regarded as a punishment for sinful, usually carnal, behaviour which became
common in society in the 12th and 13th century, but which almost died out (for reasons not
well understood) by the 15th century, when lepers’ hospitals became homes for a wider
range of the long-term ill. The hospital of St Leonard’s has been assigned as a leper’s
2 A Chantry Chapel was established by a fund to pay for a priest to celebrate sung masses for a
specified purpose, generally for the soul of the deceased donor. Chantries were endowed with
lands given by donors, the income from which maintained the chantry priest. A chantry chapel is a
building on private land or a dedicated area within a greater church, set aside or built especially for
and dedicated to the performance of the chantry duties by the priest. A chantry may have only an
altar, rather than a chapel, within a larger church, generally dedicated to the donor's favourite saint.
Geophysical Survey of St. Leonard’s Medieval Hospital Prepared for North Tyneside Council
TimeScape Surveys Report Number 123-11 6 Copyright Reserved
hospital on uncertain evidence, possibly because St Leonard has been associated with
the care of lepers.
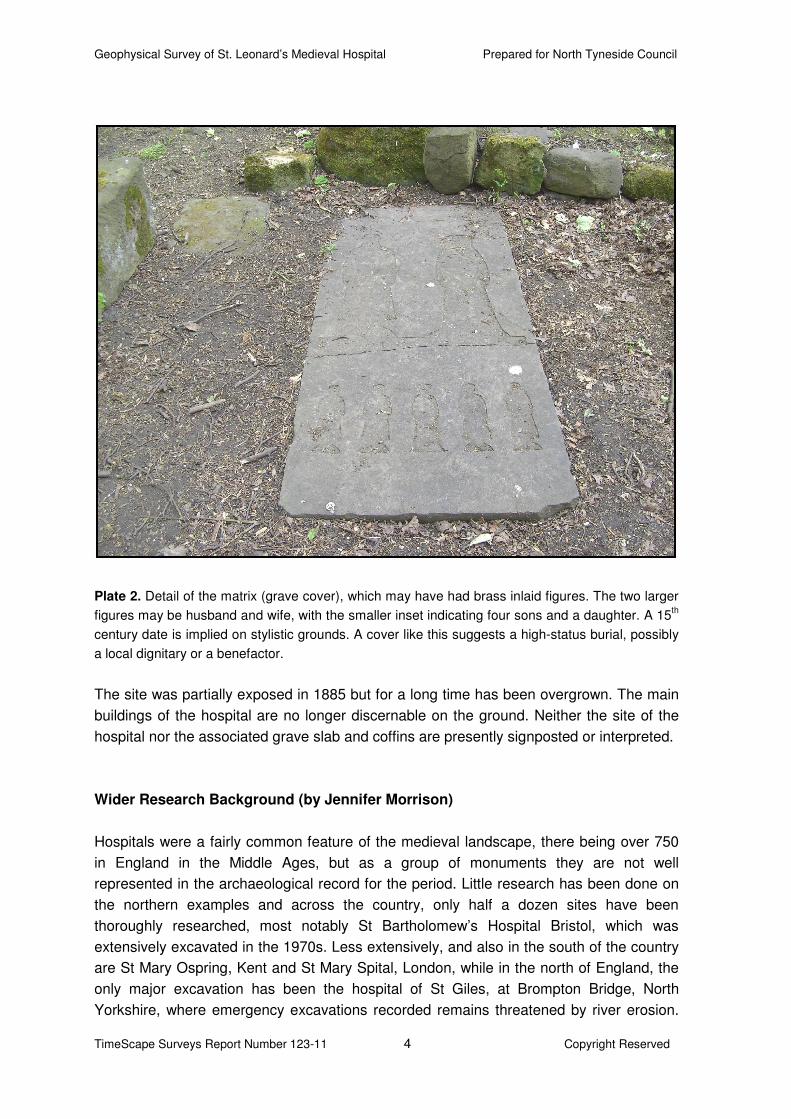
Plate 4. Sherburn Hospital, near Durham, was a much more expansive structure with a large range
of buildings connected to a chapel and outbuildings surrounded by a large courtyard. This was
founded in 1181 by Bishop Puisit. As with many other hospitals it was known that this was a lazar-
house which was appropriated for other uses (in 1434) such as care of the poor after leprosy
became less common. The original leper-hospital had as many as 65 lepers, which was reduced to
13 poor men around 1434 (after Clay 1909, 44, 118, fig. 21, 289).
The function of the hospital will determine the type and arrangement of building expected.
Hostels and alms-houses had a large central hall, an infirmary, which provided dormitory
accommodation and which was usually well-supplied with water. Ancillary buildings,
including kitchens and possibly a chapel, would be arranged around a small courtyard or
walled precinct. Leper hospitals often had groups of smaller cells for individual inmates,
again with central facilities under the supervision of a master, who had more lavish living
quarters.

Geophysical Survey of St. Leonard’s Medieval Hospital Prepared for North Tyneside Council
TimeScape Surveys Report Number 123-11 7 Copyright Reserved
Post-Medieval Features
Although earlier maps indicate the field systems associated with St. Leonard’s and
reference is made to spital, none indicate the location of upstanding masonry. Wood’s
map of 1826 (fig. 2) clearly shows the location of the House of Correction, Spital Bridge,
the Tynemouth road and a cottage located towards the west of the bridge. The 1856 O.S
map (fig. 3) shows two small steams which converge towards the south creating a triangle
of land within which the hospital is located. These natural features may well have
delineated the boundaries of the earlier ecclesiastical establishment. The 1861 1:2500
O.S map (fig. 4) shows a more complex group of buildings (hereafter referred to as Spital
Cottage I), together with Spital Dean Farm located north of the road in a position almost
opposite the present park gates. All these feature are seen on the 1856 map.
The section of the 1:500 scale 1896 map (fig. 5) shows the park shortly after opening, but
importantly indicates the presence of exposed masonry aligned east west for some 36m,
with a width of some 6.5m. The foundations are again seen on the 1898 O.S. map (fig. 6),
and a later map, although it is uncertain when these remains were recovered (or indeed
removed). On these two maps the cottage near Spital Dean Bridge (Spital Cottage I) has
been demolished a replacement Park Cottage (or Spital Cottage II) has replaced it. This in
turn was demolished some time in the 1960s.
Although the remains of St. Leonard’s Hospital would appear to be the most interesting
and important in archaeological terms, the presence of a cottage dating from at least 1826
(Wood’s map) and its mid-19th century replacement are themselves of interest. It would
appear that elements of the earlier cottage have been buried or lost in when the road was
straightened (see plate 5), although some elements may remain south of the embankment
of the Tynemouth road. Its replacement existed in living memory.
Earlier maps also indicate the presence of a market garden near to Spital Bridge. In the
case of the post-medieval features excavation may indicate invaluable evidence of these
earlier foundations. In addition, it is possible that masonry from the hospital may have
been used and may remain in situ. It should also be established whether or not any
remaining buildings were constructed on earlier foundations.

Geophysical Survey of St. Leonard’s Medieval Hospital Prepared for North Tyneside Council
TimeScape Surveys Report Number 123-11 8 Copyright Reserved
Plate 5. Cut Throat Lane renamed Spital Dene and then King Edward Road (after M. Coates).
Plate 6. Later map showing old Spital Cottage which was replaced in 1862 with New Spital Cottage
(II), later renamed Park Cottage which has since been demolished. Note the change in the
direction of the road and widening near Spital Dene Bridge (after M. Coates).

Geophysical Survey of St. Leonard’s Medieval Hospital Prepared for North Tyneside Council
TimeScape Surveys Report Number 123-11 9 Copyright Reserved
3. LOCATION OF THE SURVEY AND GEOLOGY
Northumberland Park (NZ 3612 6930), which extends over approximately 12 hectares, is
located some 300 metres to the west of Tynemouth Railway Station and 350 metres to the
north of the banks of the River Tyne (fig. 7). It is bounded by Park Avenue/Park Terrace to
the west, King Edward Road to the north, former railway sidings, allotment gardens and
Hazeldene Court to the east and Tynemouth Road to the south. The park is situated in
Spital Dene which cuts through the gently rising side of the estuarine Tyne valley. The
lowest point of the park is approximately 14 metres OD (the lake) and the highest
approximately 32 metres OD (King Edward Road entrance). The park dishes at its
southern end where 19th century engineering works raised the alignment of Tynemouth
Road and the adjacent railway, now metro, line to form a raised edge approximately 23
metres OD. (North of England Civic Trust 2009).
The drift geology of the area is dominated by boulder clay with deposits between 6-9m in
depth (Taylor et al 1971, 88). The solid geology of the area is generally not well exposed
due to the glacial drift and it is only in the exposed coastal regions, such as Tynemouth,
where good continuous sections of Westphalian strata can be seen (Jones 1967). Inland
exposures are restricted to quarries, mainly in sandstone and ganister (Johnson 1995,
267). The coast from Tynemouth to Seaton Sluice provides one of the best exposures of
rocks belonging to the Upper Carboniferous Coal Measures (approximately 300 million
years old) in Great Britain. It includes outcrops of numerous coal seams, and several
mudstone horizons yielding non-marine bivalves. Of particular importance are outcrops of
sandstones within the rock sequence, which have been interpreted as braided river
deposits. These contrast with the meandering river deposits which dominate the same
rocks in the Pennines Coalfields to the south. Geologists suggest from this evidence that
the Northumberland and Durham Coalfields formed in a more elevated area relative to the
Pennines Coalfield, and this area was thus probably rather further from the sea (Natural
England 2011).
4. GEOPHYSICAL SURVEY TECHNIQUES
4.1 Survey Parameters
The survey was located within the northern sector of the park adjacent to King Edward
Road (fig. 7). The survey was conducted according to those specifications indicated in the
project Design (Morrison 2010). The major requirements are outlined below.
The survey aims to map subsoil disturbances and locate anomaly-producing
structures or deposits which might indicate the presence of archaeological sites.
The survey grid is the network of control points used to locate the geophysical
survey measurements relative to base mapping and/or absolute position on the

Geophysical Survey of St. Leonard’s Medieval Hospital Prepared for North Tyneside Council
TimeScape Surveys Report Number 123-11 10 Copyright Reserved
Earth’s surface (dereferencing). These points were located to survey-grade
accuracy ± 100mm. The survey grid must be independently re-locatable on the
ground by a third party either by measurement to permanent features and/or by
the use of GPS coordinates.
The survey grid must be tied into known Ordnance Survey points with a total
station (EDM).
The magnetic investigation will be a 100% detailed survey using sample intervals
of 0.25m and the traverse intervals of 1m and a sensitivity of 0.1 nanoTesla.
The earth resistance survey should employ 1.0m sample intervals (0.5m were
employed in this survey) along 1.0m traverses.
20m survey grids to be employed.
The interpretation of magnetometer data must endeavour to distinguish between
anthropogenic and other causes of magnetic enhancement on the site.
A clear distinction must be made between interpretation that is scientifically
demonstrable and that which is based on informed speculation.
Any reference to negative evidence must be fully explained. Lack of geophysical
anomalies cannot be taken to imply a lack of archaeological features.
4.2 Mapping and Set-out
Survey areas were subdivided into 20m survey grids using a Total Station (Leica 403L)
which was used to provide cartographic information (fig. 8). A smaller grid size was
chosen because of the constrictions and obstructions within the survey area. The Leica
TC403L Total Station (EDM) fires a laser beam which is reflected from a prism (plate 8)
and the data recorded includes grid coordinate, height, slope angle, type of object (for
example; road, fence etc.). The digital mapping of the site is georeferenced in a DXF (or
dwg) format, and was superimposed upon an Ordnance Survey digital map.

Geophysical Survey of St. Leonard’s Medieval Hospital Prepared for North Tyneside Council
TimeScape Surveys Report Number 123-11 11 Copyright Reserved
Plate 7 Elaine Dermody and Paul Greenway setting out the survey grid and mapping using EDM
(total station). This instrument fires a laser beam towards a reflector (prism) which returns the
signal to the EDM which records mapping data.

Geophysical Survey of St. Leonard’s Medieval Hospital Prepared for North Tyneside Council
TimeScape Surveys Report Number 123-11 12 Copyright Reserved
Plate 8. David Mason can be seen with the prism which reflects back the laser beam pulse
converting the speed of light into a grid coordinate and height, which is recorded. David is seen
here recording firm map detail, stone coffins and the grave slab. The ashlar stone in the foreground
is probably a corbel bracket. This would have supported a structural element like a beam or roof
support.
4.3 Magnetic Survey
Magnetic prospection of soils is based on the measurement of differences in magnitudes
of the earth’s magnetic field at points over a specific area (down to 0.1 nanoTesla
sensitivity). The iron content of a soil provides the basis for its magnetic properties, with
the presence minerals such as magnetite, maghaemite and other iron oxides all affecting
the magnetic properties of soils. Variations in the earth’s magnetic field which are
associated with archaeological features are weak, however, especially considering the
overall strength of the earth’s magnetic field of around 48 Teslas (48x 109nT). It follows
that these instruments are very sensitive indeed.
Three basic types of magnetometer are available to the archaeologist; proton
magnetometers, fluxgate gradiometers, and alkali vapour magnetometers (also known as
caesium magnetometers, or optically pumped magnetometers). Fluxgate instruments are

Geophysical Survey of St. Leonard’s Medieval Hospital Prepared for North Tyneside Council
TimeScape Surveys Report Number 123-11 13 Copyright Reserved
based around a highly permeable nickel iron alloy core, which is magnetised by the
earth’s magnetic field, together with an alternating field applied via a primary winding. Due
to the fluxgate’s directional method of functioning, a single fluxgate cannot be utilised on
its own, as it cannot be held at a constant angle to the earth’s magnetic field.
Gradiometers therefore have two fluxgates positioned vertically to one another on a rigid
staff. This reduces the effects of instrument orientation on readings. Fluxgate
gradiometers are sensitive to 0.5nT or below depending on the instrument. However, they
can rarely detect features which are located deeper than 1m below the surface of the
ground.
A single Geoscan FM36 fluxgate gradiometer (plate 9) was used to carry out a
magnetometry survey employing 1m parallel traverses with 0.25m sample intervals. The
total area of the site surveyed is approximately 1.0ha (2.5 acres) comprising an irregular
area which were of particular interest to the Client. The distribution strategy and
emplacement of the survey grids across the field was discussed with the Client, but
follows general protocols found acceptable by English Heritage.
Plate 9. Magnetometer survey (Geoscan FM256 fluxgate gradiometer) being conducted by Rob
Shippey. This is a passive instrument which records changes in magnetic field across
archaeological features. Ditches and pits give a positive response whereas stone (but not brick)
gives a negative response.
Archaeological features such as brick walls, hearths, kilns and disturbed building material
will be represented in the results, as well as more ephemeral changes in soil, allowing the

Geophysical Survey of St. Leonard’s Medieval Hospital Prepared for North Tyneside Council
TimeScape Surveys Report Number 123-11 14 Copyright Reserved
location of foundation trenches, pits and ditches to be found. Results are however
dependent on the geology of the particular area, and whether the archaeological remains
are derived from the same materials. Around 1.0 hectares can be surveyed each day.
Data points taken per 20m grid totalled 1600 readings.
4.4 Resistivity Survey
Resistivity survey is based on the ability of sub-surface materials to conduct an electrical
current passed through them. All materials will allow the passing of an electrical current
through them to a greater or lesser extent. There are extreme cases of conductive and
non-conductive material, but differences in the structural and chemical make-up of soils
mean that there are varying degrees of resistance to an electrical current.
Plate 10. Geoscan RM15 resistance meter in use by students Sarah, Isabel and Laura, using a
dual probe configuration and 1.0m mobile probe separation.
The Geoscan Research RM15 Resistance Meter in twin electrode probe formation
represents the most popular configuration used in British archaeology (plate 10), usually
undertaken with a 0.5 or 1.0m separation between mobile probes. Details of survey
methodology are dealt with elsewhere but in this instance 1.0m probe intervals were
chosen, with 1m traverses and 0.5m sample intervals.

Geophysical Survey of St. Leonard’s Medieval Hospital Prepared for North Tyneside Council
TimeScape Surveys Report Number 123-11 15 Copyright Reserved
The technique relies on the passage of an electrical current from probes into the earth to
measure variations in resistance over a survey area. Resistance is measured in ohms (Ω),
whereas resistivity, the resistance in a given volume of earth, is measured in ohm-metres
(Ωm). Four probes are generally utilised for electrical profiling, two current and two
potential probes. Survey can be undertaken using a number of different probe arrays. The
twin probe array was used for this survey.
A number of factors may affect interpretation of twin probe survey results, including the
nature and depth of structures, soil type, terrain and localised climatic conditions.
Response to non-archaeological features may lead to misinterpretation of results, or the
masking of archaeological anomalies. A twin probe array of 0.5m will rarely recognise
features below a depth of 0.75m. More substantial features may register up to a depth of
1m, although the 1.0m array used in this survey may have increased that depth.
Although changes in the moisture content of the soil, as well as variations in temperature,
can affect the form of anomalies present in resistivity survey results, in general higher
resistance features are interpreted as structures which have a limited moisture content,
for example walls, mounds, voids, rubble filled pits, and paved or cobbled areas. Lower
resistance anomalies usually represent buried ditches, foundation trenches, pits and
gullies.
5.0 THE SURVEY RESULTS
5.1 Introduction
To simplify what is a complex report the maps, the survey figures and their derivative
anomaly plans are contained within Appendix 1, the figure numbers are prefixed (such as
fig. 1 etc.). Within the main body of the text, additional descriptive figures are included
where they will be useful to illustrate either equipment or specific items of text. The results
section endeavours to highlight as many anomalies as possible. This has been formulated
in such a way as to assist in the identification of archaeological features for future
excavation purposes. In many instances only the type, morphology and dimensions of the
feature are indicated, all of which can be georeferenced. The overall significance of the
results is brought together in the discussion section (section 6), where an overview of the
two survey methods is evaluated.
The known archaeological features are indicated superimposed upon an O.S. base map
(fig. 9). These include the remains (if any) of Spital Cottage I, which was seen on the 1860
O.S. map and demolished some time shortly afterwards (see plate 5). Elements of this
may now lie beneath the embankment of King Edward Road which has been widened and
straightened. Its replacement built in the 1860s originally as Spital Cottage (II) and more
latterly as Park Cottage was demolished in the 1960s although some residual boundary
Geophysical Survey of St. Leonard’s Medieval Hospital Prepared for North Tyneside Council
TimeScape Surveys Report Number 123-11 16 Copyright Reserved
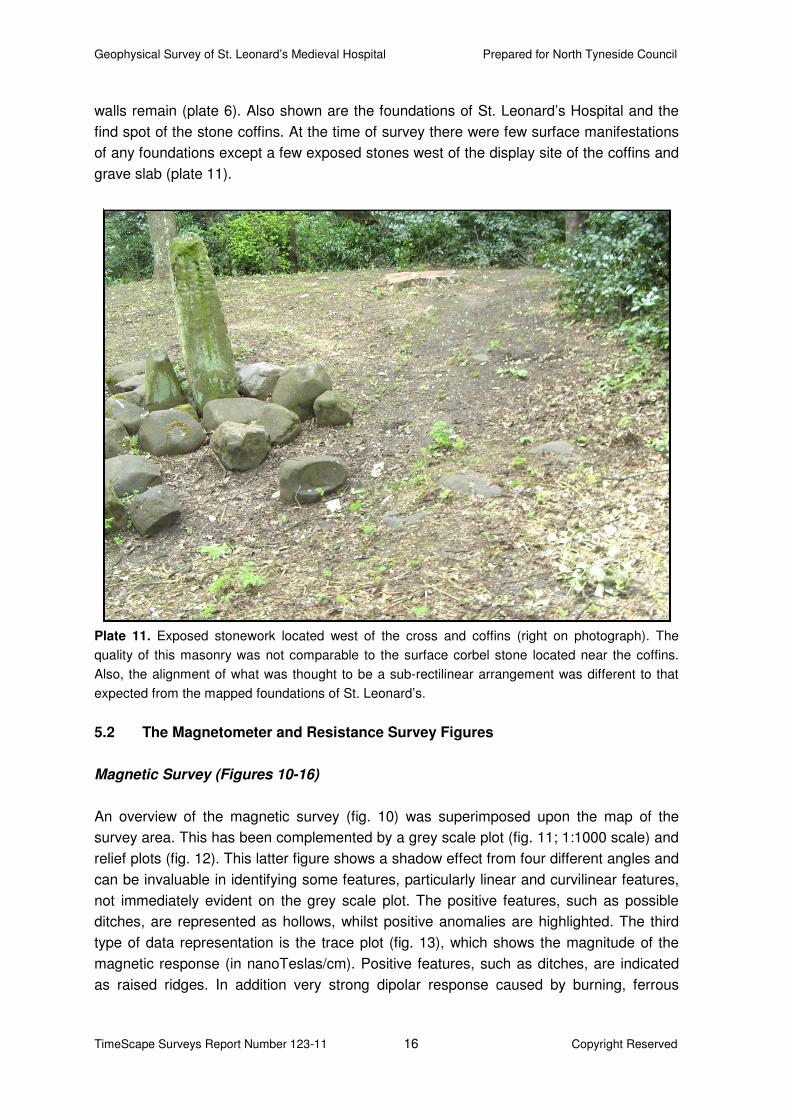
walls remain (plate 6). Also shown are the foundations of St. Leonard’s Hospital and the
find spot of the stone coffins. At the time of survey there were few surface manifestations
of any foundations except a few exposed stones west of the display site of the coffins and
grave slab (plate 11).
Plate 11. Exposed stonework located west of the cross and coffins (right on photograph). The
quality of this masonry was not comparable to the surface corbel stone located near the coffins.
Also, the alignment of what was thought to be a sub-rectilinear arrangement was different to that
expected from the mapped foundations of St. Leonard’s.
5.2 The Magnetometer and Resistance Survey Figures
Magnetic Survey (Figures 10-16)
An overview of the magnetic survey (fig. 10) was superimposed upon the map of the
survey area. This has been complemented by a grey scale plot (fig. 11; 1:1000 scale) and
relief plots (fig. 12). This latter figure shows a shadow effect from four different angles and
can be invaluable in identifying some features, particularly linear and curvilinear features,
not immediately evident on the grey scale plot. The positive features, such as possible
ditches, are represented as hollows, whilst positive anomalies are highlighted. The third
type of data representation is the trace plot (fig. 13), which shows the magnitude of the
magnetic response (in nanoTeslas/cm). Positive features, such as ditches, are indicated
as raised ridges. In addition very strong dipolar response caused by burning, ferrous

Geophysical Survey of St. Leonard’s Medieval Hospital Prepared for North Tyneside Council
TimeScape Surveys Report Number 123-11 17 Copyright Reserved
material such as pipelines and brickwork give massive response, often beyond the upper
sensitivity of the instrument. In this case the tops of the peaks are flattened.
After analysis of the data, a derivative anomaly was produced (fig. 14) which, for
comparative purposes, showed the relationship between the grey scale plot and the
anomalies derived from all three data representation methods (grey scale, trace and relief)
at a scale of 1:1000. The enumerated anomaly plan (fig. 15) is shown at scale of 1:500.
Finally the plan is shown georeferenced to the O.S. base map (fig. 16).
It should be noted that the anomaly plan is not an interpretive plan in the sense that
features are characterised morphologically; it is probably best described as a schematic
representation of anomalies. Although this can be a succeeding derivative stage on some
sites, in general it is technically unsafe to do so at many others. A site like
Northumberland Park is not isolated and is therefore likely to bear the imprint of centuries
of land use. This will be represented in the geophysical record as a palimpsest of features,
some of which will be truncated, or even totally degraded. It is also not practicable to
indicate all anomalies so some will be grouped together as amalgamated areas.
Earth Resistance Survey (Figures 17-25)
The resistance survey results were represented in a similar manner to the magnetic
survey data, except that in most instances a reverse palette was used so that features
such as ditches (low resistance) appeared dark as in the magnetic survey. An overview of
the resistance survey (fig. 17) was superimposed upon the map of the survey area. In
addition a grey scale (fig. 18; 1:1000 scale) and relief (fig. 19), and trace plots (fig. 20)
were produced. The trace plot shows the magnitude of the response in ohms/metre. The
grey scale plots show low resistance features with black colouration, whilst high
resistance is indicated by grey.
A derivative anomaly was produced from the resistivity survey data (fig. 21) which, for
comparative purposes, showed the relationship between the grey scale plot (reverse
palette) and the anomalies derived from all three data representation methods (grey scale,
trace and relief) at a scale of 1:1000. The enumerated anomaly plan (fig. 15) is shown at
scale of 1:500. Finally the plan is shown georeferenced to the O.S. base map (fig. 16).
Low resistance features can indicate features such as wells, ditches and pits, but high soil
moisture conditions, often caused by biological or geological factors can significantly
influence the magnitude of the readings. Likewise, high resistance features can indicate
masonry, brickwork paving and roads, but also areas of naturally high resistance such as
rock outcrops, very dry conditions caused by well-drained surfaces or biological factors
such as trees which remove massive amounts of water from the soil. A large oak tree can
remove 40,000 gallons (151,000 litres) per year, and this effect can be relatively localised
(as a rule of thumb the tree canopy). Changes of slope also affect drainage and the net

Geophysical Survey of St. Leonard’s Medieval Hospital Prepared for North Tyneside Council
TimeScape Surveys Report Number 123-11 18 Copyright Reserved
soil moisture deficit, as well as proximity to water sources, can all affect resistance
readings. In these figures ridges or high points would almost always show as high
resistance values, regardless of the sub-surface composition. It follows that the
interpretation of results from non-planar sites is far from straightforward.
The two data set showing the magnetic and resistance anomaly overviews (figs. 16 and
23) are shown together for comparative purposes (fig. 24). The comparative data is
discussed within the results section where complementary data from each technique is
highlighted. The complex relationship between the two surveys is shown when the
resistance anomaly plan is superimposed directly over the magnetic plan (fig. 25)
The final figure (fig. 26) shows the suggested emplacement of excavation trenches over
those anomalies thought to be most promising. In doing so proximity, where possible, to
the extensive tree canopies (and associated roots) was avoided. A previous topographical
survey conducted by Landform Surveys Ltd. was used (not shown) to provide this
information. The final figure (27) was a digital map showing possible trench locations and
datum points
The excavation started before the completion of this report, and occasionally images of
aspects of the excavation are used to illustrate the nature of magnetic or resistance
responses. However, the excavation findings are not taken into account in the
assessment and analysis of the geophysical survey.
5.3 The Magnetometer Survey Results (Figures 10-16)
As a rule, positive linear anomalies (in magnetic survey) are generally ditches and circular
ones probably indicate pits. More intense positive anomalies may indicated burning, or
possibly fired clay (bricks, tiles kilns), but this group may at times have strongly dipolar
components. Negative anomalies indicate the absence of clay minerals, which is generally
taken to be masonry, cobbles, or some other non-clay (or soil) composition. Thus, the
term linear rectilinear anomaly would probably indicate building foundations. Naturally,
exceptions exist and are indicated. In should be noted that it is often the more subtle
anomalies which indicate older archaeological features.
The area of Spital Cottage I and buildings associated with it (see fig. 9) was to be
investigated, although it is understood that Trench 6 (see figs. 26 & 27) originally placed in
this area was moved a few metres to the south and east. Near the northern apex of the
survey a diffuse positive response (ditches or anaerobic conditions) is associated with
negative rectilinear anomalies which could indicate stone building foundations (figs. 15 &
16, anomaly m1). A few strongly dipolar anomalies were associated with these responses.
Within that same area a pair of large conjoined anomalies (fig.2), encompass an area
some 4m square. This large response (+164 to -194nTeslas) is entirely compatible with
burning and ferrous slag (see (plate 12), and is an effect often associated with older

Geophysical Survey of St. Leonard’s Medieval Hospital Prepared for North Tyneside Council
TimeScape Surveys Report Number 123-11 19 Copyright Reserved
buildings. Towards the east, a number of large positive anomalies, similar in morphology
to pits, are seen to be associated with the foundations (m2). The magnitude of the
responses (maximally 20-25nTeslas) suggests either very deep anaerobic pits or more
likely refuse pits containing slag or ceramic material.
Plate 12. This heavy iron rich slag was removed from trench 6 close to Spital Cottage I. It exhibited
a strongly magnetic response (54 nanoTeslas). This was only a small piece of the material; the
much larger complex would have produced a significantly greater response.
Closer to the park entrance is a massively magnetically disturbed area some 30m east-
west and 20m north-south (m3). This is close to the site of the former public toilet which
would probably have had ferrous pipe-work, reinforced concrete and brick associated with
it. Surface indications show cast iron covers and brick access hatches; all of which are
highly responsive and would tend to mask any archaeological features. The magnitude of
the response can be seen on the trace plot (see plate 13).
Plate 13. An example of a large ferrous pipe, probably a water main, is shown here in an arable
field. A truncated example is seen as part of the complex anomalous response near the park gates
(m3). Each section of steel pipe when welded together creates a bar magnet, hence to distinctive
‘zebra-crossing’ effect. This type of response swamps nearby lesser archaeological effects.

Geophysical Survey of St. Leonard’s Medieval Hospital Prepared for North Tyneside Council
TimeScape Surveys Report Number 123-11 20 Copyright Reserved
The area just north of the site of Spital Cottage II (c. 1860- 1960) also gave a very strong
response commensurate with burning, brick rubble, ferrous material, and iron pipes. The
excavation trench (Trench 2; 8m x 5m) was placed over a much ‘quieter’ area directly
south of this which showed linear negative and some stronger positive responses (see
plate 14). The positive responses (c. 20-35nTeslas) were much too intense to indicate a
trench, but did suggest elements of burning or ceramic material (bricks), possibly latterly
used as hardcore (m4).
Plate 14. This image of Trench 2 shows the eastern wall of the Spital Cottage II, the response from
which may have been swamped by non-specific interference. This showed as a very disturbed area
with the magnetic survey. The bricks used as hardcore and drains would have contributed to this
responses.
A cluster of highly responsive apparently discreet anomalies (m5) are spread over a area
of some 30m by 10m. However, these features when seen on the trace plot (fig. 13) may
indicate a linear feature some 30m in length, which is aligned almost east-west, extending
as far as the modern path. This is not typical of a modern ferrous pipe as seen in plate 13,
but may indicate fragmentary elements of an iron pipe or ceramic material, although the
spread of responses is quite wide for such linear structures. A small (5m) square
rectilinear positive anomaly may be present towards the western end of this complex.

Geophysical Survey of St. Leonard’s Medieval Hospital Prepared for North Tyneside Council
TimeScape Surveys Report Number 123-11 21 Copyright Reserved
Plate 15. The diagram shows the effect of a ditch or linear feature when it acts as a bar magnet. In
this instance (anomaly m6) the positive (black) response has a lesser return flux (white) giving the
impression of two features.
Near to the flanking northern footpath which delineated the edge of the survey was a
linear feature (see fig. 16) which ran parallel with it (m6). This feature was some 34m in
length and produced a ditch-like response, with a wall type response immediately
adjacent to it. In reality it is probably a ceramic drainage pipe, probably associated with
anaerobic (wet) conditions. The positive element of the response reaches +50nTeslas,
whilst the negative response is as high as -19nTeslas. Although this effect occurs all over
the site it is probably worthwhile explaining why this happens in the next paragraph. It is
not certain whether or not this feature continues across the path to connect with a number
of parallel linear anomalies (m7) which may indicate the location of drainage channels.
The age of these features is unknown.
The response discussed previously is shown in plate 15A & B, (c. 55°) where the feature
behaves as a bar magnet which gives a dipolar response (plate 16). The magnetic circuit’
is completed by the return flux (plate 15C), which is of opposite polarity to the magnet.
Every positive magnetic anomaly has a lesser negative anomaly beside it. Because of the
angle of dip, more of the return flux is exposed on the north side. Another effect of the
angle of dip is to displace the anomaly slightly to the south (see plate 16). This effect
disappears at the magnetic North Pole and is maximal at the Equator (Clark 1990, 82-3).

Geophysical Survey of St. Leonard’s Medieval Hospital Prepared for North Tyneside Council
TimeScape Surveys Report Number 123-11 22 Copyright Reserved
Plate 16. Diagrammatic
representation of the
magnetic field of a themo-
remanently (permanent
magnetism after firing)
magnetized ceramic pipe.
Note the angle of dip
(inclination), which will cause
the maximum response of the
anomaly to be displaced
towards the south. The
parallel lines represent the
Earth’s field whilst the curved
red lines force induced in the
field of the ceramic pipe are
curved (after Clark 1990, fig.
50).
The linear feature (m6 & m7) appears to cross a positive circular feature some 8m in
diameter (m8). It is tempting to ascribe a prehistoric origin to the response such an Iron
Age hut circle (700BC – 200AD); however there are no other corroborating features such
as a defensive rectilinear ditch. A linear positive anomaly (m9) runs east west for some
20m before changing direction and heading downslope, for a similar distance, north-east
towards the responsive linear anomaly (m6). The maximal response of this anomaly (c.
11nTeslas), may indicate a drainage ditch or channel, which is apparently less well
preserved or responsive after the turn north. Whether this complex of positive linear
anomalies (m6, m7 & m9) is linked is uncertain. They may however derive from a
perceptible rectilinear feature (m10), which appears to be some 16m long and 4m wide
(plate 17). It appears to be a series of interlinked pits or possible post-holes, perhaps
indicating a wooden building, with perhaps a hearth towards the northern end. In reality
the feature lies over the remains of a curvilinear footpath of which only part remains, so it
may just be a fortuitous alignment of (partially?) non-archaeological anomalies. This
anomaly will be discussed later in the context of the site of the remains of St. Leonard’s
hospital.

Geophysical Survey of St. Leonard’s Medieval Hospital Prepared for North Tyneside Council
TimeScape Surveys Report Number 123-11 23 Copyright Reserved
Plate 17. Schematic representation of anomaly m10 showing an apparent structure some 16m
long and 4m wide. This feature does however, in part, overlie the remains of vestigial footpath.
Towards the extreme western edge of the survey, few distinctive anomalies were
identified, although the faint sub-rectilinear positive anomalies (possible stone) were
detected (m12). These responses, although faint, may have potential for future
investigations as they are aligned on the known configuration of St. Leonard’s
foundations. The ground level in that area is higher than that towards the east and may
not have been landscaped.
Plate 18. The excavation viewed from the north (trench 1) across anomaly m12 revealed a paved
area at no great depth, flanked by boulders and apparently forming part of shallow foundations.
Some of these anomalies remain buried beneath the cross base and surface boulders.

Geophysical Survey of St. Leonard’s Medieval Hospital Prepared for North Tyneside Council
TimeScape Surveys Report Number 123-11 24 Copyright Reserved
Near to the display site of the stone coffins and grave slab were found some intense
magnetic anomalies which were rectilinear in shape (m12). The dimensions were some
9m east-west and 7.5m north-south with maximal responses of +75 to -62nTeslas. That
sort or response would tend to indicate burning (i.e. hearth), ferrous material or ironstone
impregnated material. Boulders were present as a surface collection, some of which may
have been glacial igneous erratics which also give a magnetic signature (plate 11). The
material uncovered (plate 18) shows a paved area which may have been disrupted by tree
roots, but the surface manifestations (see plate 11) appear to be all that remains of the
foundations. Some anomalies remain buried beneath the cross base and surface
boulders, although magnetic scanning of these rocks may be useful to determine their
contribution to the overall response.
South-east of this complex and beneath the coffins and grave slab was a positive
rectilinear anomaly (m13) which had a strongly positive ovoid feature in the centre
(18nTeslas). This diffuse anomaly, which is aligned south-east and may have some
residual stone components, has dimensions of 5m by 2.5m, which, if it were the
foundations of a building, would perhaps indicate a small, possibly wooden structure,
within a trench. This feature is not set along the accepted alignment seen on O.S. maps
for the foundations of the hospital.
Plates 19 & 20. Two views of the excavation near the approximate location of Trenches 4 and 5.
The foundations are both unsophisticated, close to the surface and fragmentary. This would explain
the response seen from anomaly m14, which is slight.
Continuing east some very indistinct anomalies (m14) suggest the faint outline of building
foundations as seen on the O.S. plan, but indicate an insubstantial response. Little in the
way of stonework in the form of negative anomalies appears to be visible. These
anomalies stretch for some 25m east-west and 8m north-south. They are interrupted at
the eastern end by a large dipolar anomaly (probably modern ferrous interference) which
overlies the remnants of a tarmac path. Further indistinct anomalies continue towards the
east for 20m (m15). Both these features are set upon the perceived alignment of St.
Leonard’s foundations but exhibit very little by way of negative anomalies; a general

Geophysical Survey of St. Leonard’s Medieval Hospital Prepared for North Tyneside Council
TimeScape Surveys Report Number 123-11 25 Copyright Reserved
indication of stone foundations. Trenches T4 and T5 (see plates 19 & 20) show how
insubstantial the remains are, with concomitant loss of response.
Plates 21. Human femur (left) and skull with associated finger bones (right). This formed a group of
burials. No pit is evident and such remains would be almost invisible to geophysical survey.
Running parallel with the modern tarmac footpath for much of its length), but in all for
some 80m, is a linear positive feature (m16). This feature is located some 3m south of the
footpath and appear to mirror its course. It seems to start on the level ground at one of the
highest points on the site at the location of a number of faint positive and dipolar
anomalies (m17). The eastern terminus of this linear feature (m16) lies towards the
bottom of the slope; possibly linking with what might be a drainage ditch or channel (m 7).
A number of magnetically active, but discrete areas were detected towards the southern
edge of the survey (m18). The aetiology is unknown, although they may indicate pits, but
are too large to indicate individual inhumations. This is the area where the coffins were
found in the 1870s and further human remains were found in this location, significantly at
no great depth below the surface3. Those seen would have been almost indistinguishable,
as a magnetic response, from the surrounding soil matrix.
3 Examination of the medieval cemetery at Barton-on-Humber suggest the modern practice of
burying bodies at depths of 6 feet did not occur in medieval or immediate post-medieval periods;
much shallower depths were used, nor were the graves spaced regularly in grids with headstone
markers (Rodwell and Rodwell 1982, 2843-315).

Geophysical Survey of St. Leonard’s Medieval Hospital Prepared for North Tyneside Council
TimeScape Surveys Report Number 123-11 26 Copyright Reserved
Two curvilinear positive anomalies (m19) may indicate the presence of ditches, although a
geological effect cannot be excluded. These are located towards the edge of an
embankment where differential drainage can occur. This may affect the REDOX potential
of the soil thereby affecting the anaerobic activity and resulting in changes in magnetism.
This effect is discussed in more detail in appendix 2.4 The final group of annotated
magnetic anomalies (m20) present as a group of amorphous ovoid and circular positive
anomalies, which show no distinguishing morphological characteristics.
Plate 22. Small drainage channel which, although it did not have any associated material to
confirm its origin, is probably medieval. This feature was identified by the survey, just south of
anomaly m14.
Many other anomalies are present on site such as faint linear anomalies which may
indicate small drainage ditches or channels (plate 22) and small pits. Some of these
features may be of archaeological origin and significance, but are too numerous to identify
individually.
4 Reduction-oxidation potential (REDOX), is a measure of the tendency of a chemical species to
acquire electrons and thereby be reduced. Reduction potential is measured in volts (V), or millivolts
(mV). In geological terms this is usually a seasonal effect caused by wetting and drying of soils. In
winter anaerobic (low oxygen) levels are common, causing fermentation reactions which enhance
magnetic susceptibility; hence the high positive readings of some waterlogged ditches and pits.

Geophysical Survey of St. Leonard’s Medieval Hospital Prepared for North Tyneside Council
TimeScape Surveys Report Number 123-11 27 Copyright Reserved
5.4 The Earth Resistance Survey Results (Figures 17- 24)
The earth resistance survey was conducted over essentially the same area as the
magnetic survey. The anomalies in this instance are prefixed by (r), although only in the
text, not the figures. Depending as it does upon soil moisture and the electrolytes within
the soil, this methodology gives no response at all (open circuit) to features such as paths
or exposed rock. In this section it is intended to follow the same ‘pathway of anomalies’ as
the magnetic survey, but to also illustrate where the methods produce complementary
data.
In the extreme north of the survey, near the location of Spital Cottage I and associated
buildings, two large high resistance anomalies (r1) were detected (figs. 22 & 23). Both had
very strong positive responses, maximally +800ohms and a rectilinear outline suggesting
some sub-surface features (plate 23). It should be noted that there were surface
exposures of rocks and decorative flower beds in this area. The diffuse low resistance
areas were seen on the grey scale plots (see fig. 17, black on plot), but for clarity these
have been omitted from the anomaly plans. These values were in the region of -210ohms
and indicate where some natural drainage channels may be present. It was from the
trench in this area that the iron-rich slag was removed (plate 12).
Plates 23. Trench 6 (relocated slightly south-east) shows significant stonework. It was from this
trench that the slag was removed and would have produced the exceptionally high magnetic
readings. This band of slag (dark feature) would have had different resistance properties to stone.
Other factors would have contributed to the high resistance reading such as near surface stone for
the rock feature.

Geophysical Survey of St. Leonard’s Medieval Hospital Prepared for North Tyneside Council
TimeScape Surveys Report Number 123-11 28 Copyright Reserved
A curvilinear medium-high resistance feature (r2) is located south of the Spital Cottage I
area. With the eye of faith this feature can be extrapolated further west to join a high
resistance curvilinear feature (r3). Neither presents a convincing case for the remains of a
curvilinear precinct wall, but their presence should be noted. The north-western sector of
the survey covered that area close to the demolished toilet block, iron pipes, inspection
covers etc. Not surprisingly some very high resistance values were detected (r4) in this
area (see also fig. 16, anomalies m3 & m4). Most of these, however, probably relate to
relatively modern interference. By contrast, the highly magnetically active area (m4) in the
vicinity of Spital Cottage II produced a very subdued resistance response (r5) which
probably corresponded to the wall foundations seen in plate 14.
Two narrow curvilinear linear features were detected (r6) which link with the linear positive
magnetic anomaly (m9). Taken together these features indicate interlinked drainage
channels or ditches (see comparative anomaly plans, fig 24). This relationship however
can be seen more readily when magnetic anomalies are superimposed upon the
resistance anomalies, (fig. 25), albeit providing a very complex overview. A second low
resistance linear anomaly (r7) may form part of the same system. Interestingly, two
drainage channels, if that is what they are, emanate from the putative building detected in
the magnetic survey (m10 and see plate 17). Directly east, and possibly adjacent to the
‘building’ (m10) is a sub-rectilinear high resistance anomaly (r8), with some evidence that
a fainter feature continues south across the modern path.
At the eastern edge of the survey a number of indeterminate high resistance anomalies
were detected (r9). Some linear characteristics were resolved, although a linear low
resistance feature (small ditch?) traversed the circular anomaly detected in the magnetic
survey (m9). There is insufficient evidence to conclusively suggest foundations.
At the extreme western edge of the survey area a number of high resistance anomalies
were detected (r10). Some of these anomalies had linear characteristics but were not
placed along the perceived alignment of St. Leonard’s foundations. Nevertheless, as
stated earlier, this is an area of ground which appears not to have been landscaped (or
levelled) and does have a number of non-specific magnetic anomalies including some
narrow ‘drainage channels’ (m11).
The area near the stone coffins proved to be a complex area (r11), in which small areas of
dummy readings (surface stonework) were taken. It is no surprise that the raised ridge
next to the relict footpath gave a high resistance reading (+205 ohms; good drainage and
dry). Subsequent excavation did not reveal any stonework in that location. A few metres
south-east of that ridge another area of moderately high resistance (+50 to +89 ohms)
indicated the location of the flagstones (see plate 18). Given the good state of
preservation this was a rather low resistance value; a point which should be noted for
future surveys. A T-shaped narrow linear low resistance anomaly is associated with these
anomalies, although this may extend towards the north-east as a sub-rectilinear feature.

Geophysical Survey of St. Leonard’s Medieval Hospital Prepared for North Tyneside Council
TimeScape Surveys Report Number 123-11 29 Copyright Reserved
The significance is unknown, but drainage, natural or anthropogenic is a possible
explanation.
Plate 24. Two photographs of the exposed cobbles and possible foundations in the area of the
western high resistance anomaly. A high resistance response is entirely compatible to such a
configuration, and has been seen on other sites where similar features have been exposed.
Moving directly east from the coffin area two high resistance areas were detected
associated with narrow low resistance linear anomalies (r12). Given that these anomalies
were located along the line of the foundations exposed in the Victorian period, a possible
area of flooring or path was suspected (plate 24). In one instance this assessment proved
to be correct, whilst at another sondage the exposition revealed a very dry compact clay
surface with no significant archaeological features. In this latter case the proximity
(transpiration and evaporation) of a large tree may have caused this effect.
North-east of the anomaly r12 are a group of small, indistinct high resistance rectilinear
features (r13). These are small in size with what appears to be a flanking ditch to their
south, with dimensions ranging from 2-4m. Their presence should be noted, as a ditch or
channel (m17), detected with the magnetic survey, appears to run past them. When these
features are combined (see plate 25) the resistance anomalies may take on a new
significance; two at least appear to have positive magnetic interiors, which is often the
response associated with a stone building. It is probably now appropriate to illustrate this
relationship on a site which has been well preserved. One such case, illustrated in the
Discussion section, is the Roman fort and settlement at Maryport, Cumbria, where
extensive survey was conducted between 2000-2010.

Geophysical Survey of St. Leonard’s Medieval Hospital Prepared for North Tyneside Council
TimeScape Surveys Report Number 123-11 30 Copyright Reserved
Plates 25. Comparison of the magnetic and resistance responses across anomaly r12. As
separate responses they look unremarkable but, when combined, the rectilinear high resistance
responses appear to have a central positive rectilinear magnetic response; often the signature of
stone buildings. The ‘ditches’ or ‘channels’ also take on a new dimension as they appear to be
linked. That is not to say that they are necessarily significant archaeological anomalies, but their
presence must be noted.
Next to the southern footpath a number of linear low resistance anomalies were found
beside a wide high resistance anomaly (r14). The latter feature may be caused by a
simple geological effect; drying of the ground surface near a well-drained embankment.
This effect has been described earlier and is a common occurrence on other sites. That is
not to say that there are never archaeological features such as walls beneath earthworks,
there often are, but it is not likely in this case. A number of more discrete high resistance
anomalies were located just few metres north of this larger feature, possibly associated
with a curvilinear low resistance anomaly some 20m long.
Moving further east, the most notable feature appears to be a large rectangular low
resistance area some 6m by 10m (r15) which appears to have a number of ‘feeder’ low
resistance anomalies. From there a ‘channel’ may link with the sinuous low resistance
feature north of the public footpath (r6). It would be tempting to ascribe an archaeological
function to this feature, although it may only be a low spot on the plateau which is part of
the natural drainage system. That said, in the composite anomaly plan (fig. 25), the two
linear positive magnetic anomalies (m16 & m17), tentatively described as drainage
channels, also connect with this feature creating what might be a complex drainage
feature. A number of sub-rectilinear low resistance anomalies surround this feature, but
their significance is unknown.

Geophysical Survey of St. Leonard’s Medieval Hospital Prepared for North Tyneside Council
TimeScape Surveys Report Number 123-11 31 Copyright Reserved
A number of diffuse high resistance anomalies (r16), including a broad curvilinear band,
are probably caused by geological factors. The curvilinear band is located on the edge of
a steep bank leading down to the footpath some 3-4m below. The northern side is
similarly placed with a steep bank leading down to a footpath; again this would cause a
net soil moisture deficit (plate 26). It should be noted that the ‘drainage’ feature was also
seen with the magnetic survey (m16).
Plates 26. Trench 3 viewed from the north (left) and from the south (right). Very little has been
revealed which could be described as masonry, paving, cobbles or indeed anything relating to solid
geology. The ridge on which these anomalies were located and the presence of trees may have
dried the soil differentially.
Moving to the extreme east of the survey where two footpaths join, the land is raised
significantly above the surface of the path, suggesting a degree of landscaping. Certainly,
large, imported stone boulders have been use as an edge to the southern path to create a
sheltered dell, presumably to support a fernery. Regular blocks of stone have been
incorporated and appear to be ashlar masonry, some of which have lewis holes5. Although
there are some interesting high resistance features (r17) in this area, they may be a result
of ornamental stone work, differential dry conditions and drainage. Although this is the
final resistance anomaly to be discussed there are many slighter, less obvious features
which may well have archaeological potential. The implications of the survey are
5 A lewis is one of a category of lifting devices used by stonemasons to lift large stones into place
with a crane, chain block, or winch. It is inserted into a specially prepared hole, or seating, in the
top or side) of a stone, directly above its centre of mass. It works by applying principles of the lever
and uses the weight of the stone to act on the long lever-arms which in turn results in a very high
reaction force and friction where the short lever-arms make contact with the stone inside the hole
and thereby prevents slipping. The three-legged lewis or St Peter's were used in Roman and
medieval times. An alternative method working on a similar principle is to use two countersunk
holes and a curb lifter.

Geophysical Survey of St. Leonard’s Medieval Hospital Prepared for North Tyneside Council
TimeScape Surveys Report Number 123-11 32 Copyright Reserved
illustrated in the next section (Discussion) where the broader implications of the
investigation are examined.
6. DISCUSSION
At the outset of the field reconnaissance before the survey was conducted, it was
recognised that some landscaping had occurred. The major land clearance, and it must
have been substantial in places, would have occurred during the construction of the Park
in the late 1800s. This would have meant the creation of paths and the grotto-like walkway
towards the south of the survey area; all of these would have resulted in significant
removal of the land surface. It is not known what landscaping occurred on the plateau
where the hospital was located, but the surrounding flower beds all appear to be raised.
The modern interference in the park comprised the remains of iron benches, toilet blocks,
manhole covers, paths, demolished buildings, iron service pipes and brick inspection
chambers, together with physical obstructions such as trees, hedges and vegetation.
Those were just the visible objects. The surveyors (some 31 individuals), entirely
comprised of volunteers, most with little experience of the methodology, produced a
technically sound survey in difficult conditions. At first sight the results looked
disappointing, particularly over those areas where the foundations of St. Leonard’s
Hospital were thought to lie. That substantial remains were not present was evident
almost as soon as the data was downloaded.
It should be noted that previously excavated foundations and buildings do not provide a
spectacular contrast between foundations and their surroundings. This is particularly
evident with magnetic survey. The reason for this that when buildings have been
excavated, the interior material which generally exhibits a relatively strong magnetic
response, which may have developed anthropogenically (human interference) over
centuries or millennia, is returned in a mixed random manner from the spoil heap. Thus,
the magnetic contrast is lost and the negativity of stonework (caused by the lack of clay
minerals) does not stand out so clearly against a neutral background.
At this stage it might be useful to give an example of a well-preserved site where
complementary magnetic and resistance survey was conducted. Such a site is the Roman
fort and civil settlement at Maryport. Although the surface stonework has been robbed, the
survey indicated the well-preserved remains of large buildings (Biggins, J. A. and Taylor,
D. J. A., 2004b; Biggins et al 2011). This preservation has perhaps been an accident of
geography with the land being kept under pasture for many years. This in itself preserves
the features, whereas sustained deep ploughing will rapidly degrade such a site.

Geophysical Survey of St. Leonard’s Medieval Hospital Prepared for North Tyneside Council
TimeScape Surveys Report Number 123-11 33 Copyright Reserved
Plate 27. Magnetic and resistance grey scale plot showing a comparison of the magnetic and
resistance responses on a Roman archaeological site. This has been well-preserved under pasture
for many decades as a scheduled ancient monument. The composite grey scale plot shows the
magnetic survey superimposed over the resistance plot, emphasising the complementary nature of
the two techniques (Biggins et al 2011).
The magnetic survey, part of which is shown here (plate 27), illustrates a row of well
preserved buildings lining each side of a street leading from the fort, which is located
towards the south-west. The buildings are contained within their own burgage plots
defined by a ditch, with some having their own wells in these gardens. At least two phases
of construction are evident from the superseded field and ditch system. The resistance
survey proved to be complementary; whilst it did show buildings, the main feature was the
detection of a distinctive main road surface together with several minor roads branching
from it. A stone enclosure is thought to exist and is highlighted in the resistance survey,
with two low resistance features located within which are thought to be water storage
tanks. Excavation of this area in 1880 revealed two temples, since reburied, but detected
by the magnetic survey within the enclosure together with a an encircling ditch.
This brief snapshot of the individual methodologies shows how invaluable an integrated
approach to survey can be. For example, the Maryport resistance survey shows the main
road and the magnetic survey implies its presence by showing the bordering ditches.
What this does demonstrate is that the road is not as wide as the ditches, suggesting a
flanking footpath on each side. Given the urban setting of St. Leonard’, we were never
going to emulate such results; stone robbing here has been conducted on an industrial
scale. That and a Victorian penchant for ‘improvement’ militated against survival to any
meaningful degree.
Geophysical Survey of St. Leonard’s Medieval Hospital Prepared for North Tyneside Council
TimeScape Surveys Report Number 123-11 34 Copyright Reserved
When these two methods are superimposed, as we have done for the Northumberland
Park survey, the results still provide valuable insights in to the remaining archaeological
features. The survey report was not completed when the excavation was conducted,
although the results did suggest where the excavation trenches should be placed. These
were, by and large, positioned according those seen in figs. 26 and 27, with pragmatic
modifications made to avoid tree roots etc. This report was able to illustrate the
geophysical survey analysis with real-time observation of the excavation trenches.
Photographs of some of these trenches have been shown not to demonstrate the
significance of the archaeological features found per se, but to show how the survey
response was influenced by sub-surface features. It is not very often that this procedure is
conducted. Very often a geophysicist has no idea if the theoretical assessment of the
anomalies has any basis in fact.
The temptation to claim total prescience has been avoided, although most assessments of
the anomalies were decided before the excavation commenced. It should be stressed that
geophysical survey always works, but not in the way that one would always want (i.e. the
revelation of fantastic archaeological features), but all results are explainable scientifically.
The comparative analysis of the two methods has enabled some of the less obvious
relationships to be established such as the ‘interlinked drainage system’. This may be
entirely natural, caused by human intervention, or more likely a combination of both.
Some of these more subtle features, and they are subtle compared to the massive
responses of iron pipes, massive depositions of industrial slag and modern building
foundations, have been highlighted in this report. If there is to be an additional phase of
excavation, this geophysical survey has at least provided a template upon which to site
those trenches.
An important aspect of the project was the opportunity to observe the excavation, which
provides coincident data, photographs of which have been included in the geophysical
survey report. For instance, it was obvious that the Victorians had created a footpath
which encompassed the fabric of the foundations (fig. 5). Uncertainty however, existed
over precisely what was used in its construction. The excavation was able to show that
the A-horizon of the soil was comprised in part of cindery material. This would have
affected drainage and ultimately the geophysical response; this subject is discussed in
more detail in Appendix 2. Information like this provides a database of responses for
future survey assisting with the analytical procedure. Likewise the high resistance areas
near to a steep slope (less surprisingly) were shown to be physical and geological
responses, not archaeological features.

Geophysical Survey of St. Leonard’s Medieval Hospital Prepared for North Tyneside Council
TimeScape Surveys Report Number 123-11 35 Copyright Reserved
7. CONCLUSIONS
This investigation was funded by a Heritage Lottery Grant administered and implemented
by North Tyneside Council, and was always intended as a community led project
supervised by professional archaeologists. The geophysical survey was the second stage
in a process to evaluate the medieval hospital of St. Leonard’s. The initial stage
comprised a desktop assessment, followed by the geophysical survey, then the
excavation phase. Necessarily, the evaluations were sequential with little time between
phases. This was no bad thing for the volunteers as it allowed continuity between these
phases.
The survey objectives were twofold, namely to teach the basics of geophysical survey
fieldwork and basic interpretation and secondly to acquire survey data which would
indicate the location and degree of preservation of St. Leonard’s hospital and suggest
appropriate areas to excavate. In that respect, the survey achieved its objectives, even
though it became obvious that the degree of preservation was not as good as had been
hoped. Nevertheless, some meaningful data was collected and the more subtle and less
obvious anomalies may indicate where archaeological features have yet to be
investigated.
8. PROJECT ARCHIVE
8.1 Four appropriately bound hard (paper) copies of the complete document archive
together with copy disks of any electromagnetically stored or processed data will
be deposited with the Client. The receiving archive is Tyne and Wear County
Archaeologist.
8.2 As part of the OASIS project (Online Access to Index of Archaeological
Investigations) Tyne and Wear Archaeological Services would prefer that
information from developer-led projects is assimilated into a national online
database (http://ads.ahds.ac.uk/project/oasis). TimeScape and will comply with
this requirement after written confirmation is received from the Client. Upon
occasion there are very good reasons why information should not be available,
not least data covered by the Copyright Designs and Patent Act, 1988, or if
Client confidentiality is to be maintained. In this instance, the Client must give
specific permission to make the data public.
9. PUBLICITY, CONFIDENTIALITY AND COPYRIGHT
9.1 Any publicity will be handled by the Client (North Tyneside Council).

Geophysical Survey of St. Leonard’s Medieval Hospital Prepared for North Tyneside Council
TimeScape Surveys Report Number 123-11 36 Copyright Reserved
9.2 TimeScape will retain copyright of all documentary and photographic material
under the Copyright Designs and Patent Act, 1988, although they will grant an
exclusive licence to reproduce the data and images to the Client.
9.3 The maps are reproduced under TimeScape Ordnance Survey licence number
100030361, except the digital map (fig. 8) which is produced under North
Tyneside Council O.S licence number 100016801. Landform Surveys Ltd
(Newcastle) provided elements of additional survey, such as datum points and
tree canopy cover. Crown copyright is reserved.
10. STATEMENT OF INDEMNITY
All statements and opinions presented in this report arising from the programme of
investigation are offered in good faith and compiled according to professional standards.
No responsibility can be accepted by the authors of the report for any errors of fact or
opinion resulting from data supplied by any third party, or for loss or other consequence
arising from decisions or actions made upon the basis of facts or opinions expressed in
any such report(s), howsoever such facts and opinions may have been derived.
11. ACKNOWLEDGEMENTS
The authors are grateful for the funding offered by North Tyneside Council and their co-
operation in facilitating the clearing of vegetation and park furniture; this help was
invaluable. The co-operation of colleagues Jennifer Morrison and David Heslop from Tyne
and Wear Historic Environment Section was appreciated, including permission to use
material from the project design. Discussion with Richard Carlton and Alan Rushworth of
The Archaeological Practice Ltd. over aspects of the desktop assessment and their
generous co-operation during the excavation was invaluable. Thanks are extended to Mr
Eric Hinds of Landform Surveys Ltd for provision of their digital data of the landscape
survey from Northumberland Park.
Finally, without the splendid efforts of the volunteers the survey could not have taken
place; this is their survey and their report.
BIBLIOGRAPHY
Adamson, H. A., 1889, The Hospital of St. Leonard, Proceedings of the Society of Antiquaries
of Newcastle, Series 2, III, 35-6 (note).
Aitkin 1974, Physics and Archaeology, 2nd Edition. Clarendon Press, Oxford. 24-6,
Biggins, A., Robinson, J., Blau, S., and Denham, T., 1999, Report on Geophysical Survey
Muweilah, Sharjah, U.A.E. 1998, TimeScape Archaeological Surveys, England & The
Australian National University Canberra, Australia. TimeScape Unpublished Report.

Geophysical Survey of St. Leonard’s Medieval Hospital Prepared for North Tyneside Council
TimeScape Surveys Report Number 123-11 37 Copyright Reserved
Biggins, J. A., Robinson, J., Taylor, D. J. A., 1999, ‘Report on Geophysical Survey of the Fort
and Vicus at Carvoran Roman Fort, Northumberland’, Unpublished report for English Heritage.
Biggins, J. A, and Taylor, D. J. A., 2001a, ‘Report on Recent geophysical Survey at Carvoran
Roman Fort, Northumberland’ Britannia. 32, 330-2.
Biggins, J. A. and Taylor, D. J. A., 2004b, ‘The Roman Fort and vicus at Maryport: geophysical
survey, 2000 – 2004’, in R. J. A. Wilson and I, Caruana (eds.), Romans on the Solway,
CWAAS for the Trustees of the Senhouse Museum, Maryport, 102-133.
Biggins, J. A. and Taylor, D. J. A., 2004c, ‘A Geophysical Survey of Housesteads Roman Fort,
April 2003’, Archaeologia Aeliana, 33 51- 60.
Biggins, J. A., Strutt, K. D. and David J. A. Taylor, 2011, A Geophysical Survey of the
Extramural Settlement at Maryport – 2010, Hadrian’s Wall Archaeology, 2, 27-39.
Blau, S., Robinson, J., Denham, T. and Biggins J. A., 2000, 'Seeing through the Dunes:
Geophysical Investigations at Muweilah, United Arab Emirates', J. Field Arch. 27, No. 2, 117-
129.
Clark, A. J. C., 1990. ‘Seeing Beneath the Soil.’ Batsford, London.
Clay, M.R. 1909, The Medieval Hospitals of England, The Antiquaries Books.
Craster. H. E., 1907, History of Northumberland, vol. VIII. 259-260.
David, A., 1995, ‘Geophysical survey in archaeological field evaluation’. Ancient Monuments
Laboratory, English Heritage Society.
Knowles, D. and Hadcock, R.N., 1953, Medieval Religious Houses : England and Wales.
London. Longmans Green and Co.
Johnson G.A.L. (ed.), 1995, Robson's Geology of North East England, 2nd ed., Natural History
Society of Northumbria.
Jones, J. M., 1967, The geology of the coast section from Tynemouth to Seaton Sluice, Trans.
Nat. Hist. Soc. Northumb. Special Publication 79-86.
Landform Surveys Ltd, 2010, Northumberland Park: Topographical Survey, Report No.
LS6332.
Morrison, J., 2010. Northumberland Park, King Edward Road, Tynemouth: Project Design For
Archaeological Work, Tyne and Wear Archaeology Officer. (Unpublished).
Natural England, 2011, Tyne and Wear Geology,
http://www.naturalengland.org.uk/ourwork/conservation/geodiversity/englands/counties/area_I
D36.aspx
Rodwell, W. and Rodwell, K., 1982, St. Peter’s Church, Barton-upon-Humber, Antiquaries
Journal, 62, 283-315.
Taylor, B.J., Burgess, I.C., Land, D.H., Mills, D.A.C., Smith, D.B. & Warren, P.T., 1971, British
Regional Geology: Northern England, 4th Edition, NERC, HMSO.

Geophysical Survey of St. Leonard’s Medieval Hospital Prepared for North Tyneside Council
TimeScape Surveys Report Number 123-11 38 Copyright Reserved
APPENDIX 1
LIST OF FIGURES 39-65
1. O.S Location Map 1:50,000 39
2. Wood’s Plan of 1826 40
3. 1856 O.S. Map, Showing Spital Cottage I 41
4. 1861 O.S. Map; 1:2500 Scale 42
5. 1896 O.S. Map 1:500 Scale, Showing St. Leonard’s Foundations 43
6. 1898 O.S. Map Second Edition, Showing St. Leonard’s Foundations 44
7. Modern Map Showing Plan of Northumberland Park 45
8. Digital Map Showing 20m Survey Grid 46
9. Map Showing Archaeological Features 47
Magnetic Survey Figures
10. Magnetic Survey: Grey Scale Plot Overview; Scale 1:1000 48
11. Magnetic Survey: Grey Scale Plot; Scale 1:1000 49
12. Magnetic Survey: Relief Plots; Scale 1:2000 50
13. Magnetic Survey: Trace Plot; Scale 1:1000 51
14. Magnetic Anomaly Plan & Grey Scale Plot; Scale 1:1000 52
15. Magnetic Anomaly Plan - Annotated; Scale 1:500 53
16. Magnetic Anomaly Plan - Annotated Overview; Scale 1:1000 54
Resistance Survey Figures
17. Resistance Survey: Grey Scale Plot Overview; Scale 1:1000 55
18. Resistance Survey: Grey Scale Plot; Scale 1:1000 56
19. Resistance Survey: Relief Plots; Scale 1:2000 57
20. Resistance Survey: Trace Plot; Scale 1:1000 58
21. Resistance Anomaly Plan & Grey Scale Plot; Scale 1:1000 59
22. Resistance Anomaly Plan - Annotated; Scale 1:500 60
23. Resistance Anomaly Plan - Annotated Overview; Scale 1:1000 61
Survey Overviews
24. Magnetic & Resistance Anomaly Plans – Comparative 62
25. Magnetic & Resistance Anomaly Plans – Superimposed 63
26. Magnetic & Resistance Grey Scale Plot – Suggested Trench Locations 64
27. Suggested Trench Locations; Digital Map 65

Geophysical Survey of St. Leonard’s Medieval Hospital Prepared for North Tyneside Council
TimeScape Surveys Report Number 123-11 39 Copyright Reserved

Geophysical Survey of St. Leonard’s Medieval Hospital Prepared for North Tyneside Council
TimeScape Surveys Report Number 123-11 40 Copyright Reserved

Geophysical Survey of St. Leonard’s Medieval Hospital Prepared for North Tyneside Council
TimeScape Surveys Report Number 123-11 41 Copyright Reserved

Geophysical Survey of St. Leonard’s Medieval Hospital Prepared for North Tyneside Council
TimeScape Surveys Report Number 123-11 42 Copyright Reserved

Geophysical Survey of St. Leonard’s Medieval Hospital Prepared for North Tyneside Council
TimeScape Surveys Report Number 123-11 43 Copyright Reserved

Geophysical Survey of St. Leonard’s Medieval Hospital Prepared for North Tyneside Council
TimeScape Surveys Report Number 123-11 44 Copyright Reserved

Geophysical Survey of St. Leonard’s Medieval Hospital Prepared for North Tyneside Council
TimeScape Surveys Report Number 123-11 45 Copyright Reserved

Geophysical Survey of St. Leonard’s Medieval Hospital Prepared for North Tyneside Council
TimeScape Surveys Report Number 123-11 46 Copyright Reserved

Geophysical Survey of St. Leonard’s Medieval Hospital Prepared for North Tyneside Council
TimeScape Surveys Report Number 123-11 47 Copyright Reserved
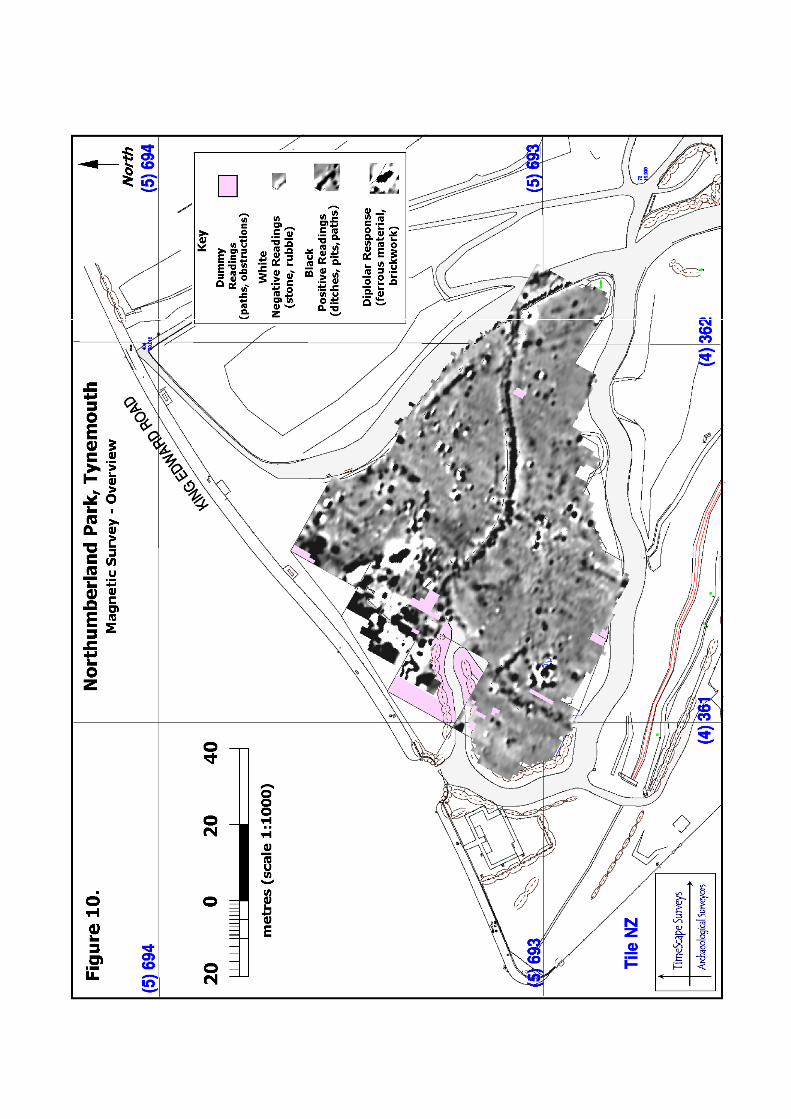
Geophysical Survey of St. Leonard’s Medieval Hospital Prepared for North Tyneside Council
TimeScape Surveys Report Number 123-11 48 Copyright Reserved

Geophysical Survey of St. Leonard’s Medieval Hospital Prepared for North Tyneside Council
TimeScape Surveys Report Number 123-11 49 Copyright Reserved

Geophysical Survey of St. Leonard’s Medieval Hospital Prepared for North Tyneside Council
TimeScape Surveys Report Number 123-11 50 Copyright Reserved

Geophysical Survey of St. Leonard’s Medieval Hospital Prepared for North Tyneside Council
TimeScape Surveys Report Number 123-11 51 Copyright Reserved

Geophysical Survey of St. Leonard’s Medieval Hospital Prepared for North Tyneside Council
TimeScape Surveys Report Number 123-11 52 Copyright Reserved

Geophysical Survey of St. Leonard’s Medieval Hospital Prepared for North Tyneside Council
TimeScape Surveys Report Number 123-11 53 Copyright Reserved

Geophysical Survey of St. Leonard’s Medieval Hospital Prepared for North Tyneside Council
TimeScape Surveys Report Number 123-11 54 Copyright Reserved

Geophysical Survey of St. Leonard’s Medieval Hospital Prepared for North Tyneside Council
TimeScape Surveys Report Number 123-11 55 Copyright Reserved

Geophysical Survey of St. Leonard’s Medieval Hospital Prepared for North Tyneside Council
TimeScape Surveys Report Number 123-11 56 Copyright Reserved

Geophysical Survey of St. Leonard’s Medieval Hospital Prepared for North Tyneside Council
TimeScape Surveys Report Number 123-11 57 Copyright Reserved
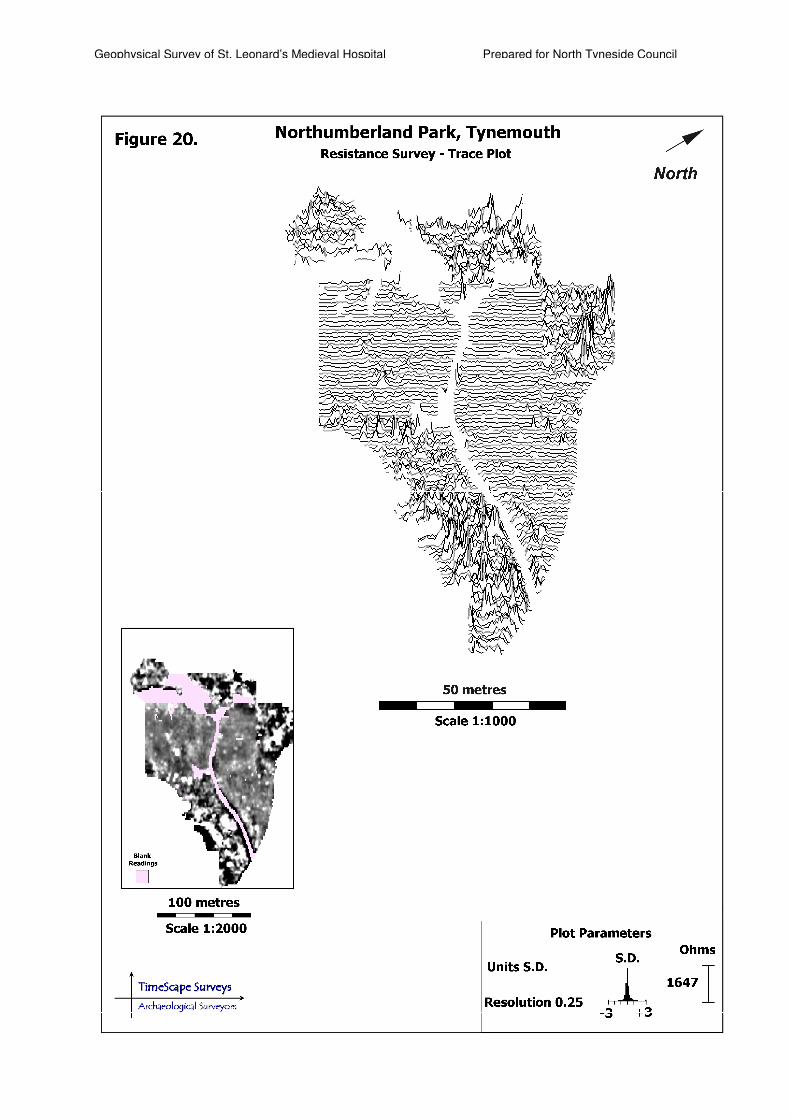
Geophysical Survey of St. Leonard’s Medieval Hospital Prepared for North Tyneside Council
TimeScape Surveys Report Number 123-11 58 Copyright Reserved

Geophysical Survey of St. Leonard’s Medieval Hospital Prepared for North Tyneside Council
TimeScape Surveys Report Number 123-11 59 Copyright Reserved

Geophysical Survey of St. Leonard’s Medieval Hospital Prepared for North Tyneside Council
TimeScape Surveys Report Number 123-11 60 Copyright Reserved

Geophysical Survey of St. Leonard’s Medieval Hospital Prepared for North Tyneside Council
TimeScape Surveys Report Number 123-11 61 Copyright Reserved

Geophysical Survey of St. Leonard’s Medieval Hospital Prepared for North Tyneside Council
TimeScape Surveys Report Number 123-11 62 Copyright Reserved

Geophysical Survey of St. Leonard’s Medieval Hospital Prepared for North Tyneside Council
TimeScape Surveys Report Number 123-11 63 Copyright Reserved

Geophysical Survey of St. Leonard’s Medieval Hospital Prepared for North Tyneside Council
TimeScape Surveys Report Number 123-11 64 Copyright Reserved

Geophysical Survey of St. Leonard’s Medieval Hospital Prepared for North Tyneside Council
TimeScape Surveys Report Number 123-11 65 Copyright Reserved

Geophysical Survey of St. Leonard’s Medieval Hospital Prepared for North Tyneside Council
TimeScape Surveys Report Number 123-11 66 Copyright Reserved

Geophysical Survey of St. Leonard’s Medieval Hospital Prepared for North Tyneside Council
TimeScape Surveys Report Number 123-11 67 Copyright Reserved
APPENDIX 2
Geophysical Survey Theory
Introduction
The use of geophysical survey (Remote Sensing) techniques has now become well
established as a methodology with which to effectively evaluate large areas. The major
methodologies are magnetic and resistance surveys and these two techniques have been
used extensively by the authors of this report. Each technique is mutually supportive and
can provide essential corroborative evidence (e.g. Housesteads; Biggins & Taylor 2004c).
More recently ground penetrating radar (GPR) has been used to define much larger
survey areas than has been usual in the past, such as the latest Maryport survey
conducted in 2010 when some 7ha of survey was conducted (Biggins et al 2011). The
theoretical aspects are considered here in outline, although what the majority of
archaeologists need to know to use the equipment effectively are the capabilities and
limitations of the two main methods, rather than a complex geophysical theory. The
complexity of relationships between archaeological structures can be highlighted when
magnetometer data is overlaid by resistivity results, and this will be discussed later in the
chapter.
Magnetic Susceptibility
In order to understand the basic principles of magnetic prospection it is first necessary to
discuss the basis of the effects of magnetic susceptibility. All materials, at an atomic level,
have magnetic properties, which are manifest when they are placed within a magnetic
field. That material acquires an induced magnetisation (Ji).
Ji =κκκκH
Where ; κκκκ = volume magnetic susceptibility (specific in strength to that material),
H = applied magnetic field (e.g. the Earth’s)
In addition to induced magnetisation, a buried feature may also possess remanent
magnetisation, (Jr). Thus, the total resultant magnetisation will produce a sub-surface
anomaly in that applied field detectable, in varying strengths, at ground level.
J Total = Jr + Ji
The production of magnetic anomalies relies on a contrast between the magnetic
susceptibility of the target feature and the surrounding subsoil. Many complex pedogenic
(soil formation) and anthropogenic (human) mechanisms may lead to the enrichment or
depletion of magnetic susceptibility and may be summarised in terms of common soil iron
oxides:

Geophysical Survey of St. Leonard’s Medieval Hospital Prepared for North Tyneside Council
TimeScape Surveys Report Number 123-11 68 Copyright Reserved
Fermentation (REDOX reactions)
Soils subject to a seasonal cycle of reducing (winter) followed by oxidising (summer)
conditions (REDOX reactions) demonstrate an enhanced topsoil magnetic susceptibility.
This process may well be (micro)-biologically moderated.
Bacterial Magnetism
Abundant soil bacteria may lead to the enhancement of magnetic susceptibility through a
number of mechanisms:
Altering the pH/Eh of the soil environment
Anaerobic Respiration utilising Fe2+ as an electron acceptor.
Presence of highly ordered magnetosome chains of magnetite (or greigite) crystals
may be a source (possibly used for navigation purposes, e.g. birds).
Note; pH is the negative logarithm of the effective hydrogen ion concentration used to
express both acidity and alkalinity. Eh is a measure of the oxidation or reduction potential
of the system. Low Eh values correspond to reducing conditions and high Eh values to
oxidizing conditions.
Enhancement through Fire
Both natural and deliberate burning leads to the considerable magnetic enhancement of
the immediate topsoil. This converts magnetite and haematite to the much more magnetic
ferrous oxide - maghaemite. This is one of the reasons that ditches for instance, are
generally much more magnetically responsive near settlements.
Site formation processes
Following habitation of a site, various anthropogenic processes including burning, and
creation of cut features accumulates and enhances the susceptibility topsoil and semi-
industrial activities (e.g. kilns) may occur. This results in the presence of local
concentrations of magnetic material that will generally produce detectable magnetic
anomalies. The resultant anomalies may be strengthened further through the
development of:
Thermo (burnt features)
Detrital (waterborne sediments)
Chemical Remanence (in situ formation of magnetic minerals).

Geophysical Survey of St. Leonard’s Medieval Hospital Prepared for North Tyneside Council
TimeScape Surveys Report Number 123-11 69 Copyright Reserved
In more general terms, the magnetic susceptibility of a soil is determined by the quantity of
ferrimagnetic minerals, usually magnetite or maghaemite. The earth’s crust contains 6%
iron in various mineral forms; ferro (Fe2+, II) or ferri-magnetic (Fe3+, III) particles exist in
two oxidation states (Co and Ni are also magnetic), but iron retains its magnetism after
being in a field and the ore is also easily magnetised. As early as 1957 Aitkin predicted
that a kiln should theoretically show magnetic anomalies (Aitkin 1974, 24-6). When the
Curie Point is reached a preferential alignment is retained on cooling. There is a
phenomenon of depositional remanent magnetism when particles are very slowly
precipitated in a lake (or ditch). Thermoremanent magnetism is associated with in situ
structures and these magnetic properties are:
a) Diamagnetic – which describes material which when placed in a magnetic field
exhibits weak repulsion of that magnetic field. This is a general, variable weak
phenomenon for all materials.
b) Paramagnetic - The direction of the field is the same as the direction of the
applied field.
This is the capacity to be magnetised; some compounds have higher capabilities than do
others. In the soil, one of the commonest substances is haematite (Fe2O3). Fires may
convert haematite into magnetite (Fe3O4 – the lodestone of old), another oxide of iron.
Upon oxidation, this is converted to maghaemite (Fe2O3) a much more magnetic
compound, which is metastable, and, when heated, transforms back into haematite. Both
natural and deliberate burning leads to the considerable enhancement of the immediate
topsoil or clay minerals, which converts magnetite and haematite to the much more
magnetic ferrous oxide, maghaemite. This enhancement occurs when the Curie point
675ºC for haematite and 565ºC for magnetite is exceeded and the oxides are
demagnetised. Upon cooling, the molecules are re-magnetised en masse and assume a
permanent magnetisation aligned to the Earth’s field at that time. The earth’s field and
magnetic force can be compared to a magnet (or more specifically a ball of iron) which is
in the region of 48-49 Teslas in Britain (a factor of 109 greater than can be measured with
an FM256 magnetometer). Diurnal changes, due to the effects of electromagnetic
radiation present a strong general field.
The measurement of magnetic susceptibility is quantified in Teslas, and typical values
found over archaeological features generally do not exceed ±20ηTeslas. Topsoil may
have very weak magnetic susceptibility, and a ditch may have a response of 1-10 ηT, but
compared to a potential with an instrument sensitivity limit of 0.1 ηT; this is quite a strong
response. Bricks, but more particularly in situ kilns made of fired clay can give relatively
massive signals of 500ηTeslas, which is more than the instrument’s maximum reading of
204.75ηTeslas (at 0.1 ηTeslas sensitivity). Magnetometry relies, in part, upon
anthropogenic changes in clay mineral caused when haematite and magnetite are
transformed to the superparamagnetic maghaemite form of the mineral. The slight but

Geophysical Survey of St. Leonard’s Medieval Hospital Prepared for North Tyneside Council
TimeScape Surveys Report Number 123-11 70 Copyright Reserved
significant rearrangement of these dipoles along the axis of the earth’s magnetic field
results in an alteration in the characteristics of the soil in relation to background levels.
Magnetic Survey
A number of magnetometers are available commercially, some used primarily for
geological survey, and whilst other types such as the Bartington 601-2 have only been
used on one site in this present study (Maryport). The robust Geoscan FM36, or its
upgraded version the FM256 fluxgate gradiometer were the instruments of choice for
these projects. These instruments have seen technological improvements developed over
the years, resulting in ease of use and greater memory capacity, which allows greater
intervals between downloads. The present author has retained a single instrument
methodology, not necessarily on costs grounds, but because the method adopted, and
discussed later, always captures superior data.
Fluxgate Gradiometer (e.g. Geoscan FM36 or FM256)
Magnetometry survey in this study was conducted using a Geoscan FM256 fluxgate
gradiometer; an upgraded version. Satisfactory results can be obtained using 0.5m
sample along 1m parallel traverse intervals, with the application for drift correction after
each grid. Drift (essentially instrument imbalance), is undesirable and is readily
recognised in surveys. The dominant cause of drift in magnetometer output was found to
be temperature change. Dull, cool, overcast, days provide the best environment for
survey. Increased sampling intervals of 4/metre (3,600 readings/30m grid) along the
direction of traverse can improve the quality of the results at little extra cost. Such a
sampling strategy provides a confident characterisation of sub-surface archaeological
features.
The application of zigzag traverses, whilst more rapid, is prone to striping effects which
may be difficult to remove. This is a sampling aberration which may create difficulties in
recognising faint archaeological features. Magnetic techniques routinely penetrate c.
1.0m, with some larger features being detected beyond that depth. Magnetometry can
detect pits, ditches, kilns, ovens and hearths, whereas resistivity is sometimes better
suited to the detection of sub-surface buildings walls and masonry foundations. A
simplified schematic view of the instrument is shown (plate 28), which shows how the
instrument passively measures magnetic signals.
A limitation of the method and a factor associated with uneven ground is the relative
distance from the land surface to the magnetometer. The strength of the magnetic
response is proportional to the reciprocal of the distance cubed (i.e. 1/D3). It follows that
any readings taken upslope with a magnetometer will give a stronger response than those
taken downslope. The differential effects of ploughing striations or more particularly
vehicle tracks can create the illusionary effect of linear features.

Geophysical Survey of St. Leonard’s Medieval Hospital Prepared for North Tyneside Council
TimeScape Surveys Report Number 123-11 71 Copyright Reserved
An additional factor, which may give erroneous results, is the presence of outcrops of
igneous rock. A summary of the suitability of various techniques (magnetometry and
resistivity) over differing geological conditions is summarised in the English Heritage
Guidelines (David, 1995 Table 9). The effect upon magnetometry of the Cheviot Massif is
well documented and similar effects have also been observed close to the Whin Sill
(Biggins et al, 1999; Biggins and Taylor 2001a). What are less easy to distinguish are the
effects of relatively small glacial erratic boulder, such as andesite. The response from a
football-sized magnetic boulder of the igneous rock, andesite, is identical to that measured
from a large pit 1-2m in diameter.
Plate 28. This class of instrument uses a pair of solid state fluxgates to measure the gradient of the
vertical component of the earth's magnetic field. Commonly used for archaeological applications
these instruments currently offer a moderate sensitivity (~0.l nTeslas) suitable for most sites. This
is the instrument in common usage, with a depth penetration of c. 1.0m. The fluxgate gradiometer
has become the standard instrument of British archaeological prospecting (after Clark 1990, 69).

Geophysical Survey of St. Leonard’s Medieval Hospital Prepared for North Tyneside Council
TimeScape Surveys Report Number 123-11 72 Copyright Reserved
Earth Resistance Survey (Geoscan RM15 Resistivity Meter)
In this method an electric current is passed through the ground between a pair of mobile
electrodes. The current passes more easily through soil having a low resistance, but is
impeded by buried walls or road surfaces of higher resistance. The electrical resistance of
the ground is primarily dependent upon net soil moisture and its distribution (see plate 29).
Stone or brick wall foundations act as insulators being in general impervious to moisture,
therefore giving high resistance readings. Natural geological variations can make
interpretation difficult and very often linear features are more readily observed with this
method. Resistance survey would not materially distinguish between brick and stone.
Plate 29. (A) The electrical resistance (R) of an object can be calculated by applying Ohms Law.
(B) The longer the current path through the object (δδδδL), or the smaller its cross-sectional area
perpendicular to the direction of current flow (δδδδA), the higher will be its resistance.
Electrical prospecting relies upon applying a known DC or low frequency AC current to the
ground. The potential difference (or voltage) can then be measured and the electrical
resistance (R) of an object can be calculated by applying Ohms Law:
R =V/I
Where; R =Resistance, V = voltage; I = current
Electrical resistance is measured in units of Ohms (ΩΩΩΩ ). The electrical resistance of a
medium does not depend solely on the material of which it is made, but also on its shape.
The longer the current path through the object, δδδδ L, or the smaller its cross-sectional area
perpendicular to the direction of current flow, δδδδA, the higher will be its resistance (plate
29). It is thus useful to define resistivity, ρρρρ as the resistance of a standard-sized piece of

Geophysical Survey of St. Leonard’s Medieval Hospital Prepared for North Tyneside Council
TimeScape Surveys Report Number 123-11 73 Copyright Reserved
material with unit length and unit cross-sectional area. Resistance and resistivity are
related by the equation:
ρρρρ = R. δ δ δ δA
δδδδL
Thus, resistivity is measured in Ohm-metres (ΩΩΩΩ m)
Plate 30. The typical range of resistivity of some materials commonly encountered in field surveys
is described above. In archaeological situations higher resistance can be equated to sub-surface
building foundations and paved roads.
The conduction of current does not rely upon water itself, but the level of electrolytes
contained within it. Dissolved atmospheric carbon dioxide and carbonic acid produce
acidic conditions, and reaction with soil minerals form a weak electrolytic solution. Humic
acids also play a role in the process of soil conduction (plate 30). Clay sub-soils or infilled
ditches give low resistance readings, due to the presence of dissolved electrolytes.
Resistivity is limited by soil moisture content, and best used during the summer months,
when soil moisture deficits are at a maximum. This can result in much better contrasts
between different buried features. Some particularly arid sandy regions are not amenable
to resistance survey at all, even when contact resistance is improved by watering the
electrodes (such as Muweilah, Sharjah, see Biggins and Robinson 1999a; Blau et al
2000) Resistivity survey can produce complementary data when used in conjunction with
magnetometry, and this is often a key factor in analysis. Natural geological variations can
make interpretation difficult and most rock acts as an insulator.
Contact Resistance
The electrodes have a very small contact area in relation to the overall volume of ground
traversed by the current; and, compared with metal, the soil is a poor conductor,

Geophysical Survey of St. Leonard’s Medieval Hospital Prepared for North Tyneside Council
TimeScape Surveys Report Number 123-11 74 Copyright Reserved
especially near the surface where it tends to be relatively dry. In combination, these
effects create much higher resistance immediately around the electrodes than is
encountered in the deeper ground that one wants to measure. When repeatedly inserting
the electrodes, variations in this high contact resistance are inevitable which would swamp
the significant changes in deeper soil resistance. A simple way to measure the electrical
resistance of the ground would be to insert two electrodes into the surface, pass a known
current through them and measure their potential difference (plate 30A) However, there
are two problems with this system:
Polarization
Plate 31. Diagrammatic view of a simple earth resistance system and the more effective 4-electode
system. This simple modification significantly reduces polarization (effectively electrolysis) at the
electrodes, but does result in having a static pair of electrodes connected by wire to the mobile
probes (after Clark 1990, 28).
Electrical current flows through soil mainly via ions dissolved in water contained in its pore
space. These ions will migrate towards the current electrode of opposite polarity to their
own electric charge and cluster around it (plate 31A). As they accumulate, the resistance
between the electrodes will change owing to the change in potential across the soil-
electrode interface.
The problems of contact resistance and polarisation can be avoided if a four electrode
system is employed, with the potential difference (voltage) being measured across a
second separate pair of electrodes. In addition, a low frequency AC or switched DC
system is often used as an additional measure against polarization. The continual reversal
of the direction of current flow does not allow the relatively slow moving ions time to
accumulate around the electrodes (see plate 31B).

Geophysical Survey of St. Leonard’s Medieval Hospital Prepared for North Tyneside Council
TimeScape Surveys Report Number 123-11 75 Copyright Reserved
Four Electrodes System
There are many ways in which 4 electrodes can be arranged (see Clark 1990, 27-48), but
for routine archaeological prospecting the Twin Electrode Array is most suited to regular
use over large areas. A number of other different electrode configurations are available
(such as Wenner, Double Dipole, Square Array, Schlumberger and Palmer). This enables
the instrument to simultaneously take readings from a series of twin electrode
configurations of different probe widths (and hence depth penetration). This method under
the right conditions can provide pseudo-depth analysis and as such has been used
effectively at Wroxeter providing definition between foundations of different depths and
dimensions. In general, this type of configuration (MPX15 Multiplexer module using
0.25m, 0.5m, 0.75m, 1m, 1.25m, and 1.5m separations) is only useful on ultra-planar
surfaces with short vegetation, and under ideal conditions (pers. comm. Dr Roger
Walker).
Plate 32. Multiplexer application at Wroxeter. Wider electrode separation permits pseudo-depth
visualisation of variable depth and dimensions of sub-surface foundations to be analysed, although
some time must be spent in obtaining the best results. The ground must also be flat to allow
simultaneous contact of all electrodes (Geoscan Research).
The normal method of choice is to conduct surveys using 1.0 m sample and 1.0 m zigzag
traverse intervals using a Geoscan RM15 resistivity meter, which has a twin electrode
configuration and a probe separation of 0.5 m. Deeper penetration can be attained by
extending the width of the mobile probes to 1.0m, but the instrument is more unwieldy and
must be used on clear surfaces. Such a sampling strategy provides a general
characterisation of sub-surface archaeological features and is appropriate for sub-surface
remains of variable depth. Better characterisation can be obtained with 0.5m sample
intervals, but this strategy has time and associated financial considerations.

Geophysical Survey of St. Leonard’s Medieval Hospital Prepared for North Tyneside Council
TimeScape Surveys Report Number 123-11 76 Copyright Reserved
TTTTTTTTiiiiiiiimmmmmmmmeeeeeeeeSSSSSSSSccccccccaaaaaaaappppppppeeeeeeee SSSSSSSSuuuuuuuurrrrrrrrvvvvvvvveeeeeeeeyyyyyyyyssssssss
AAAAAAAArrrrrrrrcccccccchhhhhhhhaaaaaaaaeeeeeeeeoooooooollllllllooooooooggggggggiiiiiiiiccccccccaaaaaaaallllllll SSSSSSSSuuuuuuuurrrrrrrrvvvvvvvveeeeeeeeyyyyyyyyoooooooorrrrrrrrssssssss
CONTACTS
Director - TimeScape Surveys J. Alan Biggins TD MA MSc MRSC MIBiol FSA FSA Scot
Northumbria, Main Road, Dinnington,
Newcastle upon Tyne. NE13 7JW.
Tel: +44 (0)1661 823 135 Mobile 07889 071 654 E-mail: [email protected]
TimeScape Consultant – Roman & Building Studies David J. A. Taylor Dip Arch PhD RIBA FSA MIFA
2A Higham Road, Padiham, Burnley
BB12 9AP Tel. 01282 773 666
E-mail: [email protected]