A dynamic elastic model for segmentation and tracking of the heart in MR image sequences
Biometric Tracking & Image Analysis Magisterarbeit
110
-
Upload
khangminh22 -
Category
Documents
-
view
0 -
download
0
Transcript of Biometric Tracking & Image Analysis Magisterarbeit

Log End Image Databases: Biometric Tracking& Image Analysis
Magisterarbeit
Zur Erlangung des Titels
Magister
an der Naturwissenschaftlichen Fakultät der
Paris-Lodron-Universität Salzburg
Eingereicht von
Dipl. Ing. Rudolf Schraml
Gutachter:
Univ.-Prof. Dr. Andreas Uhl
Fachbereich:
Computerwissenschaften
Salzburg, April, 2016

Rudolf Schraml
Halleiner Landesstraÿe 40a
A−5061 Elsbethen
Hiermit versichere ich, dass ich die von mir vorgelegte Arbeit selbstständig verfasst habe, dass
ich die verwendeten Quellen, Internet-Quellen und Hilfsmittel vollständig angegeben habe und
dass ich die Stellen der Arbeit � einschlieÿlich Tabellen, Karten und Abbildungen �, die anderen
Werken oder dem Internet im Wortlaut oder dem Sinn nach entnommen sind, auf jeden Fall
unter Angabe der Quelle als Entlehnung kenntlich gemacht habe.
Salzburg, 20.April 2016
Rudolf Schraml

Acknowledgement
Thanks to my girlfriend Tanja, without i would have lost the motivation for writing this thesis.
I also want to thank the Austrian and German railway. The majority of this work was written
in trains, probably because due to the lack of an internet connection that would have kept my
attention away for senseless internet sur�ng.

Abstract
This diploma thesis is based on the need for testset data in the TreeBio project funded by the
FWF. For this reason, a �nal project at the higher technical college HTL Kuchl was initialized
and accompanied by me. Three pupils from the HTL Kuchl successfully processed the project
in the school year 2013/14. Within this project log end images of 172 logs were captured at
two di�erent sawmills. All log end images were annotated using an annotation tool which was
especially developed for this project and within this thesis. In the practical part of the project
the pupils performed a statistical analysis of relationships between log end face measurements
and log shape measurements. The results provide interesting insights which are valuable for
log quality estimation considerations. The acquired testset data already served as basis for
two scienti�c publications. Furthermore, the developed annotation tool has also been utilized
for the annotation of further testsets and the acquired groundtruth database was utilized in
most of the experiments within the TreeBio project.
keywords Biometric Log End Recognition, Cross-Section Image Analysis, Wood Log Track-
ing, Performance Evaluation Databases
I

Zusammenfassung
Ausgangspunkt für diese Diplomarbeit war das fehlen von geeigneten Testdaten für das FWF
geförderte Projekt "TreeBio". Aus diesem Grund wurde an der Höheren Technischen Lehranstalt
(HTL) Kuchl ein Abschlussprojekt für Schüler/innen initiiert und später als Kooperationspart-
ner begleitet. Das Abschlussprojekt wurde von drei Schülern der HTL Kuchl im Schuljahr
2013/2014 erfolgreich durchgeführt und mit einer Abschlussarbeit sowie einer Abschlusspräsen-
tation beendet. In diesem Abschlussprojekt wurden Stammendbilder von 172 Baumstämmen
in zwei unterschiedlichen Sägewerken aufgenommen. Alle Stammendbilder wurden, mit einem
eigens für das Abschlussprojekt entwickelten Annotierungstool, annotiert. Die statistische
Auswertung der Zusammenhänge zwischen Stammend- und Stammformmerkmalen führt zu
neuen und für die Stammqualitätsbeurteilung wertvollen Ergebnissen. Die entwickelte Anno-
tationssoftware wurde auch für die Annotation weiterer Datensätze verwendet und die daraus
resultierende Datenbank, mit Grundwahrheiten der Stammendmerkmale, wurde in fast allen
Experimenten des TreeBio Projektes verwendet.
II

Contents
1 Introduction 1
1.1 Project - HTL Kuchl . . . . . . . . . . . . . . . . . . . . . . . . . . . . . . . . . 2
I Theoretical Background 4
2 CS-Image Analysis 6
2.1 Wood Basics . . . . . . . . . . . . . . . . . . . . . . . . . . . . . . . . . . . . . . 6
2.1.1 Wood Anatomy . . . . . . . . . . . . . . . . . . . . . . . . . . . . . . . . 7
2.2 CS Analysis Applications and Research . . . . . . . . . . . . . . . . . . . . . . . 9
2.2.1 Pith estimation . . . . . . . . . . . . . . . . . . . . . . . . . . . . . . . . 10
2.2.1.1 Literature Overview . . . . . . . . . . . . . . . . . . . . . . . . 11
2.2.2 Annual ring analysis . . . . . . . . . . . . . . . . . . . . . . . . . . . . . 16
2.2.2.1 Literature Overview . . . . . . . . . . . . . . . . . . . . . . . . 17
2.2.3 Further Literature on CS Analysis . . . . . . . . . . . . . . . . . . . . . 22
2.2.3.1 Log Defect Detection and Analysis . . . . . . . . . . . . . . . 22
2.2.3.1.1 Further Defects: Detection and Analysis . . . . . . . 25
2.2.3.2 Further Wood Properties: Detection and Analysis . . . . . . 26
2.2.4 CS Segmentation . . . . . . . . . . . . . . . . . . . . . . . . . . . . . . . 27
III

CONTENTS IV
3 Traceability of Wood Logs 31
3.1 Traceability De�nition . . . . . . . . . . . . . . . . . . . . . . . . . . . . . . . . . 31
3.2 Log Supply Chain - LSC . . . . . . . . . . . . . . . . . . . . . . . . . . . . . . . 31
3.3 Traceability Methods . . . . . . . . . . . . . . . . . . . . . . . . . . . . . . . . . 32
3.3.1 Manual Labels . . . . . . . . . . . . . . . . . . . . . . . . . . . . . . . . 32
3.3.2 Badge Labels . . . . . . . . . . . . . . . . . . . . . . . . . . . . . . . . . 33
3.3.3 Transponders . . . . . . . . . . . . . . . . . . . . . . . . . . . . . . . . . 33
4 Biometric Wood Log Traceability 36
4.1 Biometric Systems . . . . . . . . . . . . . . . . . . . . . . . . . . . . . . . . . . . 36
4.1.1 System Characteristics and Classi�cation Categories . . . . . . . . . . . 37
4.1.2 System Performance Evaluation . . . . . . . . . . . . . . . . . . . . . . . 39
4.2 Research on Biometric Log Recognition . . . . . . . . . . . . . . . . . . . . . . 42
4.2.1 Log Shape Recognition . . . . . . . . . . . . . . . . . . . . . . . . . . . 42
4.2.2 Log to Board Recognition . . . . . . . . . . . . . . . . . . . . . . . . . . 44
4.2.3 Log End Recognition . . . . . . . . . . . . . . . . . . . . . . . . . . . . . 45
4.2.3.1 Literature Review . . . . . . . . . . . . . . . . . . . . . . . . . 46
4.2.4 Wood Board Recognition . . . . . . . . . . . . . . . . . . . . . . . . . . 52
II Log End Image Analysis Project 54
5 Project Report 55
5.1 Databases for Performance Evaluation . . . . . . . . . . . . . . . . . . . . . . . 55
5.1.1 Log End Image Database Requirements . . . . . . . . . . . . . . . . . . 56
5.2 Project Goals . . . . . . . . . . . . . . . . . . . . . . . . . . . . . . . . . . . . . . 57

CONTENTS V
5.3 Project Implementation . . . . . . . . . . . . . . . . . . . . . . . . . . . . . . . . 58
5.3.1 Workpackages . . . . . . . . . . . . . . . . . . . . . . . . . . . . . . . . . 58
5.4 Database Acquisition . . . . . . . . . . . . . . . . . . . . . . . . . . . . . . . . . 59
5.4.1 Testset Entacher . . . . . . . . . . . . . . . . . . . . . . . . . . . . . . . 59
5.4.2 Testset Mayr-Melnhof . . . . . . . . . . . . . . . . . . . . . . . . . . . . 60
5.5 Database Annotation . . . . . . . . . . . . . . . . . . . . . . . . . . . . . . . . . 61
5.5.1 Annotated CS Properties . . . . . . . . . . . . . . . . . . . . . . . . . . 62
5.5.2 Annotation Software/ CrossSection Editor . . . . . . . . . . . . . . . . . 62
5.5.2.1 Database . . . . . . . . . . . . . . . . . . . . . . . . . . . . . . 63
5.5.2.2 CS-Editor Work�ow and Features . . . . . . . . . . . . . . . . 66
5.6 Statistical Analysis . . . . . . . . . . . . . . . . . . . . . . . . . . . . . . . . . . 75
5.6.1 Results . . . . . . . . . . . . . . . . . . . . . . . . . . . . . . . . . . . . . 76
5.6.1.1 Correlation Analysis . . . . . . . . . . . . . . . . . . . . . . . . 76
5.6.1.2 Regression Analysis . . . . . . . . . . . . . . . . . . . . . . . . 78
5.6.1.2.1 RW-Length Regression Analysis . . . . . . . . . . . 79
6 Conclusions 80
III Appendix 81
.1 Project Application HTL Kuchl . . . . . . . . . . . . . . . . . . . . . . . . . . . 82
.2 Project Timeline . . . . . . . . . . . . . . . . . . . . . . . . . . . . . . . . . . . . 86
.3 Project Meeting Report Example . . . . . . . . . . . . . . . . . . . . . . . . . . 87
.4 Project Progress Report Example . . . . . . . . . . . . . . . . . . . . . . . . . . 89

Chapter 1
Introduction
Wood log traceability is a constraint to solve economical, ecological, social and legal issues.
From an economic point of view tracking of wood logs is required to map the ownership of
each log. Furthermore, in the past two decades social aspects have become more important
and sustainability certi�cates like Pan European Forest Certi�cation (PEFC) and Forest Stew-
ardship Council (FSC) are a must have for all end-sellers. Regarding ecological issues, illegal
logging and deforestation are driving forces of the climate change. Actions against illegal
logging led to regulations like the European Timber Regulation, the U.S. Lacey Act and the
Australia Illegal Logging Prohibition Act (see www.forestlegality.com).
Currently, various wood log tracking approaches exist which all show up di�erent pros and cons
for di�erent �elds of applications in the timber based industries. Such approaches range from
simple methods like punching, colouring or applying batches to more sophisticated methods
like DNA �ngerprinting and the usage of Radio Frequency Identi�cation Transponders (RFID)
Tzoulis and Andreopoulou (2013). In the industry just approaches which rely on physically
marking each log are utilized. Another approach assumes that wood logs are separable iden-
tities based on their intrinsic biometric characteristics. Investigations on the hypothesis that
logs are separate entities on the basis of biometric log characteristics were presented in the
works of Chiorescu and Grönlund (2003, 2004); Flodin et al. (2007, 2008a,b), which show up
the high potential of biometric log recognition. The approaches presented in Chiorescu and
Grönlund (2003, 2004); Flodin et al. (2008a) utilized 2D and 3D scanners to extract geometric
wood properties.
On account of the fact, that wood logs o�er features on their end faces in terms of annual
rings, pith position, shape and dimension images log end faces can be used as biometric
1

CHAPTER 1. INTRODUCTION 2
characteristic for log recognition. Images containing a cross-section (CS) of a wood log are
denoted as CS-Images throughout this thesis. A biometric log recognition system based on log
end images could be used to track the ownership from the forest based industries to further
processing companies. Another application is to discover illegally harvested tree logs based on
CS-Images of their stumps Barrett (2008).
This thesis is based on the need for log end image datasets which are suited to perform
investigations on the identi�cation performance of a biometric log end recognition system.
Based on that need a �nal project for pupils of the higher technical college HTL Kuchl was
initialized and accompanied.
1.1 Project - HTL Kuchl
As graduate of the HTL Kuchl, who also had the great opportunity to conduct such a project
within the last year of my secondary school education (2002-2003), we had the idea to initialize
a project within the FWF project entitled Traceability of Logs by Means of Digital Images (FWF
TRP project 254). Thanks to DI Erwin Treml and Dr. Karl Entacher three motivated pupils
con�rmed to work on this project.
Figure 1.1: Project Team: Alexander Sampl, Michael Geistlinger and Michael Schober
The project o�cially started at the end of the school year 2012/2013 and was �nished by a
�nal presentation in Kuchl in May 2014. Based on our need for a testset database and the
input/ ideas of the two project advisor's (Erwin Treml, Karl Entacher) the goals for the project
were de�ned:

CHAPTER 1. INTRODUCTION 3
� Create a representative database of wood log end images from di�erent wood logs suited
for research purposes.
� Annotate wood features which are visible on wood log ends.
� Elaborate dependencies between log end features and wood log anomalies which are
relevant for log and wood quality assessment.
This thesis is subdivided in two parts: Part I introduces topics relevant for log end image
analysis and biometric log tracking and summarizes related scienti�c literature. In Part II the
schedule and foregoing of the conducted project as well as the gathered results are presented.

Part I
Theoretical Background
4

5
The majority of the theoretical part of this thesis was already published by myself in
my master thesis (Schraml, 2013). I declare that this content is my own intellectual
property (for comparison I refer to Schraml (2013)). Where appropriate, content was
added, deleted, restructured and revised so that the content presents the theoretical
background related to the topic of this diploma thesis.
The �rst part of this thesis contains a theoretical work-up related to cross-section image
(CS-Image) analysis and biometric wood log tracking. First, Chapter 2 introduces di�erent
CS-Image analysis tasks and for each task a literature overview is provided. Subsequently, in
Chapter 3 a possible de�nition for log traceability (Section 3.1 and 3.2) is introduced �rst and
second an overview on common and state-of-the-art traceability methods 3.3) is presented.
Finally, Chapter 4 introduces biometric systems (Section 4.1) and provides a structured review
on research related to biometric log tracking (Section 4.2).

Chapter 2
CS-Image Analysis
The increasing industrialization of sawmills in the 1990's presented new challenges to existing
processes. Requirements such as higher process speeds, better yields and lower costs con-
tributed signi�cantly to the development of new wood log scanning devices and algorithms for
further processing the acquired data. For example, the �rst fast (120m/min with 190 rpm)
and robust industrial CT-Scanner was developed recently within the CT Pro Project in 2010
Giudiceandrea et al. (2011, 2012). Within the project, among other things, investigations
on knot detection Johansson et al. (2013); Breinig et al. (2012, 2013) and log positioning
Berglund et al. (2013); Fredriksson et al. (2014b,a) were presented. Actually, a few of these
scanners were produced and are already installed in sawmills, i.e. in Germany, France and
Chile. Research showed that CT scanning in combination with an exact log positioning at the
saw intake increases the value of each log up to about 20% Berglund et al. (2013). It can be
expected that the number of sawmills equipped with a CT-Scanner increases rapidly.
CSs in log end images or CS-Images captured with a CT scanner show features which provide
valuable information for log processing. First, Section 2.1 presents wood basics and introduces
features visible in CS-Images. Subsequently, in Section 2.2 applications and research related
to CS-Image analysis are presented.
2.1 Wood Basics
This section presents facts on wood as raw material and introduces features shown in wood log
CS-Images. Although European and Austrian tree species share some basic anatomic features,
6

CHAPTER 2. CS-IMAGE ANALYSIS 7
their CS surfaces can look completely di�erent. These di�erences have to be considered for
the development of CS-Image analysis applications.
2.1.1 Wood Anatomy
Worldwide more than thousand tree species are known. In Austria, about twenty-�ve tree
species are of economic interest. Generally, Austrian and European tree species are subdivided
into softwood and hardwood tree species. Macroscopic and microscopic features identify each
tree species. Microscopically there are major di�erences between the anatomy of hardwood
and softwood. Following, some macroscopic features and related basic information will be
presented.
Standing trees can be easily classi�ed according to their leaves. Hardwood trees typical wear
broad leaves and softwood trees scale-like leaves also known as needles. These leaves are
essential for the tree to grow, as they collect sunlight and carbon dioxide which are necessary
for photosynthesis.
Annual Rings/ Growth Rings Each year a tree, independent of its species, produces new
sap conducting tissue in shape of an annual ring. These annual rings record the age of a tree.
Due to our climate and the seasons, an annual ring consists of two ring-like bands. Earlywood/
springwood is produced at the beginning of the growing season and is mostly light-coloured,-
weight and soft tissue. The dark coloured, stronger and harder tissue is formed in the period
from summer to the end of the growing season and is called latewood/ summerwood. In
most tree species annual rings and the two di�erent tissue bands are clearly visible. In regions
without major climatic changes and seasons there are less di�erences between earlywood and
latewood. Especially in subtropical/ tropical regions trees form several rings each year, which
are called growing rings. The number of growing rings depends on wet and dry periods.
The growing of annual rings and growing rings depends on weather and other environmental
conditions. Dendrochronology uses annual ring patterns for tree dating (Crossdating) in order
to draw conclusions about ecological conditions in the past (ProHolz, 2007).
Pith The pith represents the innermost point of of a tree stem. As a tree starts growing or
grows higher the �rst annual ring is formed around the pith. The thickness of a single annual
ring varies within itself due to di�erent in�uences, like wind or pressure. As a result the annual
ring pattern is not a real circular concentric pattern. So the pith is not the geometric center

CHAPTER 2. CS-IMAGE ANALYSIS 8
(gc) of a tree stem. A pith which is located wide outside of the geometric center acts as an
indicator for reaction wood.
gc
(a) The pith is located slightly outside
due to compression wood in the bottom
left of the CS. (Image source: http:
//commons.wikimedia.org/wiki/File:
Reaction_Wood_of_Picea_Abies.jpg)
gc
(b) The pith is located near to the geo-
metric center (gc). (Image source: Rudolf
Schraml)
Figure 2.1: Examples for di�erent pith locations
Heartwood/Sapwood As a tree grows and becomes older only the outer zones transport
water and nutrients (sap) stem-upwards. This causes the inner zone dying and it gets em-
balmed in tannins and resins. The resulting heartwood is commonly darker than sapwood and
has di�erent mechanical properties.
Tracheids/ Pores and Vessels Sap transport di�ers in soft- and hardwood. In softwood
tracheids are responsible to transport sap upwards and can only be seen microscopically. Hard-
wood is often referred to as porous wood. Huge vessels appearing as holes or pores conduct
sap upwards. Depending on the hardwood species, these pores are distributed di�erently and
can be recognized macroscopically on sanded log end faces or CSs. The distribution of the
pores is used to subdivide hardwood species into three di�erent categories (further reading -
Fellner et al. (2006)).
Vascular/ Medular Rays To transport sap in horizontal direction so-called vascular or
medular rays are formed. For some tree species these rays are very distinctive and visible.
Maple is well known for its distinct texture caused by these rays leading to a mirror e�ect at
the tangential surface.

CHAPTER 2. CS-IMAGE ANALYSIS 9
Bark Bark is the outermost layer of a tree stem. At the inner side of the bark there is a
special layer called xylem. Xylem is supported by vascular rays with sap and produces fresh
wood cells. Phloem is the outer side of the bark and protects the tree stem from environmental
damages.
Knots Each tree develops branches laterally from the tree trunk. Branches accommodate
leaves and needles which collect sunlight. In the wood stem and on the wood surface branches
can be seen as knots. Generally it can be distinguished between inter-grown and encased
or loosed knots. Inter-grown knots are formed by healthy branches and get encased when
branches die and fresh wood is surrounding them. Encased knots are not disturbing the wood
texture/ grain as much as inter-grown knots (Wiedenhoeft, 2010).
Reaction Wood When a tree is physically (eg. by wind, snow, slate subsoil) stressed he
tends to form reaction wood to counteract these in�uences. Softwood tree species react by
producing compression wood on the inner side of the load while hardwood species produce
tension wood on the rear side of the load. Macroscopically reaction wood can be identi�ed
by narrower and darker annual rings in contrast to their surrounding. Branches always cause
mechanical stress at the tree trunk and so lead to the production of reaction wood. Unfortu-
nately, reaction wood has a strong negative impact on the mechanical and physical properties
of wood. Consequently reaction wood is evaluated very negatively and mostly restricted by
grading rules.
Diseases and Vulnerabilities Trees can be a�ected by diseases or attacked/ injured by
animals and micro-organisms. Some of them cause colour changes or wood structure damages.
2.2 CS Analysis Applications and Research
CS analysis refers to the analysis of RGB CS-Images or CT-CS-Images. RGB CS-Images are
captured from the log end face or from CS slices. Mobile or industrial devices are utilized
and RGB CS-Images can be captured using visible light or near infra-red sensors. So far, just
visible light RGB CS-Images were utilized for CS-Image analysis. For the rest of this work
the term CS-Images refers to RGB CS-Images captured with a visible light sensor. CT-CS-
Images are captured with a CT scanner. CT scanners are utilized for wood log research since

CHAPTER 2. CS-IMAGE ANALYSIS 10
almost two decades and now an industrial CT scanner is available too. Thus, CT log scanning
and CT-CS-Image analysis is becoming increasingly important. In general, CT-CS-Images are
prevented from disturbances due to cutting or dirt. Compared to RGB CS-Images, analysis
of CT-CS-Images shows several advantages and in addition information from the total log
CT-CS-Image stack can be utilized.
Since the middle of the 19th century CS analysis is used in the �eld of dendrochronology for tree
dating (ProHolz, 2007). The �rst known approach which uses computers for CS analysis was
presented by McMillin (1982). The author presented a semi-automatic image analysis system
which requires an operator who mainly performs image or camera enhancement. A scanner unit
was used to produce an analogue video signal from sanded pine samples. This signal was then
displayed to the operator who adjusted the region of interest, gray levels and threshold values
before the signal could be binarized and processed. 13 basic measurements including annual
ring measurements like growth rate per inch or late and early wood measurements have been
implemented. Therefore, the current feature that should be measured had to be emphasized
by setting the threshold adequately. He also presented measurements of microscopic features
like the �bre length or some cell measurements of specially prepared pine samples. Finally
geometric measurements of a CT scanned CS slice were shown. McMillin (1982) already
proposed the advantages of internal log scanning regarding the sawing of a log.
In the next subsections an overview on present research until 2015 is provided. The present
literature on CS-Image analysis can be subdivided depending on the analysed macroscopic
feature. Pith estimation and annual ring analysis tasks are the most common CS-Image
analysis tasks. For both tasks a literature overview and selected state-of-the-art algorithms
will be presented in detail in Section 2.2.1 and 2.2.2, respectively. Furthermore, an overview
on literature treating further CS-Image analysis tasks is presented in Section 2.2.3 and �nally
CS segmentation is treated in Section 2.2.4.
2.2.1 Pith estimation
Pith detection/ estimation is very important for CS imaging. Anatomically the pith is the
growth centre of a tree stem. At the CS of the tree stem the pith is the innermost point
surrounded by annual rings. Annual rings and the pith are the only features that are always
present. Thus, the pith is a unique point on a CS. In determining the wood quality the
pith position has two main functions: First, it is an indicator for the presence of other wood
properties like compression or reaction wood. Second, it represents a reference point for further

CHAPTER 2. CS-IMAGE ANALYSIS 11
analysis like annual ring measurements. Pith estimation is fundamental for CS analysis.
In some cases it can be impossible to determine a ground truth for the pith location, whether
by visual inspection or an image analysis application. In combination with the fact that all
pith detection/ estimation approaches rely on a probability match it is appropriate to speak of
pith estimation rather than pith detection.
2.2.1.1 Literature Overview
The existing literature can be subdivided into approaches based on annual ring analysis or local
orientation estimation. Both rely on the assumption that annual rings are concentric circles
the center point of which is the pith position. Annual ring analysis focuses on �nding and
identifying annual rings or arcs. The detected annual rings or arcs are then used to compute
orthogonal vectors pointing towards to the pith or to compute annual ring/ arc centre points
representing votes for the pith position. Local Orientation estimation utilizes the fact that
small annual ring sections represent an oriented texture. Equal as orthogonal vectors from
annual rings/arcs local orientation estimates from annual sections point towards the pith.
With intersection of the local orientations the pith position can be determined.
Regarding the capturing device, the most approaches were developed for images from pol-
ished/sanded CSs or CT-CS-Images. The main advantage of these images is that they are free
of distortions caused by sawing or dust and that annual ring borders are slightly emphasized.
Pith estimation approaches treating CT-CS-Images are presented in Bhandarkar et al. (1996),
Andreu and Rinnhofer (2001), Longuetaud et al. (2004), Entacher et al. (2008).
In Bhandarkar et al. (1996) a system to detect internal log defects using ct-image slices of
a log is presented. Sobel edge detection and a subsequent threshold are used to extract
the annual rings and their gradients. For each detected annual ring point the values inside
of an accumulator array are raised in a certain range of the corresponding gradient vector.
It is assumed that the maxima in the accumulator array is the location of the pith. The
computational demand was reduced by only considering a sub-area around the geometric
center of the image.
For enhancing the annual ring pattern in CT-CS-Images Andreu et al. (2002) used contex-
tual Gabor �lters. The proposed pith estimation algorithm utilizes the assumption that the
orthogonal line of an annual ring cord through its bisect passes the pith. After preprocessing
the annual rings are expressed as pixel chains. Each pair of pixels from a pixel chain de�nes

CHAPTER 2. CS-IMAGE ANALYSIS 12
a chord. An accumulator array sums up the intersections of the orthogonal vectors and the
maximum is assumed to hold the pith position.
Longuetaud et al. (2004) presented an algorithm to detect the pith in a set of ct-slices from
a scanned log. Like Bhandarkar et al. (1996) gradients and an intersection image are used
to determine the pith position for a single slice. Additional information of the pith location
in the previous slice is used to speed up and to improve the accuracy of the algorithm. The
algorithm in Boukadida et al. (2012) is a successor of this work and shows improved results
by applying adaptive thresholds and an optional reversion of the CT slice order to improve the
accuracy in case of branch forks. The authors performed experiments on 125 logs from 17
di�erent tree species. It is shown that the proposed algorithm performs very accurate with an
overall mean error of 1.69 mm.
Entacher et al. (2008) made a comparison between 6 di�erent pith estimation methods. The
main focus was on keeping the computational e�ort low. In addition to the pith estimation
methods the in�uence of di�erent preprocessing methods was evaluated. Except one method
( Poincare (Poi) - well known from �ngerprint recognition - see Maltoni et al. (2009)) all
methods are annual ring analysis methods. The other methods use the circle equation (CE)
or gradient estimation methods (GM). For CE and GM two di�erent variations are presented
respectively. The �rst variation for the circle equation - CEeg (equal gradients) uses the Kirsch
operator to compute gradients for all pixels. Sets of adjacent pixels are used to determine
annual ring arcs. For the second variation CErt (ring tracing) the entire image or a sliding
window is cut at di�erent positions and ring tracing is performed along the cut edge (indicated
by white pixels). For both variations each pair of points (xi, xy), (xj, xy) on an annual ring arc
is used to determine the coordinates of the circle centre (x0, y0). The centre points are used as
votes for an accumulator array, where the maximum is assumed to represent the pith position.
The two GM variations use a sliding window and ring tracing to detect annual ring arcs. One
variation - GMi (intersection) determines the bisects of the previously localised annual ring
arcs. The second variation - GMrl (radial length) additionally uses the radial lengths of the
bisects and �nally the centre point candidates are used to calculate a pith estimate. For pith
estimation GMi intersects all gathered bisects and GMrl uses the point candidate as votes in
an accumulator array. The �fth method - Curvature(Cur) uses the fact that the annual ring
arc curvature increases towards the pith. Therefore CErl and two thresholds are used to choose
annual ring arcs that are close to the pith. The estimated pith position is used to perform a
local circle HT. The experiments show that CErt, GMi and especially CEeg are very accurate.
Poi and Curv are not suitable for pith estimation.

CHAPTER 2. CS-IMAGE ANALYSIS 13
(a) Intersection using the radial length of
detected arcs. (Image source: (Entacher
et al., 2008))
(b) Intersection using local orientations
gathered by Fourier Spectrum analysis. (Im-
age source: Schraml and Uhl (2013))
Figure 2.2: Intersection images
Pith estimation approaches for digital images (RGB CS-Images) are presented in Wu and Liew
(2000); Hanning et al. (2003); Österberg et al. (2004); Norell and Borgefors (2008); Schraml
and Uhl (2013).
While Wu and Liew (2000) basically applied the approach presented by Bhandarkar et al.
(1996), in Hanning et al. (2003) two methods with the intent to ful�l the requirements of EN
1310 were presented. This European norm de�nes rules for visual ring width measurements
on cut wood, where the pith position is a required feature. The main focus was on unpolished
board end images because polishing or sanding of end faces would be too expensive in an
industrial usage. One approach is based on �nding annual ring structures from which gradients
through their barycentre are computed. This is done by local quantization and clustering
of neighboured pixels. In this case local connectivity components are de�ned as local long
structures of adjacent pixels, similar to annual rings. In Fig. 2.3 a) the result of the local
connectivity step is shown. The second approach uses the peak of the local Fourier spectrum
as local orientation estimate of an annual ring section. The entire picture is subdivided into
windows (e.g. 32x32 pixels). For each window or window position the local orientation of the
annual ring section is determined by local Fourier Spectrum analysis. This is established by
searching the peak in the corresponding Fourier Spectrum. For both methods the �nal pith
estimate is computed by intersecting the gradients or local orientation estimates. This work
was probably the �rst which uses local orientation estimation instead of annual ring analysis
for pith estimation.
Österberg (2009) presented experiments using Fourier Spectrum analysis for well prepared
and under perfect light conditions captured CS discs. Instead of moving a window over the

CHAPTER 2. CS-IMAGE ANALYSIS 14
(a) Computed local connectivity components
(b) Local Orientations pointing to the pith
Figure 2.3: Pith estimation in images of rough log end boards. (Image source: Hanning et al. (2003))
entire image an interesting algorithm for pith estimation was introduced. The principle of this
technique is that �rst two points around a reference point are chosen. Initially, the geometric
center of the image is used as �rst reference point. Two further points are chosen, so that an
angle of 90 degrees is formed. The distance from the starting point to the two other points is
equal to the half-distance between the image border and the starting point. Then, two local
orientation estimates are calculated for the annual ring sections around these points. The
intersection of the two local orientations is used as next guess for the pith position. This
one represents the new starting point for the next iteration. At each iteration the distance
between the pith estimate and the other two points is reduced by a factor <1. The procedure
stops after a certain number of iterations or if the new reference point is close to the old
one. The concept of this technique is based on the assumption that annual rings close to the
pith are more circular. Optimally the pith estimate accuracy increases after performing several
iterations.
The authors of Hanning et al. (2003); Österberg (2009) conclude that pith estimation using
local Fourier Spectrum analysis could also be applied on images from rough log ends. So far
two works focusing on the treatment of images of rough log ends have been presented by
Norell and Borgefors (2008) and Schraml and Uhl (2013). In Norell and Borgefors (2008) two
methods which compute local orientations by convolution of �lter kernels in the spatial domain
are introduced. Rough log end images from a sawmill yard were used for the experiments.

CHAPTER 2. CS-IMAGE ANALYSIS 15
The �rst method fuses the output of three quadrature �lters from which a local orientation
estimate and a certainty value are computed. The second method uses the concept of linear
symmetry and Laplacian pyramids. Both methods use a sliding window and for each pixel
a local orientation estimate is computed. Subsequently, for 8×8 pixel blocks one estimate is
chosen to represent the block orientation and an intersection image is created, smoothed and
the maximum is used as estimate. For the quadrature �lters a second iteration in a smaller
region around the �rst estimate and a rotation �ltering step is used to improve accuracy. In
case of using linear symmetry the intersection image for pyramid level 2 is computed �rst. If
the standard deviation is too high the intersection image is computed for level 1 as well. The
intersection image with the lower standard deviation is used to estimate the pith. Finally, the
validity of the pith estimate is determined by analyzing the standard deviation of a smoothed
version of the intersection image.
Our work Schraml and Uhl (2013) provides a literature review and evaluates the performance
of two pith estimation algorithms using four di�erent Fourier spectrum analysis methods. One
algorithm is similar to that proposed in Österberg et al. (2004) and the other one subdivides
the image into blocks using a rectangular or circular grid (Figure 2.4).
GC GC GC
Figure 2.4: The �rst two images illustrate the rectangular and circular block selection procedure and in the
third image the respective intersection image is shown. The last image illustrates the point based selection
procedure including the computed local orientation estimates. (Image source: Schraml and Uhl (2013))
This led to di�erent con�gurations which were applied to 109 rough spruce log end images and
to the same CT-CS-Images as used in Entacher et al. (2008). The results for CT-CS-Images
were compared to Entacher et al. (2008) and the results for rough log end images to those
presented in Norell and Borgefors (2008). Results showed that principal component analysis
method and peak analysis for local orientation estimation in the Fourier domain achieve the
best results for both algorithms. The adopted algorithm proposed by Österberg et al. (2004)
achieves good results for CT-CS-Images but is inapplicable to rough log end images. The
grid based algorithm is well suited for pith estimation in rough log end images and achieves
the best results using a rectangular grid. Generally, the work shows that the block size, the
CHAPTER 2. CS-IMAGE ANALYSIS 16
distribution and the amount of blocks are crucial for the pith estimation accuracy.
Along with the described methods, a few other approaches are presented in Som et al. (1993),
Som et al. (1995), Chalifour et al. (2001), Sliwa et al. (2003) and Flood et al. (2003). These
methods are not examined in detail because these papers are not available to us. A structured
review about these methods is presented in Longuetaud et al. (2004).
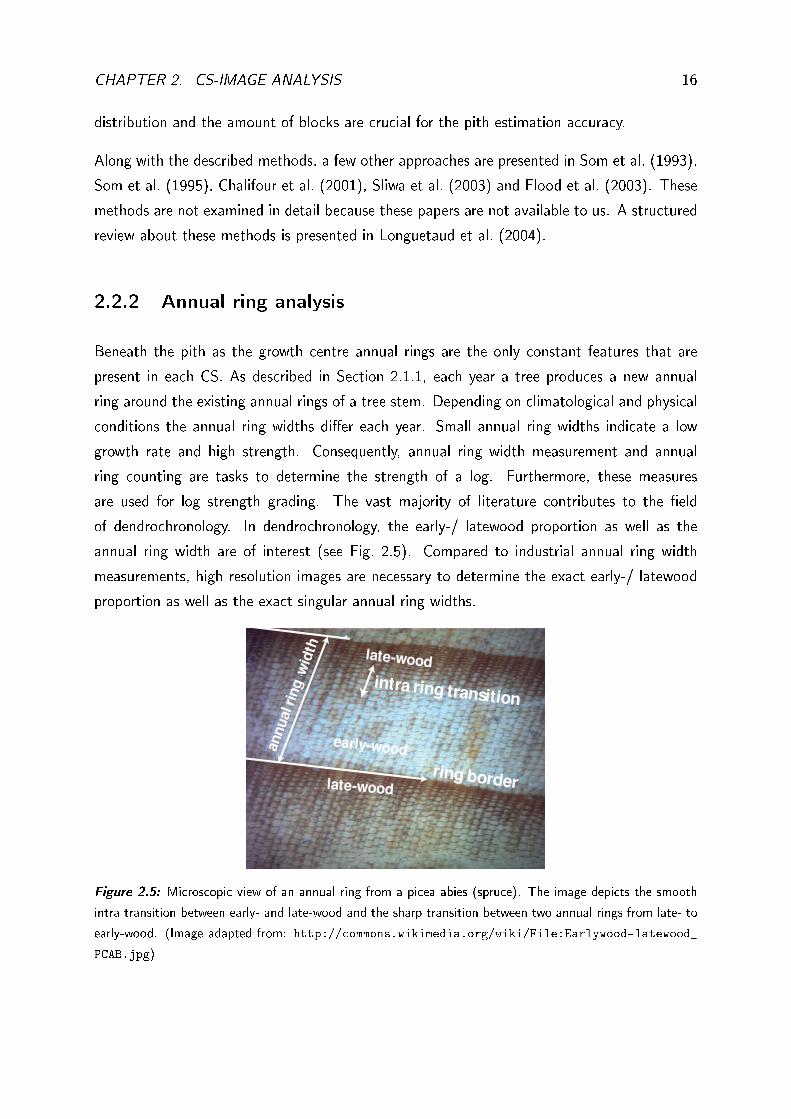
2.2.2 Annual ring analysis
Beneath the pith as the growth centre annual rings are the only constant features that are
present in each CS. As described in Section 2.1.1, each year a tree produces a new annual
ring around the existing annual rings of a tree stem. Depending on climatological and physical
conditions the annual ring widths di�er each year. Small annual ring widths indicate a low
growth rate and high strength. Consequently, annual ring width measurement and annual
ring counting are tasks to determine the strength of a log. Furthermore, these measures
are used for log strength grading. The vast majority of literature contributes to the �eld
of dendrochronology. In dendrochronology, the early-/ latewood proportion as well as the
annual ring width are of interest (see Fig. 2.5). Compared to industrial annual ring width
measurements, high resolution images are necessary to determine the exact early-/ latewood
proportion as well as the exact singular annual ring widths.
annual r
ing w
idth late-wood
early-wood
intra ring transition
late-woodring border
Figure 2.5: Microscopic view of an annual ring from a picea abies (spruce). The image depicts the smooth
intra transition between early- and late-wood and the sharp transition between two annual rings from late- to
early-wood. (Image adapted from: http://commons.wikimedia.org/wiki/File:Earlywood-latewood_
PCAB.jpg)

CHAPTER 2. CS-IMAGE ANALYSIS 17
2.2.2.1 Literature Overview
The focus in this thesis is on literature treating unprepared log end CS-Images and CS-Images
from unprepared CS discs. For the sake of completion, the literature overview approaches
treating CT-CS-Images or CS-Images from well prepared log end faces/ CS discs are described
�rst.
Tree Ring Analysis in Dendrochronology A big part of literature focuses on image
analysis to support dendrochronological tree ring analysis tasks. High resolution images of CS
slices are analysed and almost always sanded and probably polished before they are captured.
A major task in dendrochronology is to generate tree ring pro�les for tree ring dating which
is denoted as crossdating. For crossdating tree ring pro�les are matched with other pro�les.
Another aspect is to analyse the climatological circumstances over the tree life time using
its tree ring pro�le sometimes depicted as dendroecology. Consequently, dendrochronological
tree ring analysis approaches analyse radial vectors from the pith outwards to the border and
generate 1-dimensional tree ring pro�les. All known approaches are semi-automatic and require
that the pith is moved to the geometric image center or marked by an operator.
The �rst approach on tree ring analysis by McMillin (1982) is described at the beginning of this
Chapter 2.2. Further approaches for annual ring detection and annual ring width measurement
are presented in Rauschkolb (1994), Smith (1995),Conner (1999), Vaz et al. (2004),Laggoune
et al. (2005).
In the master thesis of Rauschkolb (1994) approaches to identify and measure annual rings
in high resolution images (400 dpi) of sanded log ends are introduced. The thesis focuses on
detecting annual ring boundaries which arise between early- and late-wood. Basically, there
are two boundaries that belong to a single annual ring. A slight border arises at the intra
ring transition between early- and late-wood. After winter, the annual ring growth starts with
fresh early wood and forms the real annual ring border. Then a strong and sharp crossover
between dark coloured late-wood and light coloured early-wood is produced (see Fig. 2.5).
As �nal algorithm the author introduced the "Hybrid Edge Detection from Center". For this
algorithm the pith position has to be moved to the geometric image center. For each radius
on a radial vector a set of 30 pixels is analysed. 15 pixels are taken from the left and right
side respectively. The 30 pixel values of each radius along the radial vector are stored in a
matrix. Each column represents a neighbour radial vector. Subsequently, the radial vectors in
the columns of the matrix are analysed. For edge detection central di�erences between two

CHAPTER 2. CS-IMAGE ANALYSIS 18
pixels on a radial vector are computed. Only pixel with a positive slope (transitions from dark
to light) are marked as edge pixels. Finally, the average slope is computed and marked edge
pixels smaller than the average are disregarded. Now the matrix is analysed and the edge
pixels of each row are summed up. Finally a histogram is produced. The peaks are de�ned as
being ring boundaries. This procedure is repeated four times for initially de�ned radial vectors
with π/2 angular distance to each other.
Smith (1995) described an algorithm which requires perfect annual ring patterns without
disturbances or interruptions. The algorithm starts from the outside towards the pith and
detects ring boundaries by contour tracing. Subsequently, the area between two boundaries
is calculated and assumed to be the annual ring area. As termination condition a �ood �ll
procedure was introduced. This procedure relies on the fact that the innermost area is the
smallest.
At the University of Arizona master theses regarding "TREES: computer assisted dendrochronol-
ogy" are presented by Conner (1999), Giribalan (2000) and Engle (2000) (http://www.ltrr.
arizona.edu/pub/trees/). The developed semi-automated system for dendrochronology of
Conner is also addressed in Conner et al. (1998) and Conner et al. (2000). The system analyses
an assembled set of images that are captured under a microscope from the pith outwards to the
bark (see Fig. 2.6). For annual ring border detection, the Canny edge detector (Canny, 1986)
was utilized. Non maxima suppression was performed by comparing the gradient magnitudes
of the neighbours into the gradient direction. This ensures that edge borders are only one pixel
wide. Additionally, the system uses the knowledge of the orientation of the captured annual
ring section. Edges where the gradient is orthogonal to the annual ring section orientation are
disregarded. At last, only transitions from late to early-wood (dark to light) are considered for
the �nal edge image, so intra-ring transitions are disregarded as well. After linking the found
edges, the ring widths are measured by counting and averaging pixel distances among them.
Several approaches to overcome problems with narrow ring widths are introduced in Vaz et al.
(2004). As a solution, the image scale (represented by the annual ring width) is determined
prior to annual ring detection. For this purpose, it is assumed that the gray value pro�le of an
annual ring in radial direction can be modelled by a Gaussian pro�le. Gaussian kernels with
di�erent scales are applied to radial vectors. The extrema for each scale are used to determine
annual ring centres of all annual rings lying on a radial vector. As intermediate step the signal
of the radial vector is analysed and false maxima and minima are removed. Finally, transitions
between early and late-wood are determined. First, the original signal of the radial vector is
reconstructed with cubic polynomials and a cross-entropy similarity measure between both is

CHAPTER 2. CS-IMAGE ANALYSIS 19
Figure 2.6: GUI of the TREES software for dendrochronology. (Image source: Conner (1999))
used to map the gray levels of a single annual ring into two classes. The border of the two
classes de�nes the intra ring transition and the annual ring borders (see Fig. 2.7).
Figure 2.7: Estimation of intra- and annual ring borders. (Image source: Vaz et al. (2004))
Laggoune et al. (2005) paid attention to the image quality and proposed an edge detection
�lter adopted to noisy images. The test images were captured with a grayscale �at bed scanner
(600 dpi). After edge detection thinning and thresholding is performed. Now the annual ring
contours are searched analysing the neighbours into the gradient direction. Contours whose
length are below a certain threshold are eliminated. At last, the found annual ring contours
are used to reconstruct a 3D model.

CHAPTER 2. CS-IMAGE ANALYSIS 20
Industrial Annual Ring Analysis Approaches Annual ring analysis approaches for CS-
Images from rough log end ends/ CS discs are presented in Hanning et al. (2003), Cerda et al.
(2007) and Norell (2009a), Norell (2010).
In the work of Hanning et al. (2003) an approach to determine the average annual ring width
of rough log end boards is presented. With the intention to ful�l the requirements of DIN
4074 the pith position is required to determine the average annual ring width from the pith
position to one of the border corners. The pith estimation approach is described in Section
2.2.1. Determining the annual ring width is performed by computing the main frequency of
windows positioned along the line between the pith and the border edge. Some unacceptable
outliers indicate that the method requires further investigation for an industrial usage.
An algorithm to approximate annual rings on a CS with closed polygons is described in Cerda
et al. (2007). The pith position and the outer shape as polygon are required as input. First, the
Canny edge detector is applied to the input image. Using the pith position and the intensity
of each detected edge point, dark-to-light edges are determined for further processing. Now
polygons of di�erent scales (k) (each polygon can be represented as a function of the outer
shape and the pith position) are computed (see Fig. 2.8). Each detected edge point is assigned
to the closest polygon of a given scale. This results in an accumulator array where each
assigned edge point represents a vote for a certain polygon with scale k. The polygons with
local maxima in the accumulator array are assumed to represent an annual ring (see Fig. 2.8).
Figure 2.8: Polygons with di�erent scale based on the outer shape and the pith position (left). Based on
the accumulator array local maxima are chosen to represent annual rings (right). (Image source: Cerda et al.
(2007))
The �rst approach for a full automated ring width measurement system in images from rough
log ends was proposed by Norell (2009a). The system utilizes the pith estimation presented
in Norell and Borgefors (2008). The log end images were captured in a Swedish sawmill
and 20 images with clearly visible annual rings were used for the experiments. Additionally, a
synthetic set of log end images was produced for evaluation (Synthetic Log End Images - Norell
(2009b)). After preprocessing and pith estimation the algorithm determines a proper region
for annual ring counting. For this purpose, the image is divided into N circle sectors using the

CHAPTER 2. CS-IMAGE ANALYSIS 21
estimated pith position as center point. For all pixels at the CS, a local orientation estimate is
computed. In each sector, the sum of errors between the computed local orientation and the
pixel orientation relative to the pith is computed. Next, the contrast of the sector with the
lowest error is enhanced. In this sector, annual rings are detected in a radial range between 1
and 9 centimetres from the pith using the grey weighted polar distance transform (GWPDT)
presented in Norell et al. (2007) (see Fig. 2.9). Grey weighted polar distance transform can be
Figure 2.9: Illustration of the gray weighted polar distance transform. The left image shows the distance
image computed with GWPDT. The image in the middle illustrates computed paths from the angular to the
horizontal line. Finally in the right image the shortest paths between the two lines are selected. (Image source:
(Norell et al., 2007))
used to compute circular and approximately circular paths in grayscale images. For the chosen
sector two distance images are computed using the two sector borders as starting lines. Finally,
the two distance images are analysed along a radial vector placed at the mean sector direction,
which results in two one-dimensional vectors. Local minima in these vectors correspond to
annual rings. Before counting the annual rings, elastic registration is used to best match
the signals of the two one-dimensional vectors. After registration, the local minima of the
registered signals are utilized to count the annual rings. The experiments on the synthetic
images show that eccentric annual rings, small ring widths as well as disturbances result in
considerable errors. The experiment on the real log end images are less meaningful because
the test set was very small. One conclusion is that the proposed algorithm tends to count less
rings than counted by visual inspection. Results for counting annual rings on 75 Scots pine
logs are presented in Norell (2010). The approach is identical as the one proposed in Norell
(2009a), except that marks from un-even sawing were removed by Fourier Spectrum �ltering.
The results showed that the proposed approach performs acceptable in a range from 12 to 20
rings. The author concluded that counting annual rings in a sawmill environment is a very
di�cult task mainly in�uenced by sawing disturbances.
Similar to Hanning et al. (2003), in Österberg (2009) local Fourier Spectrum analysis is used
for pith estimation and several other algorithms (e.g. thickness �elds, annual ring counting)
are applied to images from well prepared CS discs. The pith estimation algorithm is described

CHAPTER 2. CS-IMAGE ANALYSIS 22
in Section 2.2.1. For annual ring counting, a sliding window is moved along a prede�ned
radial vector where the rings are to be counted. For each pixel on the line the local Fourier
Spectrum is calculated using an appropriate window size. The dominating frequencies of the
Fourier Spectrum of each pixel are determined and in combination with the line length the
amount of annual rings is determined.
2.2.3 Further Literature on CS Analysis
Further literature on CS analysis mainly focuses on CT-CS-Images. A stack of CT-CS-Image
slices from an entire wood log enables the non-invasive analysis of the internal log structure.
The analysis of the internal log structure is required for two reasons. First, automated internal
log defect detection systems promote the development and the standardisation of automated
log grading systems. Second, internal log defects in�uence the physical properties and the
visual appearance of the �nal wood products. The knowledge about internal log defects is
used to improve the saw intake which increases the yield and the value (e.g. Berglund et al.
(2014)).
Several wood properties and features visible on CT-CS-Images are labelled as wood defects.
In case of analysing the internal log structure such defects are entitled as internal log defects
(e.g. knots, resin pockets, cracks, spiral grain and compression or reaction wood). Beside the
detection of internal log defects approaches for the detection of further wood properties not
labelled as defects have been presented.
Subsequently, an overview on the most common literature treating log defect detection and
the detection of further wood properties (bark detection and the detection of the hard- and
sapwood boundary) is presented.
2.2.3.1 Log Defect Detection and Analysis
Except spiral grain all defects are detectable due to their speci�c gray values, geometric shapes
and their location/orientation in CT-CS-Images. The majority of the related literature �rst
determines defect regions in each CT-CS slice using di�erent segmentation and clustering
techniques. In case of CT-CS-Images it is assumed that di�erent wood defects are represented
by gray values in a certain grayscale range. By combining the information of all CT-CS-Image
slices a 3D model of each detected defect is generated. Eventually, each 3D model is assigned
to a certain wood defect using di�erent approaches and techniques. The present literature

CHAPTER 2. CS-IMAGE ANALYSIS 23
mostly di�ers in the procedure how the detected objects are assigned to a certain wood defect.
Spiral grain detection works in a di�erent way. The detection of spiral grain can only be
established by comparing a set of longitudinal neighboured annual ring structures extracted
from the CT-CS-Image stack.
The �rst algorithm for defect detection in CT-CS-Images is described in Funt (1985) and Funt
and Bryant (1987). This algorithm aims to segment and cluster similar gray-scale coloured
regions and to classify the kind of defect based on 2D features of the previously segmented
regions. Segmentation is based on histogram multi-thresholding. Each pixel is assigned to
a certain class representing a set of possible defects. For example, knots are considered to
be represented by the darkest pixels. In a further step the pixels of each class are clustered.
Eventually, 2D information like size and orientation criterion's are used to validate if a cluster
represents a certain defect. For example, knots have an elliptical shape and are longitudinal
aligned into the direction of the pith position.
At the beginning of the 1990s di�erent groups of researchers presented various approaches for
internal log defect detection. Australian researchers presented CT-CS-Image defect detection
approaches in Wells et al. (1991), Som et al. (1993), Som et al. (1995). As noted in the
literature overview on pith estimation (see Section 2.2.1.1), these publications are not available
to us and cannot be examined. Further information on these works can be found in the
literature review on knot detection by Longuetaud et al. (2012).
Many publications on log defect detection are published by researchers from the Virginia
Polytechnic Institute and State University. For example, in Zhu et al. (1996) a prototype for
analysing CT-CS-Images of hardwood logs is presented. This prototype is the �nal result of a
set of earlier published works (see literature review in Longuetaud et al. (2012)). It consists of
a segmentation module and a scene analysis module. The segmentation module �rst applies
the Unser �lter to remove annual rings from the CT-CS-Image. In the next step, similar
as in Funt and Bryant (1987) adaptive histogram mulit-thresholding is utilized. According
to the Ph.D.-thesis of Zhu (1993), the pixels are assigned to three di�erent classes. For
example, knot and bark pixels are in the same class and are separated by the scene analysis
module. Morphological operations are applied to determine 2D regions representing wood
defects. Finally, a 3D model is generated by clustering of the 2D areas of all slices together.
For each detected object, geometric features and colour features are computed. Finally, the
Dempster-Schafer theory of evidential reasoning is used to classify the kind of wood defect of
each object. For this, basic knowledge about the shape, colour and location/ orientation of
each wood defect is utilized.

CHAPTER 2. CS-IMAGE ANALYSIS 24
Further publications published by researchers from the Virginia Polytechnic Institute and State
University focus on arti�cial neuronal networks (ANNs) used to classify internal log defects
(see Li et al. (1996), Schmoldt et al. (1997), Schmoldt et al. (1998) and Schmoldt et al.
(2000)). A prototype system based on the noted previous works on ANNs is presented in
Sarigul et al. (2003a) and Sarigul et al. (2003b). These publication provide a good overview
on log defect detection using ANNs.
Further research on log defect detection has been published by researches from the University
of Georgia. In Bhandarkar et al. (1996) and Bhandarkar et al. (1999) the system CATALOG
(Computer Axial Tomography for Analysis of LOGs) is described. The system uses 3D shape
parameters to classify and 3D render internal log defects. In recent two publications, Bhan-
darkar et al. (2006) and Bhandarkar et al. (2008) presented a new approach based on Kalman
�lter tracking algorithms.
Further approaches are presented by Rojas et al. (2006), Wei et al. (2009), Baumgartner et al.
(2010), Breinig et al. (2012), Longuetaud et al. (2012) andCristhian A. Aguilera (2012).
In Rojas et al. (2006) two supervised classi�cation algorithms (minimum distance classi�er and
maximum likelihood classi�er) for wood defect detection are introduced and evaluated. The
work of Wei et al. (2009) evaluates the applicability of a back propagation arti�cial network and
the maximum likelihood classi�er for wood defect detection in sugar maple and black spruce.
In Baumgartner et al. (2010) the main focus lies on knot detection just in the heartwood
region. For this purpose, the sapwood�hardwood boundary was detected in polar transformed
CSs using the pith as pole.
Knot Detecion A knot-detection (3DKnotDM) software package and exhaustive experi-
ments and tests on the accuracy and timing performance are presented by Longuetaud et al.
(2012). Additionally, this work includes a well-structured literature review on knot-detection
in CT-CS-Images. Finally, in Cristhian A. Aguilera (2012) the idea of using active contours to
detect internal log defects using a-priori information is introduced and evaluated.
Based on the results and insights presented in Longuetaud et al. (2012) further research on
knot detection was presented in Krähenbühl et al. (2014); Roussel et al. (2014) with the aim
to improve knot detection in wet areas like sapwood.
As knots are by far the most frequent internal log feature several publications within the CT-
PRO project 2010-2013 focused on knot detection algorithms, their accuracy and how knot
detection in�uences the performance of the sawing optimization (https://www.sp.se/en/

CHAPTER 2. CS-IMAGE ANALYSIS 25
index/research/CT-Pro/Sidor/default.aspx)):
In Johansson et al. (2013) the knot detection approach by Grundberg and Grönlund (1992)
was adopted to high-speed CT scanner CT-CS-Images and the algorithm was tested on Scots
pine and Norway spruce logs by comparing the knot detection results to groundtruth data.
Based on this algorithm, in Fredriksson et al. (2014b) the detected knots are projected from
3D to a 2D plane perpendicular to the log length axis with the aim to reduce the amount of
data (Fig. 2.10). The centre of mass of the knot projection image together with the centre
of a prede�ned sawing pattern are used to determine the log rotation for the saw intake.
Simulation results indicated that the board quality increases compared to the industrial praxis
of sawing logs horns down. In his PhD thesis Breinig (Breinig, 2015) focused on the accuracy
Figure 2.10: Projection of the detected knots from 3D to 2D. Based on the 2D knot image and a given saw
pattern the best rotation for sawing is determined. (Image source: (Fredriksson et al., 2014b))
of knot detection and the impact of di�erent knot detection errors on the performance of
the sawing optimization. In Breinig et al. (2012) the accuracy of a knot detection algorithm
was assessed by comparing the results to spatial measurements on the corresponding real log
CSs. The impact of knot detection errors on the performance of the sawing optimization was
investigated in Breinig et al. (2013) based on sawing simulations. Furthermore, in Breinig
et al. (2014) an approach for appearance classi�cation of wood board surfaces based on the
knot-pattern is shown. Finally, in Breinig et al. (2015) for 57 CT scanned logs the cutting and
the resulting board surfaces were simulated and virtually graded using the proposed algorithm.
The results were compared to the real human graded board surfaces after cutting the logs.
Results indicated that the obtained virtual grading results are largely consistent with the human
perception and grading results.
2.2.3.1.1 Further Defects: Detection and Analysis So far, the listed literature treats
the general task of internal log defect detection or specialises on knot detection and analysis.

CHAPTER 2. CS-IMAGE ANALYSIS 26
A few other publications focused on the detection or analysis of cracks. Approaches for crack
detection in CT-CS-Images are published by Bhandarkar et al. (2005), Li and Qi (2007) and
Wehrhausen et al. (2012). In Bhandarkar et al. (2005) Sobel-like �lters are used to detect
annual rings and cracks which are aligned orthogonal to the annual ring structure. A recent
approach presented by Wehrhausen et al. (2012) also uses directional �lters and focuses on
the evaluation of the approach. A novel approach based on fractal dimension is presented by
Li and Qi (2007).
Another wood defect is compression wood or reaction wood. The only found work treating
automated compression wood detection in CT-CS-Images or RGB CS-Images is presented by
Nystrom and Hagman (1999). It seems that there is no further literature on compression/
reaction wood detection.
Literature on spiral grain detection using ct-image slices of logs are presented in Sepúlveda
(2001), Sepúlveda et al. (2002), Ekevad (2004) and Entacher et al. (2007). The approach
presented by Sepúlveda (2001) manually analyses streaks in surfaces that are generated by
cutting the CT-CS-Image stack concentrically around the pith. The streak inclination relative
to the longitudinal axis corresponds to the spiral grain. In Sepúlveda et al. (2002) the authors
tried to predict spiral grain based on variables extracted from CS-Images (e.g. knot volume
and heart/sapwood relation). The results indicated that prediction of spiral grain should be
possible.
Another algorithm to determine spiral grain is presented by Ekevad (2004). Principal directions
of inertia of spheres that are distributed along the longitudinal axis of a log or wood board
can be used to compute local �bre-directions which represent the local spiral grain angle.
Eventually, the applicability of motion estimation algorithms for spiral grain detection is eval-
uated in Entacher et al. (2007). For this purpose, the CT-CS-Image stack is interpreted as
video data and three di�erent motion estimation techniques are assessed. The results are too
irregular and it is not clear if the detected movements are correlated to spiral grain in wood.
2.2.3.2 Further Wood Properties: Detection and Analysis
The group of wood properties that are not labelled as defects and which are relevant for
CS analysis tasks is formed by the pith, annual rings, heart- and sapwood and the bark.
Annual ring analysis and pith estimation were treated in Section 2.2.1.1 and Section 2.2.2,
respectively. Subsequently, the most common literature treating detection and analysis of bark

CHAPTER 2. CS-IMAGE ANALYSIS 27
and heart-/sapwood is quoted.
For heart- and sapwood detection, approaches based on heat sensitive infra-red images (Gjer-
drum and Høibø (2004)) and CT-CS-Images (Longuetaud et al. (2007)) were published. In
Gjerdrum and Høibø (2004) an approach to detect heartwood in Scots pine using heat infra-
red images of log ends is introduced. Due to the di�erent physical structure of heart- and
sapwood their moisture contents di�er which results in di�erent temperatures. Consequently,
heart- and sapwood can be clearly identi�ed in heat infra-red images of log ends.
The heart-/sapwood boundary detection algorithm proposed by Longuetaud et al. (2007) uses
the pith position and analyses the gray values of 360 radii. For each radii the �rst pixel
exceeding a certain threshold is chosen as boundary point.
At last, bark detection is considered. Automated bark detection enables to determine the exact
volume of a wood log without debarking it. For some wood species it is critical to remove
the bark for longer periods - e.g when storing it on the sawmill yard. Basically, no research
focuses on the particular task of bark detection. However, most of the approaches in the
literature on log defect detection are able to detect and analyse the bark in CT-CS-Images.
An industrial solution for bark detection is provided by Microtec (http://www.microtec.
eu/de). A scanner entitled TOMOLOG automatically creates a 3D pro�le of the log with and
without bark. In Baumgartner et al. (2007) results for automatic bark measurements using
the TOMOLOG scanner are presented.
2.2.4 CS Segmentation
Generally, image segmentation is a fundamental image analysis task. Segmentation enables
the detection of constituent regions or objects in an image. Algorithms for image segmentation
can be subdivided into two categories: approaches based on discontinuity or approaches based
on similarity of the pixel intensity values. Discontinuity approaches rely on boundary detection
of an object or a region. Abrupt intensity value changes between neighbouring pixels indicate
borders of objects or regions (e.g. edges or lines). Similarity approaches partition an image
into regions based on similarity criteria (Gonzalez and Woods, 2001).
CT-CS-Images can be segmented using histogram thresholding techniques. Such an approach
is not applicable for CS-Images of rough log ends. Subsequently, an exemplary comparison
on segmentation using histogram thresholding techniques is presented. For this comparison,
di�erently captured CSs are used. The results give information about the di�erences of CS

CHAPTER 2. CS-IMAGE ANALYSIS 28
Figure 2.11: Two di�erent threshholding techniques (p-tile and adaptive) applied to a CT-CS-Image (Image
source: Schraml (2013))
segmentation in CT-CS-Images compared to CS-Images from rough log ends. Basically, CS
segmentation can be performed for two reasons: First, segmentation is required to separate
the CS in an CS-Image from the background. Second, annual rings are the main wood property
of a CS. Consequently, the extraction and preservation of annual rings and structures are very
important for further annual ring analysis tasks.
Thresholding methods are well suited for segmenting CSs in CT-CS-Images. In CT-CS-Images,
annual rings are represented as white pixel chains and the background is dark coloured. Con-
sequently, thresholding can be utilized for segmentation and to extract or emphasize annual
ring structures and other wood features. In other words, the CSs features are separated as
foreground pixels from the background pixels. The three pictures in Fig. 2.11 illustrate the
results for two di�erent thresholding techniques applied to a CT-CS-Image. One technique is
a global thresholding technique and the second one is based on adaptive thresholding. The
�rst picture in Fig. 2.11 depicts the original CT-CS-Image. The second picture shows the
result for global p-tile thresholding with an assumed foreground amount of 50 %. In the third
picture, the result for adaptive thresholding is shown. For adaptive thresholding, the mean
values of 15x15 pixels blocks are used as local thresholds. Both thresholding methods indicate
that thresholding is an appropriate technique for CT-CS-Image segmentation.
The same thresholding techniques using the same parameters are applied to the CS-Image of
a sanded CS slice shown in the �rst picture of Fig. 2.12. The result for adaptive thresholding
shows that this method is very sensitive to noise in the black background. However, both
methods indicate that the CS can be separated from the background and annual ring structures
can be extracted in studio-captured images of sanded CSs.
Finally, the thresholding results in Fig. 2.13 illustrate the arising di�culties using real-world
images of rough log ends. In contrast to CT-CS-Images and studio captured CS-Images, the

CHAPTER 2. CS-IMAGE ANALYSIS 29
Figure 2.12: Two di�erent threshholding techniques (p-tile and adaptive) applied to a CS-Image of a sanded
CS slice (Image source: Schraml (2013))
Figure 2.13: Two di�erent threshholding techniques (p-tile and adaptive) applied to a CS-Image of a rough
log end (Image source: Schraml (2013))
background of real world images is very heterogeneous and strongly varying in each image.
Additionally, CS-Images of rough log ends are disturbed due to cutting. The results in Fig. 2.13
show that histogram thresholding is no appropriate technique to separate CSs from the back-
ground and to extract or separate annual ring structures in real world images of rough log
ends.
Our work Schraml and Uhl (2014) is the �rst dealing with segmentation of the CS area in
CS-Images of rough log ends. We proposed a similarity-based region growing procedure for CS
segmentation. In the experimental evaluation di�erent texture features (intensity histograms
and Local Binary Patterns (LBP)) and histogram distances were utilized. Basically, the seg-
mentation algorithm is subdivided into three consecutive stages: Cluster initialization, growing
procedure and boundary estimation.
Cluster Initialization For cluster initialization the pith position is utilized and a prede�ned
number of clusters which are equally distributed close around the pith are selected. Each
cluster is initialised by computing three features which describe the contained texture.

CHAPTER 2. CS-IMAGE ANALYSIS 30
Figure 2.14: Illustration of the cluster grow-
ing procedure. (Image source: Schraml and Uhl
(2014))
Growing Procedure For the growing procedure
the neighbourhood of each cluster is analysed and
it is decided if a neighbourhood block is added
to the cluster or not. The procedure continues
until no more neighbourhood blocks can be added
(Fig. 2.14). Finally, the clusters are merged and
it is assumed that the merged cluster represents
the area of the CS.
Boundary Estimation The CS boundary is com-
puted in three consecutive steps. In the �rst
step boundary blocks of the merged cluster are
determined and selected with the aim to reduce
the amount of blocks (Fig. 2.15a). Second, cir-
cle/ellipse �tting is performed (Fig. 2.15b). This
step further reduces the amount of blocks and in the best case outliers are cut o�. Finally,
the alpha shape (Edelsbrunner et al., 1983) of all remaining blocks is computed (Fig. 2.15c)
and is used as a �nal estimate of the CS boundary.
Our algorithm showed the best results for intensity histograms as texture features and the
Earth Movers Distance (EMD) as histogram distance.
(a) Select border blocks (b) Fit circle/ ellipse (c) Alpha shape (α =50)
Figure 2.15: Cross-section (CS) boundary estimation (Image source: Schraml and Uhl (2014))

Chapter 3
Traceability of Wood Logs
3.1 Traceability De�nition
There are various de�nitions for traceability. Some of these de�nitions originate from research
and are therefore more or less related to a research topic. Others are de�ned by ISO quality
standards and are adapted to the scope of an application. Most of the literature available
focuses on part productions and on single companies (Kvarnström and Oghazi, 2008).
Like (Kvarnström and Oghazi, 2008, p.5) we use the de�nition from Töyrylä (1999) which
suits the continuous processes: "Traceability is the ability to preserve and access the identity
and attributes of a physical supply chain's objects." Kvarnström and Oghazi (2008) introduce
the terms "traceability system" and "traceability methods". Thereby the ability of traceability
is built up on a traceability system, which uses traceability methods to link process and object
data.
3.2 Log Supply Chain - LSC
The above presented de�nition restricts traceability to the supply chain for prede�ned objects.
Consequently it is necessary to de�ne the process or time span in which traceability of wood
logs as objects should be enabled. Päivinen and Lindner (2006) use the term Forest Wood
Chain (FWC) to collect processes in which forest resources are converted into services and
products. The author's focus is on the assessment of sustainability in Forest-Wood Chains.
So Päivinen and Lindner (2006) are aware of the fact, that there are a lot of di�erent FWCs.
31

CHAPTER 3. TRACEABILITY OF WOOD LOGS 32
In each of these FWCs logs are required as raw material. Logs have to be cut in the forest
and transported to a sawmill, pulp mill or another processing company. This sub-chain can
easily de�ned as a supply chain called LSC. In general the LSC is restricted to the lifetime of a
log. This lifetime starts when a single tree is felled and length cut into a number of logs. The
lifetime ends when a log is further processed e.g. by cutting and therefore stops existing to be
a single object. The term "LSC" indicates the objects and the time span for which we want
to enable traceability. It mainly involves forest based and processing industries like sawmills or
pulp mills.
3.3 Traceability Methods
The introduction classi�es three groups of traceability methods: Manual Labels, Badge Labels,
Transponders. These groups represent current methods used for traceability systems in the
LSC. Industry and many small sized companies make use of these methods. It depends on
the application of each method if it`s possible to identify each object in the supply chain. For
sustainability issues it would be su�cient to know the origin of each object. All methods rely
on a marking/reading principle and require additional equipment.
3.3.1 Manual Labels
The simplest and oldest methods are conventional paint (Fig. 3.1b), hammer and chisel labels.
While chisel labels are markings that are engraved with knives, conventional paint labels are
simply applied with spray cans or chalk. Another method is the use hammers with special
stamps to create brands at the log end faces. Although these practices are very old and
simple, forest smallholders prefer them. The major advantage of these methods is that they
are very cheap and resistant to abrasion and damaging. Normally these methods are used to
verify the origin of a log and not to identify it. Depending on the application these methods
allow identi�cation of each individual log. There are good solutions which show that these basic
methods can be improved for industrial usage. The company Otmetka (www.otmetka.com)
has developed a method where the harvester punches a set of hammer brands on the CS.
This unique punching label is then used as an identity code and can be scanned automatically
(Fig. 3.1a). Otmetka enhanced hammer brands to ful�l the requirement of identi�cation of
each log.

CHAPTER 3. TRACEABILITY OF WOOD LOGS 33
(a) Punching Label by Otmetka.
(Image source: www.otmetka.com)
(b) Marking with spray.
(Photo by Schraml)
Figure 3.1: Manual labels
3.3.2 Badge Labels
The second group of methods uses badge labels, consisting of paper, plastic or metal. These
labels can be printed with di�erent varieties of bar-codes, numbers or logos and provide the
possibility to integrate additional information. Badges can be applied manually or automatically
and are readable via scanning devices. Depending on how these labels are applied on the wood
logs, major disadvantages are damages, fall o�s and high prices compared to manual labels. In
sawmills or pulp-mills metal badges and plastic labels can lead to problems in some processing
steps. Therefore plastic badges consisting of a special plastic material are used. These are not
detected by metal sensors and dissolve when they come in contact with paper base.
Figure 3.2: Plastic badges from Latschbacher. (Image source:www.signumat.com)
3.3.3 Transponders
This group of labels contains all kind of transponders which can be applied on wood logs.
A major advantage is the fact, that transponders transponders can be scanned automatically
without having visual contact. Disturbances (e.g. snow or dirtiness) do not in�uence the scan-
ning quality and additional processing data can be transferred on the transponder. Therefore
RFID is used as technology. Data readers can access data stored on a transponder. When a
transponder enters the electromagnetic �eld of a data reader, data can be exchanged by radio

CHAPTER 3. TRACEABILITY OF WOOD LOGS 34
waves. RFID transponders can be active or passive and can be further distinguished by the fre-
quency range they use. Active RFID transponders need a power supply like a battery. Passive
ones are non-volatile and do not need any power supply to store data. Passive transponders
receive the required submission energy from radio waves via the antenna of the transponder.
Depending on the frequency range di�erent reading ranges result. While Low Frequency (LF)
transponders have a reading range of a few centimetres, High Frequency (HF) transponders
have a reading range up to 1.5 metres. Ultra High Frequency (UHF) transponder reach reading
ranges of several metres. Consequently, higher frequencies reach a better reading range and
enable bulk reading, but they are more sensitive to dielectric material like metals or liquids
(Kvarnström and Oja, 2008).
a b
dc
Figure 3.3: Di�erent transponders:
a) Nail and Chip LF RFID Transponder. (Image source: Korten and Kaul (2008))
b) UHF RFID Transponder presented by Uusijärvi (2010)
c) RFID Transponder in batch format by Latschbacher. (Image source: www.signumat.com )
d) Lignin RFID Transponder by Fraunhofer (2010)
The two EU-projects Lineset and Indisputable Key propose RFID transponders in the LSC
as traceability method. In the Lineset project the use of LF RFID transponders has been
studied and pilot-tested. The image in Fig. 3.3 a) shows typical LF RFID tags . Because of
higher reading ranges, the Indisputable Key project studied the use of UHF RFID transponders
in which a special UHF RFID tag has been designed. These transponders promise higher
reading ranges and rates as well as lower costs compared to LF RFID transponders. The
most promising transponder with a reading range of 2 meter is shown in Fig. 3.3 b). This
transponder is applied at the CS. In doing so mechanical damaging is low. Another UHF RFID

CHAPTER 3. TRACEABILITY OF WOOD LOGS 35
transponder is shown in Fig. 3.3 c) and is presented as preview by the company Latschbacher
in Austria. It promises reading ranges up to 4 metres. It depends on the transponder material
and the costs whether it is necessary to remove a transponder before a log is further processed.
The Fraunhofer Institute presented a RFID Transponder which mainly consists of lignin. Lignin
transponders have a low metal concentration and provide the possibility to save a single number
(Fraunhofer, 2010). Bulk reading ability and no disruption of further processing steps make
these transponders very interesting for future applications.

Chapter 4
Biometric Wood Log Traceability
The idea of using biometric characteristics for human recognition has been carried to the
recognition of plants, vegetables, animals and industrial products. Hence, the concept of
human biometrics was also carried to tree log recognition. By analogy to human recognition,
it is assumed that wood logs are unique entities which can be recognized using biometric log
characteristics.
This chapter �rst introduces theoretical background on biometic systems in Section 4.1 and
second provides a structured review on research related to biometric log recognition in Sec-
tion 4.2.
4.1 Biometric Systems
With the signi�cant changes in society and economy human recognition became a major
task in our life. Related to human recognition the term Biometrics stands for the study
of behavioural or physiological characteristics to identify living people. Biometric systems
are almost always computer aided systems for biometric recognition of humans. Currently
used biometric systems use characteristics like �ngerprints, iris, retina, handwriting, face, gait
and many more to extract biometric features of living persons. Beneath biometric systems for
human recognition - approaches treating recognition of vegetables, plants, animals or products
were presented (Wayman et al., 2005).
These approaches are based on the theoretical background and concepts from human recogni-
tion to explore biometric systems for new �elds of applications. Subsequently, an introduction
36

CHAPTER 4. BIOMETRIC WOOD LOG TRACEABILITY 37
to biometric system characteristics (Section 4.1.1) and the performance evaluation of biometric
systems (Section 4.1.2) is given.
4.1.1 System Characteristics and Classi�cation Categories
In this section characteristics and classi�cation categories of biometric systems are considered
in detail. For this purpose categories and modes of biometric systems as described in Maltoni
et al. (2009) are presented.
Veri�cation vs. Identi�cation mode Commonly, biometric systems are either classi�ed
as identi�cation or as veri�cation systems, whereat recognition is used as universal term
regardless of the operation mode. Both modes require that humans become enrolled into
the system (see Fig. 4.1). Depending on the used biometric characteristics speci�c sensors
are used to capture/ digitize the related characteristics. Next, the biometric system extracts
features from the captured characteristics. Out of these features a compact and comparable
representation, called template is generated. Commonly, biometric applications store the
template together with personal information (e.g. an ID or name) into a database or data
carrier.
capture
characteristics
feature
extractortemplate
DB
personal
information
Figure 4.1: Biometric system - enrolment schemata
The two operation modes can be distinguished regarding the recognition procedure of the
system:
� Veri�cation systems are based on one-to-one comparison. A person requesting au-
thentication by the system has to announce the claimed identity to the system using
personal information (e.g. ID, PIN, magnetic cards, ...). The system then compares
the biometric characteristics of the person to those from the pre-stored template of the

CHAPTER 4. BIOMETRIC WOOD LOG TRACEABILITY 38
claimed person in the system database. Consequently, the system can accept or reject
the claimed identity. The term authentication is likely used as synonym for veri�cation,
as veri�cation con�rms or negates the claimed identity of a person.
� Identi�cation systems perform one-to-many comparisons. For each request of a person
the system compares all pre-stored templates in the system database to the template
generated from the biometric characteristics of the person. The system has to make
a decision if the person is enrolled in the system. Consequently, a single template in
the database has to be selected as the person's template. If there is no corresponding
template available, the system fails and rejects the claim for identi�cation.
Beside the basic classi�cation into veri�cation or identi�cation systems a biometric system can
operate in further modes:
� online vs. o�ine
Recognition can be performed immediately or with a long delay response. Online systems
are almost always fully automatic, while o�-line systems are likely to be supervised semi-
automatic systems.
� positve vs. negative recognition
A system that operates in positive recognition mode tests if a person is already enrolled.
Thereby the system checks if the claimed (explicit or implicit) identity is correct or
not. Consequently, it prevents di�erent users from using the same identity. In the
negative recognition mode the system checks if the person is not enrolled in the system.
It prevents a single user from using multiple identities. Positive recognition can be
performed in identi�cation or veri�cation systems. Due to the fact that all templates
have to be checked, negative recognition can only be established in an identi�cation
system.
Application Taxonomy: Additionally to these basic classi�cations biometric systems can
be described using application-dependent categories (Wayman et al., 2005):
� overt vs. covert
� habituated vs. non-habituated
� attended vs. non-attended
� standard vs. non-standard environment
� public vs. non-public
� open vs. closed

CHAPTER 4. BIOMETRIC WOOD LOG TRACEABILITY 39
Biometric characteristics quality: The development of a biometric system relies on the
quality of the selected biometric characteristics. The quality of a biometric characteristic can
be assessed considering a set of criteria (Maltoni et al., 2009):
� universality - is the characteristic available for each person?
� distinctiveness - is it possible to receive a strong variation between a set of individuals?
� permanence - is it invariant against change over time?
� collectability - can it be captured or digitized with sensors?
� performance - di�erent measures that describe the accuracy, robustness and speed of
the system using the characteristic (see Section 4.1.2)
� acceptability - is it tolerated by the individual to capture or digitize the characteristic?
� circumvention - is it possible to defraud the biometric system?
Compared to the other criteria, performance, acceptability and circumvention are criteria used
to evaluate and describe the biometric system. The other criteria describe the quality of the
biometric characteristic itself.
4.1.2 System Performance Evaluation
This section describes (error) measures that are used to assess the performance of biometric
systems as described in Maltoni et al. (2009). Each time a biometric system compares two
templates, a matching algorithm computes a matching score (s) normalized between 0 and
1. The closer to 1 the higher is the certainty that the templates are from the same person.
The decision if two templates are said to be from the same person depends on a threshold
(t). If the matching score between two templates is lower than the system's threshold, the
two templates form a non-matching pair, otherwise they form a matching pair. Out of this,
two biometric system errors are derived:
� False match or false acceptance
denotes a matching pair where the com-
pared templates are not from the same
person
� False non-match or false rejection
denotes a non-matching pair where the
compared templates are from the same
person

CHAPTER 4. BIOMETRIC WOOD LOG TRACEABILITY 40
It has to be noted that the terms "false acceptance" and "false rejection" have di�erent
meanings in positive or negative recognition mode. Instead, false match and false non-match
have the same mode-independent meaning. Nevertheless, in practical use the terms "false
match" and "false non-match" are preferably used. The performance evaluation of a biometric
system is based on the computation of the false match rate (FMR) and the false non-match
rate (FNMR). These rates can be determined considering the impostor and genuine distribution
of the system:
� Impostor Distribution
of the matching scores of each enrolled
template of a single person to all tem-
plates of the other enrolled persons - can
also be denoted as interclass variance.
� Genuine Distribution
of the matching scores between several
templates generated from the biometric
characteristics of a single person - can
also be denoted as intraclass variance.
Figure 4.2 illustrates how the FMR and FNMR are determined for a certain threshold and given
impostor and genuine distributions of a biometric system. For a positive recognition system the
FMR describes the percentage of comparisons that would be accepted by the system although
the templates are from di�erent persons. The FMNR gives the percentage of comparisons
that would be rejected although the templates are from the same person. Consequently, the
Threshold (t)
Matching score (s) 10
Pro
bab
ility
(p
)
FMR
FNMR
Genuine distribution
Impostor distribution
Figure 4.2: Biometric errors: FMR and FNMR for given impostor and genuine distributions at a certain
threshold (t). (Template: Maltoni et al. (2009))
selection of the threshold in�uences the performance of the biometric system. For example,
a high security application will choose a high threshold, taking into account that the system
denies access for a higher percentage of actually authorized persons - increasing FNMR and
decreasing FMR. Alternatively, tolerant systems use lower thresholds to ensure that a high

CHAPTER 4. BIOMETRIC WOOD LOG TRACEABILITY 41
amount of authorized persons are accepted and so decreasing the FNMR. As described in
Section 4.1.1, a biometric system operates either in veri�cation or identi�cation mode and the
term recognition is used universally. In both modes the system has to decide if the template
of an individual/ object is known to the system.
For veri�cation performance evaluation the equal error rate (EER) is a general benchmark.
The EER is de�ned as the error rate at the threshold where FMR and FNMR are equal. EER
is likely used as measure for the comparison of di�erent biometric systems. Because FMR and
FNMR are depending on the threshold value they can be described as functions FMR(t) and
FNMR(t) as illustrated in the plot in Fig. 4.3a. This plot o�ers further points of interests like
the zero false match rate (ZFMR) and the zero false non-match rate (ZFMNR).
Another possibility to get an overview on the veri�cation performance of a biometric system
is to analyse its receiver operating characteristic (ROC). This curve visualizes the dependency
of the FMR on the FNMR for changing system thresholds. Figure 4.3b depicts a sample
illustration for a ROC curve and the resulting use cases using di�erent thresholds. It is shown
that low security applications (e.g. forensic applications) require a low FNMR and therefore
take a higher FMR into account. High security applications have to ensure that they can only
be accessed by authorized people and so they require a low FMR. On the other hand a lower
FMR implies a higher FNMR and so the amount of actually authorized people that are not
recognized by the system increases.
Threshold(t)0
Err
or
EER
FNMR (t)
FMR (t)
ZFNMRZFMR
(a) Equal error rate estimation - Illustration of the FMR(t)
and FMNR(t) curves and the corresponding points of inter-
est.
False Non Match Rate (FNMR)0
Fals
e M
atch
Rat
e (FM
R)
EER
Low Security
High Security
(b) Illustration of a receiver operating char-
acteristic and the corresponding use cases
(ROC).
Figure 4.3: Biometric performance curves. (Templates: Maltoni et al. (2009))

CHAPTER 4. BIOMETRIC WOOD LOG TRACEABILITY 42
The identi�cation performance is evaluated by matching a set of probe templates to all tem-
plates enrolled in the database Jain et al. (2007). We refer to closed-set identi�cation where
it is assumed that all individuals/objects of the probe templates are enrolled in the system.
The MSs between each probe template and all database templates are ordered according to
the MS. The ordered MSs of each probe template are used to compute the probability that
the correct template is ranked within the top k-ranked MSs. The probabilities for each rank
are illustrated in a curve which is denoted as Cumulative Match Characteristic (CMC).
4.2 Research on Biometric Log Recognition
So far the research related to log recognition can be subdivided into four groups:
1. Log Shape Recognition In the works of Chiorescu and Grönlund (2003, 2004); Flodin
et al. (2008a) the log shape is used as biometric characteristic and geometric properties
are utilized as biometric features.
2. Knot Recognition The investigations in Flodin et al. (2007, 2008b) show that knots
and their locations are suited as biometric characteristics and features, respectively.
3. Log to Board Recognition Equal as in the previous group knot positions are utilized in
(Flodin et al., 2008a,b) to establish traceability between logs and the boards sawn from
it. Furthermore, Peterson (2009) showed a preliminary study on log to board tracking
using the pixel correlation between the log and board end face annual ring patterns.
4. Log End Recognition The group of research which directly relates to the topic of this
work uses the log end of a log as biometric characteristic. Annual ring pattern and/or
shape information are utilized as biometric features. Works treating log end biometrics
were presented by Barrett (2008); Schraml et al. (2014b, 2015d,b,a).
In the subsequent sections a literature review on research in each group is presented. Addi-
tionally, Section 4.2.4 presents recent research dealing with wood board recognition.
4.2.1 Log Shape Recognition
In the works of Chiorescu and Grönlund (2003, 2004) measurement data from the outer shapes
of logs are utilized as biometric features. The log shapes were captured with a two-axis log

CHAPTER 4. BIOMETRIC WOOD LOG TRACEABILITY 43
scanner and a three-dimensional log scanner, respectively.
Basically, Chiorescu and Grönlund (2003) is the �rst work dealing with log biometrics. The
authors had the intention to use existing environment to enable log traceability. For their
experiments, the on-bark shape of 879.571 logs (spruce and pine) was scanned using a 2-axis
scanner. Out of this data seven biometric features (length, diameter, bumpiness, taper, butt,
bow and ovality) were computed and stored into a database. In a �rst step the whole dataset
was used to �nd the most discriminative feature set, considering di�erent combinations of
features. Results show that the best feature combination consists of four features: diame-
ter, length, taper and bumpiness. Using these features approximately 98% of the logs are
recognized as unique individuals. The second step investigates the measurement accuracy of
the utilized 2D-axis scanner. Hundred logs were measured �ve times at random rotational
positions. The standard deviations for each feature are used to assess the measurement ro-
bustness. Based on the insights of the previous investigations a tree-based searching algorithm
is introduced. The recognition rate for the proposed matching algorithm is evaluated by a sim-
ulation. Therefore a second test-set is created. This test-set is derived from the measured
log features and incorporates measurement deviations caused by the scanner. The simulation
indicates that the utilized 2-axis scanner is too inaccurate to accomplish a recognition rate
over 34%. The authors assessed that the scanner measurement accuracy and the recognition
algorithm have a major impact onto the recognition rate.
As a consequence of the previous insights Chiorescu and Grönlund (2004) used a three-
dimensional scanner. This scanner is normally used for optimal positioning of the logs into the
headrig and is able to create a complete three-dimensional shape model of a log. Out of this
model 27 parameter for optimal sawing are calculated. Nine of them were selected as biomet-
ric features. They were chosen with regard to their measurement robustness (volume, length,
area minimum diameter, middle diameter, log taper, top taper, bumpiness, relative taper and
bow). As test set 772 debarked logs were divided into three diameter classes and each log was
scanned three times. The �rst scan was performed after the log was debarked. Further two
scans were performed after storing periods of two weeks and two months. For the recognition
procedure two di�erent algorithms were proposed and tested. The �rst algorithm is a further
development of the search algorithm in Chiorescu and Grönlund (2003). It is an one-variable
procedural search based on a robustness ranking of the features. The robustness was esti-
mated regarding the measurement accuracy of the scanner during the repeated scanning of a
set of logs. Compared to this, the second algorithm uses all features concurrently based on
multivariate principal component analysis and a nearest neighbour search. Recognition rates
ranged between 80% and 95% depending on the diameter, matching algorithm and the time

CHAPTER 4. BIOMETRIC WOOD LOG TRACEABILITY 44
span between the scan cycles. Chiorescu and Grönlund (2004) advise that future work has
to pay attention on the in�uence of bark on the recognition rate. In most Swedish sawmills,
logs get debarked/ butt end reduced and scanned before they are processed by the headrig. It
follows that the �rst scan at the log sorting station is done with bark and the second scan is
done debarked and possibly butt-end reduced.
In the work of Flodin et al. (2008a) the authors take up the suggestion for future work in
Chiorescu and Grönlund (2004). The authors present investigations on traceability from the
log sorting station to the saw intake. Therefore, a special three dimensional scanner is used at
the log sorting station. In bark suppression mode, the scanner is able to di�erentiate between
clear wood and bark using the so-called tracheid e�ect of wood. For the experiments the logs
were scanned at the log sorting station and before the saw intake. The test-set is divided
into two diameter speci�c groups, each consisting of 50 logs. At the log sorting station, each
log was scanned three times with bark suppression and once without bark suppression. The
scan at the saw intake (each log got debarked and butt-end reduced) was done a month later.
For each scanned log 11 biometric outer shape features were extracted. Further, the features
were used to compute intra-measurement di�erences between the three bark-suppression log
scans and the inter-di�erences between scans from the log sorting station and the saw intake.
By analogy to the previous works the measurement di�erences are used to rank the features
regarding to their robustness and reliability for a �ngerprint approach. Like in Chiorescu and
Grönlund (2004), the matching is based on multivariate principal components analysis. The
recognition rate was computed comparing each log from the saw intake to all logs from the log
sorting station of the respective diameter group. For small sized logs and bark suppression a
recognition rate of 91.8% and without bark suppression 77.6% could be achieved. Large-sized
logs were hardly in�uenced by the butt-end reducer and consequently a recognition rate of
63.6% - bark suppression and 54% - no suppression could be reached.
4.2.2 Log to Board Recognition
Two publications from Jens Flodin (Flodin et al. (2007), Flodin et al. (2008b)) focus on
traceability between logs and cut boards. Each log was scanned with an x-ray and an optical
log scanner. The log length as well as the knot positions and lengths were extracted as
biometric features. After sawing, a surface scanner was used to determine the board lengths
and knot positions plus lengths of each board. These biometric features were used to match
each board to all logs of the test-set. Results show that this approach reaches a correct
matching for approximately 90% of all boards.

CHAPTER 4. BIOMETRIC WOOD LOG TRACEABILITY 45
Furthermore, in the master thesis of Peterson (2009) a feasibility study on using end-grain
characteristics to enable traceability between sawn wood and their parent logs is presented.
By using log end information his thesis is thematically related to log end recognition.
Sixty Douglas �r trees were cross cut at both ends which led to 120 CS slices. Each slice was
captured in a studio - three times over a period of three days. On each CS reference points
were used to capture three equally aligned CS-Images from each CS. The CS-Images were
then manually cropped and subdivided into cants and boards simulating end grain images of
sawn wood. As a matching score the ratio of the correlated pixels between two images is used.
No features were extracted and no image processing was performed. In the experiments board
images were matched against cant images and cant images against CS-Images. The matching
was performed between images from di�erent days. All matching con�gurations reached
recognition rates between 83% to 98%. However, the detailed results are less meaningful due
to the oversimpli�ed approach and experimental settings.
4.2.3 Log End Recognition
As described in Section 4.1, various works showed that concepts of human biometrics can be
transferred to other �elds of applications. By comparing human �ngerprints to the annual ring
patterns of log ends one perceives their similarity. Log end faces show biometric information
in terms of annual rings, pith position, shape and dimension. This raised the question if single
wood logs can be identi�ed using CS-Images of log ends as biometric characteristics.
Basically, the scheme of a biometric recognition system is set up on �ve components: Data
Acquisition, Preprocessing, Feature Extraction, Template Generation and Template Matching.
In case of log end biometrics, data acquisition is the capturing of digital CS-Images of log ends.
In the preprocessing stage CS analysis is performed. In case of CS-Images the CS in the CS-
Image is separated from the background (see Section 2.2.4). Furthermore, the pith position
needs to be detected which is required as reference point for CS alignment (see Section 2.2.1).
Finally, the annual ring pattern is enhanced. The preprocessed CS-Image is passed to the
feature extraction component which extracts information of the annual ring pattern and shape
of the CS. For template generation a compact and fast comparable representation of the
extracted features is computed.
Template matching is the task of veri�cation or identi�cation of an individual or subject. For
this purpose, the individual/ subject must be enrolled in the biometric system. In case of log

CHAPTER 4. BIOMETRIC WOOD LOG TRACEABILITY 46
Template
Computation
log
template DBMatcher
log
identity
Identification
Enrolment
Figure 4.4: Exemplary enrolment and identi�cation schemes for a biometric log recognition system (Image
source: Schraml et al. (2015a))
recognition, the enrolment procedure could be performed during the harvesting procedure in
the forest. An exemplary enrolment and identi�cation scheme for wood logs is depicted in
Fig. 4.4. For enrolment the end of a fresh cut log is captured using a digital camera mounted
on a harvester. Subsequently, the �rst four steps of the biometric system chain are completed
and the computed log template is stored to a database. Additionally, the harvester operator
can assign further informational meta data to each log template in the database.
CS-Images for identi�cation could be captured at the sorting station, at the sawmill yard or at
any conveyor belt equipped with a capturing device. A captured CS Image is then processed
by the biometric system and a log template is computed. This log template is matched to all
available log templates in the database. Commonly, the best match is used to determine the
identity of the log. Furthermore, additional meta data can be retrieved or appended from/ to
the log record in the database.
4.2.3.1 Literature Review
The �rst work on log end biometrics was presented by Barrett (2008) as an e�ort to curb
poaching of trees. In Fig. 4.5a the interface of the proposed biometric system is depicted.
In the experimental evaluation CS-Images of the tree stump and the corresponding log ends
are utilized. Both show up strong saw kerf patterns. As biometric features Pseudo-Zernike
moments were computed. For establishing rotation invariance CS-Images segmented by an
operator (Fig. 4.5a) are centred using the centre of mass. In the experimental evaluation
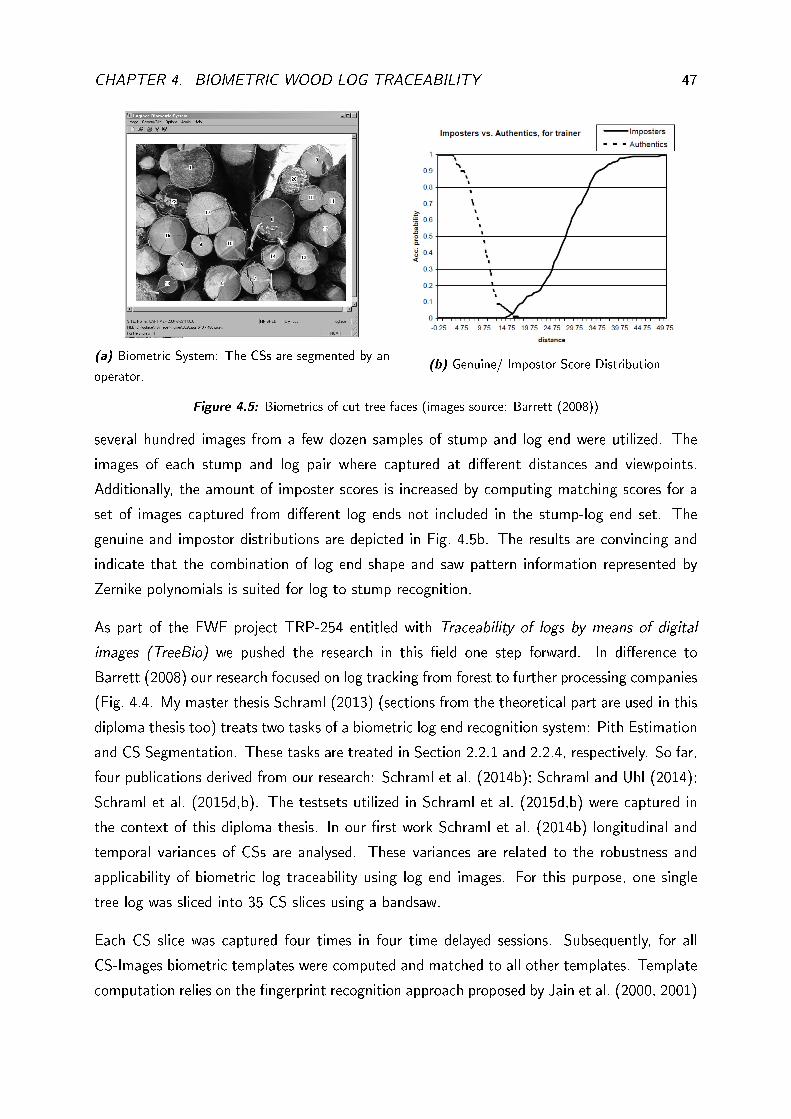
CHAPTER 4. BIOMETRIC WOOD LOG TRACEABILITY 47
(a) Biometric System: The CSs are segmented by an
operator.(b) Genuine/ Impostor Score Distribution
Figure 4.5: Biometrics of cut tree faces (images source: Barrett (2008))
several hundred images from a few dozen samples of stump and log end were utilized. The
images of each stump and log pair where captured at di�erent distances and viewpoints.
Additionally, the amount of imposter scores is increased by computing matching scores for a
set of images captured from di�erent log ends not included in the stump-log end set. The
genuine and impostor distributions are depicted in Fig. 4.5b. The results are convincing and
indicate that the combination of log end shape and saw pattern information represented by
Zernike polynomials is suited for log to stump recognition.
As part of the FWF project TRP-254 entitled with Traceability of logs by means of digital
images (TreeBio) we pushed the research in this �eld one step forward. In di�erence to
Barrett (2008) our research focused on log tracking from forest to further processing companies
(Fig. 4.4. My master thesis Schraml (2013) (sections from the theoretical part are used in this
diploma thesis too) treats two tasks of a biometric log end recognition system: Pith Estimation
and CS Segmentation. These tasks are treated in Section 2.2.1 and 2.2.4, respectively. So far,
four publications derived from our research: Schraml et al. (2014b); Schraml and Uhl (2014);
Schraml et al. (2015d,b). The testsets utilized in Schraml et al. (2015d,b) were captured in
the context of this diploma thesis. In our �rst work Schraml et al. (2014b) longitudinal and
temporal variances of CSs are analysed. These variances are related to the robustness and
applicability of biometric log traceability using log end images. For this purpose, one single
tree log was sliced into 35 CS slices using a bandsaw.
Each CS slice was captured four times in four time delayed sessions. Subsequently, for all
CS-Images biometric templates were computed and matched to all other templates. Template
computation relies on the �ngerprint recognition approach proposed by Jain et al. (2000, 2001)

CHAPTER 4. BIOMETRIC WOOD LOG TRACEABILITY 48
Subdivide intosmaller blocks
Template Generation
n
0° 22.5° 45° 67.5° 90° 112.5° 135° 157.5°
Ga
bo
r #1
- 6
Standard Deviation Maps
= (Feature vector composed by all StDev values)i
Enhanced CS-Image
Input CS-Image Pith Estimation/ Segmentation
Rotate & Scale
Registration and Enhancement
Feature Extraction
Preprocessing
CS-Code ( , .... , )1 n
i
1
n
Filtered CS Image StDev Map
Compute standard deviation maps for all filters:
Compute the gray value standard deviation blockwise
Subdivide intosmaller blocks
Feature extraction for different rotations
i
Section - filtered CS-Image Section - StDev Map
Filter CS-Image with each filter and compute the StDev Map
Figure 4.6: Log Template/ CS-Code computation illustration
(Image source: Schraml et al. (2015a))
which was adopted and extended to
work with CS-Images. This tech-
nique utilizes a Gabor-based de-
scriptor which extracts local ori-
entation and frequency information
from the annual ring pattern. Ro-
tation compensation is achieved by
computing feature vectors for ro-
tated versions of the input image
(Fig. 4.6).
The computed intraclass matching
scores were grouped into longitudi-
nal and temporal matching scores.
Longitudinal matching scores are
computed between the CS-Images
of di�erent slices for each session.
Temporal matching scores are com-
puted by matching the four time de-
layed captured CS-Images of each
CS slice.
Additionally, interclass matching
scores were computed by compar-
ing deliberately wrong rotated CS-
Images to each other. The score
distributions of the temporal, lon-
gitudinal and interclass matching
scores are illustrated in Fig. 4.7a.
The chart illustrates that the two
intraclass SDs show a low over-
lap with the arti�cially computed
interclass SD. A reasoning for
these overlaps becomes obvious by
analysing the subset structure of the
temporal and longitudinal SD.

CHAPTER 4. BIOMETRIC WOOD LOG TRACEABILITY 49
Results show that:
� With an increasing time span between two CS-Images of the same CS the matching
score gets worse (see Fig. 4.7b) .
� Adjacent CS slices show good matching scores. An increasing slice distance between
two CS slices deteriorates the matching score (Fig. 4.7c).
In our second work Schraml et al. (2015b) we shed light on the question if log end biometrics
are suited to discriminate between a large set of tree logs. To address this question we explored
the applicability of �ngerprint and iris-recognition based methods to identify 150 di�erent tree
logs. The �ngerprint-based method is the same as utilized in Schraml et al. (2014b), extended
by two matching procedures which incorporate shape information in di�erent ways. For the
iris-based methods di�erent feature extractors and matchers from the University of Salzburg
Iris Toolkit (USIT) are utilized. Additionally, for both methods the impact of enhancement
Longitudinal Temporal I n t e r
0 , 2 5 0 , 5 0 0 , 7 5 1 , 0 0L 1
0
5
1 0
1 5
2 0
2 5
3 0
3 5
Per
cen
tag
es
(a) Matching score distributions
0 , 1 0 , 2 0 , 3 0 , 4
L1
0 , 0
2 , 5
5 , 0
7 , 5
1 0 , 0
1 2 , 5
1 5 , 0
1 7 , 5
2 0 , 0
2 2 , 5
2 5 , 0
2 7 , 5
Percentages
2-4
2-3
1-2
2-3
3-4
1-3
2-41-4
(b) Temporal SD - stacked session subset
chart
1 2 3 4 5 6 7 8 9 1 0 1 1 1 2 1 3 1 4 1 5 1 6Slice distance
0 , 1 5
0 , 2 0
0 , 2 5
0 , 3 0
0 , 3 5
0 , 4 0
0 , 4 5
L1
1 2 3 4
(c) Longitudinal variances - matching score analysis
Figure 4.7: Temporal/longitudinal and interclass score distribution (SD) analysis (Images source: Schraml
et al. (2014b))

CHAPTER 4. BIOMETRIC WOOD LOG TRACEABILITY 50
(a) ENHNO (b) ENH2 (c) 512×512 ENHNO (d) 512×512 ENH2
Figure 4.8: Illustration of the impact of enhancement for the two di�erent techniques investigated in Schraml
et al. (2015b). The illustrations in (c,d) show polar transformed CS-Images utilized by the iris-based methods.
is assessed. All experiments were performed without and with two di�erent enhancement
procedures. Exemplary preprocessed CS-Images utilized by the di�erent methods are illustrated
in Fig. 4.8. The results provide �rst valuable insights on the general applicability of log end
biometrics to distinguish between a large set of tree logs. Results in Fig. 4.9 show that
�ngerprint and iris recognition based approaches can be successfully transferred to the �eld of
wood log tracking. Based on the variety of 150 logs the results indicate that both approaches
are suited for log identi�cation. In the identi�cation performance experiments the �ngerprint
based approach and all iris con�gurations which use Log-Gabor features (512 × 512 pixels
polar transformation format) achieve 100% detection rate at Rank 1. We conclude that Gabor
features are well suited to extract discriminative annual ring pattern features. All results
show that shape information is important to increase the performance and the robustness
of the biometric system. The best �ngerprint-based approach utilized shape information in
the matching procedure and the iris-based approaches rely on polar-transformation which is
based on the CS boundary and pith position. Also the approach by Barrett (2008) relies to
a high degree on shape information. Furthermore, all conducted experiments were based on
groundtruth (GT) data of the CS boundary and pith position.
NO E1 E2 NO E1 E2 NO E1 E2 NO E1 E2 NO E1 E2 NO E1 E2 NO E1 E2 NO E1 E2 NO E1 E2
MS(AP) MS(AP&S) MS(AP,F) lg,hd (all) ko,koc cr,hd lg,hd qsw,hd ko,koc
7 0
7 5
8 0
8 5
9 0
9 5
1 0 0
Re
co
gn
itio
n R
ate
FP-based configurations Iris-based (512 x 512 pixels) Iris-based configurations (512 x 64 pixels)
TS1 TS2 TS1&TS2
Figure 4.9: Identi�cation performance evaluation - Rank 1 detection rates. (Image source: Schraml et al.
(2015b))

CHAPTER 4. BIOMETRIC WOOD LOG TRACEABILITY 51
Based on these observations, in Schraml et al. (2015d) we assessed the discriminative power
of geometric log end features. For the experiments, again the acquired testsets of this diploma
thesis were used and di�erent geometric features (Fig. 4.10) were extracted based on the CS
boundaries and pith positions. In assessing the veri�cation performance for groundtruth data
we investigated the basic discriminative power of these features.
Figure 4.10: Geometric feature extraction illustration.
In case of groundtruth data for the CS border
and pith position the veri�cation performance
evaluation showed that radial distances from
the pith and centroid center to the CS bound-
ary and Zernike moments (Z) show a high dis-
criminative power. Score level fusion of these
features leads to an EER of 0.54%. The val-
idation of these features for automated seg-
mentation Schraml and Uhl (2014) and pith
estimation Schraml and Uhl (2013) showed
that Zernike moments achieve the highest re-
liability. Compared to Zernike moments the
EERs for centroid distances and pith distances are strongly in�uenced by automated segmen-
tation and pith estimation.
Finally, in Schraml et al. (2015a) additionally to the single log used in Schraml et al. (2014b)
further two logs are used to explore the robustness of log end biometrics in an industrial ap-
plication. From each log 16 CS slices were cut down and the rough and sanded CS surfaces
of each CS slice were captured with a digital camera. Consequently, the captured CS-Images
enable to consider a third group of CS variations, denoted as CS surface variations. Surface
variations arise if di�erent cutting tools are utilized for the �rst cut in the forest and the
clearance cut in the further processing company (e.g. chain-saw and circular saw). In the ex-
periments the impact of longitudinal and surface variations on the intraclass variability and the
separability between the intra- and interclass matching scores are investigated. Furthermore,
the identi�cation performance for di�erent real world like scenarios is evaluated. For tem-
plate computation the �ngerprint-based approach and the improved enhancement procedure
of Schraml et al. (2015b) is utilized. Three di�erent template matching procedures enable to
present results for annual ring pattern features, shape features and the fusion of both. All
results show that feature fusion increases the robustness signi�cantly and it turned out that CS
surface variations are not crucial for the veri�cation performance. Based on the identi�cation
performance experiments we conclude that biometric log recognition is quali�ed to overcome

CHAPTER 4. BIOMETRIC WOOD LOG TRACEABILITY 52
the issue of cutting log ends in the sawmill up to 7.5 centimetres in thickness, even if the
second cut in the sawmill is performed with another cutting tool. The analysis of the longi-
tudinal CS variations for di�erent slice distances points out that knots are disturbing factors.
Surprisingly, the results indicate that knots do not introduce any propagative e�ects to the
annual ring pattern and the CS shape.
4.2.4 Wood Board Recognition
Besides the recognition of logs or log to board recognition, e�orts were taken to establish wood
board recognition. In the context of the PhD thesis of Pahlberg (2014) three publications
treat tracking of sawn boards based on digital surface images: Pahlberg and Hagman (2012);
Pahlberg et al. (2015a,b).
Basically, it is assumed that knots on wood boards are suited for board recognition. In Pahlberg
and Hagman (2012); Pahlberg et al. (2015a) a corner/blob detector is utilized to detect
keypoints = knots on the surface of each wood board. For each keypoint a feature descriptor is
computed. The feature descriptors then compose the biometric template of the corresponding
board. As feature descriptors Block and Speeded-up Robust Features (SURF,Bay et al. (2008))
were utilized. Block features compute the normalized intensity information in a 25x25 pixel
region around each keypoint. For the Block features two di�erent keypoint detectors were
utilized: In Pahlberg and Hagman (2012) the Features from Acclerated Segment Test (FAST,
Rosten and Drummond (2006)) and in Pahlberg et al. (2015a) the Harris corner detector
(Harris and Stephens, 1988) was utilized because of robustness considerations. In case of SURF
features blobs are detected at di�erent scales. For each detected blob a feature vector with 64
values is computed. SURF was con�gured to cover regions between 9x9 to 147x147mm. In
the second paper Pahlberg et al. (2015a) the blob keypoint detector sensitivity was decreased
to increase the amount of keypoint detections. Furthermore, the fusion of both methods was
evaluated. In Fig. 4.11 for one board the Block and SURF feature descriptors are visualized
on the original board and for an distorted version of the board which was used for matching
the features. Results in Pahlberg and Hagman (2012); Pahlberg et al. (2015a) showed that
the fusion of both descriptors increases the accuracy. In case of boards with more than 20
knots 100% accuracy was obtained for high and low-quality wood board surface images. For
boards with a minimal number of >10 knots the accuracy decreases to 90%.
In the last paper (Pahlberg et al., 2015b) for every keypoint (=knot) a descriptor is created
by computing the distances and angles to the k closet neighbours. Hence, the descriptor is
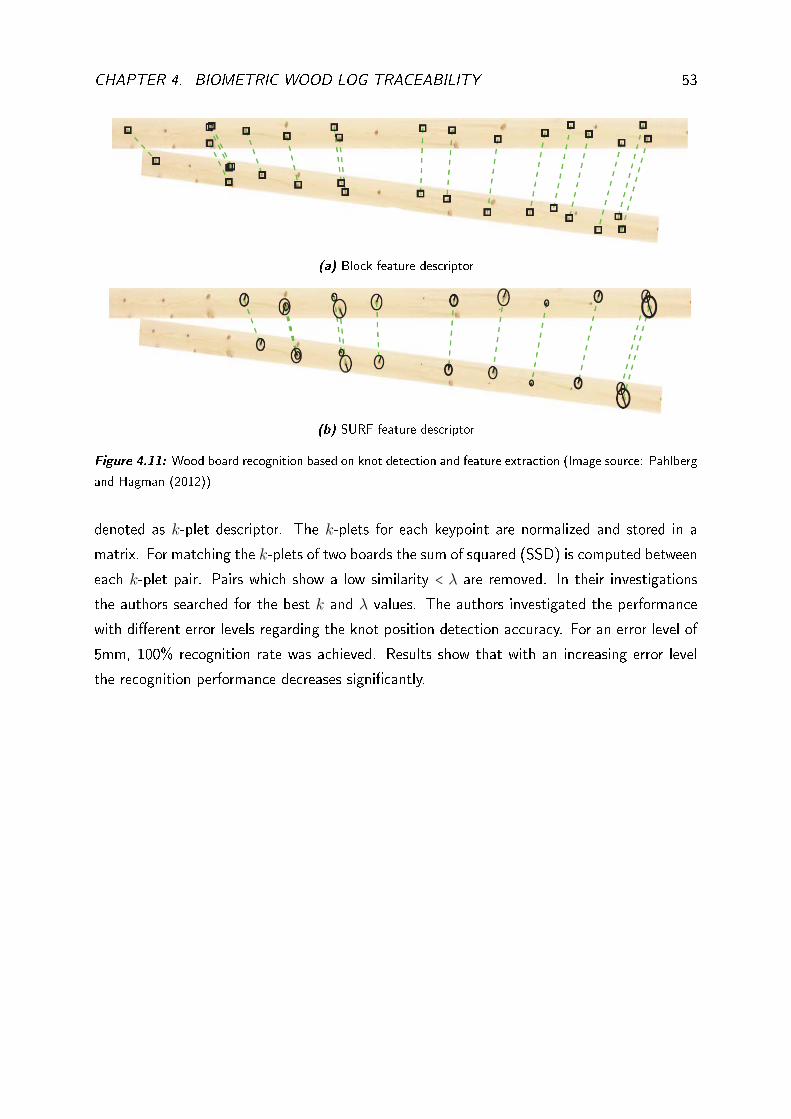
CHAPTER 4. BIOMETRIC WOOD LOG TRACEABILITY 53
(a) Block feature descriptor
(b) SURF feature descriptor
Figure 4.11: Wood board recognition based on knot detection and feature extraction (Image source: Pahlberg
and Hagman (2012))
denoted as k-plet descriptor. The k-plets for each keypoint are normalized and stored in a
matrix. For matching the k-plets of two boards the sum of squared (SSD) is computed between
each k-plet pair. Pairs which show a low similarity < λ are removed. In their investigations
the authors searched for the best k and λ values. The authors investigated the performance
with di�erent error levels regarding the knot position detection accuracy. For an error level of
5mm, 100% recognition rate was achieved. Results show that with an increasing error level
the recognition performance decreases signi�cantly.

Part II
Log End Image Analysis Project
54

Chapter 5
Project Report
This chapter presents a report for the project conducted by the three pupils of the higher
technical college in Kuchl. Our research on log end biometrics within the FWF TRP-254
project forms the basis for this project. For this purpose, Section 5.1 shines a light on the
necessity for databases in biometric performance evaluation and in Section 5.1.1 the require-
ments for the acquisition of log end image databases are worked out. These requirements
lead to the de�nition of the project goals described in Section 5.2. In Section 5.3 the project
implementation is outlined. At the beginning, legal and formal requirements for the project
start are outlined. Subsequently, the workpackage structure de�ned by the pupils is shown.
In the subsequent sections (5.4,5.5,5.6) detailed reports for each workpackage are provided.
This includes a very detailed description of the CS annotation tool, especially developed for
this project, in Section 5.5.2. Finally, Chapter 6 concludes this thesis and summarizes the
contributions of this project.
5.1 Databases for Performance Evaluation
Naturally, performance evaluation demands a database suited to compute the errors a biometric
system produces. The basics of biometric performance evaluation were already introduced in
Section 4.1. During the last decade several databases were published for di�erent human
biometric traits. Such databases enable that performance evaluations and results for di�erent
approaches get comparable. Nowadays, for scienti�c investigations in the �eld of human
biometrics one or more of these databases have to be used in the experimental evaluation.
55

CHAPTER 5. PROJECT REPORT 56
One major issue when exploring new �elds of applications is the lack of testset data. Thus,
one of the �rst tasks is to acquire testset data. Depending on the �eld of application this
can be quite challenging, di�erent requirements need to be considered and domain speci�c
problems have to be addressed. In the next section problems and requirements for acquiring
an appropriate database for log end biometrics are discussed and summarized.
5.1.1 Log End Image Database Requirements
Depending on the application a biometric system has to deal with a certain amount of indi-
viduals. Just think of human biometrics: While a door or smart-phone �ngerprint scanner just
needs to grant access to a few individuals, an international criminal �ngerprint recognition
system probably needs to handle millions of individuals.
However, biometric research is commonly conducted using databases containing a su�cient
number of individuals. Such databases enable to investigate the uniqueness and permanence
of the utilized biometric characteristic. Uniqueness means that the biometric characteristic
and the computed templates for di�erent individuals should vary strongly. Permanence is the
requirement that they do not change over time. Related to those requirements there are two
basic issues which a biometric system must handle:
Intraclass variability and Interclass similarity Interclass similarity is the problem that
di�erent individuals eventually show up similar biometric characteristics. Intraclass variability
is an issue due to internal and external caused variations between a set of templates of the
same individual. External variations occur due to irregularities in the template generation pro-
cedure, e.g. di�erent sensors or capturing environments. Furthermore, the visual appearance
of the biometric characteristic is a�ected or modi�cated by external in�uences, e.g. abrasion
of �ngerprints. Internal variations are eventually caused by an intrinsic modi�cation or change
of the biometric characteristic itself, e.g. temporal variations caused by the ageing process.
As a consequence, two simple requirements for data acquisition in the project were de�ned.
The �rst one enables to assess the interclass similarity between di�erent logs:
Database Requirement 1 (Interclass Similarity - Variation of Individuals) A database
for investigating log end biometrics has to be composed by CS-Images of as many di�erent
logs as possible.

CHAPTER 5. PROJECT REPORT 57
The second requirement enables to assess the intraclass similarity. In case of log ends external
and internal caused variations/ modi�cations of CSs of a single log have an impact on the
intraclass variability:
Database Requirement 2 (Intraclass Variability - Variations of each individual) Biometric
system performance evaluation requires manifold data of the biometric characteristic of each
individual. For each log in the database several image of it's log end need to be captured.
5.2 Project Goals
Based on the basic need for a database the project goals were extended to provide a scope
which uni�es practical and a theoretical aspects. From the beginning on Erwin Treml, my
counterpart from the HTL Kuchl, was very endeavoured to set up a project together. Based
on his idea, the second goal of the project was to investigate dependencies between wood
properties visible on the CS and other quality relevant log measurements. Particular attention
was given to investigate if any measurements show a signi�cant correlation to the presence of
reaction wood on the CS. Consequently, two goals formed the basis for the collaboration and
for the pupils which processed the project:
Project Goal 1 (Database Acquisition) Acquire a database which ful�ls Database Re-
quirement 1 and 2.
Project Goal 2 (Analysis of log end face properties) Investigate potential correlations
between wood properties visible on log end faces and log measurements provided by a 3D log
scanner.
In declaring the project goals it turned out that a software tool is required which enables to
annotate wood properties on log end faces (documentation see Section 5.5.2). A valuable
side e�ect of such a tool is that annotated CS-Images contain groundtruth information which
is useful for assessing the performance of automated CS analysis approaches. Furthermore,
ground truth data can be used for template computation in the preprocessing stage. This is
very valuable in case of log end biometrics to circumvent errors caused by pith estimation and
CS segmentation errors.

CHAPTER 5. PROJECT REPORT 58
5.3 Project Implementation
The implementation of a project as a part of the higher school certi�cate examination is
regulated by the Austrian school education law �34(3) SchUG in conjunction with the exam
regulations for higher vocational schools �22(1) BGBl. II Nr. 70.
For the o�cial approval of the project by the HTL Kuchl, the pupils had to compose a project
application in German (see Appendix .1). Together with the two advisor's and two formal
representatives of the school the pupils signed this application and agreed to submit their
diploma thesis until the 16th of May, 2014. In addition, a project agreement between the
director of the HTL Kuchl and the FWF TRP-254 project head Alexander Petutschnigg was
signed.
The application contains a short description of the project, summarizes the project baseline
and speci�es project and non-project goals. Furthermore, the pupils subdivided the project
into six workpackages (WPs), each including a set of tasks. For each task the overall aim and
the responsibilities were de�ned. Based on this, the pupils scheduled the project timeline (see
Appendix .2).
5.3.1 Workpackages
Six WPs were processed by the pupils:
1. Project Management
2. Data Aquisition
3. Data Annotation
4. Literature Research
5. Statistical Analysis
6. Diploma Thesis
On behalf of the o�cial project partner (University of Applied Sciences Salzburg/ project
leader of the FWF TRP-254) I acted as contact person for the pupils. Therefore, I was
involved in the data acquisition, data annotation and statistical analysis WPs. The other WPs
were carried out by the pupils with support from their advisor's. For the documentation of the
project progress the pupils wrote monthly reports (Appendix .4) and protocols of our meetings
(Appendix .3).
Subsequently, a review on the Data Acquisition and Data Annotation WPs is presented.

CHAPTER 5. PROJECT REPORT 59
5.4 Database Acquisition
This WP constitutes the practical part of the project which was intended to be completed
until the end of the summer holidays for those �nal projects. Consequently, the pupils have
all data they need and enough time to process the theoretical part of the project and to draft
their thesis.
The data acquisition WP represents the practical project part. The pupils were minor employed
to honour their work and to enable a basic insurance. Thanks to Mr. Entacher and Treml
two sawmills supported the project and provided logs and technicians to accomplish data
acquisition. Hence, two appointments were �xed to capture two datasets, one at each sawmill.
Basic Setup All log end images were captured using a Canon EOS DMark (35mm). Instead
of using a common tripod the pupils hand-crafted a special mounting device. This device
enables to �x a certain distance between the log end face and the camera sensor for all logs
(Fig. 5.1).
Figure 5.1: Dataset Acquisition: The pupils handcrafted a mounting device and did all the work. Each log
end was cross-cut before capturing.
5.4.1 Testset Entacher
The �rst log end capturing session (09.07.2013) was supported by the sawmill Entacher in
Grossarl. Together with the two advisor's (Entacher, Treml) and me we all met at the sawmill
yard in the morning. While Mr. Entacher and Treml organized a set of logs and a small truck
the pupils and me explored how to �x the acquisition setup with respect to ful�l the database
requirements 1 and 2 formulated in Section 5.1.1. Subsequently, the pupils captured tree by

CHAPTER 5. PROJECT REPORT 60
tree. Michael Geistlinger operated a small truck and transported each log from the log pile
to the place where the images were captured. Subsequently, Michael Schober chopped the
log end with a chain saw which was assembled with a full chisel chain to avoid strong cutting
disturbances and to emphasize the annual ring pattern. After cutting Michael Geistlinger
moved the log end face to the height of the mounting device which was placed to �x the
camera/log end distance. Finally, Alexander Sampl took the pictures of each log.
Altogether, log end images from 50 di�erent logs were taken. One log end of each log was
captured four times with and four times without �ash. Furthermore, eight logs were chopped
again and were captured once again, with and without �ash.
Figure 5.2: Testset Entacher: Each row shows four CS-Images of a single log. The �rst two CS-Images
illustrate the di�erence of capturing the log end with and without �ash. The latter two images are taken after
the log end was cross-cut, with and without �ash.
5.4.2 Testset Mayr-Melnhof
The second capturing session was done in the sawmill Mayr-Melnhof (MM) in St.Georgen im
Attergau by the pupils. The sawmill showed a great support and 141 logs were especially taken
out of the log processing chain. To investigate a possible relationship between reaction wood
on the log end face and other log properties, bended logs were chosen. Bended logs tend to
show up reaction wood on their end faces.
Initially, each log was labelled with a number on the end face using a spray. Subsequently, each
log was measured with the 3D-scanning device installed at the sawmill. The device provides
measurements regarding taper, ovality and bending of each log. All numbered and measured
logs were aligned at the sawmill yard.
For image capturing each log was processed in the following way: First, the numbered log end

CHAPTER 5. PROJECT REPORT 61
was chop cut using the chain saw using the full chisel chain. Second, the cut end face was
damped using a sponge to emphasize the reaction wood areas (Fig. 5.3). Third, the camera
mounting device was positioned and each log was captured three times without �ash. Finally,
the cut slice with the reference number was captured. The captured CS-Images of each log
were labelled according to the reference number.
Figure 5.3: Testset Mayr-Melnhof: CS-Images from 8 di�erent logs
By �nishing the data acquisition at the Entacher and the MM sawmill, the pupils ful�lled
Project Goal 1 (see Section 5.2).
5.5 Database Annotation
This WP is required because the captured CS-Images need to be annotated for the analy-
sis of possible relationships between CS wood properties as de�ned for Project Goal 2 (see
Section 5.2). Hence, the annotated CS databases serve as basis for the statistical analysis
WP.
Initially, the pupils sorted and labelled all captured CS-Images. For labelling the CS-Images of
both datasets were named according to the following convention:
[Testset Name]_[Log ID]_[Number of CS-Image] | e.g. Entacher_1_1, MM_1_1
The IDs for the Entacher dataset logs were de�ned by the capturing order. For the MM
dataset the same IDs as marked on the log ends were utilized. Unluckily, it turned out that
for the 141 logs of the MM dataset the captured data for the logs with ID 104 to 122 (=19
logs) were lost for any reason. Thus, the MM dataset is composed by CS-Images of 141-19
= 122 logs.

CHAPTER 5. PROJECT REPORT 62
Annotation of each CS-Image was done using an especially developed tool. Subsequently, the
annotated wood properties and their features are outlined, followed by a detailed description
of the developed annotation tool.
5.5.1 Annotated CS Properties
We decided to annotate a set of wood properties which are valuable for two di�erent purposes:
First, the CS border and the pith position are required for image registration by the biometric
log end recognition system. In case of automated pith estimation and CS segmentation there
are always errors which deteriorate the biometric system performance. By using groundtruth
data those errors are omitted. Furthermore, groundtruth data can be utilized to compete the
performance of automated segmentation and pith estimation procedures against.
Second, further four properties are annotated to explore possible relationships between them
and to investigate relationships between log end face properties and the 3D laser scanner
measurement data. Furthermore, the annotated data enables to assess the performance of
automated CS feature detection methods - e.g. for knots, cracks, resin pockets and reaction
wood.
5.5.2 Annotation Software/ CrossSection Editor
In this section the development and the functionalities of the CS annotation software, denoted
as CrossSection Editor (CS-Editor) are introduced. The tool is written in Java and thus works
platform independent. For the graphical user interface (GUI) of the tool Java Swing is utilized.
The wood properties are marked by de�ning region of interests (ROIs). For this purpose, the
ROI functionalities provided by ImageJ are utilized. Basically, the tool enables to mark the
following properties represented by a certain type of ImageJ ROI:
� Pith Position - Point ROI
� CS border - Polygon ROI
� Knots - Polygon ROIs
� Cracks - Polygon ROIS
� Resin Pockets - Polygon ROIs
� Reaction Wood - Polygon ROI and Line
ROI
The CS-Editor enables that for each log end image of a testset all properties can be marked

CHAPTER 5. PROJECT REPORT 63
Figure 5.4: Database Scheme for the CS-Editor
and stored in a MySQL Database. For this purpose, information of each testset and each
single CS-Image of a log needs to be available in the database.
5.5.2.1 Database
The database scheme utilized to map all relevant information is depicted in Fig. 5.4. The
database scheme is designed to record the annotated data and meta information for each
captured CS-Image. The pivotal table is the CS-Image table which contains references to the
groundtruth data and meta data.
Meta information for each CS-Image is composed by information related to the testset, the
subset structure of the testset and the corresponding CS of a log which was captured. Testset
information is stored in the Testset table. Basically, a testset entry contains the name of
the testset, a short description and the number of logs contained in the testset. The two
entries in the Testset table for the Entacher and MM datasets are shown in the top left table
depicted in Fig. 5.5. As described in Section 5.4.1 and Section 5.4.2 the Entacher and MM
datasets contain CS-Images from 50 and 122 di�erent logs, respectively. For each log and

CHAPTER 5. PROJECT REPORT 64
the corresponding CS an entry in the CrossSection table is created as exemplary illustrated
for 11 logs of the Entacher dataset in the middle right table depicted in Fig. 5.5. In order to
map speci�c CS-Image capturing scenarios to each CS-Image, di�erent testset codes in the
TestsetCode table are speci�ed. A testset code is assigned to a single testset by the foreign
key idTestset and is composed by title, image resolution and a description for the testset code
scenario. All testset codes for both datasets are shown in the top right table of Fig. 5.5. For
each captured CS-Image an entry in the CS-Image table is created by
1. specifying a name for the CS-Image,
2. assigning a serial image number to each CS-Image of a CS,
3. may assigning a speci�c textual info,
4. specifying the TestsetCode ID for the session in which the CS-Image was taken (Test-
setCode_id),
5. specifying the CrossSection ID from which the CS-Image descends from,
6. and �nally specifying the ID for the corresponding entry in the Groundtruth table.
Each entry in the Groundtruth table is associated to one single CS-Image and contains status
and data �elds for each markable CS property. The status �elds are restricted to hold Integer
values which are used in a twofold way.
Initially, the status �elds are used as markers and they are set to -2. A marker value of -2
expresses that no information for the related wood property is available so far. Depending on
the wood property the status �elds can be changed to values from -1 to N. Properties like
the pith and the CS-border which always exist are standard wood properties. They should
be annotated in each CS-Image by the annotator. Thus, the status is changed to -1 if the
corresponding property has been annotated, otherwise it remains -2.
In case of wood properties which are not present in each CS-Image, the status �elds can be
changed to -1 which means that the corresponding wood property is not shown in the CS-
Image. In case of wood properties that may occur each singular instance of a property can
be annotated separately (e.g. knots). For this reason, the status �eld is set to the amount
of marked instances. As noted, each wood property can be marked using a certain ROI type.
The ROIs of each wood property are serialized in JAVA and stored as BLOB in the respective
ROI �eld of the groundtruth table. For both testsets all required records in the database tables
were created manually using a script. In case that a new dataset is captured, new entries in
the database tables have to be added manually.

CHAPTER 5. PROJECT REPORT 65
Figure
5.5:CS-Editor-MySqlDatabaseTables:
Exemplaryentriesillustratingthemapping
ofthedata
which
isstored
foreach
CS-Imagein
thedatabase.

CHAPTER 5. PROJECT REPORT 66
5.5.2.2 CS-Editor Work�ow and Features
At startup the CS-Editor searches for CS-Images of all testsets which are available in the
prede�ned standard CS-Image database folder. In order that CS-Images are detected the �les
have to be named in the same way as in the CS-Image database table. Each testset for which
CS-Images were found is made available for selection in the menu bar. If no CS-Images were
found the user can select another directory which is subsequently used to search for CS-Images
(Fig. 5.6a). When the user selects a testset (Fig. 5.6b) the CS-Editor fetches the Groundtruth
record for each CS-Image of the testset which is available in the directory. Subsequently, an
overview for all CS-Images and wood properties is shown in the main frame of the CS-Editor
(Fig. 5.7). If the CS-Image name in the �rst column (Image List) has a red background the
image �le is not available in the chosen directory; otherwise a green background is shown
(Fig. 5.8). For each available CS-Image the fetched groundtruth table record is utilized to
provide information about the corresponding wood properties in a set of columns in the main
frame (Property Options).
Annotation Procedure The property option columns (Fig. 5.7) in the main frame enables
to edit a certain wood property. As noted, some wood properties are mandatory and others
are not.
For the mandatory properties (Pith, Ellipse, CS border) the corresponding cell of the CS-Image
provides background-colour and textual information which indicate if the property has already
been annotated. If the property has already been annotated it is layered green and the textual
information indicates that the annotation can be modi�ed. To open the annotation dialogue
(a) CrossSection Editor at startup: Select directory. (b) Each detected testset is selectable.
Figure 5.6: CS-Editor startup

CHAPTER 5. PROJECT REPORT 67
Figure 5.7: Overview of all CS-Images and wood properties for the selected testset.
Figure 5.8: Display for two CS-Images of the same CS of a testset. For the green layered image name the
corresponding image �le is available in the selected database directory. The corresponding image �le of the
red layered image name was not found.
and to start the annotation procedure a single-click on the button in the corresponding property
cell is required.
In case of the non-mandatory properties a two-fold annotation procedure needs to be per-
formed. For this purpose two di�erent cells are used to annotate each property. The �rst
column is used to specify if a CS-Image shows this property. Initially, the non-mandatory
properties are layered with a dark-yellow colour and the textual information asks the user to
provide information regarding the presence of the property. By single-clicking the button in
the corresponding cell, the user can specify if the property exists or not. If the user con�rms
that a speci�c property exists, the state of the second column switches and provides the same
functionality as the cells for the mandatory �elds. Just a single-click is required to start the
annotation procedure.
Basically, all annotation dialogues share some basic features. Each dialogue provides a button
for saving and closing. Editing is di�erent for features which occur once and for features
where several instances of a property may occur. In case of the mandatory properties all
are single instance properties. Hence, if the dialogue has been opened in edit mode a third
button provides an option to modify the currently annotated instance of this property. On

CHAPTER 5. PROJECT REPORT 68
the other hand, all non-mandatory properties may show no or multiple instances on a CS. For
this purpose, the ROI Manager of ImageJ is utilized. When the annotation dialogue opens
additionally the ROI Manager is shown. The ROI Manager provides an add, delete and edit
option to annotate multiple instances of a speci�c property.
Furthermore, all dialogues enable zooming using the plus and minus key of the keyboard.
Therefore, the cursor should be placed at the center point of the desired zoom region and
by pressing + or - the image is enlarged or shrinked with the cursor position as center point.
Thus, it is easy to navigate around and to zoom in/out to a certain ROI. Subsequently, short
descriptions for the annotation procedures of each wood property are provided.
Pith For annotating the pith position the user just has to click on the pith position in the
CS-Image in the dialogue using the mouse cursor (Fig. 5.9a). This places a pith position
marker. The marker can be moved or reset to another position.
(a) Pith = set point at the pith position. (b) CS border = polygon points along the CS area border.
(c) Ellipse = ellipse which embraces the CS area.
Figure 5.9: Mandatory CS properties

CHAPTER 5. PROJECT REPORT 69
Ellipse The ellipse is placed in the CS-Image window by one click. By clicking and holding
the mouse button the left x-axis point is set. Then the ellipse can be shrinked or enlarged by
dragging the right x-axis point of the ellipse. After releasing the mouse button the ellipse is
�xed. After �xing, four anchor points enable to improve the position and form of the ellipse
(Fig. 5.9c).
CS border For the CS border the points of a polygon have to be speci�ed. The start point
of the polygon is de�ned by the �rst click. Subsequently, further points should be added
according to the complexness of the CS border shape until the start point is reached again.
Finally, the polygon needs to be closed by clicking on the start point. The �nal polygon can
be modi�ed by dragging the anchor points (Fig. 5.9b).
Reaction Wood Proportion The reaction proportion is determined according to the Aus-
trian grading rules (ÖHHU). Therefore, the reaction proportion is determined in relation to
the log diameter. Thus, the log diameter needs to be speci�ed by an arrow that crosses the
pith position and intersects the largest possible share of reaction wood (Fig. 5.10 - Arrow).
Initially, the user has to specify an arrow which de�nes the log diameter. The log diameter
arrow is marked by a click at the start and the end point in the CS-Image. Subsequently, the
user has to con�rm the log diameter arrow using the "Save arrow" button. By doing this,
the ROI Manager is opened and the arrow is added to the ROI Manager list. All subsequent
ROI lines, added over the ROI Manager, should be placed on this arrow at sections where
the arrow crosses a reaction wood area. For adding a new line, the line needs to be drawn
�rst. By clicking the "Add" button from the ROI Manager the new line is added to the ROI
Manager. Each ROI line can be modi�ed by selecting it in the ROI Manager and dragging the
anchor points. The reaction wood proportion is de�ned as the ratio between the length of the
log diameter arrow and the total length of all placed reaction wood lines.
Reaction Wood Areas Like for the CS border each reaction wood area should be annotated
by a single polygon. For this purpose, the user draws a polygon embracing a certain reaction
wood area (Fig. 5.11). The reaction wood polygon can be added using the add option in the
ROI Manager. Subsequently, a new area can be annotated by a polygon. Each added reaction
wood polygon can be added/deleted by selecting it in the ROI Manager. Finally, the status
of the ROI Manager needs to be saved using the "Save RM-Status" button. This quits the
annotation procedure.
Knots, Cracks and Resin Pockets The annotation procedures for knots (Fig. 5.12),
cracks (Fig. 5.13) and resin pockets (Fig. 5.14) are the same as for reaction wood areas. The

CHAPTER 5. PROJECT REPORT 70
Figure 5.10: Reaction Wood: Specifying the reaction wood amount according to the ÖHHU.
Figure 5.11: Reaction Wood Areas: Each reaction wood area is speci�ed by a single polygon.
area of each property instance is annotated with a polygon which is added to the ROI Manager.
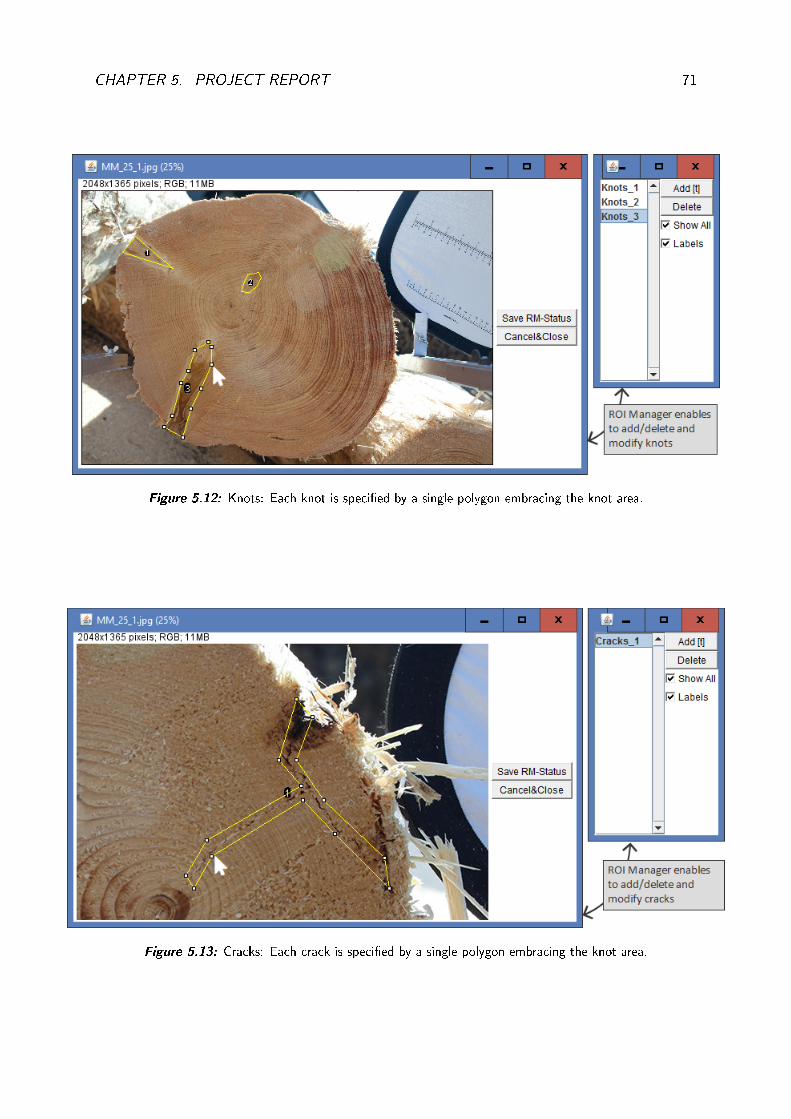
CHAPTER 5. PROJECT REPORT 71
Figure 5.12: Knots: Each knot is speci�ed by a single polygon embracing the knot area.
Figure 5.13: Cracks: Each crack is speci�ed by a single polygon embracing the knot area.

CHAPTER 5. PROJECT REPORT 72
Figure 5.14: Resin Pockets: Each resin pocket is speci�ed by a single polygon embracing the area of the
resin pocket.

CHAPTER 5. PROJECT REPORT 73
Work�ow Features To improve and support the annotation work�ow three features were
implemented (see Fig. 5.15):
1. A double click on the CS-Image name in the �rst column opens the CS-Image and
visualizes all annotated properties.
2. The pictures of a single CS for both datasets were captured with nearly no positional
variations. Thus, a copy function is valuable to copy the annotated properties of one
CS-Image of a CS to the other CS-Images. Two Drag&Drop functions are available. The
�rst option enables to copy all annotations from one to another CS-Image by dragging
the image name cell to the target image name cell. After releasing the mouse button
the user is asked to con�rm the copy action. Already annotated features for the target
image are overwritten. The second function needs to be enabled using the "Single
D&D" checkbox. Subsequntly, particular annotated properties can be copied between
CS-Images. For this purpose, the corresponding property cell of the origin CS-Image
needs to be dragged from to the respective wood property cell of the target CS-Image.
The user is again asked to con�rm the copy action.
3. Because there are still variations between di�erent CS-Images of a CS the locations of the
copied wood property annotations need to be adjusted. To enable this adjustment for all
wood properties together in a single procedure a move feature is provided. Therefore,
a reference property for the movement action must be chosen. After selecting the
reference property and pressing the "Move Rois" button a dialog is shown (Fig. 5.15).
In this dialogue the reference property is shown which should be moved to the correct
position. After con�rming the action in the dialogue the movement is applied to all
other annotated wood properties.

CHAPTER 5. PROJECT REPORT 74
Figure
5.15:The
CS-Editor
interfaceprovides
threeextra
featuresto
improve
andsupport
thework�ow
.

CHAPTER 5. PROJECT REPORT 75
5.6 Statistical Analysis
In this work package the pupils investigated possible relationships within wood properties on
log end faces and to other log properties provided by a 3D log scanner as formulated for
Project Goal 2 in Section 5.2.
For the statistical analysis we had to de�ne relevant property measurements which can be com-
puted from the annotated properties. We selected eight measurements which are denoted as
log end face measurements - see Table 5.1. These log end face measurements were computed
1. CS-Area = Area of the CS [Pixel].
2. RW-Area = Summed area of all annotated reaction wood areas [Pixel].
3. R-Area = Summed area of all annotated resin pockets [Pixel].
4. K-Area = Summed area of all annotated knots [Pixel].
5. λ-Ellipse = Axis ratio of the CS shape ellipse.
6. E (Eccentricity) = distance between the pith position and the CS ellipse centre [Pixel].
7. D = Diameter, marked for the measurement of the reaction wood proportion according
to the grading rules [Pixel].
8. RW-Length = Summed lengths of the reaction wood areas intersected by the diameter
arrow [Pixel].
Table 5.1: Log End Face Measurements
for each single CS-Image using the annotated data and were stored in an Excel �le. For the
MM dataset the pupils assigned the 3D-scanner protocol entries to each log using the protocol
image which shows the ID label sprayed on the log end face (Fig. 5.16). The 3D-scanner
protocol (just available for the MM dataset) provides a large list of log shape measurements
that can be used for the statistical analysis. The utilized measurements are listed in Table 5.1.

CHAPTER 5. PROJECT REPORT 76
Figure 5.16: Protocol Image for log ID 83 of the MM dataset produced by the Sprecher 3D-log scanner
1. O-Top = Ovality measured at the top of the tree log.
2. O-Mean = Mean ovality of all ovality measurements.
3. O-L1021 = Ovality measured according to the ÖNORM L1021.
4. Curvature = Curvature of the log.
5. Taper = Taper of the log.
Table 5.2: 3D-Scanner Log Shape Measurements
5.6.1 Results
The statistical analysis was carried out by the pupils supported by their advisor's. Subsequently
the main results of the statistical analysis presented by the pupils, in their diploma thesis
Geistlinger et al. (2014), are summarized. The pupils subdivided their statistical analysis into
a correlation and a regression analysis.
5.6.1.1 Correlation Analysis
One major question in the project was to investigate if there is any relationship between the
reaction wood measurements on the log end face and the ovality log shape measurements
provided by the 3D log scanner. The correlation plots are shown in Fig. 5.17. For a better

CHAPTER 5. PROJECT REPORT 77
overview all correlation plots depicting the correlation between the ovality and reaction wood
measurements are coloured with a green background. The yellow coloured plots show the
correlation just for reaction wood measurements from the log end face or the ovality measure-
ments from the 3D log scanner. Results show that there is no remarkable correlation between
Figure 5.17: Correlation of ovality measured by the 3D log scanner and the two log end face reaction wood
measurements (Image source: Geistlinger et al. (2014)[p.45, modi�ed])
reaction wood measured on the log end face and ovality measured by the 3D log scanner
(green background). On the other hand, the results show that there is some correlation within
the di�erent reactionwood and ovality measurements (yellow background). This leads to the
conclusion that ovality measured by the 3D-log scanner is not suited as a predictor for the
reaction wood content of a log.
Furthermore, correlations between reaction wood or ovality and other measurements were
assessed. The corresponding correlation coe�cients (R2) are depicted in Table 5.3. The
�rst two rows in Table 5.3 show the correlation coe�cients between reaction wood (RW-
Length, RW-Area) and the eccentricity (E) log end face measurements. The correlation for
RW-Length/E accounts R2 = 0.44 and for RW-Area/E a value of R2 = 0.160 was observed.
These values show that there is at least a kind of correlation between the eccentricity and the
presence of reaction wood on log end faces.
The correlation for RW-Length/Curvature (R2 = 0.159) is in the same range and shows that
there exists a minimal correlation between reaction wood on the log end face and the curvature

CHAPTER 5. PROJECT REPORT 78
Measurement 1 Measurement 2 R2
RW-Length E 0.244
RW-Area E 0.160
RW-Length Curvature 0.159
RW-Length RW-Area 0.715
O-L2012 E 0.00005
O-Top O-Middle 0.279
Table 5.3: Correlation coe�cients for selected measurements
of the log. To be able to make an exact statement more data is required and the structure of
the data should be more balanced. The MM testset basically consists of logs which show a
strong curvature and for a meaningful evaluation also logs with a low curvature are required.
Next, the correlation between the two log end face reaction wood measurements was assessed
which shows a correlation of R2=0.715. Compared to all other results, these measurements
are highly correlated. It can be stated that the simpli�ed reaction wood measurement method
according to the Austrian grading rules is well suited.
The pupils also assessed if the 3D log scanner ovality measurement (O-L2012) correlates with
E. These two measures show clearly no correlation which con�rms the results of the reaction
wood/ovality results.
Finally, the pupils assessed the correlation between the O-Top/O-Middle ovality measurements
of the 3D-log scanner which achieves a R2 of 0.279. This correlation is also not that high and
shows that the ovality is not constant along the log length axis.
5.6.1.2 Regression Analysis
In the �nal step a regression analysis was performed. For di�erent con�gurations one dependent
and a set of independent variables were de�ned. In the regression analysis for each con�guration
the best independent variables subset was determined.
RW-Length/Curvature Analysis For this con�guration the RW-Length was set as de-
pendent variable and di�erent curvature measurements (not introduced in this thesis) from
the 3D log scanner measurements were set as independent variables. Except the middle cur-
vature (given in %) all other curvature measurements were sorted out by SPSS using gradual

CHAPTER 5. PROJECT REPORT 79
selection. Therefore, a correlation coe�cient of R2=0.399 is achieved which is quite high
compared to the correlation analysis results.
5.6.1.2.1 RW-Length Regression Analysis Again the RW-Length was used as de-
pendent variable. As independent variables all available measurements were utilized. In the
gradual selection E, λ-Ellipse and O-Top were selected and together they achieve a correlation
coe�cient R2 of 0.773.

Chapter 6
Conclusions
The aim of this diploma thesis was to acquire testset data for the TreeBio project (FWF TRP-
254). For this reason a graduate project at the higher technical college Kuchl was initialized and
accompanied. Three pupils successfully processed the project. Within the project the pupils
completed a practical and a theoretical part. In the practical part two di�erent CS-Image
datasets were captured at two di�erent sawmills. In total 172 di�erent logs were captured and
all CS-Images were annotated by the pupils. For the practical part of the project the pupils
used the annotated data and log shape measurements from a 3D log scanner to perform a
statistical analysis. In this analysis relationships for the annotated properties and the log shape
measurements were investigated. Results showed no strong correlation between log end face
measurements and the 3D laser scanner measurements. However, the results showed that the
reaction wood measurement procedure de�ned by the Austrian grading rules produces reliable
results and correlates with the reaction wood area measurements.
As a practical component of this diploma thesis an annotation tool was developed which enables
to annotate CS properties in CS-Images. Meta-information and the annotated groundtruth
information for each CS-Image is stored in a database. Within the TreeBio project the anno-
tated datasets were already used for the experimental evaluation in two publications Schraml
et al. (2015b,d). Furthermore, the annotation tool was used to annotate further testsets which
were already utilized in Schraml et al. (2014b, 2015a).
80

Part III
Appendix
81

82
.1 Project Application HTL Kuchl

83

84

85

86
.2ProjectTimeline
Created
byMichaelG
eistlinger,MichaelSchober
andAlexander
Sampl

87
.3 Project Meeting Report Example

88

89
.4 Project Progress Report Example

90

91

Bibliography
Andreu, J.-P. and Rinnhofer, A. (2001). Automatic detection of pith and annual rings on
industrial computed tomography log images. In Procs. of the 9th International Conference
on Scanning Technology and Process Optimization for the Wood Industry, pages 37�47,
Washington, USA.
Andreu, J. P., Rinnhofer, A., and Petutschnigg, A. (2002). Enhancement of annual rings on
industrial CT images of logs. In Proceedings of the 16th International Conference on Pattern
Recognition (ICPR'02), pages 261�264, Washington, USA. IEEE Computer Society.
Barrett, W. (2008). Biometrics of cut tree faces. In Sobh, T., editor, Advances in Computer
and Information Sciences and Engineering, pages 562�565. Springer Netherlands.
Baumgartner, R., Brüchert, F., and Sauter, U. (2010). Knots in CT scans of scots pine logs.
In Proceedings of the Final Conference on The Future of Quality Control for Wood & Wood
Products (COST Action E53), Edingburgh, UK.
Baumgartner, R., Brüchert, F., Staudenmaier, J., and Sauter, U. (2007). Bark measurements
with x-ray technology. In Proceedings of the Conference on Quality Control for Wood and
Wood Products (COST E 53), pages 13�16, Warsaw, PL.
Bay, H., Ess, A., Tuytelaars, T., and Van Gool, L. (2008). Speeded-up robust features (surf).
Comput. Vis. Image Underst., 110:346�359.
Berglund, A., Broman, O., Grönlund, A., and Fredriksson, M. (2013). Improved log rotation
using information from a computed tomography scanner. Computers and Electronics in
Agriculture, 90:152 � 158.
Berglund, A., Johansson, E., and Skog, J. (2014). Value optimized log rotation for strength
graded boards using computed tomography. Holz als Roh- und Werksto�, 72(5):635�642.
92

BIBLIOGRAPHY 93
Bhandarkar, S., Faust, T., and Tang, M. (1996). A system for detection of internal log
defects by computer analysis of axial CT images. In Proceedings of the 3rd Workshop on
Applications of Computer Vision (WACV '96), pages 258�263.
Bhandarkar, S., Luo, X., Daniels, R., and Tollner, E. (2008). Automated planning and op-
timization of lumber production using machine vision and computed tomography. IEEE
Transactions on Automation Science and Engineering,, 5(4):677�695.
Bhandarkar, S. M., Faust, T. D., and Tang, M. (1999). Catalog: a system for detection
and rendering of internal log defects using computer tomography. Machine Vision and
Applications, 11(4):171�190.
Bhandarkar, S. M., Luo, X., Daniels, R., and Tollner, E. W. (2005). Detection of cracks in
computer tomography images of logs. Pattern Recognition Letters, 26(14):2282�2294.
Bhandarkar, S. M., Luo, X., Daniels, R., and Tollner, E. W. (2006). A novel feature-based
tracking approach to the detection, localization, and 3-D reconstruction of internal defects
in hardwood logs using computer tomography. Pattern Analysis Applications, 9(2):155�175.
Boukadida, H., Longuetaud, F., Colin, F., Freyburger, C., Constant, T., Leban, J. M., and
Mothe, F. (2012). Pithextract: A robust algorithm for pith detection in computer to-
mography images of wood - application to 125 logs from 17 tree species. Computers and
Electronics in Agriculture, 85:90�98.
Breinig, L. (2015). CT log scanning for sawing optimization with regard to the aesthetic
quality of wood. PhD thesis, University of Freiburg.
Breinig, L., Berglund, A., Grönlund, A., Brüchert, F., and Sauter, U. H. (2013). E�ect of knot
detection errors when using a computed tomography log scanner for sawing control. Forest
Products Journal, 63(7-8):263�274.
Breinig, L., Broman, O., Brüchert, F., and Becker, G. (2015). Optimization potential for
perception-oriented appearance classi�cation by simulated sawing of computed tomography-
scanned logs of norway spruce. Wood Material Science and Engineering, 10(4):319�334.
Breinig, L., BrüChert, F., Baumgartner, R., and Sauter, U. H. (2012). Measurement of knot
width in CT images of Norway spruce (picea abies [l.] karst.)-evaluating the accuracy of an
image analysis method. Computers and Electronics in Agriculture, 85:149�156.

BIBLIOGRAPHY 94
Breinig, L., Leonhart, R., Broman, O., Manuel, A., Brüchert, F., and Becker, G. (2014).
Classi�cation of wood surfaces according to visual appearance by multivariate analysis of
wood feature data. Journal of Wood Science, 61(2):89�112.
Canny, J. (1986). A computational approach to edge detection. IEEE Transactions on Pattern
Analysis and Machine Vision, 8(6):679�698.
Cerda, M., Hitschfeld-Kahler, N., and Mery, D. (2007). Robust tree-ring detection. In Mery,
D. and Rueda, L., editors, Procs. of Advances in Image and Video Technology, volume 4872
of LNCS, pages 575�585. Springer Berlin / Heidelberg.
Chalifour, A., Nouboud, F., Deprost, B., and Okana, S. (2001). Automatic detection of tree-
rings on wood disc images. In Proceedings of the 5th International Conference on Quality
Control by Arti�cial Vision, pages 348�352.
Chiorescu, S. and Grönlund, A. (2003). The �ngerprint approach: using data generated by
a 2-axis log scanner to accomplish traceability in the sawmill's log yard. Forest Products
Journal, 53:78�86.
Chiorescu, S. and Grönlund, A. (2004). The �ngerprint method: Using over-bark and under-
bark log measurement data generated by three-dimensional log scanners in combination
with radiofrequency identi�cation tags to achieve traceability in the log yard at the sawmill.
Scandinavian Journal of Forest Research, 19(4):374�383.
Conner, W. (1999). A computer vision based tree ring analysis and dating system. Master's
thesis, University of Arizona, Department of Electrical & Computer Engineering.
Conner, W., Schowengerdt, R., Munro, M., and Hughes, M. (1998). Design of a computer
vision based tree ring dating system. In Proceedings of IEEE Southwest Symposium on
Image Analysis and Interpretation, pages 256�261.
Conner, W. S., Schowengerdt, R. A., Munro, M., and Hughes, M. K. (2000). Engineering de-
sign of an image acquisition and analysis system for dendrochronology. Optical Engineering,
39(2):453�463.
Cristhian A. Aguilera, Mario A. Ramos, A. D. S. (2012). Simulated Annealing - Advances,
Applications and Hybridizations, chapter Simulated Annealing: A Novel Application of Image
Processing in the Wood Area, pages 91�104. INTECHOPEN.
Edelsbrunner, H., Kirkpatrick, D., and Seidel, R. (1983). On the shape of a set of points in
the plane. Information Theory, IEEE Transactions on, 29(4):551�559.

BIBLIOGRAPHY 95
Ekevad, M. (2004). Method to compute �ber directions in wood from computed tomography
images. Journal of Wood Science, 50(1):41�46.
Engle, J. B. (2000). A computer-assisted tree-ring chronology composition system. Master's
thesis, University of Arizona, Department of Electrical & Computer Engineering.
Entacher, K., Hegenbart, S., Kerschbaumer, J., Lenz, C., Planitzer, D., Seidel, M., Uhl, A., and
Weiglmaier, R. (2008). Pith detection on CT-cross-section images of logs: An experimental
comparison. In Proceedings of the 3rd International Symposium on Communications, Control
and Signal Processing, pages 478�483, St.Julians, MT.
Entacher, K., Lenz, C., Seidel, M., Uhl, A., and Weiglmaier, R. (2007). Applicability of motion
estimation algorithms for an automatic detection of spiral grain in CT cross-section images
of logs. In CAIP, pages 36�44.
Fellner, J., Teischinger, A., and Zschokke, W. (2006). Holzspektrum. proHolz Austria.
Flodin, J., Oja, J., and Grönlund, A. (2007). Fingerprint traceability of sawn products using
x-ray log scanning and sawn timber surface scanning. In Proccedings of Quality control for
wood and wood products: COST Action E 53 the �rst conference.
Flodin, J., Oja, J., and Grönlund, A. (2008a). Fingerprint traceability of logs using the outer
shape and the tracheid e�ect. Forest Products Journal, 58(4):21�27.
Flodin, J., Oja, J., and Grönlund, J. (2008b). Fingerprint traceability of sawn products using
industrial measurement systems for x-ray log scanning and sawn timber surface scanning.
Forest Products Journal, 58:11.
Flood, K., Danielsson, P.-E., and Seger, A. M. (2003). On 3D segmentation of knots in
3D-volume data acquired from x-ray linear cone-beam scanning. In Rinnhofer, A., editor,
Proceedings of the 5th International Conference on Image Processing and Scanning of Wood,
pages 151�159.
Fraunhofer (2010). Rundholz mit Antenne. http://www.fraunhofer.de/de/
presse/presseinformationen/2010/08/rundholz-mit-antenne.html. [last ac-
cessed: 28.07.2011].
Fredriksson, M., Broman, O., Persson, F., Axelsson, A., and Ah Shenga, P. (2014a). Rotational
position of curved saw logs and warp of the sawn timber. Wood Material Science and
Engineering, 9(1):31�39.

BIBLIOGRAPHY 96
Fredriksson, M., Johansson, E., and Berglund, A. (2014b). Rotating pinus sylvestris sawlogs by
projecting knots from computed tomography images onto a plane. BioResources, 9(1):816�
827.
Funt, B. (1985). A computer vision system that analyzes CT-scans of sawlogs. In Proceedings
of IEEE Conference on Computer Vision and Pattern Recognition, pages 175�177, San
Francisco, USA.
Funt, B. and Bryant, E. (1987). Detection of internal log defects by automatic interpretation
of computer tomography images. Forest Products Journal, 37(1):56�62.
Geistlinger, M., Schober, M., and Sampl, A. (2014). Tretree - bildanalyse von holzstammenden.
Master's thesis, Higher Technical College HTL Kuchl, Salzburg, Austria.
Giribalan, G. (2000). An interactive image analysis system for dendrochronology. Master's
thesis, University of Arizona, Department of Electrical & Computer Engineering.
Giudiceandrea, F., Ursella, E., and Vicario, E. (2011). A high speed ct scanner for the sawmill
industry. In Proceedings of the 17th International Nondestructive Testing and Evaluation
of Wood Symposium, Sopron, HU.
Giudiceandrea, F., Ursella, E., and Vicario, E. (2012). From research to market: a high speed
ct scanner for the sawmill industry. In Proceedings XXXI Scuola Annuale di Bioingegneria,
Brixen, ITA.
Gjerdrum, P. and Høibø, O. (2004). Heartwood detection in scots pine by means of heat-
sensitive infrared images. Holz als Roh- und Werksto�, 62(2):131�136.
Gonzalez, R. C. and Woods, R. E. (2001). Digital Image Processing. Addison-Wesley, Boston,
MA, USA, 2nd edition.
Grundberg, S. and Grönlund, A. (1992). Log scanning : extraction of knot geometry in CT-
volumes. In Proceedings of the Seminar/Workshop on Scanning Technology and Image
Processing on Wood.
Hanning, T., Kickingereder, R., and Casasent, D. (2003). Determining the average annual ring
width on the front side of lumber. In Osten, W., Kujawinska, M., and Creath, K., editors,
Proceedings of SPIE: Optical Measurement Systems for Industrial Inspection, volume 5144,
pages 707�716, Munich, Germany.
Harris, C. and Stephens, M. (1988). A combined corner and edge detector. In In Proceedings
of the Fourth Alvey Vision Conference, pages 147�151.
BIBLIOGRAPHY 97
Jain, A., Ross, A., and Prabhakar, S. (2001). Fingerprint matching using minutiae and texture
features. In Procs. of the International Conference on Image Processing (ICIP'01), volume 3,
pages 282�285, Thessaloniki, GR.
Jain, A. K., Flynn, P., and Ross, A. A. (2007). Handbook of Biometrics. Springer-Verlag New
York, Inc., Secaucus, NJ, USA.
Jain, A. K., Prabhakar, S., Hong, L., and Pankanti, S. (2000). Filterbank-based �ngerprint
matching. IEEE Transactions on Image Processing, 9(5):846�859.
Johansson, E., Johansson, D., Skog, J., and Fredriksson, M. (2013). Automated knot detection
for high speed computed tomography on pinus sylvestris l. and picea abies (l.) karst. using
ellipse �tting in concentric surfaces. Computers and Electronics in Agriculture, 96:238 �
245.
Korten, S. and Kaul, C. (2008). Application of RFID (Radio frequency identi�cation) in the
timber supply chain. Croatian Journal of Forest Engineering, 29(1).
Krähenbühl, A., Kerautret, B., Debled-Rennesson, I., Mothe, F., and Longuetaud, F. (2014).
Knot segmentation in 3d ct images of wet wood. Pattern Recognition, 47:3852�3869.
Kvarnström, B. and Oghazi, P. (2008). Methods for traceability in continuous processes-
experience from an iron ore re�nement process. Minerals Engineering, 21(10):720�730.
Kvarnström, B. and Oja, J. (2008). Applications of RFID to Improve Traceability in Continuous
Processes, chapter Sustainable Radio Frequency Identi�cation Solutions, page 19. InTech.
Laggoune, H., Sarifuddin, and Guesdon, V. (2005). Tree ring analysis. In Procs. of the
Canadian Conference on Electrical and Computer Engineering, pages 1574�1577.
Li, L. and Qi, D. (2007). Detection of cracks in computer tomography images of logs based
on fractal dimension. In Proceedings of the IEEE International Conference on Automation
and Logistics, pages 2259�2264.
Li, P., Abbott, A., and Schmoldt, D. (1996). Automated analysis of CT images for the
inspection of hardwood logs. In Proceeedinges of the IEEE International Conference on
Neural Networks, volume 3, pages 1744�1749.
Longuetaud, F., Leban, J.-M., Mothe, F., Kerrien, E., and Berger, M.-O. (2004). Automatic
detection of pith on CT images of spruce logs. Computers and Electronics in Agriculture,
44(2):107�119.

BIBLIOGRAPHY 98
Longuetaud, F., Mothe, F., Kerautret, B., Krähenbühl, A., Hory, L., Leban, J. M., and Debled-
Rennesson, I. (2012). Automatic knot detection and measurements from x-ray CT images of
wood: A review and validation of an improved algorithm on softwood samples. Computers
and Electronics in Agriculture, 85:77�89.
Longuetaud, F., Mothe, F., and Leban, J.-M. (2007). Automatic detection of the heart-
wood/sapwood boundary within Norway spruce (picea abies (l.) karst.) logs by means of
CT images. Computers in Electronics and Agriculture, 58(2):100�111.
Maltoni, D., Maio, D., Jain, A. K., and Prabhakar, S. (2009). Handbook of �ngerprint
recognition. Springer New York.
McMillin, C. W. (1982). Application of automatic image analysis in wood science. Wood
Science, 14:97�105.
Norell, K. (2009a). An automatic method for counting annual rings in noisy sawmill images.
In Proceedings of the Conference on Image Analysis and Processing (ICIAP), number 5716
in LNCS, pages 307�316. Springer Berlin / Heidelberg.
Norell, K. (2009b). Creating synthetic log end face images. In Proceedings of 6th International
Symposium on Image and Signal Processing and Analysis (ISPA'09), pages 353�358.
Norell, K. (2010). Counting annual rings on pinus sylvestris end faces in sawmill industry.
Computers and Electronics in Agriculture, 75(2):231�237.
Norell, K. and Borgefors, G. (2008). Estimation of pith position in untreated log ends in
sawmill environments. Computers and Electronics in Agriculture, 63(2):155�167.
Norell, K., Lindblad, J., and Svensson, S. (2007). Grey weighted polar distance transform
for outlining circular and approximately circular objects. In Procs. of14th International
Conference on Image Analysis and Processing (ICIAP'07), pages 647�652.
Nystrom, J. and Hagman, O. (1999). Methods for detecting compression wood in green and
dry conditions. In Proceedings of the Conference on Polarization and Color Techniques in
Industrial Inspection (SPIE), pages 287�294, Bellingham, Wash.
Österberg, P. (2009). Wood Quality and Geometry Measurements Based on Cross Section
Images. PhD thesis, Tampere University of Technology, Department of Automation Science
and Engineering.

BIBLIOGRAPHY 99
Österberg, P., Ihalainen, H., and Ritala, R. (2004). Method for analyzing and classifying wood
quality through local 2D-spectrum of digital log end images. In Proceedings of International
Conference on Advanced Optical Diagnostics in Fluids, Tokyo, JP.
Pahlberg, T. (2014). Wood Fingerprints: Recognition of Sawn Wood Products. PhD thesis.
Pahlberg, T. and Hagman, O. (2012). Feature recognition and �ngerprint sensing for guiding
a wood patching robot, pages 724�733. New Zealand Timber Design Society.
Pahlberg, T., Hagman, O., and Thurley, M. (2015a). Recognition of boards using wood
�ngerprints based on a fusion of feature detection methods. Computers and Electronics in
Agriculture, 111:164�173.
Pahlberg, T., Johansson, E., Hagman, O., and Thurley, M. (2015b). Wood �ngerprint recogni-
tion using knot neighborhood k-plet descriptors. Wood Science and Technology, 49(1):7�20.
Päivinen, R. and Lindner, M. (2006). Assessment of sustainability of forest-wood chains.
Technical report, EFI Technical Report 23.
Peterson, G. (2009). The potential of using log biometrics to track sawmill �ow. Master's
thesis, Oregon State University.
ProHolz (2007). Dendrochronologie. http://www.proholz.at/zuschnitt/27/
dendrochronologie/. [last accessed: 28.07.2011].
Rauschkolb, M. R. (1994). Algorithms for automatic tree ring identi�cation and measurement.
Master's thesis, Mississippi State University.
Rojas, G., Condal, A., Beauregard, R., Verret, D., and Hernýndez, R. E. (2006). Identi�ca-
tion of internal defect of sugar maple logs from CT images using supervised classi�cation
methods. Holz als Roh- und Werksto�, 64(4):295�303.
Rosten, E. and Drummond, T. (2006). Machine learning for high-speed corner detection. In
European Conference on Computer Vision, volume 1, pages 430�443.
Roussel, J.-R., Mothe, F., Krähenbühl, A., Kerautret, B., Debled-Rennesson, I., and Longue-
taud, F. (2014). Automatic knot segmentation in CT images of wet softwood logs using a
tangential approach. Computers and Electronics in Agriculture, 104:46�56.
Sarigul, E., Abbott, A., and Schmoldt, D. (2003a). Progress in analysis of computed tomog-
raphy (CT) images of hardwood logs for defect detection. In Proceedings of the Tenth

BIBLIOGRAPHY 100
International Conference on Scanning Technology and Process Optimization in the Wood
Industry (ScanTech'03), pages 19�30.
Sarigul, E., Abbott, A., and Schmoldt, D. (2003b). Rule-driven defect detection in CT images
of hardwood logs. Computers and Electronics in Agriculture, 41:101�119.
Schmoldt, D., Daniel, L., He, J., and Lynn, A. (1998). A comparison of several arti�cial
neural network classi�ers for CT images of hardwood logs. In Proceedings of Machine
Visions Applications in Industrial Inspection VI, volume 3306, pages 34�43, SPIE.
Schmoldt, D., He, J., and Abbott, A. (2000). Automated labeling of log features in CT
imagery of multiple hardwood species. Wood and Fiber Science, 32(3):287�300.
Schmoldt, D., Li, P., and Abbott, A. (1997). Machine vision using arti�cial neural networks
with local 3D neighborhoods. Computers and Electronics in Agriculture, 16(3):255�271.
Schraml, R. (2013). Treebio - preliminary study on traceability of tree logs using digital log
end images. Master's thesis, Department of Scienti�c Computing, University of Salzburg,
Austria.
Schraml, R., Charwat-Pessler, J., Petutschnigg, A., and Uhl, A. (2014a). Robustness of
biometric wood log traceability using digital log end images. Technical Report 2014-08,
Department of Computer Sciences, University of Salzburg, Austria, http://www.cosy.
sbg.ac.at/tr.
Schraml, R., Charwat-Pessler, J., Petutschnigg, A., and Uhl, A. (2015a). Towards the ap-
plicability of biometric wood log traceability using digital log end images. Computers and
Electronics in Agriculture, 119:112�122.
Schraml, R., Charwat-Pessler, J., and Uhl, A. (2014b). Temporal and longitudinal variances in
wood log cross-section image analysis. In IEEE International Conference on Image Processing
(ICIP'14), Paris, FR.
Schraml, R., Hofbauer, H., Petutschnigg, A., and Uhl, A. (2015b). Tree log identi�cation based
on digital cross-section images of log ends using �ngerprint and iris recognition methods.
In Proceedings of the 16th International Conference on Computer Analysis of Images and
Patterns (CAIP'15), LNCS, pages 752�765. Springer Verlag.
Schraml, R., Hofbauer, H., and Uhl, A. (2015c). Tree log identi�cation based on digital
cross-section images of log ends using �ngerprint and iris recognition methods. Technical

BIBLIOGRAPHY 101
Report 2015-01, Department of Computer Sciences, University of Salzburg, Austria, http:
//www.cosy.sbg.ac.at/tr.
Schraml, R., Petutschnigg, A., and Uhl, A. (2015d). Validation and reliability of the discrimi-
native power of geometric wood log end features. In Proceedings of the IEEE International
Conference on Image Processing (ICIP'15).
Schraml, R. and Uhl, A. (2013). Pith estimation on rough log end images using local fourier
spectrum analysis. In Proceedings of the 14th Conference on Computer Graphics and Imag-
ing (CGIM'13), Innsbruck, AUT.
Schraml, R. and Uhl, A. (2014). Similarity based cross-section segmentation in rough log end
images. In Iliadis, L. et al., editors, Proceedings of the 10th Arti�cial Intelligence Applications
and Innovations Conference (AIAI'14), volume 436 of Springer IFIP AICT, pages 614�621,
Rhodes, GR.
Sepúlveda, P. (2001). Measurement of spiral grain with computed tomography. Journal of
Wood Science, 47(4):289�293.
Sepúlveda, P., Oja, J., and Grönlund, A. (2002). Predicting spiral grain by computed tomog-
raphy of Norway spruce. Journal of Wood Science, 48(6):479�483.
Sliwa, T., Brunet, P., Voisin, Y., C., O. M., Stolz, C., and A. Diou, A. (2003). Detection
automatique des stries de croissance des arbres par transformee en ondelettes (automatic
detection of growth rings of trees by wavelet transforms). In Proceedings of the 16th
International Conference on Vision Interface, Halifax, CAN.
Smith, W. R. (1995). A prototype and algorithms for tree ring area measurement. In Pro-
ceedings of the 33rd annual on Southeast regional conference, ACM-SE 33, pages 254�259,
New York, USA. ACM.
Som, S., Davis, J., Wells, P., and Svalbe, I. (1993). Morphology methods for processing
tomographic images of wood. In Digital Image Computing: Techniques and Applications
(DICTA'93), volume 2, pages 564�571, Sydney, AU.
Som, S., Svalbe, I., Davis, J., Grant, J., Gold, E., Tsui, K., and Wells, P. (1995). Internal
scanning of logs for grade evaluation and defect location. In Digital Image Computing:
Techniques and Applications (DICTA'95), pages 408�413, Brisbane AU.
Töyrylä, I. (1999). Realising the Potential of Traceability � A Case Study Research on Usage
and Impacts of Product Traceability. PhD thesis, Helsinki University of Technology.

BIBLIOGRAPHY 102
Tzoulis, I. and Andreopoulou, Z. (2013). Emerging traceability technologies as a tool for
quality wood trade. Procedia Technology, 8(0):606�611.
Uusijärvi, R. (2010). Forest RFID transponder and reader design - indisputable key project.
Technical report, IST - ICT for Networked Businesses - Extended products and services.
[last accessed: 22.03.2012].
Vaz, C., Carvalho, P., Duarte, F., and Dourado, A. (2004). A vision-based system for automatic
growing ring detection and measurement. Comput. Ind. Eng., 46(2):347�354.
Wayman, J., Jain, A., and Maltoni, D. (2005). Biometric Systems. Springer Berlin / Heidel-
berg.
Wehrhausen, M., Norvin, N., Bruchert, F., and Sauter, U. (2012). Crack detection in computer
tomographic scans of softwood tree discs. Forest Products Journal, 62(6):434�442.
Wei, Q., Chui, Y., Leblon, B., and Zhang, S. (2009). Identi�cation of selected internal wood
characteristics in computed tomography images of black spruce: a comparison study. Journal
of Wood Science, 55(3):175�180.
Wells, P., Som, S., and Davis, J. (1991). Automated feature extraction from tomographic
images of wood. In Digital Image Computing: Techniques and Applications (DICTA'91),
volume 2, pages 564�571, Melbourne, AU.
Wiedenhoeft, A. (2010). Wood Handbook - Wood as an Engineering Material, chapter Struc-
ture and Function of Wood. Forest Products Laboratory. Wood handbook U.S. Department
of Agriculture.
Wu, J. and Liew, D. (2000). A computer vision method for detection of external log cracks and
pith in log cross-section images. In Procs. of the World Automation Congress: International
Symposium on Intelligent Automation and Control (ISIAC'00), Hawaii, USA.
Zhu, D. (1993). A feasibility study on using ct image analysis for hardwood log inspection.
PhD thesis, Virginia Polytechnic Institute and State University. AAI9323799.
Zhu, D., Conners, R., Schmoldt, D., and Araman, P. (1996). A prototype vision system
for analyzing CT imagery of hardwood logs. IEEE Transactions on Systems, Man, and
Cybernetics, Part B: Cybernetics, 26(4):522�532.