Evaluation and Comparison of Current Fetal Ultrasound Image Segmentation Methods for Biometric...
17
IEEE TRANSACTIONS ON MEDICAL IMAGING, VOL. 33, NO. 4, APRIL 2014 797 Evaluation and Comparison of Current Fetal Ultrasound Image Segmentation Methods for Biometric Measurements: A Grand Challenge Sylvia Rueda*, Sana Fathima, Caroline L. Knight, Mohammad Yaqub, Aris T. Papageorghiou, Bahbibi Rahmatullah, Alessandro Foi, Senior Member, IEEE, Matteo Maggioni, Antonietta Pepe, Jussi Tohka, Richard V. Stebbing, John E. McManigle, Student Member, IEEE, Anca Ciurte, Xavier Bresson, Meritxell Bach Cuadra, Changming Sun, Member, IEEE, Gennady V. Ponomarev, Mikhail S. Gelfand, Marat D. Kazanov, Ching-Wei Wang, Member, IEEE, Hsiang-Chou Chen, Chun-Wei Peng, Chu-Mei Hung, and J. Alison Noble Abstract—This paper presents the evaluation results of the methods submitted to Challenge US: Biometric Measurements from Fetal Ultrasound Images, a segmentation challenge held at the IEEE International Symposium on Biomedical Imaging 2012. The challenge was set to compare and evaluate current fetal ultrasound image segmentation methods. It consisted of automat- ically segmenting fetal anatomical structures to measure standard obstetric biometric parameters, from 2D fetal ultrasound images taken on fetuses at different gestational ages (21 weeks, 28 weeks, and 33 weeks) and with varying image quality to reflect data encountered in real clinical environments. Four independent sub-challenges were proposed, according to the objects of interest measured in clinical practice: abdomen, head, femur, and whole fetus. Five teams participated in the head sub-challenge and two teams in the femur sub-challenge, including one team who tackled both. Nobody attempted the abdomen and whole fetus Manuscript received May 29, 2013; revised July 24, 2013; accepted July 25, 2013. Date of publication August 06, 2013; date of current version March 31, 2014. Asterisk indicates corresponding author. Due to space constraints, funding information for this work appears in the acknowledgement section. S. Rueda is with the Institute of Biomedical Engineering, Department of Engineering Science, University of Oxford, OX3 7DQ Oxford, U.K. (e-mail: [email protected]). S. Fathima, M. Yaqub, B. Rahmatullah, R. V. Stebbing, J. E. McManigle, and J. A. Noble are with the Institute of Biomedical Engineering, Department of Engineering Science, University of Oxford, OX3 7DQ Oxford, U.K. C. L. Knight and A. T. Papageorghiou are with the Nuffield Department of Obstetrics and Gynaecology, University of Oxford, OX3 7DQ Oxford, U.K. A. Foi, M. Maggioni, A. Pepe, and J. Tohka are with the Department of Signal Processing, Tampere University of Technology, 33101 Tampere, Finland. A. Ciurte is with the Department of Computer Science, Technical University of Cluj-Napoca, 400020 Cluj-Napoca, Romania. M. Bach Cuadra is with the Department of Radiology, Centre Hospitalier Uni- versitaire Vaudois and University of Lausanne, Center for Biomedical Imaging (CIBM), and the Signal Processing Laboratory 5 (LTS5), Ecole Polytechnique Fédérale de Lausanne (EPFL), 1015 Lausanne, Switzerland. X. Bresson is with the Computer Science Department, City University of Hong Kong, Hong Kong. C. Sun is with the CSIRO Computational Informatics, North Ryde, NSW 1670, Australia. G. V. Ponomarev, M. S. Gelfand, and M. D. Kazanov are with the Research and Training Center on Bioinformatics, Institute for Information Transmission Problems, 127994 Moscow, Russia. C.-W. Wang, H.-C. Chen, C.-W. Peng, and C.-M. Hung are with the Graduate Institute of Biomedical Engineering, National Taiwan University of Science and Technology, Taipei 106, Taiwan. Color versions of one or more of the figures in this paper are available online at http://ieeexplore.ieee.org. Digital Object Identifier 10.1109/TMI.2013.2276943 sub-challenges. The challenge goals were two-fold and the partic- ipants were asked to submit the segmentation results as well as the measurements derived from the segmented objects. Extensive quantitative (region-based, distance-based, and Bland–Altman measurements) and qualitative evaluation was performed to com- pare the results from a representative selection of current methods submitted to the challenge. Several experts (three for the head sub-challenge and two for the femur sub-challenge), with different degrees of expertise, manually delineated the objects of interest to define the ground truth used within the evaluation framework. For the head sub-challenge, several groups produced results that could be potentially used in clinical settings, with comparable performance to manual delineations. The femur sub-challenge had inferior performance to the head sub-challenge due to the fact that it is a harder segmentation problem and that the techniques presented relied more on the femur’s appearance. Index Terms—Challenge, evaluation, fetal biometry, image quality, segmentation, ultrasound (US). I. INTRODUCTION U LTRASOUND (US) imaging is the modality of choice in many clinical applications due to its non-invasive nature, reduced cost, and real-time acquisition, compared to other imaging modalities, such as computed tomography (CT) or magnetic resonance imaging (MRI). However, US images are patient-specific, operator-dependent, and machine specific, which makes image appearance tightly linked to patient char- acteristics, the expertise of the clinician acquiring the images, and the machine used. Besides, due to the properties of image formation intrinsic to US images, they can be affected by signal dropouts, artefacts, missing boundaries, attenuation, shadows, and speckle, making US one of the most challenging modalities to work with. Depending on the orientation of the transducer, the image obtained might not have the expected anatomical significance and can be distorted or incomplete. Protocols are defined to acquire the best possible images while retaining the characteristics of the object of interest (e.g., shape and anatomy). 2D fetal US biometrics have been extensively used to es- tablish (or confirm) the gestational age of the fetus, estimate 0278-0062 © 2013 IEEE. Personal use is permitted, but republication/redistribution requires IEEE permission. See http://www.ieee.org/publications_standards/publications/rights/index.html for more information.
-
Upload
independent -
Category
Documents
-
view
1 -
download
0
Transcript of Evaluation and Comparison of Current Fetal Ultrasound Image Segmentation Methods for Biometric...

IEEE TRANSACTIONS ON MEDICAL IMAGING, VOL. 33, NO. 4, APRIL 2014 797
Evaluation and Comparison of Current FetalUltrasound Image Segmentation Methods forBiometric Measurements: A Grand ChallengeSylvia Rueda*, Sana Fathima, Caroline L. Knight, Mohammad Yaqub, Aris T. Papageorghiou,Bahbibi Rahmatullah, Alessandro Foi, Senior Member, IEEE, Matteo Maggioni, Antonietta Pepe,
Jussi Tohka, Richard V. Stebbing, John E. McManigle, Student Member, IEEE, Anca Ciurte, Xavier Bresson,Meritxell Bach Cuadra, Changming Sun, Member, IEEE, Gennady V. Ponomarev, Mikhail S. Gelfand,
Marat D. Kazanov, Ching-Wei Wang, Member, IEEE, Hsiang-Chou Chen, Chun-Wei Peng, Chu-Mei Hung, andJ. Alison Noble
Abstract—This paper presents the evaluation results of themethods submitted to Challenge US: Biometric Measurementsfrom Fetal Ultrasound Images, a segmentation challenge heldat the IEEE International Symposium on Biomedical Imaging2012. The challenge was set to compare and evaluate current fetalultrasound image segmentation methods. It consisted of automat-ically segmenting fetal anatomical structures to measure standardobstetric biometric parameters, from 2D fetal ultrasound imagestaken on fetuses at different gestational ages (21 weeks, 28 weeks,and 33 weeks) and with varying image quality to reflect dataencountered in real clinical environments. Four independentsub-challenges were proposed, according to the objects of interestmeasured in clinical practice: abdomen, head, femur, and wholefetus. Five teams participated in the head sub-challenge andtwo teams in the femur sub-challenge, including one team whotackled both. Nobody attempted the abdomen and whole fetus
Manuscript received May 29, 2013; revised July 24, 2013; accepted July 25,2013. Date of publication August 06, 2013; date of current version March 31,2014. Asterisk indicates corresponding author.Due to space constraints, funding information for this work appears in the
acknowledgement section.S. Rueda is with the Institute of Biomedical Engineering, Department of
Engineering Science, University of Oxford, OX3 7DQ Oxford, U.K. (e-mail:[email protected]).S. Fathima, M. Yaqub, B. Rahmatullah, R. V. Stebbing, J. E. McManigle,
and J. A. Noble are with the Institute of Biomedical Engineering, Departmentof Engineering Science, University of Oxford, OX3 7DQ Oxford, U.K.C. L. Knight and A. T. Papageorghiou are with the Nuffield Department of
Obstetrics and Gynaecology, University of Oxford, OX3 7DQ Oxford, U.K.A. Foi, M.Maggioni, A. Pepe, and J. Tohka are with the Department of Signal
Processing, Tampere University of Technology, 33101 Tampere, Finland.A. Ciurte is with the Department of Computer Science, Technical University
of Cluj-Napoca, 400020 Cluj-Napoca, Romania.M. Bach Cuadra is with the Department of Radiology, Centre Hospitalier Uni-
versitaire Vaudois and University of Lausanne, Center for Biomedical Imaging(CIBM), and the Signal Processing Laboratory 5 (LTS5), Ecole PolytechniqueFédérale de Lausanne (EPFL), 1015 Lausanne, Switzerland.X. Bresson is with the Computer Science Department, City University of
Hong Kong, Hong Kong.C. Sun is with the CSIRO Computational Informatics, North Ryde, NSW
1670, Australia.G. V. Ponomarev, M. S. Gelfand, and M. D. Kazanov are with the Research
and Training Center on Bioinformatics, Institute for Information TransmissionProblems, 127994 Moscow, Russia.C.-W.Wang, H.-C. Chen, C.-W. Peng, and C.-M. Hung are with the Graduate
Institute of Biomedical Engineering, National Taiwan University of Science andTechnology, Taipei 106, Taiwan.Color versions of one or more of the figures in this paper are available online
at http://ieeexplore.ieee.org.Digital Object Identifier 10.1109/TMI.2013.2276943
sub-challenges. The challenge goals were two-fold and the partic-ipants were asked to submit the segmentation results as well asthe measurements derived from the segmented objects. Extensivequantitative (region-based, distance-based, and Bland–Altmanmeasurements) and qualitative evaluation was performed to com-pare the results from a representative selection of current methodssubmitted to the challenge. Several experts (three for the headsub-challenge and two for the femur sub-challenge), with differentdegrees of expertise, manually delineated the objects of interestto define the ground truth used within the evaluation framework.For the head sub-challenge, several groups produced results thatcould be potentially used in clinical settings, with comparableperformance to manual delineations. The femur sub-challengehad inferior performance to the head sub-challenge due to the factthat it is a harder segmentation problem and that the techniquespresented relied more on the femur’s appearance.
Index Terms—Challenge, evaluation, fetal biometry, imagequality, segmentation, ultrasound (US).
I. INTRODUCTION
U LTRASOUND (US) imaging is the modality of choicein many clinical applications due to its non-invasive
nature, reduced cost, and real-time acquisition, compared toother imaging modalities, such as computed tomography (CT)or magnetic resonance imaging (MRI). However, US imagesare patient-specific, operator-dependent, and machine specific,which makes image appearance tightly linked to patient char-acteristics, the expertise of the clinician acquiring the images,and the machine used. Besides, due to the properties of imageformation intrinsic to US images, they can be affected by signaldropouts, artefacts, missing boundaries, attenuation, shadows,and speckle, making US one of the most challenging modalitiesto work with. Depending on the orientation of the transducer,the image obtained might not have the expected anatomicalsignificance and can be distorted or incomplete. Protocols aredefined to acquire the best possible images while retainingthe characteristics of the object of interest (e.g., shape andanatomy).2D fetal US biometrics have been extensively used to es-
tablish (or confirm) the gestational age of the fetus, estimate
0278-0062 © 2013 IEEE. Personal use is permitted, but republication/redistribution requires IEEE permission.See http://www.ieee.org/publications_standards/publications/rights/index.html for more information.

798 IEEE TRANSACTIONS ON MEDICAL IMAGING, VOL. 33, NO. 4, APRIL 2014
its size and weight, and identify growth patterns and abnor-malities [1]. Typically, fetal size is estimated by using 2DUS measurements of head, abdomen, and femur, at around20 weeks gestational age [2]. These measurements, and anyat later gestations, are then compared with population-basedgrowth charts to identify normal or abnormal growth. In anattempt to reduce intra- and inter-observer variability, andcreate more accurate and reproducible measurements [3],[4], automatic methods for fetal biometric measurementshave been investigated recently. Furthermore, automatedfetal biometry has been shown to improve the work flowefficiency by reducing the examination time and the numberof steps necessary for standard fetal measurements [5]. Thiswould also benefit less experienced users.It is worth noting that automated analysis of US images is
hard, and methods developed for MRI and CT do not neces-sarily work on US images. Furthermore, general methods forUS image segmentation do not exist, and the segmentationstrategies are application dependent [6]. The automatic segmen-tation methods previously developed in the fetal imaging fieldfocused on using segmentation as an intermediate processingstep for estimating standard biometric measurements. Most ofthe methods attempted to segment the fetal femur [7]–[10],the fetal head [11]–[16], or both [17]–[19]. The methods werebased on morphological operators, active contour models,Hough transform, deformable models, or machine learningapproaches. Low level features and textures were frequentlyused to find the femur and the skull, because these have abrighter response [Fig. 1(a) and (b)]. However, the task ofsegmenting the abdomen is more challenging and only fewworks have attempted it up-to-date [14], [20], [21]. Generalmethods retrieving all standard fetal biometric measurementsused in antenatal clinical practice are limited [22], [23], [4],[24]. Carneiro et al. [22] used a discriminative constrainedprobabilistic boosting tree classifier to segment structures ofinterest and to reproduce standard biometric measurementsfor all three objects of interest (head, abdomen, and femur) infetal US images. They developed and patented a commercialsystem, called Auto OB [4], which is integrated into Siemenssoftware and that can detect, apart from head, abdomen, andfemur biometric measurements, the humerus length (HL) andthe crown-rump length (CRL). This is the only system for fetalbiometry that has been translated into clinical practice.Among the different objects of interest, the simplest segmen-
tation and detection appears to be the head [Fig. 1(a)], becauseit presents clear boundaries and texture similarities among in-dividuals The fetal femur [Fig. 1(b)] can lack internal texture,which can make its accurate delineation difficult, but most ofthe time strong edges are present in most of their contour ex-cept in the extremities. The abdomen [Fig. 1(c)] and the wholefetus [Fig. 1(d)] segmentations are the hardest because they lackclear boundaries and have inconsistencies in the internal struc-tures among individuals. Furthermore, the healthy fetal bodychanges its shape across gestation, as a result of growth, andthe different organs that surround the object of interest createhigh pose and shape variability for the same structure.
Fig. 1. Ultrasound images of (a) the fetal head, (b) the fetal femur, (c) the fetalabdomen, and (d) the whole fetus.
This paper presents the evaluation and comparison of the rep-resentative selection of current methods presented during Chal-lenge US: Biometric Measurements from Fetal Ultrasound Im-ages1, a segmentation challenge held in conjunction and withthe support of the IEEE International Symposium on Biomed-ical Imaging (ISBI) 2012. The challenge consisted of four in-dependent sub-challenges according to the objects of interestmeasured in clinical practice on 2D fetal ultrasound images:abdomen, head, femur, and whole fetus (Fig. 1). The imageswere selected at three different gestational ages (21 weeks, 28weeks, and 33 weeks) and with varying image quality to repre-sent real clinical environments. The gestational ages were se-lected from 20 weeks onwards, as this is representative of areal clinical setting for this particular application. Several ex-perts, with different degrees of expertise, manually delineatedthe objects of interest to define the ground truth, which was usedwithin the segmentation framework. Extensive quantitative andqualitative evaluation was performed to assess the performanceof the methods with respect to manual delineations.Apart from the segmentation results, participants were asked
to estimate biometric measurements derived from the seg-mented objects, which are the values used clinically for fetalgrowth assessment. The evaluation of the segmentation resultsand derived measurements were performed separately, sincea segmentation result can be poor and still lead to good mea-surements. One key aspect missing in most US strategies is theability to incorporate image quality within the comparison, tounderstand which methods are more susceptible to changes inappearance. We have deliberately included analysis on data ofdifferent degrees of difficulty to better understand degradationof methods with quality.Five teams participated in the head sub-challenge and two
teams in the femur sub-challenge, including one team whotackled both. Nobody attempted the abdomen and the whole
1http://www.ibme.ox.ac.uk/challengeus2012

RUEDA et al.: EVALUATION AND COMPARISON OF CURRENT FETAL ULTRASOUND IMAGE SEGMENTATION METHODS 799
fetus sub-challenges. This is to our knowledge the first seg-mentation challenge undertaken in the fetal US imaging field,and thus provides both a reference publication from which togauge how well a representative selection of current methodswork today and may encourage others to work in this area.In Section II, we introduce the challenge aims, the description
of image data sets used within the challenge, and the descrip-tion of the fetal biometric measurements for the structures ofinterest. Section III presents the evaluation metrics used tocompare the segmentation results and derived measurements.Section IV introduces the ground truth and its reproducibilitystudy. Section V summarizes the methodologies presented tothe challenge. Quantitative and qualitative results are describedin Section VI. A discussion and conclusions are given inSections VII and VIII, respectively.
II. CHALLENGE US: BIOMETRIC MEASUREMENTSFROM FETAL ULTRASOUND IMAGES
A. Organization
The challenge was set up to automatically segment anatom-ical structures to measure standard obstetric biometric param-eters, from 2D fetal ultrasound images, taken on fetuses atdifferent gestational ages (21 weeks, 28 weeks, and 33 weeks).The segmentation challenge was formed by 4 sub-challenges,named fetal head, fetal abdomen, fetal femur, and whole fetus.The participation was open to those wanting to attempt one orseveral of these sub-challenges, presenting different degreesof difficulty. General solutions applicable to all four sub-chal-lenges had more value if the performance was good. Onlymethods based on automatic or semi-automatic segmentationtechniques were considered. The challenge was open to teamsfrom academia and industry. Published methods were allowedto be submitted. The results from each team were automaticallycompared to the ground truth, obtained from expert manualsegmentations and measurements. The challenge goals weretwo-fold, since segmented objects and derived clinical mea-surements were both considered to assess the quality of themethods. Two months were given to develop the methods andsubmit the results.
B. Description of Image Data Sets
All the images from this study were acquired by trained clin-icians using the same mid-range ultrasound machine PhilipsHD9 and following the protocols defined by the INTER-GROWTH-21st study [25]. Most of the images were acquiredwith a 7-3MHz transducer. In case of later gestations or mothershaving a high body mass index, the 5-2 MHz transducer waspreferred. The images were in DICOM format, anonymised,and automatically cropped (to remove the header) to a sizeof 756 546 pixels before distribution. Spatial resolution (inmillimeters) varied among the images.Fetal head, abdomen, and femur sub-challenges had a total of
90 images each in anonymised DICOM format and the wholefetus sub-challenge a total of 14 images, as these were not rou-tinely acquired on site. Three different gestational ages were
considered at 21, 28, and 33 weeks with a total of 30 imagesper gestational age for each of the structures considered. Thegestational ages to include in this challenge have been carefullyselected after clinical advice, providing a good representation ofthe challenges encountered across gestation. Furthermore, foreach gestational age, three groups of different qualities wereobtained. These were graded as low, medium, and high qualityand were selected as objectively as possible to create real imagedata sets as used in clinical practice. The reader is referred toAppendix A for details on the image scoring criteria used withinthis framework.
C. Participation in the Challenge
A total of six teams submitted results to the challenge. Fiveteams participated in the fetal head sub-challenge:
Foi et al. [26], Head contour extraction from the fetal ul-trasound images by difference of Gaussians revolved alongelliptical paths. (Finland).Ciurte et al. [27], A semi-supervised patch-based ap-proach for segmentation of fetal ultrasound imaging.(Switzerland).Stebbing and McManigle [28], A boundary fragmentmodel for head segmentation in fetal ultrasound. (U.K.).Sun [29], Automatic fetal head measurements from ultra-sound images using circular shortest paths. (Australia).Ponomarev et al. [30], A multilevel thresholding com-bined with edge detection and shape-based recognition forsegmentation of fetal ultrasound images. (Russia).
Two teams participated in the femur sub-challenge:Ponomarev et al. [30], A multilevel thresholding com-bined with edge detection and shape-based recognition forsegmentation of fetal ultrasound images. (Russia).Wang et al. [31], Automatic femur segmentation andlength measurement from fetal ultrasound images.(Taiwan).
Only the method by Ponomarev et al. [30] attempted to solveboth sub-challenges simultaneously. No attempts were made onabdomen and whole fetus segmentations. This could be due tothe fact that these two sub-challenges were harder because theimages tend to have fuzzy boundaries and present inconsisten-cies in the internal structures among individuals. Another pos-sible explanation would be the limited amount of time the teamshad to develop a new method. In the rest of the paper, we willonly focus on the head and femur sub-challenges.
D. Standard Fetal Biometry
Three standard fetal biometric measurements of the headwere considered: Biparietal Diameter (BPD), Occipito-FrontalDiameter (OFD), and Head Circumference (HC), as shown inFig. 2(a). Several ways of measuring BPD and OFD exist (e.g.,outer-to-outer, inner-to-outer). In this paper, BPD and OFDare defined as in the INTERGROWTH-21st study [25]. Thesemeasures are shown in Fig. 2(a). The HC parameter is derivedfrom BPD and OFD parameters as .Another standard measure for fetal biometry consists of mea-suring the femur length (FL). The FL is measured from the outer

800 IEEE TRANSACTIONS ON MEDICAL IMAGING, VOL. 33, NO. 4, APRIL 2014
Fig. 2. (a) Fetal Head Biometric Measurements: Head Circumference (HC),Biparietal Diameter (BPD), and Occipito-Frontal Diameter (OFD). (b) FetalFemur Biometric Measurement: Femur Length (FL).
TABLE IRESULTS REQUIRED FOR EACH SUB-CHALLENGE
edges of the bone, without taking into account the trochanter ofthe femur, as shown in Fig. 2(b).
E. Submission of Results
The results submitted depended on the sub-challenge at-tempted, as summarised in Table I. For the fetal head, due tothe huge difficulty in manually delineating the actual objectsin a variety of ultrasound images, the binary image resultingfrom the ellipse fitted object was used as the result. The valuefor the binary image pixels on the contour and inside of theellipses needed to be equal to 1 (foreground) and the rest equalto 0 (background).For the fetal femur, the whole segmented structure needed to
be obtained as part of the segmentation challenge. Recent clin-ical evidence [32], [33] has shown that other femoral character-istics, apart from the femur length, are important to assess fetalbone growth and development. Automatic and accurate tools forwhole femur bone segmentation, although limited, have showngreat potential [34], [35] and are able to perform more complexmeasurements for a better fetal bone development assessment.This is the clinical motivation for incorporating whole femurbone segmentation into this challenge.From the segmented objects, the biometric measurements
could be derived and needed to be presented as part of theresults, with the binary images. The measurements neededto be reported in millimeters, using the DICOM informationproviding the resolution of each image.
III. EVALUATION METRICS
The evaluation metrics chosen attempt to assess the quality ofthe segmentation as well as the measurements. Three differentcriteria were considered. First, region-based metrics were se-lected to assess the precision, specificity, sensitivity, and Dicesimilarity. Then, distance-based metrics were used to quantifythe local variability existing between the proposed methods andmanual delineations. Finally, Bland–Altman plots were used to
compare against clinical measurements, to show the agreementbetween the proposed methods and the experts. These metricsare defined in the following.
A. Region-Based Metrics
Region-based evaluation metrics, as defined in [36], were se-lected as a way of assessing precision and accuracy of differentsegmentation methods. Due to the difficulty of establishing truesegmentations, segmentation results were compared to manualdelineations of the structures, performed by several operatorstwice on each image. The results per image were averaged toobtain the overall performance for a particular expert and for allexperts. In the following, let denote the segmentation re-sults for a method M and the ground truth delineated bythe experts. All region-based metrics are given as percentages.1) Precision: The precision assesses the reproducibility
of each segmentation method. characterizes the commonamount of tissue in both and as a fraction of the totalamount of tissue in the union of and as
(1)
2) Accuracy: True positive (TP) and true negative (TN)mea-sures are calculated to assess the accuracy of each method [36].TP is the fraction of the total amount of tissue in the true delin-eation that was covered by the method and represents the delin-eation sensitivity. It is defined as
(2)
TN is the fraction of the total amount of tissue in the referenceregion that does not belong to the object and was excludedfrom the method. It represents the delineation specificity and isdefined as
(3)
where denotes the absolute complement of a set for a fixedreference region . The greater the TN values, the better thedelineation accuracy of a method.3) Dice Similarity: Dice similarity gives an indication of
the mutual overlap between and . is defined as
(4)
B. Distance-Based Metrics
Along with area overlap measures defined previously, dis-tance-based metrics, as described in [37], are incorporated intothe evaluation to provide different ways of assessing the er-rors of the different segmentation methods. These measures aregiven in millimeters.1) Maximum Symmetric Contour Distance: Let and
be the contours of and , respectively.

RUEDA et al.: EVALUATION AND COMPARISON OF CURRENT FETAL ULTRASOUND IMAGE SEGMENTATION METHODS 801
denotes a contour element of and a contour ele-ment of . The shortest distance of a pixel tois defined as
(5)
where denotes the Euclidean distance. The Maximum Sym-metric Contour Distance (MSD), also known as Hausdorff dis-tance [38], can then be expressed as
(6)
This measure is sensitive to outliers and returns the maximumerror, which represents the worst case scenario.2) Average Symmetric Contour Distance: TheAverage Sym-
metric Contour Distance (ASD) corresponds to the average ofall distances between and defined as
(7)
where denotes the length of the contour. A perfect segmen-tation would return a value of 0 mm.3) Root Mean Square Symmetric Contour Distance: The
Root Mean Square Symmetric Contour Distance (RMSD) is de-fined in (8), as shown at the bottom of the page. The RMSDis similar to the ASD but large distance differences betweencontours will return a greater value, penalizing large deviationsfrom the ground truth.
C. Bland–Altman Plots
Bland–Altman plots [39], [40] assess the agreement betweentwo sets of measurements. In this study, Bland–Altman plotsare used to compare the measurements derived from the seg-mentation results to the clinical measurements performed by the
different experts. This technique can also be used to obtain theinter- and intra-observer variability measurements.
D. Efficiency
Average segmentation times, software, and hardware used byeach method are reported in the paper but none of the methodshad been implemented for efficiency so such times are not aguide to practical deployment.
E. Failures
The failures of a method are reported individually on eachimage when no overlap exists between the segmentation re-sult and the ground truth delineated by the experts. Failures areexcluded from the segmentation evaluation and reported sepa-rately.
IV. GROUND TRUTH AND ITS REPRODUCIBILITY
A. Fetal Head Sub-Challenge
A total of three experts, with different degrees of expertise,participated in defining the fetal head sub-challenge groundtruth, by fitting an ellipse to the object of interest twice oneach image, as well as performing the corresponding standardclinical measurements (HC, BPD, OFD). The experts for thehead sub-challenge had the following level of expertise.• Expert 1: Clinician (fetal medicine specialist) with 10 yearpostgraduate experience in fetal US scans.
• Expert 2: Clinician (obstetrician) with two years experi-ence in fetal US scans.
• Expert 3: Engineer with 1 year of experience.The intra- and inter-observer variability was calculated
independently for each expert using the metrics defined inSection III. The average intra-expert variability results (re-sulting from comparing manual delineations) over all imagesare presented in Table II. The intra-expert variability is similarfor all three experts. Although there were minor differencesreflecting the levels of experience, these were not statisticallysignificant. Expert 3, who was the less experienced, obtainedslightly inferior results than the other two experts, but still veryclose.The average inter-expert variability results over all images
are presented in Table III comparing the manual delineationsfrom different experts two by two. The results are very similarbetween all combinations of experts.The intra- and inter-expert variability of the fetal biometric
measurements can be assessed using Bland–Altman plots, asreported in Tables IV and V, respectively. The mean values
(8)

802 IEEE TRANSACTIONS ON MEDICAL IMAGING, VOL. 33, NO. 4, APRIL 2014
TABLE IIINTRA-OBSERVER VARIABILITY OF MANUAL DELINEATIONS: FETAL HEAD
TABLE IIIINTER-OBSERVER VARIABILITY OF MANUAL DELINEATIONS: FETAL HEAD
TABLE IVINTRA-OBSERVER VARIABILITY OF CLINICAL MEASUREMENTS: FETAL HEAD
TABLE VINTER-OBSERVER VARIABILITY OF CLINICAL MEASUREMENTS: FETAL HEAD
in Table IV correspond to the bias between both measure-ments for each expert. The standard deviations representthe random error existing between measurements (repro-ducibility). Standard deviations in Table V represent thereproducibility of the measurements between experts. Boththe intra- (Table IV) and inter-expert (Table V) variabilityhave a lower standard deviation than previously reportedvalues [41], [42], indicating a higher reproducibility. This isdue to the fact that this study was performed on a differentclinical database to the ones used in [41] and [42] and thatthe experts had different levels of expertise. In the remainingof the paper, the reproducibility of the biometric measure-ments submitted to the head sub-challenge will be comparedto those reported in Tables IV and V.
B. Fetal Femur Sub-Challenge
For the femur sub-challenge, two experts performed manualdelineation of the fetal femur andmeasured the FL twice on eachimage. Delineation of the whole femur is not done in routineclinical practice, therefore only two experts were considered inthis case to account for manual tracing variability, whereas more
TABLE VIINTRA- AND INTER-OBSERVER VARIABILITY OF MANUAL DELINEATIONS:
FEMUR
TABLE VIIINTRA- AND INTER-OBSERVER VARIABILITY OF CLINICAL MEASUREMENTS:
FEMUR LENGTH
clinicians are experienced in biometric measurements. The ex-perts had the following level of expertise.• Expert 1: Engineer with more than three years of experi-ence in fetal femur segmentation.
• Expert 2: Clinician (obstetrician) with two years experi-ence in fetal US scans.
Intra- and inter-expert variability are presented in Table VI.Both experts present similar results for all the metrics used. Theresults are inferior to those presented for the head, because theaccurate delineation of the structures is more challenging andsubjected to higher variability due to the fuzzy boundaries andpresence of artefacts.The intra- and inter-expert variability of the fetal biometric
measurements can be assessed using Bland–Altman plots, as re-ported in Table VII. Similarly to the fetal head sub-challenge,the intra- and inter-expert variability (Table VII) show a higherreproducibility than those reported in [41], [42]. The FL mea-surements submitted to the femur sub-challenge will be assessedbased on Table VII.
V. METHODS
This section summarizes the methods that were submittedto the different sub-challenges. For more details, we refer thereader to the individual papers.
A. Fetal Head Sub-Challenge
Five very different methods were submitted to the fetalhead sub-challenge. The Foi et al. method [26] used signalprocessing operations combined with an optimization frame-work. The methods of Ciurte et al. [27] and Sun [29] usedgraph-based approaches. Stebbing and McManigle [28] useda machine learning approach based on a boundary fragmentmodel resulting from a training step. The Ponomarev et al.method [30] defined multiple thresholds combined with edgedetection and shape-based recognition and then fitted an ellipse

RUEDA et al.: EVALUATION AND COMPARISON OF CURRENT FETAL ULTRASOUND IMAGE SEGMENTATION METHODS 803
Fig. 3. (a) Surface modelling the fetal skull by revolving a difference of Gaus-sians along the elliptical path. Negative parts of the surface are not visible,hidden by the US image. (b) Example on a 21 week fetus using the proposedapproach. The central ellipse is the fitted ellipse. The outer ellipse is used forOFD and BPD measurements.
to the resulting binary image. A summary of each method ispresented in the following.1) Head Contour Extraction by Difference of Gaussians Re-
volved Along Elliptical Paths: Foi et al. [26] proposed a fullyautomatic method based on fitting an ellipse to each US imageby modelling the fetal head contour. This was achieved by min-imizing a cost function with respect to the parameters of theellipse, by using a global multi-scale multi-start Nelder–Meadalgorithm [43]. The images are first preprocessed to fill in theblack background outside the scanned area by extrapolating theimage inside the scanned area using a constrained iterative low-pass filter in the discrete cosine transform (DCT) domain. Then,image contrast and intensity are regularized by leveraging DCT-domain smoothing in order to provide smoothly varying localnormalization of intensities. For a given ellipse, the surface thatmodels the skull of the fetus is obtained by revolving a differ-ence of Gaussians along the elliptical path, as shown in Fig. 3(a).The cost function can then be defined as the product of theimage and the surface integrated over the image domain. Thecost function is minimized globally using a multiscale multistartNelder–Mead algorithm. The convergence of the optimizationalgorithm is accelerated by using a coarse-to-fine multi-scaleapproach, starting the process at a lower resolution and using theresult to initialise higher resolutions. The final biometric mea-surements are derived from the major and minor axes after ob-taining outer-to-outer measures of the skull. Fig. 3(b) shows thefitted ellipse and the inner and outer ellipses after incorporatingthe skull thickness. The method did not require any tuning ofparameters.2) Semi-Supervised Patch-Based Approach: Ciurte et al.
[27] proposed a semi-supervised patch-based segmentationapproach based on a previous work [44]. Each US image isrepresented by a graph of image patches (Fig. 4). A continuousmin-cut partition [45] of the graph and a fast minimizationscheme solve the segmentation problem. The method issemi-supervised, and therefore initial labels have to be definedon each image, to act as soft priors. In general, the labels aredefined by doing a few clicks on the image, resulting in aninitial polygonal shape. The automatization of the initializationwas performed by setting two concentric elliptic labels at themiddle of the image, as shown in Fig. 4. This assumes that thehead is always at the center of the image, which is not true
Fig. 4. Block diagram of the Patch-based Continuous Min-Cut (P-CMC) seg-mentation for fetal ultrasound images. Fetus of 28 weeks of gestational age. xand y correspond to two different pixels in the image (nodes of the graph). a isthe size of the searching window and b represents the patch size. w(x,y) is thesimilarity measure between pixels x and y.
Fig. 5. (a) Original image with edge fragments overlaid (yellow segments).(b) Edge map derived from feature asymmetry with final edge classificationoverlaid (blue: inner boundary; red: outer boundary).
in all cases. Otherwise, manual initialization was necessary.This was the case for around half of the images in the dataset. The segmentation returns a binary object with irregularcontour (red contour in Fig. 4), which is used in a secondstep to determine its corresponding elliptical binary object.For this purpose, the axis of elongation [46] of the resultingobject (or axis of least second-order moment) is computed. Theelongation axis corresponds to the OFD measurement, and theBPD can be computed perpendicularly to it, for the same centerof mass. An example of the resulting ellipse is given in Fig. 4(green contour). The parameter setting was constant for all tests( , scaling factor , and regularizationterm ).3) A Boundary Fragment Model for Random Forest Edge
Classification: Stebbing and McManigle [28] proposed an au-tomatic method, based on a boundary fragment model, con-structed using a machine learning approach, extending previouswork [47]. The method relies only on edge information, derivedfrom feature asymmetry [48]. From the edges, the position andorientation of edge pixels can be retrieved. A boundary frag-ment model [Fig. 5(a)] is then used to determine the centroidand scale of the skull by using a boosted classifier [49], whichallows to identify the optimal centroid and scale of the fetal skullby using a mean-shift method. The same boundary fragment

804 IEEE TRANSACTIONS ON MEDICAL IMAGING, VOL. 33, NO. 4, APRIL 2014
Fig. 6. Ellipse fitting step. (a) A dual ellipse fitted to inner (blue) and outer (red)contours. (b) Final result used for biometric measurements (red: outer contour).
model is then used in a Random Forest framework to differ-entiate between inner, outer edges, and background [Fig. 5(b)].An iterative dual ellipse fitting step is used to find the best innerand outer skull ellipses (Fig. 6) to derive the biometric measure-ments. The training samples were obtained from a set of imagesdifferent from the challenge data set. Half of the training setwas used to build the boundary fragment model and the otherhalf was used to train the detection and delineation classifiers.The training data was split in half randomly, only once. The pa-rameters used within the random forest framework were set em-pirically. Those needed to create the boundary fragment modelwere selected in line with [49]. Most of these parameters havelittle impact on the final performance and can be set within awide range.4) Circular Shortest Paths: Sun [29] proposed an automatic
method based on a graph-based approach called circular shortestpaths (CSP), developed in previous work [50]. The method isdivided into three main steps: circular shortest path extraction,robust ellipse fitting, and finding the outer edge of the skull. TheCSP algorithm ensures a closed boundary by forcing the startingand ending points of a shortest path to meet. The summation ofpixel values along the object boundary is maximized to obtainthe optimal path. The CSP algorithm is run up to three times.The third time will only be in the rare cases where BPD andOFD values are greater than a threshold. For each iteration, theimage is converted to polar coordinates, a CSP is found, andan ellipse is fitted. The robust ellipse fitting relies only on the50% brightest pixels on the circular shortest path, which aremost likely to belong to the skull. When the CSP is run for thethird time, the ellipse center is selected and the side of the el-lipse which best fits the data is used to constraint the locationand scale of the ellipse. Within the new constrained region, theCSP is run again and the new ellipse is found. The outer edgeof the skull is then retrieved by calculating the image gradientin the radial direction in the neighborhood of the fitted ellipseboundary, pointing towards the outside of the skull, and findingan edge. The resulting edge offset can then be added to the fittedellipse to find the outer edge of the skull to derive the biometricmeasurements. An example is given in Fig. 7. The parametersettings involved defining an image center, which was initiallyused for CSP finding; using the top 50% brightest pixels alongthe resulting CSP to fit the ellipse; and fixing the upper limits ofBPD and OFD values to 90 and 105, respectively, for the thirdCSP pass. The parameter setting was constant for all tests.
Fig. 7. (a) Closed contour (green) resulting from the CSP algorithm. (b) Finalfitted ellipse overlaid to the original image.
Fig. 8. (a) Original image. (b) Preliminary segmented objects. (c) Inscribedhead ellipse.
5) AMultilevel Thresholding CombinedWith Edge Detectionand Shape-Based Recognition: Ponomarev et al. [30] used amultilevel thresholding approach to segment the fetal skull com-bined with edge detection and shape-based recognition. This ap-proach makes use of the difference in intensities between thebone and the image background, and assumes that hard tissue(bone) appears brighter than the surrounding objects in the USimages. The methodology is based on multiple intensity levelthresholds. For each binary image obtained, the connected com-ponents are retrieved and a measure of thinness and elongationis calculated. The candidate objects are found after applying em-pirically chosen thresholds. A size constraint was also appliedto remove small objects. The objects resulting from the multi-thresholding were grouped into a cluster from which mean edgecontrast was calculated to estimate the best object intensity rep-resentation. The result for each cluster was transformed into abinary image, as shown in Fig. 8. The binary image containsspurious objects due to other structures appearing in the images.Ellipses are then fitted considering all possible combinationsusing a scoring function, created to study the contrast around theellipse contour, which should normally correspond to the skull.All the thresholds used within this approach were empiricallychosen and fixed for all experiments. This method was also ap-plied to the femur sub-challenge. The adaptations to this otherobject are defined in Section V-B.
B. Fetal Femur Sub-Challenge
Two teams participated in this sub-challenge. Both methodsrelied on appearance and edge information extracted directlyfrom intensity values.1) A Multilevel Thresholding Combined With Edge Detec-
tion and Shape-Based Recognition: Ponomarev et al. [30] at-tempted the segmentation of the femur, by adapting the previ-ously described method (Section V-A5) as follows. After ob-taining the binary image grouping the cluster values into one

RUEDA et al.: EVALUATION AND COMPARISON OF CURRENT FETAL ULTRASOUND IMAGE SEGMENTATION METHODS 805
Fig. 9. (a) Original image. (b) Preliminary segmented objects. (c) Recognisedfemur object.
Fig. 10. Entropy-based segmentation method. (a) Original image. (b) Resultafter entropy-based segmentation. (c) Final selected femur.
unique value, the method needs to guarantee that only one ob-ject is detected as femur. The authors expected the femur boneto have high brightness, large size, contrasted edges, and a cen-tral location within the image. These properties were used asfeatures to train a linear support vector machine (SVM) clas-sifier. This was obtained using exhaustive search with 10-foldcross-validation. The whole dataset was divided into 10 partsof equal size. For each iteration, the method was trained on theconcatenated set of nine parts and tested on the remaining part.The segmented objects were manually classified into positiveand negative classes to train the SVM classifier. This resulted ina scoring function, encoding the recognition model. The femurlength was then calculated as the longest distance between anypair of pixels for the selected binary object. An example canbe seen in Fig. 9. The parameters required for this method arethe coefficients used within the SVM approach. These were ad-justed using a cross-validation strategy from the training set.2) Morphology-Based Approach: Wang et al. [31] developed
a fully automatic method, based on morphology, to extract thefetal femur bone from the ultrasound images. They proposedtwo methods for segmenting the femur, one based on entropyand one based on edge detection. The first one was used as themain approach, and the second method was only used when themain approach failed, as an alternative approach.For the main approach, after the images were initially filtered
by a median filter, entropy-based segmentation identified pos-sible pixel candidates within the images, as shown in Fig. 10(b).To obtain the final segmented femurs, first the image comple-ment followed by a morphological dilation were performed foreach image. Then, slim and long connected objects can be au-tomatically selected as the final segmented femurs [Fig. 10(c)]by combining the information of density and height-to-widthratio for each segmented object. The density is calculated as thenumber of segmented pixels over the area of the bounding boxfor that particular object. The best object is obtained by consid-ering the morphology and layout of the detected objects.The alternative segmentation approach obtains the horizontal
edges and the stretched edges using filters as a preprocessing
Fig. 11. Edge-based segmentation method. (a) Original image. (b) Result afterhorizontal edges and stretching. (c) Selected femur.
step. The final step consists of seeking for the longest and slimobjects in the resulting edge images. An example is given inFig. 11.For both methods, the femur length is derived from the seg-
mentation results by using the width and height of the boundingrectangle of the segmented femur object. Two parameters areused within this method: the density of an object and the heightto width ratio of an object. These were held constant over alltests.
VI. EXPERIMENTAL RESULTS
In this section, the qualitative and quantitative evaluation forfetal head and fetal femur sub-challenges is presented. All theproposed methods are evaluated against the ground truth on the90 fetal US images acquired across gestation, as described inSection II-B.
A. Fetal Head Sub-Challenge
1) Failures: No failures were reported for the fetal head sub-challenge, and all the proposed methods obtained segmentationresults that overlapped the manually fitted ellipses drawn by theexperts.2) Qualitative Evaluation: Qualitative evaluation was per-
formed on the set of 90 fetal head US images acquired acrossgestation. The poorest result from each of the proposed methodsparticipating in this challenge is shown in Fig. 12. Note thatmost of the poor results correspond to images of 33 weeks fe-tuses, which generally have lower image quality (e.g., increasedshadowing due to increased bone density) than earlier gesta-tions. Similarly, the best results, displayed in Fig. 13, were gen-erally at early gestation (21 weeks and 28 weeks), where theimage quality is normally better, presenting less artefacts thanat later gestation and with clear anatomical definition.3) Quantitative Evaluation: Table VIII presents the region-
based and distance-based evaluation for each proposed method.The best results per metric are highlighted in bold. For the re-gion-based evaluation, the Foi et al. method performed bestin terms of precision and Dice similarity. Stebbing and Mc-Manigle’s method performed best in terms of sensitivity. Ciurteet al. obtained the best result in terms of specificity. Overall,the Foi et al. method had better performance followed closelyby Stebbing and McManigle’s method.For the distance-based evaluation, smallest mean error in
terms of MSD, ASD, and RMSD is obtained by the Foi et al.method, closely followed by Stebbing and McManigle. How-ever, Stebbing and McManigle’s method presents a smallerstandard deviation, showing that their segmentation is less vari-

806 IEEE TRANSACTIONS ON MEDICAL IMAGING, VOL. 33, NO. 4, APRIL 2014
Fig. 12. Poorest fetal head result for each proposed method in terms of precision. Yellow continuous lines denote the automatic methods. Dashed lines representmanually fitted ellipses by the clinical experts (magenta: Expert 1, green: Expert 2, white: Expert 3) as defined in Section IV-A.
Fig. 13. Best fetal head result for each proposed method in terms of precision. Yellow continuous lines denote the automatic methods. Dashed lines representmanually fitted ellipses by the clinical experts (magenta: Expert 1, green: Expert 2, white: Expert 3) as defined in Section IV-A.
TABLE VIIIQUANTITATIVE EVALUATION OF THE METHODS FOR THE FETAL HEAD SUB-CHALLENGE
able. Foi et al. also obtained similar results to the inter-observervariability presented in Table III, producing results comparableto manual delineation.To study if the performance varies for the different gestational
age groups, the mean and standard deviations in terms of preci-sion, accuracy (sensitivity and specificity), and Dice similarity,at 21, 28, and 33 weeks are presented in Fig. 14. The best per-formance in terms of mean precision [Fig. 14(a)] for all threegestational ages is by the Foi et al. method, closely followedby Stebbing and McManigle’s method. However, the Foi et al.standard deviation increases marginally across gestation. Thismight be due to the higher variation in image quality at latergestations and the presence of stronger artefacts. Stebbing andMcManigle’s method has a small and constant standard devia-tion across gestation. This is also true for the overall precisionpresented in Table VIII.In terms of sensitivity, Stebbing and McManigle and Foi
et al.’s methods perform better than the other methods ac-cording to Fig. 14(b). They also have the smallest standarddeviation, which increases slightly at later gestations. Sun’smethod has a similar performance, with constant mean andstandard deviation across gestation. In terms of specificity, all
methods seem to have constant means and standard deviationsaccording to Fig. 14(c). The best result is given by Ciurte et al.(Table VIII).In terms of Dice similarity, the Foi et al. method had the
best result, followed by Stebbing and McManigle and Sun[Fig. 14(d)]. This is also true overall, as shown in Table VIII.Mean and standard deviation appear quite constant for allmethods except for the Ponomarev et al. method.The last aspect of the evaluation was to study the performance
in terms of clinical measurements derived from the segmentedobjects. Table IX presents the mean and standard deviation fromthe Bland–Altman plots in comparison to each expert and overall experts. The best BPD results when compared with the ex-perts were obtained by Sun’s method, closely followed by theFoi et al.method. The best OFD results were obtained by the Foiet al. method, closely followed by Stebbing and McManigle’smethod. This means that the major axes of the fitted ellipses,from which the OFD measurements are derived, are probablymore accurate for the Foi et al. method and Stebbing and Mc-Manigle’s method, whereas the minor axis of the fitted ellipsesseems to be better detected by Sun’s method. Since the OFDmeasurement is greater than the BPD measurement, this results

RUEDA et al.: EVALUATION AND COMPARISON OF CURRENT FETAL ULTRASOUND IMAGE SEGMENTATION METHODS 807
Fig. 14. Mean and standard deviation for the fetal head for each gestational age in terms of (a) precision; (b) sensitivity; (c) specificity; and (d) Dice similarity.
TABLE IXBLAND–ALTMAN PLOTS (FETAL HEAD SUB-CHALLENGE): BPD, OFD, AND HC
in similar performance of the HC measurement with respect tothe OFD, as shown in Table IX.Overall, for the fetal head sub-challenge, the Foi et al.method
seems to perform best in terms of region-based and distance-based metrics, as well as clinical measurements. Stebbing andMcManigle obtained similar results. Sun’s method showed highagreement in BPD biometric measurements.
B. Fetal Femur Sub-Challenge
Qualitative and quantitative evaluation is performed in thefollowing for the two methods submitted to the fetal femur USimage segmentation challenge. The data set presents differentqualities, with some images especially challenging, but all ofthem used in clinical practice.1) Failures: The Ponomarev et al.method had a total of two
failures on different images, shown in Fig. 15. The Wang et al.method had a total of four failures over the 90 images in the fetalfemur dataset. The failures are presented in Fig. 16.Two of them were due to the method not finding any result
on the images. In both cases, the methods found other elongated
Fig. 15. (a)–(b) Failures of the Ponomarev et al. method in terms of precisionfor the fetal femur. Yellow continuous lines: automatic methods. Dashed lines:manual delineations (magenta: Expert 1, green: Expert 2).
objects in the images (e.g., other bones, adipose tissue layer,placental tissue) instead of the femur bone. This is because themethods are based on intensities, and the detected incorrect ob-jects had high intensity values while having an elongated shape.2) Quantitative Evaluation: The evaluation with respect to
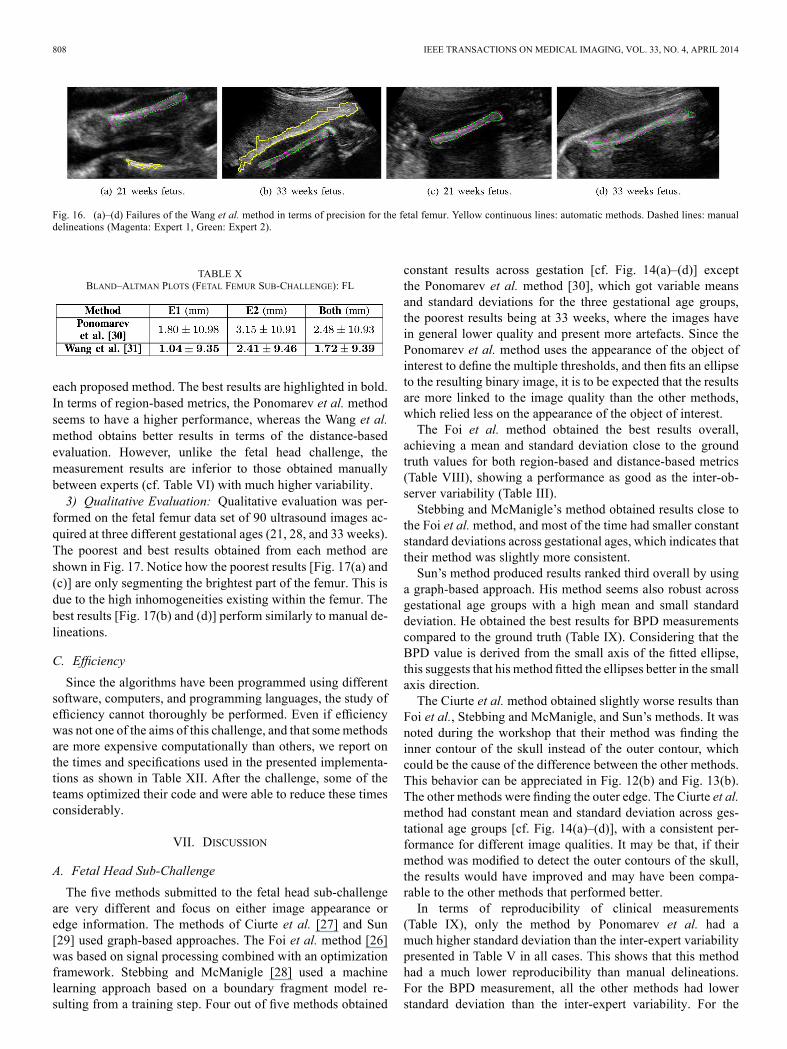
the measurements is presented in Table X and shows that thebest results are obtained by the Wang et al. method. Table XIpresents the region-based and distance-based evaluation for
808 IEEE TRANSACTIONS ON MEDICAL IMAGING, VOL. 33, NO. 4, APRIL 2014
Fig. 16. (a)–(d) Failures of the Wang et al. method in terms of precision for the fetal femur. Yellow continuous lines: automatic methods. Dashed lines: manualdelineations (Magenta: Expert 1, Green: Expert 2).
TABLE XBLAND–ALTMAN PLOTS (FETAL FEMUR SUB-CHALLENGE): FL
each proposed method. The best results are highlighted in bold.In terms of region-based metrics, the Ponomarev et al. methodseems to have a higher performance, whereas the Wang et al.method obtains better results in terms of the distance-basedevaluation. However, unlike the fetal head challenge, themeasurement results are inferior to those obtained manuallybetween experts (cf. Table VI) with much higher variability.3) Qualitative Evaluation: Qualitative evaluation was per-
formed on the fetal femur data set of 90 ultrasound images ac-quired at three different gestational ages (21, 28, and 33 weeks).The poorest and best results obtained from each method areshown in Fig. 17. Notice how the poorest results [Fig. 17(a) and(c)] are only segmenting the brightest part of the femur. This isdue to the high inhomogeneities existing within the femur. Thebest results [Fig. 17(b) and (d)] perform similarly to manual de-lineations.
C. Efficiency
Since the algorithms have been programmed using differentsoftware, computers, and programming languages, the study ofefficiency cannot thoroughly be performed. Even if efficiencywas not one of the aims of this challenge, and that somemethodsare more expensive computationally than others, we report onthe times and specifications used in the presented implementa-tions as shown in Table XII. After the challenge, some of theteams optimized their code and were able to reduce these timesconsiderably.
VII. DISCUSSION
A. Fetal Head Sub-Challenge
The five methods submitted to the fetal head sub-challengeare very different and focus on either image appearance oredge information. The methods of Ciurte et al. [27] and Sun[29] used graph-based approaches. The Foi et al. method [26]was based on signal processing combined with an optimizationframework. Stebbing and McManigle [28] used a machinelearning approach based on a boundary fragment model re-sulting from a training step. Four out of five methods obtained
constant results across gestation [cf. Fig. 14(a)–(d)] exceptthe Ponomarev et al. method [30], which got variable meansand standard deviations for the three gestational age groups,the poorest results being at 33 weeks, where the images havein general lower quality and present more artefacts. Since thePonomarev et al. method uses the appearance of the object ofinterest to define the multiple thresholds, and then fits an ellipseto the resulting binary image, it is to be expected that the resultsare more linked to the image quality than the other methods,which relied less on the appearance of the object of interest.The Foi et al. method obtained the best results overall,
achieving a mean and standard deviation close to the groundtruth values for both region-based and distance-based metrics(Table VIII), showing a performance as good as the inter-ob-server variability (Table III).Stebbing and McManigle’s method obtained results close to
the Foi et al.method, and most of the time had smaller constantstandard deviations across gestational ages, which indicates thattheir method was slightly more consistent.Sun’s method produced results ranked third overall by using
a graph-based approach. His method seems also robust acrossgestational age groups with a high mean and small standarddeviation. He obtained the best results for BPD measurementscompared to the ground truth (Table IX). Considering that theBPD value is derived from the small axis of the fitted ellipse,this suggests that his method fitted the ellipses better in the smallaxis direction.The Ciurte et al. method obtained slightly worse results than
Foi et al., Stebbing and McManigle, and Sun’s methods. It wasnoted during the workshop that their method was finding theinner contour of the skull instead of the outer contour, whichcould be the cause of the difference between the other methods.This behavior can be appreciated in Fig. 12(b) and Fig. 13(b).The other methods were finding the outer edge. The Ciurte et al.method had constant mean and standard deviation across ges-tational age groups [cf. Fig. 14(a)–(d)], with a consistent per-formance for different image qualities. It may be that, if theirmethod was modified to detect the outer contours of the skull,the results would have improved and may have been compa-rable to the other methods that performed better.In terms of reproducibility of clinical measurements
(Table IX), only the method by Ponomarev et al. had amuch higher standard deviation than the inter-expert variabilitypresented in Table V in all cases. This shows that this methodhad a much lower reproducibility than manual delineations.For the BPD measurement, all the other methods had lowerstandard deviation than the inter-expert variability. For the

RUEDA et al.: EVALUATION AND COMPARISON OF CURRENT FETAL ULTRASOUND IMAGE SEGMENTATION METHODS 809
TABLE XIQUANTITATIVE EVALUATION OF THE METHODS FOR THE FETAL FEMUR SUB-CHALLENGE
OFD measurement, only the method by Foi et al. had a re-producibility within the range reported in Table V. The othermethods had a slightly higher standard deviation, but closeto the ground truth values, except for the Ponomarev et al.method. For the HC measurement, only the methods by Foi etal. and Stebbing and McManigle had a reproducibility close tomanual segmentations. The other methods, except the one byPonomarev et al., obtained values within the range reported inprevious reproducibility studies [41], [42].
B. Fetal Femur Sub-Challenge
Fetal femur segmentation is the harder of the two sub-chal-lenges. The complete segmentation of the femur needs to takeinto account the huge inhomogeneities existing in the objectof interest. The two methods participating in this challengerelied on appearance and edge information extracted directlyfrom intensity values. This makes the methods rely on theimage quality and in some cases miss certain parts of thefemur bone during the segmentation process. It also makes themethods more prone to finding other objects that are not thefemur bone but have similar appearance to it, hence producingfailures on some of the images. This challenge would requirea more advanced modelling of the femur bone, incorporatingmorphological measures of normal fetal femur across gesta-tional ages. The overall mean values in terms of precision,sensitivity, and Dice similarity, were lower than those obtainedmanually (Table XI). The overall standard deviations of bothmethods ranged around 16%–17% for precision, 19%–20% forsensitivity, and 14%–15% for Dice similarity, indicating a highvariability with respect to the ground truth. Manual segmenta-tions presented a standard deviation around 5% for precision,6% sensitivity, and 3% Dice similarity for intra-expert vari-ability (Table VI). Considering the inter-expert variability,precision had a standard deviation around 6%, sensitivityaround 7%, and Dice similarity around 4%.This sub-challenge proves the necessity of using both region
and distance-based metrics for segmentation evaluation. ThePonomarev et al. method [30] obtained better results in termsof precision, specificity, sensitivity, and Dice similarity, whereasthe Wang et al. method [31] achieved better results in terms ofMSD, ASD, and RMSD values (Table XI). The Ponomarev etal. method had higher overlap with respect to manual segmen-tations than the Wang et al. method, and slightly higher dis-tance-based errors. This could also be due to the fact that theWang et al.method had twomore failures than the Ponomarev etal. method, and the evaluation results were reported only in theimages where there were no failures. Therefore, the Ponomarevet al. had slightly higher MSD, ASD, and RMSD, but thesewere calculated on two more images than in the Wang et al.method. In terms of the actual FL measurement, the Wang et al.
Fig. 17. Poorest and best fetal femur results for each proposed method in termsof precision. Yellow continuous lines: automatic methods. Dashed lines: manualdelineations (magenta: Expert 1, green: Expert 2).
method obtained better results for both mean and standard devi-ation (Table X). However, in terms of reproducibility of the FLmeasurement (cf. Table X), none of the methods obtained a stan-dard deviation within the values reported in Table VII, whichmeans that they had low reproducibility compared to manualdelineations.Another discrepancy to note was that some of the Wang et al.
segmentation results only found the brightest part of the bone,resulting in an incomplete segmentation result, but a good FLmeasurement could still be observed [e.g., Fig. 17(a)]. Whenthe femur’s appearance had homogeneous intensity values, bothmethods seemed to perform well, agreeing with manual delin-eations [e.g., Fig. 17(b) and (d)].
C. General Observations
Signal processing methods, graph-based methods, and ma-chine learning methods seemed to achieve a good performance,since they considered the images as a whole. Some of these alsotake into account the relationship between different regions ofthe images simultaneously. On the contrary, intensity and gra-dient-based methods have a lower performance, since they relymore on the appearance of the objects of interest, which presenthigh variability.
D. How to Move the Fetal us Image Segmentation FieldForward?
From the four sub-challenges proposed, only the head andfemur challenges were attempted. The abdomen and whole

810 IEEE TRANSACTIONS ON MEDICAL IMAGING, VOL. 33, NO. 4, APRIL 2014
TABLE XIICOMPUTER SPECIFICATIONS AND EFFICIENCY
fetus segmentations are extremely challenging due to the lackof strong object boundaries and the similar appearance ofsurrounding objects. General frameworks that could solve allfour sub-challenges simultaneously are yet to be developed. Asargued in [6], successful US image segmentation methods arenormally application dependent.One of the main difficulties of working with US images
is that they have a variable appearance and it is difficult toobtain quantitative measures of quality to provide more in-sight on the performance of different methods with respect toimage quality in an objective manner. We need better tools ofquantitatively assessing US image quality, to be able to studymethod’s performance in depth, relating the performance tothe quality of the image. This can be extrapolated to otherimaging modalities, but it is especially important in a modalitylike US. This is a problem that is not solved yet and needs fur-ther investigation.
VIII. CONCLUSION
This paper presented a thorough qualitative and quantita-tive segmentation evaluation of the representative selectionof current methods submitted to Challenge US: BiometricMeasurements from Fetal Ultrasound Images, held at ISBI2012. The images were selected to incorporate the differentqualities, reflective of a real antenatal clinical environment.Three different gestational ages were assessed to incorporateimage variability across gestation. Several experts manuallydelineated the objects of interest to define the ground truth,which was used within the evaluation framework. A total offive teams submitted their results to the fetal head sub-challengeand two teams to the fetal femur sub-challenge, including oneteam who attempted both.The results for the fetal head sub-challenge show that a very
good performance can be achieved and that it is comparableto manual delineations. Several groups produced results thatcould be potentially used in clinical settings. The fetal femursub-challenge consisted of solving a very hard segmentationproblem, since the object of interest has strong appearancechanges within the object. Furthermore, other elongated objectsare present around the femur bone, causing methods to fail incertain situations. The performance of the femur sub-challengewas inferior to the head sub-challenge, because the task wasmore complex and the techniques used relied more on thefemur’s appearance.
Further investigation is necessary to provide better quanti-tative tools for assessing US image quality, which in turn willassist in developing a better understanding of how images copewith the image quality variability.On release of the data, anticipated autumn 2014, the web-
site (http://www.ibme.ox.ac.uk/challengeus2012) will providea mechanism to upload new segmentation results and comparethem to previous methods.
APPENDIX AIMAGE QUALITY SCORING CRITERIA
In the following, we present the scoring criteria used for se-lecting images of different qualities within each sub-challenge.The scoring criteria is based on a score-basedmethod for qualitycontrol [51]–[53]. The aimwas to select as many good, medium,and high quality images within each gestational age group asobjectively as possible. Considerations of image quality are notindependent of the gestational ages considered, as they describequality variation of cross-sectional data (data in a certain gesta-tional agewindow), which capture a wide range of image qualityfactors. The scoring criteria was different for each sub-challengeand was performed by experts on each type of images, takinginto account the image characteristics. In the case of fetal ul-trasound images, the fetal anatomy varies during pregnancy, aswell as soft tissue properties and composition. The quality ofthe images diminishes with gestational age as shown in Figs. 18and 19 for the head and femur, respectively. This is due to the in-crease of the body mass index of the mother towards the end ofpregnancy, the increase in fetal bone density and fetal size, thereduced amniotic fluid present in older fetuses, and the changesof tissue texture, which create different speckle patterns at dif-ferent gestational ages.The scoring criteria used to classify the fetal head images
(Fig. 18) between low, medium, and high score is as follows.Low: Skull is not symmetrical or elliptical in shape. Skullboundary is barely visible. Internal anatomy is difficult todiscern with an overall lack of contrast in the image.Medium: The fetal skull should be roughly elliptical inshape. Skull boundary visible but not less than 60% en-circlement. Rough internal anatomy visible (lateral ventri-cles, cerebral falx, cavum septum pellucidum, thalamus).Average contrasted image.High: Fetal skull should be roughly symmetrical and ellip-tical in shape. Skull boundary should be visible with more

RUEDA et al.: EVALUATION AND COMPARISON OF CURRENT FETAL ULTRASOUND IMAGE SEGMENTATION METHODS 811
Fig. 18. Ultrasound images of the head at (a)–(c) 21 weeks of gestation, (d)–(f)28 weeks of gestation, and (g)–(i) 33 weeks of gestation.
Fig. 19. Ultrasound images of the femur at (a)–(c) 21 weeks of gestation,(d)–(f) 28 weeks of gestation, and (g)–(i) 33 weeks of gestation.
than 60% encircled cranial area. Internal anatomy (lateralventricles, cerebral falx, cavum septum pellucidum, thal-amus, and cortical boundary) visible and discernible. Highcontrasted image.
The scoring criteria used to classify the fetal femur images(Fig. 19) considered.• The sharpness of the border of the femur from all direc-tions.
• How easy it is to find femur end points (distal and prox-imal).
• The difference between the femur and its surrounding tis-sues. Better femur images need to have bright femur andrelatively dark surrounding.
• The continuity of the femur. Some femurs are not fullyvisible because of the scan signal direction and shadowingso these are low quality.
We can observe that more artefacts appear in the imagestowards the end of pregnancy as a result of the fetus becomingbigger and compressed within the womb, with less space tomove. The bone density in the fetus increases too, creatingshadows and splaying in the ultrasound images. These shadowsappear in the skull in the head, in the ribs and spine in theabdomen, and in the femur in the leg, respectively. Changesin size, shape, pose, and composition are also important, espe-cially in the abdomen that is a soft body region in comparisonto the bony structures of head and femur.
ACKNOWLEDGMENT
S. Rueda, J. A. Noble, and C. L. Knight acknowledge theWellcome/EPSRC Centre of Excellence in Medical Engi-neering—Personalised Healthcare, WT 088877/Z/09/Z. Thework of A. T. Papageorghiou was supported by the Oxford Part-nership Comprehensive Biomedical Research Centre fundedby the Department of Health NIHR Biomedical ResearchCentres funding scheme. The work of M. Yaqub was supportedby the EPSRC Grant EP/G030693/1. The work of A. Foi, M.Maggioni, A. Pepe, and J. Tohka was supported in part by theAcademy of Finland under Grant 130275 and Grant 252547, inpart by the Tampere Graduate School in Information Scienceand Engineering (TISE), and in part by the Finnish DoctoralProgramme in Computational Sciences (FICS). The work ofA. Ciurte, X. Bresson, M. Bach Cuadra was supported by theCenter for Biomedical Imaging (CIBM) of the Geneva-Lau-sanne Universities and the EPFL, as well as the foundationsLeenaards and Louis-Jeantet. The work of R.V. Stebbing and J.E. McManigle’s was supported by the Rhodes Trust, in part bythe U.S. National Institutes of Health (NIH) Graduate Partner-ship Program (GPP), and in part by the National Heart, Lung,and Blood Institute (NHLBI) intramural research program. Thework of G. V. Ponomarev, M. S. Gelfand, and M. D. Kazanovwas supported by the Ministry of Education and Science ofRussian Federation under Project 8049. The medical imageswere provided by the International Fetal and Newborn GrowthConsortium, INTERGROWTH-21st, Nuffield Department ofObstetrics and Gynaecology, John Radcliffe Hospital, Univer-sity of Oxford, Oxford, U.K. The authors would like to thankProf. J. K. Udupa for the useful discussions on segmentationevaluation.
REFERENCES
[1] P. Loughna, L. Chitty, T. Evans, and T. Chudleigh, “Fetal size anddating: Charts recommended for clinical obstetric practice,” Ultra-sound, vol. 17, no. 3, pp. 161–167, 2009.
[2] B. Hearn-Stebbins, “Normal fetal growth assessment: A review of lit-erature and current practice,” J. Diagn. Med. Sonog., vol. 11, no. 4, pp.176–187, July 1995.

812 IEEE TRANSACTIONS ON MEDICAL IMAGING, VOL. 33, NO. 4, APRIL 2014
[3] M. Pramanik, M. Gupta, and K. B. Krishnan, “Enhancing repro-ducibility of ultrasonic measurements by new users,” Proc. SPIEMedical Imaging: Image Perception, Observer Performance, andTechnology Assessment, vol. 8673, p. 86730Q, 2013.
[4] G. Carneiro, B. Georgescu, and S. Good, “Knowledge-based auto-mated fetal biometrics using syngo Auto OB measurements,” SiemensMedical Solutions, 2008.
[5] J. Espinoza, S. Good, E. Russell, and W. Lee, “Does theuse of automated fetal biometry improve clinical work flowefficiency?,” Journal of Ultrasound in Medicine, vol. 32, no.5, pp. 847–850, 2013.
[6] J. A. Noble and D. Boukerroui, “Ultrasound image segmentation: Asurvey,” IEEE Trans. Med. Imaging., vol. 25, no. 8, pp. 987–1010,2006.
[7] J. G. Thomas, R. A. Peters, and P. Jeanty, “Automatic segmentation ofultrasound images using morphological operators,” IEEE Trans. Med.Imaging, vol. 10, no. 2, pp. 180–186, 1991.
[8] J. G. Thomas, P. Jeanty, R. A. Peters, and E. A. Parrish, “Automaticmeasurements of fetal long bones. a feasibility study,” J. UltrasoundMed., vol. 10, no. 7, pp. 381–385, July 1991.
[9] B. Rahmatullah and R. Besar, “Analysis of semi-automated methodfor femur length measurement from foetal ultrasound,” J. Med. Eng.Technol., vol. 33, no. 6, pp. 417–425, 2009.
[10] V. Shrimali, R. S. Anand, and V. Kumar, “Improved segmentationof ultrasound images for fetal biometry, using morphologicaloperators,” IEEE Eng. Med. Biol. Soc., vol. 2009, pp. 459–462,2009.
[11] C. W. Hanna and A. B. M. Youssef, “Automated measurements in ob-stetric ultrasound images,” in ICIP, Oct. 1997, pp. 504–507.
[12] W. Lu and J. Tan, “Segmentation of ultrasound fetal images,” Biolog-ical Quality and Precision Agriculture II, vol. 4203, no. 1, pp. 81–90,2000.
[13] W. Lu, J. Tan, and R. Floyd, “Automated fetal head detectionand measurement in ultrasound images by iterative randomizedHough transform,” Ultrasound Med. Biol., vol. 31, no. 7, pp.929–936, July 2005.
[14] V. Chalana, T. C. Winter, D. R. Cyr, D. R. Haynor, and Y. Kim, “Auto-matic fetal head measurements from sonographic images,” Acad. Ra-diol., vol. 3, no. 8, pp. 628–635, Aug. 1996.
[15] S. D. Pathak, V. Chalana, and Y. Kim, “Interactive automatic fetalhead measurements from ultrasound images using multimedia com-puter technology,” Ultrasound Med. Biol., vol. 23, no. 5, pp. 665–673,1997.
[16] S. D. Pathak, V. Chalana, and Y. Kim, “Multimedia systems in ultra-sound image boundary detection and measurements,” Proceedings ofSPIE Medical Imaging 1997: Image Display, vol. 3031, pp. 397–408,1997.
[17] S. M. G. V. B. Jardim and M. A. T. Figueiredo, “Automatic contourestimation in fetal ultrasound images,” in ICIP, Sept. 2003, vol. 2–3,pp. II-1065–1068.
[18] S. M. G. V. B. Jardim and M. A. T. Figueiredo, “Segmentation of fetalultrasound images,”UltrasoundMed. Biol., vol. 31, no. 2, pp. 243–250,Feb. 2005.
[19] B. P. Shan and M. Madheswaran, “Extraction of fetal biometrics usingclass separable shape sensitive approach for gestational age estima-tion,” in ICCTD, 2009, pp. 376–380.
[20] J. Nithya and M. Madheswaran, “Detection of intrauterine growth re-tardation using fetal abdominal circumference,” ICCTD, pp. 371–375,2009.
[21] J. Yu, Y.Wang, P. Chen, and Y. Shen, “Fetal abdominal contour extrac-tion and measurement in ultrasound images,” Ultrasound Med. Biol.,vol. 34, no. 2, pp. 169–182, Feb. 2008.
[22] G. Carneiro, B. Georgescu, S. Good, and D. Comaniciu, “Automaticfetal measurements in ultrasound using constrained probabilisticboosting tree,” in MICCAI, 2007, vol. 10, pp. 571–579, Part II, LNCS4792.
[23] G. Carneiro, B. Georgescu, S. Good, and D. Comaniciu, “Detection andmeasurement of fetal anatomies from ultrasound images using a con-strained probabilistic boosting tree,” IEEE Trans Med. Imaging, vol.27, no. 9, pp. 1342–1355, Sept. 2008.
[24] J. Yu, Y. Wang, and P. Chen, “Fetal ultrasound image segmentationsystem and its use in fetal weight estimation,”Med. Biol. Eng. Comput.,vol. 46, no. 12, pp. 1227–1237, Dec. 2008.
[25] International Fetal and Newborn Growth Consortium, The Interna-tional Fetal and Newborn Growth Standards for the 21st Century(Intergrowth-21st) Study Protocol [Online]. Available: www.inter-growth21.org.uk 2008
[26] A. Foi, M. Maggioni, A. Pepe, and J. Tohka, “Head contour extrac-tion from the fetal ultrasound images by difference of gaussians re-volved along elliptical paths,” in Proceedings of Challenge US: Bio-metric Measurements from Fetal Ultrasound Images, ISBI 2012, 2012,pp. 1–3.
[27] A. Ciurte, X. Bresson, and M. B. Cuadra, “A semi-supervised patch-based approach for segmentation of fetal ultrasound imaging,” in Pro-ceedings of Challenge US: Biometric Measurements from Fetal Ultra-sound Images, ISBI 2012, 2012, pp. 5–7.
[28] R. V. Stebbing and J. E. McManigle, “A boundary fragment modelfor head segmentation in fetal ultrasound,” in Proceedings of Chal-lenge US: Biometric Measurements from Fetal Ultrasound Images,ISBI 2012, 2012, pp. 9–11.
[29] C. Sun, “Automatic fetal head measurements from ultrasound imagesusing circular shortest paths,” in Proceedings of Challenge US: Bio-metric Measurements from Fetal Ultrasound Images, ISBI 2012, 2012,pp. 13–15.
[30] G. V. Ponomarev, M. S. Gelfand, and M. D. Kazanov, “A multilevelthresholding combined with edge detection and shape-based recogni-tion for segmentation of fetal ultrasound images,” in Proceedings ofChallenge US: Biometric Measurements from Fetal Ultrasound Im-ages, ISBI 2012, 2012, pp. 17–19.
[31] C.-W. Wang, H.-C. Chen, C.-W. Peng, and C.-M. Hung,“Automatic femur segmentation and length measurement fromfetal ultrasound images,” Proceedings of Challenge US: BiometricMeasurements from Fetal Ultrasound Images, ISBI 2012, pp.21–23, 2012.
[32] C. H. Chang, P. Y. Tsai, C. H. Yu, H. C. Ko, and F.M. Chang, “Prenataldetection of fetal growth restriction by fetal femur volume: efficacy as-sessment using three-dimensional ultrasound,” Ultrasound Med. Biol.,vol. 33, no. 3, pp. 335–341, 2007.
[33] P. A. Mahon, C. Cooper, S. R. Crozier, and K. M. Godfrey, “The use of3d ultrasound to investigate fetal bone development,” Norsk Epidemi-ologi, vol. 19, no. 1, pp. 45–52, 2009.
[34] M. Yaqub, M. K. Javaid, C. Cooper, and J. A. Noble, “Improvingthe classification accuracy of the classic rf method by intelligentfeature selection and weighted voting of trees with application tomedical image segmentation,” in Workshop on Machine Learningin Medical Imaging (MLMI)—MICCAI, 2011, vol. 7009, pp.184–192.
[35] C. Ioannou, M. Yaqub, A. Noble, K. Javaid, and A. Papageorghiou,“Fetal femur volume measurement using fusion of multiple three-di-mensional ultrasound image sets: A pilot study,” Ultrasound Obstet.Gynecol., vol. 36, no. S1, p. 80, 2010.
[36] J. K. Udupa, V. R. Leblanc, Y. Zhuge, C. Imielinska, H. Schmidt, L. M.Currie, B. E. Hirsch, and J. Woodburn, “A framework for evaluatingimage segmentation algorithms,” Comput. Med. Imaging Graph, vol.30, no. 2, pp. 75–87, 2006.
[37] T. Heimann, B. van Ginneken, M. A. Styner, Y. Arzhaeva, V. Au-rich, C. Bauer, A. Beck, C. Becker, R. Beichel, G. Bekes, F. Bello, G.Binnig, H. Bischof, A. Bornik, P. M.M. Cashman, Y. Chi, A. Cordova,B. M. Dawant, M. Fidrich, J. D. Furst, D. Furukawa, L. Grenacher, J.Hornegger, D. Kainmller, R. I. Kitney, H. Kobatake, H. Lamecker, T.Lange, J. Lee, B. Lennon, R. Li, S. Li, H.-P. Meinzer, G. Nemeth, D.S. Raicu, A.-M. Rau, E. M. van Rikxoort, M. Rousson, L. Rusko, K. A.Saddi, G. Schmidt, D. Seghers, A. Shimizu, P. Slagmolen, E. Sorantin,G. Soza, R. Susomboon, J. M. Waite, A. Wimmer, and I. Wolf, “Com-parison and evaluation of methods for liver segmentation from CTdatasets,” IEEE Trans. Med. Imaging, vol. 28, no. 8, pp. 1251–1265,Aug. 2009.
[38] D. Huttenlocher, D. Klanderman, and A. Rucklige, “Comparing imagesusing the Hausdorff distance,” IEEE Trans. Pattern Anal. Mach. Intell.,vol. 15, no. 9, pp. 850–863, 1993.
[39] J. M. Bland and D. G. Altman, “Statistical methods for assessing agree-ment between two methods of clinical measurement,” Lancet, vol. 1,pp. 307–310, 1986.
[40] J. M. Bland and D. G. Altman, “Measurement error,” BMJ, vol. 313,pp. 744–753, 1996.

RUEDA et al.: EVALUATION AND COMPARISON OF CURRENT FETAL ULTRASOUND IMAGE SEGMENTATION METHODS 813
[41] S. Perni, F. A. Chervenak, R. B. Kalish, S. Magherini-Rothe, M.Predanic, J. Streltzoff, and D. W. Skupski, “Intraobserver and interob-server reproducibility of fetal biometry,” Ultrasound Obstet. Gynecol.,vol. 24, no. 6, pp. 654–658, 2004.
[42] I. Sarris, C. Ioannou, P. Chamberlain, E. Ohuma, F. Roseman, L. Hoch,D. G. Altman, and A. T. Papageorghiou, “International fetal and new-born consortium for the 21st century (INTERGROWTH-21st intra-and interobserver variability in fetal ultrasound measurements,” Ultra-sound Obstet Gynecol, vol. 39, no. 3, pp. 266–273, 2012.
[43] J. A. Nelder and R. Mead, “A simplex method for function minimiza-tion,” The Computer Journal, vol. 7, no. 4, pp. 308–313, 1965.
[44] A. Ciurte, N. Houhou, S. Nedevschi, A. Pica, F. L. M. J.-P. Thiran, X.Bresson, and M. B. Cuadra, “An efficient segmentation method for ul-trasound images based on a semi-supervised approach and patch-basedfeatures,” in ISBI, 2011, pp. 969–972.
[45] N. Houhou, X. Bresson, A. Szlam, T. F. Chan, and J.-P. Thiran, “Semi-supervised segmentation based on non-local continuous min-cut,” inSSVM, 2009, pp. 112–123.
[46] J. Flusser, “On the independence of rotation moment invariants,” Pat-tern Recogn, vol. 33, no. 9, pp. 1405–1410, Oct. 2000.
[47] R. V. Stebbing, J. E. McManigle, and J. A. Noble, “Interpreting edgeinformation for improved endocardium delineation in echocardio-grams,” in ISBI, 2012, pp. 238–241.
[48] P. Kovesi, “Image features from phase congruency,” Videre, vol. 1, no.3, 1999.
[49] J. Shotton, A. Blake, and R. Cipolla, “Multiscale categorical objectrecognition using contour fragments,” IEEE Trans. Pattern Anal.Mach. Intell., vol. 30, no. 7, pp. 1270–1281, 2008.
[50] B. Appleton and C. Sun, “Circular shortest paths by branch and bound,”Pattern Recogn., vol. 36, no. 11, pp. 2513–2520, 2003.
[51] L. J. Salomon, J. P. Bernard, M. Duyme, B. Doris, N. Mas, and Y.Ville, “Feasibility and reproducibility of an image-scoring method forquality control of fetal biometry in the second trimester,” UltrasoundObstet. Gynecol., vol. 27, no. 1, pp. 34–40, 2006.
[52] L. J. Salomon, N. Winer, J. P. Bernard, and Y. Ville, “A score-basedmethod for quality control of fetal images at routine second-trimesterultrasound examination,” Prenat. Diagn., vol. 28, no. 9, pp. 822–827,2008.
[53] L. J. Salomon, M. Nassar, J. P. Bernard, Y. Ville, A. Fauconnier, and S.F. Pour, “A score-based method to improve the quality of emergencygynaecological ultrasound examination,” Eur. J Obstet. Gynecol. Re-prod. Biol., vol. 143, no. 2, pp. 116–120, 2009, L’Amélioration desPratiques Echographiques (SFAPE).