Robust hand image processing for biometric application
11
THEORETICAL ADVANCES Robust hand image processing for biometric application Jugurta Montalva ˜o • Lucas Molina • Ja ˆnio Canuto Received: 29 May 2007 / Accepted: 13 July 2008 / Published online: 16 September 2010 Ó Springer-Verlag London Limited 2010 Abstract A new approach for both hand image seg- mentation and feature extraction is described. The main advantage of this approach, namely its robustness to low quality images, is illustrated through verification experi- ments with two public databases: one with scanned images from 50 subjects and another one with low-quality images acquired from 23 subjects, from a conventional webcam. In both cases, features are successfully extracted and good performances are obtained, in spite of image quality. Moreover, the main drawbacks of feature extraction in conventional algorithms are highlighted. Keywords Peg-free hand recognition EIH-inspired method Robustness against noise Clustering fingers 1 Introduction Hand shape recognition for individual identification/ver- ification is now a well known biometric modality [1–3]. It is roughly based upon the hypothesis that individuals have different hand geometries (e.g. finger lengths, finger widths, palm area). Another important hand based biometric approach takes into account palmprints [4, 5] instead of contours and/or finger/palm dimensions. Although the fusion of both approaches seems to be a natural trend for hand biometrics, this paper is only concerned with shape-based issues. In spite of the relatively low performance of this kind of biometric scheme, mainly if compared to typical fingerprint or iris-based schemes, hand geometry is attractive because of its unobtrusiveness, low-cost and low-data storage requirement [6]. Nevertheless, unlike fingerprints, for instance, hand geometry is expected to be more prone to deformations, mainly due to free finger rotations. Conse- quently, early attempts at individual authentication through hand geometry were mostly based on digital images from hands placed on flat surfaces with fixed pegs carefully placed in order to constrain the hands into a standard position, before hand picture is taken and digitalized [1]. It is also known [2] that, though pegs indeed facilitate image segmentation and feature extraction, it does not totally avoid finger translation/rotation and, unless some kind of image normalization is applied prior to hand-to-hand geometry comparisons, performances can be strongly degraded due to even small mismatchings between parts of such images. Indeed, assuming that mismatchings between images to be compared are a kind of measurement noise, it has been observed that, in some cases, this noise can be much greater than differences between hand geometries from individuals (i.e., useful signal), which are often minute [6]. Moreover, pegs or other positioning devices may deform hand shape if they push the hand skin during data acqui- sition. For instance, in [1], finger widths just beside pegs are avoided during feature extraction. Most recent approaches that have appeared in literature claim that they allow ‘‘free’’ hand positioning during acquisition. However, according to what we can infer from database samples presented in [3, 7, 8], for instance, sub- jects are somehow induced to place their hands according to a preestablished orientation for the whole hand, into a J. Montalva ˜o (&) L. Molina J. Canuto Universidade Federal de Sergipe (UFS), Sa ˜o Cristo ´va ˜o CEP 49100-000, Brazil e-mail: [email protected]; [email protected] L. Molina e-mail: [email protected] J. Canuto e-mail: [email protected] 123 Pattern Anal Applic (2010) 13:397–407 DOI 10.1007/s10044-010-0185-7
-
Upload
independent -
Category
Documents
-
view
0 -
download
0
Transcript of Robust hand image processing for biometric application

THEORETICAL ADVANCES
Robust hand image processing for biometric application
Jugurta Montalvao • Lucas Molina •
Janio Canuto
Received: 29 May 2007 / Accepted: 13 July 2008 / Published online: 16 September 2010
� Springer-Verlag London Limited 2010
Abstract A new approach for both hand image seg-
mentation and feature extraction is described. The main
advantage of this approach, namely its robustness to low
quality images, is illustrated through verification experi-
ments with two public databases: one with scanned images
from 50 subjects and another one with low-quality images
acquired from 23 subjects, from a conventional webcam. In
both cases, features are successfully extracted and good
performances are obtained, in spite of image quality.
Moreover, the main drawbacks of feature extraction in
conventional algorithms are highlighted.
Keywords Peg-free hand recognition � EIH-inspired
method � Robustness against noise � Clustering fingers
1 Introduction
Hand shape recognition for individual identification/ver-
ification is now a well known biometric modality [1–3]. It
is roughly based upon the hypothesis that individuals have
different hand geometries (e.g. finger lengths, finger
widths, palm area).
Another important hand based biometric approach takes
into account palmprints [4, 5] instead of contours and/or
finger/palm dimensions. Although the fusion of both
approaches seems to be a natural trend for hand biometrics,
this paper is only concerned with shape-based issues.
In spite of the relatively low performance of this kind of
biometric scheme, mainly if compared to typical fingerprint
or iris-based schemes, hand geometry is attractive because
of its unobtrusiveness, low-cost and low-data storage
requirement [6]. Nevertheless, unlike fingerprints, for
instance, hand geometry is expected to be more prone to
deformations, mainly due to free finger rotations. Conse-
quently, early attempts at individual authentication through
hand geometry were mostly based on digital images from
hands placed on flat surfaces with fixed pegs carefully
placed in order to constrain the hands into a standard
position, before hand picture is taken and digitalized [1].
It is also known [2] that, though pegs indeed facilitate
image segmentation and feature extraction, it does not totally
avoid finger translation/rotation and, unless some kind of
image normalization is applied prior to hand-to-hand
geometry comparisons, performances can be strongly
degraded due to even small mismatchings between parts of
such images. Indeed, assuming that mismatchings between
images to be compared are a kind of measurement noise, it
has been observed that, in some cases, this noise can be much
greater than differences between hand geometries from
individuals (i.e., useful signal), which are often minute [6].
Moreover, pegs or other positioning devices may deform
hand shape if they push the hand skin during data acqui-
sition. For instance, in [1], finger widths just beside pegs
are avoided during feature extraction.
Most recent approaches that have appeared in literature
claim that they allow ‘‘free’’ hand positioning during
acquisition. However, according to what we can infer from
database samples presented in [3, 7, 8], for instance, sub-
jects are somehow induced to place their hands according
to a preestablished orientation for the whole hand, into a
J. Montalvao (&) � L. Molina � J. Canuto
Universidade Federal de Sergipe (UFS),
Sao Cristovao CEP 49100-000, Brazil
e-mail: [email protected]; [email protected]
L. Molina
e-mail: [email protected]
J. Canuto
e-mail: [email protected]
123
Pattern Anal Applic (2010) 13:397–407
DOI 10.1007/s10044-010-0185-7

limited area, from which they are finally free to rotate their
fingers, given that fingers do not touch each other. Indeed,
this is explicitly mentioned in [2].
A few state-of-the-art works also propose strategies for
‘‘contact-free’’ hand feature extraction, such as in [9, 10].
Though these approaches are more computationally
demanding—because hands are free to rove around a 3-D
limited space, instead of the usual 2-D flat surfaces—they
represent a new paradigm in terms of user acceptance.
Unfortunately, they face some segmentation problems that
are beyond the scope of this paper. Therefore, in this paper,
though some 3-D segmentation problems are briefly men-
tioned in Sect. 2, we limit our focus to 2-D hand repre-
sentation, acquired from flat surfaces.
In spite of the diversity and creativeness of new
approaches to process ‘‘freely’’ placed hands, on flat sur-
faces, there is, at least, a common point among most of
them: they depend upon boundary-following algorithms,
even though relatively little attention is paid to this very
first step to be done. Consequently, motivated by the lack
of robustness of boundary-tracking algorithms, mainly
when applied to noisy images of hands with rings or other
jewelry, we propose here a new method where no explicit
contour tracing algorithms are applied.
In our approach—somehow inspired by the Ensemble
Histogram Interval (EIH) approach [11] mainly applied to
speech signals, whose main advantage is its robustness
against noise—hand images are scanned column by col-
umn (or row by row, alternatively), and fingers are detected
by signal frequency analysis.
Thus, the main matter of this work is robustness of hand
image processing, which is discussed in Sect. 2, prior to the
description of the proposed method, in Sects. 3 and 4. In
Sect. 5, some details concerning databases used in this
work are given. In Sect. 6, experimental results are pre-
sented and, finally, we discuss the main issues from the
new proposal in Sect. 7.
2 Robustness issues
Feature extraction approaches from hand images in [1, 2, 6,
8, 12–14] and [15], for instance, depend upon common
preprocessing steps, namely: foreground segmentation,
boundary detection. Moreover, except for [1] and [15], they
also depend on contour tracking algorithms. Additionally,
after contour tracking is done, corresponding finger and
palm contours must be properly segmented.
In most published works, where hand images are scanned
with conventional desktop scanners, or pictures are taken
under controlled illumination, foreground segmentation is
not an important matter. For instance, in [6], both simple
clustering and more sophisticated watershed transform-based
segmentation were compared through their database, pro-
viding equivalent results. Similarly, in [3], after experiments
with three clustering algorithms for gray-level threshold
search, the authors finally concluded that small variations in
the threshold choice do not relevantly affect their final results.
Thus, for their database, a range from 65 to 100 (in 256 gray
levels) was considered as the threshold choice.
On the other hand, boundary detection and contour
tracking seem to be less straightforward matters. Surely,
even a simple contour tracking algorithm, whenever it is
properly initialized, may do the job correctly. Figure 1
illustrates such a case.
However, algorithms without specific constraints to deal
with rings, other jewelry, or even part of the arm are clearly
more prone to mistakes and may provide meaningless
contours, as it is shown in Fig. 2.
In [6], for instance, it is highlighted that delineation of
hand contours must be very accurate, since the difference
between hands of different individuals are often minute. In
fact, the authors pay special attention to the filtering of
perturbation due to ring artifacts, however, not enough
details are given concerning the boundary-following algo-
rithm used by them.
Similarly, in [2], it is explicitly mentioned that the trace
of hand contours is obtained by ‘‘a boundary following
algorithm’’. Unfortunately, no further information con-
cerning this algorithm is provided.
In [3], a contour tracking algorithm from [16] was
modified: 8 directions were considered instead of 4. This
Fig. 1 Successful contour tracing illustration
Fig. 2 Bad contour tracing illustration
398 Pattern Anal Applic (2010) 13:397–407
123

adaptation was not justified in the paper but we believe that
it may have been motivated by robustness issues, to avoid
bad contours.
To get some experimental insights concerning this issue,
we also adapted a simple tracking bug algorithm to thinned
hand contours in our own low-quality database (the BioC-
haves database, see Sect. 5 for further details). But first, we
manually removed wrist and arm from each original image
(a typical example is show in Fig. 2), in order to get only
fingers and palm contour, as it is shown in Fig. 1. Still, the
algorithm was carefully initialized with a start point cor-
responding to the thumb contour. It is worth noting that to
do so, some initial information concerning hand position
and orientation is necessary. However, in spite of this highly
favorable setup, in our experiment with low quality images,
we obtained 12 bad contours, out of 115 images.
Furthermore, once hand contours are properly obtained,
in most approaches, it is necessary to estimate which part
of the contour corresponds to each finger, so that each
finger can be translated/rotated prior to metric compari-
sons. In both [2] and [13] very similar algorithms based on
contour curvature to detect fingertips and valleys between
fingers are used. However, from Figure 2(a) in [2], it is
easy to infer that correct fingertip and valley detection
depends upon a threshold to be set to a limited value
interval—high thresholds may cause false detection of tips/
valleys, whereas small ones may cause non-detection of
actual tips/valleys.1
We applied the algorithm proposed in [2] to our data-
base and we indeed observed that this limited threshold
interval, illustrated in Fig. 3, is a clear drawback of this
approach, in terms of robustness.
In order to cope with this lack of robustness, in [13], a
Gaussian (low-pass) filter is applied to the signal corre-
sponding to the contour curvature index, therefore, pro-
viding a larger range for a suitable threshold. Nevertheless,
none of them study the risk of tips/valleys detection failing,
in spite of the importance of the success of this step for the
whole algorithm, in both cases. That is to say that, if a
single valley is missed, for instance, all features detected
afterwards are likely to be meaningless.
Yoruk et al. [6] have experimented with the same
approach based on the curvature of the contour for detec-
tion of tips and valleys, but they observed that ‘‘this
technique was rather sensitive to contour irregularities,
such as spurious cavities and kinks, especially around the
ill-defined wrist region’’. Consequently, they proposed a
more robust alternative, based on the radial distance from
contour points to a reference point around the wrist region.
Unfortunately, the reference point, defined as the first
intersection point of the major axis (the largest eigenvector
of the hand inertial matrix) with the wrist line, depends on
the definition of the wrist line, not provided in their paper.
Nevertheless, we tried the approach by assuming that the
reference point is the closest intersection point toward the
wrist (note that a previous knowledge about finger orien-
tation is necessary in this case). But, as it is illustrated in
Fig. 4, the reference point found in this way is not a robust
parameter, at least for images in our database, though the
approach proposed in [6] is possibly suitable for images
taken from conventional scanners, as in their work, where
hands are easily segmented from the foreground, excluding
parts of the arm.
Fig. 3 Curvature-based method for finding fingertips and valleys
between fingers
(b)(a)
Fig. 4 Finding reference points according to the strategy proposed by
Yoruk et al. [6]
1 Some papers, such as [3], do not provide an explanation for either
how the arm is separated from the hand, or how finger tips are
detected.
Pattern Anal Applic (2010) 13:397–407 399
123

Finally, even in contact-free hand geometry techniques,
such as [10] and [9], hand segmentation is a crucial con-
cern. In [10], for instance, though feature point extraction
is performed in a fairly clear imaging background, the
authors remark that it (automated feature extraction)
remains a ‘‘very challenging process’’. Indeed, in spite of
their powerful approach based on projective invariants, in
order to get hand boundary properly detected, they need an
application-tuned Canny edge detector, two thresholding
steps, one being with hysteresis, and a morphological
erosion. They also apply a zero-crossing technique to
identify edge pixels during finger seam detection. Again, a
third threshold is necessary to filter trivial edges.
Similarly, in [9], where a 3-D segmentation is done
through the fitting of a Gaussian Mixture Model to the
detected points, the convergence of the iterative Expecta-
tion-Maximization procedure relies on good initial
parameter values. Therefore, in order to cope with the risk
of wrong convergency, which is analogous to 2-D region
segmentation through clustering, the authors exploit prior
knowledge of the body geometry. Nonetheless, even with
this application-tuned solution, after hand points are seg-
mented, the authors declare that hand silhouette is not
reliably estimated. Consequently, they follow a more
elaborate procedure instead, based on the distance trans-
form, which provides the smallest distance from each pixel
to the noisy hand boundary. As a result, both palm center
and approximated radius are estimated without contour
tracking.
Motivated by the former observations, we propose a new
method based on the following straightforward hypothesis:
– In behalf of robustness, explicit contour tracking
algorithms are to be avoided.
– In most hand images, three or four fingers are almost
parallel and detection based on this parallelism is less
prone to mistakes.
– Doing multiple trials of simple detection tests is a
straightforward recipe for robust strategies. More
specifically, our approach is directly motivated by
results from the application of the Ensemble Histogram
Interval (EIH) [11] on speech signals, and by its
robustness against noise.
We highlight that the application of this method is
limited to 2-D hand images, or 2-D projection of 3-D
models.
3 Image preprocessing
Before application of the proposed method itself, a
simple two-step pre-processing must be considered for
each hand image. Pictures are assumed to present a
single left hand image. Whenever the background is
roughly uniform, a single threshold should be applied in
order to provide a two level representation, where hand
(foreground) pixels are coded in black and background
pixels, in white. Figure 5 illustrates this first prepro-
cessing step.
From our database, three color channels—red, green and
blue—from each hand picture are available, with intensity
levels ranging from 0 (lowest) to 255 (brightest). For our
database, enough contrast between foreground (hand) and
background was observed from the red channel, which was
systematically taken as preprocessing input. Then a static
intensity threshold equal to 100 was applied to provide the
two-level matrix, where each entry corresponds to a image
pixel, whose gray level attribute is 0 (black foreground)
whenever red channel intensity is above threshold, or 255
(white background) otherwise.
HSV color space representation prior to background
segmentation was also tested, but it did not improve
segmentation results. As far as we can understand this
result, it is probably due to the strong amount of red
present in the targeted foreground, the human skin.
Nonetheless, we highlight that, depending on the back-
ground color, perceptual color space, such as HSV,
would provide better results. In any case, even in RGB
space, we did not optimize discriminability between
foreground and background. Instead, we chose channel R
for simplicity. Besides, it is clear that we could improve
foreground segmentation by using better illumination or
even another more elaborated setup for hand image
capture. Nonetheless, the noisy foreground segmentation
we obtained is rather welcome in this work because it
highlights the robustness of the main part of our
approach, which is aimed at replacing boundary-follow-
ing algorithms.
This two-level matrix is then low-pass filtered and, from
the resulting matrix, M, two discrete gradient matrices are
obtained, namely Dx and Dy, according to:
Dx ¼M �H ð1Þ
Dy ¼M �HT ð2Þ
where symbol * stands for 2-D discrete convolution,
T stands for matrix transposition and
Fig. 5 Preprocessing—step 1: thresholding
400 Pattern Anal Applic (2010) 13:397–407
123
H ¼
þ1 þ1 0 �1 �1
þ1 þ1 0 �1 �1
þ1 þ1 0 �1 �1
þ1 þ1 0 �1 �1
þ1 þ1 0 �1 �1
266664
377775
is the low-pass filter mask.
Then, intensity gradient, G, can be obtained as in Eq. 3.
Gði; jÞ ¼ Dxði; jÞux þ Dyði; jÞuy ð3Þ
where ux and uy are orthonormal vectors.
Figure 6 illustrates this second pre-processing step by
showing |G| as a gray bitmap.
4 Proposed method
4.1 Step one: column-by-column scanning
First, a compensation factor C ¼ cosðXði; jÞÞ is computed
for each image pixel, according to Eq. 4, where Xði; jÞ ¼\Gði; jÞ � p=2; as illustrated in Fig. 7.
Cði; jÞ ¼ Dyði; jÞðDxði; jÞ2 þ Dyði; jÞ2Þ
ð4Þ
Then, assuming that matrix M represents a single left hand
image with fingers oriented from right to left, M is then
scanned column-by-column, so that whenever a Hgray level
(threshold) crossing is detected, the corresponding line, j, is
recorded along with its column, i.
Each thus detected pixel position, (i, j), along with the
corresponding parameters L(i, j) and C(i, j), are given as
inputs to a list of all points sequentially detected, column-
by-column, through the whole matrix (bitmap) M.
Let Pn ¼ ðin; jnÞ; n ¼ 1; . . .;N be the whole set of points
sequentially detected from the leftmost column to the
rightmost one. Then, a rough but biased finger and/or palm
width estimation, in pixels, is provided by
Lði; jÞ ¼ jmþ1 � jm
where m only corresponds to points Pm associated to high-
to-low Hgray-gray level crossings (presumably, a lower
boundary of a finger/palm).
Clearly, finger/palm width estimation L(i, j) strongly
depends on the finger/palm rotation. That is to say that
fingers and/or palm, not horizontally oriented, do provoke
biased higher L values.
To compensate for this bias, L(i, j) must be multiplied
by the compensation factor C(i, j), according to the illus-
tration in Fig. 7.
4.2 Step two: spectral detection of quasi-parallel
fingers
Alternatively, an equivalent representation of detected
points and their corresponding parameters is provided by
the following vectors:
– x(m): column index, i, where the mth high-to-low Hgray
crossing was detected. Note that columns are scanned
from left (i = 1) to right.
– y(m): row index, j, (down-up) corresponding to the m-th
detected high-to-low Hgray crossing.
– l(m): corresponding compensated width, i. e. l(m) =
L(i, j)C(i, j).
– c(m): corresponding compensation factor, i. e. c(m) =
C(i, j).
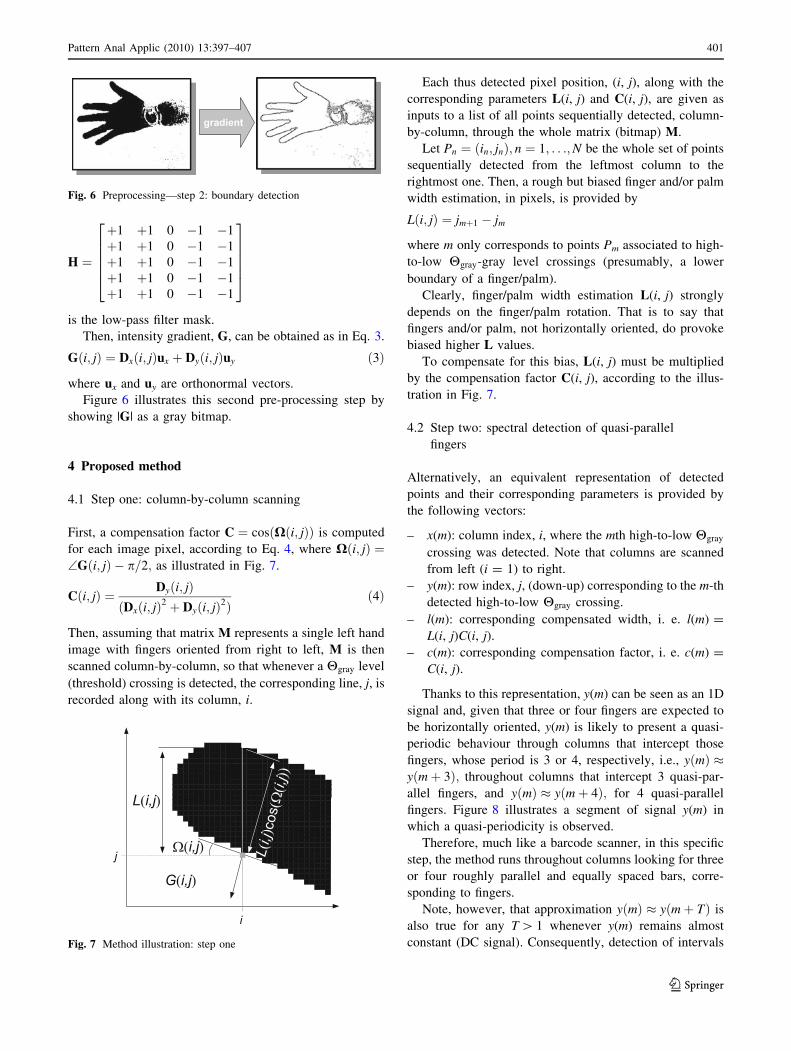
Thanks to this representation, y(m) can be seen as an 1D
signal and, given that three or four fingers are expected to
be horizontally oriented, y(m) is likely to present a quasi-
periodic behaviour through columns that intercept those
fingers, whose period is 3 or 4, respectively, i.e., yðmÞ �yðmþ 3Þ; throughout columns that intercept 3 quasi-par-
allel fingers, and yðmÞ � yðmþ 4Þ; for 4 quasi-parallel
fingers. Figure 8 illustrates a segment of signal y(m) in
which a quasi-periodicity is observed.
Therefore, much like a barcode scanner, in this specific
step, the method runs throughout columns looking for three
or four roughly parallel and equally spaced bars, corre-
sponding to fingers.
Note, however, that approximation yðmÞ � yðmþ TÞ is
also true for any T [ 1 whenever y(m) remains almost
constant (DC signal). Consequently, detection of intervals
Fig. 6 Preprocessing—step 2: boundary detection
Fig. 7 Method illustration: step one
Pattern Anal Applic (2010) 13:397–407 401
123
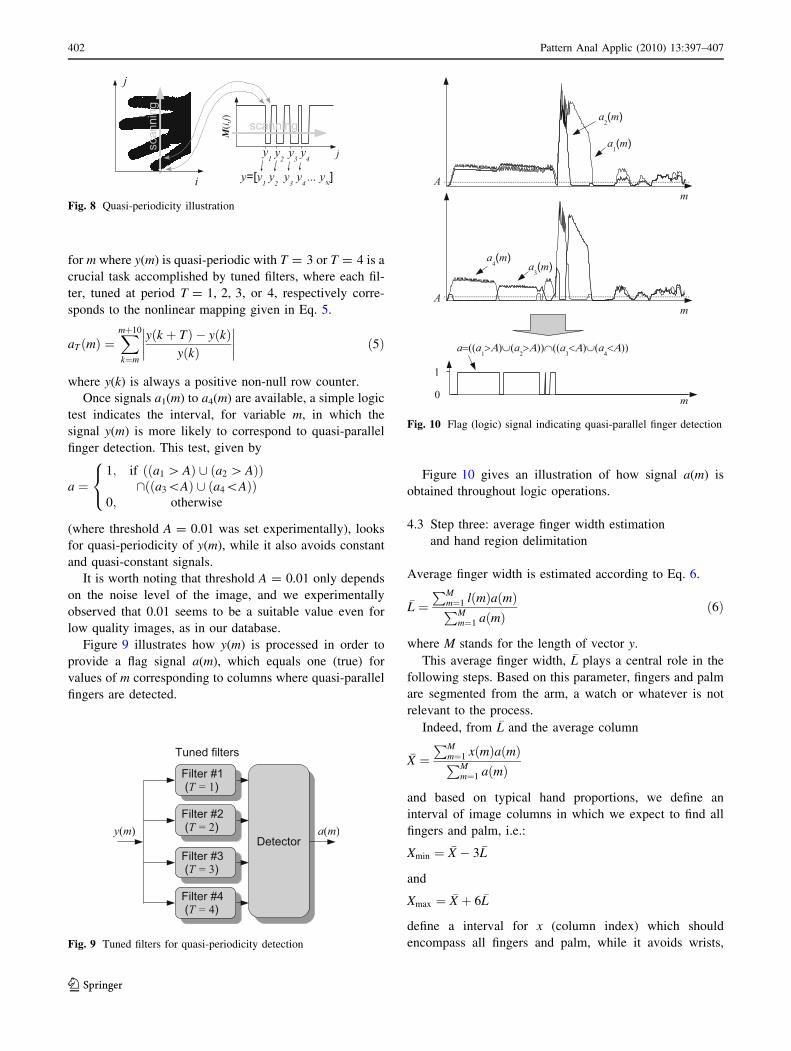
for m where y(m) is quasi-periodic with T = 3 or T = 4 is a
crucial task accomplished by tuned filters, where each fil-
ter, tuned at period T = 1, 2, 3, or 4, respectively corre-
sponds to the nonlinear mapping given in Eq. 5.
aTðmÞ ¼Xmþ10
k¼m
yðk þ TÞ � yðkÞyðkÞ
�������� ð5Þ
where y(k) is always a positive non-null row counter.
Once signals a1(m) to a4(m) are available, a simple logic
test indicates the interval, for variable m, in which the
signal y(m) is more likely to correspond to quasi-parallel
finger detection. This test, given by
a ¼1; if ðða1 [ AÞ [ ða2 [ AÞÞ
\ðða3\AÞ [ ða4\AÞÞ0; otherwise
8<:
(where threshold A = 0.01 was set experimentally), looks
for quasi-periodicity of y(m), while it also avoids constant
and quasi-constant signals.
It is worth noting that threshold A = 0.01 only depends
on the noise level of the image, and we experimentally
observed that 0.01 seems to be a suitable value even for
low quality images, as in our database.
Figure 9 illustrates how y(m) is processed in order to
provide a flag signal a(m), which equals one (true) for
values of m corresponding to columns where quasi-parallel
fingers are detected.
Figure 10 gives an illustration of how signal a(m) is
obtained throughout logic operations.
4.3 Step three: average finger width estimation
and hand region delimitation
Average finger width is estimated according to Eq. 6.
�L ¼PM
m¼1 lðmÞaðmÞPMm¼1 aðmÞ
ð6Þ
where M stands for the length of vector y.
This average finger width, �L plays a central role in the
following steps. Based on this parameter, fingers and palm
are segmented from the arm, a watch or whatever is not
relevant to the process.
Indeed, from �L and the average column
�X ¼PM
m¼1 xðmÞaðmÞPMm¼1 aðmÞ
and based on typical hand proportions, we define an
interval of image columns in which we expect to find all
fingers and palm, i.e.:
Xmin ¼ �X � 3 �L
and
Xmax ¼ �X þ 6 �L
define a interval for x (column index) which should
encompass all fingers and palm, while it avoids wrists,Fig. 9 Tuned filters for quasi-periodicity detection
Fig. 10 Flag (logic) signal indicating quasi-parallel finger detection
Fig. 8 Quasi-periodicity illustration
402 Pattern Anal Applic (2010) 13:397–407
123

according to average hand proportions we estimated from
our database. We highlight that these proportions roughly
remain constant for normal hand shapes.2
Similarly, an expected average palm width is defined as�Pa ¼ 4 �L. These two dependent average measures, �Pa and�L; are then used to filter x(m) between Xmin and Xmax,
according to their associated width attributes.
For the sake of clarity, we define feature vectors as:
fðmÞ ¼ ½xðmÞ yðmÞ lðmÞ cðmÞ�
Accordingly, a filter is applied so that only feature vectors,
f(m), inside the interval for m corresponding to columns
from Xmin to Xmax, whose width attributes, l(m), are in the
interval from 0:5 �L to 1:5 �Pa; are transmitted to the next
algorithm step.
4.4 Step four: palm segmentation
After hand segmentation and filtering based on average
finger width, selected feature vectors are expected to rep-
resent only fingers and palm. Consequently, widths should
be roughly characterized by a bimodal distribution: low
widths for fingers and high widths for palm. Thus, even a
simple clustering algorithm would be able to provide palm
segmentation.
Nevertheless, for robustness concerns, we apply here a
simple threshold based selection, i.e., feature vectors
whose width attributes are greater than 3 �L are segmented as
palm features. Note that this threshold is adaptive, for it
depends on �L;
4.5 Step five: finger segmentation
Initially, feature vectors whose width attributes lie between
0:5 �L and 1:5 �L are segmented as fingers.
The whole set of feature vectors thus segmented as
fingers is to be properly clustered and labeled as thumb,
index, middle, ring, or little finger. For this specific task,
we use a simple but robust sequential clustering algorithm,
which can be summarized as follows:
1. Initialize nine clusters with null feature vectors.
2. Through columns corresponding to segmented fingers,
from left to right, do:
2.1 Compute the absolute difference between attri-
bute y(m), (row) from each feature vector, and
the corresponding feature from the last input in
each cluster.
2.2 If the minimum absolute difference is less than�L=2; then accept this feature vector as a new
input to the corresponding cluster (closest one).
2.3 Otherwise, if there is still a cluster with only null
vectors, accept the new feature vector as the first
non-null input to it (i.e., start a new non-null
cluster). In case all clusters are already fulfilled
with non-null entries, then stop.
3. Sort all clusters according to their cardinality and take
the five biggest ones.
4. Sort these five biggest clusters according to the
average y attribute (centroid row, �y)
5. From the highest to the lowest �y; corresponding
clusters are associated, respectively, to thumb (1),
index (2), middle (3), ring (4), or little (5) finger.
Thus, from each hand picture, six sets of non-null fea-
ture vectors are extracted, namely: F0, from palm,
F1;F2;F3;F4 and F5 from thumb, index, middle, ring, and
little finger, respectively.
Finally, in agreement with the study presented in [2],
concerning the sub-segmentation of fingers into smaller
parts to improve distinctiveness between individuals, sets
Fk; k ¼ 1; . . .; 5; are split into subsets Fk;1;Fk;2; . . .;Fk;NP;
where NP stands for the number of finger slices (subsets) to
be considered.
4.6 Step six: hand proportions estimation
A final step for feature extraction is the estimation of fin-
ger/palm length and average width, which can be easily
obtained from subsets Fk;m; 0� k� 6; and 1�m�NP; for
k = 0. Indeed, average widths, wk,m, are thus estimated as
the mean of all width attributes in subset Fk,m, whereas
finger/palm length, hk,m, is simply the cardinality of the
corresponding cluster—i.e., the number of columns that
intercept each finger or palm—divided by the averaged c of
the cluster. This division compensates for cardinality
dependency upon finger/palm rotation.
We highlight that, alternatively, when pictures of hands
to be compared are taken with different resolutions (in
terms of pixel per inch, for instance), all estimated pro-
portions h and w, here expressed in number of pixels, can
be divided by �L in order to provide a dimensionless set of
measures.
Figure 11 provides an overall illustration of the six steps
for feature extraction.
4.7 Hand proportions comparison
Let hu, wu represent hand features from the uth picture in
the database, whereas hv, wv, represent those from the vth2 Indeed, similar standard hand proportions are frequently used by art
students, for instance.
Pattern Anal Applic (2010) 13:397–407 403
123

picture. A simple comparison between hand shapes is
provided by the summation of absolute differences
between corresponding features, i.e., the Manhattan dis-
tance between features [17].
5 Data acquisition
Two databases were used in experiments with the proposed
method:
(a) the BioChaves hand database,3
(b) and the GPDS [3] database, downloaded from the
Internet in December 2006.
In the BioChaves database, hand pictures were taken
with a conventional low cost webcam, attached to a support
over a black background. Figure 12 illustrates this setup,
where we can observe that 6 white paper strips, over the
black background, roughly orientate hand positioning. That
is to say that, in the BioChaves database, hands are not
freely positioned, though no pegs were used. Furthermore,
images were acquired in low resolution: 288 rows per 352
columns, and illumination provided just by the fluorescent
lamps already present in our laboratory.
As indicated in Fig. 13, we got 5 images per subject,
from 23 subjects. After each new picture, subjects were
asked to remove his/her hand from the setup and replace it
a few seconds later.
Additionally, 10 out of the 23 subjects were asked to
come back at least one month later, and provide five more
samples (images) from the same hand. This second set of
images will be referred to as the second session, in Sect. 6.
In the GPDS database, images were acquired with a
typical desk-scanner using 8 bits per pixel (256 gray lev-
els), with a resolution of 1403 rows per 1021 columns,
consisting of 10 different acquisitions per subject, from 50
subjects. The number of sessions in not given.
6 Experimental results
Three experimental results are presented here. One with the
GPDS database of scanned images of right hands, and two
Fig. 12 Image acquisition setup
Fig. 11 Whole method illustration
Fig. 13 Database illustration
3 Database available for download at http://www.ufs.br/biochaves.
404 Pattern Anal Applic (2010) 13:397–407
123
with the BioChaves database, with left hand images from a
conventional webcam.
As explained in Sect. 3, the very first algorithm we
implemented to test the new method is adapted to process
left hand pictures (as in Fig. 5), in which fingers are ori-
ented from right to left, whereas the thumb is in the higher
part of the image. However, in the GPDS database, only
scanned images from right hands are provided, with fingers
oriented upward and thumb on the right side. Fortunately, a
very simple adaptation was possible by a 90 degrees
counterclockwise rotation of such images.
Therefore, we highlight that images from BioChaves
(from a webcam) and GPDS (scanned) databases were
taken from opposite sides of hands. Moreover, hand posi-
tioning in the BioChaves database was partially con-
strained by white strips over the black background, as it is
shown in Fig. 12. In all experiments, parameter NP was set
to 9 (i.e., NP = 9. See Sect. 4.5 for further details).
For the first experiment, each image (out of 10 per
subject) was compared to all other images in the GPDS
database. Thus we tried to simulate a single picture
enrollment versus a single picture interrogation. Whenever
the score computed with images from the same subject is
above a given threshold, a false rejection is registered,
whereas a false acceptation is registered whenever scores
from different subjects are below the same threshold.
In Fig. 14, it is possible to observe both False Accep-
tation Rate (FAR) and False Rejection Rate (FRR)
dependence on the decision threshold, along with two
distance histograms: one from the same subject (left his-
togram), and another from different subjects (right histo-
gram). The threshold which provides Equal Error Ratio
(EER—the operational point where FAR equals FRR) is
also indicated.
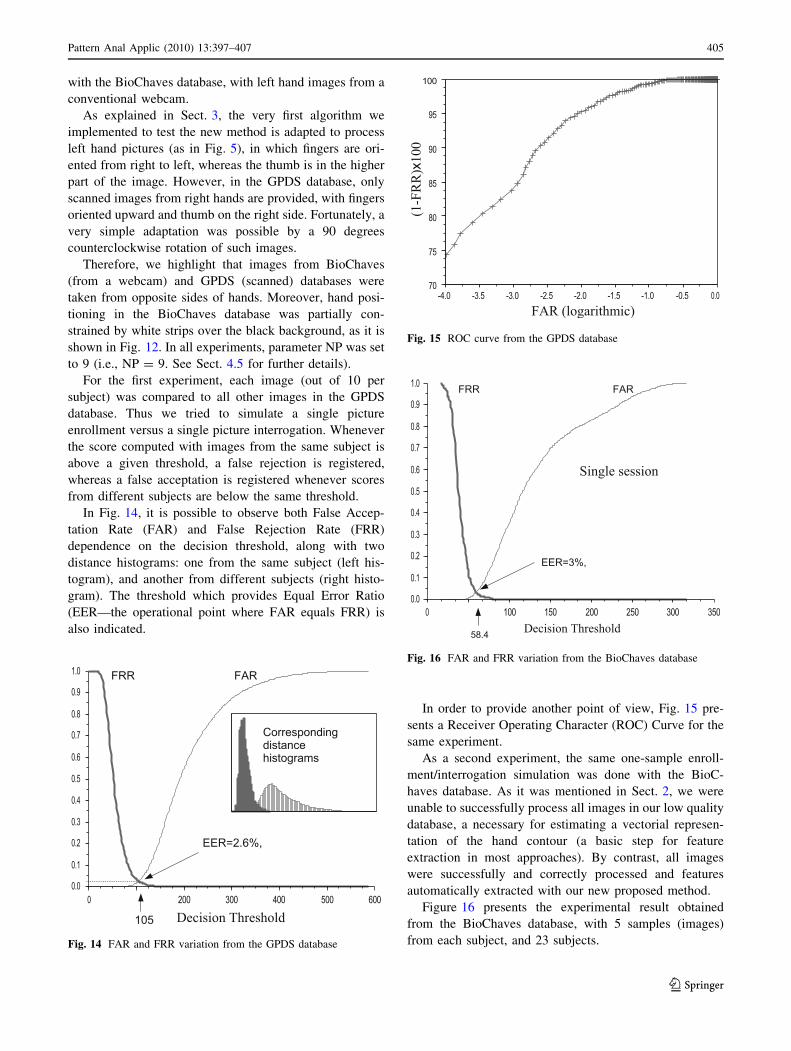
In order to provide another point of view, Fig. 15 pre-
sents a Receiver Operating Character (ROC) Curve for the
same experiment.
As a second experiment, the same one-sample enroll-
ment/interrogation simulation was done with the BioC-
haves database. As it was mentioned in Sect. 2, we were
unable to successfully process all images in our low quality
database, a necessary for estimating a vectorial represen-
tation of the hand contour (a basic step for feature
extraction in most approaches). By contrast, all images
were successfully and correctly processed and features
automatically extracted with our new proposed method.
Figure 16 presents the experimental result obtained
from the BioChaves database, with 5 samples (images)
from each subject, and 23 subjects.Fig. 14 FAR and FRR variation from the GPDS database
Fig. 15 ROC curve from the GPDS database
Fig. 16 FAR and FRR variation from the BioChaves database
Pattern Anal Applic (2010) 13:397–407 405
123

In this experiment, an EER & 3% was obtained, quite
close to the EER & 2.6% in spite of the difference
between data acquisition setups. Moreover, as expected,
the lower quality of the BioChaves images leads to a lower
performance, in terms of EER. We should observe, how-
ever, that EER corresponding thresholds depend on image
resolution, since distances between features are measured
in number of pixels.
Finally, in the GPDS database it is not mentioned
whether images were acquired during a single session (i.e.,
all images per subject acquired at once) or otherwise.
Therefore, in order to simulate a situation in which inter-
rogation (still with a single image) is done at least one
month after enrollment, we asked 10 subjects (out of 23) to
provide 5 more samples, at least one month after the first
session. Then, we again did the one-sample enrollment/
interrogation experiment. However, in this case, only
comparisons between samples from different sessions were
allowed. It roughly corresponds to a simulation of inter-
rogation done more than one month after enrollment.
Figure 17 shows the result in terms of FAR and FRR, along
with the corresponding EER.
In Fig. 18, we can compare performances with samples
from one or two acquisition sessions.
7 Discussion and conclusions
A new method for feature extraction from hand images was
proposed. It was mainly motivated by the lack of robust-
ness of most strategies based on contour tracking
algorithms.
Inspired by the well-known robustness of the Ensemble
Histogram Interval (EIH) processing against background
noise, mainly applied to feature extraction from speech
signals, we proposed a new method where hand images are
scanned column by column (for hands horizontally ori-
ented) and fingers are detected through an interval between
(gray) level crossing analysis, as in EIH based algorithms.
The strength of this kind of approach is partially due to
the repetition of simple tests. This multiplicity of tests
tends to reduce the influence of individual errors caused by
noise.
For the specific case of hand image processing, it is
particularly useful for quasi-parallel finger detection, even
when subjects are wearing rings, for the multiplicity of
periodicity tests (one to each column) improves the prob-
ability of finding fingers, from which average width (i.e.,
finger width) estimation plays a central role in the method.
A few experimental verification results are presented as
illustrations of the performance of this new method, and
found performances are comparable to those presented in
[2], which is a quite expected result, for the features we use
here are the same, i.e., fingers and palm width and height,
though the extraction methods are rather different.
We further highlight that, once hand contours, finger tips
and valleys between fingers are correctly detected, we do
not expect our method to outperform, for instance, results
presented in [2], in terms of EER. However, we claim that,
whenever there is a high fail rate of finger tips/valley
detection, our approach provides a reliable alternative
method with competitive performance.
Moreover, through experimental results from databases
prepared with very different setups, we observe a consis-
tent performance, roughly expressed by EER close to 3%,
with data from a single acquisition session. We further
highlight that all images, in both databases, were correctly
processed, with the very same algorithm. That is to say that
Fig. 17 FAR and FRR variation from the BioChaves database: two
sessions
Fig. 18 ROC curves from the BioChaves database
406 Pattern Anal Applic (2010) 13:397–407
123

no algorithm adaptation was necessary other than the 90-
degree counterclockwise rotation of images from the GPDS
database.
For the last experiment, in which two data acquisition
sessions were used, at least one month apart from each
other, a lower performance was obtained, as expected.
Indeed, some of the subjects that took part in this experi-
ment had their hand shape clearly changed from one ses-
sion to another. For instance, one of them was a pregnant
woman whose weight slightly changed during this period.
Certainly, we believe that this worse result is much more
realistic for practical applications of the method.
Now, we are just paving the route to analyzing the
influence of each finger on hand shape recognition, and to
improving the method performance through fusion strate-
gies. A more straightforward future work, also in prepa-
ration, is the adaptation of the method to any possible hand
orientation.
In spite of the smallness of our database (BioChaves),
we tried to compensate for this drawback by making it
available for download at http://www.ufs.br/biochaves, and
thus allow further comparisons between the results reported
here and performances from other strategies. Furthermore,
a simple routine, in Scilab code [18], for feature extraction
from grayscale bitmaps, according to the new method
proposed in this paper, is also available for download at the
same website.
Acknowledgments This work was granted by the Conselho Nac-ional de Desenvolvimento Cientıfico e Tecnologico (CNPq). We also
thank all students and fellows whose samples (hand images) were
used in this work. Finally, we thank the ‘‘Grupo de Procesado Digital
de la Senal’’ (GPDS), Universidad de Las Palmas de Gran Canaria,
whose publicly available database was used in this work.
References
1. Sanchez-Reillo R, Sanchez-Avila C, Gonzalez-Marcos A (2000)
Biometric identification through hand geometry measurements.
IEEE Trans Pattern Anal Mach Intell 22(10):1168–1171
2. Xiong W, Toh K-A, Yau W-Y, Jiang X (2005) Model-guided
deformable hand shape recognition without positioning aids.
Pattern Recognit 38:1651–1664
3. Gonzalez S, Travieso C, Alonso J, Ferrer M (2003) Automatic
biometric identification system by hand geometry. In: IEEE 37th
annual international carnahan conference on security technology,
pp 281–284
4. Duta N, Jain A, Mardia K (2001) Matching of palmprint. Pattern
Recognit Lett 23(4):477–485
5. Wu X, Zhang D, Wang K (2006) Fusion of phase and orientation
information for palmprint authentication. Pattern Anal Appl
(PAA) 9(2–3):103–111
6. Yoruk E, Konukoglu E, Sankur B, Darbon J (2006) Shape-based
hand recognition. IEEE Trans Image Processing
15(7):1803–1815
7. Travieso C, Alonso J, David S, Ferrer M (2004) Optimization of a
biometric system identification by hand geometry. In: Complex
systems intelligence and modern technological applications
(CSIMTA’04), pp 581–586
8. Kumar A, Wong D, Shen H, Jain A (2006) Personal authentica-
tion using hand images. Pattern Recognit Lett 27:1478–1486
9. Malassiotis S, Aifanti N, Strintzis MG (2006) Personal authen-
tication using 3-D finger geometry. IEEE Trans Inf Forensics
Secur 1(1):12–21
10. Zheng G, Wang C-J, Boult TE (2007) Application of projective
invariants in hand geometry biometrics. IEEE Trans Inf Forensics
Secur 2(4):758–768
11. Ghitza O (1987) Robustness against noise: the role of timing-
synchrony analysis. In: 1987 IEEE international conference on
acoustics, speech, and signal processing (ICASSP’87),
pp 2372–2375
12. Oden C, Ercil A, Buke B (2003) Combining implicit polynomials
and geometric features for hand recognition. Pattern Recognit
Lett 24:2145–2152
13. Boreki G, Zimmer A (2005) Hand geometry: a new approach for
feature extraction. In: Fourth IEEE workshop on automatic
identification advanced technologies (AUTOID2005),
pp 149–154
14. Wong A, Shi P (2002) Peg-free hand geometry recognition using
hierarchical geometry and shape matching. In: IAPR workshop
on machine vision applications (MVA02)
15. Amayeh G, Bebis G, Erol A, Nicolescu M (2006) Peg-free hand
shape verification using high order Zernike moments Amayeh. In:
Conference on computer vision and pattern recognition workshop
16. Sonka M, Hlavac V, Boyle R (1994) Image processing, analysis
and machine vision. Chapman & Hall, Boca Raton
17. Theodoridis S, Koutroumbas K (1999) Pattern recognition.
Academic Press, New York
18. SCILAB Group (2007) at http://www.scilab.org/
Pattern Anal Applic (2010) 13:397–407 407
123