National Tracking Poll 2112154 - Morning Consult
276
National Tracking Poll #2112154 December 18-20, 2021 Crosstabulation Results Methodology: is poll was conducted between December 18-December 20, 2021 among a sample of 1998 Reg- istered Voters. e interviews were conducted online and the data were weighted to approximate a target sample of Registered Voters based on gender by age, educational attainment, race, marital status, home ownership, race by educational attainment, 2020 presidential vote, and region. Results from the full survey have a margin of error of plus or minus 2 percentage points.
-
Upload
khangminh22 -
Category
Documents
-
view
1 -
download
0
Transcript of National Tracking Poll 2112154 - Morning Consult

National Tracking Poll #2112154December 18-20, 2021
Crosstabulation Results
Methodology:This poll was conducted between December 18-December 20, 2021 among a sample of 1998 Reg-istered Voters. The interviews were conducted online and the data were weighted to approximatea target sample of Registered Voters based on gender by age, educational attainment, race, maritalstatus, home ownership, race by educational attainment, 2020 presidential vote, and region. Resultsfrom the full survey have a margin of error of plus or minus 2 percentage points.

Table Index
1 Table P1: Now, generally speaking, would you say that things in the country are going in theright direction, or have they pretty seriously gotten off on the wrong track? . . . . . . . . . . 6
2 Table nr2b: Do you approve or disapprove of the job Joe Biden is doing as President? . . . . 10
3 Table nr2bNET: Do you approve or disapprove of the job Joe Biden is doing as President? . . 14
4 Table P3: Now, thinking about your vote, what would you say is the top set of issues on yourmind when you cast your vote for federal offices such as U.S. Senate or Congress? . . . . . . . 18
5 Table POL1: Thinking about the November 2022 midterm elections for U.S. Congress, howenthusiastic would you say you are about voting in the midterm elections? . . . . . . . . . . 23
6 Table POL2: If the election for U.S. Congress in your district was held today, which one of thefollowing candidates are you most likely to vote for? . . . . . . . . . . . . . . . . . . . . . . 27
7 Table POL3_1: Do you approve or disapprove of how President Biden is handling each of thefollowing? The economy . . . . . . . . . . . . . . . . . . . . . . . . . . . . . . . . . . . . . 31
8 Table POL3_2: Do you approve or disapprove of how President Biden is handling each of thefollowing? Jobs . . . . . . . . . . . . . . . . . . . . . . . . . . . . . . . . . . . . . . . . . 35
9 Table POL3_3: Do you approve or disapprove of how President Biden is handling each of thefollowing? Health care . . . . . . . . . . . . . . . . . . . . . . . . . . . . . . . . . . . . . 39
10 Table POL3_4: Do you approve or disapprove of how President Biden is handling each of thefollowing? Immigration . . . . . . . . . . . . . . . . . . . . . . . . . . . . . . . . . . . . . 43
11 Table POL3_5: Do you approve or disapprove of how President Biden is handling each of thefollowing? Climate change . . . . . . . . . . . . . . . . . . . . . . . . . . . . . . . . . . . 47
12 Table POL3_6: Do you approve or disapprove of how President Biden is handling each of thefollowing? The environment . . . . . . . . . . . . . . . . . . . . . . . . . . . . . . . . . . 51
13 Table POL3_7: Do you approve or disapprove of how President Biden is handling each of thefollowing? Energy . . . . . . . . . . . . . . . . . . . . . . . . . . . . . . . . . . . . . . . . 55
14 Table POL3_8: Do you approve or disapprove of how President Biden is handling each of thefollowing? Education . . . . . . . . . . . . . . . . . . . . . . . . . . . . . . . . . . . . . . 59
15 Table POL3_9: Do you approve or disapprove of how President Biden is handling each of thefollowing? National security . . . . . . . . . . . . . . . . . . . . . . . . . . . . . . . . . . 63
16 Table POL3_10: Do you approve or disapprove of how President Biden is handling each ofthe following? Gun policy . . . . . . . . . . . . . . . . . . . . . . . . . . . . . . . . . . . . 67
17 Table POL3_11: Do you approve or disapprove of how President Biden is handling each ofthe following? Protecting Medicare and Social Security . . . . . . . . . . . . . . . . . . . . 71
2

National Tracking Poll #2112154, December, 2021
18 Table POL3_12: Do you approve or disapprove of how President Biden is handling each ofthe following? Coronavirus . . . . . . . . . . . . . . . . . . . . . . . . . . . . . . . . . . . 75
19 Table POL3_13: Do you approve or disapprove of how President Biden is handling each ofthe following? Voting rights . . . . . . . . . . . . . . . . . . . . . . . . . . . . . . . . . . . 79
20 Table POL3_14: Do you approve or disapprove of how President Biden is handling each ofthe following? Foreign policy . . . . . . . . . . . . . . . . . . . . . . . . . . . . . . . . . . 83
21 Table POL4_1: How would you rate each of the following on their handling of the coron-avirus? President Joe Biden . . . . . . . . . . . . . . . . . . . . . . . . . . . . . . . . . . . 87
22 Table POL4_2: How would you rate each of the following on their handling of the coron-avirus? Congress . . . . . . . . . . . . . . . . . . . . . . . . . . . . . . . . . . . . . . . . 91
23 Table POL4_3: How would you rate each of the following on their handling of the coron-avirus? Congressional Democrats . . . . . . . . . . . . . . . . . . . . . . . . . . . . . . . 95
24 Table POL4_4: How would you rate each of the following on their handling of the coron-avirus? Congressional Republicans . . . . . . . . . . . . . . . . . . . . . . . . . . . . . . . 99
25 Table POL4_5: How would you rate each of the following on their handling of the coron-avirus? The World Health Organization (WHO) . . . . . . . . . . . . . . . . . . . . . . . . 103
26 Table POL4_6: How would you rate each of the following on their handling of the coron-avirus? The Centers for Disease Control and Prevention (CDC) . . . . . . . . . . . . . . . . 107
27 Table POL4_7: How would you rate each of the following on their handling of the coron-avirus? Your state’s governor . . . . . . . . . . . . . . . . . . . . . . . . . . . . . . . . . . 111
28 Table POL4_8: How would you rate each of the following on their handling of the coron-avirus? Dr. Anthony Fauci, Director of the National Institute of Allergy and Infectious Diseases 115
29 Table POL5: Generally speaking, would you say you are more concerned about... . . . . . . 119
30 Table POL6: Currently, do you believe it’s more important for the government to address the: 123
31 Table POL7: Even if neither is exactly correct, which of the following comes closest to youropinion? . . . . . . . . . . . . . . . . . . . . . . . . . . . . . . . . . . . . . . . . . . . . . 127
32 Table POL8a: Thinking about congressional Democrats’ agenda andwhat they have been ableto do since taking full control of the U.S. Congress in January 2021, which of the following isclosest to your opinion, even if none is exactly right? . . . . . . . . . . . . . . . . . . . . . . 131
33 Table POL8b: Thinking about President Biden’s agenda and what he has been able to do sincebeing sworn into office in January 2021, which of the following is closest to your opinion, evenif none is exactly right? . . . . . . . . . . . . . . . . . . . . . . . . . . . . . . . . . . . . . 135
34 Table POL9: As you may know, the U.S. House and Senate passed a $1 trillion bipartisan billto improve America’s infrastructure. Do you support or oppose this infrastructure bill? . . . . 139
3

Morning Consult
35 Table POL10: As you may know, the U.S. House of Representatives passed the Democrats’roughly $2 trillion climate and social spending package. Do you support or oppose this climateand social spending package? . . . . . . . . . . . . . . . . . . . . . . . . . . . . . . . . . . 143
36 Table POL11: And would you say Democrats in the Senate are moving too fast or too slowon passing this climate and social spending package, or are they moving at just the right pace? 147
37 Table POL12: As you may know, on July 15, 2021 the Treasury Department began makingpayments of up to $300 a month per child to most families with children, also known as ex-panded child tax credit payments.Do you support or oppose these expanded child tax creditpayments? . . . . . . . . . . . . . . . . . . . . . . . . . . . . . . . . . . . . . . . . . . . . 150
38 Table POL13: Have you received the expanded child tax credit payment? . . . . . . . . . . 154
39 Table POL14: Has the expanded child tax credit payment you received had a major or minorimpact on your financial security, or has it had no impact? . . . . . . . . . . . . . . . . . . 157
40 Table POL15_1NET: Who do you feel is responsible for the expanded child tax credit pay-ments being made possible? Please select all that apply. Democrats in Congress . . . . . . . . 160
41 Table POL15_2NET: Who do you feel is responsible for the expanded child tax credit pay-ments being made possible? Please select all that apply. Republicans in Congress . . . . . . . 164
42 Table POL15_3NET: Who do you feel is responsible for the expanded child tax credit pay-ments being made possible? Please select all that apply. President Joe Biden . . . . . . . . . . 168
43 Table POL15_4NET: Who do you feel is responsible for the expanded child tax credit pay-ments being made possible? Please select all that apply. Other (please specify) . . . . . . . . 172
44 Table POL15_5NET: Who do you feel is responsible for the expanded child tax credit pay-ments being made possible? Please select all that apply. Don’t know / No opinion . . . . . . . 176
45 Table POL16: As you may know, the expanded child tax credit payments are set to expirenext year. Do you think the payments should be made permanent? . . . . . . . . . . . . . . 180
46 Table POL17: Do you think the expanded child tax credit payments should be extended forat least one more year? . . . . . . . . . . . . . . . . . . . . . . . . . . . . . . . . . . . . . 184
47 Table POL18: When it comes to voting in U.S. elections, which of the following do you thinkis more important, even if neither is exactly right?It is more important to . . . . . . . . . . . 188
48 Table POL19: When it comes to student loan debt, which of the following is closest to youropinion, even if none is exactly right?The federal government should . . . . . . . . . . . . . 192
49 Table POL20_1: How much have you seen, read, or heard about the following? A specialcongressional committee revealing that some Fox News hosts were texting President Trump’sChief of Staff during the January 6th riot at the U.S. Capitol . . . . . . . . . . . . . . . . . . 196
50 Table POL20_2: How much have you seen, read, or heard about the following? Historictornadoes in the Midwest killing dozens . . . . . . . . . . . . . . . . . . . . . . . . . . . . 200
4

National Tracking Poll #2112154, December, 2021
51 Table POL20_3: Howmuch have you seen, read, or heard about the following? The COVID-19 death toll in the U.S. surpassing 800,000 . . . . . . . . . . . . . . . . . . . . . . . . . . 204
52 Table POL20_4: How much have you seen, read, or heard about the following? About 100NFL players testing positive for COVID-19 this week, the league’s most significant outbreaksince the pandemic began . . . . . . . . . . . . . . . . . . . . . . . . . . . . . . . . . . . . 208
53 Table POL20_5: How much have you seen, read, or heard about the following? Democratsin the U.S. Senate planning to delay consideration of the party’s climate and social spendingpackage until 2022 . . . . . . . . . . . . . . . . . . . . . . . . . . . . . . . . . . . . . . . 212
54 Table POL20_6: How much have you seen, read, or heard about the following? PresidentBiden signing into a law a bill that raises the U.S. debt limit by $2.5 trillion . . . . . . . . . . 216
55 Table POL20_7: How much have you seen, read, or heard about the following? The JusticeDepartment pulling out of negotiations for financially compensating migrant families whowere separated at the U.S.-Mexico border by the Trump administration . . . . . . . . . . . . 220
56 Table POL20_8: Howmuch have you seen, read, or heard about the following? The Food andDrug Administration announcing that it will permanently soften restrictions on a pill used toterminate early pregnancies, making it easier for Americans to obtain the pill by mail . . . . 224
57 Table POL20_9: How much have you seen, read, or heard about the following? The coron-avirus omicron variant causing an increase in COVID-19 cases in many countries . . . . . . 228
58 Table POLx_1: Next we will look at a list of names that are active in politics. It is a longlist, please take the time to go through the list carefully and give an individual answer foreach name below. For each person, please indicate if you have a Very Favorable, SomewhatFavorable, Somewhat Unfavorable, or Very Unfavorable opinion of each If you have heard ofthe person, but do not have an opinion, please mark ’Heard Of, No Opinion.’ If you have notheard of the person, please mark ’Never Heard Of.’Mitch McConnell . . . . . . . . . . . . . 232
59 Table POLx_2: Favorability for Nancy Pelosi . . . . . . . . . . . . . . . . . . . . . . . . . 236
60 Table POLx_3: Favorability for Charles Schumer . . . . . . . . . . . . . . . . . . . . . . . 240
61 Table POLx_4: Favorability for Mike Pence . . . . . . . . . . . . . . . . . . . . . . . . . . 244
62 Table POLx_5: Favorability for Donald Trump . . . . . . . . . . . . . . . . . . . . . . . . 248
63 Table POLx_6: Favorability for Republicans in Congress . . . . . . . . . . . . . . . . . . . 252
64 Table POLx_7: Favorability for Democrats in Congress . . . . . . . . . . . . . . . . . . . . 256
65 Table POLx_9: Favorability for Kevin McCarthy . . . . . . . . . . . . . . . . . . . . . . . 260
66 Table POLx_10: Favorability for Joe Biden . . . . . . . . . . . . . . . . . . . . . . . . . . 264
67 Table POLx_11: Favorability for Kamala Harris . . . . . . . . . . . . . . . . . . . . . . . 268
68 Summary Statistics of Survey Respondent Demographics . . . . . . . . . . . . . . . . . 272
5

6
Morning ConsultTable P1
Crosstabulation Results by Respondent Demographics
Table P1: Now, generally speaking, would you say that things in the country are going in the right direction, or have they pretty seriously gotten off onthe wrong track?
Demographic Right Direction Wrong Track Total N
Registered Voters 37% (743) 63% (1255) 1998Gender: Male 40% (379) 60% (563) 942Gender: Female 34% (364) 66% (692) 1056Age: 18-34 41% (212) 59% (302) 514Age: 35-44 44% (137) 56% (170) 307Age: 45-64 32% (217) 68% (463) 679Age: 65+ 36% (178) 64% (320) 497GenZers: 1997-2012 27% (49) 73% (132) 181Millennials: 1981-1996 49% (261) 51% (273) 534GenXers: 1965-1980 34% (155) 66% (305) 460Baby Boomers: 1946-1964 34% (256) 66% (499) 755PID: Dem (no lean) 69% (524) 31% (235) 759PID: Ind (no lean) 26% (140) 74% (391) 531PID: Rep (no lean) 11% (80) 89% (628) 708PID/Gender: DemMen 76% (251) 24% (77) 328PID/Gender: DemWomen 63% (273) 37% (158) 431PID/Gender: Ind Men 28% (70) 72% (184) 255PID/Gender: Ind Women 25% (70) 75% (206) 276PID/Gender: Rep Men 16% (58) 84% (301) 359PID/Gender: Rep Women 6% (22) 94% (327) 349Ideo: Liberal (1-3) 68% (390) 32% (186) 576Ideo: Moderate (4) 44% (210) 56% (270) 481Ideo: Conservative (5-7) 14% (111) 86% (666) 776Educ: < College 30% (360) 70% (847) 1206Educ: Bachelors degree 46% (231) 54% (270) 501Educ: Post-grad 52% (152) 48% (138) 290Income: Under 50k 35% (302) 65% (566) 868Income: 50k-100k 39% (281) 61% (443) 725Income: 100k+ 40% (160) 60% (245) 405
Continued on next page

National Tracking Poll #2112154, December, 2021
7
Table P1
Table P1: Now, generally speaking, would you say that things in the country are going in the right direction, or have they pretty seriously gotten off onthe wrong track?
Demographic Right Direction Wrong Track Total N
Registered Voters 37% (743) 63% (1255) 1998Ethnicity: White 36% (546) 64% (991) 1536Ethnicity: Hispanic 49% (108) 51% (114) 222Ethnicity: Black 50% (127) 50% (128) 255Ethnicity: Other 34% (71) 66% (136) 207All Christian 36% (362) 64% (641) 1003All Non-Christian 68% (103) 32% (48) 151Atheist 35% (26) 65% (49) 75Agnostic/Nothing in particular 41% (193) 59% (281) 474Something Else 20% (59) 80% (236) 295Religious Non-Protestant/Catholic 63% (105) 37% (62) 168Evangelical 26% (147) 74% (408) 555Non-Evangelical 37% (265) 63% (450) 715Community: Urban 54% (288) 46% (250) 538Community: Suburban 36% (340) 64% (599) 939Community: Rural 22% (115) 78% (406) 521Employ: Private Sector 43% (294) 57% (393) 687Employ: Government 29% (37) 71% (90) 127Employ: Self-Employed 44% (89) 56% (112) 200Employ: Homemaker 20% (26) 80% (100) 126Employ: Student 30% (18) 70% (43) 61Employ: Retired 36% (189) 64% (332) 520Employ: Unemployed 32% (48) 68% (102) 150Employ: Other 34% (43) 66% (84) 127Military HH: Yes 36% (126) 64% (222) 348Military HH: No 37% (618) 63% (1033) 1650RD/WT: Right Direction 100% (743) — (0) 743RD/WT: Wrong Track — (0) 100% (1255) 1255Biden Job Approve 79% (678) 21% (185) 863Biden Job Disapprove 5% (54) 95% (1003) 1057
Continued on next page

8
Morning ConsultTable P1
Table P1: Now, generally speaking, would you say that things in the country are going in the right direction, or have they pretty seriously gotten off onthe wrong track?
Demographic Right Direction Wrong Track Total N
Registered Voters 37% (743) 63% (1255) 1998Biden Job Strongly Approve 92% (392) 8% (32) 424Biden Job Somewhat Approve 65% (286) 35% (153) 438Biden Job Somewhat Disapprove 12% (33) 88% (250) 283Biden Job Strongly Disapprove 3% (21) 97% (753) 774Favorable of Biden 75% (668) 25% (228) 896Unfavorable of Biden 5% (46) 95% (974) 1020Very Favorable of Biden 90% (385) 10% (42) 427Somewhat Favorable of Biden 60% (283) 40% (186) 469Somewhat Unfavorable of Biden 12% (26) 88% (190) 216Very Unfavorable of Biden 2% (20) 98% (784) 804#1 Issue: Economy 29% (249) 71% (609) 858#1 Issue: Security 13% (36) 87% (238) 274#1 Issue: Health Care 60% (136) 40% (92) 227#1 Issue: Medicare / Social Security 48% (94) 52% (102) 196#1 Issue: Women’s Issues 55% (68) 45% (55) 124#1 Issue: Education 53% (43) 47% (37) 80#1 Issue: Energy 57% (69) 43% (52) 121#1 Issue: Other 41% (49) 59% (69) 1182020 Vote: Joe Biden 66% (623) 34% (323) 9462020 Vote: Donald Trump 9% (81) 91% (783) 8642020 Vote: Didn’t Vote 22% (33) 78% (120) 1532018 House Vote: Democrat 66% (473) 34% (242) 7152018 House Vote: Republican 13% (94) 87% (622) 7162018 House Vote: Someone else 26% (17) 74% (50) 672016 Vote: Hillary Clinton 68% (465) 32% (214) 6792016 Vote: Donald Trump 13% (96) 87% (657) 7542016 Vote: Other 36% (35) 64% (61) 962016 Vote: Didn’t Vote 31% (147) 69% (321) 468Voted in 2014: Yes 40% (539) 60% (822) 1360Voted in 2014: No 32% (205) 68% (433) 638
Continued on next page

National Tracking Poll #2112154, December, 2021
9
Table P1
Table P1: Now, generally speaking, would you say that things in the country are going in the right direction, or have they pretty seriously gotten off onthe wrong track?
Demographic Right Direction Wrong Track Total N
Registered Voters 37% (743) 63% (1255) 19984-Region: Northeast 49% (172) 51% (181) 3534-Region: Midwest 29% (129) 71% (315) 4444-Region: South 30% (227) 70% (518) 7464-Region: West 47% (215) 53% (240) 455Party: Democrat/Leans Democrat 67% (595) 33% (288) 883Party: Republican/Leans Republican 10% (88) 90% (753) 841Note: Row proportions may total to larger than one-hundred percent due to rounding. For more information visit MorningConsultIntelligence.com.

10
Morning ConsultTable nr2b
Table nr2b: Do you approve or disapprove of the job Joe Biden is doing as President?
DemographicStronglyApprove
SomewhatApprove
SomewhatDisapprove
StronglyDisapprove
Don’t Know /No Opinion Total N
Registered Voters 21% (424) 22% (438) 14% (283) 39% (774) 4% (78) 1998Gender: Male 24% (227) 20% (186) 13% (125) 40% (379) 3% (25) 942Gender: Female 19% (198) 24% (252) 15% (159) 37% (394) 5% (53) 1056Age: 18-34 22% (113) 22% (111) 21% (108) 26% (134) 10% (49) 514Age: 35-44 23% (70) 27% (84) 13% (41) 30% (92) 7% (20) 307Age: 45-64 18% (123) 21% (145) 13% (86) 47% (318) 1% (8) 679Age: 65+ 24% (119) 20% (99) 10% (49) 46% (229) — (1) 497GenZers: 1997-2012 10% (18) 20% (36) 23% (42) 29% (53) 17% (31) 181Millennials: 1981-1996 28% (151) 23% (124) 17% (89) 25% (133) 7% (36) 534GenXers: 1965-1980 16% (75) 25% (113) 14% (65) 43% (200) 2% (8) 460Baby Boomers: 1946-1964 22% (167) 20% (151) 10% (77) 47% (356) — (3) 755PID: Dem (no lean) 47% (353) 36% (273) 9% (70) 5% (41) 3% (21) 759PID: Ind (no lean) 8% (41) 25% (133) 20% (105) 39% (205) 9% (47) 531PID: Rep (no lean) 4% (30) 5% (32) 15% (108) 74% (527) 1% (10) 708PID/Gender: DemMen 55% (179) 30% (99) 8% (27) 6% (20) 1% (3) 328PID/Gender: DemWomen 40% (174) 40% (174) 10% (43) 5% (22) 4% (19) 431PID/Gender: Ind Men 9% (22) 25% (65) 19% (49) 39% (100) 7% (19) 255PID/Gender: Ind Women 7% (19) 25% (68) 20% (56) 38% (105) 10% (28) 276PID/Gender: Rep Men 7% (26) 6% (22) 13% (48) 72% (260) 1% (3) 359PID/Gender: Rep Women 1% (4) 3% (10) 17% (60) 77% (268) 2% (7) 349Ideo: Liberal (1-3) 45% (261) 36% (205) 11% (61) 7% (40) 1% (8) 576Ideo: Moderate (4) 19% (93) 33% (157) 17% (82) 27% (128) 4% (20) 481Ideo: Conservative (5-7) 8% (60) 7% (52) 14% (105) 71% (549) 1% (9) 776Educ: < College 17% (200) 19% (225) 16% (194) 43% (518) 6% (69) 1206Educ: Bachelors degree 27% (135) 27% (133) 12% (59) 33% (168) 1% (7) 501Educ: Post-grad 31% (90) 28% (80) 10% (30) 30% (88) 1% (2) 290Income: Under 50k 19% (161) 22% (192) 15% (133) 37% (322) 7% (61) 868Income: 50k-100k 24% (174) 20% (145) 15% (106) 39% (286) 2% (14) 725Income: 100k+ 22% (89) 25% (102) 11% (45) 41% (166) 1% (4) 405Ethnicity: White 22% (331) 20% (303) 13% (205) 44% (673) 2% (25) 1536Ethnicity: Hispanic 30% (67) 22% (49) 12% (27) 25% (55) 11% (24) 222Ethnicity: Black 24% (61) 34% (86) 18% (45) 14% (37) 10% (27) 255
Continued on next page

National Tracking Poll #2112154, December, 2021
11
Table nr2b
Table nr2b: Do you approve or disapprove of the job Joe Biden is doing as President?
DemographicStronglyApprove
SomewhatApprove
SomewhatDisapprove
StronglyDisapprove
Don’t Know /No Opinion Total N
Registered Voters 21% (424) 22% (438) 14% (283) 39% (774) 4% (78) 1998Ethnicity: Other 15% (32) 24% (50) 16% (34) 31% (64) 13% (26) 207All Christian 22% (219) 20% (202) 15% (152) 42% (421) 1% (9) 1003All Non-Christian 48% (72) 22% (33) 11% (16) 17% (26) 2% (3) 151Atheist 25% (19) 27% (20) 13% (10) 34% (25) 2% (1) 75Agnostic/Nothing in particular 19% (89) 28% (130) 15% (69) 30% (144) 9% (41) 474Something Else 9% (25) 18% (53) 12% (37) 53% (157) 8% (23) 295Religious Non-Protestant/Catholic 44% (73) 21% (35) 10% (17) 23% (39) 2% (3) 168Evangelical 16% (90) 14% (77) 15% (81) 53% (293) 3% (14) 555Non-Evangelical 21% (149) 24% (174) 14% (103) 38% (270) 2% (18) 715Community: Urban 37% (201) 22% (119) 10% (56) 26% (142) 4% (20) 538Community: Suburban 17% (159) 27% (250) 15% (139) 38% (353) 4% (39) 939Community: Rural 12% (65) 13% (69) 17% (89) 54% (279) 4% (19) 521Employ: Private Sector 22% (149) 27% (186) 15% (100) 35% (241) 2% (11) 687Employ: Government 19% (24) 22% (28) 19% (25) 34% (43) 6% (8) 127Employ: Self-Employed 30% (60) 19% (39) 12% (24) 30% (61) 8% (17) 200Employ: Homemaker 13% (17) 14% (18) 13% (17) 54% (68) 5% (6) 126Employ: Student 20% (12) 17% (10) 34% (21) 25% (15) 4% (2) 61Employ: Retired 23% (122) 21% (107) 9% (48) 47% (243) — (1) 520Employ: Unemployed 18% (27) 19% (28) 19% (28) 31% (46) 14% (20) 150Employ: Other 11% (13) 18% (23) 17% (21) 44% (56) 10% (13) 127Military HH: Yes 24% (84) 16% (55) 13% (44) 44% (153) 3% (12) 348Military HH: No 21% (341) 23% (383) 14% (239) 38% (621) 4% (67) 1650RD/WT: Right Direction 53% (392) 38% (286) 4% (33) 3% (21) 2% (12) 743RD/WT: Wrong Track 3% (32) 12% (153) 20% (250) 60% (753) 5% (66) 1255Biden Job Approve 49% (424) 51% (438) — (0) — (0) — (0) 863Biden Job Disapprove — (0) — (0) 27% (283) 73% (774) — (0) 1057Biden Job Strongly Approve 100% (424) — (0) — (0) — (0) — (0) 424Biden Job Somewhat Approve — (0) 100% (438) — (0) — (0) — (0) 438Biden Job Somewhat Disapprove — (0) — (0) 100% (283) — (0) — (0) 283Biden Job Strongly Disapprove — (0) — (0) — (0) 100% (774) — (0) 774
Continued on next page

12
Morning ConsultTable nr2b
Table nr2b: Do you approve or disapprove of the job Joe Biden is doing as President?
DemographicStronglyApprove
SomewhatApprove
SomewhatDisapprove
StronglyDisapprove
Don’t Know /No Opinion Total N
Registered Voters 21% (424) 22% (438) 14% (283) 39% (774) 4% (78) 1998Favorable of Biden 45% (399) 47% (421) 5% (42) 1% (9) 3% (26) 896Unfavorable of Biden 1% (7) 1% (14) 23% (232) 74% (754) 1% (13) 1020Very Favorable of Biden 84% (357) 13% (58) 1% (5) 1% (5) 1% (2) 427Somewhat Favorable of Biden 9% (41) 78% (363) 8% (37) 1% (3) 5% (23) 469Somewhat Unfavorable of Biden 1% (3) 7% (14) 81% (176) 9% (19) 2% (5) 216Very Unfavorable of Biden 1% (4) — (0) 7% (56) 91% (735) 1% (8) 804#1 Issue: Economy 15% (127) 19% (159) 18% (156) 45% (385) 4% (30) 858#1 Issue: Security 8% (21) 8% (21) 8% (22) 76% (208) 1% (2) 274#1 Issue: Health Care 39% (88) 30% (67) 16% (35) 12% (27) 4% (9) 227#1 Issue: Medicare / Social Security 30% (58) 30% (58) 7% (14) 31% (61) 2% (4) 196#1 Issue: Women’s Issues 28% (34) 38% (47) 11% (13) 14% (17) 10% (12) 124#1 Issue: Education 28% (22) 32% (25) 17% (13) 14% (12) 9% (7) 80#1 Issue: Energy 34% (42) 30% (36) 15% (18) 15% (19) 6% (7) 121#1 Issue: Other 27% (31) 20% (24) 10% (11) 39% (46) 5% (6) 1182020 Vote: Joe Biden 40% (381) 40% (379) 12% (110) 5% (45) 3% (32) 9462020 Vote: Donald Trump 3% (30) 3% (25) 16% (134) 77% (668) 1% (7) 8642020 Vote: Didn’t Vote 9% (14) 18% (27) 17% (26) 32% (50) 24% (37) 1532018 House Vote: Democrat 42% (301) 40% (288) 9% (64) 6% (43) 3% (18) 7152018 House Vote: Republican 6% (43) 5% (38) 14% (101) 74% (528) 1% (5) 7162018 House Vote: Someone else 8% (5) 20% (14) 18% (12) 41% (27) 13% (8) 672016 Vote: Hillary Clinton 44% (296) 42% (282) 8% (56) 5% (31) 2% (13) 6792016 Vote: Donald Trump 6% (46) 5% (36) 14% (107) 74% (555) 1% (10) 7542016 Vote: Other 14% (13) 30% (28) 21% (20) 29% (28) 7% (6) 962016 Vote: Didn’t Vote 15% (69) 19% (91) 21% (100) 34% (158) 10% (49) 468Voted in 2014: Yes 24% (325) 22% (302) 12% (158) 41% (558) 1% (17) 1360Voted in 2014: No 16% (99) 21% (136) 20% (126) 34% (216) 10% (61) 6384-Region: Northeast 29% (102) 27% (95) 14% (48) 28% (100) 2% (9) 3534-Region: Midwest 17% (75) 21% (92) 17% (78) 43% (191) 2% (9) 4444-Region: South 17% (127) 17% (130) 14% (101) 47% (353) 5% (34) 7464-Region: West 27% (121) 27% (121) 13% (57) 28% (129) 6% (27) 455
Continued on next page

National Tracking Poll #2112154, December, 2021
13
Table nr2b
Table nr2b: Do you approve or disapprove of the job Joe Biden is doing as President?
DemographicStronglyApprove
SomewhatApprove
SomewhatDisapprove
StronglyDisapprove
Don’t Know /No Opinion Total N
Registered Voters 21% (424) 22% (438) 14% (283) 39% (774) 4% (78) 1998Party: Democrat/Leans Democrat 43% (381) 39% (342) 10% (86) 6% (50) 3% (24) 883Party: Republican/Leans Republican 4% (32) 5% (44) 16% (134) 74% (621) 1% (11) 841Note: Row proportions may total to larger than one-hundred percent due to rounding. For more information visit MorningConsultIntelligence.com.

14
Morning ConsultTable nr2bNET
Table nr2bNET: Do you approve or disapprove of the job Joe Biden is doing as President?
Demographic Total Approve Total DisapproveDon’t Know / No
Opinion Total N
Registered Voters 43% (863) 53% (1057) 4% (78) 1998Gender: Male 44% (413) 54% (504) 3% (25) 942Gender: Female 43% (450) 52% (553) 5% (53) 1056Age: 18-34 43% (223) 47% (242) 10% (49) 514Age: 35-44 50% (154) 43% (133) 7% (20) 307Age: 45-64 39% (267) 59% (404) 1% (8) 679Age: 65+ 44% (218) 56% (279) — (1) 497GenZers: 1997-2012 30% (55) 52% (95) 17% (31) 181Millennials: 1981-1996 52% (275) 42% (222) 7% (36) 534GenXers: 1965-1980 41% (187) 58% (265) 2% (8) 460Baby Boomers: 1946-1964 42% (319) 57% (434) — (3) 755PID: Dem (no lean) 82% (626) 15% (112) 3% (21) 759PID: Ind (no lean) 33% (174) 58% (310) 9% (47) 531PID: Rep (no lean) 9% (62) 90% (636) 1% (10) 708PID/Gender: DemMen 85% (278) 14% (47) 1% (3) 328PID/Gender: DemWomen 81% (348) 15% (65) 4% (19) 431PID/Gender: Ind Men 34% (87) 59% (149) 7% (19) 255PID/Gender: Ind Women 32% (88) 58% (161) 10% (28) 276PID/Gender: Rep Men 13% (48) 86% (308) 1% (3) 359PID/Gender: Rep Women 4% (15) 94% (328) 2% (7) 349Ideo: Liberal (1-3) 81% (467) 18% (102) 1% (8) 576Ideo: Moderate (4) 52% (250) 44% (210) 4% (20) 481Ideo: Conservative (5-7) 14% (112) 84% (654) 1% (9) 776Educ: < College 35% (425) 59% (712) 6% (69) 1206Educ: Bachelors degree 53% (268) 45% (227) 1% (7) 501Educ: Post-grad 59% (170) 41% (118) 1% (2) 290Income: Under 50k 41% (353) 52% (455) 7% (61) 868Income: 50k-100k 44% (319) 54% (392) 2% (14) 725Income: 100k+ 47% (191) 52% (211) 1% (4) 405Ethnicity: White 41% (634) 57% (877) 2% (25) 1536Ethnicity: Hispanic 52% (116) 37% (82) 11% (24) 222Ethnicity: Black 58% (147) 32% (81) 10% (27) 255
Continued on next page

National Tracking Poll #2112154, December, 2021
15
Table nr2bNET
Table nr2bNET: Do you approve or disapprove of the job Joe Biden is doing as President?
Demographic Total Approve Total DisapproveDon’t Know / No
Opinion Total N
Registered Voters 43% (863) 53% (1057) 4% (78) 1998Ethnicity: Other 40% (82) 47% (98) 13% (26) 207All Christian 42% (421) 57% (573) 1% (9) 1003All Non-Christian 70% (105) 28% (42) 2% (3) 151Atheist 52% (39) 46% (35) 2% (1) 75Agnostic/Nothing in particular 46% (219) 45% (214) 9% (41) 474Something Else 27% (78) 66% (194) 8% (23) 295Religious Non-Protestant/Catholic 64% (108) 34% (56) 2% (3) 168Evangelical 30% (167) 67% (373) 3% (14) 555Non-Evangelical 45% (324) 52% (373) 2% (18) 715Community: Urban 60% (320) 37% (197) 4% (20) 538Community: Suburban 44% (409) 52% (491) 4% (39) 939Community: Rural 26% (134) 71% (368) 4% (19) 521Employ: Private Sector 49% (334) 50% (341) 2% (11) 687Employ: Government 41% (52) 53% (67) 6% (8) 127Employ: Self-Employed 50% (99) 42% (85) 8% (17) 200Employ: Homemaker 28% (35) 68% (85) 5% (6) 126Employ: Student 37% (23) 59% (36) 4% (2) 61Employ: Retired 44% (229) 56% (291) — (1) 520Employ: Unemployed 37% (55) 50% (74) 14% (20) 150Employ: Other 29% (36) 61% (78) 10% (13) 127Military HH: Yes 40% (139) 57% (197) 3% (12) 348Military HH: No 44% (724) 52% (860) 4% (67) 1650RD/WT: Right Direction 91% (678) 7% (54) 2% (12) 743RD/WT: Wrong Track 15% (185) 80% (1003) 5% (66) 1255Biden Job Approve 100% (863) — (0) — (0) 863Biden Job Disapprove — (0) 100% (1057) — (0) 1057Biden Job Strongly Approve 100% (424) — (0) — (0) 424Biden Job Somewhat Approve 100% (438) — (0) — (0) 438Biden Job Somewhat Disapprove — (0) 100% (283) — (0) 283Biden Job Strongly Disapprove — (0) 100% (774) — (0) 774
Continued on next page

16
Morning ConsultTable nr2bNET
Table nr2bNET: Do you approve or disapprove of the job Joe Biden is doing as President?
Demographic Total Approve Total DisapproveDon’t Know / No
Opinion Total N
Registered Voters 43% (863) 53% (1057) 4% (78) 1998Favorable of Biden 91% (820) 6% (51) 3% (26) 896Unfavorable of Biden 2% (21) 97% (986) 1% (13) 1020Very Favorable of Biden 97% (415) 2% (10) 1% (2) 427Somewhat Favorable of Biden 86% (405) 9% (41) 5% (23) 469Somewhat Unfavorable of Biden 8% (17) 90% (194) 2% (5) 216Very Unfavorable of Biden 1% (4) 98% (792) 1% (8) 804#1 Issue: Economy 33% (287) 63% (541) 4% (30) 858#1 Issue: Security 15% (42) 84% (230) 1% (2) 274#1 Issue: Health Care 68% (155) 28% (63) 4% (9) 227#1 Issue: Medicare / Social Security 60% (117) 38% (75) 2% (4) 196#1 Issue: Women’s Issues 66% (81) 25% (30) 10% (12) 124#1 Issue: Education 60% (48) 31% (25) 9% (7) 80#1 Issue: Energy 64% (78) 30% (36) 6% (7) 121#1 Issue: Other 47% (55) 48% (57) 5% (6) 1182020 Vote: Joe Biden 80% (759) 16% (155) 3% (32) 9462020 Vote: Donald Trump 6% (55) 93% (802) 1% (7) 8642020 Vote: Didn’t Vote 27% (41) 49% (76) 24% (37) 1532018 House Vote: Democrat 82% (590) 15% (107) 3% (18) 7152018 House Vote: Republican 11% (82) 88% (629) 1% (5) 7162018 House Vote: Someone else 29% (19) 59% (39) 13% (8) 672016 Vote: Hillary Clinton 85% (579) 13% (87) 2% (13) 6792016 Vote: Donald Trump 11% (81) 88% (663) 1% (10) 7542016 Vote: Other 44% (42) 50% (48) 7% (6) 962016 Vote: Didn’t Vote 34% (160) 55% (259) 10% (49) 468Voted in 2014: Yes 46% (627) 53% (716) 1% (17) 1360Voted in 2014: No 37% (236) 54% (341) 10% (61) 6384-Region: Northeast 56% (196) 42% (148) 2% (9) 3534-Region: Midwest 37% (167) 61% (269) 2% (9) 4444-Region: South 35% (257) 61% (454) 5% (34) 7464-Region: West 53% (242) 41% (186) 6% (27) 455
Continued on next page

National Tracking Poll #2112154, December, 2021
17
Table nr2bNET
Table nr2bNET: Do you approve or disapprove of the job Joe Biden is doing as President?
Demographic Total Approve Total DisapproveDon’t Know / No
Opinion Total N
Registered Voters 43% (863) 53% (1057) 4% (78) 1998Party: Democrat/Leans Democrat 82% (722) 15% (136) 3% (24) 883Party: Republican/Leans Republican 9% (76) 90% (755) 1% (11) 841Note: Row proportions may total to larger than one-hundred percent due to rounding. For more information visit MorningConsultIntelligence.com.

18
Morning ConsultTable P3
Table P3: Now, thinking about your vote, what would you say is the top set of issues on your mind when you cast your vote for federal offices such asU.S. Senate or Congress?
Demographic
EconomicIssues –like taxes,wages,jobs,
unemploy-ment, andspending
SecurityIssues –like
terrorism,foreign
policy, andbordersecurity
HealthCare Issues– like the2010 healthcare law,Medicaid,other
challenges
SeniorsIssues –like
Medicareand SocialSecurity
Women’sIssues –like birthcontrol,abortion,and equal
pay
EducationIssues – like
schoolstandards,class sizes,
school choice,and student
loans
Energy Issues– like carbonemissions,cost ofelectric-
ity/gasoline,or renewables Other: Total N
Registered Voters 43%(858) 14%(274) 11%(227) 10%(196) 6%(124) 4% (80) 6% (121) 6% (118) 1998Gender: Male 47%(441) 14%(128) 12%(108) 10% (92) 3% (26) 4% (37) 6% (60) 5% (51) 942Gender: Female 40%(417) 14%(147) 11% (119) 10%(104) 9% (98) 4% (43) 6% (61) 6% (67) 1056Age: 18-34 46%(236) 6% (33) 13% (69) 1% (6) 14% (71) 8% (40) 7% (36) 5% (24) 514Age: 35-44 49%(150) 8% (24) 14% (41) 2% (5) 7% (22) 7% (22) 10% (30) 4% (13) 307Age: 45-64 47%(323) 15%(104) 13% (87) 9% (62) 3% (17) 2% (14) 5% (32) 6% (40) 679Age: 65+ 30%(150) 23% (113) 6% (30) 25%(124) 3% (14) 1% (4) 5% (23) 8% (41) 497GenZers: 1997-2012 40% (72) 10% (17) 11% (19) 2% (3) 16% (28) 11% (20) 6% (12) 5% (9) 181Millennials: 1981-1996 49%(262) 6% (30) 15% (78) 1% (7) 11% (57) 7% (37) 8% (44) 4% (19) 534GenXers: 1965-1980 49%(227) 14% (65) 14% (63) 5% (22) 4% (18) 3% (13) 6% (28) 5% (23) 460Baby Boomers: 1946-1964 37%(277) 19% (141) 9% (65) 19%(145) 2% (17) 1% (10) 5% (37) 8% (62) 755PID: Dem (no lean) 34%(255) 5% (41) 17%(128) 13% (101) 10% (74) 6% (47) 8% (62) 7% (50) 759PID: Ind (no lean) 48%(257) 10% (55) 10% (56) 8% (43) 5% (28) 4% (23) 6% (33) 7% (36) 531PID: Rep (no lean) 49%(346) 25%(178) 6% (43) 7% (53) 3% (21) 1% (10) 4% (26) 4% (31) 708PID/Gender: DemMen 38%(123) 5% (15) 20% (65) 13% (42) 4% (14) 7% (21) 9% (29) 6% (19) 328PID/Gender: DemWomen 31%(132) 6% (27) 15% (63) 14% (59) 14% (60) 6% (25) 8% (33) 7% (31) 431PID/Gender: Ind Men 52%(134) 9% (23) 10% (24) 9% (23) 2% (5) 4% (11) 7% (17) 7% (17) 255PID/Gender: Ind Women 45%(124) 12% (32) 11% (31) 7% (20) 8% (23) 4% (12) 6% (15) 7% (19) 276PID/Gender: Rep Men 51%(184) 25% (90) 5% (19) 7% (27) 2% (7) 1% (5) 4% (13) 4% (15) 359PID/Gender: Rep Women 46%(162) 25% (88) 7% (24) 7% (26) 4% (14) 2% (6) 4% (13) 5% (17) 349Ideo: Liberal (1-3) 32%(182) 4% (21) 18%(105) 10% (58) 13% (73) 5% (29) 12% (66) 7% (41) 576Ideo: Moderate (4) 41%(199) 12% (56) 11% (53) 14% (65) 4% (20) 6% (27) 7% (33) 6% (28) 481Ideo: Conservative (5-7) 51%(393) 24%(187) 7% (54) 8% (63) 2% (16) 2% (15) 2% (13) 5% (35) 776
Continued on next page

National Tracking Poll #2112154, December, 2021
19
Table P3
Table P3: Now, thinking about your vote, what would you say is the top set of issues on your mind when you cast your vote for federal offices such asU.S. Senate or Congress?
Demographic
EconomicIssues –like taxes,wages,jobs,
unemploy-ment, andspending
SecurityIssues –like
terrorism,foreign
policy, andbordersecurity
HealthCare Issues– like the2010 healthcare law,Medicaid,other
challenges
SeniorsIssues –like
Medicareand SocialSecurity
Women’sIssues –like birthcontrol,abortion,and equal
pay
EducationIssues – like
schoolstandards,class sizes,
school choice,and student
loans
Energy Issues– like carbonemissions,cost ofelectric-
ity/gasoline,or renewables Other: Total N
Registered Voters 43%(858) 14%(274) 11%(227) 10%(196) 6%(124) 4% (80) 6% (121) 6% (118) 1998Educ: < College 43%(515) 17%(202) 10%(123) 10% (118) 6% (67) 4% (47) 6% (71) 5% (63) 1206Educ: Bachelors degree 44%(221) 9% (46) 14% (70) 10% (49) 8% (39) 3% (17) 6% (32) 6% (28) 501Educ: Post-grad 42%(122) 9% (26) 12% (34) 10% (29) 6% (18) 6% (16) 6% (18) 9% (27) 290Income: Under 50k 39%(337) 14% (118) 13% (110) 12% (101) 7% (62) 4% (35) 6% (54) 6% (52) 868Income: 50k-100k 43%(313) 14%(100) 11% (82) 10% (74) 6% (45) 4% (26) 6% (42) 6% (43) 725Income: 100k+ 51%(208) 14% (57) 9% (36) 5% (21) 4% (17) 5% (20) 6% (24) 6% (23) 405Ethnicity: White 41%(630) 17%(254) 11% (171) 11%(165) 5% (81) 3% (45) 6% (94) 6% (96) 1536Ethnicity: Hispanic 38% (86) 7% (15) 20% (45) 8% (18) 7% (16) 6% (14) 9% (20) 3% (7) 222Ethnicity: Black 49%(125) 2% (6) 11% (29) 7% (18) 12% (31) 9% (22) 4% (11) 5% (14) 255Ethnicity: Other 50%(103) 7% (15) 13% (27) 6% (13) 6% (12) 6% (13) 8% (16) 4% (8) 207All Christian 44%(440) 17% (171) 10%(105) 12% (121) 3% (34) 4% (36) 4% (44) 5% (52) 1003All Non-Christian 39% (59) 8% (11) 21% (32) 10% (15) 8% (12) 7% (10) 5% (7) 3% (4) 151Atheist 44% (33) 3% (2) 11% (9) 5% (4) 15% (11) 5% (3) 7% (5) 10% (8) 75Agnostic/Nothing in particular 41%(192) 9% (42) 12% (55) 8% (39) 10% (50) 4% (19) 9% (42) 7% (34) 474Something Else 45%(134) 16% (47) 9% (27) 6% (17) 5% (16) 4% (11) 8% (23) 7% (19) 295Religious Non-Protestant/Catholic 39% (66) 10% (17) 19% (32) 9% (15) 8% (13) 7% (13) 4% (7) 3% (5) 168Evangelical 45%(247) 19%(107) 11% (63) 10% (55) 3% (17) 4% (20) 3% (17) 5% (29) 555Non-Evangelical 44%(313) 15%(106) 9% (67) 12% (83) 4% (31) 3% (25) 7% (48) 6% (41) 715Community: Urban 45%(241) 9% (46) 16% (86) 7% (38) 8% (43) 5% (25) 6% (32) 5% (28) 538Community: Suburban 42%(396) 14%(132) 10% (98) 11%(102) 7% (63) 4% (33) 6% (59) 6% (56) 939Community: Rural 42%(221) 19% (96) 8% (43) 11% (56) 3% (18) 4% (23) 6% (30) 6% (34) 521
Continued on next page

20
Morning ConsultTable P3
Table P3: Now, thinking about your vote, what would you say is the top set of issues on your mind when you cast your vote for federal offices such asU.S. Senate or Congress?
Demographic
EconomicIssues –like taxes,wages,jobs,
unemploy-ment, andspending
SecurityIssues –like
terrorism,foreign
policy, andbordersecurity
HealthCare Issues– like the2010 healthcare law,Medicaid,other
challenges
SeniorsIssues –like
Medicareand SocialSecurity
Women’sIssues –like birthcontrol,abortion,and equal
pay
EducationIssues – like
schoolstandards,class sizes,
school choice,and student
loans
Energy Issues– like carbonemissions,cost ofelectric-
ity/gasoline,or renewables Other: Total N
Registered Voters 43%(858) 14%(274) 11%(227) 10%(196) 6%(124) 4% (80) 6% (121) 6% (118) 1998Employ: Private Sector 49%(339) 10% (71) 12% (81) 5% (37) 7% (49) 5% (31) 6% (40) 6% (38) 687Employ: Government 56% (71) 9% (12) 13% (17) 1% (1) 4% (5) 6% (7) 8% (10) 4% (5) 127Employ: Self-Employed 44% (87) 11% (23) 14% (28) 5% (10) 9% (17) 2% (5) 11% (22) 4% (8) 200Employ: Homemaker 34% (43) 17% (21) 14% (18) 8% (10) 5% (7) 7% (8) 7% (8) 9% (11) 126Employ: Student 37% (22) 8% (5) 15% (9) — (0) 16% (10) 17% (10) 6% (4) 2% (1) 61Employ: Retired 30%(156) 22% (116) 8% (43) 23%(122) 3% (14) 1% (4) 5% (27) 8% (40) 520Employ: Unemployed 55% (82) 6% (9) 10% (14) 5% (8) 12% (17) 6% (10) 3% (5) 3% (5) 150Employ: Other 45% (58) 15% (19) 14% (18) 7% (8) 4% (5) 4% (5) 4% (5) 8% (10) 127Military HH: Yes 43%(149) 19% (65) 9% (30) 12% (42) 3% (10) 3% (12) 6% (20) 6% (20) 348Military HH: No 43%(710) 13%(209) 12%(197) 9%(154) 7% (114) 4% (68) 6% (101) 6% (98) 1650RD/WT: Right Direction 33%(249) 5% (36) 18%(136) 13% (94) 9% (68) 6% (43) 9% (69) 7% (49) 743RD/WT: Wrong Track 49%(609) 19%(238) 7% (92) 8%(102) 4% (55) 3% (37) 4% (52) 6% (69) 1255Biden Job Approve 33%(287) 5% (42) 18%(155) 14% (117) 9% (81) 6% (48) 9% (78) 6% (55) 863Biden Job Disapprove 51%(541) 22%(230) 6% (63) 7% (75) 3% (30) 2% (25) 3% (36) 5% (57) 1057Biden Job Strongly Approve 30%(127) 5% (21) 21% (88) 14% (58) 8% (34) 5% (22) 10% (42) 7% (31) 424Biden Job Somewhat Approve 36%(159) 5% (21) 15% (67) 13% (58) 11% (47) 6% (25) 8% (36) 5% (24) 438Biden Job Somewhat Disapprove 55%(156) 8% (22) 12% (35) 5% (14) 5% (13) 5% (13) 6% (18) 4% (11) 283Biden Job Strongly Disapprove 50%(385) 27%(208) 4% (27) 8% (61) 2% (17) 1% (12) 2% (19) 6% (46) 774Favorable of Biden 35%(310) 4% (40) 18%(157) 13% (119) 9% (79) 5% (49) 9% (81) 7% (61) 896Unfavorable of Biden 51%(517) 22%(227) 6% (62) 7% (75) 3% (33) 2% (23) 3% (33) 5% (50) 1020Very Favorable of Biden 31%(132) 5% (20) 22% (94) 15% (62) 7% (30) 4% (16) 9% (38) 8% (36) 427Somewhat Favorable of Biden 38%(178) 4% (20) 14% (63) 12% (57) 11% (49) 7% (33) 9% (43) 5% (25) 469Somewhat Unfavorable of Biden 52% (113) 9% (20) 10% (22) 6% (12) 8% (17) 5% (11) 6% (14) 4% (8) 216Very Unfavorable of Biden 50%(404) 26%(207) 5% (40) 8% (62) 2% (16) 2% (13) 2% (20) 5% (42) 804
Continued on next page

National Tracking Poll #2112154, December, 2021
21
Table P3
Table P3: Now, thinking about your vote, what would you say is the top set of issues on your mind when you cast your vote for federal offices such asU.S. Senate or Congress?
Demographic
EconomicIssues –like taxes,wages,jobs,
unemploy-ment, andspending
SecurityIssues –like
terrorism,foreign
policy, andbordersecurity
HealthCare Issues– like the2010 healthcare law,Medicaid,other
challenges
SeniorsIssues –like
Medicareand SocialSecurity
Women’sIssues –like birthcontrol,abortion,and equal
pay
EducationIssues – like
schoolstandards,class sizes,
school choice,and student
loans
Energy Issues– like carbonemissions,cost ofelectric-
ity/gasoline,or renewables Other: Total N
Registered Voters 43%(858) 14%(274) 11%(227) 10%(196) 6%(124) 4% (80) 6% (121) 6% (118) 1998#1 Issue: Economy 100%(858) — (0) — (0) — (0) — (0) — (0) — (0) — (0) 858#1 Issue: Security — (0) 100%(274) — (0) — (0) — (0) — (0) — (0) — (0) 274#1 Issue: Health Care — (0) — (0) 100%(227) — (0) — (0) — (0) — (0) — (0) 227#1 Issue: Medicare / Social Security — (0) — (0) — (0) 100%(196) — (0) — (0) — (0) — (0) 196#1 Issue: Women’s Issues — (0) — (0) — (0) — (0) 100%(124) — (0) — (0) — (0) 124#1 Issue: Education — (0) — (0) — (0) — (0) — (0) 100% (80) — (0) — (0) 80#1 Issue: Energy — (0) — (0) — (0) — (0) — (0) — (0) 100% (121) — (0) 121#1 Issue: Other — (0) — (0) — (0) — (0) — (0) — (0) — (0) 100% (118) 1182020 Vote: Joe Biden 35%(330) 5% (44) 17%(163) 12% (117) 9% (88) 6% (54) 9% (81) 7% (68) 9462020 Vote: Donald Trump 51%(440) 24% (211) 5% (42) 8% (69) 2% (16) 2% (16) 3% (28) 5% (41) 8642020 Vote: Didn’t Vote 49% (75) 10% (15) 10% (15) 5% (8) 12% (18) 5% (8) 6% (9) 3% (5) 1532018 House Vote: Democrat 32%(230) 5% (33) 17%(123) 15%(105) 9% (63) 5% (36) 9% (63) 8% (60) 7152018 House Vote: Republican 52%(371) 24%(175) 5% (37) 8% (56) 1% (9) 2% (12) 3% (23) 5% (34) 7162018 House Vote: Someone else 50% (33) 4% (3) 8% (5) 10% (7) 11% (8) 4% (3) 6% (4) 7% (5) 672016 Vote: Hillary Clinton 33%(225) 5% (31) 16%(109) 16% (110) 9% (62) 5% (33) 8% (54) 8% (55) 6792016 Vote: Donald Trump 51%(385) 25%(187) 6% (42) 7% (50) 1% (8) 2% (12) 3% (25) 6% (44) 7542016 Vote: Other 46% (44) 5% (5) 17% (17) 8% (8) 4% (3) 4% (4) 9% (8) 7% (7) 962016 Vote: Didn’t Vote 44%(204) 11% (50) 13% (60) 6% (28) 11% (50) 7% (31) 7% (33) 3% (12) 468Voted in 2014: Yes 43%(590) 15%(203) 10%(143) 11%(152) 4% (61) 3% (39) 6% (80) 7% (93) 1360Voted in 2014: No 42%(268) 11% (71) 13% (85) 7% (44) 10% (62) 6% (41) 7% (41) 4% (25) 6384-Region: Northeast 35%(123) 16% (55) 12% (41) 12% (42) 7% (25) 4% (13) 8% (29) 7% (24) 3534-Region: Midwest 46%(203) 15% (65) 11% (49) 10% (45) 7% (30) 2% (8) 5% (23) 5% (22) 4444-Region: South 47%(349) 15% (110) 8% (60) 9% (70) 5% (36) 6% (42) 4% (33) 6% (46) 7464-Region: West 40%(183) 10% (44) 17% (77) 9% (39) 7% (33) 4% (17) 8% (36) 6% (26) 455
Continued on next page

22
Morning ConsultTable P3
Table P3: Now, thinking about your vote, what would you say is the top set of issues on your mind when you cast your vote for federal offices such asU.S. Senate or Congress?
Demographic
EconomicIssues –like taxes,wages,jobs,
unemploy-ment, andspending
SecurityIssues –like
terrorism,foreign
policy, andbordersecurity
HealthCare Issues– like the2010 healthcare law,Medicaid,other
challenges
SeniorsIssues –like
Medicareand SocialSecurity
Women’sIssues –like birthcontrol,abortion,and equal
pay
EducationIssues – like
schoolstandards,class sizes,
school choice,and student
loans
Energy Issues– like carbonemissions,cost ofelectric-
ity/gasoline,or renewables Other: Total N
Registered Voters 43%(858) 14%(274) 11%(227) 10%(196) 6%(124) 4% (80) 6% (121) 6% (118) 1998Party: Democrat/Leans Democrat 34%(299) 5% (45) 17%(146) 13% (118) 9% (83) 6% (53) 9% (79) 7% (59) 883Party: Republican/Leans Republican 50%(424) 24%(203) 6% (54) 8% (64) 2% (21) 1% (11) 3% (27) 4% (37) 841Note: Row proportions may total to larger than one-hundred percent due to rounding. For more information visit MorningConsultIntelligence.com.

National Tracking Poll #2112154, December, 2021
23
Table POL1
Table POL1: Thinking about the November 2022 midterm elections for U.S. Congress, how enthusiastic would you say you are about voting in themidterm elections?
DemographicExtremelyenthusiastic
Veryenthusiastic
Somewhatenthusiastic
Not tooenthusiastic
Not at allenthusiastic Total N
Registered Voters 29% (573) 18% (358) 27% (538) 18% (367) 8% (162) 1998Gender: Male 38% (359) 20% (188) 22% (206) 11% (107) 9% (82) 942Gender: Female 20% (214) 16% (170) 31% (332) 25% (260) 8% (80) 1056Age: 18-34 20% (105) 13% (68) 33% (169) 21% (106) 13% (66) 514Age: 35-44 25% (77) 17% (53) 26% (80) 20% (62) 12% (35) 307Age: 45-64 32% (219) 17% (116) 24% (161) 20% (134) 7% (50) 679Age: 65+ 35% (173) 25% (122) 26% (128) 13% (65) 2% (10) 497GenZers: 1997-2012 9% (17) 9% (16) 44% (80) 24% (43) 14% (24) 181Millennials: 1981-1996 28% (147) 16% (88) 25% (133) 18% (99) 13% (67) 534GenXers: 1965-1980 25% (113) 16% (75) 29% (133) 21% (97) 9% (42) 460Baby Boomers: 1946-1964 36% (275) 21% (161) 23% (172) 16% (118) 4% (28) 755PID: Dem (no lean) 30% (231) 20% (148) 28% (209) 17% (130) 5% (41) 759PID: Ind (no lean) 17% (90) 14% (73) 27% (141) 28% (151) 14% (75) 531PID: Rep (no lean) 36% (252) 19% (137) 26% (187) 12% (86) 6% (45) 708PID/Gender: DemMen 41% (134) 23% (75) 22% (71) 7% (23) 8% (25) 328PID/Gender: DemWomen 23% (97) 17% (74) 32% (138) 25% (107) 4% (15) 431PID/Gender: Ind Men 23% (59) 15% (37) 28% (72) 21% (53) 13% (33) 255PID/Gender: Ind Women 11% (31) 13% (36) 25% (69) 36% (98) 15% (42) 276PID/Gender: Rep Men 46% (166) 21% (76) 17% (62) 9% (31) 6% (23) 359PID/Gender: Rep Women 25% (86) 17% (61) 36% (125) 16% (55) 6% (22) 349Ideo: Liberal (1-3) 31% (176) 23% (135) 27% (155) 14% (81) 5% (30) 576Ideo: Moderate (4) 19% (93) 15% (74) 28% (137) 29% (140) 8% (37) 481Ideo: Conservative (5-7) 38% (293) 19% (145) 25% (192) 14% (110) 5% (37) 776Educ: < College 24% (295) 16% (190) 29% (344) 21% (255) 10% (123) 1206Educ: Bachelors degree 35% (178) 21% (107) 24% (121) 13% (66) 6% (30) 501Educ: Post-grad 35% (101) 21% (62) 25% (73) 16% (46) 3% (9) 290Income: Under 50k 22% (189) 15% (130) 30% (259) 22% (190) 12% (100) 868Income: 50k-100k 33% (236) 21% (149) 24% (172) 17% (126) 6% (42) 725Income: 100k+ 37% (148) 20% (79) 26% (107) 13% (51) 5% (20) 405Ethnicity: White 31% (478) 20% (300) 26% (396) 17% (255) 7% (107) 1536Ethnicity: Hispanic 26% (58) 21% (46) 29% (65) 15% (34) 9% (20) 222
Continued on next page

24
Morning ConsultTable POL1
Table POL1: Thinking about the November 2022 midterm elections for U.S. Congress, how enthusiastic would you say you are about voting in themidterm elections?
DemographicExtremelyenthusiastic
Veryenthusiastic
Somewhatenthusiastic
Not tooenthusiastic
Not at allenthusiastic Total N
Registered Voters 29% (573) 18% (358) 27% (538) 18% (367) 8% (162) 1998Ethnicity: Black 20% (50) 14% (35) 28% (71) 24% (61) 15% (38) 255Ethnicity: Other 22% (45) 11% (24) 34% (71) 24% (51) 8% (17) 207All Christian 32% (317) 21% (212) 25% (255) 16% (158) 6% (61) 1003All Non-Christian 46% (69) 19% (29) 21% (31) 7% (11) 6% (10) 151Atheist 35% (26) 12% (9) 31% (23) 13% (9) 10% (7) 75Agnostic/Nothing in particular 19% (90) 13% (63) 31% (148) 24% (114) 13% (59) 474Something Else 24% (71) 15% (45) 27% (80) 25% (75) 8% (24) 295Religious Non-Protestant/Catholic 46% (77) 19% (32) 20% (34) 8% (13) 7% (11) 168Evangelical 33% (184) 20% (109) 25% (138) 16% (89) 6% (35) 555Non-Evangelical 27% (193) 20% (142) 27% (193) 20% (140) 7% (48) 715Community: Urban 33% (179) 22% (118) 22% (120) 13% (70) 9% (49) 538Community: Suburban 27% (253) 17% (161) 29% (268) 20% (187) 7% (69) 939Community: Rural 27% (141) 15% (79) 29% (149) 21% (109) 8% (43) 521Employ: Private Sector 29% (202) 19% (133) 27% (188) 17% (118) 7% (46) 687Employ: Government 22% (28) 21% (26) 36% (46) 14% (18) 7% (9) 127Employ: Self-Employed 33% (66) 16% (33) 30% (61) 15% (31) 5% (11) 200Employ: Homemaker 24% (30) 16% (20) 23% (29) 28% (35) 9% (12) 126Employ: Student 9% (6) 11% (7) 43% (26) 20% (12) 17% (11) 61Employ: Retired 36% (188) 21% (107) 24% (124) 16% (82) 4% (20) 520Employ: Unemployed 15% (22) 12% (19) 25% (38) 29% (43) 19% (28) 150Employ: Other 25% (32) 12% (15) 21% (26) 22% (28) 20% (26) 127Military HH: Yes 38% (133) 16% (55) 25% (88) 16% (57) 4% (16) 348Military HH: No 27% (441) 18% (303) 27% (450) 19% (310) 9% (146) 1650RD/WT: Right Direction 33% (242) 22% (163) 29% (213) 12% (92) 4% (33) 743RD/WT: Wrong Track 26% (332) 16% (195) 26% (324) 22% (275) 10% (129) 1255Biden Job Approve 31% (263) 21% (181) 29% (249) 15% (132) 4% (37) 863Biden Job Disapprove 29% (304) 17% (175) 25% (266) 20% (211) 9% (100) 1057
Continued on next page

National Tracking Poll #2112154, December, 2021
25
Table POL1
Table POL1: Thinking about the November 2022 midterm elections for U.S. Congress, how enthusiastic would you say you are about voting in themidterm elections?
DemographicExtremelyenthusiastic
Veryenthusiastic
Somewhatenthusiastic
Not tooenthusiastic
Not at allenthusiastic Total N
Registered Voters 29% (573) 18% (358) 27% (538) 18% (367) 8% (162) 1998Biden Job Strongly Approve 48% (202) 22% (95) 19% (82) 8% (32) 3% (14) 424Biden Job Somewhat Approve 14% (61) 20% (86) 38% (167) 23% (100) 5% (24) 438Biden Job Somewhat Disapprove 8% (23) 15% (43) 33% (95) 31% (87) 12% (35) 283Biden Job Strongly Disapprove 36% (282) 17% (132) 22% (171) 16% (124) 8% (65) 774Favorable of Biden 28% (255) 20% (182) 29% (264) 16% (145) 6% (50) 896Unfavorable of Biden 30% (301) 17% (169) 25% (257) 20% (204) 9% (89) 1020Very Favorable of Biden 46% (197) 22% (93) 21% (91) 8% (32) 3% (14) 427Somewhat Favorable of Biden 12% (58) 19% (89) 37% (173) 24% (112) 8% (36) 469Somewhat Unfavorable of Biden 8% (16) 16% (34) 31% (68) 31% (68) 14% (30) 216Very Unfavorable of Biden 35% (285) 17% (134) 24% (190) 17% (136) 7% (59) 804#1 Issue: Economy 26% (223) 16% (139) 28% (240) 21% (184) 8% (72) 858#1 Issue: Security 41% (114) 18% (49) 21% (58) 13% (35) 7% (18) 274#1 Issue: Health Care 28% (64) 19% (44) 23% (53) 19% (43) 10% (23) 227#1 Issue: Medicare / Social Security 29% (58) 23% (45) 30% (59) 14% (27) 4% (8) 196#1 Issue: Women’s Issues 22% (27) 15% (18) 32% (39) 22% (27) 10% (13) 124#1 Issue: Education 17% (14) 15% (12) 42% (34) 17% (14) 8% (7) 80#1 Issue: Energy 23% (28) 24% (29) 33% (40) 14% (17) 5% (7) 121#1 Issue: Other 39% (46) 19% (23) 13% (15) 18% (21) 12% (14) 1182020 Vote: Joe Biden 27% (254) 20% (186) 29% (270) 19% (179) 6% (58) 9462020 Vote: Donald Trump 35% (299) 18% (154) 26% (222) 16% (138) 6% (51) 8642020 Vote: Didn’t Vote 12% (18) 10% (15) 22% (34) 27% (41) 29% (44) 1532018 House Vote: Democrat 30% (218) 22% (160) 26% (186) 16% (112) 5% (39) 7152018 House Vote: Republican 37% (267) 19% (135) 26% (183) 13% (95) 5% (36) 7162018 House Vote: Someone else 12% (8) 13% (9) 30% (20) 24% (16) 21% (14) 672016 Vote: Hillary Clinton 31% (211) 22% (148) 26% (177) 16% (108) 5% (35) 6792016 Vote: Donald Trump 37% (281) 18% (134) 24% (182) 15% (113) 6% (43) 7542016 Vote: Other 16% (15) 20% (19) 30% (29) 23% (22) 12% (11) 962016 Vote: Didn’t Vote 14% (65) 12% (57) 32% (150) 27% (124) 15% (72) 468Voted in 2014: Yes 35% (474) 21% (279) 25% (338) 14% (191) 6% (79) 1360Voted in 2014: No 16% (99) 12% (79) 31% (200) 28% (176) 13% (83) 638
Continued on next page

26
Morning ConsultTable POL1
Table POL1: Thinking about the November 2022 midterm elections for U.S. Congress, how enthusiastic would you say you are about voting in themidterm elections?
DemographicExtremelyenthusiastic
Veryenthusiastic
Somewhatenthusiastic
Not tooenthusiastic
Not at allenthusiastic Total N
Registered Voters 29% (573) 18% (358) 27% (538) 18% (367) 8% (162) 19984-Region: Northeast 35% (123) 18% (64) 23% (82) 16% (56) 8% (28) 3534-Region: Midwest 28% (126) 16% (72) 29% (127) 19% (85) 8% (35) 4444-Region: South 27% (198) 18% (136) 26% (191) 21% (158) 8% (62) 7464-Region: West 28% (126) 19% (87) 30% (137) 15% (68) 8% (37) 455Party: Democrat/Leans Democrat 28% (251) 20% (176) 28% (245) 18% (158) 6% (53) 883Party: Republican/Leans Republican 35% (292) 18% (155) 26% (222) 14% (120) 6% (53) 841Note: Row proportions may total to larger than one-hundred percent due to rounding. For more information visit MorningConsultIntelligence.com.

National Tracking Poll #2112154, December, 2021
27
Table POL2
Table POL2: If the election for U.S. Congress in your district was held today, which one of the following candidates are you most likely to vote for?
Demographic Democratic candidate Republican candidateDon’t know / No
opinion Total N
Registered Voters 41% (822) 41% (827) 17% (349) 1998Gender: Male 40% (376) 44% (419) 16% (147) 942Gender: Female 42% (446) 39% (408) 19% (202) 1056Age: 18-34 47% (240) 31% (160) 22% (114) 514Age: 35-44 45% (139) 34% (104) 21% (64) 307Age: 45-64 37% (250) 48% (328) 15% (102) 679Age: 65+ 39% (193) 47% (235) 14% (69) 497GenZers: 1997-2012 46% (83) 27% (50) 26% (48) 181Millennials: 1981-1996 48% (257) 31% (168) 20% (108) 534GenXers: 1965-1980 36% (164) 48% (219) 17% (77) 460Baby Boomers: 1946-1964 39% (294) 46% (351) 15% (110) 755PID: Dem (no lean) 89% (672) 4% (28) 8% (59) 759PID: Ind (no lean) 25% (133) 31% (164) 44% (234) 531PID: Rep (no lean) 2% (17) 90% (635) 8% (56) 708PID/Gender: DemMen 90% (296) 5% (15) 5% (17) 328PID/Gender: DemWomen 87% (376) 3% (13) 10% (43) 431PID/Gender: Ind Men 26% (67) 34% (87) 39% (100) 255PID/Gender: Ind Women 24% (66) 28% (77) 48% (133) 276PID/Gender: Rep Men 3% (12) 88% (316) 8% (30) 359PID/Gender: Rep Women 1% (5) 91% (319) 7% (26) 349Ideo: Liberal (1-3) 84% (482) 9% (49) 8% (45) 576Ideo: Moderate (4) 48% (231) 24% (117) 28% (133) 481Ideo: Conservative (5-7) 10% (80) 80% (619) 10% (76) 776Educ: < College 35% (425) 44% (528) 21% (254) 1206Educ: Bachelors degree 49% (247) 37% (188) 13% (66) 501Educ: Post-grad 52% (150) 38% (111) 10% (29) 290Income: Under 50k 40% (343) 39% (340) 21% (185) 868Income: 50k-100k 43% (311) 41% (296) 16% (118) 725Income: 100k+ 41% (168) 47% (191) 11% (47) 405Ethnicity: White 37% (569) 47% (723) 16% (243) 1536Ethnicity: Hispanic 49% (108) 27% (61) 24% (53) 222Ethnicity: Black 68% (174) 13% (32) 19% (49) 255
Continued on next page

28
Morning ConsultTable POL2
Table POL2: If the election for U.S. Congress in your district was held today, which one of the following candidates are you most likely to vote for?
Demographic Democratic candidate Republican candidateDon’t know / No
opinion Total N
Registered Voters 41% (822) 41% (827) 17% (349) 1998Ethnicity: Other 38% (79) 34% (71) 28% (57) 207All Christian 36% (360) 51% (510) 13% (133) 1003All Non-Christian 65% (98) 25% (38) 10% (15) 151Atheist 58% (44) 32% (24) 10% (7) 75Agnostic/Nothing in particular 50% (236) 23% (109) 27% (130) 474Something Else 29% (85) 49% (146) 22% (64) 295Religious Non-Protestant/Catholic 60% (100) 30% (50) 10% (17) 168Evangelical 28% (154) 61% (341) 11% (59) 555Non-Evangelical 40% (284) 42% (299) 19% (133) 715Community: Urban 57% (304) 29% (155) 15% (79) 538Community: Suburban 41% (387) 39% (366) 20% (187) 939Community: Rural 25% (132) 59% (306) 16% (83) 521Employ: Private Sector 45% (311) 39% (269) 15% (106) 687Employ: Government 40% (50) 45% (57) 15% (20) 127Employ: Self-Employed 47% (94) 36% (73) 17% (34) 200Employ: Homemaker 27% (34) 56% (70) 17% (21) 126Employ: Student 45% (27) 35% (21) 21% (13) 61Employ: Retired 38% (200) 47% (243) 15% (77) 520Employ: Unemployed 41% (62) 30% (45) 28% (43) 150Employ: Other 34% (44) 38% (48) 28% (36) 127Military HH: Yes 36% (124) 48% (166) 17% (58) 348Military HH: No 42% (698) 40% (661) 18% (291) 1650RD/WT: Right Direction 79% (586) 12% (86) 10% (71) 743RD/WT: Wrong Track 19% (236) 59% (741) 22% (278) 1255Biden Job Approve 83% (712) 7% (64) 10% (87) 863Biden Job Disapprove 9% (99) 72% (756) 19% (202) 1057Biden Job Strongly Approve 88% (372) 9% (39) 3% (14) 424Biden Job Somewhat Approve 78% (340) 6% (25) 17% (73) 438Biden Job Somewhat Disapprove 23% (67) 45% (127) 32% (89) 283Biden Job Strongly Disapprove 4% (32) 81% (629) 15% (113) 774
Continued on next page

National Tracking Poll #2112154, December, 2021
29
Table POL2
Table POL2: If the election for U.S. Congress in your district was held today, which one of the following candidates are you most likely to vote for?
Demographic Democratic candidate Republican candidateDon’t know / No
opinion Total N
Registered Voters 41% (822) 41% (827) 17% (349) 1998Favorable of Biden 81% (722) 8% (67) 12% (107) 896Unfavorable of Biden 8% (77) 72% (738) 20% (205) 1020Very Favorable of Biden 91% (389) 5% (23) 4% (15) 427Somewhat Favorable of Biden 71% (333) 9% (44) 20% (92) 469Somewhat Unfavorable of Biden 23% (49) 39% (85) 38% (82) 216Very Unfavorable of Biden 3% (28) 81% (653) 15% (123) 804#1 Issue: Economy 31% (269) 50% (430) 19% (159) 858#1 Issue: Security 11% (31) 74% (204) 14% (39) 274#1 Issue: Health Care 65% (149) 18% (40) 17% (38) 227#1 Issue: Medicare / Social Security 54% (106) 30% (60) 16% (31) 196#1 Issue: Women’s Issues 67% (82) 14% (18) 19% (23) 124#1 Issue: Education 62% (49) 16% (13) 22% (17) 80#1 Issue: Energy 62% (75) 20% (24) 18% (22) 121#1 Issue: Other 51% (60) 32% (38) 17% (20) 1182020 Vote: Joe Biden 79% (748) 5% (46) 16% (152) 9462020 Vote: Donald Trump 3% (25) 85% (731) 13% (108) 8642020 Vote: Didn’t Vote 26% (40) 25% (39) 48% (74) 1532018 House Vote: Democrat 86% (613) 4% (31) 10% (71) 7152018 House Vote: Republican 3% (22) 87% (626) 10% (68) 7162018 House Vote: Someone else 12% (8) 21% (14) 67% (45) 672016 Vote: Hillary Clinton 85% (576) 5% (37) 10% (66) 6792016 Vote: Donald Trump 5% (40) 83% (623) 12% (90) 7542016 Vote: Other 33% (32) 21% (20) 46% (44) 962016 Vote: Didn’t Vote 37% (174) 31% (145) 32% (149) 468Voted in 2014: Yes 42% (578) 46% (619) 12% (163) 1360Voted in 2014: No 38% (244) 33% (207) 29% (186) 6384-Region: Northeast 54% (191) 28% (99) 18% (63) 3534-Region: Midwest 37% (162) 47% (209) 17% (73) 4444-Region: South 35% (258) 50% (370) 16% (117) 7464-Region: West 46% (211) 33% (149) 21% (95) 455
Continued on next page

30
Morning ConsultTable POL2
Table POL2: If the election for U.S. Congress in your district was held today, which one of the following candidates are you most likely to vote for?
Demographic Democratic candidate Republican candidateDon’t know / No
opinion Total N
Registered Voters 41% (822) 41% (827) 17% (349) 1998Party: Democrat/Leans Democrat 87% (766) 3% (30) 10% (87) 883Party: Republican/Leans Republican 2% (20) 88% (738) 10% (83) 841Note: Row proportions may total to larger than one-hundred percent due to rounding. For more information visit MorningConsultIntelligence.com.

National Tracking Poll #2112154, December, 2021
31
Table POL3_1
Table POL3_1: Do you approve or disapprove of how President Biden is handling each of the following?The economy
DemographicStronglyapprove
Somewhatapprove
Somewhatdisapprove
Stronglydisapprove
Don’t Know /No Opinion Total N
Registered Voters 17% (332) 23% (454) 13% (262) 40% (807) 7% (143) 1998Gender: Male 20% (186) 20% (191) 13% (119) 41% (382) 7% (63) 942Gender: Female 14% (146) 25% (263) 13% (143) 40% (425) 8% (79) 1056Age: 18-34 16% (81) 21% (109) 16% (82) 32% (162) 16% (81) 514Age: 35-44 22% (69) 26% (79) 12% (37) 31% (96) 9% (27) 307Age: 45-64 14% (92) 22% (148) 14% (93) 47% (320) 4% (26) 679Age: 65+ 18% (90) 24% (119) 10% (50) 46% (229) 2% (9) 497GenZers: 1997-2012 10% (18) 15% (28) 17% (30) 34% (62) 24% (43) 181Millennials: 1981-1996 22% (118) 25% (134) 12% (66) 30% (161) 10% (53) 534GenXers: 1965-1980 13% (61) 22% (102) 17% (77) 43% (197) 5% (22) 460Baby Boomers: 1946-1964 16% (124) 23% (176) 11% (80) 47% (353) 3% (23) 755PID: Dem (no lean) 34% (259) 40% (305) 12% (94) 8% (64) 5% (36) 759PID: Ind (no lean) 7% (35) 22% (116) 17% (88) 42% (223) 13% (70) 531PID: Rep (no lean) 5% (38) 5% (34) 11% (80) 73% (520) 5% (36) 708PID/Gender: DemMen 41% (134) 36% (119) 11% (37) 8% (25) 4% (13) 328PID/Gender: DemWomen 29% (126) 43% (186) 13% (57) 9% (39) 5% (23) 431PID/Gender: Ind Men 9% (22) 19% (49) 18% (45) 41% (105) 13% (34) 255PID/Gender: Ind Women 5% (13) 24% (67) 15% (43) 43% (117) 13% (36) 276PID/Gender: Rep Men 9% (31) 7% (24) 10% (37) 70% (252) 5% (16) 359PID/Gender: Rep Women 2% (8) 3% (11) 12% (43) 77% (268) 6% (20) 349Ideo: Liberal (1-3) 35% (204) 39% (226) 11% (64) 9% (52) 5% (31) 576Ideo: Moderate (4) 12% (60) 33% (159) 19% (94) 30% (142) 6% (26) 481Ideo: Conservative (5-7) 8% (59) 7% (54) 11% (83) 71% (548) 4% (32) 776Educ: < College 14% (165) 19% (228) 14% (172) 45% (539) 8% (102) 1206Educ: Bachelors degree 21% (103) 26% (132) 12% (63) 35% (175) 6% (28) 501Educ: Post-grad 22% (64) 32% (94) 9% (27) 32% (93) 4% (12) 290Income: Under 50k 13% (114) 22% (194) 15% (128) 38% (333) 11% (100) 868Income: 50k-100k 19% (141) 22% (160) 12% (87) 42% (306) 4% (30) 725Income: 100k+ 19% (77) 25% (100) 12% (47) 41% (168) 3% (13) 405Ethnicity: White 16% (245) 21% (330) 12% (183) 45% (695) 5% (83) 1536Ethnicity: Hispanic 21% (46) 26% (58) 16% (36) 25% (55) 12% (27) 222
Continued on next page

32
Morning ConsultTable POL3_1
Table POL3_1: Do you approve or disapprove of how President Biden is handling each of the following?The economy
DemographicStronglyapprove
Somewhatapprove
Somewhatdisapprove
Stronglydisapprove
Don’t Know /No Opinion Total N
Registered Voters 17% (332) 23% (454) 13% (262) 40% (807) 7% (143) 1998Ethnicity: Black 22% (57) 30% (77) 17% (44) 17% (45) 12% (32) 255Ethnicity: Other 15% (30) 23% (47) 17% (34) 32% (67) 13% (28) 207All Christian 17% (174) 20% (202) 14% (141) 45% (451) 3% (35) 1003All Non-Christian 31% (47) 34% (51) 10% (15) 15% (23) 10% (15) 151Atheist 17% (13) 31% (23) 8% (6) 40% (30) 4% (3) 75Agnostic/Nothing in particular 14% (67) 27% (130) 13% (63) 32% (150) 13% (64) 474Something Else 11% (31) 16% (48) 12% (37) 52% (153) 9% (26) 295Religious Non-Protestant/Catholic 29% (49) 31% (51) 11% (18) 18% (31) 11% (19) 168Evangelical 16% (87) 13% (74) 14% (76) 54% (299) 3% (19) 555Non-Evangelical 16% (116) 24% (170) 14% (97) 41% (295) 5% (38) 715Community: Urban 29% (153) 25% (132) 11% (60) 27% (145) 9% (48) 538Community: Suburban 13% (119) 27% (252) 14% (129) 40% (373) 7% (67) 939Community: Rural 11% (60) 14% (71) 14% (73) 56% (289) 5% (28) 521Employ: Private Sector 17% (115) 24% (163) 16% (111) 38% (260) 6% (38) 687Employ: Government 10% (13) 26% (33) 12% (15) 40% (50) 13% (16) 127Employ: Self-Employed 28% (56) 26% (51) 14% (27) 27% (53) 6% (13) 200Employ: Homemaker 10% (13) 19% (24) 13% (17) 51% (64) 7% (8) 126Employ: Student 19% (12) 17% (10) 10% (6) 34% (21) 21% (13) 61Employ: Retired 17% (86) 23% (121) 10% (54) 47% (245) 3% (14) 520Employ: Unemployed 15% (23) 16% (24) 14% (21) 40% (60) 14% (21) 150Employ: Other 12% (16) 22% (28) 9% (11) 42% (53) 15% (19) 127Military HH: Yes 19% (65) 17% (58) 13% (44) 46% (159) 6% (22) 348Military HH: No 16% (267) 24% (396) 13% (218) 39% (648) 7% (121) 1650RD/WT: Right Direction 38% (281) 45% (331) 8% (61) 3% (21) 7% (49) 743RD/WT: Wrong Track 4% (51) 10% (124) 16% (200) 63% (786) 7% (93) 1255Biden Job Approve 35% (304) 47% (405) 11% (96) 2% (13) 5% (45) 863Biden Job Disapprove 2% (24) 4% (37) 15% (154) 75% (788) 5% (54) 1057
Continued on next page

National Tracking Poll #2112154, December, 2021
33
Table POL3_1
Table POL3_1: Do you approve or disapprove of how President Biden is handling each of the following?The economy
DemographicStronglyapprove
Somewhatapprove
Somewhatdisapprove
Stronglydisapprove
Don’t Know /No Opinion Total N
Registered Voters 17% (332) 23% (454) 13% (262) 40% (807) 7% (143) 1998Biden Job Strongly Approve 62% (263) 29% (124) 3% (12) 2% (7) 4% (19) 424Biden Job Somewhat Approve 9% (41) 64% (282) 19% (84) 1% (7) 6% (26) 438Biden Job Somewhat Disapprove 1% (4) 12% (33) 41% (115) 37% (106) 9% (26) 283Biden Job Strongly Disapprove 2% (19) 1% (5) 5% (39) 88% (682) 4% (28) 774Favorable of Biden 33% (300) 47% (419) 11% (102) 3% (30) 5% (45) 896Unfavorable of Biden 2% (20) 3% (31) 15% (151) 75% (765) 5% (53) 1020Very Favorable of Biden 57% (245) 34% (147) 3% (13) 2% (11) 3% (11) 427Somewhat Favorable of Biden 12% (55) 58% (272) 19% (89) 4% (19) 7% (34) 469Somewhat Unfavorable of Biden 1% (2) 10% (22) 45% (97) 32% (69) 12% (26) 216Very Unfavorable of Biden 2% (18) 1% (9) 7% (54) 87% (696) 3% (27) 804#1 Issue: Economy 12% (103) 18% (150) 15% (125) 50% (427) 6% (53) 858#1 Issue: Security 7% (20) 8% (21) 8% (22) 73% (200) 4% (11) 274#1 Issue: Health Care 24% (54) 34% (78) 16% (36) 18% (41) 8% (19) 227#1 Issue: Medicare / Social Security 17% (34) 35% (69) 15% (30) 27% (54) 5% (9) 196#1 Issue: Women’s Issues 25% (31) 29% (36) 13% (16) 15% (18) 18% (22) 124#1 Issue: Education 26% (21) 31% (25) 12% (10) 20% (16) 11% (9) 80#1 Issue: Energy 29% (35) 37% (44) 12% (14) 16% (19) 7% (8) 121#1 Issue: Other 28% (33) 26% (31) 7% (9) 28% (33) 10% (12) 1182020 Vote: Joe Biden 30% (284) 42% (398) 13% (126) 8% (77) 6% (61) 9462020 Vote: Donald Trump 4% (31) 3% (25) 12% (103) 77% (664) 5% (41) 8642020 Vote: Didn’t Vote 10% (15) 17% (26) 14% (22) 35% (53) 24% (37) 1532018 House Vote: Democrat 32% (230) 43% (308) 13% (91) 7% (52) 5% (33) 7152018 House Vote: Republican 5% (33) 7% (50) 11% (80) 73% (520) 5% (33) 7162018 House Vote: Someone else 5% (3) 22% (15) 12% (8) 46% (31) 15% (10) 672016 Vote: Hillary Clinton 33% (221) 44% (301) 12% (82) 6% (43) 5% (32) 6792016 Vote: Donald Trump 6% (43) 5% (40) 11% (86) 72% (544) 5% (40) 7542016 Vote: Other 12% (12) 30% (29) 18% (17) 31% (30) 9% (9) 962016 Vote: Didn’t Vote 12% (56) 18% (84) 16% (77) 40% (189) 13% (63) 468Voted in 2014: Yes 18% (246) 25% (341) 12% (159) 41% (555) 4% (59) 1360Voted in 2014: No 14% (86) 18% (113) 16% (103) 39% (252) 13% (83) 638
Continued on next page

34
Morning ConsultTable POL3_1
Table POL3_1: Do you approve or disapprove of how President Biden is handling each of the following?The economy
DemographicStronglyapprove
Somewhatapprove
Somewhatdisapprove
Stronglydisapprove
Don’t Know /No Opinion Total N
Registered Voters 17% (332) 23% (454) 13% (262) 40% (807) 7% (143) 19984-Region: Northeast 23% (81) 26% (91) 12% (43) 31% (109) 8% (29) 3534-Region: Midwest 14% (64) 22% (99) 13% (58) 45% (200) 5% (23) 4444-Region: South 14% (108) 17% (129) 14% (101) 48% (357) 7% (51) 7464-Region: West 17% (79) 30% (136) 13% (59) 31% (141) 9% (40) 455Party: Democrat/Leans Democrat 32% (282) 41% (361) 13% (116) 8% (74) 6% (50) 883Party: Republican/Leans Republican 5% (39) 5% (41) 12% (104) 73% (618) 5% (39) 841Note: Row proportions may total to larger than one-hundred percent due to rounding. For more information visit MorningConsultIntelligence.com.

National Tracking Poll #2112154, December, 2021
35
Table POL3_2
Table POL3_2: Do you approve or disapprove of how President Biden is handling each of the following?Jobs
DemographicStronglyapprove
Somewhatapprove
Somewhatdisapprove
Stronglydisapprove
Don’t Know /No Opinion Total N
Registered Voters 19% (382) 25% (502) 13% (252) 34% (688) 9% (173) 1998Gender: Male 22% (206) 24% (228) 12% (111) 36% (335) 7% (62) 942Gender: Female 17% (176) 26% (275) 13% (141) 33% (353) 11% (112) 1056Age: 18-34 21% (108) 25% (127) 13% (65) 25% (127) 17% (88) 514Age: 35-44 24% (74) 27% (82) 15% (47) 25% (77) 9% (27) 307Age: 45-64 15% (102) 24% (165) 13% (88) 41% (281) 6% (43) 679Age: 65+ 20% (98) 26% (129) 10% (52) 41% (203) 3% (16) 497GenZers: 1997-2012 15% (27) 20% (36) 9% (16) 32% (57) 25% (45) 181Millennials: 1981-1996 26% (140) 28% (148) 14% (74) 21% (115) 11% (57) 534GenXers: 1965-1980 14% (65) 25% (113) 15% (71) 39% (180) 7% (31) 460Baby Boomers: 1946-1964 18% (136) 26% (194) 11% (84) 40% (305) 5% (36) 755PID: Dem (no lean) 38% (291) 42% (321) 7% (50) 6% (47) 7% (51) 759PID: Ind (no lean) 8% (41) 23% (124) 19% (100) 36% (189) 14% (76) 531PID: Rep (no lean) 7% (50) 8% (57) 14% (102) 64% (452) 7% (47) 708PID/Gender: DemMen 44% (144) 40% (132) 6% (21) 6% (21) 3% (10) 328PID/Gender: DemWomen 34% (147) 44% (189) 7% (29) 6% (26) 9% (41) 431PID/Gender: Ind Men 9% (23) 23% (58) 17% (44) 37% (95) 14% (35) 255PID/Gender: Ind Women 7% (18) 24% (66) 20% (56) 34% (94) 15% (41) 276PID/Gender: Rep Men 11% (39) 10% (37) 13% (47) 61% (219) 5% (17) 359PID/Gender: Rep Women 3% (11) 6% (20) 16% (55) 67% (233) 9% (30) 349Ideo: Liberal (1-3) 39% (223) 41% (235) 7% (43) 7% (43) 6% (33) 576Ideo: Moderate (4) 16% (78) 33% (158) 16% (77) 24% (115) 11% (54) 481Ideo: Conservative (5-7) 7% (57) 11% (89) 14% (112) 62% (485) 4% (34) 776Educ: < College 17% (202) 21% (258) 13% (152) 39% (468) 10% (126) 1206Educ: Bachelors degree 23% (113) 28% (143) 14% (73) 29% (143) 6% (30) 501Educ: Post-grad 23% (67) 35% (102) 9% (27) 27% (77) 6% (17) 290Income: Under 50k 19% (165) 24% (206) 12% (108) 32% (278) 13% (111) 868Income: 50k-100k 20% (144) 25% (182) 11% (83) 37% (267) 7% (49) 725Income: 100k+ 18% (73) 28% (114) 15% (61) 35% (144) 3% (14) 405Ethnicity: White 18% (281) 23% (349) 13% (196) 39% (604) 7% (106) 1536Ethnicity: Hispanic 23% (50) 27% (59) 17% (37) 21% (47) 13% (28) 222
Continued on next page

36
Morning ConsultTable POL3_2
Table POL3_2: Do you approve or disapprove of how President Biden is handling each of the following?Jobs
DemographicStronglyapprove
Somewhatapprove
Somewhatdisapprove
Stronglydisapprove
Don’t Know /No Opinion Total N
Registered Voters 19% (382) 25% (502) 13% (252) 34% (688) 9% (173) 1998Ethnicity: Black 28% (72) 36% (92) 6% (15) 13% (34) 16% (42) 255Ethnicity: Other 14% (29) 30% (61) 20% (41) 24% (50) 12% (26) 207All Christian 19% (195) 23% (235) 14% (142) 38% (380) 5% (52) 1003All Non-Christian 33% (50) 36% (54) 10% (14) 14% (21) 7% (11) 151Atheist 16% (12) 36% (27) 10% (8) 34% (26) 4% (3) 75Agnostic/Nothing in particular 18% (85) 29% (138) 13% (63) 25% (119) 15% (69) 474Something Else 14% (40) 17% (49) 9% (25) 48% (142) 13% (38) 295Religious Non-Protestant/Catholic 30% (51) 33% (55) 12% (20) 16% (27) 9% (15) 168Evangelical 18% (99) 17% (96) 11% (61) 47% (260) 7% (37) 555Non-Evangelical 19% (133) 25% (181) 14% (98) 36% (255) 7% (48) 715Community: Urban 30% (159) 28% (150) 9% (50) 24% (129) 9% (50) 538Community: Suburban 15% (142) 29% (269) 15% (137) 33% (311) 9% (81) 939Community: Rural 16% (81) 16% (83) 13% (65) 48% (249) 8% (43) 521Employ: Private Sector 19% (127) 29% (198) 14% (93) 33% (228) 6% (40) 687Employ: Government 12% (15) 28% (35) 9% (11) 38% (48) 14% (17) 127Employ: Self-Employed 28% (55) 24% (48) 20% (40) 22% (44) 7% (13) 200Employ: Homemaker 14% (18) 16% (21) 13% (16) 43% (54) 14% (17) 126Employ: Student 23% (14) 20% (12) 15% (9) 24% (15) 18% (11) 61Employ: Retired 18% (96) 26% (136) 10% (54) 41% (213) 4% (21) 520Employ: Unemployed 25% (38) 16% (24) 8% (12) 32% (48) 19% (28) 150Employ: Other 15% (19) 22% (28) 12% (16) 31% (39) 20% (25) 127Military HH: Yes 18% (62) 23% (80) 11% (37) 41% (142) 8% (27) 348Military HH: No 19% (321) 26% (423) 13% (215) 33% (546) 9% (147) 1650RD/WT: Right Direction 42% (314) 43% (321) 6% (43) 2% (13) 7% (51) 743RD/WT: Wrong Track 5% (68) 14% (181) 17% (209) 54% (675) 10% (122) 1255Biden Job Approve 39% (337) 48% (411) 7% (57) 1% (9) 6% (48) 863Biden Job Disapprove 4% (37) 8% (87) 17% (183) 64% (673) 7% (77) 1057
Continued on next page

National Tracking Poll #2112154, December, 2021
37
Table POL3_2
Table POL3_2: Do you approve or disapprove of how President Biden is handling each of the following?Jobs
DemographicStronglyapprove
Somewhatapprove
Somewhatdisapprove
Stronglydisapprove
Don’t Know /No Opinion Total N
Registered Voters 19% (382) 25% (502) 13% (252) 34% (688) 9% (173) 1998Biden Job Strongly Approve 64% (273) 28% (117) 3% (13) 1% (4) 4% (18) 424Biden Job Somewhat Approve 14% (63) 67% (295) 10% (45) 1% (5) 7% (31) 438Biden Job Somewhat Disapprove 7% (21) 22% (62) 34% (97) 24% (68) 12% (35) 283Biden Job Strongly Disapprove 2% (17) 3% (25) 11% (86) 78% (604) 5% (41) 774Favorable of Biden 38% (340) 48% (428) 7% (63) 2% (16) 5% (48) 896Unfavorable of Biden 3% (27) 7% (70) 18% (185) 65% (662) 7% (76) 1020Very Favorable of Biden 62% (263) 31% (132) 3% (14) 1% (6) 3% (13) 427Somewhat Favorable of Biden 16% (77) 63% (296) 11% (50) 2% (10) 8% (36) 469Somewhat Unfavorable of Biden 3% (6) 22% (47) 42% (90) 18% (38) 16% (35) 216Very Unfavorable of Biden 3% (21) 3% (23) 12% (95) 78% (624) 5% (41) 804#1 Issue: Economy 15% (129) 20% (171) 15% (130) 42% (362) 8% (66) 858#1 Issue: Security 8% (21) 8% (23) 16% (43) 62% (171) 6% (16) 274#1 Issue: Health Care 28% (64) 41% (93) 10% (22) 12% (26) 10% (22) 227#1 Issue: Medicare / Social Security 22% (44) 37% (73) 8% (15) 26% (51) 7% (13) 196#1 Issue: Women’s Issues 22% (27) 38% (47) 9% (11) 12% (15) 19% (23) 124#1 Issue: Education 35% (28) 29% (24) 3% (2) 18% (14) 15% (12) 80#1 Issue: Energy 30% (36) 31% (38) 19% (23) 14% (17) 6% (8) 121#1 Issue: Other 28% (33) 28% (33) 4% (5) 28% (33) 11% (14) 1182020 Vote: Joe Biden 33% (314) 44% (418) 9% (87) 5% (52) 8% (75) 9462020 Vote: Donald Trump 5% (44) 6% (51) 15% (131) 67% (583) 6% (54) 8642020 Vote: Didn’t Vote 14% (21) 14% (22) 17% (26) 28% (42) 26% (40) 1532018 House Vote: Democrat 36% (258) 44% (318) 7% (53) 7% (47) 5% (39) 7152018 House Vote: Republican 6% (46) 8% (58) 16% (116) 64% (455) 6% (40) 7162018 House Vote: Someone else 5% (3) 23% (15) 24% (16) 33% (22) 15% (10) 672016 Vote: Hillary Clinton 36% (245) 47% (316) 6% (44) 6% (38) 5% (36) 6792016 Vote: Donald Trump 7% (52) 8% (58) 15% (116) 64% (480) 6% (48) 7542016 Vote: Other 13% (12) 28% (26) 22% (21) 24% (23) 14% (13) 962016 Vote: Didn’t Vote 16% (73) 22% (101) 15% (70) 31% (146) 16% (77) 468Voted in 2014: Yes 21% (281) 26% (357) 12% (166) 36% (487) 5% (70) 1360Voted in 2014: No 16% (101) 23% (145) 13% (86) 32% (202) 16% (104) 638
Continued on next page

38
Morning ConsultTable POL3_2
Table POL3_2: Do you approve or disapprove of how President Biden is handling each of the following?Jobs
DemographicStronglyapprove
Somewhatapprove
Somewhatdisapprove
Stronglydisapprove
Don’t Know /No Opinion Total N
Registered Voters 19% (382) 25% (502) 13% (252) 34% (688) 9% (173) 19984-Region: Northeast 23% (83) 29% (103) 12% (44) 26% (90) 9% (33) 3534-Region: Midwest 16% (70) 28% (122) 14% (61) 37% (167) 6% (25) 4444-Region: South 18% (135) 18% (133) 11% (80) 43% (323) 10% (75) 7464-Region: West 21% (95) 32% (144) 15% (67) 24% (109) 9% (41) 455Party: Democrat/Leans Democrat 36% (315) 43% (381) 8% (68) 6% (55) 7% (64) 883Party: Republican/Leans Republican 6% (52) 8% (66) 16% (131) 64% (541) 6% (51) 841Note: Row proportions may total to larger than one-hundred percent due to rounding. For more information visit MorningConsultIntelligence.com.

National Tracking Poll #2112154, December, 2021
39
Table POL3_3
Table POL3_3: Do you approve or disapprove of how President Biden is handling each of the following?Health care
DemographicStronglyapprove
Somewhatapprove
Somewhatdisapprove
Stronglydisapprove
Don’t Know /No Opinion Total N
Registered Voters 17% (349) 26% (528) 16% (313) 31% (621) 9% (187) 1998Gender: Male 22% (205) 25% (233) 14% (134) 31% (289) 9% (81) 942Gender: Female 14% (144) 28% (295) 17% (178) 32% (333) 10% (106) 1056Age: 18-34 19% (96) 26% (134) 17% (86) 24% (126) 14% (72) 514Age: 35-44 20% (63) 28% (85) 19% (57) 23% (71) 10% (31) 307Age: 45-64 13% (89) 28% (187) 14% (96) 37% (250) 8% (57) 679Age: 65+ 20% (101) 24% (121) 15% (74) 35% (175) 5% (27) 497GenZers: 1997-2012 12% (22) 22% (39) 18% (32) 26% (48) 22% (40) 181Millennials: 1981-1996 24% (130) 29% (153) 15% (81) 23% (121) 9% (49) 534GenXers: 1965-1980 11% (52) 26% (118) 18% (81) 37% (168) 9% (40) 460Baby Boomers: 1946-1964 18% (135) 27% (202) 14% (109) 34% (254) 7% (55) 755PID: Dem (no lean) 36% (274) 42% (321) 12% (91) 5% (38) 5% (35) 759PID: Ind (no lean) 6% (32) 26% (140) 18% (97) 34% (178) 16% (83) 531PID: Rep (no lean) 6% (43) 9% (66) 18% (124) 57% (406) 10% (69) 708PID/Gender: DemMen 46% (151) 38% (124) 7% (22) 7% (24) 2% (7) 328PID/Gender: DemWomen 29% (123) 46% (197) 16% (69) 3% (14) 6% (28) 431PID/Gender: Ind Men 8% (21) 27% (68) 19% (49) 32% (82) 14% (35) 255PID/Gender: Ind Women 4% (12) 26% (72) 18% (49) 35% (96) 17% (48) 276PID/Gender: Rep Men 9% (33) 11% (41) 18% (63) 51% (182) 11% (39) 359PID/Gender: Rep Women 3% (10) 7% (25) 17% (61) 64% (223) 9% (30) 349Ideo: Liberal (1-3) 36% (209) 39% (227) 12% (72) 8% (47) 4% (21) 576Ideo: Moderate (4) 13% (64) 40% (191) 17% (82) 20% (97) 10% (47) 481Ideo: Conservative (5-7) 7% (56) 12% (94) 18% (138) 55% (424) 8% (65) 776Educ: < College 15% (178) 23% (275) 16% (199) 35% (425) 11% (130) 1206Educ: Bachelors degree 19% (97) 32% (161) 14% (73) 26% (129) 8% (42) 501Educ: Post-grad 25% (73) 32% (92) 14% (41) 23% (68) 5% (16) 290Income: Under 50k 16% (136) 26% (227) 15% (126) 31% (268) 13% (111) 868Income: 50k-100k 18% (131) 26% (189) 17% (125) 32% (234) 6% (46) 725Income: 100k+ 20% (82) 27% (111) 15% (62) 29% (119) 8% (31) 405Ethnicity: White 17% (259) 24% (368) 15% (229) 35% (545) 9% (136) 1536Ethnicity: Hispanic 23% (52) 31% (69) 12% (28) 21% (46) 13% (28) 222
Continued on next page

40
Morning ConsultTable POL3_3
Table POL3_3: Do you approve or disapprove of how President Biden is handling each of the following?Health care
DemographicStronglyapprove
Somewhatapprove
Somewhatdisapprove
Stronglydisapprove
Don’t Know /No Opinion Total N
Registered Voters 17% (349) 26% (528) 16% (313) 31% (621) 9% (187) 1998Ethnicity: Black 25% (65) 36% (93) 18% (46) 11% (27) 10% (24) 255Ethnicity: Other 12% (26) 32% (67) 18% (38) 24% (49) 13% (27) 207All Christian 18% (185) 27% (266) 16% (158) 33% (328) 7% (66) 1003All Non-Christian 34% (51) 29% (44) 12% (18) 14% (21) 11% (16) 151Atheist 19% (14) 27% (20) 14% (10) 38% (28) 3% (2) 75Agnostic/Nothing in particular 14% (64) 30% (142) 18% (87) 23% (110) 15% (71) 474Something Else 12% (34) 19% (55) 13% (40) 45% (134) 11% (32) 295Religious Non-Protestant/Catholic 31% (53) 27% (46) 14% (24) 15% (26) 12% (20) 168Evangelical 16% (90) 20% (110) 14% (76) 43% (239) 7% (40) 555Non-Evangelical 18% (127) 29% (204) 16% (115) 30% (216) 7% (53) 715Community: Urban 28% (149) 30% (159) 12% (65) 19% (102) 12% (62) 538Community: Suburban 14% (132) 29% (270) 17% (159) 30% (283) 10% (95) 939Community: Rural 13% (68) 19% (99) 17% (89) 45% (236) 6% (29) 521Employ: Private Sector 17% (116) 30% (204) 17% (113) 29% (198) 8% (55) 687Employ: Government 10% (13) 27% (34) 14% (18) 35% (45) 14% (17) 127Employ: Self-Employed 28% (55) 25% (49) 24% (49) 18% (36) 6% (11) 200Employ: Homemaker 11% (14) 20% (25) 13% (16) 45% (56) 12% (15) 126Employ: Student 11% (7) 36% (22) 12% (7) 22% (14) 18% (11) 61Employ: Retired 19% (98) 25% (128) 14% (71) 35% (185) 7% (39) 520Employ: Unemployed 19% (28) 23% (34) 17% (26) 30% (46) 11% (16) 150Employ: Other 14% (18) 24% (30) 10% (13) 34% (43) 18% (23) 127Military HH: Yes 18% (61) 20% (70) 15% (51) 38% (131) 10% (35) 348Military HH: No 17% (288) 28% (458) 16% (262) 30% (491) 9% (151) 1650RD/WT: Right Direction 39% (292) 44% (329) 8% (58) 3% (20) 6% (44) 743RD/WT: Wrong Track 5% (57) 16% (199) 20% (255) 48% (601) 11% (143) 1255Biden Job Approve 36% (314) 47% (405) 9% (78) 1% (12) 6% (53) 863Biden Job Disapprove 3% (30) 10% (103) 21% (226) 57% (603) 9% (95) 1057
Continued on next page

National Tracking Poll #2112154, December, 2021
41
Table POL3_3
Table POL3_3: Do you approve or disapprove of how President Biden is handling each of the following?Health care
DemographicStronglyapprove
Somewhatapprove
Somewhatdisapprove
Stronglydisapprove
Don’t Know /No Opinion Total N
Registered Voters 17% (349) 26% (528) 16% (313) 31% (621) 9% (187) 1998Biden Job Strongly Approve 59% (252) 30% (129) 4% (18) 2% (7) 5% (20) 424Biden Job Somewhat Approve 14% (63) 63% (276) 14% (61) 1% (5) 8% (34) 438Biden Job Somewhat Disapprove 7% (21) 25% (72) 36% (102) 20% (56) 12% (33) 283Biden Job Strongly Disapprove 1% (9) 4% (32) 16% (124) 71% (546) 8% (62) 774Favorable of Biden 36% (319) 48% (429) 9% (80) 2% (19) 5% (49) 896Unfavorable of Biden 2% (18) 9% (88) 22% (220) 59% (597) 9% (96) 1020Very Favorable of Biden 58% (249) 32% (137) 5% (20) 2% (7) 3% (14) 427Somewhat Favorable of Biden 15% (70) 62% (292) 13% (60) 2% (12) 7% (35) 469Somewhat Unfavorable of Biden 2% (4) 25% (53) 43% (93) 15% (33) 16% (34) 216Very Unfavorable of Biden 2% (15) 4% (35) 16% (127) 70% (565) 8% (62) 804#1 Issue: Economy 14% (123) 23% (194) 18% (150) 35% (304) 10% (87) 858#1 Issue: Security 6% (17) 10% (27) 18% (51) 56% (154) 9% (26) 274#1 Issue: Health Care 30% (67) 34% (77) 13% (30) 16% (36) 8% (18) 227#1 Issue: Medicare / Social Security 21% (41) 39% (76) 10% (20) 25% (50) 5% (9) 196#1 Issue: Women’s Issues 19% (23) 36% (44) 17% (20) 15% (18) 15% (18) 124#1 Issue: Education 27% (22) 35% (28) 13% (10) 15% (12) 10% (8) 80#1 Issue: Energy 24% (28) 40% (49) 16% (20) 12% (14) 8% (10) 121#1 Issue: Other 24% (28) 28% (33) 9% (11) 28% (33) 10% (12) 1182020 Vote: Joe Biden 31% (289) 46% (431) 13% (120) 5% (44) 7% (62) 9462020 Vote: Donald Trump 5% (40) 7% (59) 19% (164) 60% (519) 10% (83) 8642020 Vote: Didn’t Vote 13% (19) 18% (28) 14% (21) 30% (47) 25% (38) 1532018 House Vote: Democrat 33% (239) 45% (322) 11% (82) 6% (41) 4% (30) 7152018 House Vote: Republican 5% (39) 9% (67) 19% (136) 56% (398) 11% (75) 7162018 House Vote: Someone else 6% (4) 24% (16) 20% (13) 35% (24) 15% (10) 672016 Vote: Hillary Clinton 34% (232) 47% (317) 10% (65) 5% (31) 5% (34) 6792016 Vote: Donald Trump 6% (48) 9% (65) 19% (144) 55% (417) 10% (79) 7542016 Vote: Other 11% (11) 25% (24) 24% (23) 29% (28) 11% (11) 962016 Vote: Didn’t Vote 12% (58) 26% (121) 17% (80) 31% (144) 14% (64) 468Voted in 2014: Yes 20% (268) 26% (360) 15% (209) 32% (435) 6% (88) 1360Voted in 2014: No 13% (81) 26% (168) 16% (103) 29% (186) 16% (99) 638
Continued on next page

42
Morning ConsultTable POL3_3
Table POL3_3: Do you approve or disapprove of how President Biden is handling each of the following?Health care
DemographicStronglyapprove
Somewhatapprove
Somewhatdisapprove
Stronglydisapprove
Don’t Know /No Opinion Total N
Registered Voters 17% (349) 26% (528) 16% (313) 31% (621) 9% (187) 19984-Region: Northeast 24% (86) 29% (101) 15% (52) 22% (78) 10% (36) 3534-Region: Midwest 14% (61) 27% (122) 17% (77) 35% (153) 7% (32) 4444-Region: South 15% (114) 23% (168) 15% (109) 39% (289) 9% (65) 7464-Region: West 19% (88) 30% (137) 16% (75) 22% (101) 12% (54) 455Party: Democrat/Leans Democrat 34% (296) 43% (379) 13% (113) 5% (49) 5% (46) 883Party: Republican/Leans Republican 5% (44) 10% (80) 19% (160) 57% (475) 10% (82) 841Note: Row proportions may total to larger than one-hundred percent due to rounding. For more information visit MorningConsultIntelligence.com.

National Tracking Poll #2112154, December, 2021
43
Table POL3_4
Table POL3_4: Do you approve or disapprove of how President Biden is handling each of the following?Immigration
DemographicStronglyapprove
Somewhatapprove
Somewhatdisapprove
Stronglydisapprove
Don’t Know /No Opinion Total N
Registered Voters 12% (235) 23% (455) 15% (304) 41% (811) 10% (192) 1998Gender: Male 16% (147) 20% (184) 16% (146) 42% (391) 8% (73) 942Gender: Female 8% (88) 26% (271) 15% (158) 40% (420) 11% (119) 1056Age: 18-34 15% (77) 23% (118) 19% (97) 28% (141) 16% (80) 514Age: 35-44 17% (53) 23% (72) 14% (43) 32% (97) 14% (41) 307Age: 45-64 9% (62) 21% (142) 15% (103) 47% (321) 8% (52) 679Age: 65+ 9% (42) 25% (123) 12% (61) 51% (252) 4% (19) 497GenZers: 1997-2012 8% (14) 23% (42) 13% (24) 32% (58) 23% (42) 181Millennials: 1981-1996 21% (110) 23% (125) 19% (101) 25% (135) 12% (62) 534GenXers: 1965-1980 9% (43) 19% (88) 16% (74) 46% (212) 9% (43) 460Baby Boomers: 1946-1964 9% (66) 24% (180) 13% (99) 49% (367) 6% (43) 755PID: Dem (no lean) 24% (184) 42% (317) 18% (134) 8% (59) 9% (65) 759PID: Ind (no lean) 3% (18) 17% (88) 21% (113) 43% (227) 16% (84) 531PID: Rep (no lean) 5% (32) 7% (50) 8% (56) 74% (525) 6% (44) 708PID/Gender: DemMen 33% (108) 35% (115) 18% (59) 8% (26) 6% (18) 328PID/Gender: DemWomen 18% (76) 47% (201) 17% (75) 7% (32) 11% (46) 431PID/Gender: Ind Men 4% (11) 16% (40) 23% (59) 42% (107) 15% (38) 255PID/Gender: Ind Women 3% (7) 17% (48) 20% (55) 44% (120) 17% (46) 276PID/Gender: Rep Men 8% (28) 8% (29) 8% (28) 72% (258) 5% (17) 359PID/Gender: Rep Women 1% (5) 6% (22) 8% (28) 77% (268) 8% (27) 349Ideo: Liberal (1-3) 25% (145) 41% (235) 16% (94) 10% (59) 8% (44) 576Ideo: Moderate (4) 9% (43) 28% (135) 23% (110) 29% (139) 11% (53) 481Ideo: Conservative (5-7) 5% (40) 8% (61) 10% (76) 72% (560) 5% (39) 776Educ: < College 10% (116) 19% (233) 15% (178) 45% (545) 11% (134) 1206Educ: Bachelors degree 15% (73) 25% (126) 17% (86) 35% (176) 8% (40) 501Educ: Post-grad 16% (46) 33% (96) 14% (41) 31% (90) 6% (18) 290Income: Under 50k 10% (84) 22% (192) 16% (138) 38% (330) 14% (125) 868Income: 50k-100k 13% (96) 23% (165) 16% (114) 42% (306) 6% (44) 725Income: 100k+ 14% (55) 24% (99) 13% (52) 43% (176) 6% (23) 405Ethnicity: White 12% (185) 21% (318) 14% (209) 46% (711) 7% (113) 1536Ethnicity: Hispanic 17% (38) 30% (68) 15% (33) 26% (57) 12% (27) 222
Continued on next page

44
Morning ConsultTable POL3_4
Table POL3_4: Do you approve or disapprove of how President Biden is handling each of the following?Immigration
DemographicStronglyapprove
Somewhatapprove
Somewhatdisapprove
Stronglydisapprove
Don’t Know /No Opinion Total N
Registered Voters 12% (235) 23% (455) 15% (304) 41% (811) 10% (192) 1998Ethnicity: Black 12% (30) 32% (81) 22% (55) 15% (39) 20% (50) 255Ethnicity: Other 10% (20) 27% (57) 19% (40) 29% (61) 14% (30) 207All Christian 12% (118) 23% (227) 14% (145) 46% (458) 6% (56) 1003All Non-Christian 28% (43) 29% (44) 15% (23) 15% (23) 12% (18) 151Atheist 13% (10) 21% (16) 17% (13) 39% (29) 10% (7) 75Agnostic/Nothing in particular 9% (44) 25% (120) 20% (93) 31% (146) 15% (71) 474Something Else 7% (20) 17% (49) 10% (31) 53% (156) 13% (40) 295Religious Non-Protestant/Catholic 26% (44) 27% (46) 14% (23) 20% (33) 13% (21) 168Evangelical 12% (69) 16% (89) 11% (61) 54% (301) 6% (35) 555Non-Evangelical 9% (66) 25% (182) 16% (115) 41% (295) 8% (57) 715Community: Urban 22% (120) 28% (148) 13% (69) 26% (140) 11% (61) 538Community: Suburban 8% (74) 24% (226) 17% (160) 41% (385) 10% (95) 939Community: Rural 8% (41) 16% (82) 14% (75) 55% (287) 7% (37) 521Employ: Private Sector 14% (95) 24% (167) 16% (108) 38% (263) 8% (54) 687Employ: Government 10% (13) 20% (25) 16% (20) 39% (49) 16% (21) 127Employ: Self-Employed 22% (44) 18% (36) 18% (37) 31% (63) 10% (21) 200Employ: Homemaker 6% (7) 12% (15) 19% (23) 53% (66) 11% (14) 126Employ: Student 14% (9) 34% (21) 10% (6) 30% (18) 11% (7) 61Employ: Retired 9% (45) 25% (130) 12% (63) 50% (259) 4% (23) 520Employ: Unemployed 7% (11) 28% (43) 14% (21) 32% (48) 18% (27) 150Employ: Other 9% (11) 15% (19) 20% (26) 35% (44) 21% (27) 127Military HH: Yes 10% (36) 20% (69) 12% (42) 48% (168) 9% (33) 348Military HH: No 12% (199) 23% (386) 16% (262) 39% (643) 10% (160) 1650RD/WT: Right Direction 27% (198) 42% (314) 18% (133) 4% (32) 9% (65) 743RD/WT: Wrong Track 3% (37) 11% (141) 14% (171) 62% (779) 10% (127) 1255Biden Job Approve 24% (208) 44% (381) 20% (175) 3% (24) 9% (75) 863Biden Job Disapprove 2% (25) 6% (61) 12% (124) 74% (779) 6% (69) 1057
Continued on next page

National Tracking Poll #2112154, December, 2021
45
Table POL3_4
Table POL3_4: Do you approve or disapprove of how President Biden is handling each of the following?Immigration
DemographicStronglyapprove
Somewhatapprove
Somewhatdisapprove
Stronglydisapprove
Don’t Know /No Opinion Total N
Registered Voters 12% (235) 23% (455) 15% (304) 41% (811) 10% (192) 1998Biden Job Strongly Approve 42% (177) 42% (178) 7% (31) 2% (10) 7% (28) 424Biden Job Somewhat Approve 7% (31) 46% (203) 33% (144) 3% (14) 11% (46) 438Biden Job Somewhat Disapprove 4% (11) 19% (55) 31% (89) 34% (96) 12% (33) 283Biden Job Strongly Disapprove 2% (14) 1% (6) 5% (35) 88% (683) 5% (36) 774Favorable of Biden 23% (202) 46% (412) 19% (173) 4% (33) 9% (77) 896Unfavorable of Biden 2% (21) 3% (34) 12% (127) 75% (767) 7% (71) 1020Very Favorable of Biden 38% (164) 44% (188) 9% (36) 3% (12) 6% (27) 427Somewhat Favorable of Biden 8% (38) 48% (223) 29% (137) 4% (21) 11% (50) 469Somewhat Unfavorable of Biden 3% (7) 10% (21) 40% (86) 32% (70) 15% (33) 216Very Unfavorable of Biden 2% (14) 2% (13) 5% (41) 87% (698) 5% (38) 804#1 Issue: Economy 10% (82) 19% (160) 16% (139) 46% (392) 10% (86) 858#1 Issue: Security 6% (16) 5% (13) 9% (25) 76% (208) 5% (12) 274#1 Issue: Health Care 18% (40) 36% (82) 17% (39) 18% (42) 11% (24) 227#1 Issue: Medicare / Social Security 9% (18) 33% (65) 15% (29) 35% (68) 8% (15) 196#1 Issue: Women’s Issues 17% (20) 32% (40) 21% (26) 14% (17) 16% (20) 124#1 Issue: Education 26% (21) 31% (25) 12% (9) 20% (16) 11% (9) 80#1 Issue: Energy 20% (24) 32% (39) 19% (23) 19% (23) 10% (12) 121#1 Issue: Other 12% (14) 28% (33) 12% (14) 38% (44) 11% (14) 1182020 Vote: Joe Biden 20% (189) 41% (392) 21% (199) 8% (73) 10% (94) 9462020 Vote: Donald Trump 4% (33) 4% (36) 9% (77) 78% (671) 5% (46) 8642020 Vote: Didn’t Vote 8% (12) 14% (21) 15% (23) 33% (51) 30% (46) 1532018 House Vote: Democrat 21% (148) 44% (312) 19% (139) 9% (62) 8% (54) 7152018 House Vote: Republican 5% (38) 6% (40) 10% (68) 74% (529) 6% (41) 7162018 House Vote: Someone else 3% (2) 28% (19) 20% (13) 39% (26) 11% (7) 672016 Vote: Hillary Clinton 21% (146) 45% (306) 18% (123) 7% (47) 8% (57) 6792016 Vote: Donald Trump 5% (36) 6% (42) 10% (75) 74% (556) 6% (45) 7542016 Vote: Other 5% (5) 21% (20) 29% (27) 33% (32) 12% (12) 962016 Vote: Didn’t Vote 10% (49) 18% (86) 17% (78) 38% (175) 17% (79) 468Voted in 2014: Yes 13% (171) 24% (330) 15% (203) 42% (569) 6% (87) 1360Voted in 2014: No 10% (64) 20% (126) 16% (101) 38% (243) 16% (105) 638
Continued on next page

46
Morning ConsultTable POL3_4
Table POL3_4: Do you approve or disapprove of how President Biden is handling each of the following?Immigration
DemographicStronglyapprove
Somewhatapprove
Somewhatdisapprove
Stronglydisapprove
Don’t Know /No Opinion Total N
Registered Voters 12% (235) 23% (455) 15% (304) 41% (811) 10% (192) 19984-Region: Northeast 16% (57) 22% (79) 18% (64) 33% (118) 10% (35) 3534-Region: Midwest 9% (42) 24% (108) 15% (66) 42% (186) 10% (43) 4444-Region: South 10% (73) 20% (145) 13% (94) 49% (368) 9% (65) 7464-Region: West 14% (62) 27% (123) 18% (81) 31% (140) 11% (49) 455Party: Democrat/Leans Democrat 22% (194) 41% (360) 20% (173) 8% (69) 10% (87) 883Party: Republican/Leans Republican 4% (34) 7% (56) 9% (78) 74% (626) 6% (47) 841Note: Row proportions may total to larger than one-hundred percent due to rounding. For more information visit MorningConsultIntelligence.com.

National Tracking Poll #2112154, December, 2021
47
Table POL3_5
Table POL3_5: Do you approve or disapprove of how President Biden is handling each of the following?Climate change
DemographicStronglyapprove
Somewhatapprove
Somewhatdisapprove
Stronglydisapprove
Don’t Know /No Opinion Total N
Registered Voters 19% (372) 25% (501) 12% (250) 30% (607) 13% (268) 1998Gender: Male 21% (194) 24% (230) 13% (118) 31% (289) 12% (110) 942Gender: Female 17% (178) 26% (271) 12% (132) 30% (318) 15% (158) 1056Age: 18-34 20% (105) 23% (117) 14% (72) 22% (112) 21% (109) 514Age: 35-44 19% (60) 30% (93) 12% (36) 21% (64) 17% (53) 307Age: 45-64 15% (105) 25% (173) 13% (85) 36% (244) 11% (72) 679Age: 65+ 21% (103) 24% (118) 11% (56) 38% (187) 7% (34) 497GenZers: 1997-2012 13% (24) 20% (36) 19% (35) 21% (37) 27% (49) 181Millennials: 1981-1996 25% (134) 26% (139) 11% (61) 22% (116) 16% (85) 534GenXers: 1965-1980 12% (54) 28% (128) 14% (62) 33% (151) 14% (65) 460Baby Boomers: 1946-1964 20% (148) 24% (183) 11% (86) 36% (275) 8% (63) 755PID: Dem (no lean) 37% (284) 41% (314) 8% (64) 5% (38) 8% (59) 759PID: Ind (no lean) 9% (49) 21% (110) 17% (93) 34% (178) 19% (100) 531PID: Rep (no lean) 6% (39) 11% (76) 13% (93) 55% (391) 15% (109) 708PID/Gender: DemMen 44% (144) 39% (126) 9% (31) 5% (17) 3% (10) 328PID/Gender: DemWomen 32% (140) 44% (188) 8% (34) 5% (21) 11% (48) 431PID/Gender: Ind Men 10% (26) 23% (59) 16% (41) 33% (85) 17% (44) 255PID/Gender: Ind Women 8% (23) 19% (51) 19% (51) 34% (93) 20% (56) 276PID/Gender: Rep Men 7% (24) 12% (45) 13% (46) 52% (188) 16% (56) 359PID/Gender: Rep Women 4% (15) 9% (31) 13% (46) 58% (203) 15% (53) 349Ideo: Liberal (1-3) 39% (227) 38% (220) 9% (51) 8% (47) 5% (31) 576Ideo: Moderate (4) 16% (79) 34% (163) 14% (67) 21% (99) 15% (73) 481Ideo: Conservative (5-7) 7% (54) 13% (103) 15% (113) 54% (419) 11% (88) 776Educ: < College 15% (183) 21% (249) 13% (159) 35% (420) 16% (196) 1206Educ: Bachelors degree 24% (121) 29% (148) 13% (63) 23% (115) 11% (54) 501Educ: Post-grad 24% (68) 36% (105) 9% (27) 25% (72) 6% (18) 290Income: Under 50k 16% (136) 22% (187) 13% (114) 30% (258) 20% (172) 868Income: 50k-100k 22% (160) 26% (190) 11% (83) 32% (230) 9% (62) 725Income: 100k+ 19% (76) 30% (123) 13% (53) 29% (119) 8% (34) 405Ethnicity: White 18% (279) 24% (369) 12% (181) 34% (526) 12% (180) 1536Ethnicity: Hispanic 23% (51) 30% (66) 13% (30) 19% (42) 15% (32) 222
Continued on next page

48
Morning ConsultTable POL3_5
Table POL3_5: Do you approve or disapprove of how President Biden is handling each of the following?Climate change
DemographicStronglyapprove
Somewhatapprove
Somewhatdisapprove
Stronglydisapprove
Don’t Know /No Opinion Total N
Registered Voters 19% (372) 25% (501) 12% (250) 30% (607) 13% (268) 1998Ethnicity: Black 25% (63) 31% (79) 12% (31) 10% (25) 22% (57) 255Ethnicity: Other 14% (30) 26% (53) 18% (38) 27% (56) 15% (31) 207All Christian 19% (191) 26% (263) 12% (120) 32% (325) 10% (103) 1003All Non-Christian 36% (53) 33% (50) 7% (11) 12% (18) 13% (19) 151Atheist 14% (11) 28% (21) 19% (14) 35% (27) 4% (3) 75Agnostic/Nothing in particular 18% (85) 27% (128) 13% (60) 24% (115) 18% (87) 474Something Else 11% (32) 13% (39) 15% (44) 42% (123) 19% (56) 295Religious Non-Protestant/Catholic 33% (56) 30% (50) 9% (15) 14% (24) 14% (23) 168Evangelical 15% (84) 17% (95) 13% (70) 41% (229) 14% (78) 555Non-Evangelical 19% (133) 28% (203) 13% (90) 30% (212) 11% (76) 715Community: Urban 30% (159) 27% (144) 11% (62) 19% (101) 13% (72) 538Community: Suburban 15% (140) 29% (274) 13% (118) 30% (280) 14% (127) 939Community: Rural 14% (72) 16% (83) 13% (70) 43% (226) 13% (69) 521Employ: Private Sector 19% (131) 28% (189) 13% (88) 29% (196) 12% (83) 687Employ: Government 14% (18) 24% (31) 17% (22) 24% (30) 20% (25) 127Employ: Self-Employed 28% (55) 25% (49) 18% (36) 19% (39) 11% (21) 200Employ: Homemaker 11% (14) 22% (28) 7% (9) 44% (56) 15% (19) 126Employ: Student 14% (9) 29% (18) 22% (13) 13% (8) 22% (13) 61Employ: Retired 20% (105) 24% (127) 11% (55) 38% (197) 7% (38) 520Employ: Unemployed 16% (23) 23% (34) 10% (15) 29% (43) 23% (34) 150Employ: Other 14% (17) 19% (25) 9% (11) 31% (40) 27% (35) 127Military HH: Yes 18% (61) 25% (87) 10% (35) 35% (122) 12% (42) 348Military HH: No 19% (311) 25% (413) 13% (215) 29% (486) 14% (226) 1650RD/WT: Right Direction 41% (308) 42% (312) 6% (42) 3% (23) 8% (57) 743RD/WT: Wrong Track 5% (64) 15% (189) 17% (207) 47% (584) 17% (211) 1255Biden Job Approve 39% (338) 45% (385) 7% (61) 2% (20) 7% (60) 863Biden Job Disapprove 3% (27) 10% (109) 17% (179) 55% (582) 15% (159) 1057
Continued on next page

National Tracking Poll #2112154, December, 2021
49
Table POL3_5
Table POL3_5: Do you approve or disapprove of how President Biden is handling each of the following?Climate change
DemographicStronglyapprove
Somewhatapprove
Somewhatdisapprove
Stronglydisapprove
Don’t Know /No Opinion Total N
Registered Voters 19% (372) 25% (501) 12% (250) 30% (607) 13% (268) 1998Biden Job Strongly Approve 61% (260) 29% (125) 3% (12) 1% (6) 5% (22) 424Biden Job Somewhat Approve 18% (78) 59% (260) 11% (49) 3% (14) 9% (38) 438Biden Job Somewhat Disapprove 5% (15) 25% (70) 28% (79) 17% (48) 25% (70) 283Biden Job Strongly Disapprove 2% (12) 5% (39) 13% (99) 69% (534) 12% (89) 774Favorable of Biden 38% (344) 44% (393) 8% (71) 2% (19) 8% (69) 896Unfavorable of Biden 2% (18) 10% (98) 17% (176) 56% (573) 15% (154) 1020Very Favorable of Biden 59% (252) 32% (139) 3% (12) 2% (7) 4% (17) 427Somewhat Favorable of Biden 20% (93) 54% (254) 12% (58) 3% (12) 11% (52) 469Somewhat Unfavorable of Biden 2% (5) 25% (53) 29% (62) 15% (32) 29% (63) 216Very Unfavorable of Biden 2% (13) 6% (45) 14% (114) 67% (541) 11% (91) 804#1 Issue: Economy 14% (119) 21% (182) 14% (119) 35% (301) 16% (138) 858#1 Issue: Security 8% (21) 10% (28) 11% (31) 61% (168) 9% (25) 274#1 Issue: Health Care 30% (67) 35% (80) 14% (32) 8% (19) 13% (29) 227#1 Issue: Medicare / Social Security 25% (49) 34% (66) 12% (23) 21% (41) 9% (17) 196#1 Issue: Women’s Issues 29% (35) 35% (43) 8% (10) 11% (14) 17% (21) 124#1 Issue: Education 23% (19) 32% (26) 13% (11) 22% (17) 9% (8) 80#1 Issue: Energy 31% (38) 32% (39) 14% (18) 13% (16) 9% (11) 121#1 Issue: Other 20% (23) 31% (36) 6% (7) 27% (31) 17% (20) 1182020 Vote: Joe Biden 34% (325) 41% (391) 9% (86) 5% (49) 10% (94) 9462020 Vote: Donald Trump 4% (33) 8% (65) 16% (134) 59% (512) 14% (119) 8642020 Vote: Didn’t Vote 7% (11) 23% (35) 13% (19) 23% (35) 34% (52) 1532018 House Vote: Democrat 36% (255) 43% (304) 10% (71) 5% (34) 7% (50) 7152018 House Vote: Republican 5% (37) 11% (78) 15% (104) 58% (412) 12% (85) 7162018 House Vote: Someone else 7% (5) 26% (18) 19% (13) 28% (19) 19% (13) 672016 Vote: Hillary Clinton 37% (249) 44% (297) 9% (59) 5% (33) 6% (40) 6792016 Vote: Donald Trump 5% (41) 10% (76) 14% (108) 57% (431) 13% (97) 7542016 Vote: Other 14% (14) 34% (33) 13% (13) 23% (22) 16% (15) 962016 Vote: Didn’t Vote 15% (68) 20% (93) 15% (70) 26% (120) 25% (116) 468Voted in 2014: Yes 20% (269) 27% (365) 13% (172) 32% (436) 9% (119) 1360Voted in 2014: No 16% (103) 21% (136) 12% (78) 27% (171) 23% (149) 638
Continued on next page

50
Morning ConsultTable POL3_5
Table POL3_5: Do you approve or disapprove of how President Biden is handling each of the following?Climate change
DemographicStronglyapprove
Somewhatapprove
Somewhatdisapprove
Stronglydisapprove
Don’t Know /No Opinion Total N
Registered Voters 19% (372) 25% (501) 12% (250) 30% (607) 13% (268) 19984-Region: Northeast 24% (83) 30% (105) 13% (47) 23% (79) 11% (39) 3534-Region: Midwest 16% (70) 24% (105) 14% (64) 34% (151) 12% (54) 4444-Region: South 16% (119) 22% (163) 11% (81) 37% (279) 14% (104) 7464-Region: West 22% (99) 28% (129) 13% (58) 22% (98) 16% (71) 455Party: Democrat/Leans Democrat 35% (313) 41% (364) 9% (81) 6% (50) 8% (75) 883Party: Republican/Leans Republican 5% (41) 10% (88) 14% (122) 56% (474) 14% (116) 841Note: Row proportions may total to larger than one-hundred percent due to rounding. For more information visit MorningConsultIntelligence.com.

National Tracking Poll #2112154, December, 2021
51
Table POL3_6
Table POL3_6: Do you approve or disapprove of how President Biden is handling each of the following?The environment
DemographicStronglyapprove
Somewhatapprove
Somewhatdisapprove
Stronglydisapprove
Don’t Know /No Opinion Total N
Registered Voters 19% (371) 27% (533) 13% (256) 31% (618) 11% (219) 1998Gender: Male 22% (210) 25% (239) 13% (118) 31% (295) 8% (79) 942Gender: Female 15% (161) 28% (294) 13% (138) 31% (322) 13% (140) 1056Age: 18-34 18% (95) 26% (132) 13% (67) 25% (128) 18% (92) 514Age: 35-44 22% (67) 32% (100) 12% (36) 19% (57) 15% (47) 307Age: 45-64 15% (105) 26% (176) 14% (95) 37% (249) 8% (54) 679Age: 65+ 21% (104) 25% (126) 12% (58) 37% (184) 5% (26) 497GenZers: 1997-2012 12% (21) 23% (42) 11% (19) 32% (57) 23% (42) 181Millennials: 1981-1996 25% (131) 28% (149) 13% (70) 20% (107) 14% (76) 534GenXers: 1965-1980 13% (61) 30% (138) 14% (63) 32% (145) 11% (52) 460Baby Boomers: 1946-1964 19% (143) 25% (190) 13% (95) 37% (280) 6% (45) 755PID: Dem (no lean) 36% (277) 42% (315) 9% (67) 7% (50) 7% (50) 759PID: Ind (no lean) 9% (48) 26% (141) 15% (80) 33% (175) 16% (86) 531PID: Rep (no lean) 6% (46) 11% (78) 15% (109) 55% (392) 12% (83) 708PID/Gender: DemMen 45% (149) 38% (124) 7% (24) 7% (21) 3% (10) 328PID/Gender: DemWomen 30% (128) 44% (191) 10% (43) 7% (28) 9% (40) 431PID/Gender: Ind Men 11% (27) 27% (68) 16% (41) 32% (82) 14% (37) 255PID/Gender: Ind Women 8% (21) 26% (73) 14% (39) 34% (93) 18% (49) 276PID/Gender: Rep Men 9% (34) 13% (47) 15% (53) 54% (192) 9% (32) 359PID/Gender: Rep Women 3% (12) 9% (30) 16% (56) 57% (200) 14% (51) 349Ideo: Liberal (1-3) 39% (226) 39% (224) 9% (50) 8% (48) 5% (29) 576Ideo: Moderate (4) 16% (76) 38% (184) 11% (54) 22% (105) 13% (62) 481Ideo: Conservative (5-7) 7% (55) 14% (108) 17% (135) 53% (411) 9% (68) 776Educ: < College 15% (186) 22% (271) 13% (153) 37% (442) 13% (155) 1206Educ: Bachelors degree 23% (114) 32% (158) 13% (67) 23% (115) 9% (47) 501Educ: Post-grad 25% (71) 36% (105) 12% (36) 21% (61) 6% (17) 290Income: Under 50k 16% (142) 24% (209) 12% (107) 31% (270) 16% (140) 868Income: 50k-100k 21% (149) 27% (194) 14% (98) 32% (230) 7% (53) 725Income: 100k+ 20% (79) 32% (131) 13% (51) 29% (117) 7% (27) 405Ethnicity: White 19% (286) 25% (384) 13% (198) 34% (525) 9% (143) 1536Ethnicity: Hispanic 26% (59) 27% (60) 12% (26) 20% (45) 15% (33) 222
Continued on next page

52
Morning ConsultTable POL3_6
Table POL3_6: Do you approve or disapprove of how President Biden is handling each of the following?The environment
DemographicStronglyapprove
Somewhatapprove
Somewhatdisapprove
Stronglydisapprove
Don’t Know /No Opinion Total N
Registered Voters 19% (371) 27% (533) 13% (256) 31% (618) 11% (219) 1998Ethnicity: Black 22% (57) 33% (85) 11% (27) 17% (44) 17% (42) 255Ethnicity: Other 14% (28) 31% (64) 15% (32) 24% (49) 16% (34) 207All Christian 19% (186) 28% (277) 13% (130) 33% (329) 8% (81) 1003All Non-Christian 39% (59) 26% (39) 10% (15) 13% (20) 11% (17) 151Atheist 13% (10) 28% (21) 19% (15) 36% (27) 4% (3) 75Agnostic/Nothing in particular 18% (86) 28% (135) 12% (56) 26% (123) 16% (74) 474Something Else 10% (30) 21% (62) 14% (40) 41% (120) 15% (44) 295Religious Non-Protestant/Catholic 37% (62) 24% (40) 12% (20) 15% (25) 12% (21) 168Evangelical 16% (89) 19% (107) 13% (71) 42% (232) 10% (56) 555Non-Evangelical 17% (123) 31% (224) 13% (93) 29% (210) 9% (65) 715Community: Urban 30% (160) 30% (160) 10% (53) 20% (106) 11% (58) 538Community: Suburban 15% (136) 31% (288) 13% (126) 30% (280) 12% (110) 939Community: Rural 14% (74) 16% (85) 15% (78) 45% (232) 10% (52) 521Employ: Private Sector 19% (128) 30% (208) 15% (104) 27% (185) 9% (62) 687Employ: Government 13% (17) 30% (38) 14% (18) 25% (32) 18% (23) 127Employ: Self-Employed 28% (56) 24% (48) 19% (37) 19% (39) 10% (20) 200Employ: Homemaker 8% (10) 25% (32) 6% (8) 41% (51) 19% (24) 126Employ: Student 9% (5) 40% (24) 19% (12) 17% (10) 15% (9) 61Employ: Retired 21% (107) 24% (125) 11% (55) 38% (200) 6% (33) 520Employ: Unemployed 15% (23) 23% (35) 6% (10) 36% (54) 19% (29) 150Employ: Other 19% (24) 19% (25) 10% (13) 37% (47) 15% (19) 127Military HH: Yes 16% (57) 25% (86) 12% (40) 36% (124) 11% (40) 348Military HH: No 19% (313) 27% (448) 13% (216) 30% (493) 11% (180) 1650RD/WT: Right Direction 40% (299) 43% (317) 7% (50) 3% (21) 8% (57) 743RD/WT: Wrong Track 6% (72) 17% (217) 16% (206) 48% (597) 13% (163) 1255Biden Job Approve 38% (327) 46% (396) 8% (66) 2% (16) 7% (57) 863Biden Job Disapprove 3% (33) 12% (126) 18% (188) 56% (596) 11% (113) 1057
Continued on next page

National Tracking Poll #2112154, December, 2021
53
Table POL3_6
Table POL3_6: Do you approve or disapprove of how President Biden is handling each of the following?The environment
DemographicStronglyapprove
Somewhatapprove
Somewhatdisapprove
Stronglydisapprove
Don’t Know /No Opinion Total N
Registered Voters 19% (371) 27% (533) 13% (256) 31% (618) 11% (219) 1998Biden Job Strongly Approve 62% (261) 30% (126) 3% (12) 1% (5) 5% (20) 424Biden Job Somewhat Approve 15% (66) 62% (270) 12% (54) 3% (12) 8% (37) 438Biden Job Somewhat Disapprove 7% (18) 29% (82) 30% (85) 19% (53) 16% (46) 283Biden Job Strongly Disapprove 2% (15) 6% (44) 13% (103) 70% (543) 9% (67) 774Favorable of Biden 37% (330) 46% (413) 7% (65) 3% (28) 7% (59) 896Unfavorable of Biden 2% (21) 11% (117) 19% (189) 57% (579) 11% (114) 1020Very Favorable of Biden 60% (256) 31% (133) 3% (13) 2% (7) 4% (19) 427Somewhat Favorable of Biden 16% (75) 60% (281) 11% (52) 5% (21) 9% (40) 469Somewhat Unfavorable of Biden 3% (6) 32% (70) 33% (72) 9% (20) 22% (48) 216Very Unfavorable of Biden 2% (16) 6% (47) 15% (117) 70% (559) 8% (65) 804#1 Issue: Economy 14% (123) 24% (205) 14% (118) 36% (312) 12% (99) 858#1 Issue: Security 9% (26) 12% (33) 12% (34) 60% (164) 7% (18) 274#1 Issue: Health Care 30% (69) 38% (87) 9% (21) 10% (23) 12% (26) 227#1 Issue: Medicare / Social Security 25% (49) 33% (65) 12% (24) 22% (43) 8% (15) 196#1 Issue: Women’s Issues 19% (24) 37% (46) 16% (20) 12% (15) 16% (20) 124#1 Issue: Education 24% (19) 32% (26) 11% (9) 20% (16) 13% (11) 80#1 Issue: Energy 31% (37) 32% (39) 16% (20) 12% (15) 9% (11) 121#1 Issue: Other 21% (24) 28% (33) 9% (11) 26% (30) 16% (19) 1182020 Vote: Joe Biden 33% (310) 44% (421) 9% (83) 6% (55) 8% (77) 9462020 Vote: Donald Trump 4% (38) 9% (77) 17% (148) 60% (515) 10% (86) 8642020 Vote: Didn’t Vote 14% (21) 16% (25) 11% (17) 25% (38) 35% (53) 1532018 House Vote: Democrat 36% (254) 44% (315) 10% (74) 5% (34) 5% (38) 7152018 House Vote: Republican 6% (40) 13% (91) 16% (115) 57% (405) 9% (65) 7162018 House Vote: Someone else 12% (8) 24% (16) 14% (9) 30% (20) 20% (14) 672016 Vote: Hillary Clinton 36% (242) 45% (307) 9% (60) 4% (30) 6% (40) 6792016 Vote: Donald Trump 6% (45) 12% (87) 17% (126) 57% (429) 9% (67) 7542016 Vote: Other 16% (15) 33% (31) 10% (10) 24% (23) 17% (16) 962016 Vote: Didn’t Vote 15% (68) 23% (108) 13% (61) 29% (135) 21% (96) 468Voted in 2014: Yes 20% (274) 28% (382) 13% (177) 32% (433) 7% (95) 1360Voted in 2014: No 15% (97) 24% (151) 13% (80) 29% (185) 20% (125) 638
Continued on next page

54
Morning ConsultTable POL3_6
Table POL3_6: Do you approve or disapprove of how President Biden is handling each of the following?The environment
DemographicStronglyapprove
Somewhatapprove
Somewhatdisapprove
Stronglydisapprove
Don’t Know /No Opinion Total N
Registered Voters 19% (371) 27% (533) 13% (256) 31% (618) 11% (219) 19984-Region: Northeast 24% (86) 30% (107) 11% (39) 23% (82) 11% (39) 3534-Region: Midwest 16% (71) 27% (121) 16% (71) 31% (140) 9% (41) 4444-Region: South 17% (125) 22% (164) 12% (91) 38% (285) 11% (81) 7464-Region: West 19% (89) 31% (141) 12% (55) 25% (112) 13% (59) 455Party: Democrat/Leans Democrat 35% (307) 42% (373) 9% (80) 7% (61) 7% (63) 883Party: Republican/Leans Republican 6% (48) 12% (98) 16% (136) 56% (470) 11% (89) 841Note: Row proportions may total to larger than one-hundred percent due to rounding. For more information visit MorningConsultIntelligence.com.

National Tracking Poll #2112154, December, 2021
55
Table POL3_7
Table POL3_7: Do you approve or disapprove of how President Biden is handling each of the following?Energy
DemographicStronglyapprove
Somewhatapprove
Somewhatdisapprove
Stronglydisapprove
Don’t Know /No Opinion Total N
Registered Voters 16% (313) 26% (518) 12% (237) 34% (678) 13% (252) 1998Gender: Male 19% (183) 23% (220) 12% (117) 35% (326) 10% (97) 942Gender: Female 12% (130) 28% (298) 11% (120) 33% (352) 15% (156) 1056Age: 18-34 15% (78) 26% (135) 14% (73) 24% (123) 20% (105) 514Age: 35-44 19% (58) 32% (97) 12% (37) 22% (69) 15% (46) 307Age: 45-64 14% (95) 23% (157) 13% (89) 40% (273) 10% (66) 679Age: 65+ 16% (82) 26% (129) 8% (38) 43% (212) 7% (36) 497GenZers: 1997-2012 9% (16) 24% (44) 13% (23) 30% (54) 24% (43) 181Millennials: 1981-1996 21% (112) 29% (155) 13% (72) 20% (109) 16% (86) 534GenXers: 1965-1980 12% (56) 25% (113) 14% (64) 37% (169) 13% (58) 460Baby Boomers: 1946-1964 16% (120) 25% (188) 10% (75) 42% (313) 8% (59) 755PID: Dem (no lean) 32% (243) 44% (332) 9% (72) 6% (49) 8% (63) 759PID: Ind (no lean) 7% (36) 23% (123) 16% (83) 35% (186) 19% (103) 531PID: Rep (no lean) 5% (35) 9% (63) 12% (83) 63% (443) 12% (85) 708PID/Gender: DemMen 40% (132) 40% (133) 9% (28) 6% (21) 4% (14) 328PID/Gender: DemWomen 26% (110) 46% (200) 10% (43) 7% (28) 11% (49) 431PID/Gender: Ind Men 9% (23) 22% (56) 18% (47) 34% (86) 17% (43) 255PID/Gender: Ind Women 5% (13) 24% (67) 13% (36) 36% (100) 22% (60) 276PID/Gender: Rep Men 8% (28) 9% (31) 12% (42) 61% (219) 11% (39) 359PID/Gender: Rep Women 2% (7) 9% (32) 12% (41) 64% (224) 13% (46) 349Ideo: Liberal (1-3) 33% (192) 40% (228) 10% (60) 9% (53) 8% (44) 576Ideo: Moderate (4) 11% (54) 38% (185) 12% (58) 22% (106) 16% (77) 481Ideo: Conservative (5-7) 7% (53) 11% (87) 13% (100) 61% (474) 8% (62) 776Educ: < College 13% (155) 22% (262) 12% (145) 38% (462) 15% (183) 1206Educ: Bachelors degree 19% (96) 30% (151) 13% (67) 28% (139) 10% (48) 501Educ: Post-grad 21% (62) 36% (105) 9% (26) 27% (77) 7% (21) 290Income: Under 50k 13% (115) 25% (214) 12% (107) 32% (279) 18% (154) 868Income: 50k-100k 18% (131) 26% (186) 13% (94) 34% (250) 9% (64) 725Income: 100k+ 16% (67) 29% (118) 9% (37) 37% (149) 8% (34) 405Ethnicity: White 15% (236) 24% (361) 12% (179) 39% (593) 11% (167) 1536Ethnicity: Hispanic 20% (44) 31% (70) 15% (33) 21% (47) 13% (28) 222
Continued on next page

56
Morning ConsultTable POL3_7
Table POL3_7: Do you approve or disapprove of how President Biden is handling each of the following?Energy
DemographicStronglyapprove
Somewhatapprove
Somewhatdisapprove
Stronglydisapprove
Don’t Know /No Opinion Total N
Registered Voters 16% (313) 26% (518) 12% (237) 34% (678) 13% (252) 1998Ethnicity: Black 20% (51) 37% (94) 11% (28) 11% (29) 21% (53) 255Ethnicity: Other 12% (26) 30% (63) 15% (30) 27% (56) 15% (32) 207All Christian 16% (158) 26% (259) 12% (124) 36% (365) 10% (96) 1003All Non-Christian 35% (52) 29% (43) 10% (15) 14% (21) 13% (19) 151Atheist 16% (12) 25% (19) 15% (11) 37% (28) 7% (5) 75Agnostic/Nothing in particular 14% (65) 30% (142) 12% (55) 25% (120) 20% (93) 474Something Else 9% (26) 18% (54) 11% (32) 49% (143) 13% (39) 295Religious Non-Protestant/Catholic 32% (53) 27% (45) 12% (20) 16% (27) 14% (23) 168Evangelical 13% (74) 17% (96) 12% (68) 48% (269) 9% (47) 555Non-Evangelical 15% (107) 30% (211) 12% (83) 32% (232) 11% (81) 715Community: Urban 27% (143) 29% (158) 10% (53) 21% (112) 13% (72) 538Community: Suburban 12% (109) 30% (279) 13% (122) 32% (303) 13% (126) 939Community: Rural 12% (61) 16% (82) 12% (62) 51% (264) 10% (54) 521Employ: Private Sector 16% (111) 29% (196) 13% (90) 31% (212) 11% (77) 687Employ: Government 9% (11) 30% (39) 15% (20) 32% (41) 13% (17) 127Employ: Self-Employed 29% (58) 20% (40) 17% (34) 26% (52) 8% (17) 200Employ: Homemaker 10% (12) 17% (21) 11% (14) 42% (53) 20% (25) 126Employ: Student 9% (5) 39% (23) 16% (10) 19% (11) 18% (11) 61Employ: Retired 15% (80) 25% (132) 9% (49) 42% (219) 8% (40) 520Employ: Unemployed 13% (19) 26% (38) 7% (10) 33% (50) 22% (33) 150Employ: Other 12% (15) 22% (28) 9% (11) 32% (40) 26% (33) 127Military HH: Yes 15% (54) 21% (73) 10% (34) 40% (138) 14% (50) 348Military HH: No 16% (259) 27% (445) 12% (204) 33% (540) 12% (202) 1650RD/WT: Right Direction 35% (259) 44% (331) 7% (55) 3% (21) 10% (78) 743RD/WT: Wrong Track 4% (54) 15% (187) 15% (182) 52% (657) 14% (174) 1255Biden Job Approve 33% (284) 47% (406) 9% (76) 2% (17) 9% (80) 863Biden Job Disapprove 2% (24) 9% (100) 15% (157) 61% (650) 12% (127) 1057
Continued on next page

National Tracking Poll #2112154, December, 2021
57
Table POL3_7
Table POL3_7: Do you approve or disapprove of how President Biden is handling each of the following?Energy
DemographicStronglyapprove
Somewhatapprove
Somewhatdisapprove
Stronglydisapprove
Don’t Know /No Opinion Total N
Registered Voters 16% (313) 26% (518) 12% (237) 34% (678) 13% (252) 1998Biden Job Strongly Approve 56% (237) 32% (137) 3% (13) 1% (5) 8% (32) 424Biden Job Somewhat Approve 11% (47) 61% (269) 14% (63) 3% (11) 11% (48) 438Biden Job Somewhat Disapprove 3% (8) 26% (74) 31% (87) 17% (47) 24% (67) 283Biden Job Strongly Disapprove 2% (16) 3% (26) 9% (69) 78% (603) 8% (60) 774Favorable of Biden 31% (282) 47% (424) 9% (77) 3% (22) 10% (90) 896Unfavorable of Biden 2% (21) 8% (82) 15% (157) 63% (640) 12% (120) 1020Very Favorable of Biden 54% (232) 35% (148) 3% (14) 1% (6) 6% (27) 427Somewhat Favorable of Biden 11% (50) 59% (277) 13% (63) 3% (16) 13% (63) 469Somewhat Unfavorable of Biden 2% (3) 23% (49) 35% (77) 11% (24) 29% (63) 216Very Unfavorable of Biden 2% (18) 4% (34) 10% (81) 77% (615) 7% (57) 804#1 Issue: Economy 12% (104) 21% (178) 12% (103) 41% (353) 14% (121) 858#1 Issue: Security 6% (15) 10% (28) 12% (32) 64% (177) 8% (22) 274#1 Issue: Health Care 26% (59) 37% (85) 15% (34) 10% (22) 12% (27) 227#1 Issue: Medicare / Social Security 22% (43) 31% (61) 11% (21) 26% (50) 11% (21) 196#1 Issue: Women’s Issues 14% (18) 41% (50) 15% (18) 14% (17) 16% (20) 124#1 Issue: Education 22% (17) 39% (31) 7% (5) 19% (15) 14% (11) 80#1 Issue: Energy 27% (33) 41% (49) 11% (13) 12% (15) 9% (11) 121#1 Issue: Other 21% (24) 30% (35) 9% (11) 25% (29) 15% (18) 1182020 Vote: Joe Biden 29% (271) 45% (427) 10% (92) 5% (44) 12% (111) 9462020 Vote: Donald Trump 3% (26) 6% (49) 14% (118) 66% (573) 11% (97) 8642020 Vote: Didn’t Vote 9% (14) 22% (33) 12% (18) 31% (48) 26% (40) 1532018 House Vote: Democrat 30% (217) 47% (336) 9% (62) 5% (39) 9% (62) 7152018 House Vote: Republican 5% (33) 9% (63) 13% (90) 65% (463) 9% (65) 7162018 House Vote: Someone else 4% (3) 26% (17) 22% (15) 34% (23) 14% (9) 672016 Vote: Hillary Clinton 31% (209) 48% (326) 8% (52) 5% (31) 9% (61) 6792016 Vote: Donald Trump 5% (40) 8% (59) 12% (90) 65% (488) 10% (77) 7542016 Vote: Other 12% (12) 30% (28) 16% (16) 25% (24) 17% (16) 962016 Vote: Didn’t Vote 11% (51) 22% (104) 17% (80) 29% (134) 21% (99) 468Voted in 2014: Yes 17% (237) 27% (368) 11% (145) 36% (494) 9% (117) 1360Voted in 2014: No 12% (76) 24% (150) 14% (92) 29% (184) 21% (135) 638
Continued on next page

58
Morning ConsultTable POL3_7
Table POL3_7: Do you approve or disapprove of how President Biden is handling each of the following?Energy
DemographicStronglyapprove
Somewhatapprove
Somewhatdisapprove
Stronglydisapprove
Don’t Know /No Opinion Total N
Registered Voters 16% (313) 26% (518) 12% (237) 34% (678) 13% (252) 19984-Region: Northeast 21% (74) 29% (104) 11% (40) 25% (88) 13% (46) 3534-Region: Midwest 13% (59) 29% (127) 12% (54) 36% (159) 10% (46) 4444-Region: South 14% (103) 20% (148) 11% (86) 42% (315) 13% (95) 7464-Region: West 17% (77) 31% (140) 13% (58) 25% (116) 14% (65) 455Party: Democrat/Leans Democrat 30% (265) 44% (392) 10% (86) 6% (57) 9% (83) 883Party: Republican/Leans Republican 4% (35) 9% (74) 13% (113) 63% (527) 11% (92) 841Note: Row proportions may total to larger than one-hundred percent due to rounding. For more information visit MorningConsultIntelligence.com.

National Tracking Poll #2112154, December, 2021
59
Table POL3_8
Table POL3_8: Do you approve or disapprove of how President Biden is handling each of the following?Education
DemographicStronglyapprove
Somewhatapprove
Somewhatdisapprove
Stronglydisapprove
Don’t Know /No Opinion Total N
Registered Voters 17% (338) 25% (506) 13% (266) 32% (631) 13% (257) 1998Gender: Male 20% (191) 24% (222) 12% (116) 33% (313) 11% (100) 942Gender: Female 14% (147) 27% (284) 14% (150) 30% (317) 15% (157) 1056Age: 18-34 21% (109) 24% (123) 14% (71) 24% (124) 17% (88) 514Age: 35-44 20% (62) 25% (77) 12% (37) 23% (72) 19% (58) 307Age: 45-64 13% (89) 26% (178) 15% (99) 36% (242) 11% (72) 679Age: 65+ 16% (79) 26% (127) 12% (59) 39% (192) 8% (39) 497GenZers: 1997-2012 13% (23) 26% (47) 11% (20) 26% (47) 24% (43) 181Millennials: 1981-1996 26% (140) 24% (126) 13% (70) 22% (119) 15% (78) 534GenXers: 1965-1980 12% (55) 25% (115) 16% (76) 34% (155) 13% (60) 460Baby Boomers: 1946-1964 15% (112) 27% (200) 12% (93) 37% (281) 9% (69) 755PID: Dem (no lean) 34% (258) 41% (309) 10% (79) 6% (42) 9% (72) 759PID: Ind (no lean) 6% (31) 22% (117) 17% (90) 36% (189) 20% (104) 531PID: Rep (no lean) 7% (50) 11% (80) 14% (97) 56% (400) 12% (81) 708PID/Gender: DemMen 42% (138) 37% (122) 8% (28) 7% (22) 6% (19) 328PID/Gender: DemWomen 28% (120) 43% (187) 12% (51) 5% (20) 12% (53) 431PID/Gender: Ind Men 7% (18) 22% (55) 17% (44) 35% (88) 19% (49) 255PID/Gender: Ind Women 5% (13) 22% (62) 16% (45) 37% (101) 20% (56) 276PID/Gender: Rep Men 10% (35) 12% (44) 12% (44) 57% (203) 9% (33) 359PID/Gender: Rep Women 4% (15) 10% (36) 15% (54) 56% (196) 14% (49) 349Ideo: Liberal (1-3) 35% (203) 37% (211) 11% (62) 8% (44) 10% (57) 576Ideo: Moderate (4) 13% (62) 36% (175) 13% (61) 22% (107) 16% (75) 481Ideo: Conservative (5-7) 7% (55) 13% (98) 15% (119) 56% (432) 9% (72) 776Educ: < College 14% (174) 22% (266) 14% (174) 35% (425) 14% (167) 1206Educ: Bachelors degree 21% (103) 28% (140) 12% (62) 26% (132) 13% (64) 501Educ: Post-grad 21% (61) 34% (100) 11% (31) 25% (73) 9% (26) 290Income: Under 50k 16% (141) 25% (215) 13% (109) 31% (268) 16% (136) 868Income: 50k-100k 17% (125) 25% (179) 14% (101) 33% (237) 12% (83) 725Income: 100k+ 18% (73) 27% (111) 14% (57) 31% (126) 9% (38) 405Ethnicity: White 16% (252) 23% (356) 13% (204) 35% (540) 12% (185) 1536Ethnicity: Hispanic 20% (45) 26% (59) 13% (29) 23% (51) 17% (39) 222
Continued on next page

60
Morning ConsultTable POL3_8
Table POL3_8: Do you approve or disapprove of how President Biden is handling each of the following?Education
DemographicStronglyapprove
Somewhatapprove
Somewhatdisapprove
Stronglydisapprove
Don’t Know /No Opinion Total N
Registered Voters 17% (338) 25% (506) 13% (266) 32% (631) 13% (257) 1998Ethnicity: Black 23% (59) 38% (97) 12% (29) 13% (34) 14% (35) 255Ethnicity: Other 13% (27) 25% (53) 16% (33) 27% (57) 18% (38) 207All Christian 17% (173) 25% (248) 14% (142) 33% (336) 10% (104) 1003All Non-Christian 35% (53) 28% (42) 12% (19) 16% (23) 9% (13) 151Atheist 15% (11) 24% (18) 9% (7) 37% (28) 14% (11) 75Agnostic/Nothing in particular 15% (69) 28% (134) 14% (68) 24% (115) 19% (89) 474Something Else 11% (32) 22% (64) 10% (31) 43% (128) 14% (40) 295Religious Non-Protestant/Catholic 33% (55) 25% (43) 13% (23) 19% (31) 10% (17) 168Evangelical 17% (93) 17% (95) 14% (78) 41% (229) 11% (59) 555Non-Evangelical 15% (108) 30% (213) 13% (90) 31% (223) 11% (81) 715Community: Urban 29% (155) 29% (155) 9% (51) 21% (114) 12% (63) 538Community: Suburban 12% (110) 29% (270) 14% (136) 30% (286) 15% (138) 939Community: Rural 14% (74) 15% (80) 15% (80) 44% (231) 11% (57) 521Employ: Private Sector 18% (127) 28% (191) 14% (93) 29% (197) 11% (79) 687Employ: Government 9% (11) 24% (31) 21% (27) 29% (37) 17% (21) 127Employ: Self-Employed 24% (48) 26% (52) 16% (32) 22% (43) 12% (25) 200Employ: Homemaker 13% (16) 14% (18) 14% (17) 41% (51) 19% (23) 126Employ: Student 15% (9) 34% (21) 14% (9) 25% (15) 12% (7) 61Employ: Retired 15% (78) 26% (136) 12% (61) 39% (203) 8% (42) 520Employ: Unemployed 20% (30) 17% (26) 10% (15) 31% (47) 21% (31) 150Employ: Other 15% (19) 24% (31) 10% (13) 29% (37) 22% (28) 127Military HH: Yes 15% (53) 24% (83) 11% (37) 36% (126) 14% (49) 348Military HH: No 17% (286) 26% (422) 14% (230) 31% (505) 13% (208) 1650RD/WT: Right Direction 37% (275) 41% (308) 9% (65) 3% (20) 10% (76) 743RD/WT: Wrong Track 5% (63) 16% (198) 16% (202) 49% (611) 14% (181) 1255Biden Job Approve 34% (295) 45% (385) 10% (89) 1% (13) 9% (82) 863Biden Job Disapprove 4% (38) 10% (108) 17% (175) 57% (605) 12% (131) 1057
Continued on next page

National Tracking Poll #2112154, December, 2021
61
Table POL3_8
Table POL3_8: Do you approve or disapprove of how President Biden is handling each of the following?Education
DemographicStronglyapprove
Somewhatapprove
Somewhatdisapprove
Stronglydisapprove
Don’t Know /No Opinion Total N
Registered Voters 17% (338) 25% (506) 13% (266) 32% (631) 13% (257) 1998Biden Job Strongly Approve 60% (253) 26% (110) 5% (23) 1% (4) 8% (35) 424Biden Job Somewhat Approve 10% (42) 63% (274) 15% (66) 2% (9) 11% (47) 438Biden Job Somewhat Disapprove 8% (23) 23% (65) 32% (90) 17% (47) 21% (58) 283Biden Job Strongly Disapprove 2% (14) 6% (43) 11% (85) 72% (558) 9% (73) 774Favorable of Biden 34% (304) 45% (405) 9% (85) 2% (20) 9% (82) 896Unfavorable of Biden 2% (19) 9% (93) 17% (174) 59% (599) 13% (135) 1020Very Favorable of Biden 56% (237) 30% (127) 6% (24) 2% (8) 7% (32) 427Somewhat Favorable of Biden 14% (66) 59% (278) 13% (61) 3% (12) 11% (51) 469Somewhat Unfavorable of Biden 2% (4) 21% (46) 33% (71) 15% (32) 30% (65) 216Very Unfavorable of Biden 2% (16) 6% (47) 13% (104) 71% (567) 9% (70) 804#1 Issue: Economy 15% (125) 21% (181) 15% (131) 36% (311) 13% (110) 858#1 Issue: Security 7% (20) 12% (33) 10% (29) 61% (167) 9% (26) 274#1 Issue: Health Care 25% (58) 34% (77) 13% (30) 12% (28) 15% (35) 227#1 Issue: Medicare / Social Security 18% (35) 36% (70) 12% (23) 24% (46) 11% (22) 196#1 Issue: Women’s Issues 20% (24) 37% (45) 14% (17) 11% (14) 18% (22) 124#1 Issue: Education 27% (21) 27% (22) 12% (10) 23% (18) 11% (9) 80#1 Issue: Energy 28% (34) 35% (42) 15% (18) 11% (13) 11% (14) 121#1 Issue: Other 17% (20) 30% (36) 8% (9) 28% (33) 17% (20) 1182020 Vote: Joe Biden 29% (270) 43% (409) 11% (105) 5% (52) 12% (109) 9462020 Vote: Donald Trump 5% (44) 7% (64) 15% (133) 60% (520) 12% (103) 8642020 Vote: Didn’t Vote 14% (22) 16% (24) 14% (22) 31% (48) 24% (37) 1532018 House Vote: Democrat 30% (216) 43% (304) 11% (78) 6% (45) 10% (72) 7152018 House Vote: Republican 6% (42) 11% (78) 16% (117) 57% (407) 10% (72) 7162018 House Vote: Someone else 5% (3) 25% (17) 11% (7) 41% (27) 18% (12) 672016 Vote: Hillary Clinton 31% (209) 44% (299) 9% (64) 6% (38) 10% (69) 6792016 Vote: Donald Trump 7% (51) 9% (68) 16% (123) 57% (430) 11% (82) 7542016 Vote: Other 12% (11) 24% (23) 18% (17) 27% (26) 20% (19) 962016 Vote: Didn’t Vote 14% (68) 24% (114) 13% (63) 29% (135) 19% (88) 468Voted in 2014: Yes 18% (244) 26% (356) 14% (186) 33% (446) 9% (129) 1360Voted in 2014: No 15% (95) 24% (150) 13% (80) 29% (184) 20% (129) 638
Continued on next page

62
Morning ConsultTable POL3_8
Table POL3_8: Do you approve or disapprove of how President Biden is handling each of the following?Education
DemographicStronglyapprove
Somewhatapprove
Somewhatdisapprove
Stronglydisapprove
Don’t Know /No Opinion Total N
Registered Voters 17% (338) 25% (506) 13% (266) 32% (631) 13% (257) 19984-Region: Northeast 23% (82) 25% (87) 13% (45) 26% (92) 13% (47) 3534-Region: Midwest 14% (62) 27% (119) 15% (65) 32% (144) 12% (54) 4444-Region: South 15% (112) 23% (174) 12% (88) 38% (283) 12% (89) 7464-Region: West 18% (84) 27% (125) 15% (68) 25% (112) 15% (67) 455Party: Democrat/Leans Democrat 31% (278) 41% (361) 11% (97) 6% (52) 11% (95) 883Party: Republican/Leans Republican 6% (51) 11% (90) 16% (132) 57% (476) 11% (93) 841Note: Row proportions may total to larger than one-hundred percent due to rounding. For more information visit MorningConsultIntelligence.com.

National Tracking Poll #2112154, December, 2021
63
Table POL3_9
Table POL3_9: Do you approve or disapprove of how President Biden is handling each of the following?National security
DemographicStronglyapprove
Somewhatapprove
Somewhatdisapprove
Stronglydisapprove
Don’t Know /No Opinion Total N
Registered Voters 17% (337) 25% (492) 12% (242) 36% (719) 10% (207) 1998Gender: Male 19% (183) 23% (220) 11% (108) 37% (350) 9% (80) 942Gender: Female 15% (154) 26% (272) 13% (134) 35% (369) 12% (126) 1056Age: 18-34 19% (95) 22% (114) 15% (77) 26% (133) 18% (94) 514Age: 35-44 21% (64) 29% (91) 10% (31) 27% (84) 12% (38) 307Age: 45-64 13% (91) 24% (166) 12% (83) 42% (289) 7% (51) 679Age: 65+ 18% (88) 24% (122) 10% (51) 43% (214) 5% (24) 497GenZers: 1997-2012 12% (22) 20% (37) 16% (28) 28% (50) 24% (44) 181Millennials: 1981-1996 23% (122) 26% (140) 13% (67) 24% (127) 14% (77) 534GenXers: 1965-1980 14% (64) 24% (110) 14% (63) 40% (186) 8% (37) 460Baby Boomers: 1946-1964 16% (117) 25% (189) 11% (80) 43% (321) 6% (48) 755PID: Dem (no lean) 35% (263) 42% (320) 8% (64) 5% (41) 9% (71) 759PID: Ind (no lean) 6% (32) 23% (122) 17% (92) 37% (196) 17% (88) 531PID: Rep (no lean) 6% (42) 7% (50) 12% (85) 68% (482) 7% (48) 708PID/Gender: DemMen 40% (133) 39% (127) 8% (26) 6% (21) 6% (21) 328PID/Gender: DemWomen 30% (130) 45% (193) 9% (38) 5% (20) 12% (50) 431PID/Gender: Ind Men 7% (17) 23% (59) 18% (46) 37% (93) 16% (40) 255PID/Gender: Ind Women 5% (15) 23% (63) 17% (47) 37% (103) 18% (48) 276PID/Gender: Rep Men 9% (33) 9% (33) 10% (36) 66% (236) 6% (20) 359PID/Gender: Rep Women 3% (9) 5% (17) 14% (50) 70% (246) 8% (28) 349Ideo: Liberal (1-3) 36% (205) 38% (218) 9% (54) 8% (44) 10% (55) 576Ideo: Moderate (4) 13% (61) 40% (190) 14% (67) 23% (113) 10% (49) 481Ideo: Conservative (5-7) 6% (49) 8% (66) 13% (103) 67% (518) 5% (41) 776Educ: < College 15% (185) 20% (244) 13% (155) 39% (475) 12% (149) 1206Educ: Bachelors degree 18% (88) 30% (151) 12% (60) 32% (161) 8% (42) 501Educ: Post-grad 22% (65) 34% (98) 9% (28) 29% (84) 6% (16) 290Income: Under 50k 16% (137) 25% (213) 10% (87) 34% (295) 16% (135) 868Income: 50k-100k 18% (134) 24% (173) 14% (100) 37% (269) 7% (48) 725Income: 100k+ 16% (66) 26% (106) 13% (54) 38% (155) 6% (24) 405Ethnicity: White 16% (252) 23% (358) 11% (175) 41% (629) 8% (122) 1536Ethnicity: Hispanic 20% (45) 29% (64) 14% (32) 23% (51) 14% (31) 222
Continued on next page
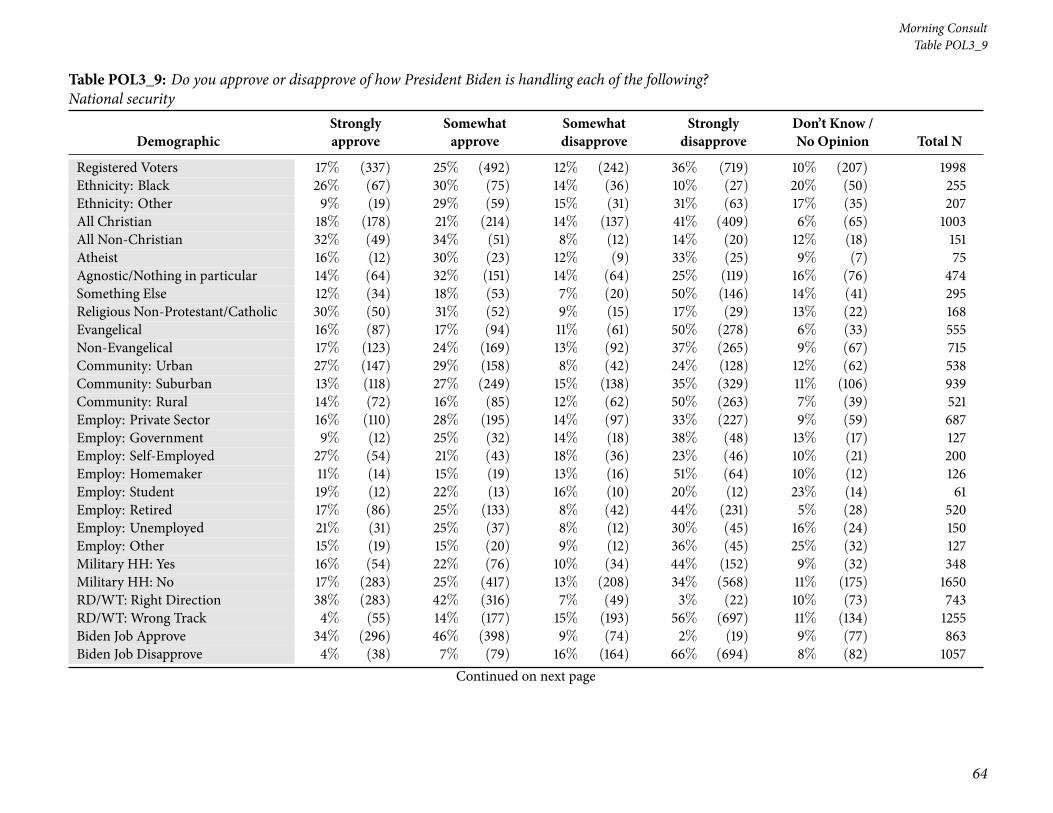
64
Morning ConsultTable POL3_9
Table POL3_9: Do you approve or disapprove of how President Biden is handling each of the following?National security
DemographicStronglyapprove
Somewhatapprove
Somewhatdisapprove
Stronglydisapprove
Don’t Know /No Opinion Total N
Registered Voters 17% (337) 25% (492) 12% (242) 36% (719) 10% (207) 1998Ethnicity: Black 26% (67) 30% (75) 14% (36) 10% (27) 20% (50) 255Ethnicity: Other 9% (19) 29% (59) 15% (31) 31% (63) 17% (35) 207All Christian 18% (178) 21% (214) 14% (137) 41% (409) 6% (65) 1003All Non-Christian 32% (49) 34% (51) 8% (12) 14% (20) 12% (18) 151Atheist 16% (12) 30% (23) 12% (9) 33% (25) 9% (7) 75Agnostic/Nothing in particular 14% (64) 32% (151) 14% (64) 25% (119) 16% (76) 474Something Else 12% (34) 18% (53) 7% (20) 50% (146) 14% (41) 295Religious Non-Protestant/Catholic 30% (50) 31% (52) 9% (15) 17% (29) 13% (22) 168Evangelical 16% (87) 17% (94) 11% (61) 50% (278) 6% (33) 555Non-Evangelical 17% (123) 24% (169) 13% (92) 37% (265) 9% (67) 715Community: Urban 27% (147) 29% (158) 8% (42) 24% (128) 12% (62) 538Community: Suburban 13% (118) 27% (249) 15% (138) 35% (329) 11% (106) 939Community: Rural 14% (72) 16% (85) 12% (62) 50% (263) 7% (39) 521Employ: Private Sector 16% (110) 28% (195) 14% (97) 33% (227) 9% (59) 687Employ: Government 9% (12) 25% (32) 14% (18) 38% (48) 13% (17) 127Employ: Self-Employed 27% (54) 21% (43) 18% (36) 23% (46) 10% (21) 200Employ: Homemaker 11% (14) 15% (19) 13% (16) 51% (64) 10% (12) 126Employ: Student 19% (12) 22% (13) 16% (10) 20% (12) 23% (14) 61Employ: Retired 17% (86) 25% (133) 8% (42) 44% (231) 5% (28) 520Employ: Unemployed 21% (31) 25% (37) 8% (12) 30% (45) 16% (24) 150Employ: Other 15% (19) 15% (20) 9% (12) 36% (45) 25% (32) 127Military HH: Yes 16% (54) 22% (76) 10% (34) 44% (152) 9% (32) 348Military HH: No 17% (283) 25% (417) 13% (208) 34% (568) 11% (175) 1650RD/WT: Right Direction 38% (283) 42% (316) 7% (49) 3% (22) 10% (73) 743RD/WT: Wrong Track 4% (55) 14% (177) 15% (193) 56% (697) 11% (134) 1255Biden Job Approve 34% (296) 46% (398) 9% (74) 2% (19) 9% (77) 863Biden Job Disapprove 4% (38) 7% (79) 16% (164) 66% (694) 8% (82) 1057
Continued on next page
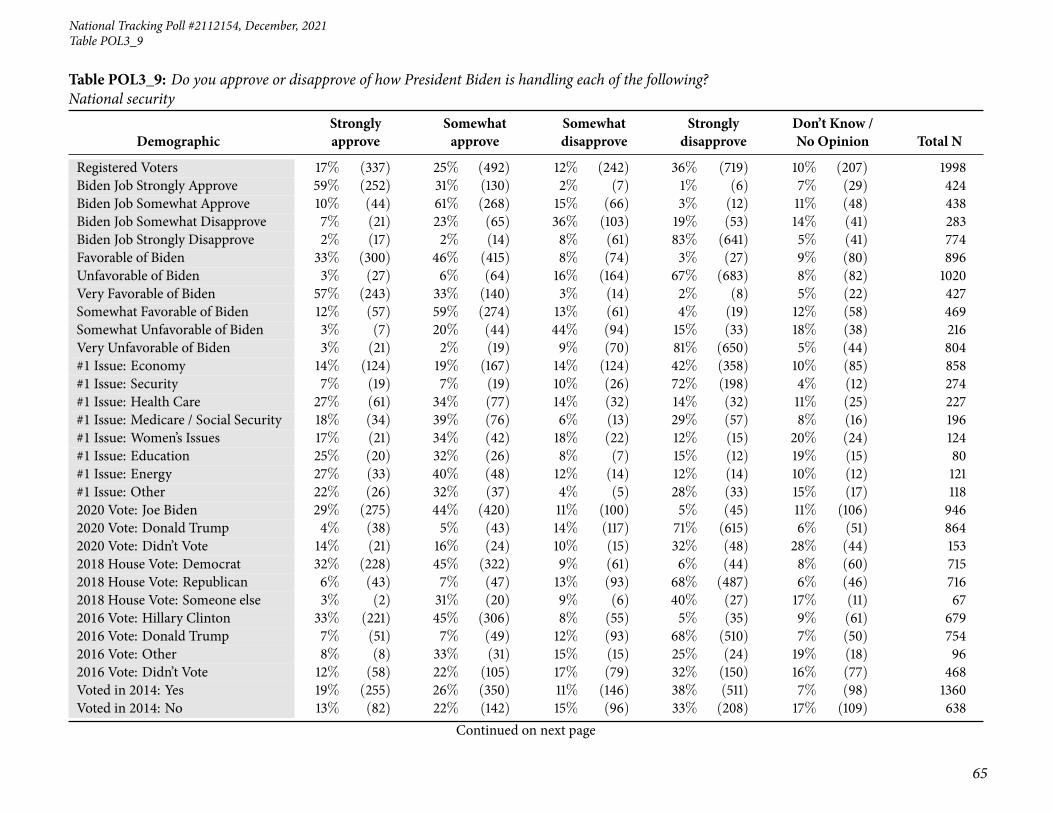
National Tracking Poll #2112154, December, 2021
65
Table POL3_9
Table POL3_9: Do you approve or disapprove of how President Biden is handling each of the following?National security
DemographicStronglyapprove
Somewhatapprove
Somewhatdisapprove
Stronglydisapprove
Don’t Know /No Opinion Total N
Registered Voters 17% (337) 25% (492) 12% (242) 36% (719) 10% (207) 1998Biden Job Strongly Approve 59% (252) 31% (130) 2% (7) 1% (6) 7% (29) 424Biden Job Somewhat Approve 10% (44) 61% (268) 15% (66) 3% (12) 11% (48) 438Biden Job Somewhat Disapprove 7% (21) 23% (65) 36% (103) 19% (53) 14% (41) 283Biden Job Strongly Disapprove 2% (17) 2% (14) 8% (61) 83% (641) 5% (41) 774Favorable of Biden 33% (300) 46% (415) 8% (74) 3% (27) 9% (80) 896Unfavorable of Biden 3% (27) 6% (64) 16% (164) 67% (683) 8% (82) 1020Very Favorable of Biden 57% (243) 33% (140) 3% (14) 2% (8) 5% (22) 427Somewhat Favorable of Biden 12% (57) 59% (274) 13% (61) 4% (19) 12% (58) 469Somewhat Unfavorable of Biden 3% (7) 20% (44) 44% (94) 15% (33) 18% (38) 216Very Unfavorable of Biden 3% (21) 2% (19) 9% (70) 81% (650) 5% (44) 804#1 Issue: Economy 14% (124) 19% (167) 14% (124) 42% (358) 10% (85) 858#1 Issue: Security 7% (19) 7% (19) 10% (26) 72% (198) 4% (12) 274#1 Issue: Health Care 27% (61) 34% (77) 14% (32) 14% (32) 11% (25) 227#1 Issue: Medicare / Social Security 18% (34) 39% (76) 6% (13) 29% (57) 8% (16) 196#1 Issue: Women’s Issues 17% (21) 34% (42) 18% (22) 12% (15) 20% (24) 124#1 Issue: Education 25% (20) 32% (26) 8% (7) 15% (12) 19% (15) 80#1 Issue: Energy 27% (33) 40% (48) 12% (14) 12% (14) 10% (12) 121#1 Issue: Other 22% (26) 32% (37) 4% (5) 28% (33) 15% (17) 1182020 Vote: Joe Biden 29% (275) 44% (420) 11% (100) 5% (45) 11% (106) 9462020 Vote: Donald Trump 4% (38) 5% (43) 14% (117) 71% (615) 6% (51) 8642020 Vote: Didn’t Vote 14% (21) 16% (24) 10% (15) 32% (48) 28% (44) 1532018 House Vote: Democrat 32% (228) 45% (322) 9% (61) 6% (44) 8% (60) 7152018 House Vote: Republican 6% (43) 7% (47) 13% (93) 68% (487) 6% (46) 7162018 House Vote: Someone else 3% (2) 31% (20) 9% (6) 40% (27) 17% (11) 672016 Vote: Hillary Clinton 33% (221) 45% (306) 8% (55) 5% (35) 9% (61) 6792016 Vote: Donald Trump 7% (51) 7% (49) 12% (93) 68% (510) 7% (50) 7542016 Vote: Other 8% (8) 33% (31) 15% (15) 25% (24) 19% (18) 962016 Vote: Didn’t Vote 12% (58) 22% (105) 17% (79) 32% (150) 16% (77) 468Voted in 2014: Yes 19% (255) 26% (350) 11% (146) 38% (511) 7% (98) 1360Voted in 2014: No 13% (82) 22% (142) 15% (96) 33% (208) 17% (109) 638
Continued on next page

66
Morning ConsultTable POL3_9
Table POL3_9: Do you approve or disapprove of how President Biden is handling each of the following?National security
DemographicStronglyapprove
Somewhatapprove
Somewhatdisapprove
Stronglydisapprove
Don’t Know /No Opinion Total N
Registered Voters 17% (337) 25% (492) 12% (242) 36% (719) 10% (207) 19984-Region: Northeast 22% (79) 26% (91) 11% (39) 27% (97) 13% (47) 3534-Region: Midwest 14% (61) 25% (113) 13% (60) 40% (176) 8% (36) 4444-Region: South 16% (118) 20% (147) 12% (87) 44% (325) 9% (68) 7464-Region: West 17% (79) 31% (141) 12% (57) 27% (122) 12% (56) 455Party: Democrat/Leans Democrat 32% (285) 43% (379) 9% (80) 5% (47) 10% (92) 883Party: Republican/Leans Republican 5% (43) 7% (58) 14% (114) 68% (574) 6% (53) 841Note: Row proportions may total to larger than one-hundred percent due to rounding. For more information visit MorningConsultIntelligence.com.

National Tracking Poll #2112154, December, 2021
67
Table POL3_10
Table POL3_10: Do you approve or disapprove of how President Biden is handling each of the following?Gun policy
DemographicStronglyapprove
Somewhatapprove
Somewhatdisapprove
Stronglydisapprove
Don’t Know /No Opinion Total N
Registered Voters 13% (258) 19% (384) 16% (314) 38% (769) 14% (273) 1998Gender: Male 16% (147) 18% (169) 13% (127) 41% (387) 12% (111) 942Gender: Female 10% (111) 20% (214) 18% (188) 36% (381) 15% (162) 1056Age: 18-34 13% (68) 20% (100) 16% (82) 30% (157) 21% (108) 514Age: 35-44 18% (55) 20% (60) 18% (56) 31% (96) 13% (40) 307Age: 45-64 11% (76) 18% (120) 15% (105) 45% (306) 11% (72) 679Age: 65+ 12% (59) 21% (103) 14% (72) 42% (210) 11% (54) 497GenZers: 1997-2012 8% (15) 16% (29) 18% (32) 30% (53) 29% (52) 181Millennials: 1981-1996 18% (97) 21% (114) 17% (92) 29% (152) 15% (78) 534GenXers: 1965-1980 10% (48) 18% (84) 14% (64) 46% (211) 12% (54) 460Baby Boomers: 1946-1964 12% (92) 19% (142) 16% (121) 43% (321) 11% (80) 755PID: Dem (no lean) 25% (192) 35% (267) 17% (127) 11% (84) 12% (90) 759PID: Ind (no lean) 6% (30) 16% (84) 20% (107) 40% (211) 19% (99) 531PID: Rep (no lean) 5% (36) 5% (33) 11% (81) 67% (474) 12% (84) 708PID/Gender: DemMen 31% (103) 35% (116) 13% (41) 11% (35) 10% (33) 328PID/Gender: DemWomen 21% (89) 35% (151) 20% (85) 11% (49) 13% (57) 431PID/Gender: Ind Men 6% (14) 13% (34) 20% (50) 44% (112) 17% (44) 255PID/Gender: Ind Women 6% (16) 18% (50) 21% (57) 36% (98) 20% (55) 276PID/Gender: Rep Men 8% (30) 5% (19) 10% (35) 67% (240) 10% (35) 359PID/Gender: Rep Women 2% (6) 4% (14) 13% (46) 67% (233) 14% (50) 349Ideo: Liberal (1-3) 27% (157) 33% (188) 18% (102) 12% (69) 10% (59) 576Ideo: Moderate (4) 9% (44) 26% (123) 19% (93) 29% (140) 17% (81) 481Ideo: Conservative (5-7) 5% (41) 9% (67) 13% (103) 64% (497) 9% (68) 776Educ: < College 10% (126) 15% (183) 16% (190) 43% (523) 15% (184) 1206Educ: Bachelors degree 16% (79) 23% (116) 16% (79) 32% (163) 13% (64) 501Educ: Post-grad 18% (53) 29% (85) 15% (45) 29% (83) 8% (24) 290Income: Under 50k 11% (94) 19% (161) 15% (131) 38% (331) 17% (151) 868Income: 50k-100k 14% (101) 19% (136) 16% (118) 40% (288) 11% (81) 725Income: 100k+ 15% (63) 21% (86) 16% (66) 37% (149) 10% (41) 405Ethnicity: White 13% (196) 18% (270) 15% (229) 43% (654) 12% (186) 1536Ethnicity: Hispanic 15% (34) 24% (54) 15% (34) 26% (58) 19% (42) 222
Continued on next page

68
Morning ConsultTable POL3_10
Table POL3_10: Do you approve or disapprove of how President Biden is handling each of the following?Gun policy
DemographicStronglyapprove
Somewhatapprove
Somewhatdisapprove
Stronglydisapprove
Don’t Know /No Opinion Total N
Registered Voters 13% (258) 19% (384) 16% (314) 38% (769) 14% (273) 1998Ethnicity: Black 15% (37) 30% (78) 18% (45) 21% (54) 16% (41) 255Ethnicity: Other 12% (25) 17% (36) 20% (41) 29% (60) 22% (45) 207All Christian 13% (135) 20% (205) 16% (162) 40% (405) 10% (96) 1003All Non-Christian 27% (41) 25% (37) 16% (24) 17% (25) 16% (24) 151Atheist 9% (7) 17% (13) 25% (19) 37% (28) 12% (9) 75Agnostic/Nothing in particular 11% (54) 19% (89) 16% (77) 33% (155) 21% (100) 474Something Else 7% (21) 14% (40) 11% (33) 53% (156) 15% (45) 295Religious Non-Protestant/Catholic 26% (43) 23% (38) 17% (28) 19% (32) 16% (27) 168Evangelical 12% (67) 13% (74) 14% (79) 51% (284) 9% (51) 555Non-Evangelical 12% (86) 23% (167) 16% (111) 37% (266) 12% (85) 715Community: Urban 23% (124) 24% (128) 15% (79) 25% (132) 14% (74) 538Community: Suburban 9% (82) 21% (196) 17% (160) 37% (350) 16% (151) 939Community: Rural 10% (52) 11% (59) 15% (76) 55% (286) 9% (48) 521Employ: Private Sector 14% (93) 22% (151) 16% (111) 36% (249) 12% (83) 687Employ: Government 10% (13) 15% (19) 20% (25) 37% (47) 18% (23) 127Employ: Self-Employed 22% (44) 20% (40) 21% (43) 27% (54) 10% (20) 200Employ: Homemaker 8% (10) 11% (14) 14% (18) 47% (59) 20% (25) 126Employ: Student 14% (8) 31% (19) 17% (10) 26% (16) 13% (8) 61Employ: Retired 12% (63) 18% (95) 16% (82) 43% (225) 11% (56) 520Employ: Unemployed 10% (14) 19% (28) 10% (15) 41% (61) 21% (31) 150Employ: Other 10% (13) 15% (18) 9% (12) 46% (58) 21% (27) 127Military HH: Yes 10% (36) 21% (74) 12% (43) 42% (145) 14% (50) 348Military HH: No 13% (222) 19% (309) 16% (272) 38% (624) 14% (223) 1650RD/WT: Right Direction 29% (216) 36% (269) 16% (118) 6% (47) 12% (93) 743RD/WT: Wrong Track 3% (42) 9% (114) 16% (197) 57% (721) 14% (180) 1255Biden Job Approve 27% (235) 37% (322) 17% (149) 6% (54) 12% (103) 863Biden Job Disapprove 2% (21) 5% (55) 14% (153) 67% (710) 11% (118) 1057
Continued on next page

National Tracking Poll #2112154, December, 2021
69
Table POL3_10
Table POL3_10: Do you approve or disapprove of how President Biden is handling each of the following?Gun policy
DemographicStronglyapprove
Somewhatapprove
Somewhatdisapprove
Stronglydisapprove
Don’t Know /No Opinion Total N
Registered Voters 13% (258) 19% (384) 16% (314) 38% (769) 14% (273) 1998Biden Job Strongly Approve 45% (191) 31% (131) 11% (46) 5% (21) 8% (35) 424Biden Job Somewhat Approve 10% (44) 43% (190) 24% (103) 8% (33) 15% (68) 438Biden Job Somewhat Disapprove 3% (8) 15% (43) 29% (82) 31% (88) 22% (62) 283Biden Job Strongly Disapprove 2% (13) 2% (12) 9% (70) 80% (622) 7% (56) 774Favorable of Biden 26% (231) 37% (333) 18% (157) 8% (67) 12% (108) 896Unfavorable of Biden 2% (18) 5% (48) 15% (151) 67% (685) 12% (118) 1020Very Favorable of Biden 43% (186) 32% (137) 12% (52) 5% (20) 8% (33) 427Somewhat Favorable of Biden 10% (45) 42% (195) 23% (106) 10% (48) 16% (75) 469Somewhat Unfavorable of Biden 1% (1) 17% (36) 33% (72) 24% (51) 26% (56) 216Very Unfavorable of Biden 2% (16) 1% (12) 10% (79) 79% (634) 8% (62) 804#1 Issue: Economy 10% (86) 16% (134) 16% (135) 46% (396) 13% (108) 858#1 Issue: Security 5% (15) 6% (18) 12% (33) 68% (185) 9% (23) 274#1 Issue: Health Care 22% (49) 31% (71) 18% (41) 14% (31) 15% (35) 227#1 Issue: Medicare / Social Security 14% (27) 27% (53) 14% (27) 29% (58) 16% (32) 196#1 Issue: Women’s Issues 18% (22) 29% (36) 23% (28) 12% (15) 17% (21) 124#1 Issue: Education 16% (13) 24% (19) 19% (15) 22% (18) 19% (15) 80#1 Issue: Energy 26% (31) 25% (30) 16% (19) 21% (26) 13% (15) 121#1 Issue: Other 13% (15) 20% (23) 14% (16) 34% (40) 20% (23) 1182020 Vote: Joe Biden 23% (214) 35% (333) 18% (175) 10% (94) 14% (131) 9462020 Vote: Donald Trump 4% (31) 3% (28) 12% (104) 71% (615) 10% (86) 8642020 Vote: Didn’t Vote 8% (12) 11% (17) 17% (26) 32% (49) 32% (50) 1532018 House Vote: Democrat 24% (173) 36% (258) 19% (134) 10% (72) 11% (77) 7152018 House Vote: Republican 4% (31) 6% (42) 13% (95) 68% (486) 9% (62) 7162018 House Vote: Someone else 5% (3) 15% (10) 10% (7) 40% (27) 30% (20) 672016 Vote: Hillary Clinton 24% (166) 38% (255) 18% (119) 9% (59) 12% (79) 6792016 Vote: Donald Trump 5% (36) 5% (40) 13% (100) 67% (504) 10% (73) 7542016 Vote: Other 11% (10) 16% (15) 19% (18) 39% (38) 15% (14) 962016 Vote: Didn’t Vote 10% (46) 16% (73) 16% (76) 36% (167) 23% (106) 468Voted in 2014: Yes 14% (196) 20% (268) 16% (215) 40% (548) 10% (132) 1360Voted in 2014: No 10% (62) 18% (115) 16% (99) 35% (220) 22% (141) 638
Continued on next page

70
Morning ConsultTable POL3_10
Table POL3_10: Do you approve or disapprove of how President Biden is handling each of the following?Gun policy
DemographicStronglyapprove
Somewhatapprove
Somewhatdisapprove
Stronglydisapprove
Don’t Know /No Opinion Total N
Registered Voters 13% (258) 19% (384) 16% (314) 38% (769) 14% (273) 19984-Region: Northeast 19% (66) 22% (78) 16% (58) 30% (105) 13% (46) 3534-Region: Midwest 12% (52) 18% (80) 17% (74) 42% (187) 12% (51) 4444-Region: South 11% (78) 17% (128) 13% (96) 47% (347) 13% (96) 7464-Region: West 14% (62) 21% (98) 19% (86) 28% (129) 18% (80) 455Party: Democrat/Leans Democrat 24% (211) 34% (302) 18% (160) 11% (98) 13% (111) 883Party: Republican/Leans Republican 4% (36) 5% (39) 13% (111) 67% (565) 11% (90) 841Note: Row proportions may total to larger than one-hundred percent due to rounding. For more information visit MorningConsultIntelligence.com.

National Tracking Poll #2112154, December, 2021
71
Table POL3_11
Table POL3_11: Do you approve or disapprove of how President Biden is handling each of the following?Protecting Medicare and Social Security
DemographicStronglyapprove
Somewhatapprove
Somewhatdisapprove
Stronglydisapprove
Don’t Know /No Opinion Total N
Registered Voters 17% (345) 26% (512) 13% (268) 29% (587) 14% (286) 1998Gender: Male 21% (200) 23% (218) 14% (132) 29% (277) 12% (116) 942Gender: Female 14% (145) 28% (295) 13% (136) 29% (310) 16% (170) 1056Age: 18-34 18% (94) 25% (129) 13% (65) 23% (119) 21% (107) 514Age: 35-44 19% (58) 29% (90) 13% (38) 21% (65) 18% (56) 307Age: 45-64 15% (104) 23% (160) 14% (96) 35% (238) 12% (82) 679Age: 65+ 18% (89) 27% (134) 14% (68) 33% (164) 8% (42) 497GenZers: 1997-2012 14% (26) 24% (44) 10% (19) 25% (46) 25% (45) 181Millennials: 1981-1996 22% (116) 28% (148) 13% (67) 20% (109) 17% (93) 534GenXers: 1965-1980 13% (61) 25% (113) 14% (66) 33% (154) 14% (65) 460Baby Boomers: 1946-1964 17% (132) 25% (189) 14% (108) 33% (252) 10% (75) 755PID: Dem (no lean) 34% (261) 41% (308) 9% (66) 6% (44) 10% (79) 759PID: Ind (no lean) 7% (39) 26% (140) 15% (80) 31% (165) 20% (106) 531PID: Rep (no lean) 6% (44) 9% (64) 17% (122) 53% (378) 14% (101) 708PID/Gender: DemMen 45% (147) 34% (112) 9% (30) 7% (22) 5% (17) 328PID/Gender: DemWomen 27% (115) 46% (196) 8% (36) 5% (21) 14% (62) 431PID/Gender: Ind Men 9% (24) 26% (65) 16% (41) 32% (81) 17% (44) 255PID/Gender: Ind Women 5% (15) 27% (75) 14% (39) 31% (84) 22% (62) 276PID/Gender: Rep Men 8% (28) 11% (41) 17% (62) 48% (173) 15% (55) 359PID/Gender: Rep Women 4% (15) 7% (23) 17% (60) 59% (205) 13% (46) 349Ideo: Liberal (1-3) 36% (209) 36% (210) 10% (57) 8% (45) 10% (56) 576Ideo: Moderate (4) 13% (60) 37% (178) 13% (64) 21% (100) 16% (79) 481Ideo: Conservative (5-7) 8% (58) 13% (100) 17% (134) 51% (397) 11% (88) 776Educ: < College 14% (171) 23% (273) 14% (168) 34% (406) 16% (188) 1206Educ: Bachelors degree 22% (111) 28% (140) 13% (65) 24% (119) 13% (66) 501Educ: Post-grad 22% (63) 34% (99) 12% (35) 21% (61) 11% (32) 290Income: Under 50k 16% (137) 26% (227) 11% (94) 28% (244) 19% (167) 868Income: 50k-100k 19% (137) 24% (173) 15% (110) 32% (234) 10% (71) 725Income: 100k+ 18% (71) 28% (113) 16% (64) 27% (109) 12% (48) 405Ethnicity: White 17% (257) 24% (363) 13% (207) 33% (513) 13% (195) 1536Ethnicity: Hispanic 23% (52) 28% (63) 13% (30) 19% (42) 16% (36) 222
Continued on next page

72
Morning ConsultTable POL3_11
Table POL3_11: Do you approve or disapprove of how President Biden is handling each of the following?Protecting Medicare and Social Security
DemographicStronglyapprove
Somewhatapprove
Somewhatdisapprove
Stronglydisapprove
Don’t Know /No Opinion Total N
Registered Voters 17% (345) 26% (512) 13% (268) 29% (587) 14% (286) 1998Ethnicity: Black 20% (52) 37% (93) 11% (28) 11% (27) 21% (54) 255Ethnicity: Other 17% (36) 27% (56) 16% (33) 22% (46) 17% (36) 207All Christian 17% (168) 25% (255) 16% (159) 31% (306) 11% (115) 1003All Non-Christian 35% (53) 31% (47) 9% (14) 14% (20) 11% (17) 151Atheist 21% (16) 28% (21) 6% (5) 34% (25) 11% (9) 75Agnostic/Nothing in particular 17% (79) 28% (132) 12% (55) 24% (114) 20% (95) 474Something Else 10% (29) 20% (58) 12% (36) 41% (121) 17% (51) 295Religious Non-Protestant/Catholic 32% (54) 30% (50) 10% (17) 16% (27) 12% (20) 168Evangelical 16% (86) 16% (91) 16% (90) 40% (223) 12% (64) 555Non-Evangelical 15% (108) 30% (212) 14% (102) 27% (196) 14% (97) 715Community: Urban 28% (152) 28% (151) 9% (47) 20% (107) 15% (82) 538Community: Suburban 14% (131) 28% (265) 15% (140) 28% (261) 15% (142) 939Community: Rural 12% (62) 19% (97) 16% (81) 42% (219) 12% (62) 521Employ: Private Sector 17% (120) 28% (193) 14% (99) 27% (185) 13% (91) 687Employ: Government 9% (11) 31% (39) 12% (15) 30% (38) 18% (23) 127Employ: Self-Employed 29% (59) 22% (45) 16% (32) 23% (45) 10% (20) 200Employ: Homemaker 11% (14) 12% (15) 18% (22) 38% (48) 21% (27) 126Employ: Student 13% (8) 35% (21) 18% (11) 18% (11) 16% (10) 61Employ: Retired 17% (88) 26% (136) 13% (67) 35% (181) 9% (48) 520Employ: Unemployed 18% (27) 20% (30) 12% (18) 24% (36) 25% (38) 150Employ: Other 14% (17) 27% (34) 3% (4) 33% (42) 24% (30) 127Military HH: Yes 17% (59) 21% (72) 13% (45) 34% (119) 15% (53) 348Military HH: No 17% (286) 27% (440) 14% (224) 28% (468) 14% (232) 1650RD/WT: Right Direction 38% (282) 42% (310) 7% (55) 3% (23) 10% (73) 743RD/WT: Wrong Track 5% (63) 16% (202) 17% (213) 45% (564) 17% (213) 1255Biden Job Approve 35% (304) 45% (392) 8% (68) 2% (20) 9% (79) 863Biden Job Disapprove 3% (31) 10% (106) 19% (196) 53% (563) 15% (160) 1057
Continued on next page

National Tracking Poll #2112154, December, 2021
73
Table POL3_11
Table POL3_11: Do you approve or disapprove of how President Biden is handling each of the following?Protecting Medicare and Social Security
DemographicStronglyapprove
Somewhatapprove
Somewhatdisapprove
Stronglydisapprove
Don’t Know /No Opinion Total N
Registered Voters 17% (345) 26% (512) 13% (268) 29% (587) 14% (286) 1998Biden Job Strongly Approve 57% (242) 32% (138) 3% (13) 1% (6) 6% (26) 424Biden Job Somewhat Approve 14% (62) 58% (254) 12% (54) 3% (14) 12% (53) 438Biden Job Somewhat Disapprove 4% (12) 22% (64) 33% (93) 15% (44) 25% (71) 283Biden Job Strongly Disapprove 2% (19) 5% (42) 13% (103) 67% (520) 12% (89) 774Favorable of Biden 33% (299) 47% (418) 8% (70) 2% (20) 10% (90) 896Unfavorable of Biden 3% (26) 9% (90) 19% (191) 55% (557) 15% (156) 1020Very Favorable of Biden 55% (234) 34% (145) 4% (16) 1% (5) 6% (26) 427Somewhat Favorable of Biden 14% (64) 58% (272) 12% (54) 3% (15) 14% (64) 469Somewhat Unfavorable of Biden 2% (3) 20% (43) 35% (75) 14% (30) 30% (64) 216Very Unfavorable of Biden 3% (23) 6% (47) 14% (116) 66% (527) 11% (91) 804#1 Issue: Economy 13% (111) 23% (195) 15% (131) 33% (285) 16% (136) 858#1 Issue: Security 6% (15) 12% (33) 17% (46) 57% (156) 9% (24) 274#1 Issue: Health Care 29% (67) 34% (76) 13% (30) 11% (25) 13% (29) 227#1 Issue: Medicare / Social Security 21% (41) 33% (64) 11% (22) 23% (45) 12% (24) 196#1 Issue: Women’s Issues 25% (31) 31% (39) 6% (8) 15% (19) 22% (27) 124#1 Issue: Education 25% (20) 37% (29) 8% (6) 17% (14) 13% (10) 80#1 Issue: Energy 27% (32) 36% (43) 13% (15) 11% (13) 14% (17) 121#1 Issue: Other 23% (27) 28% (33) 7% (8) 26% (31) 16% (19) 1182020 Vote: Joe Biden 30% (282) 43% (408) 10% (95) 5% (43) 12% (118) 9462020 Vote: Donald Trump 4% (37) 8% (67) 18% (154) 57% (490) 13% (116) 8642020 Vote: Didn’t Vote 16% (24) 17% (26) 9% (13) 28% (43) 30% (46) 1532018 House Vote: Democrat 32% (229) 45% (321) 9% (64) 5% (35) 9% (67) 7152018 House Vote: Republican 6% (44) 9% (66) 18% (132) 54% (385) 12% (89) 7162018 House Vote: Someone else 10% (6) 27% (18) 14% (9) 33% (22) 16% (11) 672016 Vote: Hillary Clinton 33% (222) 45% (304) 8% (57) 4% (27) 10% (68) 6792016 Vote: Donald Trump 6% (45) 9% (68) 17% (129) 55% (411) 13% (100) 7542016 Vote: Other 12% (11) 33% (32) 17% (16) 22% (21) 17% (16) 962016 Vote: Didn’t Vote 14% (66) 23% (108) 14% (65) 27% (127) 22% (102) 468Voted in 2014: Yes 19% (255) 27% (364) 14% (190) 30% (410) 10% (142) 1360Voted in 2014: No 14% (90) 23% (148) 12% (79) 28% (177) 23% (144) 638
Continued on next page
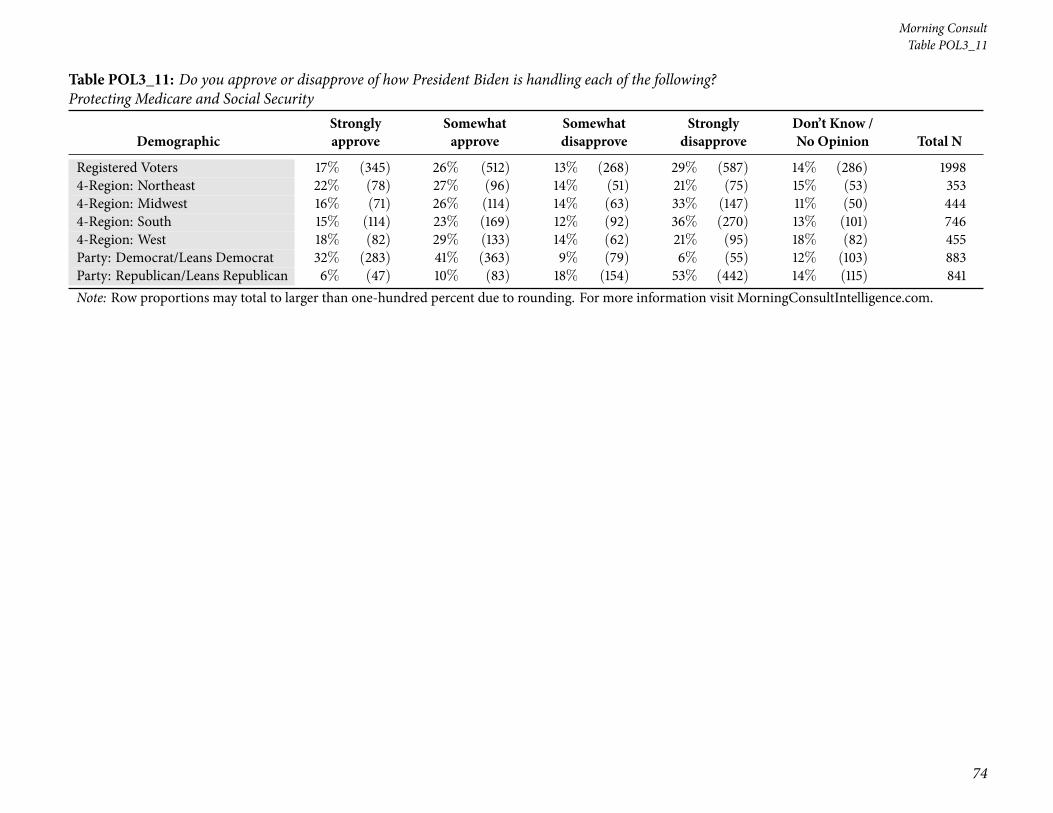
74
Morning ConsultTable POL3_11
Table POL3_11: Do you approve or disapprove of how President Biden is handling each of the following?Protecting Medicare and Social Security
DemographicStronglyapprove
Somewhatapprove
Somewhatdisapprove
Stronglydisapprove
Don’t Know /No Opinion Total N
Registered Voters 17% (345) 26% (512) 13% (268) 29% (587) 14% (286) 19984-Region: Northeast 22% (78) 27% (96) 14% (51) 21% (75) 15% (53) 3534-Region: Midwest 16% (71) 26% (114) 14% (63) 33% (147) 11% (50) 4444-Region: South 15% (114) 23% (169) 12% (92) 36% (270) 13% (101) 7464-Region: West 18% (82) 29% (133) 14% (62) 21% (95) 18% (82) 455Party: Democrat/Leans Democrat 32% (283) 41% (363) 9% (79) 6% (55) 12% (103) 883Party: Republican/Leans Republican 6% (47) 10% (83) 18% (154) 53% (442) 14% (115) 841Note: Row proportions may total to larger than one-hundred percent due to rounding. For more information visit MorningConsultIntelligence.com.

National Tracking Poll #2112154, December, 2021
75
Table POL3_12
Table POL3_12: Do you approve or disapprove of how President Biden is handling each of the following?Coronavirus
DemographicStronglyapprove
Somewhatapprove
Somewhatdisapprove
Stronglydisapprove
Don’t Know /No Opinion Total N
Registered Voters 24% (478) 24% (480) 12% (230) 35% (691) 6% (120) 1998Gender: Male 26% (245) 21% (200) 12% (115) 35% (330) 5% (52) 942Gender: Female 22% (233) 26% (279) 11% (115) 34% (361) 6% (68) 1056Age: 18-34 21% (108) 24% (122) 10% (52) 32% (163) 14% (70) 514Age: 35-44 25% (76) 30% (93) 11% (34) 28% (87) 6% (18) 307Age: 45-64 21% (145) 24% (160) 13% (87) 39% (267) 3% (21) 679Age: 65+ 30% (150) 21% (104) 12% (58) 35% (174) 2% (12) 497GenZers: 1997-2012 17% (30) 19% (34) 12% (22) 31% (56) 21% (38) 181Millennials: 1981-1996 25% (135) 28% (147) 10% (52) 30% (159) 8% (41) 534GenXers: 1965-1980 18% (83) 27% (123) 13% (60) 39% (178) 3% (15) 460Baby Boomers: 1946-1964 28% (214) 20% (154) 12% (91) 36% (271) 3% (25) 755PID: Dem (no lean) 49% (369) 36% (274) 5% (37) 7% (54) 3% (26) 759PID: Ind (no lean) 14% (73) 23% (124) 17% (89) 36% (192) 10% (54) 531PID: Rep (no lean) 5% (36) 12% (82) 15% (104) 63% (445) 6% (40) 708PID/Gender: DemMen 54% (177) 33% (107) 4% (14) 8% (26) 2% (5) 328PID/Gender: DemWomen 45% (192) 39% (167) 5% (23) 7% (28) 5% (21) 431PID/Gender: Ind Men 17% (42) 20% (52) 19% (48) 34% (86) 11% (27) 255PID/Gender: Ind Women 11% (30) 26% (72) 15% (41) 38% (106) 10% (27) 276PID/Gender: Rep Men 7% (26) 12% (42) 15% (53) 61% (219) 5% (20) 359PID/Gender: Rep Women 3% (10) 12% (41) 15% (51) 65% (227) 6% (21) 349Ideo: Liberal (1-3) 49% (283) 33% (190) 7% (40) 8% (46) 3% (17) 576Ideo: Moderate (4) 25% (118) 32% (156) 13% (61) 23% (113) 7% (32) 481Ideo: Conservative (5-7) 8% (62) 15% (115) 14% (112) 59% (461) 3% (26) 776Educ: < College 19% (232) 20% (246) 12% (148) 41% (489) 8% (91) 1206Educ: Bachelors degree 28% (143) 29% (147) 11% (55) 27% (134) 5% (23) 501Educ: Post-grad 36% (104) 30% (87) 9% (26) 23% (68) 2% (6) 290Income: Under 50k 22% (187) 21% (179) 11% (99) 36% (312) 10% (91) 868Income: 50k-100k 26% (189) 25% (180) 11% (81) 35% (256) 3% (18) 725Income: 100k+ 25% (101) 30% (120) 12% (50) 30% (123) 3% (10) 405Ethnicity: White 24% (374) 21% (330) 12% (183) 37% (569) 5% (80) 1536Ethnicity: Hispanic 29% (65) 25% (56) 10% (23) 26% (57) 9% (21) 222
Continued on next page
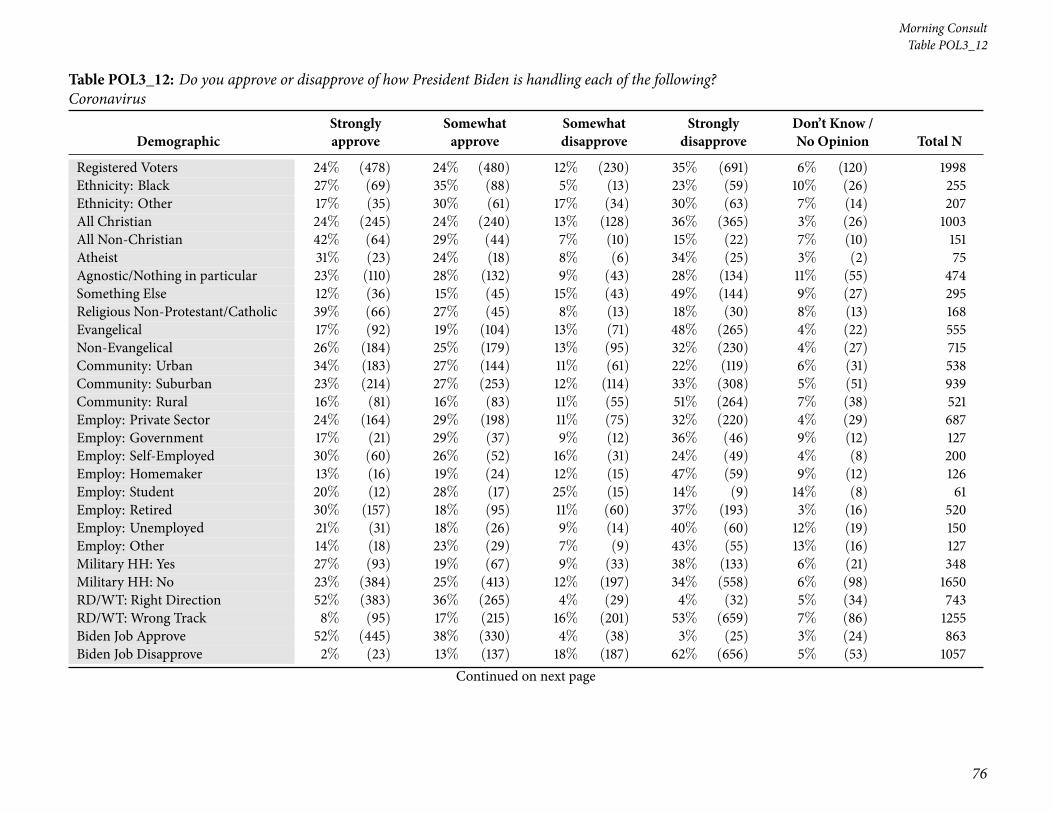
76
Morning ConsultTable POL3_12
Table POL3_12: Do you approve or disapprove of how President Biden is handling each of the following?Coronavirus
DemographicStronglyapprove
Somewhatapprove
Somewhatdisapprove
Stronglydisapprove
Don’t Know /No Opinion Total N
Registered Voters 24% (478) 24% (480) 12% (230) 35% (691) 6% (120) 1998Ethnicity: Black 27% (69) 35% (88) 5% (13) 23% (59) 10% (26) 255Ethnicity: Other 17% (35) 30% (61) 17% (34) 30% (63) 7% (14) 207All Christian 24% (245) 24% (240) 13% (128) 36% (365) 3% (26) 1003All Non-Christian 42% (64) 29% (44) 7% (10) 15% (22) 7% (10) 151Atheist 31% (23) 24% (18) 8% (6) 34% (25) 3% (2) 75Agnostic/Nothing in particular 23% (110) 28% (132) 9% (43) 28% (134) 11% (55) 474Something Else 12% (36) 15% (45) 15% (43) 49% (144) 9% (27) 295Religious Non-Protestant/Catholic 39% (66) 27% (45) 8% (13) 18% (30) 8% (13) 168Evangelical 17% (92) 19% (104) 13% (71) 48% (265) 4% (22) 555Non-Evangelical 26% (184) 25% (179) 13% (95) 32% (230) 4% (27) 715Community: Urban 34% (183) 27% (144) 11% (61) 22% (119) 6% (31) 538Community: Suburban 23% (214) 27% (253) 12% (114) 33% (308) 5% (51) 939Community: Rural 16% (81) 16% (83) 11% (55) 51% (264) 7% (38) 521Employ: Private Sector 24% (164) 29% (198) 11% (75) 32% (220) 4% (29) 687Employ: Government 17% (21) 29% (37) 9% (12) 36% (46) 9% (12) 127Employ: Self-Employed 30% (60) 26% (52) 16% (31) 24% (49) 4% (8) 200Employ: Homemaker 13% (16) 19% (24) 12% (15) 47% (59) 9% (12) 126Employ: Student 20% (12) 28% (17) 25% (15) 14% (9) 14% (8) 61Employ: Retired 30% (157) 18% (95) 11% (60) 37% (193) 3% (16) 520Employ: Unemployed 21% (31) 18% (26) 9% (14) 40% (60) 12% (19) 150Employ: Other 14% (18) 23% (29) 7% (9) 43% (55) 13% (16) 127Military HH: Yes 27% (93) 19% (67) 9% (33) 38% (133) 6% (21) 348Military HH: No 23% (384) 25% (413) 12% (197) 34% (558) 6% (98) 1650RD/WT: Right Direction 52% (383) 36% (265) 4% (29) 4% (32) 5% (34) 743RD/WT: Wrong Track 8% (95) 17% (215) 16% (201) 53% (659) 7% (86) 1255Biden Job Approve 52% (445) 38% (330) 4% (38) 3% (25) 3% (24) 863Biden Job Disapprove 2% (23) 13% (137) 18% (187) 62% (656) 5% (53) 1057
Continued on next page

National Tracking Poll #2112154, December, 2021
77
Table POL3_12
Table POL3_12: Do you approve or disapprove of how President Biden is handling each of the following?Coronavirus
DemographicStronglyapprove
Somewhatapprove
Somewhatdisapprove
Stronglydisapprove
Don’t Know /No Opinion Total N
Registered Voters 24% (478) 24% (480) 12% (230) 35% (691) 6% (120) 1998Biden Job Strongly Approve 71% (303) 21% (90) 2% (10) 2% (9) 3% (12) 424Biden Job Somewhat Approve 33% (143) 55% (240) 6% (28) 3% (15) 3% (12) 438Biden Job Somewhat Disapprove 7% (19) 29% (82) 35% (98) 22% (63) 8% (22) 283Biden Job Strongly Disapprove 1% (5) 7% (55) 12% (89) 77% (593) 4% (31) 774Favorable of Biden 49% (442) 39% (349) 5% (44) 4% (38) 3% (24) 896Unfavorable of Biden 2% (23) 12% (125) 18% (183) 63% (640) 5% (49) 1020Very Favorable of Biden 71% (305) 22% (93) 2% (8) 3% (13) 2% (8) 427Somewhat Favorable of Biden 29% (137) 55% (256) 8% (36) 5% (25) 3% (16) 469Somewhat Unfavorable of Biden 6% (13) 30% (66) 35% (76) 19% (40) 10% (22) 216Very Unfavorable of Biden 1% (9) 7% (59) 13% (108) 75% (600) 3% (28) 804#1 Issue: Economy 16% (136) 22% (186) 15% (128) 41% (355) 6% (53) 858#1 Issue: Security 9% (25) 11% (31) 13% (34) 64% (175) 3% (9) 274#1 Issue: Health Care 38% (86) 35% (79) 9% (21) 13% (30) 5% (12) 227#1 Issue: Medicare / Social Security 39% (76) 27% (53) 8% (16) 23% (45) 3% (6) 196#1 Issue: Women’s Issues 30% (38) 33% (41) 8% (10) 14% (17) 14% (18) 124#1 Issue: Education 34% (27) 30% (24) 10% (8) 18% (14) 8% (6) 80#1 Issue: Energy 36% (43) 38% (46) 6% (7) 16% (19) 5% (5) 121#1 Issue: Other 40% (47) 17% (21) 4% (5) 30% (35) 9% (10) 1182020 Vote: Joe Biden 45% (426) 39% (372) 7% (62) 6% (53) 3% (33) 9462020 Vote: Donald Trump 3% (30) 9% (77) 16% (135) 67% (576) 5% (46) 8642020 Vote: Didn’t Vote 12% (19) 15% (23) 14% (21) 35% (54) 24% (37) 1532018 House Vote: Democrat 48% (346) 38% (269) 5% (33) 7% (49) 2% (18) 7152018 House Vote: Republican 5% (38) 12% (88) 16% (114) 62% (444) 4% (32) 7162018 House Vote: Someone else 8% (5) 21% (14) 14% (9) 36% (24) 21% (14) 672016 Vote: Hillary Clinton 50% (338) 38% (257) 5% (31) 5% (34) 3% (18) 6792016 Vote: Donald Trump 6% (43) 12% (92) 15% (114) 63% (471) 4% (34) 7542016 Vote: Other 24% (23) 29% (28) 17% (16) 24% (23) 7% (7) 962016 Vote: Didn’t Vote 16% (74) 22% (102) 15% (69) 34% (161) 13% (61) 468Voted in 2014: Yes 26% (358) 25% (334) 11% (149) 35% (472) 3% (48) 1360Voted in 2014: No 19% (120) 23% (145) 13% (81) 34% (219) 11% (72) 638
Continued on next page

78
Morning ConsultTable POL3_12
Table POL3_12: Do you approve or disapprove of how President Biden is handling each of the following?Coronavirus
DemographicStronglyapprove
Somewhatapprove
Somewhatdisapprove
Stronglydisapprove
Don’t Know /No Opinion Total N
Registered Voters 24% (478) 24% (480) 12% (230) 35% (691) 6% (120) 19984-Region: Northeast 31% (108) 24% (86) 14% (48) 25% (88) 6% (22) 3534-Region: Midwest 19% (83) 25% (113) 15% (66) 35% (157) 6% (25) 4444-Region: South 21% (159) 20% (152) 10% (71) 43% (319) 6% (44) 7464-Region: West 28% (128) 28% (129) 10% (44) 28% (127) 6% (28) 455Party: Democrat/Leans Democrat 47% (414) 37% (322) 6% (53) 7% (62) 4% (32) 883Party: Republican/Leans Republican 5% (40) 12% (97) 16% (135) 62% (526) 5% (43) 841Note: Row proportions may total to larger than one-hundred percent due to rounding. For more information visit MorningConsultIntelligence.com.
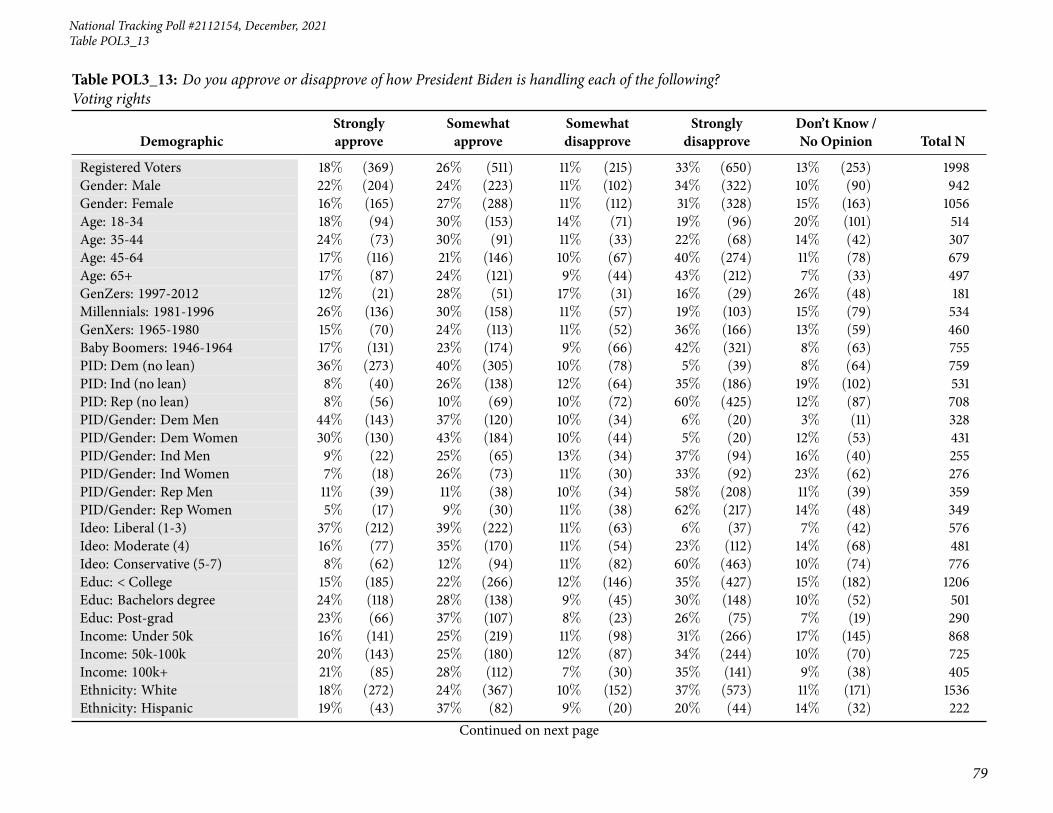
National Tracking Poll #2112154, December, 2021
79
Table POL3_13
Table POL3_13: Do you approve or disapprove of how President Biden is handling each of the following?Voting rights
DemographicStronglyapprove
Somewhatapprove
Somewhatdisapprove
Stronglydisapprove
Don’t Know /No Opinion Total N
Registered Voters 18% (369) 26% (511) 11% (215) 33% (650) 13% (253) 1998Gender: Male 22% (204) 24% (223) 11% (102) 34% (322) 10% (90) 942Gender: Female 16% (165) 27% (288) 11% (112) 31% (328) 15% (163) 1056Age: 18-34 18% (94) 30% (153) 14% (71) 19% (96) 20% (101) 514Age: 35-44 24% (73) 30% (91) 11% (33) 22% (68) 14% (42) 307Age: 45-64 17% (116) 21% (146) 10% (67) 40% (274) 11% (78) 679Age: 65+ 17% (87) 24% (121) 9% (44) 43% (212) 7% (33) 497GenZers: 1997-2012 12% (21) 28% (51) 17% (31) 16% (29) 26% (48) 181Millennials: 1981-1996 26% (136) 30% (158) 11% (57) 19% (103) 15% (79) 534GenXers: 1965-1980 15% (70) 24% (113) 11% (52) 36% (166) 13% (59) 460Baby Boomers: 1946-1964 17% (131) 23% (174) 9% (66) 42% (321) 8% (63) 755PID: Dem (no lean) 36% (273) 40% (305) 10% (78) 5% (39) 8% (64) 759PID: Ind (no lean) 8% (40) 26% (138) 12% (64) 35% (186) 19% (102) 531PID: Rep (no lean) 8% (56) 10% (69) 10% (72) 60% (425) 12% (87) 708PID/Gender: DemMen 44% (143) 37% (120) 10% (34) 6% (20) 3% (11) 328PID/Gender: DemWomen 30% (130) 43% (184) 10% (44) 5% (20) 12% (53) 431PID/Gender: Ind Men 9% (22) 25% (65) 13% (34) 37% (94) 16% (40) 255PID/Gender: Ind Women 7% (18) 26% (73) 11% (30) 33% (92) 23% (62) 276PID/Gender: Rep Men 11% (39) 11% (38) 10% (34) 58% (208) 11% (39) 359PID/Gender: Rep Women 5% (17) 9% (30) 11% (38) 62% (217) 14% (48) 349Ideo: Liberal (1-3) 37% (212) 39% (222) 11% (63) 6% (37) 7% (42) 576Ideo: Moderate (4) 16% (77) 35% (170) 11% (54) 23% (112) 14% (68) 481Ideo: Conservative (5-7) 8% (62) 12% (94) 11% (82) 60% (463) 10% (74) 776Educ: < College 15% (185) 22% (266) 12% (146) 35% (427) 15% (182) 1206Educ: Bachelors degree 24% (118) 28% (138) 9% (45) 30% (148) 10% (52) 501Educ: Post-grad 23% (66) 37% (107) 8% (23) 26% (75) 7% (19) 290Income: Under 50k 16% (141) 25% (219) 11% (98) 31% (266) 17% (145) 868Income: 50k-100k 20% (143) 25% (180) 12% (87) 34% (244) 10% (70) 725Income: 100k+ 21% (85) 28% (112) 7% (30) 35% (141) 9% (38) 405Ethnicity: White 18% (272) 24% (367) 10% (152) 37% (573) 11% (171) 1536Ethnicity: Hispanic 19% (43) 37% (82) 9% (20) 20% (44) 14% (32) 222
Continued on next page

80
Morning ConsultTable POL3_13
Table POL3_13: Do you approve or disapprove of how President Biden is handling each of the following?Voting rights
DemographicStronglyapprove
Somewhatapprove
Somewhatdisapprove
Stronglydisapprove
Don’t Know /No Opinion Total N
Registered Voters 18% (369) 26% (511) 11% (215) 33% (650) 13% (253) 1998Ethnicity: Black 24% (60) 35% (90) 15% (38) 10% (25) 16% (41) 255Ethnicity: Other 18% (37) 26% (54) 12% (25) 25% (51) 20% (41) 207All Christian 18% (176) 25% (252) 11% (110) 37% (368) 10% (97) 1003All Non-Christian 35% (53) 34% (51) 9% (13) 14% (20) 9% (13) 151Atheist 18% (13) 29% (22) 13% (10) 35% (26) 5% (3) 75Agnostic/Nothing in particular 18% (87) 27% (129) 11% (53) 22% (106) 21% (99) 474Something Else 14% (40) 19% (56) 10% (29) 44% (129) 14% (40) 295Religious Non-Protestant/Catholic 32% (54) 31% (52) 10% (18) 15% (26) 11% (18) 168Evangelical 18% (98) 18% (101) 9% (50) 45% (248) 10% (57) 555Non-Evangelical 16% (115) 28% (200) 12% (84) 34% (241) 10% (75) 715Community: Urban 30% (161) 29% (154) 9% (48) 19% (103) 13% (71) 538Community: Suburban 15% (137) 28% (267) 10% (96) 32% (305) 14% (134) 939Community: Rural 14% (71) 17% (89) 14% (71) 46% (242) 9% (48) 521Employ: Private Sector 20% (137) 28% (194) 11% (77) 29% (200) 12% (79) 687Employ: Government 14% (18) 25% (31) 11% (15) 34% (43) 15% (20) 127Employ: Self-Employed 27% (54) 23% (46) 18% (35) 23% (46) 9% (19) 200Employ: Homemaker 15% (18) 16% (20) 11% (13) 39% (49) 19% (24) 126Employ: Student 14% (8) 44% (27) 14% (8) 11% (7) 18% (11) 61Employ: Retired 17% (91) 23% (121) 7% (37) 44% (229) 8% (43) 520Employ: Unemployed 19% (28) 31% (46) 10% (15) 25% (37) 15% (23) 150Employ: Other 12% (15) 20% (26) 10% (13) 31% (39) 27% (34) 127Military HH: Yes 15% (54) 23% (81) 9% (32) 40% (138) 12% (43) 348Military HH: No 19% (316) 26% (430) 11% (183) 31% (513) 13% (210) 1650RD/WT: Right Direction 40% (295) 42% (312) 6% (44) 3% (22) 9% (69) 743RD/WT: Wrong Track 6% (74) 16% (199) 14% (170) 50% (628) 15% (184) 1255Biden Job Approve 38% (326) 43% (373) 8% (66) 3% (27) 8% (70) 863Biden Job Disapprove 3% (36) 12% (125) 13% (142) 58% (617) 13% (136) 1057
Continued on next page

National Tracking Poll #2112154, December, 2021
81
Table POL3_13
Table POL3_13: Do you approve or disapprove of how President Biden is handling each of the following?Voting rights
DemographicStronglyapprove
Somewhatapprove
Somewhatdisapprove
Stronglydisapprove
Don’t Know /No Opinion Total N
Registered Voters 18% (369) 26% (511) 11% (215) 33% (650) 13% (253) 1998Biden Job Strongly Approve 60% (255) 29% (124) 3% (12) 1% (6) 6% (27) 424Biden Job Somewhat Approve 16% (72) 57% (248) 12% (54) 5% (21) 10% (43) 438Biden Job Somewhat Disapprove 2% (6) 35% (100) 29% (81) 11% (31) 23% (65) 283Biden Job Strongly Disapprove 4% (30) 3% (25) 8% (61) 76% (586) 9% (71) 774Favorable of Biden 35% (317) 45% (399) 8% (73) 3% (30) 9% (77) 896Unfavorable of Biden 4% (36) 10% (100) 13% (137) 60% (611) 13% (136) 1020Very Favorable of Biden 58% (246) 32% (136) 4% (16) 2% (7) 5% (22) 427Somewhat Favorable of Biden 15% (71) 56% (263) 12% (56) 5% (24) 12% (55) 469Somewhat Unfavorable of Biden 2% (5) 31% (67) 28% (60) 11% (24) 28% (61) 216Very Unfavorable of Biden 4% (31) 4% (33) 10% (77) 73% (588) 9% (74) 804#1 Issue: Economy 15% (125) 23% (195) 13% (108) 36% (311) 14% (118) 858#1 Issue: Security 8% (23) 8% (23) 8% (22) 64% (174) 12% (32) 274#1 Issue: Health Care 28% (63) 43% (97) 9% (21) 9% (20) 12% (26) 227#1 Issue: Medicare / Social Security 23% (45) 28% (55) 11% (21) 29% (57) 9% (18) 196#1 Issue: Women’s Issues 30% (37) 27% (34) 10% (12) 17% (21) 16% (19) 124#1 Issue: Education 24% (19) 33% (26) 9% (7) 20% (16) 14% (11) 80#1 Issue: Energy 29% (35) 35% (43) 10% (12) 16% (19) 10% (13) 121#1 Issue: Other 19% (22) 32% (38) 9% (11) 27% (32) 13% (15) 1182020 Vote: Joe Biden 31% (296) 43% (411) 10% (91) 5% (45) 11% (103) 9462020 Vote: Donald Trump 6% (49) 7% (61) 11% (96) 65% (561) 11% (97) 8642020 Vote: Didn’t Vote 15% (23) 19% (30) 11% (18) 23% (36) 31% (47) 1532018 House Vote: Democrat 34% (244) 43% (305) 10% (69) 6% (41) 8% (57) 7152018 House Vote: Republican 7% (48) 10% (70) 12% (82) 62% (444) 10% (72) 7162018 House Vote: Someone else 10% (7) 27% (18) 15% (10) 29% (19) 19% (13) 672016 Vote: Hillary Clinton 35% (234) 43% (292) 9% (64) 5% (31) 8% (57) 6792016 Vote: Donald Trump 7% (54) 9% (69) 11% (83) 62% (470) 10% (76) 7542016 Vote: Other 13% (12) 31% (30) 15% (15) 23% (22) 18% (17) 962016 Vote: Didn’t Vote 15% (69) 25% (119) 11% (53) 27% (125) 22% (103) 468Voted in 2014: Yes 20% (279) 26% (349) 11% (147) 35% (472) 8% (114) 1360Voted in 2014: No 14% (91) 25% (162) 11% (68) 28% (178) 22% (139) 638
Continued on next page

82
Morning ConsultTable POL3_13
Table POL3_13: Do you approve or disapprove of how President Biden is handling each of the following?Voting rights
DemographicStronglyapprove
Somewhatapprove
Somewhatdisapprove
Stronglydisapprove
Don’t Know /No Opinion Total N
Registered Voters 18% (369) 26% (511) 11% (215) 33% (650) 13% (253) 19984-Region: Northeast 23% (83) 26% (92) 12% (42) 26% (92) 13% (45) 3534-Region: Midwest 17% (77) 25% (110) 12% (54) 33% (148) 12% (55) 4444-Region: South 16% (122) 21% (154) 12% (86) 40% (296) 12% (87) 7464-Region: West 19% (87) 34% (156) 7% (32) 25% (114) 15% (66) 455Party: Democrat/Leans Democrat 34% (299) 41% (364) 10% (88) 6% (50) 9% (82) 883Party: Republican/Leans Republican 7% (56) 10% (84) 11% (92) 61% (513) 11% (96) 841Note: Row proportions may total to larger than one-hundred percent due to rounding. For more information visit MorningConsultIntelligence.com.

National Tracking Poll #2112154, December, 2021
83
Table POL3_14
Table POL3_14: Do you approve or disapprove of how President Biden is handling each of the following?Foreign policy
DemographicStronglyapprove
Somewhatapprove
Somewhatdisapprove
Stronglydisapprove
Don’t Know /No Opinion Total N
Registered Voters 15% (295) 23% (463) 13% (269) 36% (712) 13% (259) 1998Gender: Male 16% (155) 23% (218) 13% (125) 37% (348) 10% (96) 942Gender: Female 13% (139) 23% (246) 14% (144) 34% (364) 15% (163) 1056Age: 18-34 14% (73) 21% (109) 17% (86) 24% (124) 24% (122) 514Age: 35-44 19% (58) 25% (78) 15% (47) 27% (81) 14% (43) 307Age: 45-64 12% (80) 24% (160) 13% (86) 42% (286) 10% (67) 679Age: 65+ 17% (83) 23% (117) 10% (49) 44% (220) 6% (28) 497GenZers: 1997-2012 6% (11) 21% (38) 15% (27) 24% (43) 34% (62) 181Millennials: 1981-1996 21% (115) 22% (118) 16% (88) 24% (128) 16% (86) 534GenXers: 1965-1980 8% (39) 26% (121) 14% (67) 40% (183) 11% (51) 460Baby Boomers: 1946-1964 16% (122) 23% (171) 11% (83) 43% (321) 8% (57) 755PID: Dem (no lean) 31% (234) 42% (320) 10% (75) 6% (44) 11% (86) 759PID: Ind (no lean) 5% (28) 20% (104) 17% (93) 38% (201) 20% (104) 531PID: Rep (no lean) 5% (33) 6% (39) 14% (101) 66% (466) 10% (68) 708PID/Gender: DemMen 34% (113) 42% (137) 10% (34) 8% (25) 6% (20) 328PID/Gender: DemWomen 28% (121) 42% (182) 10% (42) 4% (19) 15% (67) 431PID/Gender: Ind Men 7% (19) 21% (52) 17% (44) 37% (95) 17% (44) 255PID/Gender: Ind Women 3% (9) 19% (52) 17% (48) 39% (107) 22% (60) 276PID/Gender: Rep Men 7% (24) 8% (28) 13% (47) 64% (228) 9% (32) 359PID/Gender: Rep Women 2% (9) 3% (12) 15% (54) 68% (238) 11% (37) 349Ideo: Liberal (1-3) 33% (192) 40% (229) 11% (63) 7% (42) 9% (50) 576Ideo: Moderate (4) 12% (56) 32% (153) 16% (78) 23% (110) 17% (83) 481Ideo: Conservative (5-7) 5% (43) 8% (66) 14% (106) 66% (509) 7% (53) 776Educ: < College 11% (133) 19% (224) 15% (175) 39% (473) 17% (200) 1206Educ: Bachelors degree 21% (104) 27% (137) 12% (58) 32% (158) 9% (44) 501Educ: Post-grad 20% (57) 35% (102) 12% (35) 28% (81) 5% (15) 290Income: Under 50k 11% (98) 22% (189) 13% (116) 33% (288) 20% (177) 868Income: 50k-100k 18% (127) 23% (168) 14% (104) 37% (266) 8% (60) 725Income: 100k+ 17% (70) 26% (107) 12% (49) 39% (158) 5% (22) 405Ethnicity: White 16% (240) 21% (324) 13% (197) 40% (620) 10% (155) 1536Ethnicity: Hispanic 22% (49) 21% (47) 17% (38) 22% (49) 18% (39) 222
Continued on next page

84
Morning ConsultTable POL3_14
Table POL3_14: Do you approve or disapprove of how President Biden is handling each of the following?Foreign policy
DemographicStronglyapprove
Somewhatapprove
Somewhatdisapprove
Stronglydisapprove
Don’t Know /No Opinion Total N
Registered Voters 15% (295) 23% (463) 13% (269) 36% (712) 13% (259) 1998Ethnicity: Black 12% (30) 36% (92) 13% (34) 13% (33) 26% (66) 255Ethnicity: Other 12% (24) 23% (48) 18% (38) 29% (59) 18% (38) 207All Christian 16% (158) 23% (227) 13% (130) 40% (402) 9% (86) 1003All Non-Christian 32% (48) 33% (49) 9% (13) 14% (21) 13% (19) 151Atheist 23% (17) 15% (11) 20% (15) 32% (24) 10% (8) 75Agnostic/Nothing in particular 11% (52) 26% (122) 16% (77) 26% (122) 21% (101) 474Something Else 7% (20) 18% (54) 11% (33) 48% (143) 15% (45) 295Religious Non-Protestant/Catholic 29% (49) 30% (51) 9% (16) 17% (29) 14% (23) 168Evangelical 12% (67) 17% (94) 12% (66) 50% (278) 9% (49) 555Non-Evangelical 15% (108) 25% (181) 13% (94) 36% (254) 11% (77) 715Community: Urban 25% (135) 28% (150) 11% (61) 22% (118) 14% (74) 538Community: Suburban 12% (115) 25% (231) 14% (131) 36% (336) 13% (126) 939Community: Rural 9% (45) 16% (82) 15% (77) 49% (258) 11% (59) 521Employ: Private Sector 16% (108) 27% (188) 15% (100) 32% (222) 10% (69) 687Employ: Government 13% (17) 18% (23) 12% (15) 41% (52) 16% (20) 127Employ: Self-Employed 20% (40) 24% (47) 23% (46) 21% (42) 12% (25) 200Employ: Homemaker 8% (10) 16% (20) 12% (15) 48% (60) 16% (20) 126Employ: Student 8% (5) 35% (21) 16% (10) 21% (13) 21% (13) 61Employ: Retired 16% (81) 24% (127) 9% (44) 45% (234) 7% (34) 520Employ: Unemployed 13% (20) 14% (21) 17% (26) 26% (39) 29% (43) 150Employ: Other 10% (13) 12% (16) 10% (12) 39% (50) 28% (36) 127Military HH: Yes 16% (54) 17% (60) 12% (41) 41% (143) 14% (50) 348Military HH: No 15% (240) 24% (403) 14% (228) 34% (569) 13% (209) 1650RD/WT: Right Direction 35% (259) 43% (323) 8% (63) 4% (26) 10% (72) 743RD/WT: Wrong Track 3% (36) 11% (140) 16% (206) 55% (686) 15% (187) 1255Biden Job Approve 32% (274) 46% (400) 10% (82) 2% (20) 10% (86) 863Biden Job Disapprove 2% (17) 6% (62) 16% (174) 65% (687) 11% (117) 1057
Continued on next page

National Tracking Poll #2112154, December, 2021
85
Table POL3_14
Table POL3_14: Do you approve or disapprove of how President Biden is handling each of the following?Foreign policy
DemographicStronglyapprove
Somewhatapprove
Somewhatdisapprove
Stronglydisapprove
Don’t Know /No Opinion Total N
Registered Voters 15% (295) 23% (463) 13% (269) 36% (712) 13% (259) 1998Biden Job Strongly Approve 52% (219) 35% (148) 5% (20) 2% (9) 7% (28) 424Biden Job Somewhat Approve 13% (55) 57% (252) 14% (62) 3% (11) 13% (58) 438Biden Job Somewhat Disapprove 3% (7) 18% (50) 35% (101) 21% (61) 23% (64) 283Biden Job Strongly Disapprove 1% (10) 2% (12) 9% (73) 81% (626) 7% (52) 774Favorable of Biden 30% (271) 46% (414) 10% (86) 3% (23) 12% (103) 896Unfavorable of Biden 2% (18) 4% (42) 17% (174) 67% (681) 10% (105) 1020Very Favorable of Biden 53% (227) 36% (154) 3% (14) 2% (9) 5% (23) 427Somewhat Favorable of Biden 9% (43) 55% (260) 15% (71) 3% (14) 17% (81) 469Somewhat Unfavorable of Biden 2% (5) 13% (27) 42% (90) 21% (46) 22% (47) 216Very Unfavorable of Biden 2% (12) 2% (15) 10% (84) 79% (635) 7% (58) 804#1 Issue: Economy 11% (97) 19% (161) 16% (141) 40% (341) 14% (118) 858#1 Issue: Security 6% (16) 7% (18) 10% (27) 70% (192) 8% (21) 274#1 Issue: Health Care 25% (57) 37% (83) 12% (27) 15% (34) 12% (27) 227#1 Issue: Medicare / Social Security 19% (38) 33% (65) 7% (14) 29% (58) 11% (22) 196#1 Issue: Women’s Issues 17% (21) 31% (38) 20% (25) 14% (17) 18% (22) 124#1 Issue: Education 22% (18) 38% (30) 8% (7) 18% (14) 14% (11) 80#1 Issue: Energy 20% (24) 30% (36) 18% (22) 15% (19) 17% (21) 121#1 Issue: Other 21% (25) 27% (31) 6% (7) 33% (38) 14% (16) 1182020 Vote: Joe Biden 27% (259) 43% (403) 11% (107) 5% (51) 13% (126) 9462020 Vote: Donald Trump 3% (25) 4% (33) 15% (127) 70% (604) 9% (74) 8642020 Vote: Didn’t Vote 6% (10) 15% (22) 15% (24) 29% (45) 34% (52) 1532018 House Vote: Democrat 29% (209) 44% (312) 11% (76) 7% (50) 9% (67) 7152018 House Vote: Republican 4% (29) 6% (43) 14% (100) 67% (479) 9% (64) 7162018 House Vote: Someone else 1% (1) 22% (15) 23% (15) 36% (24) 18% (12) 672016 Vote: Hillary Clinton 30% (205) 45% (308) 10% (68) 5% (34) 9% (63) 6792016 Vote: Donald Trump 5% (36) 5% (39) 14% (108) 67% (506) 9% (64) 7542016 Vote: Other 9% (8) 26% (25) 20% (19) 26% (25) 19% (19) 962016 Vote: Didn’t Vote 10% (45) 19% (90) 16% (74) 31% (146) 24% (113) 468Voted in 2014: Yes 16% (220) 25% (337) 13% (184) 38% (511) 8% (109) 1360Voted in 2014: No 12% (74) 20% (126) 13% (85) 32% (201) 24% (150) 638
Continued on next page

86
Morning ConsultTable POL3_14
Table POL3_14: Do you approve or disapprove of how President Biden is handling each of the following?Foreign policy
DemographicStronglyapprove
Somewhatapprove
Somewhatdisapprove
Stronglydisapprove
Don’t Know /No Opinion Total N
Registered Voters 15% (295) 23% (463) 13% (269) 36% (712) 13% (259) 19984-Region: Northeast 22% (76) 27% (94) 12% (42) 28% (98) 12% (42) 3534-Region: Midwest 14% (60) 22% (99) 15% (66) 37% (164) 12% (55) 4444-Region: South 12% (87) 20% (146) 13% (96) 43% (323) 13% (94) 7464-Region: West 16% (71) 27% (124) 14% (65) 28% (126) 15% (68) 455Party: Democrat/Leans Democrat 29% (253) 42% (374) 11% (99) 6% (51) 12% (105) 883Party: Republican/Leans Republican 4% (34) 5% (46) 15% (128) 66% (558) 9% (76) 841Note: Row proportions may total to larger than one-hundred percent due to rounding. For more information visit MorningConsultIntelligence.com.

National Tracking Poll #2112154, December, 2021
87
Table POL4_1
Table POL4_1: How would you rate each of the following on their handling of the coronavirus?President Joe Biden
Demographic Excellent Good Just Fair PoorDon’t Know /No Opinion Total N
Registered Voters 20% (393) 20% (405) 16% (320) 39% (770) 5% (109) 1998Gender: Male 21% (199) 19% (177) 14% (129) 41% (386) 5% (50) 942Gender: Female 18% (194) 22% (227) 18% (191) 36% (384) 6% (59) 1056Age: 18-34 18% (90) 18% (95) 20% (102) 32% (162) 13% (65) 514Age: 35-44 19% (57) 25% (77) 17% (52) 34% (105) 5% (16) 307Age: 45-64 17% (117) 20% (138) 15% (99) 45% (304) 3% (21) 679Age: 65+ 26% (129) 19% (95) 13% (67) 40% (199) 1% (7) 497GenZers: 1997-2012 10% (18) 13% (23) 24% (43) 35% (63) 18% (33) 181Millennials: 1981-1996 22% (117) 23% (121) 18% (94) 30% (161) 8% (41) 534GenXers: 1965-1980 14% (66) 22% (99) 15% (69) 45% (209) 4% (17) 460Baby Boomers: 1946-1964 24% (178) 19% (144) 14% (105) 41% (311) 2% (16) 755PID: Dem (no lean) 43% (325) 34% (262) 14% (108) 6% (47) 2% (18) 759PID: Ind (no lean) 7% (38) 20% (104) 22% (117) 42% (225) 9% (46) 531PID: Rep (no lean) 4% (31) 6% (39) 13% (96) 70% (498) 6% (45) 708PID/Gender: DemMen 47% (153) 31% (102) 13% (42) 8% (25) 2% (6) 328PID/Gender: DemWomen 40% (172) 37% (159) 15% (67) 5% (21) 3% (12) 431PID/Gender: Ind Men 10% (24) 20% (52) 17% (44) 44% (111) 9% (23) 255PID/Gender: Ind Women 5% (14) 19% (52) 26% (73) 41% (114) 8% (23) 276PID/Gender: Rep Men 6% (22) 6% (23) 12% (44) 70% (250) 6% (21) 359PID/Gender: Rep Women 3% (9) 5% (16) 15% (52) 71% (249) 7% (24) 349Ideo: Liberal (1-3) 42% (239) 33% (192) 15% (84) 9% (50) 2% (11) 576Ideo: Moderate (4) 21% (99) 26% (127) 20% (98) 27% (131) 5% (25) 481Ideo: Conservative (5-7) 6% (47) 8% (62) 15% (120) 67% (523) 3% (25) 776Educ: < College 15% (182) 18% (222) 15% (180) 44% (535) 7% (87) 1206Educ: Bachelors degree 24% (121) 23% (117) 19% (95) 30% (152) 3% (17) 501Educ: Post-grad 31% (90) 23% (65) 16% (46) 29% (83) 2% (5) 290Income: Under 50k 16% (140) 20% (171) 16% (136) 38% (329) 11% (92) 868Income: 50k-100k 22% (160) 21% (150) 17% (122) 39% (281) 1% (11) 725Income: 100k+ 23% (93) 21% (84) 15% (62) 39% (160) 2% (6) 405Ethnicity: White 20% (312) 19% (288) 14% (220) 43% (654) 4% (62) 1536Ethnicity: Hispanic 22% (49) 20% (43) 21% (46) 30% (66) 8% (19) 222
Continued on next page

88
Morning ConsultTable POL4_1
Table POL4_1: How would you rate each of the following on their handling of the coronavirus?President Joe Biden
Demographic Excellent Good Just Fair PoorDon’t Know /No Opinion Total N
Registered Voters 20% (393) 20% (405) 16% (320) 39% (770) 5% (109) 1998Ethnicity: Black 24% (62) 28% (71) 21% (53) 16% (40) 11% (29) 255Ethnicity: Other 9% (19) 22% (46) 23% (47) 37% (76) 9% (18) 207All Christian 22% (222) 18% (179) 17% (169) 41% (407) 3% (25) 1003All Non-Christian 36% (55) 24% (36) 15% (23) 18% (26) 7% (10) 151Atheist 23% (18) 27% (20) 11% (9) 37% (27) 2% (1) 75Agnostic/Nothing in particular 15% (71) 28% (134) 15% (69) 32% (150) 11% (50) 474Something Else 9% (28) 12% (35) 17% (50) 54% (159) 8% (22) 295Religious Non-Protestant/Catholic 33% (56) 23% (39) 14% (24) 22% (37) 8% (13) 168Evangelical 16% (90) 13% (71) 14% (76) 52% (288) 5% (29) 555Non-Evangelical 22% (156) 19% (139) 20% (140) 37% (265) 2% (15) 715Community: Urban 30% (164) 22% (116) 16% (84) 27% (144) 6% (30) 538Community: Suburban 18% (168) 23% (215) 18% (165) 38% (354) 4% (38) 939Community: Rural 12% (62) 14% (74) 14% (71) 52% (273) 8% (41) 521Employ: Private Sector 19% (132) 22% (150) 19% (130) 37% (256) 3% (18) 687Employ: Government 12% (15) 25% (32) 19% (24) 37% (47) 6% (8) 127Employ: Self-Employed 25% (49) 21% (42) 16% (32) 33% (65) 6% (12) 200Employ: Homemaker 12% (15) 15% (19) 13% (17) 50% (63) 9% (11) 126Employ: Student 16% (10) 23% (14) 22% (14) 32% (20) 7% (4) 61Employ: Retired 25% (132) 19% (99) 12% (61) 42% (220) 2% (10) 520Employ: Unemployed 16% (24) 14% (21) 17% (25) 35% (53) 18% (27) 150Employ: Other 12% (15) 23% (29) 14% (18) 36% (46) 15% (19) 127Military HH: Yes 23% (80) 17% (60) 13% (46) 42% (145) 5% (17) 348Military HH: No 19% (313) 21% (345) 17% (275) 38% (625) 6% (93) 1650RD/WT: Right Direction 46% (345) 35% (262) 11% (84) 3% (22) 4% (32) 743RD/WT: Wrong Track 4% (48) 11% (143) 19% (237) 60% (748) 6% (78) 1255Biden Job Approve 44% (376) 39% (335) 14% (118) 1% (12) 2% (21) 863Biden Job Disapprove 2% (16) 6% (59) 17% (185) 71% (747) 5% (51) 1057
Continued on next page

National Tracking Poll #2112154, December, 2021
89
Table POL4_1
Table POL4_1: How would you rate each of the following on their handling of the coronavirus?President Joe Biden
Demographic Excellent Good Just Fair PoorDon’t Know /No Opinion Total N
Registered Voters 20% (393) 20% (405) 16% (320) 39% (770) 5% (109) 1998Biden Job Strongly Approve 72% (304) 19% (82) 5% (21) 1% (5) 3% (13) 424Biden Job Somewhat Approve 16% (72) 58% (253) 22% (98) 2% (8) 2% (9) 438Biden Job Somewhat Disapprove 3% (10) 15% (44) 42% (118) 31% (88) 9% (24) 283Biden Job Strongly Disapprove 1% (6) 2% (15) 9% (66) 85% (659) 3% (27) 774Favorable of Biden 42% (374) 39% (347) 15% (136) 1% (13) 3% (26) 896Unfavorable of Biden 1% (9) 5% (50) 17% (177) 73% (744) 4% (39) 1020Very Favorable of Biden 72% (307) 21% (89) 5% (21) 1% (4) 2% (7) 427Somewhat Favorable of Biden 14% (67) 55% (259) 24% (114) 2% (10) 4% (19) 469Somewhat Unfavorable of Biden 1% (2) 16% (34) 47% (101) 30% (64) 7% (14) 216Very Unfavorable of Biden 1% (7) 2% (16) 9% (76) 85% (680) 3% (25) 804#1 Issue: Economy 14% (124) 15% (129) 18% (154) 47% (400) 6% (51) 858#1 Issue: Security 8% (21) 7% (18) 11% (31) 70% (193) 4% (11) 274#1 Issue: Health Care 30% (67) 32% (74) 19% (43) 13% (30) 6% (13) 227#1 Issue: Medicare / Social Security 30% (59) 28% (55) 11% (21) 28% (55) 3% (6) 196#1 Issue: Women’s Issues 23% (29) 35% (43) 17% (21) 16% (19) 9% (11) 124#1 Issue: Education 23% (19) 33% (26) 18% (14) 18% (14) 8% (7) 80#1 Issue: Energy 28% (33) 34% (41) 20% (24) 18% (22) 1% (1) 121#1 Issue: Other 35% (42) 16% (18) 11% (13) 31% (37) 7% (8) 1182020 Vote: Joe Biden 38% (357) 36% (340) 19% (175) 5% (51) 2% (22) 9462020 Vote: Donald Trump 3% (23) 4% (37) 13% (115) 74% (637) 6% (52) 8642020 Vote: Didn’t Vote 8% (12) 13% (20) 14% (21) 44% (67) 21% (32) 1532018 House Vote: Democrat 40% (289) 36% (256) 17% (121) 5% (39) 1% (10) 7152018 House Vote: Republican 5% (35) 6% (46) 14% (99) 69% (493) 6% (42) 7162018 House Vote: Someone else 3% (2) 22% (15) 22% (14) 42% (28) 10% (7) 672016 Vote: Hillary Clinton 42% (284) 36% (244) 16% (107) 5% (33) 1% (10) 6792016 Vote: Donald Trump 5% (38) 7% (51) 14% (104) 69% (517) 6% (43) 7542016 Vote: Other 14% (13) 28% (27) 23% (22) 27% (26) 8% (7) 962016 Vote: Didn’t Vote 12% (57) 17% (81) 19% (87) 41% (193) 11% (49) 468Voted in 2014: Yes 22% (305) 21% (288) 15% (206) 38% (513) 4% (48) 1360Voted in 2014: No 14% (88) 18% (117) 18% (114) 40% (257) 10% (61) 638
Continued on next page

90
Morning ConsultTable POL4_1
Table POL4_1: How would you rate each of the following on their handling of the coronavirus?President Joe Biden
Demographic Excellent Good Just Fair PoorDon’t Know /No Opinion Total N
Registered Voters 20% (393) 20% (405) 16% (320) 39% (770) 5% (109) 19984-Region: Northeast 26% (91) 25% (88) 16% (56) 28% (101) 5% (18) 3534-Region: Midwest 16% (70) 18% (81) 20% (87) 42% (186) 4% (20) 4444-Region: South 18% (132) 16% (120) 14% (108) 47% (352) 5% (34) 7464-Region: West 22% (101) 25% (115) 15% (70) 29% (131) 8% (38) 455Party: Democrat/Leans Democrat 40% (352) 36% (315) 16% (140) 6% (57) 2% (19) 883Party: Republican/Leans Republican 4% (31) 6% (47) 15% (128) 70% (586) 6% (49) 841Note: Row proportions may total to larger than one-hundred percent due to rounding. For more information visit MorningConsultIntelligence.com.

National Tracking Poll #2112154, December, 2021
91
Table POL4_2
Table POL4_2: How would you rate each of the following on their handling of the coronavirus?Congress
Demographic Excellent Good Just Fair PoorDon’t Know /No Opinion Total N
Registered Voters 6% (128) 18% (363) 35% (696) 31% (625) 9% (186) 1998Gender: Male 9% (88) 18% (169) 34% (316) 33% (311) 6% (57) 942Gender: Female 4% (40) 18% (193) 36% (380) 30% (314) 12% (129) 1056Age: 18-34 13% (68) 18% (93) 28% (145) 26% (133) 15% (75) 514Age: 35-44 9% (27) 24% (74) 31% (94) 25% (76) 12% (36) 307Age: 45-64 3% (18) 17% (116) 37% (252) 36% (244) 7% (49) 679Age: 65+ 3% (15) 16% (80) 41% (204) 34% (172) 5% (27) 497GenZers: 1997-2012 4% (7) 13% (23) 34% (61) 25% (45) 24% (44) 181Millennials: 1981-1996 16% (84) 23% (123) 26% (140) 25% (133) 10% (53) 534GenXers: 1965-1980 4% (17) 17% (76) 38% (174) 34% (155) 8% (38) 460Baby Boomers: 1946-1964 2% (17) 17% (126) 39% (294) 36% (273) 6% (45) 755PID: Dem (no lean) 13% (98) 31% (232) 36% (273) 15% (115) 5% (41) 759PID: Ind (no lean) 1% (7) 11% (57) 34% (180) 39% (207) 15% (78) 531PID: Rep (no lean) 3% (23) 10% (73) 34% (242) 43% (303) 9% (67) 708PID/Gender: DemMen 21% (68) 31% (102) 33% (107) 14% (45) 2% (7) 328PID/Gender: DemWomen 7% (30) 30% (131) 39% (166) 16% (70) 8% (34) 431PID/Gender: Ind Men 1% (2) 11% (29) 33% (84) 41% (105) 14% (34) 255PID/Gender: Ind Women 2% (5) 10% (28) 35% (97) 37% (102) 16% (44) 276PID/Gender: Rep Men 5% (18) 11% (39) 35% (125) 45% (161) 5% (16) 359PID/Gender: Rep Women 2% (6) 10% (35) 33% (117) 41% (142) 14% (50) 349Ideo: Liberal (1-3) 14% (79) 27% (157) 36% (208) 19% (110) 4% (22) 576Ideo: Moderate (4) 4% (18) 22% (107) 36% (175) 28% (135) 10% (46) 481Ideo: Conservative (5-7) 4% (31) 10% (81) 37% (284) 43% (335) 6% (46) 776Educ: < College 3% (39) 18% (214) 33% (396) 34% (411) 12% (146) 1206Educ: Bachelors degree 12% (58) 18% (90) 37% (188) 27% (135) 6% (30) 501Educ: Post-grad 11% (31) 20% (58) 39% (112) 27% (79) 4% (10) 290Income: Under 50k 4% (37) 19% (163) 32% (280) 30% (263) 15% (127) 868Income: 50k-100k 8% (57) 18% (127) 35% (251) 33% (243) 6% (47) 725Income: 100k+ 8% (34) 18% (73) 41% (165) 30% (120) 3% (13) 405Ethnicity: White 7% (101) 16% (251) 35% (543) 34% (521) 8% (121) 1536Ethnicity: Hispanic 9% (20) 23% (52) 28% (63) 27% (59) 13% (28) 222
Continued on next page

92
Morning ConsultTable POL4_2
Table POL4_2: How would you rate each of the following on their handling of the coronavirus?Congress
Demographic Excellent Good Just Fair PoorDon’t Know /No Opinion Total N
Registered Voters 6% (128) 18% (363) 35% (696) 31% (625) 9% (186) 1998Ethnicity: Black 7% (19) 30% (75) 35% (89) 17% (44) 11% (28) 255Ethnicity: Other 4% (9) 18% (37) 31% (65) 29% (60) 18% (37) 207All Christian 5% (55) 21% (212) 38% (382) 29% (292) 6% (63) 1003All Non-Christian 30% (45) 17% (26) 23% (34) 20% (30) 10% (15) 151Atheist 5% (4) 16% (12) 24% (18) 52% (39) 3% (2) 75Agnostic/Nothing in particular 2% (12) 15% (72) 36% (172) 31% (147) 15% (72) 474Something Else 4% (13) 14% (41) 30% (89) 40% (117) 12% (34) 295Religious Non-Protestant/Catholic 27% (46) 18% (29) 23% (38) 22% (37) 11% (18) 168Evangelical 8% (47) 19% (107) 33% (181) 34% (187) 6% (34) 555Non-Evangelical 3% (20) 19% (139) 40% (284) 30% (214) 8% (59) 715Community: Urban 17% (89) 23% (124) 30% (163) 22% (116) 9% (46) 538Community: Suburban 3% (29) 16% (153) 38% (355) 33% (309) 10% (93) 939Community: Rural 2% (11) 16% (86) 34% (178) 38% (200) 9% (47) 521Employ: Private Sector 8% (55) 20% (140) 35% (243) 31% (211) 6% (38) 687Employ: Government 9% (12) 19% (24) 31% (39) 32% (41) 9% (11) 127Employ: Self-Employed 13% (27) 20% (41) 31% (62) 24% (49) 11% (23) 200Employ: Homemaker 4% (6) 12% (15) 29% (36) 38% (48) 17% (21) 126Employ: Student 3% (2) 24% (15) 35% (21) 24% (14) 15% (9) 61Employ: Retired 3% (17) 14% (74) 41% (214) 35% (184) 6% (32) 520Employ: Unemployed 2% (3) 21% (31) 34% (51) 28% (42) 15% (22) 150Employ: Other 6% (8) 18% (23) 24% (30) 28% (36) 24% (31) 127Military HH: Yes 6% (21) 18% (62) 33% (115) 35% (123) 8% (26) 348Military HH: No 6% (107) 18% (300) 35% (581) 30% (502) 10% (160) 1650RD/WT: Right Direction 16% (120) 31% (232) 35% (263) 9% (70) 8% (58) 743RD/WT: Wrong Track 1% (8) 10% (131) 35% (433) 44% (555) 10% (128) 1255Biden Job Approve 14% (124) 30% (257) 37% (321) 13% (112) 6% (49) 863Biden Job Disapprove — (3) 9% (97) 35% (367) 47% (499) 9% (91) 1057
Continued on next page

National Tracking Poll #2112154, December, 2021
93
Table POL4_2
Table POL4_2: How would you rate each of the following on their handling of the coronavirus?Congress
Demographic Excellent Good Just Fair PoorDon’t Know /No Opinion Total N
Registered Voters 6% (128) 18% (363) 35% (696) 31% (625) 9% (186) 1998Biden Job Strongly Approve 25% (107) 32% (136) 29% (124) 8% (34) 6% (23) 424Biden Job Somewhat Approve 4% (17) 28% (121) 45% (197) 18% (78) 6% (26) 438Biden Job Somewhat Disapprove — (1) 18% (52) 42% (119) 26% (74) 13% (37) 283Biden Job Strongly Disapprove — (2) 6% (45) 32% (247) 55% (425) 7% (54) 774Favorable of Biden 13% (116) 31% (275) 38% (340) 13% (114) 6% (50) 896Unfavorable of Biden 1% (6) 8% (82) 34% (344) 49% (500) 9% (88) 1020Very Favorable of Biden 22% (95) 31% (133) 35% (148) 8% (33) 4% (18) 427Somewhat Favorable of Biden 4% (21) 30% (142) 41% (191) 17% (82) 7% (33) 469Somewhat Unfavorable of Biden — (0) 13% (27) 43% (94) 29% (62) 15% (33) 216Very Unfavorable of Biden 1% (5) 7% (55) 31% (251) 54% (438) 7% (55) 804#1 Issue: Economy 6% (52) 18% (151) 35% (304) 32% (278) 9% (73) 858#1 Issue: Security 3% (8) 9% (24) 30% (82) 50% (136) 8% (23) 274#1 Issue: Health Care 15% (34) 23% (52) 32% (73) 21% (48) 9% (20) 227#1 Issue: Medicare / Social Security 7% (13) 17% (33) 43% (85) 26% (50) 8% (15) 196#1 Issue: Women’s Issues 6% (7) 20% (25) 31% (39) 28% (34) 15% (19) 124#1 Issue: Education 6% (4) 32% (26) 32% (26) 17% (14) 13% (10) 80#1 Issue: Energy 6% (8) 26% (31) 32% (39) 28% (33) 8% (10) 121#1 Issue: Other 2% (2) 18% (21) 41% (49) 26% (31) 13% (15) 1182020 Vote: Joe Biden 11% (101) 28% (263) 39% (367) 16% (153) 6% (61) 9462020 Vote: Donald Trump 2% (20) 9% (77) 33% (286) 47% (405) 9% (76) 8642020 Vote: Didn’t Vote 5% (7) 10% (15) 23% (34) 34% (53) 29% (44) 1532018 House Vote: Democrat 10% (73) 27% (195) 41% (296) 17% (122) 4% (29) 7152018 House Vote: Republican 3% (23) 11% (77) 34% (242) 44% (316) 8% (58) 7162018 House Vote: Someone else 3% (2) 9% (6) 30% (20) 38% (26) 20% (13) 672016 Vote: Hillary Clinton 10% (66) 29% (195) 39% (265) 17% (115) 6% (38) 6792016 Vote: Donald Trump 4% (26) 11% (85) 33% (249) 44% (332) 8% (61) 7542016 Vote: Other 2% (2) 14% (13) 40% (38) 34% (33) 10% (9) 962016 Vote: Didn’t Vote 7% (34) 15% (70) 31% (143) 31% (144) 17% (78) 468Voted in 2014: Yes 7% (92) 19% (258) 38% (511) 31% (418) 6% (81) 1360Voted in 2014: No 6% (36) 16% (105) 29% (185) 32% (207) 17% (105) 638
Continued on next page

94
Morning ConsultTable POL4_2
Table POL4_2: How would you rate each of the following on their handling of the coronavirus?Congress
Demographic Excellent Good Just Fair PoorDon’t Know /No Opinion Total N
Registered Voters 6% (128) 18% (363) 35% (696) 31% (625) 9% (186) 19984-Region: Northeast 11% (40) 17% (60) 35% (124) 27% (95) 10% (34) 3534-Region: Midwest 3% (12) 19% (84) 36% (162) 32% (142) 10% (44) 4444-Region: South 6% (42) 15% (114) 36% (266) 34% (257) 9% (67) 7464-Region: West 8% (34) 23% (105) 32% (144) 29% (131) 9% (41) 455Party: Democrat/Leans Democrat 12% (103) 29% (259) 37% (330) 16% (144) 5% (46) 883Party: Republican/Leans Republican 3% (23) 10% (85) 34% (288) 44% (370) 9% (76) 841Note: Row proportions may total to larger than one-hundred percent due to rounding. For more information visit MorningConsultIntelligence.com.

National Tracking Poll #2112154, December, 2021
95
Table POL4_3
Table POL4_3: How would you rate each of the following on their handling of the coronavirus?Congressional Democrats
Demographic Excellent Good Just Fair PoorDon’t Know /No Opinion Total N
Registered Voters 12% (249) 23% (464) 19% (386) 35% (696) 10% (203) 1998Gender: Male 14% (130) 21% (202) 19% (174) 38% (358) 8% (78) 942Gender: Female 11% (118) 25% (262) 20% (212) 32% (338) 12% (126) 1056Age: 18-34 15% (79) 17% (87) 25% (130) 23% (119) 19% (100) 514Age: 35-44 16% (49) 29% (88) 17% (52) 27% (83) 12% (35) 307Age: 45-64 10% (67) 22% (148) 19% (129) 43% (291) 7% (45) 679Age: 65+ 11% (53) 28% (141) 15% (76) 41% (203) 5% (24) 497GenZers: 1997-2012 9% (16) 11% (20) 26% (47) 25% (46) 28% (51) 181Millennials: 1981-1996 20% (107) 23% (124) 21% (114) 22% (120) 13% (69) 534GenXers: 1965-1980 9% (41) 23% (104) 19% (89) 41% (187) 8% (38) 460Baby Boomers: 1946-1964 10% (77) 26% (196) 17% (127) 42% (315) 5% (40) 755PID: Dem (no lean) 28% (214) 43% (328) 18% (140) 4% (33) 6% (45) 759PID: Ind (no lean) 4% (21) 18% (93) 22% (119) 39% (209) 17% (89) 531PID: Rep (no lean) 2% (14) 6% (43) 18% (127) 64% (454) 10% (70) 708PID/Gender: DemMen 32% (105) 41% (133) 18% (60) 5% (16) 4% (14) 328PID/Gender: DemWomen 25% (109) 45% (194) 19% (80) 4% (17) 7% (30) 431PID/Gender: Ind Men 6% (14) 18% (45) 19% (49) 43% (110) 14% (36) 255PID/Gender: Ind Women 2% (7) 17% (48) 25% (70) 36% (99) 19% (53) 276PID/Gender: Rep Men 3% (12) 7% (23) 18% (66) 65% (232) 7% (27) 359PID/Gender: Rep Women 1% (2) 6% (20) 18% (61) 64% (223) 12% (43) 349Ideo: Liberal (1-3) 27% (156) 44% (252) 20% (114) 5% (26) 5% (29) 576Ideo: Moderate (4) 11% (55) 28% (136) 25% (119) 25% (120) 11% (51) 481Ideo: Conservative (5-7) 4% (33) 8% (63) 18% (138) 64% (499) 6% (43) 776Educ: < College 10% (115) 20% (240) 18% (223) 39% (465) 14% (163) 1206Educ: Bachelors degree 17% (87) 25% (127) 21% (107) 30% (149) 6% (30) 501Educ: Post-grad 16% (46) 33% (97) 19% (56) 28% (81) 3% (10) 290Income: Under 50k 11% (94) 22% (188) 18% (160) 33% (285) 16% (141) 868Income: 50k-100k 14% (103) 24% (177) 20% (146) 35% (253) 6% (45) 725Income: 100k+ 13% (52) 24% (99) 20% (80) 39% (157) 4% (17) 405Ethnicity: White 12% (184) 22% (345) 19% (288) 39% (601) 8% (119) 1536Ethnicity: Hispanic 17% (39) 24% (53) 22% (49) 22% (48) 15% (33) 222
Continued on next page

96
Morning ConsultTable POL4_3
Table POL4_3: How would you rate each of the following on their handling of the coronavirus?Congressional Democrats
Demographic Excellent Good Just Fair PoorDon’t Know /No Opinion Total N
Registered Voters 12% (249) 23% (464) 19% (386) 35% (696) 10% (203) 1998Ethnicity: Black 17% (44) 33% (84) 22% (57) 11% (27) 17% (42) 255Ethnicity: Other 10% (21) 17% (35) 20% (42) 33% (68) 20% (42) 207All Christian 13% (127) 23% (228) 19% (191) 39% (388) 7% (70) 1003All Non-Christian 32% (48) 26% (40) 15% (22) 15% (23) 12% (18) 151Atheist 15% (11) 28% (21) 22% (16) 31% (24) 4% (3) 75Agnostic/Nothing in particular 9% (43) 27% (129) 20% (95) 28% (132) 16% (75) 474Something Else 7% (19) 16% (46) 21% (62) 44% (129) 13% (38) 295Religious Non-Protestant/Catholic 30% (50) 25% (42) 14% (23) 19% (32) 13% (22) 168Evangelical 12% (65) 16% (86) 17% (96) 47% (261) 8% (46) 555Non-Evangelical 11% (79) 26% (183) 21% (154) 34% (245) 8% (55) 715Community: Urban 22% (117) 29% (156) 17% (89) 24% (128) 9% (48) 538Community: Suburban 10% (93) 25% (230) 22% (207) 33% (311) 10% (97) 939Community: Rural 7% (38) 15% (78) 17% (90) 49% (256) 11% (59) 521Employ: Private Sector 14% (94) 24% (166) 23% (158) 33% (228) 6% (41) 687Employ: Government 9% (12) 21% (26) 24% (30) 35% (44) 12% (15) 127Employ: Self-Employed 23% (46) 20% (40) 20% (40) 25% (49) 12% (25) 200Employ: Homemaker 7% (9) 18% (23) 18% (23) 44% (55) 12% (15) 126Employ: Student 15% (9) 13% (8) 30% (18) 24% (15) 18% (11) 61Employ: Retired 10% (54) 26% (135) 15% (80) 43% (223) 6% (29) 520Employ: Unemployed 10% (15) 22% (33) 16% (24) 28% (42) 24% (35) 150Employ: Other 9% (12) 26% (33) 10% (12) 31% (39) 25% (32) 127Military HH: Yes 10% (35) 24% (84) 17% (61) 40% (139) 8% (28) 348Military HH: No 13% (214) 23% (380) 20% (326) 34% (556) 11% (175) 1650RD/WT: Right Direction 30% (227) 43% (322) 17% (126) 3% (21) 6% (48) 743RD/WT: Wrong Track 2% (22) 11% (142) 21% (261) 54% (675) 12% (156) 1255Biden Job Approve 28% (238) 45% (389) 19% (167) 3% (25) 5% (45) 863Biden Job Disapprove 1% (10) 6% (65) 20% (210) 63% (665) 10% (107) 1057
Continued on next page

National Tracking Poll #2112154, December, 2021
97
Table POL4_3
Table POL4_3: How would you rate each of the following on their handling of the coronavirus?Congressional Democrats
Demographic Excellent Good Just Fair PoorDon’t Know /No Opinion Total N
Registered Voters 12% (249) 23% (464) 19% (386) 35% (696) 10% (203) 1998Biden Job Strongly Approve 47% (197) 41% (174) 7% (28) 2% (9) 4% (16) 424Biden Job Somewhat Approve 9% (40) 49% (214) 32% (139) 4% (17) 6% (28) 438Biden Job Somewhat Disapprove 1% (4) 16% (46) 38% (107) 25% (70) 20% (56) 283Biden Job Strongly Disapprove 1% (6) 2% (19) 13% (103) 77% (595) 7% (51) 774Favorable of Biden 26% (229) 46% (409) 20% (175) 3% (28) 6% (55) 896Unfavorable of Biden 1% (9) 5% (49) 20% (201) 65% (663) 10% (98) 1020Very Favorable of Biden 44% (188) 44% (189) 8% (32) 2% (8) 2% (10) 427Somewhat Favorable of Biden 9% (42) 47% (220) 30% (143) 4% (20) 9% (44) 469Somewhat Unfavorable of Biden 1% (2) 12% (27) 40% (87) 26% (57) 20% (44) 216Very Unfavorable of Biden 1% (7) 3% (22) 14% (113) 75% (607) 7% (55) 804#1 Issue: Economy 9% (80) 19% (162) 21% (182) 40% (341) 11% (93) 858#1 Issue: Security 5% (14) 8% (21) 11% (30) 67% (183) 9% (25) 274#1 Issue: Health Care 20% (45) 34% (77) 24% (54) 12% (27) 11% (25) 227#1 Issue: Medicare / Social Security 15% (29) 36% (70) 14% (28) 30% (58) 6% (11) 196#1 Issue: Women’s Issues 23% (28) 28% (35) 18% (22) 16% (19) 16% (19) 124#1 Issue: Education 24% (19) 28% (22) 22% (18) 15% (12) 11% (9) 80#1 Issue: Energy 16% (19) 34% (41) 27% (33) 14% (17) 9% (11) 121#1 Issue: Other 12% (14) 30% (36) 17% (20) 32% (38) 9% (11) 1182020 Vote: Joe Biden 23% (219) 42% (401) 23% (213) 5% (52) 6% (61) 9462020 Vote: Donald Trump 2% (19) 5% (41) 17% (144) 67% (580) 9% (81) 8642020 Vote: Didn’t Vote 6% (9) 11% (17) 13% (20) 32% (49) 37% (57) 1532018 House Vote: Democrat 24% (173) 46% (325) 21% (150) 7% (47) 3% (20) 7152018 House Vote: Republican 3% (22) 7% (50) 16% (114) 66% (471) 8% (59) 7162018 House Vote: Someone else 3% (2) 7% (4) 22% (15) 44% (30) 24% (16) 672016 Vote: Hillary Clinton 24% (163) 47% (321) 20% (133) 5% (33) 4% (28) 6792016 Vote: Donald Trump 4% (27) 6% (49) 17% (125) 65% (487) 9% (66) 7542016 Vote: Other 4% (4) 25% (24) 27% (26) 34% (32) 11% (10) 962016 Vote: Didn’t Vote 12% (54) 15% (69) 22% (102) 31% (143) 21% (99) 468Voted in 2014: Yes 13% (179) 26% (356) 18% (244) 37% (498) 6% (83) 1360Voted in 2014: No 11% (69) 17% (108) 22% (143) 31% (197) 19% (121) 638
Continued on next page
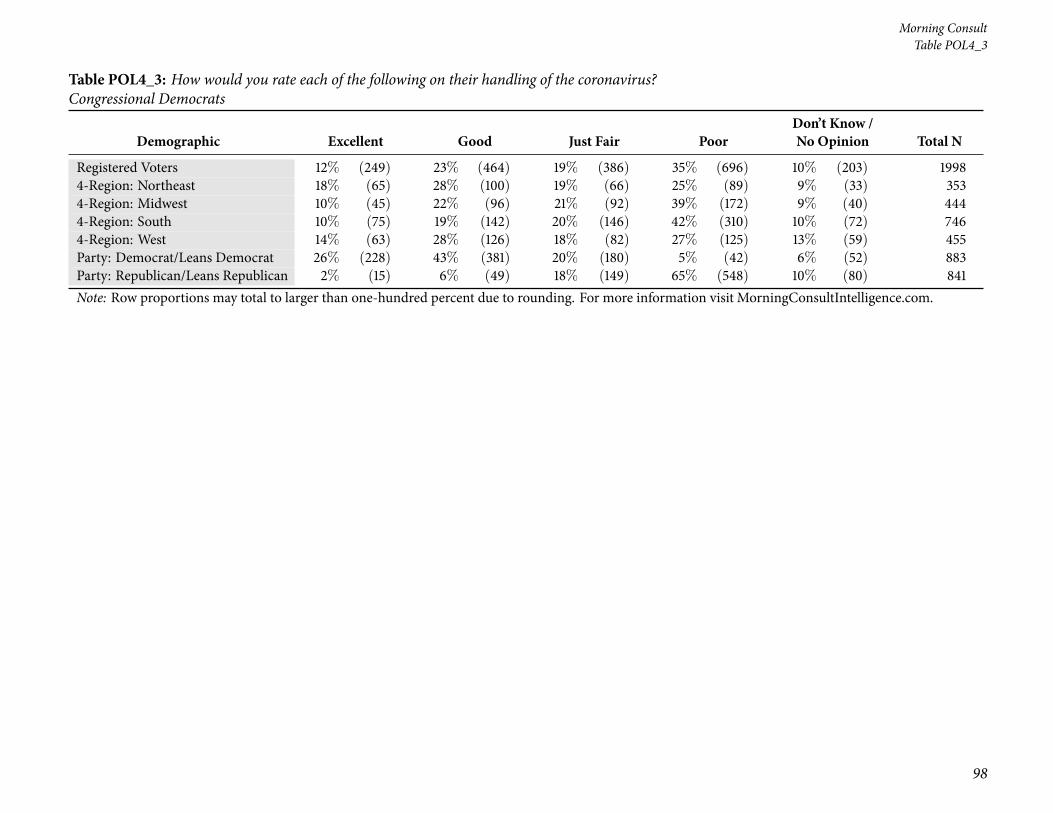
98
Morning ConsultTable POL4_3
Table POL4_3: How would you rate each of the following on their handling of the coronavirus?Congressional Democrats
Demographic Excellent Good Just Fair PoorDon’t Know /No Opinion Total N
Registered Voters 12% (249) 23% (464) 19% (386) 35% (696) 10% (203) 19984-Region: Northeast 18% (65) 28% (100) 19% (66) 25% (89) 9% (33) 3534-Region: Midwest 10% (45) 22% (96) 21% (92) 39% (172) 9% (40) 4444-Region: South 10% (75) 19% (142) 20% (146) 42% (310) 10% (72) 7464-Region: West 14% (63) 28% (126) 18% (82) 27% (125) 13% (59) 455Party: Democrat/Leans Democrat 26% (228) 43% (381) 20% (180) 5% (42) 6% (52) 883Party: Republican/Leans Republican 2% (15) 6% (49) 18% (149) 65% (548) 10% (80) 841Note: Row proportions may total to larger than one-hundred percent due to rounding. For more information visit MorningConsultIntelligence.com.

National Tracking Poll #2112154, December, 2021
99
Table POL4_4
Table POL4_4: How would you rate each of the following on their handling of the coronavirus?Congressional Republicans
Demographic Excellent Good Just Fair PoorDon’t Know /No Opinion Total N
Registered Voters 9% (173) 17% (333) 27% (542) 36% (729) 11% (220) 1998Gender: Male 12% (116) 19% (183) 26% (243) 35% (327) 8% (73) 942Gender: Female 5% (57) 14% (149) 28% (300) 38% (402) 14% (148) 1056Age: 18-34 16% (80) 14% (71) 25% (127) 24% (122) 22% (114) 514Age: 35-44 13% (40) 14% (44) 22% (67) 40% (122) 11% (34) 307Age: 45-64 4% (29) 19% (130) 28% (191) 41% (280) 7% (49) 679Age: 65+ 5% (24) 18% (88) 32% (158) 41% (204) 5% (24) 497GenZers: 1997-2012 8% (15) 12% (21) 22% (40) 25% (44) 33% (60) 181Millennials: 1981-1996 18% (97) 15% (80) 22% (120) 30% (162) 14% (75) 534GenXers: 1965-1980 5% (22) 19% (89) 29% (134) 38% (173) 9% (42) 460Baby Boomers: 1946-1964 4% (31) 17% (126) 31% (232) 44% (329) 5% (38) 755PID: Dem (no lean) 11% (80) 10% (76) 19% (144) 54% (407) 7% (52) 759PID: Ind (no lean) 1% (4) 13% (69) 26% (140) 43% (230) 17% (89) 531PID: Rep (no lean) 13% (89) 27% (189) 37% (259) 13% (92) 11% (80) 708PID/Gender: DemMen 19% (61) 12% (41) 16% (54) 50% (164) 3% (9) 328PID/Gender: DemWomen 5% (19) 8% (35) 21% (90) 56% (243) 10% (43) 431PID/Gender: Ind Men — (0) 14% (35) 26% (66) 46% (118) 14% (35) 255PID/Gender: Ind Women 1% (4) 12% (33) 27% (73) 40% (112) 19% (54) 276PID/Gender: Rep Men 15% (55) 30% (107) 34% (123) 13% (45) 8% (28) 359PID/Gender: Rep Women 10% (34) 23% (81) 39% (136) 14% (47) 15% (51) 349Ideo: Liberal (1-3) 12% (69) 7% (43) 17% (100) 58% (332) 6% (33) 576Ideo: Moderate (4) 4% (20) 13% (62) 28% (133) 43% (208) 12% (58) 481Ideo: Conservative (5-7) 10% (79) 27% (208) 37% (290) 19% (146) 7% (54) 776Educ: < College 7% (85) 18% (220) 28% (339) 32% (386) 15% (176) 1206Educ: Bachelors degree 10% (52) 14% (72) 27% (135) 42% (209) 7% (33) 501Educ: Post-grad 13% (36) 14% (41) 23% (68) 46% (134) 4% (11) 290Income: Under 50k 7% (58) 14% (124) 27% (235) 34% (295) 18% (156) 868Income: 50k-100k 10% (74) 18% (128) 28% (201) 38% (276) 6% (45) 725Income: 100k+ 10% (41) 20% (81) 26% (106) 39% (157) 5% (19) 405Ethnicity: White 10% (150) 17% (256) 29% (448) 36% (556) 8% (127) 1536Ethnicity: Hispanic 12% (27) 14% (31) 27% (60) 32% (71) 15% (34) 222
Continued on next page

100
Morning ConsultTable POL4_4
Table POL4_4: How would you rate each of the following on their handling of the coronavirus?Congressional Republicans
Demographic Excellent Good Just Fair PoorDon’t Know /No Opinion Total N
Registered Voters 9% (173) 17% (333) 27% (542) 36% (729) 11% (220) 1998Ethnicity: Black 5% (12) 15% (37) 22% (55) 38% (97) 21% (54) 255Ethnicity: Other 6% (12) 19% (40) 19% (40) 37% (76) 19% (40) 207All Christian 9% (86) 21% (212) 30% (305) 33% (333) 7% (66) 1003All Non-Christian 26% (39) 13% (19) 16% (24) 31% (47) 14% (21) 151Atheist 8% (6) 7% (5) 15% (11) 66% (50) 4% (3) 75Agnostic/Nothing in particular 4% (17) 10% (46) 20% (96) 48% (227) 19% (89) 474Something Else 9% (26) 17% (50) 36% (106) 24% (71) 14% (42) 295Religious Non-Protestant/Catholic 23% (39) 14% (23) 16% (27) 32% (54) 15% (25) 168Evangelical 14% (80) 25% (139) 30% (169) 22% (121) 8% (46) 555Non-Evangelical 4% (30) 17% (119) 33% (235) 39% (276) 8% (56) 715Community: Urban 18% (96) 16% (85) 22% (120) 33% (179) 11% (59) 538Community: Suburban 4% (37) 15% (138) 29% (273) 41% (388) 11% (102) 939Community: Rural 8% (41) 21% (110) 29% (150) 31% (162) 11% (60) 521Employ: Private Sector 10% (68) 17% (115) 29% (199) 37% (257) 7% (49) 687Employ: Government 11% (14) 25% (32) 24% (31) 29% (37) 11% (14) 127Employ: Self-Employed 16% (33) 18% (36) 24% (49) 31% (63) 10% (20) 200Employ: Homemaker 8% (11) 14% (18) 31% (39) 32% (40) 14% (18) 126Employ: Student 8% (5) 22% (13) 16% (10) 34% (21) 20% (12) 61Employ: Retired 5% (28) 18% (95) 30% (154) 41% (214) 6% (29) 520Employ: Unemployed 3% (5) 7% (10) 21% (31) 40% (60) 29% (43) 150Employ: Other 8% (11) 11% (14) 24% (30) 29% (37) 28% (36) 127Military HH: Yes 10% (34) 20% (71) 29% (102) 33% (114) 8% (26) 348Military HH: No 8% (139) 16% (262) 27% (440) 37% (614) 12% (194) 1650RD/WT: Right Direction 13% (97) 11% (84) 20% (149) 49% (365) 7% (49) 743RD/WT: Wrong Track 6% (76) 20% (249) 31% (394) 29% (364) 14% (171) 1255Biden Job Approve 11% (99) 10% (83) 20% (172) 54% (467) 5% (43) 863Biden Job Disapprove 7% (73) 23% (246) 34% (361) 24% (250) 12% (126) 1057
Continued on next page

National Tracking Poll #2112154, December, 2021
101
Table POL4_4
Table POL4_4: How would you rate each of the following on their handling of the coronavirus?Congressional Republicans
Demographic Excellent Good Just Fair PoorDon’t Know /No Opinion Total N
Registered Voters 9% (173) 17% (333) 27% (542) 36% (729) 11% (220) 1998Biden Job Strongly Approve 21% (90) 10% (43) 12% (51) 53% (225) 4% (15) 424Biden Job Somewhat Approve 2% (9) 9% (40) 27% (120) 55% (242) 6% (28) 438Biden Job Somewhat Disapprove 2% (4) 19% (53) 30% (84) 30% (86) 20% (56) 283Biden Job Strongly Disapprove 9% (69) 25% (193) 36% (277) 21% (164) 9% (71) 774Favorable of Biden 10% (90) 10% (88) 20% (180) 54% (488) 6% (50) 896Unfavorable of Biden 7% (76) 24% (242) 35% (355) 23% (236) 11% (112) 1020Very Favorable of Biden 17% (73) 10% (43) 13% (56) 58% (247) 2% (8) 427Somewhat Favorable of Biden 4% (16) 10% (45) 26% (124) 52% (241) 9% (43) 469Somewhat Unfavorable of Biden 2% (4) 15% (32) 35% (76) 30% (66) 18% (39) 216Very Unfavorable of Biden 9% (72) 26% (210) 35% (279) 21% (170) 9% (73) 804#1 Issue: Economy 8% (72) 19% (165) 32% (275) 28% (241) 12% (106) 858#1 Issue: Security 12% (32) 25% (70) 29% (81) 25% (68) 9% (24) 274#1 Issue: Health Care 13% (29) 10% (23) 18% (42) 47% (106) 12% (28) 227#1 Issue: Medicare / Social Security 5% (10) 14% (27) 26% (51) 49% (96) 7% (13) 196#1 Issue: Women’s Issues 7% (8) 4% (5) 19% (23) 53% (66) 18% (22) 124#1 Issue: Education 7% (6) 21% (17) 25% (20) 33% (27) 13% (10) 80#1 Issue: Energy 11% (14) 14% (17) 19% (23) 50% (60) 6% (7) 121#1 Issue: Other 3% (4) 9% (10) 23% (27) 55% (65) 10% (12) 1182020 Vote: Joe Biden 8% (76) 9% (81) 20% (193) 56% (526) 7% (70) 9462020 Vote: Donald Trump 10% (89) 27% (231) 36% (314) 16% (142) 10% (88) 8642020 Vote: Didn’t Vote 5% (8) 9% (13) 18% (27) 31% (48) 37% (57) 1532018 House Vote: Democrat 6% (45) 8% (61) 19% (133) 64% (455) 3% (21) 7152018 House Vote: Republican 10% (74) 28% (198) 36% (259) 17% (124) 9% (61) 7162018 House Vote: Someone else — (0) 15% (10) 19% (12) 42% (28) 24% (16) 672016 Vote: Hillary Clinton 6% (41) 9% (58) 18% (121) 63% (429) 4% (30) 6792016 Vote: Donald Trump 10% (72) 26% (198) 37% (275) 18% (139) 9% (69) 7542016 Vote: Other — (0) 9% (9) 26% (25) 55% (53) 10% (9) 962016 Vote: Didn’t Vote 13% (59) 15% (68) 26% (121) 23% (108) 24% (113) 468Voted in 2014: Yes 8% (113) 18% (251) 26% (352) 41% (561) 6% (83) 1360Voted in 2014: No 9% (60) 13% (82) 30% (190) 26% (168) 22% (137) 638
Continued on next page

102
Morning ConsultTable POL4_4
Table POL4_4: How would you rate each of the following on their handling of the coronavirus?Congressional Republicans
Demographic Excellent Good Just Fair PoorDon’t Know /No Opinion Total N
Registered Voters 9% (173) 17% (333) 27% (542) 36% (729) 11% (220) 19984-Region: Northeast 10% (36) 15% (54) 23% (82) 40% (142) 11% (39) 3534-Region: Midwest 5% (23) 20% (88) 30% (131) 36% (162) 9% (41) 4444-Region: South 9% (64) 17% (130) 32% (238) 32% (236) 10% (77) 7464-Region: West 11% (50) 13% (61) 20% (91) 42% (189) 14% (64) 455Party: Democrat/Leans Democrat 9% (82) 9% (82) 19% (170) 56% (491) 7% (58) 883Party: Republican/Leans Republican 11% (90) 27% (225) 37% (310) 15% (130) 10% (86) 841Note: Row proportions may total to larger than one-hundred percent due to rounding. For more information visit MorningConsultIntelligence.com.

National Tracking Poll #2112154, December, 2021
103
Table POL4_5
Table POL4_5: How would you rate each of the following on their handling of the coronavirus?The World Health Organization (WHO)
Demographic Excellent Good Just Fair PoorDon’t Know /No Opinion Total N
Registered Voters 15% (300) 27% (535) 22% (434) 27% (537) 10% (191) 1998Gender: Male 18% (168) 25% (232) 20% (190) 30% (283) 7% (69) 942Gender: Female 13% (132) 29% (303) 23% (245) 24% (255) 12% (122) 1056Age: 18-34 19% (98) 22% (116) 27% (138) 14% (74) 17% (88) 514Age: 35-44 17% (51) 31% (96) 20% (61) 23% (70) 9% (28) 307Age: 45-64 11% (73) 27% (186) 20% (139) 33% (225) 8% (56) 679Age: 65+ 16% (78) 28% (137) 19% (96) 34% (167) 4% (19) 497GenZers: 1997-2012 9% (16) 22% (40) 25% (45) 16% (29) 28% (52) 181Millennials: 1981-1996 23% (124) 26% (139) 25% (133) 15% (82) 10% (56) 534GenXers: 1965-1980 11% (50) 28% (128) 22% (99) 32% (147) 8% (36) 460Baby Boomers: 1946-1964 13% (98) 27% (207) 19% (143) 35% (262) 6% (44) 755PID: Dem (no lean) 28% (215) 43% (327) 19% (147) 4% (28) 5% (41) 759PID: Ind (no lean) 8% (40) 24% (128) 23% (120) 31% (166) 14% (76) 531PID: Rep (no lean) 6% (45) 11% (79) 24% (167) 48% (343) 10% (74) 708PID/Gender: DemMen 36% (118) 37% (122) 19% (61) 4% (12) 4% (15) 328PID/Gender: DemWomen 23% (98) 48% (205) 20% (86) 4% (15) 6% (27) 431PID/Gender: Ind Men 7% (18) 26% (66) 19% (48) 34% (88) 13% (34) 255PID/Gender: Ind Women 8% (22) 23% (62) 26% (72) 28% (78) 15% (42) 276PID/Gender: Rep Men 9% (32) 12% (44) 22% (81) 51% (182) 6% (20) 359PID/Gender: Rep Women 4% (13) 10% (35) 25% (87) 46% (161) 15% (53) 349Ideo: Liberal (1-3) 28% (162) 43% (249) 22% (124) 4% (23) 3% (19) 576Ideo: Moderate (4) 15% (70) 31% (151) 25% (120) 19% (93) 10% (47) 481Ideo: Conservative (5-7) 7% (52) 15% (117) 22% (171) 49% (383) 7% (53) 776Educ: < College 12% (143) 23% (277) 22% (268) 30% (362) 13% (155) 1206Educ: Bachelors degree 19% (95) 31% (154) 22% (111) 23% (117) 5% (24) 501Educ: Post-grad 21% (62) 36% (104) 19% (55) 20% (58) 4% (12) 290Income: Under 50k 13% (111) 23% (199) 24% (204) 24% (209) 17% (145) 868Income: 50k-100k 17% (124) 29% (211) 21% (155) 28% (205) 4% (29) 725Income: 100k+ 16% (66) 31% (125) 19% (75) 30% (123) 4% (16) 405Ethnicity: White 15% (237) 26% (400) 21% (318) 31% (470) 7% (112) 1536Ethnicity: Hispanic 16% (35) 24% (54) 30% (67) 16% (35) 14% (31) 222
Continued on next page

104
Morning ConsultTable POL4_5
Table POL4_5: How would you rate each of the following on their handling of the coronavirus?The World Health Organization (WHO)
Demographic Excellent Good Just Fair PoorDon’t Know /No Opinion Total N
Registered Voters 15% (300) 27% (535) 22% (434) 27% (537) 10% (191) 1998Ethnicity: Black 18% (45) 30% (77) 26% (66) 9% (22) 17% (44) 255Ethnicity: Other 9% (18) 28% (59) 24% (51) 21% (44) 17% (36) 207All Christian 16% (161) 28% (276) 22% (217) 30% (302) 5% (47) 1003All Non-Christian 34% (51) 25% (38) 20% (30) 12% (18) 9% (14) 151Atheist 15% (11) 33% (25) 17% (13) 28% (21) 7% (5) 75Agnostic/Nothing in particular 11% (52) 32% (151) 21% (99) 18% (87) 18% (86) 474Something Else 9% (26) 15% (44) 26% (76) 37% (110) 13% (39) 295Religious Non-Protestant/Catholic 33% (55) 25% (41) 20% (34) 13% (22) 10% (17) 168Evangelical 16% (90) 20% (110) 20% (111) 38% (210) 6% (34) 555Non-Evangelical 13% (94) 29% (205) 24% (173) 27% (196) 7% (47) 715Community: Urban 24% (129) 30% (161) 20% (107) 17% (91) 9% (49) 538Community: Suburban 12% (110) 31% (293) 21% (195) 28% (259) 9% (83) 939Community: Rural 12% (61) 16% (82) 25% (132) 36% (187) 11% (59) 521Employ: Private Sector 15% (101) 30% (207) 24% (165) 26% (176) 5% (36) 687Employ: Government 16% (20) 27% (34) 26% (32) 23% (30) 9% (11) 127Employ: Self-Employed 24% (48) 20% (39) 21% (42) 28% (55) 8% (15) 200Employ: Homemaker 8% (10) 21% (27) 20% (25) 31% (39) 20% (25) 126Employ: Student 16% (10) 24% (14) 36% (22) 9% (5) 16% (10) 61Employ: Retired 15% (76) 28% (144) 20% (102) 33% (174) 5% (25) 520Employ: Unemployed 14% (21) 27% (40) 20% (29) 18% (27) 22% (32) 150Employ: Other 11% (14) 22% (29) 12% (16) 24% (31) 29% (38) 127Military HH: Yes 12% (43) 27% (95) 21% (75) 31% (106) 8% (29) 348Military HH: No 16% (257) 27% (440) 22% (360) 26% (431) 10% (163) 1650RD/WT: Right Direction 31% (227) 43% (323) 17% (127) 3% (21) 6% (45) 743RD/WT: Wrong Track 6% (73) 17% (212) 24% (307) 41% (516) 12% (147) 1255Biden Job Approve 29% (254) 45% (389) 18% (159) 2% (21) 5% (39) 863Biden Job Disapprove 4% (39) 13% (134) 25% (264) 48% (510) 10% (109) 1057
Continued on next page

National Tracking Poll #2112154, December, 2021
105
Table POL4_5
Table POL4_5: How would you rate each of the following on their handling of the coronavirus?The World Health Organization (WHO)
Demographic Excellent Good Just Fair PoorDon’t Know /No Opinion Total N
Registered Voters 15% (300) 27% (535) 22% (434) 27% (537) 10% (191) 1998Biden Job Strongly Approve 44% (186) 41% (173) 10% (41) 2% (7) 4% (18) 424Biden Job Somewhat Approve 16% (69) 49% (216) 27% (119) 3% (14) 5% (21) 438Biden Job Somewhat Disapprove 9% (25) 28% (80) 33% (95) 17% (49) 12% (35) 283Biden Job Strongly Disapprove 2% (14) 7% (54) 22% (170) 60% (462) 10% (74) 774Favorable of Biden 29% (261) 46% (410) 18% (161) 3% (23) 5% (40) 896Unfavorable of Biden 3% (28) 11% (113) 26% (265) 50% (508) 10% (105) 1020Very Favorable of Biden 40% (173) 42% (181) 12% (50) 2% (7) 4% (16) 427Somewhat Favorable of Biden 19% (88) 49% (229) 24% (111) 3% (15) 5% (25) 469Somewhat Unfavorable of Biden 5% (11) 25% (54) 40% (87) 15% (33) 14% (31) 216Very Unfavorable of Biden 2% (17) 7% (60) 22% (178) 59% (475) 9% (74) 804#1 Issue: Economy 11% (98) 24% (209) 21% (179) 33% (286) 10% (87) 858#1 Issue: Security 6% (18) 11% (31) 23% (63) 50% (137) 9% (25) 274#1 Issue: Health Care 25% (58) 36% (82) 20% (46) 9% (20) 10% (22) 227#1 Issue: Medicare / Social Security 21% (41) 35% (68) 22% (44) 14% (28) 8% (16) 196#1 Issue: Women’s Issues 21% (25) 35% (43) 21% (26) 11% (13) 12% (15) 124#1 Issue: Education 22% (17) 34% (27) 27% (22) 8% (6) 9% (7) 80#1 Issue: Energy 21% (26) 31% (38) 29% (36) 12% (15) 6% (8) 121#1 Issue: Other 15% (18) 32% (38) 17% (20) 27% (32) 8% (10) 1182020 Vote: Joe Biden 26% (243) 43% (411) 22% (204) 3% (32) 6% (56) 9462020 Vote: Donald Trump 5% (43) 11% (91) 22% (188) 53% (454) 10% (87) 8642020 Vote: Didn’t Vote 8% (13) 16% (25) 19% (28) 28% (42) 29% (44) 1532018 House Vote: Democrat 26% (189) 44% (313) 21% (153) 5% (35) 4% (25) 7152018 House Vote: Republican 7% (47) 13% (90) 20% (145) 52% (376) 8% (58) 7162018 House Vote: Someone else 7% (5) 18% (12) 28% (19) 26% (17) 21% (14) 672016 Vote: Hillary Clinton 27% (180) 46% (313) 19% (131) 4% (27) 4% (27) 6792016 Vote: Donald Trump 7% (54) 11% (84) 21% (157) 53% (402) 7% (56) 7542016 Vote: Other 14% (13) 35% (34) 18% (17) 21% (20) 12% (12) 962016 Vote: Didn’t Vote 11% (52) 22% (104) 28% (130) 18% (86) 20% (96) 468Voted in 2014: Yes 17% (229) 28% (376) 21% (279) 29% (400) 6% (76) 1360Voted in 2014: No 11% (71) 25% (159) 24% (155) 22% (137) 18% (115) 638
Continued on next page

106
Morning ConsultTable POL4_5
Table POL4_5: How would you rate each of the following on their handling of the coronavirus?The World Health Organization (WHO)
Demographic Excellent Good Just Fair PoorDon’t Know /No Opinion Total N
Registered Voters 15% (300) 27% (535) 22% (434) 27% (537) 10% (191) 19984-Region: Northeast 19% (67) 30% (105) 21% (76) 21% (74) 8% (30) 3534-Region: Midwest 13% (57) 29% (128) 21% (92) 28% (123) 10% (44) 4444-Region: South 12% (90) 24% (180) 21% (156) 32% (240) 11% (78) 7464-Region: West 19% (86) 27% (121) 24% (111) 22% (99) 8% (38) 455Party: Democrat/Leans Democrat 27% (240) 43% (376) 21% (185) 4% (35) 5% (47) 883Party: Republican/Leans Republican 5% (46) 13% (106) 23% (191) 49% (413) 10% (86) 841Note: Row proportions may total to larger than one-hundred percent due to rounding. For more information visit MorningConsultIntelligence.com.

National Tracking Poll #2112154, December, 2021
107
Table POL4_6
Table POL4_6: How would you rate each of the following on their handling of the coronavirus?The Centers for Disease Control and Prevention (CDC)
Demographic Excellent Good Just Fair PoorDon’t Know /No Opinion Total N
Registered Voters 19% (382) 31% (613) 21% (417) 22% (443) 7% (143) 1998Gender: Male 21% (197) 28% (265) 21% (202) 23% (213) 7% (65) 942Gender: Female 18% (185) 33% (349) 20% (214) 22% (230) 7% (78) 1056Age: 18-34 19% (96) 28% (143) 23% (116) 16% (84) 15% (75) 514Age: 35-44 20% (61) 33% (102) 18% (56) 22% (67) 7% (21) 307Age: 45-64 17% (113) 30% (203) 21% (142) 27% (185) 5% (35) 679Age: 65+ 22% (111) 33% (166) 20% (101) 21% (107) 3% (13) 497GenZers: 1997-2012 13% (23) 29% (53) 19% (34) 17% (30) 22% (40) 181Millennials: 1981-1996 23% (123) 29% (157) 21% (114) 17% (93) 9% (48) 534GenXers: 1965-1980 14% (66) 31% (141) 23% (106) 26% (118) 6% (28) 460Baby Boomers: 1946-1964 21% (155) 32% (239) 19% (146) 25% (192) 3% (23) 755PID: Dem (no lean) 35% (268) 43% (325) 15% (116) 4% (28) 3% (22) 759PID: Ind (no lean) 12% (65) 26% (139) 23% (123) 28% (146) 11% (58) 531PID: Rep (no lean) 7% (48) 21% (149) 25% (178) 38% (269) 9% (64) 708PID/Gender: DemMen 40% (133) 38% (124) 17% (56) 3% (10) 2% (7) 328PID/Gender: DemWomen 31% (135) 47% (202) 14% (60) 4% (18) 4% (15) 431PID/Gender: Ind Men 13% (33) 27% (70) 22% (57) 27% (68) 11% (28) 255PID/Gender: Ind Women 12% (32) 25% (69) 24% (66) 29% (79) 11% (30) 276PID/Gender: Rep Men 9% (31) 20% (71) 25% (90) 38% (136) 9% (31) 359PID/Gender: Rep Women 5% (17) 22% (78) 25% (88) 38% (133) 9% (33) 349Ideo: Liberal (1-3) 36% (209) 43% (246) 16% (91) 4% (21) 2% (10) 576Ideo: Moderate (4) 19% (90) 35% (168) 23% (112) 16% (78) 7% (32) 481Ideo: Conservative (5-7) 9% (72) 22% (171) 25% (190) 39% (306) 5% (37) 776Educ: < College 16% (188) 28% (341) 21% (249) 26% (309) 10% (119) 1206Educ: Bachelors degree 23% (118) 33% (165) 21% (105) 19% (94) 4% (19) 501Educ: Post-grad 26% (76) 37% (107) 22% (63) 14% (40) 2% (5) 290Income: Under 50k 15% (132) 28% (239) 21% (179) 23% (201) 13% (117) 868Income: 50k-100k 23% (164) 32% (229) 21% (150) 23% (163) 3% (19) 725Income: 100k+ 21% (86) 36% (145) 22% (88) 20% (80) 2% (7) 405Ethnicity: White 20% (307) 30% (458) 20% (310) 25% (379) 5% (82) 1536Ethnicity: Hispanic 23% (51) 28% (62) 22% (50) 17% (39) 10% (21) 222
Continued on next page

108
Morning ConsultTable POL4_6
Table POL4_6: How would you rate each of the following on their handling of the coronavirus?The Centers for Disease Control and Prevention (CDC)
Demographic Excellent Good Just Fair PoorDon’t Know /No Opinion Total N
Registered Voters 19% (382) 31% (613) 21% (417) 22% (443) 7% (143) 1998Ethnicity: Black 20% (51) 34% (87) 21% (53) 13% (32) 12% (32) 255Ethnicity: Other 11% (23) 33% (67) 26% (54) 16% (33) 14% (30) 207All Christian 20% (203) 32% (324) 21% (210) 23% (228) 4% (37) 1003All Non-Christian 38% (57) 28% (42) 16% (24) 10% (16) 8% (12) 151Atheist 20% (15) 39% (29) 14% (11) 27% (20) — (0) 75Agnostic/Nothing in particular 16% (75) 33% (157) 19% (92) 19% (88) 13% (64) 474Something Else 11% (32) 21% (61) 27% (81) 31% (91) 10% (30) 295Religious Non-Protestant/Catholic 35% (60) 28% (47) 15% (26) 12% (21) 9% (15) 168Evangelical 17% (93) 23% (130) 22% (125) 31% (170) 7% (36) 555Non-Evangelical 19% (139) 35% (248) 22% (159) 20% (142) 4% (27) 715Community: Urban 29% (156) 32% (170) 17% (89) 16% (86) 7% (37) 538Community: Suburban 17% (157) 35% (328) 21% (196) 21% (199) 6% (60) 939Community: Rural 13% (69) 22% (115) 25% (132) 30% (159) 9% (47) 521Employ: Private Sector 20% (135) 32% (222) 23% (156) 22% (152) 3% (22) 687Employ: Government 17% (22) 33% (42) 25% (31) 19% (24) 6% (8) 127Employ: Self-Employed 26% (51) 24% (48) 25% (51) 19% (38) 6% (12) 200Employ: Homemaker 14% (17) 23% (28) 18% (22) 31% (39) 15% (19) 126Employ: Student 23% (14) 36% (22) 21% (13) 10% (6) 11% (7) 61Employ: Retired 21% (110) 33% (171) 19% (100) 23% (121) 3% (17) 520Employ: Unemployed 12% (18) 26% (40) 18% (28) 23% (35) 20% (30) 150Employ: Other 11% (14) 32% (40) 13% (16) 22% (28) 22% (28) 127Military HH: Yes 23% (79) 31% (109) 17% (57) 25% (87) 5% (16) 348Military HH: No 18% (303) 31% (504) 22% (359) 22% (357) 8% (128) 1650RD/WT: Right Direction 37% (278) 43% (317) 13% (96) 2% (13) 5% (39) 743RD/WT: Wrong Track 8% (104) 24% (296) 26% (321) 34% (430) 8% (104) 1255Biden Job Approve 37% (321) 43% (375) 14% (123) 2% (18) 3% (25) 863Biden Job Disapprove 5% (52) 21% (227) 27% (284) 39% (414) 8% (79) 1057
Continued on next page

National Tracking Poll #2112154, December, 2021
109
Table POL4_6
Table POL4_6: How would you rate each of the following on their handling of the coronavirus?The Centers for Disease Control and Prevention (CDC)
Demographic Excellent Good Just Fair PoorDon’t Know /No Opinion Total N
Registered Voters 19% (382) 31% (613) 21% (417) 22% (443) 7% (143) 1998Biden Job Strongly Approve 52% (221) 36% (153) 7% (29) 2% (6) 3% (15) 424Biden Job Somewhat Approve 23% (101) 51% (222) 21% (94) 3% (12) 2% (10) 438Biden Job Somewhat Disapprove 10% (27) 38% (107) 29% (82) 15% (43) 8% (23) 283Biden Job Strongly Disapprove 3% (25) 16% (120) 26% (202) 48% (371) 7% (56) 774Favorable of Biden 36% (323) 44% (394) 14% (124) 3% (25) 3% (31) 896Unfavorable of Biden 5% (49) 20% (209) 28% (285) 40% (410) 7% (67) 1020Very Favorable of Biden 50% (213) 38% (163) 8% (34) 2% (8) 2% (10) 427Somewhat Favorable of Biden 24% (110) 49% (231) 19% (89) 4% (17) 4% (21) 469Somewhat Unfavorable of Biden 9% (20) 36% (78) 35% (77) 13% (29) 6% (13) 216Very Unfavorable of Biden 4% (29) 16% (131) 26% (208) 47% (381) 7% (54) 804#1 Issue: Economy 14% (117) 30% (257) 24% (202) 26% (220) 7% (63) 858#1 Issue: Security 9% (24) 19% (52) 21% (59) 42% (115) 9% (24) 274#1 Issue: Health Care 29% (66) 41% (92) 15% (34) 10% (22) 6% (14) 227#1 Issue: Medicare / Social Security 28% (55) 38% (75) 16% (31) 11% (21) 7% (13) 196#1 Issue: Women’s Issues 21% (26) 35% (43) 23% (28) 14% (18) 7% (9) 124#1 Issue: Education 35% (28) 22% (17) 24% (19) 10% (8) 9% (7) 80#1 Issue: Energy 28% (34) 36% (44) 23% (28) 9% (11) 4% (5) 121#1 Issue: Other 26% (31) 28% (34) 13% (16) 25% (29) 7% (8) 1182020 Vote: Joe Biden 34% (319) 43% (405) 17% (157) 4% (33) 3% (31) 9462020 Vote: Donald Trump 6% (48) 19% (160) 26% (228) 41% (354) 9% (74) 8642020 Vote: Didn’t Vote 8% (12) 24% (37) 13% (20) 31% (48) 23% (35) 1532018 House Vote: Democrat 34% (243) 43% (309) 16% (114) 5% (33) 2% (16) 7152018 House Vote: Republican 6% (44) 20% (146) 27% (195) 39% (280) 7% (51) 7162018 House Vote: Someone else 11% (7) 26% (17) 16% (11) 34% (23) 13% (9) 672016 Vote: Hillary Clinton 34% (231) 44% (299) 15% (101) 4% (29) 3% (18) 6792016 Vote: Donald Trump 8% (58) 19% (140) 26% (199) 40% (299) 8% (58) 7542016 Vote: Other 19% (18) 42% (41) 13% (13) 18% (18) 8% (7) 962016 Vote: Didn’t Vote 16% (74) 29% (133) 22% (104) 21% (96) 13% (60) 468Voted in 2014: Yes 20% (273) 32% (433) 21% (289) 22% (300) 5% (65) 1360Voted in 2014: No 17% (109) 28% (180) 20% (127) 23% (144) 12% (78) 638
Continued on next page

110
Morning ConsultTable POL4_6
Table POL4_6: How would you rate each of the following on their handling of the coronavirus?The Centers for Disease Control and Prevention (CDC)
Demographic Excellent Good Just Fair PoorDon’t Know /No Opinion Total N
Registered Voters 19% (382) 31% (613) 21% (417) 22% (443) 7% (143) 19984-Region: Northeast 26% (92) 31% (110) 19% (69) 17% (61) 6% (22) 3534-Region: Midwest 16% (73) 34% (152) 21% (93) 23% (101) 6% (26) 4444-Region: South 17% (127) 28% (206) 22% (161) 27% (203) 7% (49) 7464-Region: West 20% (91) 32% (146) 21% (94) 17% (78) 10% (47) 455Party: Democrat/Leans Democrat 34% (304) 42% (375) 16% (139) 5% (40) 3% (24) 883Party: Republican/Leans Republican 6% (53) 21% (175) 26% (220) 39% (326) 8% (68) 841Note: Row proportions may total to larger than one-hundred percent due to rounding. For more information visit MorningConsultIntelligence.com.

National Tracking Poll #2112154, December, 2021
111
Table POL4_7
Table POL4_7: How would you rate each of the following on their handling of the coronavirus?Your state’s governor
Demographic Excellent Good Just Fair PoorDon’t Know /No Opinion Total N
Registered Voters 18% (367) 29% (584) 18% (353) 28% (561) 7% (133) 1998Gender: Male 21% (197) 28% (263) 17% (160) 28% (264) 6% (58) 942Gender: Female 16% (170) 30% (321) 18% (192) 28% (298) 7% (75) 1056Age: 18-34 14% (72) 25% (131) 22% (115) 22% (116) 16% (80) 514Age: 35-44 19% (58) 35% (107) 16% (49) 25% (76) 6% (17) 307Age: 45-64 16% (112) 28% (192) 17% (118) 34% (232) 4% (26) 679Age: 65+ 25% (125) 31% (154) 14% (71) 28% (138) 2% (10) 497GenZers: 1997-2012 3% (6) 19% (34) 25% (45) 27% (49) 26% (47) 181Millennials: 1981-1996 20% (109) 31% (167) 19% (101) 21% (112) 8% (44) 534GenXers: 1965-1980 14% (63) 30% (136) 18% (84) 34% (155) 5% (22) 460Baby Boomers: 1946-1964 21% (160) 31% (230) 15% (114) 31% (233) 2% (18) 755PID: Dem (no lean) 27% (206) 33% (249) 16% (120) 20% (155) 4% (28) 759PID: Ind (no lean) 10% (55) 29% (155) 21% (113) 29% (155) 10% (52) 531PID: Rep (no lean) 15% (106) 25% (179) 17% (120) 35% (251) 7% (52) 708PID/Gender: DemMen 32% (105) 33% (108) 15% (50) 17% (57) 2% (8) 328PID/Gender: DemWomen 23% (101) 33% (141) 16% (70) 23% (98) 5% (20) 431PID/Gender: Ind Men 11% (28) 26% (67) 18% (47) 35% (89) 9% (24) 255PID/Gender: Ind Women 10% (28) 32% (88) 24% (66) 24% (66) 10% (28) 276PID/Gender: Rep Men 18% (64) 24% (87) 18% (64) 33% (118) 7% (26) 359PID/Gender: Rep Women 12% (42) 26% (91) 16% (57) 38% (133) 8% (26) 349Ideo: Liberal (1-3) 29% (164) 35% (201) 15% (84) 20% (113) 2% (14) 576Ideo: Moderate (4) 15% (74) 32% (152) 23% (113) 23% (112) 6% (30) 481Ideo: Conservative (5-7) 15% (119) 28% (215) 17% (132) 36% (281) 4% (30) 776Educ: < College 14% (170) 29% (351) 17% (201) 31% (377) 9% (107) 1206Educ: Bachelors degree 24% (119) 28% (141) 21% (106) 23% (115) 4% (21) 501Educ: Post-grad 27% (78) 32% (92) 16% (46) 24% (70) 2% (5) 290Income: Under 50k 15% (133) 26% (222) 18% (153) 29% (253) 12% (108) 868Income: 50k-100k 21% (155) 31% (222) 17% (126) 28% (206) 2% (17) 725Income: 100k+ 19% (79) 35% (140) 18% (74) 25% (103) 2% (8) 405Ethnicity: White 20% (312) 29% (447) 17% (255) 29% (449) 5% (73) 1536Ethnicity: Hispanic 14% (31) 40% (90) 17% (37) 19% (43) 10% (21) 222
Continued on next page

112
Morning ConsultTable POL4_7
Table POL4_7: How would you rate each of the following on their handling of the coronavirus?Your state’s governor
Demographic Excellent Good Just Fair PoorDon’t Know /No Opinion Total N
Registered Voters 18% (367) 29% (584) 18% (353) 28% (561) 7% (133) 1998Ethnicity: Black 12% (29) 28% (71) 23% (58) 23% (60) 14% (36) 255Ethnicity: Other 12% (25) 32% (65) 19% (40) 25% (53) 12% (24) 207All Christian 21% (210) 31% (311) 18% (181) 27% (267) 3% (33) 1003All Non-Christian 31% (46) 30% (45) 11% (16) 20% (29) 9% (14) 151Atheist 11% (8) 20% (15) 22% (17) 46% (34) 1% (1) 75Agnostic/Nothing in particular 13% (59) 29% (136) 17% (82) 29% (139) 12% (57) 474Something Else 15% (44) 26% (77) 19% (56) 31% (91) 9% (28) 295Religious Non-Protestant/Catholic 29% (49) 30% (51) 12% (21) 18% (30) 10% (17) 168Evangelical 22% (121) 28% (155) 16% (88) 29% (159) 6% (32) 555Non-Evangelical 18% (129) 31% (223) 20% (143) 27% (195) 3% (25) 715Community: Urban 28% (148) 29% (156) 15% (80) 22% (116) 7% (37) 538Community: Suburban 16% (146) 31% (294) 19% (174) 29% (271) 6% (54) 939Community: Rural 14% (73) 26% (134) 19% (99) 33% (174) 8% (42) 521Employ: Private Sector 19% (130) 28% (194) 21% (145) 28% (191) 4% (27) 687Employ: Government 17% (22) 34% (43) 17% (22) 24% (30) 8% (10) 127Employ: Self-Employed 22% (43) 27% (55) 13% (26) 32% (65) 6% (11) 200Employ: Homemaker 10% (13) 35% (44) 19% (23) 27% (34) 9% (11) 126Employ: Student 5% (3) 21% (13) 25% (15) 32% (19) 17% (10) 61Employ: Retired 23% (119) 30% (156) 17% (88) 28% (144) 2% (13) 520Employ: Unemployed 14% (20) 20% (30) 16% (24) 30% (45) 21% (31) 150Employ: Other 14% (17) 37% (48) 8% (10) 26% (33) 15% (20) 127Military HH: Yes 19% (65) 30% (106) 20% (69) 27% (95) 4% (12) 348Military HH: No 18% (302) 29% (478) 17% (284) 28% (466) 7% (121) 1650RD/WT: Right Direction 28% (209) 33% (243) 16% (122) 17% (129) 5% (40) 743RD/WT: Wrong Track 13% (158) 27% (341) 18% (231) 34% (433) 7% (93) 1255Biden Job Approve 28% (241) 34% (290) 17% (147) 18% (151) 4% (32) 863Biden Job Disapprove 12% (124) 27% (284) 18% (196) 37% (390) 6% (64) 1057
Continued on next page

National Tracking Poll #2112154, December, 2021
113
Table POL4_7
Table POL4_7: How would you rate each of the following on their handling of the coronavirus?Your state’s governor
Demographic Excellent Good Just Fair PoorDon’t Know /No Opinion Total N
Registered Voters 18% (367) 29% (584) 18% (353) 28% (561) 7% (133) 1998Biden Job Strongly Approve 40% (170) 29% (121) 11% (45) 17% (74) 3% (14) 424Biden Job Somewhat Approve 16% (71) 39% (169) 23% (102) 18% (78) 4% (18) 438Biden Job Somewhat Disapprove 7% (21) 28% (80) 24% (69) 32% (91) 8% (23) 283Biden Job Strongly Disapprove 13% (104) 26% (204) 16% (126) 39% (299) 5% (41) 774Favorable of Biden 27% (238) 33% (300) 17% (156) 18% (165) 4% (37) 896Unfavorable of Biden 12% (122) 27% (275) 19% (193) 37% (381) 5% (49) 1020Very Favorable of Biden 39% (167) 29% (122) 14% (59) 17% (72) 2% (8) 427Somewhat Favorable of Biden 15% (71) 38% (177) 21% (97) 20% (93) 6% (29) 469Somewhat Unfavorable of Biden 6% (13) 32% (69) 29% (62) 28% (60) 6% (12) 216Very Unfavorable of Biden 14% (109) 26% (206) 16% (130) 40% (321) 5% (37) 804#1 Issue: Economy 15% (131) 30% (254) 17% (149) 31% (268) 6% (55) 858#1 Issue: Security 15% (42) 24% (65) 17% (46) 38% (105) 6% (16) 274#1 Issue: Health Care 21% (47) 32% (73) 20% (46) 21% (47) 6% (14) 227#1 Issue: Medicare / Social Security 31% (60) 32% (63) 13% (25) 21% (42) 3% (7) 196#1 Issue: Women’s Issues 21% (26) 33% (41) 15% (19) 18% (22) 13% (16) 124#1 Issue: Education 15% (12) 26% (21) 29% (23) 19% (15) 11% (9) 80#1 Issue: Energy 20% (24) 30% (36) 27% (32) 18% (22) 5% (6) 121#1 Issue: Other 21% (24) 26% (31) 10% (12) 34% (40) 9% (11) 1182020 Vote: Joe Biden 24% (230) 33% (310) 18% (174) 20% (193) 4% (38) 9462020 Vote: Donald Trump 14% (124) 27% (235) 17% (145) 36% (309) 6% (52) 8642020 Vote: Didn’t Vote 6% (8) 18% (28) 17% (26) 33% (51) 26% (40) 1532018 House Vote: Democrat 26% (186) 32% (227) 18% (132) 22% (154) 2% (16) 7152018 House Vote: Republican 16% (112) 26% (189) 17% (120) 35% (252) 6% (43) 7162018 House Vote: Someone else 9% (6) 28% (19) 22% (15) 26% (17) 15% (10) 672016 Vote: Hillary Clinton 27% (184) 33% (223) 17% (117) 20% (137) 3% (18) 6792016 Vote: Donald Trump 16% (117) 26% (196) 17% (128) 36% (268) 6% (44) 7542016 Vote: Other 10% (10) 36% (34) 20% (19) 24% (23) 10% (9) 962016 Vote: Didn’t Vote 12% (56) 27% (128) 19% (88) 28% (133) 13% (62) 468Voted in 2014: Yes 21% (291) 30% (409) 17% (226) 28% (379) 4% (55) 1360Voted in 2014: No 12% (76) 27% (175) 20% (127) 29% (182) 12% (78) 638
Continued on next page

114
Morning ConsultTable POL4_7
Table POL4_7: How would you rate each of the following on their handling of the coronavirus?Your state’s governor
Demographic Excellent Good Just Fair PoorDon’t Know /No Opinion Total N
Registered Voters 18% (367) 29% (584) 18% (353) 28% (561) 7% (133) 19984-Region: Northeast 25% (88) 27% (96) 16% (55) 26% (91) 7% (23) 3534-Region: Midwest 16% (71) 29% (128) 19% (84) 31% (136) 6% (25) 4444-Region: South 18% (131) 27% (205) 19% (141) 30% (227) 6% (41) 7464-Region: West 17% (76) 34% (156) 16% (73) 23% (107) 10% (44) 455Party: Democrat/Leans Democrat 25% (224) 34% (297) 17% (148) 21% (182) 4% (32) 883Party: Republican/Leans Republican 15% (128) 27% (224) 17% (145) 35% (290) 7% (55) 841Note: Row proportions may total to larger than one-hundred percent due to rounding. For more information visit MorningConsultIntelligence.com.

National Tracking Poll #2112154, December, 2021
115
Table POL4_8
Table POL4_8: How would you rate each of the following on their handling of the coronavirus?Dr. Anthony Fauci, Director of the National Institute of Allergy and Infectious Diseases
Demographic Excellent Good Just Fair PoorDon’t Know /No Opinion Total N
Registered Voters 27% (535) 20% (408) 13% (255) 31% (624) 9% (176) 1998Gender: Male 28% (264) 18% (170) 13% (125) 33% (314) 7% (68) 942Gender: Female 26% (271) 23% (238) 12% (129) 29% (310) 10% (107) 1056Age: 18-34 22% (112) 20% (101) 17% (90) 21% (106) 21% (106) 514Age: 35-44 23% (71) 28% (87) 14% (43) 26% (79) 9% (27) 307Age: 45-64 25% (169) 21% (140) 10% (69) 39% (268) 5% (34) 679Age: 65+ 37% (183) 16% (80) 11% (53) 34% (171) 2% (9) 497GenZers: 1997-2012 15% (28) 18% (33) 19% (34) 18% (33) 30% (54) 181Millennials: 1981-1996 26% (138) 24% (126) 16% (84) 21% (114) 13% (71) 534GenXers: 1965-1980 21% (98) 20% (94) 13% (59) 40% (182) 6% (28) 460Baby Boomers: 1946-1964 32% (245) 19% (147) 9% (66) 37% (276) 3% (21) 755PID: Dem (no lean) 52% (391) 28% (212) 11% (83) 5% (38) 5% (35) 759PID: Ind (no lean) 15% (78) 24% (127) 12% (63) 34% (182) 15% (81) 531PID: Rep (no lean) 9% (66) 10% (70) 15% (109) 57% (404) 8% (59) 708PID/Gender: DemMen 54% (177) 24% (78) 15% (50) 5% (15) 2% (8) 328PID/Gender: DemWomen 50% (214) 31% (134) 8% (33) 5% (23) 6% (27) 431PID/Gender: Ind Men 17% (44) 23% (59) 9% (22) 37% (95) 13% (33) 255PID/Gender: Ind Women 12% (34) 24% (67) 15% (40) 31% (87) 17% (48) 276PID/Gender: Rep Men 12% (42) 9% (33) 15% (53) 57% (204) 7% (27) 359PID/Gender: Rep Women 7% (23) 11% (37) 16% (55) 57% (201) 9% (33) 349Ideo: Liberal (1-3) 54% (309) 26% (152) 9% (55) 6% (32) 5% (29) 576Ideo: Moderate (4) 27% (130) 29% (138) 14% (68) 22% (107) 8% (38) 481Ideo: Conservative (5-7) 11% (86) 12% (97) 15% (117) 57% (445) 4% (32) 776Educ: < College 21% (248) 18% (216) 13% (155) 37% (441) 12% (145) 1206Educ: Bachelors degree 34% (172) 24% (118) 13% (66) 24% (122) 5% (23) 501Educ: Post-grad 39% (114) 26% (75) 11% (33) 21% (61) 3% (8) 290Income: Under 50k 21% (185) 19% (166) 13% (117) 31% (265) 16% (135) 868Income: 50k-100k 30% (219) 21% (154) 12% (84) 33% (237) 4% (30) 725Income: 100k+ 32% (131) 22% (88) 13% (54) 30% (122) 3% (10) 405Ethnicity: White 27% (420) 19% (297) 12% (179) 36% (550) 6% (89) 1536Ethnicity: Hispanic 31% (70) 21% (46) 12% (28) 20% (44) 16% (35) 222
Continued on next page

116
Morning ConsultTable POL4_8
Table POL4_8: How would you rate each of the following on their handling of the coronavirus?Dr. Anthony Fauci, Director of the National Institute of Allergy and Infectious Diseases
Demographic Excellent Good Just Fair PoorDon’t Know /No Opinion Total N
Registered Voters 27% (535) 20% (408) 13% (255) 31% (624) 9% (176) 1998Ethnicity: Black 28% (72) 23% (58) 19% (49) 11% (28) 19% (47) 255Ethnicity: Other 21% (43) 26% (53) 13% (27) 22% (46) 19% (39) 207All Christian 29% (288) 20% (200) 13% (128) 34% (341) 5% (47) 1003All Non-Christian 43% (65) 27% (40) 8% (13) 11% (16) 11% (17) 151Atheist 32% (24) 23% (17) 11% (9) 30% (23) 4% (3) 75Agnostic/Nothing in particular 27% (127) 23% (109) 12% (59) 25% (117) 13% (62) 474Something Else 10% (31) 15% (43) 16% (47) 44% (129) 16% (46) 295Religious Non-Protestant/Catholic 41% (69) 24% (41) 9% (16) 13% (22) 12% (20) 168Evangelical 17% (93) 18% (99) 16% (87) 43% (240) 6% (36) 555Non-Evangelical 31% (218) 20% (141) 11% (82) 31% (222) 7% (52) 715Community: Urban 35% (188) 24% (129) 12% (66) 20% (108) 9% (47) 538Community: Suburban 29% (273) 21% (197) 12% (110) 31% (287) 8% (72) 939Community: Rural 14% (75) 16% (82) 15% (78) 44% (230) 11% (57) 521Employ: Private Sector 26% (180) 25% (171) 15% (102) 28% (195) 5% (38) 687Employ: Government 22% (27) 25% (32) 10% (13) 32% (40) 12% (15) 127Employ: Self-Employed 27% (55) 17% (33) 15% (30) 30% (60) 11% (22) 200Employ: Homemaker 13% (16) 18% (23) 13% (16) 43% (54) 13% (16) 126Employ: Student 24% (14) 17% (10) 23% (14) 20% (12) 17% (10) 61Employ: Retired 34% (179) 18% (93) 9% (47) 36% (188) 3% (13) 520Employ: Unemployed 25% (38) 17% (26) 10% (15) 24% (35) 23% (35) 150Employ: Other 20% (26) 15% (20) 12% (16) 30% (38) 22% (28) 127Military HH: Yes 29% (101) 19% (67) 9% (30) 36% (125) 7% (24) 348Military HH: No 26% (434) 21% (342) 14% (224) 30% (500) 9% (151) 1650RD/WT: Right Direction 52% (388) 29% (217) 9% (70) 3% (24) 6% (44) 743RD/WT: Wrong Track 12% (147) 15% (191) 15% (185) 48% (601) 10% (131) 1255Biden Job Approve 53% (458) 31% (268) 9% (76) 3% (27) 4% (34) 863Biden Job Disapprove 6% (67) 12% (131) 16% (167) 56% (592) 9% (100) 1057
Continued on next page

National Tracking Poll #2112154, December, 2021
117
Table POL4_8
Table POL4_8: How would you rate each of the following on their handling of the coronavirus?Dr. Anthony Fauci, Director of the National Institute of Allergy and Infectious Diseases
Demographic Excellent Good Just Fair PoorDon’t Know /No Opinion Total N
Registered Voters 27% (535) 20% (408) 13% (255) 31% (624) 9% (176) 1998Biden Job Strongly Approve 67% (286) 23% (96) 6% (24) 1% (4) 3% (13) 424Biden Job Somewhat Approve 39% (172) 39% (172) 12% (52) 5% (22) 5% (21) 438Biden Job Somewhat Disapprove 16% (45) 25% (72) 24% (69) 19% (55) 15% (43) 283Biden Job Strongly Disapprove 3% (21) 8% (60) 13% (98) 69% (537) 7% (57) 774Favorable of Biden 52% (464) 31% (280) 9% (82) 3% (28) 5% (42) 896Unfavorable of Biden 5% (53) 11% (117) 16% (167) 58% (592) 9% (90) 1020Very Favorable of Biden 67% (287) 23% (97) 7% (28) 1% (4) 3% (12) 427Somewhat Favorable of Biden 38% (177) 39% (184) 12% (54) 5% (24) 6% (30) 469Somewhat Unfavorable of Biden 14% (30) 27% (58) 25% (55) 20% (43) 14% (31) 216Very Unfavorable of Biden 3% (23) 7% (59) 14% (112) 68% (550) 7% (60) 804#1 Issue: Economy 18% (158) 21% (177) 15% (129) 36% (306) 10% (87) 858#1 Issue: Security 11% (31) 9% (25) 11% (29) 60% (165) 9% (23) 274#1 Issue: Health Care 43% (98) 26% (59) 13% (30) 11% (26) 6% (14) 227#1 Issue: Medicare / Social Security 43% (84) 22% (43) 9% (18) 21% (42) 4% (9) 196#1 Issue: Women’s Issues 35% (43) 28% (35) 9% (11) 18% (23) 10% (12) 124#1 Issue: Education 37% (29) 26% (21) 14% (11) 14% (11) 8% (7) 80#1 Issue: Energy 35% (43) 24% (29) 14% (17) 16% (19) 11% (13) 121#1 Issue: Other 40% (48) 16% (19) 7% (8) 27% (32) 9% (11) 1182020 Vote: Joe Biden 50% (470) 30% (286) 11% (106) 4% (35) 5% (49) 9462020 Vote: Donald Trump 5% (47) 10% (90) 14% (118) 62% (532) 9% (77) 8642020 Vote: Didn’t Vote 11% (17) 13% (20) 14% (22) 32% (48) 30% (46) 1532018 House Vote: Democrat 52% (369) 29% (205) 11% (80) 5% (37) 3% (24) 7152018 House Vote: Republican 9% (61) 12% (84) 14% (102) 58% (416) 7% (52) 7162018 House Vote: Someone else 18% (12) 20% (13) 11% (8) 37% (25) 13% (9) 672016 Vote: Hillary Clinton 53% (361) 30% (200) 10% (69) 4% (26) 3% (24) 6792016 Vote: Donald Trump 8% (63) 12% (89) 14% (107) 59% (442) 7% (54) 7542016 Vote: Other 27% (26) 22% (21) 11% (11) 27% (26) 13% (12) 962016 Vote: Didn’t Vote 18% (85) 21% (98) 15% (69) 28% (131) 18% (86) 468Voted in 2014: Yes 30% (411) 20% (271) 12% (168) 32% (440) 5% (71) 1360Voted in 2014: No 19% (124) 22% (137) 14% (87) 29% (184) 16% (105) 638
Continued on next page

118
Morning ConsultTable POL4_8
Table POL4_8: How would you rate each of the following on their handling of the coronavirus?Dr. Anthony Fauci, Director of the National Institute of Allergy and Infectious Diseases
Demographic Excellent Good Just Fair PoorDon’t Know /No Opinion Total N
Registered Voters 27% (535) 20% (408) 13% (255) 31% (624) 9% (176) 19984-Region: Northeast 35% (124) 21% (76) 12% (43) 24% (85) 7% (25) 3534-Region: Midwest 24% (106) 22% (96) 15% (65) 31% (140) 8% (37) 4444-Region: South 23% (172) 18% (132) 13% (97) 39% (290) 7% (54) 7464-Region: West 29% (133) 23% (104) 11% (49) 24% (110) 13% (59) 455Party: Democrat/Leans Democrat 50% (437) 29% (256) 11% (98) 5% (48) 5% (44) 883Party: Republican/Leans Republican 8% (67) 11% (92) 15% (126) 58% (488) 8% (69) 841Note: Row proportions may total to larger than one-hundred percent due to rounding. For more information visit MorningConsultIntelligence.com.

National Tracking Poll #2112154, December, 2021
119
Table POL5
Table POL5: Generally speaking, would you say you are more concerned about...
Demographic
The economic impact ofcoronavirus including theeffect on the stock market
and increasedunemployment
The public health impactof coronavirus includingthe spread of the diseasewhich would cause more
deathsDon’t know / No
opinion Total N
Registered Voters 41% (816) 51% (1012) 9% (170) 1998Gender: Male 45% (425) 48% (451) 7% (66) 942Gender: Female 37% (391) 53% (561) 10% (104) 1056Age: 18-34 42% (218) 43% (220) 15% (76) 514Age: 35-44 45% (138) 48% (147) 7% (22) 307Age: 45-64 44% (298) 50% (338) 6% (43) 679Age: 65+ 32% (161) 62% (307) 6% (29) 497GenZers: 1997-2012 34% (62) 41% (74) 25% (45) 181Millennials: 1981-1996 45% (240) 46% (247) 9% (46) 534GenXers: 1965-1980 46% (214) 46% (213) 7% (33) 460Baby Boomers: 1946-1964 37% (279) 57% (434) 6% (42) 755PID: Dem (no lean) 25% (190) 69% (523) 6% (46) 759PID: Ind (no lean) 39% (207) 49% (258) 12% (66) 531PID: Rep (no lean) 59% (418) 33% (231) 8% (59) 708PID/Gender: DemMen 32% (106) 64% (209) 4% (13) 328PID/Gender: DemWomen 19% (84) 73% (314) 8% (33) 431PID/Gender: Ind Men 40% (102) 47% (121) 13% (33) 255PID/Gender: Ind Women 38% (105) 50% (138) 12% (33) 276PID/Gender: Rep Men 60% (217) 34% (122) 6% (21) 359PID/Gender: Rep Women 58% (202) 31% (110) 11% (38) 349Ideo: Liberal (1-3) 27% (153) 68% (393) 5% (31) 576Ideo: Moderate (4) 36% (171) 59% (283) 6% (27) 481Ideo: Conservative (5-7) 58% (449) 34% (267) 8% (60) 776Educ: < College 40% (486) 48% (581) 12% (139) 1206Educ: Bachelors degree 45% (224) 51% (256) 4% (21) 501Educ: Post-grad 36% (106) 60% (175) 3% (10) 290Income: Under 50k 37% (321) 50% (431) 13% (117) 868Income: 50k-100k 42% (306) 52% (378) 6% (41) 725Income: 100k+ 47% (189) 50% (203) 3% (13) 405
Continued on next page

120
Morning ConsultTable POL5
Table POL5: Generally speaking, would you say you are more concerned about...
Demographic
The economic impact ofcoronavirus including theeffect on the stock market
and increasedunemployment
The public health impactof coronavirus includingthe spread of the diseasewhich would cause more
deathsDon’t know / No
opinion Total N
Registered Voters 41% (816) 51% (1012) 9% (170) 1998Ethnicity: White 43% (657) 50% (774) 7% (106) 1536Ethnicity: Hispanic 46% (101) 45% (100) 10% (21) 222Ethnicity: Black 30% (75) 54% (138) 16% (41) 255Ethnicity: Other 40% (84) 48% (100) 11% (24) 207All Christian 45% (448) 51% (509) 5% (47) 1003All Non-Christian 36% (55) 58% (87) 6% (9) 151Atheist 42% (31) 56% (42) 2% (2) 75Agnostic/Nothing in particular 31% (145) 54% (256) 15% (73) 474Something Else 46% (137) 40% (118) 14% (40) 295Religious Non-Protestant/Catholic 37% (62) 58% (97) 5% (9) 168Evangelical 51% (282) 40% (222) 9% (51) 555Non-Evangelical 41% (290) 55% (391) 5% (34) 715Community: Urban 38% (206) 54% (289) 8% (42) 538Community: Suburban 40% (379) 51% (480) 8% (80) 939Community: Rural 44% (230) 47% (243) 9% (48) 521Employ: Private Sector 48% (329) 49% (336) 3% (21) 687Employ: Government 46% (59) 49% (62) 5% (6) 127Employ: Self-Employed 52% (104) 42% (85) 6% (11) 200Employ: Homemaker 41% (52) 46% (58) 13% (17) 126Employ: Student 28% (17) 59% (36) 13% (8) 61Employ: Retired 33% (169) 60% (314) 7% (38) 520Employ: Unemployed 28% (42) 45% (67) 27% (41) 150Employ: Other 34% (43) 43% (55) 23% (29) 127Military HH: Yes 41% (141) 52% (181) 7% (25) 348Military HH: No 41% (675) 50% (831) 9% (145) 1650RD/WT: Right Direction 27% (197) 67% (499) 6% (47) 743RD/WT: Wrong Track 49% (619) 41% (513) 10% (123) 1255
Continued on next page

National Tracking Poll #2112154, December, 2021
121
Table POL5
Table POL5: Generally speaking, would you say you are more concerned about...
Demographic
The economic impact ofcoronavirus including theeffect on the stock market
and increasedunemployment
The public health impactof coronavirus includingthe spread of the diseasewhich would cause more
deathsDon’t know / No
opinion Total N
Registered Voters 41% (816) 51% (1012) 9% (170) 1998Biden Job Approve 26% (220) 70% (603) 5% (39) 863Biden Job Disapprove 55% (576) 36% (381) 9% (100) 1057Biden Job Strongly Approve 26% (108) 70% (297) 4% (19) 424Biden Job Somewhat Approve 26% (112) 70% (306) 5% (20) 438Biden Job Somewhat Disapprove 36% (103) 53% (151) 11% (30) 283Biden Job Strongly Disapprove 61% (474) 30% (230) 9% (70) 774Favorable of Biden 26% (229) 69% (620) 5% (47) 896Unfavorable of Biden 57% (578) 34% (350) 9% (92) 1020Very Favorable of Biden 23% (98) 73% (310) 5% (19) 427Somewhat Favorable of Biden 28% (131) 66% (310) 6% (28) 469Somewhat Unfavorable of Biden 37% (79) 53% (114) 10% (23) 216Very Unfavorable of Biden 62% (499) 29% (236) 9% (69) 804#1 Issue: Economy 54% (464) 39% (331) 7% (63) 858#1 Issue: Security 50% (137) 42% (115) 8% (22) 274#1 Issue: Health Care 20% (44) 71% (162) 9% (21) 227#1 Issue: Medicare / Social Security 23% (44) 71% (139) 7% (13) 196#1 Issue: Women’s Issues 23% (29) 67% (83) 10% (12) 124#1 Issue: Education 36% (28) 46% (37) 18% (14) 80#1 Issue: Energy 33% (40) 61% (74) 6% (7) 121#1 Issue: Other 24% (29) 61% (72) 15% (17) 1182020 Vote: Joe Biden 24% (228) 71% (670) 5% (47) 9462020 Vote: Donald Trump 60% (517) 31% (269) 9% (78) 8642020 Vote: Didn’t Vote 39% (60) 34% (52) 27% (42) 1532018 House Vote: Democrat 23% (163) 73% (521) 4% (31) 7152018 House Vote: Republican 60% (429) 33% (238) 7% (48) 7162018 House Vote: Someone else 45% (30) 39% (26) 16% (11) 67
Continued on next page

122
Morning ConsultTable POL5
Table POL5: Generally speaking, would you say you are more concerned about...
Demographic
The economic impact ofcoronavirus including theeffect on the stock market
and increasedunemployment
The public health impactof coronavirus includingthe spread of the diseasewhich would cause more
deathsDon’t know / No
opinion Total N
Registered Voters 41% (816) 51% (1012) 9% (170) 19982016 Vote: Hillary Clinton 21% (145) 75% (506) 4% (28) 6792016 Vote: Donald Trump 58% (440) 35% (260) 7% (53) 7542016 Vote: Other 40% (39) 54% (52) 5% (5) 962016 Vote: Didn’t Vote 41% (191) 41% (192) 18% (84) 468Voted in 2014: Yes 41% (556) 54% (731) 5% (73) 1360Voted in 2014: No 41% (259) 44% (281) 15% (98) 6384-Region: Northeast 40% (142) 55% (195) 4% (16) 3534-Region: Midwest 42% (186) 49% (219) 9% (39) 4444-Region: South 43% (321) 46% (339) 11% (85) 7464-Region: West 37% (166) 57% (258) 7% (30) 455Party: Democrat/Leans Democrat 25% (219) 69% (610) 6% (54) 883Party: Republican/Leans Republican 59% (500) 32% (271) 8% (71) 841Note: Row proportions may total to larger than one-hundred percent due to rounding. For more information visit MorningConsultIntelligence.com.

National Tracking Poll #2112154, December, 2021
123
Table POL6
Table POL6: Currently, do you believe it’s more important for the government to address the:
DemographicThe spread ofcoronavirus The economy
Don’t know / Noopinion Total N
Registered Voters 46% (916) 46% (918) 8% (164) 1998Gender: Male 45% (421) 49% (465) 6% (56) 942Gender: Female 47% (495) 43% (453) 10% (108) 1056Age: 18-34 47% (240) 42% (214) 12% (61) 514Age: 35-44 42% (129) 48% (148) 10% (31) 307Age: 45-64 41% (282) 51% (350) 7% (48) 679Age: 65+ 53% (266) 42% (207) 5% (25) 497GenZers: 1997-2012 50% (90) 30% (54) 21% (37) 181Millennials: 1981-1996 45% (240) 48% (256) 7% (38) 534GenXers: 1965-1980 41% (188) 50% (232) 9% (40) 460Baby Boomers: 1946-1964 48% (361) 47% (354) 5% (40) 755PID: Dem (no lean) 67% (507) 28% (212) 5% (40) 759PID: Ind (no lean) 45% (240) 44% (233) 11% (58) 531PID: Rep (no lean) 24% (168) 67% (473) 9% (66) 708PID/Gender: DemMen 63% (206) 35% (113) 3% (9) 328PID/Gender: DemWomen 70% (301) 23% (99) 7% (31) 431PID/Gender: Ind Men 45% (115) 46% (117) 9% (23) 255PID/Gender: Ind Women 45% (125) 42% (116) 13% (35) 276PID/Gender: Rep Men 28% (100) 65% (235) 7% (24) 359PID/Gender: Rep Women 20% (69) 68% (239) 12% (42) 349Ideo: Liberal (1-3) 70% (404) 26% (152) 4% (21) 576Ideo: Moderate (4) 54% (260) 38% (181) 8% (39) 481Ideo: Conservative (5-7) 25% (192) 68% (530) 7% (54) 776Educ: < College 42% (505) 47% (571) 11% (130) 1206Educ: Bachelors degree 49% (246) 46% (232) 5% (23) 501Educ: Post-grad 57% (164) 40% (115) 4% (11) 290Income: Under 50k 46% (397) 42% (364) 12% (107) 868Income: 50k-100k 47% (341) 48% (346) 5% (38) 725Income: 100k+ 44% (178) 51% (208) 5% (19) 405Ethnicity: White 43% (656) 50% (771) 7% (109) 1536Ethnicity: Hispanic 48% (108) 40% (90) 11% (25) 222Ethnicity: Black 59% (151) 28% (71) 13% (34) 255
Continued on next page

124
Morning ConsultTable POL6
Table POL6: Currently, do you believe it’s more important for the government to address the:
DemographicThe spread ofcoronavirus The economy
Don’t know / Noopinion Total N
Registered Voters 46% (916) 46% (918) 8% (164) 1998Ethnicity: Other 53% (110) 37% (76) 10% (21) 207All Christian 45% (452) 50% (497) 5% (54) 1003All Non-Christian 55% (83) 43% (64) 2% (4) 151Atheist 47% (35) 48% (36) 5% (4) 75Agnostic/Nothing in particular 53% (252) 33% (158) 14% (65) 474Something Else 32% (94) 55% (164) 13% (38) 295Religious Non-Protestant/Catholic 54% (91) 44% (73) 2% (4) 168Evangelical 34% (188) 57% (314) 10% (53) 555Non-Evangelical 49% (347) 46% (330) 5% (38) 715Community: Urban 52% (282) 40% (216) 8% (41) 538Community: Suburban 48% (450) 44% (413) 8% (76) 939Community: Rural 35% (184) 56% (289) 9% (48) 521Employ: Private Sector 46% (318) 50% (340) 4% (28) 687Employ: Government 45% (57) 49% (63) 6% (7) 127Employ: Self-Employed 41% (81) 54% (108) 6% (11) 200Employ: Homemaker 42% (53) 49% (62) 9% (11) 126Employ: Student 57% (34) 32% (20) 11% (7) 61Employ: Retired 49% (254) 44% (231) 7% (35) 520Employ: Unemployed 50% (75) 27% (40) 23% (34) 150Employ: Other 33% (42) 43% (55) 24% (30) 127Military HH: Yes 45% (156) 49% (170) 6% (21) 348Military HH: No 46% (760) 45% (748) 9% (143) 1650RD/WT: Right Direction 66% (491) 27% (201) 7% (51) 743RD/WT: Wrong Track 34% (425) 57% (717) 9% (113) 1255Biden Job Approve 70% (606) 24% (210) 5% (46) 863Biden Job Disapprove 27% (284) 65% (683) 8% (90) 1057Biden Job Strongly Approve 70% (295) 25% (106) 5% (23) 424Biden Job Somewhat Approve 71% (311) 24% (104) 5% (23) 438Biden Job Somewhat Disapprove 47% (132) 44% (124) 9% (27) 283Biden Job Strongly Disapprove 20% (152) 72% (559) 8% (63) 774
Continued on next page

National Tracking Poll #2112154, December, 2021
125
Table POL6
Table POL6: Currently, do you believe it’s more important for the government to address the:
DemographicThe spread ofcoronavirus The economy
Don’t know / Noopinion Total N
Registered Voters 46% (916) 46% (918) 8% (164) 1998Favorable of Biden 70% (626) 24% (215) 6% (54) 896Unfavorable of Biden 25% (259) 67% (679) 8% (82) 1020Very Favorable of Biden 72% (308) 21% (90) 7% (30) 427Somewhat Favorable of Biden 68% (319) 27% (126) 5% (25) 469Somewhat Unfavorable of Biden 46% (98) 45% (98) 9% (20) 216Very Unfavorable of Biden 20% (160) 72% (581) 8% (63) 804#1 Issue: Economy 34% (291) 59% (508) 7% (59) 858#1 Issue: Security 35% (97) 57% (156) 8% (21) 274#1 Issue: Health Care 65% (148) 24% (54) 11% (26) 227#1 Issue: Medicare / Social Security 63% (123) 30% (58) 7% (14) 196#1 Issue: Women’s Issues 65% (81) 23% (28) 12% (15) 124#1 Issue: Education 59% (47) 27% (21) 14% (12) 80#1 Issue: Energy 56% (68) 41% (50) 3% (4) 121#1 Issue: Other 52% (61) 36% (42) 12% (14) 1182020 Vote: Joe Biden 70% (661) 25% (235) 5% (50) 9462020 Vote: Donald Trump 22% (187) 70% (609) 8% (69) 8642020 Vote: Didn’t Vote 35% (53) 37% (57) 28% (43) 1532018 House Vote: Democrat 71% (508) 24% (173) 5% (33) 7152018 House Vote: Republican 25% (176) 69% (491) 7% (49) 7162018 House Vote: Someone else 44% (29) 40% (27) 16% (11) 672016 Vote: Hillary Clinton 71% (482) 23% (159) 6% (38) 6792016 Vote: Donald Trump 25% (192) 68% (511) 7% (50) 7542016 Vote: Other 49% (47) 48% (46) 3% (3) 962016 Vote: Didn’t Vote 42% (194) 43% (201) 15% (72) 468Voted in 2014: Yes 48% (647) 47% (636) 6% (77) 1360Voted in 2014: No 42% (269) 44% (282) 14% (87) 6384-Region: Northeast 54% (191) 41% (145) 5% (17) 3534-Region: Midwest 43% (193) 47% (210) 9% (42) 4444-Region: South 40% (298) 50% (371) 10% (77) 7464-Region: West 52% (235) 42% (192) 6% (29) 455
Continued on next page

126
Morning ConsultTable POL6
Table POL6: Currently, do you believe it’s more important for the government to address the:
DemographicThe spread ofcoronavirus The economy
Don’t know / Noopinion Total N
Registered Voters 46% (916) 46% (918) 8% (164) 1998Party: Democrat/Leans Democrat 67% (596) 27% (237) 6% (50) 883Party: Republican/Leans Republican 24% (200) 68% (570) 8% (71) 841Note: Row proportions may total to larger than one-hundred percent due to rounding. For more information visit MorningConsultIntelligence.com.

National Tracking Poll #2112154, December, 2021
127
Table POL7
Table POL7: Even if neither is exactly correct, which of the following comes closest to your opinion?
Demographic
Americans shouldcontinue to social
distance for as long as isneeded to curb the spreadof coronavirus even if itmeans continued damage
to the economy
Americans should stopsocial distancing to
stimulate the economyeven if it means
increasing the spread ofcoronavirus
Don’t know / Noopinion Total N
Registered Voters 60% (1203) 28% (552) 12% (243) 1998Gender: Male 57% (533) 33% (307) 11% (102) 942Gender: Female 63% (670) 23% (245) 13% (141) 1056Age: 18-34 56% (287) 30% (154) 14% (73) 514Age: 35-44 60% (184) 26% (79) 14% (44) 307Age: 45-64 57% (386) 31% (213) 12% (81) 679Age: 65+ 70% (346) 21% (106) 9% (46) 497GenZers: 1997-2012 57% (103) 20% (36) 23% (41) 181Millennials: 1981-1996 57% (306) 31% (163) 12% (65) 534GenXers: 1965-1980 57% (261) 33% (151) 10% (48) 460Baby Boomers: 1946-1964 64% (484) 25% (189) 11% (82) 755PID: Dem (no lean) 82% (626) 11% (84) 7% (49) 759PID: Ind (no lean) 56% (295) 27% (141) 18% (94) 531PID: Rep (no lean) 40% (282) 46% (327) 14% (100) 708PID/Gender: DemMen 79% (259) 16% (52) 5% (18) 328PID/Gender: DemWomen 85% (367) 7% (32) 7% (32) 431PID/Gender: Ind Men 54% (137) 28% (70) 19% (48) 255PID/Gender: Ind Women 57% (158) 26% (71) 17% (46) 276PID/Gender: Rep Men 38% (137) 52% (185) 10% (36) 359PID/Gender: Rep Women 41% (145) 40% (141) 18% (63) 349Ideo: Liberal (1-3) 81% (467) 14% (80) 5% (30) 576Ideo: Moderate (4) 71% (342) 17% (84) 11% (54) 481Ideo: Conservative (5-7) 41% (320) 47% (362) 12% (94) 776Educ: < College 57% (690) 28% (332) 15% (184) 1206Educ: Bachelors degree 62% (310) 30% (150) 8% (41) 501Educ: Post-grad 70% (203) 24% (70) 6% (18) 290
Continued on next page

128
Morning ConsultTable POL7
Table POL7: Even if neither is exactly correct, which of the following comes closest to your opinion?
Demographic
Americans shouldcontinue to social
distance for as long as isneeded to curb the spreadof coronavirus even if itmeans continued damage
to the economy
Americans should stopsocial distancing to
stimulate the economyeven if it means
increasing the spread ofcoronavirus
Don’t know / Noopinion Total N
Registered Voters 60% (1203) 28% (552) 12% (243) 1998Income: Under 50k 60% (525) 24% (205) 16% (139) 868Income: 50k-100k 61% (442) 29% (211) 10% (72) 725Income: 100k+ 58% (236) 34% (137) 8% (32) 405Ethnicity: White 58% (895) 31% (476) 11% (165) 1536Ethnicity: Hispanic 56% (124) 30% (67) 14% (32) 222Ethnicity: Black 73% (185) 14% (35) 13% (34) 255Ethnicity: Other 59% (122) 20% (41) 21% (44) 207All Christian 61% (609) 29% (293) 10% (101) 1003All Non-Christian 61% (92) 34% (51) 5% (8) 151Atheist 68% (51) 27% (20) 5% (4) 75Agnostic/Nothing in particular 65% (309) 18% (84) 17% (82) 474Something Else 48% (142) 35% (104) 17% (49) 295Religious Non-Protestant/Catholic 60% (100) 35% (58) 5% (9) 168Evangelical 50% (277) 39% (215) 11% (63) 555Non-Evangelical 64% (460) 24% (170) 12% (84) 715Community: Urban 67% (360) 24% (127) 10% (51) 538Community: Suburban 62% (578) 25% (231) 14% (130) 939Community: Rural 51% (265) 37% (194) 12% (62) 521Employ: Private Sector 60% (410) 32% (222) 8% (55) 687Employ: Government 56% (71) 32% (40) 12% (16) 127Employ: Self-Employed 55% (109) 33% (66) 12% (25) 200Employ: Homemaker 63% (79) 24% (31) 13% (16) 126Employ: Student 64% (39) 22% (14) 14% (8) 61Employ: Retired 67% (351) 23% (120) 10% (49) 520Employ: Unemployed 59% (88) 16% (23) 26% (39) 150Employ: Other 44% (56) 29% (37) 27% (35) 127
Continued on next page

National Tracking Poll #2112154, December, 2021
129
Table POL7
Table POL7: Even if neither is exactly correct, which of the following comes closest to your opinion?
Demographic
Americans shouldcontinue to social
distance for as long as isneeded to curb the spreadof coronavirus even if itmeans continued damage
to the economy
Americans should stopsocial distancing to
stimulate the economyeven if it means
increasing the spread ofcoronavirus
Don’t know / Noopinion Total N
Registered Voters 60% (1203) 28% (552) 12% (243) 1998Military HH: Yes 57% (198) 31% (109) 11% (40) 348Military HH: No 61% (1005) 27% (442) 12% (203) 1650RD/WT: Right Direction 80% (597) 13% (100) 6% (47) 743RD/WT: Wrong Track 48% (607) 36% (452) 16% (196) 1255Biden Job Approve 84% (727) 11% (91) 5% (45) 863Biden Job Disapprove 42% (445) 43% (452) 15% (161) 1057Biden Job Strongly Approve 82% (348) 14% (57) 4% (19) 424Biden Job Somewhat Approve 86% (378) 8% (34) 6% (26) 438Biden Job Somewhat Disapprove 61% (173) 22% (62) 17% (48) 283Biden Job Strongly Disapprove 35% (271) 50% (390) 15% (112) 774Favorable of Biden 83% (746) 11% (100) 6% (50) 896Unfavorable of Biden 41% (420) 43% (438) 16% (162) 1020Very Favorable of Biden 84% (358) 11% (47) 5% (22) 427Somewhat Favorable of Biden 83% (388) 11% (54) 6% (27) 469Somewhat Unfavorable of Biden 61% (133) 20% (42) 19% (41) 216Very Unfavorable of Biden 36% (287) 49% (396) 15% (121) 804#1 Issue: Economy 52% (445) 35% (299) 13% (115) 858#1 Issue: Security 47% (129) 39% (106) 14% (39) 274#1 Issue: Health Care 72% (163) 16% (35) 13% (29) 227#1 Issue: Medicare / Social Security 77% (152) 14% (27) 9% (18) 196#1 Issue: Women’s Issues 81% (101) 11% (14) 7% (9) 124#1 Issue: Education 65% (52) 19% (15) 16% (13) 80#1 Issue: Energy 72% (87) 21% (26) 7% (8) 121#1 Issue: Other 64% (76) 25% (29) 11% (13) 118
Continued on next page

130
Morning ConsultTable POL7
Table POL7: Even if neither is exactly correct, which of the following comes closest to your opinion?
Demographic
Americans shouldcontinue to social
distance for as long as isneeded to curb the spreadof coronavirus even if itmeans continued damage
to the economy
Americans should stopsocial distancing to
stimulate the economyeven if it means
increasing the spread ofcoronavirus
Don’t know / Noopinion Total N
Registered Voters 60% (1203) 28% (552) 12% (243) 19982020 Vote: Joe Biden 83% (784) 11% (101) 7% (61) 9462020 Vote: Donald Trump 37% (318) 48% (415) 15% (130) 8642020 Vote: Didn’t Vote 54% (82) 17% (26) 29% (45) 1532018 House Vote: Democrat 83% (593) 11% (77) 6% (45) 7152018 House Vote: Republican 39% (279) 48% (344) 13% (93) 7162018 House Vote: Someone else 58% (39) 20% (14) 21% (14) 672016 Vote: Hillary Clinton 86% (583) 8% (53) 6% (43) 6792016 Vote: Donald Trump 39% (293) 48% (362) 13% (99) 7542016 Vote: Other 61% (59) 27% (25) 12% (12) 962016 Vote: Didn’t Vote 57% (268) 24% (111) 19% (90) 468Voted in 2014: Yes 62% (837) 29% (391) 10% (132) 1360Voted in 2014: No 57% (366) 25% (161) 17% (111) 6384-Region: Northeast 66% (235) 25% (87) 9% (31) 3534-Region: Midwest 59% (260) 27% (118) 15% (66) 4444-Region: South 57% (424) 30% (224) 13% (98) 7464-Region: West 62% (284) 27% (122) 11% (49) 455Party: Democrat/Leans Democrat 83% (730) 11% (95) 7% (57) 883Party: Republican/Leans Republican 39% (330) 46% (386) 15% (126) 841Note: Row proportions may total to larger than one-hundred percent due to rounding. For more information visit MorningConsultIntelligence.com.

National Tracking Poll #2112154, December, 2021
131
Table POL8a
Table POL8a: Thinking about congressional Democrats’ agenda and what they have been able to do since taking full control of the U.S. Congress inJanuary 2021, which of the following is closest to your opinion, even if none is exactly right?
Demographic
Democrats inCongress haveaccomplishedmore than Iexpected
Democrats inCongress have
accomplished lessthan I expected
Democrats inCongress haveaccomplishedabout what Iexpected
Don’t know / Noopinion Total N
Registered Voters 10% (96) 41% (402) 32% (316) 16% (161) 975Gender: Male 14% (60) 41% (181) 35% (153) 11% (49) 442Gender: Female 7% (36) 42% (221) 31% (164) 21% (112) 533Age: 18-34 13% (34) 36% (92) 25% (63) 26% (65) 254Age: 35-44 13% (20) 36% (54) 36% (54) 15% (23) 151Age: 45-64 6% (21) 40% (129) 37% (120) 16% (53) 323Age: 65+ 9% (22) 51% (127) 32% (80) 8% (20) 248GenZers: 1997-2012 10% (9) 34% (31) 13% (12) 43% (39) 90Millennials: 1981-1996 15% (41) 36% (97) 33% (88) 15% (41) 267GenXers: 1965-1980 6% (13) 42% (88) 32% (68) 19% (40) 210Baby Boomers: 1946-1964 8% (30) 45% (166) 37% (135) 10% (36) 367PID: Dem (no lean) 18% (67) 33% (120) 39% (142) 9% (34) 362PID: Ind (no lean) 5% (12) 46% (109) 25% (60) 24% (56) 237PID: Rep (no lean) 5% (17) 46% (173) 30% (114) 19% (71) 376PID/Gender: DemMen 27% (43) 28% (45) 40% (63) 4% (7) 158PID/Gender: DemWomen 12% (24) 37% (75) 38% (79) 13% (27) 204PID/Gender: Ind Men 6% (6) 55% (55) 24% (24) 15% (15) 101PID/Gender: Ind Women 4% (6) 40% (54) 26% (36) 30% (41) 136PID/Gender: Rep Men 6% (10) 44% (81) 36% (65) 15% (27) 183PID/Gender: Rep Women 4% (7) 48% (92) 26% (49) 23% (44) 193Ideo: Liberal (1-3) 17% (49) 39% (112) 35% (101) 9% (26) 289Ideo: Moderate (4) 11% (24) 36% (79) 34% (75) 19% (41) 218Ideo: Conservative (5-7) 6% (23) 49% (191) 34% (132) 12% (45) 392Educ: < College 8% (48) 39% (231) 31% (185) 21% (124) 588Educ: Bachelors degree 13% (33) 42% (106) 37% (93) 9% (22) 255Educ: Post-grad 11% (14) 49% (65) 29% (38) 11% (14) 132
Continued on next page

132
Morning ConsultTable POL8a
Table POL8a: Thinking about congressional Democrats’ agenda and what they have been able to do since taking full control of the U.S. Congress inJanuary 2021, which of the following is closest to your opinion, even if none is exactly right?
Demographic
Democrats inCongress haveaccomplishedmore than Iexpected
Democrats inCongress have
accomplished lessthan I expected
Democrats inCongress haveaccomplishedabout what Iexpected
Don’t know / Noopinion Total N
Registered Voters 10% (96) 41% (402) 32% (316) 16% (161) 975Income: Under 50k 8% (33) 38% (162) 32% (138) 22% (92) 426Income: 50k-100k 12% (42) 43% (153) 31% (112) 14% (50) 357Income: 100k+ 11% (21) 45% (87) 34% (66) 10% (19) 193Ethnicity: White 10% (75) 45% (340) 33% (251) 13% (95) 762Ethnicity: Hispanic 15% (16) 28% (30) 33% (35) 24% (25) 106Ethnicity: Black 16% (18) 32% (36) 29% (32) 23% (26) 112Ethnicity: Other 3% (3) 26% (26) 32% (33) 39% (39) 101All Christian 11% (54) 42% (206) 35% (175) 12% (59) 494All Non-Christian 28% (23) 36% (29) 27% (22) 8% (7) 80Agnostic/Nothing in particular 3% (6) 39% (86) 30% (67) 28% (61) 221Something Else 9% (13) 41% (61) 31% (46) 20% (29) 148Religious Non-Protestant/Catholic 24% (23) 39% (36) 27% (25) 11% (10) 94Evangelical 13% (39) 38% (110) 36% (105) 13% (37) 291Non-Evangelical 8% (27) 45% (146) 33% (108) 14% (47) 328Community: Urban 17% (46) 37% (101) 31% (86) 15% (42) 275Community: Suburban 7% (34) 44% (206) 31% (145) 17% (79) 463Community: Rural 7% (16) 40% (96) 36% (86) 17% (40) 238Employ: Private Sector 14% (44) 42% (132) 35% (110) 10% (32) 318Employ: Government 4% (3) 33% (24) 38% (27) 25% (18) 71Employ: Self-Employed 15% (19) 38% (47) 32% (40) 15% (19) 125Employ: Homemaker 2% (2) 46% (30) 24% (16) 27% (18) 66Employ: Retired 7% (16) 50% (123) 34% (83) 9% (21) 244Employ: Unemployed 14% (9) 22% (13) 22% (13) 42% (25) 60Employ: Other 5% (3) 30% (18) 36% (21) 29% (17) 60Military HH: Yes 11% (18) 43% (72) 28% (47) 19% (31) 167Military HH: No 10% (78) 41% (331) 33% (270) 16% (130) 808
Continued on next page

National Tracking Poll #2112154, December, 2021
133
Table POL8a
Table POL8a: Thinking about congressional Democrats’ agenda and what they have been able to do since taking full control of the U.S. Congress inJanuary 2021, which of the following is closest to your opinion, even if none is exactly right?
Demographic
Democrats inCongress haveaccomplishedmore than Iexpected
Democrats inCongress have
accomplished lessthan I expected
Democrats inCongress haveaccomplishedabout what Iexpected
Don’t know / Noopinion Total N
Registered Voters 10% (96) 41% (402) 32% (316) 16% (161) 975RD/WT: Right Direction 19% (66) 28% (98) 43% (152) 11% (40) 355RD/WT: Wrong Track 5% (30) 49% (304) 27% (165) 19% (121) 620Biden Job Approve 19% (77) 31% (129) 40% (167) 10% (42) 415Biden Job Disapprove 3% (15) 53% (270) 27% (140) 17% (88) 513Biden Job Strongly Approve 27% (57) 22% (48) 43% (93) 8% (16) 214Biden Job Somewhat Approve 10% (20) 40% (81) 37% (74) 13% (26) 201Biden Job Somewhat Disapprove 2% (2) 51% (68) 24% (32) 23% (31) 134Biden Job Strongly Disapprove 3% (13) 53% (202) 28% (108) 15% (57) 379Favorable of Biden 17% (74) 32% (136) 40% (169) 11% (49) 428Unfavorable of Biden 3% (15) 53% (264) 27% (134) 18% (89) 501Very Favorable of Biden 24% (52) 24% (52) 43% (93) 9% (20) 217Somewhat Favorable of Biden 11% (23) 40% (84) 36% (77) 13% (28) 211Somewhat Unfavorable of Biden 3% (3) 50% (55) 20% (22) 27% (29) 109Very Unfavorable of Biden 3% (11) 53% (209) 29% (113) 15% (59) 392#1 Issue: Economy 9% (35) 45% (178) 27% (105) 20% (78) 396#1 Issue: Security 11% (17) 51% (77) 26% (39) 12% (18) 150#1 Issue: Health Care 18% (21) 29% (34) 39% (45) 14% (16) 116#1 Issue: Medicare / Social Security 7% (6) 41% (38) 38% (36) 14% (13) 93#1 Issue: Women’s Issues 7% (4) 37% (23) 30% (19) 26% (16) 62#1 Issue: Energy 12% (8) 33% (21) 49% (31) 5% (3) 63#1 Issue: Other 3% (2) 36% (24) 50% (34) 11% (7) 672020 Vote: Joe Biden 15% (71) 35% (161) 38% (173) 12% (56) 4612020 Vote: Donald Trump 4% (16) 51% (218) 31% (129) 14% (61) 4242020 Vote: Didn’t Vote 8% (6) 24% (17) 12% (8) 56% (41) 722018 House Vote: Democrat 14% (50) 37% (129) 40% (139) 9% (30) 3472018 House Vote: Republican 4% (15) 48% (168) 35% (123) 13% (45) 351
Continued on next page

134
Morning ConsultTable POL8a
Table POL8a: Thinking about congressional Democrats’ agenda and what they have been able to do since taking full control of the U.S. Congress inJanuary 2021, which of the following is closest to your opinion, even if none is exactly right?
Demographic
Democrats inCongress haveaccomplishedmore than Iexpected
Democrats inCongress have
accomplished lessthan I expected
Democrats inCongress haveaccomplishedabout what Iexpected
Don’t know / Noopinion Total N
Registered Voters 10% (96) 41% (402) 32% (316) 16% (161) 9752016 Vote: Hillary Clinton 15% (51) 38% (130) 37% (128) 10% (36) 3462016 Vote: Donald Trump 6% (21) 45% (162) 35% (126) 14% (49) 3582016 Vote: Didn’t Vote 10% (22) 39% (89) 22% (50) 29% (67) 227Voted in 2014: Yes 10% (66) 42% (284) 36% (240) 12% (78) 669Voted in 2014: No 10% (30) 39% (118) 25% (76) 27% (82) 3074-Region: Northeast 19% (33) 36% (64) 34% (60) 12% (21) 1784-Region: Midwest 4% (9) 45% (93) 31% (64) 19% (39) 2054-Region: South 8% (31) 42% (159) 32% (120) 18% (70) 3814-Region: West 11% (23) 41% (86) 34% (72) 14% (30) 212Party: Democrat/Leans Democrat 17% (73) 36% (150) 38% (158) 10% (40) 421Party: Republican/Leans Republican 5% (22) 48% (207) 30% (129) 17% (73) 431Note: Row proportions may total to larger than one-hundred percent due to rounding. For more information visit MorningConsultIntelligence.com.

National Tracking Poll #2112154, December, 2021
135
Table POL8b
Table POL8b: Thinking about President Biden’s agenda and what he has been able to do since being sworn into office in January 2021, which of thefollowing is closest to your opinion, even if none is exactly right?
Demographic
President Bidenhas accomplished
more than Iexpected
President Bidenhas accomplished
less than Iexpected
President Bidenhas accomplishedabout what Iexpected
Don’t know / Noopinion Total N
Registered Voters 11% (114) 42% (428) 38% (391) 9% (89) 1023Gender: Male 12% (60) 44% (218) 35% (176) 9% (45) 500Gender: Female 10% (55) 40% (210) 41% (215) 8% (44) 523Age: 18-34 13% (34) 45% (117) 28% (73) 14% (38) 261Age: 35-44 13% (20) 38% (60) 39% (61) 10% (16) 156Age: 45-64 9% (32) 41% (146) 43% (152) 7% (26) 357Age: 65+ 11% (29) 42% (105) 43% (106) 4% (9) 249GenZers: 1997-2012 5% (4) 42% (38) 30% (27) 24% (21) 91Millennials: 1981-1996 16% (44) 45% (120) 29% (76) 10% (27) 267GenXers: 1965-1980 10% (25) 42% (105) 42% (106) 6% (14) 250Baby Boomers: 1946-1964 10% (39) 40% (155) 44% (170) 6% (25) 388PID: Dem (no lean) 19% (76) 28% (110) 49% (193) 4% (18) 397PID: Ind (no lean) 9% (26) 46% (135) 27% (79) 18% (54) 294PID: Rep (no lean) 4% (13) 55% (183) 36% (118) 5% (18) 332PID/Gender: DemMen 24% (40) 28% (47) 44% (76) 4% (8) 170PID/Gender: DemWomen 16% (35) 28% (63) 52% (118) 4% (10) 226PID/Gender: Ind Men 5% (8) 47% (72) 27% (41) 21% (32) 153PID/Gender: Ind Women 13% (18) 45% (63) 27% (38) 15% (21) 140PID/Gender: Rep Men 7% (12) 57% (100) 34% (60) 3% (5) 176PID/Gender: Rep Women 1% (1) 54% (84) 38% (59) 8% (13) 156Ideo: Liberal (1-3) 22% (62) 32% (92) 43% (125) 3% (9) 288Ideo: Moderate (4) 10% (27) 40% (106) 40% (105) 9% (24) 262Ideo: Conservative (5-7) 7% (25) 51% (196) 37% (144) 5% (19) 384Educ: < College 7% (43) 42% (260) 38% (237) 13% (78) 618Educ: Bachelors degree 18% (44) 43% (105) 38% (93) 2% (4) 246Educ: Post-grad 17% (27) 40% (63) 39% (62) 4% (7) 159Income: Under 50k 8% (36) 41% (180) 36% (161) 15% (65) 442Income: 50k-100k 17% (62) 41% (151) 37% (135) 5% (20) 368Income: 100k+ 8% (17) 45% (96) 45% (95) 2% (4) 212
Continued on next page

136
Morning ConsultTable POL8b
Table POL8b: Thinking about President Biden’s agenda and what he has been able to do since being sworn into office in January 2021, which of thefollowing is closest to your opinion, even if none is exactly right?
Demographic
President Bidenhas accomplished
more than Iexpected
President Bidenhas accomplished
less than Iexpected
President Bidenhas accomplishedabout what Iexpected
Don’t know / Noopinion Total N
Registered Voters 11% (114) 42% (428) 38% (391) 9% (89) 1023Ethnicity: White 12% (93) 43% (334) 38% (295) 7% (52) 774Ethnicity: Hispanic 17% (19) 38% (44) 35% (41) 11% (12) 116Ethnicity: Black 9% (12) 34% (49) 44% (63) 12% (18) 142Ethnicity: Other 8% (9) 43% (45) 31% (33) 19% (20) 106All Christian 11% (57) 42% (212) 43% (216) 5% (24) 509All Non-Christian 34% (24) 35% (24) 28% (20) 4% (3) 70Agnostic/Nothing in particular 7% (18) 42% (106) 34% (87) 17% (43) 254Something Else 6% (9) 49% (72) 31% (46) 13% (19) 147Religious Non-Protestant/Catholic 32% (24) 36% (27) 28% (21) 4% (3) 74Evangelical 10% (27) 42% (111) 41% (107) 7% (18) 263Non-Evangelical 10% (38) 44% (170) 40% (154) 7% (25) 387Community: Urban 20% (53) 34% (90) 38% (99) 8% (22) 263Community: Suburban 9% (44) 43% (206) 40% (190) 8% (37) 477Community: Rural 6% (18) 47% (133) 36% (102) 11% (30) 283Employ: Private Sector 13% (48) 43% (159) 38% (141) 6% (20) 368Employ: Government 8% (5) 51% (29) 35% (20) 6% (3) 56Employ: Self-Employed 23% (17) 32% (24) 32% (24) 13% (10) 76Employ: Homemaker 9% (6) 46% (27) 33% (20) 12% (7) 60Employ: Retired 11% (32) 39% (108) 46% (128) 3% (9) 277Employ: Unemployed 1% (1) 54% (49) 28% (25) 16% (15) 90Employ: Other 7% (5) 34% (23) 32% (22) 26% (18) 68Military HH: Yes 13% (23) 44% (80) 39% (70) 4% (8) 180Military HH: No 11% (91) 41% (348) 38% (321) 10% (81) 842RD/WT: Right Direction 25% (96) 18% (69) 52% (201) 5% (21) 388RD/WT: Wrong Track 3% (18) 57% (359) 30% (190) 11% (68) 635Biden Job Approve 23% (102) 22% (100) 51% (230) 4% (16) 448Biden Job Disapprove 2% (12) 60% (325) 28% (155) 9% (52) 544
Continued on next page

National Tracking Poll #2112154, December, 2021
137
Table POL8b
Table POL8b: Thinking about President Biden’s agenda and what he has been able to do since being sworn into office in January 2021, which of thefollowing is closest to your opinion, even if none is exactly right?
Demographic
President Bidenhas accomplished
more than Iexpected
President Bidenhas accomplished
less than Iexpected
President Bidenhas accomplishedabout what Iexpected
Don’t know / Noopinion Total N
Registered Voters 11% (114) 42% (428) 38% (391) 9% (89) 1023Biden Job Strongly Approve 35% (74) 9% (18) 53% (111) 3% (7) 211Biden Job Somewhat Approve 12% (28) 34% (81) 50% (119) 4% (9) 238Biden Job Somewhat Disapprove 3% (5) 59% (88) 19% (29) 18% (27) 149Biden Job Strongly Disapprove 2% (7) 60% (237) 32% (126) 6% (24) 395Favorable of Biden 21% (98) 24% (113) 50% (234) 5% (22) 468Unfavorable of Biden 3% (13) 59% (307) 30% (153) 9% (46) 519Very Favorable of Biden 34% (71) 9% (20) 53% (111) 4% (8) 210Somewhat Favorable of Biden 10% (27) 36% (93) 48% (123) 6% (14) 258Somewhat Unfavorable of Biden 6% (6) 52% (55) 19% (20) 24% (25) 107Very Unfavorable of Biden 2% (7) 61% (251) 32% (133) 5% (21) 412#1 Issue: Economy 8% (39) 48% (221) 35% (162) 9% (39) 462#1 Issue: Security 4% (5) 52% (65) 35% (43) 9% (11) 124#1 Issue: Health Care 25% (27) 27% (31) 40% (45) 8% (9) 111#1 Issue: Medicare / Social Security 16% (17) 41% (42) 37% (39) 6% (6) 103#1 Issue: Women’s Issues 9% (6) 36% (22) 44% (27) 11% (7) 62#1 Issue: Education 9% (4) 39% (20) 45% (23) 8% (4) 52#1 Issue: Energy 19% (11) 33% (19) 37% (22) 10% (6) 58#1 Issue: Other 8% (4) 16% (8) 61% (31) 15% (8) 512020 Vote: Joe Biden 20% (98) 29% (140) 47% (229) 4% (18) 4852020 Vote: Donald Trump 3% (13) 57% (249) 31% (137) 9% (41) 4402020 Vote: Didn’t Vote 4% (4) 40% (33) 22% (18) 33% (27) 812018 House Vote: Democrat 18% (68) 29% (105) 50% (185) 3% (10) 3682018 House Vote: Republican 4% (14) 51% (186) 37% (136) 8% (29) 3652016 Vote: Hillary Clinton 20% (67) 26% (86) 52% (172) 2% (7) 3332016 Vote: Donald Trump 4% (16) 53% (208) 35% (138) 8% (33) 3952016 Vote: Other 8% (5) 39% (21) 50% (27) 3% (1) 532016 Vote: Didn’t Vote 11% (26) 47% (113) 23% (55) 20% (47) 241
Continued on next page

138
Morning ConsultTable POL8b
Table POL8b: Thinking about President Biden’s agenda and what he has been able to do since being sworn into office in January 2021, which of thefollowing is closest to your opinion, even if none is exactly right?
Demographic
President Bidenhas accomplished
more than Iexpected
President Bidenhas accomplished
less than Iexpected
President Bidenhas accomplishedabout what Iexpected
Don’t know / Noopinion Total N
Registered Voters 11% (114) 42% (428) 38% (391) 9% (89) 1023Voted in 2014: Yes 11% (78) 41% (283) 43% (294) 5% (36) 692Voted in 2014: No 11% (36) 44% (145) 29% (97) 16% (53) 3314-Region: Northeast 17% (30) 44% (77) 33% (59) 5% (9) 1754-Region: Midwest 10% (24) 48% (114) 32% (76) 11% (25) 2394-Region: South 7% (27) 39% (142) 46% (168) 7% (27) 3654-Region: West 14% (33) 39% (95) 36% (88) 11% (27) 244Party: Democrat/Leans Democrat 19% (89) 29% (133) 47% (218) 5% (21) 462Party: Republican/Leans Republican 3% (13) 55% (225) 34% (142) 8% (32) 411Note: Row proportions may total to larger than one-hundred percent due to rounding. For more information visit MorningConsultIntelligence.com.

National Tracking Poll #2112154, December, 2021
139
Table POL9
Table POL9: As you may know, the U.S. House and Senate passed a $1 trillion bipartisan bill to improve America’s infrastructure. Do you support oroppose this infrastructure bill?
DemographicStronglysupport
Somewhatsupport
Somewhatoppose
Stronglyoppose
Don’t know /No opinion Total N
Registered Voters 27% (533) 25% (496) 14% (275) 19% (385) 15% (309) 1998Gender: Male 30% (281) 25% (233) 14% (130) 23% (218) 9% (80) 942Gender: Female 24% (252) 25% (263) 14% (145) 16% (168) 22% (228) 1056Age: 18-34 24% (124) 24% (122) 13% (69) 10% (49) 29% (150) 514Age: 35-44 26% (81) 33% (100) 8% (25) 14% (44) 19% (57) 307Age: 45-64 23% (157) 25% (170) 17% (112) 23% (159) 12% (81) 679Age: 65+ 34% (171) 21% (104) 14% (69) 27% (133) 4% (20) 497GenZers: 1997-2012 12% (22) 23% (42) 16% (28) 4% (7) 45% (81) 181Millennials: 1981-1996 30% (160) 27% (144) 11% (57) 12% (66) 20% (107) 534GenXers: 1965-1980 21% (95) 27% (124) 15% (69) 23% (105) 15% (67) 460Baby Boomers: 1946-1964 31% (236) 23% (176) 15% (113) 24% (185) 6% (46) 755PID: Dem (no lean) 49% (369) 30% (229) 6% (45) 4% (30) 11% (87) 759PID: Ind (no lean) 19% (101) 26% (138) 15% (82) 18% (96) 22% (114) 531PID: Rep (no lean) 9% (63) 18% (130) 21% (148) 37% (260) 15% (108) 708PID/Gender: DemMen 56% (185) 27% (90) 5% (17) 6% (19) 6% (18) 328PID/Gender: DemWomen 43% (184) 32% (139) 6% (28) 3% (11) 16% (68) 431PID/Gender: Ind Men 23% (58) 28% (71) 16% (40) 20% (52) 13% (34) 255PID/Gender: Ind Women 15% (42) 24% (67) 15% (42) 16% (44) 29% (80) 276PID/Gender: Rep Men 11% (38) 20% (73) 20% (73) 41% (147) 8% (28) 359PID/Gender: Rep Women 7% (25) 16% (57) 22% (75) 32% (113) 23% (80) 349Ideo: Liberal (1-3) 53% (306) 27% (153) 6% (37) 4% (22) 10% (57) 576Ideo: Moderate (4) 27% (129) 34% (165) 12% (56) 11% (53) 16% (78) 481Ideo: Conservative (5-7) 11% (86) 20% (154) 21% (162) 38% (297) 10% (77) 776Educ: < College 20% (237) 24% (293) 15% (176) 20% (247) 21% (253) 1206Educ: Bachelors degree 35% (174) 25% (125) 13% (66) 19% (97) 8% (39) 501Educ: Post-grad 42% (122) 27% (78) 11% (32) 14% (41) 6% (17) 290Income: Under 50k 22% (192) 26% (227) 13% (110) 16% (136) 24% (204) 868Income: 50k-100k 30% (216) 22% (160) 14% (104) 23% (166) 11% (79) 725Income: 100k+ 31% (126) 27% (109) 15% (62) 21% (83) 6% (26) 405Ethnicity: White 28% (423) 24% (369) 14% (217) 22% (339) 12% (188) 1536Ethnicity: Hispanic 33% (74) 25% (56) 12% (26) 14% (31) 16% (35) 222
Continued on next page

140
Morning ConsultTable POL9
Table POL9: As you may know, the U.S. House and Senate passed a $1 trillion bipartisan bill to improve America’s infrastructure. Do you support oroppose this infrastructure bill?
DemographicStronglysupport
Somewhatsupport
Somewhatoppose
Stronglyoppose
Don’t know /No opinion Total N
Registered Voters 27% (533) 25% (496) 14% (275) 19% (385) 15% (309) 1998Ethnicity: Black 25% (65) 30% (76) 9% (23) 5% (13) 31% (78) 255Ethnicity: Other 22% (45) 25% (51) 17% (35) 16% (33) 21% (43) 207All Christian 25% (252) 27% (269) 15% (151) 23% (233) 10% (98) 1003All Non-Christian 52% (78) 23% (34) 10% (15) 10% (14) 6% (9) 151Atheist 42% (32) 17% (13) 8% (6) 21% (16) 11% (9) 75Agnostic/Nothing in particular 28% (133) 25% (120) 13% (62) 11% (52) 23% (108) 474Something Else 13% (39) 20% (59) 14% (42) 24% (70) 29% (85) 295Religious Non-Protestant/Catholic 48% (81) 22% (38) 11% (18) 11% (19) 7% (12) 168Evangelical 18% (102) 23% (125) 15% (86) 30% (169) 13% (72) 555Non-Evangelical 26% (184) 27% (195) 14% (101) 18% (128) 15% (106) 715Community: Urban 38% (206) 27% (144) 8% (45) 13% (69) 14% (74) 538Community: Suburban 25% (234) 26% (247) 15% (142) 19% (182) 14% (133) 939Community: Rural 18% (93) 20% (105) 17% (88) 26% (134) 20% (102) 521Employ: Private Sector 28% (195) 29% (201) 12% (82) 20% (137) 10% (71) 687Employ: Government 22% (28) 25% (31) 26% (33) 17% (21) 10% (13) 127Employ: Self-Employed 32% (64) 21% (42) 15% (31) 15% (30) 17% (34) 200Employ: Homemaker 11% (14) 25% (31) 19% (24) 21% (27) 23% (29) 126Employ: Student 8% (5) 34% (20) 13% (8) 5% (3) 40% (24) 61Employ: Retired 33% (171) 22% (117) 14% (71) 26% (133) 6% (29) 520Employ: Unemployed 25% (38) 17% (26) 7% (11) 10% (15) 40% (60) 150Employ: Other 14% (18) 22% (28) 12% (15) 15% (19) 37% (48) 127Military HH: Yes 27% (93) 27% (93) 14% (50) 26% (91) 6% (21) 348Military HH: No 27% (441) 24% (403) 14% (225) 18% (294) 17% (288) 1650RD/WT: Right Direction 54% (401) 29% (215) 5% (34) 3% (23) 9% (70) 743RD/WT: Wrong Track 11% (132) 22% (281) 19% (241) 29% (362) 19% (239) 1255Biden Job Approve 53% (455) 33% (281) 5% (41) 2% (20) 8% (66) 863Biden Job Disapprove 7% (74) 20% (206) 21% (226) 34% (362) 18% (189) 1057
Continued on next page
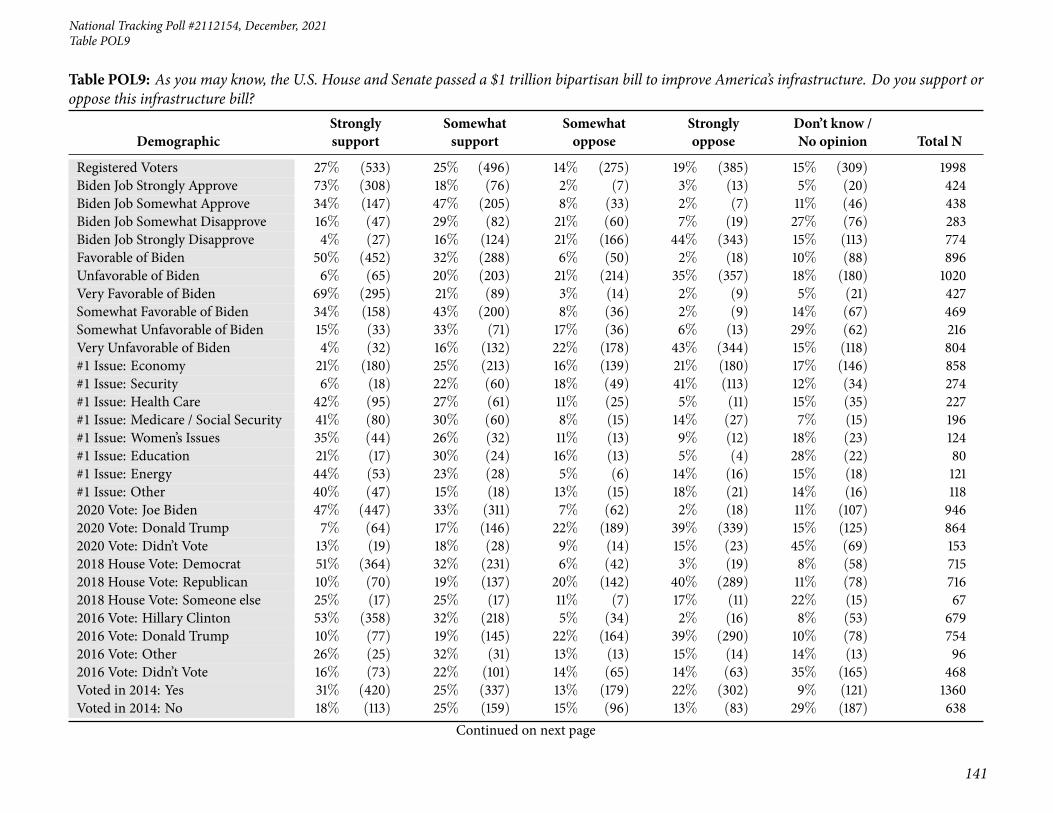
National Tracking Poll #2112154, December, 2021
141
Table POL9
Table POL9: As you may know, the U.S. House and Senate passed a $1 trillion bipartisan bill to improve America’s infrastructure. Do you support oroppose this infrastructure bill?
DemographicStronglysupport
Somewhatsupport
Somewhatoppose
Stronglyoppose
Don’t know /No opinion Total N
Registered Voters 27% (533) 25% (496) 14% (275) 19% (385) 15% (309) 1998Biden Job Strongly Approve 73% (308) 18% (76) 2% (7) 3% (13) 5% (20) 424Biden Job Somewhat Approve 34% (147) 47% (205) 8% (33) 2% (7) 11% (46) 438Biden Job Somewhat Disapprove 16% (47) 29% (82) 21% (60) 7% (19) 27% (76) 283Biden Job Strongly Disapprove 4% (27) 16% (124) 21% (166) 44% (343) 15% (113) 774Favorable of Biden 50% (452) 32% (288) 6% (50) 2% (18) 10% (88) 896Unfavorable of Biden 6% (65) 20% (203) 21% (214) 35% (357) 18% (180) 1020Very Favorable of Biden 69% (295) 21% (89) 3% (14) 2% (9) 5% (21) 427Somewhat Favorable of Biden 34% (158) 43% (200) 8% (36) 2% (9) 14% (67) 469Somewhat Unfavorable of Biden 15% (33) 33% (71) 17% (36) 6% (13) 29% (62) 216Very Unfavorable of Biden 4% (32) 16% (132) 22% (178) 43% (344) 15% (118) 804#1 Issue: Economy 21% (180) 25% (213) 16% (139) 21% (180) 17% (146) 858#1 Issue: Security 6% (18) 22% (60) 18% (49) 41% (113) 12% (34) 274#1 Issue: Health Care 42% (95) 27% (61) 11% (25) 5% (11) 15% (35) 227#1 Issue: Medicare / Social Security 41% (80) 30% (60) 8% (15) 14% (27) 7% (15) 196#1 Issue: Women’s Issues 35% (44) 26% (32) 11% (13) 9% (12) 18% (23) 124#1 Issue: Education 21% (17) 30% (24) 16% (13) 5% (4) 28% (22) 80#1 Issue: Energy 44% (53) 23% (28) 5% (6) 14% (16) 15% (18) 121#1 Issue: Other 40% (47) 15% (18) 13% (15) 18% (21) 14% (16) 1182020 Vote: Joe Biden 47% (447) 33% (311) 7% (62) 2% (18) 11% (107) 9462020 Vote: Donald Trump 7% (64) 17% (146) 22% (189) 39% (339) 15% (125) 8642020 Vote: Didn’t Vote 13% (19) 18% (28) 9% (14) 15% (23) 45% (69) 1532018 House Vote: Democrat 51% (364) 32% (231) 6% (42) 3% (19) 8% (58) 7152018 House Vote: Republican 10% (70) 19% (137) 20% (142) 40% (289) 11% (78) 7162018 House Vote: Someone else 25% (17) 25% (17) 11% (7) 17% (11) 22% (15) 672016 Vote: Hillary Clinton 53% (358) 32% (218) 5% (34) 2% (16) 8% (53) 6792016 Vote: Donald Trump 10% (77) 19% (145) 22% (164) 39% (290) 10% (78) 7542016 Vote: Other 26% (25) 32% (31) 13% (13) 15% (14) 14% (13) 962016 Vote: Didn’t Vote 16% (73) 22% (101) 14% (65) 14% (63) 35% (165) 468Voted in 2014: Yes 31% (420) 25% (337) 13% (179) 22% (302) 9% (121) 1360Voted in 2014: No 18% (113) 25% (159) 15% (96) 13% (83) 29% (187) 638
Continued on next page

142
Morning ConsultTable POL9
Table POL9: As you may know, the U.S. House and Senate passed a $1 trillion bipartisan bill to improve America’s infrastructure. Do you support oroppose this infrastructure bill?
DemographicStronglysupport
Somewhatsupport
Somewhatoppose
Stronglyoppose
Don’t know /No opinion Total N
Registered Voters 27% (533) 25% (496) 14% (275) 19% (385) 15% (309) 19984-Region: Northeast 36% (127) 26% (92) 13% (45) 15% (53) 10% (36) 3534-Region: Midwest 23% (101) 25% (112) 17% (77) 21% (95) 13% (59) 4444-Region: South 22% (167) 23% (175) 13% (99) 21% (159) 20% (146) 7464-Region: West 30% (138) 26% (117) 12% (54) 17% (78) 15% (67) 455Party: Democrat/Leans Democrat 48% (423) 32% (279) 6% (52) 4% (31) 11% (97) 883Party: Republican/Leans Republican 8% (71) 19% (159) 22% (183) 37% (307) 15% (122) 841Note: Row proportions may total to larger than one-hundred percent due to rounding. For more information visit MorningConsultIntelligence.com.

National Tracking Poll #2112154, December, 2021
143
Table POL10
Table POL10: As you may know, the U.S. House of Representatives passed the Democrats’ roughly $2 trillion climate and social spending package. Doyou support or oppose this climate and social spending package?
DemographicStronglysupport
Somewhatsupport
Somewhatoppose
Stronglyoppose
Don’t know /No opinion Total N
Registered Voters 24% (473) 21% (422) 12% (249) 28% (560) 15% (294) 1998Gender: Male 26% (247) 19% (179) 12% (114) 33% (314) 9% (88) 942Gender: Female 21% (226) 23% (244) 13% (135) 23% (246) 20% (206) 1056Age: 18-34 22% (114) 26% (136) 15% (75) 11% (55) 26% (135) 514Age: 35-44 26% (81) 25% (77) 10% (29) 23% (70) 16% (50) 307Age: 45-64 20% (135) 20% (138) 14% (94) 34% (231) 12% (81) 679Age: 65+ 29% (144) 14% (72) 10% (50) 41% (204) 6% (28) 497GenZers: 1997-2012 12% (22) 27% (50) 19% (34) 6% (10) 36% (65) 181Millennials: 1981-1996 28% (150) 27% (144) 11% (58) 15% (80) 19% (102) 534GenXers: 1965-1980 19% (88) 20% (93) 14% (64) 33% (151) 14% (65) 460Baby Boomers: 1946-1964 26% (196) 17% (130) 12% (89) 38% (287) 7% (53) 755PID: Dem (no lean) 47% (358) 32% (241) 6% (49) 5% (35) 10% (76) 759PID: Ind (no lean) 15% (80) 23% (123) 15% (79) 25% (134) 21% (114) 531PID: Rep (no lean) 5% (35) 8% (58) 17% (121) 55% (390) 15% (104) 708PID/Gender: DemMen 54% (177) 29% (96) 6% (19) 6% (20) 5% (16) 328PID/Gender: DemWomen 42% (181) 34% (145) 7% (30) 3% (15) 14% (60) 431PID/Gender: Ind Men 18% (45) 22% (56) 16% (41) 29% (74) 15% (39) 255PID/Gender: Ind Women 13% (35) 24% (67) 14% (38) 22% (60) 27% (75) 276PID/Gender: Rep Men 7% (25) 7% (27) 15% (54) 61% (220) 9% (33) 359PID/Gender: Rep Women 3% (10) 9% (31) 19% (67) 49% (170) 20% (71) 349Ideo: Liberal (1-3) 52% (302) 27% (157) 7% (41) 5% (31) 8% (44) 576Ideo: Moderate (4) 21% (102) 33% (160) 12% (58) 15% (71) 19% (89) 481Ideo: Conservative (5-7) 7% (54) 11% (87) 16% (124) 57% (444) 9% (66) 776Educ: < College 18% (217) 20% (246) 14% (165) 28% (338) 20% (241) 1206Educ: Bachelors degree 30% (152) 22% (111) 12% (58) 29% (143) 7% (37) 501Educ: Post-grad 36% (104) 23% (66) 9% (26) 27% (79) 5% (16) 290Income: Under 50k 20% (176) 22% (193) 13% (111) 21% (183) 24% (206) 868Income: 50k-100k 26% (189) 20% (145) 13% (92) 32% (231) 9% (68) 725Income: 100k+ 27% (108) 21% (84) 11% (46) 36% (146) 5% (21) 405Ethnicity: White 25% (381) 19% (295) 12% (188) 32% (495) 12% (177) 1536Ethnicity: Hispanic 32% (72) 23% (51) 13% (29) 19% (41) 13% (29) 222
Continued on next page

144
Morning ConsultTable POL10
Table POL10: As you may know, the U.S. House of Representatives passed the Democrats’ roughly $2 trillion climate and social spending package. Doyou support or oppose this climate and social spending package?
DemographicStronglysupport
Somewhatsupport
Somewhatoppose
Stronglyoppose
Don’t know /No opinion Total N
Registered Voters 24% (473) 21% (422) 12% (249) 28% (560) 15% (294) 1998Ethnicity: Black 24% (62) 29% (74) 11% (27) 5% (14) 31% (78) 255Ethnicity: Other 14% (30) 26% (54) 16% (34) 25% (51) 18% (38) 207All Christian 21% (208) 21% (212) 13% (130) 36% (358) 10% (96) 1003All Non-Christian 52% (79) 20% (31) 9% (14) 14% (21) 4% (6) 151Atheist 39% (29) 20% (15) 6% (5) 21% (16) 14% (10) 75Agnostic/Nothing in particular 26% (124) 23% (107) 14% (65) 15% (73) 22% (106) 474Something Else 11% (32) 20% (58) 12% (36) 31% (93) 26% (76) 295Religious Non-Protestant/Catholic 48% (80) 19% (32) 11% (19) 16% (28) 6% (9) 168Evangelical 14% (79) 16% (90) 14% (77) 43% (240) 12% (69) 555Non-Evangelical 22% (157) 25% (177) 11% (82) 28% (201) 14% (98) 715Community: Urban 35% (189) 24% (129) 10% (55) 18% (94) 13% (70) 538Community: Suburban 22% (211) 22% (208) 13% (120) 28% (263) 14% (136) 939Community: Rural 14% (73) 16% (85) 14% (74) 39% (202) 17% (88) 521Employ: Private Sector 25% (169) 26% (177) 12% (81) 29% (197) 9% (61) 687Employ: Government 14% (18) 27% (35) 25% (32) 25% (32) 9% (11) 127Employ: Self-Employed 31% (62) 20% (41) 11% (22) 24% (48) 14% (29) 200Employ: Homemaker 13% (16) 19% (23) 14% (18) 26% (32) 29% (36) 126Employ: Student 20% (12) 26% (16) 24% (15) 4% (3) 25% (15) 61Employ: Retired 28% (143) 15% (78) 11% (57) 39% (205) 7% (38) 520Employ: Unemployed 20% (30) 19% (28) 10% (16) 14% (20) 37% (56) 150Employ: Other 18% (23) 19% (24) 7% (10) 18% (23) 37% (47) 127Military HH: Yes 22% (77) 18% (63) 12% (43) 37% (129) 10% (36) 348Military HH: No 24% (395) 22% (359) 12% (206) 26% (431) 16% (258) 1650RD/WT: Right Direction 50% (375) 30% (220) 6% (43) 4% (29) 10% (76) 743RD/WT: Wrong Track 8% (97) 16% (202) 16% (206) 42% (531) 17% (218) 1255Biden Job Approve 50% (435) 34% (289) 5% (44) 3% (24) 8% (70) 863Biden Job Disapprove 3% (29) 11% (120) 19% (197) 50% (530) 17% (181) 1057
Continued on next page

National Tracking Poll #2112154, December, 2021
145
Table POL10
Table POL10: As you may know, the U.S. House of Representatives passed the Democrats’ roughly $2 trillion climate and social spending package. Doyou support or oppose this climate and social spending package?
DemographicStronglysupport
Somewhatsupport
Somewhatoppose
Stronglyoppose
Don’t know /No opinion Total N
Registered Voters 24% (473) 21% (422) 12% (249) 28% (560) 15% (294) 1998Biden Job Strongly Approve 71% (303) 17% (73) 3% (12) 3% (15) 5% (21) 424Biden Job Somewhat Approve 30% (132) 49% (216) 7% (32) 2% (10) 11% (49) 438Biden Job Somewhat Disapprove 7% (19) 27% (77) 28% (79) 13% (38) 25% (70) 283Biden Job Strongly Disapprove 1% (10) 6% (43) 15% (118) 64% (493) 14% (110) 774Favorable of Biden 49% (437) 33% (299) 6% (52) 2% (22) 10% (86) 896Unfavorable of Biden 2% (22) 11% (116) 18% (186) 52% (527) 17% (170) 1020Very Favorable of Biden 70% (297) 19% (83) 4% (16) 2% (7) 6% (24) 427Somewhat Favorable of Biden 30% (139) 46% (217) 8% (36) 3% (15) 13% (61) 469Somewhat Unfavorable of Biden 5% (10) 30% (64) 25% (54) 14% (30) 27% (58) 216Very Unfavorable of Biden 1% (12) 6% (51) 16% (132) 62% (496) 14% (113) 804#1 Issue: Economy 16% (138) 19% (163) 14% (117) 33% (287) 18% (152) 858#1 Issue: Security 7% (19) 12% (32) 15% (40) 56% (154) 11% (29) 274#1 Issue: Health Care 42% (95) 29% (66) 11% (25) 6% (14) 12% (28) 227#1 Issue: Medicare / Social Security 35% (69) 24% (47) 11% (22) 21% (42) 8% (16) 196#1 Issue: Women’s Issues 33% (41) 30% (38) 10% (12) 9% (11) 18% (22) 124#1 Issue: Education 21% (16) 33% (27) 13% (10) 9% (7) 24% (19) 80#1 Issue: Energy 44% (53) 26% (31) 9% (11) 11% (13) 10% (12) 121#1 Issue: Other 35% (41) 16% (19) 10% (11) 27% (31) 13% (15) 1182020 Vote: Joe Biden 45% (421) 33% (316) 8% (73) 4% (35) 11% (101) 9462020 Vote: Donald Trump 3% (30) 7% (60) 18% (154) 58% (497) 14% (123) 8642020 Vote: Didn’t Vote 13% (19) 22% (34) 9% (14) 14% (22) 42% (64) 1532018 House Vote: Democrat 48% (342) 33% (237) 7% (50) 5% (33) 7% (54) 7152018 House Vote: Republican 5% (34) 9% (62) 15% (109) 60% (429) 11% (81) 7162018 House Vote: Someone else 21% (14) 22% (15) 11% (7) 25% (17) 21% (14) 672016 Vote: Hillary Clinton 49% (334) 31% (214) 6% (44) 4% (28) 9% (59) 6792016 Vote: Donald Trump 6% (43) 9% (67) 16% (120) 59% (441) 11% (82) 7542016 Vote: Other 22% (21) 31% (30) 10% (9) 23% (23) 14% (13) 962016 Vote: Didn’t Vote 16% (74) 24% (112) 16% (76) 14% (67) 30% (139) 468Voted in 2014: Yes 26% (360) 20% (270) 11% (151) 33% (454) 9% (125) 1360Voted in 2014: No 18% (112) 24% (153) 15% (99) 17% (105) 26% (169) 638
Continued on next page

146
Morning ConsultTable POL10
Table POL10: As you may know, the U.S. House of Representatives passed the Democrats’ roughly $2 trillion climate and social spending package. Doyou support or oppose this climate and social spending package?
DemographicStronglysupport
Somewhatsupport
Somewhatoppose
Stronglyoppose
Don’t know /No opinion Total N
Registered Voters 24% (473) 21% (422) 12% (249) 28% (560) 15% (294) 19984-Region: Northeast 33% (118) 24% (85) 14% (48) 20% (71) 9% (32) 3534-Region: Midwest 20% (88) 20% (88) 16% (72) 33% (146) 11% (51) 4444-Region: South 19% (141) 18% (137) 11% (82) 31% (235) 20% (151) 7464-Region: West 28% (126) 25% (113) 10% (47) 24% (108) 13% (60) 455Party: Democrat/Leans Democrat 46% (406) 33% (293) 7% (59) 4% (39) 10% (87) 883Party: Republican/Leans Republican 4% (38) 9% (74) 18% (152) 55% (461) 14% (118) 841Note: Row proportions may total to larger than one-hundred percent due to rounding. For more information visit MorningConsultIntelligence.com.

National Tracking Poll #2112154, December, 2021
147
Table POL11
Table POL11: And would you say Democrats in the Senate are moving too fast or too slow on passing this climate and social spending package, or arethey moving at just the right pace?
Demographic Too fast Just right Too slowDon’t know / No
opinion Total N
Registered Voters 9% (84) 36% (321) 45% (406) 9% (84) 895Gender: Male 14% (58) 40% (170) 41% (174) 5% (23) 425Gender: Female 6% (26) 32% (151) 49% (232) 13% (60) 470Age: 18-34 24% (60) 32% (81) 33% (82) 11% (27) 249Age: 35-44 5% (9) 51% (80) 36% (57) 8% (12) 157Age: 45-64 4% (11) 37% (100) 49% (133) 11% (29) 273Age: 65+ 2% (5) 28% (60) 63% (135) 7% (15) 215GenZers: 1997-2012 16% (12) 26% (19) 41% (29) 17% (12) 72Millennials: 1981-1996 20% (57) 42% (122) 32% (94) 7% (20) 294GenXers: 1965-1980 3% (5) 41% (74) 43% (78) 13% (24) 181Baby Boomers: 1946-1964 3% (11) 31% (101) 58% (188) 8% (26) 326PID: Dem (no lean) 9% (54) 41% (245) 44% (263) 6% (37) 599PID: Ind (no lean) 4% (9) 27% (54) 55% (112) 14% (28) 203PID: Rep (no lean) 23% (21) 23% (22) 33% (31) 20% (19) 93PID/Gender: DemMen 14% (39) 46% (126) 37% (100) 3% (8) 273PID/Gender: DemWomen 5% (15) 37% (119) 50% (163) 9% (28) 326PID/Gender: Ind Men 5% (5) 28% (29) 57% (57) 10% (10) 101PID/Gender: Ind Women 4% (4) 25% (26) 53% (54) 18% (19) 103PID/Gender: Rep Men 27% (14) 30% (16) 33% (17) 10% (5) 52Ideo: Liberal (1-3) 9% (42) 34% (158) 51% (235) 5% (25) 460Ideo: Moderate (4) 5% (13) 39% (102) 44% (116) 12% (32) 263Ideo: Conservative (5-7) 21% (30) 38% (53) 32% (45) 9% (13) 141Educ: < College 8% (37) 35% (164) 43% (201) 13% (61) 462Educ: Bachelors degree 13% (33) 38% (101) 44% (117) 5% (13) 263Educ: Post-grad 9% (15) 33% (57) 52% (89) 6% (10) 170Income: Under 50k 9% (32) 35% (129) 43% (158) 13% (49) 369Income: 50k-100k 12% (41) 32% (108) 48% (162) 7% (23) 334Income: 100k+ 5% (10) 44% (84) 45% (86) 6% (12) 192Ethnicity: White 9% (63) 36% (240) 46% (313) 9% (59) 676Ethnicity: Hispanic 23% (28) 32% (39) 36% (44) 10% (12) 123Ethnicity: Black 9% (12) 42% (57) 40% (54) 9% (12) 135
Continued on next page

148
Morning ConsultTable POL11
Table POL11: And would you say Democrats in the Senate are moving too fast or too slow on passing this climate and social spending package, or arethey moving at just the right pace?
Demographic Too fast Just right Too slowDon’t know / No
opinion Total N
Registered Voters 9% (84) 36% (321) 45% (406) 9% (84) 895Ethnicity: Other 11% (9) 28% (23) 46% (39) 15% (13) 84All Christian 9% (36) 40% (167) 44% (187) 7% (30) 420All Non-Christian 29% (31) 40% (43) 31% (34) 1% (1) 110Agnostic/Nothing in particular 4% (9) 31% (72) 53% (122) 12% (28) 231Something Else 7% (7) 35% (32) 37% (34) 20% (18) 90Religious Non-Protestant/Catholic 28% (31) 39% (44) 32% (36) 1% (1) 112Evangelical 17% (29) 49% (83) 27% (46) 6% (11) 169Non-Evangelical 4% (14) 33% (111) 51% (171) 11% (38) 334Community: Urban 15% (48) 39% (125) 37% (119) 8% (26) 318Community: Suburban 7% (28) 34% (142) 48% (201) 11% (48) 420Community: Rural 5% (8) 34% (54) 55% (86) 6% (9) 157Employ: Private Sector 11% (38) 42% (145) 40% (139) 7% (24) 347Employ: Government 7% (4) 33% (17) 44% (23) 17% (9) 53Employ: Self-Employed 23% (23) 31% (32) 36% (36) 11% (11) 102Employ: Retired 3% (6) 32% (72) 58% (128) 7% (15) 221Employ: Unemployed 5% (3) 29% (17) 51% (30) 15% (8) 58Military HH: Yes 14% (19) 31% (43) 44% (62) 11% (16) 140Military HH: No 9% (65) 37% (278) 46% (344) 9% (68) 755RD/WT: Right Direction 10% (60) 44% (260) 41% (242) 6% (33) 595RD/WT: Wrong Track 8% (24) 20% (61) 55% (164) 17% (51) 300Biden Job Approve 9% (63) 41% (293) 44% (322) 6% (46) 724Biden Job Disapprove 14% (20) 16% (24) 53% (78) 18% (26) 149Biden Job Strongly Approve 13% (51) 46% (174) 36% (136) 4% (16) 376Biden Job Somewhat Approve 4% (13) 34% (120) 53% (186) 8% (30) 348Biden Job Somewhat Disapprove 13% (13) 17% (16) 52% (50) 18% (17) 96Biden Job Strongly Disapprove 15% (8) 15% (8) 54% (29) 17% (9) 53Favorable of Biden 8% (62) 40% (295) 45% (328) 7% (51) 736Unfavorable of Biden 13% (18) 15% (20) 52% (72) 20% (27) 137
Continued on next page

National Tracking Poll #2112154, December, 2021
149
Table POL11
Table POL11: And would you say Democrats in the Senate are moving too fast or too slow on passing this climate and social spending package, or arethey moving at just the right pace?
Demographic Too fast Just right Too slowDon’t know / No
opinion Total N
Registered Voters 9% (84) 36% (321) 45% (406) 9% (84) 895Very Favorable of Biden 12% (47) 46% (175) 37% (140) 5% (18) 380Somewhat Favorable of Biden 4% (16) 34% (119) 53% (188) 9% (33) 356Somewhat Unfavorable of Biden 11% (8) 18% (14) 49% (36) 22% (16) 74Very Unfavorable of Biden 16% (10) 11% (7) 56% (36) 17% (11) 63#1 Issue: Economy 10% (31) 41% (125) 41% (123) 8% (23) 302#1 Issue: Security 4% (2) 53% (27) 27% (14) 15% (8) 50#1 Issue: Health Care 16% (25) 36% (59) 37% (60) 10% (17) 161#1 Issue: Medicare / Social Security 5% (6) 30% (35) 60% (69) 5% (6) 116#1 Issue: Women’s Issues 7% (5) 39% (31) 47% (37) 7% (5) 79#1 Issue: Energy 7% (6) 26% (22) 53% (45) 14% (12) 84#1 Issue: Other 1% (1) 17% (10) 69% (42) 13% (8) 602020 Vote: Joe Biden 7% (55) 38% (281) 46% (341) 8% (60) 7382020 Vote: Donald Trump 22% (20) 18% (16) 46% (41) 14% (13) 902020 Vote: Didn’t Vote 11% (6) 38% (20) 32% (17) 19% (10) 532018 House Vote: Democrat 5% (29) 39% (224) 50% (287) 7% (38) 5792018 House Vote: Republican 20% (19) 26% (25) 40% (39) 14% (13) 972016 Vote: Hillary Clinton 5% (26) 39% (212) 51% (282) 5% (29) 5482016 Vote: Donald Trump 16% (18) 31% (34) 37% (40) 16% (18) 1102016 Vote: Other 7% (3) 32% (16) 50% (26) 11% (6) 512016 Vote: Didn’t Vote 20% (37) 32% (58) 31% (58) 17% (32) 186Voted in 2014: Yes 7% (43) 38% (237) 49% (309) 6% (41) 630Voted in 2014: No 15% (41) 32% (84) 37% (97) 16% (43) 2654-Region: Northeast 17% (34) 38% (76) 38% (76) 8% (16) 2024-Region: Midwest 6% (10) 32% (57) 48% (85) 14% (25) 1764-Region: South 5% (15) 36% (101) 49% (136) 9% (26) 2774-Region: West 11% (26) 36% (87) 46% (110) 7% (17) 239Party: Democrat/Leans Democrat 8% (57) 39% (270) 46% (323) 7% (49) 699Party: Republican/Leans Republican 22% (25) 25% (27) 35% (39) 18% (20) 111Note: Row proportions may total to larger than one-hundred percent due to rounding. For more information visit MorningConsultIntelligence.com.

150
Morning ConsultTable POL12
Table POL12: As you may know, on July 15, 2021 the Treasury Department began making payments of up to $300 a month per child to most familieswith children, also known as expanded child tax credit payments.Do you support or oppose these expanded child tax credit payments?
DemographicStronglysupport
Somewhatsupport
Somewhatoppose
Stronglyoppose
Don’t know /No opinion Total N
Registered Voters 23% (459) 26% (519) 17% (333) 21% (426) 13% (260) 1998Gender: Male 24% (230) 25% (233) 17% (162) 22% (211) 11% (106) 942Gender: Female 22% (230) 27% (286) 16% (171) 20% (215) 15% (154) 1056Age: 18-34 31% (158) 28% (143) 9% (48) 10% (54) 22% (111) 514Age: 35-44 28% (87) 32% (99) 14% (41) 14% (43) 12% (37) 307Age: 45-64 20% (138) 23% (157) 20% (133) 26% (176) 11% (75) 679Age: 65+ 15% (77) 24% (120) 22% (110) 31% (154) 7% (36) 497GenZers: 1997-2012 17% (30) 23% (42) 11% (20) 10% (18) 39% (70) 181Millennials: 1981-1996 38% (202) 30% (161) 9% (49) 11% (59) 12% (63) 534GenXers: 1965-1980 20% (93) 26% (120) 20% (93) 21% (97) 12% (56) 460Baby Boomers: 1946-1964 15% (117) 25% (186) 21% (157) 30% (228) 9% (68) 755PID: Dem (no lean) 39% (298) 30% (225) 12% (94) 8% (64) 10% (77) 759PID: Ind (no lean) 17% (90) 29% (156) 17% (90) 18% (98) 18% (97) 531PID: Rep (no lean) 10% (71) 20% (139) 21% (149) 37% (264) 12% (86) 708PID/Gender: DemMen 46% (150) 25% (83) 13% (42) 9% (30) 7% (23) 328PID/Gender: DemWomen 34% (148) 33% (142) 12% (52) 8% (34) 13% (55) 431PID/Gender: Ind Men 16% (40) 32% (81) 18% (45) 20% (51) 15% (38) 255PID/Gender: Ind Women 18% (50) 27% (75) 16% (45) 17% (47) 21% (59) 276PID/Gender: Rep Men 11% (39) 19% (69) 21% (75) 36% (130) 13% (46) 359PID/Gender: Rep Women 9% (32) 20% (69) 21% (74) 38% (134) 11% (40) 349Ideo: Liberal (1-3) 41% (236) 31% (179) 11% (61) 7% (42) 10% (57) 576Ideo: Moderate (4) 21% (103) 35% (167) 15% (73) 15% (74) 13% (64) 481Ideo: Conservative (5-7) 11% (89) 17% (135) 24% (188) 38% (296) 9% (68) 776Educ: < College 20% (247) 26% (309) 17% (204) 22% (264) 15% (183) 1206Educ: Bachelors degree 25% (127) 26% (132) 18% (91) 19% (97) 11% (53) 501Educ: Post-grad 29% (86) 27% (79) 13% (38) 22% (65) 8% (24) 290Income: Under 50k 25% (213) 26% (228) 14% (124) 17% (148) 18% (156) 868Income: 50k-100k 21% (156) 28% (203) 17% (123) 24% (173) 10% (71) 725Income: 100k+ 22% (91) 22% (89) 21% (87) 26% (105) 8% (34) 405Ethnicity: White 22% (338) 24% (374) 19% (286) 24% (373) 11% (165) 1536Ethnicity: Hispanic 26% (58) 38% (85) 8% (19) 15% (34) 12% (26) 222
Continued on next page

National Tracking Poll #2112154, December, 2021
151
Table POL12
Table POL12: As you may know, on July 15, 2021 the Treasury Department began making payments of up to $300 a month per child to most familieswith children, also known as expanded child tax credit payments.Do you support or oppose these expanded child tax credit payments?
DemographicStronglysupport
Somewhatsupport
Somewhatoppose
Stronglyoppose
Don’t know /No opinion Total N
Registered Voters 23% (459) 26% (519) 17% (333) 21% (426) 13% (260) 1998Ethnicity: Black 34% (85) 30% (77) 7% (17) 7% (17) 23% (59) 255Ethnicity: Other 17% (36) 33% (68) 15% (31) 18% (37) 17% (36) 207All Christian 19% (187) 26% (262) 21% (207) 27% (269) 8% (79) 1003All Non-Christian 51% (77) 19% (28) 11% (16) 12% (18) 7% (11) 151Atheist 42% (31) 14% (11) 19% (14) 17% (13) 8% (6) 75Agnostic/Nothing in particular 23% (108) 28% (131) 12% (57) 14% (67) 23% (111) 474Something Else 19% (55) 30% (87) 13% (39) 20% (60) 18% (54) 295Religious Non-Protestant/Catholic 49% (83) 19% (32) 13% (21) 12% (19) 8% (13) 168Evangelical 20% (109) 24% (135) 18% (100) 29% (159) 9% (51) 555Non-Evangelical 18% (126) 29% (207) 19% (138) 23% (166) 11% (78) 715Community: Urban 36% (192) 27% (143) 13% (70) 13% (70) 12% (63) 538Community: Suburban 19% (178) 27% (251) 17% (164) 23% (213) 14% (133) 939Community: Rural 17% (89) 24% (125) 19% (99) 28% (144) 12% (64) 521Employ: Private Sector 26% (178) 29% (200) 15% (101) 21% (146) 9% (62) 687Employ: Government 16% (21) 29% (37) 19% (24) 24% (31) 11% (14) 127Employ: Self-Employed 34% (68) 26% (53) 18% (36) 13% (26) 9% (18) 200Employ: Homemaker 27% (34) 29% (37) 19% (23) 14% (18) 10% (13) 126Employ: Student 20% (12) 17% (10) 14% (9) 9% (6) 40% (24) 61Employ: Retired 15% (76) 23% (120) 23% (117) 31% (161) 9% (45) 520Employ: Unemployed 24% (36) 26% (39) 7% (10) 14% (21) 29% (44) 150Employ: Other 27% (35) 18% (23) 10% (13) 13% (16) 31% (40) 127Military HH: Yes 20% (70) 28% (98) 19% (67) 24% (83) 9% (30) 348Military HH: No 24% (390) 26% (421) 16% (266) 21% (343) 14% (230) 1650RD/WT: Right Direction 38% (284) 32% (239) 14% (104) 5% (38) 11% (79) 743RD/WT: Wrong Track 14% (176) 22% (280) 18% (230) 31% (388) 14% (181) 1255Biden Job Approve 37% (321) 34% (292) 13% (114) 6% (50) 10% (85) 863Biden Job Disapprove 12% (124) 19% (200) 21% (219) 35% (371) 14% (143) 1057
Continued on next page

152
Morning ConsultTable POL12
Table POL12: As you may know, on July 15, 2021 the Treasury Department began making payments of up to $300 a month per child to most familieswith children, also known as expanded child tax credit payments.Do you support or oppose these expanded child tax credit payments?
DemographicStronglysupport
Somewhatsupport
Somewhatoppose
Stronglyoppose
Don’t know /No opinion Total N
Registered Voters 23% (459) 26% (519) 17% (333) 21% (426) 13% (260) 1998Biden Job Strongly Approve 53% (224) 23% (98) 10% (42) 5% (21) 9% (39) 424Biden Job Somewhat Approve 22% (97) 44% (194) 16% (72) 7% (29) 11% (46) 438Biden Job Somewhat Disapprove 21% (59) 25% (70) 19% (54) 16% (46) 19% (55) 283Biden Job Strongly Disapprove 8% (65) 17% (130) 21% (165) 42% (325) 11% (88) 774Favorable of Biden 35% (316) 34% (306) 13% (119) 6% (54) 11% (100) 896Unfavorable of Biden 12% (123) 19% (198) 21% (212) 35% (360) 12% (127) 1020Very Favorable of Biden 48% (206) 29% (123) 11% (48) 3% (14) 9% (36) 427Somewhat Favorable of Biden 23% (110) 39% (184) 15% (72) 9% (40) 14% (64) 469Somewhat Unfavorable of Biden 25% (53) 26% (56) 19% (41) 13% (28) 17% (37) 216Very Unfavorable of Biden 9% (70) 18% (141) 21% (171) 41% (332) 11% (90) 804#1 Issue: Economy 21% (184) 25% (211) 18% (153) 24% (205) 12% (105) 858#1 Issue: Security 10% (27) 18% (50) 22% (59) 39% (106) 12% (32) 274#1 Issue: Health Care 37% (84) 31% (71) 14% (32) 8% (19) 10% (22) 227#1 Issue: Medicare / Social Security 19% (38) 31% (61) 22% (44) 18% (34) 10% (19) 196#1 Issue: Women’s Issues 34% (42) 27% (33) 13% (16) 10% (13) 16% (19) 124#1 Issue: Education 28% (23) 27% (21) 9% (7) 10% (8) 26% (21) 80#1 Issue: Energy 30% (36) 35% (42) 8% (10) 12% (15) 15% (19) 121#1 Issue: Other 22% (26) 25% (30) 11% (13) 23% (27) 19% (22) 1182020 Vote: Joe Biden 35% (327) 33% (310) 14% (133) 7% (68) 11% (107) 9462020 Vote: Donald Trump 10% (84) 20% (169) 21% (178) 39% (339) 11% (94) 8642020 Vote: Didn’t Vote 26% (40) 18% (28) 12% (19) 8% (12) 35% (53) 1532018 House Vote: Democrat 37% (264) 32% (230) 13% (96) 8% (57) 10% (68) 7152018 House Vote: Republican 11% (78) 19% (135) 22% (160) 40% (283) 8% (60) 7162018 House Vote: Someone else 21% (14) 18% (12) 17% (11) 22% (14) 23% (15) 672016 Vote: Hillary Clinton 36% (241) 34% (232) 12% (84) 8% (53) 10% (69) 6792016 Vote: Donald Trump 12% (89) 18% (137) 22% (167) 39% (294) 9% (66) 7542016 Vote: Other 23% (22) 25% (24) 27% (26) 15% (14) 10% (9) 962016 Vote: Didn’t Vote 23% (107) 27% (125) 12% (57) 14% (63) 25% (116) 468Voted in 2014: Yes 24% (328) 25% (335) 18% (247) 25% (334) 9% (117) 1360Voted in 2014: No 21% (132) 29% (184) 14% (86) 14% (92) 22% (143) 638
Continued on next page

National Tracking Poll #2112154, December, 2021
153
Table POL12
Table POL12: As you may know, on July 15, 2021 the Treasury Department began making payments of up to $300 a month per child to most familieswith children, also known as expanded child tax credit payments.Do you support or oppose these expanded child tax credit payments?
DemographicStronglysupport
Somewhatsupport
Somewhatoppose
Stronglyoppose
Don’t know /No opinion Total N
Registered Voters 23% (459) 26% (519) 17% (333) 21% (426) 13% (260) 19984-Region: Northeast 30% (107) 27% (94) 17% (59) 17% (59) 10% (34) 3534-Region: Midwest 21% (92) 21% (92) 22% (96) 25% (110) 12% (53) 4444-Region: South 20% (151) 26% (194) 17% (125) 22% (166) 15% (109) 7464-Region: West 24% (109) 31% (139) 12% (52) 20% (91) 14% (63) 455Party: Democrat/Leans Democrat 37% (328) 31% (273) 13% (117) 8% (69) 11% (95) 883Party: Republican/Leans Republican 10% (84) 20% (165) 22% (185) 37% (310) 12% (98) 841Note: Row proportions may total to larger than one-hundred percent due to rounding. For more information visit MorningConsultIntelligence.com.

154
Morning ConsultTable POL13
Table POL13: Have you received the expanded child tax credit payment?Demographic Yes No Don’t know Total N
Registered Voters 60% (326) 35% (191) 5% (27) 545Gender: Male 64% (181) 33% (93) 2% (7) 280Gender: Female 55% (146) 37% (98) 8% (20) 264Age: 18-34 67% (138) 28% (57) 5% (10) 205Age: 35-44 57% (101) 37% (64) 6% (11) 175Age: 45-64 57% (88) 40% (62) 3% (5) 155Millennials: 1981-1996 67% (204) 29% (88) 4% (12) 303GenXers: 1965-1980 55% (96) 41% (71) 4% (7) 174PID: Dem (no lean) 69% (160) 28% (66) 3% (7) 233PID: Ind (no lean) 47% (63) 42% (56) 11% (15) 134PID: Rep (no lean) 58% (103) 39% (70) 3% (5) 178PID/Gender: DemMen 69% (97) 30% (42) 2% (3) 141PID/Gender: DemWomen 69% (64) 26% (24) 5% (4) 92PID/Gender: Ind Men 51% (25) 42% (21) 7% (3) 50PID/Gender: Ind Women 44% (37) 42% (35) 14% (12) 84PID/Gender: Rep Men 65% (59) 34% (31) 1% (1) 90PID/Gender: Rep Women 51% (45) 45% (39) 5% (4) 88Ideo: Liberal (1-3) 66% (131) 31% (62) 2% (4) 198Ideo: Moderate (4) 54% (60) 42% (47) 4% (5) 112Ideo: Conservative (5-7) 56% (107) 40% (77) 4% (8) 192Educ: < College 54% (145) 40% (108) 6% (17) 271Educ: Bachelors degree 66% (121) 29% (54) 5% (8) 183Educ: Post-grad 67% (61) 32% (29) 1% (1) 91Income: Under 50k 55% (108) 37% (73) 8% (15) 196Income: 50k-100k 65% (132) 31% (63) 4% (8) 202Income: 100k+ 59% (87) 38% (55) 3% (4) 147Ethnicity: White 61% (257) 35% (148) 3% (13) 418Ethnicity: Hispanic 56% (52) 41% (38) 3% (3) 93Ethnicity: Black 53% (41) 35% (27) 12% (9) 77All Christian 59% (143) 38% (93) 3% (8) 244All Non-Christian 89% (66) 10% (8) 1% (1) 75Agnostic/Nothing in particular 50% (57) 39% (44) 10% (12) 113Something Else 55% (50) 39% (35) 7% (6) 91
Continued on next page
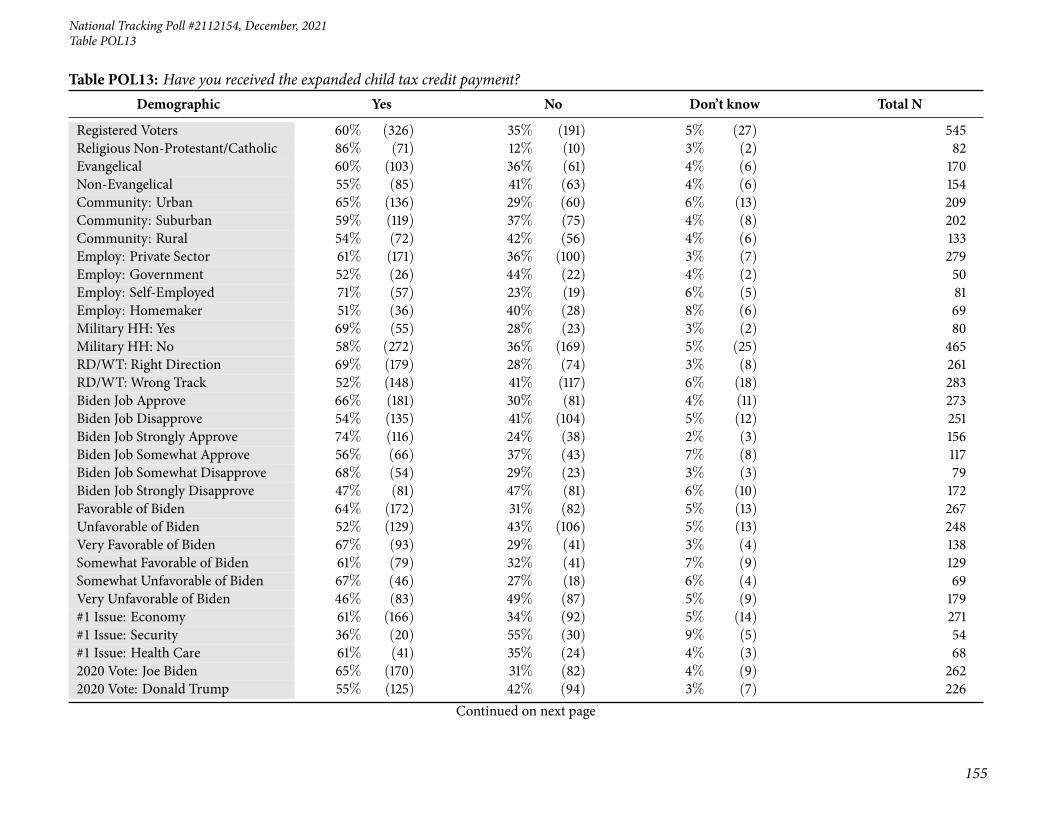
National Tracking Poll #2112154, December, 2021
155
Table POL13
Table POL13: Have you received the expanded child tax credit payment?Demographic Yes No Don’t know Total N
Registered Voters 60% (326) 35% (191) 5% (27) 545Religious Non-Protestant/Catholic 86% (71) 12% (10) 3% (2) 82Evangelical 60% (103) 36% (61) 4% (6) 170Non-Evangelical 55% (85) 41% (63) 4% (6) 154Community: Urban 65% (136) 29% (60) 6% (13) 209Community: Suburban 59% (119) 37% (75) 4% (8) 202Community: Rural 54% (72) 42% (56) 4% (6) 133Employ: Private Sector 61% (171) 36% (100) 3% (7) 279Employ: Government 52% (26) 44% (22) 4% (2) 50Employ: Self-Employed 71% (57) 23% (19) 6% (5) 81Employ: Homemaker 51% (36) 40% (28) 8% (6) 69Military HH: Yes 69% (55) 28% (23) 3% (2) 80Military HH: No 58% (272) 36% (169) 5% (25) 465RD/WT: Right Direction 69% (179) 28% (74) 3% (8) 261RD/WT: Wrong Track 52% (148) 41% (117) 6% (18) 283Biden Job Approve 66% (181) 30% (81) 4% (11) 273Biden Job Disapprove 54% (135) 41% (104) 5% (12) 251Biden Job Strongly Approve 74% (116) 24% (38) 2% (3) 156Biden Job Somewhat Approve 56% (66) 37% (43) 7% (8) 117Biden Job Somewhat Disapprove 68% (54) 29% (23) 3% (3) 79Biden Job Strongly Disapprove 47% (81) 47% (81) 6% (10) 172Favorable of Biden 64% (172) 31% (82) 5% (13) 267Unfavorable of Biden 52% (129) 43% (106) 5% (13) 248Very Favorable of Biden 67% (93) 29% (41) 3% (4) 138Somewhat Favorable of Biden 61% (79) 32% (41) 7% (9) 129Somewhat Unfavorable of Biden 67% (46) 27% (18) 6% (4) 69Very Unfavorable of Biden 46% (83) 49% (87) 5% (9) 179#1 Issue: Economy 61% (166) 34% (92) 5% (14) 271#1 Issue: Security 36% (20) 55% (30) 9% (5) 54#1 Issue: Health Care 61% (41) 35% (24) 4% (3) 682020 Vote: Joe Biden 65% (170) 31% (82) 4% (9) 2622020 Vote: Donald Trump 55% (125) 42% (94) 3% (7) 226
Continued on next page

156
Morning ConsultTable POL13
Table POL13: Have you received the expanded child tax credit payment?Demographic Yes No Don’t know Total N
Registered Voters 60% (326) 35% (191) 5% (27) 5452018 House Vote: Democrat 63% (122) 34% (67) 3% (6) 1942018 House Vote: Republican 60% (103) 37% (64) 3% (5) 1732016 Vote: Hillary Clinton 62% (110) 33% (59) 6% (10) 1792016 Vote: Donald Trump 60% (109) 37% (68) 3% (5) 1812016 Vote: Didn’t Vote 57% (90) 36% (56) 7% (11) 157Voted in 2014: Yes 61% (213) 35% (122) 4% (15) 350Voted in 2014: No 58% (114) 35% (69) 6% (12) 1954-Region: Northeast 67% (76) 31% (35) 2% (2) 1134-Region: Midwest 61% (66) 33% (36) 6% (7) 1094-Region: South 51% (93) 42% (77) 7% (13) 1834-Region: West 65% (92) 31% (44) 3% (5) 140Party: Democrat/Leans Democrat 66% (172) 31% (79) 3% (9) 260Party: Republican/Leans Republican 56% (118) 41% (87) 3% (6) 211Note: Row proportions may total to larger than one-hundred percent due to rounding. For more information visit MorningConsultIntelligence.com.

National Tracking Poll #2112154, December, 2021
157
Table POL14
Table POL14: Has the expanded child tax credit payment you received had a major or minor impact on your financial security, or has it had noimpact?
Demographic Major impact Minor impact No impact Total N
Registered Voters 44% (145) 41% (134) 15% (47) 326Gender: Male 53% (96) 37% (66) 10% (19) 181Gender: Female 34% (49) 46% (68) 20% (29) 146Age: 18-34 59% (81) 32% (44) 9% (12) 138Age: 35-44 38% (38) 49% (49) 13% (14) 101Age: 45-64 29% (26) 46% (41) 25% (22) 88Millennials: 1981-1996 55% (111) 38% (78) 7% (15) 204GenXers: 1965-1980 25% (24) 48% (46) 28% (27) 96PID: Dem (no lean) 56% (90) 37% (59) 7% (12) 160PID: Ind (no lean) 34% (21) 45% (28) 21% (13) 63PID: Rep (no lean) 33% (34) 45% (47) 22% (23) 103PID/Gender: DemMen 63% (60) 35% (34) 2% (2) 97PID/Gender: DemWomen 46% (30) 39% (25) 15% (9) 64PID/Gender: Rep Men 41% (24) 34% (20) 25% (15) 59Ideo: Liberal (1-3) 60% (79) 34% (44) 6% (8) 131Ideo: Moderate (4) 31% (19) 54% (32) 15% (9) 60Ideo: Conservative (5-7) 29% (31) 48% (51) 23% (25) 107Educ: < College 40% (59) 44% (64) 15% (22) 145Educ: Bachelors degree 51% (62) 33% (40) 16% (19) 121Educ: Post-grad 40% (25) 49% (30) 10% (6) 61Income: Under 50k 50% (54) 41% (44) 10% (10) 108Income: 50k-100k 46% (61) 41% (55) 12% (16) 132Income: 100k+ 35% (31) 41% (36) 24% (21) 87Ethnicity: White 46% (119) 38% (98) 15% (39) 257Ethnicity: Hispanic 52% (27) 46% (24) 2% (1) 52All Christian 38% (54) 50% (71) 12% (17) 143All Non-Christian 83% (55) 14% (9) 4% (2) 66Agnostic/Nothing in particular 25% (14) 42% (24) 33% (19) 57Something Else 34% (17) 52% (26) 14% (7) 50Religious Non-Protestant/Catholic 79% (55) 16% (11) 5% (4) 71Evangelical 42% (43) 47% (49) 11% (11) 103Non-Evangelical 34% (29) 53% (45) 13% (11) 85
Continued on next page

158
Morning ConsultTable POL14
Table POL14: Has the expanded child tax credit payment you received had a major or minor impact on your financial security, or has it had noimpact?
Demographic Major impact Minor impact No impact Total N
Registered Voters 44% (145) 41% (134) 15% (47) 326Community: Urban 67% (91) 29% (39) 5% (6) 136Community: Suburban 24% (29) 55% (65) 21% (25) 119Community: Rural 36% (26) 42% (30) 23% (16) 72Employ: Private Sector 40% (68) 44% (75) 17% (29) 171Employ: Self-Employed 69% (39) 26% (15) 6% (3) 57Military HH: Yes 43% (24) 41% (22) 16% (9) 55Military HH: No 45% (122) 41% (112) 14% (39) 272RD/WT: Right Direction 56% (100) 37% (66) 7% (13) 179RD/WT: Wrong Track 31% (45) 46% (68) 23% (34) 148Biden Job Approve 55% (100) 38% (68) 7% (13) 181Biden Job Disapprove 29% (39) 46% (62) 25% (33) 135Biden Job Strongly Approve 68% (79) 28% (32) 5% (5) 116Biden Job Somewhat Approve 32% (21) 55% (36) 13% (8) 66Biden Job Somewhat Disapprove 36% (19) 42% (23) 22% (12) 54Biden Job Strongly Disapprove 25% (20) 49% (39) 27% (22) 81Favorable of Biden 55% (95) 36% (63) 8% (14) 172Unfavorable of Biden 27% (34) 48% (62) 25% (33) 129Very Favorable of Biden 67% (62) 27% (25) 6% (5) 93Somewhat Favorable of Biden 41% (32) 48% (37) 11% (9) 79Very Unfavorable of Biden 19% (16) 52% (43) 30% (25) 83#1 Issue: Economy 41% (69) 44% (72) 15% (25) 1662020 Vote: Joe Biden 52% (88) 38% (64) 11% (18) 1702020 Vote: Donald Trump 35% (44) 44% (55) 21% (27) 1252018 House Vote: Democrat 50% (61) 41% (50) 9% (10) 1222018 House Vote: Republican 38% (39) 42% (43) 21% (21) 1032016 Vote: Hillary Clinton 47% (51) 43% (47) 10% (11) 1102016 Vote: Donald Trump 41% (45) 39% (42) 20% (22) 1092016 Vote: Didn’t Vote 50% (45) 38% (34) 13% (11) 90Voted in 2014: Yes 42% (90) 42% (89) 16% (34) 213Voted in 2014: No 49% (56) 39% (45) 12% (14) 114
Continued on next page

National Tracking Poll #2112154, December, 2021
159
Table POL14
Table POL14: Has the expanded child tax credit payment you received had a major or minor impact on your financial security, or has it had noimpact?
Demographic Major impact Minor impact No impact Total N
Registered Voters 44% (145) 41% (134) 15% (47) 3264-Region: Northeast 67% (51) 25% (19) 8% (6) 764-Region: Midwest 37% (24) 47% (31) 17% (11) 664-Region: South 30% (28) 47% (44) 23% (21) 934-Region: West 46% (42) 44% (40) 10% (9) 92Party: Democrat/Leans Democrat 55% (95) 37% (64) 7% (12) 172Party: Republican/Leans Republican 36% (43) 43% (51) 21% (25) 118Note: Row proportions may total to larger than one-hundred percent due to rounding. For more information visit MorningConsultIntelligence.com.

160
Morning ConsultTable POL15_1NET
Table POL15_1NET:Who do you feel is responsible for the expanded child tax credit payments being made possible? Please select all that apply.Democrats in Congress
Demographic Selected Not Selected Total N
Registered Voters 46% (916) 54% (1082) 1998Gender: Male 48% (452) 52% (489) 942Gender: Female 44% (464) 56% (592) 1056Age: 18-34 36% (187) 64% (328) 514Age: 35-44 43% (132) 57% (174) 307Age: 45-64 45% (306) 55% (373) 679Age: 65+ 58% (291) 42% (207) 497GenZers: 1997-2012 32% (59) 68% (122) 181Millennials: 1981-1996 41% (218) 59% (316) 534GenXers: 1965-1980 40% (184) 60% (276) 460Baby Boomers: 1946-1964 54% (411) 46% (344) 755PID: Dem (no lean) 56% (422) 44% (337) 759PID: Ind (no lean) 38% (202) 62% (329) 531PID: Rep (no lean) 41% (293) 59% (415) 708PID/Gender: DemMen 58% (189) 42% (139) 328PID/Gender: DemWomen 54% (233) 46% (198) 431PID/Gender: Ind Men 44% (111) 56% (144) 255PID/Gender: Ind Women 33% (91) 67% (185) 276PID/Gender: Rep Men 43% (153) 57% (206) 359PID/Gender: Rep Women 40% (140) 60% (209) 349Ideo: Liberal (1-3) 54% (313) 46% (263) 576Ideo: Moderate (4) 46% (220) 54% (260) 481Ideo: Conservative (5-7) 46% (358) 54% (418) 776Educ: < College 41% (500) 59% (707) 1206Educ: Bachelors degree 53% (266) 47% (235) 501Educ: Post-grad 52% (151) 48% (140) 290Income: Under 50k 38% (329) 62% (539) 868Income: 50k-100k 53% (384) 47% (341) 725Income: 100k+ 50% (203) 50% (202) 405Ethnicity: White 46% (710) 54% (826) 1536Ethnicity: Hispanic 43% (96) 57% (126) 222Ethnicity: Black 48% (122) 52% (133) 255
Continued on next page

National Tracking Poll #2112154, December, 2021
161
Table POL15_1NET
Table POL15_1NET:Who do you feel is responsible for the expanded child tax credit payments being made possible? Please select all that apply.Democrats in Congress
Demographic Selected Not Selected Total N
Registered Voters 46% (916) 54% (1082) 1998Ethnicity: Other 41% (84) 59% (123) 207All Christian 50% (499) 50% (504) 1003All Non-Christian 49% (74) 51% (77) 151Atheist 52% (39) 48% (36) 75Agnostic/Nothing in particular 40% (191) 60% (283) 474Something Else 38% (113) 62% (182) 295Religious Non-Protestant/Catholic 48% (80) 52% (88) 168Evangelical 50% (279) 50% (276) 555Non-Evangelical 45% (320) 55% (395) 715Community: Urban 48% (257) 52% (280) 538Community: Suburban 47% (442) 53% (497) 939Community: Rural 42% (217) 58% (305) 521Employ: Private Sector 46% (318) 54% (368) 687Employ: Government 42% (53) 58% (74) 127Employ: Self-Employed 44% (87) 56% (113) 200Employ: Homemaker 40% (50) 60% (75) 126Employ: Student 31% (19) 69% (42) 61Employ: Retired 56% (290) 44% (231) 520Employ: Unemployed 39% (59) 61% (91) 150Employ: Other 31% (40) 69% (88) 127Military HH: Yes 48% (167) 52% (181) 348Military HH: No 45% (750) 55% (901) 1650RD/WT: Right Direction 51% (382) 49% (362) 743RD/WT: Wrong Track 43% (535) 57% (720) 1255Biden Job Approve 52% (450) 48% (413) 863Biden Job Disapprove 43% (456) 57% (601) 1057Biden Job Strongly Approve 54% (229) 46% (195) 424Biden Job Somewhat Approve 50% (221) 50% (218) 438Biden Job Somewhat Disapprove 40% (112) 60% (171) 283Biden Job Strongly Disapprove 44% (344) 56% (430) 774
Continued on next page

162
Morning ConsultTable POL15_1NET
Table POL15_1NET:Who do you feel is responsible for the expanded child tax credit payments being made possible? Please select all that apply.Democrats in Congress
Demographic Selected Not Selected Total N
Registered Voters 46% (916) 54% (1082) 1998Favorable of Biden 51% (457) 49% (439) 896Unfavorable of Biden 43% (435) 57% (585) 1020Very Favorable of Biden 57% (242) 43% (185) 427Somewhat Favorable of Biden 46% (215) 54% (253) 469Somewhat Unfavorable of Biden 39% (83) 61% (133) 216Very Unfavorable of Biden 44% (352) 56% (452) 804#1 Issue: Economy 44% (374) 56% (484) 858#1 Issue: Security 44% (122) 56% (153) 274#1 Issue: Health Care 46% (104) 54% (123) 227#1 Issue: Medicare / Social Security 55% (108) 45% (88) 196#1 Issue: Women’s Issues 48% (59) 52% (64) 124#1 Issue: Education 37% (30) 63% (50) 80#1 Issue: Energy 43% (52) 57% (69) 121#1 Issue: Other 57% (67) 43% (50) 1182020 Vote: Joe Biden 53% (505) 47% (440) 9462020 Vote: Donald Trump 41% (355) 59% (509) 8642020 Vote: Didn’t Vote 27% (41) 73% (112) 1532018 House Vote: Democrat 56% (398) 44% (317) 7152018 House Vote: Republican 44% (314) 56% (402) 7162018 House Vote: Someone else 27% (18) 73% (49) 672016 Vote: Hillary Clinton 57% (386) 43% (292) 6792016 Vote: Donald Trump 44% (335) 56% (419) 7542016 Vote: Other 42% (40) 58% (56) 962016 Vote: Didn’t Vote 33% (153) 67% (315) 468Voted in 2014: Yes 50% (678) 50% (683) 1360Voted in 2014: No 37% (238) 63% (399) 6384-Region: Northeast 48% (170) 52% (183) 3534-Region: Midwest 47% (209) 53% (236) 4444-Region: South 45% (336) 55% (409) 7464-Region: West 44% (201) 56% (254) 455
Continued on next page

National Tracking Poll #2112154, December, 2021
163
Table POL15_1NET
Table POL15_1NET:Who do you feel is responsible for the expanded child tax credit payments being made possible? Please select all that apply.Democrats in Congress
Demographic Selected Not Selected Total N
Registered Voters 46% (916) 54% (1082) 1998Party: Democrat/Leans Democrat 55% (488) 45% (395) 883Party: Republican/Leans Republican 42% (353) 58% (489) 841Note: Row proportions may total to larger than one-hundred percent due to rounding. For more information visit MorningConsultIntelligence.com.

164
Morning ConsultTable POL15_2NET
Table POL15_2NET:Who do you feel is responsible for the expanded child tax credit payments being made possible? Please select all that apply.Republicans in Congress
Demographic Selected Not Selected Total N
Registered Voters 11% (217) 89% (1781) 1998Gender: Male 13% (121) 87% (821) 942Gender: Female 9% (96) 91% (961) 1056Age: 18-34 14% (72) 86% (442) 514Age: 35-44 14% (41) 86% (265) 307Age: 45-64 11% (75) 89% (604) 679Age: 65+ 6% (28) 94% (470) 497GenZers: 1997-2012 15% (28) 85% (153) 181Millennials: 1981-1996 13% (70) 87% (463) 534GenXers: 1965-1980 15% (67) 85% (393) 460Baby Boomers: 1946-1964 6% (44) 94% (711) 755PID: Dem (no lean) 5% (38) 95% (721) 759PID: Ind (no lean) 8% (42) 92% (489) 531PID: Rep (no lean) 19% (137) 81% (571) 708PID/Gender: DemMen 6% (20) 94% (308) 328PID/Gender: DemWomen 4% (18) 96% (413) 431PID/Gender: Ind Men 8% (20) 92% (235) 255PID/Gender: Ind Women 8% (22) 92% (254) 276PID/Gender: Rep Men 23% (82) 77% (277) 359PID/Gender: Rep Women 16% (55) 84% (294) 349Ideo: Liberal (1-3) 7% (39) 93% (537) 576Ideo: Moderate (4) 9% (43) 91% (437) 481Ideo: Conservative (5-7) 15% (117) 85% (659) 776Educ: < College 12% (142) 88% (1064) 1206Educ: Bachelors degree 11% (54) 89% (448) 501Educ: Post-grad 7% (21) 93% (269) 290Income: Under 50k 13% (115) 87% (754) 868Income: 50k-100k 9% (65) 91% (660) 725Income: 100k+ 9% (37) 91% (368) 405Ethnicity: White 11% (176) 89% (1360) 1536Ethnicity: Hispanic 14% (30) 86% (192) 222Ethnicity: Black 8% (20) 92% (235) 255
Continued on next page

National Tracking Poll #2112154, December, 2021
165
Table POL15_2NET
Table POL15_2NET:Who do you feel is responsible for the expanded child tax credit payments being made possible? Please select all that apply.Republicans in Congress
Demographic Selected Not Selected Total N
Registered Voters 11% (217) 89% (1781) 1998Ethnicity: Other 10% (20) 90% (187) 207All Christian 11% (113) 89% (890) 1003All Non-Christian 16% (24) 84% (127) 151Atheist 9% (7) 91% (68) 75Agnostic/Nothing in particular 8% (37) 92% (438) 474Something Else 12% (37) 88% (258) 295Religious Non-Protestant/Catholic 16% (28) 84% (140) 168Evangelical 15% (83) 85% (472) 555Non-Evangelical 9% (62) 91% (652) 715Community: Urban 14% (76) 86% (462) 538Community: Suburban 8% (75) 92% (864) 939Community: Rural 13% (65) 87% (456) 521Employ: Private Sector 14% (96) 86% (590) 687Employ: Government 9% (11) 91% (116) 127Employ: Self-Employed 12% (24) 88% (176) 200Employ: Homemaker 16% (21) 84% (105) 126Employ: Student 15% (9) 85% (52) 61Employ: Retired 5% (27) 95% (493) 520Employ: Unemployed 10% (15) 90% (135) 150Employ: Other 11% (14) 89% (113) 127Military HH: Yes 12% (41) 88% (306) 348Military HH: No 11% (176) 89% (1475) 1650RD/WT: Right Direction 9% (64) 91% (679) 743RD/WT: Wrong Track 12% (153) 88% (1102) 1255Biden Job Approve 7% (57) 93% (806) 863Biden Job Disapprove 15% (158) 85% (899) 1057Biden Job Strongly Approve 9% (37) 91% (388) 424Biden Job Somewhat Approve 5% (20) 95% (418) 438Biden Job Somewhat Disapprove 12% (35) 88% (248) 283Biden Job Strongly Disapprove 16% (123) 84% (651) 774
Continued on next page

166
Morning ConsultTable POL15_2NET
Table POL15_2NET:Who do you feel is responsible for the expanded child tax credit payments being made possible? Please select all that apply.Republicans in Congress
Demographic Selected Not Selected Total N
Registered Voters 11% (217) 89% (1781) 1998Favorable of Biden 5% (48) 95% (848) 896Unfavorable of Biden 15% (152) 85% (868) 1020Very Favorable of Biden 5% (23) 95% (404) 427Somewhat Favorable of Biden 5% (25) 95% (443) 469Somewhat Unfavorable of Biden 9% (20) 91% (196) 216Very Unfavorable of Biden 16% (133) 84% (671) 804#1 Issue: Economy 12% (105) 88% (753) 858#1 Issue: Security 12% (32) 88% (242) 274#1 Issue: Health Care 11% (24) 89% (203) 227#1 Issue: Medicare / Social Security 6% (12) 94% (184) 196#1 Issue: Women’s Issues 10% (13) 90% (111) 124#1 Issue: Education 11% (9) 89% (71) 80#1 Issue: Energy 14% (17) 86% (104) 121#1 Issue: Other 5% (6) 95% (112) 1182020 Vote: Joe Biden 5% (48) 95% (898) 9462020 Vote: Donald Trump 18% (152) 82% (712) 8642020 Vote: Didn’t Vote 8% (13) 92% (140) 1532018 House Vote: Democrat 3% (19) 97% (696) 7152018 House Vote: Republican 18% (125) 82% (590) 7162018 House Vote: Someone else 4% (3) 96% (64) 672016 Vote: Hillary Clinton 3% (22) 97% (656) 6792016 Vote: Donald Trump 16% (124) 84% (630) 7542016 Vote: Other 6% (5) 94% (90) 962016 Vote: Didn’t Vote 14% (65) 86% (403) 468Voted in 2014: Yes 10% (130) 90% (1230) 1360Voted in 2014: No 14% (86) 86% (551) 6384-Region: Northeast 11% (40) 89% (313) 3534-Region: Midwest 12% (55) 88% (389) 4444-Region: South 12% (88) 88% (658) 7464-Region: West 7% (34) 93% (421) 455
Continued on next page

National Tracking Poll #2112154, December, 2021
167
Table POL15_2NET
Table POL15_2NET:Who do you feel is responsible for the expanded child tax credit payments being made possible? Please select all that apply.Republicans in Congress
Demographic Selected Not Selected Total N
Registered Voters 11% (217) 89% (1781) 1998Party: Democrat/Leans Democrat 5% (44) 95% (838) 883Party: Republican/Leans Republican 18% (154) 82% (688) 841Note: Row proportions may total to larger than one-hundred percent due to rounding. For more information visit MorningConsultIntelligence.com.

168
Morning ConsultTable POL15_3NET
Table POL15_3NET:Who do you feel is responsible for the expanded child tax credit payments being made possible? Please select all that apply.President Joe Biden
Demographic Selected Not Selected Total N
Registered Voters 34% (682) 66% (1316) 1998Gender: Male 32% (301) 68% (640) 942Gender: Female 36% (381) 64% (675) 1056Age: 18-34 34% (175) 66% (339) 514Age: 35-44 34% (105) 66% (202) 307Age: 45-64 34% (231) 66% (448) 679Age: 65+ 34% (171) 66% (326) 497GenZers: 1997-2012 27% (50) 73% (131) 181Millennials: 1981-1996 37% (197) 63% (337) 534GenXers: 1965-1980 35% (159) 65% (301) 460Baby Boomers: 1946-1964 33% (253) 67% (502) 755PID: Dem (no lean) 48% (363) 52% (396) 759PID: Ind (no lean) 27% (142) 73% (389) 531PID: Rep (no lean) 25% (177) 75% (531) 708PID/Gender: DemMen 49% (162) 51% (166) 328PID/Gender: DemWomen 47% (201) 53% (230) 431PID/Gender: Ind Men 21% (54) 79% (200) 255PID/Gender: Ind Women 32% (87) 68% (188) 276PID/Gender: Rep Men 24% (85) 76% (274) 359PID/Gender: Rep Women 26% (92) 74% (257) 349Ideo: Liberal (1-3) 43% (246) 57% (331) 576Ideo: Moderate (4) 38% (181) 62% (299) 481Ideo: Conservative (5-7) 30% (229) 70% (547) 776Educ: < College 34% (407) 66% (799) 1206Educ: Bachelors degree 33% (167) 67% (334) 501Educ: Post-grad 37% (108) 63% (183) 290Income: Under 50k 31% (268) 69% (600) 868Income: 50k-100k 36% (264) 64% (460) 725Income: 100k+ 37% (150) 63% (255) 405Ethnicity: White 33% (505) 67% (1031) 1536Ethnicity: Hispanic 33% (74) 67% (148) 222Ethnicity: Black 44% (113) 56% (142) 255
Continued on next page

National Tracking Poll #2112154, December, 2021
169
Table POL15_3NET
Table POL15_3NET:Who do you feel is responsible for the expanded child tax credit payments being made possible? Please select all that apply.President Joe Biden
Demographic Selected Not Selected Total N
Registered Voters 34% (682) 66% (1316) 1998Ethnicity: Other 31% (64) 69% (143) 207All Christian 36% (362) 64% (641) 1003All Non-Christian 41% (61) 59% (89) 151Atheist 39% (29) 61% (46) 75Agnostic/Nothing in particular 29% (138) 71% (336) 474Something Else 31% (91) 69% (203) 295Religious Non-Protestant/Catholic 40% (68) 60% (100) 168Evangelical 33% (183) 67% (371) 555Non-Evangelical 36% (259) 64% (456) 715Community: Urban 38% (204) 62% (334) 538Community: Suburban 33% (312) 67% (628) 939Community: Rural 32% (167) 68% (354) 521Employ: Private Sector 35% (237) 65% (449) 687Employ: Government 38% (48) 62% (79) 127Employ: Self-Employed 39% (77) 61% (123) 200Employ: Homemaker 25% (31) 75% (95) 126Employ: Student 29% (18) 71% (43) 61Employ: Retired 35% (184) 65% (337) 520Employ: Unemployed 26% (39) 74% (111) 150Employ: Other 38% (48) 62% (79) 127Military HH: Yes 30% (105) 70% (243) 348Military HH: No 35% (577) 65% (1073) 1650RD/WT: Right Direction 46% (340) 54% (404) 743RD/WT: Wrong Track 27% (343) 73% (912) 1255Biden Job Approve 47% (408) 53% (455) 863Biden Job Disapprove 24% (253) 76% (804) 1057Biden Job Strongly Approve 53% (225) 47% (199) 424Biden Job Somewhat Approve 42% (183) 58% (255) 438Biden Job Somewhat Disapprove 25% (70) 75% (213) 283Biden Job Strongly Disapprove 24% (183) 76% (591) 774
Continued on next page

170
Morning ConsultTable POL15_3NET
Table POL15_3NET:Who do you feel is responsible for the expanded child tax credit payments being made possible? Please select all that apply.President Joe Biden
Demographic Selected Not Selected Total N
Registered Voters 34% (682) 66% (1316) 1998Favorable of Biden 47% (425) 53% (471) 896Unfavorable of Biden 24% (248) 76% (772) 1020Very Favorable of Biden 55% (235) 45% (193) 427Somewhat Favorable of Biden 41% (190) 59% (279) 469Somewhat Unfavorable of Biden 23% (50) 77% (166) 216Very Unfavorable of Biden 25% (197) 75% (607) 804#1 Issue: Economy 34% (291) 66% (567) 858#1 Issue: Security 26% (71) 74% (203) 274#1 Issue: Health Care 36% (82) 64% (145) 227#1 Issue: Medicare / Social Security 37% (73) 63% (123) 196#1 Issue: Women’s Issues 33% (41) 67% (83) 124#1 Issue: Education 40% (32) 60% (48) 80#1 Issue: Energy 37% (44) 63% (77) 121#1 Issue: Other 41% (48) 59% (70) 1182020 Vote: Joe Biden 45% (428) 55% (518) 9462020 Vote: Donald Trump 25% (213) 75% (651) 8642020 Vote: Didn’t Vote 22% (33) 78% (119) 1532018 House Vote: Democrat 46% (332) 54% (383) 7152018 House Vote: Republican 27% (193) 73% (523) 7162018 House Vote: Someone else 29% (20) 71% (47) 672016 Vote: Hillary Clinton 46% (310) 54% (369) 6792016 Vote: Donald Trump 28% (213) 72% (540) 7542016 Vote: Other 37% (36) 63% (60) 962016 Vote: Didn’t Vote 26% (124) 74% (344) 468Voted in 2014: Yes 36% (492) 64% (868) 1360Voted in 2014: No 30% (190) 70% (447) 6384-Region: Northeast 33% (118) 67% (235) 3534-Region: Midwest 34% (151) 66% (294) 4444-Region: South 35% (260) 65% (486) 7464-Region: West 34% (154) 66% (301) 455
Continued on next page

National Tracking Poll #2112154, December, 2021
171
Table POL15_3NET
Table POL15_3NET:Who do you feel is responsible for the expanded child tax credit payments being made possible? Please select all that apply.President Joe Biden
Demographic Selected Not Selected Total N
Registered Voters 34% (682) 66% (1316) 1998Party: Democrat/Leans Democrat 47% (414) 53% (468) 883Party: Republican/Leans Republican 25% (210) 75% (632) 841Note: Row proportions may total to larger than one-hundred percent due to rounding. For more information visit MorningConsultIntelligence.com.

172
Morning ConsultTable POL15_4NET
Table POL15_4NET:Who do you feel is responsible for the expanded child tax credit payments being made possible? Please select all that apply.Other (please specify)
Demographic Selected Not Selected Total N
Registered Voters 2% (35) 98% (1963) 1998Gender: Male 2% (17) 98% (924) 942Gender: Female 2% (18) 98% (1038) 1056Age: 18-34 1% (6) 99% (508) 514Age: 35-44 2% (8) 98% (299) 307Age: 45-64 2% (15) 98% (665) 679Age: 65+ 1% (7) 99% (490) 497GenZers: 1997-2012 1% (2) 99% (179) 181Millennials: 1981-1996 1% (7) 99% (526) 534GenXers: 1965-1980 2% (11) 98% (449) 460Baby Boomers: 1946-1964 2% (14) 98% (741) 755PID: Dem (no lean) 1% (11) 99% (748) 759PID: Ind (no lean) 2% (13) 98% (517) 531PID: Rep (no lean) 2% (11) 98% (697) 708PID/Gender: DemMen 2% (7) 98% (321) 328PID/Gender: DemWomen 1% (4) 99% (427) 431PID/Gender: Ind Men 3% (8) 97% (247) 255PID/Gender: Ind Women 2% (5) 98% (271) 276PID/Gender: Rep Men 1% (2) 99% (357) 359PID/Gender: Rep Women 3% (9) 97% (341) 349Ideo: Liberal (1-3) 1% (6) 99% (570) 576Ideo: Moderate (4) 2% (10) 98% (471) 481Ideo: Conservative (5-7) 2% (16) 98% (760) 776Educ: < College 2% (23) 98% (1184) 1206Educ: Bachelors degree 1% (3) 99% (498) 501Educ: Post-grad 3% (9) 97% (281) 290Income: Under 50k 2% (17) 98% (851) 868Income: 50k-100k 2% (13) 98% (712) 725Income: 100k+ 1% (5) 99% (400) 405Ethnicity: White 2% (26) 98% (1510) 1536Ethnicity: Hispanic 3% (7) 97% (215) 222Ethnicity: Black 1% (4) 99% (251) 255
Continued on next page

National Tracking Poll #2112154, December, 2021
173
Table POL15_4NET
Table POL15_4NET:Who do you feel is responsible for the expanded child tax credit payments being made possible? Please select all that apply.Other (please specify)
Demographic Selected Not Selected Total N
Registered Voters 2% (35) 98% (1963) 1998Ethnicity: Other 3% (6) 97% (201) 207All Christian 2% (16) 98% (987) 1003All Non-Christian 1% (2) 99% (149) 151Atheist 2% (2) 98% (74) 75Agnostic/Nothing in particular 2% (9) 98% (465) 474Something Else 2% (7) 98% (288) 295Religious Non-Protestant/Catholic 1% (2) 99% (166) 168Evangelical 2% (11) 98% (544) 555Non-Evangelical 2% (12) 98% (703) 715Community: Urban 2% (8) 98% (530) 538Community: Suburban 2% (19) 98% (920) 939Community: Rural 2% (8) 98% (513) 521Employ: Private Sector 1% (10) 99% (676) 687Employ: Government 2% (2) 98% (125) 127Employ: Self-Employed 3% (7) 97% (193) 200Employ: Homemaker 3% (4) 97% (122) 126Employ: Student 1% (1) 99% (60) 61Employ: Retired 1% (5) 99% (515) 520Employ: Unemployed 2% (3) 98% (147) 150Employ: Other 3% (4) 97% (124) 127Military HH: Yes 1% (4) 99% (344) 348Military HH: No 2% (32) 98% (1619) 1650RD/WT: Right Direction 1% (6) 99% (737) 743RD/WT: Wrong Track 2% (29) 98% (1225) 1255Biden Job Approve 1% (12) 99% (850) 863Biden Job Disapprove 2% (21) 98% (1036) 1057Biden Job Strongly Approve — (2) 100% (423) 424Biden Job Somewhat Approve 2% (11) 98% (428) 438Biden Job Somewhat Disapprove 1% (4) 99% (280) 283Biden Job Strongly Disapprove 2% (17) 98% (757) 774
Continued on next page

174
Morning ConsultTable POL15_4NET
Table POL15_4NET:Who do you feel is responsible for the expanded child tax credit payments being made possible? Please select all that apply.Other (please specify)
Demographic Selected Not Selected Total N
Registered Voters 2% (35) 98% (1963) 1998Favorable of Biden 2% (15) 98% (881) 896Unfavorable of Biden 2% (21) 98% (999) 1020Very Favorable of Biden — (0) 100% (427) 427Somewhat Favorable of Biden 3% (14) 97% (454) 469Somewhat Unfavorable of Biden 1% (2) 99% (214) 216Very Unfavorable of Biden 2% (19) 98% (785) 804#1 Issue: Economy 2% (13) 98% (845) 858#1 Issue: Security 4% (11) 96% (263) 274#1 Issue: Health Care 3% (6) 97% (221) 227#1 Issue: Medicare / Social Security — (0) 100% (196) 196#1 Issue: Women’s Issues — (0) 100% (123) 124#1 Issue: Education 1% (1) 99% (79) 80#1 Issue: Energy — (0) 100% (121) 121#1 Issue: Other 3% (4) 97% (114) 1182020 Vote: Joe Biden 1% (14) 99% (932) 9462020 Vote: Donald Trump 2% (15) 98% (848) 8642020 Vote: Didn’t Vote 3% (4) 97% (148) 1532018 House Vote: Democrat 1% (10) 99% (705) 7152018 House Vote: Republican 2% (16) 98% (700) 7162018 House Vote: Someone else 1% (1) 99% (66) 672016 Vote: Hillary Clinton 1% (8) 99% (671) 6792016 Vote: Donald Trump 2% (12) 98% (741) 7542016 Vote: Other 4% (4) 96% (92) 962016 Vote: Didn’t Vote 2% (11) 98% (456) 468Voted in 2014: Yes 2% (24) 98% (1337) 1360Voted in 2014: No 2% (12) 98% (626) 6384-Region: Northeast 2% (8) 98% (345) 3534-Region: Midwest 2% (8) 98% (437) 4444-Region: South 2% (13) 98% (732) 7464-Region: West 2% (7) 98% (448) 455
Continued on next page

National Tracking Poll #2112154, December, 2021
175
Table POL15_4NET
Table POL15_4NET:Who do you feel is responsible for the expanded child tax credit payments being made possible? Please select all that apply.Other (please specify)
Demographic Selected Not Selected Total N
Registered Voters 2% (35) 98% (1963) 1998Party: Democrat/Leans Democrat 1% (12) 99% (871) 883Party: Republican/Leans Republican 2% (15) 98% (827) 841Note: Row proportions may total to larger than one-hundred percent due to rounding. For more information visit MorningConsultIntelligence.com.

176
Morning ConsultTable POL15_5NET
Table POL15_5NET:Who do you feel is responsible for the expanded child tax credit payments being made possible? Please select all that apply.Don’t know / No opinion
Demographic Selected Not Selected Total N
Registered Voters 25% (498) 75% (1500) 1998Gender: Male 22% (210) 78% (732) 942Gender: Female 27% (288) 73% (768) 1056Age: 18-34 28% (143) 72% (372) 514Age: 35-44 27% (84) 73% (223) 307Age: 45-64 25% (170) 75% (509) 679Age: 65+ 20% (102) 80% (396) 497GenZers: 1997-2012 36% (65) 64% (116) 181Millennials: 1981-1996 23% (124) 77% (410) 534GenXers: 1965-1980 27% (125) 73% (335) 460Baby Boomers: 1946-1964 23% (175) 77% (580) 755PID: Dem (no lean) 13% (102) 87% (657) 759PID: Ind (no lean) 39% (205) 61% (326) 531PID: Rep (no lean) 27% (191) 73% (517) 708PID/Gender: DemMen 9% (28) 91% (300) 328PID/Gender: DemWomen 17% (74) 83% (357) 431PID/Gender: Ind Men 37% (95) 63% (160) 255PID/Gender: Ind Women 40% (110) 60% (166) 276PID/Gender: Rep Men 24% (87) 76% (272) 359PID/Gender: Rep Women 30% (104) 70% (245) 349Ideo: Liberal (1-3) 16% (92) 84% (485) 576Ideo: Moderate (4) 25% (121) 75% (360) 481Ideo: Conservative (5-7) 23% (178) 77% (598) 776Educ: < College 28% (340) 72% (866) 1206Educ: Bachelors degree 21% (107) 79% (395) 501Educ: Post-grad 18% (51) 82% (239) 290Income: Under 50k 31% (268) 69% (600) 868Income: 50k-100k 21% (149) 79% (576) 725Income: 100k+ 20% (81) 80% (324) 405Ethnicity: White 25% (380) 75% (1156) 1536Ethnicity: Hispanic 22% (50) 78% (172) 222Ethnicity: Black 22% (56) 78% (199) 255
Continued on next page

National Tracking Poll #2112154, December, 2021
177
Table POL15_5NET
Table POL15_5NET:Who do you feel is responsible for the expanded child tax credit payments being made possible? Please select all that apply.Don’t know / No opinion
Demographic Selected Not Selected Total N
Registered Voters 25% (498) 75% (1500) 1998Ethnicity: Other 30% (63) 70% (144) 207All Christian 21% (209) 79% (794) 1003All Non-Christian 9% (13) 91% (137) 151Atheist 14% (11) 86% (65) 75Agnostic/Nothing in particular 36% (171) 64% (303) 474Something Else 32% (94) 68% (201) 295Religious Non-Protestant/Catholic 12% (20) 88% (147) 168Evangelical 21% (116) 79% (439) 555Non-Evangelical 25% (179) 75% (536) 715Community: Urban 20% (108) 80% (430) 538Community: Suburban 27% (249) 73% (690) 939Community: Rural 27% (141) 73% (380) 521Employ: Private Sector 20% (139) 80% (548) 687Employ: Government 31% (40) 69% (87) 127Employ: Self-Employed 20% (39) 80% (161) 200Employ: Homemaker 30% (38) 70% (88) 126Employ: Student 33% (20) 67% (41) 61Employ: Retired 22% (116) 78% (405) 520Employ: Unemployed 39% (58) 61% (92) 150Employ: Other 39% (50) 61% (78) 127Military HH: Yes 25% (89) 75% (259) 348Military HH: No 25% (410) 75% (1241) 1650RD/WT: Right Direction 14% (102) 86% (641) 743RD/WT: Wrong Track 32% (396) 68% (858) 1255Biden Job Approve 13% (116) 87% (747) 863Biden Job Disapprove 32% (333) 68% (724) 1057Biden Job Strongly Approve 8% (34) 92% (390) 424Biden Job Somewhat Approve 19% (82) 81% (357) 438Biden Job Somewhat Disapprove 36% (102) 64% (182) 283Biden Job Strongly Disapprove 30% (232) 70% (542) 774
Continued on next page

178
Morning ConsultTable POL15_5NET
Table POL15_5NET:Who do you feel is responsible for the expanded child tax credit payments being made possible? Please select all that apply.Don’t know / No opinion
Demographic Selected Not Selected Total N
Registered Voters 25% (498) 75% (1500) 1998Favorable of Biden 15% (135) 85% (761) 896Unfavorable of Biden 32% (325) 68% (695) 1020Very Favorable of Biden 9% (38) 91% (389) 427Somewhat Favorable of Biden 21% (97) 79% (372) 469Somewhat Unfavorable of Biden 42% (90) 58% (126) 216Very Unfavorable of Biden 29% (235) 71% (569) 804#1 Issue: Economy 26% (225) 74% (633) 858#1 Issue: Security 29% (79) 71% (195) 274#1 Issue: Health Care 19% (44) 81% (183) 227#1 Issue: Medicare / Social Security 22% (43) 78% (154) 196#1 Issue: Women’s Issues 26% (32) 74% (92) 124#1 Issue: Education 25% (20) 75% (60) 80#1 Issue: Energy 23% (28) 77% (93) 121#1 Issue: Other 24% (29) 76% (89) 1182020 Vote: Joe Biden 17% (162) 83% (783) 9462020 Vote: Donald Trump 29% (250) 71% (614) 8642020 Vote: Didn’t Vote 49% (75) 51% (78) 1532018 House Vote: Democrat 14% (101) 86% (614) 7152018 House Vote: Republican 25% (181) 75% (535) 7162018 House Vote: Someone else 46% (31) 54% (36) 672016 Vote: Hillary Clinton 15% (100) 85% (579) 6792016 Vote: Donald Trump 26% (195) 74% (558) 7542016 Vote: Other 27% (26) 73% (70) 962016 Vote: Didn’t Vote 38% (177) 62% (291) 468Voted in 2014: Yes 21% (283) 79% (1078) 1360Voted in 2014: No 34% (216) 66% (422) 6384-Region: Northeast 23% (82) 77% (271) 3534-Region: Midwest 24% (106) 76% (338) 4444-Region: South 25% (184) 75% (562) 7464-Region: West 28% (127) 72% (328) 455
Continued on next page

National Tracking Poll #2112154, December, 2021
179
Table POL15_5NET
Table POL15_5NET:Who do you feel is responsible for the expanded child tax credit payments being made possible? Please select all that apply.Don’t know / No opinion
Demographic Selected Not Selected Total N
Registered Voters 25% (498) 75% (1500) 1998Party: Democrat/Leans Democrat 14% (124) 86% (759) 883Party: Republican/Leans Republican 27% (227) 73% (614) 841Note: Row proportions may total to larger than one-hundred percent due to rounding. For more information visit MorningConsultIntelligence.com.

180
Morning ConsultTable POL16
Table POL16: As you may know, the expanded child tax credit payments are set to expire next year. Do you think the payments should be madepermanent?
Demographic Yes, definitely Yes, probablyNo, probably
notNo, definitely
notDon’t know /No opinion Total N
Registered Voters 17% (342) 18% (355) 20% (393) 31% (623) 14% (285) 1998Gender: Male 20% (192) 18% (166) 18% (171) 33% (306) 11% (107) 942Gender: Female 14% (150) 18% (190) 21% (222) 30% (317) 17% (178) 1056Age: 18-34 27% (139) 22% (115) 22% (113) 11% (56) 18% (91) 514Age: 35-44 21% (66) 23% (72) 20% (61) 21% (65) 14% (42) 307Age: 45-64 14% (96) 14% (94) 20% (134) 39% (267) 13% (89) 679Age: 65+ 8% (41) 15% (74) 17% (84) 47% (235) 13% (63) 497GenZers: 1997-2012 16% (28) 24% (43) 22% (39) 13% (24) 25% (46) 181Millennials: 1981-1996 31% (164) 24% (127) 21% (110) 12% (65) 13% (68) 534GenXers: 1965-1980 16% (72) 17% (80) 18% (83) 35% (162) 14% (63) 460Baby Boomers: 1946-1964 9% (69) 13% (96) 20% (154) 45% (336) 13% (100) 755PID: Dem (no lean) 27% (205) 29% (218) 17% (129) 15% (112) 12% (95) 759PID: Ind (no lean) 14% (75) 13% (69) 21% (113) 32% (168) 20% (106) 531PID: Rep (no lean) 9% (62) 10% (69) 21% (151) 48% (343) 12% (84) 708PID/Gender: DemMen 36% (119) 29% (96) 13% (42) 15% (49) 7% (22) 328PID/Gender: DemWomen 20% (86) 28% (122) 20% (87) 15% (63) 17% (72) 431PID/Gender: Ind Men 13% (34) 13% (33) 23% (58) 32% (83) 19% (48) 255PID/Gender: Ind Women 15% (41) 13% (36) 20% (55) 31% (85) 21% (59) 276PID/Gender: Rep Men 11% (38) 10% (37) 20% (71) 49% (175) 10% (37) 359PID/Gender: Rep Women 7% (23) 9% (32) 23% (79) 48% (168) 13% (47) 349Ideo: Liberal (1-3) 31% (177) 27% (153) 19% (108) 10% (59) 14% (78) 576Ideo: Moderate (4) 11% (55) 24% (114) 23% (109) 28% (134) 14% (69) 481Ideo: Conservative (5-7) 10% (81) 9% (72) 21% (160) 52% (405) 8% (60) 776Educ: < College 14% (174) 18% (215) 18% (222) 32% (391) 17% (204) 1206Educ: Bachelors degree 21% (104) 17% (84) 23% (115) 30% (150) 9% (48) 501Educ: Post-grad 22% (63) 19% (57) 19% (56) 28% (82) 11% (33) 290Income: Under 50k 17% (149) 18% (155) 20% (176) 26% (224) 19% (164) 868Income: 50k-100k 17% (123) 18% (129) 20% (147) 34% (246) 11% (80) 725Income: 100k+ 17% (69) 18% (72) 17% (70) 38% (153) 10% (41) 405Ethnicity: White 16% (243) 16% (238) 20% (301) 36% (551) 13% (203) 1536Ethnicity: Hispanic 26% (57) 22% (49) 21% (47) 15% (34) 16% (36) 222
Continued on next page

National Tracking Poll #2112154, December, 2021
181
Table POL16
Table POL16: As you may know, the expanded child tax credit payments are set to expire next year. Do you think the payments should be madepermanent?
Demographic Yes, definitely Yes, probablyNo, probably
notNo, definitely
notDon’t know /No opinion Total N
Registered Voters 17% (342) 18% (355) 20% (393) 31% (623) 14% (285) 1998Ethnicity: Black 24% (61) 33% (84) 17% (44) 6% (16) 19% (50) 255Ethnicity: Other 18% (38) 16% (34) 23% (47) 27% (55) 16% (33) 207All Christian 13% (126) 19% (194) 20% (198) 38% (380) 10% (105) 1003All Non-Christian 49% (73) 16% (24) 16% (24) 13% (20) 6% (9) 151Atheist 28% (21) 14% (11) 19% (14) 30% (22) 10% (7) 75Agnostic/Nothing in particular 16% (75) 18% (85) 21% (100) 22% (106) 23% (108) 474Something Else 16% (47) 14% (42) 19% (56) 32% (95) 19% (56) 295Religious Non-Protestant/Catholic 45% (76) 15% (25) 17% (29) 15% (25) 8% (13) 168Evangelical 17% (93) 18% (100) 16% (90) 40% (220) 9% (52) 555Non-Evangelical 11% (77) 18% (129) 22% (160) 35% (248) 14% (102) 715Community: Urban 30% (163) 20% (110) 19% (103) 19% (104) 11% (58) 538Community: Suburban 12% (113) 17% (161) 20% (191) 35% (324) 16% (150) 939Community: Rural 13% (66) 16% (85) 19% (99) 37% (195) 15% (77) 521Employ: Private Sector 19% (130) 21% (146) 21% (145) 30% (208) 8% (57) 687Employ: Government 14% (18) 18% (23) 24% (30) 28% (36) 15% (20) 127Employ: Self-Employed 35% (69) 16% (33) 19% (37) 19% (38) 12% (24) 200Employ: Homemaker 19% (24) 12% (15) 19% (23) 30% (37) 21% (26) 126Employ: Student 18% (11) 30% (19) 26% (16) 9% (5) 17% (10) 61Employ: Retired 9% (45) 13% (70) 19% (97) 46% (238) 14% (71) 520Employ: Unemployed 18% (28) 10% (15) 19% (29) 17% (26) 35% (52) 150Employ: Other 14% (17) 27% (35) 12% (15) 27% (35) 20% (26) 127Military HH: Yes 14% (50) 16% (54) 18% (64) 36% (125) 16% (55) 348Military HH: No 18% (292) 18% (302) 20% (329) 30% (498) 14% (230) 1650RD/WT: Right Direction 28% (205) 28% (209) 18% (131) 13% (95) 14% (103) 743RD/WT: Wrong Track 11% (136) 12% (147) 21% (262) 42% (528) 15% (182) 1255Biden Job Approve 26% (228) 28% (246) 19% (162) 14% (117) 13% (110) 863Biden Job Disapprove 10% (103) 10% (101) 20% (214) 47% (498) 13% (140) 1057
Continued on next page

182
Morning ConsultTable POL16
Table POL16: As you may know, the expanded child tax credit payments are set to expire next year. Do you think the payments should be madepermanent?
Demographic Yes, definitely Yes, probablyNo, probably
notNo, definitely
notDon’t know /No opinion Total N
Registered Voters 17% (342) 18% (355) 20% (393) 31% (623) 14% (285) 1998Biden Job Strongly Approve 41% (172) 26% (111) 13% (55) 10% (43) 10% (43) 424Biden Job Somewhat Approve 13% (56) 31% (135) 24% (107) 17% (75) 15% (67) 438Biden Job Somewhat Disapprove 13% (38) 17% (50) 26% (74) 26% (72) 17% (49) 283Biden Job Strongly Disapprove 8% (65) 7% (51) 18% (140) 55% (426) 12% (91) 774Favorable of Biden 25% (223) 27% (240) 21% (184) 14% (126) 14% (123) 896Unfavorable of Biden 10% (98) 10% (100) 20% (203) 48% (491) 12% (127) 1020Very Favorable of Biden 35% (151) 26% (113) 16% (70) 10% (42) 12% (51) 427Somewhat Favorable of Biden 15% (72) 27% (127) 24% (114) 18% (84) 15% (72) 469Somewhat Unfavorable of Biden 13% (29) 19% (42) 27% (58) 25% (54) 15% (33) 216Very Unfavorable of Biden 9% (70) 7% (59) 18% (145) 54% (436) 12% (95) 804#1 Issue: Economy 17% (144) 16% (137) 21% (177) 33% (285) 13% (115) 858#1 Issue: Security 8% (23) 5% (15) 17% (46) 59% (161) 11% (29) 274#1 Issue: Health Care 26% (59) 24% (54) 20% (45) 16% (35) 15% (34) 227#1 Issue: Medicare / Social Security 11% (21) 19% (38) 20% (40) 33% (64) 17% (33) 196#1 Issue: Women’s Issues 28% (35) 24% (30) 16% (20) 14% (18) 17% (21) 124#1 Issue: Education 24% (19) 28% (22) 13% (10) 14% (12) 21% (17) 80#1 Issue: Energy 19% (23) 28% (33) 28% (34) 12% (15) 13% (15) 121#1 Issue: Other 14% (16) 22% (26) 18% (21) 29% (34) 17% (21) 1182020 Vote: Joe Biden 24% (227) 27% (255) 20% (191) 16% (153) 13% (120) 9462020 Vote: Donald Trump 9% (79) 8% (68) 20% (169) 50% (435) 13% (113) 8642020 Vote: Didn’t Vote 20% (31) 17% (26) 16% (24) 17% (26) 30% (45) 1532018 House Vote: Democrat 24% (173) 26% (189) 20% (144) 17% (119) 13% (90) 7152018 House Vote: Republican 11% (75) 9% (66) 19% (136) 51% (367) 10% (72) 7162018 House Vote: Someone else 20% (13) 9% (6) 14% (10) 39% (26) 18% (12) 672016 Vote: Hillary Clinton 24% (161) 28% (189) 19% (130) 15% (104) 14% (94) 6792016 Vote: Donald Trump 11% (84) 8% (61) 18% (138) 52% (389) 11% (82) 7542016 Vote: Other 19% (18) 15% (14) 22% (21) 38% (36) 6% (6) 962016 Vote: Didn’t Vote 17% (79) 20% (91) 22% (103) 20% (93) 22% (102) 468Voted in 2014: Yes 17% (236) 17% (231) 18% (251) 35% (480) 12% (162) 1360Voted in 2014: No 17% (105) 19% (124) 22% (142) 22% (143) 19% (123) 638
Continued on next page

National Tracking Poll #2112154, December, 2021
183
Table POL16
Table POL16: As you may know, the expanded child tax credit payments are set to expire next year. Do you think the payments should be madepermanent?
Demographic Yes, definitely Yes, probablyNo, probably
notNo, definitely
notDon’t know /No opinion Total N
Registered Voters 17% (342) 18% (355) 20% (393) 31% (623) 14% (285) 19984-Region: Northeast 24% (85) 20% (70) 18% (63) 28% (98) 11% (38) 3534-Region: Midwest 14% (64) 15% (66) 22% (96) 36% (159) 13% (58) 4444-Region: South 15% (112) 17% (128) 20% (149) 34% (253) 14% (103) 7464-Region: West 18% (80) 20% (91) 19% (85) 25% (113) 19% (86) 455Party: Democrat/Leans Democrat 26% (230) 28% (247) 18% (158) 15% (132) 13% (116) 883Party: Republican/Leans Republican 9% (76) 9% (75) 21% (180) 49% (412) 12% (99) 841Note: Row proportions may total to larger than one-hundred percent due to rounding. For more information visit MorningConsultIntelligence.com.

184
Morning ConsultTable POL17
Table POL17: Do you think the expanded child tax credit payments should be extended for at least one more year?
Demographic Yes, definitely Yes, probablyNo, probably
notNo, definitely
notDon’t know /No opinion Total N
Registered Voters 25% (490) 22% (443) 16% (320) 26% (517) 11% (228) 1998Gender: Male 27% (250) 22% (203) 15% (141) 27% (255) 10% (94) 942Gender: Female 23% (240) 23% (240) 17% (179) 25% (263) 13% (134) 1056Age: 18-34 33% (171) 32% (163) 12% (60) 9% (47) 14% (73) 514Age: 35-44 32% (98) 27% (84) 12% (36) 18% (55) 11% (34) 307Age: 45-64 22% (152) 14% (98) 21% (141) 32% (220) 10% (68) 679Age: 65+ 14% (69) 20% (98) 17% (83) 39% (194) 11% (53) 497GenZers: 1997-2012 21% (37) 34% (61) 11% (20) 12% (22) 23% (41) 181Millennials: 1981-1996 40% (211) 29% (157) 11% (60) 10% (54) 10% (51) 534GenXers: 1965-1980 25% (114) 19% (88) 19% (87) 27% (125) 10% (47) 460Baby Boomers: 1946-1964 15% (113) 17% (131) 19% (143) 38% (287) 11% (81) 755PID: Dem (no lean) 39% (297) 27% (206) 13% (96) 12% (92) 9% (69) 759PID: Ind (no lean) 20% (108) 24% (125) 18% (93) 24% (126) 15% (79) 531PID: Rep (no lean) 12% (85) 16% (112) 18% (131) 42% (299) 11% (80) 708PID/Gender: DemMen 46% (151) 27% (88) 8% (27) 13% (44) 6% (18) 328PID/Gender: DemWomen 34% (146) 27% (118) 16% (69) 11% (47) 12% (50) 431PID/Gender: Ind Men 20% (51) 22% (55) 21% (54) 22% (56) 15% (39) 255PID/Gender: Ind Women 21% (57) 25% (70) 14% (39) 26% (70) 14% (40) 276PID/Gender: Rep Men 13% (48) 17% (60) 17% (60) 43% (155) 10% (37) 359PID/Gender: Rep Women 11% (37) 15% (52) 20% (71) 41% (145) 12% (43) 349Ideo: Liberal (1-3) 42% (242) 30% (172) 14% (79) 7% (40) 8% (44) 576Ideo: Moderate (4) 23% (111) 26% (126) 18% (87) 22% (104) 11% (52) 481Ideo: Conservative (5-7) 13% (98) 15% (115) 18% (142) 46% (353) 9% (67) 776Educ: < College 22% (264) 22% (266) 15% (177) 27% (326) 14% (174) 1206Educ: Bachelors degree 28% (139) 21% (106) 19% (97) 25% (127) 6% (32) 501Educ: Post-grad 30% (87) 25% (72) 16% (46) 22% (64) 8% (22) 290Income: Under 50k 26% (223) 23% (202) 13% (117) 21% (185) 16% (142) 868Income: 50k-100k 23% (170) 22% (159) 18% (132) 29% (209) 7% (54) 725Income: 100k+ 24% (98) 20% (83) 17% (71) 30% (122) 8% (32) 405Ethnicity: White 23% (347) 20% (306) 17% (267) 30% (457) 10% (159) 1536Ethnicity: Hispanic 32% (70) 36% (79) 9% (20) 15% (32) 9% (20) 222Ethnicity: Black 37% (94) 28% (71) 11% (29) 6% (16) 18% (45) 255
Continued on next page

National Tracking Poll #2112154, December, 2021
185
Table POL17
Table POL17: Do you think the expanded child tax credit payments should be extended for at least one more year?
Demographic Yes, definitely Yes, probablyNo, probably
notNo, definitely
notDon’t know /No opinion Total N
Registered Voters 25% (490) 22% (443) 16% (320) 26% (517) 11% (228) 1998Ethnicity: Other 24% (49) 32% (66) 12% (24) 21% (44) 11% (23) 207All Christian 21% (206) 21% (213) 18% (183) 31% (314) 9% (86) 1003All Non-Christian 52% (78) 21% (32) 11% (17) 9% (14) 7% (10) 151Atheist 38% (28) 22% (16) 12% (9) 23% (18) 5% (4) 75Agnostic/Nothing in particular 24% (112) 24% (115) 16% (76) 18% (86) 18% (86) 474Something Else 23% (67) 23% (67) 12% (34) 29% (85) 14% (42) 295Religious Non-Protestant/Catholic 50% (84) 22% (37) 11% (18) 11% (19) 6% (10) 168Evangelical 23% (126) 19% (103) 16% (87) 34% (187) 9% (51) 555Non-Evangelical 19% (139) 23% (166) 18% (128) 29% (206) 10% (75) 715Community: Urban 37% (202) 22% (118) 15% (81) 15% (81) 11% (57) 538Community: Suburban 21% (194) 23% (218) 16% (150) 29% (271) 11% (106) 939Community: Rural 18% (95) 21% (108) 17% (89) 32% (165) 12% (64) 521Employ: Private Sector 27% (183) 25% (175) 18% (123) 25% (170) 5% (36) 687Employ: Government 19% (25) 25% (32) 22% (29) 24% (31) 8% (11) 127Employ: Self-Employed 37% (75) 26% (52) 12% (23) 14% (28) 11% (22) 200Employ: Homemaker 29% (36) 18% (23) 17% (22) 21% (27) 15% (18) 126Employ: Student 28% (17) 34% (21) 10% (6) 8% (5) 20% (12) 61Employ: Retired 15% (77) 18% (92) 17% (86) 39% (205) 12% (60) 520Employ: Unemployed 28% (42) 20% (30) 10% (14) 15% (22) 27% (40) 150Employ: Other 28% (36) 14% (18) 13% (17) 23% (29) 21% (27) 127Military HH: Yes 20% (68) 24% (83) 14% (50) 30% (104) 12% (43) 348Military HH: No 26% (422) 22% (360) 16% (270) 25% (413) 11% (185) 1650RD/WT: Right Direction 38% (285) 28% (212) 13% (98) 9% (66) 11% (82) 743RD/WT: Wrong Track 16% (205) 18% (232) 18% (221) 36% (451) 12% (145) 1255Biden Job Approve 38% (330) 29% (254) 13% (115) 10% (86) 9% (78) 863Biden Job Disapprove 14% (143) 16% (166) 19% (204) 40% (427) 11% (118) 1057Biden Job Strongly Approve 50% (212) 23% (97) 11% (46) 7% (30) 9% (38) 424Biden Job Somewhat Approve 27% (118) 36% (156) 16% (68) 13% (55) 9% (40) 438Biden Job Somewhat Disapprove 22% (63) 22% (62) 21% (61) 19% (54) 15% (44) 283Biden Job Strongly Disapprove 10% (80) 13% (104) 18% (143) 48% (373) 10% (74) 774
Continued on next page

186
Morning ConsultTable POL17
Table POL17: Do you think the expanded child tax credit payments should be extended for at least one more year?
Demographic Yes, definitely Yes, probablyNo, probably
notNo, definitely
notDon’t know /No opinion Total N
Registered Voters 25% (490) 22% (443) 16% (320) 26% (517) 11% (228) 1998Favorable of Biden 37% (328) 29% (263) 13% (117) 10% (93) 11% (95) 896Unfavorable of Biden 14% (140) 15% (156) 19% (199) 41% (419) 10% (106) 1020Very Favorable of Biden 49% (210) 21% (91) 12% (53) 7% (30) 10% (42) 427Somewhat Favorable of Biden 25% (118) 37% (172) 14% (64) 13% (62) 11% (53) 469Somewhat Unfavorable of Biden 24% (51) 25% (55) 20% (44) 17% (36) 14% (30) 216Very Unfavorable of Biden 11% (88) 13% (102) 19% (155) 48% (383) 9% (76) 804#1 Issue: Economy 23% (197) 22% (191) 17% (144) 27% (235) 11% (91) 858#1 Issue: Security 11% (29) 12% (33) 20% (54) 49% (133) 9% (25) 274#1 Issue: Health Care 36% (82) 23% (52) 16% (36) 12% (27) 13% (31) 227#1 Issue: Medicare / Social Security 23% (46) 21% (41) 15% (30) 29% (56) 12% (23) 196#1 Issue: Women’s Issues 40% (49) 26% (33) 10% (13) 10% (12) 14% (17) 124#1 Issue: Education 24% (19) 37% (29) 7% (6) 12% (10) 20% (16) 80#1 Issue: Energy 27% (33) 33% (40) 18% (22) 13% (16) 9% (10) 121#1 Issue: Other 29% (34) 20% (24) 13% (16) 24% (29) 13% (15) 1182020 Vote: Joe Biden 35% (333) 29% (272) 15% (144) 11% (108) 9% (89) 9462020 Vote: Donald Trump 12% (102) 15% (133) 18% (159) 44% (377) 11% (93) 8642020 Vote: Didn’t Vote 30% (46) 20% (31) 6% (9) 17% (26) 27% (42) 1532018 House Vote: Democrat 37% (267) 27% (192) 15% (110) 12% (86) 8% (61) 7152018 House Vote: Republican 14% (98) 15% (106) 18% (132) 44% (314) 9% (66) 7162018 House Vote: Someone else 23% (15) 13% (9) 12% (8) 31% (21) 21% (14) 672016 Vote: Hillary Clinton 37% (252) 28% (190) 15% (103) 11% (72) 9% (60) 6792016 Vote: Donald Trump 15% (110) 13% (96) 17% (131) 45% (336) 11% (80) 7542016 Vote: Other 27% (26) 19% (19) 21% (20) 27% (26) 6% (6) 962016 Vote: Didn’t Vote 22% (102) 30% (139) 14% (64) 17% (82) 17% (81) 468Voted in 2014: Yes 25% (347) 20% (265) 16% (220) 29% (400) 9% (129) 1360Voted in 2014: No 23% (144) 28% (178) 16% (100) 18% (118) 15% (99) 6384-Region: Northeast 34% (121) 21% (75) 16% (58) 21% (73) 7% (26) 3534-Region: Midwest 21% (93) 16% (69) 20% (90) 30% (136) 13% (57) 4444-Region: South 22% (164) 21% (159) 16% (120) 29% (213) 12% (89) 7464-Region: West 25% (112) 31% (141) 11% (51) 21% (96) 12% (55) 455
Continued on next page

National Tracking Poll #2112154, December, 2021
187
Table POL17
Table POL17: Do you think the expanded child tax credit payments should be extended for at least one more year?
Demographic Yes, definitely Yes, probablyNo, probably
notNo, definitely
notDon’t know /No opinion Total N
Registered Voters 25% (490) 22% (443) 16% (320) 26% (517) 11% (228) 1998Party: Democrat/Leans Democrat 38% (335) 28% (246) 14% (121) 11% (98) 9% (82) 883Party: Republican/Leans Republican 13% (106) 16% (131) 19% (156) 42% (357) 11% (92) 841Note: Row proportions may total to larger than one-hundred percent due to rounding. For more information visit MorningConsultIntelligence.com.

188
Morning ConsultTable POL18
Table POL18: When it comes to voting in U.S. elections, which of the following do you think is more important, even if neither is exactly right?It ismore important to
Demographic
make voting accessiblein order to increaseengagement in
elections
make voting restrictivein order to avoid fraud
in electionsDon’t know / No
opinion Total N
Registered Voters 49% (982) 41% (824) 10% (192) 1998Gender: Male 50% (467) 44% (410) 7% (65) 942Gender: Female 49% (515) 39% (414) 12% (127) 1056Age: 18-34 55% (283) 31% (158) 14% (73) 514Age: 35-44 50% (155) 39% (120) 10% (31) 307Age: 45-64 44% (301) 47% (318) 9% (61) 679Age: 65+ 49% (243) 46% (227) 5% (27) 497GenZers: 1997-2012 49% (89) 27% (48) 24% (44) 181Millennials: 1981-1996 56% (301) 35% (185) 9% (48) 534GenXers: 1965-1980 45% (208) 44% (203) 11% (49) 460Baby Boomers: 1946-1964 46% (350) 47% (358) 6% (47) 755PID: Dem (no lean) 80% (605) 14% (106) 6% (48) 759PID: Ind (no lean) 42% (225) 42% (225) 15% (80) 531PID: Rep (no lean) 21% (152) 70% (492) 9% (64) 708PID/Gender: DemMen 79% (259) 18% (58) 3% (11) 328PID/Gender: DemWomen 80% (346) 11% (48) 9% (37) 431PID/Gender: Ind Men 45% (116) 43% (109) 12% (30) 255PID/Gender: Ind Women 40% (110) 42% (116) 18% (50) 276PID/Gender: Rep Men 26% (92) 68% (243) 7% (23) 359PID/Gender: Rep Women 17% (60) 71% (249) 12% (40) 349Ideo: Liberal (1-3) 82% (470) 14% (79) 5% (27) 576Ideo: Moderate (4) 55% (266) 35% (169) 10% (46) 481Ideo: Conservative (5-7) 24% (187) 70% (540) 6% (49) 776Educ: < College 43% (523) 44% (528) 13% (155) 1206Educ: Bachelors degree 56% (282) 38% (192) 5% (27) 501Educ: Post-grad 61% (177) 35% (103) 3% (10) 290Income: Under 50k 49% (425) 37% (318) 14% (125) 868Income: 50k-100k 49% (352) 45% (325) 6% (47) 725Income: 100k+ 51% (205) 44% (180) 5% (20) 405
Continued on next page

National Tracking Poll #2112154, December, 2021
189
Table POL18
Table POL18: When it comes to voting in U.S. elections, which of the following do you think is more important, even if neither is exactly right?It ismore important to
Demographic
make voting accessiblein order to increaseengagement in
elections
make voting restrictivein order to avoid fraud
in electionsDon’t know / No
opinion Total N
Registered Voters 49% (982) 41% (824) 10% (192) 1998Ethnicity: White 46% (702) 46% (708) 8% (126) 1536Ethnicity: Hispanic 56% (124) 31% (68) 14% (31) 222Ethnicity: Black 64% (163) 20% (51) 16% (41) 255Ethnicity: Other 57% (117) 31% (64) 12% (26) 207All Christian 48% (477) 46% (464) 6% (62) 1003All Non-Christian 63% (95) 32% (48) 5% (7) 151Atheist 66% (49) 30% (23) 4% (3) 75Agnostic/Nothing in particular 55% (262) 27% (129) 18% (83) 474Something Else 34% (99) 54% (159) 12% (36) 295Religious Non-Protestant/Catholic 58% (97) 36% (60) 6% (10) 168Evangelical 36% (200) 57% (315) 7% (39) 555Non-Evangelical 51% (367) 41% (293) 8% (55) 715Community: Urban 57% (305) 35% (189) 8% (43) 538Community: Suburban 51% (480) 40% (372) 9% (88) 939Community: Rural 38% (197) 50% (263) 12% (61) 521Employ: Private Sector 52% (360) 42% (289) 5% (37) 687Employ: Government 52% (66) 41% (52) 7% (9) 127Employ: Self-Employed 54% (108) 38% (76) 8% (17) 200Employ: Homemaker 37% (46) 47% (59) 16% (20) 126Employ: Student 60% (37) 20% (12) 20% (12) 61Employ: Retired 47% (247) 46% (239) 7% (35) 520Employ: Unemployed 46% (69) 30% (44) 25% (37) 150Employ: Other 39% (50) 41% (52) 20% (25) 127Military HH: Yes 46% (158) 47% (165) 7% (25) 348Military HH: No 50% (824) 40% (659) 10% (167) 1650RD/WT: Right Direction 79% (590) 14% (101) 7% (52) 743RD/WT: Wrong Track 31% (392) 58% (722) 11% (140) 1255
Continued on next page

190
Morning ConsultTable POL18
Table POL18: When it comes to voting in U.S. elections, which of the following do you think is more important, even if neither is exactly right?It ismore important to
Demographic
make voting accessiblein order to increaseengagement in
elections
make voting restrictivein order to avoid fraud
in electionsDon’t know / No
opinion Total N
Registered Voters 49% (982) 41% (824) 10% (192) 1998Biden Job Approve 81% (695) 14% (119) 6% (49) 863Biden Job Disapprove 25% (260) 65% (688) 10% (109) 1057Biden Job Strongly Approve 81% (343) 15% (63) 4% (18) 424Biden Job Somewhat Approve 80% (351) 13% (56) 7% (31) 438Biden Job Somewhat Disapprove 54% (154) 30% (84) 16% (45) 283Biden Job Strongly Disapprove 14% (106) 78% (604) 8% (64) 774Favorable of Biden 81% (728) 13% (112) 6% (56) 896Unfavorable of Biden 22% (229) 67% (686) 10% (105) 1020Very Favorable of Biden 83% (356) 13% (54) 4% (18) 427Somewhat Favorable of Biden 79% (372) 13% (59) 8% (38) 469Somewhat Unfavorable of Biden 50% (109) 33% (72) 17% (36) 216Very Unfavorable of Biden 15% (120) 76% (614) 9% (69) 804#1 Issue: Economy 42% (363) 48% (410) 10% (86) 858#1 Issue: Security 20% (54) 71% (196) 9% (25) 274#1 Issue: Health Care 68% (155) 24% (55) 8% (17) 227#1 Issue: Medicare / Social Security 66% (129) 28% (55) 7% (13) 196#1 Issue: Women’s Issues 69% (85) 19% (24) 12% (15) 124#1 Issue: Education 58% (47) 21% (17) 20% (16) 80#1 Issue: Energy 66% (80) 26% (32) 7% (9) 121#1 Issue: Other 60% (71) 31% (36) 9% (11) 1182020 Vote: Joe Biden 81% (763) 13% (121) 7% (62) 9462020 Vote: Donald Trump 18% (152) 74% (642) 8% (70) 8642020 Vote: Didn’t Vote 32% (48) 31% (47) 37% (57) 1532018 House Vote: Democrat 83% (591) 12% (87) 5% (37) 7152018 House Vote: Republican 21% (153) 72% (514) 7% (49) 7162018 House Vote: Someone else 49% (33) 27% (18) 24% (16) 67
Continued on next page

National Tracking Poll #2112154, December, 2021
191
Table POL18
Table POL18: When it comes to voting in U.S. elections, which of the following do you think is more important, even if neither is exactly right?It ismore important to
Demographic
make voting accessiblein order to increaseengagement in
elections
make voting restrictivein order to avoid fraud
in electionsDon’t know / No
opinion Total N
Registered Voters 49% (982) 41% (824) 10% (192) 19982016 Vote: Hillary Clinton 84% (569) 11% (76) 5% (34) 6792016 Vote: Donald Trump 20% (153) 72% (545) 7% (56) 7542016 Vote: Other 61% (59) 27% (26) 12% (12) 962016 Vote: Didn’t Vote 43% (202) 38% (175) 19% (91) 468Voted in 2014: Yes 51% (693) 42% (574) 7% (93) 1360Voted in 2014: No 45% (289) 39% (250) 16% (99) 6384-Region: Northeast 60% (213) 33% (116) 7% (24) 3534-Region: Midwest 47% (208) 45% (198) 9% (38) 4444-Region: South 40% (298) 48% (359) 12% (89) 7464-Region: West 58% (263) 33% (151) 9% (41) 455Party: Democrat/Leans Democrat 80% (706) 14% (120) 6% (57) 883Party: Republican/Leans Republican 20% (172) 71% (598) 8% (71) 841Note: Row proportions may total to larger than one-hundred percent due to rounding. For more information visit MorningConsultIntelligence.com.

192
Morning ConsultTable POL19
Table POL19: When it comes to student loan debt, which of the following is closest to your opinion, even if none is exactly right?The federal governmentshould
Demographic
forgive allstudent loandebt for allAmericans
forgive allstudent loandebt forlower-income
Americans
forgive somestudent loandebt for allAmericans
forgive somestudent loandebt forlower-income
Americans
not forgivestudent loandebt at all
Don’t know /No opinion Total N
Registered Voters 19% (382) 15% (306) 16% (316) 12% (247) 28% (552) 10% (196) 1998Gender: Male 19% (181) 13% (118) 14% (135) 14% (128) 33% (309) 8% (71) 942Gender: Female 19% (201) 18% (188) 17% (180) 11% (119) 23% (243) 12% (125) 1056Age: 18-34 32% (166) 20% (103) 14% (73) 10% (52) 9% (47) 14% (74) 514Age: 35-44 24% (75) 20% (62) 17% (51) 11% (35) 19% (58) 9% (27) 307Age: 45-64 15% (102) 13% (90) 15% (102) 15% (103) 34% (229) 8% (53) 679Age: 65+ 8% (39) 10% (51) 18% (90) 11% (56) 44% (218) 8% (42) 497GenZers: 1997-2012 24% (43) 27% (49) 8% (14) 8% (14) 7% (12) 27% (48) 181Millennials: 1981-1996 34% (182) 19% (104) 15% (81) 11% (58) 13% (69) 8% (40) 534GenXers: 1965-1980 19% (88) 15% (69) 19% (88) 15% (67) 23% (106) 9% (43) 460Baby Boomers: 1946-1964 9% (65) 10% (77) 16% (117) 13% (102) 45% (339) 7% (57) 755PID: Dem (no lean) 27% (207) 23% (172) 19% (143) 16% (121) 8% (62) 7% (54) 759PID: Ind (no lean) 18% (95) 14% (74) 14% (74) 11% (59) 29% (152) 15% (77) 531PID: Rep (no lean) 11% (80) 9% (60) 14% (99) 9% (66) 48% (337) 9% (65) 708PID/Gender: DemMen 30% (97) 22% (72) 19% (61) 18% (58) 9% (29) 3% (11) 328PID/Gender: DemWomen 25% (110) 23% (100) 19% (82) 15% (63) 8% (34) 10% (43) 431PID/Gender: Ind Men 17% (45) 10% (27) 12% (31) 14% (35) 35% (89) 11% (29) 255PID/Gender: Ind Women 18% (50) 17% (47) 16% (43) 9% (24) 23% (63) 18% (48) 276PID/Gender: Rep Men 11% (39) 5% (19) 12% (43) 10% (35) 53% (191) 9% (32) 359PID/Gender: Rep Women 12% (41) 12% (41) 16% (56) 9% (31) 42% (147) 10% (34) 349Ideo: Liberal (1-3) 31% (179) 23% (131) 20% (113) 15% (85) 6% (34) 6% (34) 576Ideo: Moderate (4) 17% (80) 18% (85) 19% (91) 16% (77) 22% (104) 9% (43) 481Ideo: Conservative (5-7) 11% (89) 8% (65) 13% (97) 9% (72) 52% (400) 7% (52) 776Educ: < College 18% (213) 17% (200) 14% (175) 12% (144) 26% (318) 13% (157) 1206Educ: Bachelors degree 22% (108) 13% (66) 17% (84) 13% (66) 31% (154) 5% (24) 501Educ: Post-grad 21% (60) 14% (41) 20% (57) 13% (37) 28% (80) 5% (15) 290
Continued on next page

National Tracking Poll #2112154, December, 2021
193
Table POL19
Table POL19: When it comes to student loan debt, which of the following is closest to your opinion, even if none is exactly right?The federal governmentshould
Demographic
forgive allstudent loandebt for allAmericans
forgive allstudent loandebt forlower-income
Americans
forgive somestudent loandebt for allAmericans
forgive somestudent loandebt forlower-income
Americans
not forgivestudent loandebt at all
Don’t know /No opinion Total N
Registered Voters 19% (382) 15% (306) 16% (316) 12% (247) 28% (552) 10% (196) 1998Income: Under 50k 22% (190) 20% (172) 13% (114) 11% (92) 20% (171) 15% (130) 868Income: 50k-100k 18% (131) 13% (94) 18% (127) 14% (101) 31% (222) 7% (50) 725Income: 100k+ 15% (61) 10% (40) 19% (75) 13% (53) 39% (159) 4% (17) 405Ethnicity: White 18% (272) 14% (209) 16% (247) 13% (195) 32% (487) 8% (127) 1536Ethnicity: Hispanic 29% (64) 18% (40) 16% (35) 12% (26) 15% (33) 11% (23) 222Ethnicity: Black 27% (70) 23% (59) 16% (41) 13% (34) 5% (13) 15% (39) 255Ethnicity: Other 19% (40) 18% (38) 14% (28) 9% (18) 25% (52) 15% (31) 207All Christian 15% (146) 11% (112) 17% (172) 13% (135) 37% (370) 7% (68) 1003All Non-Christian 41% (61) 16% (24) 12% (18) 12% (18) 15% (22) 5% (7) 151Atheist 19% (14) 33% (24) 13% (10) 16% (12) 19% (14) — (0) 75Agnostic/Nothing in particular 22% (107) 19% (88) 15% (72) 12% (55) 16% (77) 16% (76) 474Something Else 18% (53) 20% (58) 15% (45) 9% (27) 23% (68) 15% (45) 295Religious Non-Protestant/Catholic 38% (64) 17% (28) 12% (20) 12% (21) 17% (28) 4% (7) 168Evangelical 16% (89) 12% (69) 16% (89) 10% (56) 36% (199) 9% (53) 555Non-Evangelical 15% (107) 13% (96) 17% (123) 14% (100) 32% (230) 8% (58) 715Community: Urban 28% (149) 21% (112) 15% (81) 13% (71) 16% (85) 7% (39) 538Community: Suburban 16% (154) 11% (102) 19% (177) 13% (118) 32% (301) 9% (86) 939Community: Rural 15% (78) 18% (91) 11% (57) 11% (57) 32% (166) 14% (71) 521Employ: Private Sector 21% (145) 18% (124) 16% (110) 14% (98) 27% (184) 4% (26) 687Employ: Government 22% (28) 11% (13) 19% (24) 15% (19) 21% (27) 13% (16) 127Employ: Self-Employed 29% (58) 12% (24) 19% (39) 12% (24) 20% (41) 7% (13) 200Employ: Homemaker 19% (24) 15% (19) 14% (18) 10% (13) 21% (26) 20% (26) 126Employ: Student 34% (21) 31% (19) 3% (2) 10% (6) 10% (6) 11% (7) 61Employ: Retired 9% (46) 10% (53) 17% (90) 11% (58) 43% (225) 9% (48) 520Employ: Unemployed 20% (30) 23% (34) 13% (19) 12% (18) 10% (15) 23% (34) 150Employ: Other 24% (30) 16% (20) 10% (13) 8% (10) 22% (28) 21% (26) 127
Continued on next page

194
Morning ConsultTable POL19
Table POL19: When it comes to student loan debt, which of the following is closest to your opinion, even if none is exactly right?The federal governmentshould
Demographic
forgive allstudent loandebt for allAmericans
forgive allstudent loandebt forlower-income
Americans
forgive somestudent loandebt for allAmericans
forgive somestudent loandebt forlower-income
Americans
not forgivestudent loandebt at all
Don’t know /No opinion Total N
Registered Voters 19% (382) 15% (306) 16% (316) 12% (247) 28% (552) 10% (196) 1998Military HH: Yes 15% (52) 9% (32) 19% (68) 12% (41) 35% (123) 9% (32) 348Military HH: No 20% (330) 17% (274) 15% (248) 12% (206) 26% (429) 10% (164) 1650RD/WT: Right Direction 27% (203) 20% (151) 20% (146) 17% (124) 8% (61) 8% (58) 743RD/WT: Wrong Track 14% (178) 12% (155) 14% (170) 10% (122) 39% (491) 11% (138) 1255Biden Job Approve 26% (221) 22% (187) 20% (171) 17% (150) 9% (76) 7% (58) 863Biden Job Disapprove 14% (147) 10% (108) 13% (139) 8% (88) 44% (470) 10% (105) 1057Biden Job Strongly Approve 31% (131) 23% (98) 17% (72) 15% (65) 7% (29) 7% (30) 424Biden Job Somewhat Approve 20% (90) 20% (89) 23% (99) 19% (85) 11% (47) 6% (28) 438Biden Job Somewhat Disapprove 22% (62) 14% (39) 15% (41) 9% (25) 26% (73) 15% (43) 283Biden Job Strongly Disapprove 11% (85) 9% (69) 13% (97) 8% (63) 51% (397) 8% (62) 774Favorable of Biden 25% (225) 21% (188) 21% (185) 16% (147) 9% (83) 8% (68) 896Unfavorable of Biden 14% (138) 10% (106) 12% (124) 8% (87) 46% (467) 10% (98) 1020Very Favorable of Biden 29% (122) 25% (105) 18% (75) 14% (61) 7% (31) 8% (33) 427Somewhat Favorable of Biden 22% (103) 18% (83) 23% (110) 18% (86) 11% (52) 8% (35) 469Somewhat Unfavorable of Biden 22% (48) 14% (30) 12% (25) 10% (21) 29% (63) 14% (29) 216Very Unfavorable of Biden 11% (91) 9% (76) 12% (99) 8% (66) 50% (404) 9% (69) 804#1 Issue: Economy 16% (137) 14% (123) 16% (136) 12% (99) 33% (283) 9% (80) 858#1 Issue: Security 10% (28) 9% (25) 12% (32) 9% (26) 48% (131) 12% (32) 274#1 Issue: Health Care 31% (70) 20% (45) 15% (35) 14% (33) 12% (27) 8% (18) 227#1 Issue: Medicare / Social Security 17% (33) 11% (21) 17% (34) 19% (38) 27% (53) 9% (17) 196#1 Issue: Women’s Issues 29% (36) 23% (28) 15% (19) 16% (20) 7% (8) 10% (12) 124#1 Issue: Education 34% (27) 22% (18) 19% (15) 9% (7) 7% (5) 10% (8) 80#1 Issue: Energy 31% (37) 20% (24) 20% (25) 12% (14) 9% (11) 9% (11) 121#1 Issue: Other 11% (13) 19% (23) 17% (20) 9% (10) 30% (35) 14% (17) 118
Continued on next page

National Tracking Poll #2112154, December, 2021
195
Table POL19
Table POL19: When it comes to student loan debt, which of the following is closest to your opinion, even if none is exactly right?The federal governmentshould
Demographic
forgive allstudent loandebt for allAmericans
forgive allstudent loandebt forlower-income
Americans
forgive somestudent loandebt for allAmericans
forgive somestudent loandebt forlower-income
Americans
not forgivestudent loandebt at all
Don’t know /No opinion Total N
Registered Voters 19% (382) 15% (306) 16% (316) 12% (247) 28% (552) 10% (196) 19982020 Vote: Joe Biden 26% (248) 21% (198) 19% (180) 16% (151) 10% (99) 7% (71) 9462020 Vote: Donald Trump 11% (92) 8% (72) 14% (117) 9% (80) 49% (425) 9% (78) 8642020 Vote: Didn’t Vote 21% (31) 19% (29) 10% (15) 9% (14) 12% (19) 29% (44) 1532018 House Vote: Democrat 25% (181) 21% (153) 19% (137) 17% (124) 10% (72) 7% (48) 7152018 House Vote: Republican 10% (72) 7% (51) 14% (97) 10% (71) 52% (369) 8% (56) 7162018 House Vote: Someone else 22% (15) 11% (7) 11% (7) 16% (11) 26% (18) 14% (9) 672016 Vote: Hillary Clinton 25% (173) 21% (142) 20% (134) 17% (118) 9% (63) 7% (49) 6792016 Vote: Donald Trump 9% (67) 7% (55) 13% (97) 11% (79) 52% (389) 9% (65) 7542016 Vote: Other 24% (24) 9% (9) 12% (12) 10% (10) 37% (35) 7% (6) 962016 Vote: Didn’t Vote 25% (118) 21% (100) 15% (71) 8% (39) 14% (64) 16% (76) 468Voted in 2014: Yes 17% (226) 14% (191) 16% (214) 13% (183) 32% (437) 8% (109) 1360Voted in 2014: No 24% (156) 18% (115) 16% (102) 10% (63) 18% (115) 14% (87) 6384-Region: Northeast 27% (94) 16% (58) 16% (56) 11% (40) 23% (81) 7% (24) 3534-Region: Midwest 17% (74) 12% (53) 18% (78) 12% (53) 32% (141) 10% (45) 4444-Region: South 18% (132) 16% (117) 16% (119) 12% (88) 29% (215) 10% (76) 7464-Region: West 18% (82) 17% (79) 14% (62) 14% (66) 25% (116) 11% (51) 455Party: Democrat/Leans Democrat 27% (240) 23% (199) 19% (168) 16% (142) 8% (73) 7% (61) 883Party: Republican/Leans Republican 11% (90) 8% (71) 13% (113) 10% (82) 48% (408) 9% (78) 841Note: Row proportions may total to larger than one-hundred percent due to rounding. For more information visit MorningConsultIntelligence.com.

196
Morning ConsultTable POL20_1
Table POL20_1: How much have you seen, read, or heard about the following?A special congressional committee revealing that some Fox News hosts were texting President Trump’s Chief of Staff during the January 6th riot at theU.S. Capitol
Demographic A lot Some Not Much Nothing at all Total N
Registered Voters 20% (407) 29% (578) 23% (456) 28% (557) 1998Gender: Male 24% (230) 29% (271) 24% (222) 23% (219) 942Gender: Female 17% (178) 29% (307) 22% (233) 32% (338) 1056Age: 18-34 22% (111) 20% (103) 26% (136) 32% (164) 514Age: 35-44 23% (69) 27% (84) 22% (69) 28% (85) 307Age: 45-64 18% (120) 33% (224) 21% (140) 29% (195) 679Age: 65+ 21% (107) 34% (167) 22% (110) 23% (113) 497GenZers: 1997-2012 12% (21) 18% (33) 32% (58) 38% (68) 181Millennials: 1981-1996 27% (146) 23% (121) 23% (124) 27% (143) 534GenXers: 1965-1980 15% (69) 30% (137) 22% (102) 33% (152) 460Baby Boomers: 1946-1964 21% (158) 36% (270) 20% (154) 23% (173) 755PID: Dem (no lean) 32% (246) 33% (247) 18% (134) 17% (133) 759PID: Ind (no lean) 13% (69) 31% (163) 22% (117) 34% (182) 531PID: Rep (no lean) 13% (93) 24% (168) 29% (205) 34% (242) 708PID/Gender: DemMen 40% (131) 30% (99) 16% (53) 14% (46) 328PID/Gender: DemWomen 27% (115) 34% (149) 19% (81) 20% (87) 431PID/Gender: Ind Men 14% (35) 35% (89) 23% (58) 28% (72) 255PID/Gender: Ind Women 12% (33) 27% (74) 21% (59) 40% (110) 276PID/Gender: Rep Men 18% (63) 23% (84) 31% (111) 28% (101) 359PID/Gender: Rep Women 9% (30) 24% (84) 27% (94) 41% (142) 349Ideo: Liberal (1-3) 38% (220) 32% (185) 15% (86) 15% (84) 576Ideo: Moderate (4) 15% (73) 31% (151) 26% (123) 28% (133) 481Ideo: Conservative (5-7) 13% (104) 27% (210) 27% (208) 33% (254) 776Educ: < College 15% (185) 27% (320) 25% (298) 33% (403) 1206Educ: Bachelors degree 26% (130) 32% (158) 19% (98) 23% (116) 501Educ: Post-grad 32% (92) 34% (100) 21% (60) 13% (39) 290Income: Under 50k 15% (128) 26% (224) 27% (231) 33% (286) 868Income: 50k-100k 23% (167) 31% (227) 20% (147) 25% (184) 725Income: 100k+ 28% (112) 31% (127) 19% (78) 22% (88) 405Ethnicity: White 20% (305) 30% (455) 23% (356) 27% (419) 1536Ethnicity: Hispanic 31% (69) 21% (46) 22% (49) 26% (57) 222
Continued on next page

National Tracking Poll #2112154, December, 2021
197
Table POL20_1
Table POL20_1: How much have you seen, read, or heard about the following?A special congressional committee revealing that some Fox News hosts were texting President Trump’s Chief of Staff during the January 6th riot at theU.S. Capitol
Demographic A lot Some Not Much Nothing at all Total N
Registered Voters 20% (407) 29% (578) 23% (456) 28% (557) 1998Ethnicity: Black 23% (58) 31% (80) 21% (55) 24% (62) 255Ethnicity: Other 21% (44) 20% (42) 22% (45) 37% (76) 207All Christian 18% (181) 32% (319) 25% (254) 25% (249) 1003All Non-Christian 46% (69) 24% (36) 18% (27) 13% (19) 151Atheist 23% (17) 20% (15) 28% (21) 29% (22) 75Agnostic/Nothing in particular 21% (100) 27% (129) 18% (86) 34% (159) 474Something Else 14% (41) 27% (79) 23% (68) 37% (108) 295Religious Non-Protestant/Catholic 42% (70) 23% (39) 21% (35) 14% (24) 168Evangelical 16% (90) 28% (158) 26% (145) 29% (162) 555Non-Evangelical 18% (129) 33% (232) 23% (164) 27% (190) 715Community: Urban 29% (155) 29% (155) 19% (102) 23% (126) 538Community: Suburban 21% (196) 29% (276) 23% (214) 27% (254) 939Community: Rural 11% (57) 28% (148) 27% (140) 34% (177) 521Employ: Private Sector 20% (139) 33% (226) 23% (157) 24% (165) 687Employ: Government 14% (18) 29% (37) 29% (37) 27% (35) 127Employ: Self-Employed 35% (69) 18% (35) 24% (49) 23% (47) 200Employ: Homemaker 16% (20) 21% (27) 26% (32) 37% (46) 126Employ: Student 14% (8) 26% (16) 26% (16) 34% (21) 61Employ: Retired 21% (109) 34% (179) 20% (105) 24% (127) 520Employ: Unemployed 15% (22) 20% (30) 26% (40) 39% (58) 150Employ: Other 17% (22) 22% (28) 15% (20) 46% (58) 127Military HH: Yes 21% (72) 27% (92) 22% (75) 31% (108) 348Military HH: No 20% (335) 29% (486) 23% (381) 27% (448) 1650RD/WT: Right Direction 34% (256) 33% (242) 15% (115) 18% (130) 743RD/WT: Wrong Track 12% (152) 27% (336) 27% (341) 34% (427) 1255Biden Job Approve 34% (294) 35% (298) 16% (134) 16% (137) 863Biden Job Disapprove 10% (109) 26% (272) 28% (298) 36% (378) 1057
Continued on next page

198
Morning ConsultTable POL20_1
Table POL20_1: How much have you seen, read, or heard about the following?A special congressional committee revealing that some Fox News hosts were texting President Trump’s Chief of Staff during the January 6th riot at theU.S. Capitol
Demographic A lot Some Not Much Nothing at all Total N
Registered Voters 20% (407) 29% (578) 23% (456) 28% (557) 1998Biden Job Strongly Approve 43% (183) 33% (139) 11% (48) 13% (54) 424Biden Job Somewhat Approve 25% (111) 36% (159) 20% (86) 19% (82) 438Biden Job Somewhat Disapprove 9% (25) 26% (75) 34% (95) 31% (88) 283Biden Job Strongly Disapprove 11% (84) 26% (198) 26% (203) 37% (290) 774Favorable of Biden 33% (298) 34% (307) 16% (147) 16% (144) 896Unfavorable of Biden 9% (92) 26% (265) 28% (290) 36% (372) 1020Very Favorable of Biden 43% (184) 35% (151) 11% (45) 11% (48) 427Somewhat Favorable of Biden 24% (115) 33% (157) 22% (102) 20% (96) 469Somewhat Unfavorable of Biden 4% (8) 26% (56) 35% (75) 36% (77) 216Very Unfavorable of Biden 11% (84) 26% (209) 27% (215) 37% (295) 804#1 Issue: Economy 17% (150) 28% (236) 27% (228) 28% (244) 858#1 Issue: Security 15% (40) 26% (72) 23% (63) 36% (99) 274#1 Issue: Health Care 26% (60) 32% (73) 15% (34) 27% (61) 227#1 Issue: Medicare / Social Security 20% (39) 38% (75) 19% (38) 23% (44) 196#1 Issue: Women’s Issues 34% (42) 21% (26) 18% (22) 27% (33) 124#1 Issue: Education 15% (12) 31% (25) 24% (19) 30% (24) 80#1 Issue: Energy 31% (37) 26% (31) 24% (30) 19% (23) 121#1 Issue: Other 23% (28) 33% (39) 18% (21) 25% (30) 1182020 Vote: Joe Biden 30% (283) 35% (336) 16% (151) 19% (177) 9462020 Vote: Donald Trump 12% (106) 24% (207) 29% (251) 35% (301) 8642020 Vote: Didn’t Vote 11% (16) 16% (25) 28% (43) 45% (69) 1532018 House Vote: Democrat 31% (225) 38% (271) 15% (107) 16% (111) 7152018 House Vote: Republican 14% (100) 28% (203) 27% (192) 31% (221) 7162018 House Vote: Someone else 7% (5) 14% (9) 26% (18) 52% (35) 672016 Vote: Hillary Clinton 33% (226) 37% (253) 14% (94) 16% (106) 6792016 Vote: Donald Trump 13% (99) 27% (204) 27% (202) 33% (249) 7542016 Vote: Other 16% (16) 32% (31) 31% (30) 20% (19) 962016 Vote: Didn’t Vote 14% (67) 19% (89) 28% (129) 39% (183) 468Voted in 2014: Yes 23% (309) 32% (437) 22% (296) 23% (318) 1360Voted in 2014: No 15% (98) 22% (141) 25% (160) 37% (239) 638
Continued on next page

National Tracking Poll #2112154, December, 2021
199
Table POL20_1
Table POL20_1: How much have you seen, read, or heard about the following?A special congressional committee revealing that some Fox News hosts were texting President Trump’s Chief of Staff during the January 6th riot at theU.S. Capitol
Demographic A lot Some Not Much Nothing at all Total N
Registered Voters 20% (407) 29% (578) 23% (456) 28% (557) 19984-Region: Northeast 27% (95) 30% (107) 19% (66) 24% (84) 3534-Region: Midwest 16% (73) 32% (144) 21% (91) 31% (136) 4444-Region: South 18% (131) 27% (200) 26% (197) 29% (218) 7464-Region: West 24% (108) 28% (126) 22% (101) 26% (120) 455Party: Democrat/Leans Democrat 31% (272) 34% (301) 17% (154) 18% (155) 883Party: Republican/Leans Republican 13% (107) 25% (213) 28% (239) 34% (282) 841Note: Row proportions may total to larger than one-hundred percent due to rounding. For more information visit MorningConsultIntelligence.com.

200
Morning ConsultTable POL20_2
Table POL20_2: How much have you seen, read, or heard about the following?Historic tornadoes in the Midwest killing dozens
Demographic A lot Some Not Much Nothing at all Total N
Registered Voters 56% (1118) 28% (569) 8% (165) 7% (146) 1998Gender: Male 55% (522) 29% (270) 9% (84) 7% (66) 942Gender: Female 56% (595) 28% (299) 8% (82) 8% (80) 1056Age: 18-34 40% (207) 26% (136) 18% (95) 15% (77) 514Age: 35-44 49% (151) 33% (101) 7% (23) 11% (32) 307Age: 45-64 59% (399) 33% (221) 5% (33) 4% (25) 679Age: 65+ 73% (361) 22% (111) 3% (14) 2% (11) 497GenZers: 1997-2012 29% (53) 23% (42) 23% (41) 25% (45) 181Millennials: 1981-1996 48% (255) 29% (155) 13% (67) 11% (56) 534GenXers: 1965-1980 52% (241) 35% (161) 7% (33) 5% (25) 460Baby Boomers: 1946-1964 68% (512) 27% (205) 3% (21) 2% (17) 755PID: Dem (no lean) 59% (445) 29% (221) 8% (60) 4% (32) 759PID: Ind (no lean) 50% (267) 31% (164) 9% (46) 10% (53) 531PID: Rep (no lean) 57% (405) 26% (184) 8% (59) 9% (61) 708PID/Gender: DemMen 56% (183) 32% (104) 10% (33) 3% (9) 328PID/Gender: DemWomen 61% (263) 27% (117) 6% (28) 5% (23) 431PID/Gender: Ind Men 50% (127) 31% (79) 9% (23) 10% (26) 255PID/Gender: Ind Women 51% (140) 31% (86) 8% (23) 10% (27) 276PID/Gender: Rep Men 59% (212) 24% (87) 8% (29) 9% (31) 359PID/Gender: Rep Women 55% (193) 28% (96) 9% (30) 9% (30) 349Ideo: Liberal (1-3) 61% (351) 28% (160) 8% (45) 4% (20) 576Ideo: Moderate (4) 51% (245) 34% (164) 9% (45) 5% (26) 481Ideo: Conservative (5-7) 59% (457) 27% (210) 7% (55) 7% (54) 776Educ: < College 52% (631) 29% (352) 10% (116) 9% (108) 1206Educ: Bachelors degree 61% (306) 26% (130) 7% (34) 6% (32) 501Educ: Post-grad 62% (181) 30% (88) 5% (16) 2% (6) 290Income: Under 50k 47% (412) 30% (263) 11% (96) 11% (98) 868Income: 50k-100k 62% (449) 26% (191) 7% (51) 5% (33) 725Income: 100k+ 63% (257) 29% (116) 4% (18) 4% (14) 405Ethnicity: White 60% (915) 28% (430) 7% (101) 6% (90) 1536Ethnicity: Hispanic 47% (104) 33% (73) 11% (24) 10% (21) 222Ethnicity: Black 41% (105) 31% (80) 17% (43) 10% (27) 255
Continued on next page

National Tracking Poll #2112154, December, 2021
201
Table POL20_2
Table POL20_2: How much have you seen, read, or heard about the following?Historic tornadoes in the Midwest killing dozens
Demographic A lot Some Not Much Nothing at all Total N
Registered Voters 56% (1118) 28% (569) 8% (165) 7% (146) 1998Ethnicity: Other 47% (98) 29% (60) 10% (20) 14% (29) 207All Christian 60% (599) 29% (294) 7% (68) 4% (42) 1003All Non-Christian 58% (88) 21% (32) 12% (18) 8% (13) 151Atheist 69% (52) 21% (16) 8% (6) 1% (1) 75Agnostic/Nothing in particular 49% (233) 30% (140) 10% (48) 11% (53) 474Something Else 49% (145) 30% (87) 8% (25) 13% (38) 295Religious Non-Protestant/Catholic 57% (96) 24% (40) 12% (20) 7% (13) 168Evangelical 52% (291) 33% (184) 9% (48) 6% (33) 555Non-Evangelical 62% (442) 26% (187) 6% (40) 6% (46) 715Community: Urban 51% (277) 30% (159) 9% (50) 10% (52) 538Community: Suburban 57% (536) 28% (259) 9% (81) 7% (64) 939Community: Rural 58% (305) 29% (152) 7% (34) 6% (30) 521Employ: Private Sector 54% (370) 31% (213) 9% (59) 7% (45) 687Employ: Government 50% (64) 31% (40) 11% (15) 7% (9) 127Employ: Self-Employed 54% (107) 32% (65) 8% (16) 6% (12) 200Employ: Homemaker 56% (71) 25% (32) 9% (11) 10% (12) 126Employ: Student 37% (23) 24% (15) 18% (11) 21% (13) 61Employ: Retired 71% (367) 24% (124) 3% (15) 3% (15) 520Employ: Unemployed 45% (68) 26% (39) 17% (25) 12% (18) 150Employ: Other 38% (49) 34% (43) 11% (15) 17% (21) 127Military HH: Yes 66% (228) 22% (78) 5% (17) 7% (25) 348Military HH: No 54% (889) 30% (492) 9% (148) 7% (121) 1650RD/WT: Right Direction 55% (411) 29% (217) 9% (67) 7% (49) 743RD/WT: Wrong Track 56% (707) 28% (353) 8% (99) 8% (97) 1255Biden Job Approve 58% (499) 30% (255) 8% (68) 5% (41) 863Biden Job Disapprove 57% (600) 28% (295) 8% (81) 8% (81) 1057Biden Job Strongly Approve 60% (256) 27% (113) 7% (31) 6% (25) 424Biden Job Somewhat Approve 55% (243) 32% (142) 8% (37) 4% (16) 438Biden Job Somewhat Disapprove 55% (155) 28% (78) 10% (29) 8% (21) 283Biden Job Strongly Disapprove 58% (445) 28% (217) 7% (52) 8% (60) 774
Continued on next page

202
Morning ConsultTable POL20_2
Table POL20_2: How much have you seen, read, or heard about the following?Historic tornadoes in the Midwest killing dozens
Demographic A lot Some Not Much Nothing at all Total N
Registered Voters 56% (1118) 28% (569) 8% (165) 7% (146) 1998Favorable of Biden 58% (523) 29% (262) 8% (69) 5% (41) 896Unfavorable of Biden 56% (566) 29% (295) 8% (80) 8% (79) 1020Very Favorable of Biden 62% (266) 26% (112) 7% (28) 5% (22) 427Somewhat Favorable of Biden 55% (258) 32% (150) 9% (41) 4% (20) 469Somewhat Unfavorable of Biden 52% (112) 29% (62) 10% (21) 10% (22) 216Very Unfavorable of Biden 57% (454) 29% (233) 7% (60) 7% (57) 804#1 Issue: Economy 54% (461) 28% (237) 10% (83) 9% (77) 858#1 Issue: Security 61% (167) 29% (80) 5% (14) 5% (13) 274#1 Issue: Health Care 51% (116) 37% (83) 7% (16) 5% (12) 227#1 Issue: Medicare / Social Security 70% (138) 24% (48) 3% (5) 3% (6) 196#1 Issue: Women’s Issues 47% (59) 29% (36) 12% (15) 11% (13) 124#1 Issue: Education 41% (33) 35% (28) 13% (11) 10% (8) 80#1 Issue: Energy 64% (77) 20% (25) 12% (15) 4% (5) 121#1 Issue: Other 57% (67) 27% (32) 5% (6) 11% (13) 1182020 Vote: Joe Biden 58% (548) 30% (283) 7% (64) 5% (51) 9462020 Vote: Donald Trump 58% (503) 27% (233) 8% (68) 7% (60) 8642020 Vote: Didn’t Vote 33% (51) 25% (38) 21% (32) 21% (32) 1532018 House Vote: Democrat 62% (445) 28% (201) 5% (39) 4% (30) 7152018 House Vote: Republican 60% (428) 27% (191) 7% (52) 6% (45) 7162018 House Vote: Someone else 50% (34) 25% (17) 2% (1) 23% (15) 672016 Vote: Hillary Clinton 63% (429) 27% (185) 5% (32) 5% (32) 6792016 Vote: Donald Trump 60% (455) 27% (202) 7% (51) 6% (45) 7542016 Vote: Other 55% (53) 35% (34) 4% (3) 6% (6) 962016 Vote: Didn’t Vote 38% (179) 31% (147) 17% (78) 13% (63) 468Voted in 2014: Yes 62% (839) 28% (376) 5% (73) 5% (73) 1360Voted in 2014: No 44% (279) 30% (194) 15% (92) 11% (72) 6384-Region: Northeast 60% (213) 24% (83) 9% (31) 8% (27) 3534-Region: Midwest 62% (274) 25% (112) 8% (38) 5% (20) 4444-Region: South 56% (417) 29% (216) 8% (58) 7% (55) 7464-Region: West 47% (214) 35% (158) 8% (39) 10% (44) 455
Continued on next page

National Tracking Poll #2112154, December, 2021
203
Table POL20_2
Table POL20_2: How much have you seen, read, or heard about the following?Historic tornadoes in the Midwest killing dozens
Demographic A lot Some Not Much Nothing at all Total N
Registered Voters 56% (1118) 28% (569) 8% (165) 7% (146) 1998Party: Democrat/Leans Democrat 59% (519) 29% (255) 8% (73) 4% (35) 883Party: Republican/Leans Republican 56% (474) 28% (233) 8% (69) 8% (66) 841Note: Row proportions may total to larger than one-hundred percent due to rounding. For more information visit MorningConsultIntelligence.com.

204
Morning ConsultTable POL20_3
Table POL20_3: How much have you seen, read, or heard about the following?The COVID-19 death toll in the U.S. surpassing 800,000
Demographic A lot Some Not Much Nothing at all Total N
Registered Voters 36% (711) 35% (701) 17% (342) 12% (244) 1998Gender: Male 37% (346) 35% (332) 17% (156) 12% (108) 942Gender: Female 35% (365) 35% (369) 18% (186) 13% (136) 1056Age: 18-34 31% (161) 31% (158) 19% (98) 19% (98) 514Age: 35-44 32% (98) 34% (104) 23% (70) 11% (35) 307Age: 45-64 34% (233) 39% (263) 16% (110) 11% (73) 679Age: 65+ 44% (219) 35% (176) 13% (64) 8% (38) 497GenZers: 1997-2012 30% (54) 28% (51) 20% (35) 23% (41) 181Millennials: 1981-1996 33% (177) 32% (168) 20% (105) 16% (83) 534GenXers: 1965-1980 28% (131) 41% (190) 20% (93) 10% (46) 460Baby Boomers: 1946-1964 41% (312) 37% (279) 13% (97) 9% (67) 755PID: Dem (no lean) 45% (339) 36% (272) 12% (92) 7% (56) 759PID: Ind (no lean) 30% (157) 39% (208) 17% (90) 14% (76) 531PID: Rep (no lean) 30% (214) 31% (221) 23% (160) 16% (113) 708PID/Gender: DemMen 47% (156) 34% (113) 10% (34) 8% (25) 328PID/Gender: DemWomen 42% (183) 37% (159) 13% (58) 7% (31) 431PID/Gender: Ind Men 28% (72) 45% (115) 15% (38) 12% (30) 255PID/Gender: Ind Women 31% (85) 34% (93) 19% (51) 17% (46) 276PID/Gender: Rep Men 33% (118) 29% (104) 23% (83) 15% (54) 359PID/Gender: Rep Women 28% (97) 33% (116) 22% (77) 17% (59) 349Ideo: Liberal (1-3) 47% (272) 35% (203) 13% (75) 5% (27) 576Ideo: Moderate (4) 36% (174) 36% (175) 18% (85) 10% (47) 481Ideo: Conservative (5-7) 29% (228) 35% (274) 20% (155) 15% (118) 776Educ: < College 31% (371) 33% (394) 21% (257) 15% (185) 1206Educ: Bachelors degree 41% (207) 38% (191) 11% (54) 10% (48) 501Educ: Post-grad 46% (132) 40% (116) 11% (31) 4% (11) 290Income: Under 50k 30% (259) 33% (284) 21% (184) 16% (141) 868Income: 50k-100k 38% (272) 36% (257) 16% (116) 11% (79) 725Income: 100k+ 44% (180) 39% (159) 10% (42) 6% (24) 405Ethnicity: White 37% (567) 35% (537) 17% (262) 11% (170) 1536Ethnicity: Hispanic 35% (78) 34% (75) 21% (48) 10% (22) 222Ethnicity: Black 29% (75) 35% (89) 18% (47) 17% (44) 255
Continued on next page

National Tracking Poll #2112154, December, 2021
205
Table POL20_3
Table POL20_3: How much have you seen, read, or heard about the following?The COVID-19 death toll in the U.S. surpassing 800,000
Demographic A lot Some Not Much Nothing at all Total N
Registered Voters 36% (711) 35% (701) 17% (342) 12% (244) 1998Ethnicity: Other 33% (69) 36% (75) 16% (33) 14% (30) 207All Christian 36% (364) 38% (379) 17% (168) 9% (92) 1003All Non-Christian 51% (77) 29% (44) 9% (13) 11% (17) 151Atheist 42% (32) 32% (24) 10% (8) 15% (11) 75Agnostic/Nothing in particular 35% (164) 33% (157) 17% (80) 15% (73) 474Something Else 25% (75) 33% (97) 25% (73) 17% (50) 295Religious Non-Protestant/Catholic 48% (81) 30% (50) 12% (20) 10% (17) 168Evangelical 32% (178) 34% (190) 21% (118) 12% (69) 555Non-Evangelical 35% (253) 39% (277) 16% (115) 10% (69) 715Community: Urban 44% (237) 32% (170) 13% (72) 11% (58) 538Community: Suburban 33% (314) 38% (357) 17% (155) 12% (113) 939Community: Rural 31% (160) 33% (173) 22% (115) 14% (73) 521Employ: Private Sector 34% (232) 38% (262) 19% (127) 9% (64) 687Employ: Government 28% (36) 45% (57) 21% (26) 6% (7) 127Employ: Self-Employed 41% (83) 28% (57) 22% (44) 8% (16) 200Employ: Homemaker 27% (34) 38% (48) 17% (21) 18% (23) 126Employ: Student 41% (25) 16% (10) 21% (13) 23% (14) 61Employ: Retired 43% (223) 35% (180) 15% (76) 8% (42) 520Employ: Unemployed 24% (36) 41% (61) 12% (17) 24% (35) 150Employ: Other 33% (42) 20% (26) 14% (17) 33% (42) 127Military HH: Yes 35% (121) 39% (134) 17% (59) 10% (34) 348Military HH: No 36% (590) 34% (567) 17% (283) 13% (210) 1650RD/WT: Right Direction 46% (339) 34% (255) 12% (86) 8% (63) 743RD/WT: Wrong Track 30% (372) 36% (446) 20% (256) 14% (181) 1255Biden Job Approve 45% (390) 36% (309) 13% (109) 6% (55) 863Biden Job Disapprove 29% (311) 34% (356) 21% (220) 16% (170) 1057Biden Job Strongly Approve 53% (223) 33% (139) 8% (34) 7% (28) 424Biden Job Somewhat Approve 38% (167) 39% (170) 17% (74) 6% (27) 438Biden Job Somewhat Disapprove 29% (81) 39% (111) 20% (56) 12% (35) 283Biden Job Strongly Disapprove 30% (230) 32% (245) 21% (164) 17% (135) 774
Continued on next page

206
Morning ConsultTable POL20_3
Table POL20_3: How much have you seen, read, or heard about the following?The COVID-19 death toll in the U.S. surpassing 800,000
Demographic A lot Some Not Much Nothing at all Total N
Registered Voters 36% (711) 35% (701) 17% (342) 12% (244) 1998Favorable of Biden 45% (405) 36% (320) 12% (110) 7% (61) 896Unfavorable of Biden 29% (292) 34% (351) 21% (217) 16% (160) 1020Very Favorable of Biden 53% (229) 33% (140) 8% (33) 6% (26) 427Somewhat Favorable of Biden 38% (177) 38% (180) 16% (77) 8% (35) 469Somewhat Unfavorable of Biden 27% (58) 42% (92) 19% (41) 11% (24) 216Very Unfavorable of Biden 29% (234) 32% (259) 22% (175) 17% (135) 804#1 Issue: Economy 33% (284) 35% (304) 17% (143) 15% (127) 858#1 Issue: Security 35% (95) 28% (78) 25% (69) 12% (32) 274#1 Issue: Health Care 45% (102) 33% (76) 10% (22) 12% (27) 227#1 Issue: Medicare / Social Security 36% (71) 41% (81) 19% (37) 4% (7) 196#1 Issue: Women’s Issues 39% (48) 33% (41) 20% (24) 8% (10) 124#1 Issue: Education 31% (25) 35% (28) 19% (15) 15% (12) 80#1 Issue: Energy 38% (46) 40% (49) 16% (20) 5% (6) 121#1 Issue: Other 34% (40) 38% (45) 10% (11) 19% (22) 1182020 Vote: Joe Biden 45% (423) 38% (363) 11% (105) 6% (55) 9462020 Vote: Donald Trump 28% (243) 33% (284) 22% (193) 17% (143) 8642020 Vote: Didn’t Vote 22% (34) 27% (41) 23% (36) 28% (42) 1532018 House Vote: Democrat 47% (338) 38% (269) 11% (77) 4% (31) 7152018 House Vote: Republican 30% (212) 34% (244) 21% (148) 16% (112) 7162018 House Vote: Someone else 21% (14) 34% (23) 23% (15) 22% (15) 672016 Vote: Hillary Clinton 48% (327) 37% (251) 10% (67) 5% (33) 6792016 Vote: Donald Trump 30% (223) 34% (254) 21% (156) 16% (121) 7542016 Vote: Other 32% (31) 46% (44) 14% (14) 8% (7) 962016 Vote: Didn’t Vote 28% (129) 32% (151) 22% (104) 18% (83) 468Voted in 2014: Yes 38% (523) 36% (491) 15% (203) 11% (144) 1360Voted in 2014: No 30% (188) 33% (210) 22% (139) 16% (101) 6384-Region: Northeast 43% (151) 31% (109) 18% (62) 9% (31) 3534-Region: Midwest 34% (152) 35% (157) 16% (71) 15% (65) 4444-Region: South 33% (249) 35% (264) 19% (141) 12% (92) 7464-Region: West 35% (159) 38% (171) 15% (68) 13% (57) 455
Continued on next page

National Tracking Poll #2112154, December, 2021
207
Table POL20_3
Table POL20_3: How much have you seen, read, or heard about the following?The COVID-19 death toll in the U.S. surpassing 800,000
Demographic A lot Some Not Much Nothing at all Total N
Registered Voters 36% (711) 35% (701) 17% (342) 12% (244) 1998Party: Democrat/Leans Democrat 44% (390) 36% (318) 13% (113) 7% (62) 883Party: Republican/Leans Republican 28% (240) 33% (281) 23% (192) 15% (129) 841Note: Row proportions may total to larger than one-hundred percent due to rounding. For more information visit MorningConsultIntelligence.com.

208
Morning ConsultTable POL20_4
Table POL20_4: How much have you seen, read, or heard about the following?About 100 NFL players testing positive for COVID-19 this week, the league’s most significant outbreak since the pandemic began
Demographic A lot Some Not Much Nothing at all Total N
Registered Voters 25% (503) 38% (751) 17% (335) 20% (408) 1998Gender: Male 31% (296) 37% (348) 16% (149) 16% (148) 942Gender: Female 20% (207) 38% (403) 18% (186) 25% (260) 1056Age: 18-34 23% (116) 28% (143) 19% (97) 31% (158) 514Age: 35-44 25% (78) 40% (122) 15% (46) 20% (61) 307Age: 45-64 26% (174) 38% (257) 17% (116) 20% (133) 679Age: 65+ 27% (136) 46% (229) 15% (76) 11% (57) 497GenZers: 1997-2012 14% (26) 28% (50) 17% (31) 41% (75) 181Millennials: 1981-1996 28% (148) 32% (170) 18% (97) 22% (119) 534GenXers: 1965-1980 25% (115) 37% (172) 15% (69) 23% (105) 460Baby Boomers: 1946-1964 26% (193) 44% (336) 16% (123) 14% (104) 755PID: Dem (no lean) 31% (238) 40% (306) 15% (110) 14% (105) 759PID: Ind (no lean) 18% (96) 38% (201) 16% (86) 28% (149) 531PID: Rep (no lean) 24% (170) 35% (244) 20% (139) 22% (154) 708PID/Gender: DemMen 43% (142) 34% (112) 14% (46) 8% (28) 328PID/Gender: DemWomen 22% (95) 45% (194) 15% (64) 18% (78) 431PID/Gender: Ind Men 22% (56) 43% (109) 13% (34) 22% (56) 255PID/Gender: Ind Women 15% (40) 33% (92) 19% (51) 34% (93) 276PID/Gender: Rep Men 27% (98) 35% (127) 19% (69) 18% (64) 359PID/Gender: Rep Women 21% (72) 34% (117) 20% (71) 26% (90) 349Ideo: Liberal (1-3) 32% (184) 40% (228) 15% (88) 13% (76) 576Ideo: Moderate (4) 24% (114) 38% (183) 18% (86) 20% (98) 481Ideo: Conservative (5-7) 25% (190) 39% (301) 17% (129) 20% (156) 776Educ: < College 20% (246) 36% (435) 18% (217) 26% (308) 1206Educ: Bachelors degree 33% (165) 39% (195) 15% (73) 14% (69) 501Educ: Post-grad 32% (92) 42% (121) 16% (46) 11% (31) 290Income: Under 50k 19% (166) 34% (299) 19% (161) 28% (242) 868Income: 50k-100k 28% (202) 38% (274) 17% (125) 17% (123) 725Income: 100k+ 33% (135) 44% (179) 12% (49) 10% (42) 405Ethnicity: White 26% (399) 37% (569) 17% (267) 20% (302) 1536Ethnicity: Hispanic 28% (62) 31% (69) 18% (39) 24% (53) 222Ethnicity: Black 22% (57) 43% (109) 15% (38) 20% (52) 255
Continued on next page

National Tracking Poll #2112154, December, 2021
209
Table POL20_4
Table POL20_4: How much have you seen, read, or heard about the following?About 100 NFL players testing positive for COVID-19 this week, the league’s most significant outbreak since the pandemic began
Demographic A lot Some Not Much Nothing at all Total N
Registered Voters 25% (503) 38% (751) 17% (335) 20% (408) 1998Ethnicity: Other 23% (48) 36% (74) 15% (31) 26% (55) 207All Christian 28% (285) 43% (434) 15% (150) 13% (135) 1003All Non-Christian 41% (61) 31% (47) 13% (19) 15% (23) 151Atheist 30% (22) 25% (19) 19% (14) 27% (20) 75Agnostic/Nothing in particular 20% (95) 30% (144) 21% (101) 28% (134) 474Something Else 14% (40) 37% (108) 17% (51) 33% (96) 295Religious Non-Protestant/Catholic 38% (64) 32% (54) 14% (23) 16% (26) 168Evangelical 23% (130) 41% (227) 16% (90) 19% (108) 555Non-Evangelical 27% (190) 43% (306) 14% (103) 16% (116) 715Community: Urban 32% (173) 34% (183) 16% (87) 17% (94) 538Community: Suburban 24% (222) 41% (387) 17% (160) 18% (170) 939Community: Rural 21% (108) 35% (181) 17% (88) 28% (145) 521Employ: Private Sector 26% (179) 41% (284) 17% (115) 16% (109) 687Employ: Government 20% (25) 37% (47) 18% (22) 25% (32) 127Employ: Self-Employed 34% (68) 31% (63) 15% (30) 20% (39) 200Employ: Homemaker 14% (17) 35% (43) 24% (31) 27% (34) 126Employ: Student 19% (12) 26% (16) 15% (9) 40% (24) 61Employ: Retired 29% (152) 43% (221) 15% (77) 13% (70) 520Employ: Unemployed 12% (18) 33% (50) 24% (36) 31% (46) 150Employ: Other 26% (33) 20% (26) 12% (16) 42% (53) 127Military HH: Yes 28% (97) 35% (122) 18% (62) 19% (66) 348Military HH: No 25% (406) 38% (629) 17% (274) 21% (342) 1650RD/WT: Right Direction 32% (241) 38% (286) 14% (101) 15% (115) 743RD/WT: Wrong Track 21% (262) 37% (465) 19% (234) 23% (293) 1255Biden Job Approve 32% (277) 41% (353) 14% (122) 13% (111) 863Biden Job Disapprove 21% (223) 36% (379) 19% (201) 24% (253) 1057Biden Job Strongly Approve 38% (162) 38% (160) 13% (56) 11% (46) 424Biden Job Somewhat Approve 26% (115) 44% (193) 15% (66) 15% (65) 438Biden Job Somewhat Disapprove 23% (64) 38% (109) 19% (53) 20% (58) 283Biden Job Strongly Disapprove 21% (159) 35% (271) 19% (149) 25% (195) 774
Continued on next page

210
Morning ConsultTable POL20_4
Table POL20_4: How much have you seen, read, or heard about the following?About 100 NFL players testing positive for COVID-19 this week, the league’s most significant outbreak since the pandemic began
Demographic A lot Some Not Much Nothing at all Total N
Registered Voters 25% (503) 38% (751) 17% (335) 20% (408) 1998Favorable of Biden 31% (276) 43% (383) 13% (120) 13% (118) 896Unfavorable of Biden 21% (216) 35% (353) 20% (203) 24% (248) 1020Very Favorable of Biden 37% (159) 40% (171) 13% (55) 10% (42) 427Somewhat Favorable of Biden 25% (117) 45% (212) 14% (65) 16% (75) 469Somewhat Unfavorable of Biden 24% (52) 34% (73) 21% (45) 21% (45) 216Very Unfavorable of Biden 20% (164) 35% (280) 20% (158) 25% (202) 804#1 Issue: Economy 23% (201) 38% (326) 17% (147) 21% (184) 858#1 Issue: Security 25% (68) 36% (98) 19% (52) 21% (57) 274#1 Issue: Health Care 30% (69) 33% (76) 16% (36) 20% (46) 227#1 Issue: Medicare / Social Security 28% (55) 47% (92) 13% (25) 12% (23) 196#1 Issue: Women’s Issues 23% (28) 37% (45) 22% (27) 19% (23) 124#1 Issue: Education 23% (18) 36% (29) 18% (14) 23% (19) 80#1 Issue: Energy 32% (39) 32% (38) 16% (19) 20% (25) 121#1 Issue: Other 21% (25) 40% (47) 12% (15) 27% (32) 1182020 Vote: Joe Biden 30% (284) 41% (391) 14% (129) 15% (142) 9462020 Vote: Donald Trump 23% (196) 35% (305) 18% (159) 24% (203) 8642020 Vote: Didn’t Vote 11% (17) 26% (40) 25% (38) 38% (58) 1532018 House Vote: Democrat 31% (223) 44% (317) 12% (86) 12% (89) 7152018 House Vote: Republican 25% (182) 37% (263) 18% (130) 20% (141) 7162018 House Vote: Someone else 11% (8) 38% (25) 16% (11) 35% (23) 672016 Vote: Hillary Clinton 32% (216) 43% (293) 14% (92) 11% (78) 6792016 Vote: Donald Trump 26% (195) 36% (274) 17% (130) 20% (154) 7542016 Vote: Other 20% (20) 46% (44) 16% (15) 18% (17) 962016 Vote: Didn’t Vote 15% (72) 30% (139) 21% (98) 34% (159) 468Voted in 2014: Yes 29% (391) 41% (553) 16% (211) 15% (205) 1360Voted in 2014: No 18% (113) 31% (198) 19% (124) 32% (203) 6384-Region: Northeast 32% (115) 36% (128) 16% (56) 15% (54) 3534-Region: Midwest 24% (105) 35% (157) 20% (90) 21% (92) 4444-Region: South 23% (169) 38% (282) 17% (130) 22% (164) 7464-Region: West 25% (115) 40% (184) 13% (59) 21% (97) 455
Continued on next page

National Tracking Poll #2112154, December, 2021
211
Table POL20_4
Table POL20_4: How much have you seen, read, or heard about the following?About 100 NFL players testing positive for COVID-19 this week, the league’s most significant outbreak since the pandemic began
Demographic A lot Some Not Much Nothing at all Total N
Registered Voters 25% (503) 38% (751) 17% (335) 20% (408) 1998Party: Democrat/Leans Democrat 31% (270) 41% (359) 14% (127) 14% (128) 883Party: Republican/Leans Republican 23% (194) 37% (310) 19% (160) 21% (177) 841Note: Row proportions may total to larger than one-hundred percent due to rounding. For more information visit MorningConsultIntelligence.com.

212
Morning ConsultTable POL20_5
Table POL20_5: How much have you seen, read, or heard about the following?Democrats in the U.S. Senate planning to delay consideration of the party’s climate and social spending package until 2022
Demographic A lot Some Not Much Nothing at all Total N
Registered Voters 13% (268) 28% (557) 28% (557) 31% (616) 1998Gender: Male 17% (162) 32% (300) 27% (252) 24% (228) 942Gender: Female 10% (106) 24% (256) 29% (305) 37% (388) 1056Age: 18-34 17% (86) 21% (109) 29% (151) 33% (169) 514Age: 35-44 16% (49) 34% (105) 23% (70) 27% (83) 307Age: 45-64 9% (59) 30% (201) 29% (194) 33% (225) 679Age: 65+ 15% (74) 29% (142) 28% (141) 28% (140) 497GenZers: 1997-2012 9% (17) 21% (37) 31% (56) 39% (71) 181Millennials: 1981-1996 20% (108) 27% (146) 25% (133) 28% (147) 534GenXers: 1965-1980 8% (39) 27% (122) 31% (145) 34% (155) 460Baby Boomers: 1946-1964 12% (94) 31% (231) 28% (212) 29% (218) 755PID: Dem (no lean) 20% (154) 30% (228) 24% (184) 25% (193) 759PID: Ind (no lean) 7% (38) 27% (143) 30% (159) 36% (191) 531PID: Rep (no lean) 11% (77) 26% (185) 30% (214) 33% (232) 708PID/Gender: DemMen 28% (93) 30% (100) 21% (70) 20% (66) 328PID/Gender: DemWomen 14% (61) 30% (129) 26% (114) 30% (127) 431PID/Gender: Ind Men 8% (20) 36% (93) 30% (76) 26% (66) 255PID/Gender: Ind Women 6% (18) 18% (50) 30% (83) 45% (125) 276PID/Gender: Rep Men 14% (49) 30% (108) 29% (106) 27% (96) 359PID/Gender: Rep Women 8% (28) 22% (77) 31% (109) 39% (136) 349Ideo: Liberal (1-3) 22% (124) 30% (176) 22% (129) 26% (148) 576Ideo: Moderate (4) 10% (46) 30% (143) 31% (150) 29% (141) 481Ideo: Conservative (5-7) 12% (92) 25% (195) 30% (233) 33% (257) 776Educ: < College 10% (117) 24% (289) 30% (366) 36% (435) 1206Educ: Bachelors degree 19% (97) 32% (160) 24% (121) 25% (124) 501Educ: Post-grad 19% (55) 37% (108) 24% (71) 20% (57) 290Income: Under 50k 8% (70) 27% (232) 30% (257) 36% (310) 868Income: 50k-100k 18% (127) 25% (183) 28% (201) 29% (213) 725Income: 100k+ 18% (71) 35% (142) 25% (99) 23% (93) 405Ethnicity: White 14% (217) 26% (406) 29% (440) 31% (473) 1536Ethnicity: Hispanic 17% (38) 31% (69) 24% (54) 28% (61) 222Ethnicity: Black 13% (33) 33% (84) 24% (62) 30% (76) 255
Continued on next page

National Tracking Poll #2112154, December, 2021
213
Table POL20_5
Table POL20_5: How much have you seen, read, or heard about the following?Democrats in the U.S. Senate planning to delay consideration of the party’s climate and social spending package until 2022
Demographic A lot Some Not Much Nothing at all Total N
Registered Voters 13% (268) 28% (557) 28% (557) 31% (616) 1998Ethnicity: Other 9% (19) 32% (67) 27% (56) 32% (66) 207All Christian 12% (119) 32% (323) 27% (274) 29% (287) 1003All Non-Christian 39% (58) 23% (35) 20% (29) 19% (28) 151Atheist 21% (16) 26% (19) 17% (12) 37% (28) 75Agnostic/Nothing in particular 11% (51) 23% (111) 31% (145) 35% (168) 474Something Else 8% (24) 23% (69) 33% (97) 36% (105) 295Religious Non-Protestant/Catholic 35% (60) 24% (40) 21% (36) 19% (33) 168Evangelical 13% (72) 30% (168) 27% (149) 30% (165) 555Non-Evangelical 9% (68) 30% (217) 30% (212) 31% (218) 715Community: Urban 23% (126) 30% (163) 23% (124) 23% (125) 538Community: Suburban 10% (97) 27% (252) 31% (291) 32% (299) 939Community: Rural 9% (45) 27% (142) 27% (142) 37% (192) 521Employ: Private Sector 14% (96) 34% (235) 27% (183) 25% (172) 687Employ: Government 12% (15) 28% (36) 36% (46) 24% (30) 127Employ: Self-Employed 25% (50) 23% (46) 29% (59) 22% (45) 200Employ: Homemaker 13% (16) 16% (20) 30% (37) 42% (52) 126Employ: Student 5% (3) 26% (16) 30% (18) 39% (24) 61Employ: Retired 12% (64) 27% (143) 29% (151) 31% (162) 520Employ: Unemployed 7% (10) 27% (40) 24% (36) 42% (64) 150Employ: Other 10% (13) 17% (21) 21% (27) 52% (66) 127Military HH: Yes 15% (54) 25% (85) 33% (114) 27% (95) 348Military HH: No 13% (215) 29% (472) 27% (443) 32% (521) 1650RD/WT: Right Direction 20% (149) 32% (241) 23% (171) 25% (182) 743RD/WT: Wrong Track 9% (119) 25% (316) 31% (386) 35% (434) 1255Biden Job Approve 19% (168) 33% (288) 23% (201) 24% (207) 863Biden Job Disapprove 9% (98) 24% (254) 31% (329) 36% (376) 1057Biden Job Strongly Approve 30% (129) 32% (136) 17% (71) 21% (88) 424Biden Job Somewhat Approve 9% (39) 35% (151) 29% (129) 27% (119) 438Biden Job Somewhat Disapprove 5% (14) 25% (72) 35% (99) 35% (98) 283Biden Job Strongly Disapprove 11% (84) 24% (182) 30% (229) 36% (278) 774
Continued on next page

214
Morning ConsultTable POL20_5
Table POL20_5: How much have you seen, read, or heard about the following?Democrats in the U.S. Senate planning to delay consideration of the party’s climate and social spending package until 2022
Demographic A lot Some Not Much Nothing at all Total N
Registered Voters 13% (268) 28% (557) 28% (557) 31% (616) 1998Favorable of Biden 19% (170) 34% (302) 24% (213) 24% (212) 896Unfavorable of Biden 9% (88) 24% (243) 32% (324) 36% (365) 1020Very Favorable of Biden 28% (120) 31% (134) 19% (81) 22% (92) 427Somewhat Favorable of Biden 11% (50) 36% (168) 28% (132) 25% (120) 469Somewhat Unfavorable of Biden 4% (8) 25% (55) 32% (70) 39% (84) 216Very Unfavorable of Biden 10% (80) 23% (188) 32% (255) 35% (281) 804#1 Issue: Economy 14% (117) 26% (221) 30% (260) 30% (260) 858#1 Issue: Security 11% (31) 28% (77) 27% (73) 34% (93) 274#1 Issue: Health Care 17% (38) 29% (65) 22% (51) 32% (73) 227#1 Issue: Medicare / Social Security 9% (17) 31% (60) 26% (51) 34% (68) 196#1 Issue: Women’s Issues 13% (16) 27% (34) 31% (38) 29% (36) 124#1 Issue: Education 16% (13) 28% (22) 22% (17) 34% (27) 80#1 Issue: Energy 19% (23) 30% (36) 32% (39) 20% (24) 121#1 Issue: Other 12% (14) 35% (41) 24% (28) 30% (35) 1182020 Vote: Joe Biden 17% (163) 30% (288) 26% (242) 27% (253) 9462020 Vote: Donald Trump 11% (93) 25% (216) 31% (264) 34% (291) 8642020 Vote: Didn’t Vote 6% (10) 24% (37) 28% (43) 41% (63) 1532018 House Vote: Democrat 18% (132) 32% (229) 24% (171) 26% (183) 7152018 House Vote: Republican 11% (82) 28% (203) 30% (218) 30% (213) 7162018 House Vote: Someone else 7% (5) 18% (12) 29% (19) 47% (31) 672016 Vote: Hillary Clinton 19% (126) 33% (222) 24% (163) 25% (169) 6792016 Vote: Donald Trump 12% (89) 27% (205) 30% (224) 31% (236) 7542016 Vote: Other 10% (9) 32% (31) 31% (30) 27% (26) 962016 Vote: Didn’t Vote 10% (45) 21% (98) 30% (141) 39% (185) 468Voted in 2014: Yes 15% (204) 31% (427) 26% (356) 27% (373) 1360Voted in 2014: No 10% (64) 20% (130) 31% (201) 38% (243) 6384-Region: Northeast 20% (69) 24% (86) 27% (94) 29% (103) 3534-Region: Midwest 10% (44) 29% (130) 29% (127) 32% (143) 4444-Region: South 12% (89) 27% (202) 29% (215) 32% (239) 7464-Region: West 15% (66) 30% (138) 26% (120) 29% (130) 455
Continued on next page

National Tracking Poll #2112154, December, 2021
215
Table POL20_5
Table POL20_5: How much have you seen, read, or heard about the following?Democrats in the U.S. Senate planning to delay consideration of the party’s climate and social spending package until 2022
Demographic A lot Some Not Much Nothing at all Total N
Registered Voters 13% (268) 28% (557) 28% (557) 31% (616) 1998Party: Democrat/Leans Democrat 19% (167) 31% (270) 25% (218) 26% (228) 883Party: Republican/Leans Republican 10% (83) 27% (224) 31% (258) 33% (276) 841Note: Row proportions may total to larger than one-hundred percent due to rounding. For more information visit MorningConsultIntelligence.com.

216
Morning ConsultTable POL20_6
Table POL20_6: How much have you seen, read, or heard about the following?President Biden signing into a law a bill that raises the U.S. debt limit by $2.5 trillion
Demographic A lot Some Not Much Nothing at all Total N
Registered Voters 22% (438) 39% (771) 21% (420) 18% (369) 1998Gender: Male 27% (256) 41% (388) 19% (175) 13% (123) 942Gender: Female 17% (182) 36% (383) 23% (245) 23% (246) 1056Age: 18-34 21% (110) 30% (153) 21% (109) 28% (143) 514Age: 35-44 20% (62) 41% (124) 21% (65) 18% (55) 307Age: 45-64 19% (132) 42% (288) 20% (136) 18% (124) 679Age: 65+ 27% (134) 42% (207) 22% (109) 9% (47) 497GenZers: 1997-2012 13% (23) 21% (37) 27% (49) 39% (71) 181Millennials: 1981-1996 25% (133) 37% (195) 19% (99) 20% (106) 534GenXers: 1965-1980 16% (71) 43% (197) 21% (95) 21% (96) 460Baby Boomers: 1946-1964 25% (190) 42% (314) 21% (162) 12% (89) 755PID: Dem (no lean) 27% (201) 40% (302) 20% (150) 14% (106) 759PID: Ind (no lean) 14% (76) 39% (206) 23% (122) 24% (127) 531PID: Rep (no lean) 23% (161) 37% (263) 21% (148) 19% (136) 708PID/Gender: DemMen 35% (114) 41% (133) 15% (50) 10% (31) 328PID/Gender: DemWomen 20% (87) 39% (169) 23% (100) 17% (75) 431PID/Gender: Ind Men 17% (43) 44% (113) 21% (53) 18% (46) 255PID/Gender: Ind Women 12% (33) 34% (93) 25% (69) 29% (81) 276PID/Gender: Rep Men 28% (99) 40% (142) 20% (72) 13% (45) 359PID/Gender: Rep Women 18% (62) 35% (121) 22% (76) 26% (91) 349Ideo: Liberal (1-3) 28% (161) 39% (223) 19% (108) 15% (85) 576Ideo: Moderate (4) 18% (85) 40% (192) 26% (124) 16% (79) 481Ideo: Conservative (5-7) 23% (178) 41% (318) 19% (148) 17% (133) 776Educ: < College 19% (227) 35% (421) 23% (276) 23% (283) 1206Educ: Bachelors degree 26% (132) 45% (224) 18% (88) 11% (57) 501Educ: Post-grad 28% (80) 44% (126) 19% (55) 10% (29) 290Income: Under 50k 18% (156) 32% (275) 26% (227) 24% (211) 868Income: 50k-100k 23% (165) 43% (312) 18% (130) 16% (117) 725Income: 100k+ 29% (117) 46% (185) 15% (62) 10% (41) 405Ethnicity: White 23% (350) 39% (595) 21% (323) 17% (269) 1536Ethnicity: Hispanic 21% (46) 38% (84) 24% (54) 17% (38) 222Ethnicity: Black 19% (50) 39% (100) 18% (46) 24% (60) 255
Continued on next page

National Tracking Poll #2112154, December, 2021
217
Table POL20_6
Table POL20_6: How much have you seen, read, or heard about the following?President Biden signing into a law a bill that raises the U.S. debt limit by $2.5 trillion
Demographic A lot Some Not Much Nothing at all Total N
Registered Voters 22% (438) 39% (771) 21% (420) 18% (369) 1998Ethnicity: Other 19% (39) 37% (77) 25% (51) 19% (40) 207All Christian 23% (232) 43% (432) 20% (204) 13% (135) 1003All Non-Christian 41% (62) 34% (51) 14% (21) 11% (16) 151Atheist 21% (16) 36% (27) 20% (15) 23% (17) 75Agnostic/Nothing in particular 17% (83) 33% (158) 23% (108) 26% (126) 474Something Else 16% (46) 35% (102) 24% (72) 25% (75) 295Religious Non-Protestant/Catholic 39% (66) 34% (57) 17% (28) 10% (17) 168Evangelical 24% (134) 39% (217) 20% (112) 17% (92) 555Non-Evangelical 19% (137) 43% (310) 21% (154) 16% (114) 715Community: Urban 26% (141) 39% (207) 19% (103) 16% (86) 538Community: Suburban 20% (188) 41% (384) 22% (205) 17% (162) 939Community: Rural 21% (109) 35% (180) 21% (112) 23% (121) 521Employ: Private Sector 22% (152) 46% (314) 18% (123) 14% (97) 687Employ: Government 14% (18) 47% (60) 25% (32) 14% (17) 127Employ: Self-Employed 31% (62) 33% (65) 19% (37) 18% (36) 200Employ: Homemaker 18% (23) 33% (42) 24% (30) 25% (31) 126Employ: Student 20% (12) 21% (13) 15% (9) 45% (27) 61Employ: Retired 27% (141) 40% (209) 21% (108) 12% (62) 520Employ: Unemployed 11% (17) 27% (40) 27% (40) 35% (52) 150Employ: Other 11% (14) 22% (28) 31% (39) 36% (46) 127Military HH: Yes 26% (92) 37% (130) 25% (87) 11% (39) 348Military HH: No 21% (346) 39% (641) 20% (332) 20% (330) 1650RD/WT: Right Direction 28% (205) 42% (309) 17% (130) 13% (99) 743RD/WT: Wrong Track 19% (233) 37% (462) 23% (290) 22% (270) 1255Biden Job Approve 27% (229) 43% (374) 18% (159) 12% (101) 863Biden Job Disapprove 20% (207) 36% (385) 22% (228) 22% (237) 1057Biden Job Strongly Approve 38% (160) 40% (170) 14% (58) 9% (36) 424Biden Job Somewhat Approve 16% (69) 47% (204) 23% (101) 15% (64) 438Biden Job Somewhat Disapprove 13% (38) 40% (114) 24% (67) 23% (64) 283Biden Job Strongly Disapprove 22% (169) 35% (270) 21% (161) 22% (173) 774
Continued on next page

218
Morning ConsultTable POL20_6
Table POL20_6: How much have you seen, read, or heard about the following?President Biden signing into a law a bill that raises the U.S. debt limit by $2.5 trillion
Demographic A lot Some Not Much Nothing at all Total N
Registered Voters 22% (438) 39% (771) 21% (420) 18% (369) 1998Favorable of Biden 27% (238) 43% (386) 19% (174) 11% (98) 896Unfavorable of Biden 18% (187) 37% (381) 22% (220) 23% (232) 1020Very Favorable of Biden 35% (149) 42% (178) 15% (64) 8% (36) 427Somewhat Favorable of Biden 19% (88) 45% (209) 23% (110) 13% (62) 469Somewhat Unfavorable of Biden 12% (25) 40% (86) 25% (53) 24% (51) 216Very Unfavorable of Biden 20% (162) 37% (295) 21% (166) 22% (180) 804#1 Issue: Economy 21% (183) 39% (339) 20% (169) 20% (168) 858#1 Issue: Security 24% (66) 34% (94) 24% (66) 18% (49) 274#1 Issue: Health Care 23% (52) 46% (104) 15% (33) 17% (38) 227#1 Issue: Medicare / Social Security 18% (35) 42% (82) 26% (51) 14% (28) 196#1 Issue: Women’s Issues 18% (23) 32% (39) 27% (33) 23% (29) 124#1 Issue: Education 24% (19) 30% (24) 20% (16) 27% (22) 80#1 Issue: Energy 26% (32) 37% (45) 24% (29) 12% (15) 121#1 Issue: Other 25% (30) 38% (45) 20% (23) 17% (20) 1182020 Vote: Joe Biden 24% (226) 43% (406) 21% (195) 13% (120) 9462020 Vote: Donald Trump 22% (190) 36% (313) 21% (181) 21% (180) 8642020 Vote: Didn’t Vote 11% (17) 22% (34) 26% (40) 41% (62) 1532018 House Vote: Democrat 26% (189) 44% (315) 18% (131) 11% (80) 7152018 House Vote: Republican 23% (167) 40% (284) 20% (144) 17% (121) 7162018 House Vote: Someone else 16% (11) 32% (22) 19% (13) 33% (22) 672016 Vote: Hillary Clinton 26% (179) 44% (297) 19% (129) 11% (74) 6792016 Vote: Donald Trump 24% (185) 38% (289) 20% (152) 17% (128) 7542016 Vote: Other 14% (13) 48% (47) 27% (26) 10% (10) 962016 Vote: Didn’t Vote 13% (60) 30% (139) 24% (112) 33% (157) 468Voted in 2014: Yes 25% (342) 43% (579) 19% (253) 14% (187) 1360Voted in 2014: No 15% (96) 30% (193) 26% (167) 29% (182) 6384-Region: Northeast 26% (93) 38% (134) 20% (71) 16% (55) 3534-Region: Midwest 17% (75) 41% (184) 21% (95) 21% (91) 4444-Region: South 23% (173) 35% (262) 21% (160) 20% (150) 7464-Region: West 21% (97) 42% (192) 21% (94) 16% (72) 455
Continued on next page

National Tracking Poll #2112154, December, 2021
219
Table POL20_6
Table POL20_6: How much have you seen, read, or heard about the following?President Biden signing into a law a bill that raises the U.S. debt limit by $2.5 trillion
Demographic A lot Some Not Much Nothing at all Total N
Registered Voters 22% (438) 39% (771) 21% (420) 18% (369) 1998Party: Democrat/Leans Democrat 25% (222) 42% (367) 20% (174) 14% (120) 883Party: Republican/Leans Republican 22% (183) 39% (325) 21% (177) 19% (156) 841Note: Row proportions may total to larger than one-hundred percent due to rounding. For more information visit MorningConsultIntelligence.com.

220
Morning ConsultTable POL20_7
Table POL20_7: How much have you seen, read, or heard about the following?The Justice Department pulling out of negotiations for financially compensating migrant families who were separated at the U.S.-Mexico border by theTrump administration
Demographic A lot Some Not Much Nothing at all Total N
Registered Voters 12% (231) 24% (471) 29% (579) 36% (716) 1998Gender: Male 16% (154) 24% (226) 31% (288) 29% (274) 942Gender: Female 7% (78) 23% (246) 28% (291) 42% (442) 1056Age: 18-34 18% (93) 21% (109) 22% (115) 38% (197) 514Age: 35-44 14% (42) 25% (75) 29% (88) 33% (101) 307Age: 45-64 8% (53) 26% (179) 30% (206) 35% (241) 679Age: 65+ 9% (42) 22% (108) 34% (170) 36% (177) 497GenZers: 1997-2012 5% (10) 26% (47) 25% (44) 44% (80) 181Millennials: 1981-1996 22% (118) 21% (113) 23% (125) 33% (178) 534GenXers: 1965-1980 8% (35) 22% (103) 32% (149) 38% (173) 460Baby Boomers: 1946-1964 8% (62) 26% (199) 31% (238) 34% (256) 755PID: Dem (no lean) 14% (105) 24% (181) 28% (210) 35% (263) 759PID: Ind (no lean) 6% (30) 25% (133) 28% (148) 41% (219) 531PID: Rep (no lean) 14% (96) 22% (157) 31% (221) 33% (234) 708PID/Gender: DemMen 23% (74) 23% (75) 26% (85) 28% (93) 328PID/Gender: DemWomen 7% (31) 25% (106) 29% (125) 39% (170) 431PID/Gender: Ind Men 5% (14) 28% (72) 33% (85) 33% (84) 255PID/Gender: Ind Women 6% (16) 22% (61) 23% (63) 49% (135) 276PID/Gender: Rep Men 18% (66) 22% (78) 33% (118) 27% (97) 359PID/Gender: Rep Women 9% (31) 23% (79) 29% (103) 39% (137) 349Ideo: Liberal (1-3) 15% (87) 22% (130) 28% (163) 34% (197) 576Ideo: Moderate (4) 4% (22) 27% (129) 30% (143) 39% (188) 481Ideo: Conservative (5-7) 14% (105) 24% (188) 30% (230) 33% (253) 776Educ: < College 9% (112) 22% (268) 29% (353) 39% (473) 1206Educ: Bachelors degree 16% (81) 24% (122) 28% (140) 32% (159) 501Educ: Post-grad 13% (38) 28% (81) 30% (87) 29% (85) 290Income: Under 50k 10% (86) 21% (182) 29% (250) 40% (351) 868Income: 50k-100k 13% (95) 22% (161) 30% (217) 35% (251) 725Income: 100k+ 12% (51) 32% (128) 28% (111) 28% (115) 405Ethnicity: White 11% (170) 22% (343) 31% (476) 36% (547) 1536Ethnicity: Hispanic 19% (43) 24% (53) 30% (66) 27% (60) 222
Continued on next page

National Tracking Poll #2112154, December, 2021
221
Table POL20_7
Table POL20_7: How much have you seen, read, or heard about the following?The Justice Department pulling out of negotiations for financially compensating migrant families who were separated at the U.S.-Mexico border by theTrump administration
Demographic A lot Some Not Much Nothing at all Total N
Registered Voters 12% (231) 24% (471) 29% (579) 36% (716) 1998Ethnicity: Black 12% (31) 31% (78) 20% (52) 37% (94) 255Ethnicity: Other 15% (31) 24% (50) 25% (51) 36% (75) 207All Christian 11% (110) 24% (243) 33% (329) 32% (322) 1003All Non-Christian 37% (56) 20% (30) 22% (33) 21% (31) 151Atheist 10% (7) 22% (17) 25% (19) 43% (33) 75Agnostic/Nothing in particular 7% (35) 22% (107) 28% (133) 42% (200) 474Something Else 8% (23) 25% (75) 22% (66) 44% (131) 295Religious Non-Protestant/Catholic 33% (56) 19% (32) 24% (40) 23% (39) 168Evangelical 14% (79) 25% (140) 26% (145) 34% (191) 555Non-Evangelical 7% (51) 24% (173) 33% (238) 35% (253) 715Community: Urban 19% (105) 23% (126) 27% (145) 30% (162) 538Community: Suburban 8% (72) 24% (228) 29% (272) 39% (368) 939Community: Rural 11% (55) 23% (117) 31% (162) 36% (187) 521Employ: Private Sector 11% (77) 28% (194) 29% (202) 31% (214) 687Employ: Government 10% (12) 29% (37) 35% (45) 26% (33) 127Employ: Self-Employed 23% (47) 17% (35) 30% (60) 29% (59) 200Employ: Homemaker 8% (10) 15% (19) 33% (42) 44% (55) 126Employ: Student 14% (8) 28% (17) 16% (10) 42% (25) 61Employ: Retired 9% (46) 24% (123) 31% (161) 37% (191) 520Employ: Unemployed 9% (14) 20% (29) 23% (35) 48% (71) 150Employ: Other 13% (17) 14% (18) 19% (24) 54% (69) 127Military HH: Yes 12% (43) 24% (82) 32% (111) 32% (112) 348Military HH: No 11% (189) 24% (389) 28% (468) 37% (604) 1650RD/WT: Right Direction 15% (115) 24% (181) 28% (206) 33% (242) 743RD/WT: Wrong Track 9% (117) 23% (290) 30% (373) 38% (475) 1255Biden Job Approve 14% (117) 26% (222) 29% (252) 32% (272) 863Biden Job Disapprove 11% (113) 22% (238) 29% (305) 38% (402) 1057
Continued on next page

222
Morning ConsultTable POL20_7
Table POL20_7: How much have you seen, read, or heard about the following?The Justice Department pulling out of negotiations for financially compensating migrant families who were separated at the U.S.-Mexico border by theTrump administration
Demographic A lot Some Not Much Nothing at all Total N
Registered Voters 12% (231) 24% (471) 29% (579) 36% (716) 1998Biden Job Strongly Approve 24% (100) 25% (106) 23% (99) 28% (119) 424Biden Job Somewhat Approve 4% (16) 27% (116) 35% (153) 35% (153) 438Biden Job Somewhat Disapprove 12% (33) 20% (56) 32% (91) 37% (103) 283Biden Job Strongly Disapprove 10% (80) 23% (181) 28% (214) 39% (298) 774Favorable of Biden 13% (120) 26% (232) 29% (258) 32% (287) 896Unfavorable of Biden 10% (102) 22% (229) 30% (303) 38% (386) 1020Very Favorable of Biden 21% (89) 23% (99) 26% (112) 30% (127) 427Somewhat Favorable of Biden 7% (31) 28% (132) 31% (146) 34% (160) 469Somewhat Unfavorable of Biden 7% (15) 19% (41) 34% (74) 40% (86) 216Very Unfavorable of Biden 11% (87) 23% (188) 28% (229) 37% (301) 804#1 Issue: Economy 12% (103) 25% (218) 28% (244) 34% (294) 858#1 Issue: Security 13% (36) 22% (62) 28% (78) 36% (99) 274#1 Issue: Health Care 15% (34) 16% (37) 30% (68) 39% (88) 227#1 Issue: Medicare / Social Security 5% (10) 23% (45) 34% (66) 39% (76) 196#1 Issue: Women’s Issues 10% (13) 27% (33) 32% (40) 31% (38) 124#1 Issue: Education 15% (12) 23% (18) 18% (14) 45% (36) 80#1 Issue: Energy 13% (16) 26% (31) 32% (39) 29% (35) 121#1 Issue: Other 6% (7) 24% (28) 26% (31) 43% (51) 1182020 Vote: Joe Biden 11% (108) 24% (231) 29% (276) 35% (330) 9462020 Vote: Donald Trump 13% (110) 23% (195) 29% (249) 36% (309) 8642020 Vote: Didn’t Vote 7% (10) 22% (34) 26% (40) 45% (69) 1532018 House Vote: Democrat 11% (81) 26% (184) 29% (208) 34% (242) 7152018 House Vote: Republican 14% (101) 24% (173) 30% (213) 32% (228) 7162018 House Vote: Someone else 6% (4) 27% (18) 22% (15) 45% (30) 672016 Vote: Hillary Clinton 11% (74) 26% (178) 30% (200) 33% (226) 6792016 Vote: Donald Trump 14% (108) 23% (170) 29% (221) 34% (254) 7542016 Vote: Other 3% (3) 30% (29) 35% (33) 32% (30) 962016 Vote: Didn’t Vote 10% (47) 20% (93) 26% (123) 44% (205) 468Voted in 2014: Yes 13% (173) 26% (351) 29% (394) 33% (442) 1360Voted in 2014: No 9% (59) 19% (121) 29% (185) 43% (274) 638
Continued on next page

National Tracking Poll #2112154, December, 2021
223
Table POL20_7
Table POL20_7: How much have you seen, read, or heard about the following?The Justice Department pulling out of negotiations for financially compensating migrant families who were separated at the U.S.-Mexico border by theTrump administration
Demographic A lot Some Not Much Nothing at all Total N
Registered Voters 12% (231) 24% (471) 29% (579) 36% (716) 19984-Region: Northeast 17% (61) 20% (71) 30% (104) 33% (117) 3534-Region: Midwest 7% (33) 21% (96) 34% (151) 37% (166) 4444-Region: South 9% (70) 26% (195) 27% (204) 37% (277) 7464-Region: West 15% (68) 24% (110) 26% (120) 35% (157) 455Party: Democrat/Leans Democrat 12% (108) 24% (214) 28% (250) 35% (310) 883Party: Republican/Leans Republican 13% (108) 24% (198) 30% (254) 33% (281) 841Note: Row proportions may total to larger than one-hundred percent due to rounding. For more information visit MorningConsultIntelligence.com.

224
Morning ConsultTable POL20_8
Table POL20_8: How much have you seen, read, or heard about the following?The Food and Drug Administration announcing that it will permanently soften restrictions on a pill used to terminate early pregnancies, making iteasier for Americans to obtain the pill by mail
Demographic A lot Some Not Much Nothing at all Total N
Registered Voters 14% (270) 30% (598) 23% (456) 34% (674) 1998Gender: Male 17% (156) 31% (294) 23% (212) 30% (280) 942Gender: Female 11% (114) 29% (304) 23% (244) 37% (394) 1056Age: 18-34 18% (93) 23% (120) 24% (125) 34% (176) 514Age: 35-44 17% (51) 33% (102) 19% (58) 31% (95) 307Age: 45-64 10% (69) 31% (214) 22% (148) 37% (249) 679Age: 65+ 11% (57) 33% (162) 25% (125) 31% (153) 497GenZers: 1997-2012 10% (18) 21% (38) 21% (37) 48% (87) 181Millennials: 1981-1996 22% (116) 28% (149) 23% (120) 28% (148) 534GenXers: 1965-1980 9% (42) 32% (146) 20% (90) 40% (182) 460Baby Boomers: 1946-1964 11% (83) 32% (245) 26% (194) 31% (233) 755PID: Dem (no lean) 21% (159) 32% (243) 21% (162) 26% (195) 759PID: Ind (no lean) 7% (39) 28% (150) 24% (130) 40% (212) 531PID: Rep (no lean) 10% (71) 29% (205) 23% (164) 38% (268) 708PID/Gender: DemMen 28% (92) 32% (104) 18% (58) 23% (74) 328PID/Gender: DemWomen 16% (68) 32% (139) 24% (104) 28% (121) 431PID/Gender: Ind Men 7% (17) 32% (82) 27% (70) 34% (86) 255PID/Gender: Ind Women 8% (23) 25% (68) 22% (60) 46% (126) 276PID/Gender: Rep Men 13% (47) 30% (108) 23% (84) 33% (120) 359PID/Gender: Rep Women 7% (24) 28% (98) 23% (80) 42% (148) 349Ideo: Liberal (1-3) 22% (126) 34% (199) 20% (118) 23% (134) 576Ideo: Moderate (4) 9% (43) 30% (143) 26% (126) 35% (168) 481Ideo: Conservative (5-7) 13% (98) 28% (218) 22% (170) 37% (290) 776Educ: < College 9% (106) 27% (329) 24% (286) 40% (486) 1206Educ: Bachelors degree 20% (98) 33% (165) 21% (106) 26% (132) 501Educ: Post-grad 22% (65) 36% (105) 22% (64) 19% (56) 290Income: Under 50k 10% (85) 26% (230) 26% (229) 37% (324) 868Income: 50k-100k 15% (105) 31% (223) 22% (159) 33% (238) 725Income: 100k+ 20% (80) 36% (145) 17% (68) 28% (112) 405Ethnicity: White 14% (215) 30% (467) 22% (338) 34% (515) 1536Ethnicity: Hispanic 16% (35) 29% (64) 24% (54) 31% (68) 222
Continued on next page

National Tracking Poll #2112154, December, 2021
225
Table POL20_8
Table POL20_8: How much have you seen, read, or heard about the following?The Food and Drug Administration announcing that it will permanently soften restrictions on a pill used to terminate early pregnancies, making iteasier for Americans to obtain the pill by mail
Demographic A lot Some Not Much Nothing at all Total N
Registered Voters 14% (270) 30% (598) 23% (456) 34% (674) 1998Ethnicity: Black 13% (32) 30% (77) 23% (60) 34% (87) 255Ethnicity: Other 11% (23) 26% (53) 28% (58) 35% (73) 207All Christian 12% (119) 31% (313) 26% (258) 31% (313) 1003All Non-Christian 39% (58) 25% (38) 18% (27) 18% (27) 151Atheist 20% (15) 28% (21) 16% (12) 36% (27) 75Agnostic/Nothing in particular 11% (50) 31% (148) 21% (101) 37% (175) 474Something Else 9% (27) 26% (77) 20% (59) 45% (132) 295Religious Non-Protestant/Catholic 35% (59) 24% (40) 19% (32) 22% (37) 168Evangelical 11% (61) 31% (174) 24% (133) 34% (187) 555Non-Evangelical 11% (80) 30% (211) 25% (178) 34% (246) 715Community: Urban 23% (125) 29% (156) 21% (112) 27% (144) 538Community: Suburban 11% (99) 31% (290) 23% (214) 36% (336) 939Community: Rural 9% (45) 29% (152) 25% (130) 37% (194) 521Employ: Private Sector 16% (108) 35% (239) 22% (151) 27% (189) 687Employ: Government 13% (16) 26% (33) 24% (30) 38% (48) 127Employ: Self-Employed 21% (43) 26% (51) 23% (46) 30% (60) 200Employ: Homemaker 11% (14) 29% (37) 22% (28) 38% (47) 126Employ: Student 12% (7) 23% (14) 25% (15) 40% (25) 61Employ: Retired 12% (62) 31% (162) 24% (127) 33% (169) 520Employ: Unemployed 4% (6) 21% (32) 28% (41) 47% (70) 150Employ: Other 11% (14) 24% (30) 13% (17) 52% (67) 127Military HH: Yes 14% (50) 26% (91) 22% (77) 37% (130) 348Military HH: No 13% (220) 31% (506) 23% (379) 33% (545) 1650RD/WT: Right Direction 22% (163) 32% (235) 22% (160) 25% (185) 743RD/WT: Wrong Track 8% (107) 29% (363) 24% (296) 39% (490) 1255Biden Job Approve 20% (175) 34% (292) 22% (190) 24% (205) 863Biden Job Disapprove 9% (95) 27% (288) 24% (251) 40% (424) 1057
Continued on next page

226
Morning ConsultTable POL20_8
Table POL20_8: How much have you seen, read, or heard about the following?The Food and Drug Administration announcing that it will permanently soften restrictions on a pill used to terminate early pregnancies, making iteasier for Americans to obtain the pill by mail
Demographic A lot Some Not Much Nothing at all Total N
Registered Voters 14% (270) 30% (598) 23% (456) 34% (674) 1998Biden Job Strongly Approve 31% (133) 30% (126) 18% (76) 21% (89) 424Biden Job Somewhat Approve 10% (42) 38% (166) 26% (113) 27% (117) 438Biden Job Somewhat Disapprove 10% (27) 26% (75) 31% (87) 33% (94) 283Biden Job Strongly Disapprove 9% (67) 28% (213) 21% (164) 43% (329) 774Favorable of Biden 19% (173) 34% (304) 23% (209) 23% (209) 896Unfavorable of Biden 8% (85) 28% (281) 23% (236) 41% (418) 1020Very Favorable of Biden 30% (128) 31% (133) 17% (74) 22% (93) 427Somewhat Favorable of Biden 10% (45) 37% (172) 29% (136) 25% (117) 469Somewhat Unfavorable of Biden 9% (19) 27% (59) 28% (60) 36% (78) 216Very Unfavorable of Biden 8% (66) 28% (222) 22% (176) 42% (339) 804#1 Issue: Economy 13% (109) 29% (251) 23% (194) 35% (304) 858#1 Issue: Security 9% (25) 28% (77) 23% (64) 39% (108) 274#1 Issue: Health Care 18% (40) 30% (68) 21% (48) 31% (71) 227#1 Issue: Medicare / Social Security 8% (16) 33% (65) 26% (51) 33% (65) 196#1 Issue: Women’s Issues 20% (25) 34% (42) 24% (29) 23% (28) 124#1 Issue: Education 16% (13) 21% (17) 26% (21) 37% (30) 80#1 Issue: Energy 22% (27) 27% (33) 22% (27) 28% (34) 121#1 Issue: Other 13% (16) 38% (45) 20% (23) 29% (34) 1182020 Vote: Joe Biden 18% (173) 34% (317) 22% (208) 26% (247) 9462020 Vote: Donald Trump 10% (87) 26% (222) 24% (207) 40% (348) 8642020 Vote: Didn’t Vote 4% (7) 27% (42) 21% (32) 47% (72) 1532018 House Vote: Democrat 20% (143) 35% (250) 20% (144) 25% (178) 7152018 House Vote: Republican 12% (86) 29% (208) 24% (174) 35% (249) 7162018 House Vote: Someone else 5% (3) 20% (13) 25% (17) 51% (34) 672016 Vote: Hillary Clinton 20% (134) 35% (240) 20% (138) 25% (167) 6792016 Vote: Donald Trump 12% (89) 27% (206) 24% (183) 37% (276) 7542016 Vote: Other 8% (8) 37% (36) 26% (25) 28% (27) 962016 Vote: Didn’t Vote 8% (39) 25% (116) 23% (109) 43% (203) 468Voted in 2014: Yes 16% (217) 32% (438) 22% (299) 30% (406) 1360Voted in 2014: No 8% (53) 25% (160) 25% (157) 42% (268) 638
Continued on next page

National Tracking Poll #2112154, December, 2021
227
Table POL20_8
Table POL20_8: How much have you seen, read, or heard about the following?The Food and Drug Administration announcing that it will permanently soften restrictions on a pill used to terminate early pregnancies, making iteasier for Americans to obtain the pill by mail
Demographic A lot Some Not Much Nothing at all Total N
Registered Voters 14% (270) 30% (598) 23% (456) 34% (674) 19984-Region: Northeast 20% (71) 27% (96) 23% (80) 30% (106) 3534-Region: Midwest 8% (37) 34% (150) 23% (103) 35% (154) 4444-Region: South 11% (84) 31% (232) 21% (159) 36% (270) 7464-Region: West 17% (78) 26% (120) 25% (114) 32% (144) 455Party: Democrat/Leans Democrat 20% (176) 32% (283) 22% (193) 26% (231) 883Party: Republican/Leans Republican 9% (78) 29% (243) 24% (199) 38% (321) 841Note: Row proportions may total to larger than one-hundred percent due to rounding. For more information visit MorningConsultIntelligence.com.

228
Morning ConsultTable POL20_9
Table POL20_9: How much have you seen, read, or heard about the following?The coronavirus omicron variant causing an increase in COVID-19 cases in many countries
Demographic A lot Some Not Much Nothing at all Total N
Registered Voters 48% (965) 35% (696) 10% (195) 7% (143) 1998Gender: Male 49% (460) 35% (326) 10% (94) 7% (61) 942Gender: Female 48% (505) 35% (370) 10% (101) 8% (81) 1056Age: 18-34 41% (212) 29% (147) 16% (85) 14% (71) 514Age: 35-44 46% (141) 38% (116) 8% (25) 8% (25) 307Age: 45-64 49% (331) 39% (266) 7% (50) 5% (32) 679Age: 65+ 57% (281) 34% (167) 7% (35) 3% (14) 497GenZers: 1997-2012 37% (67) 26% (48) 16% (29) 21% (37) 181Millennials: 1981-1996 44% (234) 32% (173) 14% (73) 10% (54) 534GenXers: 1965-1980 45% (209) 39% (178) 10% (45) 6% (28) 460Baby Boomers: 1946-1964 55% (417) 37% (280) 5% (39) 3% (20) 755PID: Dem (no lean) 57% (432) 31% (232) 7% (56) 5% (39) 759PID: Ind (no lean) 42% (224) 41% (217) 9% (49) 8% (41) 531PID: Rep (no lean) 44% (309) 35% (247) 13% (91) 9% (62) 708PID/Gender: DemMen 58% (192) 30% (99) 7% (22) 5% (15) 328PID/Gender: DemWomen 56% (240) 31% (133) 8% (34) 6% (24) 431PID/Gender: Ind Men 43% (110) 42% (106) 8% (20) 7% (18) 255PID/Gender: Ind Women 41% (114) 40% (110) 10% (29) 8% (23) 276PID/Gender: Rep Men 44% (158) 34% (120) 14% (52) 8% (28) 359PID/Gender: Rep Women 43% (151) 36% (126) 11% (38) 10% (34) 349Ideo: Liberal (1-3) 60% (346) 28% (162) 7% (40) 5% (28) 576Ideo: Moderate (4) 49% (233) 38% (182) 9% (43) 5% (22) 481Ideo: Conservative (5-7) 45% (351) 38% (294) 10% (80) 7% (52) 776Educ: < College 42% (505) 37% (447) 12% (144) 9% (110) 1206Educ: Bachelors degree 60% (300) 28% (140) 7% (36) 5% (25) 501Educ: Post-grad 55% (160) 37% (108) 5% (15) 3% (7) 290Income: Under 50k 42% (365) 34% (295) 14% (119) 10% (90) 868Income: 50k-100k 49% (358) 37% (269) 8% (56) 6% (42) 725Income: 100k+ 60% (242) 32% (132) 5% (20) 3% (12) 405Ethnicity: White 51% (784) 34% (520) 9% (136) 6% (97) 1536Ethnicity: Hispanic 44% (98) 39% (88) 10% (21) 7% (15) 222Ethnicity: Black 34% (87) 38% (98) 16% (40) 12% (30) 255
Continued on next page

National Tracking Poll #2112154, December, 2021
229
Table POL20_9
Table POL20_9: How much have you seen, read, or heard about the following?The coronavirus omicron variant causing an increase in COVID-19 cases in many countries
Demographic A lot Some Not Much Nothing at all Total N
Registered Voters 48% (965) 35% (696) 10% (195) 7% (143) 1998Ethnicity: Other 45% (94) 38% (78) 9% (19) 8% (16) 207All Christian 51% (516) 37% (374) 7% (73) 4% (40) 1003All Non-Christian 58% (87) 22% (34) 10% (15) 10% (15) 151Atheist 62% (47) 21% (16) 13% (10) 4% (3) 75Agnostic/Nothing in particular 44% (208) 33% (155) 14% (67) 9% (45) 474Something Else 36% (107) 40% (117) 10% (31) 13% (39) 295Religious Non-Protestant/Catholic 53% (89) 27% (46) 10% (18) 9% (16) 168Evangelical 43% (239) 39% (214) 12% (67) 6% (34) 555Non-Evangelical 53% (380) 36% (257) 5% (34) 6% (44) 715Community: Urban 50% (268) 33% (177) 9% (49) 8% (44) 538Community: Suburban 49% (462) 34% (321) 10% (93) 7% (63) 939Community: Rural 45% (235) 38% (197) 10% (53) 7% (36) 521Employ: Private Sector 50% (342) 35% (241) 9% (63) 6% (41) 687Employ: Government 38% (48) 51% (65) 5% (6) 7% (8) 127Employ: Self-Employed 52% (105) 29% (59) 11% (23) 7% (14) 200Employ: Homemaker 46% (58) 30% (38) 14% (17) 10% (13) 126Employ: Student 48% (29) 30% (18) 5% (3) 17% (10) 61Employ: Retired 55% (288) 34% (179) 8% (41) 3% (13) 520Employ: Unemployed 33% (49) 29% (43) 20% (29) 19% (28) 150Employ: Other 37% (47) 42% (53) 11% (13) 11% (14) 127Military HH: Yes 48% (167) 41% (143) 6% (21) 5% (16) 348Military HH: No 48% (798) 33% (552) 11% (174) 8% (126) 1650RD/WT: Right Direction 56% (413) 31% (230) 8% (58) 6% (42) 743RD/WT: Wrong Track 44% (551) 37% (466) 11% (137) 8% (100) 1255Biden Job Approve 58% (497) 31% (270) 7% (64) 4% (33) 863Biden Job Disapprove 43% (457) 37% (394) 11% (118) 8% (88) 1057Biden Job Strongly Approve 60% (256) 27% (117) 7% (30) 5% (22) 424Biden Job Somewhat Approve 55% (241) 35% (153) 8% (34) 2% (10) 438Biden Job Somewhat Disapprove 48% (136) 32% (92) 11% (33) 8% (23) 283Biden Job Strongly Disapprove 41% (321) 39% (302) 11% (86) 8% (65) 774
Continued on next page

230
Morning ConsultTable POL20_9
Table POL20_9: How much have you seen, read, or heard about the following?The coronavirus omicron variant causing an increase in COVID-19 cases in many countries
Demographic A lot Some Not Much Nothing at all Total N
Registered Voters 48% (965) 35% (696) 10% (195) 7% (143) 1998Favorable of Biden 57% (512) 31% (281) 8% (69) 4% (35) 896Unfavorable of Biden 43% (442) 38% (391) 11% (109) 8% (78) 1020Very Favorable of Biden 64% (272) 26% (111) 7% (29) 4% (15) 427Somewhat Favorable of Biden 51% (240) 36% (170) 9% (40) 4% (19) 469Somewhat Unfavorable of Biden 52% (113) 33% (72) 9% (20) 5% (11) 216Very Unfavorable of Biden 41% (329) 40% (319) 11% (90) 8% (66) 804#1 Issue: Economy 43% (370) 39% (332) 10% (86) 8% (70) 858#1 Issue: Security 46% (125) 38% (103) 11% (31) 5% (15) 274#1 Issue: Health Care 56% (127) 31% (71) 8% (18) 5% (12) 227#1 Issue: Medicare / Social Security 56% (110) 34% (66) 7% (13) 4% (7) 196#1 Issue: Women’s Issues 53% (65) 23% (29) 14% (18) 9% (12) 124#1 Issue: Education 42% (34) 26% (21) 19% (15) 13% (10) 80#1 Issue: Energy 57% (69) 32% (38) 6% (7) 5% (6) 121#1 Issue: Other 55% (65) 30% (35) 6% (7) 9% (11) 1182020 Vote: Joe Biden 57% (538) 33% (308) 6% (58) 5% (43) 9462020 Vote: Donald Trump 43% (371) 37% (321) 12% (107) 7% (65) 8642020 Vote: Didn’t Vote 26% (39) 34% (52) 19% (29) 21% (33) 1532018 House Vote: Democrat 61% (433) 32% (226) 5% (33) 3% (23) 7152018 House Vote: Republican 43% (310) 38% (271) 12% (87) 7% (48) 7162018 House Vote: Someone else 39% (26) 33% (22) 8% (5) 20% (14) 672016 Vote: Hillary Clinton 62% (424) 30% (205) 4% (28) 3% (22) 6792016 Vote: Donald Trump 43% (323) 38% (286) 11% (86) 8% (59) 7542016 Vote: Other 49% (47) 39% (38) 7% (7) 4% (4) 962016 Vote: Didn’t Vote 36% (169) 35% (166) 16% (75) 12% (58) 468Voted in 2014: Yes 52% (706) 35% (475) 8% (104) 6% (75) 1360Voted in 2014: No 41% (258) 35% (221) 14% (91) 11% (68) 6384-Region: Northeast 63% (223) 25% (87) 8% (27) 5% (16) 3534-Region: Midwest 46% (204) 36% (158) 11% (49) 7% (33) 4444-Region: South 45% (338) 37% (274) 9% (70) 9% (64) 7464-Region: West 44% (200) 39% (176) 11% (50) 6% (30) 455
Continued on next page

National Tracking Poll #2112154, December, 2021
231
Table POL20_9
Table POL20_9: How much have you seen, read, or heard about the following?The coronavirus omicron variant causing an increase in COVID-19 cases in many countries
Demographic A lot Some Not Much Nothing at all Total N
Registered Voters 48% (965) 35% (696) 10% (195) 7% (143) 1998Party: Democrat/Leans Democrat 57% (499) 31% (277) 7% (65) 5% (41) 883Party: Republican/Leans Republican 42% (358) 38% (316) 12% (100) 8% (67) 841Note: Row proportions may total to larger than one-hundred percent due to rounding. For more information visit MorningConsultIntelligence.com.

232
Morning ConsultTable POLx_1
Table POLx_1: Next we will look at a list of names that are active in politics. It is a long list, please take the time to go through the list carefullyand give an individual answer for each name below. For each person, please indicate if you have a Very Favorable, Somewhat Favorable, SomewhatUnfavorable, or Very Unfavorable opinion of each If you have heard of the person, but do not have an opinion, please mark ’Heard Of, No Opinion.’ Ifyou have not heard of the person, please mark ’Never Heard Of.’Mitch McConnell
Demographic Total Favorable Total UnfavorableHeard Of, NoOpinion Never Heard Of Total N
Registered Voters 22% (449) 54% (1070) 16% (329) 8% (150) 1998Gender: Male 29% (270) 53% (501) 11% (104) 7% (67) 942Gender: Female 17% (179) 54% (569) 21% (225) 8% (84) 1056Age: 18-34 19% (97) 35% (179) 24% (124) 22% (115) 514Age: 35-44 22% (66) 53% (162) 18% (54) 8% (24) 307Age: 45-64 21% (144) 61% (413) 16% (111) 2% (11) 679Age: 65+ 28% (141) 63% (315) 8% (40) — (1) 497GenZers: 1997-2012 9% (16) 26% (47) 32% (58) 33% (60) 181Millennials: 1981-1996 24% (127) 44% (236) 18% (96) 14% (74) 534GenXers: 1965-1980 21% (96) 56% (257) 20% (92) 3% (15) 460Baby Boomers: 1946-1964 24% (180) 66% (498) 10% (75) — (2) 755PID: Dem (no lean) 13% (99) 67% (512) 11% (81) 9% (67) 759PID: Ind (no lean) 13% (67) 57% (301) 22% (119) 8% (44) 531PID: Rep (no lean) 40% (283) 36% (256) 18% (129) 6% (40) 708PID/Gender: DemMen 20% (66) 62% (205) 6% (21) 11% (37) 328PID/Gender: DemWomen 8% (33) 71% (308) 14% (60) 7% (30) 431PID/Gender: Ind Men 13% (33) 65% (166) 16% (41) 6% (14) 255PID/Gender: Ind Women 12% (34) 49% (135) 28% (77) 11% (30) 276PID/Gender: Rep Men 48% (171) 36% (130) 12% (42) 4% (16) 359PID/Gender: Rep Women 32% (111) 36% (126) 25% (88) 7% (24) 349Ideo: Liberal (1-3) 13% (74) 71% (408) 9% (51) 8% (43) 576Ideo: Moderate (4) 13% (63) 61% (292) 19% (92) 7% (33) 481Ideo: Conservative (5-7) 38% (294) 44% (338) 15% (113) 4% (31) 776Educ: < College 19% (232) 49% (596) 22% (264) 9% (114) 1206Educ: Bachelors degree 28% (140) 57% (285) 9% (45) 6% (31) 501Educ: Post-grad 26% (76) 65% (189) 7% (20) 2% (6) 290Income: Under 50k 18% (157) 49% (423) 22% (194) 11% (95) 868Income: 50k-100k 23% (166) 57% (414) 14% (103) 6% (42) 725Income: 100k+ 31% (126) 58% (233) 8% (32) 3% (13) 405
Continued on next page

National Tracking Poll #2112154, December, 2021
233
Table POLx_1
Table POLx_1: Next we will look at a list of names that are active in politics. It is a long list, please take the time to go through the list carefullyand give an individual answer for each name below. For each person, please indicate if you have a Very Favorable, Somewhat Favorable, SomewhatUnfavorable, or Very Unfavorable opinion of each If you have heard of the person, but do not have an opinion, please mark ’Heard Of, No Opinion.’ Ifyou have not heard of the person, please mark ’Never Heard Of.’Mitch McConnell
Demographic Total Favorable Total UnfavorableHeard Of, NoOpinion Never Heard Of Total N
Registered Voters 22% (449) 54% (1070) 16% (329) 8% (150) 1998Ethnicity: White 24% (366) 55% (847) 15% (235) 6% (88) 1536Ethnicity: Hispanic 22% (49) 46% (102) 17% (37) 15% (34) 222Ethnicity: Black 17% (43) 48% (123) 20% (52) 15% (38) 255Ethnicity: Other 20% (40) 48% (100) 20% (42) 12% (24) 207All Christian 29% (295) 54% (544) 13% (135) 3% (28) 1003All Non-Christian 29% (43) 43% (64) 8% (12) 21% (32) 151Atheist 15% (11) 63% (47) 19% (14) 3% (2) 75Agnostic/Nothing in particular 10% (47) 59% (278) 20% (96) 11% (52) 474Something Else 18% (52) 46% (136) 24% (72) 12% (35) 295Religious Non-Protestant/Catholic 28% (47) 45% (75) 8% (13) 19% (33) 168Evangelical 35% (196) 42% (236) 16% (91) 6% (32) 555Non-Evangelical 20% (144) 60% (431) 15% (109) 4% (30) 715Community: Urban 27% (143) 49% (263) 14% (74) 11% (58) 538Community: Suburban 17% (163) 61% (573) 16% (149) 6% (55) 939Community: Rural 27% (143) 45% (234) 20% (106) 7% (38) 521Employ: Private Sector 24% (164) 56% (385) 15% (101) 5% (36) 687Employ: Government 23% (30) 50% (63) 25% (32) 2% (2) 127Employ: Self-Employed 21% (41) 48% (95) 13% (27) 18% (37) 200Employ: Homemaker 21% (27) 49% (61) 21% (27) 9% (11) 126Employ: Student 17% (11) 25% (15) 35% (22) 22% (13) 61Employ: Retired 26% (138) 64% (334) 9% (48) — (1) 520Employ: Unemployed 16% (24) 43% (65) 24% (36) 17% (25) 150Employ: Other 11% (15) 40% (51) 29% (37) 19% (25) 127Military HH: Yes 31% (109) 52% (180) 13% (44) 4% (14) 348Military HH: No 21% (339) 54% (890) 17% (285) 8% (137) 1650RD/WT: Right Direction 19% (138) 62% (460) 12% (89) 8% (57) 743RD/WT: Wrong Track 25% (311) 49% (609) 19% (240) 7% (94) 1255
Continued on next page

234
Morning ConsultTable POLx_1
Table POLx_1: Next we will look at a list of names that are active in politics. It is a long list, please take the time to go through the list carefullyand give an individual answer for each name below. For each person, please indicate if you have a Very Favorable, Somewhat Favorable, SomewhatUnfavorable, or Very Unfavorable opinion of each If you have heard of the person, but do not have an opinion, please mark ’Heard Of, No Opinion.’ Ifyou have not heard of the person, please mark ’Never Heard Of.’Mitch McConnell
Demographic Total Favorable Total UnfavorableHeard Of, NoOpinion Never Heard Of Total N
Registered Voters 22% (449) 54% (1070) 16% (329) 8% (150) 1998Biden Job Approve 16% (138) 67% (574) 10% (90) 7% (61) 863Biden Job Disapprove 29% (308) 46% (483) 20% (208) 5% (58) 1057Biden Job Strongly Approve 22% (93) 63% (266) 6% (26) 9% (40) 424Biden Job Somewhat Approve 10% (45) 70% (309) 15% (64) 5% (21) 438Biden Job Somewhat Disapprove 19% (53) 49% (138) 26% (73) 7% (19) 283Biden Job Strongly Disapprove 33% (255) 45% (345) 17% (135) 5% (39) 774Favorable of Biden 17% (152) 67% (596) 11% (95) 6% (52) 896Unfavorable of Biden 29% (291) 46% (471) 20% (201) 6% (57) 1020Very Favorable of Biden 20% (84) 67% (284) 7% (30) 7% (29) 427Somewhat Favorable of Biden 15% (69) 67% (312) 14% (65) 5% (23) 469Somewhat Unfavorable of Biden 14% (29) 51% (111) 29% (62) 6% (14) 216Very Unfavorable of Biden 33% (262) 45% (360) 17% (139) 5% (43) 804#1 Issue: Economy 26% (225) 46% (396) 19% (164) 8% (72) 858#1 Issue: Security 33% (92) 46% (126) 17% (45) 4% (11) 274#1 Issue: Health Care 16% (35) 63% (143) 15% (35) 6% (14) 227#1 Issue: Medicare / Social Security 17% (33) 73% (144) 8% (15) 2% (4) 196#1 Issue: Women’s Issues 8% (10) 58% (72) 20% (25) 13% (16) 124#1 Issue: Education 24% (19) 41% (32) 23% (19) 12% (10) 80#1 Issue: Energy 13% (16) 62% (74) 14% (17) 11% (13) 121#1 Issue: Other 15% (18) 68% (81) 8% (9) 9% (11) 1182020 Vote: Joe Biden 13% (119) 69% (653) 12% (110) 7% (64) 9462020 Vote: Donald Trump 36% (313) 41% (351) 18% (152) 6% (48) 8642020 Vote: Didn’t Vote 9% (14) 29% (44) 39% (60) 22% (34) 1532018 House Vote: Democrat 13% (96) 75% (537) 8% (60) 3% (22) 7152018 House Vote: Republican 39% (282) 43% (311) 14% (98) 3% (24) 7162018 House Vote: Someone else 13% (9) 44% (30) 26% (17) 18% (12) 67
Continued on next page

National Tracking Poll #2112154, December, 2021
235
Table POLx_1
Table POLx_1: Next we will look at a list of names that are active in politics. It is a long list, please take the time to go through the list carefullyand give an individual answer for each name below. For each person, please indicate if you have a Very Favorable, Somewhat Favorable, SomewhatUnfavorable, or Very Unfavorable opinion of each If you have heard of the person, but do not have an opinion, please mark ’Heard Of, No Opinion.’ Ifyou have not heard of the person, please mark ’Never Heard Of.’Mitch McConnell
Demographic Total Favorable Total UnfavorableHeard Of, NoOpinion Never Heard Of Total N
Registered Voters 22% (449) 54% (1070) 16% (329) 8% (150) 19982016 Vote: Hillary Clinton 12% (79) 76% (514) 10% (66) 3% (19) 6792016 Vote: Donald Trump 40% (300) 43% (323) 13% (97) 4% (33) 7542016 Vote: Other 7% (7) 76% (73) 11% (11) 6% (5) 962016 Vote: Didn’t Vote 13% (62) 34% (159) 33% (154) 20% (93) 468Voted in 2014: Yes 27% (362) 59% (808) 11% (146) 3% (44) 1360Voted in 2014: No 14% (87) 41% (262) 29% (183) 17% (106) 6384-Region: Northeast 23% (80) 56% (199) 11% (39) 10% (36) 3534-Region: Midwest 20% (91) 54% (238) 21% (93) 5% (23) 4444-Region: South 23% (171) 52% (385) 19% (141) 7% (49) 7464-Region: West 23% (107) 55% (249) 12% (56) 9% (43) 455Party: Democrat/Leans Democrat 13% (113) 68% (601) 11% (95) 8% (73) 883Party: Republican/Leans Republican 37% (313) 40% (335) 18% (150) 5% (43) 841Note: Row proportions may total to larger than one-hundred percent due to rounding. For more information visit MorningConsultIntelligence.com.

236
Morning ConsultTable POLx_2
Table POLx_2: Favorability forNancy Pelosi
Demographic Total Favorable Total UnfavorableHeard Of, NoOpinion Never Heard Of Total N
Registered Voters 32% (648) 55% (1106) 8% (153) 5% (91) 1998Gender: Male 32% (298) 58% (542) 5% (44) 6% (58) 942Gender: Female 33% (350) 53% (564) 10% (109) 3% (33) 1056Age: 18-34 24% (121) 45% (233) 17% (86) 14% (74) 514Age: 35-44 39% (119) 50% (155) 8% (24) 3% (9) 307Age: 45-64 32% (216) 62% (421) 5% (36) 1% (6) 679Age: 65+ 39% (191) 60% (297) 2% (8) — (1) 497GenZers: 1997-2012 15% (27) 42% (77) 27% (49) 16% (28) 181Millennials: 1981-1996 34% (181) 46% (246) 10% (52) 10% (55) 534GenXers: 1965-1980 31% (141) 63% (290) 5% (24) 1% (5) 460Baby Boomers: 1946-1964 36% (273) 60% (451) 4% (28) — (3) 755PID: Dem (no lean) 65% (495) 22% (164) 8% (63) 5% (36) 759PID: Ind (no lean) 22% (116) 61% (321) 12% (66) 5% (27) 531PID: Rep (no lean) 5% (36) 88% (620) 3% (25) 4% (27) 708PID/Gender: DemMen 66% (216) 23% (75) 4% (13) 7% (24) 328PID/Gender: DemWomen 65% (279) 21% (90) 12% (50) 3% (12) 431PID/Gender: Ind Men 22% (56) 64% (164) 9% (24) 4% (11) 255PID/Gender: Ind Women 22% (60) 57% (158) 15% (41) 6% (17) 276PID/Gender: Rep Men 7% (26) 84% (303) 2% (7) 6% (23) 359PID/Gender: Rep Women 3% (10) 91% (317) 5% (18) 1% (5) 349Ideo: Liberal (1-3) 66% (379) 22% (129) 7% (41) 5% (27) 576Ideo: Moderate (4) 35% (166) 54% (258) 9% (45) 2% (12) 481Ideo: Conservative (5-7) 11% (85) 84% (655) 3% (23) 2% (14) 776Educ: < College 25% (306) 59% (713) 11% (133) 4% (54) 1206Educ: Bachelors degree 38% (193) 53% (265) 3% (14) 6% (30) 501Educ: Post-grad 51% (149) 44% (128) 2% (7) 2% (6) 290Income: Under 50k 28% (244) 52% (453) 13% (115) 7% (56) 868Income: 50k-100k 35% (255) 57% (415) 4% (31) 3% (24) 725Income: 100k+ 37% (150) 59% (238) 2% (7) 3% (11) 405Ethnicity: White 31% (478) 61% (939) 5% (74) 3% (45) 1536Ethnicity: Hispanic 37% (83) 43% (96) 14% (31) 5% (12) 222
Continued on next page

National Tracking Poll #2112154, December, 2021
237
Table POLx_2
Table POLx_2: Favorability forNancy Pelosi
Demographic Total Favorable Total UnfavorableHeard Of, NoOpinion Never Heard Of Total N
Registered Voters 32% (648) 55% (1106) 8% (153) 5% (91) 1998Ethnicity: Black 43% (110) 26% (66) 19% (50) 12% (29) 255Ethnicity: Other 29% (60) 48% (100) 14% (30) 8% (16) 207All Christian 34% (340) 61% (608) 3% (33) 2% (23) 1003All Non-Christian 48% (72) 27% (41) 4% (6) 21% (32) 151Atheist 38% (29) 51% (39) 9% (7) 1% (1) 75Agnostic/Nothing in particular 34% (159) 46% (220) 15% (71) 5% (24) 474Something Else 16% (48) 67% (198) 13% (37) 4% (11) 295Religious Non-Protestant/Catholic 44% (74) 33% (55) 4% (6) 19% (32) 168Evangelical 23% (127) 70% (386) 4% (23) 3% (19) 555Non-Evangelical 36% (254) 56% (400) 6% (46) 2% (15) 715Community: Urban 41% (220) 42% (227) 8% (42) 9% (48) 538Community: Suburban 34% (323) 56% (526) 7% (66) 2% (23) 939Community: Rural 20% (104) 68% (353) 9% (45) 4% (20) 521Employ: Private Sector 34% (233) 56% (388) 6% (44) 3% (22) 687Employ: Government 29% (37) 54% (69) 14% (18) 2% (3) 127Employ: Self-Employed 35% (71) 45% (90) 5% (11) 14% (28) 200Employ: Homemaker 25% (31) 63% (80) 11% (13) 1% (2) 126Employ: Student 20% (12) 47% (29) 13% (8) 20% (12) 61Employ: Retired 37% (193) 61% (318) 1% (8) — (1) 520Employ: Unemployed 28% (41) 43% (65) 22% (33) 7% (11) 150Employ: Other 23% (30) 53% (67) 15% (19) 9% (11) 127Military HH: Yes 32% (111) 62% (215) 4% (15) 2% (6) 348Military HH: No 33% (537) 54% (891) 8% (139) 5% (84) 1650RD/WT: Right Direction 68% (502) 20% (147) 5% (39) 7% (56) 743RD/WT: Wrong Track 12% (146) 76% (959) 9% (114) 3% (35) 1255Biden Job Approve 68% (591) 20% (176) 6% (50) 5% (46) 863Biden Job Disapprove 5% (51) 86% (911) 6% (67) 3% (28) 1057
Continued on next page

238
Morning ConsultTable POLx_2
Table POLx_2: Favorability forNancy Pelosi
Demographic Total Favorable Total UnfavorableHeard Of, NoOpinion Never Heard Of Total N
Registered Voters 32% (648) 55% (1106) 8% (153) 5% (91) 1998Biden Job Strongly Approve 79% (334) 10% (42) 3% (11) 9% (36) 424Biden Job Somewhat Approve 59% (257) 30% (134) 9% (38) 2% (10) 438Biden Job Somewhat Disapprove 12% (34) 73% (207) 10% (27) 5% (15) 283Biden Job Strongly Disapprove 2% (17) 91% (703) 5% (40) 2% (13) 774Favorable of Biden 68% (612) 21% (186) 6% (53) 5% (45) 896Unfavorable of Biden 3% (29) 89% (909) 6% (62) 2% (19) 1020Very Favorable of Biden 83% (353) 9% (40) 2% (11) 5% (23) 427Somewhat Favorable of Biden 55% (258) 31% (146) 9% (42) 5% (22) 469Somewhat Unfavorable of Biden 8% (18) 76% (164) 14% (30) 2% (4) 216Very Unfavorable of Biden 1% (11) 93% (745) 4% (32) 2% (15) 804#1 Issue: Economy 24% (203) 62% (530) 9% (81) 5% (44) 858#1 Issue: Security 10% (28) 85% (234) 4% (12) — (1) 274#1 Issue: Health Care 51% (115) 40% (90) 6% (14) 4% (8) 227#1 Issue: Medicare / Social Security 54% (105) 41% (81) 3% (7) 2% (3) 196#1 Issue: Women’s Issues 48% (60) 30% (38) 14% (18) 7% (8) 124#1 Issue: Education 34% (27) 44% (35) 8% (7) 14% (11) 80#1 Issue: Energy 46% (56) 38% (46) 10% (12) 6% (8) 121#1 Issue: Other 46% (54) 44% (52) 3% (4) 7% (8) 1182020 Vote: Joe Biden 61% (580) 26% (243) 9% (81) 4% (41) 9462020 Vote: Donald Trump 5% (42) 88% (764) 3% (28) 3% (30) 8642020 Vote: Didn’t Vote 16% (24) 46% (70) 26% (39) 12% (19) 1532018 House Vote: Democrat 67% (479) 24% (174) 6% (40) 3% (22) 7152018 House Vote: Republican 7% (52) 87% (624) 2% (13) 4% (27) 7162018 House Vote: Someone else 9% (6) 71% (48) 16% (11) 3% (2) 672016 Vote: Hillary Clinton 71% (480) 22% (149) 5% (35) 2% (15) 6792016 Vote: Donald Trump 7% (54) 86% (649) 3% (21) 4% (30) 7542016 Vote: Other 18% (17) 73% (70) 10% (9) — (0) 962016 Vote: Didn’t Vote 21% (96) 51% (237) 19% (89) 10% (46) 468Voted in 2014: Yes 37% (501) 56% (764) 4% (60) 3% (36) 1360Voted in 2014: No 23% (147) 54% (342) 15% (93) 9% (55) 638
Continued on next page

National Tracking Poll #2112154, December, 2021
239
Table POLx_2
Table POLx_2: Favorability forNancy Pelosi
Demographic Total Favorable Total UnfavorableHeard Of, NoOpinion Never Heard Of Total N
Registered Voters 32% (648) 55% (1106) 8% (153) 5% (91) 19984-Region: Northeast 41% (144) 45% (158) 6% (20) 9% (31) 3534-Region: Midwest 29% (130) 59% (264) 9% (39) 2% (11) 4444-Region: South 26% (197) 64% (474) 8% (57) 2% (17) 7464-Region: West 39% (177) 46% (210) 8% (37) 7% (31) 455Party: Democrat/Leans Democrat 64% (563) 23% (204) 9% (76) 5% (40) 883Party: Republican/Leans Republican 5% (44) 88% (736) 4% (35) 3% (27) 841Note: Row proportions may total to larger than one-hundred percent due to rounding. For more information visit MorningConsultIntelligence.com.

240
Morning ConsultTable POLx_3
Table POLx_3: Favorability forCharles Schumer
Demographic Total Favorable Total UnfavorableHeard Of, NoOpinion Never Heard Of Total N
Registered Voters 28% (558) 43% (850) 17% (334) 13% (255) 1998Gender: Male 32% (304) 47% (446) 11% (99) 10% (93) 942Gender: Female 24% (255) 38% (404) 22% (235) 15% (162) 1056Age: 18-34 19% (96) 25% (127) 20% (105) 36% (188) 514Age: 35-44 36% (109) 34% (105) 19% (57) 12% (35) 307Age: 45-64 27% (181) 52% (354) 17% (117) 4% (28) 679Age: 65+ 35% (173) 53% (265) 11% (56) 1% (4) 497GenZers: 1997-2012 5% (9) 19% (35) 26% (47) 50% (90) 181Millennials: 1981-1996 31% (167) 29% (153) 17% (93) 23% (122) 534GenXers: 1965-1980 26% (121) 47% (217) 19% (87) 8% (36) 460Baby Boomers: 1946-1964 31% (237) 54% (411) 13% (100) 1% (7) 755PID: Dem (no lean) 54% (411) 20% (152) 13% (100) 13% (97) 759PID: Ind (no lean) 16% (87) 44% (235) 23% (123) 16% (86) 531PID: Rep (no lean) 9% (61) 65% (463) 16% (112) 10% (73) 708PID/Gender: DemMen 63% (208) 18% (58) 7% (22) 12% (40) 328PID/Gender: DemWomen 47% (202) 22% (94) 18% (78) 13% (56) 431PID/Gender: Ind Men 20% (51) 54% (138) 16% (42) 9% (23) 255PID/Gender: Ind Women 13% (36) 35% (97) 29% (81) 23% (62) 276PID/Gender: Rep Men 12% (44) 70% (250) 10% (35) 8% (30) 359PID/Gender: Rep Women 5% (17) 61% (213) 22% (76) 12% (43) 349Ideo: Liberal (1-3) 55% (315) 20% (118) 13% (78) 11% (66) 576Ideo: Moderate (4) 29% (140) 39% (186) 19% (92) 13% (62) 481Ideo: Conservative (5-7) 12% (95) 66% (513) 14% (107) 8% (61) 776Educ: < College 20% (242) 44% (526) 21% (247) 16% (191) 1206Educ: Bachelors degree 37% (183) 41% (206) 12% (62) 10% (50) 501Educ: Post-grad 46% (133) 41% (118) 9% (25) 5% (14) 290Income: Under 50k 22% (190) 37% (324) 22% (189) 19% (165) 868Income: 50k-100k 31% (227) 44% (318) 15% (112) 9% (68) 725Income: 100k+ 35% (141) 51% (207) 8% (34) 6% (22) 405Ethnicity: White 28% (431) 46% (711) 16% (245) 10% (149) 1536Ethnicity: Hispanic 35% (77) 23% (51) 23% (51) 20% (44) 222
Continued on next page

National Tracking Poll #2112154, December, 2021
241
Table POLx_3
Table POLx_3: Favorability forCharles Schumer
Demographic Total Favorable Total UnfavorableHeard Of, NoOpinion Never Heard Of Total N
Registered Voters 28% (558) 43% (850) 17% (334) 13% (255) 1998Ethnicity: Black 33% (83) 25% (64) 19% (47) 24% (61) 255Ethnicity: Other 21% (44) 36% (75) 21% (42) 22% (46) 207All Christian 29% (286) 50% (503) 14% (144) 7% (70) 1003All Non-Christian 44% (67) 24% (35) 9% (13) 24% (36) 151Atheist 44% (33) 21% (16) 17% (13) 18% (14) 75Agnostic/Nothing in particular 29% (138) 33% (157) 22% (105) 16% (75) 474Something Else 12% (35) 47% (139) 20% (60) 21% (61) 295Religious Non-Protestant/Catholic 40% (68) 30% (50) 8% (14) 22% (36) 168Evangelical 19% (105) 53% (296) 17% (96) 10% (58) 555Non-Evangelical 29% (211) 46% (328) 15% (105) 10% (71) 715Community: Urban 38% (207) 32% (174) 14% (75) 15% (82) 538Community: Suburban 29% (274) 43% (402) 17% (160) 11% (103) 939Community: Rural 15% (78) 52% (273) 19% (100) 14% (71) 521Employ: Private Sector 32% (221) 44% (305) 13% (90) 10% (70) 687Employ: Government 24% (31) 39% (50) 27% (34) 10% (13) 127Employ: Self-Employed 25% (49) 40% (79) 10% (21) 25% (51) 200Employ: Homemaker 16% (20) 55% (69) 20% (25) 9% (12) 126Employ: Student 11% (6) 12% (7) 28% (17) 49% (30) 61Employ: Retired 34% (177) 51% (267) 14% (73) 1% (4) 520Employ: Unemployed 17% (25) 28% (42) 31% (46) 25% (37) 150Employ: Other 23% (29) 25% (31) 22% (28) 31% (39) 127Military HH: Yes 30% (104) 50% (172) 15% (52) 6% (20) 348Military HH: No 28% (455) 41% (677) 17% (283) 14% (235) 1650RD/WT: Right Direction 57% (421) 18% (134) 14% (104) 11% (85) 743RD/WT: Wrong Track 11% (138) 57% (716) 18% (231) 14% (171) 1255Biden Job Approve 57% (491) 19% (160) 14% (120) 11% (92) 863Biden Job Disapprove 6% (66) 65% (683) 18% (189) 11% (120) 1057
Continued on next page

242
Morning ConsultTable POLx_3
Table POLx_3: Favorability forCharles Schumer
Demographic Total Favorable Total UnfavorableHeard Of, NoOpinion Never Heard Of Total N
Registered Voters 28% (558) 43% (850) 17% (334) 13% (255) 1998Biden Job Strongly Approve 69% (292) 11% (45) 9% (40) 11% (48) 424Biden Job Somewhat Approve 46% (200) 26% (115) 18% (80) 10% (44) 438Biden Job Somewhat Disapprove 12% (33) 45% (126) 24% (68) 20% (56) 283Biden Job Strongly Disapprove 4% (33) 72% (556) 16% (121) 8% (63) 774Favorable of Biden 55% (497) 19% (171) 14% (122) 12% (105) 896Unfavorable of Biden 5% (55) 66% (672) 18% (181) 11% (112) 1020Very Favorable of Biden 72% (308) 11% (48) 9% (36) 8% (35) 427Somewhat Favorable of Biden 40% (189) 26% (123) 18% (86) 15% (70) 469Somewhat Unfavorable of Biden 12% (26) 45% (97) 26% (57) 17% (37) 216Very Unfavorable of Biden 4% (30) 72% (575) 15% (124) 9% (75) 804#1 Issue: Economy 21% (181) 48% (408) 18% (154) 13% (116) 858#1 Issue: Security 10% (27) 68% (187) 13% (37) 9% (24) 274#1 Issue: Health Care 47% (106) 26% (59) 18% (40) 10% (22) 227#1 Issue: Medicare / Social Security 46% (91) 36% (71) 13% (26) 4% (9) 196#1 Issue: Women’s Issues 30% (37) 23% (29) 24% (29) 23% (28) 124#1 Issue: Education 27% (21) 21% (17) 26% (21) 27% (21) 80#1 Issue: Energy 41% (49) 26% (32) 15% (19) 17% (21) 121#1 Issue: Other 38% (45) 41% (48) 8% (10) 12% (15) 1182020 Vote: Joe Biden 51% (479) 23% (213) 15% (139) 12% (115) 9462020 Vote: Donald Trump 7% (64) 67% (579) 16% (140) 9% (82) 8642020 Vote: Didn’t Vote 8% (13) 25% (37) 33% (51) 34% (52) 1532018 House Vote: Democrat 58% (412) 23% (164) 12% (83) 8% (56) 7152018 House Vote: Republican 10% (68) 70% (501) 13% (90) 8% (56) 7162018 House Vote: Someone else 10% (7) 44% (30) 32% (21) 14% (10) 672016 Vote: Hillary Clinton 60% (405) 21% (139) 13% (89) 7% (46) 6792016 Vote: Donald Trump 10% (77) 69% (522) 13% (95) 8% (60) 7542016 Vote: Other 20% (20) 56% (53) 16% (15) 8% (8) 962016 Vote: Didn’t Vote 12% (56) 29% (134) 29% (136) 30% (142) 468Voted in 2014: Yes 34% (461) 47% (646) 13% (174) 6% (79) 1360Voted in 2014: No 15% (97) 32% (204) 25% (160) 28% (176) 638
Continued on next page

National Tracking Poll #2112154, December, 2021
243
Table POLx_3
Table POLx_3: Favorability forCharles Schumer
Demographic Total Favorable Total UnfavorableHeard Of, NoOpinion Never Heard Of Total N
Registered Voters 28% (558) 43% (850) 17% (334) 13% (255) 19984-Region: Northeast 39% (136) 38% (136) 12% (42) 11% (39) 3534-Region: Midwest 23% (104) 45% (201) 19% (83) 13% (57) 4444-Region: South 23% (174) 46% (341) 19% (144) 12% (86) 7464-Region: West 32% (145) 38% (172) 14% (65) 16% (74) 455Party: Democrat/Leans Democrat 53% (469) 20% (180) 14% (122) 13% (112) 883Party: Republican/Leans Republican 8% (65) 65% (549) 17% (145) 10% (82) 841Note: Row proportions may total to larger than one-hundred percent due to rounding. For more information visit MorningConsultIntelligence.com.

244
Morning ConsultTable POLx_4
Table POLx_4: Favorability forMike Pence
Demographic Total Favorable Total UnfavorableHeard Of, NoOpinion Never Heard Of Total N
Registered Voters 38% (758) 46% (916) 11% (228) 5% (97) 1998Gender: Male 44% (413) 41% (390) 8% (77) 6% (61) 942Gender: Female 33% (344) 50% (526) 14% (151) 3% (35) 1056Age: 18-34 25% (131) 40% (204) 21% (108) 14% (71) 514Age: 35-44 37% (113) 47% (146) 11% (34) 5% (14) 307Age: 45-64 41% (277) 48% (329) 9% (63) 1% (9) 679Age: 65+ 48% (237) 48% (238) 4% (22) — (1) 497GenZers: 1997-2012 18% (32) 37% (68) 34% (61) 11% (21) 181Millennials: 1981-1996 32% (169) 44% (234) 13% (68) 12% (63) 534GenXers: 1965-1980 41% (188) 47% (214) 11% (53) 1% (6) 460Baby Boomers: 1946-1964 44% (330) 50% (375) 6% (43) 1% (7) 755PID: Dem (no lean) 17% (127) 68% (520) 9% (66) 6% (47) 759PID: Ind (no lean) 31% (166) 48% (256) 16% (86) 4% (23) 531PID: Rep (no lean) 66% (465) 20% (141) 11% (76) 4% (27) 708PID/Gender: DemMen 26% (86) 59% (192) 5% (15) 10% (34) 328PID/Gender: DemWomen 9% (40) 76% (327) 12% (51) 3% (13) 431PID/Gender: Ind Men 34% (87) 49% (126) 14% (35) 3% (7) 255PID/Gender: Ind Women 28% (79) 47% (130) 19% (52) 6% (16) 276PID/Gender: Rep Men 67% (240) 20% (72) 8% (27) 6% (20) 359PID/Gender: Rep Women 64% (225) 20% (69) 14% (48) 2% (7) 349Ideo: Liberal (1-3) 15% (89) 73% (420) 6% (34) 6% (33) 576Ideo: Moderate (4) 26% (123) 53% (255) 18% (85) 4% (19) 481Ideo: Conservative (5-7) 66% (516) 25% (198) 6% (49) 2% (14) 776Educ: < College 36% (438) 43% (517) 16% (189) 5% (62) 1206Educ: Bachelors degree 40% (200) 49% (246) 5% (26) 6% (30) 501Educ: Post-grad 41% (120) 53% (153) 4% (12) 2% (5) 290Income: Under 50k 31% (270) 44% (381) 19% (163) 6% (55) 868Income: 50k-100k 41% (298) 48% (350) 6% (45) 4% (32) 725Income: 100k+ 47% (189) 46% (186) 5% (20) 2% (10) 405Ethnicity: White 43% (659) 45% (686) 9% (138) 3% (52) 1536Ethnicity: Hispanic 29% (64) 43% (96) 17% (38) 11% (24) 222
Continued on next page

National Tracking Poll #2112154, December, 2021
245
Table POLx_4
Table POLx_4: Favorability forMike Pence
Demographic Total Favorable Total UnfavorableHeard Of, NoOpinion Never Heard Of Total N
Registered Voters 38% (758) 46% (916) 11% (228) 5% (97) 1998Ethnicity: Black 15% (38) 52% (134) 24% (60) 9% (23) 255Ethnicity: Other 29% (60) 47% (96) 14% (30) 10% (21) 207All Christian 49% (495) 41% (415) 7% (70) 2% (22) 1003All Non-Christian 32% (48) 40% (60) 8% (13) 20% (30) 151Atheist 27% (20) 64% (48) 9% (7) — (0) 75Agnostic/Nothing in particular 22% (104) 56% (265) 15% (73) 7% (32) 474Something Else 31% (91) 43% (127) 22% (64) 4% (12) 295Religious Non-Protestant/Catholic 35% (59) 39% (66) 8% (13) 18% (30) 168Evangelical 55% (305) 30% (167) 11% (59) 4% (23) 555Non-Evangelical 37% (266) 51% (362) 11% (75) 2% (11) 715Community: Urban 32% (173) 47% (252) 12% (66) 9% (46) 538Community: Suburban 36% (340) 51% (480) 10% (91) 3% (29) 939Community: Rural 47% (245) 35% (184) 14% (71) 4% (21) 521Employ: Private Sector 41% (278) 48% (328) 9% (59) 3% (22) 687Employ: Government 42% (54) 36% (46) 13% (17) 9% (11) 127Employ: Self-Employed 36% (71) 41% (82) 8% (16) 15% (31) 200Employ: Homemaker 30% (38) 48% (60) 19% (24) 3% (3) 126Employ: Student 19% (12) 49% (30) 25% (15) 7% (4) 61Employ: Retired 46% (241) 49% (257) 4% (21) — (1) 520Employ: Unemployed 20% (30) 46% (69) 27% (41) 6% (10) 150Employ: Other 26% (33) 35% (44) 27% (35) 12% (15) 127Military HH: Yes 42% (145) 44% (153) 11% (38) 3% (12) 348Military HH: No 37% (613) 46% (763) 12% (190) 5% (85) 1650RD/WT: Right Direction 24% (178) 61% (453) 8% (57) 7% (54) 743RD/WT: Wrong Track 46% (579) 37% (463) 14% (170) 3% (42) 1255Biden Job Approve 20% (176) 66% (572) 8% (71) 5% (44) 863Biden Job Disapprove 55% (576) 31% (326) 11% (116) 4% (39) 1057
Continued on next page

246
Morning ConsultTable POLx_4
Table POLx_4: Favorability forMike Pence
Demographic Total Favorable Total UnfavorableHeard Of, NoOpinion Never Heard Of Total N
Registered Voters 38% (758) 46% (916) 11% (228) 5% (97) 1998Biden Job Strongly Approve 24% (101) 61% (259) 6% (27) 9% (38) 424Biden Job Somewhat Approve 17% (75) 72% (314) 10% (43) 1% (6) 438Biden Job Somewhat Disapprove 31% (87) 49% (140) 13% (36) 7% (20) 283Biden Job Strongly Disapprove 63% (490) 24% (186) 10% (79) 2% (18) 774Favorable of Biden 20% (183) 67% (598) 8% (75) 4% (40) 896Unfavorable of Biden 56% (570) 30% (309) 11% (110) 3% (31) 1020Very Favorable of Biden 23% (99) 65% (279) 6% (24) 6% (24) 427Somewhat Favorable of Biden 18% (84) 68% (319) 11% (51) 3% (15) 469Somewhat Unfavorable of Biden 32% (70) 49% (107) 16% (35) 2% (4) 216Very Unfavorable of Biden 62% (500) 25% (203) 9% (75) 3% (26) 804#1 Issue: Economy 45% (385) 37% (317) 13% (109) 5% (47) 858#1 Issue: Security 63% (174) 27% (74) 9% (25) 1% (2) 274#1 Issue: Health Care 24% (54) 61% (139) 11% (24) 4% (10) 227#1 Issue: Medicare / Social Security 33% (64) 61% (119) 5% (10) 1% (3) 196#1 Issue: Women’s Issues 11% (14) 70% (86) 13% (17) 5% (7) 124#1 Issue: Education 20% (16) 51% (40) 24% (19) 5% (4) 80#1 Issue: Energy 17% (21) 58% (70) 10% (12) 15% (18) 121#1 Issue: Other 24% (29) 60% (71) 9% (11) 6% (7) 1182020 Vote: Joe Biden 18% (167) 69% (651) 9% (85) 4% (42) 9462020 Vote: Donald Trump 64% (551) 23% (196) 9% (81) 4% (36) 8642020 Vote: Didn’t Vote 19% (30) 33% (51) 36% (55) 11% (17) 1532018 House Vote: Democrat 18% (127) 74% (527) 7% (49) 2% (11) 7152018 House Vote: Republican 67% (479) 24% (174) 5% (34) 4% (29) 7162018 House Vote: Someone else 26% (18) 36% (24) 31% (21) 6% (4) 672016 Vote: Hillary Clinton 16% (112) 75% (508) 7% (48) 2% (11) 6792016 Vote: Donald Trump 66% (497) 24% (179) 5% (41) 5% (36) 7542016 Vote: Other 29% (27) 58% (55) 12% (12) 2% (1) 962016 Vote: Didn’t Vote 26% (120) 37% (173) 27% (127) 10% (48) 468Voted in 2014: Yes 43% (585) 48% (651) 6% (85) 3% (40) 1360Voted in 2014: No 27% (172) 42% (265) 22% (143) 9% (57) 638
Continued on next page

National Tracking Poll #2112154, December, 2021
247
Table POLx_4
Table POLx_4: Favorability forMike Pence
Demographic Total Favorable Total UnfavorableHeard Of, NoOpinion Never Heard Of Total N
Registered Voters 38% (758) 46% (916) 11% (228) 5% (97) 19984-Region: Northeast 36% (126) 50% (175) 8% (27) 7% (25) 3534-Region: Midwest 38% (169) 46% (204) 14% (63) 2% (9) 4444-Region: South 42% (312) 42% (317) 13% (94) 3% (23) 7464-Region: West 33% (150) 48% (221) 10% (44) 9% (40) 455Party: Democrat/Leans Democrat 17% (148) 69% (609) 9% (79) 5% (47) 883Party: Republican/Leans Republican 65% (544) 22% (186) 10% (84) 3% (27) 841Note: Row proportions may total to larger than one-hundred percent due to rounding. For more information visit MorningConsultIntelligence.com.

248
Morning ConsultTable POLx_5
Table POLx_5: Favorability forDonald Trump
Demographic Total Favorable Total UnfavorableHeard Of, NoOpinion Never Heard Of Total N
Registered Voters 44% (888) 51% (1022) 3% (56) 2% (32) 1998Gender: Male 48% (455) 46% (438) 2% (23) 3% (26) 942Gender: Female 41% (433) 55% (584) 3% (33) 1% (6) 1056Age: 18-34 39% (203) 48% (249) 6% (33) 6% (30) 514Age: 35-44 42% (129) 56% (170) 2% (7) — (0) 307Age: 45-64 49% (334) 49% (333) 2% (11) — (2) 679Age: 65+ 45% (223) 54% (270) 1% (5) — (0) 497GenZers: 1997-2012 30% (53) 54% (98) 11% (20) 5% (9) 181Millennials: 1981-1996 43% (230) 49% (263) 4% (20) 4% (21) 534GenXers: 1965-1980 50% (232) 48% (219) 2% (8) — (2) 460Baby Boomers: 1946-1964 44% (335) 55% (414) 1% (6) — (0) 755PID: Dem (no lean) 13% (101) 81% (617) 2% (15) 3% (26) 759PID: Ind (no lean) 36% (193) 57% (301) 6% (31) 1% (7) 531PID: Rep (no lean) 84% (595) 15% (103) 1% (10) — (0) 708PID/Gender: DemMen 20% (64) 73% (241) 1% (3) 6% (20) 328PID/Gender: DemWomen 8% (36) 87% (377) 3% (13) 1% (6) 431PID/Gender: Ind Men 35% (90) 56% (142) 7% (17) 2% (6) 255PID/Gender: Ind Women 37% (103) 57% (159) 5% (14) — (1) 276PID/Gender: Rep Men 84% (301) 15% (55) 1% (3) — (0) 359PID/Gender: Rep Women 84% (294) 14% (48) 2% (7) — (0) 349Ideo: Liberal (1-3) 15% (86) 81% (464) 1% (8) 3% (18) 576Ideo: Moderate (4) 27% (132) 68% (328) 4% (17) 1% (4) 481Ideo: Conservative (5-7) 78% (603) 21% (163) 1% (7) — (2) 776Educ: < College 49% (589) 46% (554) 4% (49) 1% (14) 1206Educ: Bachelors degree 39% (196) 56% (283) 1% (6) 3% (16) 501Educ: Post-grad 35% (103) 63% (184) 1% (2) 1% (2) 290Income: Under 50k 44% (385) 48% (421) 6% (48) 2% (14) 868Income: 50k-100k 45% (327) 53% (382) 1% (6) 1% (10) 725Income: 100k+ 43% (175) 54% (219) — (2) 2% (9) 405Ethnicity: White 50% (767) 47% (724) 1% (21) 2% (25) 1536Ethnicity: Hispanic 40% (88) 52% (115) 6% (14) 2% (5) 222
Continued on next page

National Tracking Poll #2112154, December, 2021
249
Table POLx_5
Table POLx_5: Favorability forDonald Trump
Demographic Total Favorable Total UnfavorableHeard Of, NoOpinion Never Heard Of Total N
Registered Voters 44% (888) 51% (1022) 3% (56) 2% (32) 1998Ethnicity: Black 17% (44) 76% (195) 6% (15) — (1) 255Ethnicity: Other 37% (77) 50% (103) 10% (20) 3% (7) 207All Christian 51% (510) 48% (482) 1% (10) — (2) 1003All Non-Christian 38% (58) 46% (70) 1% (1) 15% (22) 151Atheist 29% (22) 71% (53) — (0) — (0) 75Agnostic/Nothing in particular 27% (130) 65% (309) 6% (28) 2% (8) 474Something Else 57% (169) 37% (108) 6% (18) — (0) 295Religious Non-Protestant/Catholic 42% (70) 45% (75) 1% (1) 13% (22) 168Evangelical 66% (364) 32% (175) 3% (14) — (1) 555Non-Evangelical 41% (296) 57% (405) 2% (13) — (1) 715Community: Urban 37% (197) 56% (300) 3% (16) 4% (24) 538Community: Suburban 40% (375) 57% (533) 3% (24) 1% (8) 939Community: Rural 61% (316) 36% (189) 3% (16) — (0) 521Employ: Private Sector 42% (291) 55% (379) 1% (10) 1% (7) 687Employ: Government 47% (60) 48% (61) 5% (6) — (0) 127Employ: Self-Employed 50% (100) 43% (86) — (1) 6% (13) 200Employ: Homemaker 57% (71) 37% (46) 5% (7) 1% (2) 126Employ: Student 35% (22) 57% (35) 2% (1) 5% (3) 61Employ: Retired 45% (234) 54% (282) 1% (5) — (0) 520Employ: Unemployed 35% (53) 52% (79) 11% (17) 1% (2) 150Employ: Other 45% (58) 43% (55) 8% (10) 4% (5) 127Military HH: Yes 51% (177) 45% (158) 3% (10) 1% (3) 348Military HH: No 43% (711) 52% (864) 3% (46) 2% (29) 1650RD/WT: Right Direction 18% (136) 76% (563) 2% (16) 4% (28) 743RD/WT: Wrong Track 60% (752) 37% (458) 3% (40) — (4) 1255Biden Job Approve 14% (119) 82% (706) 2% (15) 3% (23) 863Biden Job Disapprove 71% (754) 27% (283) 1% (14) 1% (6) 1057
Continued on next page

250
Morning ConsultTable POLx_5
Table POLx_5: Favorability forDonald Trump
Demographic Total Favorable Total UnfavorableHeard Of, NoOpinion Never Heard Of Total N
Registered Voters 44% (888) 51% (1022) 3% (56) 2% (32) 1998Biden Job Strongly Approve 20% (84) 73% (311) 1% (6) 6% (23) 424Biden Job Somewhat Approve 8% (36) 90% (394) 2% (9) — (0) 438Biden Job Somewhat Disapprove 40% (113) 56% (159) 3% (8) 1% (2) 283Biden Job Strongly Disapprove 83% (641) 16% (124) 1% (5) — (4) 774Favorable of Biden 13% (117) 83% (742) 2% (18) 2% (18) 896Unfavorable of Biden 73% (749) 26% (261) 1% (8) — (2) 1020Very Favorable of Biden 16% (70) 78% (335) 1% (5) 4% (17) 427Somewhat Favorable of Biden 10% (47) 87% (407) 3% (13) — (1) 469Somewhat Unfavorable of Biden 37% (79) 60% (130) 2% (5) 1% (2) 216Very Unfavorable of Biden 83% (670) 16% (131) — (3) — (1) 804#1 Issue: Economy 50% (433) 45% (385) 3% (24) 2% (17) 858#1 Issue: Security 77% (212) 20% (55) 3% (8) — (0) 274#1 Issue: Health Care 32% (72) 66% (149) 2% (5) 1% (2) 227#1 Issue: Medicare / Social Security 30% (58) 68% (133) 2% (5) — (0) 196#1 Issue: Women’s Issues 18% (22) 74% (92) 6% (7) 2% (2) 124#1 Issue: Education 27% (21) 63% (51) 6% (5) 4% (3) 80#1 Issue: Energy 26% (31) 70% (84) 1% (1) 3% (4) 121#1 Issue: Other 33% (39) 62% (73) 1% (2) 4% (5) 1182020 Vote: Joe Biden 9% (85) 87% (821) 2% (15) 3% (25) 9462020 Vote: Donald Trump 86% (744) 12% (104) 1% (12) — (4) 8642020 Vote: Didn’t Vote 34% (51) 49% (75) 15% (23) 2% (3) 1532018 House Vote: Democrat 10% (68) 89% (634) 1% (9) 1% (4) 7152018 House Vote: Republican 82% (585) 17% (124) — (3) 1% (4) 7162018 House Vote: Someone else 25% (16) 69% (46) 2% (2) 4% (2) 672016 Vote: Hillary Clinton 9% (59) 90% (608) 1% (10) — (2) 6792016 Vote: Donald Trump 82% (617) 17% (128) 1% (5) — (4) 7542016 Vote: Other 10% (10) 88% (84) — (0) 1% (1) 962016 Vote: Didn’t Vote 43% (201) 43% (200) 9% (41) 5% (26) 468Voted in 2014: Yes 46% (622) 53% (717) 1% (15) 1% (7) 1360Voted in 2014: No 42% (266) 48% (304) 6% (41) 4% (26) 638
Continued on next page

National Tracking Poll #2112154, December, 2021
251
Table POLx_5
Table POLx_5: Favorability forDonald Trump
Demographic Total Favorable Total UnfavorableHeard Of, NoOpinion Never Heard Of Total N
Registered Voters 44% (888) 51% (1022) 3% (56) 2% (32) 19984-Region: Northeast 39% (136) 56% (197) 1% (3) 5% (17) 3534-Region: Midwest 46% (206) 50% (224) 3% (12) 1% (3) 4444-Region: South 50% (373) 47% (348) 3% (22) — (2) 7464-Region: West 38% (173) 55% (252) 4% (19) 2% (11) 455Party: Democrat/Leans Democrat 12% (108) 83% (733) 2% (16) 3% (26) 883Party: Republican/Leans Republican 83% (695) 16% (132) 2% (14) — (0) 841Note: Row proportions may total to larger than one-hundred percent due to rounding. For more information visit MorningConsultIntelligence.com.

252
Morning ConsultTable POLx_6
Table POLx_6: Favorability forRepublicans in Congress
Demographic Total Favorable Total UnfavorableHeard Of, NoOpinion Never Heard Of Total N
Registered Voters 37% (749) 52% (1035) 7% (148) 3% (66) 1998Gender: Male 40% (377) 50% (471) 5% (50) 5% (44) 942Gender: Female 35% (372) 53% (564) 9% (98) 2% (22) 1056Age: 18-34 33% (169) 41% (213) 16% (82) 10% (51) 514Age: 35-44 37% (113) 52% (158) 9% (26) 3% (9) 307Age: 45-64 39% (267) 55% (376) 5% (31) 1% (6) 679Age: 65+ 40% (201) 58% (288) 2% (9) — (0) 497GenZers: 1997-2012 26% (46) 38% (69) 27% (49) 9% (16) 181Millennials: 1981-1996 36% (191) 47% (249) 9% (51) 8% (43) 534GenXers: 1965-1980 40% (186) 52% (240) 6% (27) 1% (7) 460Baby Boomers: 1946-1964 38% (289) 59% (446) 3% (19) — (0) 755PID: Dem (no lean) 12% (93) 78% (596) 5% (38) 4% (32) 759PID: Ind (no lean) 21% (113) 59% (313) 15% (81) 4% (23) 531PID: Rep (no lean) 77% (542) 18% (127) 4% (29) 1% (10) 708PID/Gender: DemMen 18% (58) 72% (236) 2% (8) 8% (26) 328PID/Gender: DemWomen 8% (35) 83% (360) 7% (30) 1% (6) 431PID/Gender: Ind Men 20% (51) 65% (165) 12% (31) 3% (8) 255PID/Gender: Ind Women 23% (62) 54% (148) 18% (50) 6% (16) 276PID/Gender: Rep Men 75% (268) 20% (70) 3% (11) 3% (10) 359PID/Gender: Rep Women 79% (275) 16% (57) 5% (18) — (0) 349Ideo: Liberal (1-3) 12% (70) 81% (468) 2% (10) 5% (28) 576Ideo: Moderate (4) 23% (110) 63% (305) 13% (60) 1% (6) 481Ideo: Conservative (5-7) 69% (532) 28% (215) 2% (19) 1% (10) 776Educ: < College 40% (478) 47% (565) 10% (126) 3% (37) 1206Educ: Bachelors degree 33% (167) 58% (289) 4% (19) 5% (26) 501Educ: Post-grad 35% (103) 62% (181) 1% (4) 1% (2) 290Income: Under 50k 35% (303) 48% (421) 13% (110) 4% (35) 868Income: 50k-100k 38% (274) 55% (400) 5% (33) 2% (18) 725Income: 100k+ 42% (172) 53% (215) 1% (5) 3% (13) 405Ethnicity: White 42% (651) 50% (773) 5% (69) 3% (43) 1536Ethnicity: Hispanic 36% (80) 49% (109) 10% (21) 5% (12) 222
Continued on next page

National Tracking Poll #2112154, December, 2021
253
Table POLx_6
Table POLx_6: Favorability forRepublicans in Congress
Demographic Total Favorable Total UnfavorableHeard Of, NoOpinion Never Heard Of Total N
Registered Voters 37% (749) 52% (1035) 7% (148) 3% (66) 1998Ethnicity: Black 17% (44) 61% (155) 18% (45) 4% (11) 255Ethnicity: Other 26% (54) 52% (107) 17% (34) 6% (11) 207All Christian 45% (451) 49% (495) 5% (49) 1% (9) 1003All Non-Christian 30% (46) 47% (71) 3% (5) 19% (29) 151Atheist 27% (20) 69% (52) 4% (3) — (0) 75Agnostic/Nothing in particular 21% (101) 63% (298) 13% (62) 3% (14) 474Something Else 44% (131) 41% (120) 10% (30) 5% (14) 295Religious Non-Protestant/Catholic 31% (52) 49% (82) 3% (6) 17% (29) 168Evangelical 60% (333) 33% (182) 5% (30) 2% (10) 555Non-Evangelical 33% (238) 58% (418) 7% (47) 2% (12) 715Community: Urban 31% (169) 54% (292) 7% (39) 7% (37) 538Community: Suburban 33% (314) 58% (547) 6% (59) 2% (18) 939Community: Rural 51% (265) 38% (196) 10% (50) 2% (10) 521Employ: Private Sector 37% (253) 55% (379) 5% (34) 3% (20) 687Employ: Government 41% (52) 48% (61) 11% (13) 1% (1) 127Employ: Self-Employed 34% (68) 47% (94) 8% (15) 11% (23) 200Employ: Homemaker 46% (57) 44% (55) 7% (9) 4% (5) 126Employ: Student 36% (22) 34% (21) 22% (13) 8% (5) 61Employ: Retired 41% (213) 57% (297) 2% (10) — (0) 520Employ: Unemployed 30% (45) 49% (73) 19% (29) 2% (3) 150Employ: Other 31% (39) 44% (56) 19% (24) 6% (8) 127Military HH: Yes 46% (158) 48% (168) 4% (14) 2% (7) 348Military HH: No 36% (591) 53% (867) 8% (134) 4% (59) 1650RD/WT: Right Direction 19% (140) 70% (522) 5% (40) 6% (42) 743RD/WT: Wrong Track 49% (609) 41% (514) 9% (108) 2% (24) 1255Biden Job Approve 15% (130) 75% (651) 5% (42) 5% (39) 863Biden Job Disapprove 58% (613) 34% (358) 7% (72) 1% (14) 1057
Continued on next page

254
Morning ConsultTable POLx_6
Table POLx_6: Favorability forRepublicans in Congress
Demographic Total Favorable Total UnfavorableHeard Of, NoOpinion Never Heard Of Total N
Registered Voters 37% (749) 52% (1035) 7% (148) 3% (66) 1998Biden Job Strongly Approve 20% (84) 70% (299) 3% (11) 7% (31) 424Biden Job Somewhat Approve 11% (47) 80% (352) 7% (31) 2% (8) 438Biden Job Somewhat Disapprove 34% (98) 52% (147) 12% (35) 1% (4) 283Biden Job Strongly Disapprove 67% (516) 27% (211) 5% (37) 1% (10) 774Favorable of Biden 15% (137) 77% (688) 5% (44) 3% (27) 896Unfavorable of Biden 59% (601) 33% (335) 7% (72) 1% (12) 1020Very Favorable of Biden 17% (72) 77% (328) 1% (6) 5% (21) 427Somewhat Favorable of Biden 14% (65) 77% (360) 8% (39) 1% (5) 469Somewhat Unfavorable of Biden 30% (65) 52% (113) 17% (36) 1% (2) 216Very Unfavorable of Biden 67% (536) 28% (222) 5% (36) 1% (10) 804#1 Issue: Economy 42% (359) 46% (396) 9% (75) 3% (28) 858#1 Issue: Security 65% (179) 29% (79) 5% (14) 1% (2) 274#1 Issue: Health Care 25% (57) 66% (150) 6% (14) 3% (6) 227#1 Issue: Medicare / Social Security 28% (55) 68% (133) 2% (4) 2% (3) 196#1 Issue: Women’s Issues 12% (15) 71% (88) 10% (12) 6% (8) 124#1 Issue: Education 27% (22) 45% (36) 24% (20) 4% (3) 80#1 Issue: Energy 28% (34) 63% (76) 4% (4) 5% (6) 121#1 Issue: Other 23% (28) 66% (77) 4% (4) 7% (9) 1182020 Vote: Joe Biden 11% (108) 80% (753) 5% (51) 4% (34) 9462020 Vote: Donald Trump 69% (597) 24% (211) 5% (41) 2% (14) 8642020 Vote: Didn’t Vote 25% (38) 33% (50) 32% (49) 11% (17) 1532018 House Vote: Democrat 10% (71) 85% (611) 4% (25) 1% (8) 7152018 House Vote: Republican 71% (510) 24% (170) 3% (23) 2% (13) 7162018 House Vote: Someone else 21% (14) 47% (32) 25% (17) 6% (4) 672016 Vote: Hillary Clinton 10% (69) 85% (579) 3% (23) 1% (8) 6792016 Vote: Donald Trump 69% (519) 25% (189) 4% (27) 2% (19) 7542016 Vote: Other 13% (12) 80% (76) 7% (7) 1% (1) 962016 Vote: Didn’t Vote 32% (148) 41% (190) 19% (91) 8% (38) 468Voted in 2014: Yes 40% (546) 55% (746) 4% (48) 2% (20) 1360Voted in 2014: No 32% (203) 45% (290) 16% (100) 7% (45) 638
Continued on next page

National Tracking Poll #2112154, December, 2021
255
Table POLx_6
Table POLx_6: Favorability forRepublicans in Congress
Demographic Total Favorable Total UnfavorableHeard Of, NoOpinion Never Heard Of Total N
Registered Voters 37% (749) 52% (1035) 7% (148) 3% (66) 19984-Region: Northeast 31% (108) 55% (195) 7% (23) 7% (26) 3534-Region: Midwest 38% (170) 52% (232) 8% (36) 1% (6) 4444-Region: South 44% (329) 47% (349) 7% (55) 2% (13) 7464-Region: West 31% (141) 57% (260) 7% (34) 4% (20) 455Party: Democrat/Leans Democrat 11% (100) 80% (707) 5% (43) 4% (33) 883Party: Republican/Leans Republican 72% (610) 21% (180) 5% (41) 1% (10) 841Note: Row proportions may total to larger than one-hundred percent due to rounding. For more information visit MorningConsultIntelligence.com.

256
Morning ConsultTable POLx_7
Table POLx_7: Favorability forDemocrats in Congress
Demographic Total Favorable Total UnfavorableHeard Of, NoOpinion Never Heard Of Total N
Registered Voters 41% (827) 49% (980) 7% (131) 3% (60) 1998Gender: Male 40% (376) 52% (492) 4% (39) 4% (35) 942Gender: Female 43% (451) 46% (489) 9% (92) 2% (24) 1056Age: 18-34 43% (219) 36% (184) 13% (66) 9% (45) 514Age: 35-44 48% (148) 39% (121) 10% (29) 3% (9) 307Age: 45-64 37% (249) 59% (398) 4% (27) 1% (6) 679Age: 65+ 43% (212) 56% (278) 2% (8) — (0) 497GenZers: 1997-2012 31% (56) 36% (65) 22% (39) 11% (21) 181Millennials: 1981-1996 51% (270) 35% (184) 9% (47) 6% (32) 534GenXers: 1965-1980 37% (171) 56% (259) 5% (23) 1% (6) 460Baby Boomers: 1946-1964 40% (302) 57% (433) 3% (19) — (1) 755PID: Dem (no lean) 83% (628) 11% (82) 3% (25) 3% (24) 759PID: Ind (no lean) 26% (140) 55% (294) 13% (72) 5% (25) 531PID: Rep (no lean) 8% (59) 85% (604) 5% (34) 2% (11) 708PID/Gender: DemMen 83% (272) 11% (37) 1% (3) 5% (17) 328PID/Gender: DemWomen 83% (356) 11% (45) 5% (22) 2% (7) 431PID/Gender: Ind Men 25% (65) 61% (154) 10% (26) 4% (10) 255PID/Gender: Ind Women 27% (76) 51% (140) 17% (46) 5% (15) 276PID/Gender: Rep Men 11% (40) 84% (301) 3% (10) 2% (8) 359PID/Gender: Rep Women 5% (19) 87% (303) 7% (24) 1% (3) 349Ideo: Liberal (1-3) 79% (457) 17% (97) 1% (7) 3% (15) 576Ideo: Moderate (4) 46% (222) 41% (199) 11% (52) 2% (8) 481Ideo: Conservative (5-7) 14% (109) 82% (635) 3% (21) 1% (12) 776Educ: < College 36% (431) 52% (621) 9% (110) 4% (43) 1206Educ: Bachelors degree 48% (239) 47% (235) 3% (14) 3% (14) 501Educ: Post-grad 54% (157) 43% (124) 2% (7) 1% (2) 290Income: Under 50k 40% (350) 45% (389) 11% (93) 4% (36) 868Income: 50k-100k 43% (314) 51% (367) 4% (29) 2% (15) 725Income: 100k+ 40% (163) 55% (224) 2% (9) 2% (9) 405Ethnicity: White 39% (594) 55% (840) 4% (69) 2% (34) 1536Ethnicity: Hispanic 48% (107) 36% (80) 11% (24) 5% (12) 222
Continued on next page

National Tracking Poll #2112154, December, 2021
257
Table POLx_7
Table POLx_7: Favorability forDemocrats in Congress
Demographic Total Favorable Total UnfavorableHeard Of, NoOpinion Never Heard Of Total N
Registered Voters 41% (827) 49% (980) 7% (131) 3% (60) 1998Ethnicity: Black 64% (163) 18% (45) 12% (30) 6% (17) 255Ethnicity: Other 34% (71) 46% (95) 16% (32) 4% (9) 207All Christian 40% (397) 55% (551) 4% (44) 1% (10) 1003All Non-Christian 58% (87) 26% (39) 3% (4) 14% (21) 151Atheist 50% (38) 43% (33) 6% (5) — (0) 75Agnostic/Nothing in particular 46% (217) 40% (189) 11% (51) 4% (17) 474Something Else 30% (87) 57% (168) 9% (27) 4% (12) 295Religious Non-Protestant/Catholic 53% (89) 32% (54) 3% (4) 12% (21) 168Evangelical 30% (169) 62% (345) 5% (27) 2% (14) 555Non-Evangelical 43% (307) 50% (356) 6% (43) 1% (9) 715Community: Urban 55% (296) 33% (180) 6% (34) 5% (27) 538Community: Suburban 41% (383) 52% (485) 6% (54) 2% (17) 939Community: Rural 28% (148) 60% (315) 8% (43) 3% (16) 521Employ: Private Sector 45% (311) 48% (333) 5% (31) 2% (12) 687Employ: Government 35% (44) 55% (69) 10% (12) 1% (1) 127Employ: Self-Employed 44% (89) 38% (77) 6% (13) 11% (22) 200Employ: Homemaker 28% (35) 64% (81) 7% (9) 1% (2) 126Employ: Student 38% (23) 41% (25) 17% (10) 4% (3) 61Employ: Retired 42% (219) 56% (290) 2% (11) — (1) 520Employ: Unemployed 45% (67) 34% (51) 15% (22) 6% (10) 150Employ: Other 31% (40) 43% (54) 18% (24) 8% (10) 127Military HH: Yes 38% (133) 55% (191) 5% (17) 2% (6) 348Military HH: No 42% (694) 48% (789) 7% (114) 3% (53) 1650RD/WT: Right Direction 80% (595) 11% (80) 4% (32) 5% (36) 743RD/WT: Wrong Track 18% (232) 72% (900) 8% (99) 2% (24) 1255Biden Job Approve 83% (717) 10% (85) 4% (33) 3% (28) 863Biden Job Disapprove 9% (94) 83% (880) 7% (71) 1% (12) 1057
Continued on next page

258
Morning ConsultTable POLx_7
Table POLx_7: Favorability forDemocrats in Congress
Demographic Total Favorable Total UnfavorableHeard Of, NoOpinion Never Heard Of Total N
Registered Voters 41% (827) 49% (980) 7% (131) 3% (60) 1998Biden Job Strongly Approve 91% (384) 3% (12) 1% (5) 5% (23) 424Biden Job Somewhat Approve 76% (333) 17% (73) 6% (28) 1% (5) 438Biden Job Somewhat Disapprove 23% (66) 66% (186) 10% (29) 1% (3) 283Biden Job Strongly Disapprove 4% (29) 90% (694) 5% (42) 1% (9) 774Favorable of Biden 84% (752) 11% (97) 4% (34) 2% (14) 896Unfavorable of Biden 6% (65) 86% (875) 7% (70) 1% (11) 1020Very Favorable of Biden 94% (403) 3% (12) 1% (3) 2% (10) 427Somewhat Favorable of Biden 74% (349) 18% (85) 7% (31) 1% (4) 469Somewhat Unfavorable of Biden 18% (38) 67% (146) 14% (31) 1% (1) 216Very Unfavorable of Biden 3% (26) 91% (729) 5% (39) 1% (9) 804#1 Issue: Economy 35% (298) 55% (473) 7% (60) 3% (27) 858#1 Issue: Security 14% (37) 79% (217) 7% (18) 1% (2) 274#1 Issue: Health Care 64% (147) 27% (62) 7% (16) 1% (3) 227#1 Issue: Medicare / Social Security 57% (112) 39% (77) 2% (4) 2% (3) 196#1 Issue: Women’s Issues 61% (75) 25% (31) 6% (8) 8% (10) 124#1 Issue: Education 48% (38) 31% (25) 19% (15) 2% (2) 80#1 Issue: Energy 55% (66) 37% (45) 4% (4) 5% (6) 121#1 Issue: Other 46% (54) 43% (51) 4% (5) 7% (8) 1182020 Vote: Joe Biden 76% (721) 18% (166) 4% (42) 2% (17) 9462020 Vote: Donald Trump 8% (68) 85% (732) 5% (46) 2% (18) 8642020 Vote: Didn’t Vote 23% (35) 37% (56) 24% (37) 16% (25) 1532018 House Vote: Democrat 81% (579) 16% (116) 2% (13) 1% (6) 7152018 House Vote: Republican 10% (72) 84% (598) 4% (28) 2% (17) 7162018 House Vote: Someone else 14% (9) 57% (38) 24% (16) 5% (3) 672016 Vote: Hillary Clinton 83% (561) 13% (91) 3% (23) 1% (5) 6792016 Vote: Donald Trump 10% (73) 83% (626) 4% (32) 3% (23) 7542016 Vote: Other 35% (33) 60% (58) 5% (5) — (0) 962016 Vote: Didn’t Vote 34% (159) 44% (205) 15% (71) 7% (32) 468Voted in 2014: Yes 45% (607) 51% (688) 3% (43) 2% (23) 1360Voted in 2014: No 35% (220) 46% (292) 14% (88) 6% (37) 638
Continued on next page

National Tracking Poll #2112154, December, 2021
259
Table POLx_7
Table POLx_7: Favorability forDemocrats in Congress
Demographic Total Favorable Total UnfavorableHeard Of, NoOpinion Never Heard Of Total N
Registered Voters 41% (827) 49% (980) 7% (131) 3% (60) 19984-Region: Northeast 50% (178) 39% (138) 6% (21) 4% (16) 3534-Region: Midwest 37% (165) 52% (232) 9% (40) 2% (8) 4444-Region: South 35% (260) 58% (432) 5% (41) 2% (13) 7464-Region: West 49% (224) 39% (178) 7% (30) 5% (23) 455Party: Democrat/Leans Democrat 81% (713) 13% (114) 3% (31) 3% (24) 883Party: Republican/Leans Republican 8% (67) 86% (720) 5% (44) 1% (11) 841Note: Row proportions may total to larger than one-hundred percent due to rounding. For more information visit MorningConsultIntelligence.com.

260
Morning ConsultTable POLx_9
Table POLx_9: Favorability forKevin McCarthy
Demographic Total Favorable Total UnfavorableHeard Of, NoOpinion Never Heard Of Total N
Registered Voters 24% (479) 37% (730) 22% (435) 18% (354) 1998Gender: Male 32% (303) 37% (350) 17% (164) 13% (124) 942Gender: Female 17% (176) 36% (380) 26% (271) 22% (230) 1056Age: 18-34 17% (86) 22% (112) 25% (128) 37% (189) 514Age: 35-44 26% (80) 31% (96) 22% (67) 21% (64) 307Age: 45-64 26% (173) 40% (275) 22% (148) 12% (83) 679Age: 65+ 28% (139) 50% (247) 18% (92) 4% (19) 497GenZers: 1997-2012 9% (16) 14% (26) 30% (54) 47% (84) 181Millennials: 1981-1996 23% (123) 28% (148) 23% (121) 26% (140) 534GenXers: 1965-1980 22% (101) 34% (155) 25% (114) 20% (91) 460Baby Boomers: 1946-1964 28% (215) 49% (370) 18% (133) 5% (38) 755PID: Dem (no lean) 17% (128) 48% (367) 18% (134) 17% (130) 759PID: Ind (no lean) 15% (80) 39% (208) 26% (136) 20% (107) 531PID: Rep (no lean) 38% (271) 22% (155) 23% (165) 16% (117) 708PID/Gender: DemMen 27% (89) 44% (146) 16% (52) 13% (42) 328PID/Gender: DemWomen 9% (39) 51% (221) 19% (82) 21% (89) 431PID/Gender: Ind Men 17% (44) 48% (122) 21% (54) 14% (35) 255PID/Gender: Ind Women 13% (36) 31% (85) 30% (82) 26% (73) 276PID/Gender: Rep Men 48% (171) 23% (82) 16% (58) 13% (48) 359PID/Gender: Rep Women 29% (100) 21% (74) 31% (107) 20% (69) 349Ideo: Liberal (1-3) 13% (77) 54% (312) 18% (102) 15% (85) 576Ideo: Moderate (4) 14% (69) 43% (207) 24% (114) 19% (91) 481Ideo: Conservative (5-7) 42% (325) 24% (188) 21% (164) 13% (99) 776Educ: < College 22% (261) 32% (392) 26% (309) 20% (244) 1206Educ: Bachelors degree 27% (137) 40% (199) 17% (83) 17% (83) 501Educ: Post-grad 28% (81) 48% (139) 15% (43) 9% (27) 290Income: Under 50k 19% (168) 33% (285) 25% (221) 22% (194) 868Income: 50k-100k 25% (183) 39% (280) 21% (154) 15% (108) 725Income: 100k+ 32% (128) 41% (165) 15% (60) 13% (52) 405Ethnicity: White 26% (396) 38% (588) 22% (336) 14% (216) 1536Ethnicity: Hispanic 22% (49) 35% (79) 22% (49) 21% (46) 222
Continued on next page

National Tracking Poll #2112154, December, 2021
261
Table POLx_9
Table POLx_9: Favorability forKevin McCarthy
Demographic Total Favorable Total UnfavorableHeard Of, NoOpinion Never Heard Of Total N
Registered Voters 24% (479) 37% (730) 22% (435) 18% (354) 1998Ethnicity: Black 19% (49) 31% (78) 20% (51) 30% (78) 255Ethnicity: Other 17% (34) 31% (64) 23% (49) 29% (60) 207All Christian 31% (306) 38% (384) 21% (212) 10% (100) 1003All Non-Christian 31% (47) 32% (48) 10% (16) 26% (40) 151Atheist 13% (10) 47% (35) 20% (15) 20% (15) 75Agnostic/Nothing in particular 12% (55) 40% (189) 25% (118) 24% (113) 474Something Else 21% (61) 25% (73) 25% (74) 29% (87) 295Religious Non-Protestant/Catholic 29% (49) 32% (55) 13% (21) 26% (43) 168Evangelical 36% (202) 26% (146) 21% (114) 17% (93) 555Non-Evangelical 23% (163) 42% (298) 23% (165) 12% (89) 715Community: Urban 27% (147) 33% (177) 18% (94) 22% (119) 538Community: Suburban 20% (184) 43% (401) 23% (218) 14% (136) 939Community: Rural 28% (148) 29% (152) 24% (123) 19% (99) 521Employ: Private Sector 27% (183) 40% (271) 20% (135) 14% (97) 687Employ: Government 24% (30) 28% (35) 32% (41) 16% (20) 127Employ: Self-Employed 24% (48) 32% (64) 15% (29) 29% (59) 200Employ: Homemaker 22% (28) 34% (43) 27% (34) 17% (22) 126Employ: Student 12% (7) 11% (7) 30% (18) 48% (29) 61Employ: Retired 30% (156) 44% (229) 21% (109) 5% (26) 520Employ: Unemployed 9% (13) 30% (46) 27% (41) 34% (51) 150Employ: Other 11% (15) 27% (35) 22% (28) 40% (50) 127Military HH: Yes 32% (112) 32% (112) 24% (84) 11% (40) 348Military HH: No 22% (367) 37% (618) 21% (351) 19% (314) 1650RD/WT: Right Direction 20% (148) 49% (361) 18% (136) 13% (99) 743RD/WT: Wrong Track 26% (331) 29% (369) 24% (300) 20% (255) 1255Biden Job Approve 17% (145) 52% (446) 18% (151) 14% (121) 863Biden Job Disapprove 32% (333) 26% (273) 24% (256) 18% (194) 1057
Continued on next page
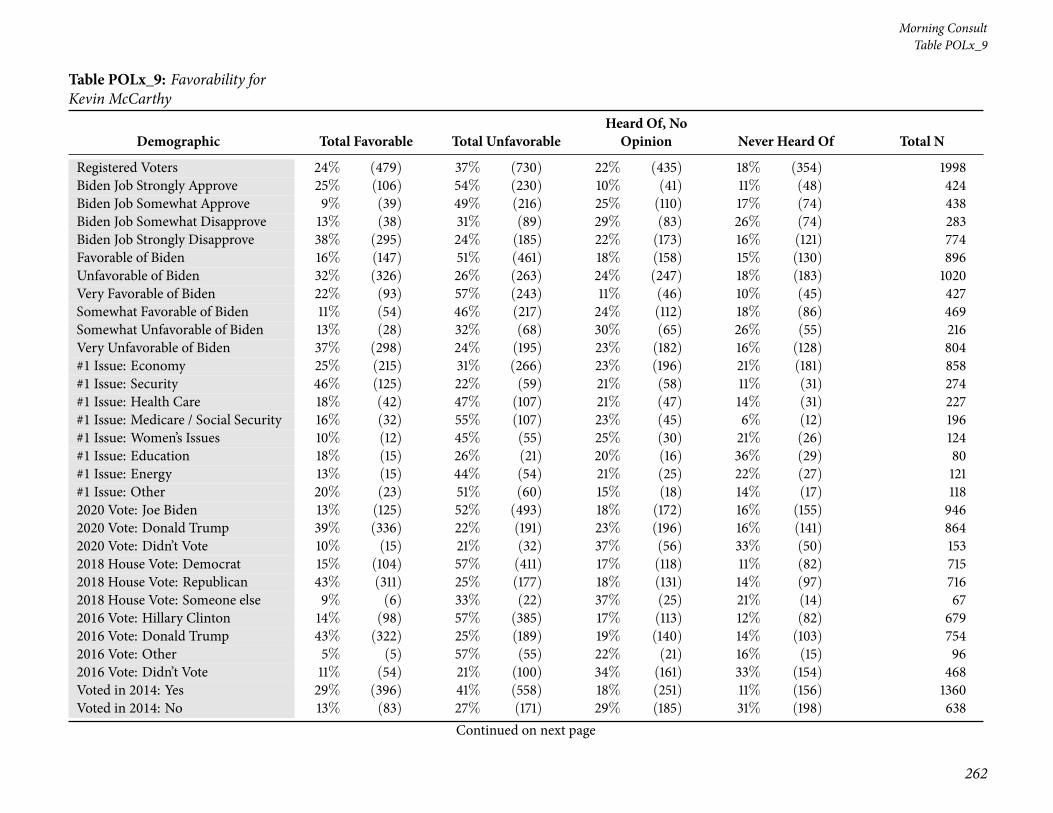
262
Morning ConsultTable POLx_9
Table POLx_9: Favorability forKevin McCarthy
Demographic Total Favorable Total UnfavorableHeard Of, NoOpinion Never Heard Of Total N
Registered Voters 24% (479) 37% (730) 22% (435) 18% (354) 1998Biden Job Strongly Approve 25% (106) 54% (230) 10% (41) 11% (48) 424Biden Job Somewhat Approve 9% (39) 49% (216) 25% (110) 17% (74) 438Biden Job Somewhat Disapprove 13% (38) 31% (89) 29% (83) 26% (74) 283Biden Job Strongly Disapprove 38% (295) 24% (185) 22% (173) 16% (121) 774Favorable of Biden 16% (147) 51% (461) 18% (158) 15% (130) 896Unfavorable of Biden 32% (326) 26% (263) 24% (247) 18% (183) 1020Very Favorable of Biden 22% (93) 57% (243) 11% (46) 10% (45) 427Somewhat Favorable of Biden 11% (54) 46% (217) 24% (112) 18% (86) 469Somewhat Unfavorable of Biden 13% (28) 32% (68) 30% (65) 26% (55) 216Very Unfavorable of Biden 37% (298) 24% (195) 23% (182) 16% (128) 804#1 Issue: Economy 25% (215) 31% (266) 23% (196) 21% (181) 858#1 Issue: Security 46% (125) 22% (59) 21% (58) 11% (31) 274#1 Issue: Health Care 18% (42) 47% (107) 21% (47) 14% (31) 227#1 Issue: Medicare / Social Security 16% (32) 55% (107) 23% (45) 6% (12) 196#1 Issue: Women’s Issues 10% (12) 45% (55) 25% (30) 21% (26) 124#1 Issue: Education 18% (15) 26% (21) 20% (16) 36% (29) 80#1 Issue: Energy 13% (15) 44% (54) 21% (25) 22% (27) 121#1 Issue: Other 20% (23) 51% (60) 15% (18) 14% (17) 1182020 Vote: Joe Biden 13% (125) 52% (493) 18% (172) 16% (155) 9462020 Vote: Donald Trump 39% (336) 22% (191) 23% (196) 16% (141) 8642020 Vote: Didn’t Vote 10% (15) 21% (32) 37% (56) 33% (50) 1532018 House Vote: Democrat 15% (104) 57% (411) 17% (118) 11% (82) 7152018 House Vote: Republican 43% (311) 25% (177) 18% (131) 14% (97) 7162018 House Vote: Someone else 9% (6) 33% (22) 37% (25) 21% (14) 672016 Vote: Hillary Clinton 14% (98) 57% (385) 17% (113) 12% (82) 6792016 Vote: Donald Trump 43% (322) 25% (189) 19% (140) 14% (103) 7542016 Vote: Other 5% (5) 57% (55) 22% (21) 16% (15) 962016 Vote: Didn’t Vote 11% (54) 21% (100) 34% (161) 33% (154) 468Voted in 2014: Yes 29% (396) 41% (558) 18% (251) 11% (156) 1360Voted in 2014: No 13% (83) 27% (171) 29% (185) 31% (198) 638
Continued on next page

National Tracking Poll #2112154, December, 2021
263
Table POLx_9
Table POLx_9: Favorability forKevin McCarthy
Demographic Total Favorable Total UnfavorableHeard Of, NoOpinion Never Heard Of Total N
Registered Voters 24% (479) 37% (730) 22% (435) 18% (354) 19984-Region: Northeast 25% (88) 39% (137) 17% (61) 19% (66) 3534-Region: Midwest 21% (91) 38% (167) 25% (113) 16% (73) 4444-Region: South 26% (192) 32% (240) 24% (180) 18% (134) 7464-Region: West 24% (108) 41% (184) 18% (81) 18% (82) 455Party: Democrat/Leans Democrat 16% (140) 49% (435) 17% (154) 17% (154) 883Party: Republican/Leans Republican 38% (319) 22% (185) 24% (201) 16% (136) 841Note: Row proportions may total to larger than one-hundred percent due to rounding. For more information visit MorningConsultIntelligence.com.

264
Morning ConsultTable POLx_10
Table POLx_10: Favorability forJoe Biden
Demographic Total Favorable Total UnfavorableHeard Of, NoOpinion Never Heard Of Total N
Registered Voters 45% (896) 51% (1020) 3% (55) 1% (27) 1998Gender: Male 43% (407) 52% (488) 2% (22) 3% (26) 942Gender: Female 46% (489) 50% (532) 3% (33) — (2) 1056Age: 18-34 46% (237) 43% (221) 7% (34) 4% (22) 514Age: 35-44 50% (152) 45% (139) 4% (11) 1% (4) 307Age: 45-64 41% (281) 57% (389) 1% (8) — (1) 679Age: 65+ 45% (225) 54% (270) — (2) — (0) 497GenZers: 1997-2012 35% (63) 46% (82) 16% (30) 3% (6) 181Millennials: 1981-1996 53% (282) 41% (218) 3% (14) 4% (20) 534GenXers: 1965-1980 41% (188) 58% (266) 1% (6) — (1) 460Baby Boomers: 1946-1964 45% (337) 55% (412) 1% (6) — (0) 755PID: Dem (no lean) 84% (641) 12% (88) 2% (16) 2% (15) 759PID: Ind (no lean) 35% (186) 59% (312) 5% (28) 1% (5) 531PID: Rep (no lean) 10% (69) 88% (620) 2% (11) 1% (7) 708PID/Gender: DemMen 84% (275) 12% (40) — (1) 4% (13) 328PID/Gender: DemWomen 85% (367) 11% (48) 3% (14) — (2) 431PID/Gender: Ind Men 32% (82) 60% (152) 6% (16) 2% (5) 255PID/Gender: Ind Women 38% (104) 58% (159) 4% (12) — (0) 276PID/Gender: Rep Men 14% (50) 82% (296) 1% (5) 2% (7) 359PID/Gender: Rep Women 5% (19) 93% (325) 2% (6) — (0) 349Ideo: Liberal (1-3) 82% (470) 15% (85) 2% (11) 2% (10) 576Ideo: Moderate (4) 55% (263) 42% (204) 3% (13) — (1) 481Ideo: Conservative (5-7) 15% (115) 83% (646) 1% (6) 1% (9) 776Educ: < College 39% (466) 56% (680) 4% (46) 1% (14) 1206Educ: Bachelors degree 51% (257) 45% (226) 1% (6) 3% (13) 501Educ: Post-grad 60% (173) 39% (114) 1% (3) — (0) 290Income: Under 50k 44% (379) 49% (429) 5% (45) 2% (16) 868Income: 50k-100k 45% (324) 54% (388) 1% (6) 1% (7) 725Income: 100k+ 48% (194) 50% (203) 1% (4) 1% (4) 405Ethnicity: White 41% (628) 56% (865) 1% (20) 2% (23) 1536Ethnicity: Hispanic 52% (115) 38% (85) 6% (14) 3% (8) 222
Continued on next page

National Tracking Poll #2112154, December, 2021
265
Table POLx_10
Table POLx_10: Favorability forJoe Biden
Demographic Total Favorable Total UnfavorableHeard Of, NoOpinion Never Heard Of Total N
Registered Voters 45% (896) 51% (1020) 3% (55) 1% (27) 1998Ethnicity: Black 67% (170) 24% (61) 8% (21) 1% (2) 255Ethnicity: Other 47% (98) 45% (94) 7% (14) 1% (2) 207All Christian 44% (437) 55% (554) 1% (8) — (4) 1003All Non-Christian 64% (96) 26% (39) — (0) 10% (16) 151Atheist 52% (39) 47% (35) 1% (1) — (0) 75Agnostic/Nothing in particular 49% (235) 42% (199) 7% (33) 2% (7) 474Something Else 30% (89) 65% (192) 5% (14) — (0) 295Religious Non-Protestant/Catholic 59% (99) 32% (53) — (0) 9% (16) 168Evangelical 32% (179) 65% (358) 2% (13) 1% (4) 555Non-Evangelical 47% (339) 51% (367) 1% (8) — (0) 715Community: Urban 58% (312) 36% (196) 3% (15) 3% (15) 538Community: Suburban 45% (427) 51% (481) 2% (23) 1% (8) 939Community: Rural 30% (157) 66% (343) 3% (17) 1% (4) 521Employ: Private Sector 49% (334) 49% (336) 1% (9) 1% (8) 687Employ: Government 37% (47) 57% (73) 5% (6) 1% (1) 127Employ: Self-Employed 49% (99) 44% (87) 2% (3) 6% (11) 200Employ: Homemaker 33% (42) 65% (82) 2% (2) — (0) 126Employ: Student 42% (25) 53% (32) 4% (3) 1% (1) 61Employ: Retired 46% (238) 54% (280) — (2) — (0) 520Employ: Unemployed 43% (64) 41% (62) 16% (23) — (1) 150Employ: Other 37% (47) 54% (69) 5% (7) 4% (5) 127Military HH: Yes 39% (137) 57% (197) 3% (9) 1% (4) 348Military HH: No 46% (759) 50% (823) 3% (46) 1% (23) 1650RD/WT: Right Direction 90% (668) 6% (46) 1% (6) 3% (23) 743RD/WT: Wrong Track 18% (228) 78% (974) 4% (48) — (5) 1255Biden Job Approve 95% (820) 2% (21) 1% (5) 2% (17) 863Biden Job Disapprove 5% (51) 93% (986) 1% (15) — (5) 1057
Continued on next page

266
Morning ConsultTable POLx_10
Table POLx_10: Favorability forJoe Biden
Demographic Total Favorable Total UnfavorableHeard Of, NoOpinion Never Heard Of Total N
Registered Voters 45% (896) 51% (1020) 3% (55) 1% (27) 1998Biden Job Strongly Approve 94% (399) 2% (7) — (2) 4% (17) 424Biden Job Somewhat Approve 96% (421) 3% (14) 1% (3) — (0) 438Biden Job Somewhat Disapprove 15% (42) 82% (232) 3% (9) — (0) 283Biden Job Strongly Disapprove 1% (9) 97% (754) 1% (6) 1% (5) 774Favorable of Biden 100% (896) — (0) — (0) — (0) 896Unfavorable of Biden — (0) 100% (1020) — (0) — (0) 1020Very Favorable of Biden 100% (427) — (0) — (0) — (0) 427Somewhat Favorable of Biden 100% (469) — (0) — (0) — (0) 469Somewhat Unfavorable of Biden — (0) 100% (216) — (0) — (0) 216Very Unfavorable of Biden — (0) 100% (804) — (0) — (0) 804#1 Issue: Economy 36% (310) 60% (517) 3% (23) 1% (8) 858#1 Issue: Security 15% (40) 83% (227) 2% (7) — (0) 274#1 Issue: Health Care 69% (157) 27% (62) 2% (4) 2% (4) 227#1 Issue: Medicare / Social Security 61% (119) 38% (75) 1% (2) — (1) 196#1 Issue: Women’s Issues 64% (79) 26% (33) 6% (8) 3% (4) 124#1 Issue: Education 61% (49) 29% (23) 9% (7) 1% (1) 80#1 Issue: Energy 67% (81) 27% (33) 2% (2) 4% (5) 121#1 Issue: Other 52% (61) 42% (50) 2% (2) 4% (5) 1182020 Vote: Joe Biden 84% (791) 14% (129) 2% (18) 1% (8) 9462020 Vote: Donald Trump 6% (53) 91% (786) 1% (9) 2% (16) 8642020 Vote: Didn’t Vote 29% (44) 53% (80) 17% (26) 2% (3) 1532018 House Vote: Democrat 87% (619) 12% (88) 1% (4) — (3) 7152018 House Vote: Republican 11% (75) 86% (617) 1% (9) 2% (15) 7162018 House Vote: Someone else 30% (20) 62% (41) 8% (6) — (0) 672016 Vote: Hillary Clinton 88% (600) 11% (72) 1% (5) — (1) 6792016 Vote: Donald Trump 10% (74) 87% (654) 1% (10) 2% (16) 7542016 Vote: Other 48% (46) 49% (47) 2% (2) — (0) 962016 Vote: Didn’t Vote 37% (175) 53% (246) 8% (38) 2% (10) 468Voted in 2014: Yes 47% (644) 51% (688) 1% (11) 1% (17) 1360Voted in 2014: No 40% (252) 52% (332) 7% (43) 2% (10) 638
Continued on next page

National Tracking Poll #2112154, December, 2021
267
Table POLx_10
Table POLx_10: Favorability forJoe Biden
Demographic Total Favorable Total UnfavorableHeard Of, NoOpinion Never Heard Of Total N
Registered Voters 45% (896) 51% (1020) 3% (55) 1% (27) 19984-Region: Northeast 54% (192) 42% (147) 1% (3) 3% (10) 3534-Region: Midwest 40% (177) 58% (258) 2% (10) — (1) 4444-Region: South 37% (277) 59% (439) 4% (29) — (1) 7464-Region: West 55% (251) 39% (176) 3% (13) 3% (15) 455Party: Democrat/Leans Democrat 83% (735) 13% (117) 2% (16) 2% (15) 883Party: Republican/Leans Republican 10% (82) 88% (738) 2% (13) 1% (7) 841Note: Row proportions may total to larger than one-hundred percent due to rounding. For more information visit MorningConsultIntelligence.com.

268
Morning ConsultTable POLx_11
Table POLx_11: Favorability forKamala Harris
Demographic Total Favorable Total UnfavorableHeard Of, NoOpinion Never Heard Of Total N
Registered Voters 40% (800) 50% (1006) 6% (126) 3% (65) 1998Gender: Male 38% (361) 53% (496) 5% (45) 4% (40) 942Gender: Female 42% (440) 48% (511) 8% (81) 2% (25) 1056Age: 18-34 42% (215) 37% (189) 12% (60) 10% (50) 514Age: 35-44 50% (153) 38% (118) 9% (27) 3% (9) 307Age: 45-64 36% (244) 59% (399) 4% (30) 1% (7) 679Age: 65+ 38% (188) 60% (300) 2% (9) — (0) 497GenZers: 1997-2012 33% (59) 32% (58) 24% (43) 11% (20) 181Millennials: 1981-1996 49% (263) 37% (200) 6% (33) 7% (38) 534GenXers: 1965-1980 37% (172) 56% (257) 5% (25) 2% (7) 460Baby Boomers: 1946-1964 37% (278) 60% (451) 3% (26) — (0) 755PID: Dem (no lean) 77% (586) 14% (109) 6% (47) 2% (17) 759PID: Ind (no lean) 30% (159) 56% (299) 9% (49) 4% (24) 531PID: Rep (no lean) 8% (56) 84% (597) 4% (31) 3% (24) 708PID/Gender: DemMen 76% (249) 16% (52) 4% (13) 4% (13) 328PID/Gender: DemWomen 78% (336) 13% (57) 8% (33) 1% (4) 431PID/Gender: Ind Men 31% (78) 58% (149) 7% (18) 4% (10) 255PID/Gender: Ind Women 29% (80) 55% (151) 11% (31) 5% (14) 276PID/Gender: Rep Men 9% (33) 82% (295) 4% (14) 5% (17) 359PID/Gender: Rep Women 7% (23) 87% (303) 5% (16) 2% (7) 349Ideo: Liberal (1-3) 76% (436) 18% (104) 4% (23) 2% (12) 576Ideo: Moderate (4) 46% (222) 42% (203) 11% (51) 1% (4) 481Ideo: Conservative (5-7) 14% (107) 82% (636) 2% (18) 2% (14) 776Educ: < College 33% (401) 54% (657) 8% (99) 4% (48) 1206Educ: Bachelors degree 47% (236) 47% (233) 3% (16) 3% (15) 501Educ: Post-grad 56% (163) 40% (115) 4% (11) — (1) 290Income: Under 50k 38% (328) 46% (403) 11% (92) 5% (46) 868Income: 50k-100k 42% (301) 53% (384) 4% (27) 2% (12) 725Income: 100k+ 42% (171) 54% (220) 2% (7) 2% (7) 405Ethnicity: White 37% (564) 56% (862) 5% (75) 2% (35) 1536Ethnicity: Hispanic 45% (99) 43% (96) 8% (17) 5% (10) 222
Continued on next page

National Tracking Poll #2112154, December, 2021
269
Table POLx_11
Table POLx_11: Favorability forKamala Harris
Demographic Total Favorable Total UnfavorableHeard Of, NoOpinion Never Heard Of Total N
Registered Voters 40% (800) 50% (1006) 6% (126) 3% (65) 1998Ethnicity: Black 60% (153) 17% (44) 16% (41) 7% (17) 255Ethnicity: Other 40% (83) 48% (100) 5% (11) 7% (13) 207All Christian 37% (373) 58% (584) 3% (33) 1% (13) 1003All Non-Christian 61% (92) 23% (35) 3% (5) 12% (19) 151Atheist 44% (33) 52% (39) 4% (3) — (0) 75Agnostic/Nothing in particular 47% (223) 37% (174) 13% (60) 4% (17) 474Something Else 27% (80) 59% (174) 8% (25) 6% (16) 295Religious Non-Protestant/Catholic 56% (94) 30% (50) 3% (5) 11% (19) 168Evangelical 28% (157) 63% (347) 5% (30) 4% (21) 555Non-Evangelical 41% (290) 54% (389) 4% (27) 1% (9) 715Community: Urban 51% (273) 36% (196) 7% (40) 5% (28) 538Community: Suburban 42% (398) 50% (471) 6% (52) 2% (18) 939Community: Rural 25% (129) 65% (340) 7% (34) 4% (19) 521Employ: Private Sector 44% (301) 49% (338) 5% (34) 2% (13) 687Employ: Government 45% (57) 50% (63) 5% (6) 1% (1) 127Employ: Self-Employed 43% (87) 44% (88) 4% (8) 9% (18) 200Employ: Homemaker 28% (35) 63% (79) 8% (10) 2% (3) 126Employ: Student 34% (21) 47% (29) 11% (7) 7% (4) 61Employ: Retired 38% (200) 59% (308) 2% (13) — (0) 520Employ: Unemployed 37% (56) 33% (49) 21% (31) 9% (14) 150Employ: Other 34% (44) 42% (53) 14% (18) 10% (12) 127Military HH: Yes 37% (129) 59% (205) 3% (10) 1% (4) 348Military HH: No 41% (672) 49% (801) 7% (116) 4% (61) 1650RD/WT: Right Direction 79% (591) 12% (88) 4% (33) 4% (31) 743RD/WT: Wrong Track 17% (209) 73% (918) 7% (93) 3% (34) 1255Biden Job Approve 82% (706) 12% (102) 4% (35) 2% (21) 863Biden Job Disapprove 7% (75) 85% (894) 6% (61) 3% (28) 1057
Continued on next page

270
Morning ConsultTable POLx_11
Table POLx_11: Favorability forKamala Harris
Demographic Total Favorable Total UnfavorableHeard Of, NoOpinion Never Heard Of Total N
Registered Voters 40% (800) 50% (1006) 6% (126) 3% (65) 1998Biden Job Strongly Approve 85% (363) 8% (32) 2% (10) 5% (20) 424Biden Job Somewhat Approve 78% (343) 16% (70) 6% (25) — (1) 438Biden Job Somewhat Disapprove 18% (51) 67% (190) 10% (29) 5% (14) 283Biden Job Strongly Disapprove 3% (23) 91% (704) 4% (32) 2% (14) 774Favorable of Biden 81% (729) 12% (111) 4% (37) 2% (20) 896Unfavorable of Biden 6% (58) 87% (891) 5% (53) 2% (18) 1020Very Favorable of Biden 89% (382) 6% (27) 2% (9) 2% (10) 427Somewhat Favorable of Biden 74% (347) 18% (84) 6% (28) 2% (10) 469Somewhat Unfavorable of Biden 18% (39) 68% (146) 13% (28) 1% (2) 216Very Unfavorable of Biden 2% (19) 93% (745) 3% (25) 2% (16) 804#1 Issue: Economy 31% (268) 57% (493) 7% (62) 4% (35) 858#1 Issue: Security 13% (36) 83% (228) 4% (10) — (0) 274#1 Issue: Health Care 60% (136) 30% (69) 8% (17) 2% (5) 227#1 Issue: Medicare / Social Security 52% (102) 43% (85) 4% (7) 1% (2) 196#1 Issue: Women’s Issues 63% (78) 22% (28) 11% (13) 4% (5) 124#1 Issue: Education 61% (48) 27% (21) 8% (6) 5% (4) 80#1 Issue: Energy 62% (75) 27% (33) 6% (7) 4% (5) 121#1 Issue: Other 48% (56) 42% (50) 2% (3) 8% (9) 1182020 Vote: Joe Biden 74% (702) 18% (169) 6% (59) 2% (16) 9462020 Vote: Donald Trump 7% (58) 88% (761) 2% (13) 4% (32) 8642020 Vote: Didn’t Vote 24% (37) 35% (54) 30% (47) 10% (16) 1532018 House Vote: Democrat 79% (564) 17% (123) 4% (26) — (3) 7152018 House Vote: Republican 9% (66) 85% (608) 2% (15) 4% (27) 7162018 House Vote: Someone else 19% (13) 51% (34) 27% (18) 4% (3) 672016 Vote: Hillary Clinton 80% (543) 16% (110) 3% (23) — (3) 6792016 Vote: Donald Trump 9% (68) 84% (634) 3% (20) 4% (31) 7542016 Vote: Other 37% (35) 53% (51) 10% (10) — (0) 962016 Vote: Didn’t Vote 33% (154) 45% (209) 16% (74) 7% (31) 468Voted in 2014: Yes 43% (580) 52% (710) 3% (44) 2% (27) 1360Voted in 2014: No 35% (220) 46% (296) 13% (83) 6% (39) 638
Continued on next page
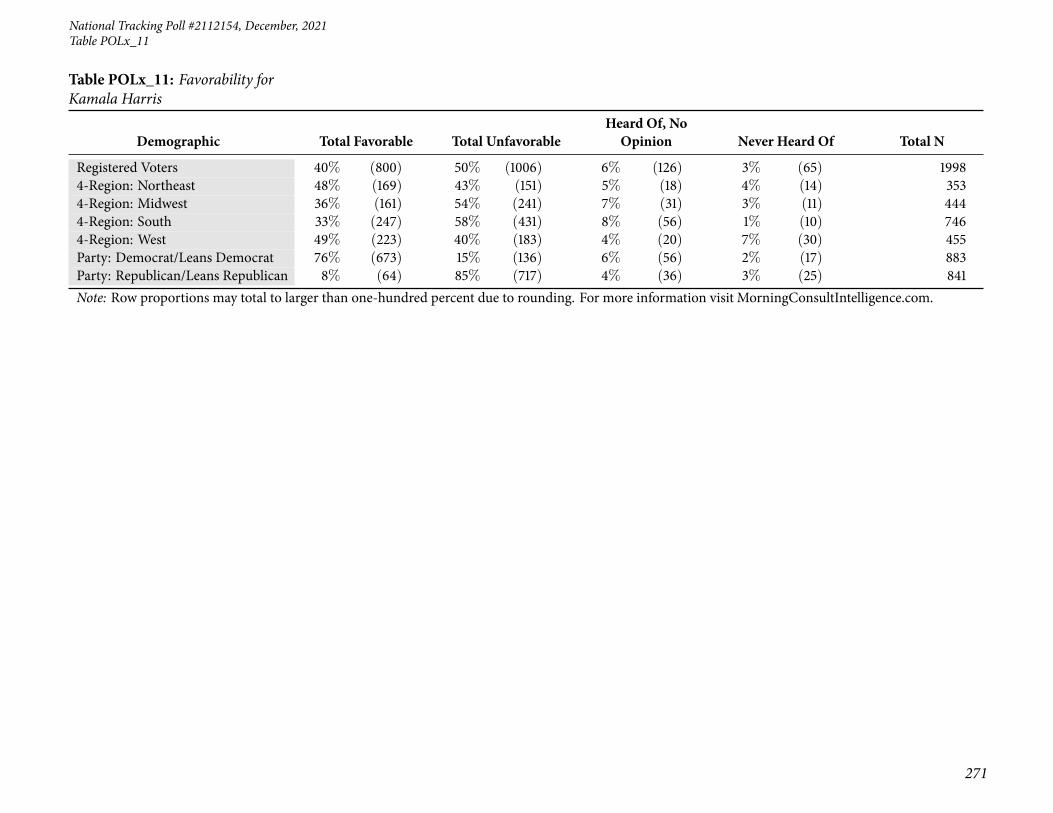
National Tracking Poll #2112154, December, 2021
271
Table POLx_11
Table POLx_11: Favorability forKamala Harris
Demographic Total Favorable Total UnfavorableHeard Of, NoOpinion Never Heard Of Total N
Registered Voters 40% (800) 50% (1006) 6% (126) 3% (65) 19984-Region: Northeast 48% (169) 43% (151) 5% (18) 4% (14) 3534-Region: Midwest 36% (161) 54% (241) 7% (31) 3% (11) 4444-Region: South 33% (247) 58% (431) 8% (56) 1% (10) 7464-Region: West 49% (223) 40% (183) 4% (20) 7% (30) 455Party: Democrat/Leans Democrat 76% (673) 15% (136) 6% (56) 2% (17) 883Party: Republican/Leans Republican 8% (64) 85% (717) 4% (36) 3% (25) 841Note: Row proportions may total to larger than one-hundred percent due to rounding. For more information visit MorningConsultIntelligence.com.

Morning ConsultRespondent Demographics Summary
Respondent Demographics Summary
Summary Statistics of Survey Respondent DemographicsDemographic Group Frequency Percentage
xdemAll Registered Voters 1998 100%
xdemGender Gender: Male 942 47%Gender: Female 1056 53%
N 1998
age Age: 18-34 514 26%Age: 35-44 307 15%Age: 45-64 679 34%Age: 65+ 497 25%
N 1998
demAgeGeneration GenZers: 1997-2012 181 9%Millennials: 1981-1996 534 27%GenXers: 1965-1980 460 23%
Baby Boomers: 1946-1964 755 38%N 1930
xpid3 PID: Dem (no lean) 759 38%PID: Ind (no lean) 531 27%PID: Rep (no lean) 708 35%
N 1998
xpidGender PID/Gender: DemMen 328 16%PID/Gender: DemWomen 431 22%
PID/Gender: Ind Men 255 13%PID/Gender: Ind Women 276 14%
PID/Gender: Rep Men 359 18%PID/Gender: Rep Women 349 17%
N 1998
xdemIdeo3 Ideo: Liberal (1-3) 576 29%Ideo: Moderate (4) 481 24%
Ideo: Conservative (5-7) 776 39%N 1833
xeduc3 Educ: < College 1206 60%Educ: Bachelors degree 501 25%
Educ: Post-grad 290 15%N 1998
Continued on next page
272

National Tracking Poll #2112154, December, 2021Respondent Demographics Summary
Summary Statistics of Survey Respondent DemographicsDemographic Group Frequency Percentage
xdemInc3 Income: Under 50k 868 43%Income: 50k-100k 725 36%
Income: 100k+ 405 20%N 1998
xdemWhite Ethnicity: White 1536 77%
xdemHispBin Ethnicity: Hispanic 222 11%
demBlackBin Ethnicity: Black 255 13%
demRaceOther Ethnicity: Other 207 10%
xdemReligion All Christian 1003 50%All Non-Christian 151 8%
Atheist 75 4%Agnostic/Nothing in particular 474 24%
Something Else 295 15%N 1998
xdemReligOther Religious Non-Protestant/Catholic 168 8%
xdemEvang Evangelical 555 28%Non-Evangelical 715 36%
N 1269
xdemUsr Community: Urban 538 27%Community: Suburban 939 47%
Community: Rural 521 26%N 1998
xdemEmploy Employ: Private Sector 687 34%Employ: Government 127 6%
Employ: Self-Employed 200 10%Employ: Homemaker 126 6%
Employ: Student 61 3%Employ: Retired 520 26%
Employ: Unemployed 150 7%Employ: Other 127 6%
N 1998
xdemMilHH1 Military HH: Yes 348 17%Military HH: No 1650 83%
N 1998
Continued on next page
273

Morning ConsultRespondent Demographics Summary
Summary Statistics of Survey Respondent DemographicsDemographic Group Frequency Percentage
xnr1 RD/WT: Right Direction 743 37%RD/WT: Wrong Track 1255 63%
N 1998
xdemBidenApprove Biden Job Approve 863 43%Biden Job Disapprove 1057 53%
N 1920
xdemBidenApprove2 Biden Job Strongly Approve 424 21%Biden Job Somewhat Approve 438 22%
Biden Job Somewhat Disapprove 283 14%Biden Job Strongly Disapprove 774 39%
N 1920
xdemBidenFav Favorable of Biden 896 45%Unfavorable of Biden 1020 51%
N 1916
xdemBidenFavFull Very Favorable of Biden 427 21%Somewhat Favorable of Biden 469 23%
Somewhat Unfavorable of Biden 216 11%Very Unfavorable of Biden 804 40%
N 1916
xnr3 #1 Issue: Economy 858 43%#1 Issue: Security 274 14%
#1 Issue: Health Care 227 11%#1 Issue: Medicare / Social Security 196 10%
#1 Issue: Women’s Issues 124 6%#1 Issue: Education 80 4%
#1 Issue: Energy 121 6%#1 Issue: Other 118 6%
N 1998
xsubVote20O 2020 Vote: Joe Biden 946 47%2020 Vote: Donald Trump 864 43%
2020 Vote: Other 35 2%2020 Vote: Didn’t Vote 153 8%
N 1998
xsubVote18O 2018 House Vote: Democrat 715 36%2018 House Vote: Republican 716 36%
2018 House Vote: Someone else 67 3%N 1498
Continued on next page
274

National Tracking Poll #2112154, December, 2021Respondent Demographics Summary
Summary Statistics of Survey Respondent DemographicsDemographic Group Frequency Percentage
xsubVote16O 2016 Vote: Hillary Clinton 679 34%2016 Vote: Donald Trump 754 38%
2016 Vote: Other 96 5%2016 Vote: Didn’t Vote 468 23%
N 1996
xsubVote14O Voted in 2014: Yes 1360 68%Voted in 2014: No 638 32%
N 1998
xreg4 4-Region: Northeast 353 18%4-Region: Midwest 444 22%
4-Region: South 746 37%4-Region: West 455 23%
N 1998
xdemPidLean Party: Democrat/Leans Democrat 883 44%Party: Republican/Leans Republican 841 42%
N 1724
Note: Group proportions may total to larger than one-hundred percent due to rounding. All statistics are calcu-lated with demographic post-stratification weights applied.
275

276 Morning Consult