Serum heat inactivation affects protein corona composition and nanoparticle uptake
8
Serum heat inactivation affects protein corona composition and nanoparticle uptake Anna Lesniak, Abigail Campbell, Marco P. Monopoli, Iseult Lynch, Anna Salvati * , Kenneth A. Dawson * Centre for BioNano Interactions, School of Chemistry and Chemical Biology, UCD Conway Institute for Biomolecular and Biomedical Research, University College Dublin, Belfield, Dublin 4, Ireland article info Article history: Received 1 July 2010 Accepted 14 September 2010 Available online 5 November 2010 Keywords: Nanoparticles Complement Protein adsorption Flow cytometry Confocal microscopy abstract Nanoparticles are of an appropriate size to interact with cells, and are likely to use a range of cellular machinery for internalisation and trafficking to various sub-cellular compartments. It is now understood that once in contact with biological fluids, the nanoparticle surface gets covered by a highly specific layer of proteins, forming the nanoparticle protein corona. This protein layer is stable for times longer than the typical time scale of nanoparticle import, and thus can impact on particle uptake and trafficking inside the cells. In this work, the effect of the corona composition on nanoparticle uptake has been investigated, by studying the impact of serum heat inactivation and complement depletion on the load of nanoparticles accumulated inside the cell. For the same material and nanoparticle size, cellular uptake was found to be significantly different when the nanoparticles were dispersed in medium where the serum was heat inactivated or not heat inactivated, even for non-specialized cells, suggesting that different sera can lead to different nano- particle doses. The fact that uptake was correlated with the amount of protein bound into the nanoparticle corona suggests the need for commonly agreed dispersion protocols for in vitro nanoparticleecell studies. Ó 2010 Elsevier Ltd. All rights reserved. 1. Introduction Striking new bionanoscience and nanomedicine paradigms have arisen in the last few years. We are beginning to realize just how different interactions between nanoscale objects and living organ- isms are from more conventional moleculeeorganism interactions. For example, at cell and tissue level, endogenous trafficking mech- anisms process nanoscale objects, leading to energy dependent trafficking into the cell. This should be contrasted with the purely physical kinetics (diffusion) dominated by equilibrium applicable to molecular species, such as small molecular drugs. An additional element in this newly emerging story is a growing realization that the nanoparticle ‘surface’, whether pristine or with various surface grafts, is greatly modified by the environment where it is applied or administered. For example, in plasma, for most materials not especially engineered to avoid it, the nominal nanoparticle surface is modified by a protein (and lipidic) ‘corona’ that entirely covers the surface, obscuring the bare material prop- erties [1e4]. Although in the first few hours after contact with the biological medium some re-arrangements occur for the proteins with the highest affinity to bind to the particle surface, the corona exchange times are so long (typically many hours) that the cell is not likely to ‘see’ the bare material properties for many acute impacts or other shorter term biological processes [5e7]. The implications of this are profound, for it suggests that one cannot fully evaluate the biological consequences of a nanoparticleecell (barrier, organ or other) interaction in the absence of the context, or biological environment. This will naturally have implications, for instance, in the comparison of in vitro and in vivo studies, since in vitro biological studies typically use low amounts (10% dilution or less, depending on cell type) of animal derived serum instead of full plasma, which is present in in vivo studies, and thus, nanoparticle coronas are formed at very different protein to nanoparticle ratios under in vitro and in vivo conditions. To what degree in vitro studies are informative of in vivo outcomes needs further consideration, and interpretation. Besides this, there is the quite serious issue of (lack of) reproducibility of observed outcomes. Consider even the simplest example of (intracellular) dose in an in vitro toxicology study. Here one can see that if different serum or serum conditions are applied between researchers (serum heat inactivated or not, but also potentially different batches of serum) apparent irreproduc- ibilities may arise, in terms of the nature of the protein corona and the nanoparticle dispersion stability [2,5]. We will consider an interesting (and highly applicable) mani- festation of this phenomenon. Heat inactivation is a procedure * Corresponding authors. Centre for BioNano Interactions, School of Chem- istry and Chemical Biology, University College Dublin, Belfield, Dublin 4, Ireland. Tel.: þ353 (0)1 716 6928; fax: þ353 (0)1 716 2415. E-mail addresses: [email protected] (A. Salvati), kenneth@fiachra.ucd.ie (K.A. Dawson). Contents lists available at ScienceDirect Biomaterials journal homepage: www.elsevier.com/locate/biomaterials 0142-9612/$ e see front matter Ó 2010 Elsevier Ltd. All rights reserved. doi:10.1016/j.biomaterials.2010.09.049 Biomaterials 31 (2010) 9511e9518
-
Upload
independent -
Category
Documents
-
view
0 -
download
0
Transcript of Serum heat inactivation affects protein corona composition and nanoparticle uptake
lable at ScienceDirect
Biomaterials 31 (2010) 9511e9518
Contents lists avai
Biomaterials
journal homepage: www.elsevier .com/locate/biomater ia ls
Serum heat inactivation affects protein corona compositionand nanoparticle uptake
Anna Lesniak, Abigail Campbell, Marco P. Monopoli, Iseult Lynch, Anna Salvati*, Kenneth A. Dawson*
Centre for BioNano Interactions, School of Chemistry and Chemical Biology, UCD Conway Institute for Biomolecular and Biomedical Research, University College Dublin,Belfield, Dublin 4, Ireland
a r t i c l e i n f o
Article history:Received 1 July 2010Accepted 14 September 2010Available online 5 November 2010
Keywords:NanoparticlesComplementProtein adsorptionFlow cytometryConfocal microscopy
* Corresponding authors. Centre for BioNano Intistry and Chemical Biology, University College DubliTel.: þ353 (0)1 716 6928; fax: þ353 (0)1 716 2415.
E-mail addresses: [email protected] (A. Sal(K.A. Dawson).
0142-9612/$ e see front matter � 2010 Elsevier Ltd.doi:10.1016/j.biomaterials.2010.09.049
a b s t r a c t
Nanoparticles are of an appropriate size to interact with cells, and are likely to use a range of cellularmachinery for internalisationandtrafficking tovarious sub-cellularcompartments. It isnowunderstood thatonce in contact with biological fluids, the nanoparticle surface gets covered by a highly specific layer ofproteins, forming thenanoparticleproteincorona.Thisprotein layer is stable for times longer than the typicaltime scale of nanoparticle import, and thus can impact on particle uptake and trafficking inside the cells. Inthiswork, theeffectof thecoronacomposition onnanoparticleuptakehasbeen investigated, bystudying theimpact of serum heat inactivation and complement depletion on the load of nanoparticles accumulatedinside the cell. For the same material and nanoparticle size, cellular uptake was found to be significantlydifferent when the nanoparticles were dispersed in mediumwhere the serumwas heat inactivated or notheat inactivated, even for non-specialized cells, suggesting that different sera can lead to different nano-particle doses. The fact that uptake was correlated with the amount of protein bound into the nanoparticlecorona suggests the need for commonly agreed dispersion protocols for in vitro nanoparticleecell studies.
� 2010 Elsevier Ltd. All rights reserved.
1. Introduction
Striking newbionanoscience and nanomedicine paradigms havearisen in the last few years. We are beginning to realize just howdifferent interactions between nanoscale objects and living organ-isms are from more conventional moleculeeorganism interactions.For example, at cell and tissue level, endogenous trafficking mech-anisms process nanoscale objects, leading to energy dependenttrafficking into the cell. This should be contrasted with the purelyphysical kinetics (diffusion) dominated by equilibrium applicable tomolecular species, such as small molecular drugs.
An additional element in this newly emerging story is a growingrealization that the nanoparticle ‘surface’, whether pristine or withvarious surface grafts, is greatly modified by the environmentwhere it is applied or administered. For example, in plasma, formost materials not especially engineered to avoid it, the nominalnanoparticle surface is modified by a protein (and lipidic) ‘corona’that entirely covers the surface, obscuring the bare material prop-erties [1e4]. Although in the first few hours after contact with thebiological medium some re-arrangements occur for the proteins
eractions, School of Chem-n, Belfield, Dublin 4, Ireland.
vati), [email protected]
All rights reserved.
with the highest affinity to bind to the particle surface, the coronaexchange times are so long (typically many hours) that the cell isnot likely to ‘see’ the bare material properties for many acuteimpacts or other shorter term biological processes [5e7]. Theimplications of this are profound, for it suggests that one cannotfully evaluate the biological consequences of a nanoparticleecell(barrier, organ or other) interaction in the absence of the context, orbiological environment. This will naturally have implications, forinstance, in the comparison of in vitro and in vivo studies, since invitro biological studies typically use low amounts (10% dilution orless, depending on cell type) of animal derived serum instead of fullplasma, which is present in in vivo studies, and thus, nanoparticlecoronas are formed at very different protein to nanoparticle ratiosunder in vitro and in vivo conditions. To what degree in vitro studiesare informative of in vivo outcomes needs further consideration,and interpretation. Besides this, there is the quite serious issue of(lack of) reproducibility of observed outcomes. Consider even thesimplest example of (intracellular) dose in an in vitro toxicologystudy. Here one can see that if different serum or serum conditionsare applied between researchers (serum heat inactivated or not, butalso potentially different batches of serum) apparent irreproduc-ibilities may arise, in terms of the nature of the protein corona andthe nanoparticle dispersion stability [2,5].
We will consider an interesting (and highly applicable) mani-festation of this phenomenon. Heat inactivation is a procedure

A. Lesniak et al. / Biomaterials 31 (2010) 9511e95189512
commonly applied in cell culture that destroys the complementactivity in the serum e some cells can be sensitive to the presenceof the complement [8], though not all cell types require the serumto be heat inactivated [9]. Certainly serum heat inactivation, if notproperly controlled and performed, can alter the quality of theserum itself thus affecting cell growth by destroying desirableactive components or creating precipitates in the cell culturemedium [10,11]. Temperature and length of the procedure need tobe properly controlled, without which significant variability can beintroduced into the final protein composition. Moreover, immu-noglobulin aggregation has been reported as a consequence of theheating procedure, and this can affect subsequent immunologicalassays [11].
Where the complement is properly removed, it is natural to askif the protein corona on nanoparticles is affected, and if this has anyimplications for nanoparticle internalisation (or indeed for func-tional impacts). Complement receptors in fact activate severaluptake pathways [12,13], and this could affect nanoparticle uptake,even in vitro, whilst in vivo adsorption of complement proteins andimmunoglobulins from the serum onto the nanoparticle surfacecan activate the complement and potentially induce nanoparticleremoval by macrophages, via classical and/or alternative pathways.Several works have already been reported, where the effect ofcomplement activation on foreign nanoparticle removal byphagocytic cells has been investigated [14e16]. Other examplesdiscuss the role of specific receptors involved in particulateremoval, such as scavenger receptors, which are also connected tophagocytic activity and the complement proteins [17]. In particularit has been demonstrated that scavenger receptors are involved insilica nanoparticle phagocytosis and also polystyrene nanoparticleremoval by macrophages [18e20]. In other cases, the complementactivity has also been connected to phagocytic activity in nonspecialised cells, such as lung epithelium [13].
Evidently for those cell types that are sensitive to complement,the effect of the nanoparticle complement-corona could be quitecomplex, and difficult to separate from other uptake mechanisms.However, for example, the A549 cells used in this study are rela-tively insensitive to the presence of the complement proteins andgrow regularly in both kinds of sera, and as such represent a goodmodel for the elucidation of the effects of complement proteins onnanoparticles uptake and localisation.
Thus, in this work, heat inactivation has been performed on cellsnot specialized for phagocytosis, with the main objective ofinvestigating if nanoparticle uptake is different when the nano-particles are dispersed in sera of different protein character(composition). Previous studies on the same nanoparticles as usedhere have in fact reported the presence of complement proteins inthe corona formed upon contact with human plasma [3]. Here, wechange the ratio of nanoparticle-to-serum concentration, and thepresence/absence of complement in the serum, thereby varyingboth the surface coverage and the character (composition) of thecorona. The results are striking, and illustrate just how intimatelyconnected the protein-coated particle surface is to cellular uptake.
2. Materials and methods
Polystyrene nanoparticles (Green carboxylate modified polystyrene of 20, 40,100 and 200 nm from Invitrogen) were used without further modification or puri-fication. Nanoparticle surface area was calculated assuming a spherical shape andusing the nominal diameter to determine the total particle number at a given mass.The total surface area of nanoparticles was then estimated from the number ofnanoparticles in the different concentrations (mass) applied.
The size of the dry nanoparticles was characterized by Transmission ElectronMicroscopy, by air drying the particles onto a holey copper grid from a watersuspension.
Size and zeta potential measurements of nanoparticle dispersions were carriedout using a Malvern Zetasizer Nano ZS90 (Worcestershire, UK) to measure the
hydrodynamic diameter by Dynamic light scattering (DLS) and the zeta potential(related to surface charge). Nanoparticle dispersions were characterized in phos-phate buffered saline (PBS) at 25 �C and in cell culture media at both 25 �C and 37�C. DLS measurements are the average of at least 3 runs each containing 100 sub-measurements. The data are reported as average hydrodynamic diameter andpolydispersity index (PDI), which is a measure of the size distribution and poly-dispersity of the sample, which can be due to the presence of different sizednanoparticles resulting from the synthesis procedure, or eventual aggregation(values smaller than 0.3 indicate monodisperse samples with no particle aggre-gation). The zeta potential, which is connected to the surface charge of the nano-particles, and can vary with pH and composition (e.g. ionic strength) of the media,was measured in a relevant buffer, such as PBS and also in the complete cell culturemedia (cMEM) with not heat inactivated serum (unless otherwise stated e seeResults and Discussion).
A549 cells (passage 1e30 after defrosting from liquid nitrogen; original batchesfrom ATCC, item number CCL-185, at passage number 105 or 82) were cultured at37 �C in 5% CO2 in Minimum Essential Medium (MEM, with additional L-Glutamine)supplemented with 10% Fetal Calf Serum (FCS, Gibco), 1% penicillin/streptomycin(Invitrogen Corp.), and 1% MEM non-essential amino acids (HyClone). The mediumwith all its additives is denoted cMEM hereafter. Cells were confirmed to bemycoplasma negative using the mycoAlert kit (Lonza Inc. Allendale, NJ) and weretested monthly. Serum heat inactivated (HI) and serum not heat inactivated (NHI)were used. HI serum was prepared by incubation at 56 �C for 30 min prior toaddition to MEM. Before each experiment cells were counted and re-suspended inan appropriate volume of cMEM to obtain the required cell density. For flowcytometry, 2.5 � 105 cells were seeded into individual 60 mm tissue culture dishes(Greiner Bio-one), and incubated for 24 h prior to addition of the nanoparticledispersion. Depending on the experiment, the concentrated stock of nanoparticleswas diluted in HI or NHI cMEM to obtain the desired final concentration. Cells wereincubated with particles for the required exposure time, depending on theexperiment, by replacing the medium with the particle suspension. The particlesuspension was presented to cells immediately after preparation. After theappropriate exposure time, the particle containing medium was removed and thecells were washed three times with PBS buffer and harvested with trypsin/EDTAfor 3 min. Cells were fixed with 4% formalin solution (Sigma) for 20 min and thenre-suspended in PBS buffer for the measurement. Careful control of each of thesesteps is required in order to ensure reproducibility and controlled exposure tonanoparticles. At least three independent biological replicas were performed undereach condition.
Fluorescence levels in the cells were measured by flow cytometry usinga CyAn� ADPAnalyzer by Beckman Coulter (Fullerton, CA). Results are presented asthe averaged mean of the distribution of the cell fluorescence obtained by countingminimum 15,000 cells for each replica. Error bars are obtained by measuring thestandard deviation among the replicas.
For confocal imaging, cells were plated on 35 mm plates with 15 mm diameterglass coverslips at densities ranging from 1.25 � 105 to 1.8 � 105 cells per plate andtreated as described above for flow cytometry sample preparation. For lysosomestaining, samples were washed with 3 � 1 ml PBS, fixed for 20 min with 1 ml 4%formalin, permeabilized for 5min in 1ml 1% saponin fromQuillaja bark (Sigma), andincubated for 30 min at room temperature with a blocking solution of 1% AlbuminBovine Serum Fraction V (Sigma) in PBS-T to prevent non specific binding. Sampleswere thus incubated for 1 h at room temperature with a primary antibody 1:200mouse mAb to LAMP [H4A3] (Abcam, Cambridge, UK), washed with 3 � 1 ml PBS,and then incubated at room temperature for 1 h with 1:400 dilution of AlexaFluor647 Goat Anti-mouse IgG (H þ L) as a secondary antibody (Molecular Probes).Samples were washed with 3 � 1 ml PBS and incubated for 3 minwith DAPI (Sigma)beforemounting with MOWIOL on slides for imaging. The cells were observed usinga Carl Zeiss LSM 510 Meta laser scanning confocal microscope (Zeiss, Munchen,Germany) with lasers at 364 nm (DAPI), 488 nm (green labelled nanoparticles), and633 nm (LAMP1 antibody).
The total protein composition of the two different types of serum, HI and NHI,was compared by separation using an SDS-PAGE (sodium dodecyl sulphate Poly-Acrylamide Gel Electrophoresis). To further analyse the 2 different sera, proteinswere also separated by Fast Protein Liquid Chromatography (FPLC) gel filtration(AKTApurifier, GE Healthcare), and the fractions further separated using an SDS-PAGE. The analytical column Tricon Superdex 200 10/300 used for this study enabledhigh-resolution purification by molecular weight (in the range 10,000�600,000 Dafor globular proteins). PBS buffer was used as the mobile phase, with a flow rate of0.5 ml/min. Both types of serum (HI and NHI) were run twice, to confirm theobtained results (1 ml serum was loaded for each sample). The absorbance at 280nm was measured continuously to monitor the elution of the proteins from thecolumn. Each fraction (2 ml) was collected and the proteins of each fraction werefurther separated by SDS-PAGE (4% stacking gel and 12% resolving gel).
To ensure optimal protein loading on the gel, the fractions were dilutedaccording to the following protocol:
� Fractions 3, 4 and 5: 20 ml eluted sample þ 20 ml PBS þ 20 ml loading buffer� Fractions 6 and 7: 4 ml eluted sample þ 36 ml PBS þ 20 ml loading buffer� Fractions 8, 9, 10, 11 and 12: 40 ml eluted sample þ 20 ml loading buffer

Table 1Size characterisation of the fluorescent polystyrene nanoparticles in PBS and cellculture media not heat inactivated (cMEM NHI), obtained by dynamic light scat-tering (Malvern ZetaSizer) and Transmission Electron Microscopy. Zeta potentialmeasured in PBS and cMEM NHI.
Sample Medium T [�C] Diameter[nm]
PDI TEM size[nm]
Zeta Potential[mV]
pH
20 nm PBS 25 58.09 0.334 28.54 �41.4 7.5240 nm PBS 25 73.31 0.23 36.16 �35.8 7.45100 nm PBS 25 119.8 0.004 117.3 �42.3 7.54200 nm PBS 25 202.5 0.011 177.5 �54.2 7.5320 nm cMEM 25 42.35 0.545 �18.9 7.2640 nm cMEM 25 81.03 0.178 �19.6 7.21100 nm cMEM 25 166.2 0.174 �18.7 7.26200 nm cMEM 25 221.7 0.146 �20.5 7.2520 nm cMEM 37 38.43 0.64940 nm cMEM 37 85.78 0.117100 nm cMEM 37 163.1 0.147200 nm cMEM 37 223 0.086
A. Lesniak et al. / Biomaterials 31 (2010) 9511e9518 9513
The proteins in the eluted samples were thus denatured adding 3X loadingbuffer (New England Biolabs) and 1:10 volume of 1.25 M DTT. The samples wereboiled for 5 min and then loaded in two gels (fractions 3e7 in the first gel and 8e11in the second), subjected to electrophoresis at 120 V, 400 mA for about 70 min each,until the proteins neared the end of the gel. The gels were stained the following dayusing the DAIICHI silver staining kit (Tokyo, Japan).
SDS-PAGE (4% stacking gel and 10% resolving gel) was also used to separate theproteins recovered from the nanoparticle surfaces. To obtain accurate results, theprotocol for protein recovery has been optimised. This ensures the preservation ofthe proteins strongly associated with the nanoparticle and the removal of looselybound proteins.
Samples were mixed in the order PBS-serum-particles. The nanoparticles wereincubated with the serum (HI or NHI) for 1 h at 37 �C, and then subjected tocentrifugation at 20,000 rcf at 4 �C for 15min. The supernatant was removed and thepellet was re-suspended in 500 ml of filtered PBS. This step was repeated twice,followed by a fourth centrifugation step at 20,000 rcf, 4 �C for 15 min. Finally, afterthe last centrifugation, the supernatant was removed and the pellet was re-sus-pended carefully with 20 ml SDS-loading buffer. Next, the samples were boiled for 5min to denature the proteins, cooled to room temperature, and finally they werespun down for 15 s to pellet the nanoparticles.
The samples were loaded into the 4% stacking gel with a 10% resolving gel andsubjected to electrophoresis at 120 V, 400 mA for about 70 min each, until theproteins neared the end of the gel. The gels were stained the following day using theDAIICHI silver staining kit (Tokyo, Japan). Even thoughmultiple concentrations werestudied on the same gel, since the different samples contained a different mass ofparticles of different size, the protein concentrations were thus not the same amongall samples, and as such meaningful comparisons could only be made withinsamples obtained from same particle size and concentration for the 2 different sera(HI versus NHI).
The gels were analysed using densitometry to quantify the protein amount inthe bands from the pixel intensity in the acquired gel image.
Table 2Characterisation of 40 and 100 nm nanoparticles in complete cell media cMEMcontaining 10% serum HI or NHI.
Sample Medium T [�C] Diameter [nm] PDI
40 nm Serum HI 25 82.97 0.18740 nm Serum NHI 25 81.03 0.178100 nm Serum HI 25 161.1 0.197100 nm Serum NHI 25 166.2 0.17440 nm Serum HI 37 83.72 0.17940 nm Serum NHI 37 85.78 0.117100 nm Serum HI 37 173.6 0.138100 nm Serum NHI 37 163.1 0.147
3. Results and discussion
In the present work the uptake of fluorescently labelled poly-styrene nanoparticles with carboxylate surface groups of differentsizes (nominally 20, 40, 100, 200 nm) by A549 cells grown in heatinactivated and not heat inactivated serum (HI and NHI, respec-tively) has been studied. For complement depletion, the fetal calfserum was heat inactivated by incubation at 56 �C for 30 min inawater bath. The samples were slightly agitated every 5min to helpmixing and to ensure homogenous heating throughout the fullsample volume. Although the full serum composition will certainlybe different because of the heat inactivation (PAGE gel of the heatinactivated (HI) and not heat inactivated (NHI) full sera at differentdilutions is shown in Fig. S1), it is very difficult to see differences insuch complex fluids with a simple gel. More detailed studies havebeen performed to further characterize the effect of the heat inac-tivation procedure on the serum character (composition): for thispurpose the 2 sera have been loaded into an FPLC column asdescribed in the Materials and Methods and the obtained elutionprofiles are shown in Fig. S2A. The silver-stained gels of the corre-sponding eluted fractions are also shown in Fig. S2B and C. Both theelution profiles and the gels showed that bigger aggregates werepresent in the heat inactivated serum, probably as a consequence ofimmunoglobulin and complement aggregation, as described in theliterature [11]. This is an example of how a common procedure,which is not always required, especially when calf serum is used (asopposed to adult-bovine serum), could lead to further complicationsand irreproducibility, especially when immunological assays are tobe performed. Here, however, nomajor damage of the sera could bedetected, thus the2 serahavebeenused to studywhether a differentprotein character (composition) can result in a different proteincorona, thus affecting nanoparticle uptake. Complete medium HIandNHIhas beenpreparedbyadding50mlof the serumto500mlofthe cell culture medium MEM (together with 5 ml non-essentialamino acids and 5ml of penicillin and streptomycin, as described inthe Materials and Methods).
Particles are characterized in the usual manner prior to anyexperiment with cells. Representative EM images of the 4 different
particles are shown in the Supplementary Information in Fig. S3.From these images an average particle size has been obtained andresults are reported in Table 1, together with the size, size distri-bution and zeta potential of the investigated nanoparticles in PBSand cell media, cMEM NHI. The results suggest that all the inves-tigated nanoparticles were monodisperse and their size distribu-tion was homogenous (low PDI). When dispersed in the completecell media, no strong aggregation could be detected for all sizesexcept the 20 nm nanoparticles. The zeta potential (which isa reflection of the charge measured at the material surface,including the most strongly associated counterions) changed tolower absolute values in complete media, as a consequence of theinteraction with the serum proteins. A more detailed study hasbeen performed with the 40 and 100 nm particles measuring thesizes in both HI and NHI cMEM at 25 and 37 �C, with the datapresented in Table 2, in order to investigate if the different seraaffect the particle dispersion and its stability during exposure tocells, thus potentially affecting the available particle dose andrelating to eventual differences in nanoparticle uptake. The resultsin Table 1 indicate that for all particle sizes, upon contact withcMEM the nanoparticle average sizes increase as the coronas form,as reported in literature [5]. However, the data presented in Table 2do not show significant differences in particle size and size distri-bution (dispersion) for the two different sera.
Uptake kinetics of A549 cells is studied according to a careful setof protocols laid out of the Materials and Methods. We do not enterinto details here, but remark that by following this approach onecan (with effort) obtain nearly quantitatively reproducible uptakecurves, intracellular fluorescence, and intracellular loads of nano-particles, and other species. For example, the error bars marked inFig. 1 are truly representative, and the relative trends arereproducible.

Table 3Uptake of endocytosismarkers (FITC Dextran 40 kDa and Lucifer Yellow) and Free YGDye by A549 cells in complete cell media cMEM containing 10% serumHI or NHI. Cellfluorescence intensity values were obtained by flow cytometry as described in theMethods section.
Untreated cells(background fluorescence)
Serum HI Error � Serum NHI Error �0.2763 0.0035 0.3033 0.0095
Endocytosis markers Serum HI Error � Serum NHI Error �Free dye 100.13 6.504 117.56 14.709FITC dextran 40 165.5 1 172.4 2.163Lucifer yellow 1.123 0.0153 1.696 0.0208
A. Lesniak et al. / Biomaterials 31 (2010) 9511e95189514
We can also note (see Table 3) that there are few effects of serumheat inactivation on uptake of a series of molecular and macro-molecular uptake controls, ranging from FITC Dextran 40 kDa,Lucifer Yellow, to Free Dye YG. These constitute useful controls, forthey indicate that the various endogenous uptake processes usedby these molecules are unaffected by heat inactivation of theserum.
Fig. 1 shows the flow cytometry results obtained from cellstreated for 24 h with the different nanoparticle sizes at differentconcentrations in medium HI and NHI. Significant variations inparticle uptake result from heat inactivation, depending on the sizeand concentration of the nanoparticles. Thus, for the smaller sizes,20 (a) and 40 (b) nm, at all of the concentrations we investigated,nanoparticle uptake is higher in NHI serum. However for the 2bigger sizes, 100 (c) and 200 (d) nm this trend is reversed. For thoselarger particles, at lower particle concentrations (or particle-serumratio, where the corona could be expected to be more developed,there being excess protein) uptake is higher for cells in the heatinactivated serum, with the situation reversing (again for largerparticles) at higher particle concentration. It is striking that thesurface of nanoparticles of same material but different sizes areaffected by heat inactivation in quite different manners.
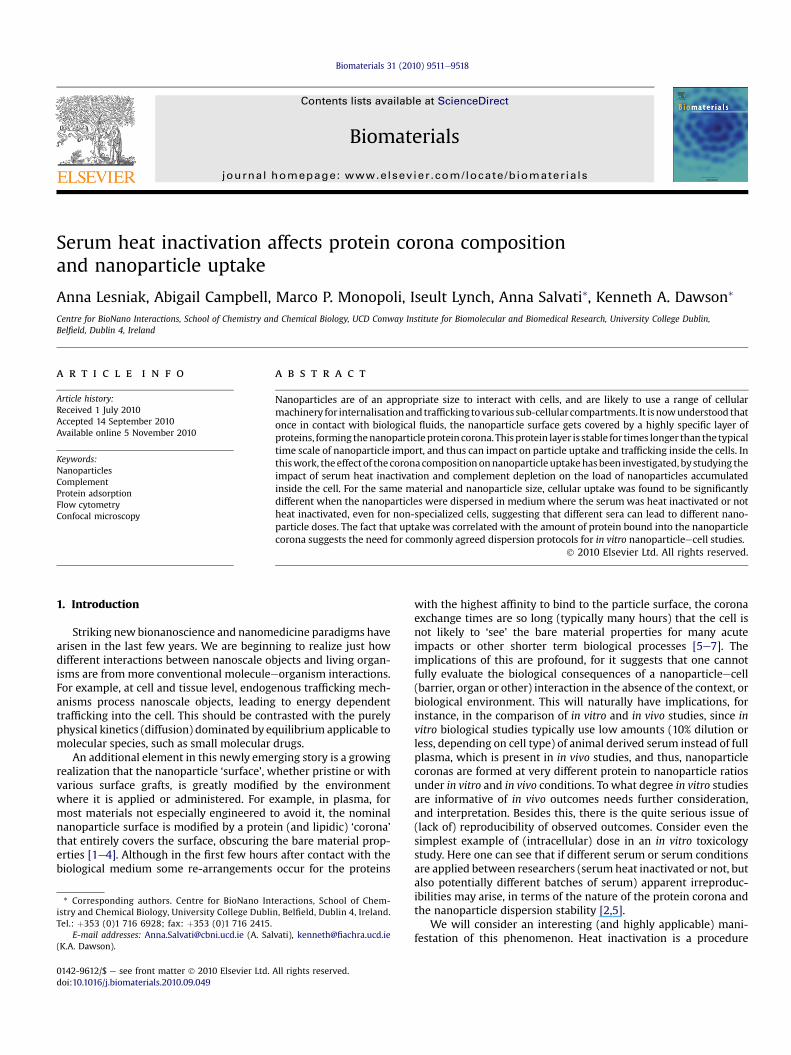
Additional studies have been performed for the 40 and 100 nmparticles at a wider range of doses, including lower concentrations,to see if the phenomenon could be associated with the amount ofsurface compared to the available protein. The results are presentedin Fig. 2 (the surface area corresponding to the applied mass ofnanoparticles is also shown). Assuming a spherical shape (seeMethods), the surface area of 25 mg of the 100 nm nanoparticles is
Fig. 1. Uptake of polystyrene particles of (A) 20, (B) 40, (C) 100 and (D) 200 nm by A549 cell(HI). Filled bars: serum not heat inactivated (NHI). Cell fluorescence intensity values were
equivalent to the surface area of 10 mg of the 40 nm particles (thecalculated values are marked in red in Fig. 2 to indicate thiscorrespondence). Since for concentrations lower than 25 mg/ml thetrend for the 100 nm nanoparticle inverts (and uptake becomeslarger in serum HI), we investigated if a similar inversion wouldoccur for the 40 nm when a lower surface area is available, thus atconcentrations lower than 10 mg/ml. The data reported in Fig. 2A(an enlarged detail is shown in Fig. 2B) suggest that no clearinversion of the trend could be detected for the 40 nm nano-particles. (Note however, that at these low concentrations themeasured levels of fluorescence intensity in the cells are moredifficult to discriminate.) Thus the behavior for the differentnanoparticles sizes is not explicable by considering only the totalsurface area, and suggests an intrinsic size difference, possibly dueto different cellular uptake processes. Moreover, since the data inFigs. 1 and 2 refer to 24 h of uptake in cells, these differences arelikely connected to the different sera resulting in subtle differences
s after 24 h of exposure at different concentrations. Empty bars: serum heat inactivatedobtained by flow cytometry, as described in the Methods section.
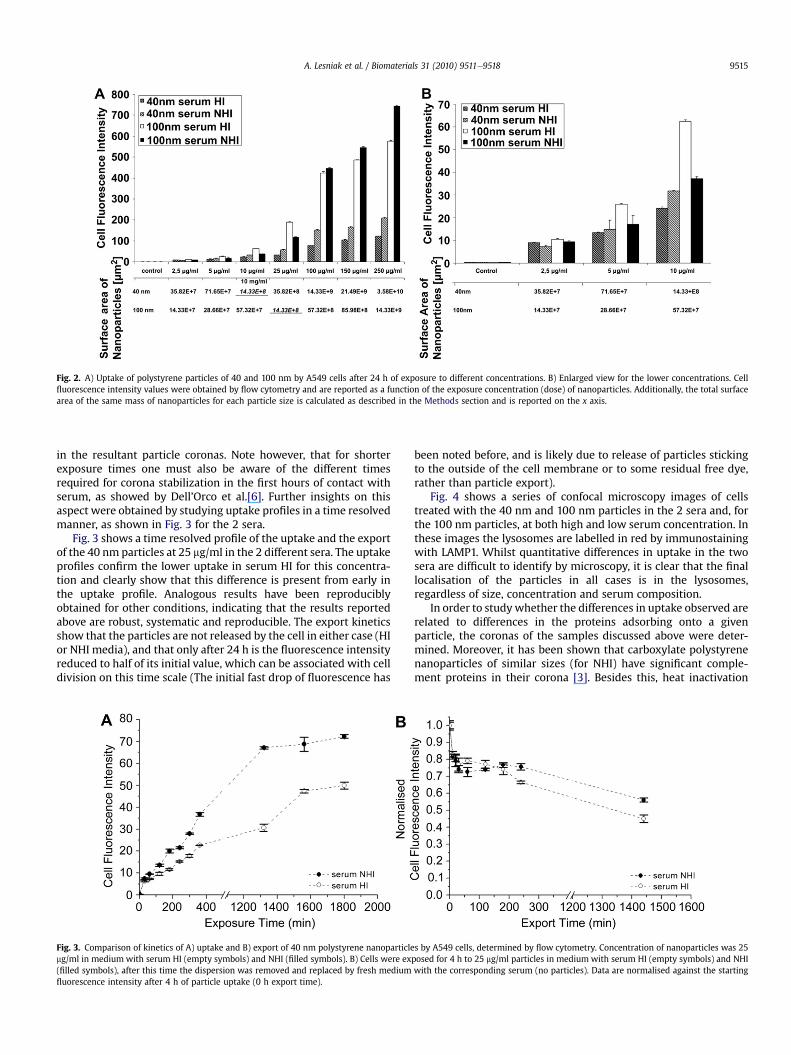
Fig. 2. A) Uptake of polystyrene particles of 40 and 100 nm by A549 cells after 24 h of exposure to different concentrations. B) Enlarged view for the lower concentrations. Cellfluorescence intensity values were obtained by flow cytometry and are reported as a function of the exposure concentration (dose) of nanoparticles. Additionally, the total surfacearea of the same mass of nanoparticles for each particle size is calculated as described in the Methods section and is reported on the x axis.
A. Lesniak et al. / Biomaterials 31 (2010) 9511e9518 9515
in the resultant particle coronas. Note however, that for shorterexposure times one must also be aware of the different timesrequired for corona stabilization in the first hours of contact withserum, as showed by Dell’Orco et al.[6]. Further insights on thisaspect were obtained by studying uptake profiles in a time resolvedmanner, as shown in Fig. 3 for the 2 sera.
Fig. 3 shows a time resolved profile of the uptake and the exportof the 40 nm particles at 25 mg/ml in the 2 different sera. The uptakeprofiles confirm the lower uptake in serum HI for this concentra-tion and clearly show that this difference is present from early inthe uptake profile. Analogous results have been reproduciblyobtained for other conditions, indicating that the results reportedabove are robust, systematic and reproducible. The export kineticsshow that the particles are not released by the cell in either case (HIor NHI media), and that only after 24 h is the fluorescence intensityreduced to half of its initial value, which can be associated with celldivision on this time scale (The initial fast drop of fluorescence has
Fig. 3. Comparison of kinetics of A) uptake and B) export of 40 nm polystyrene nanoparticlemg/ml in medium with serum HI (empty symbols) and NHI (filled symbols). B) Cells were ex(filled symbols), after this time the dispersion was removed and replaced by fresh mediumfluorescence intensity after 4 h of particle uptake (0 h export time).
been noted before, and is likely due to release of particles stickingto the outside of the cell membrane or to some residual free dye,rather than particle export).
Fig. 4 shows a series of confocal microscopy images of cellstreated with the 40 nm and 100 nm particles in the 2 sera and, forthe 100 nm particles, at both high and low serum concentration. Inthese images the lysosomes are labelled in red by immunostainingwith LAMP1. Whilst quantitative differences in uptake in the twosera are difficult to identify by microscopy, it is clear that the finallocalisation of the particles in all cases is in the lysosomes,regardless of size, concentration and serum composition.
In order to study whether the differences in uptake observed arerelated to differences in the proteins adsorbing onto a givenparticle, the coronas of the samples discussed above were deter-mined. Moreover, it has been shown that carboxylate polystyrenenanoparticles of similar sizes (for NHI) have significant comple-ment proteins in their corona [3]. Besides this, heat inactivation
s by A549 cells, determined by flow cytometry. Concentration of nanoparticles was 25posed for 4 h to 25 mg/ml particles in medium with serum HI (empty symbols) and NHIwith the corresponding serum (no particles). Data are normalised against the starting

Fig. 4. Confocal images of A549 cells treated for 24 h with green polystyrene nanoparticles (40 or 100 nm). In red: LAMP1 staining of the lysosomes (secondary antibody conjugatedwith Alexa-647). (A) 100 nm, 25 mg/ml serum NHI, (B) 100 nm, 25 mg/ml serum HI, (C) 100 nm, 250 mg/ml serum NHI, (D) 100 nm, 250 mg/ml serum HI, (E) 40 nm, 250 mg/ml serumHI, (F) 40 nm, 250 mg/ml serum NHI.
A. Lesniak et al. / Biomaterials 31 (2010) 9511e95189516
also leads to different total amounts of protein in the corona, and itis of interest to know if cell uptake is most linked to coronacomposition or amount. To recover the hard corona, after incuba-tion of the nanoparticles with the serum, the samples have beencleaned and run in SDS-gels as described in the Methods section ofthis paper. This protocol is confirmed in Fig. S4, where severalwashes have been performed to remove the loosely bound proteins
from the hard coronaenanoparticle complexes. The gel in Fig. S5shows the results obtained under the optimised conditions. Acontrol of cell culture medium without particles, treated to thesame centrifugation and removal of supernatant process as used toseparate the particles and their hard corona of proteins, is given inlane 6, illustrating that this process does not result in precipitationof proteins or protein clusters in the absence of particles. For

Fig. 5. Silver-stained gel of the protein coronas recovered from the 40 nm and 100 nmpolystyrene nanoparticles at different concentrations in the 2 different sera, HI andNHI. The proteins recovered from the same number of particles (at the investigatedconcentration) have been loaded in each line to allow comparison between the HI andNHI corona under each of the conditions tested. A higher amount of protein has beenrecovered for the 100 nm 25 mg/ml in NHI serum and for the 250 mg/ml in HI serumthan for the 100 nm 25 mg/ml in HI serum and for the 250 mg/ml in NHI serum. For the40 nm at 250 mg/ml the corona is more abundant after exposure to HI serum than afterexposure to NHI serum. In all the cases, the lower protein amount in the coronacorresponds to the sample with higher cell uptake (see Fig. 2).
A. Lesniak et al. / Biomaterials 31 (2010) 9511e9518 9517
comparison, the corona proteins associated with 100 nm nano-particles (25 mg/ml), recovered using the same protocol, are shownin lane 4. The reproducibility of the results is good and supports thevalidity of the protocol.
The corona formed on the 100 nm nanoparticles at both 25 and250 mg particles/ml medium has been studied, in an attempt tounderstand the source of the differences in the nanoparticle uptakefor these two concentrations. The 40 nm particles have beenstudied at only one concentration, since for all investigatedconcentrations the uptake was higher in NHI serum, as describedpreviously. The data for the coronas formed on the 100 nm and 40nm particles is shown in Fig. 5, with an independent replica inFig. S6 to validate and confirm the reproducibility of the results. Inthese gels, it is only meaningful to compare the coronas betweenparticles of the same size and at the same particle concentration,e.g. in the coronas of particles in serum HI versus NHI, where theproteins were recovered from the same number of particles of samesize, and thus with the same surface area and surface curvature. It ischallenging to map out the bands completely from both sera, butgeneral assessments can be made: the striking outcome of thepresent study is that, as indicated by the results in Fig. 5, in all casesa lower particle uptake into cells is correlated with more protein inthe recovered hard corona. This conclusion is strengthened bydensitometry results (shown in Fig. S7) for the 40 nm nanoparticlesat 250 mg/ml, calculated from the same gels shown previously(Fig. S6 and Fig. 5). Four different bands are analysed forcompleteness and in all cases, more protein is present in theHI-incubated particles’ corona which gave lower particle uptakeinto cells, than in the NHI-incubated particles’ corona which gavehigher particle uptake into cells (see Fig. 2). The observation isconsistent in both experiments.
4. Conclusions
Growing evidence suggests that in the study of nano-particleeorganism interactions it is impossible to separate the role of
the material (and its surface) from the nature of the (long-lived)biomolecular layer adsorbed onto it. Here we have studied a simplemanifestationof this, andoneconcludes that theessential intracellularconcentration (which is essentially the ‘dose’) of nanoparticles isaffected by serum heat inactivation, and complement depletion. Theamount of adsorbed protein on the long-lived (hard) corona is affectedby heat inactivation and correlates with nanoparticle uptake, witha more protein-rich corona leading to decreased particle uptake bycells. To what degree different cell-function effects (apart from in vivoimmune and clearance effects) arise from the differently adsorbedproteins isnotyetknown.However, it is alreadyclear that for this arenato grow into a systematic, reproducible and rational science, theprotein corona is a key parameter that must be specified (or at leastfixed) in the system. Onewill have to account for the variations in cellculture media resulting from serum source (animal type, animal age,and even between individual animals of the same species/age) whendesigning in vitro studies, whilst in vivo variations in route of admin-istration, inter-species variations, and potentially even different indi-vidualsmight all lead todifferent protein levels of different kinds, all ofwhich will affect nanoparticle uptake and distribution.
Acknowledgments
This work was conducted under the framework of the INSPIREprogramme, funded by the Irish Government’s Programme forResearch in Third Level Institutions, Cycle 4, National DevelopmentPlan 2007e2013 (AC, MPM). Additional financial support from FP6IST project SIGHT (IST-2005-033700), EU FP6 NanoInteract(NMP4-CT-2006-033231), the Irish Research Council for Science,Engineering and Technology (AS), EU FP7 Small CollaborativeProject, NeuroNano (NMP4-SL-2008-214547) and is based uponworks supported by Science Foundation Ireland under Grant No.[SFI/SRC/B1155]. Dr. Alfonso Blanco (UCD Conway Flow Cytometryfacility) is kindly acknowledged for the technical support with flowcytometry. Use of the Conway Imaging Facility and the UCD Elec-tron Microscopy Core facility is also acknowledged.
Appendix. Supplementary information
Supplementary data associated with this article can be found, inthe online version, at doi:10.1016/j.biomaterials.2010.09.049.
References
[1] Cedervall T, Lynch I, Lindman S, Berggard T, Thulin E, Nilsson H, et al.Understanding the nanoparticle-protein corona using methods to quantifyexchange rates and affinities of proteins for nanoparticles. Proc Natl Acad SciU S A 2007;104(7):2050e5.
[2] Lynch I, Salvati A, Dawson KA. Protein-nanoparticle interactions: what doesthe cell see? Nat Nanotechnol 2009;4(9):546e7.
[3] Lundqvist M, Stigler J, Elia G, Lynch I, Cedervall T, Dawson KA. Nanoparticlesize and surface properties determine the protein corona with possibleimplications for biological impacts. Proc Natl Acad Sci U S A 2008;105(38):14265e70.
[4] Lacerda SHDP, Park JJ, Meuse C, Pristinski D, Becker ML, Karim A, et al.Interaction of gold nanoparticles with common human blood proteins. ACSNano 2009;4(1):365e79.
[5] Walczyk D, Baldelli Bombelli F, Monopoli M, Lynch I, Dawson KA. What thecell “sees” in bionanoscience. J Am Chem Soc 2010;132(16):5761e8.
[6] Dell’Orco D, Lundqvist M, Oslakovic C, Cedervall T, Linse S. Modeling the timeevolution of the nanoparticle-protein corona in a body fluid. PLoS One 2010;5(6):e10949.
[7] Casals E, Pfaller T, Duschl A, Oostingh GJ, Puntes V. Time evolution of thenanoparticle protein corona. ACS Nano 2010;4(7):3623e32.
[8] Northoff H, Flegel WA, Peter JD. Fetal calf serum. Encyclopedia of immunology.Oxford: Elsevier; 1998. pp. 896e897.
[9] Leshem B, Yogev D, Fiorentini D. Heat inactivation of fetal calf serum is notrequired for in vitro measurement of lymphocyte functions. J ImmunolMethods 1999;223(2):249e54.
[10] Giard DJ. Routine heat inactivation of serum reduces its capacity to promotecell attachment. Vitro Cell Dev Biol 1987;23(10):691e7.

A. Lesniak et al. / Biomaterials 31 (2010) 9511e95189518
[11] Soltis RD, Hasz D, Morris MJ, Wilson ID. The effect of heat inactivationof serum on aggregation of immunoglobulins. Immunology 1979;36(1):37e45.
[12] Hirsch C, Ellner J, Russell D, Rich E. Complement receptor-mediated uptakeand tumor necrosis factor-alpha-mediated growth inhibition of Mycobacte-rium tuberculosis by human alveolar macrophages. J Immunol 1994;152(2):743e53.
[13] de Astorza B, Cortes G, Crespi C, Saus C, Rojo JM, Alberti S. C3 promotesclearance of Klebsiella pneumoniae by A549 epithelial cells. Infect Immun2004;72(3):1767e74.
[14] Yang A, Liu W, Li Z, Jiang L, Xu H, Yang X. Influence of polyethyleneglycolmodification on phagocytic uptake of polymeric nanoparticles mediated byimmunoglobulin G and complement activation. J Nanosci Nanotechnol2010;10:622e8.
[15] Brown EJ. Complement receptors and phagocytosis. Curr Opin Immunol1991;3(1):76e82.
[16] Metzger H. Fc receptors and membrane immunoglobulin. Curr Opin Immunol1991;3(1):40e6.
[17] Reichert F, Rotshenker S. Complement-receptor-3 and scavenger-receptor-AI/II mediated myelin phagocytosis in microglia and macrophages. Neurobiol Dis2003;12(1):65e72.
[18] Kanno S, Furuyama A, Hirano S. A murine scavenger receptor MARCOrecognizes polystyrene nanoparticles. Toxicol Sci 2007;97(2):398e406.
[19] Postlethwait EM. Scavenger receptors clear the air. J Clin Invest 2007;117(3):601e4.
[20] Hamilton RF, Thakur SA, Mayfair JK, Holian A. MARCO mediates silica uptakeand toxicity in alveolar macrophages from C57BL/6 mice. J Biol Chem2006;281(45):34218e26.