Serial imaging of micro-agents and cancer cell spheroids in a ...
24
RESEARCH ARTICLE Serial imaging of micro-agents and cancer cell spheroids in a microfluidic channel using multicolor fluorescence microscopy Mert Kaya ID 1,2 *, Fabian Stein 3 , Jeroen Rouwkema 3 , Islam S. M. Khalil 2 , Sarthak Misra 1,2 1 Surgical Robotics Laboratory, Department of Biomechanical Engineering, University of Twente, Enschede, The Netherlands, 2 Surgical Robotics Laboratory, Department of Biomedical Engineering and University Medical Centre Groningen, University of Groningen, Groningen, The Netherlands, 3 Vascularization Laboratory, Department of Biomechanical Engineering, University of Twente, Enschede, The Netherlands * [email protected] Abstract Multicolor fluorescence microscopy is a powerful technique to fully visualize many biological phenomena by acquiring images from different spectrum channels. This study expands the scope of multicolor fluorescence microscopy by serial imaging of polystyrene micro-beads as surrogates for drug carriers, cancer spheroids formed using HeLa cells, and microfluidic channels. Three fluorophores with different spectral characteristics are utilized to perform multicolor microscopy. According to the spectrum analysis of the fluorophores, a multicolor widefield fluorescence microscope is developed. Spectral crosstalk is corrected by exciting the fluorophores in a round-robin manner and synchronous emitted light collection. To report the performance of the multicolor microscopy, a simplified 3D tumor model is created by placing beads and spheroids inside a channel filled with the cell culture medium is imaged at varying exposure times. As a representative case and a method for bio-hybrid drug carrier fabrication, a spheroid surface is coated with beads in a channel utilizing electrostatic forces under the guidance of multicolor microscopy. Our experiments show that multicolor fluores- cence microscopy enables crosstalk-free and spectrally-different individual image acquisi- tion of beads, spheroids, and channels with the minimum exposure time of 5.5 ms. The imaging technique has the potential to monitor drug carrier transportation to cancer cells in real-time. Introduction The functionalization of tetherless manipulatable micro-agents as drug carriers offers a rem- edy for required dose delivery to cancer cells. Microfluidic channels have been used as a con- trolled experimental environment to validate the effectiveness of such micro-agents [1, 2]. Since the channels are fabricated using optically transparent materials, microscopy is the most widely used method for imaging [3]. Among the microscopy techniques, fluorescence micros- copy is the most effective way to visualize a specific target structure with a relatively high con- trast-to-noise ratio by eliminating the background. In the literature, only micro-agents are PLOS ONE PLOS ONE | https://doi.org/10.1371/journal.pone.0253222 June 15, 2021 1 / 24 a1111111111 a1111111111 a1111111111 a1111111111 a1111111111 OPEN ACCESS Citation: Kaya M, Stein F, Rouwkema J, Khalil ISM, Misra S (2021) Serial imaging of micro-agents and cancer cell spheroids in a microfluidic channel using multicolor fluorescence microscopy. PLoS ONE 16(6): e0253222. https://doi.org/10.1371/ journal.pone.0253222 Editor: Kristen C. Maitland, Texas A&M University, UNITED STATES Received: April 6, 2021 Accepted: May 31, 2021 Published: June 15, 2021 Peer Review History: PLOS recognizes the benefits of transparency in the peer review process; therefore, we enable the publication of all of the content of peer review and author responses alongside final, published articles. The editorial history of this article is available here: https://doi.org/10.1371/journal.pone.0253222 Copyright: © 2021 Kaya et al. This is an open access article distributed under the terms of the Creative Commons Attribution License, which permits unrestricted use, distribution, and reproduction in any medium, provided the original author and source are credited. Data Availability Statement: All relevant data are within the paper and its Supporting information files.
-
Upload
khangminh22 -
Category
Documents
-
view
4 -
download
0
Transcript of Serial imaging of micro-agents and cancer cell spheroids in a ...

RESEARCH ARTICLE
Serial imaging of micro-agents and cancer cell
spheroids in a microfluidic channel using
multicolor fluorescence microscopy
Mert KayaID1,2*, Fabian Stein3, Jeroen Rouwkema3, Islam S. M. Khalil2, Sarthak Misra1,2
1 Surgical Robotics Laboratory, Department of Biomechanical Engineering, University of Twente, Enschede,
The Netherlands, 2 Surgical Robotics Laboratory, Department of Biomedical Engineering and University
Medical Centre Groningen, University of Groningen, Groningen, The Netherlands, 3 Vascularization
Laboratory, Department of Biomechanical Engineering, University of Twente, Enschede, The Netherlands
Abstract
Multicolor fluorescence microscopy is a powerful technique to fully visualize many biological
phenomena by acquiring images from different spectrum channels. This study expands the
scope of multicolor fluorescence microscopy by serial imaging of polystyrene micro-beads
as surrogates for drug carriers, cancer spheroids formed using HeLa cells, and microfluidic
channels. Three fluorophores with different spectral characteristics are utilized to perform
multicolor microscopy. According to the spectrum analysis of the fluorophores, a multicolor
widefield fluorescence microscope is developed. Spectral crosstalk is corrected by exciting
the fluorophores in a round-robin manner and synchronous emitted light collection. To report
the performance of the multicolor microscopy, a simplified 3D tumor model is created by
placing beads and spheroids inside a channel filled with the cell culture medium is imaged at
varying exposure times. As a representative case and a method for bio-hybrid drug carrier
fabrication, a spheroid surface is coated with beads in a channel utilizing electrostatic forces
under the guidance of multicolor microscopy. Our experiments show that multicolor fluores-
cence microscopy enables crosstalk-free and spectrally-different individual image acquisi-
tion of beads, spheroids, and channels with the minimum exposure time of 5.5 ms. The
imaging technique has the potential to monitor drug carrier transportation to cancer cells in
real-time.
Introduction
The functionalization of tetherless manipulatable micro-agents as drug carriers offers a rem-
edy for required dose delivery to cancer cells. Microfluidic channels have been used as a con-
trolled experimental environment to validate the effectiveness of such micro-agents [1, 2].
Since the channels are fabricated using optically transparent materials, microscopy is the most
widely used method for imaging [3]. Among the microscopy techniques, fluorescence micros-
copy is the most effective way to visualize a specific target structure with a relatively high con-
trast-to-noise ratio by eliminating the background. In the literature, only micro-agents are
PLOS ONE
PLOS ONE | https://doi.org/10.1371/journal.pone.0253222 June 15, 2021 1 / 24
a1111111111
a1111111111
a1111111111
a1111111111
a1111111111
OPEN ACCESS
Citation: Kaya M, Stein F, Rouwkema J, Khalil ISM,
Misra S (2021) Serial imaging of micro-agents and
cancer cell spheroids in a microfluidic channel
using multicolor fluorescence microscopy. PLoS
ONE 16(6): e0253222. https://doi.org/10.1371/
journal.pone.0253222
Editor: Kristen C. Maitland, Texas A&M University,
UNITED STATES
Received: April 6, 2021
Accepted: May 31, 2021
Published: June 15, 2021
Peer Review History: PLOS recognizes the
benefits of transparency in the peer review
process; therefore, we enable the publication of
all of the content of peer review and author
responses alongside final, published articles. The
editorial history of this article is available here:
https://doi.org/10.1371/journal.pone.0253222
Copyright: © 2021 Kaya et al. This is an open
access article distributed under the terms of the
Creative Commons Attribution License, which
permits unrestricted use, distribution, and
reproduction in any medium, provided the original
author and source are credited.
Data Availability Statement: All relevant data are
within the paper and its Supporting information
files.

imaged and localized using single-band fluorescence microscopy [4–10]. To study the drug
transportation mechanism using micro-agents, imaging and localization of cancer cells and
channels are also required. In this study, a multicolor widefield fluorescence microscope is
developed to serially acquire images of micro-agents, cancer cells, and microfluidic channel.
The main contribution of this study is that multicolor fluorescence microscopy is applied for
spectrally-different and high-contrast visualization to monitor the interaction between micro-
agents and cancer cells in a channel.
In numerous application domains ranging from single-cell visualization to rapid diagnosis,
multicolor fluorescence microscopy is recognized as a key emerging technology [11–23]. The
working principle of this microscopy technique is based on performing imaging using spec-
trally-different conventional fluorescent dyes [11], endogenous fluorophores [22], fluorescent
proteins [24], or quantum dots [25]. Relatively narrow excitation and emission wavelength
ranges enable image acquisition from different spectrum bands with multiple fluorophores.
Acquired spectrally-different images, defined as individual fluorescence images, are overlaid to
form a multicolor fluorescence image. Different configurations are developed to perform mul-
ticolor fluorescence microscopy. The simplest way is to collect multicolor images using a com-
bination of an imaging sensor and single-band filters. Individual fluorescence images are
collected by changing the filters with different bandwidths [23, 26, 27]. However, performing
imaging by positioning the filters either manually or using a motorized drive creates a delay
and limits the image acquisition rate. An appealing solution for stationary components is to
use a multi-band emission filter [11, 15]. Since the delay associated with the spectrum band
change is removed, the acquisition is limited by the frame rate of the imaging sensor. Depend-
ing on the spectrum of the fluorophores, the acquired images suffer from crosstalk [14]. To
minimize the crosstalk, emitted light from the fluorophores is separated using dichroic mirrors
and direct to individual imaging sensors using a common optical path [16, 18, 20–22]. Under
simultaneous excitation of the fluorophores, the individual images still contain crosstalk due
to the overlapping of emission spectra [17]. To overcome crosstalk, our multicolor microscope
is configured to excite one fluorophore at a time and synchronously trigger the designated
camera for individual image acquisition. We experimentally validate that the crosstalk is cor-
rected by the assignment of emitted light from each fluorophore to the specified camera.
For imaging experiments, cancer cell spheroids with a diameter of 200 μm are formed using
HeLa cells and placed inside a microfluidic channel filled with cell culture medium to create a
simplified 3D tumor model. Polystyrene beads with a diameter of 20 μm are employed as sur-
rogates for drug carriers and injected in the channel [28–30]. In our simplified tumor model,
there are height differences between beads, spheroids, and channel. To form focused multi-
color fluorescence images using widefield microscopy, individual image acquisition from dif-
ferent focal planes is required. Since micro-structures in the previously used samples have
almost the same height, defocus aberration correction is not addressed for widefield multicolor
imaging [11, 18, 31, 32]. In this study, our multicolor fluorescence microscope is specially
developed for defocus aberration correction by spectrally-different image acquisition from
multiple focal planes within the simplified tumor model. Fluorescein, CellTracker Red
CMTPX, indocyanine green, fluorophores with different spectral properties, are used to render
beads, spheroid, and channel visible by fluorescence imaging, respectively. Spectrum analysis
of the fluorophores is carried out using a spectrofluorometer to determine effective wavelength
ranges for excitation and fluorescence photon emission. Fluorophores are excited in a round-
robin manner, and acquired individual images in one-round are overlaid to form time-lapse
multicolor images. The achievable maximum multicolor image acquisition rate using the
round-robin method is measured by exposure time analysis. Photobleaching curves of the
fluorophores are studied to determine the duration of the multicolor imaging. To demonstrate
PLOS ONE Serial imaging of micro-agents and cancer cell spheroids in a microfluidic channel
PLOS ONE | https://doi.org/10.1371/journal.pone.0253222 June 15, 2021 2 / 24
Funding: This work was supported by the
European Research Council under the European
Union’s Horizon 2020 Research and Innovation
programme under Grant 638428–project
ROBOTAR: Robot-Assisted Flexible Needle
Steering for Targeted Delivery of Magnetic Agents
– European Research Council (ERC) Starting Grant.
Competing interests: The authors have declared
that no competing interests exist.

the application of the microscope for the investigation of drug targeting, HeLa cell spheroids
are coated with micro-beads utilizing electrostatic forces. An optical flow method is used to
compute motion information between consecutive time-lapse images. Our experiments show
that multicolor fluorescence microscopy enables more information collection for localization
and providing feedback by image acquisition from multiple spectrum bands compared to
bright-field and single-band fluorescence microscopy.
Materials and methods
Spectrum analysis
Excitation and emission spectrum of the fluorophores are measured using a spectrofluorome-
ter (FP-8300, Jasco, Japan) in the range of 200 nm and 900 nm with 1 nm data interval. For
spectrum analysis, 2.5 μM indocyanine green (I2633–25MG, Sigma-Aldrich, USA) solution is
prepared by dissolving 1.5 μg indocyanine green in 700 μL fetal bovine serum (16000044,
Thermo Fisher Scientific, USA). The solution is placed in a water bath at 37˚C for 2 hours to
bind indocyanine green to proteins in the culture medium [33]. A 10 μM working CellTracker
Red CMTPX (Thermo Fisher Scientific, USA) solution is prepared in a serum-free medium by
mixing 50 μg CMTPX dye in the vial with 7.29 μl dimethyl sulfoxide (D2650–100ML, Sigma-
Aldrich, USA). Micro-beads stained with fluorescein (42–00-204, Micromod, Germany) are
obtained in a solution form. 2 μL CMTPX and micro-beads solutions are diluted with 700 μL
Milli-Q water and placed in quartz cuvettes (CV10Q700F, Thorlabs, USA) for the analysis.
The spectrum graphs are illustrated in Fig 1(a). The peak excitation and emission wavelengths
are measured as 492 nm and 513 nm for fluorescein, 583 nm and 611 nm for CMTPX, and 773
nm and 799 nm for indocyanine green, respectively. The multicolor widefield fluorescence
microscope is developed based on the spectrum analysis for effective excitation of the fluoro-
phores and accurate emitted light collection.
Multicolor fluorescence microscope architecture
The microscope consists of illumination and emission units. The illumination unit generates
discrete light beams with the center wavelengths of 470 nm, 565 nm, and 780 nm for sharp
excitation of the fluorophores using three individual narrow-spectrum light-emitting diodes
(LEDs) (M470L3, M565L3, M780LP1, Thorlabs, USA). The spectrum of LEDs is plotted in Fig
1(f). LEDs are collimated using 20 mm focal length aspheric condenser lenses (ACL2520U-A,
ACL2520U-B, Thorlabs, USA) and coupled with filters (ET470/40x, ET572/35x, ET775/50x,
Chroma, USA) for selection of the excitation wavelengths. Generated three discrete and colli-
mated light beams are combined using two dichroic mirrors (T660lpxrxt, T510lpxrxt,
Chroma, USA) for excitation of the fluorophores using a single optical path. The spectrum for
the excitation path is shown in Fig 1(c). Collimated light provides non-homogeneous illumina-
tion, which results in artifact formation in the acquired fluorescence images. To achieve uni-
form illumination, Kohler illumination is used [34]. Collimated light is focussed for Kohler
illumination using a 150 mm focal length plano-convex lens (LA1417, Thorlabs, USA). Kohler
optics is constructed with the combination of a 150 mm focal length bi-convex lens (LB1374,
Thorlabs, USA), a 75 mm focal length plano-convex lens (LA1145, Thorlabs, USA), and two
iris diaphragms (SM2D25D and CP20S, Thorlabs, USA). The incoming light is first focussed
and then collimated using bi-convex and plano-convex lenses, respectively. Images of the LED
chips are obtained on the front focal plane of the plano-convex lens. A protective silver mirror
(PF10–03-P01, Thorlabs, USA) is utilized to direct the collimated light. A 10x long working
distance objective lens (Plan Apo, Mitutoyo, Japan) is employed to focus the excitation light
on the sample. The objective is placed in a way that its back focal plane intersects with the
PLOS ONE Serial imaging of micro-agents and cancer cell spheroids in a microfluidic channel
PLOS ONE | https://doi.org/10.1371/journal.pone.0253222 June 15, 2021 3 / 24

Fig 1. Optical layout of the multicolor fluorescence microscope developed for monitoring interaction between polystyrene
micro-beads as surrogates for drug carriers and cancer cells in a microfluidic channel. (a) Two-dimensional excitation and
emission spectrum of fluorescein, CellTracker Red CMTPX, and indocyanine green measured by a spectrofluorometer in the range
of 200 nm and 900 nm. The peak excitation and emission wavelengths are shown with vertical lines. (b) and (h) Illumination and
emission units. (c) and (g) Spectrum of excitation and emission paths, respectively. (d) and (e) Illumination and microscope
objectives that employed for focusing excitation light on the sample and collection of emitted light from the fluorophores,
respectively. (f) Spectrum of light-emitting diodes.
https://doi.org/10.1371/journal.pone.0253222.g001
PLOS ONE Serial imaging of micro-agents and cancer cell spheroids in a microfluidic channel
PLOS ONE | https://doi.org/10.1371/journal.pone.0253222 June 15, 2021 4 / 24

image plane of LED chips. To control illumination area and intensity at the sample plane, two
individual irises (i.e., field and aperture diaphragms) are placed to back focal planes of plano-
convex and objective lenses, respectively. Emitted light from fluorophores is collected using a
5x long working distance objective (Plan Apo, Mitutoyo, Japan) and transmitted towards the
emission unit by a protective silver mirror (PF20–03-P01, Thorlabs, USA). The emission unit
separates the emitted fluorescence light into its spectral components for individual image for-
mation of microfluidic channels, HeLa cells, and micro-beads using two dichroic mirrors
(DMLP567L and DMLP805L, Thorlabs, USA). Individual fluorescence light beams are
directed onto tube lenses (ITL200, Thorlabs, USA) to form images onto complementary
metal-oxide-semiconductor (CMOS) cameras (CS135MUN, DCC3240N, Thorlabs, USA). To
block excitation light and select fluorescence wavelengths, emission filters (ET845/55m,
ET623/60m, ET520/40m, Chroma, USA) are placed in front of the cameras. The spectrum for
the emission path is plotted in Fig 1(g).
Demultiplexer interface
Simultaneous excitation of the fluorophores leads to crosstalk between acquired fluorescence
signals due to spectral overlap (Fig 1). To prevent crosstalk, the microscope is coupled with a
demultiplexer interface to excite fluorophores in a round-robin manner and synchronically
acquire fluorescence images using two individual pulse trains. Multicolor fluorescence images
are obtained by overlapping serially acquired images from three different spectrum ranges in
one round. The demultiplexer interface architecture and timing diagram are illustrated in S1
Fig. Pulse train signals are generated using a programmable dual-channel signal generator
(33510B, Keysight, USA). A demultiplexer integrated circuit (74HC4052, Texas Instruments,
USA) is used to distribute generated pulses to the corresponding LED driver (LEDD1B, Thor-
labs, USA) and CMOS camera by channel selection using a microcontroller. Line drivers and
voltage followers are connected to the inputs and outputs of the circuit to match the imped-
ance and provide isolation, respectively.
Cell culture and spheroid formation
HeLa cells are cultured in Dulbecco’s modified Eagle’s medium (11–965-092, Fisher Scientific
Ltd. Canada), supplemented with 10%, fetal bovine serum (F7524–500ML, Sigma-Aldrich,
USA), and 1% penicillin-streptomycin (15–140-122, Thermo Fisher Scientific Inc., USA). Dur-
ing the culture period, the cells are maintained at 37˚C in a humidified atmosphere containing
5% carbon dioxide. In the 2D cell culture, the medium is changed every 48 hours. When cells
reach 80% confluency, the cells are trypsinized, counted, and resuspended in cell culture
medium at a concentration of 2 × 10⁶ cells/ml. In the next step 0.2 mL of cell suspension is
then placed on top of an agarose mold, which was previously placed in the well of a 12-well
plate for spheroid formation (Fig 2(a)). This results in spheroids which on average contain
approximately 270 cells. Half of the medium is replaced daily. For measuring the spheroid
morphology, images are taken every day (Fig 2(b)). The measured spheroid perimeter is used
to determine the average spheroid diameter by calculating the surface area.
Agarose molds
Agarose microarrays for nonadherent 3D cell culture are formed by replica molding [35]. Elas-
tomeric stamps of polydimethylsiloxane (PDMS) (Sylgard 184 Silicon Elastomer Kit, Dow
Corning, USA) are molded over the SU-8 photoresist master. Before use, the stamps are steril-
ized by 30 minutes incubation in 70% ethanol (84010059.5000, Boom Lab, the Netherlands).
Afterward, 3% agarose (weight/volume) (16500500, ultra-pure agarose, Invitrogen, USA) is
PLOS ONE Serial imaging of micro-agents and cancer cell spheroids in a microfluidic channel
PLOS ONE | https://doi.org/10.1371/journal.pone.0253222 June 15, 2021 5 / 24

cast onto the PDMS stamps and placed into 12-well round-bottom plates after polymerization.
Each agarose mold contains 1500 microwells with depth and a diameter of 200 μm.
Cell labelling using CMTPX and fixation
The 10 μM CMTPX working solution is prepared in a serum-free medium and subsequently
incubated for 30 minutes with the cells in monolayer and spheroids which have compacted for
3 days under cultivation conditions. Afterward, the working solution is removed, and the cul-
ture medium is added again. For long-term storage, HeLa cell spheroids stained with CMTPX
are fixated for 15 minutes with 4% formaldehyde (F8775–25ML, Sigma-Aldrich, USA) at
room temperature. This is followed by washing twice with Dulbecco’s phosphate-buffered
saline.
Microfluidic channel fabrication
To create a simplified 3D tumor model, HeLa cell spheroids stained with CMTPX are embed-
ded in microfluidic channels with a height of 187 μm using a micropipette. The channels are
fabricated using a standard soft lithography process [36]. Negative molds of microfluidic
Fig 2. HeLa cell spheroid formation. (a) Schematic of cell spheroid formation in microwell array from micropatterned agarose well. (b) After the
expansion of HeLa cells in standard tissue culture plates, cells were transferred into agarose microarrays for 3D cell spheroid formation with a diameter
of 200 μm. Circularity and diameter of the spheroid versus time are plotted in (b2) and (b3), respectively.
https://doi.org/10.1371/journal.pone.0253222.g002
PLOS ONE Serial imaging of micro-agents and cancer cell spheroids in a microfluidic channel
PLOS ONE | https://doi.org/10.1371/journal.pone.0253222 June 15, 2021 6 / 24
channels on a silicon wafer are prepared in the cleanroom using SU-8 photoresist. A mixture
of 10:1 Sylgard 184 PDMS and the curing agent is poured onto the wafer and cured in the
oven at 70˚C overnight. The cured PDMS layer is gently removed from the wafer, and inlet-
outlet ports are punched. Finally, the microfluidic channels are obtained by bonding the
PDMS layer to a microscope slide using plasma-oxidation. For imaging experiments,
the microfluidic channels are filled with 250 μg/ml indocyanine green in the culture medium
[37].
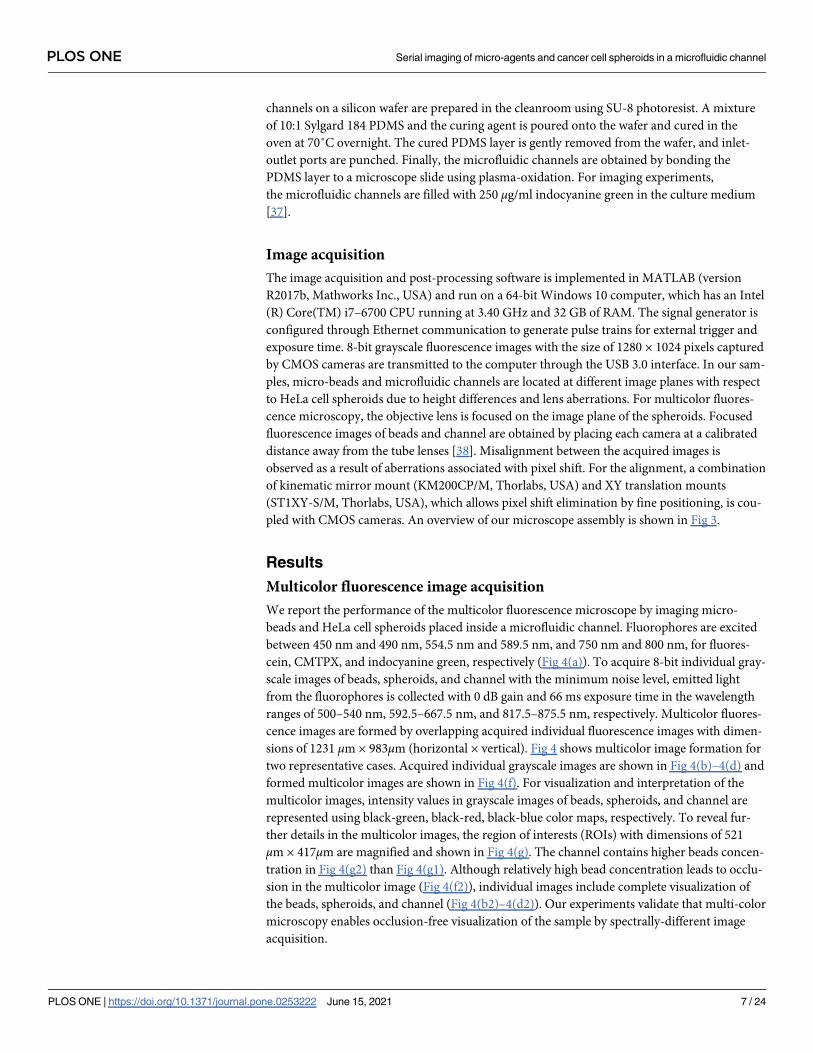
Image acquisition
The image acquisition and post-processing software is implemented in MATLAB (version
R2017b, Mathworks Inc., USA) and run on a 64-bit Windows 10 computer, which has an Intel
(R) Core(TM) i7–6700 CPU running at 3.40 GHz and 32 GB of RAM. The signal generator is
configured through Ethernet communication to generate pulse trains for external trigger and
exposure time. 8-bit grayscale fluorescence images with the size of 1280 × 1024 pixels captured
by CMOS cameras are transmitted to the computer through the USB 3.0 interface. In our sam-
ples, micro-beads and microfluidic channels are located at different image planes with respect
to HeLa cell spheroids due to height differences and lens aberrations. For multicolor fluores-
cence microscopy, the objective lens is focused on the image plane of the spheroids. Focused
fluorescence images of beads and channel are obtained by placing each camera at a calibrated
distance away from the tube lenses [38]. Misalignment between the acquired images is
observed as a result of aberrations associated with pixel shift. For the alignment, a combination
of kinematic mirror mount (KM200CP/M, Thorlabs, USA) and XY translation mounts
(ST1XY-S/M, Thorlabs, USA), which allows pixel shift elimination by fine positioning, is cou-
pled with CMOS cameras. An overview of our microscope assembly is shown in Fig 3.
Results
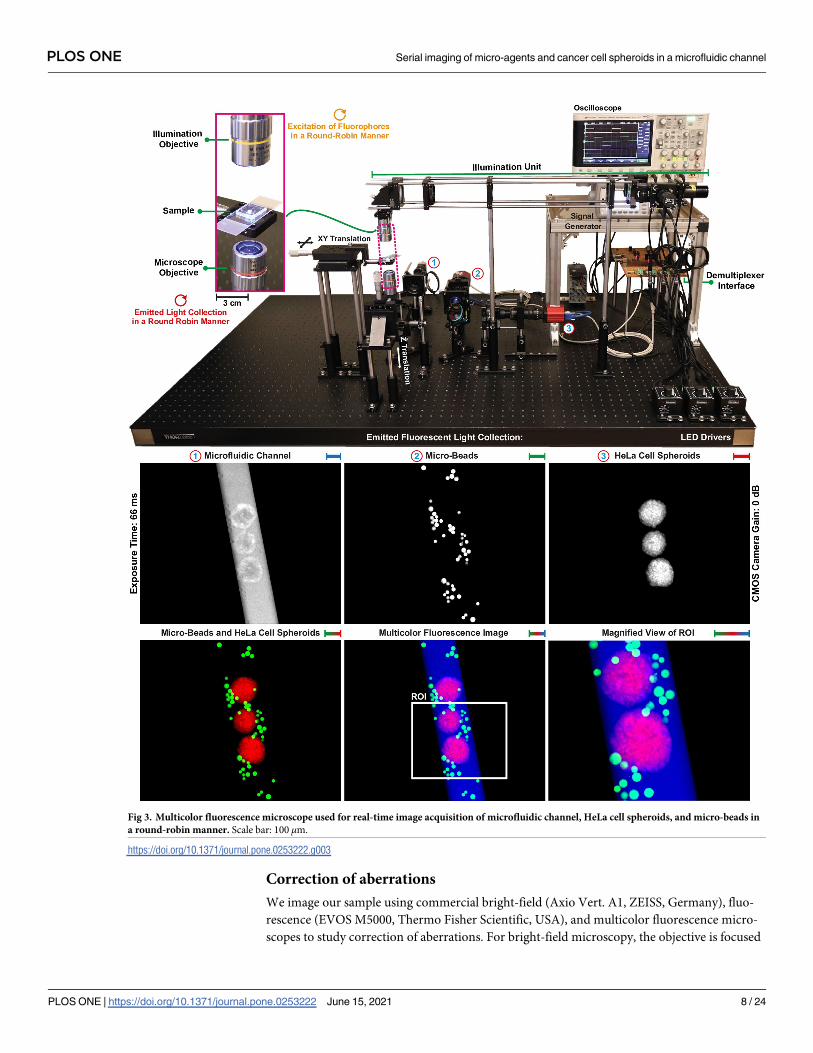
Multicolor fluorescence image acquisition
We report the performance of the multicolor fluorescence microscope by imaging micro-
beads and HeLa cell spheroids placed inside a microfluidic channel. Fluorophores are excited
between 450 nm and 490 nm, 554.5 nm and 589.5 nm, and 750 nm and 800 nm, for fluores-
cein, CMTPX, and indocyanine green, respectively (Fig 4(a)). To acquire 8-bit individual gray-
scale images of beads, spheroids, and channel with the minimum noise level, emitted light
from the fluorophores is collected with 0 dB gain and 66 ms exposure time in the wavelength
ranges of 500–540 nm, 592.5–667.5 nm, and 817.5–875.5 nm, respectively. Multicolor fluores-
cence images are formed by overlapping acquired individual fluorescence images with dimen-
sions of 1231 μm × 983μm (horizontal × vertical). Fig 4 shows multicolor image formation for
two representative cases. Acquired individual grayscale images are shown in Fig 4(b)–4(d) and
formed multicolor images are shown in Fig 4(f). For visualization and interpretation of the
multicolor images, intensity values in grayscale images of beads, spheroids, and channel are
represented using black-green, black-red, black-blue color maps, respectively. To reveal fur-
ther details in the multicolor images, the region of interests (ROIs) with dimensions of 521
μm × 417μm are magnified and shown in Fig 4(g). The channel contains higher beads concen-
tration in Fig 4(g2) than Fig 4(g1). Although relatively high bead concentration leads to occlu-
sion in the multicolor image (Fig 4(f2)), individual images include complete visualization of
the beads, spheroids, and channel (Fig 4(b2)–4(d2)). Our experiments validate that multi-color
microscopy enables occlusion-free visualization of the sample by spectrally-different image
acquisition.
PLOS ONE Serial imaging of micro-agents and cancer cell spheroids in a microfluidic channel
PLOS ONE | https://doi.org/10.1371/journal.pone.0253222 June 15, 2021 7 / 24
Correction of aberrations
We image our sample using commercial bright-field (Axio Vert. A1, ZEISS, Germany), fluo-
rescence (EVOS M5000, Thermo Fisher Scientific, USA), and multicolor fluorescence micro-
scopes to study correction of aberrations. For bright-field microscopy, the objective is focused
Fig 3. Multicolor fluorescence microscope used for real-time image acquisition of microfluidic channel, HeLa cell spheroids, and micro-beads in
a round-robin manner. Scale bar: 100 μm.
https://doi.org/10.1371/journal.pone.0253222.g003
PLOS ONE Serial imaging of micro-agents and cancer cell spheroids in a microfluidic channel
PLOS ONE | https://doi.org/10.1371/journal.pone.0253222 June 15, 2021 8 / 24
Fig 4. Multicolor fluorescence image formation. (a1)-(a3) Contour plots represent the spectrum of fluorescein, CellTracker Red
CMTPX, and indocyanine green measured by a spectrofluorometer at varying excitation and emission wavelengths, respectively. (b)-
(d) Acquired raw individual fluorescence images of micro-beads, HeLa cell spheroids, and microfluidic channel from different
spectrum bands, respectively. (e) Merged fluorescence image of beads and spheroids. (f) Formed multicolor fluorescence image by
overlapping acquired spectrally-different individual images. (g) Magnified view of the region of interest (ROI) defined on the
multicolor image for revealing further details. Scale bar: 50 μm.
https://doi.org/10.1371/journal.pone.0253222.g004
PLOS ONE Serial imaging of micro-agents and cancer cell spheroids in a microfluidic channel
PLOS ONE | https://doi.org/10.1371/journal.pone.0253222 June 15, 2021 9 / 24

on the spheroid. Image of the sample is captured using a color CMOS camera (BFLY-PGE-
14S2C-CS, Point Grey, USA) (Fig 5(a1)). Height differences cause the image of beads to be
blurred (Fig 5(a2)). Spectrally-different images are acquired with the fluorescence microscope
by manually selecting color channels and individually focusing the objective on beads, spher-
oid, and channel (Fig 5(b1)). Since the microscope does not have optical components for indo-
cyanine green, fluorescence images of micro-beads and HeLa cell spheroid are acquired. The
microscope is also able to perform bright-field imaging. To obtain visualization of the channel,
the bright-field image of the sample is acquired (Fig 5(b2)). Full visualization of the sample is
obtained by overlapping acquired fluorescence and bright-field images. Multicolor fluores-
cence image of the sample is shown in Fig 5(c1). Our microscope produces focused image
acquisition from different planes by adjusting the distance between the tube lens and CMOS
cameras (Fig 5(c2)). Thus, the aberrations associated with the size difference between
Fig 5. A microfluidic channel contains micro-beads and a HeLa cell spheroid is imaged with (a1) bright-field (Axio Vert. A1, ZEISS, Germany), (b1)
fluorescence (EVOS M5000, Thermo Fisher, USA), and (c1) our multicolor fluorescence microscopes. (a2)-(c2) Magnified views of the region of
interests (ROIs) cropped from the acquired microscope images. (a3)-(c3) Image gradients of the ROIs for contrast visualization. Scale bar: 50 μm.
https://doi.org/10.1371/journal.pone.0253222.g005
PLOS ONE Serial imaging of micro-agents and cancer cell spheroids in a microfluidic channel
PLOS ONE | https://doi.org/10.1371/journal.pone.0253222 June 15, 2021 10 / 24

micro-objects and lens aberrations are corrected for real-time multicolor fluorescence image
acquisition.
Crosstalk analysis for the multicolor fluorescence microscopy
Crosstalk analysis is carried out to visualize the effect of excitation light and emitted fluores-
cence signals on the acquired individual fluorescence images [14, 39]. Fluorophores are excited
with single, double, and triple combinations of the center wavelengths at 470 nm, 565 nm, and
775 nm. Emitted fluorescence signals are simultaneously acquired from 500–540 nm, 592.5–
667.5 nm, and 817.5–875.5 nm spectrum bands for micro-beads, HeLa cell spheroids, and
microfluidic channel, respectively. According to the status of the center wavelength, we
observe the following:
• 470 nm: ON, 565 nm: OFF, 780 nm: OFF (Fig 6(a1)): Fluorescence signal emitted from
beads is collected without crosstalk from the 500–540 nm band. Relatively low-level crosstalk
makes beads and spheroid visible in the image acquired from 592.5–667.5 nm band. No
crosstalk is observed at the image acquired from the 817.5–875.5 nm band.
• 470 nm: OFF, 565 nm: ON, 780 nm: OFF (Fig 6(a2)): No crosstalk is observed at the images
acquired from the 500–540 nm and 817.5–875.5 nm bands. Fluorescence signal emitted
from spheroid is collected without crosstalk from the 592.5–667.5 nm band.
• 470 nm: OFF, 565 nm: OFF, 780 nm: ON (Fig 6(a3)) and 470 nm: OFF, 565 nm: ON, 780
nm: ON (Fig 6(a5)): No crosstalk is observed at the 500–540 nm band. Emitted light from
the medium inside the channel is collected without crosstalk from the 817.5–875.5 nm band.
The excitation light generated by 780 nm LED is collected from the 592.5–667.5 nm band
and blocks the image acquisition.
• 470 nm: ON, 565 nm: ON, 780 nm: OFF (Fig 6(a4): Fluorescence image of beads is acquired
from 500–540 nm band. The image acquired from the 592.5–667.5 nm band contain beads,
spheroid, and channel as a result of crosstalk. Besides, excitation of CMTPX by 470 nm LED
results in increasing the fluorescence signal intensity emitted from spheroid Fig 1(a). No
crosstalk is observed at 817.5–875.5 nm band.
• 470 nm: ON, 565 nm: OFF, 780 nm: ON (Fig 6(a6)) and 470 nm: ON, 565 nm: ON, 780 nm:
ON (Fig 6(a7)): Spectrum analysis shows that there is no overlap between fluorescein and
indocyanine green (Figs 1(a) and 4(a)). However, the emission filter used for image acquisi-
tion of beads (ET520/40m, Chroma, USA) transmits the light with the wavelength range of
791–1000 nm (Fig 1(g)). Therefore, both beads and channel are visible at the image acquired
from 500–540 nm. Excitation light generated by 780 nm LED blocks the image acquisition
from 592.5–667.5 nm band. Fluorescence image of channel is acquired without crosstalk
from 817.5–875.5 nm band.
The crosstalk is corrected and the blockage is removed by exciting the fluorophores in a
round-robin manner and synchronically trigger cameras for individual image acquisition (Fig
6(a8)). The effect of crosstalk on the individual images acquired using continuous (Fig 6(a7))
and round-robin (Fig 6(a8)) methods is quantified by image quality assessment using struc-
tural similarity index measure (SSIM) metric [41]. Single-band fluorescence images of micro-
beads (500–540 nm band), HeLa cell spheroid (592.5–667.5 nm band), and microfluidic chan-
nel (817.5–875.5 nm band) are used as references for the measurements (Fig 6(a1)–6(a3)).
SSIM values for the individual images of beads (Fig 6(f1)) and spheroid (Fig 6(f2)) acquired
PLOS ONE Serial imaging of micro-agents and cancer cell spheroids in a microfluidic channel
PLOS ONE | https://doi.org/10.1371/journal.pone.0253222 June 15, 2021 11 / 24

Fig 6. Crosstalk analysis. (a) Status of light-emitting diodes. (b)-(d) Acquired fluorescence images from 500–540 nm,
592.5–667.5 nm, and 817.5–875.5 nm spectrum bands, respectively. (e) Formed image by overlapping acquired images.
(f) and (g) Quantitative crosstalk analysis by computing structural similarity measure index between reference images
(REF) and images acquired using continuous (CON) and round-robin (RR) methods, respectively. Scale bar: 100 μm.
https://doi.org/10.1371/journal.pone.0253222.g006
PLOS ONE Serial imaging of micro-agents and cancer cell spheroids in a microfluidic channel
PLOS ONE | https://doi.org/10.1371/journal.pone.0253222 June 15, 2021 12 / 24
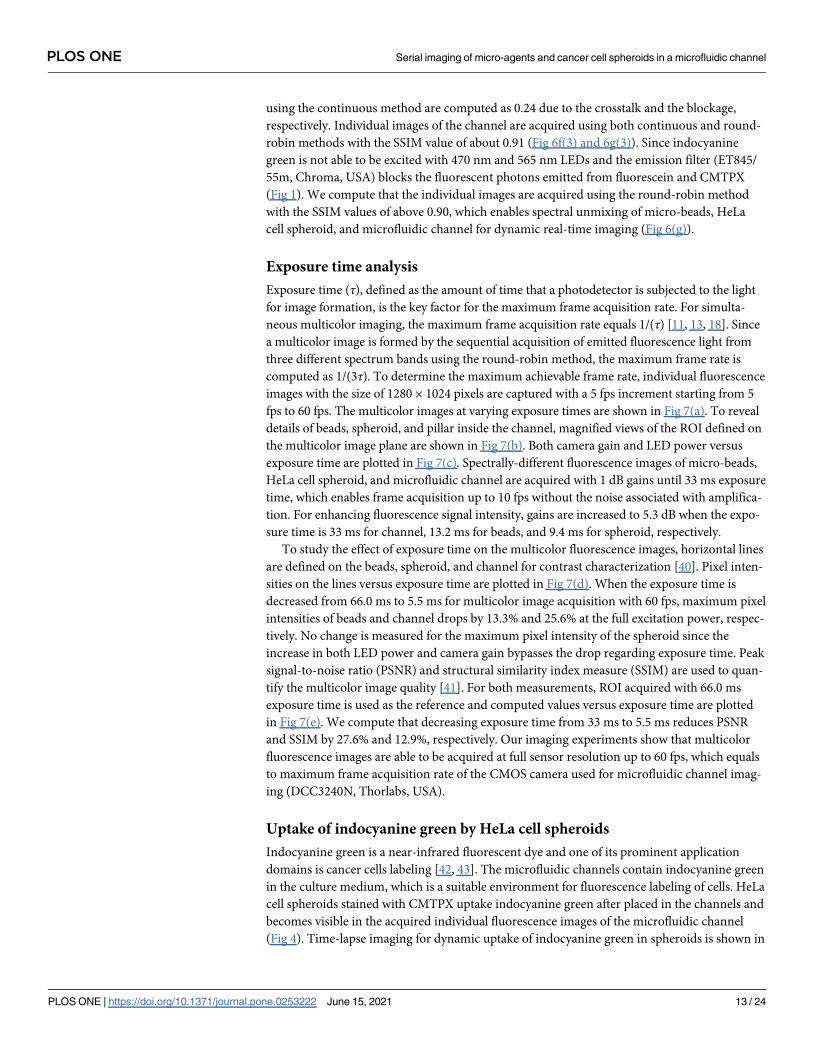
using the continuous method are computed as 0.24 due to the crosstalk and the blockage,
respectively. Individual images of the channel are acquired using both continuous and round-
robin methods with the SSIM value of about 0.91 (Fig 6f(3) and 6g(3)). Since indocyanine
green is not able to be excited with 470 nm and 565 nm LEDs and the emission filter (ET845/
55m, Chroma, USA) blocks the fluorescent photons emitted from fluorescein and CMTPX
(Fig 1). We compute that the individual images are acquired using the round-robin method
with the SSIM values of above 0.90, which enables spectral unmixing of micro-beads, HeLa
cell spheroid, and microfluidic channel for dynamic real-time imaging (Fig 6(g)).
Exposure time analysis
Exposure time (τ), defined as the amount of time that a photodetector is subjected to the light
for image formation, is the key factor for the maximum frame acquisition rate. For simulta-
neous multicolor imaging, the maximum frame acquisition rate equals 1/(τ) [11, 13, 18]. Since
a multicolor image is formed by the sequential acquisition of emitted fluorescence light from
three different spectrum bands using the round-robin method, the maximum frame rate is
computed as 1/(3τ). To determine the maximum achievable frame rate, individual fluorescence
images with the size of 1280 × 1024 pixels are captured with a 5 fps increment starting from 5
fps to 60 fps. The multicolor images at varying exposure times are shown in Fig 7(a). To reveal
details of beads, spheroid, and pillar inside the channel, magnified views of the ROI defined on
the multicolor image plane are shown in Fig 7(b). Both camera gain and LED power versus
exposure time are plotted in Fig 7(c). Spectrally-different fluorescence images of micro-beads,
HeLa cell spheroid, and microfluidic channel are acquired with 1 dB gains until 33 ms exposure
time, which enables frame acquisition up to 10 fps without the noise associated with amplifica-
tion. For enhancing fluorescence signal intensity, gains are increased to 5.3 dB when the expo-
sure time is 33 ms for channel, 13.2 ms for beads, and 9.4 ms for spheroid, respectively.
To study the effect of exposure time on the multicolor fluorescence images, horizontal lines
are defined on the beads, spheroid, and channel for contrast characterization [40]. Pixel inten-
sities on the lines versus exposure time are plotted in Fig 7(d). When the exposure time is
decreased from 66.0 ms to 5.5 ms for multicolor image acquisition with 60 fps, maximum pixel
intensities of beads and channel drops by 13.3% and 25.6% at the full excitation power, respec-
tively. No change is measured for the maximum pixel intensity of the spheroid since the
increase in both LED power and camera gain bypasses the drop regarding exposure time. Peak
signal-to-noise ratio (PSNR) and structural similarity index measure (SSIM) are used to quan-
tify the multicolor image quality [41]. For both measurements, ROI acquired with 66.0 ms
exposure time is used as the reference and computed values versus exposure time are plotted
in Fig 7(e). We compute that decreasing exposure time from 33 ms to 5.5 ms reduces PSNR
and SSIM by 27.6% and 12.9%, respectively. Our imaging experiments show that multicolor
fluorescence images are able to be acquired at full sensor resolution up to 60 fps, which equals
to maximum frame acquisition rate of the CMOS camera used for microfluidic channel imag-
ing (DCC3240N, Thorlabs, USA).
Uptake of indocyanine green by HeLa cell spheroids
Indocyanine green is a near-infrared fluorescent dye and one of its prominent application
domains is cancer cells labeling [42, 43]. The microfluidic channels contain indocyanine green
in the culture medium, which is a suitable environment for fluorescence labeling of cells. HeLa
cell spheroids stained with CMTPX uptake indocyanine green after placed in the channels and
becomes visible in the acquired individual fluorescence images of the microfluidic channel
(Fig 4). Time-lapse imaging for dynamic uptake of indocyanine green in spheroids is shown in
PLOS ONE Serial imaging of micro-agents and cancer cell spheroids in a microfluidic channel
PLOS ONE | https://doi.org/10.1371/journal.pone.0253222 June 15, 2021 13 / 24

Fig 7. (a) Multicolor fluorescence images at varying exposure times. (b) Magnified view of the region of interest
(ROI). (c1) and (c2) Camera gain and LED power during the image acquisition, respectively. (d1)-(d3) Intensity
profiles of the lines defined on the beads, spheroid, and channel, respectively. (e1) and (e2) Measured peak signal-to-
noise ratio and structural similarity measure index between multicolor images in (b) and the reference (multicolor
image with 66.0 ms exposure time), respectively.
https://doi.org/10.1371/journal.pone.0253222.g007
PLOS ONE Serial imaging of micro-agents and cancer cell spheroids in a microfluidic channel
PLOS ONE | https://doi.org/10.1371/journal.pone.0253222 June 15, 2021 14 / 24

Fig 8(a) and 8(b). The effect of staining a spheroid with CMTPX and indocyanine green uptake
on the formed multicolor fluorescence images are shown in Fig 8(c). CMTPX and indocyanine
green enable dual-color fluorescence microscopy for the spheroid by image acquisition from
592.5–667.5 nm and 817.5–875.5 nm spectrum bands. Therefore, four-color fluorescence
microscopy is performed utilizing fluorescein, CMTPX, and indocyanine green for dynamic
imaging of micro-agents and 3D cancer cell spheroids in a microfluidic setup.
We observe that heating of the illuminated area results in a temperature gradient, which
creates a flow inside the channel. To image the flow, a microfluidic channel contains 250 μg/
ml indocyanine green in the culture medium is continuously excited. The acquired time-lapse
image sequence is shown in Fig 8(d). For the first 81 minutes, indocyanine green bleaches so
pixel intensities drop. The flow starts to bring the non-bleached fluorescent molecules area to
the imaging area at 81-minutes, and pixel intensities start to increase (Fig 8(d2)). The effect of
the flow on a spheroid is shown in Fig 8(b). Indocyanine green uptake is saturated at 30-min-
ute and then the fluorescence signal decreases until 95-minutes as a result of photobleaching.
The spheroid starts to uptake the non-bleached indocyanine green molecules brought by the
flow at 95-minutes (Fig 8(b2)). Our imaging experiments show that the flow created by tem-
perature gradient prolongs the imaging time of both microfluidic channels and HeLa cell
spheroids at 817.5–875.5 nm band by recovering the fluorescence signals [44].
Photobleaching resistance
When a fluorophore starts to be excited, emission light intensity decays over time. After a
decay time, the emission of fluorescence photons is not possible due to irreversible photo-
chemical alterations in the fluorophore molecules. This phenomenon is called photobleaching
[45]. The photobleaching resistance of fluorescein, CMTPX, and indocyanine green is studied
using time-lapse multicolor fluorescence microscopy of micro-beads, HeLa cell spheroids, and
microfluidic channels, respectively. Multicolor fluorescence images are acquired under con-
stant excitation power for 60 minutes with 66.0 ms, 33.0, 22.0, and 16.5 ms exposure times (Fig
9(a)). To express the effect of the photobleaching mechanism on the emitted fluorescence
intensity, the normalized average intensity profiles of beads, spheroids, and channels over time
are plotted in Fig 9(b). When the exposure time is 16.5 ms, we compute that the normalized
average intensity of beads, spheroids, and channels decreases to 0.8 at 1.1 minutes, 29.5 min-
utes, and 60.0 minutes, respectively. Compared to fluorescein and indocyanine green, CMTPX
exhibits a greater photobleaching resistance. Although beads and channels are not fully visible
in the fluorescence images due to photobleaching, the spheroids are imaged with the normal-
ized average intensity of more than 0.8 (Fig 9(a3) and 9(a4)). We also observe that the flow cre-
ated by temperature gradient and indocyanine green uptake by spheroids create a fluctuation
in the intensity profile of the microfluidic channel (Figs 8 and 9(b3)). The flow also fully recov-
ers fluorescence imaging of microfluidic channel when the exposure time is 66.0 ms. Fluores-
cence recovery is not observed when the exposure time is lower than 66.0 ms. Imaging with
higher exposure times increases the rate of recovery owing to a decrease in the photodamage
on the fluorescence molecules brought by the flow [44].
Photodamage analysis
Performing excitation in a round-robin manner inherently prolongs the fluorescence imaging
time by reducing the photodamage on the fluorophores. To monitor the effect of photodamage
on fluorescein, CMTPX, and indocyanine green, time-lapse fluorescence microscopy with
continuous and round-robin excitation methods is performed for micro-beads, HeLa cell
spheroids, and microfluidic channel, respectively (Fig 10). Photobleaching curves are obtained
PLOS ONE Serial imaging of micro-agents and cancer cell spheroids in a microfluidic channel
PLOS ONE | https://doi.org/10.1371/journal.pone.0253222 June 15, 2021 15 / 24
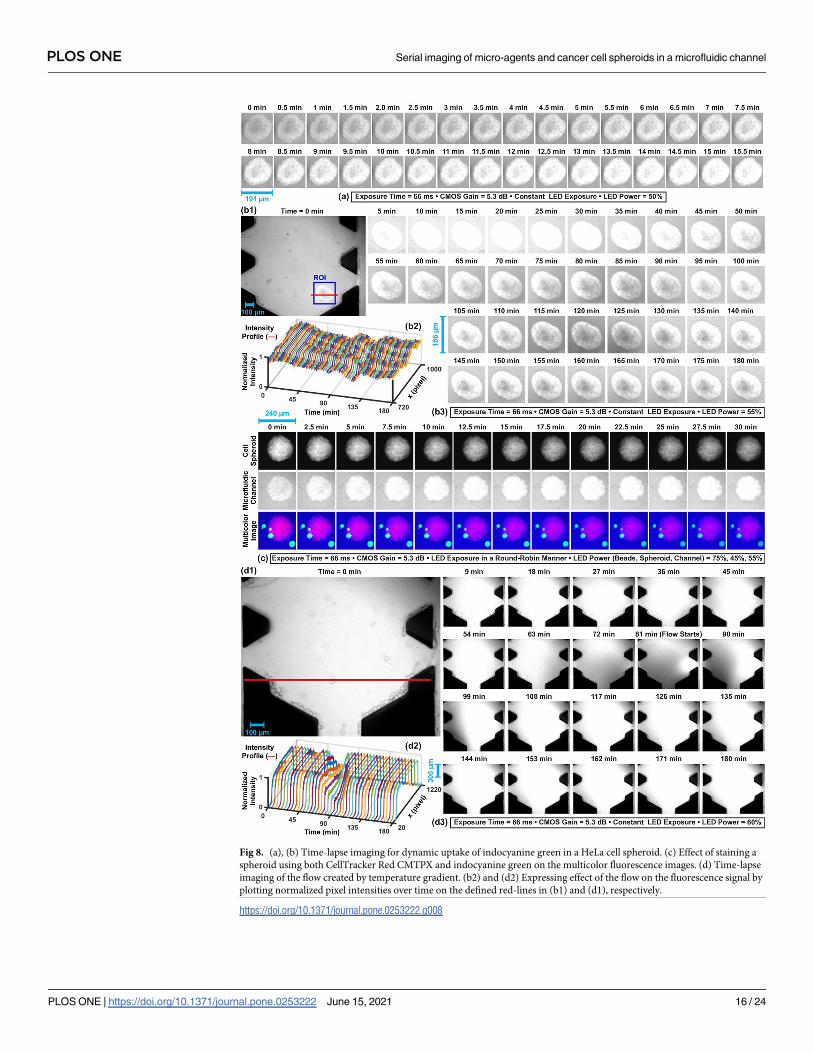
Fig 8. (a), (b) Time-lapse imaging for dynamic uptake of indocyanine green in a HeLa cell spheroid. (c) Effect of staining a
spheroid using both CellTracker Red CMTPX and indocyanine green on the multicolor fluorescence images. (d) Time-lapse
imaging of the flow created by temperature gradient. (b2) and (d2) Expressing effect of the flow on the fluorescence signal by
plotting normalized pixel intensities over time on the defined red-lines in (b1) and (d1), respectively.
https://doi.org/10.1371/journal.pone.0253222.g008
PLOS ONE Serial imaging of micro-agents and cancer cell spheroids in a microfluidic channel
PLOS ONE | https://doi.org/10.1371/journal.pone.0253222 June 15, 2021 16 / 24

Fig 9. The effect of photobleaching mechanism on multicolor fluorescence microscopy under constant excitation
power. (a) Time-lapse multicolor fluorescence images at varying exposure times. (b1)-(b3) Normalized average
intensity profiles of micro-beads, HeLa cell spheroids, and microfluidic channel, respectively. Scale bar: 100 μm.
https://doi.org/10.1371/journal.pone.0253222.g009
PLOS ONE Serial imaging of micro-agents and cancer cell spheroids in a microfluidic channel
PLOS ONE | https://doi.org/10.1371/journal.pone.0253222 June 15, 2021 17 / 24

Fig 10. The effect of continuous and round-robin excitation methods on photodamage mechanism. (a1)-(c1) Acquired time-lapse
fluorescence images of micro-beads, HeLa cell spheroids, and microfluidic channel, respectively. (a2)-(c2) Photobleaching curves by
computing normalized average pixel intensity in each image. (a3)-(a4)—(c3)-(c4) Intensity profiles of the lines defined on beads,
spheroids, and channel, respectively. Scale bar: 100 μm.
https://doi.org/10.1371/journal.pone.0253222.g010
PLOS ONE Serial imaging of micro-agents and cancer cell spheroids in a microfluidic channel
PLOS ONE | https://doi.org/10.1371/journal.pone.0253222 June 15, 2021 18 / 24

by computing normalized average intensity over time for photodamage characterization (Fig
10(a2)–10(c2)). Our experiments show that the round-robin excitation method increases the
fluorescence half-lives of beads, spheroids, and channels 2.0-fold, 1.6-fold, and 1.5-fold,
respectively. Approximately 0.5-fold drop in the half-lives of spheroid and channel is measured
since CMTPX and indocyanine green are also excited by LEDs with the center wavelengths of
470 nm and 565 nm as a result of spectral overlap, respectively (Fig 6). We also observe that
the flow created by temperature gradient does not occur with the continuous excitation due to
relatively high excitation power [44]. On the other hand, round-robin excitation enables flow
generation and fluorescence signal recovery of the channel by decreasing the photodamage on
the indocyanine green.
Real-time multicolor fluorescence microscopy
HeLa cell spheroids and polystyrene micro-beads are negatively and positively charged,
respectively. Utilizing electrostatic forces, beads are able to be attached to the surface of spher-
oids without functionalization, which a self-assembly method used for bio-hybrid micro-agent
fabrication [46]. As a representative application, the attachment of micro-beads to a HeLa cell
spheroid in a microfluidic channel is imaged using multicolor fluorescence microscopy. For
the imaging experiment, the channel is fixed on the sample holder attached to a translation
stage (PT3/M, Thorlabs, USA). The holder is manually and randomly moved in horizontal
and vertical directions until no further bead capture by the spheroid takes place due to the neu-
tralization (Fig 11). Individual fluorescence images of the beads, spheroid, and channel are
acquired with 22 ms exposure time and 5.3 dB gain at 15 fps and overlaid to form multicolor
images. The motion of beads, spheroid, and channel between consecutive individual fluores-
cence images are analyzed using the Lukas-Kanade optical flow technique [47]. The analyzed
motion at 63 seconds and 518 seconds is represented as three independent vector fields and
overlaid onto the fluorescence images (Fig 11(c)). Our experiment shows that individual
motion of micro-agents, 3D cancer cell spheroids, and microfluidic setup is able to be imaged
in real-time by spectrally different image acquisition.
Conclusions
This study presents multicolor fluorescence microscopy to visualize polymeric drug carriers,
organic bodies, as well as their surroundings. Polystyrene micro-beads and HeLa cell spher-
oids are employed as an example of polymeric drug carriers and organic bodies, respectively.
We develop a simplified 3D tumor model to validate spectrally-different image acquisition of
beads, spheroids, and channel, using multicolor fluorescence microscopy. A multicolor wide-
field fluorescence microscope is developed as a tool to acquire images from three different
spectrum bands using a common optical path. To correct the spectral crosstalk, fluorophores
with fairly well-separated emission spectra are excited in a round-robin manner and the
emitted light is synchronously collected. In this study, we experimentally validate that multi-
color fluorescence microscopy enables crosstalk-free visualization of beads, spheroids, and
channel by individual image acquisition from different spectrum bands with a minimum
exposure time of 5.5 ms. Our measurements show that multicolor fluorescence microscopy
using round-robin method provide clear visualization by containing direct segmentation of
beads, spheroids, and channel. We utilize multicolor fluorescence microscopy for real-time
visualization of the interaction between drug carriers and cancer cells in a microfluidic
channel.
PLOS ONE Serial imaging of micro-agents and cancer cell spheroids in a microfluidic channel
PLOS ONE | https://doi.org/10.1371/journal.pone.0253222 June 15, 2021 19 / 24

Fig 11. Multicolor fluorescence microscopy for the attachment of polystyrene micro-beads to a HeLa cell spheroid
surface utilizing electrostatic forces. (a) Time-lapse multicolor fluorescence image sequence acquired at 15 frames
per second. (b) The analyzed motion using Lukas-Kanade optical flow in ROI(1) and ROI(2) at 63 seconds and 518
seconds is represented as vector fields and overlaid on the fluorescence images. The spectrally different motion
information of beads, spheroid, and channel is represented using green, red, and blue arrows, respectively. (c) Time-
lapse fluorescence image sequence of beads and spheroid. (d) Neutral HeLa cell spheroid covered with micro-beads.
(e) Gradients of the images in (d) for contrast visualization. Scale bar: 100 μm.
https://doi.org/10.1371/journal.pone.0253222.g011
PLOS ONE Serial imaging of micro-agents and cancer cell spheroids in a microfluidic channel
PLOS ONE | https://doi.org/10.1371/journal.pone.0253222 June 15, 2021 20 / 24

Supporting information
S1 Fig. Demultiplexer circuit diagram. Schematic representation of the demultiplexer inter-
face used for preventing crosstalk between fluorophores by synchronically triggering light-
emitting diodes (LEDs) and complementary metal-oxide-semiconductor (CMOS) cameras in
a round-robin manner using two individual pulse trains. (a and c) Architecture and computed
frequency response plot of the demultiplexer circuit. (b) Timing diagram for input pulse trains
generated using a signal generator (33510B, Keysight, USA) and output trigger signals for each
LED and CMOS sensor combination.
(PDF)
Author Contributions
Conceptualization: Mert Kaya, Fabian Stein, Jeroen Rouwkema, Islam S. M. Khalil, Sarthak
Misra.
Data curation: Mert Kaya, Fabian Stein.
Formal analysis: Mert Kaya, Fabian Stein, Jeroen Rouwkema, Islam S. M. Khalil, Sarthak
Misra.
Funding acquisition: Sarthak Misra.
Investigation: Mert Kaya, Fabian Stein.
Methodology: Mert Kaya, Fabian Stein, Islam S. M. Khalil.
Project administration: Mert Kaya, Fabian Stein, Sarthak Misra.
Resources: Mert Kaya, Fabian Stein.
Software: Mert Kaya.
Supervision: Jeroen Rouwkema, Islam S. M. Khalil, Sarthak Misra.
Validation: Mert Kaya, Fabian Stein, Jeroen Rouwkema, Islam S. M. Khalil, Sarthak Misra.
Visualization: Mert Kaya, Fabian Stein.
Writing – original draft: Mert Kaya, Fabian Stein.
Writing – review & editing: Mert Kaya, Fabian Stein, Jeroen Rouwkema, Islam S. M. Khalil,
Sarthak Misra.
References1. Rosenholm JM, Sahlgren C, Linden M. Towards multifunctional, targeted drug delivery systems using
mesoporous silica nanoparticles–opportunities & challenges. Nanoscale. 2010; 2(10):1870–83. https://
doi.org/10.1039/c0nr00156b PMID: 20730166
2. Ahn J, Ko J, Lee S, Yu J, Kim Y, Jeon NL. Microfluidics in nanoparticle drug delivery; From synthesis to
pre-clinical screening. Advanced drug delivery reviews. 2018 Mar 15; 128:29–53. https://doi.org/10.
1016/j.addr.2018.04.001 PMID: 29626551
3. Wu J, Zheng G, Lee LM. Optical imaging techniques in microfluidics and their applications. Lab on a
Chip. 2012; 12(19):3566–75. https://doi.org/10.1039/c2lc40517b PMID: 22878811
4. Srivastava SK, Medina-Sanchez M, Koch B, Schmidt OG. Medibots: dual-action biogenic microdaggers
for single cell surgery and drug release. Advanced Materials. 2016 Feb; 28(5):832–7. https://doi.org/
10.1002/adma.201504327 PMID: 26619085
5. Li J, Li X, Luo T, Wang R, Liu C, Chen S, et al. Development of a magnetic microrobot for carrying and
delivering targeted cells. Science Robotics. 2018 Jun 27; 3(19). https://doi.org/10.1126/scirobotics.
aat8829 PMID: 33141689
PLOS ONE Serial imaging of micro-agents and cancer cell spheroids in a microfluidic channel
PLOS ONE | https://doi.org/10.1371/journal.pone.0253222 June 15, 2021 21 / 24
6. Yan X, Xu J, Zhou Q, Jin D, Vong CI, Feng Q, et al. Molecular cargo delivery using multicellular mag-
netic microswimmers. Applied Materials Today. 2019 Jun 1; 15:242–51. https://doi.org/10.1016/j.apmt.
2019.02.006
7. Yang L, Zhang Y, Vong CI, Zhang L. Automated control of multifunctional magnetic spores using fluo-
rescence imaging for microrobotic cargo delivery. In 2018 IEEE/RSJ International Conference on Intelli-
gent Robots and Systems (IROS) 2018 Oct 1 (pp. 1-6). IEEE.
8. Servant A, Qiu F, Mazza M, Kostarelos K, Nelson BJ. Controlled in vivo swimming of a swarm of bacte-
ria-like microrobotic flagella. Advanced Materials. 2015 May; 27(19):2981–8. https://doi.org/10.1002/
adma.201404444 PMID: 25850420
9. Pane S, Puigmartı-Luis J, Bergeles C, Chen XZ, Pellicer E, Sort J, et al. Imaging technologies for bio-
medical micro-and nanoswimmers. Advanced Materials Technologies. 2019 Apr; 4(4):1800575.
https://doi.org/10.1002/admt.201800575
10. Alapan Y, Yasa O, Schauer O, Giltinan J, Tabak AF, Sourjik V, et al. Soft erythrocyte-based bacterial
microswimmers for cargo delivery. Science Robotics. 2018 Apr 25; 3(17). https://doi.org/10.1126/
scirobotics.aar4423 PMID: 33141741
11. Park KS, Kim DU, Lee J, Kim GH, Chang KS. Simultaneous multicolor imaging of wide-field epi-fluores-
cence microscopy with four-bucket detection. Biomedical optics express. 2016 Jun 1; 7(6):2285–94.
https://doi.org/10.1364/BOE.7.002285 PMID: 27375944
12. Webb SE, Zanetti-Domingues L, Coles BC, Rolfe DJ, Wareham RJ, Martin-Fernandez ML. Multicolour
single molecule imaging on cells using a supercontinuum source. Biomedical optics express. 2012 Mar
1; 3(3):400–6. https://doi.org/10.1364/BOE.3.000400 PMID: 22435089
13. Wang K, Liu TM, Wu J, Horton NG, Lin CP, Xu C. Three-color femtosecond source for simultaneous
excitation of three fluorescent proteins in two-photon fluorescence microscopy. Biomedical optics
express. 2012 Sep 1; 3(9):1972–7. https://doi.org/10.1364/BOE.3.001972 PMID: 23024893
14. Licea-Rodriguez J, Figueroa-Melendez A, Falaggis K, Sanchez MP, Riquelme M, Rocha-Mendoza I.
Multicolor fluorescence microscopy using static light sheets and a single-channel detection. Journal of
biomedical optics. 2019 Jan; 24(1):016501. https://doi.org/10.1117/1.JBO.24.1.016501
15. Zhou X, Lei M, Dan D, Yao B, Yang Y, Qian J, et al. Image recombination transform algorithm for super-
resolution structured illumination microscopy. Journal of biomedical optics. 2016 Sep; 21(9):096009.
https://doi.org/10.1117/1.JBO.21.9.096009 PMID: 27653935
16. Abdeladim L, Matho KS, Clavreul S, Mahou P, Sintes JM, Solinas X, et al. Multicolor multiscale brain
imaging with chromatic multiphoton serial microscopy. Nature communications. 2019 Apr 10; 10(1):1–
4. https://doi.org/10.1038/s41467-019-10225-w
17. Rakhymzhan A, Leben R, Zimmermann H, Gunther R, Mex P, Reismann D, et al. Synergistic strategy
for multicolor two-photon microscopy: application to the analysis of germinal center reactions in vivo.
Scientific reports. 2017 Aug 2; 7(1):1–6. https://doi.org/10.1038/s41598-017-07165-0 PMID: 28769068
18. Li Q, Chen P, Fan Y, Wang X, Xu K, Li L, et al. Multicolor fluorescence detection-based microfluidic
device for single-cell metabolomics: simultaneous quantitation of multiple small molecules in primary
liver cells. Analytical chemistry. 2016 Sep 6; 88(17):8610–6. https://doi.org/10.1021/acs.analchem.
6b01775 PMID: 27503398
19. Sung Y, Campa F, Shih WC. Open-source do-it-yourself multi-color fluorescence smartphone micros-
copy. Biomedical optics express. 2017 Nov 1; 8(11):5075–86. https://doi.org/10.1364/BOE.8.005075
PMID: 29188104
20. Aguilar-Avelar C, Soto-Garcıa B, Araiz-Hernandez D, Yee-de Leon JF, Esparza M, Chacon F, et al.
High-throughput automated microscopy of circulating tumor cells. Scientific reports. 2019 Sep 24; 9
(1):1–9. https://doi.org/10.1038/s41598-019-50241-w PMID: 31551445
21. Doronina-Amitonova LV, Fedotov IY, Efimova O, Chernysheva M, Fedotov AB, Anokhin KV, et al. Multi-
color in vivo brain imaging with a microscope-coupled fiber-bundle microprobe. Applied Physics Letters.
2012 Dec 3; 101(23):233702. https://doi.org/10.1063/1.4767386
22. Stringari C, Abdeladim L, Malkinson G, Mahou P, Solinas X, Lamarre I, et al. Multicolor two-photon
imaging of endogenous fluorophores in living tissues by wavelength mixing. Scientific reports. 2017 Jun
19; 7(1):1–1. https://doi.org/10.1038/s41598-017-03359-8 PMID: 28630487
23. Tristan-Landin SB, Gonzalez-Suarez AM, Jimenez-Valdes RJ, Garcia-Cordero JL. Facile assembly of
an affordable miniature multicolor fluorescence microscope made of 3D-printed parts enables detection
of single cells. PloS one. 2019 Oct 10; 14(10):e0215114. https://doi.org/10.1371/journal.pone.0215114
PMID: 31600202
24. Hu C, Kerppola T. Simultaneous visualization of multiple protein interactions in living cells using multi-
color fluorescence complementation analysis. Nature Biotechnology. 2003; 21(5):539–545. https://doi.
org/10.1038/nbt816 PMID: 12692560
PLOS ONE Serial imaging of micro-agents and cancer cell spheroids in a microfluidic channel
PLOS ONE | https://doi.org/10.1371/journal.pone.0253222 June 15, 2021 22 / 24

25. Larson DR, Zipfel WR, Williams RM, Clark SW, Bruchez MP, Wise FW, et al. Water-soluble quantum
dots for multiphoton fluorescence imaging in vivo. Science. 2003; 300(5624):1434–1436. https://doi.
org/10.1126/science.1083780 PMID: 12775841
26. Verkhovskii RA, Kozlova AA, Sindeeva OA, Kozhevnikov IO, Prikhozhdenko ES, Mayorova OA, et al.
Lightsheet-based flow cytometer for whole blood with the ability for the magnetic retrieval of objects
from the blood flow. Biomedical optics express. 2021 Jan 1; 12(1):380–94. https://doi.org/10.1364/
BOE.413845 PMID: 33659080
27. Li KC, Huang LL, Liang JH, Chan MC. Simple approach to three-color two-photon microscopy by a
fiber-optic wavelength convertor. Biomedical optics express. 2016 Nov 1; 7(11):4803–15. https://doi.
org/10.1364/BOE.7.004803 PMID: 27896017
28. Pouponneau P, Bringout G, Martel S. Therapeutic magnetic microcarriers guided by magnetic reso-
nance navigation for enhanced liver chemoembilization: a design review. Annals of biomedical engi-
neering. 2014 May; 42(5):929–939. https://doi.org/10.1007/s10439-014-0972-1 PMID: 24435657
29. Xu H, Medina-Sanchez M, Magdanz V, Schwarz L, Hebenstreit F, Schmidt O. Sperm-Hybrid Micromo-
tor for Targeted Drug Delivery. ACS Nano. 2017; 12(1):327–337. https://doi.org/10.1021/acsnano.
7b06398 PMID: 29202221
30. Nelson BJ, Kaliakatsos IK, Abbott JJ. Microrobots for minimally invasive medicine. Annual review of bio-
medical engineering. 2010; 12(1):55–85. https://doi.org/10.1146/annurev-bioeng-010510-103409
PMID: 20415589
31. Yang C, Hou V, Nelson L, Seibel E. Mitigating fluorescence spectral overlap in wide-field endoscopic
imaging. Journal of Biomedical Optics. 2013; 18(8):086012. https://doi.org/10.1117/1.JBO.18.8.086012
PMID: 23966226
32. Zimmermann T, Rietdorf J, Pepperkok R. Spectral imaging and its applications in live cell microscopy.
FEBS Letters. 2003; 546(1):87–92. https://doi.org/10.1016/S0014-5793(03)00521-0 PMID: 12829241
33. Jung B, Vullev VI, Anvari B. Revisiting indocyanine green: effects of serum and physiological tempera-
ture on absorption and fluorescence characteristics. IEEE Journal of Selected Topics in Quantum Elec-
tronics. 2013 Aug 15; 20(2):149–57. https://doi.org/10.1109/JSTQE.2013.2278674
34. Avci O, Campana MI, Yurdakul C, Unlu MS. Pupil function engineering for enhanced nanoparticle visi-
bility in wide-field interferometric microscopy. Optica. 2017 Feb 20; 4(2):247–54. https://doi.org/10.
1364/OPTICA.4.000247
35. Rivron NC, Vrij EJ, Rouwkema J, Le Gac S, van den Berg A, Truckenmuller RK, et al. Tissue deforma-
tion spatially modulates VEGF signaling and angiogenesis. Proceedings of the National Academy of
Sciences. 2012 May 1; 109(18):6886–91. https://doi.org/10.1073/pnas.1201626109 PMID: 22511716
36. Xia Y, Whitesides GM. Soft lithography. Annual review of materials science. 1998 Aug; 28(1):153–84.
https://doi.org/10.1146/annurev.matsci.28.1.153 PMID: 29711088
37. Park S, Kim J, Jeon M, Song J, Kim C. In vivo photoacoustic and fluorescence cystography using clini-
cally relevant dual modal indocyanine green. Sensors. 2014 Oct; 14(10):19660–8. https://doi.org/10.
3390/s141019660 PMID: 25337743
38. Abrahamsson S, Chen J, Hajj B, Stallinga S, Katsov AY, Wisniewski J, et al. Fast multicolor 3D imaging
using aberration-corrected multifocus microscopy. Nature methods. 2013 Jan; 10(1):60–3. https://doi.
org/10.1038/nmeth.2277 PMID: 23223154
39. Bates M, Dempsey GT, Chen KH, Zhuang X. Multicolor super-resolution fluorescence imaging via
multi-parameter fluorophore detection. ChemPhysChem. 2012 Jan 16; 13(1):99. https://doi.org/10.
1002/cphc.201100735 PMID: 22213647
40. Mudanyali O, McLeod E, Luo W, Greenbaum A, Coskun AF, Hennequin Y, et al. Wide-field optical
detection of nanoparticles using on-chip microscopy and self-assembled nanolenses. Nature photonics.
2013 Mar; 7(3):247–54. https://doi.org/10.1038/nphoton.2012.337 PMID: 24358054
41. Wang Z, Bovik AC, Sheikh HR, Simoncelli EP. Image quality assessment: from error visibility to struc-
tural similarity. IEEE transactions on image processing. 2004 Apr 13; 13(4):600–12. https://doi.org/10.
1109/TIP.2003.819861 PMID: 15376593
42. Aydoğan F, Arıkan AE, Aytac E, Velidedeoğlu M, Yılmaz MH, Sager MS, et al. Sentinel lymph node
biopsy under fluorescent indocyanin green guidance: Initial experience. Turkish Journal of Surgery/Ulu-
sal cerrahi dergisi. 2016; 32(1):50. https://doi.org/10.5152/UCD.2015.2832 PMID: 26985159
43. Ruhi MK, Ak A, Gulsoy M. Dose-dependent photochemical/photothermal toxicity of indocyanine green-
based therapy on three different cancer cell lines. Photodiagnosis and photodynamic therapy. 2018 Mar
1; 21:334–43. https://doi.org/10.1016/j.pdpdt.2018.01.008 PMID: 29339061
44. Reits EA, Neefjes JJ. From fixed to FRAP: measuring protein mobility and activity in living cells. Nature
cell biology. 2001 Jun 1; 3(6):E145–7. https://doi.org/10.1038/35078615 PMID: 11389456
PLOS ONE Serial imaging of micro-agents and cancer cell spheroids in a microfluidic channel
PLOS ONE | https://doi.org/10.1371/journal.pone.0253222 June 15, 2021 23 / 24

45. Bernas T, Zarebski M, Cook RR, Dobrucki JW. Minimizing photobleaching during confocal microscopy
of fluorescent probes bound to chromatin: role of anoxia and photon flux. Journal of microscopy. 2004
Sep; 215(3):281–96. https://doi.org/10.1111/j.0022-2720.2004.01377.x PMID: 15312193
46. Magdanz V, Khalil IS, Simmchen J, Furtado GP, Mohanty S, Gebauer J, et al. IRONSperm: Sperm-tem-
plated soft magnetic microrobots. Science advances. 2020 Jul 1; 6(28):eaba5855. https://doi.org/10.
1126/sciadv.aba5855 PMID: 32923590
47. Lucas BD, Kanade T. An iterative image registration technique with an application to stereo vision.
PLOS ONE Serial imaging of micro-agents and cancer cell spheroids in a microfluidic channel
PLOS ONE | https://doi.org/10.1371/journal.pone.0253222 June 15, 2021 24 / 24


![North Carolina register [serial] - NC.gov](https://static.fdokumen.com/doc/165x107/6327f539e491bcb36c0b8a23/north-carolina-register-serial-ncgov.jpg)
![Yackety yack [serial]](https://static.fdokumen.com/doc/165x107/6328fdedcedd78c2b50e548e/yackety-yack-serial.jpg)