Self-organized criticality in the substorm phenomenon and its relation to localized reconnection in...
35
08/25/99 The role of self-organized criticality in the substorm phenomenon and its relation to localized reconnection in the magnetospheric plasma sheet A. J. Klimas NASA / Goddard Space Flight Center, Greenbelt, Maryland J. A. Valdivia Universities Space Research Association, Seabrook, Maryland D. Vassiliadis Universities Space Research Association, Seabrook, Maryland D. N. Baker Laboratory for Atmospheric and Space Physics, University of Colorado, Boulder, Colorado M. Hesse NASA / Goddard Space Flight Center, Greenbelt, Maryland J. Takalo Visiting Scientist, NASA / Goddard Space Flight Center, Greenbelt, Maryland Abstract. Evidence is presented that suggests there is a significant self-organized criticality (SOC) component in the dynamics of substorms in the magnetosphere. Observations of BBFs, fast flows, localized dipolarizations, plasma turbulence, etc. are taken to show that multiple localized reconnection sites provide the basic avalanche phenomenon in the estab- lishment of SOC in the plasma sheet. First results are presented from a continuing plasma physical study of this avalanche process. A one-dimensional resistive MHD model of a mag- netic field reversal is discussed. Resistivity, in this model, is self-consistently generated in re- sponse to the excitation of an idealized current-driven instability. When forced by convection of magnetic flux into the field reversal region, the model yields rapid magnetic field annihi- lation through a dynamic behavior that is shown to exhibit many of the characteristics of SOC. Over a large range of forcing strengths, the annihilation rate is shown to self-adjust to
Transcript of Self-organized criticality in the substorm phenomenon and its relation to localized reconnection in...
08/25/99
The role of self-organized criticality in the substorm
phenomenon and its relation to localized reconnection in the
magnetospheric plasma sheet
A. J. Klimas
NASA / Goddard Space Flight Center, Greenbelt, Maryland
J. A. Valdivia
Universities Space Research Association, Seabrook, Maryland
D. Vassiliadis
Universities Space Research Association, Seabrook, Maryland
D. N. Baker
Laboratory for Atmospheric and Space Physics, University of Colorado, Boulder, Colorado
M. Hesse
NASA / Goddard Space Flight Center, Greenbelt, Maryland
J. Takalo
Visiting Scientist, NASA / Goddard Space Flight Center, Greenbelt, Maryland
Abstract. Evidence is presented that suggests there is a significant self-organized criticality
(SOC) component in the dynamics of substorms in the magnetosphere. Observations of
BBFs, fast flows, localized dipolarizations, plasma turbulence, etc. are taken to show that
multiple localized reconnection sites provide the basic avalanche phenomenon in the estab-
lishment of SOC in the plasma sheet. First results are presented from a continuing plasma
physical study of this avalanche process. A one-dimensional resistive MHD model of a mag-
netic field reversal is discussed. Resistivity, in this model, is self-consistently generated in re-
sponse to the excitation of an idealized current-driven instability. When forced by convection
of magnetic flux into the field reversal region, the model yields rapid magnetic field annihi-
lation through a dynamic behavior that is shown to exhibit many of the characteristics of
SOC. Over a large range of forcing strengths, the annihilation rate is shown to self-adjust to
08/25/99
balance the rate at which flux is convected into the reversal region. Several analogies to mag-
netotail dynamics are discussed: (1) It is shown that the presence of a localized criticality in
the model produces a remarkable stability in the global configuration of the field reversal
while simultaneously exciting extraordinarily dynamic internal evolution. (2) Under steady
forcing, it is shown that a loading-unloading cycle may arise that, as a consequence of the
global stability, is quasi-periodic and, therefore, predictable despite the presence of internal
turbulence in the field distribution. Indeed, it is shown that the global loading-unloading cy-
cle is a consequence of the internal turbulence. (3) It is shown that, under steady, strong
forcing the loading-unloading cycle vanishes. Instead, a recovery from a single unloading
persists indefinitely. The field reversal is globally very steady while internally it is very dy-
namic as field annihilation goes on at the rate necessary to match the strong forcing. From
this result we speculate that steady magnetospheric convection events result when the plasma
sheet has been driven close to criticality over an extended spatial domain. During these
events, we would expect to find localized reconnection sites distributed over the spatial do-
main of near criticality and we would expect to find plasma sheet transport in that domain to
be closely related to that of BBF and fast flow events.
I. Introduction
The magnetospheric substorm is a coherent global phenomenon that evolves predictably through a sequence of
clearly recognizable phases [Baker et al., 1996; 1999]. Recent Geotail spacecraft observations generally support the
near-Earth neutral line (NENL) model of this evolution. In particular, the plasma sheet region 20-30 Re tailward of
Earth has been identified as the most probable location of the NENL early in the substorm expansion phase and the
commencement of recormection at the NENL has been associated with the substorm onset [Nagai et al., 1998].
Within the NENL model, loading of magnetic flux into the magnetotail leads to a substorm growth phase during'
which the plasma and current sheet are stretched tailward and thinned [Pulkkinen et al., 1992; 1994a; 1994b; 1998].
The substorm is predominantly a mechanism for unloading this excess magnetic energy and relieving the stressed
plasma sheet [Baker et al., 1997]. The onset ofreconnection at the NENL is not well understood, but it is clear that a
critical state must be reached for this onset to occur; magnetic flux loading typically proceeds for 50-60 rain before
this critical state can be reached [Baker et al., 1986].
08/25/99
Recentobservationsofthemagnetotailplasmasheethaveshownit to be a dynamic and turbulent region. Borov-
sky et al. [1997] have found strong turbulence in the plasma sheet at = 20 RE tailward of Earth, close to the average
position of the NI_NL; the turbulence is observed at all geomagnetic activity levels. These turbulent magnetic and
velocity fields are most certainly related to the high-speed, bursty bulk flows of the inner central plasma sheet
[Baumjohann et al., 1990; Angelopoulos et al., 1992; 1994; 1996]. Detailed studies of the Geotail plasma sheet data
have revealed high-speed flow bursts, plasma vortices, and corresponding strongly varying magnetic field [Fairfield
et al., 1998; 1999; Lyons et al., 1999]. In the distant tail ( = 200 RE) the turbulent magnetic field forms power-law
power spectra [Hoshino et at, 1994]. Closer to Earth, (< 10 RE) Ohtani et al. [1995; 1998] have described
AMPTE/CCE and SCATHA observations of magnetic fluctuations associated with substorm onset as due to a sys-
tem of turbulent and chaotic filamentary electric currents. Nagai et al. [1998] found that magnetic reconnection in
the vicinity of the NENL lasts for approximately 10 rain, stopping even while the substorm expansion phase pro-
ceeds, implying that reconnection occurs at localized sites that either move rapidly or turn on and offover the course
of a substorm.
The appearance of strong turbulence in the plasma sheet, in particular in the region associated with substorm on-
set, may seem incompatible with the coherence and repeatability of the substorm cycle. It is difficult to understand
the existence of a critical state and the sudden transition from global stability to instability in plasma that is strongly
turbulent even before the transition. It appears that localized, intermittent reconnection plays a role in this transition.
But the mechanism by which these localized, intermittent reconnection sites are organized into the global coherent
magnetospheric substorm remains unexplored [Baker et at, 1999].
Below, we review a variety of evidence that strongly suggests the magnetotail is driven through flux transfer from
the dayside magnetopause into a state of "self-organized criticality" (SOC). It is an important property of physical
systems that evolve into SOC that they self-organize toward a unique global state. In this state, internal small-
spatiotemporal-scale system phenomena are unpredictable and can only be described statistically. Nevertheless, this
critical global state is inevitable, and repeatable. This is the basis, we propose, for the global coherence and repeat-
ability of the substorm phenomenon in the turbulent plasma sheet. At or near substorm onset, the plasma sheet can
be described as being in a global SOC state containing significant small-scale turbulence. A quantitative characteri-
zation of that global SOC state is a primary goal of our research. In this paper we report the first results from this
research.
We study the magnetospheric substorm phenomenon as an avalanche of many small reconnection events in the
turbulent plasma sheet under the assumption that it is in, or near, a SOC state. In the SOC state, such avalanches

08/25/99
occuroverabroaddistributionof spatialandtemporalscales,rangingfromlocalizedevents,whichweassociate
withflowbursts,to"systemwide"events,substorms,inwhichasignificantportionoftheplasmasheetislostinthe
formofplasmoids.Ourapproachisguidedbyseveralrecentstudiesinwhich"sandpile"models[Consolini,1997;
Chapman et al., 1998; Uritsky and Pudovkin, 1998] and "coupled-map lattice" models [Takalo et al., 1999a; 1999b]
(both discussed below) were driven into SOC and then shown to thereby reproduce various measures of substorm
activity. Based on the available evidence for SOC in the plasma sheet, combined with the successes of these early
sandpile and coupled-map lattice model studies, we have begun an investigation of plasma physical models of the
plasma sheet that appear to evolve into SOC. Our goal is to understand the conditions under which the plasma sheet
may evolve into SOC and, further, to understand the role of this plasma sheet in the substorm phenomenon.
In the following section we present primarily observational evidence in support of our contention that the plasma
sheet is in SOC, or something very similar to it. Then, in section III we give a brief review of some basic properties
of systems in SOC and we discuss the relationship between discrete and continuum models of SOC. In section IV
we introduce a resistive MHD model of a magnetic field reversal, relate it to a general model introduced earlier by
Lu [1995a], and present a detailed analysis of the model behavior. Our principal result is a magnetic field reversal
model in which fast field annihilation is achieved through a dynamic process that exhibits many of the properties of
a system in SOC. Section V contains a summary of our results. Although the field reversal model is a highly ideal-
ized representation of the plasma sheet, we are able, nevertheless, to make several conjectures on the magnetotail
substorm dynamics based on our results.
II. Evidence for the Self-Organized Critical Plasma Sheet
Self-organized criticality is a state to which dissipative systems evolve naturally under loading of a conserved
quantity, being unable to unload until reaching a critical state in which a localized threshold instability is excited
which allows rapid transport of the conserved quantity out of the system. It is now well established that loading of
magnetic flux into the magnetotail during the substorm growth phase leads to thinning of the plasma sheet and in-
tensification of the current sheet to the point of instability, and thus unloading [Baker et al., 1996].
Although there is no experimental proof that the magnetotail is in a SOC state, there are several pieces of evi-
dence that support the conjecture quite effectively.
Extended power-law distributions in auroral geomagnetic disturbances
4

08/25/99
An important feature of many systems that exhibit SOC is that they dissipate their stored energy in "avalanches"
characterized by power-law distributions for avalanche size and duration. In addition, power-law power spectra are
found associated with the internal energy dissipation and system output time series. Assuming that the AE index is
an indirect measure of energy dissipation, Consolini [1997] has examined 1 year (1978) of 1 min resolution AE in-
dex data for these effects. To measure avalanche size, Consolini defined a "burst strength"
s=I(AE(t)-LAE)dt (1)fl
in which L_e is a fixed measure of quiet conditions in the AE index and f_ is the time interval over which the con-
dition AE(t) >_LAE is satisfied. Nearly 3000 events were defined in this manner and a distribution of bursts strengths
D(s) was constructed. Consolini found that D(s) 0, s -I over more than 4 decades in burst strength. Consolini also
constructed a power spectrum for these AE index data. The spectrum consists of two power-law spectral regions, the
low frequency portion with slope = -1 and the high frequency portion with slope = -1.9, separated by a break at
the frequency f,, = 1/4.3 hrs "s, in agreement with results that had been obtained earlier by Tsurutani et al. [1990].
In addition, Consolini was able to use the running sandpile model of Hwa and Kardar [ 1992] to reproduce this
power spectrum.
With the assumption that the solar wind input to the magnetosphere can be approximated by stochastic noise, the
results of Consolini are strong evidence that the AE index data are the result of a self-organized critical phenomenon
in the magnetosphere. We assume that this phenomenon occurs in the plasma sheet.
Bursty bulk flow events
We hypothesize local reconnection sites that are much smaller than the dimensions of the plasma sheet and that
provide the basic avalanche phenomenon in the establishment of SOC in the plasma sheet. Bursty bulk flow (BBF)
events containing high-speed flows have been observed in the inner central plasma sheet [Baumjohann et aL, 1990;
Angelopoulos et al., 1992]; these may be related to localized recormection sites. Angelopoulos et al. have shown that
BBFs are short lived events, lasting approximately 10 min and containing very large amplitude velocity peaks last-
ing characteristically 1 min, with both temporal and spatial effects responsible for their bursty nature. These events
are usually associated with magnetic field dipolarizations and ion temperature increases and they are responsible for
most of the earthward transport of magnetic field, plasma density and energy. In a statistical study of bursty bulk
flow events, Angelopoulos et al. [1994] have found that they correlate with the AE index, and they have suggested
that BBFs are associated with geomagnetic activity. In a detailed study of a single BBF, Angelopoulos et al. [1996]
put an upper bound on the spatial extent of the flow in the Y-Z directions at 1-2 RE. Further, they concluded, on the

08/25/99
basis of the flux content convected past the AMPTEflRM spacecraft, that lobe flux reconnection must have occurred
tailward of the spacecraft in this event. On the basis of these observations, Sergeev et al. [1996b] have postulated
impulsive dissipation events, localized in space and time, which are the manifestations of tail reconnection. They
suggested two competitive processes responsible for energy storage and dissipation during substorm and non-
substorm times; a slow reconfiguration associated with energy storage and a sequence of local, sporadic, short-term
energy dissipation events. More recently, Fairfield et al. [1998] studied a single event observed on Geotail in the
near-equatorial magnetotail at 13 RE and 2300 LT and associated with a substorm onset. Fairfield et al. reported in-
tense earthward flow at 2000 krn/s perpendicular to the northward magnetic field and lasting approximately 1 min-
ute. Subsequent to the onset, they noted plasma vortices punctuated by occasional flow bursts and violently varying
magnetic field. Fairfield et al. concluded the rapid flow had a small cross-tail dimension of the order of 1 RE and was
associated with reconnection tailward of the spacecraft. In a continuation of this work, Fairfield et al. [1999] dem-
onstrated the association of isolated ---1 rain fast flows (up to 1000 km/sec) with auroral brightening, AKR onsets,
geosynchronous particle injections, and ground magnetic activity. Fairfield et al. concluded that these phenomena
were initiated in the tail beyond 15 RE, presumably by magnetic recounection. But the particular events studied by
Fairfield et al. [1999] were not associated with auroral expansion. Nagai et al. [ 1998], in a study of many substorm
onsets with Geotail observations, found that magnetic reconnection is localized to the premidnight sector of the
magnetotail at 20-30 RE. Further, they found that, at the position of the spacecraft, magnetic recormection lasts for
approximately 10 min, stopping even while the substorm expansion phase proceeds, and thus implying that recon-
nection occurs at localized sites that either move rapidly or turn on and offover the course ofa substorm.
All of the above observations are consistent with our assumption of multiple localized reconnection sites as the
basic avalanche phenomenon in the establishment of SOC in the plasma sheet.
Self-similar current and magnetic field topologies in the distant plasma sheet
Physical systems that evolve into self-organized criticality are spatially extended and dynamic; they evolve both
temporally and spatially. When in the SOC state these systems exhibit no characteristic time or length scale over a
broad range of such scales. These systems exhibit self-similar spatial structure; i.e., fractal topology. These appear to
be characteristics of the plasma sheet.
Hoshino et al. [1994] have discussed Geotail magnetic field observations in the distant plasma sheet (-- 200 RE) in
terms of a turbulent magnetic reconnection process. They showed that most of the data are characterized by "kink"
power-law power spectra containing two spectral indices separated by a critical frequency.
08125
M:
in ter
fract:.
expla
high_
kink
of s:
orgy.
ran_
et al. [ 1996] have provided an explanation for the magnetic field observations of Hoshino et al. [ 1994]
self-consistent model of the magnetic field structures in the distant plasma sheet. Their model predicts
;etic structures in the range of spatial scales between -- 4x10: km and = 8x10³ kin. Milovanov et al.
_e position of the kink frequency in the Hoshino et al. spectra and predicted the position of a second,
=ency, kink. In addition, they explained the values of the spectral indices on either side of the observed
model is of an ensemble of magnetic field flux tubes with a self-similar spatial distribution in the range
:tales given above. They argued that "... the existence of the two kinks could be a result of self-
.,n of currents and magnetic fields in the distant tail related to the development of fractal topologies in the
?atial scales between 4 x 10² km and 8 x 10s kin."
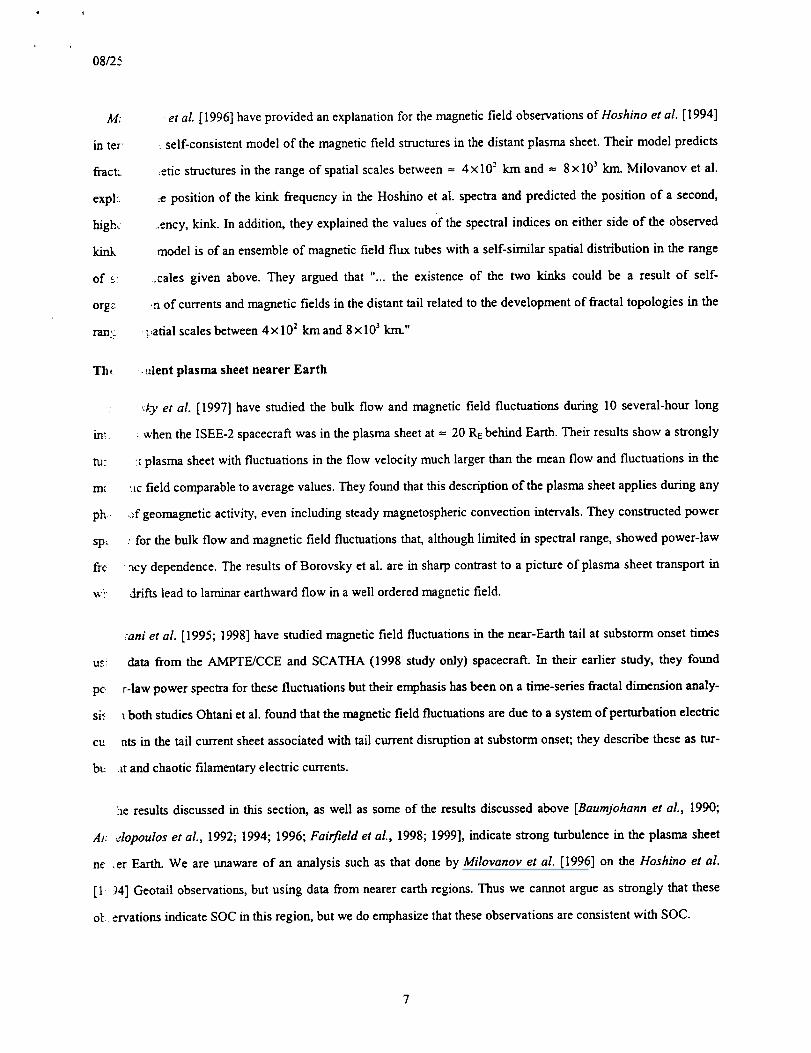
Th,. •,,,.lent plasma sheet nearer Earth
':_.y et al. [1997] have studied the bulk flow and magnetic field fluctuations during 10 several-hour long
int : when the ISEE-2 spacecraft was in the plasma sheet at - 20 RE behind Earth. Their results show a strongly
tu: :: plasma sheet with fluctuations in the flow velocity much larger than the mean flow and fluctuations in the
m_ "_c field comparable to average values. They found that this description of the plasma sheet applies during any
ph. ._f geomagnetic activity, even including steady magnetospheric convection intervals. They constructed power
sp.- , for the bulk flow and magnetic field fluctuations that, although limited in spectral range, showed power-law
fre acy dependence. The results of Borovsky et al. are in sharp contrast to a picture of plasma sheet transport in
w! drifts lead to laminar earthward flow in a well ordered magnetic field.
:aniet al. [1995; 1998] have studied magnetic field fluctuations in the near-Earth tail at substorm onset times
usi data from the AMPTE/CCE and SCATHA (1998 study only) spacecraft. In their earlier study, they found
pc r-law power spectra for these fluctuations but their emphasis has been on a time-series fractal dimension analy-
sit _ both studies Ohtani et al. found that the magnetic field fluctuations are due to a system of perturbation electric
cc ats in the tail current sheet associated with tail current disruption at substorm onset; they describe these as tur-
bt. :Ltand chaotic filamentary electric currents.
:m results discussed in this section, as well as some of the results discussed above [Baumjohann et aL, 1990;
At: elopoulos et al., 1992; 1994; 1996; Fairfield et al., 1998; 1999], indicate strong turbulence in the plasma sheet
ne ,er Earth. We are unaware of an analysis such as that done by Milovanov et al. [1996] on the Hoshino et al.
[1 )4] Geotail observations, but using data from nearer earth regions. Thus we cannot argue as strongly that these
o_ ervations indicate SOC in this region, but we do emphasize that these observations are consistent with SOC.

08/25/99
Pi2 pulsations
These magnetic pulsations are signatures of plasma sheet turbulence and self-organization before the release of
excess energy. As the plasma sheet is compressed during the late growth phase of substorms, a series of Pi2 pulsa-
tions, separated by 5-10 rain, appears shortly before the onset and are considered one of its indicators [Saito et al.,
1976; Sakurai and Saito, 1976]. McPherron and Hsu [1998] have compared the timing information from each Pi2
peak to other indicators (auroral precipitation, poleward retraction of the oval, high-latitude magnetograms) and
have found that the early peaks precede the substorm indicators, while the last one (which they call the "main on-
set") coincides with the other signatures. Their interpretation is that the pulsations correspond to local plasma sheet
regions becoming temporarily unstable, but their effect is quenched before it can affect global stability. Hence the
growth phase does not evolve monotonically towards onset, but goes through several metastable or even locally un-
stable states. This is strikingly similar to the conditions for a system to develop self-organized criticality [Lu,
1995a].
Low-dimensional magnetospheric dynamics
The magnetosphere behaves as a low-dimensional dynamical system in many respects [Klimas et al., 1996].
Modem input-output methods, which either rely on the system being low dimensional, or show that it is low dimen-
sional, have been quite successful in modeling and/or predicting the geomagnetic activity of the magnetosphere.
Perhaps the most important results, in this respect, were obtained by Vassiliadis et al. [1995] who, using empirical
nonlinear filters and upstream solar wind data for input, were able to effectively predict electrojet index data and
simultaneously show that the dynamics of the empirical filters are low dimensional. The methods used by Vas-
siliadis et al. have also been used to predict Dst index data [Valdivia et al., 1996], and more recently have been ap-
plied successfully to predict the spatial distribution of magnetic disturbances on Earth's surface [Valdivia et al.,
1999a; 1999b]. Moreover, low-dimensional physics based models [Klimas et al., 1992; 1994; Horton and Doxas,
1996; Horton et al., 1998; Horton and Doxas, 1998] have been shown to replicate many of the features of the solar
wind-magnetosphere interaction over very long intervals of electrojet index data. Recently, empirical analogues
have been constructed [Klimas et al., 1997; 1998; 1999] that combine the methods used by Vassiliadis et al. with the
physics based methods. These are data-derived low-dimensional models that have been shown to both model the
magnetospheric dynamics and predict the Dst and electrojet index responses.
The plasma sheet is a key component in the dynamics of the magnetosphere, particularly with respect to the sub-
storm dynamics. We have shown above that the plasma sheet is strongly turbulent. It is difficult to understand how a
dynamical system containing a strongly turbulent key component can exhibit apparently low dimensional behavior.

08/25/99
ButChang [1992a; 1992b; 1998] has shown that this is exactly the behavior to be expected from a system in SOC
and studies of turbulent transport in magnetically confined plasmas have confu-med this [Diamond and Hahm, 1995;
Newman et al., 1996; Carreras et al., 1996].
Summary
We believe that the evidence overwhelmingly supports the presence of a SOC component in the central plasma
sheet that is instrumental in the development of the substorm cycle. Although the SOC paradigm is a new and unfa-
miliar one, it does not appear possible to proceed further in understanding the substorm process without examining
the implications of SOC in the process.
IlL Discrete and Continuum Models of Self-Organized Criticality
Physical systems that are open (subject to throughput; loading, transport, unloading), dissipative, spatially distrib-
uted, and driven by an external loading process often evolve to a critical state far from equilibrium that has been
called self-organized criticality [Bak et al., 1987; 1988]. In such a state the temporal output of the system is inter-
mittent and characterized by power-law power spectra while its spatial structure exhibits scale-invariant, self-similar
(fractai) properties.
It is remarkable that the SOC state is a robust state (it does not depend on the details of the dynamics and the
physics of the system); it occurs in a variety of plasma and fluid environments [Lu and Hamilton, 1991; 1993;
1995b; 1995c; Vlahos et al., 1995; Diamond and Hahm, 1995; Newman et aL, 1996; Carreras et al., 1996; 1998].
The statistical behavior of many complex distributed systems appears to be more a property of their self-organized
critical state, if it is achieved, than the details of the physical processes that allow the critical state. In the plasma
sheet, for example, it is possible that the statistics of substorms, pseudobreakups, and even the evolutions of the
growth and expansion phases, are unrelated to the details of the reconnection process other than that reconnection
allows for the establishment ofa SOC state.
Following the seminal study ofBak et al. [1987], a variety of sandpile models have been shown to evolve natu-
rally into a SOC state (in particular, see the "nmning" sandpile model of Hwa and Kardar [1992]).
Sandpile models
Sandpile models [Bak et aL, 1987; 1988; Hwa and Kardar, 1992; Consolini, 1997; Chapman et al., 1998; Uritsky
and Pudovkin, 1998] are cellular automata in which discrete "grains" of a conserved quantity are added to an array
of cells and then moved from one cell to the next according to a set of rules. Coupled-map lattice models [Takalo et
08/25/99
al., 1999a; 1999b] are similar to the sandpile models, except that the conserved quantity is transported in a contin-
uum of grain sizes. Generally the grains do not move until a critical condition is exceeded in one of the ceils, at
which point a portion of the grains in that cell is distributed into the surrounding cells. Following this distribution it
may be that one of the receiving cells has been driven above the critical condition and thus a further distribution
follows. In this way an avalanche may result in which many cells take part in the response to the introduction of a
single grain in one of the cells. When the grains reach an open boundary they are removed from the system. Under
certain conditions such a system can reach a quasi-steady state in which the long-term average rate at which grains
leave the system is equal to the long-term average rate at which they are introduced while avalanches of all sizes
take part in the transport of grains to the open boundary. For reference, a true sandpile can be imagined on which the
slope of the sandpile is almost unstable everywhere. It should be noted, however, that we have found the evolution
of the plasma physical model that we discuss below to be considerably more dynamic than that suggested by this
image. An important feature of the sandpile models is that they are extremely fast computational tools for examining
the evolution of physical systems that are in SOC.
The sandpile and coupled-map lattice models, however, are rather abstract models of the physical systems that
they represent. These models are inherently discontinuous; they are iterated on a discrete grid with time evolving in
a series of discontinuous steps. Further, a field quantity that usually represents a conserved quantity is transported
from grid point to grid point according to a set of simple rules. Such models seem so far from the continuous physi-
cal world that we might ignore them were it not for the fact that they are effective in representing many facets of the
substorm phenomenon [Consolini, 1997; Chapman et al., 1998; Uritsky and Pudovkin, 1998; Takalo et al., 1999a;
1999b] while incorporating the SOC dynamics that does appear to be an important feature of the central plasma
sheet. Fortunately, several studies have been carried out to discover under what conditions more realistic continuum
models of physical systems (for example, hydrodynamic or MHD systems), as opposed to cellular automata, may
evolve into SOC.
Criteria for SOC in continuum physical systems
In the culmination of a sequence of papers [Lu and Hamilton, 1991; Lu et a/., 1993] concerning the spatiotempo-
ral distribution of solar flares, Lu [1995a] has given a list of criteria that a physical system (not an automaton model)
must satisfy in order to exhibit SOC behavior. The following is a quote from Lu (enumeration added):
"To summarize, we expect that driven dissipative systems which meet the following criteria can be naturally driven
to a state with a broad power-law distribution of discrete energy dissipating events. (1) First, there must be a locally
conserved field which is subject to a threshold instability. (2) The instability leads to rapid local diffusion of the
10

08/25/99
field,whichdissipatesenergyandlocallystabilizesthefield.(3)Thefieldmusthavemetastablestatesinwhichen-
ergycanbebuiltupbythedrivingterm.(4)Theslowevolutionarytimescaleof thesemetastablestatesmustbe
verymuchslowerthantherapidinstabilitytimescale,and(5)thedrivingtimescalemustbeintermediatebetween
thetwo.Furthermore,(6)anyintrinsiclengthscalesassociatedwiththeinstabilitymustbeverymuchlessthanthe
sizeofthesystem.Finally,(7)thesystemmustbedrivenforalongenoughperiodforit tosettletoasteadystate._
It isremarkablethat,although developed in the context of an unrelated discussion, each of these criteria are satisfied
by our present understanding of the magnetotail dynamics involved in the substorm cycle: (1) The conserved field is
magnetic flux (as calculated, e.g. by considering the intersection of field lines with the equatorial plane); it is subject
to a threshold instability, that is not fully understood at present, but which is known to lead to reconnection which
reconfigures the flux lines and conserves them. (2) In the reconnection process, flux lines are rapidly transported
into and out of a recormection site with the consequent dissipation of lobe field energy. That this process stabilities
the field can only be inferred from the fact that every observed bursty bulk flow event does not lead to a substorm,
which would be the case if stabilization did not occur. (3) The metastable states correspond to the magnetotail state
during the growth phase. (4) Translated into substorm physics, the time scale under discussion in this point is a
measure of the interval necessary for the magnetotail to relax back to a "ground state," having been loaded by flux
transfer from the dayside. This is a measure of the time necessary to reconnect the excess open lobe flux at the "dis-
tant neutral line" and convect it back to the dayside magnetosphere. Estimates are several hours or more, certainly
much longer than the growth time of the localized instability that leads to recormection nearer Earth. (5) The sub-
storm growth phase typically lasts for I hour, or somewhat less, which is indeed between the instability growth time
and the metastable state relaxation time. (6) The localized reconnection sites that we consider are much smaller than
the dimensions of the plasma sheet. We discuss some of the available evidence in support of this picture in the next
section. (7) The meaning of a steady state in this context must be understood. A system in SOC never reaches a truly
steady state. What is meant is that, when averaged over a time scale that is large compared to the interval between
avalanches of any size, and large compared to any fluctuation time scales in the driver, the system has a steady state.
This steady state is reached if equilibrium between input and output can be achieved over sufficiently long time
scales. We assume that the mamaetotail has an average flux content which is neither growing nor decaying when
averaged over an interval that is long compared to all time scales associated with substorm dynamics and/or solar
wind variability.
The necessary conditions given above in the quote by Lu [1995a] must be satisfied for a continuum system to
evolve into SOC. As we have shown above, Lu's criteria are satisfied in the magnetotail. Lu [ 1995a] also introduced
a nonlinear diffusion model that satisfies his criteria and showed that it evolves into SOC. We will discuss a variant
11
08/25/99
ofthismodelthoroughlybelow and show that it is the core element of a resistive MHD model of the central plasma
sheet in which the effective resistivity varies rapidly in space and time.
IV. Self-Organized Criticality in a Continuum Model
We have presented Lu's criteria [Lu, 1995a] that a physical system must satisfy in order to exhibit SOC behavior,
and we have shown that these criteria are satisfied by the magnetotail dynamics involved in the substorm cycle. Lu
also discussed a continuum model that satisfies his criteria and evolves into SOC. In this section we give a brief re-
view of Lu's continuum model, and show that it is the element of a resistive MHD model of the plasma sheet current
layer that allows for localized reconnection. Thus the Lu continuum model provides a link between the sandpile
model studies mentioned above and a realistic plasma physical study of SOC dynamics in the plasma sheet. We ex-
amine the behavior of the model in detail as it relates to plasma sheet dynamics.
The Lu model
The continuum model of Lu [1995a] is given by
_qJ(z,t)_-t = az L oz I
as:,(:,,) o(la,/azl)z _t 1" "t"
D,m low state, la lazl<kQ(la /azl)= O_, highstate, la /azl>lk
(2)
(3)
(4)
in which ¢p(z,t) is a scalar field, D(z,t)is a variable diffusion coefficient, S(z,t) is a source term, and
D_,_ >> D_,. The quantity Q(z,t) is double valued and depends on the history of IO¢p/Ozl, k represents an insta-
bility threshold, and 0 < i < 1. It is important to realize that Q(z,t) varies both spatially and temporally. At a given
position, Q remains in the low state, Q = Din,, until the slope satisfies IO¢p/Ozl > k, whereupon it undergoes a tran-
sition to the high state. However, when in the high state Q does not make the transition to the low state until the
slope IO_o/Oz[ < elk. Thus Q acts like a physical instability in that the value of the slope k required to turn on the
instability is greater than the value flk required to maintain the instability once it is turned on.
The diffusion coefficient D(z,t) evolves in response to Q. When Q switches to Din, , , the diffusion coefficient
D(z,t) begins to rise toward D,,,_. If the absolute value of the local slope remains above k for a time longer than of
order z, then the diffusion coefficient saturates at D = D,_. Once the instability is turned off, the diffusion coeffi-
12
08/25/99
cientdecaysbackto D=i. with time constant z. At any position z the evolution of both Q(z,t) and D(z,t) is in-
dependent of either of these quantities at any other position. Completely disordered evolution is possible; ordered
evolution that may develop is self-organized.
Resistive MHD Field Reversal Model
Lu [1995a] studied solutions of the system (2)-(4) that mimic those of sand pile models. Through the source
S(z,t), field cp(z,t) was added to a "pile" and the dynamics of the system developed as the slope of the pile in-
creased and consequently the field migrated to open boundaries where it was removed. With a different source
function, and modified boundary conditions, the Lu model, system (2)-(4), becomes a 1-dimensional resistive MHD
model of a magnetic field reversal in which the dynamics of the system are due to spatiotemporal magnetic field
annihilation. This simplified current sheet model is developed and studied below. We present this model as the first
step in the development of a resistive MHD plasma sheet model in which kinetic effects that lead to localized recon-
nection at small spatial scales are modeled as time-dependent and spatially localized anomalous resistivity.
We start with the resistive MHD assumption
Vxe+Lan_-o (5)c o_t
VxB=4rc J (6)C
1 ,7,in which 1/ is a spatiotemporal resistivity. Assuming that all quantities depend on only a single spatial variable z
and that the magnetic field has only an x -component, then
OBx_)t=_zED(z't)-_] +S(z't)(8)
inwhich
(9)
with the diffusion coefficient D(z,t)=(c 2/47r)rl(z,t) and the current .ly =(c/4Jr)aBx/az. Comparing (8)to (2),
we see that the Lu model can be viewed as a l-dimensional resistive MHD model in which the resistivity is gener-
13
08/25/99
atedselfconsistently.Fromthisviewpoint,thediffusionisduetoanomalousresistivitythatwaxesandwanesin
responsetotheexcitationandquenchingof acurrentdriveninstability;onethatisexcitedwhenthecurrentdensity
getsaboveacriticallevel[Papadopoulos,1985;Lui et al., 1991; 1993; 1995; Yoon andLui, 1996] and is quenched
when the current density is driven below a level that is lower than the critical one.
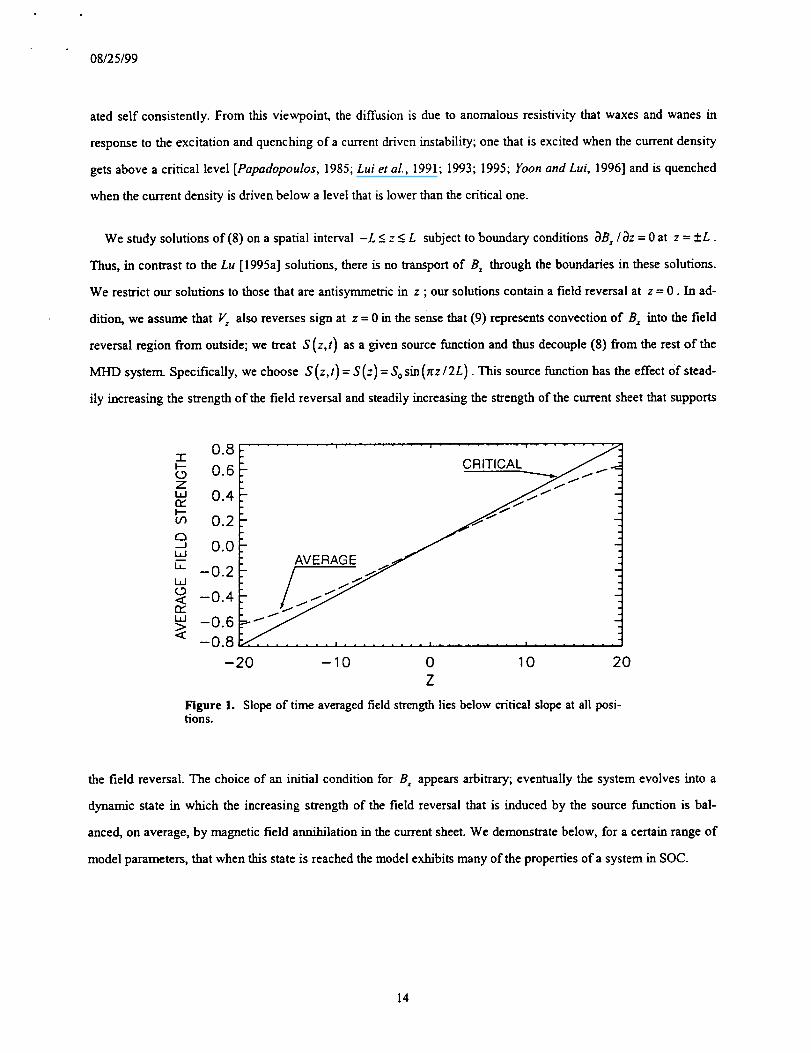
We study solutions of(8) on a spatial interval -L < z < L subject to boundary conditions OB,/Oz = 0 at z = +L.
Thus, in contrast to the Lu [1995a] solutions, there is no transport of B_ through the boundaries in these solutions.
We restrict our solutions to those that are antisymmetric in z ; our solutions contain a field reversal at z = 0. In ad-
dition, we assume that V, also reverses sign at z = 0 in the sense that (9) represents convection of B, into the field
reversal region from outside; we treat S(z,t) as a given source function and thus decouple (8) from the rest of the
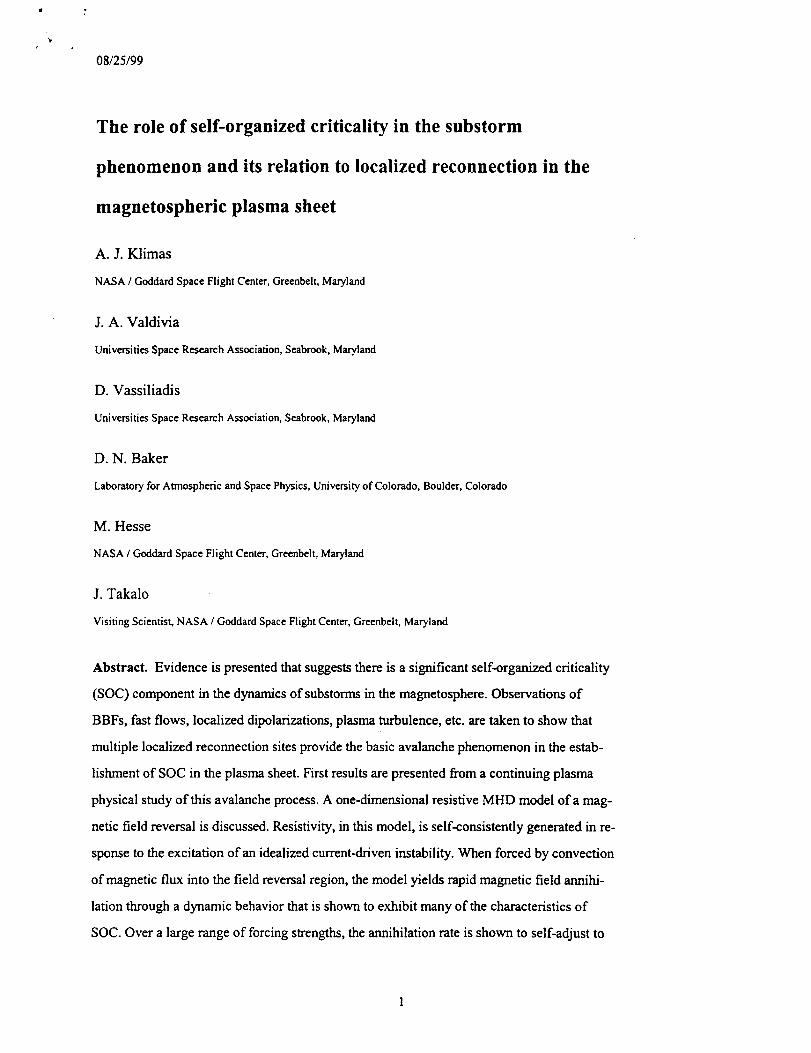
MH system. Specifically, we choose S (z,t) = S (z) = SOsin (Trz / 2L). This source function has the effect Of stead-
ily increasing the strength of the field reversal and steadily increasing the strength of the current sheet that supports
.8 D i i ...... °
0.2 _ -:
S o.o
AVE RAG _.,_,_
_ -o.4-0.6 =" ""
<> : :-0.8 " ................... , ................... "
-20 -10 0 10 20
Z
Figure I. Slope of time averaged field strengthlies below critical slope at all posi-tions.
the field reversal. The choice of an initial condition for B, appears arbitrary; eventually the system evolves into a
dynamic state in which the increasing strength of the field reversal that is induced by the source function is bal-
anced, on average, by magnetic field annihilation in the current sheet. We demonstrate below, for a certain range of
model parameters, that when this state is reached the model exhibits many of the properties of a system in SOC.
14

08/25/99
Analysis
We integrate the system (2)-(4), with q_(z,t) replaced by B_ (z,t), using a source S(z) that is constant in time as
discussed above. Initially, we set a(z,0) = D_, and D(z,O)= D_,. It appears that the choice for B, (z,0) is arbi-
wary. For a set of test integrations, we have found that the system evolves through a transient into a dynamical be-
havior that is independent of the initial state. Generally, to achieve this behavior as quickly as possible, we initialize
B, so that its gradient is just above the critical gradient k over a significant portion of the spatial interval [-L,L].
For all of the results discussed below, we have set OB_/Oz = 0 at the boundaries of the discrete spatial grid on
which we integrate the system.
In response to the source S(z,t)= S(z)= So sin(Trz/2L), the field B,(z,t) evolves into a reversed field configu-
ration. Eventually, criticality is reached at some position, leading to a remarkably complex sequence of avalanche-
like events that carry flux through the system. The result is a time-averaged state, an example of which is shown in
Figure 1, whose slope lies close to, but below, the critical gradient. This difference between average state and criti-
cal state is central to the evolution of the system; it will be discussed further below.
We have examined the behavior of (2)-(4) over a wide range of the parameters S O (the source strength) and D.,i,
while holding the remaining model parameters fixed at the values chosen by Lu; _"= 1 (the fundamental time-scale in
the model), D_, = 5, k = 0.04, and 13= 0.9. In addition, we have studied some of the effects of varying the pa-
rameter ft. For large D=i. ( = 0.1 and greater) the system settles into a simple periodic evolution. For smaller D,m,
an irregular loading-unloading cycle arises over a range of S O values that varies with D=i,. The amplitude of the
loading-unloading cycle depends primarily on Dmi. , not So; it decreases as Dramdecreases. In the following we
discuss the behavior of(2)-(4) with D=i. = 10q and with Soin the range 3x 10-" _ 10 -2 . For this Dm the loading-
unloading cycle is quasi-periodic, leading to a clearer identification of the signatures of loading and unloading vs.
other phenomena in the statistical results that we present below.
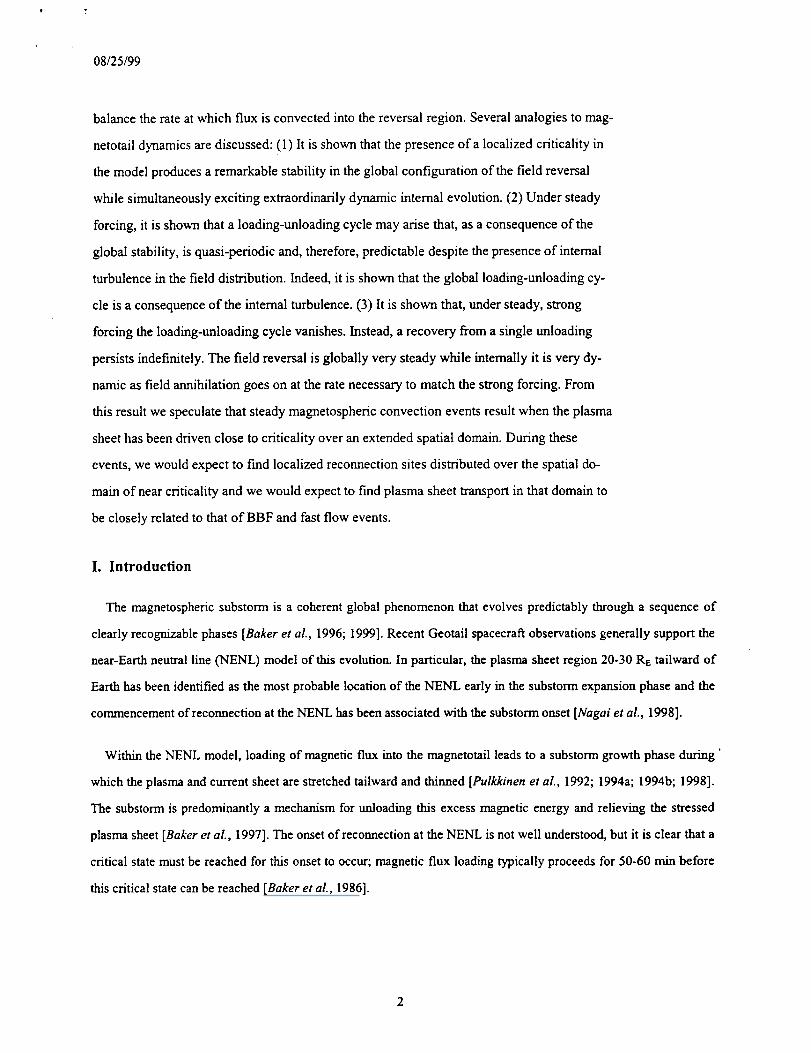
Loading-unloading cycle. The total field energy at any instant can be defined as
E(t)=fdzB_=(z,t) (10)
Figure 2 shows the evolution of this quantity for four integrations of the system (2)-(4) with Dmi. fixed and over a
large range in source strengths. These four runs will be referred to as RI - R4 for the remainder of this paper. The
results shown follow early transients from arbitrary initial states that are not included in the figure.
15

08/25/99
It ispossibletosetthesourcestrengthS(z) to a low enough value so that field annihilation at the rate set by
D(z,t) = D,_, is sufficient to balance the rate of field reversal growth induced by the source. In this case the system
settles into a simple steady diffusion state. The distribution of field in this case is qualitatively similar to the average
state in Figure 1. The slope of the distribution self adjusts so that the field annihilation rate equals the reversal
7.5
7.0
6.5
W
6.0
5.5
5.0
7.0
>" 6.50n,,I.iJ
z 6.0
5.5
/
/
V
/// h
I
I
| , .... , . .
10 15
TIME x 10 -3
(b)
, .... ,
(c)
(d)
,0 ' i | ! , I m . . , .... • .... J .... , .... , - - -
0 5 20 0 5 10 15 20 25
TIME x 10 -3
Figure 2. Evolution of the total field energy with D,_, = 10-4 and SO= 3x10 4 (a), So = 10-3 (b), So = 3xi0 -3 (c),and So = l 0 -z . The average total energy does not vary significantly over a large range of source strengths.
growth rate. If the source strength is increased, however, the slope of the distribution must increase accordingly. At
some source strength a steady state distribution becomes impossible since it requires a slope somewhere on the dis-
tribution that is equal to the critical slope. There is a transition at that critical source strength into the time-dependent
loading-unloading type of evolution shown in Figure 2a-c. In panel (a), the source strength is just above the transi-
tion source strength. In that case, the loading-unloading cycle has its largest amplitude and, though irregular, longest
period. At the larger source strength of panel (c), the loading-unloading cycle is decreased slightly in amplitude and
increased considerably in frequency. In panel (d) the system has made a transition into an entirely different type of
behavior; this behavior will be discussed further below.
16
08/25/99
AnimportantpointtonoticeinFigure2isthattheaveragetotalenergy,andthereforetheaverageglobaldistri-
butionoffield,isessentiallyunchangedovertheentirerangeofsourcestrengths(includinglargersourcestrengths
thatarenotshown).Becauseofthepresenceofacriticalityin thedynamicsof thesystem(2)-(4),aceilingis im-
posedontheslopeofthefielddistribution,andthereforeonthestrengthof thefieldreversal.Thesourcecontinu-
ouslydrivesthedistributiontowardthatceiling,butonreachingit thefieldannihilatessufficientlytomoveitsdis-
tributionawayfromtheceilingslope.Thefielddistributionis exceedinglydynamicandfar fromequilibrium
(B_ (z,t) = 0 ) at all times. Nevertheless, the result is a stable average global configuration and a well-defined load-
ing-unloading cycle. This stability is a direct consequence of the criticality in the system; it has nothing to do with
the possibility of a ground or equilibrium state in the system.
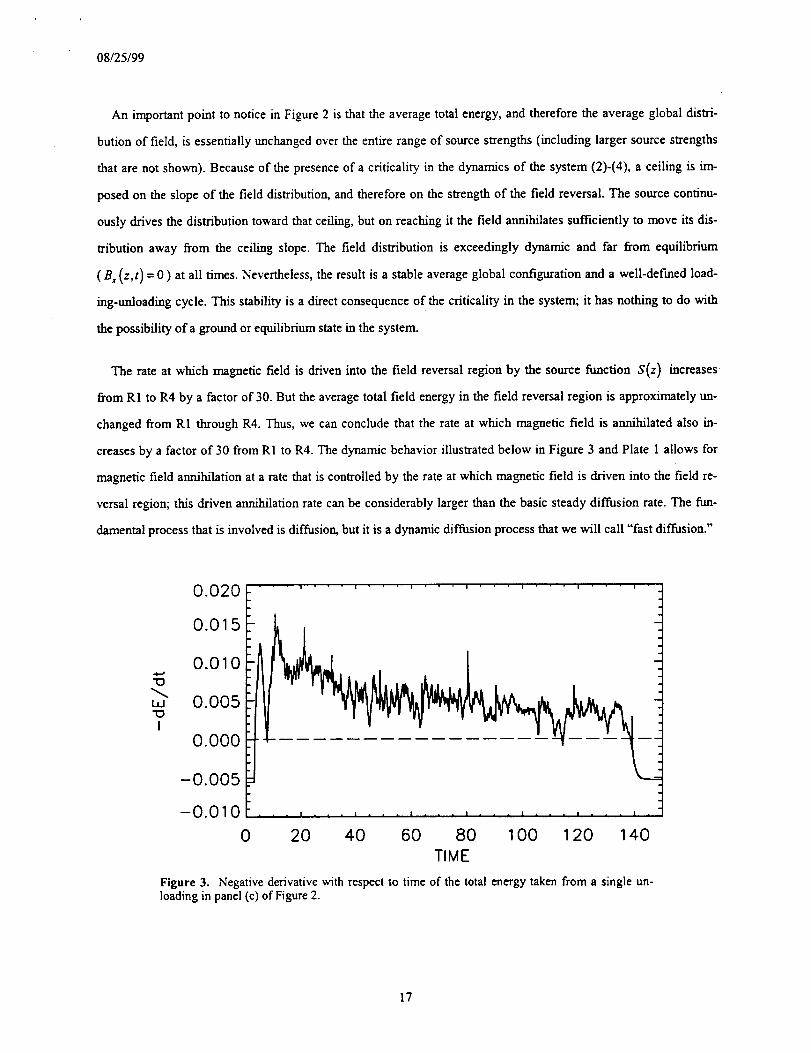
The rate at which magnetic field is driven into the field reversal region by the source function S(z) increases
from RI to R4 by a factor of 30. But the average total field energy in the field reversal region is approximately un-
changed from R1 through R4. Thus, we can conclude that the rate at which magnetic field is annihilated also in-
creases by a factor of 30 from R1 to R4. The dynamic behavior illustrated below in Figure 3 and Plate 1 allows for
magnetic field annihilation at a rate that is controlled by the rate at which magnetic field is driven into the field re-
versal region; this driven annihilation rate can be considerably larger than the basic steady diffusion rate. The fun-
damental process that is involved is diffusion, but it is a dynamic diffusion process that we will call "fast diffusion."
"tD
Ld13I
0.020
0.015
0.010
0.005
0.000
-0.005
-0.010
0
I I I I " " ' I • " • I " ' • I I . I
, , , I , , , I , , , I i | - I . . . a . . . | . . . I .
20 40 60 80 1O0 120 140
TIME
Figure 3. Negative derivative with respect to time of the total energy taken from a single un-loading in panel (c) of Figure 2.
17
0.10
SPATIOTEMPORAL DIFFUSION
0.20 0.30 0.40 0.50 0.60
N ' 0 °
-2O
0 5 10 15TIME
DIFFUSIVE TRANSPORT
-0.020 -0.015 -0.010
20 25
-0.005 0.0o0
N
10
0 5 10 15 20 25TIME
Plate 1. Details of an initial portion of the unloading event shown in Figure 3. (a) Evolution of
the diffusion coefficient D(z,t). White dots show grid points at which the current driven insta-
bility is excited. (b) Diffusive field transport in response to the growth of D(z,t).
18
08/25/99
Unloadingevent. Figure 3 gives another representation of one of the unloading events shown in Figure 2c (R3);
the total energy is differentiated with respect to time and plotted with inverted sign. Initially, -dE/dt is negative
and steady; the source S (z) steadily loads energy into the system and there is no internal evolution of consequence.
The unloading that follows is intense initially, but decays gradually until the system abruptly returns to a quiet state
in which loading begins again.
Unloading is the result of many self-organized current sheets (Q(z,t) = D,_, ) propagating as waves over the field
distribution and leading to field annihilation. The field distribution, during this unloading, appears highly variable
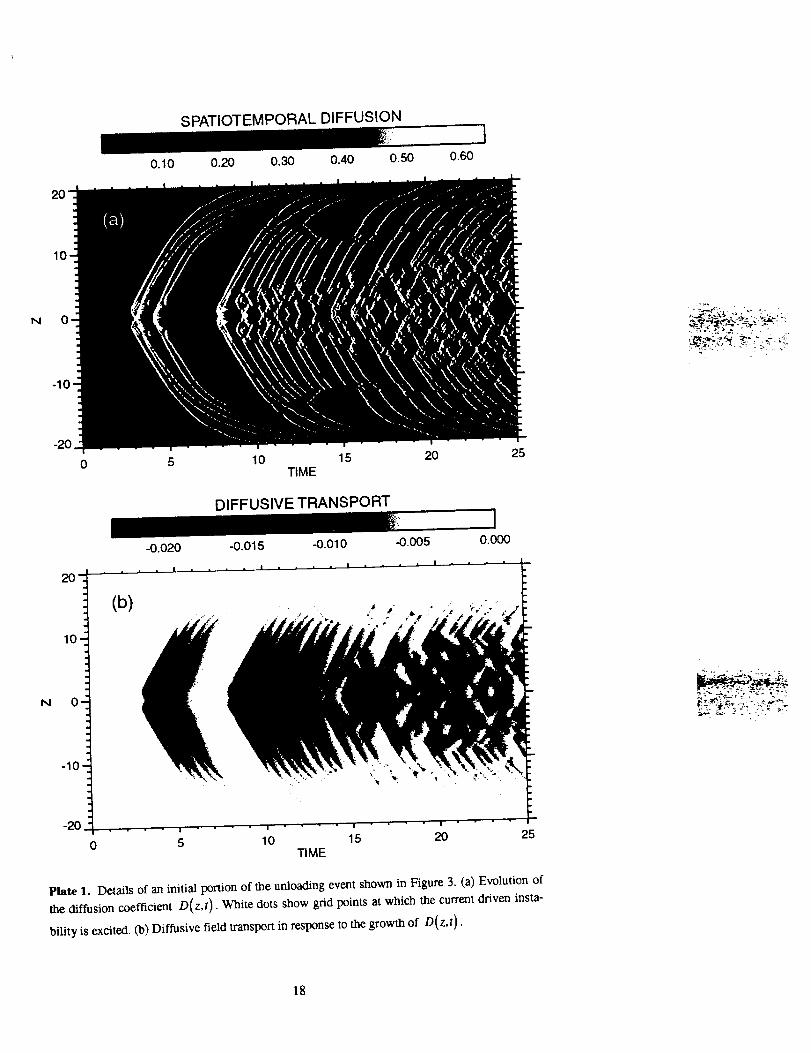
over many spatiotemporal scales. An example is given in Plate 1 that corresponds to the initial portion of the un-
loading event shown in Figure 3 (note the time variable on the abscissae of the two figures). Panel (a) of Plate 1
n_i,i
O12_
1°°I10 -5
10-10
10-15
! I I I I IIIJ I I 1 I I I Ill I I I I I I I I
t=20
t=60
t = 100
t= 140
10-20
10-25
0.01 0.10 1.00 10.00
(WAVE LENGTH)-'
Figure 4. Spatial power spectra as functions of inverse wavelength at four timesduring the unloading event shown in Figure 3. Spectra have been displaced down-ward by two decades each for clarity. For reference, a power law curve with spectralindex -5/3 has been inserted.
19

08/25/99
showstheevolutionof thediffusioncoefficientD(z,t). The white dots on that panel indicate grid points at which
the current driven instability is excited; i.e., grid points at which Q = Dm_ according to the criteria in (4). These are
grid points at which the current is intense relative to neighboring grid points. It can be seen that these are thin cur-
rent sheets that maintain themselves and propagate as waves, initially predominantly toward the spatial boundaries
but later with no preferred direction except near the boundaries. The initial behavior of the current sheets is more
organized while later they appear more disorganized and sporadic. It can be seen that D(z,t) grows rapidly at the
positions of the current sheets and then later decays (with time-scale 1:). Panel (b) of Plate 1 shows the diffusive
field transport -D_B_/_z that originates in response to the growth of D(z,t). This transport carries positive field
into the region of negative field, ultimately leading to the annihilation of both. Note that, as expected, there is no
transport at the spatial boundaries due to the gradient free boundary conditions that have been imposed.
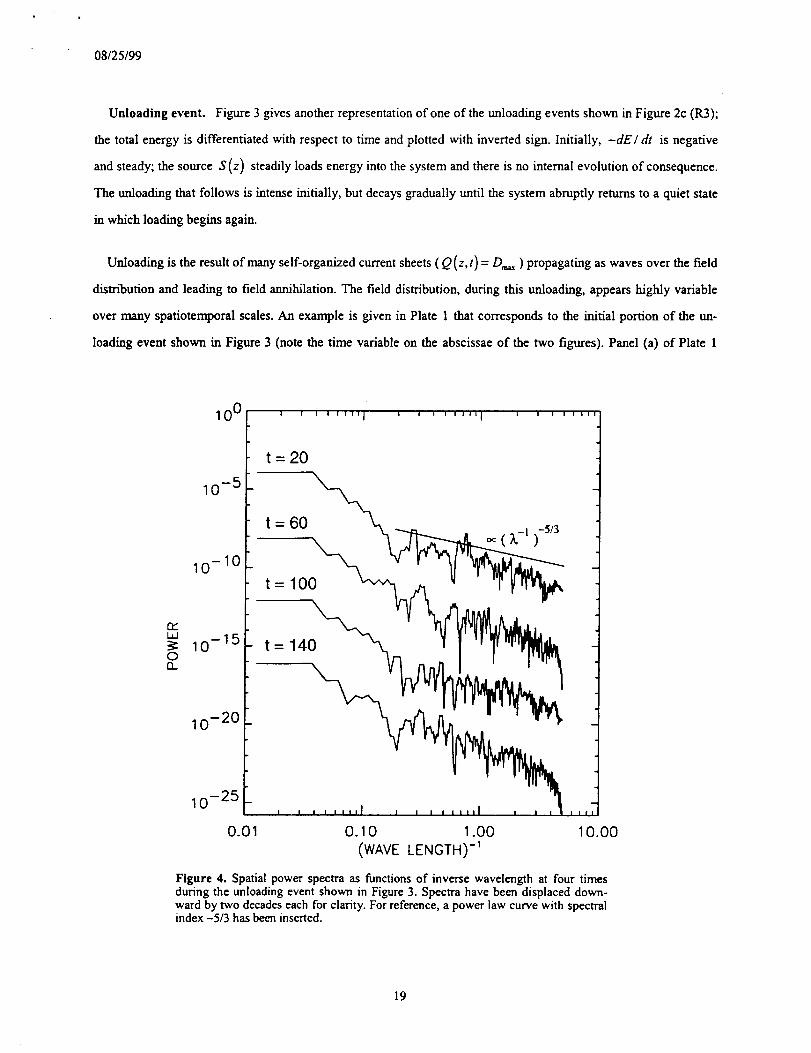
Spatial field structure. To investigate the spatial structure of the field distribution during the unloading event
shown in Figure 3 and Plate l, we have Fourier transformed the spatial distribution at four times during the event;
early in the unloading, twice in the middle of the event, and at its end. The sawtooth waveform underlying the non-
periodic field distribution has been removed in each case. Figure 4 shows the spatial power spectra at these times
plotted versus inverse wavelength from the longest wavelength allowed down to the Nyquist wavelength on the in-
tegration grid. The excess power at long wavelengths is due to the response of the system to the sinusoidal source
rrILl
OEL
10-6
10-8
10-10
-1210
-1410
-1610
0.0001
f-5/2
0.0010 0.0100 0.1000 1.0000 10.000
FREQUENCY
Figure 5. Temporal power spectrum for the field B, (z,t) at a fixed position. From a portionof the integration R3. Power-law spectra have been added for reference.
20
08/25/99
S(z,t) = S(z)= SOsin(Trz/2L). It can be seen that the spectra are power-laws in inverse wavelength for shorter
wavelengths, at all four times, with the exception, sometimes, of the very shortest wavelengths. These spectra indi-
cate self-similar spatial structure in the field over somewhat more than a decade in spatial scales down to those ap-
proaching the grid spacing; as the grid spacing is approached the field becomes relatively smooth.
Temporal field structure. Figure 5 shows a power spectrum constructed from a time series formed by sam-
piing B_ (z,t) at a fixed position z in the output from R3. A fixed position close to z = 0 has been chosen to produce
this result. The peak at the lowest frequencies shows the contribution of the loading-unloading cycle to the variabil-
ity in the time series; it is indicative of the distribution of time intervals between unloading events. Farther from
z = 0 the loading-unloading peak is larger but the remainder of the spectrum is essentially unchanged; this remain-
der is representative of the spectra found at other positions and for other intervals in the integration output. There are
clearly two scaling regions in the spectrum. A comparison with Figure 3 shows that the portion of the spectrum that
is reasonably approximated by a power-law with spectral index -3/5 contains time scales that range from the typical
duration of an unloading event down to the growth and decay time-scale of the diffusion coefficient _ = 1. This
portion of the spectrum is due to the wave-like phenomena on the field distribution during the unloading intervals.
Beyond the kink at f = 1 there is a second power-law spectral region with a steeper specaal index. The time scales
involved in this portion of the spectrum are well resolved by both the integration time step and the output-sampling
interval. We show below that this portion of the spectrum is due to the formation and decay of isolated current
sheets that do not last long enough to propagate and interact with other current sheets.
Discussion of spatiotemporai field structure. From these results, it can be seen that the presence of internal
field "turbulence" is consistent with the execution of the loading-unloading cycle. It is important to realize, in addi-
tion, that the presence of the internal turbulence is also necessary to generate the loading-unloading cycle. From the
fast three panels of Figure 2, it can be seen that at any one value of total energy the system can be in one of two
possible states, loading or unloading. The difference between these two states is the absence or presence of internal
turbulence. One can imagine a field distribution like the average one shown in Figure 1, but also containing weak
spatial perturbations, too weak to bring the distribution into criticality at any position. As the source drives the dis-
tribution slope (current sheet strength) upward, however, the critical gradient eventually must be reached at some
point on the distribution. Figure 6 is a sketch of the field evolution that we have observed near the point of criticality
just after the critical gradient is exceeded. Unstable current-sheet waves propagate away from the point of criticality.
Flux is transported rapidly by these current sheets with the consequence that even steeper gradients are generated in
their vicinities; the current sheets become self-sustaining. As time increases, the field distribution becomes exceed-
ingly dynamic; more waves are excited and more regions containing steep gradients are generated. The result is a
21
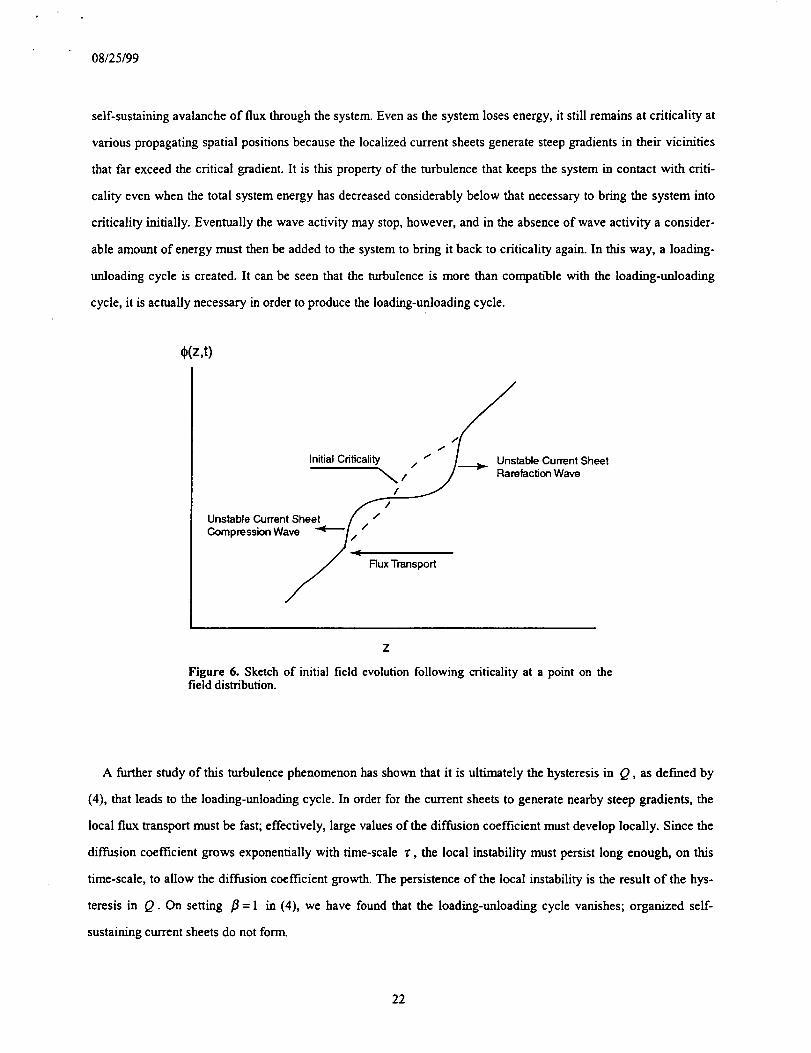
08/25/99
self-sustaining avalanche of flux through the system. Even as the system loses energy, it still remains at criticality at
various propagating spatial positions because the localized current sheets generate steep gradients in their vicinities
that far exceed the critical gradient. It is this property of the turbulence that keeps the system in contact with criti-
cality even when the total system energy has decreased considerably below that necessary to bring the system into
criticality initially. Eventually the wave activity may stop, however, and in the absence of wave activity a consider-
able amount of energy must then be added to the system to bring it back to criticality again. In this way, a loading-
unloading cycle is created. It can be seen that the turbulence is more than compatible with the loading-unloading
cycle, it is actually necessary in order to produce the loading-unloading cycle.
_(z,t)
Initial Criticality ,,, /" table CurrentSheet
Unstable CurrentSheet _//_ Ra//
refaction Wave
CompressionWave -.1[._-//< /
RuxTransport
Z
Figure 6. Sketch of initial field evolution following criticality at a point on thefield distribution.
A further study of this turbulence phenomenon has shown that it is ultimately the hysteresis in Q, as defined by
(4), that leads to the loading-unloading cycle. In order for the current sheets to generate nearby steep gradients, the
local flux transport must be fast; effectively, large values of the diffusion coefficient must develop locally. Since the
diffusion coefficient grows exponentially with time-scale "r, the local instability must persist long enough, on this
time-scale, to allow the diffusion coefficient growth. The persistence of the local instability is the result of the hys-
teresis in Q. On setting fl = 1 in (4), we have found that the loading-unloading cycle vanishes; organized self-
sustaining current sheets do not form.
22
08/25/99
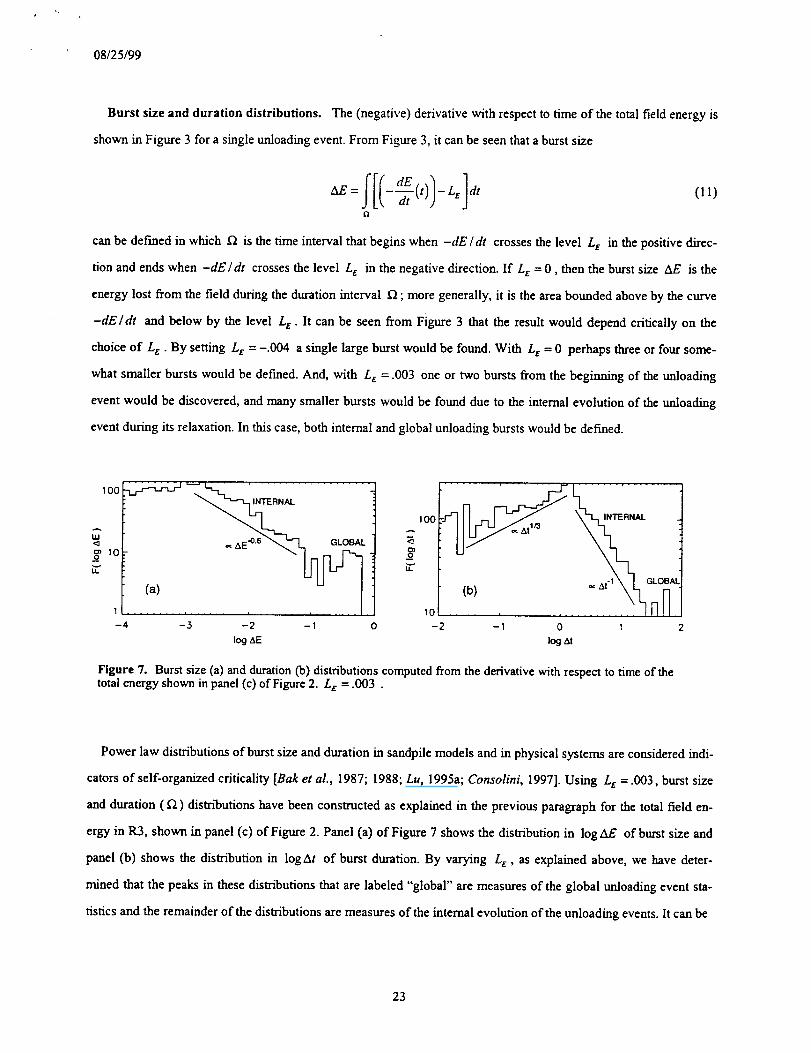
Burst size and duration distributions. The (negative) derivative with respect to time of the total field energy is
shown in Figure 3 for a single unloading event. From Figure 3, it can be seen that a burst size
Q
can be defined in which f_ is the time interval that begins when -dE / dt crosses the level Le in the positive direc-
tion and ends when -dE / dt crosses the level L e in the negative direction. If L E = 0, then the burst size AE is the
energy lost from the field during the duration interval _ ; more generally, it is the area bounded above by the curve
-dE/dt and below by the level LE . It can be seen from Figure 3 that the result would depend critically on the
choice of L E . By setting LE = -.004 a single large burst would be found. With Le = 0 perhaps three or four some-
what smaller bursts would be defined. And, with Le = .003 one or two bursts from the beginning of the unloading
event would be discovered, and many smaller bursts would be found due to the internal evolution of the unloading
event during its relaxation. In this case, both internal and global unloading bursts would be defined.
i oo
A
c_ 10_o
I O0
<I
I0
.,,, ._L_: _.._ GLOBAL(a) B__
-3 -2 -I
log AE
1 10
-4 0 - -1 0 1
log
Figure 7. Burst size (a) and duration Co) distributions computed from the derivative with respect to time of thetotal energy shown in panel (c) of Figure 2. Le = .003 .
Power law distributions of burst size and duration in sandpile models and in physical systems are considered indi-
cators of self-organized criticality [Bak et al., 1987; 1988; Lu, 1995a; Consolini, 1997]. Using L E = .003, burst size
and duration ( f2 ) distributions have been constructed as explained in the previous paragraph for the total field en-
ergy in R3, shown in panel (c) of Figure 2. Panel (a) of Figure 7 shows the distribution in log AE of burst size and
panel Co) shows the distribution in logAt of burst duration. By varying LE, as explained above, we have deter-
mined that the peaks in these distributions that are labeled "global" are measures of the global unloading event sta-
tistics and the remainder of the distributions are measures of the internal evolution of the unloading events. It can be
23

08/25/99
LO
oCL
W
oo=
rwLaA
on
10-6
10-8
10-10
10-12
-14I0
10-16
10-8
10-10
10-12
10-14
10-16
10-8
10-10
10-12
10-14
10-16
i ! i ........
f -5/4
f -5/2
(a)
.... i: : : : "'"! : : : .......... ii
(b)
..... i .... i ..... i ....
f -5/2
..... i
o_ f -5/2
(c)...... i ........ i ........ | ........ ! ....... | ......
10-,5" 10-4 10-3 10-2 10-1" 10 0 101
FREQUENCY
Figure 8. Power spectra constructed from the time series dEIdt obtained
from the outputs of integration (a) R3 (Figure 2, panel (c)), (b) R4 (Figure 2,panel (d)) and (c) R4 with fl = 1. Several scaling regions are indicated.
seen that the global unloading events have well deemed amplitude and time scales associated with them, but the in-
ternal events are broadly distributed in size and duration. Both distributions show power law shapeswith a spectral
break. As in the case of the power spectrum shown in Figure 5, the duration distribution exhibits its spectral break at
the time-scale _ = 1, the time-scale over which the diffusion coefficient evolves. The burst size distribution, in par-
24
08/25/99
ticular, is reminiscent of that obtained by Chapman et al. [1998] in their study ofa sandpile model. We conclude, as
they did, that these distributions indicate intemal SOC dynamics plus global unloading events with well-defined size
and time scales. The results shown in Figure 7 show, in addition, a spectral break at the basic time-scale T = 1 of the
system (2)-(4).
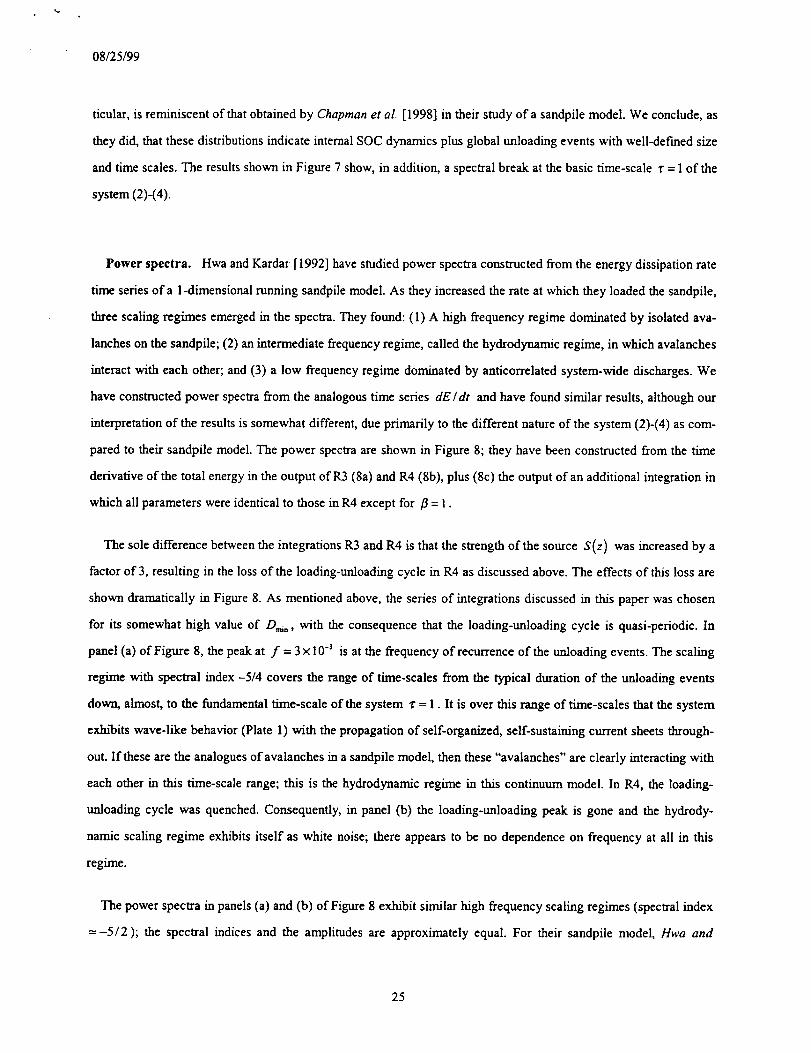
Power spectra. Hwa and Kardar [ 1992] have studied power spectra constructed from the energy dissipation rate
time series of a 1-dimensional nmning sandpile model. As they increased the rate at which they loaded the sandpile,
three scaling regimes emerged in the spectra. They found: (1) A high frequency regime dominated by isolated ava-
lanches on the sandpile; (2) an intermediate frequency regime, called the hydrodynamic regime, in which avalanches
interact with each other; and (3) a low frequency regime dominated by anticorrelated system-wide discharges. We
have constructed power spectra from the analogous time series dE/dt and have found similar results, although our
interpretation of the results is somewhat different, due primarily to the different nature of the system (2)-(4) as com-
pared to their sandpile model. The power spectra are shown in Figure 8; they have been constructed from the time
derivative of the total energy in the output of R3 (8a) and R4 (8b), plus (8c) the output of an additional integration in
which all parameters were identical to those in R4 except for fl = 1.
The sole difference between the integrations R3 and R4 is that the strength of the source S(z) was increased by a
factor of 3, resulting in the loss of the loading-unloading cycle in R4 as discussed above. The effects of this loss are
shown dramatically in Figure 8. As mentioned above, the series of integrations discussed in this paper was chosen
for its somewhat high value of Dm_,, with the consequence that the loading-unloading cycle is quasi-periodic. In
panel (a) of Figure 8, the peak at f = 3 x 10-_ is at the frequency of recurrence of the unloading events. The scaling
regime with spectral index -5/4 covers the range of time-scales from the typical duration of the unloading events
down, almost, to the fundamental time-scale of the system "r = 1. It is over this range of time-scales that the system
exhibits wave-like behavior (Plate 1) with the propagation of self-organized, self-sustaining current sheets through-
out. If these are the analogues of avalanches in a sandpile model, then these "avalanches" are clearly interacting with
each other in this time-scale range; this is the hydrodynamic regime in this continuum model. In R4, the loading-
unloading cycle was quenched. Consequently, in panel (b) the loading-unloading peak is gone and the hydrody-
namic scaling regime exhibits itself as white noise; there appears to be no dependence on frequency at all in this
regime.
The power spectra in panels (a) and (b) of Figure 8 exhibit similar high frequency scaling regimes (spectral index
=-5/2 ); the spectral indices and the amplitudes are approximately equal. For their sandpile model, Hwa and
25
08_5D9
Kardar [1992] interpreted this regime as due to the contribution of isolated non-interacting avalanches to the evolu-
tion of the pile. A close examination of Plate 1, panel (a), shows that there are instances of brief, isolated current
sheets, particularly in the range t = 20- 25. To investigate the possibility that these brief, isolated current sheets are
contributing this scaling regime to the power spectrum, we have repeated R4 with the parameter fl = 1. With fl = 1
self-sustaining current sheets do not form. All instances of current sheet formation are very brief; they form sporadi-
cally and they do not propagate nor do they interact. Of course, there also is no loading-unloading cycle. Panel (c) of
Figure 8 shows the power spectrum obtained in this case. The high frequency scaling regime remains but the rest of
the spectrum is diminished considerably compared to that shown in panel (b). From this result, we conclude that the
high frequency scaling regime is a consequence of isolated non-interacting current sheets, analogous to the non-
interacting avalanches in the study of Hwa and Kardar.
In addition, Hwa and Kardar found a low frequency scaling regime in their power spectra produced by anticorre-
lated system-wide discharges. Panels (a) and (b) of Figure 8 show the possibility of a low frequency scaling range
with spectra rising rapidly with frequency. However, the analogy between the Hwa and Kardar sandpile and the Lu
model, system (2)-(4), appears to fail at this point. We have found no system-wide discharges (all grid points unsta-
ble simultaneously) in the evolution of the solutions of (2)-(4) which we have studied. The largest events in the so-
lutions are the unloading events, and they are composed of wave-like behavior in the hydrodynamic regime.
Steady fast diffusion. At the high source strength used in R4, the field reversal solutions of the Lu model ex-
hibit an entirely different type of behavior in which there is no loading-unloading cycle; this behavior is shown in
panel (d) of Figure 2. We have examined the output of R4 in the format used in Plate 1 and have found that it looks
very much like the last portion of Plate 1, in the interval t = 20- 25. Panel (a) of Figure 9 gives an indication of how
this behavior develops. To obtain Figure 9a, we have continued R4, but with S(z) = 0, long enough for the system
to come to a quiet state; this is the case at t = 0 in Figure 9a. As indicated in the figure, the source was later turned
back on to the R4 level. The system immediately went into a loading phase until a significant unloading developed.
Comparing Figures 9a and 3, it can be seen that following the unloading the system could not recover as it did in the
lower driver strength R3. The source is strong enough to keep the system in contact with criticality continuously; the
system is pinned against the criticality ceiling. It responds by unloading continuously at a low level in the disorgan-
ized fashion shown in the latter portion of Plate 1. As we have noted above, we call this behavior "fast diffusion" to
indicate that it is a diffusive process, but a very dynamic one whose rate is high and controlled by the strength of the
source. In this case, the strength of the source is fixed by the rate at which field is convected into the field reversal
region.
26
08/25/99
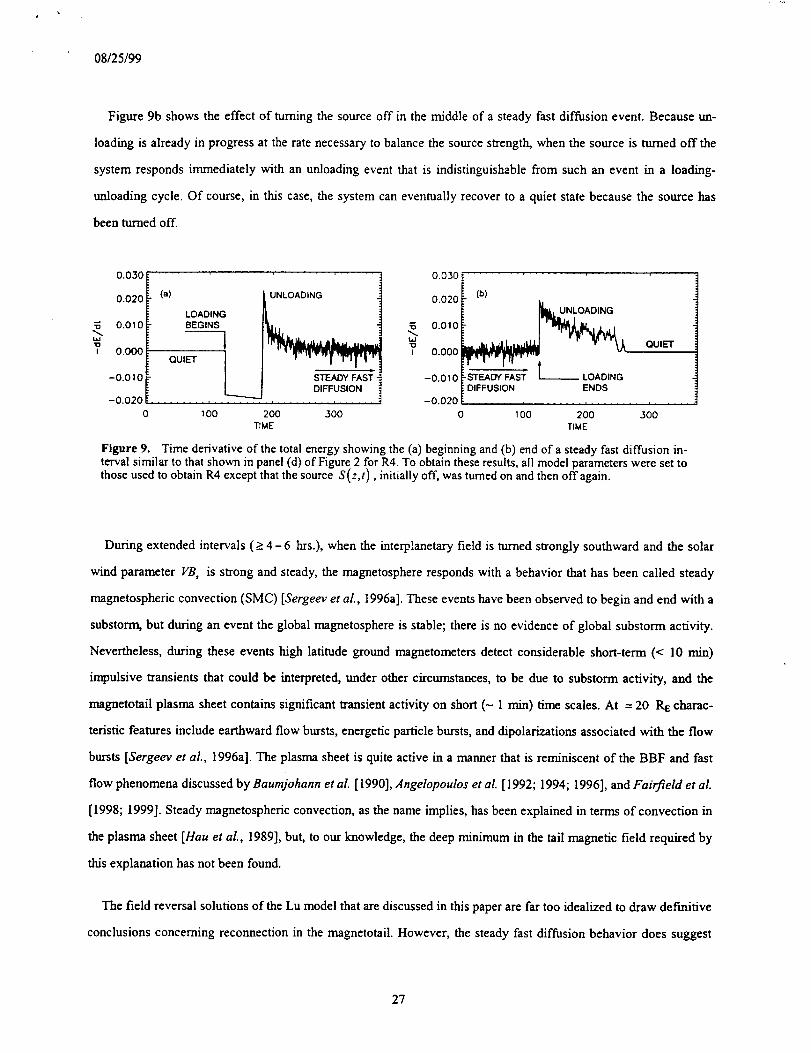
Figure9bshowstheeffectofturningthesourceoff in themiddleof asteadyfastdiffusionevent.Becauseun-
loadingisalreadyinprogressattheratenecessarytobalancethesourcestrength,whenthesourceis turnedoff the
systemrespondsimmediatelywithanunloadingeventthatis indistinguishablefromsuchaneventina loading-
unloadingcycle.Ofcourse,in thiscase,thesystemcaneventuallyrecovertoaquietstatebecausethesourcehas
beenturnedoff.
I
0.030
0.020
0.010
0.000
-0.010
-0.020
0
(a) LOADING
BEGINS 1
QUIET [__
100
........ _ 0.030:
UNLOADING i 0.020
_ 0.010
i 0.000
-0.010
....... I................... -0.020
200 300 0
TIME
(b)
DIFFUSION ENDS
QUIET
100 200 300
TiME
Figure 9. Time derivative of the total energy showing the (a) beginning and (b) end of a steady fast diffusion in-terval similar to that shown in panel (d) of Figure 2 for R4. To obtain these results, all model parameters were set tothose used to obtain R4 except that the source S(z,t), initially off, was turned on and then offagain.
During extended intervals ( > 4- 6 hrs.), when the interplanetary field is turned strongly southward and the solar
wind parameter VB, is strong and steady, the magnetosphere responds with a behavior that has been called steady
magnetospheric convection (SMC) [Sergeev et al., 1996a]. These events have been observed to begin and end with a
substorm, but during an event the global magnetosphere is stable; there is no evidence of global substorm activity.
Nevertheless, during these events high latitude ground magnetometers detect considerable short-term (< 10 min)
impulsive transients that could be interpreted, under other circumstances, to be due to substorm activity, and the
magnetotail plasma sheet contains significant transient activity on short (~ 1 min) time scales. At = 20 RE charac-
teristic features include earthward flow bursts, energetic particle bursts, and dipolarizations associated with the flow
bursts [Sergeev et al., 1996a]. The plasma sheet is quite active in a manner that is reminiscent of the BBF and fast
flow phenomena discussed by Baumjohann et al. [1990], .4ngelopoulos et al. [1992; 1994; 1996], and Fairfield et al.
[ 1998; 1999]. Steady magnetospheric convection, as the name implies, has been explained in terms of convection in
the plasma sheet [Hau et al., 1989], but, to our knowledge, the deep minimum in the tail magnetic field required by
this explanation has not been found.
The field reversal solutions of the Lu model that are discussed in this paper are far too idealized to draw definitive
conclusions concerning reconnection in the magnetotail. However, the steady fast diffusion behavior does suggest
27

08125199
an alternate explanation for the SMC events. In analogy to steady fast diffusion, we suggest that a SMC event is an
extended recovery phase in the magnetotail that cannot go to completion because the VBs driver is too strong. The
magnetotail may be driven into criticality continuously, resulting in a state of steady low level unloading that bal-
ances the strong, steady input. Observations in the magnetotail should reveal multiple, isolated, sporadic reconnec-
tion sites distributed in the plasma sheet; fast flows and BBFs should be associated with these sites. In this manner,
both the global stability and the simultaneous mesoscale activity discussed by Sergeev et al. [1996a] can be incorpo-
rated into the explanation for SMC events, and SMC events can be merged naturally within the NENL substorm
model.
V. Summary
We have reviewed a considerable body of evidence that indicates there is a SOC component in the dynamics of
the plasma sheet that contributes to the characteristics of the substorm phenomenon. In analogy to the behavior of
sandpile models when they are in SOC, we view observations of BBFs, fast flows, localized dipolarizations, etc. as
evidence that multiple localized reconnection sites provide the basic avalanche phenomenon in the establishment of
SOC in the plasma sheet.
In this paper, we have presented the results of our ftrst step toward a plasma physical model of the SOC compo-
nent in the plasma sheet. We have studied a resistive MHD model of a magnetic field reversal. The anomalous re-
sistivity is self consistently generated in this model in response to the excitation of an idealized current driven insta-
bility. We have shown that, when driven by convection of magnetic flux into the field reversal region, the model is
able to produce rapid magnetic field annihilation through a dynamic behavior that has many of the characteristics of
a system in SOC.
Although our model is a highly idealized model of the field reversal in the plasma sheet, we feel that there are
already several implications that can be drawn from its behavior that may help in understanding the substorm phe-
nomenon, while indicating directions for further study:
We fred that the global state of the field reversal is remarkably stable, essentially invariant under a wide range of
source strengths and, consequently, field annihilation rates. This stability is due to the existence of a criticality ceil-
ing in the dynamics of the field reversal. The system self-adjusts to this ceiling fi'om below and, while very dynamic
internally, always resides near this ceiling, far from its ground, or equilibrium, state. This residence in the vicinity of
criticality is a characteristic property of systems that are driven into SOC. In the case of our model of a field rever-
sal, the annihilation rate self-adjusts to the rate at which magnetic flux is introduced into the field reversal region so
28
08/25/99
thattheglobalstateof thefield remains everywhere near criticality. We suppose that this self-adjustment is also a
property of the magnetotail dynamics. In its ground state, the magnetosphere would contain a dipole magnetic field
stretching to great distances from Earth. Under the influence of the solar wind, the magnetosphere resides far from
its ground state, with a magnetotail in a self-organized state that is always near criticality, as evidenced by the ob-
servation of BBFs, fast flows, plasma sheet turbulence, etc. at all substorm phases. The rate at which magnetic flux
is processed through the magnetotail depends on the rate at which it is introduced. The magnetotail self-adjusts to
maintain this balance, thereby maintaining a stable global configuration. This stability is a consequence of the criti-
cality in the magnetotail field reversal, and is unrelated to the existence of a ground state in the system.
A principal goal in our research is to understand the compatibility of the coherent, predictable substorm cycle
with strong turbulence in the key plasma sheet component of the substorm dynamics. How can the slow approach to
a critical state in the thinning plasma sheet be understood in light of the very dynamic nature of the plasma sheet that
is observed? We have found that, under the influence of a steady driver, our field reversal model can enter a predict-
able quasi-periodic loading-unloading cycle that is not only compatible with the existence of "turbulence" in the
field reversal, it is a consequence of the turbulence. Following contact with criticality at a position in the field rever-
sal, strong, propagating, serf-sustaining current sheets are formed. These current sheets perturb the nearby field in
such a way as to induce criticality nearby, thereby producing more current sheets with the same property. An ava-
lanche is formed, with the property that the field retains contact with criticality after the field energy in the system
has fallen well below that which was necessary to bring the system into criticality originally. Later, when the system
eventually does quiet down, a significant amount of energy must be added to bring it back to criticality again. In this
way, a loading-unloading cycle is formed. We have found that it is the hysteresis, suggested by Lu [1995a], in the
current driven instability that is, at root, the source of this behavior. From these results, we would suggest that in the
plasma sheet, whatever the cause of criticality, the response of the plasma sheet (we feel, through localized recon-
nection) must force nearby positions into criticality, the result being a self-sustaining avalanche that is able to persist
even as the field energy drops below that necessary to produce the onset of the avalanche. If the solar wind driver
remains steady, a loading-unloading cycle may result. Understanding the cessation of this process would provide an
understanding of the substorm recovery phase [Baker et al., 1999]. We will search for this behavior as we generalize
our field reversal model to,_ard a more realistic plasma sheet model.
We have found that when we drive the field reversal model steadily and strongly enough the loading-unloading
cycle vanishes. The global state of the field reversal is pushed so close to criticality, the perturbations on the field
distribution cannot lose contact with criticality. Recovery from unloading never ends and the system goes into a
quasi-steady armihilation state containing current sheets everywhere propagating in a disorganized fashion. The an-
29

O8/25/99
nihilationrateishighwhencomparedtotheaverage rate in the case of loading and unloading, but low compared to
the peaks in the unloading intervals. Still, a balance between magnetic flux input and field annihilation is achieved.
The global state of the field distribution is very steady but, internally, it is quite dynamic. This behavior is analogous
to that seen in the magnetosphere during intervals called steady magnetospheric convection events. During these
events the solar wind is unusually steady with the interplanetary magnetic field turned southward, there is no evi-
dence for global substorm activity, but there is considerable activity on smaller scales in the plasma sheet with re-
sponses in the ionosphere and on the ground that otherwise look like substorm activity [Sergeev et al., 1996a]. We
suggest that this behavior is the result of steady, low-level unloading as a consequence of a substorm recovery that
could not complete. It is likely that this condition results when the plasma sheet has been driven too close to critical-
ity over an extended spatial domain as a consequence of an unusually strong and steady magnetic flux input to the
tail. We would expect to find localized reconnection sites distributed over the spatial domain of near criticality. We
believe the name, steady magnetospheric convection, is a misnomer, the plasma sheet transport being more closely
related to that of BBF and fast flow events.
In the future, we will generalize this model to higher dimensions and couple it to more of the MIID system. In
addition, we will consider other kinetic phenomena and attempt to model them as we have the idealized current
driven instability in our present work. At each step in our generalization, we will study the evolution of the model
into SOC and we will re-examine the conjectures given in the preceding paragraphs. Our goal remains, to give a
quantitative characterization of SOC in the plasma sheet and to elucidate its role in the substorm cycle.
Acknowledgments. We are grateful for the support we have received from NASA SR&T grant 344-14-00-02,
which has made this research possible.
References
Angelopoulos, V., W. Baumjohann, C.F. Kennel, F.V. Coroniti, M.G. Kivelson, R. Pellat, R.J. Walker, H. Luhr, and
G. Paschmann, Bursty Bulk Flows in the Inner Central Plasma Sheet, .I. Geophys. Res., 97 (A4), 4027-4039,
1992.
Angelopoulos, V., F.V. Coroniti, C.F. Kennel, M.G. Kivelson, R.J. Walker, C.T. Russell, R.L. McPherron, E. San-
chez, C.I. Meng, W. Baumjohann, G.D. Reeves, R.D. Belian, N. Sato, E. FriisChristensen, P.R. Sutcliffe, K. Yu-
moto, and T. Harris, Multipoint analysis of a bursty bulk flow event on April 11, 1985, .I. Geophys. Res., 101
(A3), 4967-4989, 1996.
30

08/25/99
Angelopoulos,V.,C.F.Kennel,F.V.Coroniti,R.Pellat,M.G.Kivelson,R.J. Walker, C.T. Russell, W. Baumjohann,
W.C. Feldman, and J.T. Gosling, Statistical Characteristics of Burst)' Bulk Flow Events, J. Geophys. Res., 99
(A11), 21257-21280, 1994.
Bak, P., C. Tang, and K. Wiesenfeld, Self-Organized Criticality - an Explanation of 1/F Noise, Phys. Rev. Lett., 59
(4), 381-384, 1987.
Bak, P., C. Tang, and K. Wiesenfeld, Self-Organized Criticality, Phys. Rev. A, 38 (1), 364-374, 1988.
Baker, D.N., L.F. Bargatze, and R.D. Zwickl, Magnetospheric Response to the Imf- Substorms, Journal of Geo-
magnetism and Geoelectricity, 38 (11), 1047-1073, 1986.
Baker, D.N., T.I. Pulkkinen, V. Angelopoulos, W. Baumjohann, and R.L. McPherron, Neutral line model of sub-
storms: Past results and present view, J. Geophys. Res., 101 (A6), 12975-13010, 1996.
Baker, D.N., T.I. Pulkkinen, J. Biichner, and A.J. Klimas, Substorms: A global magnetospheric instability, J. Geo-
phys. Res., 104 (A7), 14601, 1999.
Baker, D.N., T.I. Pulkkinen, M. Hesse, and R.L. McPherron, A quantitative assessment of energy storage and re-
lease in the Earth's magnetotail, J. Geophys. Res., 102 (A4), 7159-7168, 1997.
Baumjohann, W., G. Paschmann, and H. Luhr, Characteristics of High-Speed Ion Flows in the Plasma Sheet, J.
Geophys. Res., 95 (A4), 3801-3809, 1990.
Borovsky, J.E., R.C. Elphic, H.O. Funsten, and M.F. Thomsen, The Earth's plasma sheet as a laboratory for flow
turbulence in high-beta MHD, d. Plasma Phys., 57, 1-34, 1997.
Carreras, B.A., D. Newman, V.E. Lynch, and P.H. Diamond, A model realization of self-organized criticality for
plasma confinement, Phys. Plasmas, 3 (8), 2903-2911, 1996.
Carreras, B.A., B.P. van Milligen, M.A. Pedrosa, R. Balbin, C. Hidalgo, D.E. Newman, E. Sanchez, M. Frances, I.
Garcia-Cortes, J. Bleuel, M. Endler, C. Ricardi, S. Davies, G.F. Matthews, E. Martines, V. Antoni, A. Latten, and
T. Klinger, Self-similarity of the plasma edge fluctuations, Phys. Plasmas, 5 (10), 3632-3643, 1998.
Chang, T., Low-Dimensional Behavior and Symmetry-Breaking of Stochastic- Systems Near Criticality - Can These
Effects Be Observed in Space and in the Laboratory, leee Transactions On Plasma Science, 20 (6), 691-694,
1992a.
Chang, T., Path-Integrals, Differential Renormalization-Group, and Stochastic-Systems Near Criticality, Interna-
tional Journal of Engineering Science, 30 (10), 1401-1405, 1992b.
Chang, T., Multiscale intermittent turbulence in the magnetotail, in Substorms-4, edited by S. Kokubun, and Y.
Kamide, pp. 431-436, Terra Scientific, Tokyo, 1998.
Chapman, S.C., N.W. Watkins, R.O. Dendy, P. Helander, and G. Rowlands, A simple avalanche model as an ana-
logue for magnetospheric activity, Geophys. Res. Lett., 25 (13), 2397-2400, 1998.
31
08/25/99
Consolini,G.,Sandpilecellularautomataand magnetospheric dynamics, in Cosmic Physics in the Year 2000, edited
by S. Aiello, N. Lucci, G. Sironi, A. Treves, and U. Villante, pp. 123, SIF, Bologna, Italy, 1997.
Diamond, P.H., and T.S. Hahm, On the Dynamics of Turbulent Transport Near Marginal Stability, Phys. Plasmas, 2
(10), 3640-3649, 1995.
Fairfield, D.H., T. Mukai, M. Brittnacher, G.D. Reeves, S. Kokubun, G.K. Parks, T. Nagai, H. Matsumoto, K. Ha-
shimoto, D.A. Gurnett, and T. Yamamoto, Earthward flow bursts in the inner magnetotail and their relation to
auroral brightenings, AKR intensifications, geosynchronous panicle injections and magnetic activity, J. Geophys.
Res., 104 (AI), 355-370, 1999.
Fairfield, D.H., T. Mukai, A.T.Y. Lui, C.A. Cattell, G.D. Reeves, T. Nagai, G. Rostoker, H.J. Singer, M.L. Kaiser,
S. Kokubun, A.J. Lazarus, R.P. Lepping, M. Nakamura, J.T. Steinberg, K. Tsuruda, D.J. Williams, and T. Ya-
mamoto, Geotail observations of substorm onset in the inner magnetotail, J. Geophys. Res., 103 (A1), 103-117,
1998.
Hau, L.N., R.A. Wolf, G.H. Voigt, and C.C. Wu, Steady-State Magnetic-Field Configurations For the Earths Mag-
netotail, J. Geophys. Res., 94 (A2), 1303-1316, 1989.
Horton, W., and I. Doxas, A low-dimension energy-conserving state space model for substorm dynamics, J. Geo-
phys. Res., 101 (A12), 27223-27237, 1996.
Horton, W., and I. Doxas, A low-dimensional dynamical model for the solar wind driven geotail-ionosphere system,
J. Geophys. Res., 103 (A3), 4561-4572, 1998.
Horton, W., M. Pekker, and I. Doxas, Magnetic energy storage and the nightside magnetosphere- ionosphere cou-
pling, Geophys. Res. Lett., 25 (21), 4083-4086, 1998.
Hoshino, M., A. Nishida, T. Yamamoto, and S. Kokubun, Turbulent Magnetic-Field in the Distant Magnetotail -
Bottom-Up Process of Plasmoid Formation, Geophys. Res. Lett., 21 (25), 2935-2938, 1994.
Hwa, T., and M. Kardar, Avalanches, Hydrodynamics, and Discharge Events in Models of Sandpiles, Phys. Rev. A,
45 (10), 7002-7023, 1992.
Klimas, A.J., D.N. Baker, D.A. Roberts, D.H. Fairfield, and J. Buchner, A Nonlinear Dynamic Analog Model of
Geomagnetic-Activity, J. Geophys. Res., 97 (A8), 12253-12266, 1992.
Klimas, A.J., D.N. Baker, D. Vassiliadis, and D.A. Roberts, Substorm Recurrence During Steady and Variable So-
lar-Wind Driving - Evidence For a Normal-Mode in the Unloading Dynamics of the Magnetosphere, J. Geophys.
Res., 99 (A8), 14855-14861, 1994.
Klimas, A.J., D. Vassiliadis, and D.N. Baker, Data-derived analogues of the magnetospheric dynamics, J. Geophys.
Res., 102 (AI2), 26993-27009, 1997.
32
4'
08/25/99
Klimas, A.J., D. Vassiliadis, and D.N. Baker, Dst index prediction using data-derived analogues of the magneto-
spheric dynamics, .!. Geophys. Res., 103 (A9), 20435-20447, 1998.
Klimas, A.J., D. Vassiliadis, D.N. Baker, and D.A. Roberts, The organized nonlinear dynamics of the magneto-
sphere,,/. Geophys. Res., 101 (A6), 13089-13113, 1996.
Klimas, A.J., D. Vassiliadis, D.N. Baker, and J.A. Valdivia, Data-derived analogues of the solar wind-
magnetosphere interaction, Phys. Chem. Earth, 24, 37-44, 1999.
Lu, E.T., Avalanches in Continuum Driven Dissipative Systems, Phys. Rev. Lett., 74 (13), 2511-2514, 1995a.
Lu, E.T., Constraints On Energy-Storage and Release Models For Astrophysical Transients and Solar-Flares, Astro-
phys. J., 447 (I), 416-418, 1995b.
Lu, E.T., The Statistical Physics of Solar Active Regions and the Fundamental Nature of Solar-Flares, Astrophys. J.,
446(2), LI09-L112, 1995c.
Lu, E.T., and R.J. Hamilton, Avalanches and the Distribution of Solar-Flares, Astrophys. J., 380 (2), L89-L92, 1991.
Lu, E.T., R.J. Hamilton, J.M. McTieman, and K.R. Bromund, Solar-Flares and Avalanches in Driven Dissipative
Systems, Astrophys. J., 412 (2), 841-852, 1993.
Lui, A.T.Y., C.L. Chang, A. Mankofsky, H.K. Wong, and D. Winske, A Cross-Field Current Instability For Sub-
storm Expansions, J. Geophys. Res., 96 (A7), 11389-11401, 1991.
Lui, A.T.Y., C.L. Chang, and P.H. Yoon, Preliminary Nonlocal Analysis of Cross-Field Current Instability For Sub-
storm Expansion Onset, J. Geophys. Res., 100 (A10), 19147-19154, 1995.
Lui, A.T.Y., P.H. Yoon, and C.L. Chang, Quasi-Linear Analysis of Ion Weibel Instability in the Earths Neutral
Sheet, J. Geophys. Res., 98 (AI), 153-163, 1993.
Lyons, L.R., T. Nagai, G.T. Blanchard, J.C. Samson, T. Yamamoto, T. Mukai, A. Nishida, and S. Kokubun, Asso-
ciation between Geotail plasma flows and auroral poleward boundary intensifications observed by CANOPUS
photometers, J. Geophys. Res., 104 (A3), 4485-4500, 1999.
McPherron, R.L., and T. Hsu, The main onset of the magnetospheric substorm, in Substorms-4, edited by S. Ko-
kubun, and Y. Kamide, pp. 79-82, Terra Scientific, Tokyo, 1998.
Milovanov, A.V., L.M. Zelenyi, and G. Zimbardo, Fractal structures and power law spectra in the distant Earth's
magnetotail, J. Geophys. Res., 101 (A9), 19903-19910, 1996.
Nagai, T., M. Fujimoto, Y. Saito, S. Machida, T. Terasawa, R. Nakamura, T. Yamamoto, T. Mukai, A. Nishida, and
S. Kokubun, Structure and dynamics of magnetic reconnection for substorm onsets with Geotail observations, ,/.
Geophys. Res., 103 (A3), 4419-4440, 1998.
Newman, D.E., B.A. Carreras, P.H. Diamond, and T.S. Hahm, The dynamics of marginality and self-organized
criticality as a paradigm turbulent transport, Phys. Plasmas, 3 (5), 1858-1866, 1996.
33
.p • ,
08/25/99
Ohtani, S., T. Higuchi, A.T.Y. Lui, and K. Takahashi, Magnetic Fluctuations Associated With Tail Current Disrup-
tion - Fractal Analysis, J. Geophys. Res., 100 (AI0), 19135-19145, 1995.
Ohtani, S., K. Takahashi, T. Higuchi, A.T.Y. Lui, H.E. Spence, and J.F. Fennell, AMPTE/CCE-SCATHA simulta-
neous observations of substorm- associated magnetic fluctuations, J. Geophys. Res., 103 (A3), 4671-4682, 1998.
Papadopoulos, K., Microinstabilities and anomalous transport, in Collisionless Shocks in the Heliosphere: A Tuto-
rial Review, edited by R.G. Stone, and B.T. Tsurutani, pp. 59-90, American Geophysical Union, Washington
DC, 1985.
Pulkldnen, T.I., D.N. Baker, L.A. Frank, J.B. Sigwarth, H.J. Opgenoorth, R. Greenwald, E. Friis-Christensen, T.
Mukai, R. Nakamura, H. Singer, G.D. Reeves, and M. Lester, Two substorm intensifications compared: Onset,
expansion, and global consequences, J. Geophys. Res., 103 (A1), 15-27, 1998.
Pulkkinen, T.I., D.N. Baker, D.G. Mitchell, R.L. McPherron, C.Y. Huang, and L.A. Frank, Thin Current Sheets in
the Magnetotail During Substorms - Cdaw- 6 Revisited, ,I. Geophys. Res., 99 (A4), 5793-5803, 1994a.
Pulkkinen, T.I., D.N. Baker, R.J. Pellinen, J. Buchner, H.E.J. Koskinen, R.E. Lopez, R.L. Dyson, and L.A. Frank,
Particle Scattering and Current Sheet Stability in the Geomagnetic Tail During the Substorm Growth-Phase, J.
Geophys. Res., 97 (A12), 19283-19297, 1992.
Pulkkinen, T.I., D.N. Baker, P.K. Toivanen, R.J. Pellinen, R.H.W. Friedel, and A. Korth, Magnetospheric Field and
Current Distributions During the Substorm Recovery Phase, J. Geophys. Res., 99 (A6), 10955-10966, 1994b.
Saito, T., K. Yumoto, and Y. Koyarna, Magnetic pulsation Pi2 as a sensitive indicator of magnetospheric substorm,
Planetary and Space Science, 24, 1025, 1976.
Sakurai, T., and T. Saito, Magnetic pulsation Pi2 and substorm onset, Planetary and Space Science, 24, 573, 1976.
Sergeev, V.A., R.J. Pellinen, and T.I. Pulkkinen, Steady magnetospheric convection: A review of recent results,
Space Science Reviews, 75 (3-4), 551-604, 1996a.
Sergeev, V.A., T.I. Pulkkinen, and R.J. Pellinen, Coupled-mode scenario for the magnetospheric dynamics, ,I. Geo-
phys. Res., 101 (A6), 13047-13065, 1996b.
Takalo, J., J. Timonen, A.J. Klimas, J. Valdivia, and D. Vassiliadis, Nonlinear energy dissipation in a cellular
automaton rnagnetotail field model, Geophys. Res. Lett., 26 (13), 1813, 1999a.
Takalo, J., J. Timonen, A.J. Klimas, J.A. Valdivia, and D. Vassiliadis, A coupled map model for the magnetotail
current sheet, Geophys. Res. Lett., in press, 1999b.
Tsurutani, B.T., M. Sugiura, T. Iyemori, B.E. Goldstein, W.D. Gonzalez, S.I. Akasofu, and E.J. Smith, The Nonlin-
ear Response of Ae to the Imf Bs Driver - a Spectral Break At 5 Hours, Geophys. Res. Lett., 17 (3), 279-282,
1990.
34

08/25/99
Uritsky, V.M., and M.I. Pudovkin, Low frequency 1/f-like fluctuations of the AE-index as a possible manifestation
of self-organized criticality in the magnetosphere, Ann. Geophys., 16 (12), 1580-1588, 1998.
Valdivia, J.A., A.S. Sharma, and K. Papadopoulos, Prediction of magnetic storms by nonlinear models, Geophys.
Res. Lett., 23 (21), 2899-2902, 1996.
Valdivia, J.A., D. Vassiliadis, A. Klimas, A.S. Sharma, and K. Papadopoulos, Spatiotemporal activity of magnetic
storms, J. Geophys. Res., 104 (A6), 12239-12250, 1999a.
Valdivia, J.A., D. Vassiliadis, A.J. Klimas, and A.S. Sharma, Modeling the spatial structure of the high latitude
magnetic perturbations and the related current system, Phys. Plasmas, in press, 1999b.
Vassiliadis, D., A.J. Klimas, D.N. Baker, and D.A. Roberts, A Description of the Solar-Wind Magnetosphere Cou-
pling Based On Nonlinear Filters, J. Geophys. Res., !00 (A3), 3495-3512, 1995.
Vlahos, L., M. Georgoulis, R. Kluiving, and P. Paschos, The Statistical Flare, Astron. Astrophys., 299 (3), 897-911,
1995.
Yoon, P.H., and A.T.Y. Lui, Nordocal ion Weibel instability in the geomagnetic tail, ,!. Geophys. Res., 101 (A3),
4899-4906, 1996.
35