Short story assignment SHI Tianlun 53545996 The Traveler: An Unexpected Journey
Energetic electron precipitation during substorm injection events:
High-latitude fluxes and an unexpected midlatitude signature
Mark A. Clilverd,1 Craig J. Rodger,2 James Brundell,3 John Bahr,2 Neil Cobbett,1
Tracy Moffat-Griffin,1 Andrew J. Kavanagh,4 Annika Seppala,5,6 Neil. R. Thomson,2
Reiner H. W. Friedel,7 and Frederick W. Menk8
Received 28 March 2008; revised 10 June 2008; accepted 1 August 2008; published 30 October 2008.
[1] Geosynchronous Los Alamos National Laboratory (LANL-97A) satellite particledata, riometer data, and radio wave data recorded at high geomagnetic latitudes in theregion south of Australia and New Zealand are used to perform the first completemodeling study of the effect of substorm electron precipitation fluxes on low-frequencyradio wave propagation conditions associated with dispersionless substorm injectionevents. We find that the precipitated electron energy spectrum is consistent with ane-folding energy of 50 keV for energies <400 keV but also contains higher fluxes ofelectrons from 400 to 2000 keV. To reproduce the peak subionospheric radio waveabsorption signatures seen at Casey (Australian Antarctic Division), and the peak riometerabsorption observed at Macquarie Island, requires the precipitation of 50–90% of thepeak fluxes observed by LANL-97A. Additionally, there is a concurrent and previouslyunreported substorm signature at L < 2.8, observed as a substorm-associated phaseadvance on radio waves propagating between Australia and New Zealand. Twomechanisms are discussed to explain the phase advances. We find that the most likelymechanism is the triggering of wave-induced electron precipitation caused by wavesenhanced in the plasmasphere during the substorm and that either plasmaspherichiss waves or electromagnetic ion cyclotron waves are a potential source capable ofprecipitating the type of high-energy electron spectrum required. However, the presence ofthese waves at such low L shells has not been confirmed in this study.
Citation: Clilverd, M. A., et al. (2008), Energetic electron precipitation during substorm injection events: High-latitude fluxes and an
unexpected midlatitude signature, J. Geophys. Res., 113, A10311, doi:10.1029/2008JA013220.
1. Introduction
[2] In this study we analyze ground-based ionosphericdata from middle and high latitudes in the region aroundAustralia and New Zealand during dispersionless substorminjection events. We use data from 2005 to 2007 to showthat ionization signatures of substorm injection events canbe observed at both L � 4–12 and L � 2.4–2.8, despite thewell known low-latitude limit of particle precipitation beingL � 4.0 [Berkey et al., 1974]. We use radio waves, riometers
and geostationary spacecraft data to show that the timing ofthe precipitation events at L � 2.4–2.8 is the same as atL � 5, but delayed with respect to the injection signature atgeostationary orbit (L = 6.6).[3] Substorm injection events were comprehensively
mapped by Berkey et al. [1974] using about 40 NorthernHemisphere riometers in the IQSY (1964–1965) and IASY(1969). Typically, energetic electron precipitation from asubstorm occurs near midnight, rapidly expanding eastwardwith velocities that correspond to electron drift velocitiesassociated with energies of 50–300 keV. Initially the riom-eter absorption maximum is located close to 65� geomagneticlatitude (L� 6) but expands within 15 min to cover a latituderange of 60–73� geomagnetic (L= 4–12). This latitude rangeis consistent with the observations from particle detectorson DMSP flights [Sandholt et al., 2002]. After 15 min thelongitudinal extent of the substorm precipitation region is�100�. The longitudinal expansion can continue for morethan an hour until substorm signatures are observed at mostlocal times, although no further increase in latitudinal extentoccurs. The electron energies involved in substorm injec-tions seen by satellites such as LANL are typically 50–1000 keV, with the highest fluxes occurring at the lowestenergies [Baker et al., 1985]. While the satellite observa-
JOURNAL OF GEOPHYSICAL RESEARCH, VOL. 113, A10311, doi:10.1029/2008JA013220, 2008ClickHere
for
FullArticle
1Physical Sciences Division, National Environmental Research Council,British Antarctic Survey, Cambridge, U.K.
2Department of Physics, University of Otago, Dunedin, New Zealand.3Dunedin, New Zealand.4Space Plasma Environment and Radio Science Group, Department of
Communication Systems, Lancaster University, Lancaster, U.K.5Earth Observation, Finnish Meteorological Institute, Helsinki, Finland.6Now at Physical Sciences Division, National Environmental Research
Council, British Antarctic Survey, Cambridge, U.K.7Los Alamos National Laboratory, Los Alamos, New Mexico, USA.8School of Mathematical and Physical Sciences and Cooperative
Research Centre for Satellite Systems, University of Newcastle, Callaghan,New South Wales, Australia.
Copyright 2008 by the American Geophysical Union.0148-0227/08/2008JA013220$09.00
A10311 1 of 12
tions provide some information on the energy spectra of theinjected electrons, and the fluxes in drift orbit, it is verydifficult to determine what proportion of the electrons arebeing precipitated into the atmosphere through onboardsatellite measurements. The primary difficulty is in makingobservations of electron populations in the spatially narrowloss cone, particularly around the geomagnetic equatorwhere geostationary satellites reside.[4] The injection of energetic electrons during a substorm
has been modeled by considering an electromagnetic pulsepropagating earthward, interacting with a preexisting elec-tron population [Sarris et al., 2002]. The rate of inward driftof the electron population driven by radial diffusion hasbeen shown to gradually decrease with decreasing L shell.Close to the injection latitude, that is, at a single local time,the radialmotion is typically 25 km s�1, slowing to�15 km s�1
at about L = 5. Calculations at L shells below L = 4 have notbe made because of the observed limits of substorminjection precipitation, but simple extrapolation of thepublished data suggests speeds of �10 km s�1 at L = 2.8,assuming it is possible for the injection to penetrate insideL = 4. The results of Sarris et al. [2002] suggest thatbetween the time delay of an injection signature at geosta-tionary obit and L = 5.4 is 5 min, while for the sameinjection to reach L = 2.8 would be a further �20 min.[5] Energetic electron precipitation during substorms has
been studied using riometers [e.g., Jelly and Brice, 1967],
forward scatter radar [e.g., Bailey, 1968], and VLF radiowaves [e.g., Thorne and Larsen, 1976]. The VLF radiowave technique has an advantage in that it is most sensitiveto ionization caused by relativistic electron precipitationenergies, typically >100 keV, as these energies ionize theneutral atmosphere in the Earth-ionosphere waveguide, thatis, at altitudes below �70 km. Thorne and Larsen [1976,and references therein] reported that electron fluxes of�103 el. cm�2 s�1 sr�1 were required at energies of>200 keV in order to account for radio signal disturbancesduring substorms, observed over the latitudes 4.5 � L �6.0. Larsen and Thomas [1974] used the ERSO 1A satelliteto estimate that the trapped electron spectrum during asubstorm could be represented by an e-folding energy ofabout 50 keV (using 176–434 keV energies). The energyspectrum of the electron precipitation into the atmospherewas found to be of the same form as the trapped fluxes[Rosenberg et al., 1972] with the maximum precipitatedfluxes comparable with the trapped fluxes [Larsen andThomas, 1974].[6] In this study we use LANL particle data, riometer
data, and radio wave data recorded at high geomagneticlatitudes to identify the occurrence of substorm injectionevents in a region south of Australia and New Zealand. Datasets from high-latitude locations (Casey and MacquarieIsland, Australian Antarctic Division) and the geostationarysatellite LANL-97A are used to describe the high-latitudeelectron precipitation driven by dispersionless substorminjections. Additionally, we present radio wave datarecorded at Dunedin, New Zealand to show that there is aconcurrent and unexpected substorm signature at L < 2.8,but that no clear signature of the substorms can be detectedin a riometer also located in Dunedin. We discuss thepotential mechanisms that could cause the observed radiowave signature, including the precipitation of radiation beltelectrons by electromagnetic ion cyclotron waves, and thepossibility of distant scattering of radio waves by theexpected ionospheric ionization feature at L > 4 in a similarway to medium-latitude Trimpi.
2. Experimental Setup
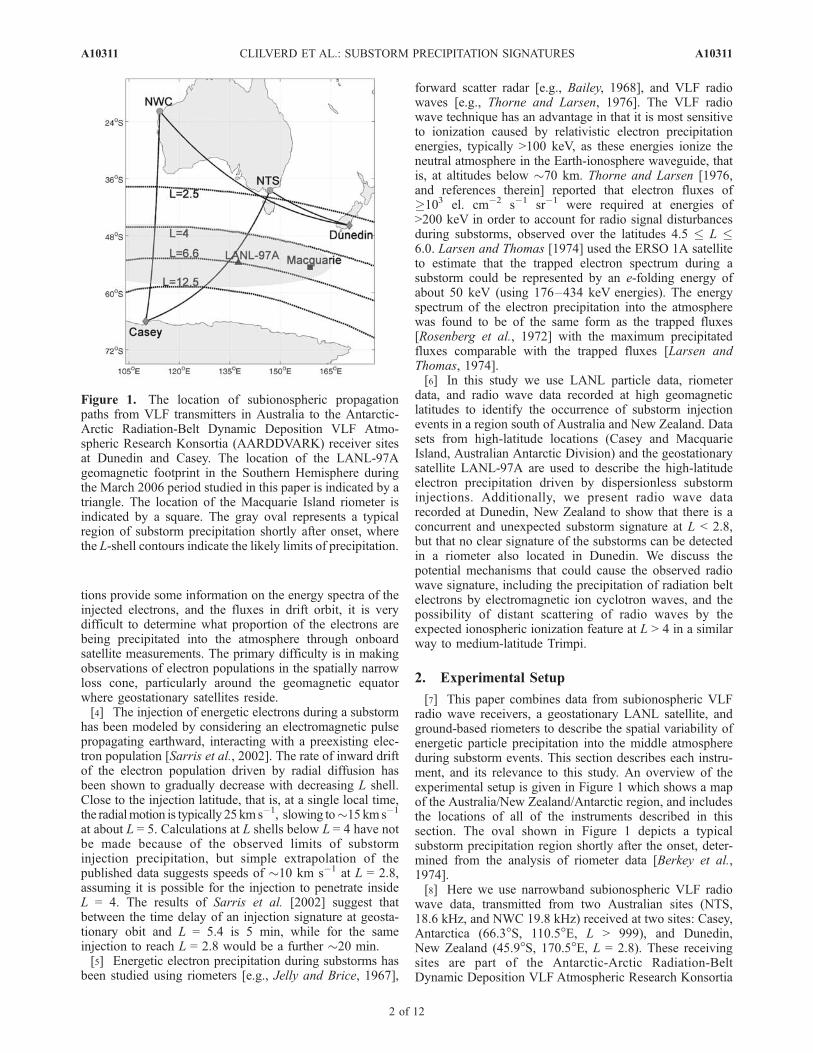
[7] This paper combines data from subionospheric VLFradio wave receivers, a geostationary LANL satellite, andground-based riometers to describe the spatial variability ofenergetic particle precipitation into the middle atmosphereduring substorm events. This section describes each instru-ment, and its relevance to this study. An overview of theexperimental setup is given in Figure 1 which shows a mapof the Australia/New Zealand/Antarctic region, and includesthe locations of all of the instruments described in thissection. The oval shown in Figure 1 depicts a typicalsubstorm precipitation region shortly after the onset, deter-mined from the analysis of riometer data [Berkey et al.,1974].[8] Here we use narrowband subionospheric VLF radio
wave data, transmitted from two Australian sites (NTS,18.6 kHz, and NWC 19.8 kHz) received at two sites: Casey,Antarctica (66.3�S, 110.5�E, L > 999), and Dunedin,New Zealand (45.9�S, 170.5�E, L = 2.8). These receivingsites are part of the Antarctic-Arctic Radiation-BeltDynamic Deposition VLF Atmospheric Research Konsortia
Figure 1. The location of subionospheric propagationpaths from VLF transmitters in Australia to the Antarctic-Arctic Radiation-Belt Dynamic Deposition VLF Atmo-spheric Research Konsortia (AARDDVARK) receiver sitesat Dunedin and Casey. The location of the LANL-97Ageomagnetic footprint in the Southern Hemisphere duringthe March 2006 period studied in this paper is indicated by atriangle. The location of the Macquarie Island riometer isindicated by a square. The gray oval represents a typicalregion of substorm precipitation shortly after onset, wherethe L-shell contours indicate the likely limits of precipitation.
A10311 CLILVERD ET AL.: SUBSTORM PRECIPITATION SIGNATURES
2 of 12
A10311
(AARDDVARK, for a comprehensive description of thearray visit www.physics.otago.ac.nz/space/AARDDVARK_homepage.htm). The effects of changing ionization condi-tions in the mesosphere, due to energetic particle precipita-tion, can be observed along the propagation path between aVLF transmitter and a receiver. Subionospheric propagationis sensitive to ionization located below about 90 km. Theeffect of increased ionization on the propagating signals canbe seen as either an increase or decrease in signal amplitudeor phase depending on the modal mixture of each signalobserved [Barr et al., 2000; Clilverd et al., 2006b]. Thisstudy reports only amplitude results from Casey becausethere are no current measurements of phase available fromthat site. Phase and amplitude data are available at Dunedin,although we typically show phase only to reduce thenumber of plots per figure, and because the phase responseis more consistent from substorm to substorm. The greatcircle paths from NWC and NTS received at Dunedin andCasey are shown in Figure 1.[9] The LANL spacecraft data used in this study are from
the Synchronous Orbit Particle Analyzer (SOPA) on LANL-97A (L � 6.6, 138�E). We concentrate on data from LANL-97A because the L-shell footprint of the satellite is locatedin the ocean south of Australia, and lies close to the greatcircle paths of signals from NTS and NWC received atCasey. In subsequent analysis we show the LANL-97Aelectron flux in the energy range 75–105 keV [Belian et al.,1992] because electrons with these energies will createionization at altitudes of �80 km, and thus significantlyinfluence the electron density profile of the nighttime lowerionosphere.[10] The riometer data used in this study are provided
from instruments located at Dunedin (45.9�S, 170.5�E,L = 2.8) and Macquarie Island (54.5�S, 158.9�E, L = 5.4).The riometers are wide-beam, 30 MHz, vertical pointingparallel dipole systems, with time resolutions of 1–10 s,although we typically present 1 min average data. Riometers[Little and Leinbach, 1959] will observe the integratedabsorption of cosmic radio noise through the ionosphere,with increased absorption due to additional ionization due toboth proton and electron precipitation. The dominant alti-tude of the absorption is typically in the range 70–100 km,that is, biased toward relatively soft particle energies(�30 keV electrons).
3. Results
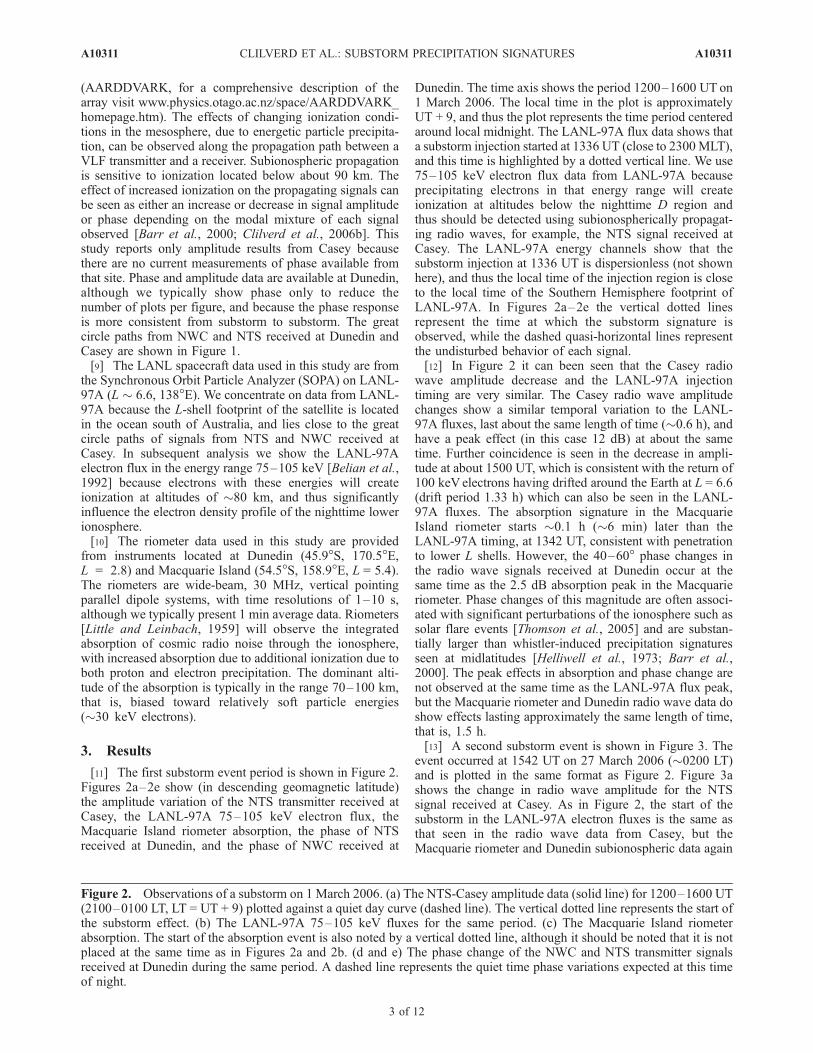
[11] The first substorm event period is shown in Figure 2.Figures 2a–2e show (in descending geomagnetic latitude)the amplitude variation of the NTS transmitter received atCasey, the LANL-97A 75–105 keV electron flux, theMacquarie Island riometer absorption, the phase of NTSreceived at Dunedin, and the phase of NWC received at
Dunedin. The time axis shows the period 1200–1600 UT on1 March 2006. The local time in the plot is approximatelyUT + 9, and thus the plot represents the time period centeredaround local midnight. The LANL-97A flux data shows thata substorm injection started at 1336 UT (close to 2300MLT),and this time is highlighted by a dotted vertical line. We use75–105 keV electron flux data from LANL-97A becauseprecipitating electrons in that energy range will createionization at altitudes below the nighttime D region andthus should be detected using subionospherically propagat-ing radio waves, for example, the NTS signal received atCasey. The LANL-97A energy channels show that thesubstorm injection at 1336 UT is dispersionless (not shownhere), and thus the local time of the injection region is closeto the local time of the Southern Hemisphere footprint ofLANL-97A. In Figures 2a–2e the vertical dotted linesrepresent the time at which the substorm signature isobserved, while the dashed quasi-horizontal lines representthe undisturbed behavior of each signal.[12] In Figure 2 it can been seen that the Casey radio
wave amplitude decrease and the LANL-97A injectiontiming are very similar. The Casey radio wave amplitudechanges show a similar temporal variation to the LANL-97A fluxes, last about the same length of time (�0.6 h), andhave a peak effect (in this case 12 dB) at about the sametime. Further coincidence is seen in the decrease in ampli-tude at about 1500 UT, which is consistent with the return of100 keVelectrons having drifted around the Earth at L = 6.6(drift period 1.33 h) which can also be seen in the LANL-97A fluxes. The absorption signature in the MacquarieIsland riometer starts �0.1 h (�6 min) later than theLANL-97A timing, at 1342 UT, consistent with penetrationto lower L shells. However, the 40–60� phase changes inthe radio wave signals received at Dunedin occur at thesame time as the 2.5 dB absorption peak in the Macquarieriometer. Phase changes of this magnitude are often associ-ated with significant perturbations of the ionosphere such assolar flare events [Thomson et al., 2005] and are substan-tially larger than whistler-induced precipitation signaturesseen at midlatitudes [Helliwell et al., 1973; Barr et al.,2000]. The peak effects in absorption and phase change arenot observed at the same time as the LANL-97A flux peak,but the Macquarie riometer and Dunedin radio wave data doshow effects lasting approximately the same length of time,that is, 1.5 h.[13] A second substorm event is shown in Figure 3. The
event occurred at 1542 UT on 27 March 2006 (�0200 LT)and is plotted in the same format as Figure 2. Figure 3ashows the change in radio wave amplitude for the NTSsignal received at Casey. As in Figure 2, the start of thesubstorm in the LANL-97A electron fluxes is the same asthat seen in the radio wave data from Casey, but theMacquarie riometer and Dunedin subionospheric data again
Figure 2. Observations of a substorm on 1 March 2006. (a) The NTS-Casey amplitude data (solid line) for 1200–1600 UT(2100–0100 LT, LT = UT + 9) plotted against a quiet day curve (dashed line). The vertical dotted line represents the start ofthe substorm effect. (b) The LANL-97A 75–105 keV fluxes for the same period. (c) The Macquarie Island riometerabsorption. The start of the absorption event is also noted by a vertical dotted line, although it should be noted that it is notplaced at the same time as in Figures 2a and 2b. (d and e) The phase change of the NWC and NTS transmitter signalsreceived at Dunedin during the same period. A dashed line represents the quiet time phase variations expected at this timeof night.
A10311 CLILVERD ET AL.: SUBSTORM PRECIPITATION SIGNATURES
3 of 12
A10311
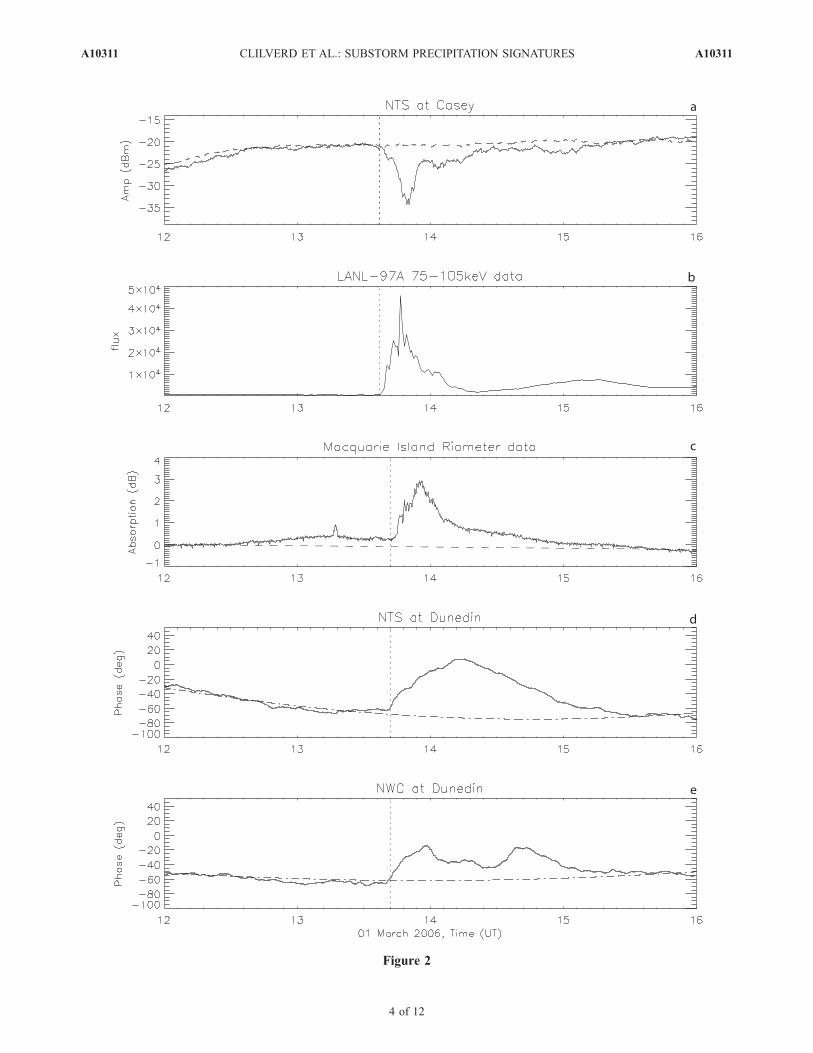
Figure 2
A10311 CLILVERD ET AL.: SUBSTORM PRECIPITATION SIGNATURES
4 of 12
A10311

Figure 3. (a–e) Observations of a substorm on 27 March 2006. Format is the same as that for Figure 2.
A10311 CLILVERD ET AL.: SUBSTORM PRECIPITATION SIGNATURES
5 of 12
A10311

start after a �0.15 h (�10 min) delay. Although the LANL-97A injection signature shows a two-peaked structureduring the substorm, none of the ground-based experimentsshow this, and instead, show a gradual rise to a maximumeffect �0.3–0.6 h after the start of the event. Similarly, allthe ground-based experiments showed that the substormevent lasted until �1730 UT, while the LANL-97A sub-storm signature appears to end at �1648 UT. Typically thisevent caused an approximately 15 dB effect in the NTS-Casey signal, 1 dB of absorption in the Macquarie Islandriometer, and a 20–40� phase advance in the radio wavesignals received at Dunedin.[14] In Table 1 we show a list of six substorm events that
have produced notable phase increases in the Dunedin radiowave data and two that showed very small effects atDunedin. The columns represent the time of the injectionas determined from the LANL data, the delay to onset timeobserved in the Macquarie Island riometer measurements,the size and the duration of the phase advance observed inthe Dunedin subionospheric recordings, and the delay of thephase advance onset time at Dunedin compared with theMacquarie Island riometer onset time. In the current studyperiod (January 2006 to December 2007) we have identifiedsix significant (>10�) phase advance events at Dunedin, allof which occurred in the months of February to April, andno >10� phase advance events outside these months despitegood substorm signatures being observed on occasions byall of the other experiments. Typically the phase advancesare �50�, which is much larger than nighttime phasechanges associated with whistler-induced electron precipi-tation [Lev-Tov et al., 1996; Clilverd et al., 1999; Rodgeret al., 2007b] and comparable with large storm effects[Thomson et al., 2007] driven by plasmaspheric hiss-inducedprecipitation [Rodger et al., 2007a].[15] The average substorm occurrence time in Table 1 is
just after magnetic midnight, and the delay between LANL-97A and the Macquarie riometer signature is typically0.10–0.15 h (6–9 min). On average the Macquarie riometerabsorption and the Dunedin phase advances last for thesame time, that is, �1.5 h. In five out of the eight events theDunedin phase advance onset occurs at the same time asthe Macquarie riometer absorption onset, however in oneevent (27 February 2007) there is no delay between the
Macquarie riometer, LANL-97A, and Casey amplitude but a�40 min delay to the Dunedin phase advance event.
4. Discussion
4.1. High-Latitude Precipitation Fluxes
[16] Figure 4 shows the diurnal variation in amplitude ofNTS received at Casey. Mesospheric ionization effects onVLF/LF wave propagation can be modeled using the LongWave Propagation Code (LWPC) [Ferguson and Snyder,1990]. LWPC models VLF signal propagation from anypoint on Earth to any other point. Given electron densityprofile parameters for the upper boundary conditions,LWPC calculates the expected amplitude and phase of theVLF signal at the reception point. In Figure 4 the diamondsindicate undisturbed LWPC model amplitude values for thepath using the Thomson [1993] daytime model ionosphere,and the Thomson et al. [2007] nighttime model ionosphere.The substorm effect at Casey can be seen at�1300–1400UTas a sudden decrease in amplitude of �12 dB, lasting �1 h.
Table 1. Properties of the NTS to Dunedin Substorm-Associated Phase Advances Observed in 2006 and 2007, Including the Delay Time
of the Macquarie Island Riometer Signal Compared With the LANL-Spacecraft Injection Onset Time and the Subsequent Delay From the
Macquarie Riometer Onset to the Radio Wave Phase Advance Onset on NTS Transmissions Observed at Dunedin
DateLANL Onset Time
(UT)Delay Time to Macquarie
Riometer (hours)NTS Phase
Advance (degrees)Phase AdvanceDuration (hours)
Subsequent DelayTime to PhaseAdvance (hours)
27 Feb 2007 1536 0.00 70 1.4 0.701 Mar 2006 1336 0.10 75 1.6 0.006 Mar 2006 1351 0.10 40 2.0 0.0027 Mar 2006 1542 0.15 55 1.5 0.005 Apr 2007 1233 0.10 50 1.3 0.0022 Apr 2007 1100 0.15 20 1.0 0.0015 Jun 2006 1411 0.02 5 1.1 0.077 Sep 2006 1300 0.00 0 - -
Figure 4. The diurnal variation in amplitude of the NTSreceived at Casey on 1 March 2006. The diamonds indicateundisturbed Long Wave Propagation Code (LWPC) modelamplitude values for the path using the Thomson [1993]daytime model ionosphere and the Thomson et al. [2007]nighttime model ionosphere. The substorm effect can beseen at �1300–1400 UT as a sudden decrease in amplitudeof >10dB, lasting �1 h.
A10311 CLILVERD ET AL.: SUBSTORM PRECIPITATION SIGNATURES
6 of 12
A10311

Figure 5
A10311 CLILVERD ET AL.: SUBSTORM PRECIPITATION SIGNATURES
7 of 12
A10311
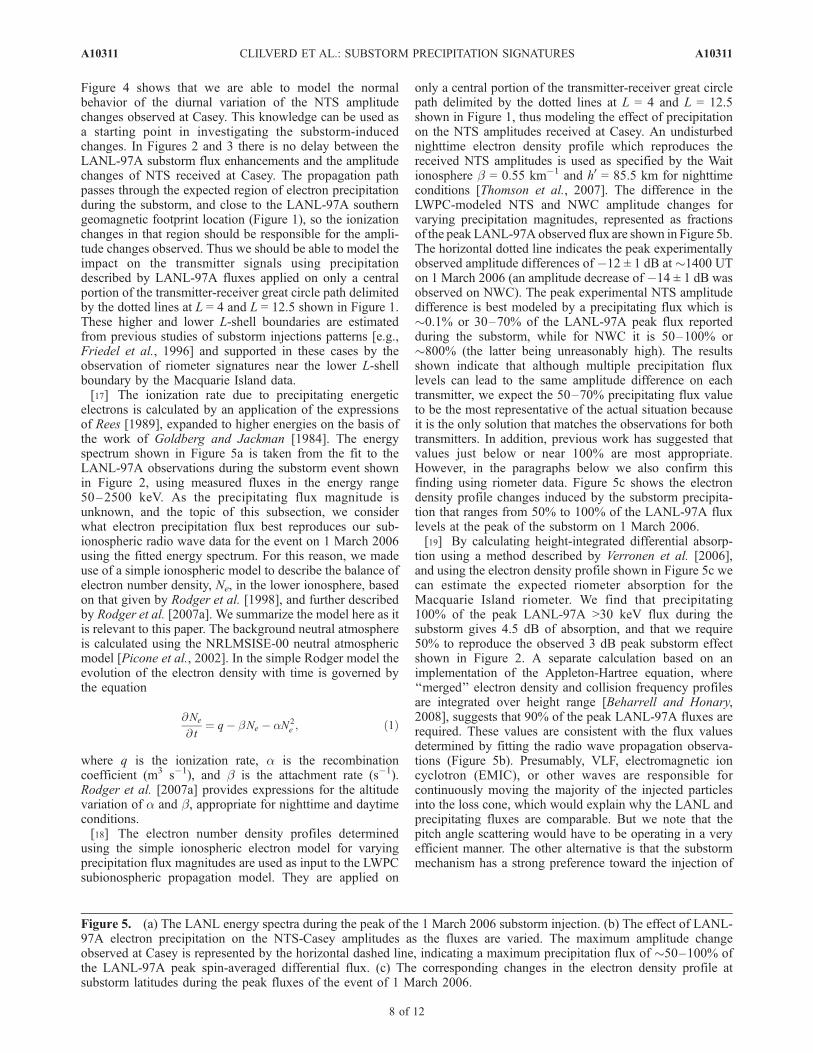
Figure 4 shows that we are able to model the normalbehavior of the diurnal variation of the NTS amplitudechanges observed at Casey. This knowledge can be used asa starting point in investigating the substorm-inducedchanges. In Figures 2 and 3 there is no delay between theLANL-97A substorm flux enhancements and the amplitudechanges of NTS received at Casey. The propagation pathpasses through the expected region of electron precipitationduring the substorm, and close to the LANL-97A southerngeomagnetic footprint location (Figure 1), so the ionizationchanges in that region should be responsible for the ampli-tude changes observed. Thus we should be able to model theimpact on the transmitter signals using precipitationdescribed by LANL-97A fluxes applied on only a centralportion of the transmitter-receiver great circle path delimitedby the dotted lines at L = 4 and L = 12.5 shown in Figure 1.These higher and lower L-shell boundaries are estimatedfrom previous studies of substorm injections patterns [e.g.,Friedel et al., 1996] and supported in these cases by theobservation of riometer signatures near the lower L-shellboundary by the Macquarie Island data.[17] The ionization rate due to precipitating energetic
electrons is calculated by an application of the expressionsof Rees [1989], expanded to higher energies on the basis ofthe work of Goldberg and Jackman [1984]. The energyspectrum shown in Figure 5a is taken from the fit to theLANL-97A observations during the substorm event shownin Figure 2, using measured fluxes in the energy range50–2500 keV. As the precipitating flux magnitude isunknown, and the topic of this subsection, we considerwhat electron precipitation flux best reproduces our sub-ionospheric radio wave data for the event on 1 March 2006using the fitted energy spectrum. For this reason, we madeuse of a simple ionospheric model to describe the balance ofelectron number density, Ne, in the lower ionosphere, basedon that given by Rodger et al. [1998], and further describedby Rodger et al. [2007a]. We summarize the model here as itis relevant to this paper. The background neutral atmosphereis calculated using the NRLMSISE-00 neutral atmosphericmodel [Picone et al., 2002]. In the simple Rodger model theevolution of the electron density with time is governed bythe equation
@Ne
@ t¼ q� bNe � aN2
e ; ð1Þ
where q is the ionization rate, a is the recombinationcoefficient (m3 s�1), and b is the attachment rate (s�1).Rodger et al. [2007a] provides expressions for the altitudevariation of a and b, appropriate for nighttime and daytimeconditions.[18] The electron number density profiles determined
using the simple ionospheric electron model for varyingprecipitation flux magnitudes are used as input to the LWPCsubionospheric propagation model. They are applied on
only a central portion of the transmitter-receiver great circlepath delimited by the dotted lines at L = 4 and L = 12.5shown in Figure 1, thus modeling the effect of precipitationon the NTS amplitudes received at Casey. An undisturbednighttime electron density profile which reproduces thereceived NTS amplitudes is used as specified by the Waitionosphere b = 0.55 km�1 and h0 = 85.5 km for nighttimeconditions [Thomson et al., 2007]. The difference in theLWPC-modeled NTS and NWC amplitude changes forvarying precipitation magnitudes, represented as fractionsof the peak LANL-97A observed flux are shown in Figure 5b.The horizontal dotted line indicates the peak experimentallyobserved amplitude differences of �12 ± 1 dB at �1400 UTon 1 March 2006 (an amplitude decrease of �14 ± 1 dB wasobserved on NWC). The peak experimental NTS amplitudedifference is best modeled by a precipitating flux which is�0.1% or 30–70% of the LANL-97A peak flux reportedduring the substorm, while for NWC it is 50–100% or�800% (the latter being unreasonably high). The resultsshown indicate that although multiple precipitation fluxlevels can lead to the same amplitude difference on eachtransmitter, we expect the 50–70% precipitating flux valueto be the most representative of the actual situation becauseit is the only solution that matches the observations for bothtransmitters. In addition, previous work has suggested thatvalues just below or near 100% are most appropriate.However, in the paragraphs below we also confirm thisfinding using riometer data. Figure 5c shows the electrondensity profile changes induced by the substorm precipita-tion that ranges from 50% to 100% of the LANL-97A fluxlevels at the peak of the substorm on 1 March 2006.[19] By calculating height-integrated differential absorp-
tion using a method described by Verronen et al. [2006],and using the electron density profile shown in Figure 5c wecan estimate the expected riometer absorption for theMacquarie Island riometer. We find that precipitating100% of the peak LANL-97A >30 keV flux during thesubstorm gives 4.5 dB of absorption, and that we require50% to reproduce the observed 3 dB peak substorm effectshown in Figure 2. A separate calculation based on animplementation of the Appleton-Hartree equation, where‘‘merged’’ electron density and collision frequency profilesare integrated over height range [Beharrell and Honary,2008], suggests that 90% of the peak LANL-97A fluxes arerequired. These values are consistent with the flux valuesdetermined by fitting the radio wave propagation observa-tions (Figure 5b). Presumably, VLF, electromagnetic ioncyclotron (EMIC), or other waves are responsible forcontinuously moving the majority of the injected particlesinto the loss cone, which would explain why the LANL andprecipitating fluxes are comparable. But we note that thepitch angle scattering would have to be operating in a veryefficient manner. The other alternative is that the substormmechanism has a strong preference toward the injection of
Figure 5. (a) The LANL energy spectra during the peak of the 1 March 2006 substorm injection. (b) The effect of LANL-97A electron precipitation on the NTS-Casey amplitudes as the fluxes are varied. The maximum amplitude changeobserved at Casey is represented by the horizontal dashed line, indicating a maximum precipitation flux of �50–100% ofthe LANL-97A peak spin-averaged differential flux. (c) The corresponding changes in the electron density profile atsubstorm latitudes during the peak fluxes of the event of 1 March 2006.
A10311 CLILVERD ET AL.: SUBSTORM PRECIPITATION SIGNATURES
8 of 12
A10311

electrons with pitch angles that lie inside or, very close to,the loss cone.[20] In Figure 6 the fitted energy spectra of both the
100% LANL-97A peak trapped flux and the 50% precip-itated flux are compared with the 50 keV e-folding energyspectrum reported by Larsen and Thomas [1974]. There isgood agreement between the fit to the LANL-97A trappedflux and the 50 keV e-folding spectrum up to �400 keV.However, for energies >400 keV the LANL-97A spectrumhas significantly higher fluxes. To reproduce the substormsignature in the radio wave data the 50% precipitated fluxproduces 1.5 105 el. cm�2 s�1 sr�1 for >200 keVenergies. This is substantially greater that the fluxes of�103 el. cm�2 s�1 sr�1 for >200 keV electrons reported by[Thorne and Larsen, 1976]. The precipitated electron spec-trum also has higher fluxes than the 50 keV e-foldingspectra for energies >400 keV, but without these high-energy fluxes we are unable to accurately model the radiopropagation effects of the substorm for precipitating fluxeswhich were 50% of the peak value reported by LANL-97A:the difference between using the high-energy flux compo-nent of the spectra or not being 7 dB for NWC and 2 dB forNTS. These highly relativistic electrons will penetratedeeply into the atmosphere and impact the chemistry ofthe stratosphere and lower mesosphere (see Turunen et al.[2008] for a review of the potential chemical effects ofrelativistic electron precipitation into the middle atmosphere).[21] The time delay between the beginning of the sub-
storm injection in the LANL-97A particle data at L = 6.6and the lower latitude Macquarie Island riometer data (L =5.4) is typically 6–9 min. Figure 1 shows that the LANLgeomagnetic field line footprint location and the riometerlocation are separated by �20� of longitude and �8� oflatitude. However, the longitudinal expansion of the sub-
storm precipitation is fast and typically covers �100� in thefirst 15 min [Berkey et al., 1974]. Thus, potentially �3 minof delay could occur between the two sites as a result oflongitudinal expansion of the precipitation region. However,the results from Sarris et al. [2002] suggest that most of the6–9 min delay is consistent with injection propagationtimes from L = 6.6 to L = 5.4 (1.2 Re at 25 km s�1 takes5 min).
4.2. Midlatitude Phase Advance Signatures
[22] In section 3 we showed that there were subiono-spheric phase advances observed at the midlatitude record-ing site in Dunedin which were associated with thesubstorms observed at higher L shells. Although the mid-latitude phase advances were delayed with respect to thesubstorm onset timing shown by the high-latitude observa-tions from LANL-97A (L = 6.6) and the Casey subiono-spheric data, they were not delayed with respect to theMacquarie Island riometer observations (L = 5.4). Thismidlatitude substorm phase advance signature has not beenreported before and may be caused by one of severalmechanisms.[23] The most obvious candidate mechanism is direct
precipitation from the substorm injection event. We notethat this mechanism seems unlikely as previous workshowed that the low-latitude boundary of electron precipi-tation from substorms determined by riometers is L = 4, aswe discussed in section 1 [Berkey et al., 1974]. However, itis possible that lower latitude electron precipitation iscaused by electromagnetic ion cyclotron waves (EMIC)associated with a region of high plasmaspheric electrondensity gradients. The effectiveness of the mechanism hasrecently been shown by Clilverd et al. [2007], with signa-tures occurring in the phase of subionospherically propa-gating radio waves just as reported in this study. Thiselectron precipitation mechanism would require EMIC-induced precipitation to be triggered by the substorm at adensity gradient region either well inside the plasmasphere,or from a compressed plasmapause. The EMIC triggeredelectron precipitation at L � 2.5 inferred by Clilverd et al.[2007] was caused by the intense coronal mass ejectionevent of 21 January 2005 [Clilverd et al., 2006a] and thuswas associated with a very large storm event, rather than thesubstorm events considered in the current paper. Observa-tional evidence of the presence of EMIC waves at higher Lshells during these substorms comes from two of theAutomated Geophysical Observatories (AGOs) pulsationmagnetometers in Antarctica, covering L = 6–8, whichare at such high L shells that they do not support or refutethe possibility of EMIC waves at L � 2.7.[24] If direct electron precipitation is causing the midlat-
itude phase advances seen in Figures 2 and 3 then we wouldexpect to observe some signature of it on the riometer datafrom Dunedin (see Figure 1 for the NWC and NTS paths toDunedin). Figure 7 shows a substorm-associated phaseadvance that occurred on 10 March 2005. Although theformat is similar to that of Figures 2 and 3, Figure 7d showsriometer absorption data from Dunedin (L = 2.8). NoDunedin riometer data is available for 2006, so we haveto show data from 2005 which was before our instrument atCasey was operational, and consequently substorm eventsfrom 2005 were not initially selected for this study. Figure 7
Figure 6. The LANL trapped flux energy spectra for the1 March 2006 substorm injection (squares), compared withthe E0 = 50 keV e-folding spectra estimated by Larsen andThomas [1974] from a relativistic electron precipitationevent observed by the ESRO 1A satellite (circles). The peaksubstorm-precipitated electron flux determined from theradio wave data is also shown (crosses).
A10311 CLILVERD ET AL.: SUBSTORM PRECIPITATION SIGNATURES
9 of 12
A10311

shows that a substorm injection event occurred in the LANLdata at 1448 UT, with a resultant 1.5 dB absorptionsignature on the Macquarie Island riometer seen �5 minlater. A small phase advance is seen at the same time onNTS received at Dunedin, all of which is consistent with thepattern of events shown in Figures 2 and 3. In contrast, theDunedin riometer shows no significant absorption coinci-dent with the event timing. Thus we conclude that either thereis no direct electron precipitation occurring at L = 2.4–2.8in this event, or that the energy of the precipitating electronsis so high that no significant absorption is produced in theriometer data. An energy spectra dominated by relativistic
electrons (energies 1–2 MeV) is consistent with theexpected spectrum driven by EMIC [Loto’aniu et al.,2006], which might produce changes in subionosphericpropagation without creating a significant change in riom-eter absorptions. EMIC waves have been associated withsubstorm particle injections [Erlandson and Ukhorskiy,2001].[25] Central to the question of the mechanism that drives
the midlatitude phase advances is the observation that thereis little timing delay between the Macquarie Island riometerdata, and the Dunedin subionospheric phase advances. Thisis clearly not consistent with the propagation of an injection
Figure 7. (a–d) A plot of the effects of a substorm on 10 March 2005. The format is similar to that ofFigure 2 but with Figure 7d representing the Dunedin riometer data. No NWC or NTS-Casey amplitudedata are available for this event.
A10311 CLILVERD ET AL.: SUBSTORM PRECIPITATION SIGNATURES
10 of 12
A10311
event, which the results of Sarris et al. [2002] suggestwould take an additional �20 min. If direct precipitation isoccurring then it is being triggered when the injectionarrives at Macquarie Island latitudes. One possibility is anenhancement of EMIC wave activity in the plasmasphere,triggered as the injection reaches the plasmapause (or justoutside this region). Another possibly, summarized byRodger and Clilverd [2008] is the enhancement of, andthen propagation of, waves from outside the plasmapauseinto the plasmasphere: Bortnik et al. [2008] showed thatchorus outside the plasmapause could appear inside theplasmasphere as plasmaspheric hiss with delay times ofonly a few seconds. In addition, Rodger et al. [2007a]showed that plasmaspheric hiss could produce significantelectron precipitation at L � 3.0 during geomagnetic storms,although the hiss provided an electron precipitation energyspectrum with significant fluxes of electrons <1 MeV whichwould not necessarily agree with the Dunedin riometer datashown in Figure 7.[26] Another mechanism that could produce a substorm-
associated phase advance on obliquely propagating radiowaves is off great circle-path scattering from the ionizationgenerated in the substorm precipitation zone between L = 4and L = 12. The patch of substorm ionization located belowthe normal altitude of the D region lower boundary couldscatter the radio waves from the transmitters in Australiaback toward the receiver in Dunedin and constructively/destructively interfere with the direct signal from transmitterto receiver [e.g., Dowden and Adams, 1993; Clilverd et al.,2002]. Off-path scattering from sprites has only beenreported from ionization patches located within �200 kmof the propagation path. In addition, the high-angle off-pathscattering requires regionally small, electrically ‘‘dense,’’ionization patches rather than the spatially large featuresexpected from substorm precipitation zone extending fromL = 4 to higher L shells.[27] Finally, we note one final characteristic of substorm-
associated phase advances, which is the preponderance ofthe observations occurring in the autumn equinox (Februaryto April). Six of the eight events shown in Table 1 occurduring this time frame, while the substorm events investi-gated outside this period showed either no phase change orvery little (<10�) change. The observed seasonal preferencein substorm-associated subionospheric phase advancescould be due to changes in the efficiency of the mechanismwhich is altering the electrical properties of the lower Dregion, which we monitor by the subionospheric propaga-tion. Another possibility is that the mechanism is occurringwith the same efficiency outside those months, but that thereis a lack of sensitivity in the underlying radio wavepropagation conditions to those ionospheric alterations.Answering these questions requires future studies whichidentify the mechanism by which the midlatitude iono-sphere is modified by high-latitude substorms.
5. Summary
[28] Data from high-latitude locations (Casey andMacquarie Island, Australian Antarctic Division) and thegeostationary satellite LANL-97A, all in the region south ofAustralia and New Zealand, are used to describe and modelhigh-latitude electron precipitation driven by substorm
injection events. We find that electron precipitation im-posed over the latitude range associated with substormprecipitation, and with the energy spectrum observed bythe LANL-97A instrument, can be used to model thesubionospheric radio wave substorm signature seen at Casey.Themaximum required precipitation rate into the atmosphereis found to be 50–90% of the peak fluxes measured by theLANL-97A spacecraft. The electron energy spectrum isconsistent with an e-folding energy of 50 keV for energies<400 keV, but also contains higher fluxes of electrons from400 to 2000 keV.[29] Additionally, we present radio wave data recorded at
midlatitudes, that is, Dunedin, New Zealand, to show thatthere is a concurrent substorm-associated phase advancesignature at L < 2.8, but that no clear signature of anysubstorms can be detected in a riometer also located inDunedin. Three mechanisms have been discussed to explainthe phase advances, including the precipitation of radiationbelt electrons, both by direct substorm electron precipitationor possibly indirectly by electromagnetic ion cyclotronwave interactions, and the distant scattering of radio wavesby the ionization feature at L > 4 in a similar way to low-latitude Trimpi or VLF Sprites. We find that the most likelymechanism considered in this paper is the triggering ofenergetic electron precipitation during the substorm, con-sistent with EMIC wave-particle interactions, although thepresence of these waves has not been directly observed.
[30] Acknowledgments. The authors would like to thank Bill andHelen Dunford for their generous support during this work. The Casey dataare supported by AAD project ASAC 1324. We would also like toacknowledge the use of the AAD data system for the provision of theMacquarie Island Riometer data, available at http://www.ips.gov.au/World_Data_Centre/1/8. We would like to acknowledge Hiroshi Fukunishiof Tohoku University, Sendai, Japan, for providing the summary AGO Pc1–2 data. The LANL data were kindly provided by the Los AlamosNational Laboratory from http://leadbelly.lanl.gov/lanl_ep_data/. A. S.would like to acknowledge funding support from the Finnish Academy.[31] Zuyin Pu thanks Xinlin Li and David Nunn for their assistance in
evaluating this paper.
ReferencesBailey, D. K. (1968), Some quantitative aspects of electron precipitation inand near the auroral zone, Rev. Geophys., 6, 289–346.
Baker, D. N., W. Aiello, J. R. Asbridge, R. D. Belian, P. R. Higbie, R. W.Klebesadel, J. G. Laros, and E. R. Tech (1985), Los Alamos energeticparticle sensor systems at geostationary orbit, AIAA-1985–243, Am. Inst.of Aeronaut. and Astronaut., Reston, Va.
Barr, R., D. L. Jones, and C. J. Rodger (2000), ELF and VLF radio waves,J. Atmos. Sol. Terr. Phys., 62, 1689 – 1718, doi:10.1016/S1364-6826(00)00121-8.
Beharrell, M. J., and F. Honary (2008), A new method for deducing theeffective collision frequency profile in the D-region, J. Geophys. Res.,113, A05303, doi:10.1029/2007JA012650.
Belian, R. D., G. R. Gisler, T. Cayton, and R. Christensen (1992), High-Zenergetic particles at geostationary orbit during the great solar protonevent series of October 1989, J. Geophys. Res., 97, 16,897–16,906.
Berkey, F. T., V. M. Driatskiy, K. Henriksen, B. Hultqvist, D. H. Jelly, T. I.Shchuka, A. Theander, and J. Yliniemi (1974), A synoptic investigationof particle precipitation dynamics for 60 substorms in IQSY (1964–1965) and IASY (1969), Planet. Space Sci., 22, 255–307, doi:10.1016/0032-0633(74)90028-2.
Bortnik, J., R. M. Thorne, and N. Meredith (2008), The unexpected originof plasmaspheric hiss from discrete chorus emissions, Nature, 452, 62–66, doi:10.1038/nature06741.
Clilverd, M. A., R. F. Yeo, D. Nunn, and A. J. Smith (1999), Latitudinallydependent Trimpi effects: Modeling and observations, J. Geophys. Res.,104, 19,881–19,887.
Clilverd, M. A., D. Nunn, S. J. Lev-Tov, U. S. Inan, R. L. Dowden, C. J.Rodger, and A. J. Smith (2002), Determining the size of lightning-
A10311 CLILVERD ET AL.: SUBSTORM PRECIPITATION SIGNATURES
11 of 12
A10311

induced electron precipitation patches, J. Geophys. Res., 107(A8), 1168,doi:10.1029/2001JA000301.
Clilverd, M. A., C. J. Rodger, and T. Ulich (2006a), The importance ofatmospheric precipitation in storm-time relativistic electron flux dropouts, Geophys. Res. Lett., 33, L01102, doi:10.1029/2005GL024661.
Clilverd, M. A., A. Seppala, C. J. Rodger, N. R. Thomson, P. T. Verronen,E. Turunen, T. Ulich, J. Lichtenberger, and P. Steinbach (2006b), Model-ing polar ionospheric effects during the October–November 2003 solarproton events, Radio Sci., 41, RS2001, doi:10.1029/2005RS003290.
Clilverd, M. A., C. J. Rodger, R. M. Millan, J. G. Sample, M. Kokorowski,M. P. McCarthy, T. Ulich, T. Raita, A. J. Kavanagh, and E. Spanswick(2007), Energetic particle precipitation into the middle atmosphere trig-gered by a coronal mass ejection, J. Geophys. Res., 112, A12206,doi:10.1029/2007JA012395.
Dowden, R. L., and C. D. D. Adams (1993), Size and location of lightning-induced ionisation enhancements from measurement of VLF phase andamplitude perturbations on multiple antennas, J. Atmos. Terr. Phys., 55,1335–1359, doi:10.1016/0021-9169(93)90102-5.
Erlandson, R. E., and A. J. Ukhorskiy (2001), Observations of electromag-netic ion cyclotron waves during geomagnetic storms: Wave occurrenceand pitch angle scattering, J. Geophys. Res., 106(A3), 3883–3895.
Ferguson, J. A., and F. P. Snyder (1990), Computer programs for assess-ment of long wavelength radio communications, Tech. Doc. 1773, Natl.Ocean Syst. Cent., San Diego, Calif.
Friedel, R. H. W., A. Korth, and G. Kremser (1996), Substorm onsetsobserved by CRRES: Determination of energetic particle source regions,J. Geophys. Res., 101, 13,137–13,154.
Goldberg, R. A., and C. H. Jackman (1984), Nighttime auroral energydeposition in the middle atmosphere, J. Geophys. Res., 89(A7), 5581–5596.
Helliwell, R. A., J. P. Katsufrakis, and M. L. Trimpi (1973), Whistler-induced amplitude perturbations in VLF propagation, J. Geophys. Res.,78, 4679–4688.
Jelly, D., and N. Brice (1967), Changes in the Van Allen radiation asso-ciated with polar substorms, J. Geophys. Res., 72, 5919–5931.
Larsen, T. R., and G. R. Thomas (1974), Energy spectra measured during arelativistic electron precipitation event on 2 February 1969, J. Atmos.Terr. Phys., 36, 1613–1622, doi:10.1016/0021-9169(74)90199-8.
Lev-Tov, S. J., U. S. Inan, A. J. Smith, and M. A. Clilverd (1996), Char-acteristics of localized ionospheric disturbances inferred from VLF mea-surements at two closely spaced receivers, J. Geophys. Res., 101,15,737–15,747.
Little, C. G., and H. Leinbach (1959), The riometer: A device for thecontinuous measurements of ionospheric absorption, Proc. IRE, 37,315–320.
Loto’aniu, T. M., R. M. Thorne, B. J. Fraser, and D. Summers (2006),Estimating relativistic electron pitch angle scattering rates using proper-ties of the electromagnetic ion cyclotron wave spectrum, J. Geophys.Res., 111, A04220, doi:10.1029/2005JA011452.
Picone, J. M., A. E. Hedin, D. P. Drob, and A. C. Aikin (2002),NRLMSISE-00 empirical model of the atmosphere: Statistical compari-sons and scientific issues, J. Geophys. Res., 107(A12), 1468, doi:10.1029/2002JA009430.
Rees, M. H. (1989), Physics and Chemistry of the Upper Atmosphere,Cambridge Univ. Press, New York.
Rodger, C. J., and M. A. Clilverd (2008), Magnetospheric physics: Hissfrom the chorus, Nature, 452(7183), 41–42, doi:10.1038/452041a.
Rodger, C. J., O. A. Molchanov, and N. R. Thomson (1998), Relaxation oftransient ionization in the lower ionosphere, J. Geophys. Res., 103(A4),6969–6975.
Rodger, C. J., M. A. Clilverd, N. R. Thomson, R. J. Gamble, A. Seppala,E. Turunen, N. P. Meredith, M. Parrot, J. A. Sauvaud, and J.-J. Berthelier(2007a), Radiation belt electron precipitation into the atmosphere:Recovery from a geomagnetic storm, J. Geophys. Res., 112, A11307,doi:10.1029/2007JA012383.
Rodger, C. J., C. F. Enell, E. Turunen, M. A. Clilverd, N. R. Thomson, andP. T. Verronen (2007b), Lightning-driven inner radiation belt energydeposition into the atmosphere: Implications for ionisation-levels andneutral chemistry, Ann. Geophys., 25, 1745–1757.
Rosenberg, T. J., L. J. Lanzerotti, D. K. Bailey, and J. D. Pierson (1972),Energy spectra in relativistic electron precipitation events, J. Atmos. Terr.Phys., 34, 1977–1990, doi:10.1016/0021-9169(72)90179-1.
Sandholt, P. E., et al. (2002), Multistage substorm expansion: Auroraldynamics in relation to plasma sheet particle injection, precipitation, andplasma convection, J. Geophys. Res., 107(A11), 1342, doi:10.1029/2001JA900116.
Sarris, T. E., X. Li, N. Tsaggas, and N. Paschalidis (2002), Modelingenergetic particle injections in dynamic pulse fields with varying propa-gation speeds, J. Geophys. Res., 107(A3), 1033, doi:10.1029/2001JA900166.
Thomson, N. R. (1993), Experimental daytime VLF ionospheric para-meters, J. Atmos. Terr. Phys., 55, 173–184, doi:10.1016/0021-9169(93)90122-F.
Thomson, N. R., C. J. Rodger, and M. A. Clilverd (2005), Large solar flaresand their ionospheric D region enhancements, J. Geophys. Res., 110,A06306, doi:10.1029/2005JA011008.
Thomson, N. R., M. A. Clilverd, and W. M. McRae (2007), Nighttimeionospheric D region parameters from VLF phase and amplitude,J. Geophys. Res., 112, A07304, doi:10.1029/2007JA012271.
Thorne, R. M., and T. R. Larsen (1976), An investigation of relativisticelectron precipitation events and their association with magnetic sub-storm activity, J. Geophys. Res., 81, 5501–5506.
Turunen, E., et al. (2008), Impact of different energies of precipitatingparticles on NOx generation in the middle and upper atmosphere duringgeomagnetic storms, J. Atmos. Sol. Terr. Phys., in press.
Verronen, P. T., T. Ulich, E. Turunen, and C. J. Rodger (2006), Sunsettransition of negative charge in the D-region ionosphere during high-ionization conditions, Ann. Geophys., 24, 187–202.
�����������������������J. Bahr, C. J. Rodger, and N. R. Thomson, Department of Physics,
University of Otago, P.O. Box 56, Dunedin 9054, New Zealand.([email protected]; [email protected]; [email protected])J. Brundell, Dunedin, New Zealand. ([email protected])M. A. Clilverd, N. Cobbett, T. Moffat-Griffin, and A. Seppala, Physical
Sciences Division, National Environmental Research Council, BritishAntarctic Survey, High Cross, Madingley Road, Cambridge CB3 0ET, UK.([email protected]; [email protected]; [email protected]; [email protected])R. H. W. Friedel, Los Alamos National Laboratory, Bikini Atoll Road,
SM 30, Los Alamos, NM 87545, USA. ([email protected])A. J. Kavanagh, Space Plasma Environment and Radio Science Group,
Department of Communication Systems, InfoLab 21, Lancaster University,Lancaster LA1 4WA, UK. ([email protected])F. W. Menk, School of Mathematical and Physical Sciences, University
of Newcastle, Callaghan, NSW 2308, Australia. ([email protected])
A10311 CLILVERD ET AL.: SUBSTORM PRECIPITATION SIGNATURES
12 of 12
A10311
Copyright © 2022 FDOKUMEN