Self-assembled monolayer mechanism for corrosion inhibition of iron by imidazolines
10
Self-Assembled Monolayer Mechanism for Corrosion Inhibition of Iron by Imidazolines Sunder Ramachandran, ²,‡ Bao-Liang Tsai, ² Mario Blanco, ² Huey Chen, § Yongchun Tang, § and William A. Goddard, III* ,² Materials and Process Simulation Center, Beckman Institute (139-74), Division of Chemistry and Chemical Engineering, California Institute of Technology, Pasadena, California 91125, and Chevron Petroleum Technology Company, 1300 Beach Boulevard, La Habra, California 90631 Received June 27, 1996 X Some of the most effective corrosion inhibitors for oil field pipeline applications are the oleic imidazoline (OI) class of molecules. However, the mechanism by which OIs inhibit corrosion is not known. We report atomistic simulations (quantum mechanics and molecular dynamics) designed to elucidate this mechanism. These studies lead to the self-assembled monolayer (SAM) model for corrosion inhibition, which explains the differences in corrosion inhibition efficiency for various OI molecules. The SAM model of OI inhibitors involves the following critical elements: (i) The function of the OI is to form a self-assembled monolayer on the native oxide surface of iron; this serves a protective role by forming a hydrophobic barrier preventing migration of H 2O, O2, and electrons to the Fe surface. (ii) The imidazoline head group serves as a sufficiently strong Lewis base to displace H2O from the Lewis acid sites of the iron oxide surface. (iii) These head groups self-assemble on the surface to form an ordered monolayer on the iron oxide surface. [x 3 × x 3 for the (001) cleavage surface of R-Fe2O3.] (iv) The long hydrophobic tail (e.g., 2-oleic acid) tilts to form a tightly packed hydrophobic monolayer. [For R-Fe2O3(001) the tilt angle is about 72° with respect to the surface normal.] (v) This hydrocarbon tail must have a sufficient length to cover the surface. [For R-Fe2O3- (001) the chain length must be 12 or more carbon atoms.] (vi) The hydrophobic tail and the pendent group (e.g., -CH2CH2NH2) must lead to an octanol/water partition coefficient (log P) below a critical value in order to rapidly form the monolayer. This SAM model should be useful in developing both alternative environmentally benign corrosion inhibitors and higher temperature corrosion inhibitors. 1.0 Introduction Corrosion in pipes, pumps, turbine blades, coolers, superheaters, reheaters, fuel cells, and exhaust systems causes enormous industrial expense due to production downtime, accidental injuries, and replacement costs. 1 The cost to U.S. industry from corrosion exceeds $10 billion per year. 1 Indeed, the market for corrosion inhibitors (CIs) in the U.S. is expected to increase to $7.1 billion per year by the year 2000. 2 Most CI impose a toxic burden on the environment, making it critical to find environmentally neutral but efficient replacements. 3 The major impediment to designing new inhibitors is that the mechanism by which these chemical compounds prevent corrosion is not understood. 3 The importance of determining the mechanism is illustrated by the strong dependence of efficiency upon minor changes in the chemical structure of these compounds. 3 Experimental evidence in support of specific mechanisms has been difficult to obtain due to the following: (i) the low concentrations at which these inhibitors are used (a few ppm), (ii) the complexity of the environments surrounding the inhibitor under real conditions (high temperatures and pressure and oil and/or water at high ionic strengths), and (iii) the difficulty in experimentally obtaining atom- istic information about the fluid/metal interface. Herein we report a variety of atomistic theoretical studies on oleic imidazoline (OI) inhibitors and compari- sons of the studies with experimentally observed efficien- cies to develop a new mechanism of corrosion inhibition for these systems. This self-assembled monolayer (SAM) mechanism suggests the following essential features for corrosion inhibitors: (i) strong bonding of the head group to Lewis acid sites on the iron oxide surface, (ii) self- assembly of the inhibitors on these surfaces to obtain a pattern controlled by the shape of the head group, (iii) self-organization of the tails to form a coherent hydro- phobic film that serves as a barrier for migration of water, oxygen, and electrons to the metal surface, and (iv) optimal oil/water partitioning of the inhibitor molecules so that a monolayer can be formed on the surface with only ppm concentration in solution. Section 2 describes the characteristics of OI molecules and some of the experiments. Section 3 describes the theoretical results on OI/surface interactions of the SAM model. Section 4 develops quantitative predictions for corrosion inhibition based upon the SAM model. Some additional discussion of the SAM model is in section 5. 2.0 Experimental Observations Concerning Inhibition by OI of Corrosion on Iron Oleic imidazolines (OIs) are used extensively as inhibi- tors of iron corrosion in acidic media, particularly in oil field applications. As shown in Figure 1, these OI molecules consist of the following: (i) an imidazoline head group, (ii) a long hydrocarbon tail group, and (iii) a short pendent group. In this paper we will use the following notation: where h indicates the hydrophobic tail and p indicates the pendent group. Examples are * To whom correspondence should be addressed. Telefax: 818- 585-0918. Phone: 818-395-2731. E-mail: [email protected], copy to [email protected]. ² Beckman Institute. ‡ Current address: Baker Performance Chemicals, Inc., 3900 Essex Lane, 3rd Floor, Houston, TX 77027. § Chevron Petroleum Technology Co. X Abstract published in Advance ACS Abstracts, December 1, 1996. (1) Zanneti, R. Chem. Eng. (NY) 1990, 97(10), 5. (2) Hairston, D. W. Chem. Eng. (NY) 1996, 103(3), 65. (3) Edwards, A.; Osborne, C.; Webster, S.; Klenerman, D.; Joseph, M.; Ostovar, P.; Doyle, M. Corros. Sci. 1994, 36, 315. OI-h-p 6419 Langmuir 1996, 12, 6419-6428 S0743-7463(96)00646-4 CCC: $12.00 © 1996 American Chemical Society
-
Upload
independent -
Category
Documents
-
view
3 -
download
0
Transcript of Self-assembled monolayer mechanism for corrosion inhibition of iron by imidazolines

Self-Assembled Monolayer Mechanism for CorrosionInhibition of Iron by Imidazolines
Sunder Ramachandran,†,‡ Bao-Liang Tsai,† Mario Blanco,† Huey Chen,§Yongchun Tang,§ and William A. Goddard, III*,†
Materials and Process Simulation Center, Beckman Institute (139-74), Division of Chemistryand Chemical Engineering, California Institute of Technology, Pasadena, California 91125,
and Chevron Petroleum Technology Company, 1300 Beach Boulevard,La Habra, California 90631
Received June 27, 1996X
Some of themost effective corrosion inhibitors for oil field pipeline applications are the oleic imidazoline(OI) class of molecules. However, the mechanism by which OIs inhibit corrosion is not known. We reportatomistic simulations (quantummechanics andmolecular dynamics) designed to elucidate thismechanism.These studies lead to the self-assembled monolayer (SAM) model for corrosion inhibition, which explainsthe differences in corrosion inhibition efficiency for various OImolecules. The SAMmodel of OI inhibitorsinvolves the following critical elements: (i) The function of the OI is to form a self-assembled monolayeron the native oxide surface of iron; this serves a protective role by forming ahydrophobic barrier preventingmigration ofH2O,O2, andelectrons to theFe surface. (ii) The imidazolineheadgroup serves asa sufficientlystrong Lewis base to displace H2O from the Lewis acid sites of the iron oxide surface. (iii) These headgroups self-assemble on the surface to form an ordered monolayer on the iron oxide surface. [x3 × x3for the (001) cleavage surface of R-Fe2O3.] (iv) The long hydrophobic tail (e.g., 2-oleic acid) tilts to forma tightly packed hydrophobic monolayer. [For R-Fe2O3(001) the tilt angle is about 72° with respect to thesurface normal.] (v) This hydrocarbon tailmust have a sufficient length to cover the surface. [ForR-Fe2O3-(001) the chain lengthmust be 12 or more carbon atoms.] (vi) The hydrophobic tail and the pendent group(e.g., -CH2CH2NH2) must lead to an octanol/water partition coefficient (log P) below a critical value inorder to rapidly form the monolayer. This SAM model should be useful in developing both alternativeenvironmentally benign corrosion inhibitors and higher temperature corrosion inhibitors.
1.0 IntroductionCorrosion in pipes, pumps, turbine blades, coolers,
superheaters, reheaters, fuel cells, and exhaust systemscauses enormous industrial expense due to productiondowntime, accidental injuries, and replacement costs.1Thecost toU.S. industry fromcorrosionexceeds$10billionperyear.1 Indeed, themarket for corrosion inhibitors (CIs)in the U.S. is expected to increase to $7.1 billion per yearby the year 2000.2 Most CI impose a toxic burden on theenvironment, making it critical to find environmentallyneutral but efficient replacements.3The major impediment to designing new inhibitors is
that the mechanism by which these chemical compoundsprevent corrosion is not understood.3 The importance ofdetermining the mechanism is illustrated by the strongdependence of efficiency upon minor changes in thechemical structure of these compounds.3 Experimentalevidence in support of specific mechanisms has beendifficult to obtain due to the following: (i) the lowconcentrations at which these inhibitors are used (a fewppm), (ii) the complexity of the environments surroundingthe inhibitor under real conditions (high temperaturesandpressure and oil and/orwater at high ionic strengths),and (iii) the difficulty in experimentally obtaining atom-istic information about the fluid/metal interface.
Herein we report a variety of atomistic theoreticalstudies on oleic imidazoline (OI) inhibitors and compari-sons of the studies with experimentally observed efficien-cies to develop a new mechanism of corrosion inhibitionfor these systems. This self-assembledmonolayer (SAM)mechanism suggests the following essential features forcorrosion inhibitors: (i) strong bonding of the head groupto Lewis acid sites on the iron oxide surface, (ii) self-assembly of the inhibitors on these surfaces to obtain apattern controlled by the shape of the head group, (iii)self-organization of the tails to form a coherent hydro-phobic film that serves as a barrier formigration ofwater,oxygen, andelectrons to themetal surface, and (iv) optimaloil/water partitioning of the inhibitor molecules so that amonolayer can be formed on the surface with only ppmconcentration in solution.Section 2 describes the characteristics of OI molecules
and some of the experiments. Section 3 describes thetheoretical results on OI/surface interactions of the SAMmodel. Section 4 develops quantitative predictions forcorrosion inhibition based upon the SAM model. Someadditional discussion of the SAM model is in section 5.
2.0 Experimental Observations ConcerningInhibition by OI of Corrosion on Iron
Oleic imidazolines (OIs) are used extensively as inhibi-tors of iron corrosion in acidic media, particularly in oilfield applications. As shown in Figure 1, these OImolecules consist of the following: (i) an imidazolineheadgroup, (ii) a long hydrocarbon tail group, and (iii) a shortpendent group.In this paper we will use the following notation:
where h indicates the hydrophobic tail and p indicatesthe pendent group. Examples are
* To whom correspondence should be addressed. Telefax: 818-585-0918. Phone: 818-395-2731. E-mail: [email protected],copy to [email protected].
† Beckman Institute.‡ Current address: Baker Performance Chemicals, Inc., 3900
Essex Lane, 3rd Floor, Houston, TX 77027.§ Chevron Petroleum Technology Co.X Abstract published in Advance ACS Abstracts, December 1,
1996.(1) Zanneti, R. Chem. Eng. (NY) 1990, 97(10), 5.(2) Hairston, D. W. Chem. Eng. (NY) 1996, 103(3), 65.(3) Edwards, A.; Osborne, C.; Webster, S.; Klenerman, D.; Joseph,
M.; Ostovar, P.; Doyle, M. Corros. Sci. 1994, 36, 315.
OI-h-p
6419Langmuir 1996, 12, 6419-6428
S0743-7463(96)00646-4 CCC: $12.00 © 1996 American Chemical Society

etc., while
The oil field pipeline applications involve brines satu-rated with carbon dioxide, leading to a pH in the rangeof 4-6, depending upon the partial pressure of carbondioxide. At anodic areas iron dissolves by (3).4 This
reaction is rapid in most media.4In deaerated solutions the cathodic reaction is given by
(4). This reactionproceeds rapidly in acids but only slowly
in alkaline or neutral media. The cathodic reaction isaccelerated by dissolved oxygen in accord with thedepolarization reaction (5).4 Depending upon conditions,
variousFe-containingproductsmay formincluding ferroushydroxide [Fe(OH)2] or hydrous ferrous oxide (FeO‚nH2O)whichmay be converted to hydrous ferric oxide or ferroushydroxide.4,5Analysis6 of the adherent corrosion product reveals the
presence of hematite R-Fe2O3, nonstoichiometric magne-tite Fe3O4, and lepidocrocite γ-FeOOH. Figure 2 showsa schematic representation of the aqueous corrosion ofmild steel with Fe2+ dissolving from the bare metal andreacting to form a nonpassivating porous adherent cor-
rosion product that does not interfere with the access ofelectrolyte to the metal surface.5McMahon7 performed partitioning and adsorption ex-
periments onOI-17(8d9)-CCN in an oil/water/iron sys-tem. Edwards et al.3 measured the corrosion resistancefor severalOIderivatives.TheadsorptionofOI-17(8d9)-CCN onto mild steel has been studied using second-harmonic generation.8,9 and sum-frequency generationtechniques.10 Pebere et al.11 havemeasured the corrosioninhibition and critical micellar concentrations (cmc) ofOI-16 and of 2-hexadecylimidazole.The observed percentage corrosion inhibition effi-
ciency3,12 (CIE) for various OIs is listed in Table 1, whichshows variations in CIE from 13% to 99%. The CIE isdefined in terms of weight loss.
3.0 OI-Surface Interactions3.1 Iron Surface. Hydrous ferric oxide, which has an
orange to red-brown color, comprises most of ordinaryrust. It exists as nonmagnetic R-Fe2O3 (hematite) or asmagnetic γ-Fe2O3 (maghemite), with the R form morestable.4 As iron cools from1000 to 250° it oxidizes to forman outmost oxide layer of hematite5 R-Fe2O3. At pH 4-5(and electrode potentials above 0.0-0.2), the stable oxideis4,5 R-Fe2O3 (hematite). In operation the pH in oil/watermixtures in pipelines tends to be 4.5, suggesting R-Fe2O3as the dominant oxide on the Fe surface.We assume that manufacturing and laying a pipeline
made of mild steel leads to a similar hematite nonpas-sivating oxide film on the Fe surface. We assume thatthe function of the OI is to stabilize this layer against
(4) Uhlig, H. H.; Revie, R. W. Corrosion and Corrosion Control, 3rded.; John Wiley and Sons: New York, 1985.
(5) Scully, J. C. The Fundamentals of Corrosion, 3rd ed.; PergamonPress: Oxford, U.K. 1990.
(6) Kallay, N.; Kovacevic, D.; Dedic, I.; Tomasic, V. Corrosion(Houston)1994,50, 598. Herrera,V.;Hernandez,D.Hyperfine Interact.1991, 67, 575. Wolski, W.; Corrosion (Houston) 1990, 46, 743.
(7) McMahon, A. J. Colloids Surf. A 1991, 59, 187.(8) Joseph,M.; Hodge, J.; Klenerman, D.FaradayDiscuss. 1992, 94,
273.(9) Joseph,M.; Klenerman, D. J.Electroanal.Chem. 1992, 340, 301.(10) Maechling,C.R.;Kliner,D.A.V.;Klenerman,D.Appl.Spectrosc.
1992, 47, 167.(11) Pebre, N.; Duprat, M.; Dabosi, F.; Lattes, A.; De Savignac, A.
J. Appl. Electrochem. 1988, 18, 225.(12) Chen, H. L., unpublished data.
Figure 1. Typical OI molecule. The case shown is OI-17-(8d9)-CCN with the 1-aminoethyl pendent group and the2-oleyl hydrophobic tail.
h ) 15 implies -(CH2)14CH3 (1)
h ) 17(8d9) implies -(CH2)7CHdCH(CH2)7CH3
h ) 17(8:OH) implies -(CH2)7CH(OH)(CH2)8CH3
p ) CCN implies -CH2CH2NH2 (2)
p ) CCO implies -CH2CH2OH
p ) C implies -CH3
p ) H implies -H
Fe h Fe2+ + 2e- (3)
2H+ + 2e- h H2 (4)
O2 + 4H+ + 4e- h 2H2O (5)
Figure 2. Sketch of corroding Fe surface.
6420 Langmuir, Vol. 12, No. 26, 1996 Ramachandran et al.

further oxidation. Consequentlywe studiedhowOIbindsto the surface of Fe2O3. Our hypothesis that the OIinteracts with R-Fe2O3 is supported by the work ofMcMahon7whomeasured theadsorption ofOI-17(8d9)-CCN onto both iron and iron oxide powders and foundsimilar adsorption isotherms and surface coverage.To study the OI/Fe2O3 interactions, we developed the
MS force field (FF)13 to describe the bulk and surfacestructure of Fe2O3 and to describe the binding ofOI to thissurface. The MS FF suggests that the (001) surface ofR-Fe2O3 is themost stable. Indeed, experiments14 indicatethat the (001) surface is most stable with little surfacerelaxation from the bulk structure.The surface Fe of Fe2O3 will be missing one to three of
its normal six lattice oxygen ligands. In aqueous media,
we expect the missing sites to be replaced by OH- or H2Ofrom the solvent. The ratio of OH- to H2O on the surfacewill be determined by the pH, by the surface plane ofFe2O3, and by the relative energetics. We find13 that theOI bonds strongly as a Lewis base to Fe3+, andwe assumethat on the surface of Fe2O3 it displaces one to two surfaceH2Os.3.2 OIHeadGroup. Two factors dictate the coverage
of OI on the surface: (i) strong adsorption to the surfaceand (ii) the intrinsic steric bulk (the footprint) of the headgroup. The quantum mechanical calculations13 indicatethatOIbonds to the iron ofR-Fe2O3 substantially strongerthan does water. Thus OI should easily displace boundwater molecules from the hematite surface. This agreeswith the experimental observation (vide infra) that OImolecules absorb rapidly.After bonding an OI to one Fe site of the (001) surface,
we find that unfavorable steric interactions preclude
(13) Ramachandran, S.; Tsai, B.-L.; Blanco, M.; Chen, H.; Tang, Y.;Goddard, W. A., III. J. Phys. Chem., in press.
(14) Eggleston, C. M.; Hochella, M. F. Am. Mineral 1992, 77, 911.
Figure 3. Surface structure of OI-2-CCO on hematite (R-Fe2O3). The -C2H5 hydrophobic tail is used to avoid obscuring thehead group. A CPK model of the OI is used except for the molecule at the (11) site which is shown with cylinders. The surfaceFe atoms are shown in black. Binding the OI to one Fe blocks binding of an OI to the six nearest neighbor Fe atoms (at 5.038Å). The result is the x3 × x3 unit cell with sides of 8.736 Å. The -CH2CH2OH pendent group is not large enough to bind withan adjacent Fe. The various cells are numbered (n, m) where n, m ) 0, 1, 2, ....
Table 1. Corrosion Inhibition of OI Molecules
label pendent group hydrophobic tail exptl corrsn inhibition (%)
2-CCO -(CH2)2OH CH3(CH)2- 13a7-CCN -(CH2)2NH2 CH3(CH2)6- 17b8-CCN -(CH2)NH2 CH3(CH2)7- 45b9-CCN -(CH2)NH2 CH3(CH2)8- 52b10-CCN -(CH2)NH)2 CH3(CH2)9- 33b10(9d10)-CCN -(CH2)2NH2 CH2dCH(CH2)8- 23b11-CCN -(CH2)2NH2 CH3(CH2)10 77b12-CCN -(CH2)2NH2 CH3(CH2)11 95b13-CCN -(CH2)2NH2 CH3(CH2)12- 87b14-CCN -(CH2)2NH2 CH3(CH2)13- 82b15-CCN -(CH2)2NH2 CH3(CH2)14- 99b16-CCN -(CH2)2NH2 CH3(CH2)15- 98b17-CCN -(CH2)2NH2 CH3(CH2)16- 86b17(8d9)-CCN -(CH2)2NH2 CH3(CH2)7CHCH(CH2)7- 86-92,b 92a17(8d9)-C -CH3 CH3(CH2)7CHdCH(CH2)7- 90a17(8d9)-CCO -(CH2)2OH CH3(CH2)7CHdCH(CH2)7- 90a17(8d9)-CCCN -(CH2)3NH2 CH3(CH2)7CHdCH(CH2)7- 90a17(8t9)-CCN -(CH2)2NH2 CH3(CH2)7CtC(CH2)7- 97b17[11:CH(OH)-CCN -(CH2)2NH2 CH3(CH2)5[CH(OH)](CH2)10- 93b17(8d9,11d12)-CCN -(CH2)2NH2 CH3(CH2)4CHdCHCH2CHdCH(CH2)7- 85b19-CCN -(CH2)2NH2 CH3(CH2)18- 85b21-CCN -(CH2)2NH2 CH3(CH2)20- 19.5b21(11d12)-CCN -(CH2)2NH2 CH3(CH2)8CHdCH(CH2)10- 63b
a Reference 3. b Reference 12.
Corrosion Inhibition of Iron by Imidazolines Langmuir, Vol. 12, No. 26, 1996 6421

binding a secondOI to thenearest neighbor sites (at 5.038Å). However, the footprint (steric bulk) for OI on thehematite surface is quite compatible with the second-
nearest neighbor spacing of 8.726 Å. Thus the highestcoverage is obtained by binding OI to next-nearestneighbor iron sites (at 8.726 Å) on the (001) surface of
Figure 4. Optimum structure for OI-21-CCN on Fe2O3. (a) Side view: the tilt angle (defined using C4 and C20) is ψ ) 71.63°.(b) Packing of the alkyl chains as seen from an angle parallel to the alkyl chains (71.6° from the surface normal). Focusing onthe chain of cell (11), we see the closest packing with two γ neighbors [(00) and (22)] and four â neighbors [(10), (01), (21), and (12)].
6422 Langmuir, Vol. 12, No. 26, 1996 Ramachandran et al.

hematite. This leads to thex3×x3 unit cell of adsorbedOI shown in Figure 3 [for OI-2-CCO]. Thus a fullmonolayer of OI covers σ ) 1/3 of the surface Fe sites orone OI per 65.94 Å2 of surface.McMahon7 carried out 14C tracer studies to determine
the adsorption of OI-17(8d9)-CCN onto iron and ironoxide powders. He found strong adsorption to both ironandthe ironoxidesurfaces, leading tosaturationcoveragesof 65 Å2 permolecule for both surfaces. This is consistentwith the predicted coverage of 65.94 Å2.In theSAMmodelweassume that theOI self-assembles
(on the Fe2O3 surface) to form amonolayer whose spacingis dictated by the size and shape of the imidazoline headgroup. Othermoleculeswould lead toSAMswithdifferentspacings depending upon their footprint and the natureof binding to iron oxide. Thus for carboxylate acids(RCOOH)andalkylamines (RNH2)we find thatamoleculecan bind to every surface iron site, leading to σ ) 1. Thisis expected to lead to a SAM with 21.98 Å2 per molecule.Indeed, for stearic acid C17H35COOH) Xing et al.15 founda limiting surface area of 21 Å2 per molecule (frommeasuring the isotherm of surface pressure vs areaoccupiedpermonolayer). Thisagreeswith theexpectationof full coverage of the surface, σ ) 1. For adsorption ofthe amines (n-C3H7)NH2 and (n-C4H9)NH2 from the vaporstate to freshlyoxidized iron,Yao16 foundsurface coveragesof 25-28 Å2 per molecule. This indicates that primaryamines cover about 80% of the iron sites on iron oxide.These results indicate that the SAM model may be
appropriate for general classes of corrosion inhibitors.3.3 Hydrophobic Tail. 3.3.1 Tilt Angle. We con-
cludedabove that on theR-Fe2O3 surface ofOIheadgroupsare spaced at 8.726 Å, corresponding to second-nearestneighbor Fe atoms. For maximum coverage of themonolayers, the tails should interact with each other. Ina polyethylene crystal, each chain is all-trans with fourneighboring chains at 4.4 Å and two at 4.8 Å, leading toan average of 4.53 Å. To achieve strong cohesion, thetails must all be tilted with respect to the surface normalby some tilt angle ψ. If these tails are tilted toward thelong axis of the unit cell as in Figure 4a, the tail of cell00 will contact the tail of cell 11 when the tilt angle is
where d ) 4.53 Å.17 The same tilt angle will also lead tocontact between tail 00 and tails 01 and 10 (a separationof d ) 4.53 Å). Equation 6 suggests a tilt angle of 72.6°with respect to the surface normal. Indeed using theMSFF we find an optimum structure for OI-21 (see Figure4a) with ψ ) 71.6° (measured with respect to the lineconnecting C4 and C20 of the tail). Viewing this optimumstructure along a line parallel to the tail (Figure 4b), wesee that the alkane tails are closest packed.Figure 5 shows a top view for the optimum structure
of OI-n-CCN with n ) 7, 11, and 12 carbons. With n )12 ormore carbons the surface is completely covered. Thefraction of the surface covered forn< 12 is approximatelylinearwithn. Thuswedefine the fractional area coveragefunction
3.3.2 Cohesive Energy. Each tail has six neighbors.Thus startingwith chain11 there are tail/tail interactionswith chains 12, 21, 10, and 01 for n g 6 and tail/tailinteractions with chain 00 and 22 for chains ng 12. Thusfor n g 12 we expect the cohesive energy within thehydrophobic film to be
whereECH2 ) 1.87 kcal/mol is the cohesive energy of PE.18For OI-n-CCN we find that the cohesive energy withinthe hydrophobic film (see Figure 6) has the form
where R ) 3.7843, â ) 0.4565, and γ ) 0.6196. Thisbilinear behavior is expected from Figure 4b. For n g 12each chain has six neighbors, leading to a cohesive energyincrement of γ + 2â for each additional carbon. Here γis for the two neighbors in the direction of the tilt, whileâ is for the other four tail/tail interactions (we divide bytwo to avoid double counting). Note that 2â + γ ) 1.53kcal/mol is close to the value of ECH2 ) 1.87 for PE.18 Forn e 5 the tails are too short to interact. For theintermediate lengths only the â neighbors interact.3.3.3 Entropy. In the SAMmodel each alkyl chain in
themonolayer is in the extended (all-trans) conformation,whereas it has a large number of favorable conformationsin solution. Thus forming the film leads to a substantialdecrease in entropy. Using rotational isomeric state (RIS)theory,19 we estimate this entropy loss to be
where Z is given by (11a). In (11a), â1 and â2 are the roots
of (11b). The quantitites σ1 ) 0.43 and ω ) 0.049 were
used for the calculation.19 These values from Abe,Jernigan, and Flory20 reproduced the experimentallyobtained energy difference of 2.1 kJ/mol between trans,-gauche, and trans,trans states of n-pentane and 7.5 kJ/mol between (+)gauche, (-)gauche states and trans/transstates ofn-pentane, respectively. This leads to the resultsfor ∆SRIS/R in Table 2.Changes in the distribution of vibrational frequencies
may also contribute to ∆S; however, we will ignore thiscontribution.3.3.4 Observed Corrosion Inhibition. Figure 7
shows theexperimental corrosion inhibitiondata12 forOI-n-CCN with n ) 7-21. These experiments12 wereperformed under conditions similar to (296 K) those of
(15) Xing, W.; Shan, Y.; Guo, D.; Lu, T.; Xi, S. Corrosion (Houston)1995, 51, 45.
(16) Yao, Y. Y. J. Phys. Chem. 1963, 67, 2055.(17) Gerdy, J. J.; Goddard, W. A., III. J. Am. Chem. Soc. 1996, 118,
3233.
(18) Karasawa,N.; Dasgupta, S.; Goddard,W.A., III.J.Phys.Chem.1991, 95, 2260.
(19) Mattice, W. L.; Suter, U. W. Conformation Theory of LargeMolecules; John Wiley: New York, 1994.
(20) Abe, A.; Jernigan, R. L.; Flory, P. L. J. Am. Chem. Soc. 1965,87, 631.
f ) 1 for n g 12 (7b)
Ecoh ) [2(n - 6) + (n - 12)](13ECH2) (8)
Ecoh ) R for n e 5 (9a)
Ecoh ) R + 2â(n - 5) for 5 < n e 11 (9b)
Ecoh ) R + 2â(n - 5) + γ(n - 11) for n > 11 (9c)
∆SRIS ) -R ln Z (10)
Z )(1 - â2)â1
n-1 + (â1 - 1)â2n-1
â1 - â2(11a)
â1, â2 ) 1 + σ1(1 + ω)x[1 - σ1(1 + ω)]2 +8σ12
(11b)
cos ψ ) d
8.726x3(6)
f ) n/12 for n e 12 (7a)
Corrosion Inhibition of Iron by Imidazolines Langmuir, Vol. 12, No. 26, 1996 6423
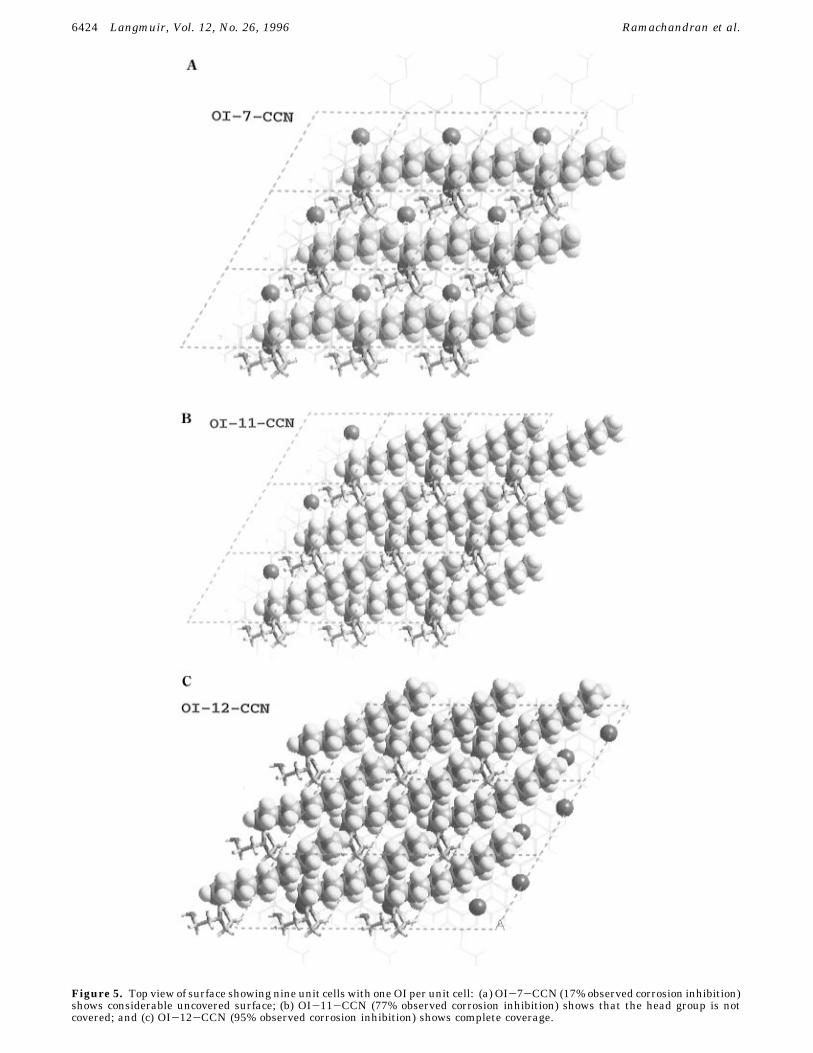
Figure 5. Top view of surface showing nine unit cells with oneOI per unit cell: (a) OI-7-CCN (17% observed corrosion inhibition)shows considerable uncovered surface; (b) OI-11-CCN (77% observed corrosion inhibition) shows that the head group is notcovered; and (c) OI-12-CCN (95% observed corrosion inhibition) shows complete coverage.
6424 Langmuir, Vol. 12, No. 26, 1996 Ramachandran et al.
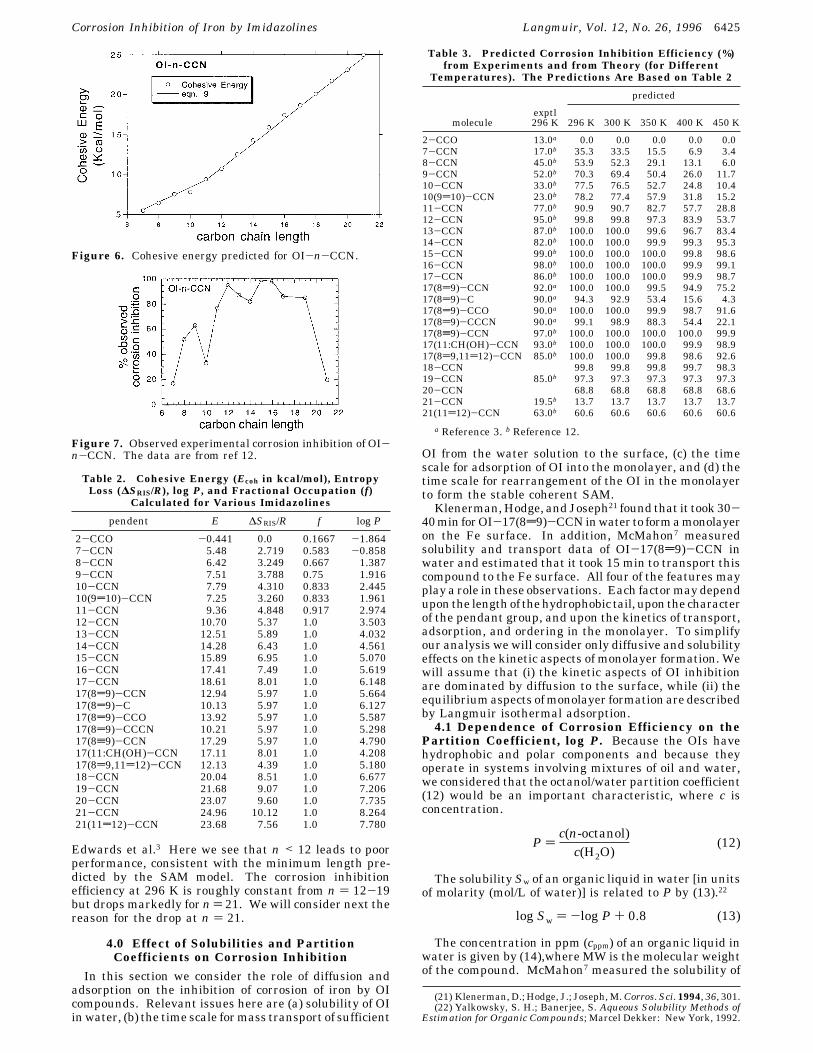
Edwards et al.3 Here we see that n < 12 leads to poorperformance, consistent with the minimum length pre-dicted by the SAM model. The corrosion inhibitionefficiency at 296 K is roughly constant from n ) 12-19but drops markedly for n) 21. We will consider next thereason for the drop at n ) 21.
4.0 Effect of Solubilities and PartitionCoefficients on Corrosion Inhibition
In this section we consider the role of diffusion andadsorption on the inhibition of corrosion of iron by OIcompounds. Relevant issues here are (a) solubility of OIinwater, (b) the time scale formass transport of sufficient
OI from the water solution to the surface, (c) the timescale for adsorption of OI into the monolayer, and (d) thetime scale for rearrangement of the OI in the monolayerto form the stable coherent SAM.Klenerman,Hodge, andJoseph21 found that it took 30-
40min forOI-17(8d9)-CCNinwater to formamonolayeron the Fe surface. In addition, McMahon7 measuredsolubility and transport data of OI-17(8d9)-CCN inwater and estimated that it took 15 min to transport thiscompound to the Fe surface. All four of the features mayplay a role in these observations. Each factormaydependupon the lengthof thehydrophobic tail, upon the characterof the pendant group, and upon the kinetics of transport,adsorption, and ordering in the monolayer. To simplifyour analysis wewill consider only diffusive and solubilityeffects on the kinetic aspects of monolayer formation. Wewill assume that (i) the kinetic aspects of OI inhibitionare dominated by diffusion to the surface, while (ii) theequilibriumaspects ofmonolayer formationare describedby Langmuir isothermal adsorption.4.1 Dependence of Corrosion Efficiency on the
Partition Coefficient, log P. Because the OIs havehydrophobic and polar components and because theyoperate in systems involving mixtures of oil and water,we considered that the octanol/water partition coefficient(12) would be an important characteristic, where c isconcentration.
The solubility Sw of an organic liquid in water [in unitsof molarity (mol/L of water)] is related to P by (13).22
The concentration in ppm (cppm) of an organic liquid inwater is given by (14),where MW is the molecular weightof the compound. McMahon7 measured the solubility of
(21) Klenerman, D.; Hodge, J.; Joseph,M.Corros.Sci. 1994, 36, 301.(22) Yalkowsky, S. H.; Banerjee, S. Aqueous Solubility Methods of
Estimation for Organic Compounds; Marcel Dekker: New York, 1992.
Figure 6. Cohesive energy predicted for OI-n-CCN.
Figure 7. Observed experimental corrosion inhibition of OI-n-CCN. The data are from ref 12.
Table 2. Cohesive Energy (Ecoh in kcal/mol), EntropyLoss (∆SRIS/R), log P, and Fractional Occupation (f)
Calculated for Various Imidazolines
pendent E ∆SRIS/R f log P
2-CCO -0.441 0.0 0.1667 -1.8647-CCN 5.48 2.719 0.583 -0.8588-CCN 6.42 3.249 0.667 1.3879-CCN 7.51 3.788 0.75 1.91610-CCN 7.79 4.310 0.833 2.44510(9d10)-CCN 7.25 3.260 0.833 1.96111-CCN 9.36 4.848 0.917 2.97412-CCN 10.70 5.37 1.0 3.50313-CCN 12.51 5.89 1.0 4.03214-CCN 14.28 6.43 1.0 4.56115-CCN 15.89 6.95 1.0 5.07016-CCN 17.41 7.49 1.0 5.61917-CCN 18.61 8.01 1.0 6.14817(8d9)-CCN 12.94 5.97 1.0 5.66417(8d9)-C 10.13 5.97 1.0 6.12717(8d9)-CCO 13.92 5.97 1.0 5.58717(8d9)-CCCN 10.21 5.97 1.0 5.29817(8t9)-CCN 17.29 5.97 1.0 4.79017(11:CH(OH)-CCN 17.11 8.01 1.0 4.20817(8d9,11d12)-CCN 12.13 4.39 1.0 5.18018-CCN 20.04 8.51 1.0 6.67719-CCN 21.68 9.07 1.0 7.20620-CCN 23.07 9.60 1.0 7.73521-CCN 24.96 10.12 1.0 8.26421(11d12)-CCN 23.68 7.56 1.0 7.780
Table 3. Predicted Corrosion Inhibition Efficiency (%)from Experiments and from Theory (for Different
Temperatures). The Predictions Are Based on Table 2
predicted
moleculeexptl296 K 296 K 300 K 350 K 400 K 450 K
2-CCO 13.0a 0.0 0.0 0.0 0.0 0.07-CCN 17.0b 35.3 33.5 15.5 6.9 3.48-CCN 45.0b 53.9 52.3 29.1 13.1 6.09-CCN 52.0b 70.3 69.4 50.4 26.0 11.710-CCN 33.0b 77.5 76.5 52.7 24.8 10.410(9d10)-CCN 23.0b 78.2 77.4 57.9 31.8 15.211-CCN 77.0b 90.9 90.7 82.7 57.7 28.812-CCN 95.0b 99.8 99.8 97.3 83.9 53.713-CCN 87.0b 100.0 100.0 99.6 96.7 83.414-CCN 82.0b 100.0 100.0 99.9 99.3 95.315-CCN 99.0b 100.0 100.0 100.0 99.8 98.616-CCN 98.0b 100.0 100.0 100.0 99.9 99.117-CCN 86.0b 100.0 100.0 100.0 99.9 98.717(8d9)-CCN 92.0a 100.0 100.0 99.5 94.9 75.217(8d9)-C 90.0a 94.3 92.9 53.4 15.6 4.317(8d9)-CCO 90.0a 100.0 100.0 99.9 98.7 91.617(8d9)-CCCN 90.0a 99.1 98.9 88.3 54.4 22.117(8t9)-CCN 97.0b 100.0 100.0 100.0 100.0 99.917(11:CH(OH)-CCN 93.0b 100.0 100.0 100.0 99.9 98.917(8d9,11d12)-CCN 85.0b 100.0 100.0 99.8 98.6 92.618-CCN 99.8 99.8 99.8 99.7 98.319-CCN 85.0b 97.3 97.3 97.3 97.3 97.320-CCN 68.8 68.8 68.8 68.8 68.621-CCN 19.5b 13.7 13.7 13.7 13.7 13.721(11d12)-CCN 63.0b 60.6 60.6 60.6 60.6 60.6
a Reference 3. b Reference 12.
P )c(n-octanol)c(H2O)
(12)
log Sw ) -log P + 0.8 (13)
Corrosion Inhibition of Iron by Imidazolines Langmuir, Vol. 12, No. 26, 1996 6425

OI-17(8d9)-CCN as 4.8 ppm at 21 °C, which from (14b)suggests that log P ) 5.664.Since there is littledataon logP for otherOI compounds,
we need a method to estimate log P. A widely usedprocedure is C log P.23 However it is well-known that Clog P over estimates the partition coefficient of stronglyhydrophobic compounds.22 Thus for OI-17(8d9)-CCN,C logP) 7.947which is 2.283 too high. Since our interestis in strongly hydrophobic compounds, we will assume
Using (14c) we evaluated log P for the various molecules(see Table 2). The results are plotted vs the observedcorrosion efficiencies in Figure 8. Clearly there is acorrelation, with an optimum corrosion inhibition ef-ficiency at log P ≈ 5.In refs 3 and 12 the corrosion inhibition rates were
determined in experiments using 10 ppm of OI in water.However, as shown by McMahon,7 the solubility of thesecompoundsmaybe less than10ppm. Using (14b), Figure9 shows the concentration of the inhibitor in water as afunction of logP (assuming that 10ppmwasadded).Whenthe amount of inhibitor exceeds its solubility in water,the extra inhibitor forms a separate phase in the system(a miscelle phase for the case of OI compounds). Sincetheamount of inhibitor is small compared to that ofwater,weassume that formationof anOImonolayer on themetalsurface occurs from the water phase. The concentrationc in units of mol cm-3 is the appropriate measure fortransport of inhibitor to the surface and adsorptionequilibrium. This concentration is related to the cppm by(15)
4.2LangmuirAdsorptionof Inhibitor. The fractionof surface sites occupied by an inhibitor molecule can bewritten as
where K is the Langmuir equilibrium constant and c isthe concentration. McMahon7 found results well fittedby (16) for the adsorption of OI-17(8d9)-CCN on ironpowder from solutions of OI in maltene and xylene. Inaddition, the saturation of corrosion inhibition withincreasing concentration has been observed3,8,21 to besimilar to the saturation observed from solutions of OI inmaltene and xylene.For various OI we predicted the K in (17) using Ecoh
calculated from the MS FF,
We find that r ) 42719 cm3/mol leads to a best fit withexperiment.3,8,12,214.3 Diffusive Formation of Monolayer. The trans-
port rate of matter from a uniform semiinfinite mediumwith initial concentration c to a surface is given by24 (18)
where q is the mass flux to the surface, D is the diffusioncoefficient, c is the concentration, and t is the time. Herewe assume that the surface immediately absorbs theinhibitor.The total amount of inhibitor Q(T) transported to the
surface from time 0 to T is given by
Thus the time Tm to deliver an amount of inhibitor Qm,sufficient for full monolayer coverage (1 molecule/66 Å2),is given by (19b)
We write this as
where τ ) 9.101× 10⁻¹⁹ h‚cm6/mol2 leads to a best fit withexperiment.Because of the equilibrium (16), the surface has less
than complete coverage, leading to a shorter time,Tcov, toform the equilibrium monolayer.
(23) Leo, A. J. Chem. Rev. 1993, 93, 1281.(24) Bird,R.; Stewart,W.W.; Lightfoot, E.N.Transport Phenomena;
John Wiley and Sons: New York, 1960.
(25) Jasinski, R. J. In Surfaces, Inhibition and Passivation; McCaf-ferty, E., Brodd, R. J., Eds.; Electrochemical Society: Pennington, NJ,1986; (Corrosion of Low-Alloy Steel in Cruce Oil/Brine/CO2 Mixtures)p 139.
cppm ) Sw ×MW × 103 (14a)
log(cppm) ) -log P + 3.8 + log(MW) (14b)
log P ) C log P - 2.283 (14c)
c )cppm × 10-6
MW(15)
θeq ) Kc1 + Kc
(16)
K ) r exp(-∆SRIS
R ) exp(Ecoh
RT ) (17)
Figure 8. Comparison of observed corrosion inhibition withcomputed log P values for a number of OI. The data are fromrefs 3 and 12.
Figure 9. Predicted concentration of OI in the water phaseupon adding 10 ppm of inhibitor. Equations 14b and 14c wereused.
q )xDc(xπt)
(18)
Q(T) ) cxDTπ
(19a)
Tm )Qm2 π
Dc2(19b)
Tm(h) ) τc2
(19c)
6426 Langmuir, Vol. 12, No. 26, 1996 Ramachandran et al.

Neglecting desorption, the site coverage of the surface fort<Tcov is givenby (21),whereθ is the fractional occupation
on the surface binding sites (θ ) 1 for a monolayer withσ ) 1/3). Experiments8,21 have clearly documented suchtransientbehaviorduringcorrosionexperiments involvingOI-17(8d9)-CCN,OI-17(8d9)-CCO,andOI-2-CCO.The experiments3,12measuring the corrosion inhibition
of the imidazoline compounds have been carried out inwater. The solubility is extremely low in water but verylittle material is required on the surface. Thus for OI-17(8d9)-CCN just7 0.08 µg/cm2 covers the (001) plane ofR-Fe2O3 (at a Fe site coverage of σ ) 1/3).4.4 Role of log P on the Rate of Forming a
Monolayer. Equation 14b implies that log(P/MW)> 2.8leads to c< 10 ppm, even though 10 ppmwas put into thesolution. Since a typical OI hasMW≈ 316, this suggeststhat logP>5.3 leads to reduced concentration. Assumingthat all OI have the same diffusion constant, then (15)and (19c) lead to (22), where Tm is transport time in h.
Thus for c ) 10 ppm of OI-15-CCN (log P ) 5.07, MW) 323.56; log(P/MW) ) 2.56), we expect
Tcov ) 0.000 95 h ) 3.4 s
Equation 22 indicates that the transportation time forthe inhibitor to form a monolayer changes dramaticallywith log P. This predicted timeTm is presented in Figure10 for OI-n-CCN as a function of n. Thus the time totransport the OI to the surface is expected to increasefrom 2.7 min for OI-17-CCN (log P ) 6.1) to 5.9 h forOI-19-CCN (log P ) 7.2) to 771.1 h (32 days) for OI-21-CCN (log P ) 8.3).Typically corrosion inhibition is measured by weight
loss in experiments with durations of Texp ) 24-72 h.12,24Equation 22a implies that inhibitors with log P> 7.7 willstill be adsorbing on the surface after 72 h. As discussedbelow, this explains the dramatic drop in CIE above N )19 (Figure 7).4.5 Quantitative Predictions of the SAM Model.
In the SAMmodel, irreversible inhibitor transport occursfrom water to the pore adjacent to the iron oxide surface.This transport occursuntil thewaterphaseholdssufficientinhibitor to be in equilibrium with the surface (inaccordancewithLangmuiradsorption inanoil richphase).Equation 21 describes the surface coverage with time inthe transient stage. Equations 16 and 17 describe thesurface coverage at equilibrium. Equation 18 describesthe diffusion time for forming a monolayer. We willintegrate these equations to obtain the CIE, includingthe corrosion occurring while the system attains equi-librium.We write the total corrosion without inhibitor as
where Texp is the total time for the experiment. Takinginto account the fractional area (7) and assuming Texp >Tcov, the total corrosion with inhibitor becomes
where we used (21). Using (23) and (24), this leads to
Thus, the percentage CIE is given by
For Texp < Tcov we obtain
and hence
or
Figure 10. Predicted values of Tm, the time to transport amonolayer of OI to the surface. The dependence on log P andalkyl chain length is shown.
Figure 11. Corrosion inhibition for OI-n-CCN. Experimen-tal values11 are circles; predicted values are lines.
Cinh
k) ∫0Tcov[1 - θ(t)f] dt + ∫TcovTexp(1 - θeqf) dt
) Tcov - 23fTcov3/2
xTm
+ (Texp - Tcov)[1 - θeqf] (24)
Cinh
Cnoinhv) 1 - θeqf + 1
3θeq
3 fTm
Texp(25)
CIE ) 100(1 -Cinh
Cninh) (26a)
) 100θeqf(1 - 13
θeq2 Tm
Texp) (26b)
Cinh
k) Texp - 2
3fTexp3/2
xTm
(26c)
Cinh
Cnoinh) 1 - 2
3fxTexp
Tm(26d)
Tcov ) θeq2 Tm (20)
θ(t) )xtxTm
for t < Tcov (21)
log(Tm) ) 2 log P - 13.641 for log PMW
> 2.8 (22a)
log(Tm) ) 2 log (MW) - 8.041 for log PMW
e 2.8(22b)
Cnoinh ) kTexp (23)
Corrosion Inhibition of Iron by Imidazolines Langmuir, Vol. 12, No. 26, 1996 6427

Equations 26b and 26e define the CIE in terms of θeq,f, and Tm (including the corrosion occurring while thesystem attains equilibrium). Thus the CIE can becalculated directly from the SAM model using (7), (16),(17), (22), and (26). We see that for systems with largelog P, the experimental time Texp can play a dominantrole. We have assumed that Texp ) 72 h in comparingvarious experiments, but Texp is not always well docu-mented which may account for some disagreement be-tween theory and experiment.3,12For OI-n-CCNFigure 11 compares the predicted and
experimental CIE at 296 K. The overall agreement isexcellent. The theory explains that the decrease in CIEfor n < 12 is due to f < 1 and hence indicates incompletecoverage of the surface. The decrease for n > 19 is dueto slow transport to the surface (high logP). This suggeststhat more effective corrosion inhibitors for n > 19 couldbe designed by modifying the tails or pendant groups tobe more soluble in water (e.g., by replacing CH2 with anether O).Thepredicted temperature dependence of the corrosion
inhibition is shown in Figure 12 for OI-n-CCN. Thissuggests that longer tails will have better high-temper-ature performance if the log P is kept sufficiently low(below 7). We do not know of experimental data on thetemperature dependence of corrosion inhibition for thosesystems.The predictions of the SAM model is compared with
available experimental results inFigure13. In this figurewe used the predicted log P to disperse the results alongthe abscissica. We see that the SAM model agreesreasonably well with the maximum CIE.
5.0 DiscussionAtomistic modeling suggests the SAM model for cor-
rosion inhibition by OI. The key elements of this modelare (i) strong bonding by the imidazoline head group tothe Fe site of Fe2O3 surface; (ii) self-assembly of the headgroups to form a dense ordered overlayer; (iii) self-assembly of the hydrophobic tails to form a dense tightly-packedhydrophobic layer that blocks oxidationby servingas a barrier to diffusion of H2O, oxygen, and electrons;and (iv) sufficient solubility and rate of transport of theinhibitor to the surface, implying that the SAM can beformed in a time fast compared to corrosion. Using theSAM model, all quantities affecting CIE (Ecoh, ∆S, log P,and f) can be evaluated purely from theory. This allowsquantitative predictions to be made prior to experimentfor how changes in the OI should affect the CIE. Inaddition, various specific predictions from theSAMmodel(e.g., the time for monolayer formation and the changesin solubilitywith logP) canbe tested experimentally. Thisshould lead to refinements and improvements in theSAMmodel. Thus the SAM model should be useful both fordesigning new experimental tests and for suggesting newclasses of CI.TheSAMmodel is consistentwith current experiments
but is by no means proved. Thus we have discussed here
only the most stable surface of Fe2O3. Clearly there willbe other surfaces present and defects (steps, kinks, anddefects) that might prefer differently-shaped inhibitors.The best CI formulation may include a blend of speciessuitable for such defect sites. In addition, other species(e.g., scale inhibitors)may be present thatwould competewith the OI for surface sites but which may not blockcorrosion. Furthermore, there are many other issuesabout what happens under flow conditions, where tur-bulence or cavitation may damage the protective layer.All these issuesdemand further study. However, theSAMmodelprovidesguidance that shouldbeuseful indesigningfuture theoretical and experimental studies.
Acknowledgment. The research was funded byChevronPetroleumTechnologyCo. (R.Heming), byDOE-BCTR (D. Boron), and by NSF-GCAG (Grant ASC 92-17368, R. Hildebrand). The facilities of theMSC are alsosupported by grants from NSF-CHE (Grant 95-22179),Aramco, Asahi Chemical, Chevron Chemical Co., AsahiGlass, Owens-Corning, Hercules, BP Chemical, ChevronResearch and Technology Co., Avery-Dennison, andBeckman Institute. Calculations for this project werecarried out on the Illinois NSFSupercomputer Center (L.Smarr) and on the JPL Cray (P. Messina).
LA960646Y
Figure 12. Predicted corrosion inhibition for OI-n-CCN asa function of temperature.
Figure 13. Observed and predicted corrosion inhibition of OI.
CIE ) 100{23fxTexp
Tm} (26e)
6428 Langmuir, Vol. 12, No. 26, 1996 Ramachandran et al.