Selected Vital Statistics and Health Status Indicators - Gov.bc.ca
154
Selected Vital Statistics and Health Status Indicators 2014 ANNUAL REPORT
-
Upload
khangminh22 -
Category
Documents
-
view
0 -
download
0
Transcript of Selected Vital Statistics and Health Status Indicators - Gov.bc.ca
Selected Vital Statistics andHealth Status Indicators20
14
ANNUAL REPORT
This annual report and others published by the BC Vital Statistics Agency can be viewed on our website at www.gov.bc.ca/vitalstatistics.
Selected Vital Statistics andHealth Status IndicatorsOne Hundred and Forty-ThirdAnnual Report 2014British Columbia Vital Statistics Agency

Foreword
The British Columbia Vital Statistics Agency is pleased to present the 2014 Annual Report, the one hundred and forty-third published since the establishment of the Division of Vital Statistics in 1872. The data in this publication are based on information collected from registrations of live births, stillbirths, deaths, and marriages, as registered by the Agency for events occurring in the 2014 calendar year. This publication contains selected information about the vital events taking place in British Columbia. Although some information related to vital events occurring within the province includes visitors, such as marriages, the majority are specific to residents of British Columbia.
The information relating only to residents is important for evaluating and monitoring the health status of the province’s population.
The report presents key indicators for the province’s health authorities (HA), health service delivery areas (HSDA) and local health areas (LHA). It includes a detailed glossary, defining the terms used in the body of the publication, as well as a methodology section explaining the statistical computations in the main body. A set of information boxes supplement the standard tables with information ranging from a profile of a Typical Day in British Columbia to Place of Birth for Midwife Assisted Births.
The 2014 Annual Report continues to follow the example of previous annual reports for easier comparison with those reports. However, efficiencies and enhancements have been introduced. The number of tables has been reduced. Causes of death more closely follow Statistics Canada, i.e. the standards of the National Center for Health Statistics. This facilitates comparison of reports across Canada. Tables have been updated for readability and in response to requests for data. Calculations requiring a standard population now use the 2011 Canadian Census population.
The Agency would like to acknowledge the many groups and individuals who ensure complete and accurate recording and reporting of vital events. Their contributions have resulted in continual improvement in the quality of vital event data and the quality of this report.
Original signed by,
Jack Shewchuk Registrar General British Columbia Vital Statistics Agency
Table of Contents
vi
i
General InformatIon
Introduction .................................................................................................................................................................... 3
Registrations .................................................................................................................................................................... 3
Vital Event Data .................................................................................................................................................................... 3
trenDS In VItal eVentSTrends in Vital Events Introduction ..................................................................................................................................... 9
Table 1 Live Births, Deaths, Marriages and Stillbirths, British Columbia, 1950 – 2014 ....................................... 10
Table 2 Live Births, Deaths, Marriages and Stillbirths by Month, British Columbia, 2014 ................................ 11
Information Box - On a Typical Day in British Columbia in 2014 ............................................................ 12
BIrtH-relateD StatIStICSBirth-Related Statistics Introduction ................................................................................................................................... 15
Table 3 Births by Age of Mother and Live Births by Birth Order, British Columbia, 2014 ................................. 16
Table 4 Live Births by Age of Mother and Kind of Birth, British Columbia, 2014 ............................................... 17
Table 5 Live Births by Mode of Delivery and Age of Mother, British Columbia, 2014 ....................................... 17
Place of Birth for Midwife-Assisted Births ................................................................................................. 18
Table 6 Live Births by Local Health Area and Mode of Delivery, British Columbia, 2014 .................................. 19
Table 7 Live Births by Birth Weight, Sex, and Gestational Age, British Columbia, 2014 .................................... 21
Table 8 Live Births by Birth Weight of Child and Age of Mother, British Columbia, 2014 ................................. 22
Table 9 Live Births by Birth Weight in Groups and Age of Mother ....................................................................... 23
Table 10 Low Birth Weight Live Births by Age of Mother and Sex of Child, British Columbia, 2014 .......................... 23 Table 11 Low Birth Weight Live Births by Local Health Area and Gestational Age, British Columbia, 2009 – 2013 and 2014 ................................................................................................... 24Table 12 Maternal Complications of Pregnancy and Delivery in Live Births by Age of Mother, British Columbia, 2009 – 2013 and 2014 ................................................................................................... 26Table 13 Maternal Complications of Pregnancy and Delivery in Live Births by Local Health Area, British Columbia, 2009 – 2013 and 2014 ................................................................................................... 27
Birth and Older Mothers, British Columbia, 2005 - 2014 ......................................................................... 29
DeatH-relateD StatIStICSDeath-Related Statistics Introduction ................................................................................................................................. 33
Table 14 Causes of Death by Sex and Age, British Columbia, 2014 ....................................................................... 34
Table 15 Twelve Leading Causes of Death, British Columbia, 2009 – 2013 .......................................................... 35
Table 16 Twelve Leading Causes of Death, British Columbia, 2014 ...................................................................... 35
Table 17 Leading Causes of Death by Age and Sex, British Columbia, 2014 ........................................................ 36
Table 18 Infant Mortality by Age of Mother and Birth Weight, British Columbia, 2014 ....................................... 38
Table 19 Infant Mortality by Gestational Age and Birth Weight, British Columbia, 2014 .................................... 38
Table 20 Infant Mortality by Local Health Area, British Columbia, 2009 – 2013 and 2014 .................................. 39
Table 21 Selected Causes of Infant Deaths, British Columbia, 2014 ...................................................................... 41
Table 22 Selected Causes of Stillbirths, British Columbia, 2014 ............................................................................. 42
Table 23 Suicide Deaths by Month and Sex, British Columbia, 2014 ..................................................................... 43
i
i
vii
Table 24 External Causes of Death by Sex, British Columbia, 2014 ....................................................................... 43Table 25 External Causes of Death by Local Health Area, British Columbia, 2014 .............................................. 44Table 26 Potential Years of Life Lost and Age Standardized Mortality Rates by Selected Cause of Death, British Columbia, 2014 ................................................................................................................................ 46Table 27 Potential Years of Life Lost by Local Health Area, External Causes of Death Under 75, British Columbia, 2009 - 2013 and 2014 .................................................................................................... 47Table 28 Deaths Due to Medically Treatable Diseases by Selected Causes and Sex, British Columbia, 2009 - 2013 and 2014 .................................................................................................... 49 Age at Death of the Oldest Male and Female, British Columbia, 1995 - 2014 ...................................... 49Table 29 Standardized Mortality Ratio by Local Health Areas, Deaths Due to Medically Treatable Diseases, British Columbia, 2009 - 2013 and 2014 .................................................................................................... 50Table 30 Alcohol-Related Deaths by Age and Sex, British Columbia, 2014 ........................................................... 51Table 31 Smoking-Attributable Mortality (SAM), British Columbia, 2014 .............................................................. 52Table 32 Drug-Induced Deaths by Age and Sex, British Columbia, 2014 .............................................................. 53
i Overdose Deaths by Type of Drug, British Columbia, 2005 - 2014 ........................................................ 54 Table 33 Deaths Directly and Indirectly Due to Falls by Age, British Columbia 2008 - 2014 .............................. 55Table 34 Method of Disposition of Decedent, British Columbia, 1993 – 2014 ...................................................... 56
marrIaGe-relateD StatIStICSMarriage-Related Statistics Introduction ............................................................................................................................ 59
Table 35 Marriages by Marital Status, British Columbia, 2014 ............................................................................... 60
Table 36 Marriages by Age, British Columbia, 2014 ................................................................................................. 60
GloSSarY .................................................................................................................................................................... 61
metHoDoloGY ............................................................................................................................................................ 73
aPPenDIX 1Statistical Summaries By Health Authority, Health Service Delivery Area, Local Health Area, and Community, British Columbia, 2014 ............................................................................................ 83
aPPenDIX 2Detailed Cause Of Death By Sex And Age, British Columbia, 2014 ................................................................................. 101
aPPenDIX 3Selected Health Status Indicators by Local Health Area, Health Service Delivery Area, and Health Authority, British Columbia, 2010 – 2014 .............................................................................................................................................. 129
Table A Summary Statistics by Local Health Area, British Columbia, 2010 – 2014 ............................................. 131
Table B Mortality Statistics by Local Health Area, British Columbia, 2010 – 2014 .............................................. 133
Table C Summary Statistics by Health Service Delivery Area, British Columbia, 2010 – 2014 .......................... 140
Table D Mortality Statistics by Health Service Delivery Area, British Columbia, 2010 – 2014 ........................... 141
Table E Summary Statistics by Health Authority, British Columbia, 2010 – 2014 .............................................. 143
Table F Mortality Statistics by Health Authority, British Columbia, 2010 – 2014 ................................................ 144
i
Tab le o f C o n t e n t s

1
General Information
Data in this section provide a long-term, month-to-month, and daily view of live births, deaths, marriages, and stillbirths in British Columbia.

2
3
Introduction
The Agency registers, and certifies vital events in compliance with the Vital Statistics Act, Marriage Act, and Name Act. Statistical information in this report is summary data provided by the Agency for use by government agencies, health planners, researchers, and the general public. In order to maintain confidentiality, the information does not disclose personally identifiable data.
Registrat ionsThe information in this report reflects the health status of the population, and most of the data provided here include B.C. residents only. Specifically, live birth, stillbirth, and death statistics summarize events that occurred in the province to B.C. residents only, and exclude events to nonresidents except where noted. Marriage statistics summarize all events that occurred in the province to either residents or nonresidents. Vital events that occurred to B.C. residents outside the province are not shown in this report; Statistics Canada makes adjustments in its publications for events that occur to Canadians outside their province of usual residence.
V ital Event DataData presented in this report are based on registrations of birth, stillbirth, death, and marriage as reported to the Agency. Registration requirements for each type of event are outlined briefly as follows:
live births: The Vital Statistics Act prescribes the legal requirements for the registration of live births. The parent(s) of the child have the responsibility to complete the birth registration within 30 days of the event. The physician, nurse practitioner, or registered midwife who was in attendance at the birth must complete a Notice of Live Birth or Stillbirth (NOB) form which must be made available to the Agency within 48 hours of the event. Other requirements must be met if the birth was not attended by a physician, nurse practitioner, or registered midwife.
Stillbirths: The physician, nurse practitioner, or registered midwife who was in attendance at the birth must complete a Notice of Live Birth or Stillbirth (NOB) form. In the event of a stillbirth, the parent(s) must complete the birth registration. In addition, a physician or coroner is required to complete the Medical Certification of Stillbirth portion of the Registration of Stillbirth and deliver it to the funeral director who in turn submits it to the Agency.
Deaths: The physician or nurse practitioner in attendance at the last illness of the deceased person, or the coroner conducting an inquiry into the death of the person is required to complete a Medical Certification of Death form. The funeral home completes the death registration with assistance from the informant (usually a relative of the deceased), and issues the disposition permit. The Medical Certification of Death form and the death registration are then forwarded to the Agency.
marriages: The Marriage Act prescribes the legal qualifications of individuals to marry, the authorization of religious representatives and marriage commissioners to perform the marriage ceremony, and the solemnization of marriage. Under the Marriage Act, the Agency licences marriage commissioners and religious representatives of established religious denominations who apply for the authority to solemnize marriages. The Agency also authorizes qualified marriage licence issuers.
4
Medical CodingThe Notice of Live Birth or Stillbirth (NOB) includes the sex, birth weight, gestation, and mode of a child’s delivery, as well as any abnormalities or complications of pregnancy, labour, and delivery. The Medical Certification of Death and the Medical Certification of Stillbirth include the immediate cause of death or stillbirth, antecedent causes giving rise to the immediate cause, and other significant conditions contributing to the death or stillbirth. This information is processed by medically trained staff using the World Health Organization’s International Statistical Classification of Diseases (ICD) coding scheme.
Since the early 1900s, the ICD has been revised regularly in order to reflect advances in medical science and changes in diagnostic terminology. The ninth revision of ICD (ICD-9) was used for medical coding of birth complications and causes of death from 1979 until 1999. The tenth revision (ICD-10) was implemented at the beginning of the year 2000. Many changes in the codes and in the rules for selection of the underlying cause of death precluded direct comparison of data in ICD-10 with data from earlier years.
Time PeriodsThis report pertains to events that occurred in the calendar year 2014. Selected tables present aggregate information for the previous five-year period. These broader time periods permit more meaningful tests of statistical significance when analyzing data at sub-provincial levels, and can smooth out random fluctuations that occur when annual numbers are small. For regional health status profiles, readers are encouraged to refer to measures of statistical significance and use data presented for the five-year aggregates.
The data for earlier years have been updated and may differ from other publications. This report replaces previous publications.
Populat ion DataMid-year population estimates for incorporated communities, local health areas, and health regions were provided by BC Stats, Ministry of Technology, Innovation and Citizens’ Services. In the mortality section of this report, a standard population is used in the calculation of Age Standardized Mortality Rates (ASMR) and Potential Years of Life Lost Standardized Rates (PYLLSR). The Agency has used the 2011 Canadian Census population as the standard population in the calculation of these age-standardized measures. Refer to Standard Population in the Glossary for a more detailed description and the Methodology section for examples of computations of measures and statistical tests.
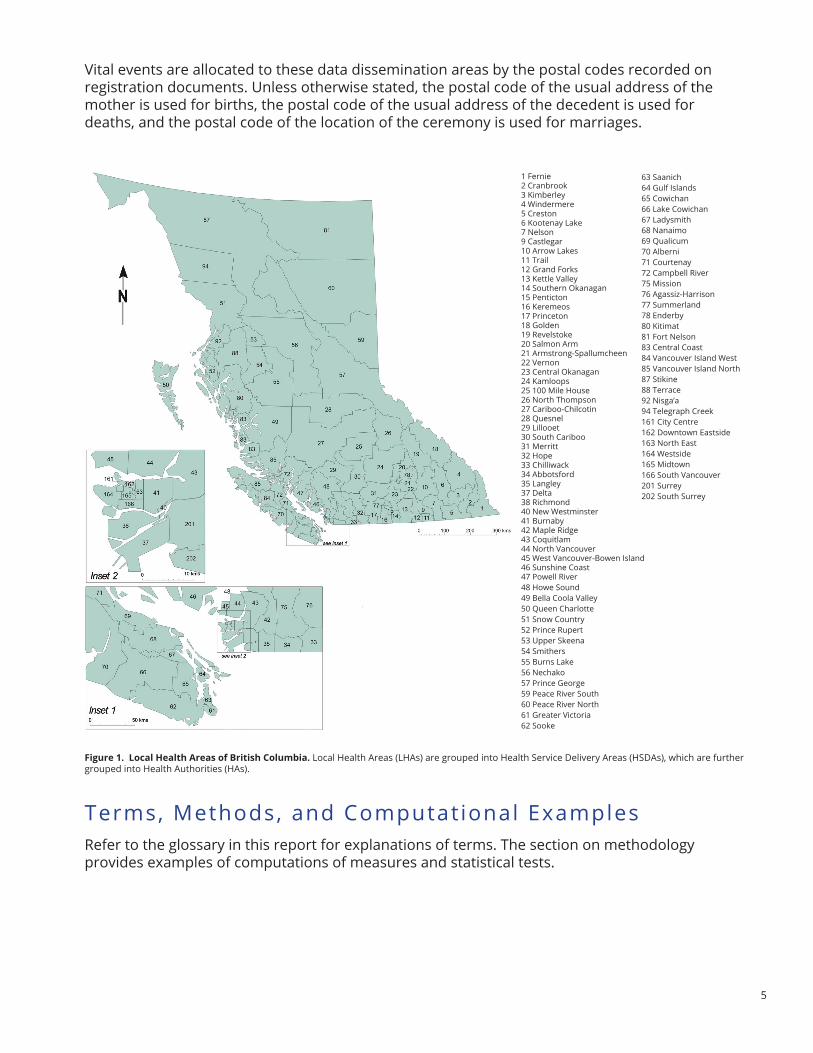
Spatial AnalysisFor spatial analysis, this report uses incorporated communities and regions used by the Ministry of Health. (See Figure 1. Local Health Areas of British Columbia.) The Ministry of Health divides the province into five health authorities (HA). Each HA is divided into health service delivery areas (HSDA). Each HSDA is divided into local health areas (LHA). Reporting in this way continues the practice established in 2001 to provide HAs with a consistent series of health status indicators for their regions over time. Health care services are managed and delivered by the five HAs. The HAs govern, plan, and coordinate services regionally within 16 HSDAs. The Interior Health Authority is divided into four HSDAs. Fraser, Vancouver Coastal, Vancouver Island, and Northern Health Authorities are each divided into three HSDAs.
5
Vital events are allocated to these data dissemination areas by the postal codes recorded on registration documents. Unless otherwise stated, the postal code of the usual address of the mother is used for births, the postal code of the usual address of the decedent is used for deaths, and the postal code of the location of the ceremony is used for marriages.
63 Saanich64 Gulf Islands65 Cowichan66 Lake Cowichan67 Ladysmith68 Nanaimo69 Qualicum70 Alberni71 Courtenay72 Campbell River75 Mission76 Agassiz-Harrison77 Summerland78 Enderby80 Kitimat81 Fort Nelson83 Central Coast84 Vancouver Island West85 Vancouver Island North87 Stikine88 Terrace92 Nisga’a94 Telegraph Creek161 City Centre162 Downtown Eastside163 North East164 Westside165 Midtown166 South Vancouver201 Surrey202 South Surrey
1 Fernie2 Cranbrook3 Kimberley4 Windermere5 Creston6 Kootenay Lake7 Nelson9 Castlegar10 Arrow Lakes11 Trail12 Grand Forks13 Kettle Valley14 Southern Okanagan15 Penticton16 Keremeos17 Princeton18 Golden19 Revelstoke20 Salmon Arm21 Armstrong-Spallumcheen22 Vernon23 Central Okanagan24 Kamloops25 100 Mile House26 North Thompson27 Cariboo-Chilcotin28 Quesnel29 Lillooet30 South Cariboo31 Merritt32 Hope33 Chilliwack34 Abbotsford35 Langley37 Delta38 Richmond40 New Westminster41 Burnaby42 Maple Ridge43 Coquitlam44 North Vancouver45 West Vancouver-Bowen Island46 Sunshine Coast47 Powell River48 Howe Sound49 Bella Coola Valley50 Queen Charlotte51 Snow Country52 Prince Rupert53 Upper Skeena54 Smithers55 Burns Lake56 Nechako57 Prince George59 Peace River South60 Peace River North61 Greater Victoria62 Sooke
Terms, Methods, and Computational ExamplesRefer to the glossary in this report for explanations of terms. The section on methodology provides examples of computations of measures and statistical tests.
figure 1. local Health areas of British Columbia. Local Health Areas (LHAs) are grouped into Health Service Delivery Areas (HSDAs), which are further grouped into Health Authorities (HAs).

6
7
Trends inVital Events
Data in this section provide a long-term, month-to-month, and daily view of live births, deaths, marriages, and stillbirths in British Columbia.

8
9
Note: Numbers may not add up due to rounding.
Trends in Vital Events
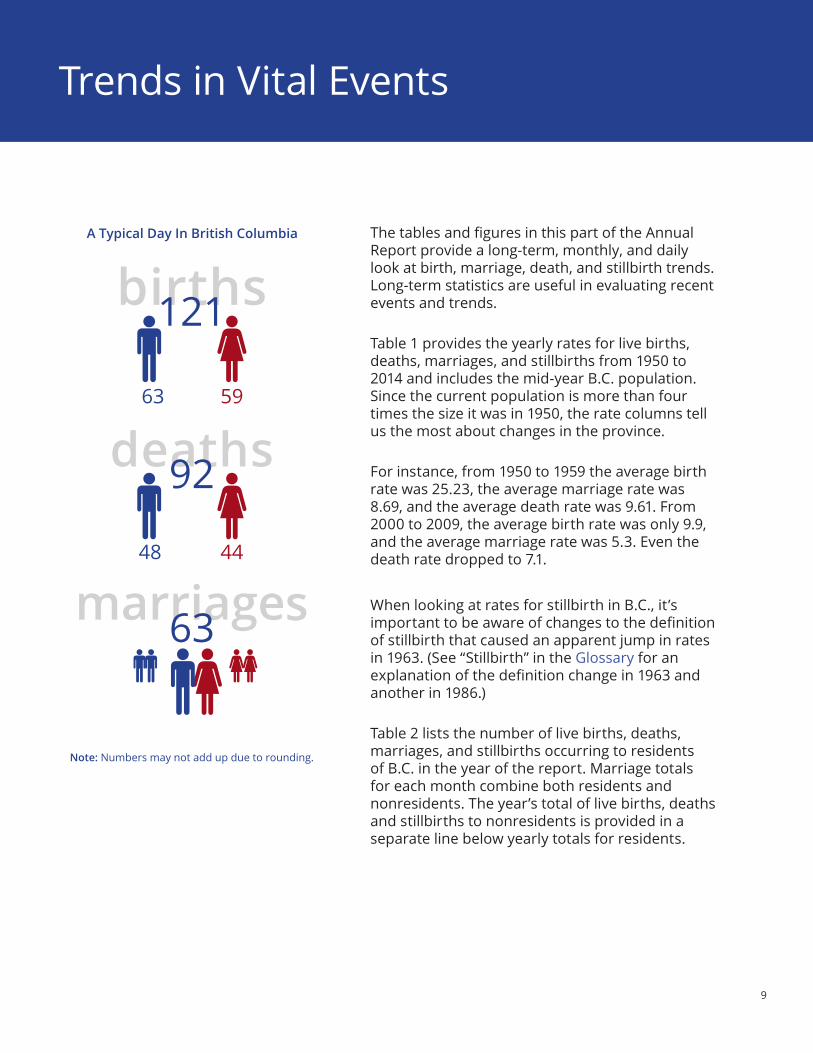
The tables and figures in this part of the Annual Report provide a long-term, monthly, and daily look at birth, marriage, death, and stillbirth trends. Long-term statistics are useful in evaluating recent events and trends.
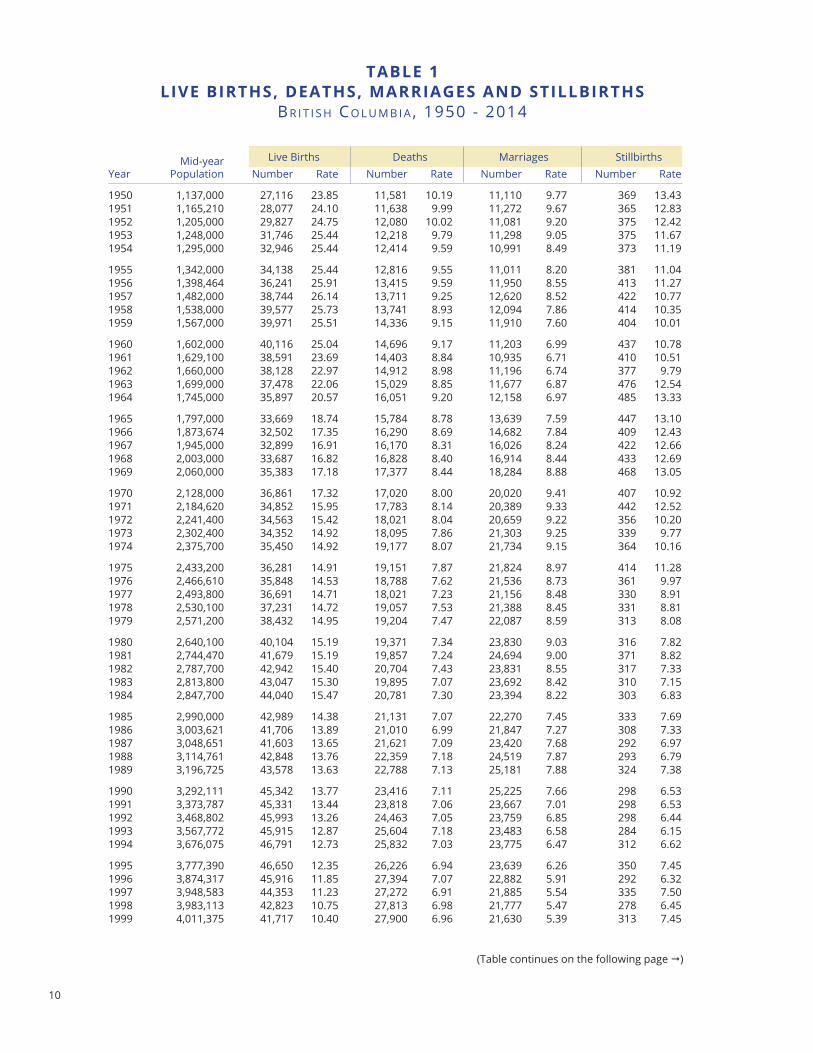
Table 1 provides the yearly rates for live births, deaths, marriages, and stillbirths from 1950 to 2014 and includes the mid-year B.C. population. Since the current population is more than four times the size it was in 1950, the rate columns tell us the most about changes in the province.
For instance, from 1950 to 1959 the average birth rate was 25.23, the average marriage rate was 8.69, and the average death rate was 9.61. From 2000 to 2009, the average birth rate was only 9.9, and the average marriage rate was 5.3. Even the death rate dropped to 7.1.
When looking at rates for stillbirth in B.C., it’s important to be aware of changes to the definition of stillbirth that caused an apparent jump in rates in 1963. (See “Stillbirth” in the Glossary for an explanation of the definition change in 1963 and another in 1986.)
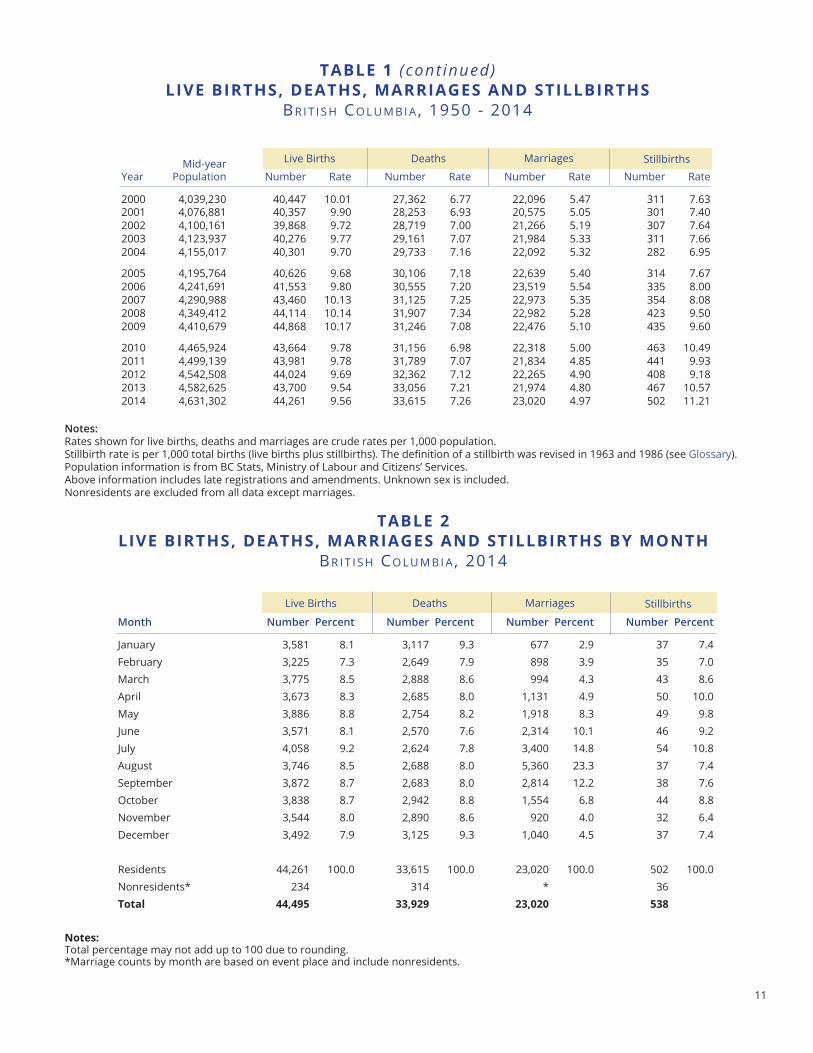
Table 2 lists the number of live births, deaths, marriages, and stillbirths occurring to residents of B.C. in the year of the report. Marriage totals for each month combine both residents and nonresidents. The year’s total of live births, deaths and stillbirths to nonresidents is provided in a separate line below yearly totals for residents.
births121
63 59
deaths92
48 44
marriages63
A Typical Day In British Columbia
10
taBle 1lIVe BIrtHS, DeatHS, marrIaGeS anD StIllBIrtHS
BR I t I S h Co L u M B I A , 1950 - 2014
(Table continues on the following page )
Mid-yearPopulation
Year Number Rate Number Rate Number Rate Number Rate
1950 1,137,000 27,116 23.85 11,581 10.19 11,110 9.77 369 13.431951 1,165,210 28,077 24.10 11,638 9.99 11,272 9.67 365 12.831952 1,205,000 29,827 24.75 12,080 10.02 11,081 9.20 375 12.421953 1,248,000 31,746 25.44 12,218 9.79 11,298 9.05 375 11.671954 1,295,000 32,946 25.44 12,414 9.59 10,991 8.49 373 11.19
1955 1,342,000 34,138 25.44 12,816 9.55 11,011 8.20 381 11.041956 1,398,464 36,241 25.91 13,415 9.59 11,950 8.55 413 11.271957 1,482,000 38,744 26.14 13,711 9.25 12,620 8.52 422 10.771958 1,538,000 39,577 25.73 13,741 8.93 12,094 7.86 414 10.351959 1,567,000 39,971 25.51 14,336 9.15 11,910 7.60 404 10.01
1960 1,602,000 40,116 25.04 14,696 9.17 11,203 6.99 437 10.781961 1,629,100 38,591 23.69 14,403 8.84 10,935 6.71 410 10.511962 1,660,000 38,128 22.97 14,912 8.98 11,196 6.74 377 9.791963 1,699,000 37,478 22.06 15,029 8.85 11,677 6.87 476 12.541964 1,745,000 35,897 20.57 16,051 9.20 12,158 6.97 485 13.33
1965 1,797,000 33,669 18.74 15,784 8.78 13,639 7.59 447 13.101966 1,873,674 32,502 17.35 16,290 8.69 14,682 7.84 409 12.431967 1,945,000 32,899 16.91 16,170 8.31 16,026 8.24 422 12.661968 2,003,000 33,687 16.82 16,828 8.40 16,914 8.44 433 12.691969 2,060,000 35,383 17.18 17,377 8.44 18,284 8.88 468 13.05
1970 2,128,000 36,861 17.32 17,020 8.00 20,020 9.41 407 10.921971 2,184,620 34,852 15.95 17,783 8.14 20,389 9.33 442 12.521972 2,241,400 34,563 15.42 18,021 8.04 20,659 9.22 356 10.201973 2,302,400 34,352 14.92 18,095 7.86 21,303 9.25 339 9.771974 2,375,700 35,450 14.92 19,177 8.07 21,734 9.15 364 10.16
1975 2,433,200 36,281 14.91 19,151 7.87 21,824 8.97 414 11.281976 2,466,610 35,848 14.53 18,788 7.62 21,536 8.73 361 9.971977 2,493,800 36,691 14.71 18,021 7.23 21,156 8.48 330 8.911978 2,530,100 37,231 14.72 19,057 7.53 21,388 8.45 331 8.811979 2,571,200 38,432 14.95 19,204 7.47 22,087 8.59 313 8.08
1980 2,640,100 40,104 15.19 19,371 7.34 23,830 9.03 316 7.821981 2,744,470 41,679 15.19 19,857 7.24 24,694 9.00 371 8.821982 2,787,700 42,942 15.40 20,704 7.43 23,831 8.55 317 7.331983 2,813,800 43,047 15.30 19,895 7.07 23,692 8.42 310 7.151984 2,847,700 44,040 15.47 20,781 7.30 23,394 8.22 303 6.83
1985 2,990,000 42,989 14.38 21,131 7.07 22,270 7.45 333 7.691986 3,003,621 41,706 13.89 21,010 6.99 21,847 7.27 308 7.331987 3,048,651 41,603 13.65 21,621 7.09 23,420 7.68 292 6.971988 3,114,761 42,848 13.76 22,359 7.18 24,519 7.87 293 6.791989 3,196,725 43,578 13.63 22,788 7.13 25,181 7.88 324 7.38
1990 3,292,111 45,342 13.77 23,416 7.11 25,225 7.66 298 6.531991 3,373,787 45,331 13.44 23,818 7.06 23,667 7.01 298 6.531992 3,468,802 45,993 13.26 24,463 7.05 23,759 6.85 298 6.441993 3,567,772 45,915 12.87 25,604 7.18 23,483 6.58 284 6.151994 3,676,075 46,791 12.73 25,832 7.03 23,775 6.47 312 6.62
1995 3,777,390 46,650 12.35 26,226 6.94 23,639 6.26 350 7.451996 3,874,317 45,916 11.85 27,394 7.07 22,882 5.91 292 6.321997 3,948,583 44,353 11.23 27,272 6.91 21,885 5.54 335 7.501998 3,983,113 42,823 10.75 27,813 6.98 21,777 5.47 278 6.451999 4,011,375 41,717 10.40 27,900 6.96 21,630 5.39 313 7.45
StillbirthsMarriagesDeathsLive Births
11
taBle 1 (cont inued)lIVe BIrtHS, DeatHS, marrIaGeS anD StIllBIrtHS
BR I t I S h Co L u M B I A , 1950 - 2014
taBle 2lIVe BIrtHS, DeatHS, marrIaGeS anD StIllBIrtHS BY montH
BR I t I S h Co L u M B I A , 2014
Notes: Rates shown for live births, deaths and marriages are crude rates per 1,000 population.Stillbirth rate is per 1,000 total births (live births plus stillbirths). The definition of a stillbirth was revised in 1963 and 1986 (see Glossary). Population information is from BC Stats, Ministry of Labour and Citizens’ Services.Above information includes late registrations and amendments. Unknown sex is included.Nonresidents are excluded from all data except marriages.
Month Number Percent Number Percent Number Percent Number Percent
January 3,581 8.1 3,117 9.3 677 2.9 37 7.4February 3,225 7.3 2,649 7.9 898 3.9 35 7.0March 3,775 8.5 2,888 8.6 994 4.3 43 8.6April 3,673 8.3 2,685 8.0 1,131 4.9 50 10.0May 3,886 8.8 2,754 8.2 1,918 8.3 49 9.8June 3,571 8.1 2,570 7.6 2,314 10.1 46 9.2July 4,058 9.2 2,624 7.8 3,400 14.8 54 10.8August 3,746 8.5 2,688 8.0 5,360 23.3 37 7.4September 3,872 8.7 2,683 8.0 2,814 12.2 38 7.6October 3,838 8.7 2,942 8.8 1,554 6.8 44 8.8November 3,544 8.0 2,890 8.6 920 4.0 32 6.4December 3,492 7.9 3,125 9.3 1,040 4.5 37 7.4
Residents 44,261 100.0 33,615 100.0 23,020 100.0 502 100.0Nonresidents* 234 314 * 36total 44,495 33,929 23,020 538
notes:Total percentage may not add up to 100 due to rounding.*Marriage counts by month are based on event place and include nonresidents.
Mid-yearPopulationYear Number Rate Number Rate Number Rate Number Rate
2000 4,039,230 40,447 10.01 27,362 6.77 22,096 5.47 311 7.632001 4,076,881 40,357 9.90 28,253 6.93 20,575 5.05 301 7.402002 4,100,161 39,868 9.72 28,719 7.00 21,266 5.19 307 7.642003 4,123,937 40,276 9.77 29,161 7.07 21,984 5.33 311 7.662004 4,155,017 40,301 9.70 29,733 7.16 22,092 5.32 282 6.95
2005 4,195,764 40,626 9.68 30,106 7.18 22,639 5.40 314 7.672006 4,241,691 41,553 9.80 30,555 7.20 23,519 5.54 335 8.002007 4,290,988 43,460 10.13 31,125 7.25 22,973 5.35 354 8.082008 4,349,412 44,114 10.14 31,907 7.34 22,982 5.28 423 9.502009 4,410,679 44,868 10.17 31,246 7.08 22,476 5.10 435 9.60
2010 4,465,924 43,664 9.78 31,156 6.98 22,318 5.00 463 10.492011 4,499,139 43,981 9.78 31,789 7.07 21,834 4.85 441 9.932012 4,542,508 44,024 9.69 32,362 7.12 22,265 4.90 408 9.182013 4,582,625 43,700 9.54 33,056 7.21 21,974 4.80 467 10.572014 4,631,302 44,261 9.56 33,615 7.26 23,020 4.97 502 11.21
StillbirthsMarriagesDeathsLive Births
StillbirthsMarriagesDeathsLive Births

12
On a Typical Day in British Columbia in 2014
i
121 Live Births in the Province to B.C. Residents63 males 59 females
2 born to teenage mothers30 born to mothers aged 35 years or older
4 multiple births39 caesarean deliveries
7 low birth weight babies9 preterm babies
67 involved maternal complications43 babies had perinatal complications
1 stillbirth
92 Deaths in the Province to B.C. Residents48 males 44 females74 seniors aged 65 years old or older, including
48 seniors aged 80 years or older7 children younger than 15 years old every 10 days, including
5 infants25 due to diseases of the circulatory system, including
- 17 from cardiovascular disease- 6 from cerebrovascular disease
27 due to malignant neoplasms (cancer), including- 7 from malignant neoplasm of trachea and lung- 3 from malignant neoplasm of colon and rectum- 2 from malignant neoplasm of female breast
9 due to diseases of the respiratory system, including- 3 from pneumonia and influenza- 4 from chronic pulmonary disease
1 every 10 days due to HIV disease5 due to external causes, including
- 2 suicides- 1 motor vehicle accident- 1 accidental fall
6 alcohol-related:- 2 directly related- 4 indirectly related
1 drug-induced17 attributed to smoking
63 Marriages in the Province to Residents and Nonresidents41 civil ceremonies22 religious ceremonies44 couples where both parties were marrying for the first time
1 marriage every 10 days to a couple where both parties were teenagers
Notes: Numbers may not add up due to rounding.
13
The tables in this section present birth statistics categorized by maternal age, complications of pregnancy, delivery mode, and gestational age.
Birth-RelatedStatistics

14
15
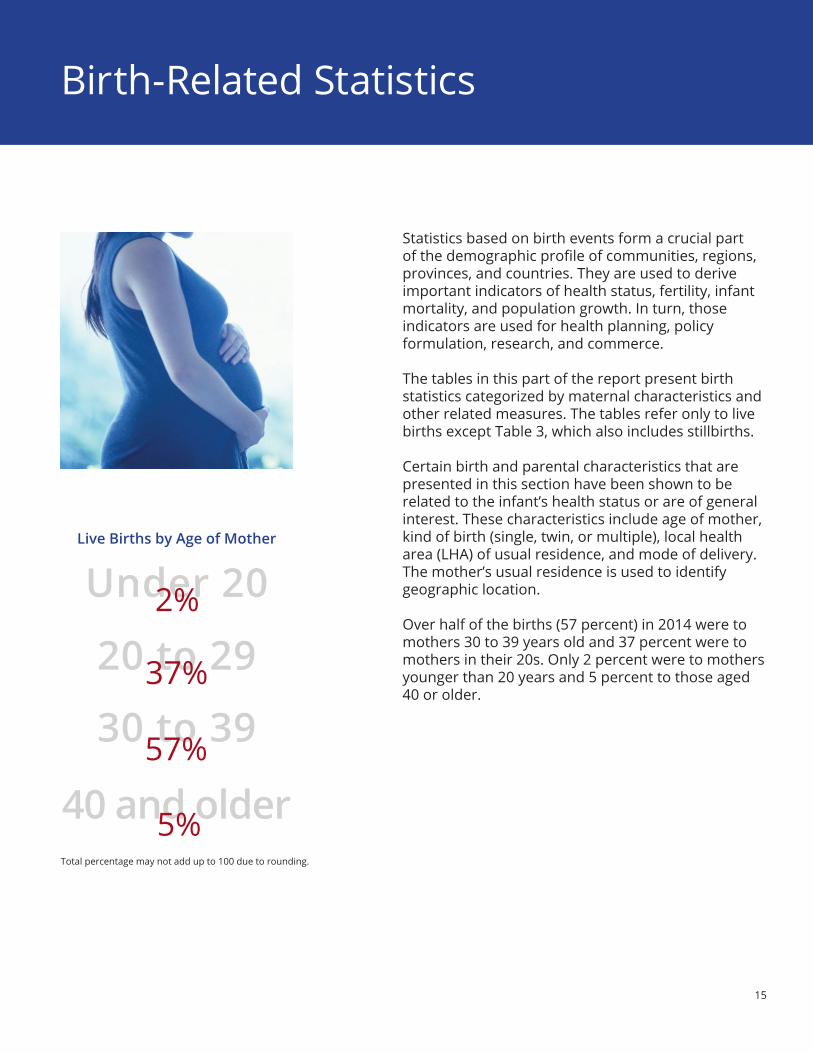
Birth-Related Statistics
Statistics based on birth events form a crucial part of the demographic profile of communities, regions, provinces, and countries. They are used to derive important indicators of health status, fertility, infant mortality, and population growth. In turn, those indicators are used for health planning, policy formulation, research, and commerce.
The tables in this part of the report present birth statistics categorized by maternal characteristics and other related measures. The tables refer only to live births except Table 3, which also includes stillbirths.
Certain birth and parental characteristics that are presented in this section have been shown to be related to the infant’s health status or are of general interest. These characteristics include age of mother, kind of birth (single, twin, or multiple), local health area (LHA) of usual residence, and mode of delivery. The mother’s usual residence is used to identify geographic location.
Over half of the births (57 percent) in 2014 were to mothers 30 to 39 years old and 37 percent were to mothers in their 20s. Only 2 percent were to mothers younger than 20 years and 5 percent to those aged 40 or older.
Live Births by Age of Mother
Under 202%
20 to 2937%
30 to 3957%
40 and older5%Total percentage may not add up to 100 due to rounding.
16
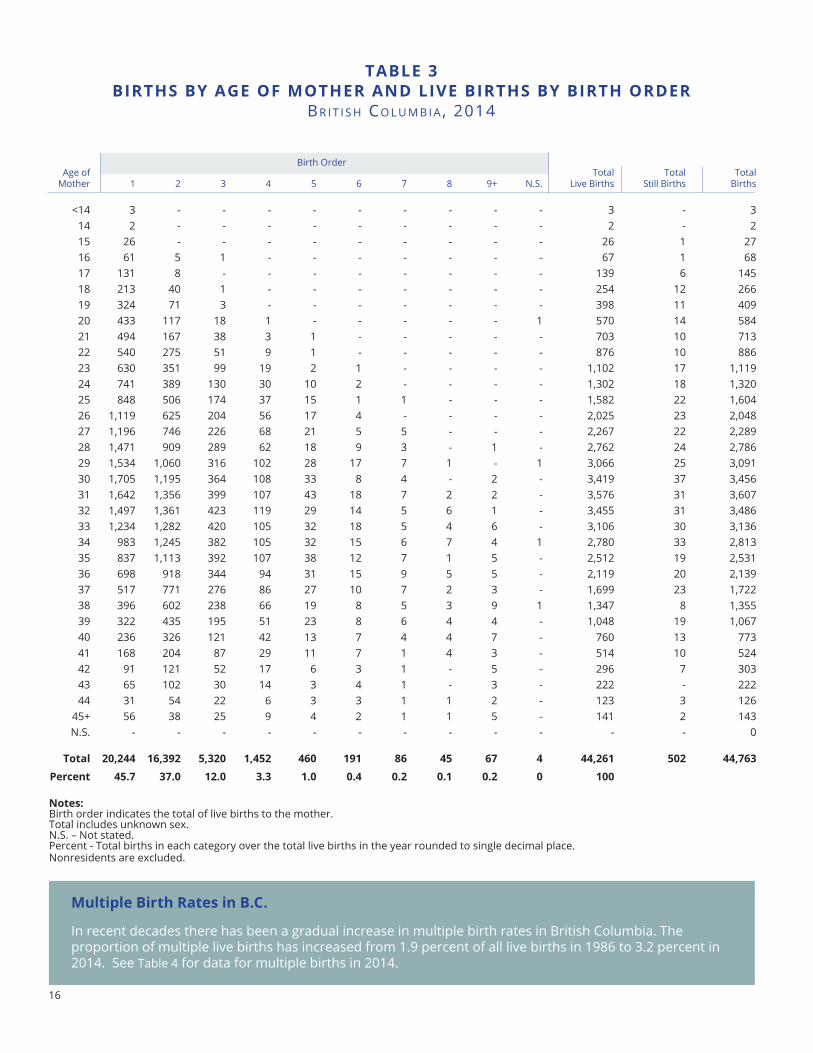
multiple Birth rates in B.C.
In recent decades there has been a gradual increase in multiple birth rates in British Columbia. The proportion of multiple live births has increased from 1.9 percent of all live births in 1986 to 3.2 percent in 2014. See Table 4 for data for multiple births in 2014.
taBle 3BIrtHS BY aGe of motHer anD lIVe BIrtHS BY BIrtH orDer
BR I t I S h Co L u M B I A , 2014
Age of Mother
Birth Order
1 2 3 4 5 6 7 8 9+ N.S.Total
Live BirthsTotal
Still BirthsTotal
Births
<14 3 - - - - - - - - - 3 - 314 2 - - - - - - - - - 2 - 215 26 - - - - - - - - - 26 1 2716 61 5 1 - - - - - - - 67 1 6817 131 8 - - - - - - - - 139 6 14518 213 40 1 - - - - - - - 254 12 26619 324 71 3 - - - - - - - 398 11 40920 433 117 18 1 - - - - - 1 570 14 58421 494 167 38 3 1 - - - - - 703 10 71322 540 275 51 9 1 - - - - - 876 10 88623 630 351 99 19 2 1 - - - - 1,102 17 1,11924 741 389 130 30 10 2 - - - - 1,302 18 1,32025 848 506 174 37 15 1 1 - - - 1,582 22 1,60426 1,119 625 204 56 17 4 - - - - 2,025 23 2,04827 1,196 746 226 68 21 5 5 - - - 2,267 22 2,28928 1,471 909 289 62 18 9 3 - 1 - 2,762 24 2,78629 1,534 1,060 316 102 28 17 7 1 - 1 3,066 25 3,09130 1,705 1,195 364 108 33 8 4 - 2 - 3,419 37 3,45631 1,642 1,356 399 107 43 18 7 2 2 - 3,576 31 3,60732 1,497 1,361 423 119 29 14 5 6 1 - 3,455 31 3,48633 1,234 1,282 420 105 32 18 5 4 6 - 3,106 30 3,13634 983 1,245 382 105 32 15 6 7 4 1 2,780 33 2,81335 837 1,113 392 107 38 12 7 1 5 - 2,512 19 2,53136 698 918 344 94 31 15 9 5 5 - 2,119 20 2,13937 517 771 276 86 27 10 7 2 3 - 1,699 23 1,72238 396 602 238 66 19 8 5 3 9 1 1,347 8 1,35539 322 435 195 51 23 8 6 4 4 - 1,048 19 1,06740 236 326 121 42 13 7 4 4 7 - 760 13 77341 168 204 87 29 11 7 1 4 3 - 514 10 52442 91 121 52 17 6 3 1 - 5 - 296 7 30343 65 102 30 14 3 4 1 - 3 - 222 - 22244 31 54 22 6 3 3 1 1 2 - 123 3 126
45+ 56 38 25 9 4 2 1 1 5 - 141 2 143N.S. - - - - - - - - - - - - 0
total 20,244 16,392 5,320 1,452 460 191 86 45 67 4 44,261 502 44,763Percent 45.7 37.0 12.0 3.3 1.0 0.4 0.2 0.1 0.2 0 100
notes:Birth order indicates the total of live births to the mother.Total includes unknown sex. N.S. – Not stated.Percent - Total births in each category over the total live births in the year rounded to single decimal place.Nonresidents are excluded.
17
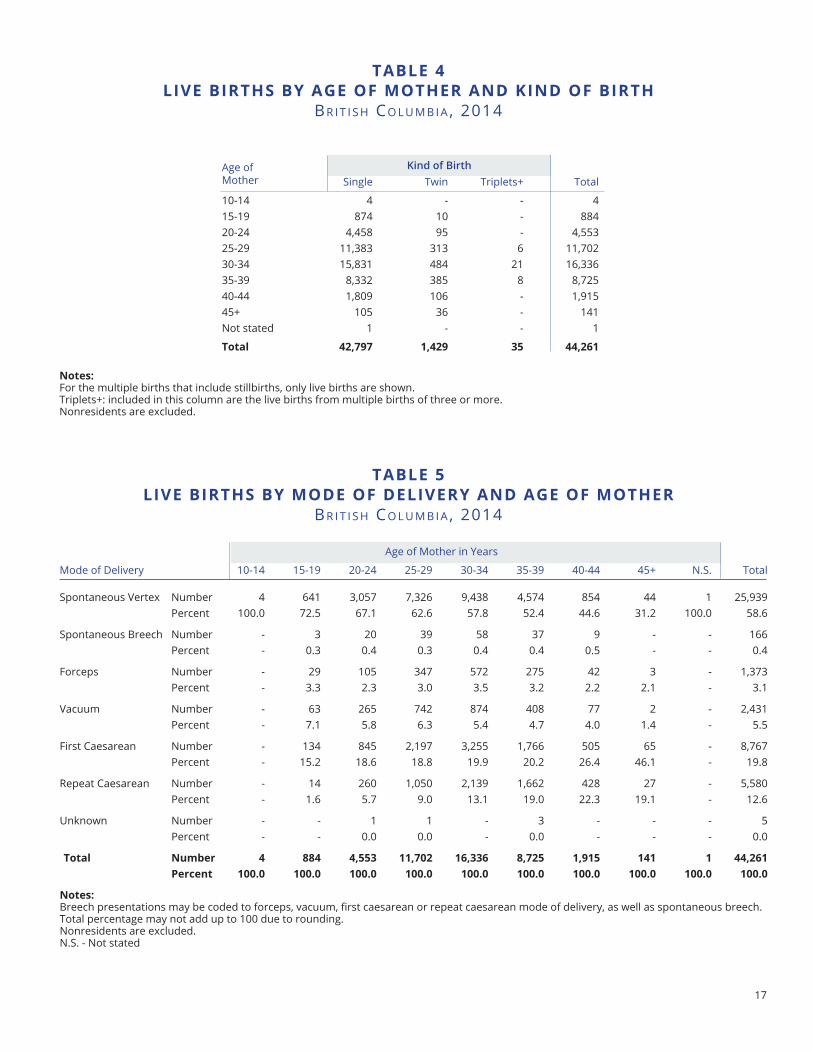
Kind of Birth
taBle 4lIVe BIrtHS BY aGe of motHer anD KInD of BIrtH
BR I t I S h Co L u M B I A , 2014
taBle 5lIVe BIrtHS BY moDe of DelIVerY anD aGe of motHer
BR I t I S h Co L u M B I A , 2014
Age of Mother in Years
Mode of Delivery 10-14 15-19 20-24 25-29 30-34 35-39 40-44 45+ N.S. Total
Spontaneous Vertex Number 4 641 3,057 7,326 9,438 4,574 854 44 1 25,939Percent 100.0 72.5 67.1 62.6 57.8 52.4 44.6 31.2 100.0 58.6
Spontaneous Breech Number - 3 20 39 58 37 9 - - 166Percent - 0.3 0.4 0.3 0.4 0.4 0.5 - - 0.4
Forceps Number - 29 105 347 572 275 42 3 - 1,373Percent - 3.3 2.3 3.0 3.5 3.2 2.2 2.1 - 3.1
Vacuum Number - 63 265 742 874 408 77 2 - 2,431Percent - 7.1 5.8 6.3 5.4 4.7 4.0 1.4 - 5.5
First Caesarean Number - 134 845 2,197 3,255 1,766 505 65 - 8,767Percent - 15.2 18.6 18.8 19.9 20.2 26.4 46.1 - 19.8
Repeat Caesarean Number - 14 260 1,050 2,139 1,662 428 27 - 5,580Percent - 1.6 5.7 9.0 13.1 19.0 22.3 19.1 - 12.6
Unknown Number - - 1 1 - 3 - - - 5Percent - - 0.0 0.0 - 0.0 - - - 0.0
total number 4 884 4,553 11,702 16,336 8,725 1,915 141 1 44,261Percent 100.0 100.0 100.0 100.0 100.0 100.0 100.0 100.0 100.0 100.0
notes:Breech presentations may be coded to forceps, vacuum, first caesarean or repeat caesarean mode of delivery, as well as spontaneous breech. Total percentage may not add up to 100 due to rounding.Nonresidents are excluded.N.S. - Not stated
Age ofMother Single Twin Triplets+ Total
10-14 4 - - 415-19 874 10 - 88420-24 4,458 95 - 4,55325-29 11,383 313 6 11,70230-34 15,831 484 21 16,33635-39 8,332 385 8 8,72540-44 1,809 106 - 1,91545+ 105 36 - 141Not stated 1 - - 1
total 42,797 1,429 35 44,261
notes:For the multiple births that include stillbirths, only live births are shown. Triplets+: included in this column are the live births from multiple births of three or more.Nonresidents are excluded.
18
2010 2011 2012 2013 2014
Place of Birth Number Percent Number Percent Number Percent Number Percent Number Percent
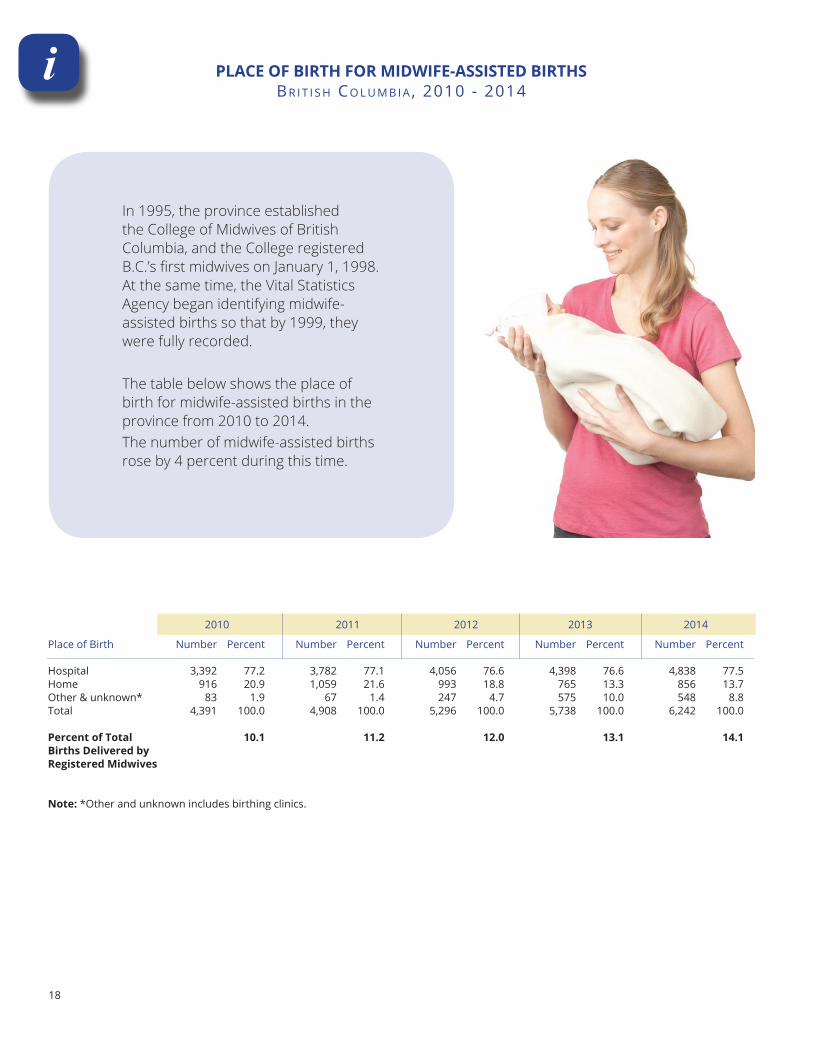
Hospital 3,392 77.2 3,782 77.1 4,056 76.6 4,398 76.6 4,838 77.5Home 916 20.9 1,059 21.6 993 18.8 765 13.3 856 13.7Other & unknown* 83 1.9 67 1.4 247 4.7 575 10.0 548 8.8Total 4,391 100.0 4,908 100.0 5,296 100.0 5,738 100.0 6,242 100.0
Percent of total Births Delivered by registered midwives
10.1 11.2 12.0 13.1 14.1
note: *Other and unknown includes birthing clinics.
i PlaCe of BIrtH for mIDWIfe-aSSISteD BIrtHSBR I t I S h Co L u M B I A , 2010 - 2014
In 1995, the province established the College of Midwives of British Columbia, and the College registered B.C.’s first midwives on January 1, 1998. At the same time, the Vital Statistics Agency began identifying midwife-assisted births so that by 1999, they were fully recorded.
The table below shows the place of birth for midwife-assisted births in the province from 2010 to 2014.The number of midwife-assisted births rose by 4 percent during this time.
19
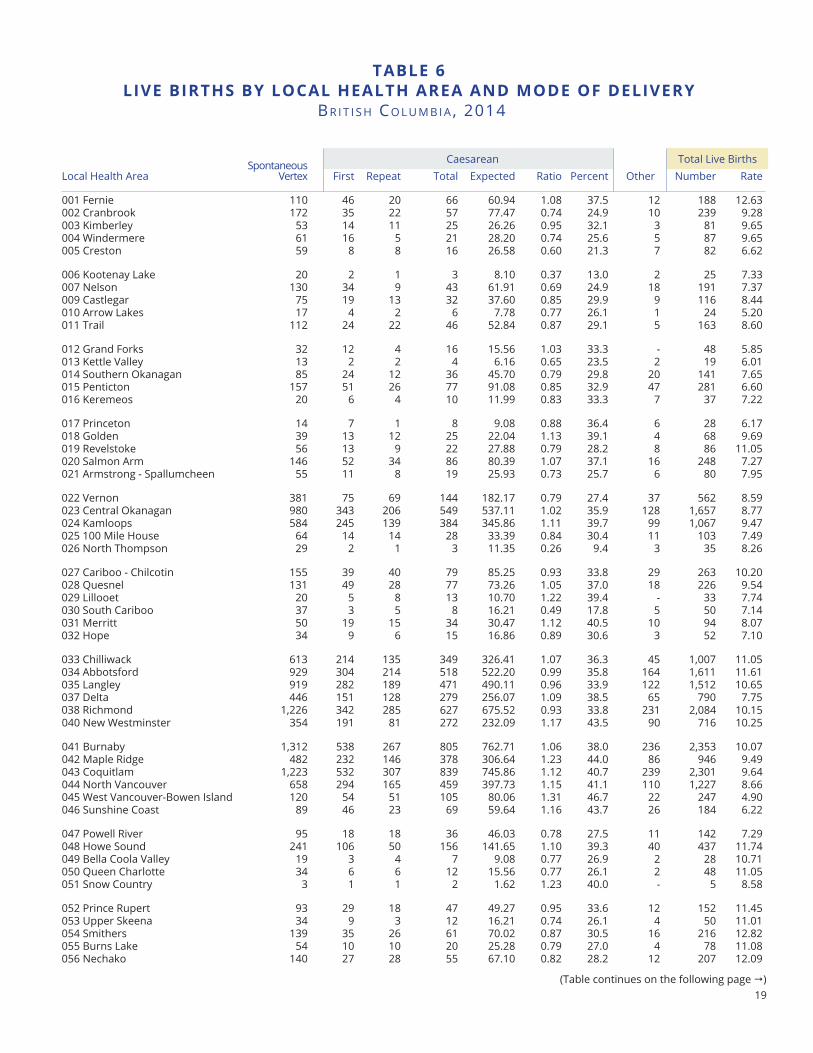
taBle 6lIVe BIrtHS BY loCal HealtH area anD moDe of DelIVerY
BR I t I S h Co L u M B I A , 2014
(Table continues on the following page )
Caesarean Total Live BirthsLocal Health Area
SpontaneousVertex First Repeat Total Expected Ratio Percent Other Number Rate
001 Fernie 110 46 20 66 60.94 1.08 37.5 12 188 12.63002 Cranbrook 172 35 22 57 77.47 0.74 24.9 10 239 9.28003 Kimberley 53 14 11 25 26.26 0.95 32.1 3 81 9.65004 Windermere 61 16 5 21 28.20 0.74 25.6 5 87 9.65005 Creston 59 8 8 16 26.58 0.60 21.3 7 82 6.62
006 Kootenay Lake 20 2 1 3 8.10 0.37 13.0 2 25 7.33007 Nelson 130 34 9 43 61.91 0.69 24.9 18 191 7.37009 Castlegar 75 19 13 32 37.60 0.85 29.9 9 116 8.44010 Arrow Lakes 17 4 2 6 7.78 0.77 26.1 1 24 5.20011 Trail 112 24 22 46 52.84 0.87 29.1 5 163 8.60
012 Grand Forks 32 12 4 16 15.56 1.03 33.3 - 48 5.85013 Kettle Valley 13 2 2 4 6.16 0.65 23.5 2 19 6.01014 Southern Okanagan 85 24 12 36 45.70 0.79 29.8 20 141 7.65015 Penticton 157 51 26 77 91.08 0.85 32.9 47 281 6.60016 Keremeos 20 6 4 10 11.99 0.83 33.3 7 37 7.22
017 Princeton 14 7 1 8 9.08 0.88 36.4 6 28 6.17018 Golden 39 13 12 25 22.04 1.13 39.1 4 68 9.69019 Revelstoke 56 13 9 22 27.88 0.79 28.2 8 86 11.05020 Salmon Arm 146 52 34 86 80.39 1.07 37.1 16 248 7.27021 Armstrong - Spallumcheen 55 11 8 19 25.93 0.73 25.7 6 80 7.95
022 Vernon 381 75 69 144 182.17 0.79 27.4 37 562 8.59023 Central Okanagan 980 343 206 549 537.11 1.02 35.9 128 1,657 8.77024 Kamloops 584 245 139 384 345.86 1.11 39.7 99 1,067 9.47025 100 Mile House 64 14 14 28 33.39 0.84 30.4 11 103 7.49026 North Thompson 29 2 1 3 11.35 0.26 9.4 3 35 8.26
027 Cariboo - Chilcotin 155 39 40 79 85.25 0.93 33.8 29 263 10.20028 Quesnel 131 49 28 77 73.26 1.05 37.0 18 226 9.54029 Lillooet 20 5 8 13 10.70 1.22 39.4 - 33 7.74030 South Cariboo 37 3 5 8 16.21 0.49 17.8 5 50 7.14031 Merritt 50 19 15 34 30.47 1.12 40.5 10 94 8.07032 Hope 34 9 6 15 16.86 0.89 30.6 3 52 7.10
033 Chilliwack 613 214 135 349 326.41 1.07 36.3 45 1,007 11.05034 Abbotsford 929 304 214 518 522.20 0.99 35.8 164 1,611 11.61035 Langley 919 282 189 471 490.11 0.96 33.9 122 1,512 10.65037 Delta 446 151 128 279 256.07 1.09 38.5 65 790 7.75038 Richmond 1,226 342 285 627 675.52 0.93 33.8 231 2,084 10.15040 New Westminster 354 191 81 272 232.09 1.17 43.5 90 716 10.25
041 Burnaby 1,312 538 267 805 762.71 1.06 38.0 236 2,353 10.07042 Maple Ridge 482 232 146 378 306.64 1.23 44.0 86 946 9.49043 Coquitlam 1,223 532 307 839 745.86 1.12 40.7 239 2,301 9.64044 North Vancouver 658 294 165 459 397.73 1.15 41.1 110 1,227 8.66045 West Vancouver-Bowen Island 120 54 51 105 80.06 1.31 46.7 22 247 4.90046 Sunshine Coast 89 46 23 69 59.64 1.16 43.7 26 184 6.22
047 Powell River 95 18 18 36 46.03 0.78 27.5 11 142 7.29048 Howe Sound 241 106 50 156 141.65 1.10 39.3 40 437 11.74049 Bella Coola Valley 19 3 4 7 9.08 0.77 26.9 2 28 10.71050 Queen Charlotte 34 6 6 12 15.56 0.77 26.1 2 48 11.05051 Snow Country 3 1 1 2 1.62 1.23 40.0 - 5 8.58
052 Prince Rupert 93 29 18 47 49.27 0.95 33.6 12 152 11.45053 Upper Skeena 34 9 3 12 16.21 0.74 26.1 4 50 11.01054 Smithers 139 35 26 61 70.02 0.87 30.5 16 216 12.82055 Burns Lake 54 10 10 20 25.28 0.79 27.0 4 78 11.08056 Nechako 140 27 28 55 67.10 0.82 28.2 12 207 12.09
20
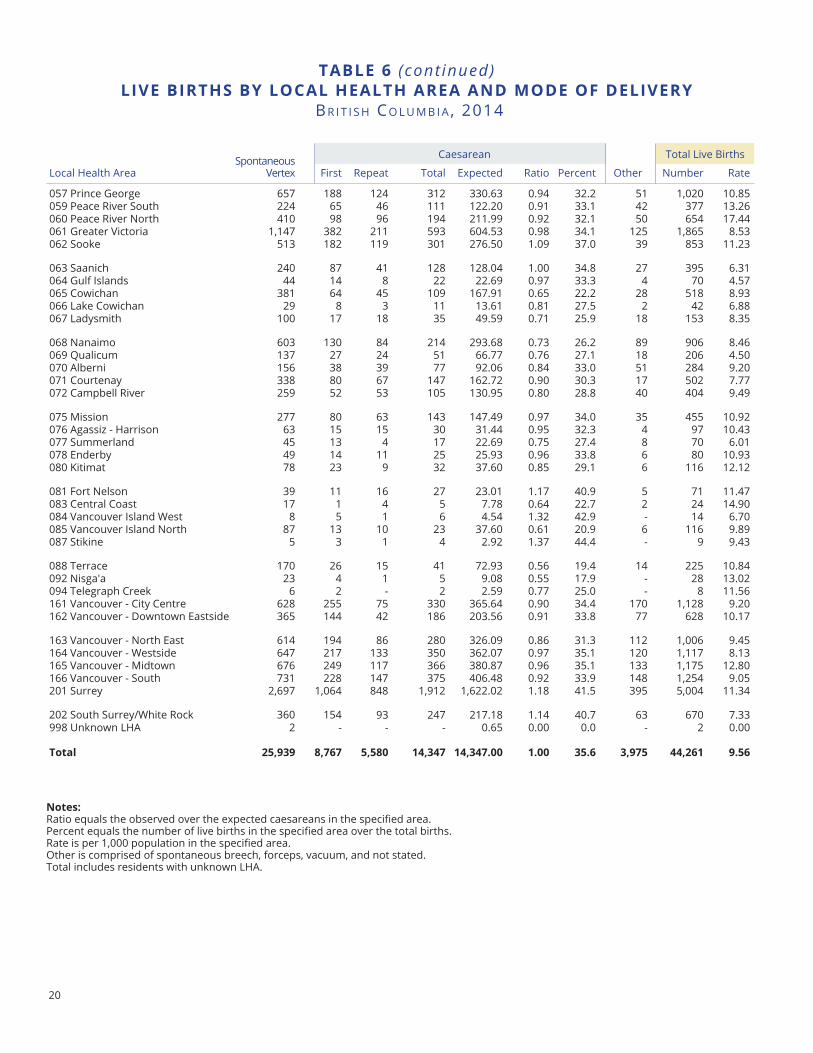
taBle 6 (cont inued)lIVe BIrtHS BY loCal HealtH area anD moDe of DelIVerY
BR I t I S h Co L u M B I A , 2014
notes: Ratio equals the observed over the expected caesareans in the specified area.Percent equals the number of live births in the specified area over the total births.Rate is per 1,000 population in the specified area. Other is comprised of spontaneous breech, forceps, vacuum, and not stated.Total includes residents with unknown LHA.
Local Health AreaSpontaneous
Vertex First Repeat Total Expected Ratio Percent Other Number Rate
057 Prince George 657 188 124 312 330.63 0.94 32.2 51 1,020 10.85059 Peace River South 224 65 46 111 122.20 0.91 33.1 42 377 13.26060 Peace River North 410 98 96 194 211.99 0.92 32.1 50 654 17.44061 Greater Victoria 1,147 382 211 593 604.53 0.98 34.1 125 1,865 8.53062 Sooke 513 182 119 301 276.50 1.09 37.0 39 853 11.23
063 Saanich 240 87 41 128 128.04 1.00 34.8 27 395 6.31064 Gulf Islands 44 14 8 22 22.69 0.97 33.3 4 70 4.57065 Cowichan 381 64 45 109 167.91 0.65 22.2 28 518 8.93066 Lake Cowichan 29 8 3 11 13.61 0.81 27.5 2 42 6.88067 Ladysmith 100 17 18 35 49.59 0.71 25.9 18 153 8.35
068 Nanaimo 603 130 84 214 293.68 0.73 26.2 89 906 8.46069 Qualicum 137 27 24 51 66.77 0.76 27.1 18 206 4.50070 Alberni 156 38 39 77 92.06 0.84 33.0 51 284 9.20071 Courtenay 338 80 67 147 162.72 0.90 30.3 17 502 7.77072 Campbell River 259 52 53 105 130.95 0.80 28.8 40 404 9.49
075 Mission 277 80 63 143 147.49 0.97 34.0 35 455 10.92076 Agassiz - Harrison 63 15 15 30 31.44 0.95 32.3 4 97 10.43077 Summerland 45 13 4 17 22.69 0.75 27.4 8 70 6.01078 Enderby 49 14 11 25 25.93 0.96 33.8 6 80 10.93080 Kitimat 78 23 9 32 37.60 0.85 29.1 6 116 12.12
081 Fort Nelson 39 11 16 27 23.01 1.17 40.9 5 71 11.47083 Central Coast 17 1 4 5 7.78 0.64 22.7 2 24 14.90084 Vancouver Island West 8 5 1 6 4.54 1.32 42.9 - 14 6.70085 Vancouver Island North 87 13 10 23 37.60 0.61 20.9 6 116 9.89087 Stikine 5 3 1 4 2.92 1.37 44.4 - 9 9.43
088 Terrace 170 26 15 41 72.93 0.56 19.4 14 225 10.84092 Nisga'a 23 4 1 5 9.08 0.55 17.9 - 28 13.02094 Telegraph Creek 6 2 - 2 2.59 0.77 25.0 - 8 11.56161 Vancouver - City Centre 628 255 75 330 365.64 0.90 34.4 170 1,128 9.20162 Vancouver - Downtown Eastside 365 144 42 186 203.56 0.91 33.8 77 628 10.17
163 Vancouver - North East 614 194 86 280 326.09 0.86 31.3 112 1,006 9.45164 Vancouver - Westside 647 217 133 350 362.07 0.97 35.1 120 1,117 8.13165 Vancouver - Midtown 676 249 117 366 380.87 0.96 35.1 133 1,175 12.80166 Vancouver - South 731 228 147 375 406.48 0.92 33.9 148 1,254 9.05201 Surrey 2,697 1,064 848 1,912 1,622.02 1.18 41.5 395 5,004 11.34
202 South Surrey/White Rock 360 154 93 247 217.18 1.14 40.7 63 670 7.33998 Unknown LHA 2 - - - 0.65 0.00 0.0 - 2 0.00
total 25,939 8,767 5,580 14,347 14,347.00 1.00 35.6 3,975 44,261 9.56
Caesarean Total Live Births
21
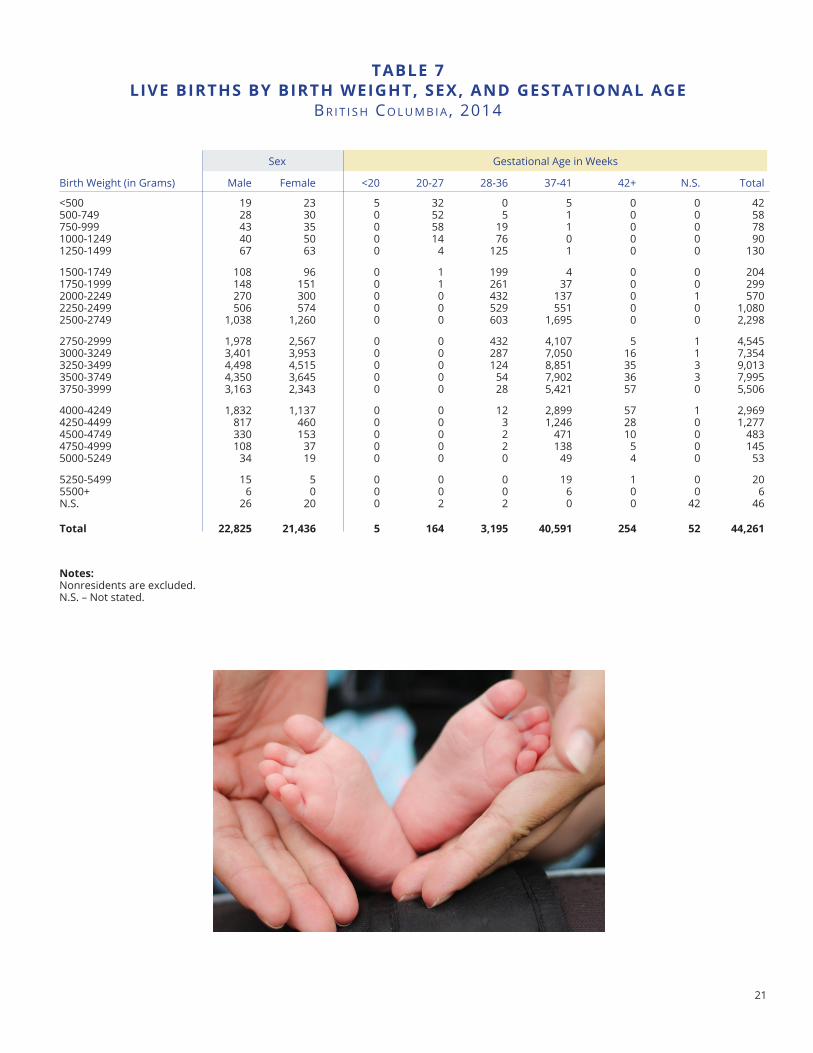
notes: Nonresidents are excluded.N.S. – Not stated.
taBle 7lIVe BIrtHS BY BIrtH WeIGHt, SeX, anD GeStatIonal aGe
BR I t I S h Co L u M B I A , 2014
Sex
Birth Weight (in Grams) Male Female <20 20-27 28-36 37-41 42+ N.S. Total
<500 19 23 5 32 0 5 0 0 42500-749 28 30 0 52 5 1 0 0 58750-999 43 35 0 58 19 1 0 0 781000-1249 40 50 0 14 76 0 0 0 901250-1499 67 63 0 4 125 1 0 0 130
1500-1749 108 96 0 1 199 4 0 0 2041750-1999 148 151 0 1 261 37 0 0 2992000-2249 270 300 0 0 432 137 0 1 5702250-2499 506 574 0 0 529 551 0 0 1,0802500-2749 1,038 1,260 0 0 603 1,695 0 0 2,298
2750-2999 1,978 2,567 0 0 432 4,107 5 1 4,5453000-3249 3,401 3,953 0 0 287 7,050 16 1 7,3543250-3499 4,498 4,515 0 0 124 8,851 35 3 9,0133500-3749 4,350 3,645 0 0 54 7,902 36 3 7,9953750-3999 3,163 2,343 0 0 28 5,421 57 0 5,506
4000-4249 1,832 1,137 0 0 12 2,899 57 1 2,9694250-4499 817 460 0 0 3 1,246 28 0 1,2774500-4749 330 153 0 0 2 471 10 0 4834750-4999 108 37 0 0 2 138 5 0 1455000-5249 34 19 0 0 0 49 4 0 53
5250-5499 15 5 0 0 0 19 1 0 205500+ 6 0 0 0 0 6 0 0 6N.S. 26 20 0 2 2 0 0 42 46
total 22,825 21,436 5 164 3,195 40,591 254 52 44,261
Gestational Age in Weeks
22
Age of Mother in Years
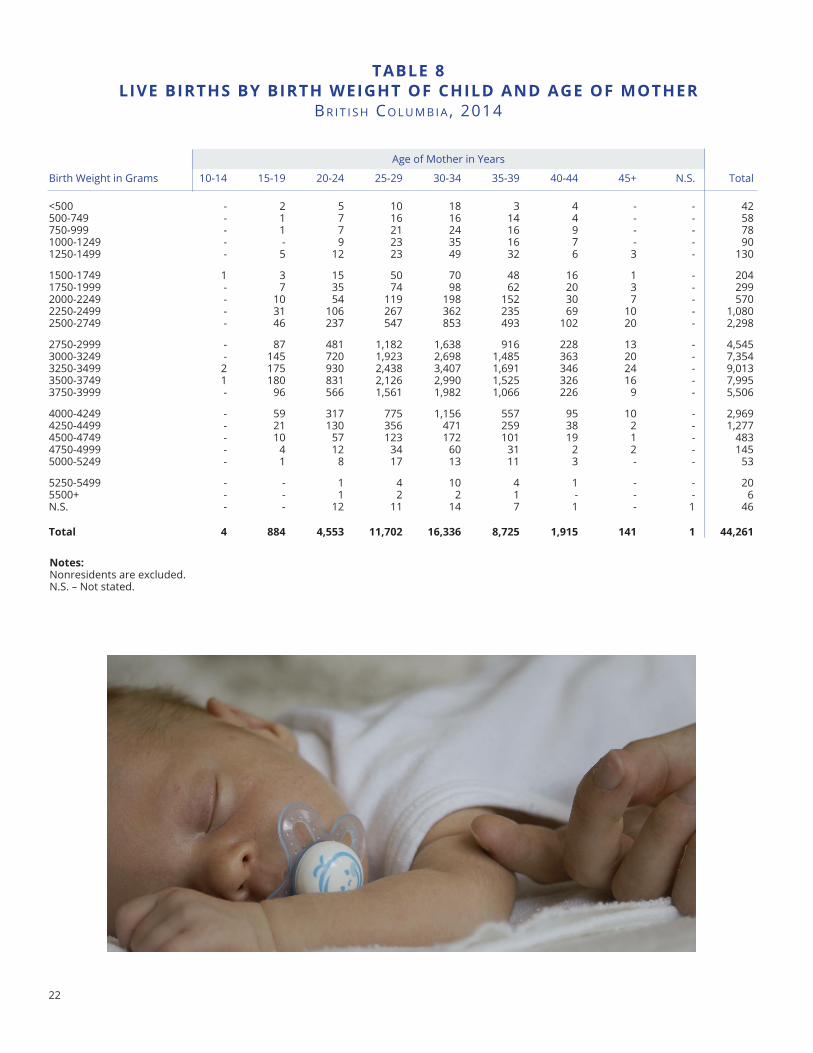
taBle 8lIVe BIrtHS BY BIrtH WeIGHt of CHIlD anD aGe of motHer
BR I t I S h Co L u M B I A , 2014
Birth Weight in Grams 10-14 15-19 20-24 25-29 30-34 35-39 40-44 45+ N.S. Total
<500 - 2 5 10 18 3 4 - - 42500-749 - 1 7 16 16 14 4 - - 58750-999 - 1 7 21 24 16 9 - - 781000-1249 - - 9 23 35 16 7 - - 901250-1499 - 5 12 23 49 32 6 3 - 130
1500-1749 1 3 15 50 70 48 16 1 - 2041750-1999 - 7 35 74 98 62 20 3 - 2992000-2249 - 10 54 119 198 152 30 7 - 5702250-2499 - 31 106 267 362 235 69 10 - 1,0802500-2749 - 46 237 547 853 493 102 20 - 2,298
2750-2999 - 87 481 1,182 1,638 916 228 13 - 4,5453000-3249 - 145 720 1,923 2,698 1,485 363 20 - 7,3543250-3499 2 175 930 2,438 3,407 1,691 346 24 - 9,0133500-3749 1 180 831 2,126 2,990 1,525 326 16 - 7,9953750-3999 - 96 566 1,561 1,982 1,066 226 9 - 5,506
4000-4249 - 59 317 775 1,156 557 95 10 - 2,9694250-4499 - 21 130 356 471 259 38 2 - 1,2774500-4749 - 10 57 123 172 101 19 1 - 4834750-4999 - 4 12 34 60 31 2 2 - 1455000-5249 - 1 8 17 13 11 3 - - 53
5250-5499 - - 1 4 10 4 1 - - 205500+ - - 1 2 2 1 - - - 6N.S. - - 12 11 14 7 1 - 1 46
total 4 884 4,553 11,702 16,336 8,725 1,915 141 1 44,261
notes: Nonresidents are excluded.N.S. – Not stated.
23
<2500 grams2,500 to 4,499 grams4,500+ grams
taBle 8lIVe BIrtHS BY BIrtH WeIGHt of CHIlD anD aGe of motHer
BR I t I S h Co L u M B I A , 2014
taBle 10loW BIrtH WeIGHt lIVe BIrtHS BY aGe of motHer anD SeX of CHIlD
BR I t I S h Co L u M B I A , 2014
taBle 9lIVe BIrtHS BY BIrtH WeIGHt In GroUPS anD aGe of motHer
BR I t I S h Co L u M B I A , 2014
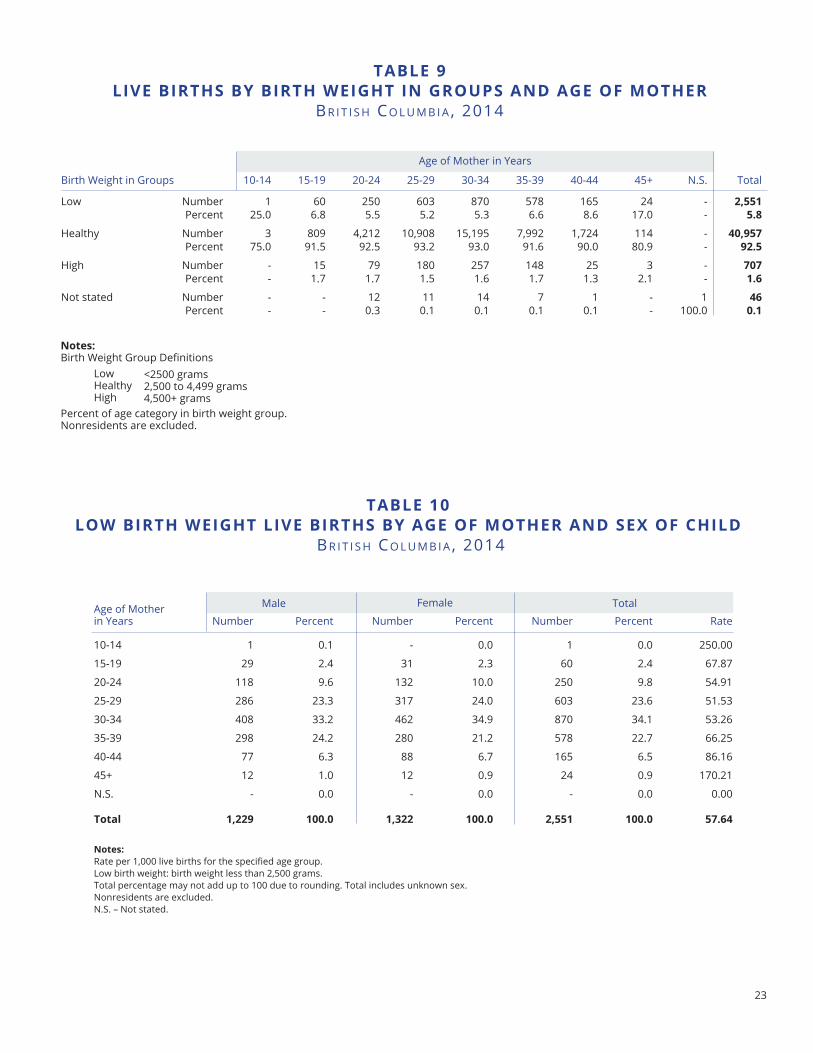
Birth Weight in Groups 10-14 15-19 20-24 25-29 30-34 35-39 40-44 45+ N.S. Total
Low Number 1 60 250 603 870 578 165 24 - 2,551Percent 25.0 6.8 5.5 5.2 5.3 6.6 8.6 17.0 - 5.8
Healthy Number 3 809 4,212 10,908 15,195 7,992 1,724 114 - 40,957Percent 75.0 91.5 92.5 93.2 93.0 91.6 90.0 80.9 - 92.5
High Number - 15 79 180 257 148 25 3 - 707Percent - 1.7 1.7 1.5 1.6 1.7 1.3 2.1 - 1.6
Not stated Number - - 12 11 14 7 1 - 1 46Percent - - 0.3 0.1 0.1 0.1 0.1 - 100.0 0.1
Age of Mother in Years
Number Percent Number Percent Number Percent Rate
10-14 1 0.1 - 0.0 1 0.0 250.00
15-19 29 2.4 31 2.3 60 2.4 67.87
20-24 118 9.6 132 10.0 250 9.8 54.91
25-29 286 23.3 317 24.0 603 23.6 51.53
30-34 408 33.2 462 34.9 870 34.1 53.26
35-39 298 24.2 280 21.2 578 22.7 66.25
40-44 77 6.3 88 6.7 165 6.5 86.16
45+ 12 1.0 12 0.9 24 0.9 170.21
N.S. - 0.0 - 0.0 - 0.0 0.00
total 1,229 100.0 1,322 100.0 2,551 100.0 57.64
notes:Rate per 1,000 live births for the specified age group.Low birth weight: birth weight less than 2,500 grams.Total percentage may not add up to 100 due to rounding. Total includes unknown sex.Nonresidents are excluded.N.S. – Not stated.
Male Female Total
notes:Birth Weight Group Definitions Low Healthy High Percent of age category in birth weight group.Nonresidents are excluded.
Age of Mother in Years
24
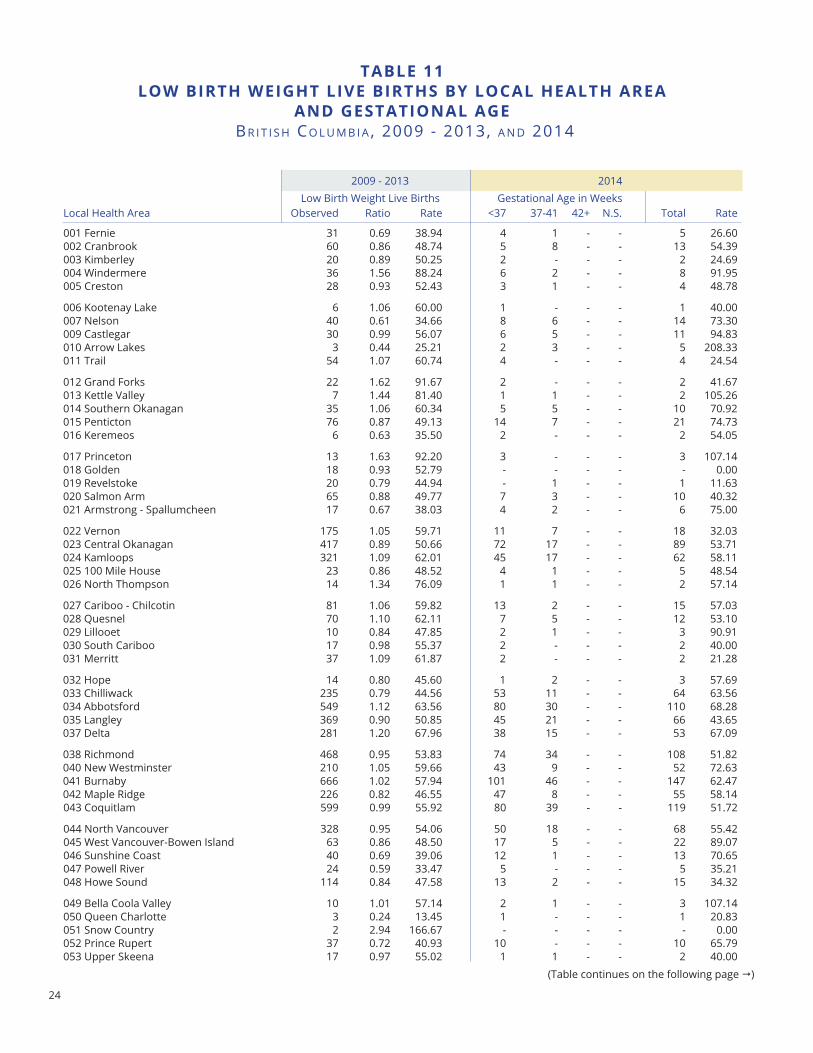
taBle 11loW BIrtH WeIGHt lIVe BIrtHS BY loCal HealtH area
anD GeStatIonal aGe BR I t I S h Co L u M B I A , 2009 - 2013, A n d 2014
(Table continues on the following page )
20142009 - 2013Low Birth Weight Live Births Gestational Age in Weeks
Local Health Area Observed Ratio Rate <37 37-41 42+ N.S. Total Rate
001 Fernie 31 0.69 38.94 4 1 - - 5 26.60002 Cranbrook 60 0.86 48.74 5 8 - - 13 54.39003 Kimberley 20 0.89 50.25 2 - - - 2 24.69004 Windermere 36 1.56 88.24 6 2 - - 8 91.95005 Creston 28 0.93 52.43 3 1 - - 4 48.78
006 Kootenay Lake 6 1.06 60.00 1 - - - 1 40.00007 Nelson 40 0.61 34.66 8 6 - - 14 73.30009 Castlegar 30 0.99 56.07 6 5 - - 11 94.83010 Arrow Lakes 3 0.44 25.21 2 3 - - 5 208.33011 Trail 54 1.07 60.74 4 - - - 4 24.54
012 Grand Forks 22 1.62 91.67 2 - - - 2 41.67013 Kettle Valley 7 1.44 81.40 1 1 - - 2 105.26014 Southern Okanagan 35 1.06 60.34 5 5 - - 10 70.92015 Penticton 76 0.87 49.13 14 7 - - 21 74.73016 Keremeos 6 0.63 35.50 2 - - - 2 54.05
017 Princeton 13 1.63 92.20 3 - - - 3 107.14018 Golden 18 0.93 52.79 - - - - - 0.00019 Revelstoke 20 0.79 44.94 - 1 - - 1 11.63020 Salmon Arm 65 0.88 49.77 7 3 - - 10 40.32021 Armstrong - Spallumcheen 17 0.67 38.03 4 2 - - 6 75.00
022 Vernon 175 1.05 59.71 11 7 - - 18 32.03023 Central Okanagan 417 0.89 50.66 72 17 - - 89 53.71024 Kamloops 321 1.09 62.01 45 17 - - 62 58.11025 100 Mile House 23 0.86 48.52 4 1 - - 5 48.54026 North Thompson 14 1.34 76.09 1 1 - - 2 57.14
027 Cariboo - Chilcotin 81 1.06 59.82 13 2 - - 15 57.03028 Quesnel 70 1.10 62.11 7 5 - - 12 53.10029 Lillooet 10 0.84 47.85 2 1 - - 3 90.91030 South Cariboo 17 0.98 55.37 2 - - - 2 40.00031 Merritt 37 1.09 61.87 2 - - - 2 21.28
032 Hope 14 0.80 45.60 1 2 - - 3 57.69033 Chilliwack 235 0.79 44.56 53 11 - - 64 63.56034 Abbotsford 549 1.12 63.56 80 30 - - 110 68.28035 Langley 369 0.90 50.85 45 21 - - 66 43.65037 Delta 281 1.20 67.96 38 15 - - 53 67.09
038 Richmond 468 0.95 53.83 74 34 - - 108 51.82040 New Westminster 210 1.05 59.66 43 9 - - 52 72.63041 Burnaby 666 1.02 57.94 101 46 - - 147 62.47042 Maple Ridge 226 0.82 46.55 47 8 - - 55 58.14043 Coquitlam 599 0.99 55.92 80 39 - - 119 51.72
044 North Vancouver 328 0.95 54.06 50 18 - - 68 55.42045 West Vancouver-Bowen Island 63 0.86 48.50 17 5 - - 22 89.07046 Sunshine Coast 40 0.69 39.06 12 1 - - 13 70.65047 Powell River 24 0.59 33.47 5 - - - 5 35.21048 Howe Sound 114 0.84 47.58 13 2 - - 15 34.32
049 Bella Coola Valley 10 1.01 57.14 2 1 - - 3 107.14050 Queen Charlotte 3 0.24 13.45 1 - - - 1 20.83051 Snow Country 2 2.94 166.67 - - - - - 0.00052 Prince Rupert 37 0.72 40.93 10 - - - 10 65.79053 Upper Skeena 17 0.97 55.02 1 1 - - 2 40.00
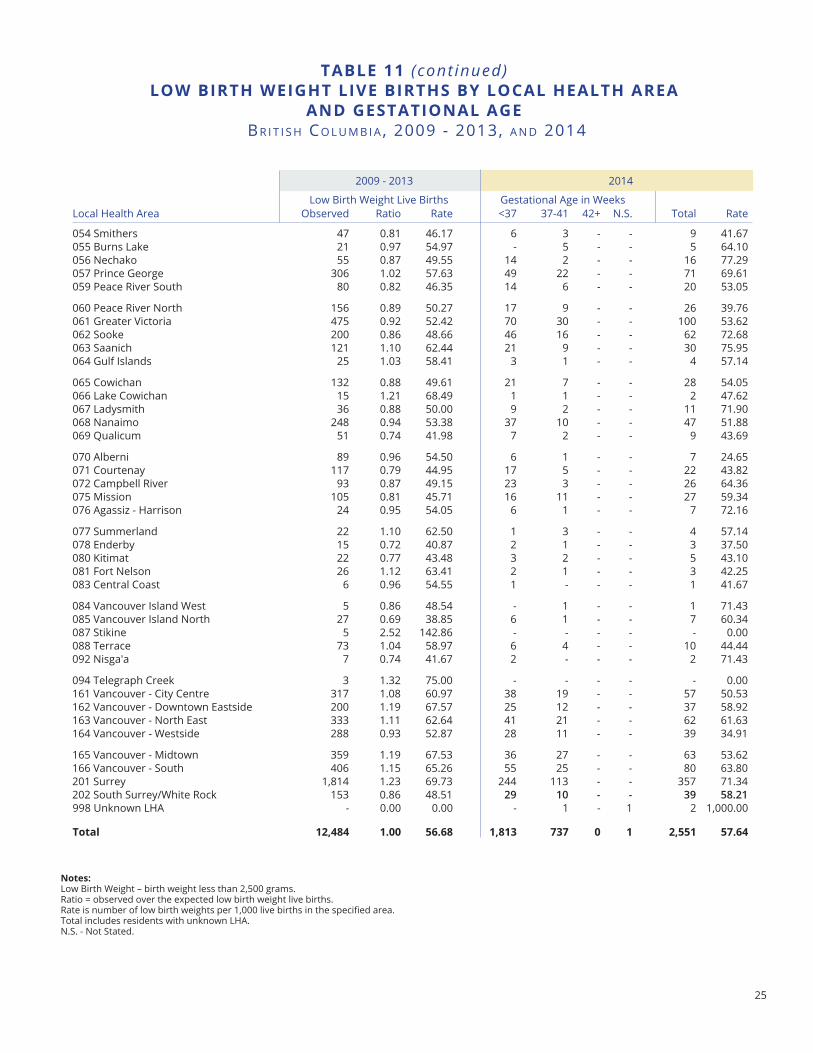
25
taBle 11 (cont inued)loW BIrtH WeIGHt lIVe BIrtHS BY loCal HealtH area
anD GeStatIonal aGe BR I t I S h Co L u M B I A , 2009 - 2013, A n d 2014
notes:Low Birth Weight – birth weight less than 2,500 grams. Ratio = observed over the expected low birth weight live births.Rate is number of low birth weights per 1,000 live births in the specified area.Total includes residents with unknown LHA.N.S. - Not Stated.
Local Health Area Observed Ratio Rate <37 37-41 42+ N.S. Total Rate
054 Smithers 47 0.81 46.17 6 3 - - 9 41.67055 Burns Lake 21 0.97 54.97 - 5 - - 5 64.10056 Nechako 55 0.87 49.55 14 2 - - 16 77.29057 Prince George 306 1.02 57.63 49 22 - - 71 69.61059 Peace River South 80 0.82 46.35 14 6 - - 20 53.05
060 Peace River North 156 0.89 50.27 17 9 - - 26 39.76061 Greater Victoria 475 0.92 52.42 70 30 - - 100 53.62062 Sooke 200 0.86 48.66 46 16 - - 62 72.68063 Saanich 121 1.10 62.44 21 9 - - 30 75.95064 Gulf Islands 25 1.03 58.41 3 1 - - 4 57.14
065 Cowichan 132 0.88 49.61 21 7 - - 28 54.05066 Lake Cowichan 15 1.21 68.49 1 1 - - 2 47.62067 Ladysmith 36 0.88 50.00 9 2 - - 11 71.90068 Nanaimo 248 0.94 53.38 37 10 - - 47 51.88069 Qualicum 51 0.74 41.98 7 2 - - 9 43.69
070 Alberni 89 0.96 54.50 6 1 - - 7 24.65071 Courtenay 117 0.79 44.95 17 5 - - 22 43.82072 Campbell River 93 0.87 49.15 23 3 - - 26 64.36075 Mission 105 0.81 45.71 16 11 - - 27 59.34076 Agassiz - Harrison 24 0.95 54.05 6 1 - - 7 72.16
077 Summerland 22 1.10 62.50 1 3 - - 4 57.14078 Enderby 15 0.72 40.87 2 1 - - 3 37.50080 Kitimat 22 0.77 43.48 3 2 - - 5 43.10081 Fort Nelson 26 1.12 63.41 2 1 - - 3 42.25083 Central Coast 6 0.96 54.55 1 - - - 1 41.67
084 Vancouver Island West 5 0.86 48.54 - 1 - - 1 71.43085 Vancouver Island North 27 0.69 38.85 6 1 - - 7 60.34087 Stikine 5 2.52 142.86 - - - - - 0.00088 Terrace 73 1.04 58.97 6 4 - - 10 44.44092 Nisga'a 7 0.74 41.67 2 - - - 2 71.43
094 Telegraph Creek 3 1.32 75.00 - - - - - 0.00161 Vancouver - City Centre 317 1.08 60.97 38 19 - - 57 50.53162 Vancouver - Downtown Eastside 200 1.19 67.57 25 12 - - 37 58.92163 Vancouver - North East 333 1.11 62.64 41 21 - - 62 61.63164 Vancouver - Westside 288 0.93 52.87 28 11 - - 39 34.91
165 Vancouver - Midtown 359 1.19 67.53 36 27 - - 63 53.62166 Vancouver - South 406 1.15 65.26 55 25 - - 80 63.80201 Surrey 1,814 1.23 69.73 244 113 - - 357 71.34202 South Surrey/White Rock 153 0.86 48.51 29 10 - - 39 58.21998 Unknown LHA - 0.00 0.00 - 1 - 1 2 1,000.00
total 12,484 1.00 56.68 1,813 737 0 1 2,551 57.64
20142009 - 2013
Low Birth Weight Live Births Gestational Age in Weeks
26
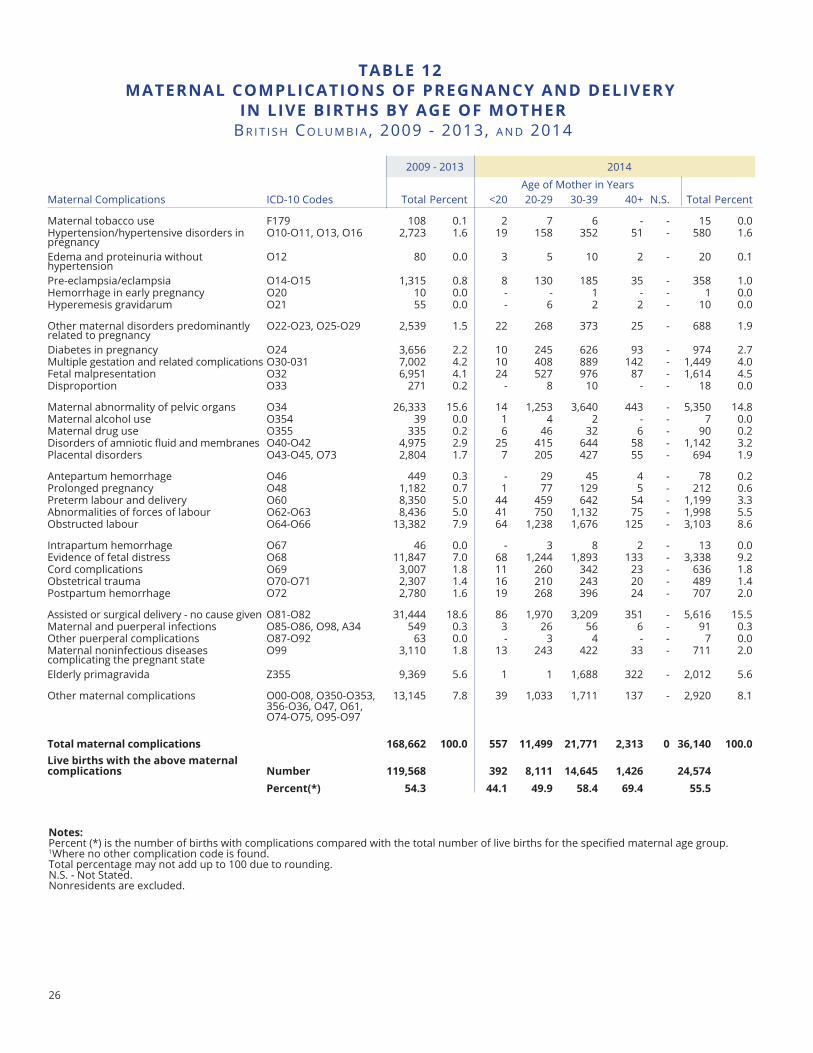
taBle 12maternal ComPlICatIonS of PreGnanCY anD DelIVerY
In lIVe BIrtHS BY aGe of motHer BR I t I S h Co L u M B I A , 2009 - 2013, A n d 2014
Age of Mother in Years
20142009 - 2013
Maternal Complications ICD-10 Codes Total Percent <20 20-29 30-39 40+ N.S. Total Percent
Maternal tobacco use F179 108 0.1 2 7 6 - - 15 0.0Hypertension/hypertensive disorders in pregnancy
O10-O11, O13, O16 2,723 1.6 19 158 352 51 - 580 1.6
Edema and proteinuria without hypertension
O12 80 0.0 3 5 10 2 - 20 0.1
Pre-eclampsia/eclampsia O14-O15 1,315 0.8 8 130 185 35 - 358 1.0Hemorrhage in early pregnancy O20 10 0.0 - - 1 - - 1 0.0Hyperemesis gravidarum O21 55 0.0 - 6 2 2 - 10 0.0
Other maternal disorders predominantly related to pregnancy
O22-O23, O25-O29 2,539 1.5 22 268 373 25 - 688 1.9
Diabetes in pregnancy O24 3,656 2.2 10 245 626 93 - 974 2.7Multiple gestation and related complications O30-031 7,002 4.2 10 408 889 142 - 1,449 4.0Fetal malpresentation O32 6,951 4.1 24 527 976 87 - 1,614 4.5Disproportion O33 271 0.2 - 8 10 - - 18 0.0
Maternal abnormality of pelvic organs O34 26,333 15.6 14 1,253 3,640 443 - 5,350 14.8Maternal alcohol use O354 39 0.0 1 4 2 - - 7 0.0Maternal drug use O355 335 0.2 6 46 32 6 - 90 0.2Disorders of amniotic fluid and membranes O40-O42 4,975 2.9 25 415 644 58 - 1,142 3.2Placental disorders O43-O45, O73 2,804 1.7 7 205 427 55 - 694 1.9
Antepartum hemorrhage O46 449 0.3 - 29 45 4 - 78 0.2Prolonged pregnancy O48 1,182 0.7 1 77 129 5 - 212 0.6Preterm labour and delivery O60 8,350 5.0 44 459 642 54 - 1,199 3.3Abnormalities of forces of labour O62-O63 8,436 5.0 41 750 1,132 75 - 1,998 5.5Obstructed labour O64-O66 13,382 7.9 64 1,238 1,676 125 - 3,103 8.6
Intrapartum hemorrhage O67 46 0.0 - 3 8 2 - 13 0.0Evidence of fetal distress O68 11,847 7.0 68 1,244 1,893 133 - 3,338 9.2Cord complications O69 3,007 1.8 11 260 342 23 - 636 1.8Obstetrical trauma O70-O71 2,307 1.4 16 210 243 20 - 489 1.4Postpartum hemorrhage O72 2,780 1.6 19 268 396 24 - 707 2.0
Assisted or surgical delivery - no cause given O81-O82 31,444 18.6 86 1,970 3,209 351 - 5,616 15.5Maternal and puerperal infections O85-O86, O98, A34 549 0.3 3 26 56 6 - 91 0.3Other puerperal complications O87-O92 63 0.0 - 3 4 - - 7 0.0Maternal noninfectious diseases complicating the pregnant state
O99 3,110 1.8 13 243 422 33 - 711 2.0
Elderly primagravida Z355 9,369 5.6 1 1 1,688 322 - 2,012 5.6
Other maternal complications O00-O08, O350-O353, 356-O36, O47, O61, O74-O75, O95-O97
13,145 7.8 39 1,033 1,711 137 - 2,920 8.1
total maternal complications 168,662 100.0 557 11,499 21,771 2,313 0 36,140 100.0live births with the above maternal complications number 119,568 392 8,111 14,645 1,426 24,574
Percent(*) 54.3 44.1 49.9 58.4 69.4 55.5
notes:Percent (*) is the number of births with complications compared with the total number of live births for the specified maternal age group.1Where no other complication code is found.Total percentage may not add up to 100 due to rounding. N.S. - Not Stated.Nonresidents are excluded.
27
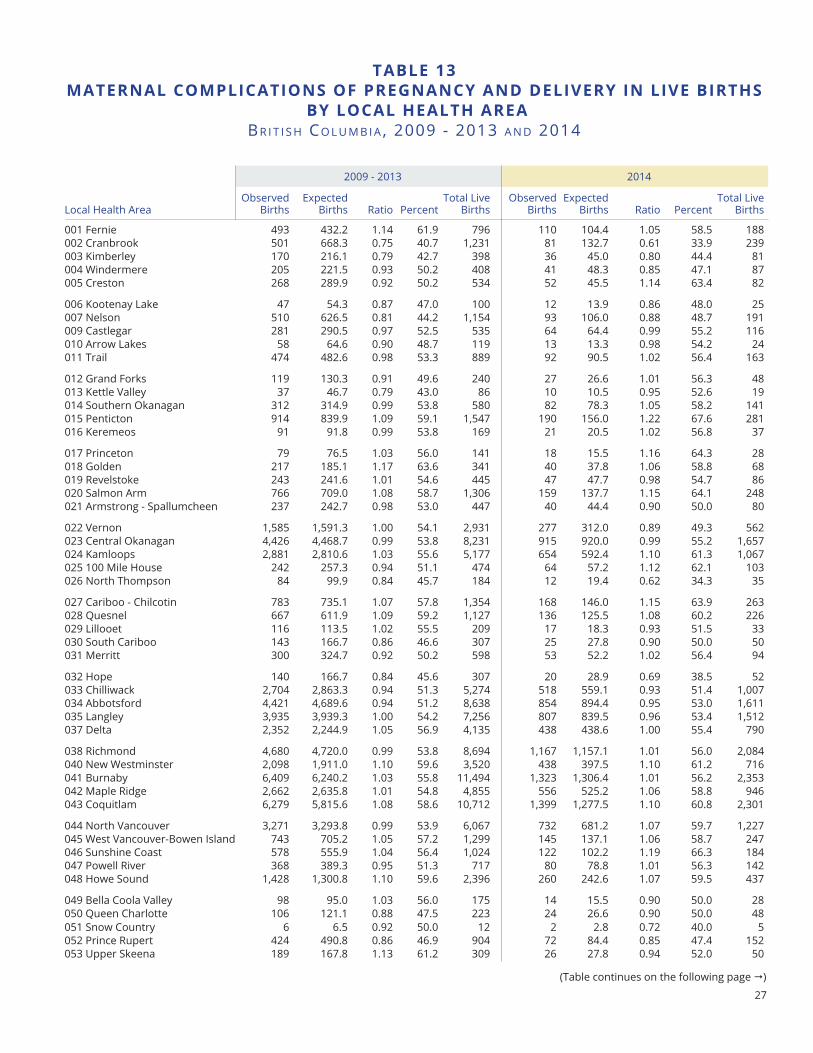
taBle 13maternal ComPlICatIonS of PreGnanCY anD DelIVerY In lIVe BIrtHS
BY loCal HealtH areaBR I t I S h Co L u M B I A , 2009 - 2013 A n d 2014
(Table continues on the following page )
20142009 - 2013
Local Health AreaObserved
BirthsExpected
Births Ratio PercentTotal Live
BirthsObserved
BirthsExpected
Births Ratio PercentTotal Live
Births
001 Fernie 493 432.2 1.14 61.9 796 110 104.4 1.05 58.5 188002 Cranbrook 501 668.3 0.75 40.7 1,231 81 132.7 0.61 33.9 239003 Kimberley 170 216.1 0.79 42.7 398 36 45.0 0.80 44.4 81004 Windermere 205 221.5 0.93 50.2 408 41 48.3 0.85 47.1 87005 Creston 268 289.9 0.92 50.2 534 52 45.5 1.14 63.4 82
006 Kootenay Lake 47 54.3 0.87 47.0 100 12 13.9 0.86 48.0 25007 Nelson 510 626.5 0.81 44.2 1,154 93 106.0 0.88 48.7 191009 Castlegar 281 290.5 0.97 52.5 535 64 64.4 0.99 55.2 116010 Arrow Lakes 58 64.6 0.90 48.7 119 13 13.3 0.98 54.2 24011 Trail 474 482.6 0.98 53.3 889 92 90.5 1.02 56.4 163
012 Grand Forks 119 130.3 0.91 49.6 240 27 26.6 1.01 56.3 48013 Kettle Valley 37 46.7 0.79 43.0 86 10 10.5 0.95 52.6 19014 Southern Okanagan 312 314.9 0.99 53.8 580 82 78.3 1.05 58.2 141015 Penticton 914 839.9 1.09 59.1 1,547 190 156.0 1.22 67.6 281016 Keremeos 91 91.8 0.99 53.8 169 21 20.5 1.02 56.8 37
017 Princeton 79 76.5 1.03 56.0 141 18 15.5 1.16 64.3 28018 Golden 217 185.1 1.17 63.6 341 40 37.8 1.06 58.8 68019 Revelstoke 243 241.6 1.01 54.6 445 47 47.7 0.98 54.7 86020 Salmon Arm 766 709.0 1.08 58.7 1,306 159 137.7 1.15 64.1 248021 Armstrong - Spallumcheen 237 242.7 0.98 53.0 447 40 44.4 0.90 50.0 80
022 Vernon 1,585 1,591.3 1.00 54.1 2,931 277 312.0 0.89 49.3 562023 Central Okanagan 4,426 4,468.7 0.99 53.8 8,231 915 920.0 0.99 55.2 1,657024 Kamloops 2,881 2,810.6 1.03 55.6 5,177 654 592.4 1.10 61.3 1,067025 100 Mile House 242 257.3 0.94 51.1 474 64 57.2 1.12 62.1 103026 North Thompson 84 99.9 0.84 45.7 184 12 19.4 0.62 34.3 35
027 Cariboo - Chilcotin 783 735.1 1.07 57.8 1,354 168 146.0 1.15 63.9 263028 Quesnel 667 611.9 1.09 59.2 1,127 136 125.5 1.08 60.2 226029 Lillooet 116 113.5 1.02 55.5 209 17 18.3 0.93 51.5 33030 South Cariboo 143 166.7 0.86 46.6 307 25 27.8 0.90 50.0 50031 Merritt 300 324.7 0.92 50.2 598 53 52.2 1.02 56.4 94
032 Hope 140 166.7 0.84 45.6 307 20 28.9 0.69 38.5 52033 Chilliwack 2,704 2,863.3 0.94 51.3 5,274 518 559.1 0.93 51.4 1,007034 Abbotsford 4,421 4,689.6 0.94 51.2 8,638 854 894.4 0.95 53.0 1,611035 Langley 3,935 3,939.3 1.00 54.2 7,256 807 839.5 0.96 53.4 1,512037 Delta 2,352 2,244.9 1.05 56.9 4,135 438 438.6 1.00 55.4 790
038 Richmond 4,680 4,720.0 0.99 53.8 8,694 1,167 1,157.1 1.01 56.0 2,084040 New Westminster 2,098 1,911.0 1.10 59.6 3,520 438 397.5 1.10 61.2 716041 Burnaby 6,409 6,240.2 1.03 55.8 11,494 1,323 1,306.4 1.01 56.2 2,353042 Maple Ridge 2,662 2,635.8 1.01 54.8 4,855 556 525.2 1.06 58.8 946043 Coquitlam 6,279 5,815.6 1.08 58.6 10,712 1,399 1,277.5 1.10 60.8 2,301
044 North Vancouver 3,271 3,293.8 0.99 53.9 6,067 732 681.2 1.07 59.7 1,227045 West Vancouver-Bowen Island 743 705.2 1.05 57.2 1,299 145 137.1 1.06 58.7 247046 Sunshine Coast 578 555.9 1.04 56.4 1,024 122 102.2 1.19 66.3 184047 Powell River 368 389.3 0.95 51.3 717 80 78.8 1.01 56.3 142048 Howe Sound 1,428 1,300.8 1.10 59.6 2,396 260 242.6 1.07 59.5 437
049 Bella Coola Valley 98 95.0 1.03 56.0 175 14 15.5 0.90 50.0 28050 Queen Charlotte 106 121.1 0.88 47.5 223 24 26.6 0.90 50.0 48051 Snow Country 6 6.5 0.92 50.0 12 2 2.8 0.72 40.0 5052 Prince Rupert 424 490.8 0.86 46.9 904 72 84.4 0.85 47.4 152053 Upper Skeena 189 167.8 1.13 61.2 309 26 27.8 0.94 52.0 50
28
taBle 13 (continued)maternal ComPlICatIonS of PreGnanCY anD DelIVerY In lIVe BIrtHS
BY loCal HealtH area BR I t I S h Co L u M B I A , 2009 - 2013 A n d 2014
Local Health AreaObserved
BirthsExpected
Births Ratio PercentTotal Live
BirthsObserved
BirthsExpected
Births Ratio PercentTotal Live
Births
054 Smithers 460 552.7 0.83 45.2 1,018 106 119.9 0.88 49.1 216055 Burns Lake 183 207.4 0.88 47.9 382 39 43.3 0.90 50.0 78056 Nechako 606 602.6 1.01 54.6 1,110 115 114.9 1.00 55.6 207057 Prince George 2,614 2,882.8 0.91 49.2 5,310 539 566.3 0.95 52.8 1,020059 Peace River South 855 937.1 0.91 49.5 1,726 218 209.3 1.04 57.8 377
060 Peace River North 1,356 1,684.6 0.80 43.7 3,103 312 363.1 0.86 47.7 654061 Greater Victoria 4,863 4,919.3 0.99 53.7 9,061 1,030 1,035.5 0.99 55.2 1,865062 Sooke 2,195 2,231.3 0.98 53.4 4,110 488 473.6 1.03 57.2 853063 Saanich 953 1,052.2 0.91 49.2 1,938 214 219.3 0.98 54.2 395064 Gulf Islands 181 232.4 0.78 42.3 428 41 38.9 1.05 58.6 70
065 Cowichan 1,212 1,444.7 0.84 45.5 2,661 245 287.6 0.85 47.3 518066 Lake Cowichan 103 118.9 0.87 47.0 219 20 23.3 0.86 47.6 42067 Ladysmith 360 390.9 0.92 50.0 720 86 84.9 1.01 56.2 153068 Nanaimo 2,693 2,522.3 1.07 58.0 4,646 518 503.0 1.03 57.2 906069 Qualicum 695 659.6 1.05 57.2 1,215 116 114.4 1.01 56.3 206
070 Alberni 912 886.6 1.03 55.8 1,633 179 157.7 1.14 63.0 284071 Courtenay 1,357 1,413.2 0.96 52.1 2,603 267 278.7 0.96 53.2 502072 Campbell River 1,120 1,027.2 1.09 59.2 1,892 218 224.3 0.97 54.0 404075 Mission 1,198 1,247.1 0.96 52.2 2,297 243 252.6 0.96 53.4 455076 Agassiz - Harrison 215 241.1 0.89 48.4 444 49 53.9 0.91 50.5 97
077 Summerland 201 191.1 1.05 57.1 352 47 38.9 1.21 67.1 70078 Enderby 183 199.2 0.92 49.9 367 49 44.4 1.10 61.3 80080 Kitimat 261 274.7 0.95 51.6 506 47 64.4 0.73 40.5 116081 Fort Nelson 204 222.6 0.92 49.8 410 37 39.4 0.94 52.1 71083 Central Coast 59 59.7 0.99 53.6 110 12 13.3 0.90 50.0 24
084 Vancouver Island West 61 55.9 1.09 59.2 103 7 7.8 0.90 50.0 14085 Vancouver Island North 355 377.3 0.94 51.1 695 54 64.4 0.84 46.6 116087 Stikine 20 19.0 1.05 57.1 35 4 5.0 0.80 44.4 9088 Terrace 552 672.1 0.82 44.6 1,238 104 124.9 0.83 46.2 225092 Nisga'a 80 91.2 0.88 47.6 168 11 15.5 0.71 39.3 28
094 Telegraph Creek 16 21.7 0.74 40.0 40 4 4.4 0.90 50.0 8161 Vancouver - City Centre 3,294 2,822.6 1.17 63.4 5,199 693 626.3 1.11 61.4 1,128162 Vancouver - Dwntwn Eastside 1,674 1,607.0 1.04 56.6 2,960 380 348.7 1.09 60.5 628163 Vancouver - North East 2,918 2,886.1 1.01 54.9 5,316 541 558.5 0.97 53.8 1,006164 Vancouver - Westside 3,023 2,957.2 1.02 55.5 5,447 617 620.2 0.99 55.2 1,117
165 Vancouver - Midtown 3,023 2,886.1 1.05 56.9 5,316 647 652.4 0.99 55.1 1,175166 Vancouver - South 3,439 3,377.4 1.02 55.3 6,221 660 696.2 0.95 52.6 1,254201 Surrey 14,259 14,122.6 1.01 54.8 26,013 2,709 2,778.3 0.98 54.1 5,004202 South Surrey/White Rock 1,674 1,712.3 0.98 53.1 3,154 361 372.0 0.97 53.9 670998 Unknown LHA 1 1.1 0.92 50.0 2 1 1.1 0.90 50.0 2
total 119,568 119,568.0 1.00 54.3 220,237 24,574 24,574.0 1.00 55.5 44,261
20142009 - 2013
notes:Ratio = Observed births divided by expected births.Percent of observed births is based on total live births.Total include residents with unknown LHA.Nonresidents are excluded.
29
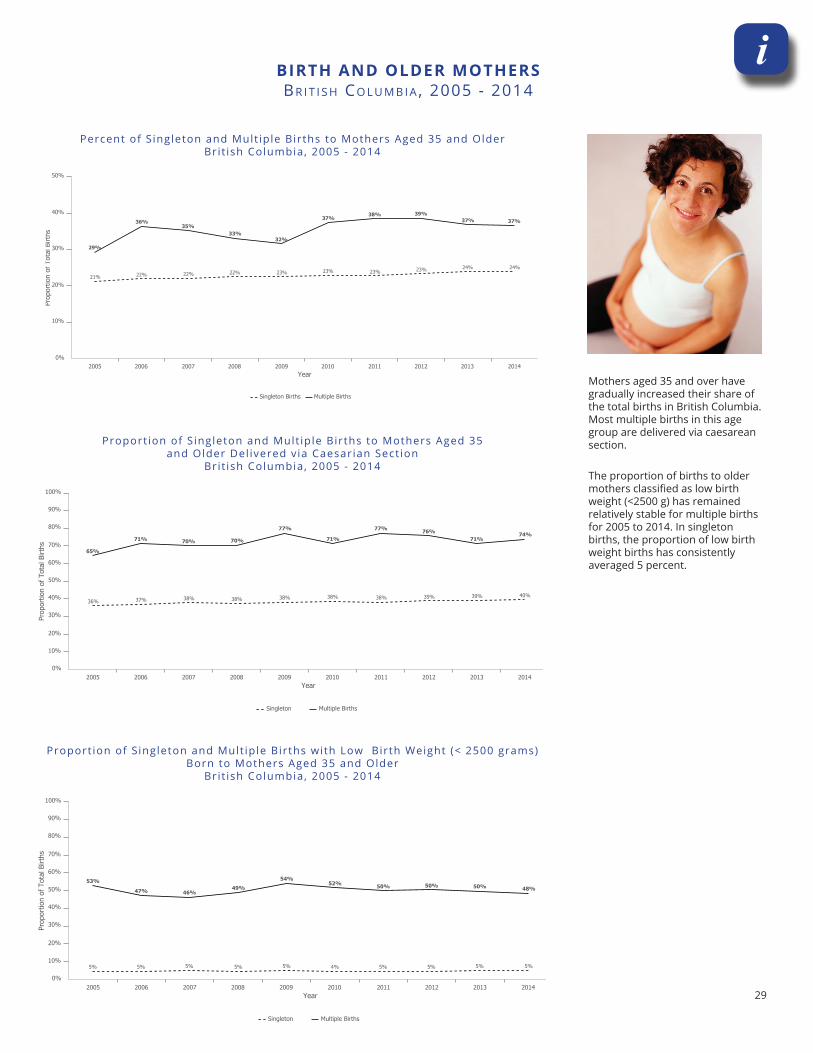
iBIrtH anD olDer motHerS BR I t I S h Co L u M B I A , 2005 - 2014
Mothers aged 35 and over have gradually increased their share of the total births in British Columbia. Most multiple births in this age group are delivered via caesarean section.
The proportion of births to older mothers classified as low birth weight (<2500 g) has remained relatively stable for multiple births for 2005 to 2014. In singleton births, the proportion of low birth weight births has consistently averaged 5 percent.
Percent of Singleton and Mult iple Births to Mothers Aged 35 and OlderBrit ish Columbia, 2005 - 2014
Birth and Older Mothers 01 All
1/1
0%
10%
20%
30%
40%
50%
21% 22% 22% 22% 23% 23% 23% 23% 24% 24%
29%
36%35%
33%32%
37%38% 39%
37% 37%
2005 2006 2007 2008 2009 2010 2011 2012 2013 2014
Singleton Births Multiple Births
Year
Prop
ortio
n of
Tot
al B
irths
Proportion of Singleton and Multiple Births to Mothers Aged 35 and Older
British Columbia, 2005 -2014
EventYear Metrics Singleton
BirthsMultipleBirths
2005200620072008200920102011201220132014
21% 29%22% 36%22% 35%22% 33%23% 32%23% 37%23% 38%23% 39%24% 37%24% 37%
Proport ion of Singleton and Mult iple Births to Mothers Aged 35 and Older Del ivered via Caesarian Sect ion
Brit ish Columbia, 2005 - 2014
Birth and Older Mothers 02 C-Section
1/1
0%
10%
20%
30%
40%
50%
60%
70%
80%
90%
100%
36% 37% 38% 38% 38% 38% 38% 39% 39% 40%
65%
71% 70% 70%
77%
71%
77% 76%71%
74%
2005 2006 2007 2008 2009 2010 2011 2012 2013 2014
Singleton Multiple Births
Year
Prop
ortio
n of
Tot
al B
irths
Proportion of Singleton and Multiple Births to Mothers Aged 35 and Older Birthed Via CesarianSection
British Columbia, 2005 - 2014
EventYear Metrics Singleton
MultipleBirths
2005200620072008200920102011201220132014
36% 65%37% 71%38% 70%38% 70%38% 77%38% 71%38% 77%39% 76%39% 71%40% 74%
Proport ion of Singleton and Mult iple Births with Low Birth Weight (< 2500 grams)Born to Mothers Aged 35 and Older
Brit ish Columbia, 2005 - 2014
Birth and Older Mothers 03 LBW
1/1
0%
10%
20%
30%
40%
50%
60%
70%
80%
90%
100%
5% 5% 5% 5% 5% 4% 5% 5% 5% 5%
53%
47% 46%49%
54%52% 50% 50% 50% 48%
2005 2006 2007 2008 2009 2010 2011 2012 2013 2014
Singleton Multiple Births
Year
Prop
ortio
n of
Tot
al B
irths
Proportion of Singleton and Multiple Births to Mothers Aged 35 and Older With Low Birth Weight(<2500 Grams)
British Columbia, 2005 - 2014
EventYear Metrics Singleton
MultipleBirths
2005200620072008200920102011201220132014
5% 53%5% 47%5% 46%5% 49%5% 54%4% 52%5% 50%5% 50%5% 50%5% 48%

30
31
The tables in this section present death statistics categorized by causes of death and age at death.
Death-RelatedStatistics

32
33
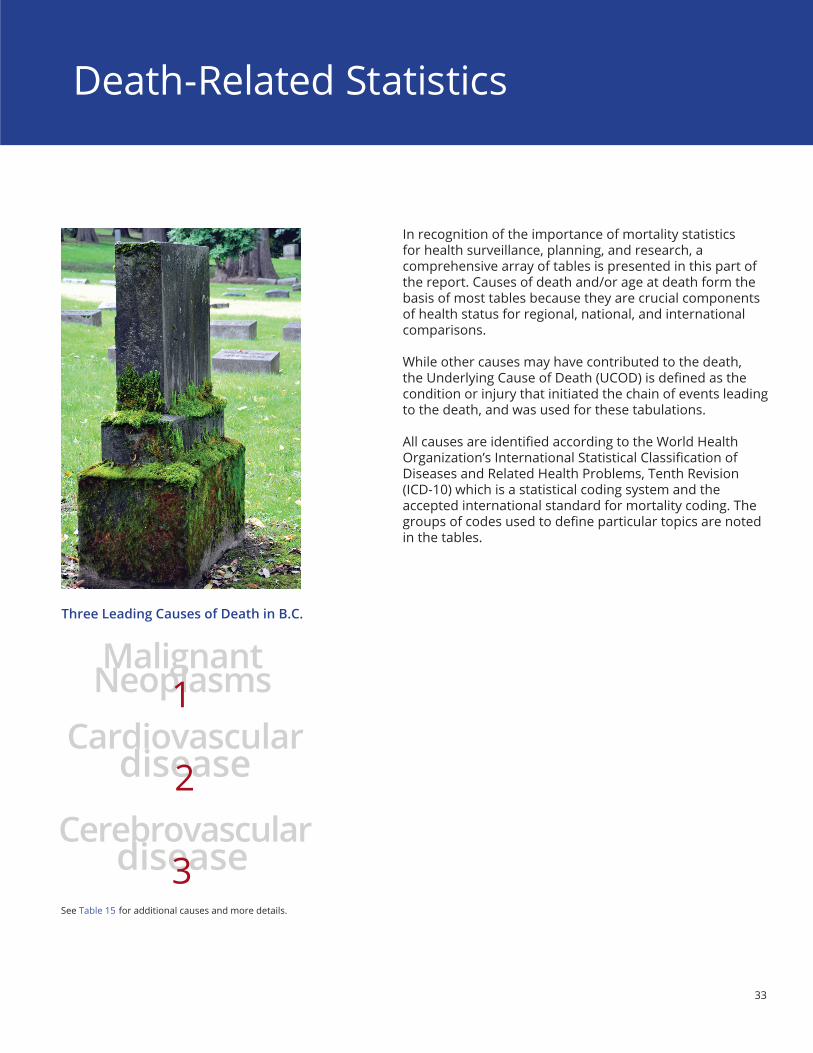
In recognition of the importance of mortality statistics for health surveillance, planning, and research, a comprehensive array of tables is presented in this part of the report. Causes of death and/or age at death form the basis of most tables because they are crucial components of health status for regional, national, and international comparisons.
While other causes may have contributed to the death, the Underlying Cause of Death (UCOD) is defined as the condition or injury that initiated the chain of events leading to the death, and was used for these tabulations.
All causes are identified according to the World Health Organization’s International Statistical Classification of Diseases and Related Health Problems, Tenth Revision (ICD-10) which is a statistical coding system and the accepted international standard for mortality coding. The groups of codes used to define particular topics are noted in the tables.
Death-Related Statistics
Cardiovasculardisease2
Cerebrovasculardisease3
Three Leading Causes of Death in B.C.
See Table 15 for additional causes and more details.
Malignant Neoplasms1
34
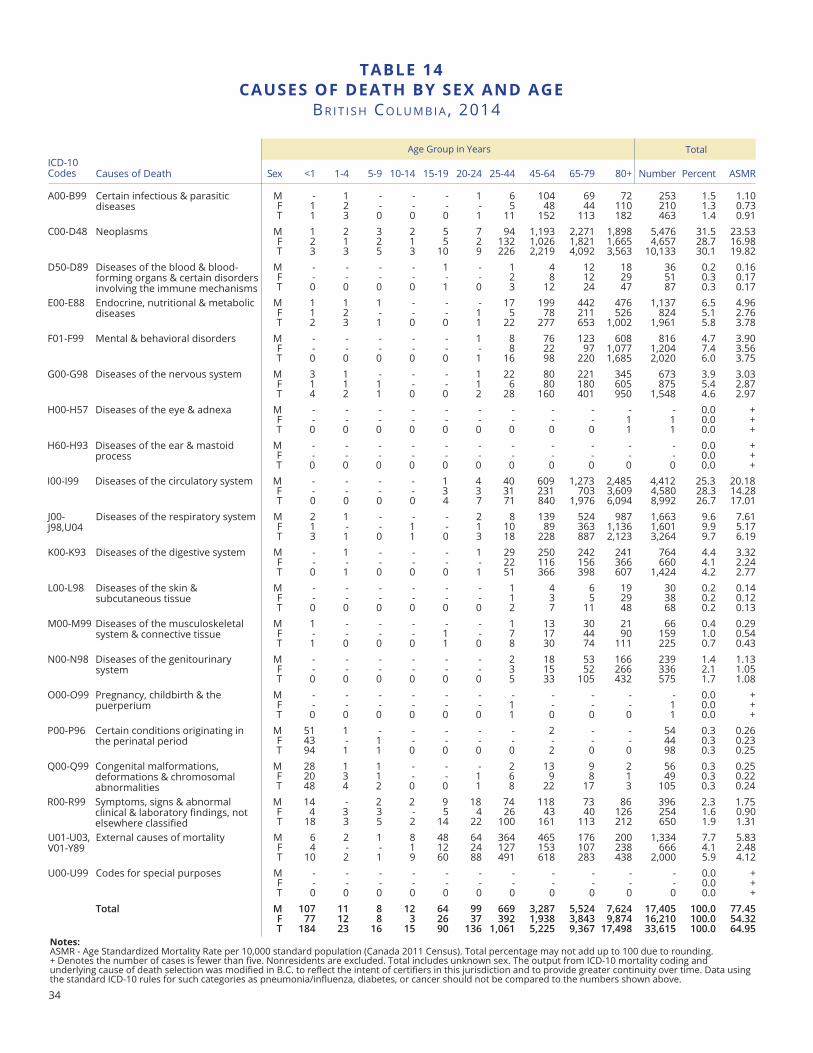
taBle 14CaUSeS of DeatH BY SeX anD aGe
BR I t I S h Co L u M B I A , 2014
notes: ASMR - Age Standardized Mortality Rate per 10,000 standard population (Canada 2011 Census). Total percentage may not add up to 100 due to rounding. + Denotes the number of cases is fewer than five. Nonresidents are excluded. Total includes unknown sex. The output from ICD-10 mortality coding and underlying cause of death selection was modified in B.C. to reflect the intent of certifiers in this jurisdiction and to provide greater continuity over time. Data using the standard ICD-10 rules for such categories as pneumonia/influenza, diabetes, or cancer should not be compared to the numbers shown above.
Age Group in Years TotalICD-10Codes Causes of Death Sex <1 1-4 5-9 10-14 15-19 20-24 25-44 45-64 65-79 80+ Number Percent ASMR
A00-B99 Certain infectious & parasitic diseases
M - 1 - - - 1 6 104 69 72 253 1.5 1.10F 1 2 - - - - 5 48 44 110 210 1.3 0.73T 1 3 0 0 0 1 11 152 113 182 463 1.4 0.91
C00-D48 Neoplasms M 1 2 3 2 5 7 94 1,193 2,271 1,898 5,476 31.5 23.53F 2 1 2 1 5 2 132 1,026 1,821 1,665 4,657 28.7 16.98T 3 3 5 3 10 9 226 2,219 4,092 3,563 10,133 30.1 19.82
D50-D89 Diseases of the blood & blood-forming organs & certain disorders involving the immune mechanisms
M - - - - 1 - 1 4 12 18 36 0.2 0.16F - - - - - - 2 8 12 29 51 0.3 0.17T 0 0 0 0 1 0 3 12 24 47 87 0.3 0.17
E00-E88 Endocrine, nutritional & metabolic diseases
M 1 1 1 - - - 17 199 442 476 1,137 6.5 4.96F 1 2 - - - 1 5 78 211 526 824 5.1 2.76T 2 3 1 0 0 1 22 277 653 1,002 1,961 5.8 3.78
F01-F99 Mental & behavioral disorders M - - - - - 1 8 76 123 608 816 4.7 3.90F - - - - - - 8 22 97 1,077 1,204 7.4 3.56T 0 0 0 0 0 1 16 98 220 1,685 2,020 6.0 3.75
G00-G98 Diseases of the nervous system M 3 1 - - - 1 22 80 221 345 673 3.9 3.03F 1 1 1 - - 1 6 80 180 605 875 5.4 2.87T 4 2 1 0 0 2 28 160 401 950 1,548 4.6 2.97
H00-H57 Diseases of the eye & adnexa M - - - - - - - - - - - 0.0 +F - - - - - - - - - 1 1 0.0 +T 0 0 0 0 0 0 0 0 0 1 1 0.0 +
H60-H93 Diseases of the ear & mastoid process
M - - - - - - - - - - - 0.0 +F - - - - - - - - - - - 0.0 +T 0 0 0 0 0 0 0 0 0 0 0 0.0 +
I00-I99 Diseases of the circulatory system M - - - - 1 4 40 609 1,273 2,485 4,412 25.3 20.18F - - - - 3 3 31 231 703 3,609 4,580 28.3 14.28T 0 0 0 0 4 7 71 840 1,976 6,094 8,992 26.7 17.01
J00-J98,U04
Diseases of the respiratory system M 2 1 - - - 2 8 139 524 987 1,663 9.6 7.61F 1 - - 1 - 1 10 89 363 1,136 1,601 9.9 5.17T 3 1 0 1 0 3 18 228 887 2,123 3,264 9.7 6.19
K00-K93 Diseases of the digestive system M - 1 - - - 1 29 250 242 241 764 4.4 3.32F - - - - - - 22 116 156 366 660 4.1 2.24T 0 1 0 0 0 1 51 366 398 607 1,424 4.2 2.77
L00-L98 Diseases of the skin & subcutaneous tissue
M - - - - - - 1 4 6 19 30 0.2 0.14F - - - - - - 1 3 5 29 38 0.2 0.12T 0 0 0 0 0 0 2 7 11 48 68 0.2 0.13
M00-M99 Diseases of the musculoskeletal system & connective tissue
M 1 - - - - - 1 13 30 21 66 0.4 0.29F - - - - 1 - 7 17 44 90 159 1.0 0.54T 1 0 0 0 1 0 8 30 74 111 225 0.7 0.43
N00-N98 Diseases of the genitourinary system
M - - - - - - 2 18 53 166 239 1.4 1.13F - - - - - - 3 15 52 266 336 2.1 1.05T 0 0 0 0 0 0 5 33 105 432 575 1.7 1.08
O00-O99 Pregnancy, childbirth & the puerperium
M - - - - - - - - - - - 0.0 +F - - - - - - 1 - - - 1 0.0 +T 0 0 0 0 0 0 1 0 0 0 1 0.0 +
P00-P96 Certain conditions originating in the perinatal period
M 51 1 - - - - - 2 - - 54 0.3 0.26F 43 - 1 - - - - - - - 44 0.3 0.23T 94 1 1 0 0 0 0 2 0 0 98 0.3 0.25
Q00-Q99 Congenital malformations, deformations & chromosomal abnormalities
M 28 1 1 - - - 2 13 9 2 56 0.3 0.25F 20 3 1 - - 1 6 9 8 1 49 0.3 0.22T 48 4 2 0 0 1 8 22 17 3 105 0.3 0.24
R00-R99 Symptoms, signs & abnormal clinical & laboratory findings, not elsewhere classified
M 14 - 2 2 9 18 74 118 73 86 396 2.3 1.75F 4 3 3 - 5 4 26 43 40 126 254 1.6 0.90T 18 3 5 2 14 22 100 161 113 212 650 1.9 1.31
U01-U03, V01-Y89
External causes of mortality M 6 2 1 8 48 64 364 465 176 200 1,334 7.7 5.83F 4 - - 1 12 24 127 153 107 238 666 4.1 2.48T 10 2 1 9 60 88 491 618 283 438 2,000 5.9 4.12
U00-U99 Codes for special purposes M - - - - - - - - - - - 0.0 +F - - - - - - - - - - - 0.0 +T 0 0 0 0 0 0 0 0 0 0 0 0.0 +
Total M 107 11 8 12 64 99 669 3,287 5,524 7,624 17,405 100.0 77.45F 77 12 8 3 26 37 392 1,938 3,843 9,874 16,210 100.0 54.32T 184 23 16 15 90 136 1,061 5,225 9,367 17,498 33,615 100.0 64.95
35
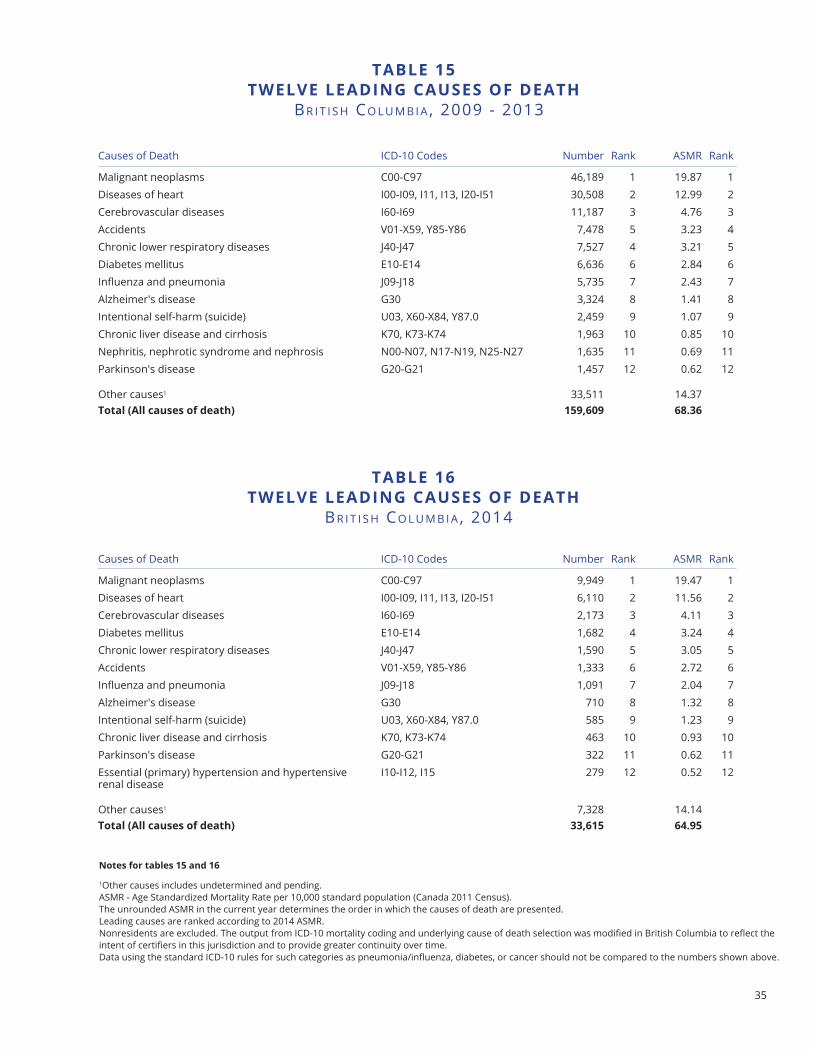
taBle 15tWelVe leaDInG CaUSeS of DeatH
BR I t I S h Co L u M B I A , 2009 - 2013
Causes of Death ICD-10 Codes Number Rank ASMR Rank
Malignant neoplasms C00-C97 46,189 1 19.87 1Diseases of heart I00-I09, I11, I13, I20-I51 30,508 2 12.99 2Cerebrovascular diseases I60-I69 11,187 3 4.76 3Accidents V01-X59, Y85-Y86 7,478 5 3.23 4Chronic lower respiratory diseases J40-J47 7,527 4 3.21 5Diabetes mellitus E10-E14 6,636 6 2.84 6Influenza and pneumonia J09-J18 5,735 7 2.43 7Alzheimer's disease G30 3,324 8 1.41 8Intentional self-harm (suicide) U03, X60-X84, Y87.0 2,459 9 1.07 9Chronic liver disease and cirrhosis K70, K73-K74 1,963 10 0.85 10Nephritis, nephrotic syndrome and nephrosis N00-N07, N17-N19, N25-N27 1,635 11 0.69 11Parkinson's disease G20-G21 1,457 12 0.62 12
Other causes1 33,511 14.37total (all causes of death) 159,609 68.36
notes for tables 15 and 16
1Other causes includes undetermined and pending.ASMR - Age Standardized Mortality Rate per 10,000 standard population (Canada 2011 Census).The unrounded ASMR in the current year determines the order in which the causes of death are presented.Leading causes are ranked according to 2014 ASMR.Nonresidents are excluded. The output from ICD-10 mortality coding and underlying cause of death selection was modified in British Columbia to reflect the intent of certifiers in this jurisdiction and to provide greater continuity over time.Data using the standard ICD-10 rules for such categories as pneumonia/influenza, diabetes, or cancer should not be compared to the numbers shown above.
Causes of Death ICD-10 Codes Number Rank ASMR Rank
Malignant neoplasms C00-C97 9,949 1 19.47 1Diseases of heart I00-I09, I11, I13, I20-I51 6,110 2 11.56 2Cerebrovascular diseases I60-I69 2,173 3 4.11 3Diabetes mellitus E10-E14 1,682 4 3.24 4Chronic lower respiratory diseases J40-J47 1,590 5 3.05 5Accidents V01-X59, Y85-Y86 1,333 6 2.72 6Influenza and pneumonia J09-J18 1,091 7 2.04 7Alzheimer's disease G30 710 8 1.32 8Intentional self-harm (suicide) U03, X60-X84, Y87.0 585 9 1.23 9Chronic liver disease and cirrhosis K70, K73-K74 463 10 0.93 10Parkinson's disease G20-G21 322 11 0.62 11Essential (primary) hypertension and hypertensive renal disease
I10-I12, I15 279 12 0.52 12
Other causes1 7,328 14.14total (all causes of death) 33,615 64.95
taBle 16tWelVe leaDInG CaUSeS of DeatH
BR I t I S h Co L u M B I A , 2014
36
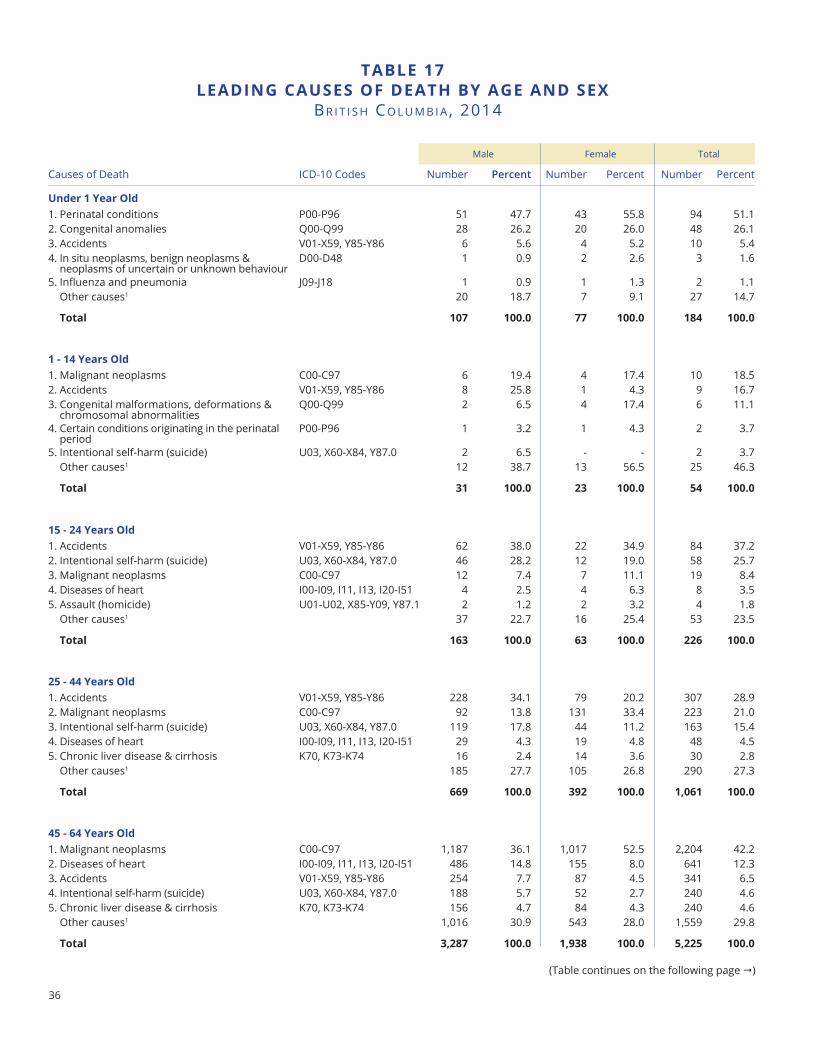
taBle 17leaDInG CaUSeS of DeatH BY aGe anD SeX
BR I t I S h Co L u M B I A , 2014
Causes of Death ICD-10 Codes Number Percent Number Percent Number Percent
Under 1 Year old1. Perinatal conditions P00-P96 51 47.7 43 55.8 94 51.12. Congenital anomalies Q00-Q99 28 26.2 20 26.0 48 26.13. Accidents V01-X59, Y85-Y86 6 5.6 4 5.2 10 5.44. In situ neoplasms, benign neoplasms &
neoplasms of uncertain or unknown behaviourD00-D48 1 0.9 2 2.6 3 1.6
5. Influenza and pneumonia J09-J18 1 0.9 1 1.3 2 1.1Other causes1 20 18.7 7 9.1 27 14.7
total 107 100.0 77 100.0 184 100.0
Male Female Total
(Table continues on the following page )
1 - 14 Years old1. Malignant neoplasms C00-C97 6 19.4 4 17.4 10 18.52. Accidents V01-X59, Y85-Y86 8 25.8 1 4.3 9 16.73. Congenital malformations, deformations &
chromosomal abnormalitiesQ00-Q99 2 6.5 4 17.4 6 11.1
4. Certain conditions originating in the perinatal period
P00-P96 1 3.2 1 4.3 2 3.7
5. Intentional self-harm (suicide) U03, X60-X84, Y87.0 2 6.5 - - 2 3.7Other causes1 12 38.7 13 56.5 25 46.3
total 31 100.0 23 100.0 54 100.0
15 - 24 Years old1. Accidents V01-X59, Y85-Y86 62 38.0 22 34.9 84 37.22. Intentional self-harm (suicide) U03, X60-X84, Y87.0 46 28.2 12 19.0 58 25.73. Malignant neoplasms C00-C97 12 7.4 7 11.1 19 8.44. Diseases of heart I00-I09, I11, I13, I20-I51 4 2.5 4 6.3 8 3.55. Assault (homicide) U01-U02, X85-Y09, Y87.1 2 1.2 2 3.2 4 1.8
Other causes1 37 22.7 16 25.4 53 23.5
total 163 100.0 63 100.0 226 100.0
25 - 44 Years old1. Accidents V01-X59, Y85-Y86 228 34.1 79 20.2 307 28.92. Malignant neoplasms C00-C97 92 13.8 131 33.4 223 21.03. Intentional self-harm (suicide) U03, X60-X84, Y87.0 119 17.8 44 11.2 163 15.44. Diseases of heart I00-I09, I11, I13, I20-I51 29 4.3 19 4.8 48 4.55. Chronic liver disease & cirrhosis K70, K73-K74 16 2.4 14 3.6 30 2.8
Other causes1 185 27.7 105 26.8 290 27.3
total 669 100.0 392 100.0 1,061 100.0
45 - 64 Years old1. Malignant neoplasms C00-C97 1,187 36.1 1,017 52.5 2,204 42.22. Diseases of heart I00-I09, I11, I13, I20-I51 486 14.8 155 8.0 641 12.33. Accidents V01-X59, Y85-Y86 254 7.7 87 4.5 341 6.54. Intentional self-harm (suicide) U03, X60-X84, Y87.0 188 5.7 52 2.7 240 4.65. Chronic liver disease & cirrhosis K70, K73-K74 156 4.7 84 4.3 240 4.6
Other causes1 1,016 30.9 543 28.0 1,559 29.8
total 3,287 100.0 1,938 100.0 5,225 100.0
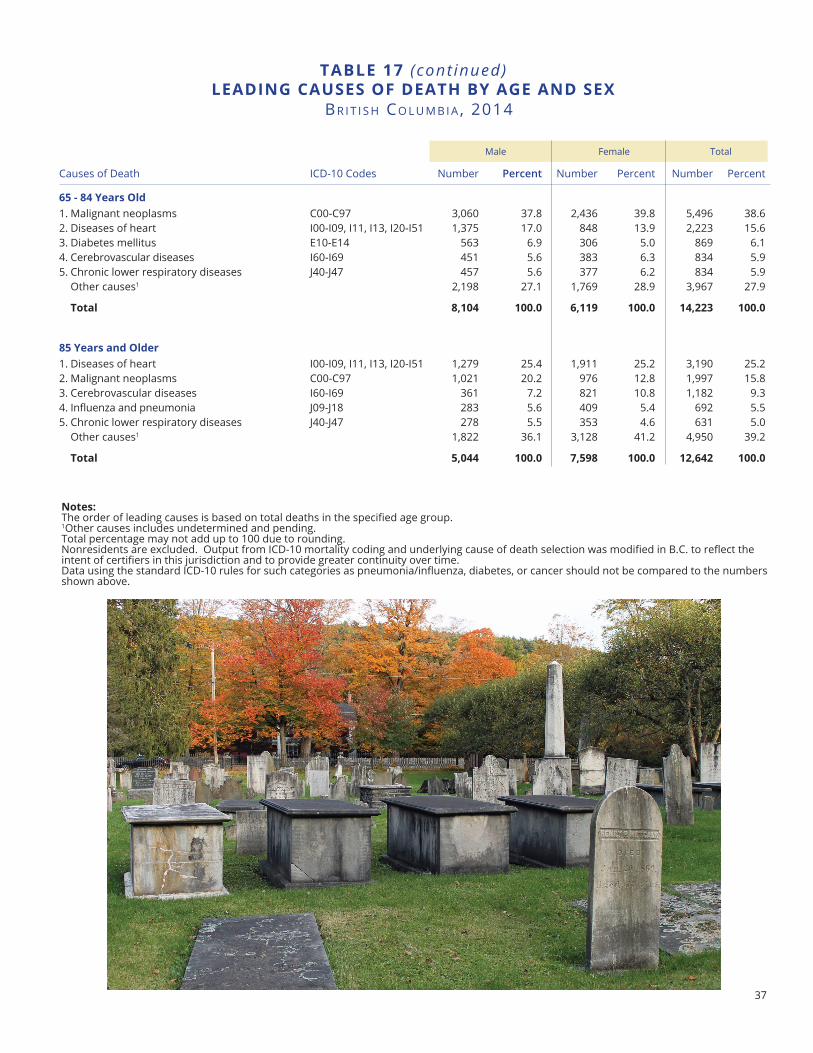
37
taBle 17 (cont inued)leaDInG CaUSeS of DeatH BY aGe anD SeX
BR I t I S h Co L u M B I A , 2014
notes: The order of leading causes is based on total deaths in the specified age group.1Other causes includes undetermined and pending.Total percentage may not add up to 100 due to rounding.Nonresidents are excluded. Output from ICD-10 mortality coding and underlying cause of death selection was modified in B.C. to reflect the intent of certifiers in this jurisdiction and to provide greater continuity over time.Data using the standard ICD-10 rules for such categories as pneumonia/influenza, diabetes, or cancer should not be compared to the numbers shown above.
Causes of Death ICD-10 Codes Number Percent Number Percent Number Percent
65 - 84 Years old1. Malignant neoplasms C00-C97 3,060 37.8 2,436 39.8 5,496 38.62. Diseases of heart I00-I09, I11, I13, I20-I51 1,375 17.0 848 13.9 2,223 15.63. Diabetes mellitus E10-E14 563 6.9 306 5.0 869 6.14. Cerebrovascular diseases I60-I69 451 5.6 383 6.3 834 5.95. Chronic lower respiratory diseases J40-J47 457 5.6 377 6.2 834 5.9
Other causes1 2,198 27.1 1,769 28.9 3,967 27.9
total 8,104 100.0 6,119 100.0 14,223 100.0
Male Female Total
85 Years and older1. Diseases of heart I00-I09, I11, I13, I20-I51 1,279 25.4 1,911 25.2 3,190 25.22. Malignant neoplasms C00-C97 1,021 20.2 976 12.8 1,997 15.83. Cerebrovascular diseases I60-I69 361 7.2 821 10.8 1,182 9.34. Influenza and pneumonia J09-J18 283 5.6 409 5.4 692 5.55. Chronic lower respiratory diseases J40-J47 278 5.5 353 4.6 631 5.0
Other causes1 1,822 36.1 3,128 41.2 4,950 39.2
total 5,044 100.0 7,598 100.0 12,642 100.0
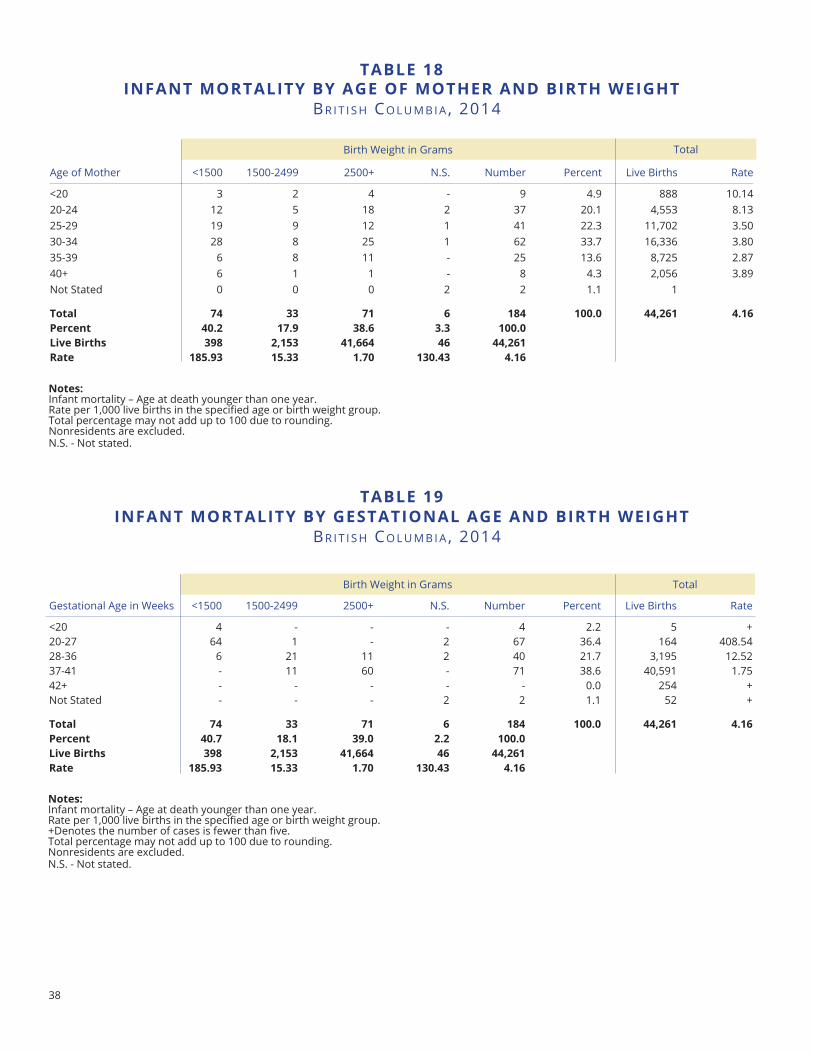
38
taBle 18Infant mortalItY BY aGe of motHer anD BIrtH WeIGHt
BR I t I S h Co L u M B I A , 2014
notes: Infant mortality – Age at death younger than one year.Rate per 1,000 live births in the specified age or birth weight group.Total percentage may not add up to 100 due to rounding.Nonresidents are excluded.N.S. - Not stated.
taBle 19Infant mortalItY BY GeStatIonal aGe anD BIrtH WeIGHt
BR I t I S h Co L u M B I A , 2014
notes:Infant mortality – Age at death younger than one year.Rate per 1,000 live births in the specified age or birth weight group.+Denotes the number of cases is fewer than five. Total percentage may not add up to 100 due to rounding.Nonresidents are excluded.N.S. - Not stated.
Age of Mother <1500 1500-2499 2500+ N.S. Number Percent Live Births Rate
<20 3 2 4 - 9 4.9 888 10.1420-24 12 5 18 2 37 20.1 4,553 8.1325-29 19 9 12 1 41 22.3 11,702 3.5030-34 28 8 25 1 62 33.7 16,336 3.8035-39 6 8 11 - 25 13.6 8,725 2.8740+ 6 1 1 - 8 4.3 2,056 3.89Not Stated 0 0 0 2 2 1.1 1
total 74 33 71 6 184 100.0 44,261 4.16Percent 40.2 17.9 38.6 3.3 100.0live Births 398 2,153 41,664 46 44,261 rate 185.93 15.33 1.70 130.43 4.16
Birth Weight in Grams Total
Birth Weight in Grams Total
Gestational Age in Weeks <1500 1500-2499 2500+ N.S. Number Percent Live Births Rate
<20 4 - - - 4 2.2 5 +20-27 64 1 - 2 67 36.4 164 408.5428-36 6 21 11 2 40 21.7 3,195 12.5237-41 - 11 60 - 71 38.6 40,591 1.7542+ - - - - - 0.0 254 +Not Stated - - - 2 2 1.1 52 +
total 74 33 71 6 184 100.0 44,261 4.16Percent 40.7 18.1 39.0 2.2 100.0live Births 398 2,153 41,664 46 44,261 rate 185.93 15.33 1.70 130.43 4.16
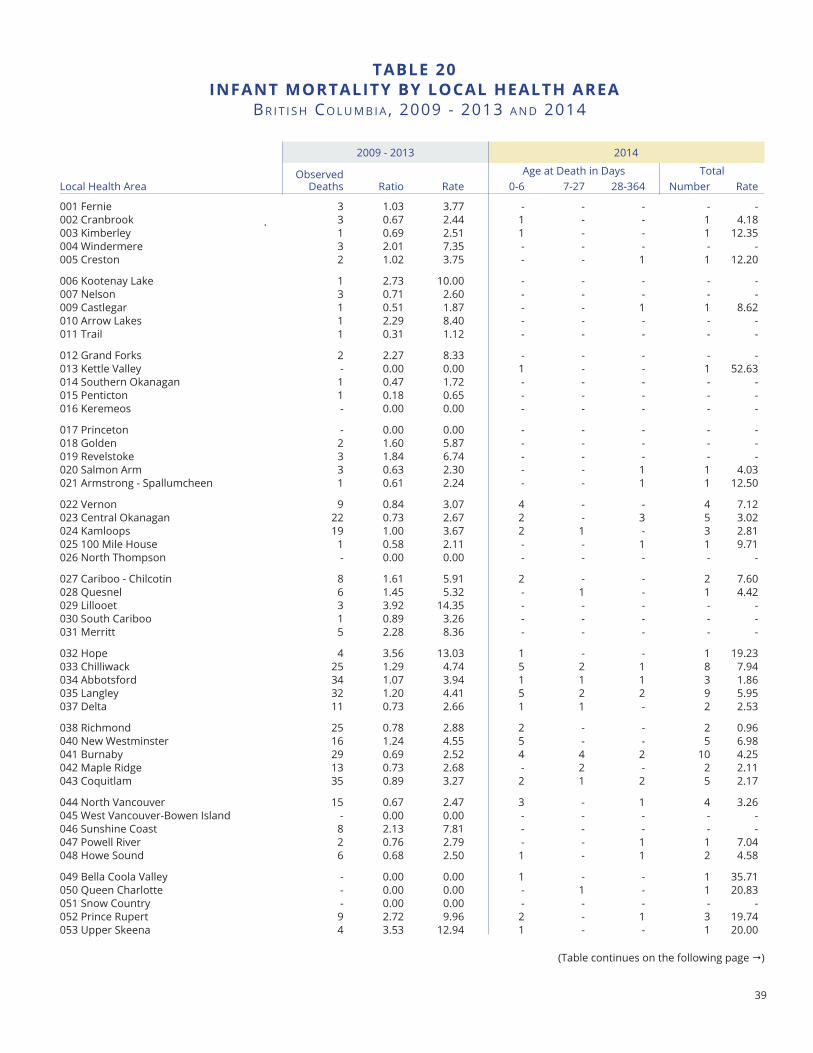
39
taBle 20Infant mortalItY BY loCal HealtH area
BR I t I S h Co L u M B I A , 2009 - 2013 A n d 2014
(Table continues on the following page )
2014
Age at Death in Days
2009 - 2013
Local Health AreaObserved
Deaths Ratio Rate 0-6 7-27 28-364 Number Rate
001 Fernie 3 1.03 3.77 - - - - -002 Cranbrook 3 0.67 2.44 1 - - 1 4.18003 Kimberley 1 0.69 2.51 1 - - 1 12.35004 Windermere 3 2.01 7.35 - - - - -005 Creston 2 1.02 3.75 - - 1 1 12.20
006 Kootenay Lake 1 2.73 10.00 - - - - -007 Nelson 3 0.71 2.60 - - - - -009 Castlegar 1 0.51 1.87 - - 1 1 8.62010 Arrow Lakes 1 2.29 8.40 - - - - -011 Trail 1 0.31 1.12 - - - - -
012 Grand Forks 2 2.27 8.33 - - - - -013 Kettle Valley - 0.00 0.00 1 - - 1 52.63014 Southern Okanagan 1 0.47 1.72 - - - - -015 Penticton 1 0.18 0.65 - - - - -016 Keremeos - 0.00 0.00 - - - - -
017 Princeton - 0.00 0.00 - - - - -018 Golden 2 1.60 5.87 - - - - -019 Revelstoke 3 1.84 6.74 - - - - -020 Salmon Arm 3 0.63 2.30 - - 1 1 4.03021 Armstrong - Spallumcheen 1 0.61 2.24 - - 1 1 12.50
022 Vernon 9 0.84 3.07 4 - - 4 7.12023 Central Okanagan 22 0.73 2.67 2 - 3 5 3.02024 Kamloops 19 1.00 3.67 2 1 - 3 2.81025 100 Mile House 1 0.58 2.11 - - 1 1 9.71026 North Thompson - 0.00 0.00 - - - - -
027 Cariboo - Chilcotin 8 1.61 5.91 2 - - 2 7.60028 Quesnel 6 1.45 5.32 - 1 - 1 4.42029 Lillooet 3 3.92 14.35 - - - - -030 South Cariboo 1 0.89 3.26 - - - - -031 Merritt 5 2.28 8.36 - - - - -
032 Hope 4 3.56 13.03 1 - - 1 19.23033 Chilliwack 25 1.29 4.74 5 2 1 8 7.94034 Abbotsford 34 1.07 3.94 1 1 1 3 1.86035 Langley 32 1.20 4.41 5 2 2 9 5.95037 Delta 11 0.73 2.66 1 1 - 2 2.53
038 Richmond 25 0.78 2.88 2 - - 2 0.96040 New Westminster 16 1.24 4.55 5 - - 5 6.98041 Burnaby 29 0.69 2.52 4 4 2 10 4.25042 Maple Ridge 13 0.73 2.68 - 2 - 2 2.11043 Coquitlam 35 0.89 3.27 2 1 2 5 2.17
044 North Vancouver 15 0.67 2.47 3 - 1 4 3.26045 West Vancouver-Bowen Island - 0.00 0.00 - - - - -046 Sunshine Coast 8 2.13 7.81 - - - - -047 Powell River 2 0.76 2.79 - - 1 1 7.04048 Howe Sound 6 0.68 2.50 1 - 1 2 4.58
049 Bella Coola Valley - 0.00 0.00 1 - - 1 35.71050 Queen Charlotte - 0.00 0.00 - 1 - 1 20.83051 Snow Country - 0.00 0.00 - - - - -052 Prince Rupert 9 2.72 9.96 2 - 1 3 19.74053 Upper Skeena 4 3.53 12.94 1 - - 1 20.00
Total
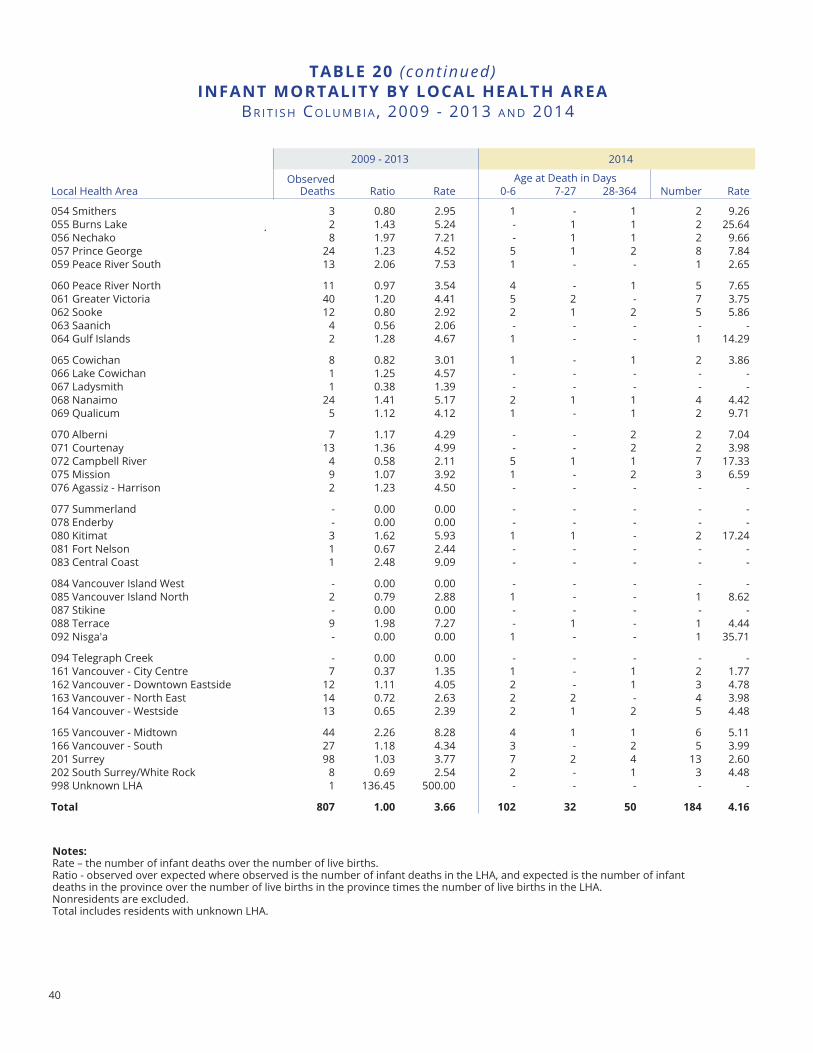
40
notes:Rate – the number of infant deaths over the number of live births.Ratio - observed over expected where observed is the number of infant deaths in the LHA, and expected is the number of infant deaths in the province over the number of live births in the province times the number of live births in the LHA.Nonresidents are excluded.Total includes residents with unknown LHA.
taBle 20 (cont inued)Infant mortalItY BY loCal HealtH area
BR I t I S h Co L u M B I A , 2009 - 2013 A n d 2014
20142009 - 2013
Age at Death in DaysLocal Health Area
Observed Deaths Ratio Rate 0-6 7-27 28-364 Number Rate
054 Smithers 3 0.80 2.95 1 - 1 2 9.26055 Burns Lake 2 1.43 5.24 - 1 1 2 25.64056 Nechako 8 1.97 7.21 - 1 1 2 9.66057 Prince George 24 1.23 4.52 5 1 2 8 7.84059 Peace River South 13 2.06 7.53 1 - - 1 2.65
060 Peace River North 11 0.97 3.54 4 - 1 5 7.65061 Greater Victoria 40 1.20 4.41 5 2 - 7 3.75062 Sooke 12 0.80 2.92 2 1 2 5 5.86063 Saanich 4 0.56 2.06 - - - - -064 Gulf Islands 2 1.28 4.67 1 - - 1 14.29
065 Cowichan 8 0.82 3.01 1 - 1 2 3.86066 Lake Cowichan 1 1.25 4.57 - - - - -067 Ladysmith 1 0.38 1.39 - - - - -068 Nanaimo 24 1.41 5.17 2 1 1 4 4.42069 Qualicum 5 1.12 4.12 1 - 1 2 9.71
070 Alberni 7 1.17 4.29 - - 2 2 7.04071 Courtenay 13 1.36 4.99 - - 2 2 3.98072 Campbell River 4 0.58 2.11 5 1 1 7 17.33075 Mission 9 1.07 3.92 1 - 2 3 6.59076 Agassiz - Harrison 2 1.23 4.50 - - - - -
077 Summerland - 0.00 0.00 - - - - -078 Enderby - 0.00 0.00 - - - - -080 Kitimat 3 1.62 5.93 1 1 - 2 17.24081 Fort Nelson 1 0.67 2.44 - - - - -083 Central Coast 1 2.48 9.09 - - - - -
084 Vancouver Island West - 0.00 0.00 - - - - -085 Vancouver Island North 2 0.79 2.88 1 - - 1 8.62087 Stikine - 0.00 0.00 - - - - -088 Terrace 9 1.98 7.27 - 1 - 1 4.44092 Nisga'a - 0.00 0.00 1 - - 1 35.71
094 Telegraph Creek - 0.00 0.00 - - - - -161 Vancouver - City Centre 7 0.37 1.35 1 - 1 2 1.77162 Vancouver - Downtown Eastside 12 1.11 4.05 2 - 1 3 4.78163 Vancouver - North East 14 0.72 2.63 2 2 - 4 3.98164 Vancouver - Westside 13 0.65 2.39 2 1 2 5 4.48
165 Vancouver - Midtown 44 2.26 8.28 4 1 1 6 5.11166 Vancouver - South 27 1.18 4.34 3 - 2 5 3.99201 Surrey 98 1.03 3.77 7 2 4 13 2.60202 South Surrey/White Rock 8 0.69 2.54 2 - 1 3 4.48998 Unknown LHA 1 136.45 500.00 - - - - -
total 807 1.00 3.66 102 32 50 184 4.16
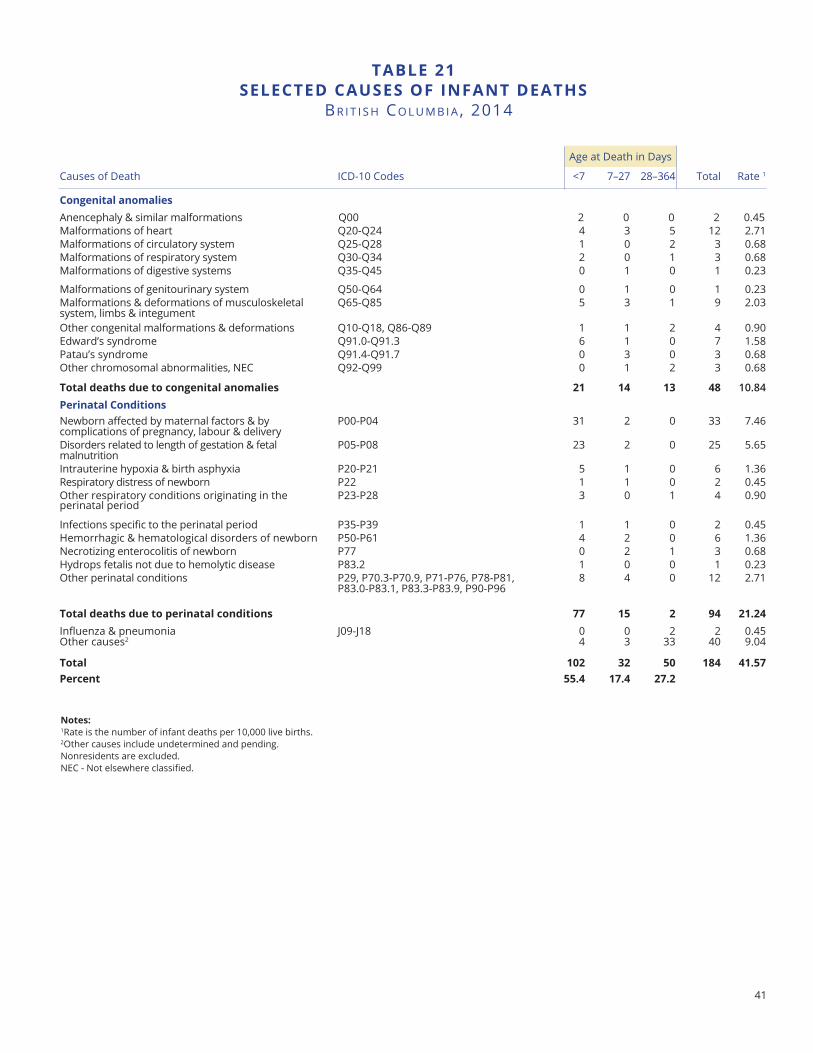
41
taBle 21SeleCteD CaUSeS of Infant DeatHS
BR I t I S h Co L u M B I A , 2014
Causes of Death ICD-10 Codes <7 7–27 28–364 Total Rate 1
Congenital anomaliesAnencephaly & similar malformations Q00 2 0 0 2 0.45Malformations of heart Q20-Q24 4 3 5 12 2.71Malformations of circulatory system Q25-Q28 1 0 2 3 0.68Malformations of respiratory system Q30-Q34 2 0 1 3 0.68Malformations of digestive systems Q35-Q45 0 1 0 1 0.23
Malformations of genitourinary system Q50-Q64 0 1 0 1 0.23Malformations & deformations of musculoskeletal system, limbs & integument
Q65-Q85 5 3 1 9 2.03
Other congenital malformations & deformations Q10-Q18, Q86-Q89 1 1 2 4 0.90Edward’s syndrome Q91.0-Q91.3 6 1 0 7 1.58Patau’s syndrome Q91.4-Q91.7 0 3 0 3 0.68Other chromosomal abnormalities, NEC Q92-Q99 0 1 2 3 0.68
total deaths due to congenital anomalies 21 14 13 48 10.84Perinatal ConditionsNewborn affected by maternal factors & by complications of pregnancy, labour & delivery
P00-P04 31 2 0 33 7.46
Disorders related to length of gestation & fetal malnutrition
P05-P08 23 2 0 25 5.65
Intrauterine hypoxia & birth asphyxia P20-P21 5 1 0 6 1.36Respiratory distress of newborn P22 1 1 0 2 0.45Other respiratory conditions originating in the perinatal period
P23-P28 3 0 1 4 0.90
Infections specific to the perinatal period P35-P39 1 1 0 2 0.45Hemorrhagic & hematological disorders of newborn P50-P61 4 2 0 6 1.36Necrotizing enterocolitis of newborn P77 0 2 1 3 0.68Hydrops fetalis not due to hemolytic disease P83.2 1 0 0 1 0.23Other perinatal conditions P29, P70.3-P70.9, P71-P76, P78-P81,
P83.0-P83.1, P83.3-P83.9, P90-P968 4 0 12 2.71
total deaths due to perinatal conditions 77 15 2 94 21.24Influenza & pneumonia J09-J18 0 0 2 2 0.45Other causes2 4 3 33 40 9.04
total 102 32 50 184 41.57Percent 55.4 17.4 27.2
notes: 1Rate is the number of infant deaths per 10,000 live births.2Other causes include undetermined and pending.Nonresidents are excluded.NEC - Not elsewhere classified.
Age at Death in Days
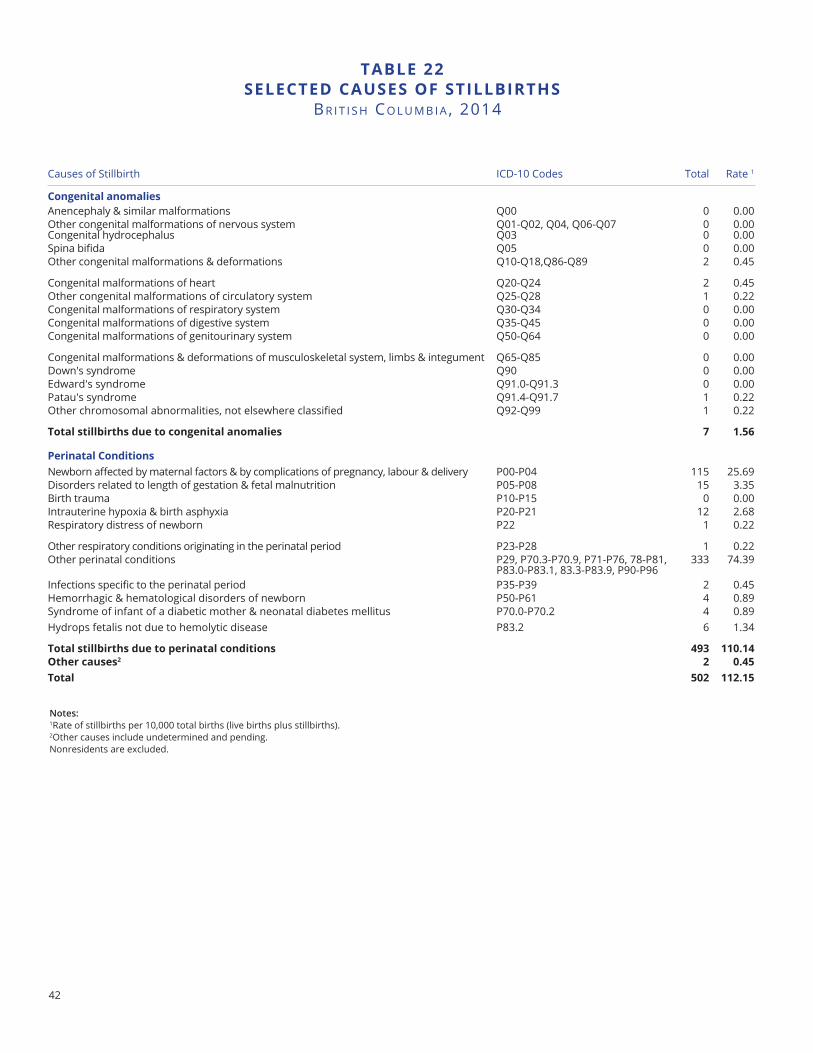
42
taBle 22SeleCteD CaUSeS of StIllBIrtHS
BR I t I S h Co L u M B I A , 2014
Causes of Stillbirth ICD-10 Codes Total Rate 1
Congenital anomaliesAnencephaly & similar malformations Q00 0 0.00Other congenital malformations of nervous system Q01-Q02, Q04, Q06-Q07 0 0.00Congenital hydrocephalus Q03 0 0.00Spina bifida Q05 0 0.00Other congenital malformations & deformations Q10-Q18,Q86-Q89 2 0.45
Congenital malformations of heart Q20-Q24 2 0.45Other congenital malformations of circulatory system Q25-Q28 1 0.22Congenital malformations of respiratory system Q30-Q34 0 0.00Congenital malformations of digestive system Q35-Q45 0 0.00Congenital malformations of genitourinary system Q50-Q64 0 0.00
Congenital malformations & deformations of musculoskeletal system, limbs & integument Q65-Q85 0 0.00Down's syndrome Q90 0 0.00Edward's syndrome Q91.0-Q91.3 0 0.00Patau's syndrome Q91.4-Q91.7 1 0.22Other chromosomal abnormalities, not elsewhere classified Q92-Q99 1 0.22
total stillbirths due to congenital anomalies 7 1.56
Perinatal ConditionsNewborn affected by maternal factors & by complications of pregnancy, labour & delivery P00-P04 115 25.69Disorders related to length of gestation & fetal malnutrition P05-P08 15 3.35Birth trauma P10-P15 0 0.00Intrauterine hypoxia & birth asphyxia P20-P21 12 2.68Respiratory distress of newborn P22 1 0.22
Other respiratory conditions originating in the perinatal period P23-P28 1 0.22Other perinatal conditions P29, P70.3-P70.9, P71-P76, 78-P81,
P83.0-P83.1, 83.3-P83.9, P90-P96333 74.39
Infections specific to the perinatal period P35-P39 2 0.45Hemorrhagic & hematological disorders of newborn P50-P61 4 0.89Syndrome of infant of a diabetic mother & neonatal diabetes mellitus P70.0-P70.2 4 0.89Hydrops fetalis not due to hemolytic disease P83.2 6 1.34
total stillbirths due to perinatal conditions 493 110.14other causes2 2 0.45total 502 112.15
Notes: 1Rate of stillbirths per 10,000 total births (live births plus stillbirths).2Other causes include undetermined and pending.Nonresidents are excluded.
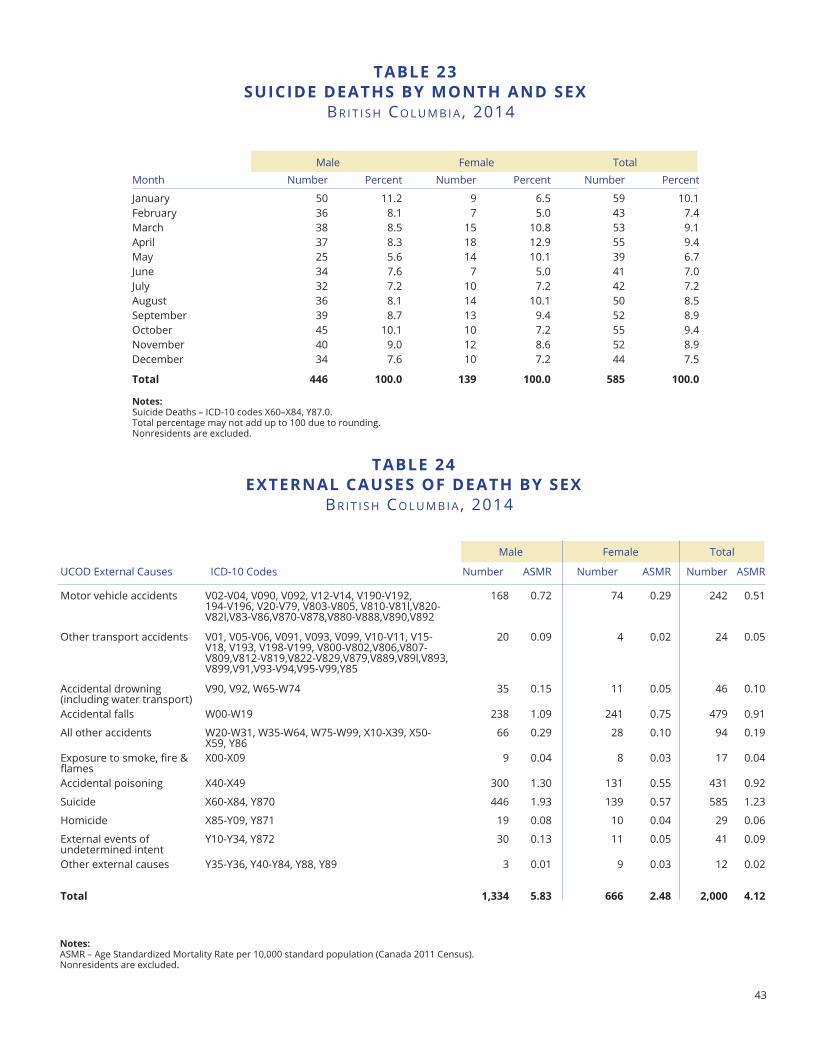
43
taBle 24eXternal CaUSeS of DeatH BY SeX
BR I t I S h Co L u M B I A , 2014
UCOD External Causes ICD-10 Codes Number ASMR Number ASMR Number ASMR
Motor vehicle accidents V02-V04, V090, V092, V12-V14, V190-V192, 194-V196, V20-V79, V803-V805, V810-V81l,V820-V82l,V83-V86,V870-V878,V880-V888,V890,V892
168 0.72 74 0.29 242 0.51
Other transport accidents V01, V05-V06, V091, V093, V099, V10-V11, V15-V18, V193, V198-V199, V800-V802,V806,V807-V809,V812-V819,V822-V829,V879,V889,V89l,V893,V899,V91,V93-V94,V95-V99,Y85
20 0.09 4 0.02 24 0.05
Accidental drowning (including water transport)
V90, V92, W65-W74 35 0.15 11 0.05 46 0.10
Accidental falls W00-W19 238 1.09 241 0.75 479 0.91
All other accidents W20-W31, W35-W64, W75-W99, X10-X39, X50-X59, Y86
66 0.29 28 0.10 94 0.19
Exposure to smoke, fire & flames
X00-X09 9 0.04 8 0.03 17 0.04
Accidental poisoning X40-X49 300 1.30 131 0.55 431 0.92
Suicide X60-X84, Y870 446 1.93 139 0.57 585 1.23
Homicide X85-Y09, Y871 19 0.08 10 0.04 29 0.06
External events of undetermined intent
Y10-Y34, Y872 30 0.13 11 0.05 41 0.09
Other external causes Y35-Y36, Y40-Y84, Y88, Y89 3 0.01 9 0.03 12 0.02
total 1,334 5.83 666 2.48 2,000 4.12
Male Female Total
taBle 23SUICIDe DeatHS BY montH anD SeX
BR I t I S h Co L u M B I A , 2014
Male Female TotalMonth Number Percent Number Percent Number Percent
January 50 11.2 9 6.5 59 10.1February 36 8.1 7 5.0 43 7.4March 38 8.5 15 10.8 53 9.1April 37 8.3 18 12.9 55 9.4May 25 5.6 14 10.1 39 6.7June 34 7.6 7 5.0 41 7.0July 32 7.2 10 7.2 42 7.2August 36 8.1 14 10.1 50 8.5September 39 8.7 13 9.4 52 8.9October 45 10.1 10 7.2 55 9.4November 40 9.0 12 8.6 52 8.9December 34 7.6 10 7.2 44 7.5
total 446 100.0 139 100.0 585 100.0
notes:Suicide Deaths – ICD-10 codes X60–X84, Y87.0.Total percentage may not add up to 100 due to rounding.Nonresidents are excluded.
notes:ASMR – Age Standardized Mortality Rate per 10,000 standard population (Canada 2011 Census).Nonresidents are excluded.
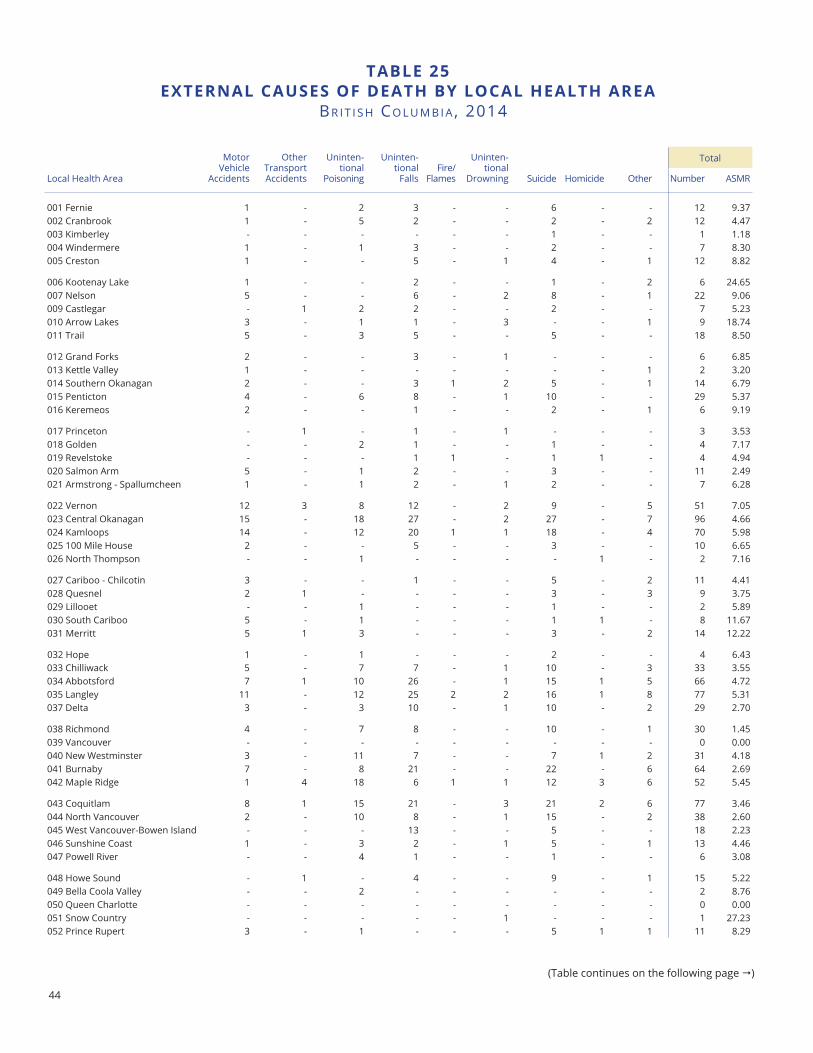
44
Local Health Area
Motor Vehicle
Accidents
Other Transport Accidents
Uninten-tional
Poisoning
Uninten-tional Falls
Fire/ Flames
Uninten-tional
Drowning Suicide Homicide Other Number ASMR
001 Fernie 1 - 2 3 - - 6 - - 12 9.37002 Cranbrook 1 - 5 2 - - 2 - 2 12 4.47003 Kimberley - - - - - - 1 - - 1 1.18004 Windermere 1 - 1 3 - - 2 - - 7 8.30005 Creston 1 - - 5 - 1 4 - 1 12 8.82
006 Kootenay Lake 1 - - 2 - - 1 - 2 6 24.65007 Nelson 5 - - 6 - 2 8 - 1 22 9.06009 Castlegar - 1 2 2 - - 2 - - 7 5.23010 Arrow Lakes 3 - 1 1 - 3 - - 1 9 18.74011 Trail 5 - 3 5 - - 5 - - 18 8.50
012 Grand Forks 2 - - 3 - 1 - - - 6 6.85013 Kettle Valley 1 - - - - - - - 1 2 3.20014 Southern Okanagan 2 - - 3 1 2 5 - 1 14 6.79015 Penticton 4 - 6 8 - 1 10 - - 29 5.37016 Keremeos 2 - - 1 - - 2 - 1 6 9.19
017 Princeton - 1 - 1 - 1 - - - 3 3.53018 Golden - - 2 1 - - 1 - - 4 7.17019 Revelstoke - - - 1 1 - 1 1 - 4 4.94020 Salmon Arm 5 - 1 2 - - 3 - - 11 2.49021 Armstrong - Spallumcheen 1 - 1 2 - 1 2 - - 7 6.28
022 Vernon 12 3 8 12 - 2 9 - 5 51 7.05023 Central Okanagan 15 - 18 27 - 2 27 - 7 96 4.66024 Kamloops 14 - 12 20 1 1 18 - 4 70 5.98025 100 Mile House 2 - - 5 - - 3 - - 10 6.65026 North Thompson - - 1 - - - - 1 - 2 7.16
027 Cariboo - Chilcotin 3 - - 1 - - 5 - 2 11 4.41028 Quesnel 2 1 - - - - 3 - 3 9 3.75029 Lillooet - - 1 - - - 1 - - 2 5.89030 South Cariboo 5 - 1 - - - 1 1 - 8 11.67031 Merritt 5 1 3 - - - 3 - 2 14 12.22
032 Hope 1 - 1 - - - 2 - - 4 6.43033 Chilliwack 5 - 7 7 - 1 10 - 3 33 3.55034 Abbotsford 7 1 10 26 - 1 15 1 5 66 4.72035 Langley 11 - 12 25 2 2 16 1 8 77 5.31037 Delta 3 - 3 10 - 1 10 - 2 29 2.70
038 Richmond 4 - 7 8 - - 10 - 1 30 1.45039 Vancouver - - - - - - - - - 0 0.00040 New Westminster 3 - 11 7 - - 7 1 2 31 4.18041 Burnaby 7 - 8 21 - - 22 - 6 64 2.69042 Maple Ridge 1 4 18 6 1 1 12 3 6 52 5.45
043 Coquitlam 8 1 15 21 - 3 21 2 6 77 3.46044 North Vancouver 2 - 10 8 - 1 15 - 2 38 2.60045 West Vancouver-Bowen Island - - - 13 - - 5 - - 18 2.23046 Sunshine Coast 1 - 3 2 - 1 5 - 1 13 4.46047 Powell River - - 4 1 - - 1 - - 6 3.08
048 Howe Sound - 1 - 4 - - 9 - 1 15 5.22049 Bella Coola Valley - - 2 - - - - - - 2 8.76050 Queen Charlotte - - - - - - - - - 0 0.00051 Snow Country - - - - - 1 - - - 1 27.23052 Prince Rupert 3 - 1 - - - 5 1 1 11 8.29
taBle 25eXternal CaUSeS of DeatH BY loCal HealtH area
BR I t I S h Co L u M B I A , 2014
(Table continues on the following page )
taBle 25 (cont inued)eXternal CaUSeS of DeatH BY loCal HealtH area
BR I t I S h Co L u M B I A , 2014
Total
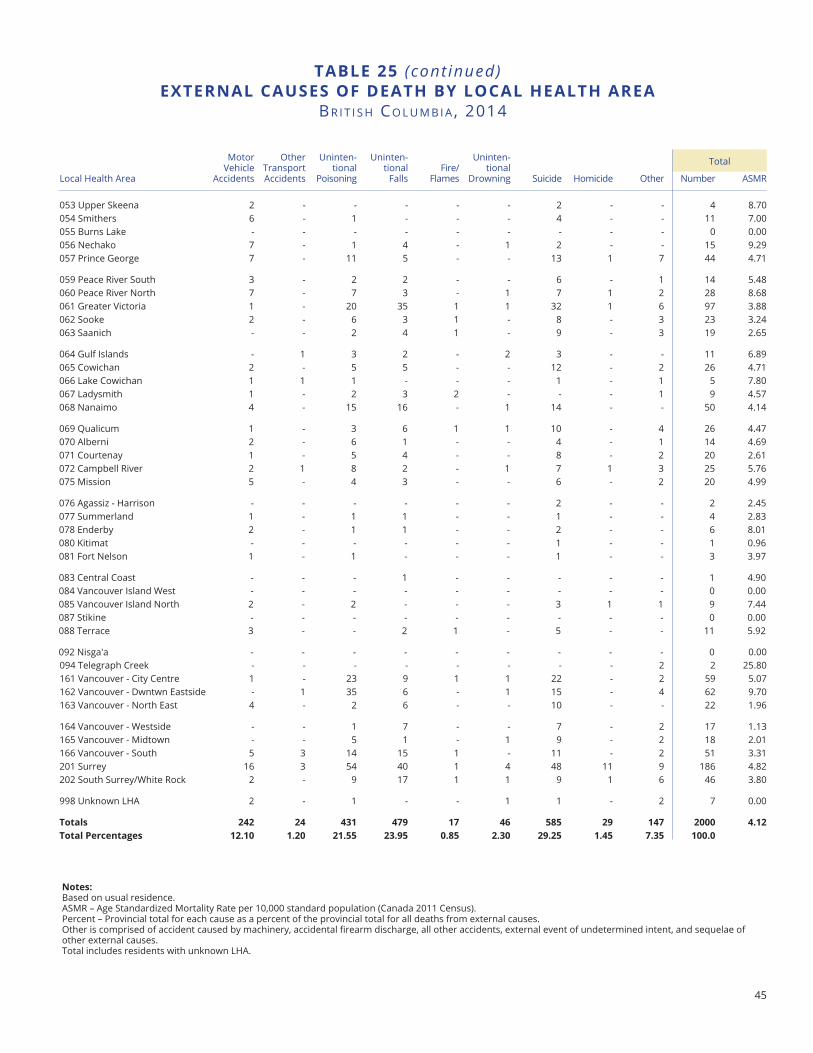
45
taBle 25eXternal CaUSeS of DeatH BY loCal HealtH area
BR I t I S h Co L u M B I A , 2014
taBle 25 (cont inued)eXternal CaUSeS of DeatH BY loCal HealtH area
BR I t I S h Co L u M B I A , 2014
Total
Local Health Area
Motor Vehicle
Accidents
Other Transport Accidents
Uninten-tional
Poisoning
Uninten-tional Falls
Fire/ Flames
Uninten-tional
Drowning Suicide Homicide Other Number ASMR
053 Upper Skeena 2 - - - - - 2 - - 4 8.70054 Smithers 6 - 1 - - - 4 - - 11 7.00055 Burns Lake - - - - - - - - - 0 0.00056 Nechako 7 - 1 4 - 1 2 - - 15 9.29057 Prince George 7 - 11 5 - - 13 1 7 44 4.71
059 Peace River South 3 - 2 2 - - 6 - 1 14 5.48060 Peace River North 7 - 7 3 - 1 7 1 2 28 8.68061 Greater Victoria 1 - 20 35 1 1 32 1 6 97 3.88062 Sooke 2 - 6 3 1 - 8 - 3 23 3.24063 Saanich - - 2 4 1 - 9 - 3 19 2.65
064 Gulf Islands - 1 3 2 - 2 3 - - 11 6.89065 Cowichan 2 - 5 5 - - 12 - 2 26 4.71066 Lake Cowichan 1 1 1 - - - 1 - 1 5 7.80067 Ladysmith 1 - 2 3 2 - - - 1 9 4.57068 Nanaimo 4 - 15 16 - 1 14 - - 50 4.14
069 Qualicum 1 - 3 6 1 1 10 - 4 26 4.47070 Alberni 2 - 6 1 - - 4 - 1 14 4.69071 Courtenay 1 - 5 4 - - 8 - 2 20 2.61072 Campbell River 2 1 8 2 - 1 7 1 3 25 5.76075 Mission 5 - 4 3 - - 6 - 2 20 4.99
076 Agassiz - Harrison - - - - - - 2 - - 2 2.45077 Summerland 1 - 1 1 - - 1 - - 4 2.83078 Enderby 2 - 1 1 - - 2 - - 6 8.01080 Kitimat - - - - - - 1 - - 1 0.96081 Fort Nelson 1 - 1 - - - 1 - - 3 3.97
083 Central Coast - - - 1 - - - - - 1 4.90084 Vancouver Island West - - - - - - - - - 0 0.00085 Vancouver Island North 2 - 2 - - - 3 1 1 9 7.44087 Stikine - - - - - - - - - 0 0.00088 Terrace 3 - - 2 1 - 5 - - 11 5.92
092 Nisga'a - - - - - - - - - 0 0.00094 Telegraph Creek - - - - - - - - 2 2 25.80161 Vancouver - City Centre 1 - 23 9 1 1 22 - 2 59 5.07162 Vancouver - Dwntwn Eastside - 1 35 6 - 1 15 - 4 62 9.70163 Vancouver - North East 4 - 2 6 - - 10 - - 22 1.96
164 Vancouver - Westside - - 1 7 - - 7 - 2 17 1.13165 Vancouver - Midtown - - 5 1 - 1 9 - 2 18 2.01166 Vancouver - South 5 3 14 15 1 - 11 - 2 51 3.31201 Surrey 16 3 54 40 1 4 48 11 9 186 4.82202 South Surrey/White Rock 2 - 9 17 1 1 9 1 6 46 3.80
998 Unknown LHA 2 - 1 - - 1 1 - 2 7 0.00
totals 242 24 431 479 17 46 585 29 147 2000 4.12total Percentages 12.10 1.20 21.55 23.95 0.85 2.30 29.25 1.45 7.35 100.0
notes:Based on usual residence. ASMR – Age Standardized Mortality Rate per 10,000 standard population (Canada 2011 Census).Percent – Provincial total for each cause as a percent of the provincial total for all deaths from external causes.Other is comprised of accident caused by machinery, accidental firearm discharge, all other accidents, external event of undetermined intent, and sequelae of other external causes.Total includes residents with unknown LHA.
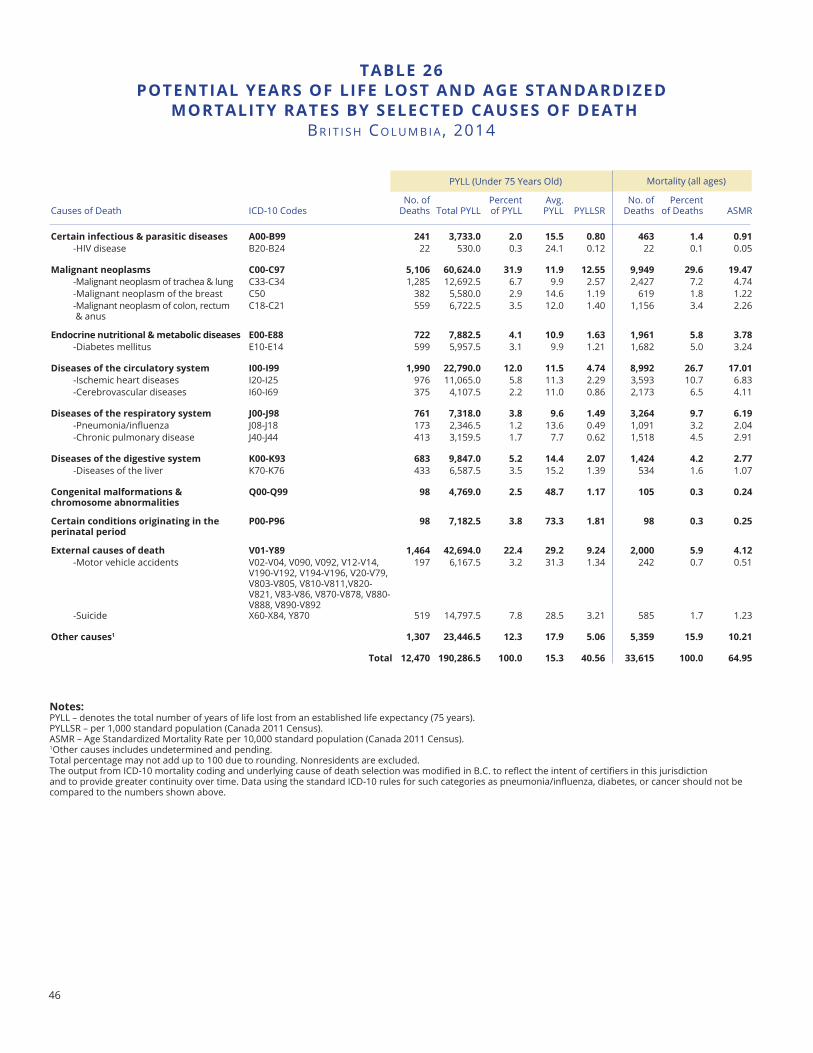
46
taBle 26PotentIal YearS of lIfe loSt anD aGe StanDarDIzeD
mortalItY rateS BY SeleCteD CaUSeS of DeatHBR I t I S h Co L u M B I A , 2014
Causes of Death ICD-10 CodesNo. of
Deaths Total PYLLPercent of PYLL
Avg.PYLL PYLLSR
No. of Deaths
Percent of Deaths ASMR
Certain infectious & parasitic diseases a00-B99 241 3,733.0 2.0 15.5 0.80 463 1.4 0.91-HIV disease B20-B24 22 530.0 0.3 24.1 0.12 22 0.1 0.05
malignant neoplasms C00-C97 5,106 60,624.0 31.9 11.9 12.55 9,949 29.6 19.47-Malignant neoplasm of trachea & lung C33-C34 1,285 12,692.5 6.7 9.9 2.57 2,427 7.2 4.74-Malignant neoplasm of the breast C50 382 5,580.0 2.9 14.6 1.19 619 1.8 1.22-Malignant neoplasm of colon, rectum & anus
C18-C21 559 6,722.5 3.5 12.0 1.40 1,156 3.4 2.26
endocrine nutritional & metabolic diseases e00-e88 722 7,882.5 4.1 10.9 1.63 1,961 5.8 3.78-Diabetes mellitus E10-E14 599 5,957.5 3.1 9.9 1.21 1,682 5.0 3.24
Diseases of the circulatory system I00-I99 1,990 22,790.0 12.0 11.5 4.74 8,992 26.7 17.01-Ischemic heart diseases I20-I25 976 11,065.0 5.8 11.3 2.29 3,593 10.7 6.83-Cerebrovascular diseases I60-I69 375 4,107.5 2.2 11.0 0.86 2,173 6.5 4.11
Diseases of the respiratory system J00-J98 761 7,318.0 3.8 9.6 1.49 3,264 9.7 6.19-Pneumonia/influenza J08-J18 173 2,346.5 1.2 13.6 0.49 1,091 3.2 2.04-Chronic pulmonary disease J40-J44 413 3,159.5 1.7 7.7 0.62 1,518 4.5 2.91
Diseases of the digestive system K00-K93 683 9,847.0 5.2 14.4 2.07 1,424 4.2 2.77-Diseases of the liver K70-K76 433 6,587.5 3.5 15.2 1.39 534 1.6 1.07
Congenital malformations & chromosome abnormalities
Q00-Q99 98 4,769.0 2.5 48.7 1.17 105 0.3 0.24
Certain conditions originating in the perinatal period
P00-P96 98 7,182.5 3.8 73.3 1.81 98 0.3 0.25
external causes of death V01-Y89 1,464 42,694.0 22.4 29.2 9.24 2,000 5.9 4.12-Motor vehicle accidents V02-V04, V090, V092, V12-V14,
V190-V192, V194-V196, V20-V79, V803-V805, V810-V811,V820-V821, V83-V86, V870-V878, V880-V888, V890-V892
197 6,167.5 3.2 31.3 1.34 242 0.7 0.51
-Suicide X60-X84, Y870 519 14,797.5 7.8 28.5 3.21 585 1.7 1.23
other causes1 1,307 23,446.5 12.3 17.9 5.06 5,359 15.9 10.21
total 12,470 190,286.5 100.0 15.3 40.56 33,615 100.0 64.95
PYLL (Under 75 Years Old) Mortality (all ages)
notes: PYLL – denotes the total number of years of life lost from an established life expectancy (75 years).PYLLSR – per 1,000 standard population (Canada 2011 Census).ASMR – Age Standardized Mortality Rate per 10,000 standard population (Canada 2011 Census).1Other causes includes undetermined and pending.Total percentage may not add up to 100 due to rounding. Nonresidents are excluded.The output from ICD-10 mortality coding and underlying cause of death selection was modified in B.C. to reflect the intent of certifiers in this jurisdiction and to provide greater continuity over time. Data using the standard ICD-10 rules for such categories as pneumonia/influenza, diabetes, or cancer should not be compared to the numbers shown above.
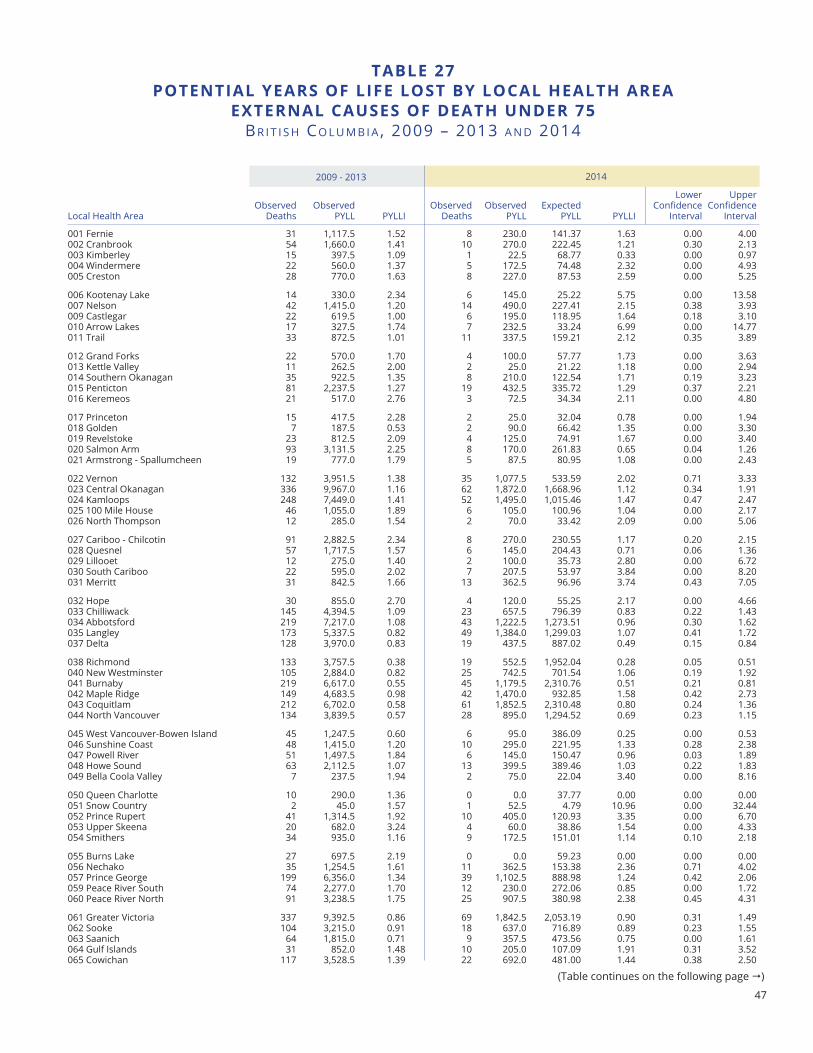
47
taBle 27 PotentIal YearS of lIfe loSt BY loCal HealtH area
eXternal CaUSeS of DeatH UnDer 75BR I t I S h Co L u M B I A , 2009 – 2013 A n d 2014
(Table continues on the following page )
Local Health AreaObserved
DeathsObserved
PYLL PYLLIObserved
DeathsObserved
PYLLExpected
PYLL PYLLI
Lower Confidence
Interval
Upper Confidence
Interval
001 Fernie 31 1,117.5 1.52 8 230.0 141.37 1.63 0.00 4.00002 Cranbrook 54 1,660.0 1.41 10 270.0 222.45 1.21 0.30 2.13003 Kimberley 15 397.5 1.09 1 22.5 68.77 0.33 0.00 0.97004 Windermere 22 560.0 1.37 5 172.5 74.48 2.32 0.00 4.93005 Creston 28 770.0 1.63 8 227.0 87.53 2.59 0.00 5.25
006 Kootenay Lake 14 330.0 2.34 6 145.0 25.22 5.75 0.00 13.58007 Nelson 42 1,415.0 1.20 14 490.0 227.41 2.15 0.38 3.93009 Castlegar 22 619.5 1.00 6 195.0 118.95 1.64 0.18 3.10010 Arrow Lakes 17 327.5 1.74 7 232.5 33.24 6.99 0.00 14.77011 Trail 33 872.5 1.01 11 337.5 159.21 2.12 0.35 3.89
012 Grand Forks 22 570.0 1.70 4 100.0 57.77 1.73 0.00 3.63013 Kettle Valley 11 262.5 2.00 2 25.0 21.22 1.18 0.00 2.94014 Southern Okanagan 35 922.5 1.35 8 210.0 122.54 1.71 0.19 3.23015 Penticton 81 2,237.5 1.27 19 432.5 335.72 1.29 0.37 2.21016 Keremeos 21 517.0 2.76 3 72.5 34.34 2.11 0.00 4.80
017 Princeton 15 417.5 2.28 2 25.0 32.04 0.78 0.00 1.94018 Golden 7 187.5 0.53 2 90.0 66.42 1.35 0.00 3.30019 Revelstoke 23 812.5 2.09 4 125.0 74.91 1.67 0.00 3.40020 Salmon Arm 93 3,131.5 2.25 8 170.0 261.83 0.65 0.04 1.26021 Armstrong - Spallumcheen 19 777.0 1.79 5 87.5 80.95 1.08 0.00 2.43
022 Vernon 132 3,951.5 1.38 35 1,077.5 533.59 2.02 0.71 3.33023 Central Okanagan 336 9,967.0 1.16 62 1,872.0 1,668.96 1.12 0.34 1.91024 Kamloops 248 7,449.0 1.41 52 1,495.0 1,015.46 1.47 0.47 2.47025 100 Mile House 46 1,055.0 1.89 6 105.0 100.96 1.04 0.00 2.17026 North Thompson 12 285.0 1.54 2 70.0 33.42 2.09 0.00 5.06
027 Cariboo - Chilcotin 91 2,882.5 2.34 8 270.0 230.55 1.17 0.20 2.15028 Quesnel 57 1,717.5 1.57 6 145.0 204.43 0.71 0.06 1.36029 Lillooet 12 275.0 1.40 2 100.0 35.73 2.80 0.00 6.72030 South Cariboo 22 595.0 2.02 7 207.5 53.97 3.84 0.00 8.20031 Merritt 31 842.5 1.66 13 362.5 96.96 3.74 0.43 7.05
032 Hope 30 855.0 2.70 4 120.0 55.25 2.17 0.00 4.66033 Chilliwack 145 4,394.5 1.09 23 657.5 796.39 0.83 0.22 1.43034 Abbotsford 219 7,217.0 1.08 43 1,222.5 1,273.51 0.96 0.30 1.62035 Langley 173 5,337.5 0.82 49 1,384.0 1,299.03 1.07 0.41 1.72037 Delta 128 3,970.0 0.83 19 437.5 887.02 0.49 0.15 0.84
038 Richmond 133 3,757.5 0.38 19 552.5 1,952.04 0.28 0.05 0.51040 New Westminster 105 2,884.0 0.82 25 742.5 701.54 1.06 0.19 1.92041 Burnaby 219 6,617.0 0.55 45 1,179.5 2,310.76 0.51 0.21 0.81042 Maple Ridge 149 4,683.5 0.98 42 1,470.0 932.85 1.58 0.42 2.73043 Coquitlam 212 6,702.0 0.58 61 1,852.5 2,310.48 0.80 0.24 1.36044 North Vancouver 134 3,839.5 0.57 28 895.0 1,294.52 0.69 0.23 1.15
045 West Vancouver-Bowen Island 45 1,247.5 0.60 6 95.0 386.09 0.25 0.00 0.53046 Sunshine Coast 48 1,415.0 1.20 10 295.0 221.95 1.33 0.28 2.38047 Powell River 51 1,497.5 1.84 6 145.0 150.47 0.96 0.03 1.89048 Howe Sound 63 2,112.5 1.07 13 399.5 389.46 1.03 0.22 1.83049 Bella Coola Valley 7 237.5 1.94 2 75.0 22.04 3.40 0.00 8.16
050 Queen Charlotte 10 290.0 1.36 0 0.0 37.77 0.00 0.00 0.00051 Snow Country 2 45.0 1.57 1 52.5 4.79 10.96 0.00 32.44052 Prince Rupert 41 1,314.5 1.92 10 405.0 120.93 3.35 0.00 6.70053 Upper Skeena 20 682.0 3.24 4 60.0 38.86 1.54 0.00 4.33054 Smithers 34 935.0 1.16 9 172.5 151.01 1.14 0.10 2.18
055 Burns Lake 27 697.5 2.19 0 0.0 59.23 0.00 0.00 0.00056 Nechako 35 1,254.5 1.61 11 362.5 153.38 2.36 0.71 4.02057 Prince George 199 6,356.0 1.34 39 1,102.5 888.98 1.24 0.42 2.06059 Peace River South 74 2,277.0 1.70 12 230.0 272.06 0.85 0.00 1.72060 Peace River North 91 3,238.5 1.75 25 907.5 380.98 2.38 0.45 4.31
061 Greater Victoria 337 9,392.5 0.86 69 1,842.5 2,053.19 0.90 0.31 1.49062 Sooke 104 3,215.0 0.91 18 637.0 716.89 0.89 0.23 1.55063 Saanich 64 1,815.0 0.71 9 357.5 473.56 0.75 0.00 1.61064 Gulf Islands 31 852.0 1.48 10 205.0 107.09 1.91 0.31 3.52065 Cowichan 117 3,528.5 1.39 22 692.0 481.00 1.44 0.38 2.50
2009 - 2013 2014
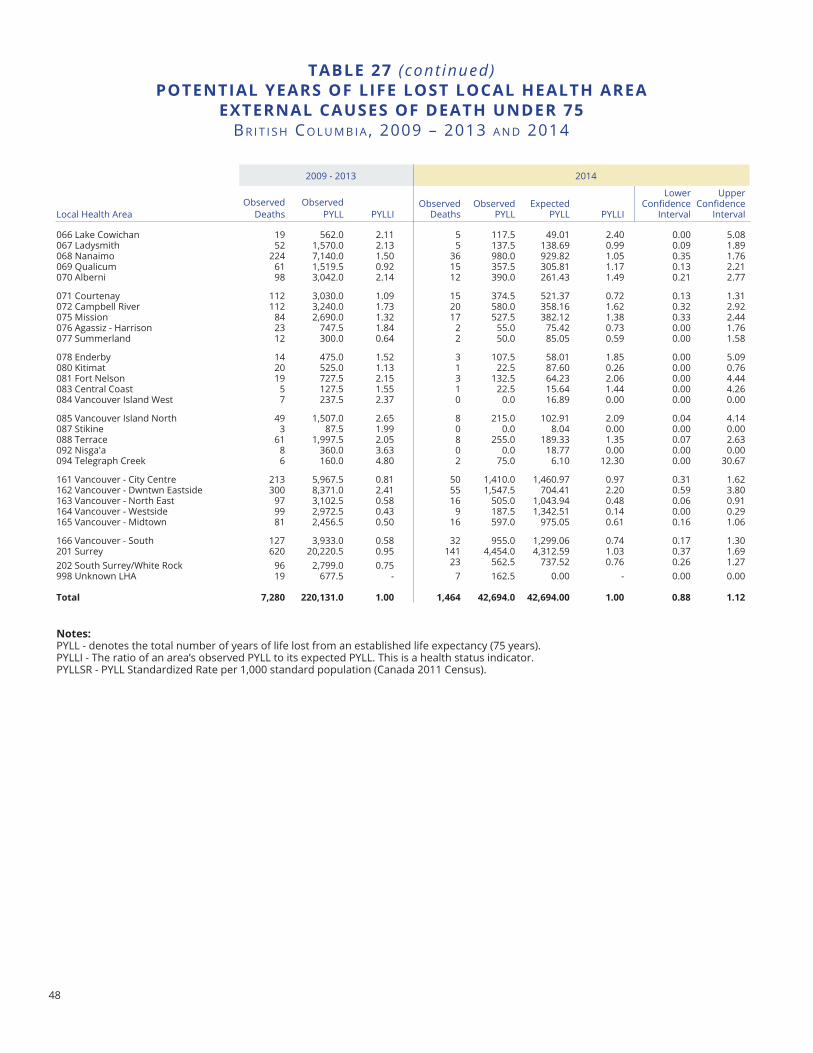
48
taBle 27 (cont inued)PotentIal YearS of lIfe loSt loCal HealtH area
eXternal CaUSeS of DeatH UnDer 75BR I t I S h Co L u M B I A , 2009 – 2013 A n d 2014
notes: PYLL - denotes the total number of years of life lost from an established life expectancy (75 years). PYLLI - The ratio of an area’s observed PYLL to its expected PYLL. This is a health status indicator.PYLLSR - PYLL Standardized Rate per 1,000 standard population (Canada 2011 Census).
Local Health AreaObserved
DeathsObserved
PYLL PYLLIObserved
DeathsObserved
PYLLExpected
PYLL PYLLI
Lower Confidence
Interval
Upper Confidence
Interval
066 Lake Cowichan 19 562.0 2.11 5 117.5 49.01 2.40 0.00 5.08067 Ladysmith 52 1,570.0 2.13 5 137.5 138.69 0.99 0.09 1.89068 Nanaimo 224 7,140.0 1.50 36 980.0 929.82 1.05 0.35 1.76069 Qualicum 61 1,519.5 0.92 15 357.5 305.81 1.17 0.13 2.21070 Alberni 98 3,042.0 2.14 12 390.0 261.43 1.49 0.21 2.77
071 Courtenay 112 3,030.0 1.09 15 374.5 521.37 0.72 0.13 1.31072 Campbell River 112 3,240.0 1.73 20 580.0 358.16 1.62 0.32 2.92075 Mission 84 2,690.0 1.32 17 527.5 382.12 1.38 0.33 2.44076 Agassiz - Harrison 23 747.5 1.84 2 55.0 75.42 0.73 0.00 1.76077 Summerland 12 300.0 0.64 2 50.0 85.05 0.59 0.00 1.58
078 Enderby 14 475.0 1.52 3 107.5 58.01 1.85 0.00 5.09080 Kitimat 20 525.0 1.13 1 22.5 87.60 0.26 0.00 0.76081 Fort Nelson 19 727.5 2.15 3 132.5 64.23 2.06 0.00 4.44083 Central Coast 5 127.5 1.55 1 22.5 15.64 1.44 0.00 4.26084 Vancouver Island West 7 237.5 2.37 0 0.0 16.89 0.00 0.00 0.00
085 Vancouver Island North 49 1,507.0 2.65 8 215.0 102.91 2.09 0.04 4.14087 Stikine 3 87.5 1.99 0 0.0 8.04 0.00 0.00 0.00088 Terrace 61 1,997.5 2.05 8 255.0 189.33 1.35 0.07 2.63092 Nisga'a 8 360.0 3.63 0 0.0 18.77 0.00 0.00 0.00094 Telegraph Creek 6 160.0 4.80 2 75.0 6.10 12.30 0.00 30.67
161 Vancouver - City Centre 213 5,967.5 0.81 50 1,410.0 1,460.97 0.97 0.31 1.62162 Vancouver - Dwntwn Eastside 300 8,371.0 2.41 55 1,547.5 704.41 2.20 0.59 3.80163 Vancouver - North East 97 3,102.5 0.58 16 505.0 1,043.94 0.48 0.06 0.91164 Vancouver - Westside 99 2,972.5 0.43 9 187.5 1,342.51 0.14 0.00 0.29165 Vancouver - Midtown 81 2,456.5 0.50 16 597.0 975.05 0.61 0.16 1.06
166 Vancouver - South 127 3,933.0 0.58 32 955.0 1,299.06 0.74 0.17 1.30201 Surrey 620 20,220.5 0.95 141 4,454.0 4,312.59 1.03 0.37 1.69202 South Surrey/White Rock 96 2,799.0 0.75 23 562.5 737.52 0.76 0.26 1.27998 Unknown LHA 19 677.5 - 7 162.5 0.00 - 0.00 0.00
total 7,280 220,131.0 1.00 1,464 42,694.0 42,694.00 1.00 0.88 1.12
2009 - 2013 2014
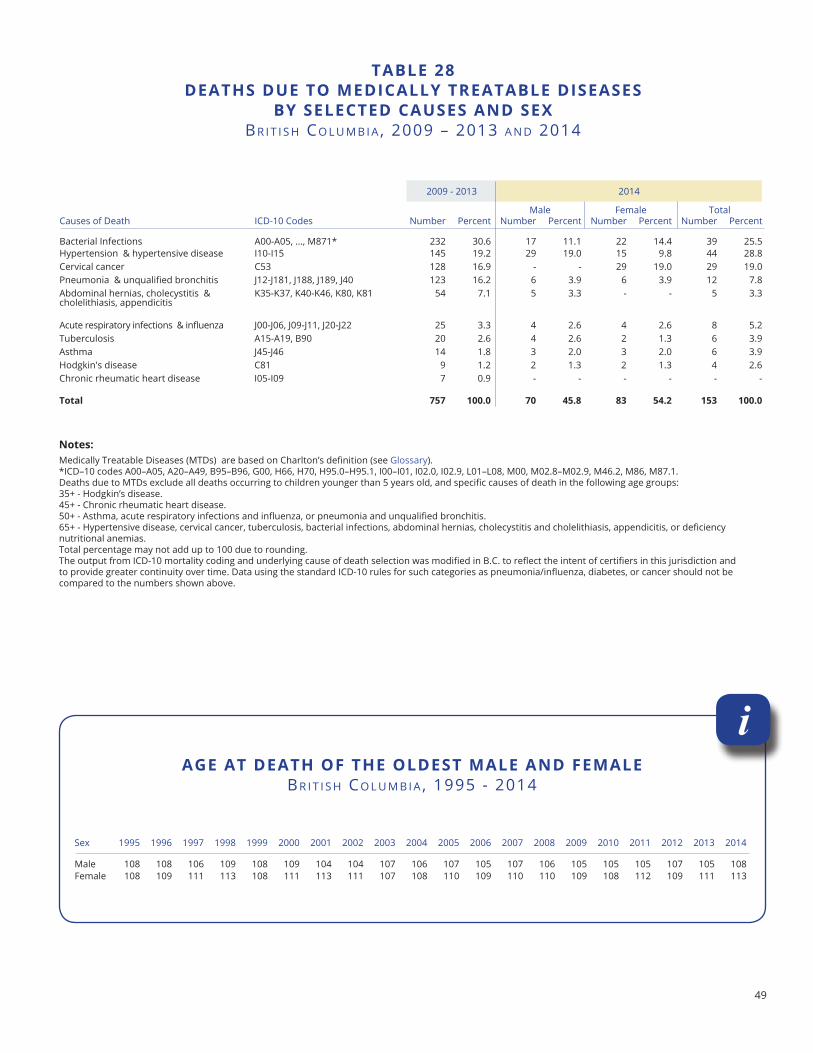
49
taBle 28DeatHS DUe to meDICallY treataBle DISeaSeS
BY SeleCteD CaUSeS anD SeXBR I t I S h Co L u M B I A , 2009 – 2013 A n d 2014
Causes of Death ICD-10 Codes Number Percent Number Percent Number Percent Number Percent
Bacterial Infections A00-A05, ..., M871* 232 30.6 17 11.1 22 14.4 39 25.5 Hypertension & hypertensive disease I10-I15 145 19.2 29 19.0 15 9.8 44 28.8 Cervical cancer C53 128 16.9 - - 29 19.0 29 19.0 Pneumonia & unqualified bronchitis J12-J181, J188, J189, J40 123 16.2 6 3.9 6 3.9 12 7.8 Abdominal hernias, cholecystitis & cholelithiasis, appendicitis
K35-K37, K40-K46, K80, K81 54 7.1 5 3.3 - - 5 3.3
Acute respiratory infections & influenza J00-J06, J09-J11, J20-J22 25 3.3 4 2.6 4 2.6 8 5.2 Tuberculosis A15-A19, B90 20 2.6 4 2.6 2 1.3 6 3.9 Asthma J45-J46 14 1.8 3 2.0 3 2.0 6 3.9 Hodgkin's disease C81 9 1.2 2 1.3 2 1.3 4 2.6 Chronic rheumatic heart disease I05-I09 7 0.9 - - - - - -
total 757 100.0 70 45.8 83 54.2 153 100.0
2009 - 2013 2014
Male Female Total
notes: Medically Treatable Diseases (MTDs) are based on Charlton’s definition (see Glossary).*ICD–10 codes A00–A05, A20–A49, B95–B96, G00, H66, H70, H95.0–H95.1, I00–I01, I02.0, I02.9, L01–L08, M00, M02.8–M02.9, M46.2, M86, M87.1.Deaths due to MTDs exclude all deaths occurring to children younger than 5 years old, and specific causes of death in the following age groups:35+ - Hodgkin’s disease.45+ - Chronic rheumatic heart disease.50+ - Asthma, acute respiratory infections and influenza, or pneumonia and unqualified bronchitis.65+ - Hypertensive disease, cervical cancer, tuberculosis, bacterial infections, abdominal hernias, cholecystitis and cholelithiasis, appendicitis, or deficiency nutritional anemias.Total percentage may not add up to 100 due to rounding.The output from ICD-10 mortality coding and underlying cause of death selection was modified in B.C. to reflect the intent of certifiers in this jurisdiction and to provide greater continuity over time. Data using the standard ICD-10 rules for such categories as pneumonia/influenza, diabetes, or cancer should not be compared to the numbers shown above.
Sex 1995 1996 1997 1998 1999 2000 2001 2002 2003 2004 2005 2006 2007 2008 2009 2010 2011 2012 2013 2014
Male 108 108 106 109 108 109 104 104 107 106 107 105 107 106 105 105 105 107 105 108Female 108 109 111 113 108 111 113 111 107 108 110 109 110 110 109 108 112 109 111 113
aGe at DeatH of tHe olDeSt male anD femaleBR I t I S h Co L u M B I A , 1995 - 2014
i
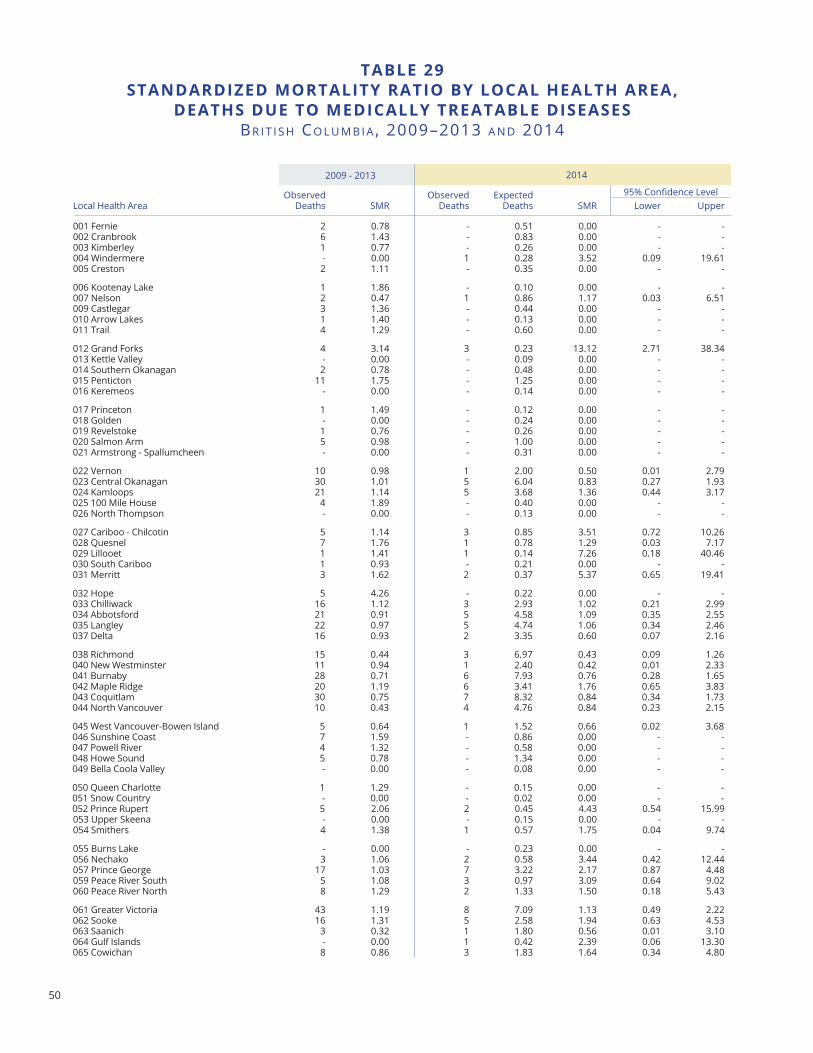
50
taBle 29StanDarDIzeD mortalItY ratIo BY loCal HealtH area,
DeatHS DUe to meDICallY treataBle DISeaSeSBR I t I S h Co L u M B I A , 2009–2013 A n d 2014
2014
Local Health AreaObserved
Deaths SMRObserved
DeathsExpected
Deaths SMR Lower Upper
001 Fernie 2 0.78 - 0.51 0.00 - -002 Cranbrook 6 1.43 - 0.83 0.00 - -003 Kimberley 1 0.77 - 0.26 0.00 - -004 Windermere - 0.00 1 0.28 3.52 0.09 19.61005 Creston 2 1.11 - 0.35 0.00 - -
006 Kootenay Lake 1 1.86 - 0.10 0.00 - -007 Nelson 2 0.47 1 0.86 1.17 0.03 6.51009 Castlegar 3 1.36 - 0.44 0.00 - -010 Arrow Lakes 1 1.40 - 0.13 0.00 - -011 Trail 4 1.29 - 0.60 0.00 - -
012 Grand Forks 4 3.14 3 0.23 13.12 2.71 38.34013 Kettle Valley - 0.00 - 0.09 0.00 - -014 Southern Okanagan 2 0.78 - 0.48 0.00 - -015 Penticton 11 1.75 - 1.25 0.00 - -016 Keremeos - 0.00 - 0.14 0.00 - -
017 Princeton 1 1.49 - 0.12 0.00 - -018 Golden - 0.00 - 0.24 0.00 - -019 Revelstoke 1 0.76 - 0.26 0.00 - -020 Salmon Arm 5 0.98 - 1.00 0.00 - -021 Armstrong - Spallumcheen - 0.00 - 0.31 0.00 - -
022 Vernon 10 0.98 1 2.00 0.50 0.01 2.79023 Central Okanagan 30 1.01 5 6.04 0.83 0.27 1.93024 Kamloops 21 1.14 5 3.68 1.36 0.44 3.17025 100 Mile House 4 1.89 - 0.40 0.00 - -026 North Thompson - 0.00 - 0.13 0.00 - -
027 Cariboo - Chilcotin 5 1.14 3 0.85 3.51 0.72 10.26028 Quesnel 7 1.76 1 0.78 1.29 0.03 7.17029 Lillooet 1 1.41 1 0.14 7.26 0.18 40.46030 South Cariboo 1 0.93 - 0.21 0.00 - -031 Merritt 3 1.62 2 0.37 5.37 0.65 19.41
032 Hope 5 4.26 - 0.22 0.00 - -033 Chilliwack 16 1.12 3 2.93 1.02 0.21 2.99034 Abbotsford 21 0.91 5 4.58 1.09 0.35 2.55035 Langley 22 0.97 5 4.74 1.06 0.34 2.46037 Delta 16 0.93 2 3.35 0.60 0.07 2.16
038 Richmond 15 0.44 3 6.97 0.43 0.09 1.26040 New Westminster 11 0.94 1 2.40 0.42 0.01 2.33041 Burnaby 28 0.71 6 7.93 0.76 0.28 1.65042 Maple Ridge 20 1.19 6 3.41 1.76 0.65 3.83043 Coquitlam 30 0.75 7 8.32 0.84 0.34 1.73044 North Vancouver 10 0.43 4 4.76 0.84 0.23 2.15
045 West Vancouver-Bowen Island 5 0.64 1 1.52 0.66 0.02 3.68046 Sunshine Coast 7 1.59 - 0.86 0.00 - -047 Powell River 4 1.32 - 0.58 0.00 - -048 Howe Sound 5 0.78 - 1.34 0.00 - -049 Bella Coola Valley - 0.00 - 0.08 0.00 - -
050 Queen Charlotte 1 1.29 - 0.15 0.00 - -051 Snow Country - 0.00 - 0.02 0.00 - -052 Prince Rupert 5 2.06 2 0.45 4.43 0.54 15.99053 Upper Skeena - 0.00 - 0.15 0.00 - -054 Smithers 4 1.38 1 0.57 1.75 0.04 9.74
055 Burns Lake - 0.00 - 0.23 0.00 - -056 Nechako 3 1.06 2 0.58 3.44 0.42 12.44057 Prince George 17 1.03 7 3.22 2.17 0.87 4.48059 Peace River South 5 1.08 3 0.97 3.09 0.64 9.02060 Peace River North 8 1.29 2 1.33 1.50 0.18 5.43
061 Greater Victoria 43 1.19 8 7.09 1.13 0.49 2.22062 Sooke 16 1.31 5 2.58 1.94 0.63 4.53063 Saanich 3 0.32 1 1.80 0.56 0.01 3.10064 Gulf Islands - 0.00 1 0.42 2.39 0.06 13.30065 Cowichan 8 0.86 3 1.83 1.64 0.34 4.80
95% Confidence Level
2009 - 2013
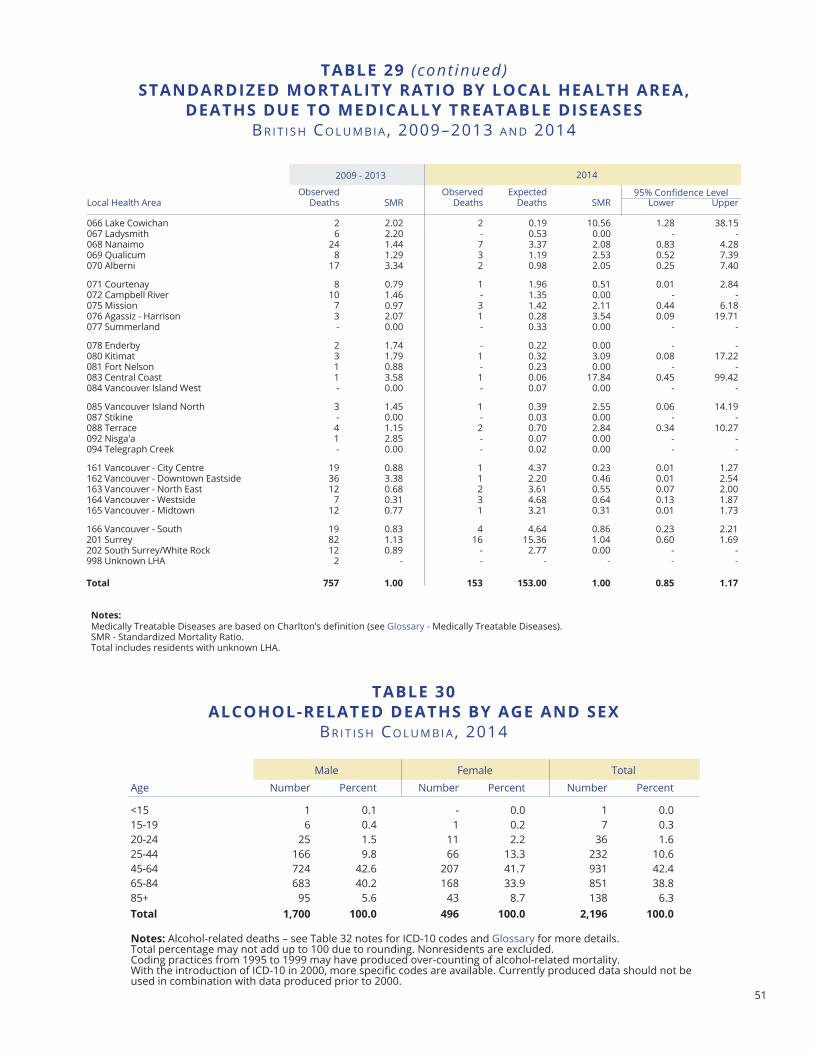
51
taBle 29 (cont inued)StanDarDIzeD mortalItY ratIo BY loCal HealtH area,
DeatHS DUe to meDICallY treataBle DISeaSeSBR I t I S h Co L u M B I A , 2009–2013 A n d 2014
notes: Medically Treatable Diseases are based on Charlton’s definition (see Glossary - Medically Treatable Diseases).SMR - Standardized Mortality Ratio.Total includes residents with unknown LHA.
taBle 30alCoHol-relateD DeatHS BY aGe anD SeX
BR I t I S h Co L u M B I A , 2014
Male Female TotalAge Number Percent Number Percent Number Percent
<15 1 0.1 - 0.0 1 0.015-19 6 0.4 1 0.2 7 0.320-24 25 1.5 11 2.2 36 1.625-44 166 9.8 66 13.3 232 10.645-64 724 42.6 207 41.7 931 42.465-84 683 40.2 168 33.9 851 38.885+ 95 5.6 43 8.7 138 6.3total 1,700 100.0 496 100.0 2,196 100.0
notes: Alcohol-related deaths – see Table 32 notes for ICD-10 codes and Glossary for more details.Total percentage may not add up to 100 due to rounding. Nonresidents are excluded.Coding practices from 1995 to 1999 may have produced over-counting of alcohol-related mortality.With the introduction of ICD-10 in 2000, more specific codes are available. Currently produced data should not be used in combination with data produced prior to 2000.
Local Health AreaObserved
Deaths SMRObserved
DeathsExpected
Deaths SMR Lower Upper
066 Lake Cowichan 2 2.02 2 0.19 10.56 1.28 38.15067 Ladysmith 6 2.20 - 0.53 0.00 - -068 Nanaimo 24 1.44 7 3.37 2.08 0.83 4.28069 Qualicum 8 1.29 3 1.19 2.53 0.52 7.39070 Alberni 17 3.34 2 0.98 2.05 0.25 7.40
071 Courtenay 8 0.79 1 1.96 0.51 0.01 2.84072 Campbell River 10 1.46 - 1.35 0.00 - -075 Mission 7 0.97 3 1.42 2.11 0.44 6.18076 Agassiz - Harrison 3 2.07 1 0.28 3.54 0.09 19.71077 Summerland - 0.00 - 0.33 0.00 - -
078 Enderby 2 1.74 - 0.22 0.00 - -080 Kitimat 3 1.79 1 0.32 3.09 0.08 17.22081 Fort Nelson 1 0.88 - 0.23 0.00 - -083 Central Coast 1 3.58 1 0.06 17.84 0.45 99.42084 Vancouver Island West - 0.00 - 0.07 0.00 - -
085 Vancouver Island North 3 1.45 1 0.39 2.55 0.06 14.19087 Stikine - 0.00 - 0.03 0.00 - -088 Terrace 4 1.15 2 0.70 2.84 0.34 10.27092 Nisga'a 1 2.85 - 0.07 0.00 - -094 Telegraph Creek - 0.00 - 0.02 0.00 - -
161 Vancouver - City Centre 19 0.88 1 4.37 0.23 0.01 1.27162 Vancouver - Downtown Eastside 36 3.38 1 2.20 0.46 0.01 2.54163 Vancouver - North East 12 0.68 2 3.61 0.55 0.07 2.00164 Vancouver - Westside 7 0.31 3 4.68 0.64 0.13 1.87165 Vancouver - Midtown 12 0.77 1 3.21 0.31 0.01 1.73
166 Vancouver - South 19 0.83 4 4.64 0.86 0.23 2.21201 Surrey 82 1.13 16 15.36 1.04 0.60 1.69202 South Surrey/White Rock 12 0.89 - 2.77 0.00 - -998 Unknown LHA 2 - - - - - -
total 757 1.00 153 153.00 1.00 0.85 1.17
2014
95% Confidence Level
2009 - 2013
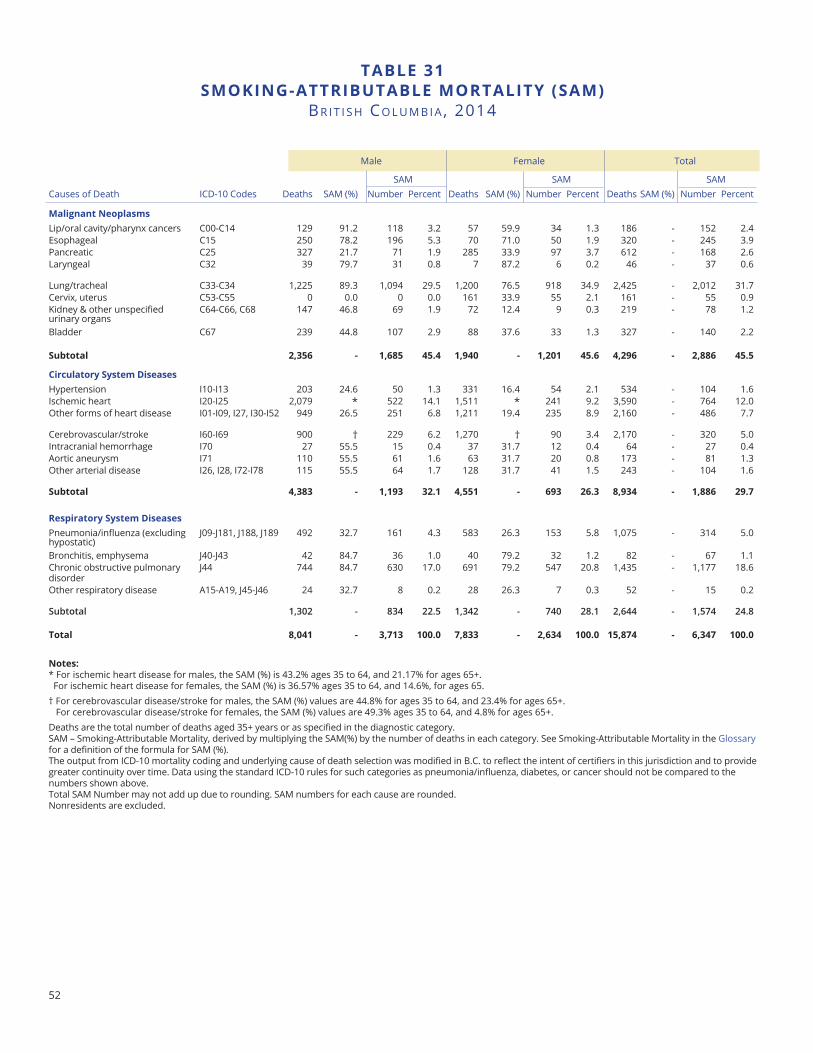
52
notes:* For ischemic heart disease for males, the SAM (%) is 43.2% ages 35 to 64, and 21.17% for ages 65+. For ischemic heart disease for females, the SAM (%) is 36.57% ages 35 to 64, and 14.6%, for ages 65.† For cerebrovascular disease/stroke for males, the SAM (%) values are 44.8% for ages 35 to 64, and 23.4% for ages 65+. For cerebrovascular disease/stroke for females, the SAM (%) values are 49.3% ages 35 to 64, and 4.8% for ages 65+.Deaths are the total number of deaths aged 35+ years or as specified in the diagnostic category.SAM – Smoking-Attributable Mortality, derived by multiplying the SAM(%) by the number of deaths in each category. See Smoking-Attributable Mortality in the Glossary for a definition of the formula for SAM (%).The output from ICD-10 mortality coding and underlying cause of death selection was modified in B.C. to reflect the intent of certifiers in this jurisdiction and to provide greater continuity over time. Data using the standard ICD-10 rules for such categories as pneumonia/influenza, diabetes, or cancer should not be compared to the numbers shown above.Total SAM Number may not add up due to rounding. SAM numbers for each cause are rounded.Nonresidents are excluded.
taBle 31SmoKInG-attrIBUtaBle mortalItY (Sam)
BR I t I S h Co L u M B I A , 2014
SAM SAM SAMCauses of Death ICD-10 Codes Deaths SAM (%) Number Percent Deaths SAM (%) Number Percent Deaths SAM (%) Number Percent
malignant neoplasmsLip/oral cavity/pharynx cancers C00-C14 129 91.2 118 3.2 57 59.9 34 1.3 186 - 152 2.4Esophageal C15 250 78.2 196 5.3 70 71.0 50 1.9 320 - 245 3.9Pancreatic C25 327 21.7 71 1.9 285 33.9 97 3.7 612 - 168 2.6Laryngeal C32 39 79.7 31 0.8 7 87.2 6 0.2 46 - 37 0.6
Lung/tracheal C33-C34 1,225 89.3 1,094 29.5 1,200 76.5 918 34.9 2,425 - 2,012 31.7Cervix, uterus C53-C55 0 0.0 0 0.0 161 33.9 55 2.1 161 - 55 0.9Kidney & other unspecified urinary organs
C64-C66, C68 147 46.8 69 1.9 72 12.4 9 0.3 219 - 78 1.2
Bladder C67 239 44.8 107 2.9 88 37.6 33 1.3 327 - 140 2.2
Subtotal 2,356 - 1,685 45.4 1,940 - 1,201 45.6 4,296 - 2,886 45.5
Circulatory System DiseasesHypertension I10-I13 203 24.6 50 1.3 331 16.4 54 2.1 534 - 104 1.6Ischemic heart I20-I25 2,079 * 522 14.1 1,511 * 241 9.2 3,590 - 764 12.0Other forms of heart disease I01-I09, I27, I30-I52 949 26.5 251 6.8 1,211 19.4 235 8.9 2,160 - 486 7.7
Cerebrovascular/stroke I60-I69 900 † 229 6.2 1,270 † 90 3.4 2,170 - 320 5.0Intracranial hemorrhage I70 27 55.5 15 0.4 37 31.7 12 0.4 64 - 27 0.4Aortic aneurysm I71 110 55.5 61 1.6 63 31.7 20 0.8 173 - 81 1.3Other arterial disease I26, I28, I72-I78 115 55.5 64 1.7 128 31.7 41 1.5 243 - 104 1.6
Subtotal 4,383 - 1,193 32.1 4,551 - 693 26.3 8,934 - 1,886 29.7
respiratory System DiseasesPneumonia/influenza (excluding hypostatic)
J09-J181, J188, J189 492 32.7 161 4.3 583 26.3 153 5.8 1,075 - 314 5.0
Bronchitis, emphysema J40-J43 42 84.7 36 1.0 40 79.2 32 1.2 82 - 67 1.1Chronic obstructive pulmonary disorder
J44 744 84.7 630 17.0 691 79.2 547 20.8 1,435 - 1,177 18.6
Other respiratory disease A15-A19, J45-J46 24 32.7 8 0.2 28 26.3 7 0.3 52 - 15 0.2
Subtotal 1,302 - 834 22.5 1,342 - 740 28.1 2,644 - 1,574 24.8
total 8,041 - 3,713 100.0 7,833 - 2,634 100.0 15,874 - 6,347 100.0
TotalMale Female
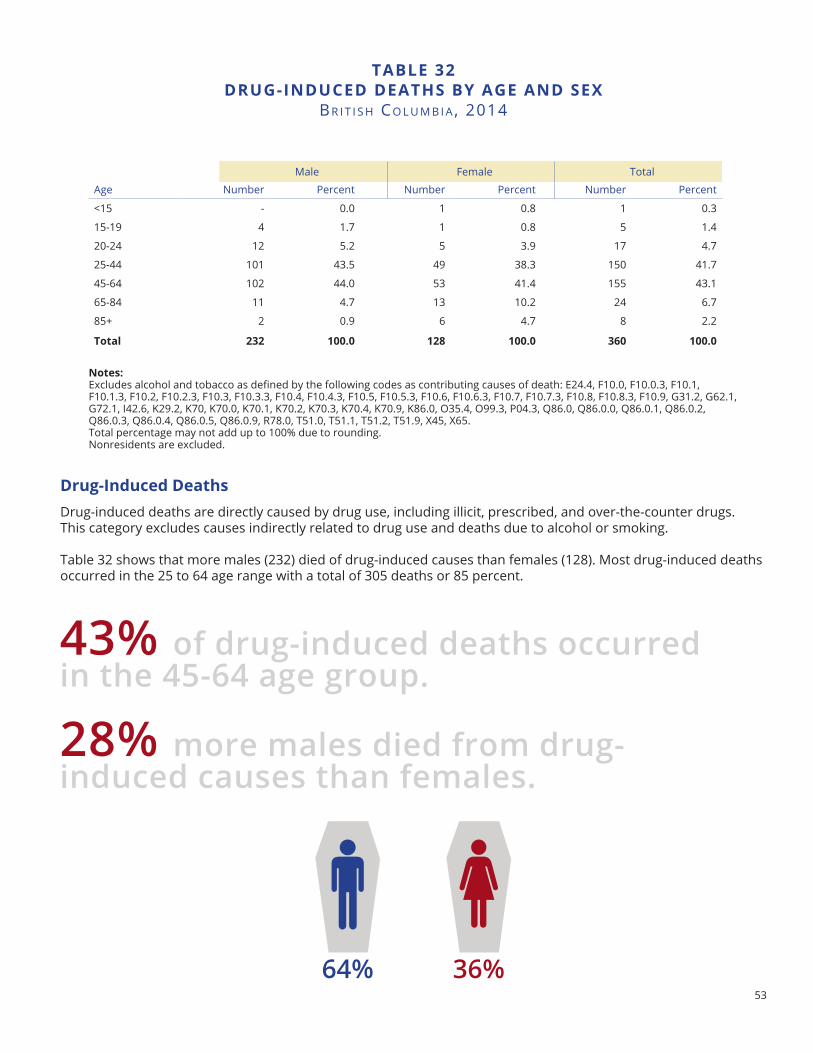
53
taBle 32DrUG-InDUCeD DeatHS BY aGe anD SeX
BR I t I S h Co L u M B I A , 2014
Drug-Induced DeathsDrug-induced deaths are directly caused by drug use, including illicit, prescribed, and over-the-counter drugs. This category excludes causes indirectly related to drug use and deaths due to alcohol or smoking.
Table 32 shows that more males (232) died of drug-induced causes than females (128). Most drug-induced deaths occurred in the 25 to 64 age range with a total of 305 deaths or 85 percent.
43% of drug-induced deaths occurred in the 45-64 age group.
36%64%
28% more males died from drug-induced causes than females.
notes: Excludes alcohol and tobacco as defined by the following codes as contributing causes of death: E24.4, F10.0, F10.0.3, F10.1, F10.1.3, F10.2, F10.2.3, F10.3, F10.3.3, F10.4, F10.4.3, F10.5, F10.5.3, F10.6, F10.6.3, F10.7, F10.7.3, F10.8, F10.8.3, F10.9, G31.2, G62.1, G72.1, I42.6, K29.2, K70, K70.0, K70.1, K70.2, K70.3, K70.4, K70.9, K86.0, O35.4, O99.3, P04.3, Q86.0, Q86.0.0, Q86.0.1, Q86.0.2, Q86.0.3, Q86.0.4, Q86.0.5, Q86.0.9, R78.0, T51.0, T51.1, T51.2, T51.9, X45, X65.Total percentage may not add up to 100% due to rounding.Nonresidents are excluded.
Age Number Percent Number Percent Number Percent
<15 - 0.0 1 0.8 1 0.3
15-19 4 1.7 1 0.8 5 1.4
20-24 12 5.2 5 3.9 17 4.7
25-44 101 43.5 49 38.3 150 41.7
45-64 102 44.0 53 41.4 155 43.1
65-84 11 4.7 13 10.2 24 6.7
85+ 2 0.9 6 4.7 8 2.2
total 232 100.0 128 100.0 360 100.0
Male Female Total
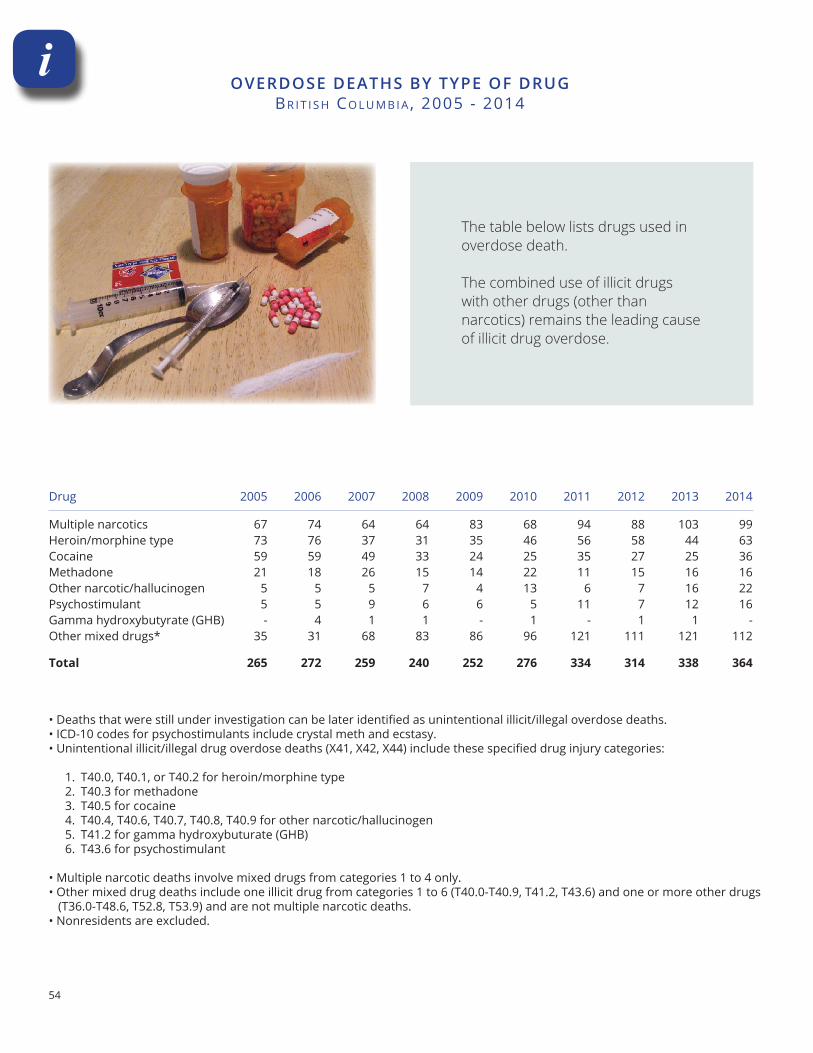
54
iOVERDOSE DEATHS BY TYPE OF DRUG
BR I t I S h Co L u M B I A , 2005 - 2014
Drug 2005 2006 2007 2008 2009 2010 2011 2012 2013 2014
Multiple narcotics 67 74 64 64 83 68 94 88 103 99Heroin/morphine type 73 76 37 31 35 46 56 58 44 63Cocaine 59 59 49 33 24 25 35 27 25 36Methadone 21 18 26 15 14 22 11 15 16 16Other narcotic/hallucinogen 5 5 5 7 4 13 6 7 16 22Psychostimulant 5 5 9 6 6 5 11 7 12 16Gamma hydroxybutyrate (GHB) - 4 1 1 - 1 - 1 1 -Other mixed drugs* 35 31 68 83 86 96 121 111 121 112
total 265 272 259 240 252 276 334 314 338 364
The table below lists drugs used in overdose death.
The combined use of illicit drugs with other drugs (other than narcotics) remains the leading cause of illicit drug overdose.
• Deaths that were still under investigation can be later identified as unintentional illicit/illegal overdose deaths. • ICD-10 codes for psychostimulants include crystal meth and ecstasy. • Unintentional illicit/illegal drug overdose deaths (X41, X42, X44) include these specified drug injury categories:
1. T40.0, T40.1, or T40.2 for heroin/morphine type 2. T40.3 for methadone 3. T40.5 for cocaine 4. T40.4, T40.6, T40.7, T40.8, T40.9 for other narcotic/hallucinogen 5. T41.2 for gamma hydroxybuturate (GHB) 6. T43.6 for psychostimulant
• Multiple narcotic deaths involve mixed drugs from categories 1 to 4 only.• Other mixed drug deaths include one illicit drug from categories 1 to 6 (T40.0-T40.9, T41.2, T43.6) and one or more other drugs (T36.0-T48.6, T52.8, T53.9) and are not multiple narcotic deaths.• Nonresidents are excluded.
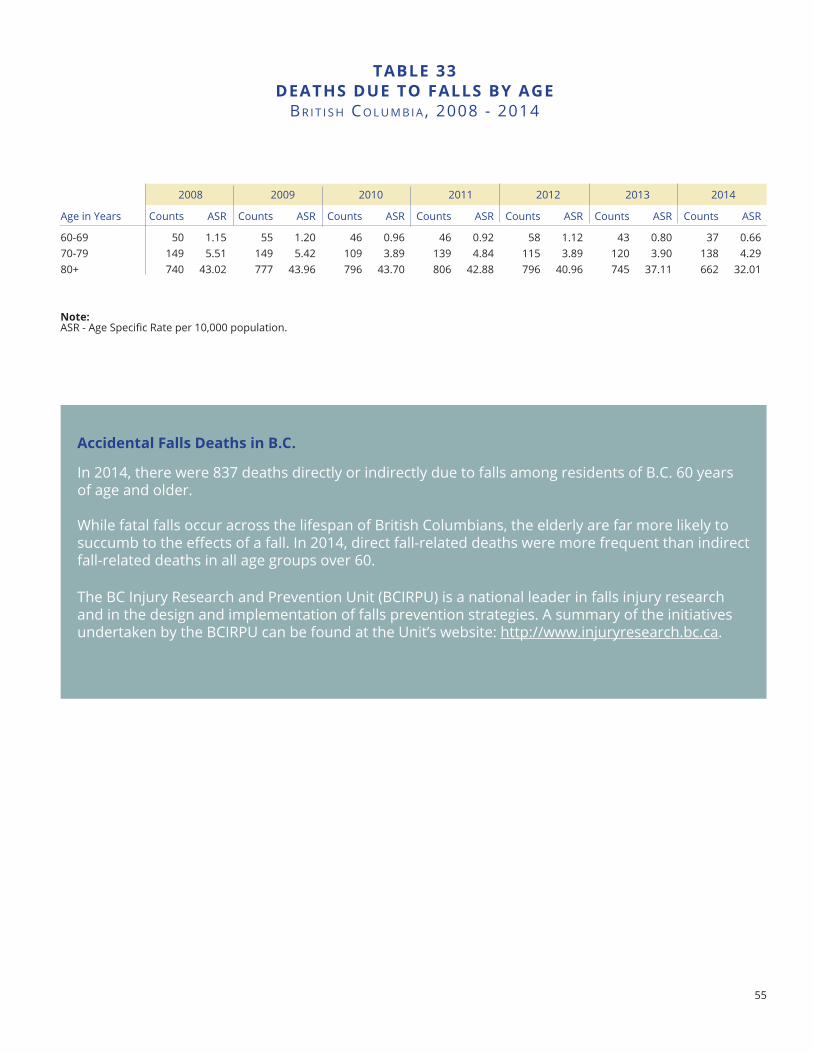
55
accidental falls Deaths in B.C.
In 2014, there were 837 deaths directly or indirectly due to falls among residents of B.C. 60 years of age and older.
While fatal falls occur across the lifespan of British Columbians, the elderly are far more likely to succumb to the effects of a fall. In 2014, direct fall-related deaths were more frequent than indirect fall-related deaths in all age groups over 60.
The BC Injury Research and Prevention Unit (BCIRPU) is a national leader in falls injury research and in the design and implementation of falls prevention strategies. A summary of the initiatives undertaken by the BCIRPU can be found at the Unit’s website: http://www.injuryresearch.bc.ca.
Age in Years Counts ASR Counts ASR Counts ASR Counts ASR Counts ASR Counts ASR Counts ASR
60-69 50 1.15 55 1.20 46 0.96 46 0.92 58 1.12 43 0.80 37 0.6670-79 149 5.51 149 5.42 109 3.89 139 4.84 115 3.89 120 3.90 138 4.2980+ 740 43.02 777 43.96 796 43.70 806 42.88 796 40.96 745 37.11 662 32.01
taBle 33DeatHS DUe to fallS BY aGe
BR I t I S h Co L u M B I A , 2008 - 2014
2008 2009 201220112010 2013 2014
note:ASR - Age Specific Rate per 10,000 population.
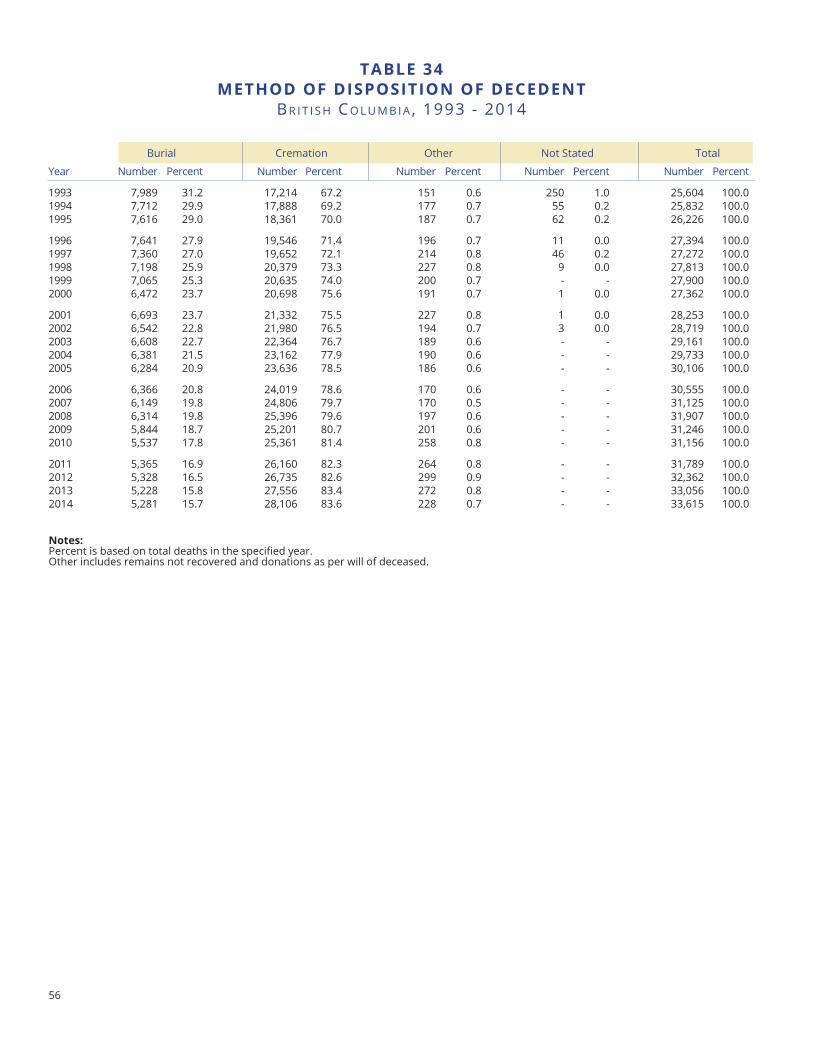
56
taBle 34metHoD of DISPoSItIon of DeCeDent
BR I t I S h Co L u M B I A , 1993 - 2014
Year Number Percent Number Percent Number Percent Number Percent Number Percent
1993 7,989 31.2 17,214 67.2 151 0.6 250 1.0 25,604 100.01994 7,712 29.9 17,888 69.2 177 0.7 55 0.2 25,832 100.01995 7,616 29.0 18,361 70.0 187 0.7 62 0.2 26,226 100.0
1996 7,641 27.9 19,546 71.4 196 0.7 11 0.0 27,394 100.01997 7,360 27.0 19,652 72.1 214 0.8 46 0.2 27,272 100.01998 7,198 25.9 20,379 73.3 227 0.8 9 0.0 27,813 100.01999 7,065 25.3 20,635 74.0 200 0.7 - - 27,900 100.02000 6,472 23.7 20,698 75.6 191 0.7 1 0.0 27,362 100.0
2001 6,693 23.7 21,332 75.5 227 0.8 1 0.0 28,253 100.02002 6,542 22.8 21,980 76.5 194 0.7 3 0.0 28,719 100.02003 6,608 22.7 22,364 76.7 189 0.6 - - 29,161 100.02004 6,381 21.5 23,162 77.9 190 0.6 - - 29,733 100.02005 6,284 20.9 23,636 78.5 186 0.6 - - 30,106 100.0
2006 6,366 20.8 24,019 78.6 170 0.6 - - 30,555 100.02007 6,149 19.8 24,806 79.7 170 0.5 - - 31,125 100.02008 6,314 19.8 25,396 79.6 197 0.6 - - 31,907 100.02009 5,844 18.7 25,201 80.7 201 0.6 - - 31,246 100.02010 5,537 17.8 25,361 81.4 258 0.8 - - 31,156 100.0
2011 5,365 16.9 26,160 82.3 264 0.8 - - 31,789 100.02012 5,328 16.5 26,735 82.6 299 0.9 - - 32,362 100.02013 5,228 15.8 27,556 83.4 272 0.8 - - 33,056 100.02014 5,281 15.7 28,106 83.6 228 0.7 - - 33,615 100.0
Burial Cremation Other Not Stated Total
notes:Percent is based on total deaths in the specified year.Other includes remains not recovered and donations as per will of deceased.
57
The tables in this section contain information about marriages by previous marital status, and ages of the parties involved.
Marriage-RelatedStatistics

58

59
The Agency records all marriages that occur in B.C. Unlike the birth and death statistics, which are based on usual residence, marriage statistics include all marriages performed in the province whether the parties were residents or nonresidents.
The tables in this section contain information about marriages by previous marital status, and the ages of the parties involved. The Agency does not record divorce decrees.
There were 23,020 marriages in British Columbia in 2014. Additional statistics, such as the number of marriages occurring each day are included in the Trends section.
Most popular month to marryAugust
Marriage-Related Statistics
Three Leading Causes of Death in B.C.
See Trends in Vital Events for additional marriage statistics. Data above reflects marriages in B.C. in 2014.
Least popular month to marryJanuary
Most common age to marry30-34
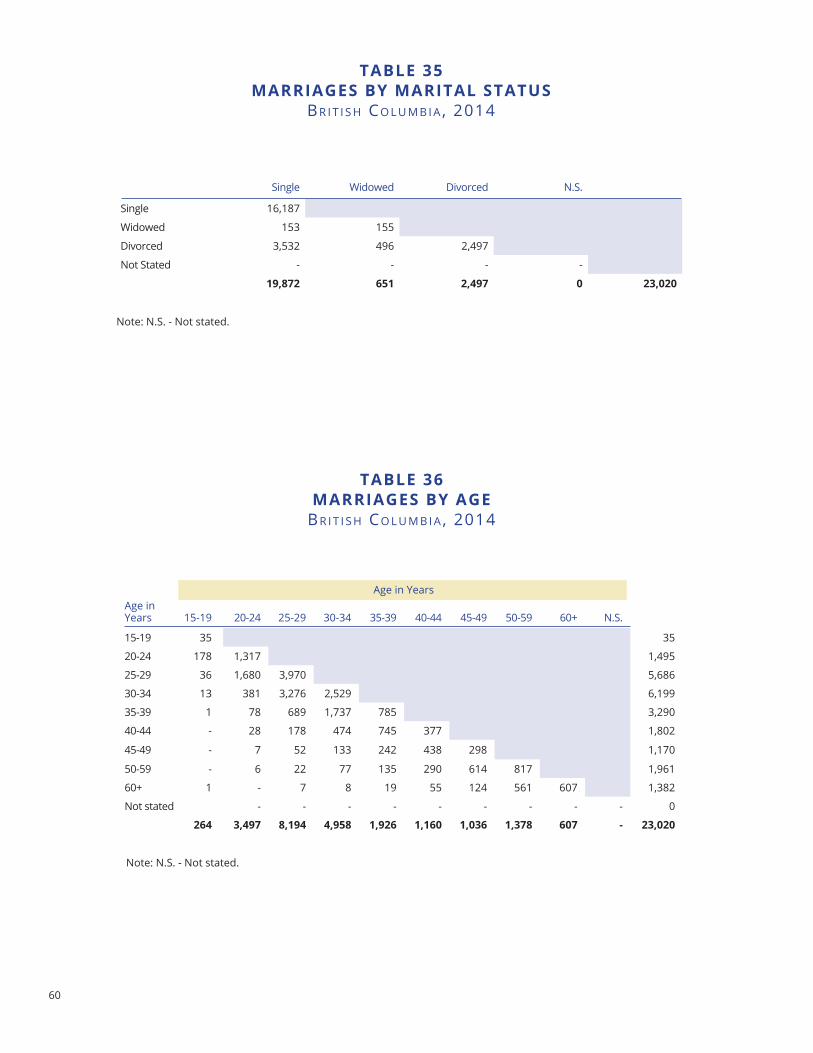
60
Single Widowed Divorced N.S.
Single 16,187
Widowed 153 155
Divorced 3,532 496 2,497
Not Stated - - - -
19,872 651 2,497 0 23,020
taBle 35marrIaGeS BY marItal StatUS
BR I t I S h Co L u M B I A , 2014
taBle 36marrIaGeS BY aGe
BR I t I S h Co L u M B I A , 2014
Age in Years 15-19 20-24 25-29 30-34 35-39 40-44 45-49 50-59 60+ N.S.
15-19 35 35
20-24 178 1,317 1,495
25-29 36 1,680 3,970 5,686
30-34 13 381 3,276 2,529 6,199
35-39 1 78 689 1,737 785 3,290
40-44 - 28 178 474 745 377 1,802
45-49 - 7 52 133 242 438 298 1,170
50-59 - 6 22 77 135 290 614 817 1,961
60+ 1 - 7 8 19 55 124 561 607 1,382
Not stated - - - - - - - - - 0
264 3,497 8,194 4,958 1,926 1,160 1,036 1,378 607 - 23,020
Age in Years
Note: N.S. - Not stated.
Note: N.S. - Not stated.
61
Glossary

62
63
aCQUIreD ImmUnoDefICIenCY SYnDrome (aIDS)See HIV DISEASE.
aGe StanDarDIzatIonAge standardization is a method of calculation which adjusts a statistical measure for differences in the age/sex structures between populations. With standardized measures, more meaningful comparisons can be made between genders, different time periods, or geographic areas because the age standardized statistic is calculated as if all populations had the same age/sex population distribution.
The age standardized measures in this report include age Standardized mortality rate (aSmr), Standardized mortality ratio (Smr), Potential Years of life lost Standardized rate (PYllSr), and Potential Years of life lost Index (PYllI). See examples for headings above in Methodology.
aGe StanDarDIzeD mortalItY rate (aSmr)A summary of age-adjusted death rates by age and sex, which have been standardized to a ‘standard’ population (2011 Canada Census) for the purpose of rate comparisons between sexes, different time periods, or different geographic locations. The ASMR is the theoretical number of deaths that would occur per 10,000 population, if the specific population had the same age structure as the standard population. Age standardization is used for comparisons because populations vary in the proportions of the various ages of the individuals that comprise them, and such differences would in themselves tend to affect the disease occurring in each of the populations.See also AGE STANDARDIZATION and STANDARD POPULATION. For an example, see Age Standardized Mortality Rate in Methodology.
aIDSSee HIV DISEASE.
alCoHol-relateD DeatHSAlcohol-related deaths include deaths where alcohol was a contributing factor (indirectly related) as well as those due to alcohol (directly related). Alcohol-related and drug overdose deaths are the only cause of death categories that are not based entirely upon underlying causes of death.
If any of the conditions listed as directly related to alcohol are noted on the Medical Certificate as antecedent causes giving rise to the underlying cause or as other significant conditions contributing to the death, the death is considered to be indirectly related to alcohol.
Coding practices from 1995 to 1999 may have produced over-counting of alcohol-related mortality. With the introduction of ICD-10 in 2000, more specific codes are available. Currently produced data should not be used in combination with data produced prior to 2000.
aSmrSee AGE STANDARDIZED MORTALITY RATE.
aVeraGe aGeThe average ages of brides, grooms, and mothers of newborns in this annual report are calculated based on information provided on marriage or birth registration forms. The average ages of the population living in data dissemination areas are based on the mid-year population estimates for five-year age groups.
aVeraGe aGe PoPUlatIonThe average age of the population is a grouped average based on the mid-year population estimates for five-year age groups. This information is provided by BC Stats, Ministry of Citizens' Services.
BIrtH orDerDenotes the number position of the present birth relative to previous live births. That is, whether the live birth being counted is the 1st, 2nd, 3rd, etc. live born infant to a particular mother.
Glossary
64
BIrtH rateThe number of live births in a geographical location divided by its mid-year population and converted to a rate per 1,000 population per year.
BIrtH relateD StatIStICSThe birth related statistics shown in this report include teenage mother, elderly gravida, C-section, low birth weight, and preterm live birth rates.
BIrtH WeIGHt The first weight of the fetus or newborn after birth. For live births this weight should be measured within the first hour of life before significant postnatal weight loss has occurred. Hospitals in B.C. measure weight in grams; the approximate equivalents in imperial measures are included below for comparisons to other jurisdictions. For statistical and risk assessment purposes, birth weights are grouped as:
• Extremely Low Birth Weight less than 500 grams (< 1 lb 2 oz)• Very Low Birth Weight 500 grams to 1,499 grams (1 lb 2 oz - 3 lb 5 oz) • Low birth weight (LBW) 1,500 grams to 2,499 grams (3 lb 5 oz - 5 lb 8 oz)• Normal birth weight 2,500 to 4,499 grams (5 lb 8 oz - 9 lb 15 oz) • High birth weight 4,500 grams or more (> 9 lb 15 oz)
In recent years there has been an increasing preference to identify high birth weight as large for gestational age, which is above the 90th percentile of the birth weight distribution at each gestational age.
BIrtHSSee TOTAL BIRTHS.
BreeCH PreSentatIonA delivery of a baby in which the hind end appears first.See also MODE OF DELIVERY.
C-SeCtIonSee MODE OF DELIVERY.
C-SeCtIon rateSThe number of live births delivered by caesarean section in a geographical location divided by its total number of live births and converted to a rate per 1,000 live births.
CaeSarean SeCtIon (C-SeCtIon)A delivery involving the surgical incision of the abdomen and uterine walls.See also MODE OF DELIVERY.
CommUnItYA geographical area defined by a municipal (city, town, village, district municipality, Indian Government district, island municipality, or resort municipality) boundary. In this report, data are only provided for incorporated communities.
ConfIDenCe InterValA measure of the variability of a statistic. A wide confidence interval indicates that the statistic is likely to fall within a wide range of values, while a narrow confidence interval indicates the statistic is likely to fall within a narrow range of values. In general, statistical confidence intervals will be wider for areas with small populations or rare events than for areas with larger populations or more common events. See STATISTICAL TESTS OF SIGNIFICANCE at the end of Methodology.
ConGenItal anomalIeSPhysical defects that existed or date from birth.
CrUDe rateSlive births:The number of live births in a given geographical location divided by its mid-year population converted to a rate per 1,000 population.Birth-related statistics (teenage mother, elderly gravida, C-section, low birth weight, and preterm):The number of births that fall into the category being reported on divided by the total number of live births, converted to a rate per 1,000.
65
Stillbirths and perinatal deaths:The number of stillbirths or perinatal deaths divided by the number of total births (live births plus stillbirths) converted to a rate per 1,000 total births.Infant deaths:The number of infant deaths divided by the number of live births converted to a rate per 1,000 live births.maternal deaths:The number of maternal deaths divided by the number of live births and converted to a rate per 10,000 live births.Deaths and mortality statistics:The number of deaths divided by the mid-year population and converted to a rate per 1,000 population.marriages:The number of marriages divided by the mid-year population and converted to a rate per 1,000 population.
DeatH rateThe number of deaths in a given geographical location divided by its mid-year population and converted to a rate per 1,000 population.
DeatHS DUe to meDICallY treataBle DISeaSeSSee MEDICALLY TREATABLE DISEASES.
DrUG-InDUCeD DeatHSDeaths due to drug-induced causes. This category of deaths excludes unintentional injuries, homicides, and other causes that could be indirectly related to drug use. Deaths directly due to alcohol are also excluded. The causes of death classified as being drug-induced are based on those used by the National Center for Health Statistics.1)
DrUG oVerDoSe DeatHSDeaths where the underlying cause of death was determined to be unintentional poisoning by illicit/illegal drugs. These deaths are a small portion of the deaths due to unintentional poisoning by drugs, and exclude accidental poisoning by drugs in therapeutic use. Deaths due to conditions that may arise from substance abuse, such as Hepatitis 'B' and 'C' and HIV, are also excluded.
Drug overdose deaths can be divided according to drug type: heroin/morphine, methadone, cocaine, psychostimulants including crystal meth (methamphetamine hydrochloride) and ecstasy (methylenedioxymethamphetamine), and other mixed drugs. The ICD-10 codes for these deaths are shown in Table 26. It should be noted that specified drug (nature of injury) codes must also be listed on the Medical Certificate for the death to be considered a drug overdose.
earlY neonatal DeatHSee INFANT DEATH.
elDerlY GraVIDaA woman having a baby at age 35 or older.
elDerlY GraVIDa rateThe number of live births to women age 35 or older in a given geographical location, divided by the total number of live births and converted to a rate per 1,000 live births.
eXPeCteD CaeSarean BIrtHSThe number of live births delivered by caesarean section that would be expected to be born to residents of a sub-provincial geographic area, based on the C-section rate for the province as a whole and the number of births in the sub-provincial geographic area. See Observed versus Expected Ratios in Methodology for an example.
eXPeCteD DeatHSThe number of deaths expected for residents of a sub-provincial geographic area, based on the age specific mortality rates for the province as a whole and the population age structure of the sub-provincial geographic area. See Standardized Mortality Ratio in Methodology for an example.
eXPeCteD loW BIrtH WeIGHtThe number of live births with low birth weight (less than 2,500 grams) that would be expected to be born to residents of a sub-provincial geographic area, based on the low birth weight rate for the province as a whole and the number of live births in the sub-provincial geographic area. See Observed versus Expected Ratios in Methodology for an example.1National Center for Health Statistics (1993). Technical notes. Monthly Vital Statistics Report. 41 (Suppl. 7), 48.
66
eXPeCteD maternal ComPlICatIonSThe number of live births with maternal complications that would be expected to be born to residents of a sub-provincial geographic area, based on the complication rate for the province as a whole and the number of live births in the sub-provincial geographic area.See Observed versus Expected Ratios in Methodology for an example.
eXPeCteD PerInatal ComPlICatIonSThe number of live births with perinatal conditions that would be expected to be born to residents of a sub-provincial geographic area, based on the rate of those conditions for the province as a whole and the number of live births in the sub-provincial geographic area.See Observed versus Expected Ratios in Methodology for an example.
eXPeCteD PotentIal YearS of lIfe loStThe number of potential years of life lost (to age 75 in this report) expected for residents of a sub-provincial geographic area based on the age specific mortality rates for the province as a whole and the population age structure of the sub-provincial geographic area.See Potential Years of Life Lost Index in Methodology for an example.
eXtremelY loW BIrtH WeIGHtSee BIRTH WEIGHT.
eXtremelY PrematUreSee GESTATIONAL AGE.
fertIlItY rateThe number of live births occurring in a given time period divided by the number of women of childbearing age for residents of a geographic area. B.C. rates are per 1,000 women aged 15 to 44; Canadian rates are per 1,000 women aged 15 to 49.
forCePSSee MODE OF DELIVERY.
GeStatIonal aGe Fetal age or duration of pregnancy measured from the first day of the mother’s last normal menstrual period. Gestational age is expressed in completed days or completed weeks (e.g., events occurring 280 to 286 days after the onset of the last normal menstrual period are considered to have occurred at 40 weeks of gestation).
Measurements of fetal growth, as they represent continuous variables, are expressed in relation to a specific week of gestational age as follows:
• Preterm - gestational age younger than 37 weeks• Term - gestational age of 37 to 41 weeks • Post-term - gestational age of 42 weeks or more
Preterm births can be further divided as follows:
• Extremely premature - gestational age of younger than 28 weeks• Moderately premature - gestational age of 28 to 36 weeks
HealtH aUtHorItY (Ha)A geographic subdivision of the province used by the Ministry of Health for administrative and data dissemination purposes. There are five health authorities plus the provincial health authority. Health authorities can be subdivided into 16 health service delivery areas (HSDAs) or 89 local health areas (LHAs).
HealtH SerVICe DelIVerY area (HSDa)A geographic subdivision of the province used by the Ministry of Health for data dissemination purposes. The 16 health service delivery areas can be aggregated into the five health authorities plus the provincial health authority, or subdivided into 89 local health areas (LHAs).
HIGH BIrtH WeIGHtSee BIRTH WEIGHT.
HSDaSee HEALTH SERVICE DELIVERY AREA.
67
HUman ImmUnoDefICIenCY VIrUS (HIV)The virus that causes HIV disease.
HIV DISeaSeIn 1987, the World Health Organization added new codes to the International Classification of Diseases (ICD) to identify Acquired Immunodeficiency Syndrome (AIDS) and Human Immunodeficiency Virus (HIV). In ICD-10, these conditions are coded to B20–B24 and are called HIV disease.
ICD-9 CoDeSThe World Health Organization’s International Classification of Diseases, Ninth Revision. This version of ICD was used by the BC Vital Statistics Agency for coding birth complications and causes of death from 1979 until 1999. Translation tables were developed and extensive manual reviews conducted in order to recode causes of death from ICD-9 to ICD-10, permitting direct comparison of cause of death trends including deaths from 1999 and earlier that were originally coded in ICD-9.
ICD-10 CoDeSThe World Health Organization’s International Statistical Classification of Diseases and Related Health Problems, Tenth Revision, implemented by the BC Vital Statistics Agency on January 1, 2000. The Preamble to Appendix 2 presents a summary of ICD-10 codes.
Infant DeatH Death of a child under one year of age. These deaths are divided according to age at death because of the high mortality rates that occur in the periods soon after birth and because different environmental factors underlie the cause of death in the different time periods.
• Neonatal death - death of a child who is fewer than 28 days old.• Post neonatal death - death of a child who is 28 to 364 days old.
Neonatal deaths are further divided as follows:
• Early neonatal death - death of a child who is fewer than 7 days old.• Late neonatal death - death of a child who is 7 to 27 days old.
Infant mortalItY rateThe number of deaths of children under one year of age expressed as a rate per 1,000 live births. The infant mortality rate is an internationally accepted indicator of the health status of a population.
late neonatal DeatHSee INFANT DEATH.
lBWSee LOW BIRTH WEIGHT.
lHaSee LOCAL HEALTH AREA.
lIfe eXPeCtanCYLife expectancy at birth represents the mean number of years a birth cohort (persons born in the same year) may expect to live given the present mortality experience of a population. The life expectancy for a population is a summary measure that reflects the mortality rates for all ages combined, weighted in accordance with a life-table population structure. Life expectancy is an internationally accepted indicator of the health status of a population. Life expectancy is provided by BC Stats, Ministry of Citizens' Services.
lIVe BIrtHThe Vital Statistics Act defines a live birth as “The complete expulsion or extraction from its mother, irrespective of the duration of the pregnancy, of a product of conception in which, after the expulsion or extraction, there is:(a) breathing;(b) beating of the heart;(c) pulsation of the umbilical cord; or(d) unmistakable movement of voluntary muscle, whether or not the umbilical cord has been cut or the placenta attached.”
lIVe BIrtH rateThe number of live births divided by the mid-year population and converted to a rate per 1,000 population.
68
loCal HealtH area (lHa)A geographic subdivision of the province used by the Ministry of Health for data dissemination purposes. The 89 local health areas can be aggregated into 16 health service delivery areas (HSDAs) or five health authorities plus the provincial health authority.
loW BIrtH WeIGHt (lBW)See BIRTH WEIGHT.
loW BIrtH WeIGHt rateThe number of low birth weight live born babies per 1,000 live births.
marrIaGe rateThe number of marriages divided by the mid-year population and converted to a rate per 1,000 population.
maternal DeatHDeath of a woman while pregnant or within 42 days of a termination of pregnancy from causes related to the pregnancy, but not from accidental or incidental causes.
maternal DeatH rateThe number of maternal deaths divided by the number of live births and converted to a rate per 10,000 live births.
meDICallY treataBle DISeaSeS, DeatHS DUe toDeaths due to medically treatable diseases are based on Charlton’s2 classification. The disease categories are ones for which mortality could potentially have been avoided through appropriate medical intervention. The incidence of deaths from medically treatable diseases can be used by public health professionals as a way of monitoring the effect of health promotion programs.
moDe of DelIVerYThe mode of delivery describes the method by which the baby is extracted or expelled from a mother’s uterus.
Caesarean: A delivery involving the surgical incision of the abdomen and uterine walls.forceps: An assisted delivery using forceps to guide the baby out the birth canal.Spontaneous Breech: An unassisted vaginal delivery in which the buttocks or feet of the fetus appear first.Spontaneous Vertex: An unassisted vaginal delivery in which the head of the fetus appears first.Vacuum: An assisted vaginal delivery employing suction or vacuum.
moDeratelY PrematUreSee GESTATIONAL AGE.
mVa DeatHSMotor Vehicle Accidental Deaths.
natUral PoPUlatIon InCreaSe (nPI)The component increase in a population due to the number of live births less deaths; also called Natural Population Growth. This increase is often expressed as a rate, such as per 1,000 population. It does not include increases due to immigration or decreases due to emigration.
neonatal DeatHDeath of a child under 28 days of age.See also INFANT DEATH.
normal WeIGHtSee BIRTH WEIGHT.
oBSerVeD DeatHSThe actual number of deaths that occurred to residents of a sub-provincial geographic area in a specified time period.
2 Charlton, J.R.H. (1987). Avoidable Deaths and Diseases as Monitors of Health Promotion. In T. Abelin, Z.J. Brzezinski, & V. Carstairs (Eds.),Measurement in Health Promotion and Protection (pp.467-479). Copenhagen, Denmark: World Health Organization, Regional Office forEurope.
69
oBSerVeD loW BIrtH WeIGHt lIVe BIrtHSThe actual number of low birth weight live births that occurred to residents of a sub-provincial geographic area in a specified time period.
oBSerVeD maternal ComPlICatIonSThe actual number of maternal complications that occurred to residents of a sub-provincial geographic area in a specified time period.
oBSerVeD PerInatal ConDItIonSThe actual number of perinatal conditions that occurred to residents of a sub-provincial geographic area in a specified time period.
oBSerVeD PYllThe actual number of potential years of life lost (to age 75) from deaths that occurred to residents of a sub-provincial geographic area in a specified time period.
oVerDoSe DeatHSSee DRUG OVERDOSE DEATHS.
P-ValUeThe probability of rejecting the null hypothesis when a specified test procedure is used on a given data set. The data are statistically significant when the null hypothesis is rejected and not significant otherwise.(See P-Value in Methodology for examples.)
PerInatal Pertaining to or occurring in the period shortly before, during and after birth, starting at 22 completed weeks of gestation and ending seven completed days after birth.
PerInatal DeatH rate The number of perinatal deaths divided by the number of total births (live births plus stillbirths) and converted to a rate per 1,000 total births.
PoPUlatIon The number of people in a specified geographic area. Mid-year population estimates used in the preparation of this report were obtained from BC Stats, Ministry of Citizens' Services.
PoSt matUreSee GESTATIONAL AGE.
PoSt neonatal DeatHSee INFANT DEATH.
PoSt termSee GESTATIONAL AGE.
PotentIal YearS of lIfe loSt (PYll)The number of years of life lost when a person dies before a specified age (75 years). In this report, all deaths are assumed to occur at the midpoint of five-year age groups.See Potential Years of Life Lost Index in Methodology for an example.
PrematUreSee GESTATIONAL AGE.
PretermSee GESTATIONAL AGE.
Preterm rateThe number of preterm live births divided by the number of live births and converted to a rate per 1,000 live births.
70
PYll InDeX (PYllI)The ratio of an area’s observed PYLL to its expected PYLL. This is a health status indicator.See Potential Years of Life Lost Index in Methodology for an example.
PYll StanDarDIzeD rate (PYllSr)An age-standardized measure of an area’s PYLL, expressed in terms of a rate per 1,000 population, adjusted to a standard population (2011 Canada Census). This is a health status indicator.See PYLLSR under “Potential Years of Life Lost (PYLL)” in Methodology for an example.
PYllSee POTENTIAL YEARS OF LIFE LOST.
PYll %The percent of all PYLL in the age group due to a specified cause of death.
PYllISee PYLL INDEX.
PYllSrSee PYLL STANDARDIZED RATE.
QUIntIleA ranking is derived by dividing a group (e.g., LHAs within British Columbia) into five subgroups, each with equal numbers of LHAs. (Since there are 89 LHAs and 89 is not evenly divisible by five, there is one less LHA in the middle group.) These divisions are derived from a ranking of the group members according to the value of a measure, such as the SMR or the PYLLI.
SamSee SMOKING-ATTRIBUTABLE MORTALITY.
SIDSSee SUDDEN INFANT DEATH SYNDROME.
SmoKInG-attrIBUtaBle mortalItY (Sam)The absence on death certifications of complete and reliable data on smoking requires the use of estimation techniques to approximate the extent of smoking-attributable deaths. Estimation methods, while not precise, may at least provide a general indication of the extent of such deaths. This report uses an estimation method based on the concept of attributable risk, which is described in Methodology.
Smoking-attributable deaths are derived by multiplying a smoking-attributable mortality percentage by the number of deaths aged 35+ in specified cause of death categories. These categories are comprised of selected malignant neoplasms, circulatory system diseases, and respiratory system diseases, and are listed in Table 31.See SMOKING-ATTRIBUTABLE MORTALITY in Methodology for more details.
SmrSee STANDARDIZED MORTALITY RATIO.
StanDarD PoPUlatIon A reference population of known age distribution used in the calculation of standardized indicators to adjust for variations in population age structures in different geographic areas or time periods. For SMR and PYLLI calculations the standard population is the British Columbia population for the year(s) concerned. The 2011 Canadian Census is used as the standard population in the calculation of ASMR and PYLLSR.
StanDarDIzeD mortalItY ratIo (Smr)The ratio of the number of deaths occurring to residents of a geographic area (e.g., LHA) to the expected number of deaths in that area based on provincial age-specific mortality rates. The SMR is a good measure for comparing mortality data that are based on a small number of cases or for readily comparing mortality data by geographical area. SMR is an internationally recognized health status indicator. See also AGE STANDARDIZATION and STANDARD POPULATION. See STANDARDIZED MORTALITY RATIO in Methodology for an example.
71
StIllBIrtHSince 1986, the Vital Statistics Act has defined a stillbirth as “the complete expulsion or extraction from its mother after at least 20 weeks of pregnancy, or after attaining a weight of at least 500 grams, of a product of conception in which, after the expul-sion or extraction, there is no breathing, beating of the heart, pulsation of the umbilical cord, or unmistakable movement of voluntary muscle.”
The definition of a stillbirth has changed over the years. From 1950 until July 1, 1962, the definition of a stillbirth was the birth of a viable fetus after at least 28 weeks’ pregnancy in which pulmonary respiration does not occur, whether death occurs before, during, or after birth. From July 1, 1962 until January 1, 1986, the definition of a stillbirth did not include the phrase “or after attaining a weight of at least 500 grams.”
StIllBIrtH rateThe number of stillbirths divided by the number of total births (live births plus stillbirths) and converted to a rate per 1,000 total births.See also CRUDE RATES.
SUDDen Infant DeatH SYnDrome (SIDS)The term was introduced in 1969 to classify sudden death in infants under 12 months of age where there were no apparent factors present to explain the death. This term, and Sudden Unexplained Death in Infancy (SUDI) are classifications that essentially mean a death is unexplained. In June 2012, the majority of Canadian Chief Coroners and Chief Medical Examiners agreed to adopt the classification “Undetermined” as there was an agreement that terms like SIDS and SUDI tended to create confusion rather than clarity, as they all reflected an undetermined cause of death.
teenaGe motHerSMothers younger than 20 years of age.
teenaGe motHer lIVe BIrtH rateThe number of live births to teenage mothers divided by the number of live births and converted to a rate per 1,000 live births.
termA gestational age of 37 to 41 weeks.See also GESTATIONAL AGE.
total BIrtHSThe sum of the number of live births and stillbirths.
total PYllThe total number of potential years of life lost prior to an established cut-off point of 75 years.
UnDerlYInG CaUSe of DeatH (UCoD)The World Health Organization defines the underlying cause of death as “(a) the disease or injury which initiated the train of events leading directly to death, or (b) the circumstances of the accident or violence which produced the fatal injury.”
VaCUUmSee MODE OF DELIVERY.
VerteXSee MODE OF DELIVERY.
VerY loW BIrtH WeIGHtSee BIRTH WEIGHT.

72
73
Methodology

74
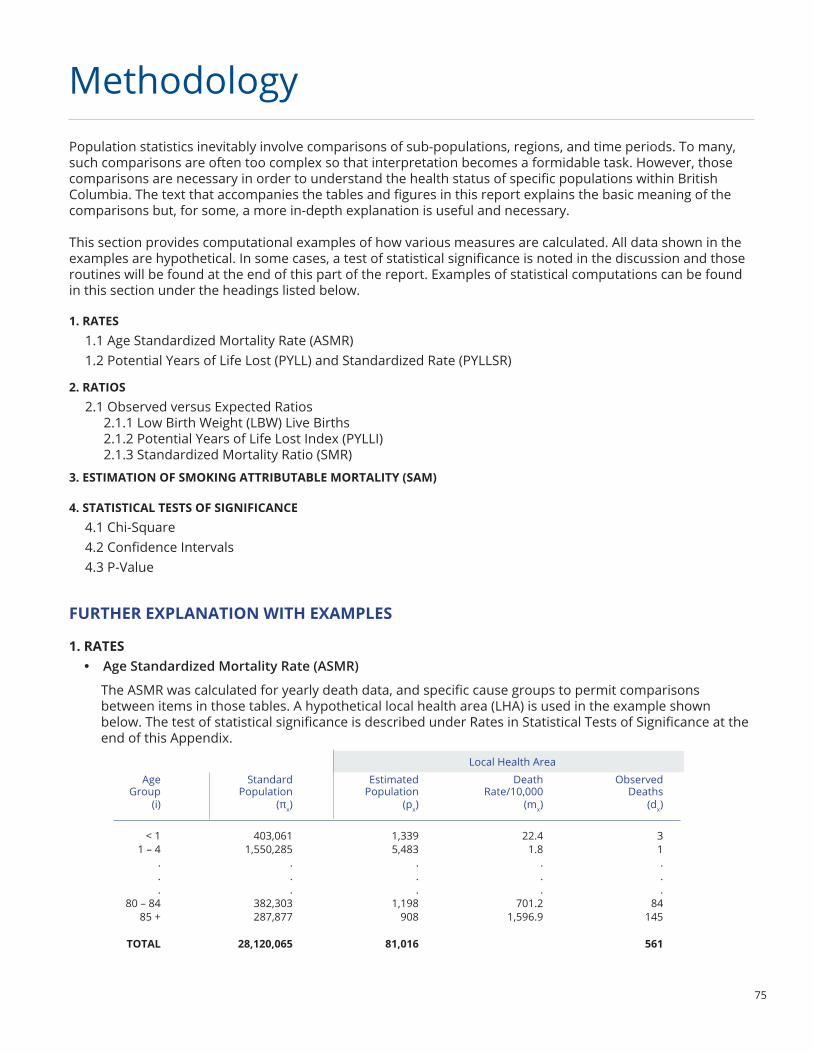
75
MethodologyPopulation statistics inevitably involve comparisons of sub-populations, regions, and time periods. To many, such comparisons are often too complex so that interpretation becomes a formidable task. However, those comparisons are necessary in order to understand the health status of specific populations within British Columbia. The text that accompanies the tables and figures in this report explains the basic meaning of the comparisons but, for some, a more in-depth explanation is useful and necessary.
This section provides computational examples of how various measures are calculated. All data shown in the examples are hypothetical. In some cases, a test of statistical significance is noted in the discussion and those routines will be found at the end of this part of the report. Examples of statistical computations can be found in this section under the headings listed below.
1. rateS 1.1 Age Standardized Mortality Rate (ASMR)1.2 Potential Years of Life Lost (PYLL) and Standardized Rate (PYLLSR)
2. ratIoS 2.1 Observed versus Expected Ratios
2.1.1 Low Birth Weight (LBW) Live Births2.1.2 Potential Years of Life Lost Index (PYLLI)2.1.3 Standardized Mortality Ratio (SMR)
3. eStImatIon of SmoKInG attrIBUtaBle mortalItY (Sam)
4. StatIStICal teStS of SIGnIfICanCe 4.1 Chi-Square4.2 Confidence Intervals4.3 P-Value
fUrtHer eXPlanatIon WItH eXamPleS
1. rateS Age Standardized Mortality Rate (ASMR)
The ASMR was calculated for yearly death data, and specific cause groups to permit comparisons between items in those tables. A hypothetical local health area (LHA) is used in the example shown below. The test of statistical significance is described under Rates in Statistical Tests of Significance at the end of this Appendix.
Age Standard Estimated Death Observed Group Population Population Rate/10,000 Deaths (i) (πx) (px) (mx) (dx)
< 1 403,061 1,339 22.4 3 1 – 4 1,550,285 5,483 1.8 1 . . . . . . . . . . . . . . . 80 – 84 382,303 1,198 701.2 84 85 + 287,877 908 1,596.9 145 total 28,120,065 81,016 561
Local Health Area
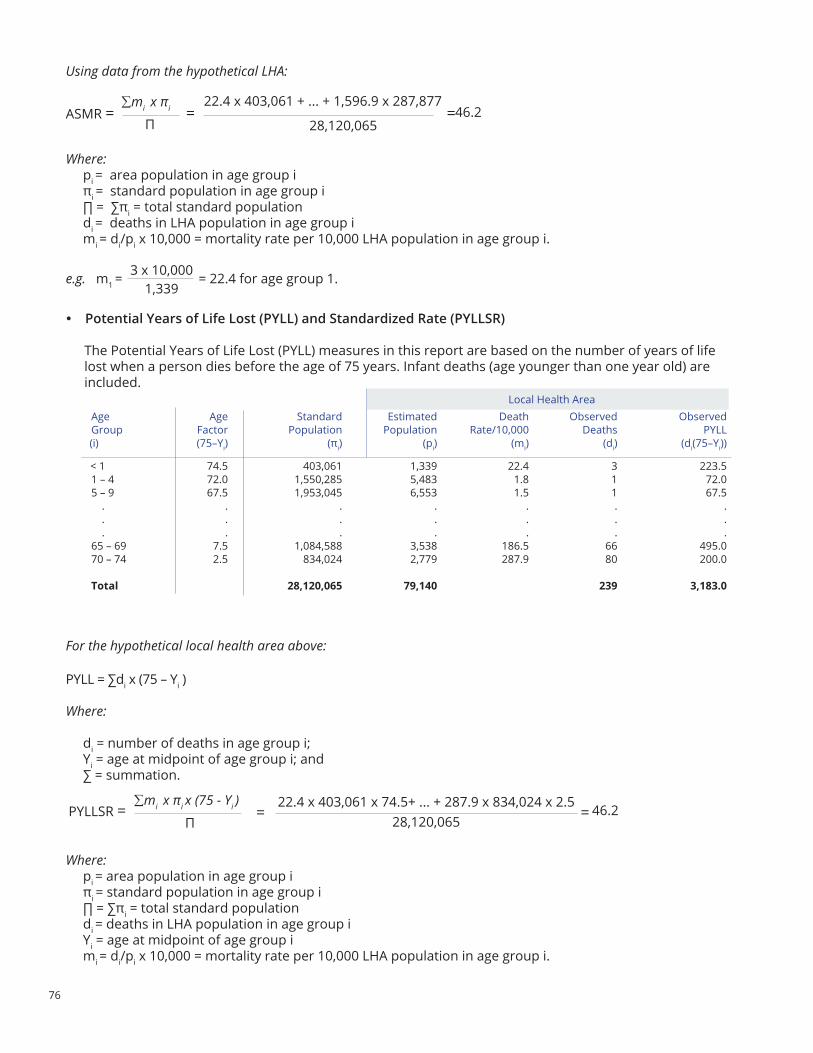
76
Age Age Standard Estimated Death Observed ObservedGroup Factor Population Population Rate/10,000 Deaths PYLL(i) (75–Yi) (πi) (pi) (mi) (di) (di(75–Yi))
< 1 74.5 403,061 1,339 22.4 3 223.51 – 4 72.0 1,550,285 5,483 1.8 1 72.05 – 9 67.5 1,953,045 6,553 1.5 1 67.5 . . . . . . . . . . . . . . . . . . . . .65 – 69 7.5 1,084,588 3,538 186.5 66 495.070 – 74 2.5 834,024 2,779 287.9 80 200.0
total 28,120,065 79,140 239 3,183.0
=46.2
∑mi x πi Π ASMR =
22.4 x 403,061 + ... + 1,596.9 x 287,877
28,120,065= =46.2
Using data from the hypothetical LHA:
Where: pi = area population in age group i πi = standard population in age group i ∏ = ∑πi = total standard population di = deaths in LHA population in age group i mi = di/pi x 10,000 = mortality rate per 10,000 LHA population in age group i.
e.g. m1 = = 22.4 for age group 1.
Potential Years of Life Lost (PYLL) and Standardized Rate (PYLLSR)
The Potential Years of Life Lost (PYLL) measures in this report are based on the number of years of life lost when a person dies before the age of 75 years. Infant deaths (age younger than one year old) are included.
For the hypothetical local health area above:
PYLL = ∑di x (75 – Yi )
Where:
di = number of deaths in age group i; Yi = age at midpoint of age group i; and ∑ = summation.
Where: pi = area population in age group i πi = standard population in age group i ∏ = ∑πi = total standard population di = deaths in LHA population in age group i Yi = age at midpoint of age group i mi = di/pi x 10,000 = mortality rate per 10,000 LHA population in age group i.
PYLLSR = 22.4 x 403,061 x 74.5+ ... + 287.9 x 834,024 x 2.5 28,120,065
=∑mi x πi x (75 - Yi ) Π
Local Health Area
3 x 10,000 1,339
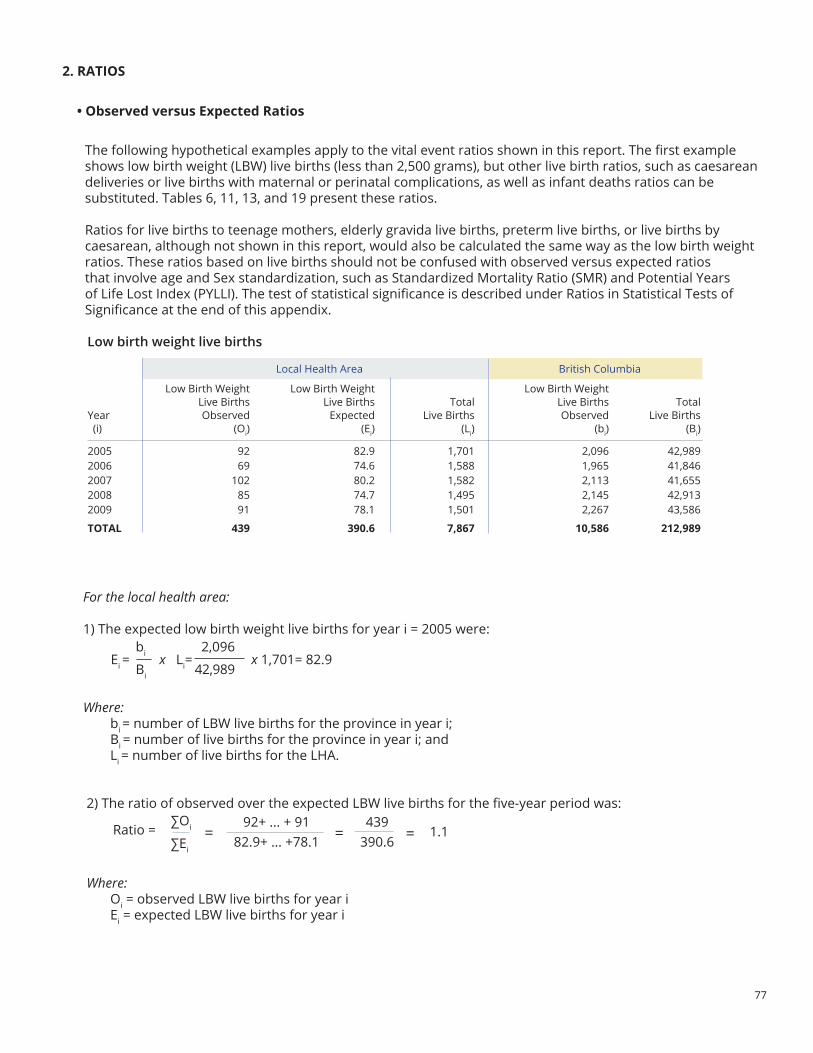
77
Local Health Area British Columbia
Age Age Standard Estimated Death Observed ObservedGroup Factor Population Population Rate/10,000 Deaths PYLL(i) (75–Yi) (πi) (pi) (mi) (di) (di(75–Yi))
< 1 74.5 403,061 1,339 22.4 3 223.51 – 4 72.0 1,550,285 5,483 1.8 1 72.05 – 9 67.5 1,953,045 6,553 1.5 1 67.5 . . . . . . . . . . . . . . . . . . . . .65 – 69 7.5 1,084,588 3,538 186.5 66 495.070 – 74 2.5 834,024 2,779 287.9 80 200.0
total 28,120,065 79,140 239 3,183.0
2. ratIoS
• Observed versus Expected Ratios
The following hypothetical examples apply to the vital event ratios shown in this report. The first example shows low birth weight (LBW) live births (less than 2,500 grams), but other live birth ratios, such as caesarean deliveries or live births with maternal or perinatal complications, as well as infant deaths ratios can be substituted. Tables 6, 11, 13, and 19 present these ratios.
Ratios for live births to teenage mothers, elderly gravida live births, preterm live births, or live births by caesarean, although not shown in this report, would also be calculated the same way as the low birth weight ratios. These ratios based on live births should not be confused with observed versus expected ratios that involve age and Sex standardization, such as Standardized Mortality Ratio (SMR) and Potential Years of Life Lost Index (PYLLI). The test of statistical significance is described under Ratios in Statistical Tests of Significance at the end of this appendix.
Low birth weight live births
For the local health area:
1) The expected low birth weight live births for year i = 2005 were: Ei = x Li= x 1,701= 82.9
Where:bi = number of LBW live births for the province in year i;Bi = number of live births for the province in year i; andLi = number of live births for the LHA.
2) The ratio of observed over the expected LBW live births for the five-year period was:
Where: Oi = observed LBW live births for year iEi = expected LBW live births for year i
Low Birth Weight Low Birth Weight Low Birth Weight Live Births Live Births Total Live Births TotalYear Observed Expected Live Births Observed Live Births (i) (Oi) (Ei) (Li) (bi) (Bi)
2005 92 82.9 1,701 2,096 42,9892006 69 74.6 1,588 1,965 41,8462007 102 80.2 1,582 2,113 41,6552008 85 74.7 1,495 2,145 42,9132009 91 78.1 1,501 2,267 43,586
total 439 390.6 7,867 10,586 212,989
bi
Bi
2,096
42,989
1.1∑Oi ∑Ei
Ratio = 92+ ... + 9182.9+ ... +78.1= =
439390.6 =
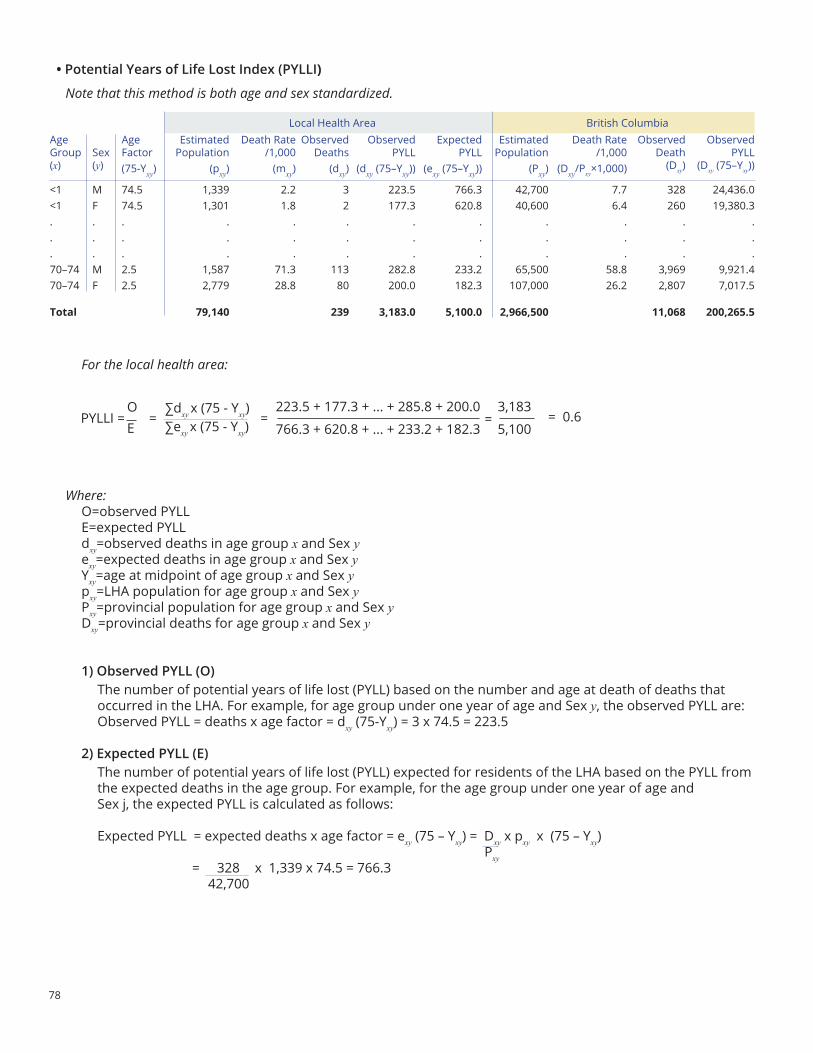
78
• Potential Years of Life Lost Index (PYLLI)
Note that this method is both age and sex standardized.
For the local health area:
Where:O=observed PYLLE=expected PYLLdxy =observed deaths in age group x and Sex yexy=expected deaths in age group x and Sex yYxy =age at midpoint of age group x and Sex ypxy=LHA population for age group x and Sex yPxy=provincial population for age group x and Sex yDxy =provincial deaths for age group x and Sex y
1) Observed PYLL (O) The number of potential years of life lost (PYLL) based on the number and age at death of deaths that
occurred in the LHA. For example, for age group under one year of age and Sex y, the observed PYLL are: Observed PYLL = deaths x age factor = dxy (75-Yxy) = 3 x 74.5 = 223.5
2) Expected PYLL (E) The number of potential years of life lost (PYLL) expected for residents of the LHA based on the PYLL from
the expected deaths in the age group. For example, for the age group under one year of age and Sex j, the expected PYLL is calculated as follows:
Expected PYLL = expected deaths x age factor = exy (75 – Yxy) = Dxy x pxy x (75 – Yxy) Pxy = 328 x 1,339 x 74.5 = 766.3 42,700
PYLLI = = =OE
∑dxy x (75 - Yxy)∑exy x (75 - Yxy)
223.5 + 177.3 + ... + 285.8 + 200.0 3,183
766.3 + 620.8 + ... + 233.2 + 182.3 5,100= = 0.6
Local Health Area British ColumbiaAge Group(x)
Sex(y)
AgeFactor(75-Yxy)
EstimatedPopulation
(pxy)
Death Rate /1,000
(mxy)
Observed Deaths
(dxy)
Observed PYLL
(dxy (75–Yxy))
Expected PYLL
(exy (75–Yxy))
Estimated Population
(Pxy)
Death Rate /1,000
(Dxy/Pxy×1,000)
Observed Death
(Dxy)
ObservedPYLL
(Dxy (75–Yxy))
<1 M 74.5 1,339 2.2 3 223.5 766.3 42,700 7.7 328 24,436.0<1 F 74.5 1,301 1.8 2 177.3 620.8 40,600 6.4 260 19,380.3. . . . . . . . . . . .. . . . . . . . . . . .. . . . . . . . . . . .70–74 M 2.5 1,587 71.3 113 282.8 233.2 65,500 58.8 3,969 9,921.470–74 F 2.5 2,779 28.8 80 200.0 182.3 107,000 26.2 2,807 7,017.5
total 79,140 239 3,183.0 5,100.0 2,966,500 11,068 200,265.5
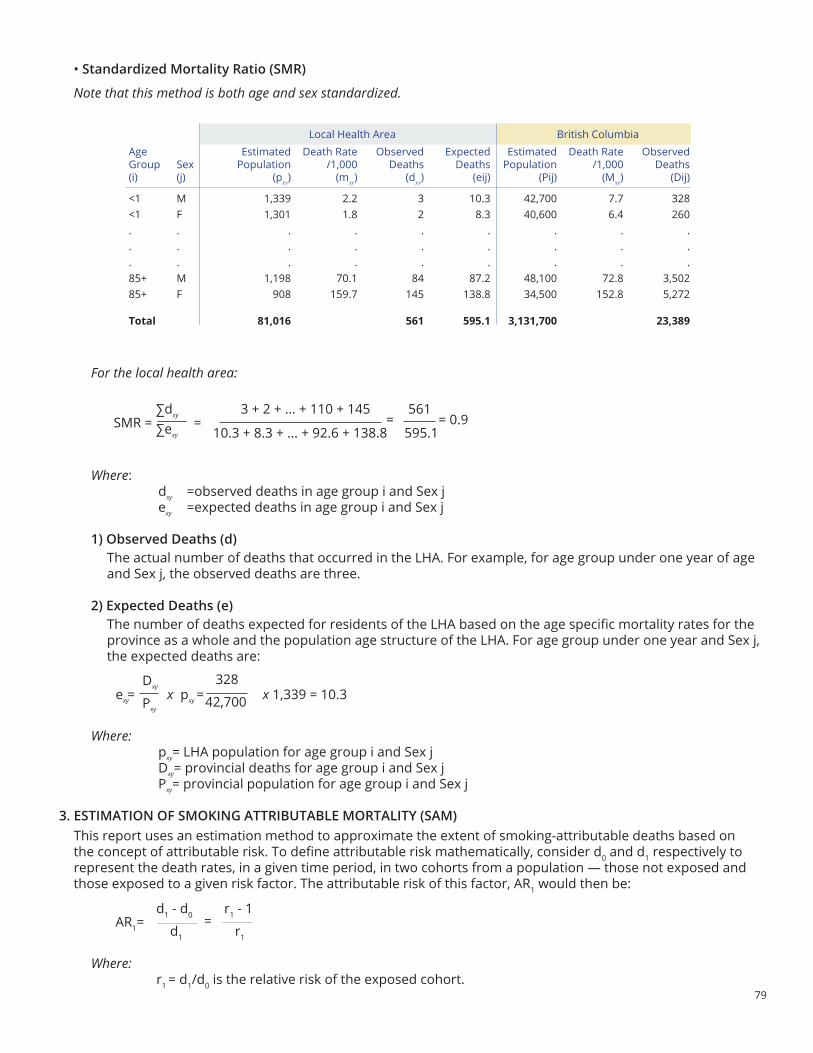
79
• Standardized Mortality Ratio (SMR) Note that this method is both age and sex standardized.
For the local health area:
Where: dxy =observed deaths in age group i and Sex j exy =expected deaths in age group i and Sex j
1) Observed Deaths (d) The actual number of deaths that occurred in the LHA. For example, for age group under one year of age
and Sex j, the observed deaths are three.
2) Expected Deaths (e)The number of deaths expected for residents of the LHA based on the age specific mortality rates for the province as a whole and the population age structure of the LHA. For age group under one year and Sex j, the expected deaths are:
Where: pxy = LHA population for age group i and Sex j Dxy = provincial deaths for age group i and Sex j Pxy = provincial population for age group i and Sex j
3. ESTIMATION OF SMOKING ATTRIBUTABLE MORTALITY (SAM)This report uses an estimation method to approximate the extent of smoking-attributable deaths based on the concept of attributable risk. To define attributable risk mathematically, consider d0 and d1 respectively to represent the death rates, in a given time period, in two cohorts from a population — those not exposed and those exposed to a given risk factor. The attributable risk of this factor, AR1 would then be:
Where: r1 = d1/d0 is the relative risk of the exposed cohort.
3 + 2 + ... + 110 + 145 561
10.3 + 8.3 + ... + 92.6 + 138.8 595.1SMR = =
∑dxy
∑exy
= 0.9=
exy x pxy = x 1,339 = 10.3Dxy
Pxy
328
42,700=
AR1=d1 - d0 r1 - 1
d1 r1
=
Local Health Area British ColumbiaAge Group(i)
Sex(j)
EstimatedPopulation
(pxy)
Death Rate /1,000
(mxy)
Observed Deaths
(dxy)
Expected Deaths
(eij)
Estimated Population
(Pij)
Death Rate /1,000
(Mxy)
Observed Deaths
(Dij)
<1 M 1,339 2.2 3 10.3 42,700 7.7 328<1 F 1,301 1.8 2 8.3 40,600 6.4 260. . . . . . . . .. . . . . . . . .. . . . . . . . .85+ M 1,198 70.1 84 87.2 48,100 72.8 3,50285+ F 908 159.7 145 138.8 34,500 152.8 5,272
total 81,016 561 595.1 3,131,700 23,389
80
The relative risk of the unexposed cohort is r0 = 1; the attributable risk of this cohort is AR0 = 0.
The attributable risk (AR) for the population as a whole (exposed plus unexposed cohorts) is given by:
Where: p1 = The proportion or fraction of the population exposed to the risk factor 1-p1 = The proportion or fraction of the population not exposed to the risk factor
This may be extended to account for multiple levels of exposure, as follows:
Where:pi = The proportion (prevalence) of the population in the ith level of exposure groupri = The relative risk at the ith level of exposurei = The ith risk category
When applied to smoking-attributable mortality (SAM), the attributable risk is often expressed as a percent-age:
SAM (%) = AR x 100
Smoking-attributable deaths are derived by multiplying the smoking-attributable mortality percentage expressed as a decimal fraction by the number of deaths aged 35+ in each of 19 specified cause of death categories. These categories are comprised of selected malignant neoplasms, circulatory system diseases, and respiratory system diseases, and are listed in the Glossary.
Relative-risk data from the American Society’s Cancer Prevention Study (CPS-II) 1982–19881 were selected for use, as they have been widely used for similar analyses. The data from CPS–II established the age groups and the classification of smokers (current, former, and never) for which smoking prevalence data were required. The relative risk age categories were for 35+, or 35-64 and 65+. B.C. prevalence rates for smoking were provided in the Tobacco Use in B.C. (1997) survey commissioned by the Heart and Stroke Foundation of BC and Yukon.2
4. StatIStICal teStS of SIGnIfICanCe • Chi Square
For ratios, such as SMRs, a Chi-square ( X2 ) test is applied to determine whether the observed number of cases is statistically significantly different from the expected number. For LHA l:
(with one degree of freedom)
Where: Ol = Observed number for LHA l El = Expected number for LHA l
If X2l > 3.84, the ratio is statistically significant at 5% significance level.
AR = p1 ( r1 - 1) (p1) (r1 - 1)
p1 ( r1) + (1 - p1) (r0) (p1) ( r1 - 1) + 1 =
AR =
n
∑ pi(ri - 1)i = i
n
∑ pi(ri - 1) + 1i = i
X2l = (Ol - El)
2
El
1Centres for Disease Control. (1990). Smoking and health: A national status report. (DHSS publication no. (CDC) 87-8396). 2nd Edition. Rockville, MD: U.S. Department of Health and Human Services.2Tobacco Use in B.C., ANGUS REID GROUP survey results, September 1997.
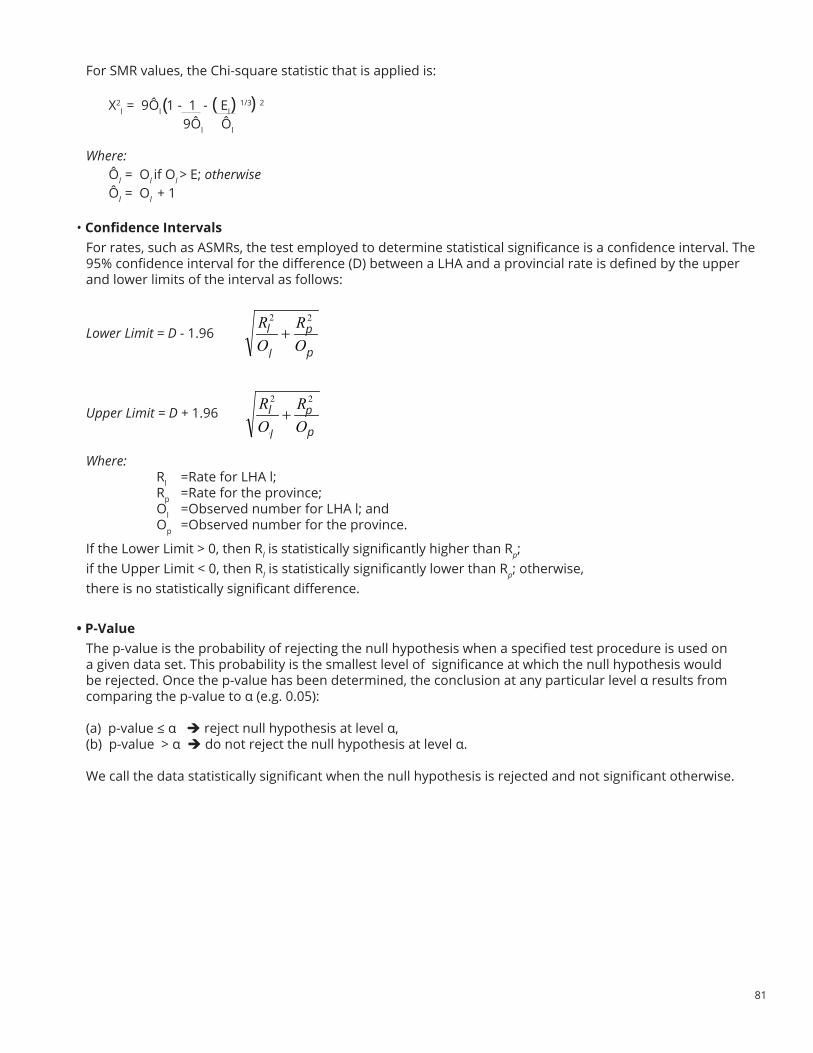
81
( (((
For SMR values, the Chi-square statistic that is applied is:
X2l = 9Ôl 1 - 1 - El
1/3 2
9Ôl
Ôl
Where: Ôl = Ol if Ol > E; otherwise Ôl = Ol + 1
• Confidence IntervalsFor rates, such as ASMRs, the test employed to determine statistical significance is a confidence interval. The 95% confidence interval for the difference (D) between a LHA and a provincial rate is defined by the upper and lower limits of the interval as follows:
Lower Limit = D - 1.96
Upper Limit = D + 1.96
Where: Rl = Rate for LHA l; Rp = Rate for the province; Ol = Observed number for LHA l; and Op = Observed number for the province.
If the Lower Limit > 0, then Rl is statistically significantly higher than Rp;if the Upper Limit < 0, then Rl is statistically significantly lower than Rp; otherwise,there is no statistically significant difference.
• P-ValueThe p-value is the probability of rejecting the null hypothesis when a specified test procedure is used on a given data set. This probability is the smallest level of significance at which the null hypothesis would be rejected. Once the p-value has been determined, the conclusion at any particular level α results from comparing the p-value to α (e.g. 0.05):
(a) p-value ≤ α reject null hypothesis at level α,(b) p-value > α do not reject the null hypothesis at level α.
We call the data statistically significant when the null hypothesis is rejected and not significant otherwise.
H
H
C
C
OR
OR
DLimitUpper22
96.1 ++=
H
H
C
C
OR
OR
DLimitUpper22
96.1 ++=l
l p
p
l
p
p
l

82
83
Statistical Summaries by Health Authority, Health Service Delivery Area, Local Health Area and CommunityBritish Columbia, 2014
Appendix One

84
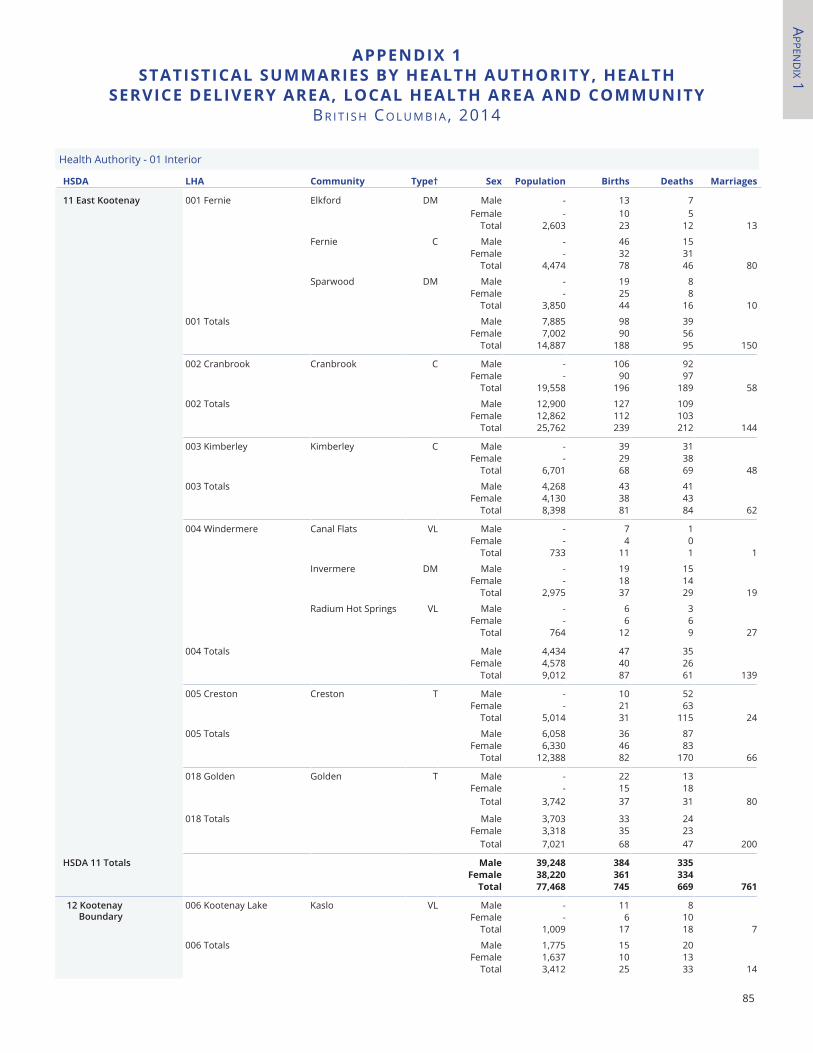
APPen
dIx 1
85
aPPenDIX 1StatIStICal SUmmarIeS BY HealtH aUtHorItY, HealtH
SerVICe DelIVerY area, loCal HealtH area anD CommUnItYBR I t I S h Co L u M B I A , 2014
HSDa lHa Community type† Sex Population Births Deaths marriages
11 East Kootenay 001 Fernie Elkford DM Male - 13 7Female - 10 5
Total 2,603 23 12 13
Fernie C Male - 46 15Female - 32 31
Total 4,474 78 46 80
Sparwood DM Male - 19 8Female - 25 8
Total 3,850 44 16 10
001 Totals Male 7,885 98 39Female 7,002 90 56
Total 14,887 188 95 150
002 Cranbrook Cranbrook C Male - 106 92Female - 90 97
Total 19,558 196 189 58
002 Totals Male 12,900 127 109Female 12,862 112 103
Total 25,762 239 212 144
003 Kimberley Kimberley C Male - 39 31Female - 29 38
Total 6,701 68 69 48
003 Totals Male 4,268 43 41Female 4,130 38 43
Total 8,398 81 84 62
004 Windermere Canal Flats VL Male - 7 1Female - 4 0
Total 733 11 1 1
Invermere DM Male - 19 15Female - 18 14
Total 2,975 37 29 19
Radium Hot Springs VL Male - 6 3Female - 6 6
Total 764 12 9 27
004 Totals Male 4,434 47 35Female 4,578 40 26
Total 9,012 87 61 139
005 Creston Creston T Male - 10 52Female - 21 63
Total 5,014 31 115 24
005 Totals Male 6,058 36 87Female 6,330 46 83
Total 12,388 82 170 66
018 Golden Golden T Male - 22 13Female - 15 18
Total 3,742 37 31 80
018 Totals Male 3,703 33 24Female 3,318 35 23
Total 7,021 68 47 200
HSDA 11 Totals male 39,248 384 335female 38,220 361 334
total 77,468 745 669 761
12 Kootenay Boundary
006 Kootenay Lake Kaslo VL Male - 11 8Female - 6 10
Total 1,009 17 18 7
006 Totals Male 1,775 15 20Female 1,637 10 13
Total 3,412 25 33 14
Health Authority - 01 Interior
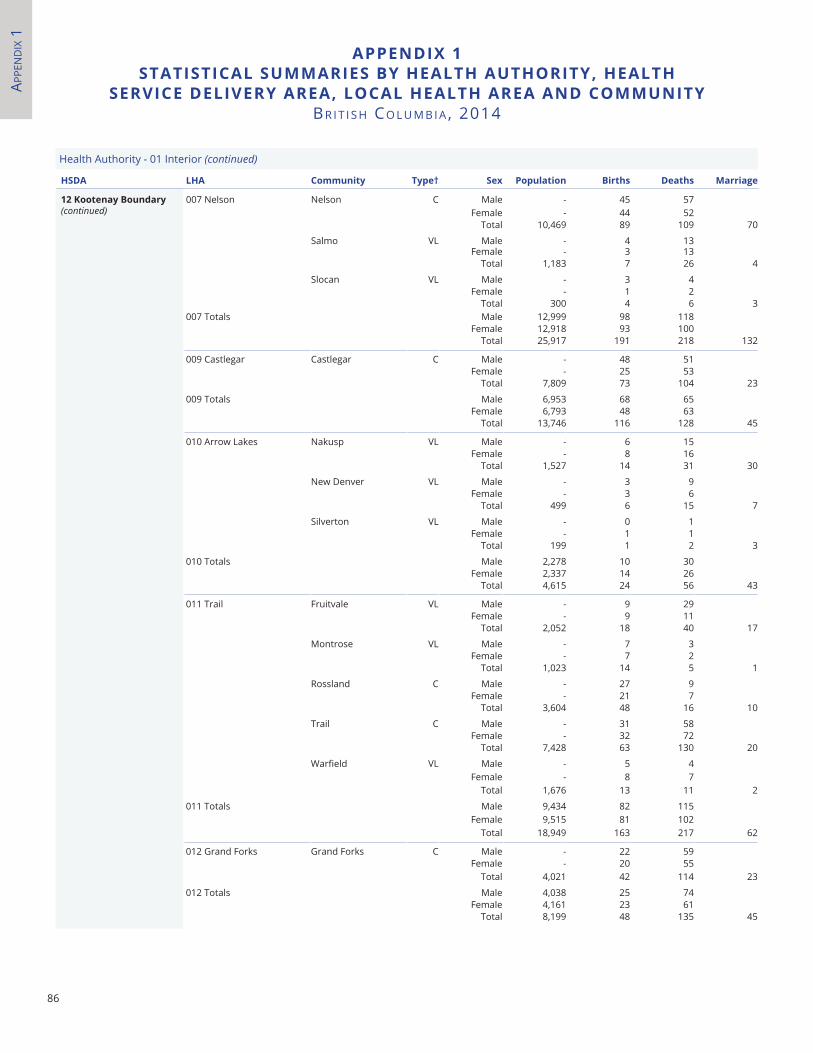
APPe
nd
Ix 1
86
aPPenDIX 1 StatIStICal SUmmarIeS BY HealtH aUtHorItY, HealtH
SerVICe DelIVerY area, loCal HealtH area anD CommUnItYBR I t I S h Co L u M B I A , 2014
Health Authority - 01 Interior (continued)
HSDa lHa Community type† Sex Population Births Deaths marriage
12 Kootenay Boundary (continued)
007 Nelson Nelson C Male - 45 57Female - 44 52
Total 10,469 89 109 70
Salmo VL Male - 4 13Female - 3 13
Total 1,183 7 26 4
Slocan VL Male - 3 4Female - 1 2
Total 300 4 6 3007 Totals Male 12,999 98 118
Female 12,918 93 100Total 25,917 191 218 132
009 Castlegar Castlegar C Male - 48 51Female - 25 53
Total 7,809 73 104 23
009 Totals Male 6,953 68 65Female 6,793 48 63
Total 13,746 116 128 45
010 Arrow Lakes Nakusp VL Male - 6 15Female - 8 16
Total 1,527 14 31 30
New Denver VL Male - 3 9Female - 3 6
Total 499 6 15 7
Silverton VL Male - 0 1Female - 1 1
Total 199 1 2 3
010 Totals Male 2,278 10 30Female 2,337 14 26
Total 4,615 24 56 43
011 Trail Fruitvale VL Male - 9 29Female - 9 11
Total 2,052 18 40 17
Montrose VL Male - 7 3Female - 7 2
Total 1,023 14 5 1
Rossland C Male - 27 9Female - 21 7
Total 3,604 48 16 10
Trail C Male - 31 58Female - 32 72
Total 7,428 63 130 20
Warfield VL Male - 5 4Female - 8 7
Total 1,676 13 11 2
011 Totals Male 9,434 82 115Female 9,515 81 102
Total 18,949 163 217 62
012 Grand Forks Grand Forks C Male - 22 59Female - 20 55
Total 4,021 42 114 23
012 Totals Male 4,038 25 74Female 4,161 23 61
Total 8,199 48 135 45
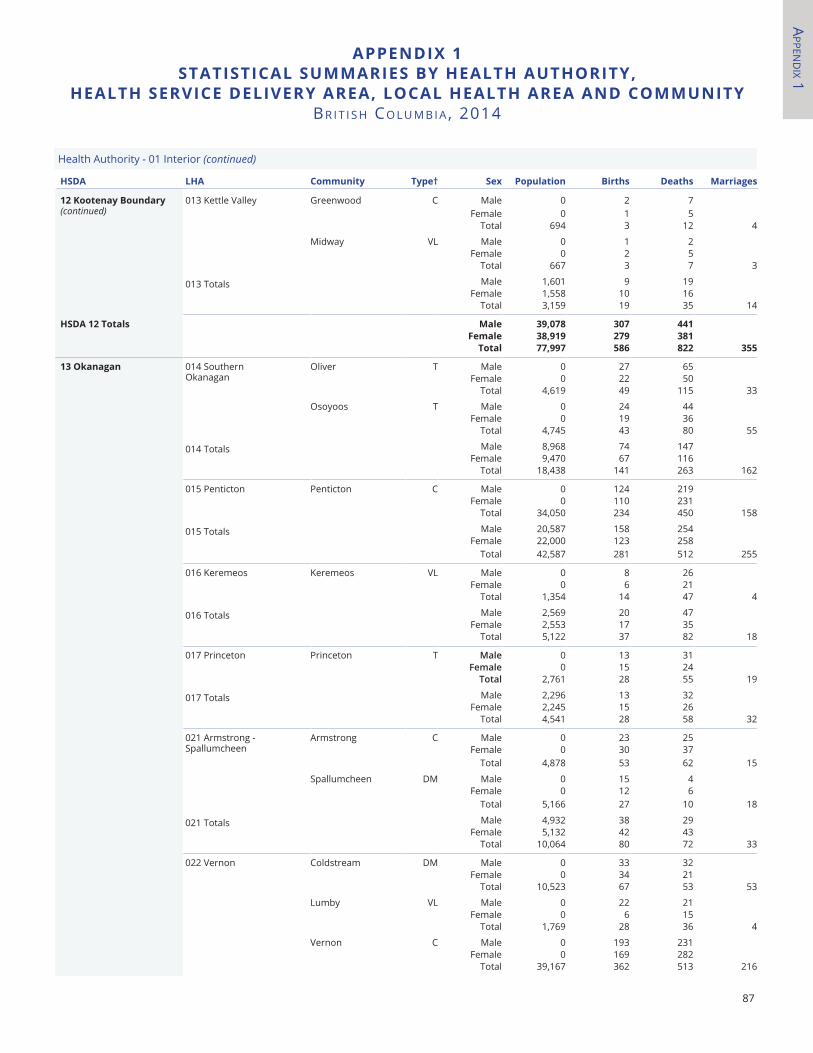
APPen
dIx 1
87
aPPenDIX 1StatIStICal SUmmarIeS BY HealtH aUtHorItY,
HealtH SerVICe DelIVerY area, loCal HealtH area anD CommUnItYBR I t I S h Co L u M B I A , 2014
HSDa lHa Community type† Sex Population Births Deaths marriages
12 Kootenay Boundary (continued)
013 Kettle Valley Greenwood C Male 0 2 7Female 0 1 5
Total 694 3 12 4
Midway VL Male 0 1 2Female 0 2 5
Total 667 3 7 3
013 Totals Male 1,601 9 19Female 1,558 10 16
Total 3,159 19 35 14
HSDa 12 totals male 39,078 307 441female 38,919 279 381
total 77,997 586 822 355
13 okanagan 014 Southern Okanagan
Oliver T Male 0 27 65Female 0 22 50
Total 4,619 49 115 33
Osoyoos T Male 0 24 44Female 0 19 36
Total 4,745 43 80 55
014 Totals Male 8,968 74 147Female 9,470 67 116
Total 18,438 141 263 162
015 Penticton Penticton C Male 0 124 219Female 0 110 231
Total 34,050 234 450 158
015 Totals Male 20,587 158 254Female 22,000 123 258
Total 42,587 281 512 255
016 Keremeos Keremeos VL Male 0 8 26Female 0 6 21
Total 1,354 14 47 4
016 Totals Male 2,569 20 47Female 2,553 17 35
Total 5,122 37 82 18
017 Princeton Princeton T Male 0 13 31Female 0 15 24
Total 2,761 28 55 19
017 Totals Male 2,296 13 32Female 2,245 15 26
Total 4,541 28 58 32
021 Armstrong - Spallumcheen
Armstrong C Male 0 23 25Female 0 30 37
Total 4,878 53 62 15
Spallumcheen DM Male 0 15 4Female 0 12 6
Total 5,166 27 10 18
021 Totals Male 4,932 38 29Female 5,132 42 43
Total 10,064 80 72 33
022 Vernon Coldstream DM Male 0 33 32Female 0 34 21
Total 10,523 67 53 53
Lumby VL Male 0 22 21Female 0 6 15
Total 1,769 28 36 4
Vernon C Male 0 193 231Female 0 169 282
Total 39,167 362 513 216
Health Authority - 01 Interior (continued)
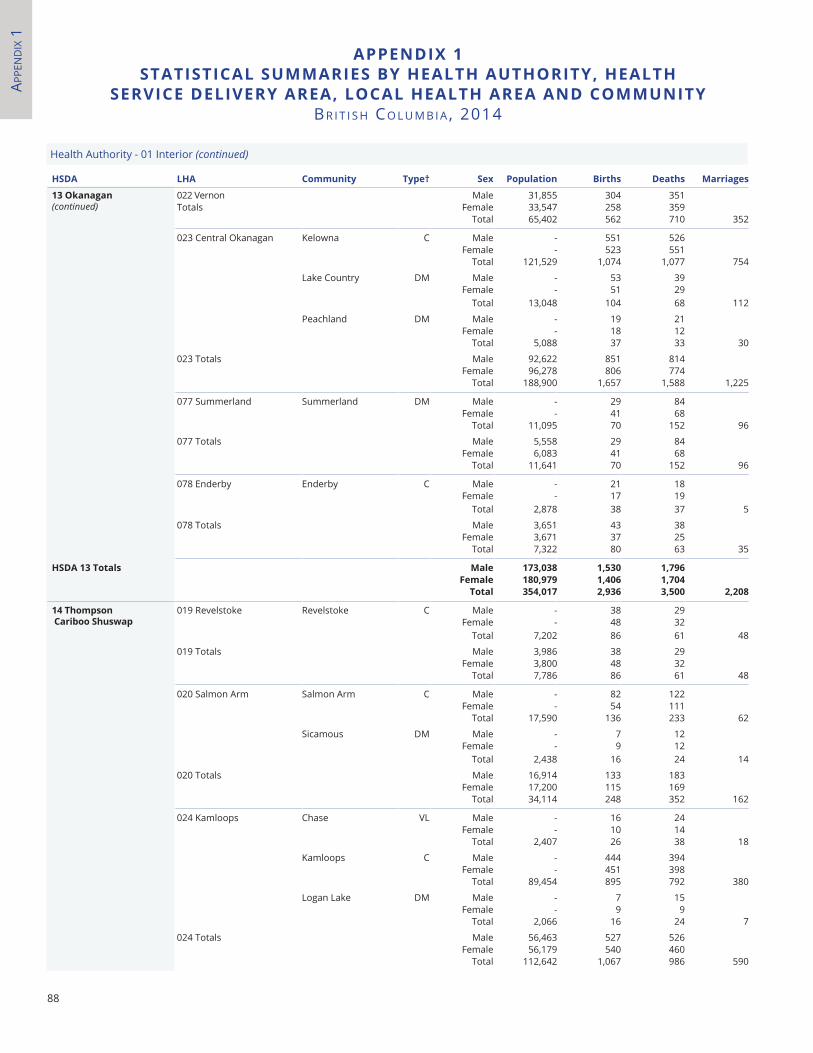
APPe
nd
Ix 1
88
aPPenDIX 1StatIStICal SUmmarIeS BY HealtH aUtHorItY, HealtH
SerVICe DelIVerY area, loCal HealtH area anD CommUnItYBR I t I S h Co L u M B I A , 2014
HSDa lHa Community type† Sex Population Births Deaths marriages
13 okanagan (continued)
022 Vernon Male 31,855 304 351Totals Female 33,547 258 359
Total 65,402 562 710 352
023 Central Okanagan Kelowna C Male - 551 526Female - 523 551
Total 121,529 1,074 1,077 754
Lake Country DM Male - 53 39Female - 51 29
Total 13,048 104 68 112
Peachland DM Male - 19 21Female - 18 12
Total 5,088 37 33 30
023 Totals Male 92,622 851 814Female 96,278 806 774
Total 188,900 1,657 1,588 1,225
077 Summerland Summerland DM Male - 29 84Female - 41 68
Total 11,095 70 152 96
077 Totals Male 5,558 29 84Female 6,083 41 68
Total 11,641 70 152 96
078 Enderby Enderby C Male - 21 18Female - 17 19
Total 2,878 38 37 5
078 Totals Male 3,651 43 38Female 3,671 37 25
Total 7,322 80 63 35
HSDa 13 totals male 173,038 1,530 1,796female 180,979 1,406 1,704
total 354,017 2,936 3,500 2,208
14 thompson Cariboo Shuswap
019 Revelstoke Revelstoke C Male - 38 29Female - 48 32
Total 7,202 86 61 48
019 Totals Male 3,986 38 29Female 3,800 48 32
Total 7,786 86 61 48
020 Salmon Arm Salmon Arm C Male - 82 122Female - 54 111
Total 17,590 136 233 62
Sicamous DM Male - 7 12Female - 9 12
Total 2,438 16 24 14
020 Totals Male 16,914 133 183Female 17,200 115 169
Total 34,114 248 352 162
024 Kamloops Chase VL Male - 16 24Female - 10 14
Total 2,407 26 38 18
Kamloops C Male - 444 394Female - 451 398
Total 89,454 895 792 380
Logan Lake DM Male - 7 15Female - 9 9
Total 2,066 16 24 7
024 Totals Male 56,463 527 526Female 56,179 540 460
Total 112,642 1,067 986 590
Health Authority - 01 Interior (continued)
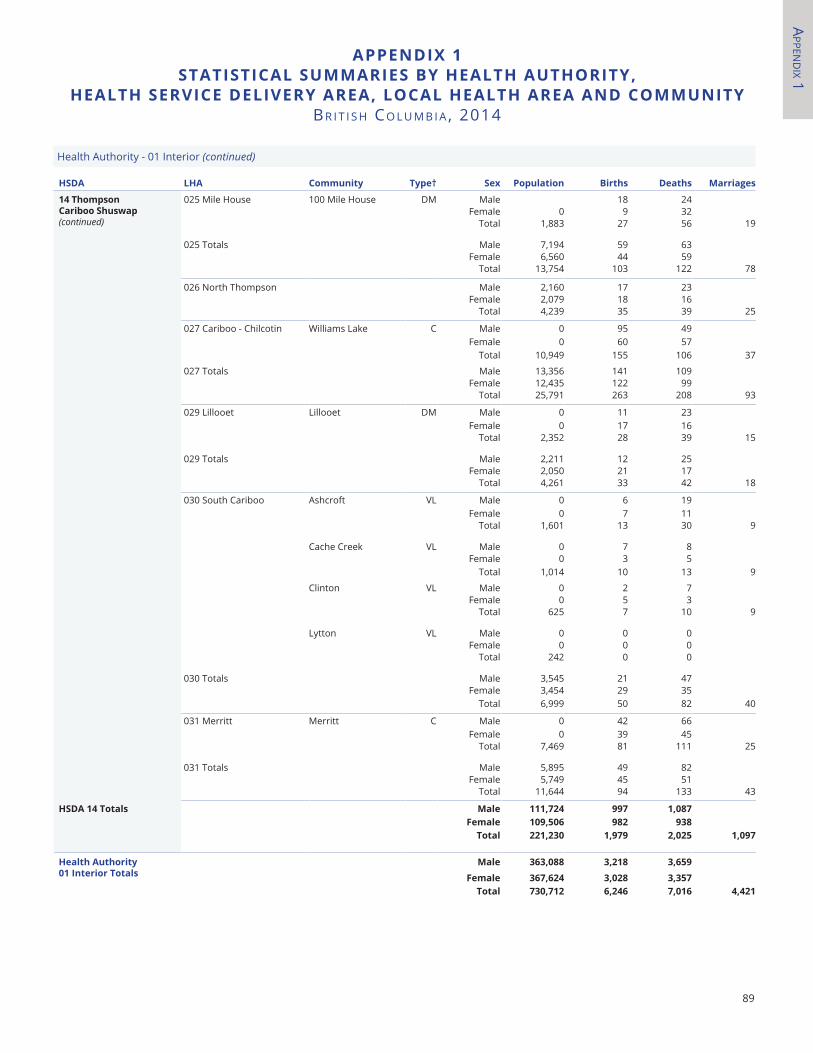
APPen
dIx 1
89
aPPenDIX 1 StatIStICal SUmmarIeS BY HealtH aUtHorItY,
HealtH SerVICe DelIVerY area, loCal HealtH area anD CommUnItYBR I t I S h Co L u M B I A , 2014
HSDa lHa Community type† Sex Population Births Deaths marriages
14 thompson Cariboo Shuswap (continued)
025 Mile House 100 Mile House DM Male 18 24Female 0 9 32
Total 1,883 27 56 19
025 Totals Male 7,194 59 63Female 6,560 44 59
Total 13,754 103 122 78
026 North Thompson Male 2,160 17 23Female 2,079 18 16
Total 4,239 35 39 25
027 Cariboo - Chilcotin Williams Lake C Male 0 95 49Female 0 60 57
Total 10,949 155 106 37
027 Totals Male 13,356 141 109Female 12,435 122 99
Total 25,791 263 208 93
029 Lillooet Lillooet DM Male 0 11 23Female 0 17 16
Total 2,352 28 39 15
029 Totals Male 2,211 12 25Female 2,050 21 17
Total 4,261 33 42 18
030 South Cariboo Ashcroft VL Male 0 6 19Female 0 7 11
Total 1,601 13 30 9
Cache Creek VL Male 0 7 8Female 0 3 5
Total 1,014 10 13 9
Clinton VL Male 0 2 7Female 0 5 3
Total 625 7 10 9
Lytton VL Male 0 0 0Female 0 0 0
Total 242 0 0
030 Totals Male 3,545 21 47Female 3,454 29 35
Total 6,999 50 82 40
031 Merritt Merritt C Male 0 42 66Female 0 39 45
Total 7,469 81 111 25
031 Totals Male 5,895 49 82Female 5,749 45 51
Total 11,644 94 133 43
HSDa 14 totals male 111,724 997 1,087female 109,506 982 938
total 221,230 1,979 2,025 1,097
Health authority 01 Interior totals
male 363,088 3,218 3,659
female 367,624 3,028 3,357total 730,712 6,246 7,016 4,421
Health Authority - 01 Interior (continued)
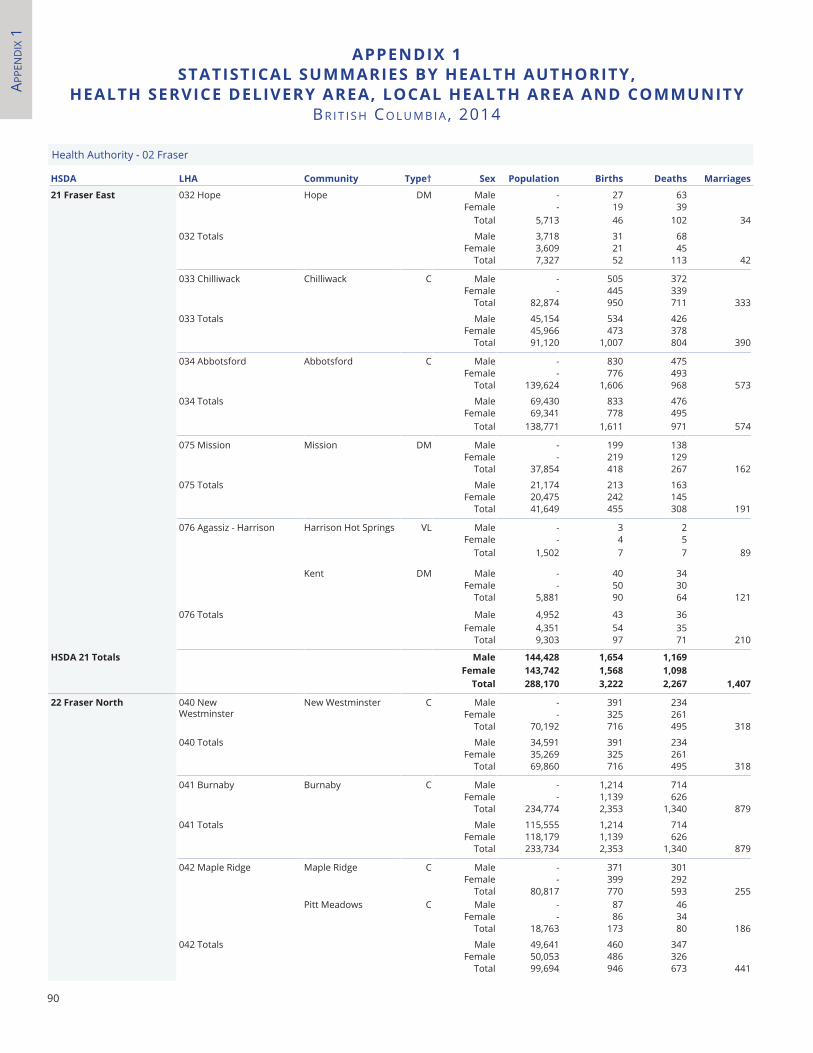
APPe
nd
Ix 1
90
aPPenDIX 1StatIStICal SUmmarIeS BY HealtH aUtHorItY,
HealtH SerVICe DelIVerY area, loCal HealtH area anD CommUnItYBR I t I S h Co L u M B I A , 2014
HSDa lHa Community type† Sex Population Births Deaths marriages
21 fraser east 032 Hope Hope DM Male - 27 63Female - 19 39
Total 5,713 46 102 34
032 Totals Male 3,718 31 68Female 3,609 21 45
Total 7,327 52 113 42
033 Chilliwack Chilliwack C Male - 505 372Female - 445 339
Total 82,874 950 711 333
033 Totals Male 45,154 534 426Female 45,966 473 378
Total 91,120 1,007 804 390
034 Abbotsford Abbotsford C Male - 830 475Female - 776 493
Total 139,624 1,606 968 573
034 Totals Male 69,430 833 476Female 69,341 778 495
Total 138,771 1,611 971 574
075 Mission Mission DM Male - 199 138Female - 219 129
Total 37,854 418 267 162
075 Totals Male 21,174 213 163Female 20,475 242 145
Total 41,649 455 308 191
076 Agassiz - Harrison Harrison Hot Springs VL Male - 3 2Female - 4 5
Total 1,502 7 7 89
Kent DM Male - 40 34Female - 50 30
Total 5,881 90 64 121
076 Totals Male 4,952 43 36Female 4,351 54 35
Total 9,303 97 71 210
HSDa 21 totals male 144,428 1,654 1,169female 143,742 1,568 1,098
total 288,170 3,222 2,267 1,407
22 fraser north 040 New Westminster
New Westminster C Male - 391 234Female - 325 261
Total 70,192 716 495 318
040 Totals Male 34,591 391 234Female 35,269 325 261
Total 69,860 716 495 318
041 Burnaby Burnaby C Male - 1,214 714Female - 1,139 626
Total 234,774 2,353 1,340 879
041 Totals Male 115,555 1,214 714Female 118,179 1,139 626
Total 233,734 2,353 1,340 879
042 Maple Ridge Maple Ridge C Male - 371 301Female - 399 292
Total 80,817 770 593 255Pitt Meadows C Male - 87 46
Female - 86 34Total 18,763 173 80 186
042 Totals Male 49,641 460 347Female 50,053 486 326
Total 99,694 946 673 441
Health Authority - 02 Fraser
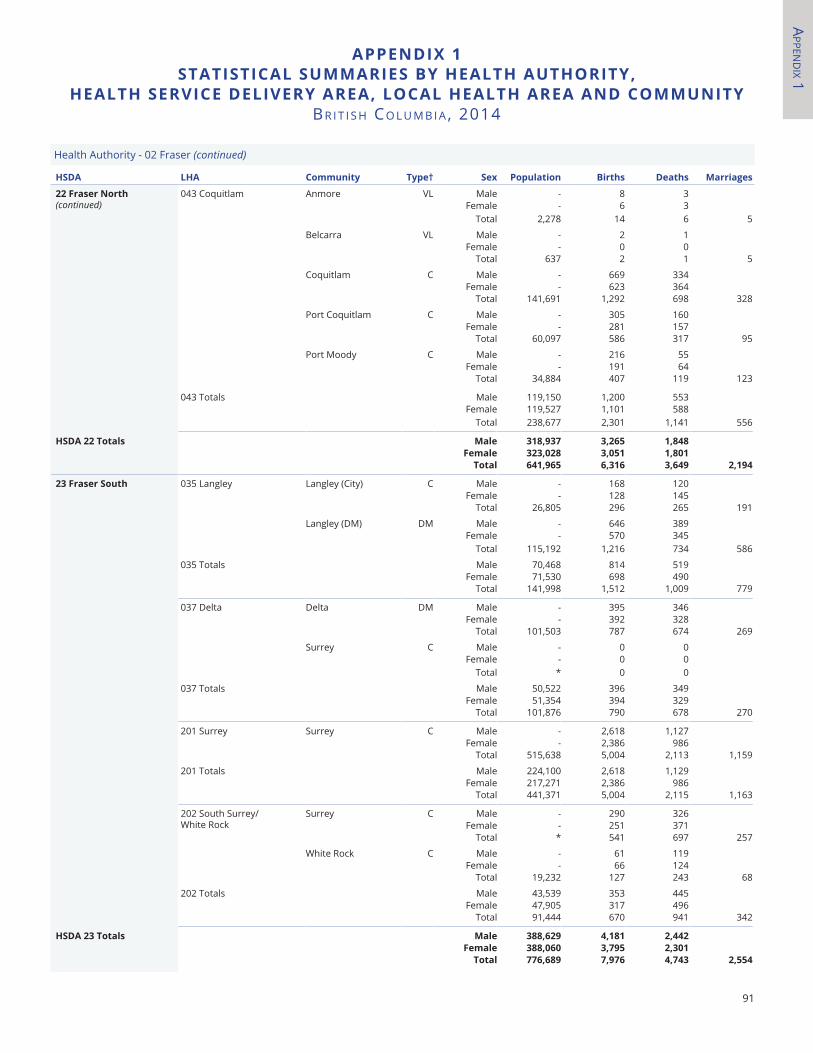
APPen
dIx 1
91
aPPenDIX 1StatIStICal SUmmarIeS BY HealtH aUtHorItY,
HealtH SerVICe DelIVerY area, loCal HealtH area anD CommUnItYBR I t I S h Co L u M B I A , 2014
Health Authority - 02 Fraser (continued)
HSDa lHa Community type† Sex Population Births Deaths marriages
22 fraser north (continued)
043 Coquitlam Anmore VL Male - 8 3Female - 6 3
Total 2,278 14 6 5
Belcarra VL Male - 2 1Female - 0 0
Total 637 2 1 5
Coquitlam C Male - 669 334Female - 623 364
Total 141,691 1,292 698 328
Port Coquitlam C Male - 305 160Female - 281 157
Total 60,097 586 317 95
Port Moody C Male - 216 55Female - 191 64
Total 34,884 407 119 123
043 Totals Male 119,150 1,200 553Female 119,527 1,101 588
Total 238,677 2,301 1,141 556
HSDa 22 totals male 318,937 3,265 1,848female 323,028 3,051 1,801
total 641,965 6,316 3,649 2,194
23 fraser South 035 Langley Langley (City) C Male - 168 120Female - 128 145
Total 26,805 296 265 191
Langley (DM) DM Male - 646 389Female - 570 345
Total 115,192 1,216 734 586
035 Totals Male 70,468 814 519Female 71,530 698 490
Total 141,998 1,512 1,009 779
037 Delta Delta DM Male - 395 346Female - 392 328
Total 101,503 787 674 269
Surrey C Male - 0 0Female - 0 0
Total * 0 0
037 Totals Male 50,522 396 349Female 51,354 394 329
Total 101,876 790 678 270
201 Surrey Surrey C Male - 2,618 1,127Female - 2,386 986
Total 515,638 5,004 2,113 1,159
201 Totals Male 224,100 2,618 1,129Female 217,271 2,386 986
Total 441,371 5,004 2,115 1,163
202 South Surrey/ White Rock
Surrey C Male - 290 326Female - 251 371
Total * 541 697 257
White Rock C Male - 61 119Female - 66 124
Total 19,232 127 243 68
202 Totals Male 43,539 353 445Female 47,905 317 496
Total 91,444 670 941 342
HSDa 23 totals male 388,629 4,181 2,442female 388,060 3,795 2,301
total 776,689 7,976 4,743 2,554
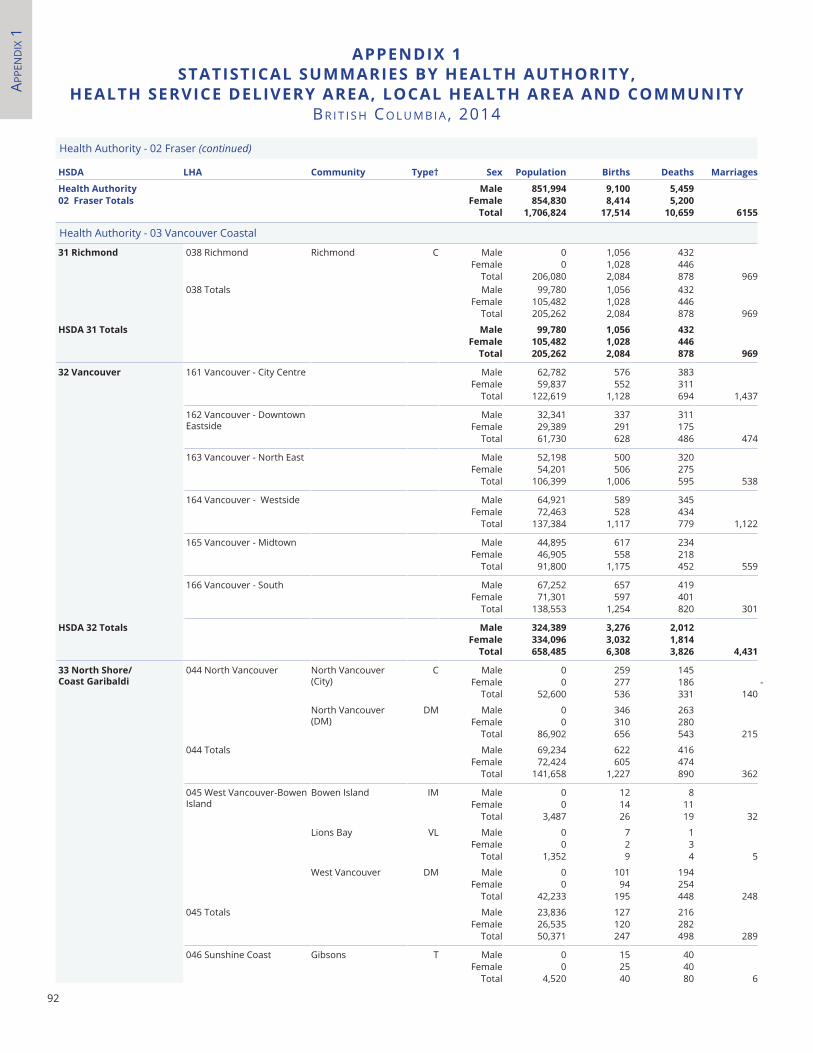
APPe
nd
Ix 1
92
aPPenDIX 1StatIStICal SUmmarIeS BY HealtH aUtHorItY,
HealtH SerVICe DelIVerY area, loCal HealtH area anD CommUnItYBR I t I S h Co L u M B I A , 2014
HSDa lHa Community type† Sex Population Births Deaths marriages
Health authority male 851,994 9,100 5,45902 fraser totals female 854,830 8,414 5,200
total 1,706,824 17,514 10,659 6155
31 richmond 038 Richmond Richmond C Male 0 1,056 432Female 0 1,028 446
Total 206,080 2,084 878 969038 Totals Male 99,780 1,056 432
Female 105,482 1,028 446Total 205,262 2,084 878 969
HSDa 31 totals male 99,780 1,056 432female 105,482 1,028 446
total 205,262 2,084 878 969
32 Vancouver 161 Vancouver - City Centre Male 62,782 576 383Female 59,837 552 311
Total 122,619 1,128 694 1,437
162 Vancouver - Downtown Eastside
Male 32,341 337 311Female 29,389 291 175
Total 61,730 628 486 474
163 Vancouver - North East Male 52,198 500 320Female 54,201 506 275
Total 106,399 1,006 595 538
164 Vancouver - Westside Male 64,921 589 345Female 72,463 528 434
Total 137,384 1,117 779 1,122
165 Vancouver - Midtown Male 44,895 617 234Female 46,905 558 218
Total 91,800 1,175 452 559
166 Vancouver - South Male 67,252 657 419Female 71,301 597 401
Total 138,553 1,254 820 301
HSDa 32 totals male 324,389 3,276 2,012female 334,096 3,032 1,814
total 658,485 6,308 3,826 4,431
33 north Shore/ Coast Garibaldi
044 North Vancouver North Vancouver (City)
C Male 0 259 145Female 0 277 186 -
Total 52,600 536 331 140
North Vancouver (DM)
DM Male 0 346 263Female 0 310 280
Total 86,902 656 543 215
044 Totals Male 69,234 622 416Female 72,424 605 474
Total 141,658 1,227 890 362
045 West Vancouver-Bowen Island
Bowen Island IM Male 0 12 8Female 0 14 11
Total 3,487 26 19 32
Lions Bay VL Male 0 7 1Female 0 2 3
Total 1,352 9 4 5
West Vancouver DM Male 0 101 194Female 0 94 254
Total 42,233 195 448 248
045 Totals Male 23,836 127 216Female 26,535 120 282
Total 50,371 247 498 289
046 Sunshine Coast Gibsons T Male 0 15 40Female 0 25 40
Total 4,520 40 80 6
Health Authority - 02 Fraser (continued)
Health Authority - 03 Vancouver Coastal
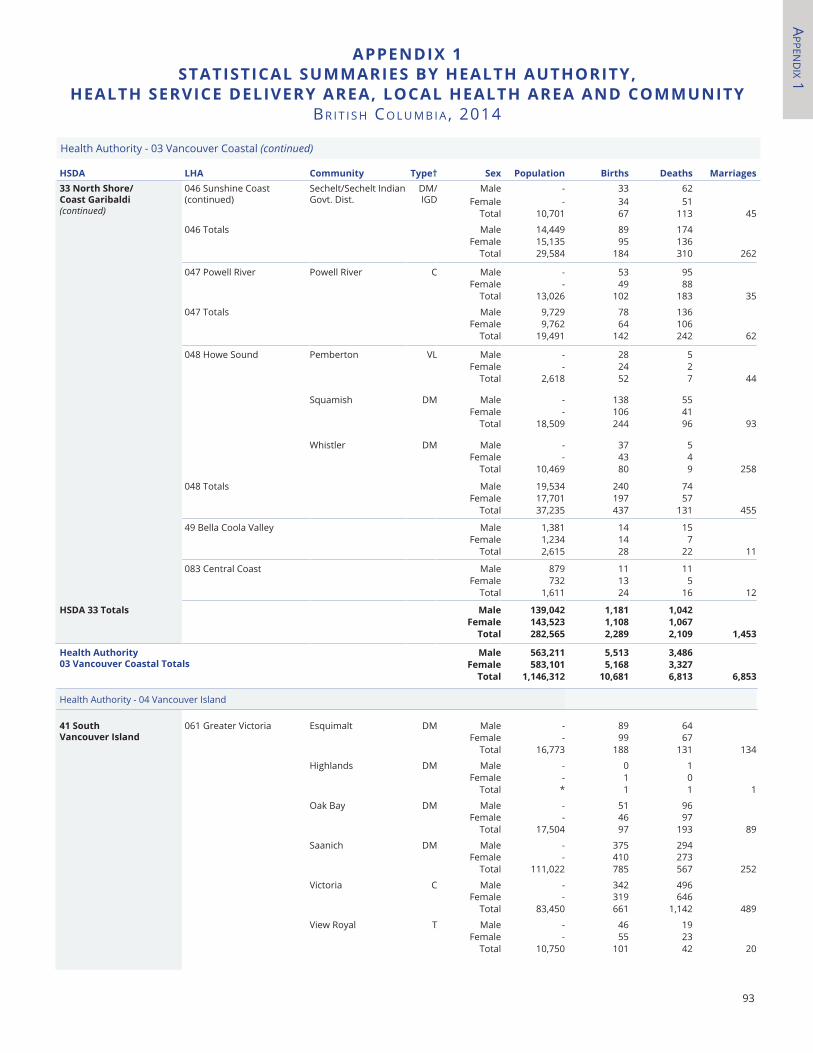
APPen
dIx 1
93
aPPenDIX 1StatIStICal SUmmarIeS BY HealtH aUtHorItY,
HealtH SerVICe DelIVerY area, loCal HealtH area anD CommUnItYBR I t I S h Co L u M B I A , 2014
HSDa lHa Community type† Sex Population Births Deaths marriages33 north Shore/ Coast Garibaldi (continued)
046 Sunshine Coast (continued)
Sechelt/Sechelt Indian Govt. Dist.
DM/IGD
Male - 33 62Female - 34 51
Total 10,701 67 113 45
046 Totals Male 14,449 89 174Female 15,135 95 136
Total 29,584 184 310 262
047 Powell River Powell River C Male - 53 95Female - 49 88
Total 13,026 102 183 35
047 Totals Male 9,729 78 136Female 9,762 64 106
Total 19,491 142 242 62
048 Howe Sound Pemberton VL Male - 28 5Female - 24 2
Total 2,618 52 7 44
Squamish DM Male - 138 55Female - 106 41
Total 18,509 244 96 93
Whistler DM Male - 37 5Female - 43 4
Total 10,469 80 9 258
048 Totals Male 19,534 240 74Female 17,701 197 57
Total 37,235 437 131 455
49 Bella Coola Valley Male 1,381 14 15Female 1,234 14 7
Total 2,615 28 22 11
083 Central Coast Male 879 11 11Female 732 13 5
Total 1,611 24 16 12
HSDa 33 totals male 139,042 1,181 1,042female 143,523 1,108 1,067
total 282,565 2,289 2,109 1,453
Health authority 03 Vancouver Coastal totals
male 563,211 5,513 3,486female 583,101 5,168 3,327
total 1,146,312 10,681 6,813 6,853
Health Authority - 04 Vancouver Island
41 South Vancouver Island
061 Greater Victoria Esquimalt DM Male - 89 64Female - 99 67
Total 16,773 188 131 134
Highlands DM Male - 0 1Female - 1 0
Total * 1 1 1
Oak Bay DM Male - 51 96Female - 46 97
Total 17,504 97 193 89
Saanich DM Male - 375 294Female - 410 273
Total 111,022 785 567 252
Victoria C Male - 342 496Female - 319 646
Total 83,450 661 1,142 489
View Royal T Male - 46 19Female - 55 23
Total 10,750 101 42 20
Health Authority - 03 Vancouver Coastal (continued)
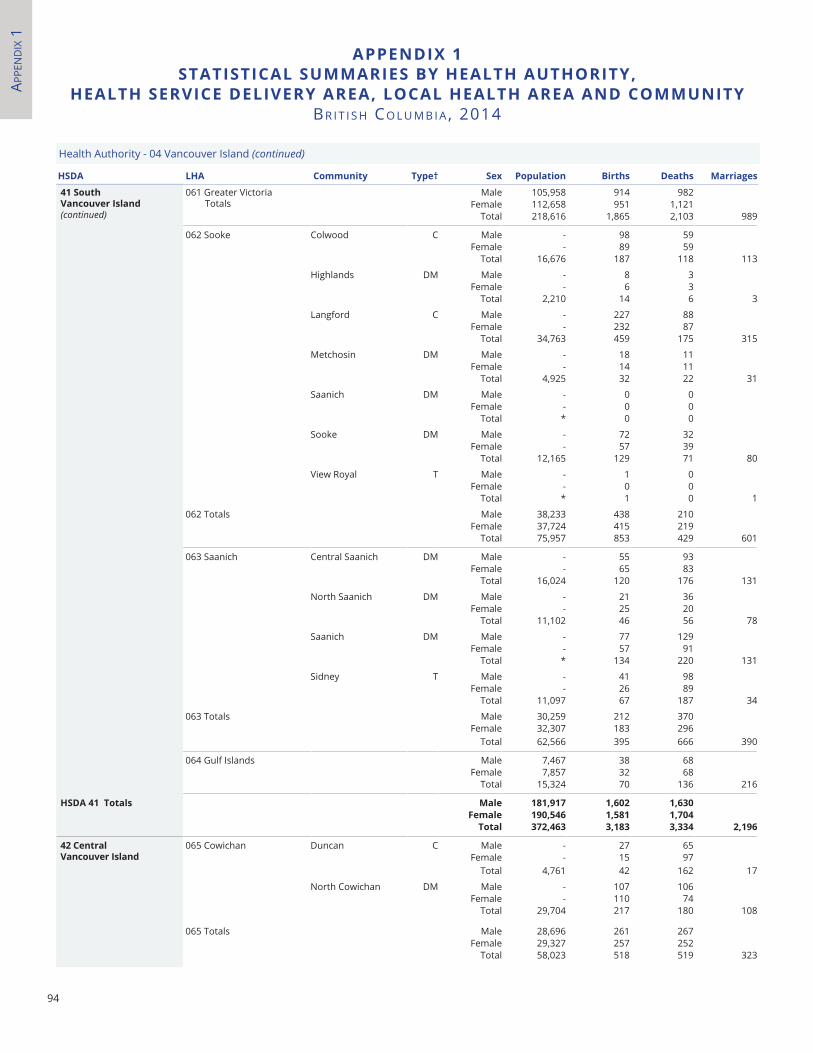
APPe
nd
Ix 1
94
aPPenDIX 1StatIStICal SUmmarIeS BY HealtH aUtHorItY,
HealtH SerVICe DelIVerY area, loCal HealtH area anD CommUnItYBR I t I S h Co L u M B I A , 2014
Health Authority - 04 Vancouver Island (continued)
HSDa lHa Community type† Sex Population Births Deaths marriages
41 South Vancouver Island(continued)
061 Greater Victoria Totals
Male 105,958 914 982Female 112,658 951 1,121
Total 218,616 1,865 2,103 989
062 Sooke Colwood C Male - 98 59Female - 89 59
Total 16,676 187 118 113
Highlands DM Male - 8 3Female - 6 3
Total 2,210 14 6 3
Langford C Male - 227 88Female - 232 87
Total 34,763 459 175 315
Metchosin DM Male - 18 11Female - 14 11
Total 4,925 32 22 31
Saanich DM Male - 0 0Female - 0 0
Total * 0 0
Sooke DM Male - 72 32Female - 57 39
Total 12,165 129 71 80
View Royal T Male - 1 0Female - 0 0
Total * 1 0 1
062 Totals Male 38,233 438 210Female 37,724 415 219
Total 75,957 853 429 601
063 Saanich Central Saanich DM Male - 55 93Female - 65 83
Total 16,024 120 176 131
North Saanich DM Male - 21 36Female - 25 20
Total 11,102 46 56 78
Saanich DM Male - 77 129Female - 57 91
Total * 134 220 131
Sidney T Male - 41 98Female - 26 89
Total 11,097 67 187 34
063 Totals Male 30,259 212 370Female 32,307 183 296
Total 62,566 395 666 390
064 Gulf Islands Male 7,467 38 68Female 7,857 32 68
Total 15,324 70 136 216
HSDa 41 totals male 181,917 1,602 1,630female 190,546 1,581 1,704
total 372,463 3,183 3,334 2,196
42 Central Vancouver Island
065 Cowichan Duncan C Male - 27 65Female - 15 97
Total 4,761 42 162 17
North Cowichan DM Male - 107 106Female - 110 74
Total 29,704 217 180 108
065 Totals Male 28,696 261 267Female 29,327 257 252
Total 58,023 518 519 323
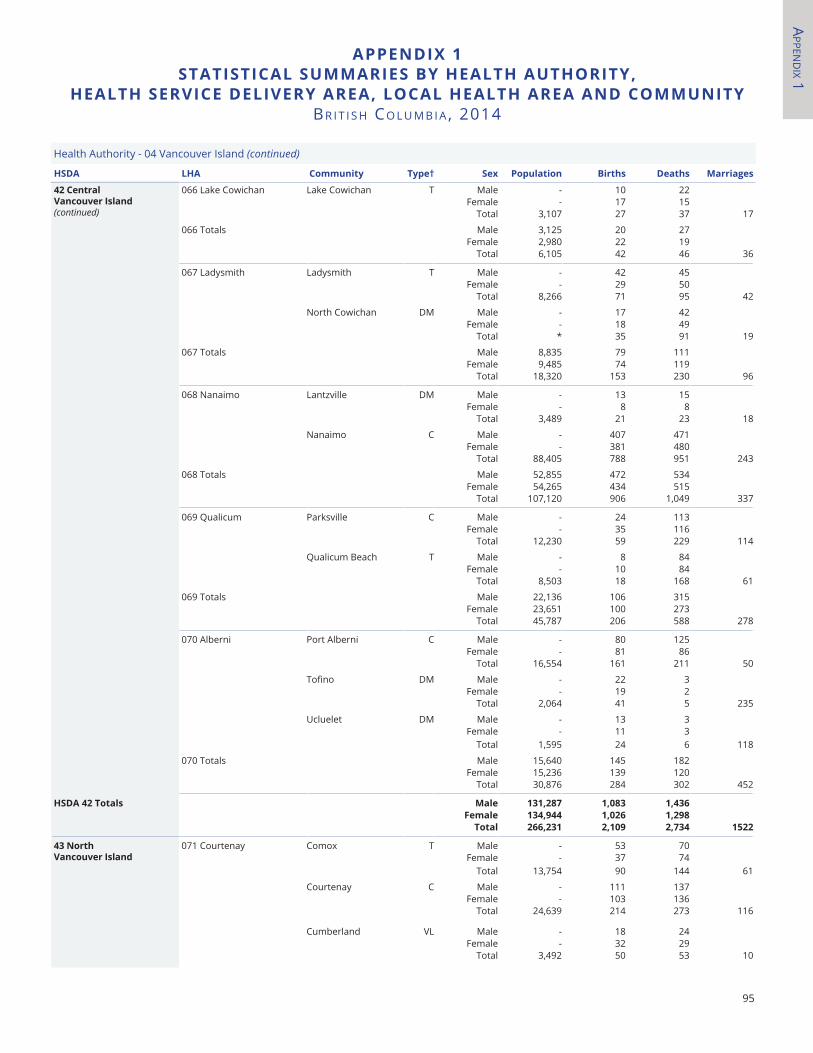
APPen
dIx 1
95
aPPenDIX 1StatIStICal SUmmarIeS BY HealtH aUtHorItY,
HealtH SerVICe DelIVerY area, loCal HealtH area anD CommUnItYBR I t I S h Co L u M B I A , 2014
Health Authority - 04 Vancouver Island (continued)
HSDa lHa Community type† Sex Population Births Deaths marriages
42 Central Vancouver Island (continued)
066 Lake Cowichan Lake Cowichan T Male - 10 22Female - 17 15
Total 3,107 27 37 17
066 Totals Male 3,125 20 27Female 2,980 22 19
Total 6,105 42 46 36
067 Ladysmith Ladysmith T Male - 42 45Female - 29 50
Total 8,266 71 95 42
North Cowichan DM Male - 17 42Female - 18 49
Total * 35 91 19
067 Totals Male 8,835 79 111Female 9,485 74 119
Total 18,320 153 230 96
068 Nanaimo Lantzville DM Male - 13 15Female - 8 8
Total 3,489 21 23 18
Nanaimo C Male - 407 471Female - 381 480
Total 88,405 788 951 243
068 Totals Male 52,855 472 534Female 54,265 434 515
Total 107,120 906 1,049 337
069 Qualicum Parksville C Male - 24 113Female - 35 116
Total 12,230 59 229 114
Qualicum Beach T Male - 8 84Female - 10 84
Total 8,503 18 168 61
069 Totals Male 22,136 106 315Female 23,651 100 273
Total 45,787 206 588 278
070 Alberni Port Alberni C Male - 80 125Female - 81 86
Total 16,554 161 211 50
Tofino DM Male - 22 3Female - 19 2
Total 2,064 41 5 235
Ucluelet DM Male - 13 3Female - 11 3
Total 1,595 24 6 118
070 Totals Male 15,640 145 182Female 15,236 139 120
Total 30,876 284 302 452
HSDa 42 totals male 131,287 1,083 1,436female 134,944 1,026 1,298
total 266,231 2,109 2,734 1522
43 north Vancouver Island
071 Courtenay Comox T Male - 53 70Female - 37 74
Total 13,754 90 144 61
Courtenay C Male - 111 137Female - 103 136
Total 24,639 214 273 116
Cumberland VL Male - 18 24Female - 32 29
Total 3,492 50 53 10
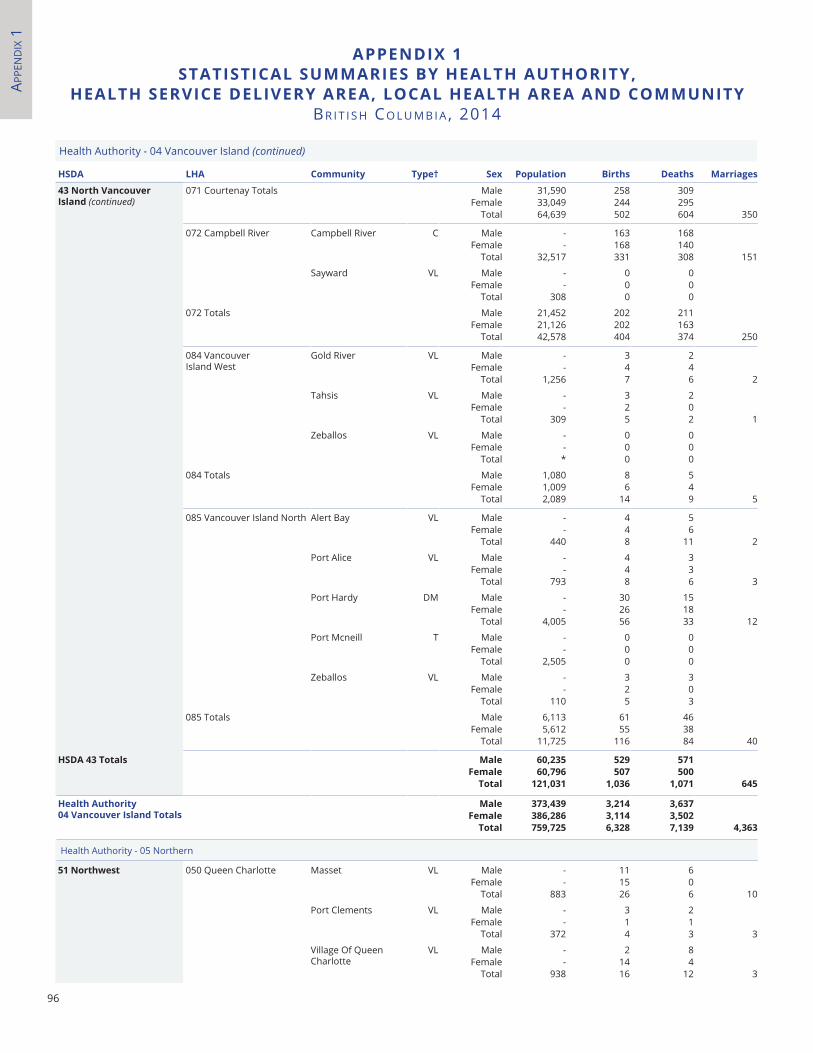
APPe
nd
Ix 1
96
aPPenDIX 1StatIStICal SUmmarIeS BY HealtH aUtHorItY,
HealtH SerVICe DelIVerY area, loCal HealtH area anD CommUnItYBR I t I S h Co L u M B I A , 2014
Health Authority - 04 Vancouver Island (continued)
HSDa lHa Community type† Sex Population Births Deaths marriages
43 north Vancouver Island (continued)
071 Courtenay Totals Male 31,590 258 309Female 33,049 244 295
Total 64,639 502 604 350
072 Campbell River Campbell River C Male - 163 168Female - 168 140
Total 32,517 331 308 151
Sayward VL Male - 0 0Female - 0 0
Total 308 0 0
072 Totals Male 21,452 202 211Female 21,126 202 163
Total 42,578 404 374 250
084 Vancouver Island West
Gold River VL Male - 3 2Female - 4 4
Total 1,256 7 6 2
Tahsis VL Male - 3 2Female - 2 0
Total 309 5 2 1
Zeballos VL Male - 0 0Female - 0 0
Total * 0 0
084 Totals Male 1,080 8 5Female 1,009 6 4
Total 2,089 14 9 5
085 Vancouver Island North Alert Bay VL Male - 4 5Female - 4 6
Total 440 8 11 2
Port Alice VL Male - 4 3Female - 4 3
Total 793 8 6 3
Port Hardy DM Male - 30 15Female - 26 18
Total 4,005 56 33 12
Port Mcneill T Male - 0 0Female - 0 0
Total 2,505 0 0
Zeballos VL Male - 3 3Female - 2 0
Total 110 5 3
085 Totals Male 6,113 61 46Female 5,612 55 38
Total 11,725 116 84 40
HSDa 43 totals male 60,235 529 571female 60,796 507 500
total 121,031 1,036 1,071 645
Health authority04 Vancouver Island totals
male 373,439 3,214 3,637female 386,286 3,114 3,502
total 759,725 6,328 7,139 4,363
Health Authority - 05 Northern
51 northwest 050 Queen Charlotte Masset VL Male - 11 6Female - 15 0
Total 883 26 6 10
Port Clements VL Male - 3 2Female - 1 1
Total 372 4 3 3
Village Of Queen Charlotte
VL Male - 2 8Female - 14 4
Total 938 16 12 3
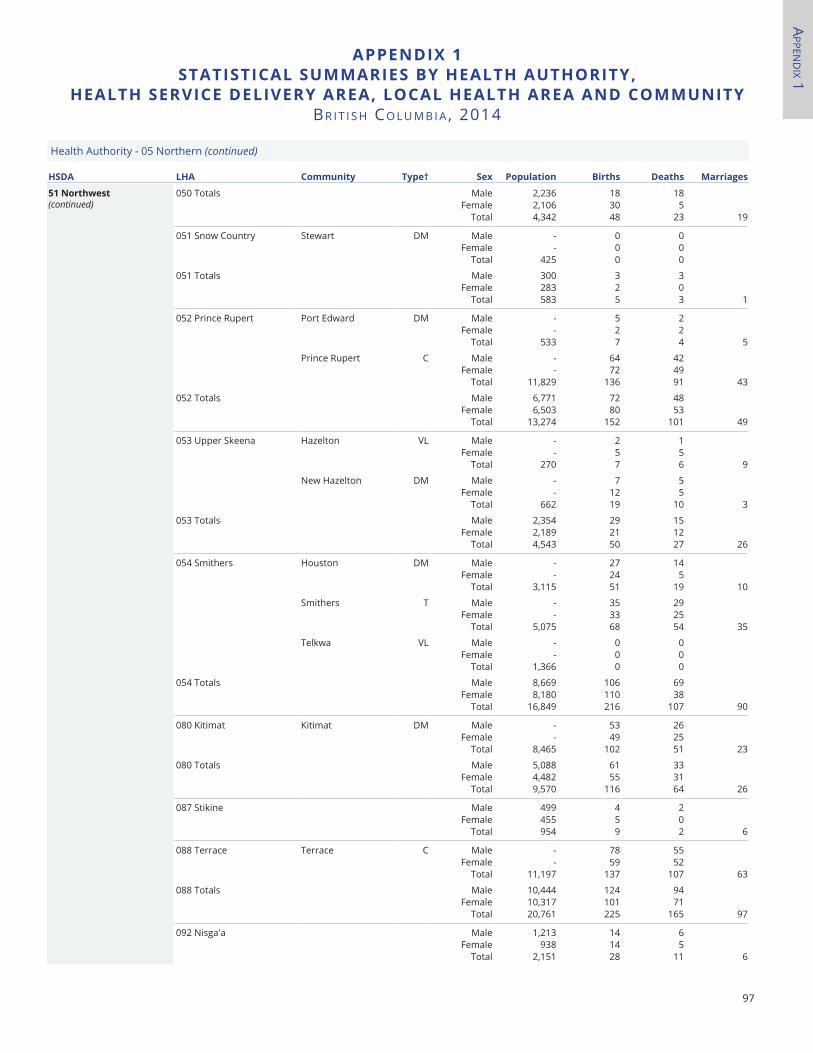
APPen
dIx 1
97
aPPenDIX 1StatIStICal SUmmarIeS BY HealtH aUtHorItY,
HealtH SerVICe DelIVerY area, loCal HealtH area anD CommUnItYBR I t I S h Co L u M B I A , 2014
Health Authority - 05 Northern (continued)
HSDa lHa Community type† Sex Population Births Deaths marriages
51 northwest (continued)
050 Totals Male 2,236 18 18Female 2,106 30 5
Total 4,342 48 23 19
051 Snow Country Stewart DM Male - 0 0Female - 0 0
Total 425 0 0
051 Totals Male 300 3 3Female 283 2 0
Total 583 5 3 1
052 Prince Rupert Port Edward DM Male - 5 2Female - 2 2
Total 533 7 4 5
Prince Rupert C Male - 64 42Female - 72 49
Total 11,829 136 91 43
052 Totals Male 6,771 72 48Female 6,503 80 53
Total 13,274 152 101 49
053 Upper Skeena Hazelton VL Male - 2 1Female - 5 5
Total 270 7 6 9
New Hazelton DM Male - 7 5Female - 12 5
Total 662 19 10 3
053 Totals Male 2,354 29 15Female 2,189 21 12
Total 4,543 50 27 26
054 Smithers Houston DM Male - 27 14Female - 24 5
Total 3,115 51 19 10
Smithers T Male - 35 29Female - 33 25
Total 5,075 68 54 35
Telkwa VL Male - 0 0Female - 0 0
Total 1,366 0 0
054 Totals Male 8,669 106 69Female 8,180 110 38
Total 16,849 216 107 90
080 Kitimat Kitimat DM Male - 53 26Female - 49 25
Total 8,465 102 51 23
080 Totals Male 5,088 61 33Female 4,482 55 31
Total 9,570 116 64 26
087 Stikine Male 499 4 2Female 455 5 0
Total 954 9 2 6
088 Terrace Terrace C Male - 78 55Female - 59 52
Total 11,197 137 107 63
088 Totals Male 10,444 124 94Female 10,317 101 71
Total 20,761 225 165 97
092 Nisga'a Male 1,213 14 6Female 938 14 5
Total 2,151 28 11 6
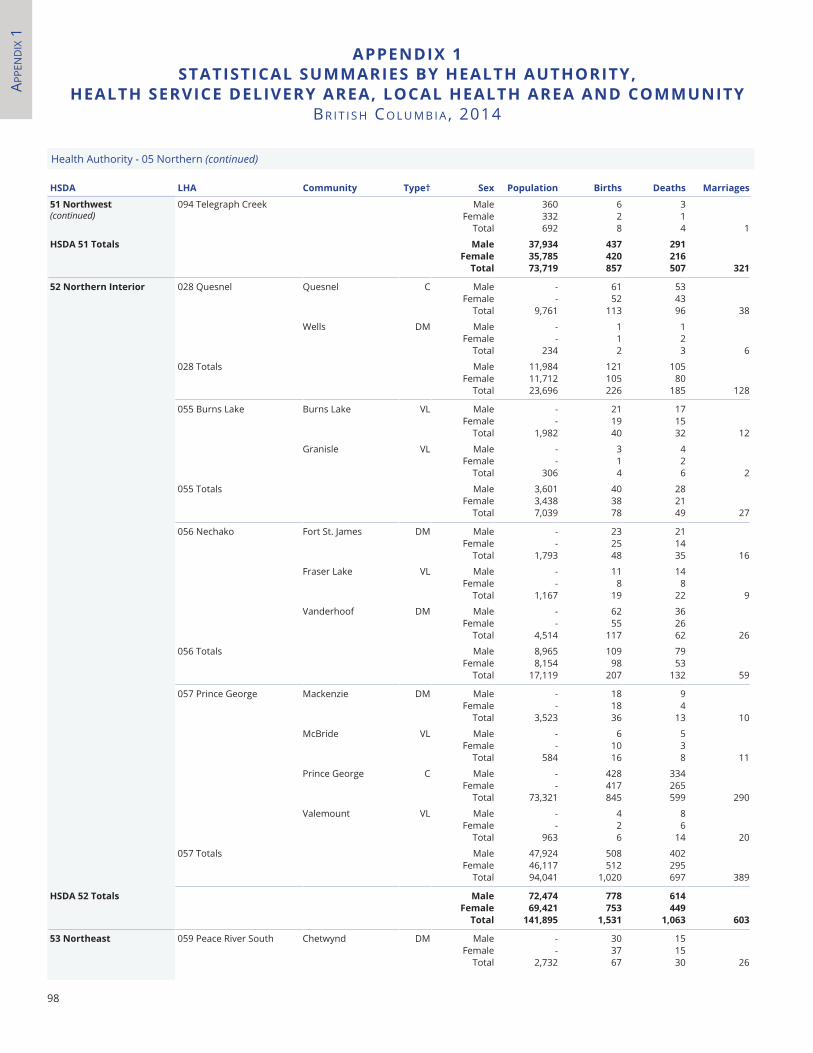
APPe
nd
Ix 1
98
aPPenDIX 1StatIStICal SUmmarIeS BY HealtH aUtHorItY,
HealtH SerVICe DelIVerY area, loCal HealtH area anD CommUnItYBR I t I S h Co L u M B I A , 2014
Health Authority - 05 Northern (continued)
HSDa lHa Community type† Sex Population Births Deaths marriages
51 northwest (continued)
094 Telegraph Creek Male 360 6 3Female 332 2 1
Total 692 8 4 1
HSDa 51 totals male 37,934 437 291female 35,785 420 216
total 73,719 857 507 321
52 northern Interior 028 Quesnel Quesnel C Male - 61 53Female - 52 43
Total 9,761 113 96 38
Wells DM Male - 1 1Female - 1 2
Total 234 2 3 6
028 Totals Male 11,984 121 105Female 11,712 105 80
Total 23,696 226 185 128
055 Burns Lake Burns Lake VL Male - 21 17Female - 19 15
Total 1,982 40 32 12
Granisle VL Male - 3 4Female - 1 2
Total 306 4 6 2
055 Totals Male 3,601 40 28Female 3,438 38 21
Total 7,039 78 49 27
056 Nechako Fort St. James DM Male - 23 21Female - 25 14
Total 1,793 48 35 16
Fraser Lake VL Male - 11 14Female - 8 8
Total 1,167 19 22 9
Vanderhoof DM Male - 62 36Female - 55 26
Total 4,514 117 62 26
056 Totals Male 8,965 109 79Female 8,154 98 53
Total 17,119 207 132 59
057 Prince George Mackenzie DM Male - 18 9Female - 18 4
Total 3,523 36 13 10
McBride VL Male - 6 5Female - 10 3
Total 584 16 8 11
Prince George C Male - 428 334Female - 417 265
Total 73,321 845 599 290
Valemount VL Male - 4 8Female - 2 6
Total 963 6 14 20
057 Totals Male 47,924 508 402Female 46,117 512 295
Total 94,041 1,020 697 389
HSDa 52 totals male 72,474 778 614female 69,421 753 449
total 141,895 1,531 1,063 603
53 northeast 059 Peace River South Chetwynd DM Male - 30 15Female - 37 15
Total 2,732 67 30 26
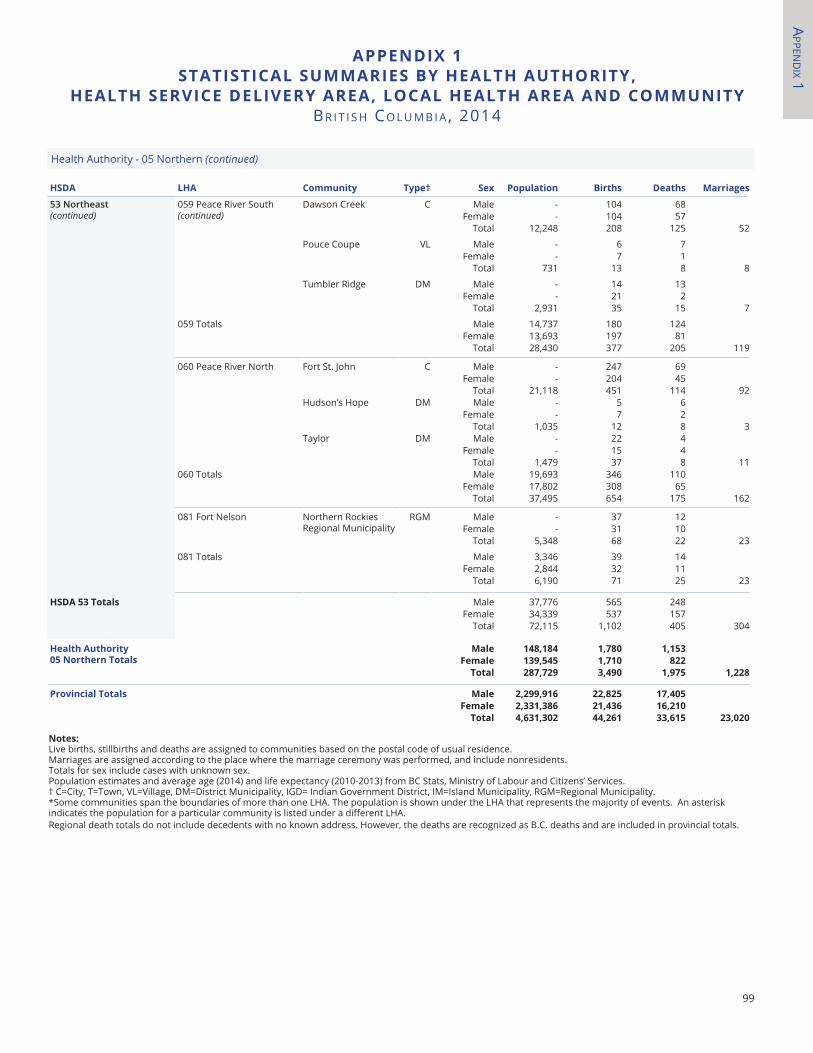
APPen
dIx 1
99
aPPenDIX 1StatIStICal SUmmarIeS BY HealtH aUtHorItY,
HealtH SerVICe DelIVerY area, loCal HealtH area anD CommUnItYBR I t I S h Co L u M B I A , 2014
notes:Live births, stillbirths and deaths are assigned to communities based on the postal code of usual residence. Marriages are assigned according to the place where the marriage ceremony was performed, and include nonresidents.Totals for sex include cases with unknown sex.Population estimates and average age (2014) and life expectancy (2010-2013) from BC Stats, Ministry of Labour and Citizens’ Services.† C=City, T=Town, VL=Village, DM=District Municipality, IGD= Indian Government District, IM=Island Municipality, RGM=Regional Municipality. *Some communities span the boundaries of more than one LHA. The population is shown under the LHA that represents the majority of events. An asterisk indicates the population for a particular community is listed under a different LHA.Regional death totals do not include decedents with no known address. However, the deaths are recognized as B.C. deaths and are included in provincial totals.
Health Authority - 05 Northern (continued)
HSDa lHa Community type† Sex Population Births Deaths marriages
53 Northeast (continued)
059 Peace River South (continued)
Dawson Creek C Male - 104 68Female - 104 57
Total 12,248 208 125 52
Pouce Coupe VL Male - 6 7Female - 7 1
Total 731 13 8 8
Tumbler Ridge DM Male - 14 13Female - 21 2
Total 2,931 35 15 7
059 Totals Male 14,737 180 124Female 13,693 197 81
Total 28,430 377 205 119
060 Peace River North Fort St. John C Male - 247 69Female - 204 45
Total 21,118 451 114 92Hudson’s Hope DM Male - 5 6
Female - 7 2Total 1,035 12 8 3
Taylor DM Male - 22 4Female - 15 4
Total 1,479 37 8 11060 Totals Male 19,693 346 110
Female 17,802 308 65Total 37,495 654 175 162
081 Fort Nelson Northern Rockies Regional Municipality
RGM Male - 37 12Female - 31 10
Total 5,348 68 22 23
081 Totals Male 3,346 39 14Female 2,844 32 11
Total 6,190 71 25 23
HSDa 53 totals Male 37,776 565 248Female 34,339 537 157
Total 72,115 1,102 405 304
Health authority 05 northern totals
male 148,184 1,780 1,153female 139,545 1,710 822
total 287,729 3,490 1,975 1,228
Provincial totals male 2,299,916 22,825 17,405female 2,331,386 21,436 16,210
total 4,631,302 44,261 33,615 23,020

100
Appendix Two
Detailed Cause of Death by Sex and Age British Columbia, 2014
101

102
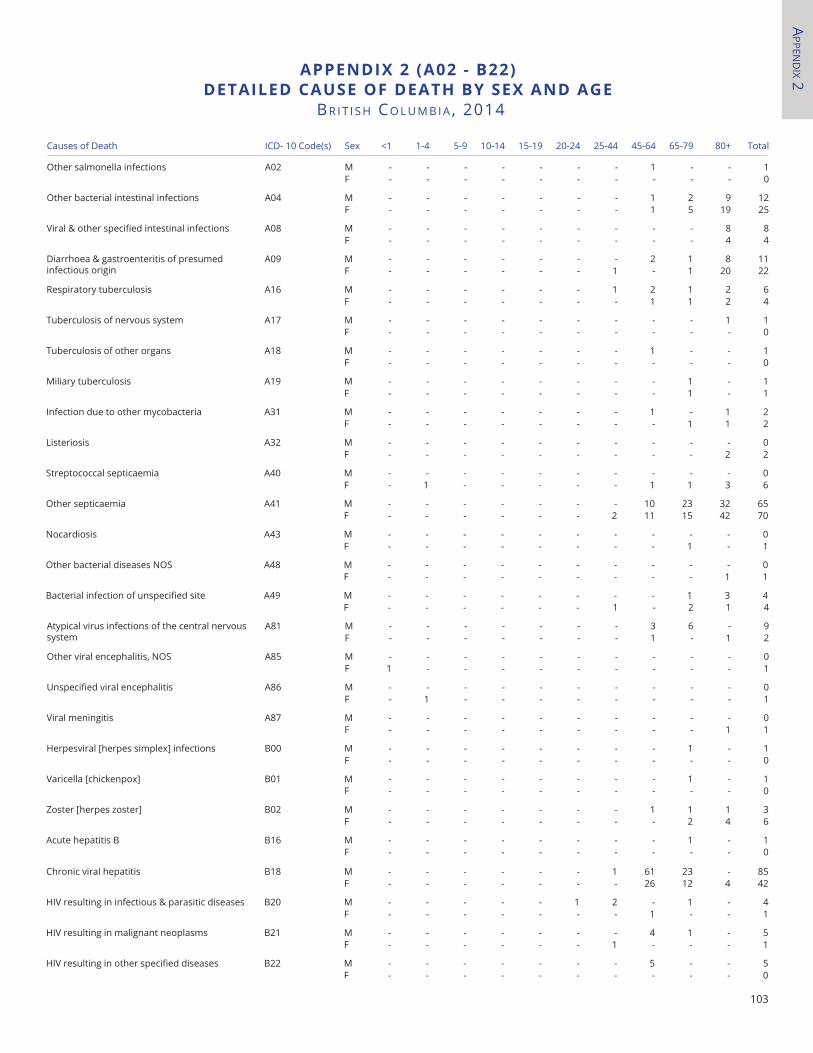
APPen
dIx 2
103
aPPenDIX 2 (a02 - B22)DetaIleD CaUSe of DeatH BY SeX anD aGe
BR I t I S h Co L u M B I A , 2014
Causes of Death ICD- 10 Code(s) Sex <1 1-4 5-9 10-14 15-19 20-24 25-44 45-64 65-79 80+ Total
Other salmonella infections A02 M - - - - - - - 1 - - 1F - - - - - - - - - - 0
Other bacterial intestinal infections A04 M - - - - - - - 1 2 9 12F - - - - - - - 1 5 19 25
Viral & other specified intestinal infections A08 M - - - - - - - - - 8 8F - - - - - - - - - 4 4
Diarrhoea & gastroenteritis of presumed infectious origin
A09 M - - - - - - - 2 1 8 11F - - - - - - 1 - 1 20 22
Respiratory tuberculosis A16 M - - - - - - 1 2 1 2 6F - - - - - - - 1 1 2 4
Tuberculosis of nervous system A17 M - - - - - - - - - 1 1F - - - - - - - - - - 0
Tuberculosis of other organs A18 M - - - - - - - 1 - - 1F - - - - - - - - - - 0
Miliary tuberculosis A19 M - - - - - - - - 1 - 1F - - - - - - - - 1 - 1
Infection due to other mycobacteria A31 M - - - - - - - 1 - 1 2F - - - - - - - - 1 1 2
Listeriosis A32 M - - - - - - - - - - 0F - - - - - - - - - 2 2
Streptococcal septicaemia A40 M - - - - - - - - - - 0F - 1 - - - - - 1 1 3 6
Other septicaemia A41 M - - - - - - - 10 23 32 65F - - - - - - 2 11 15 42 70
Nocardiosis A43 M - - - - - - - - - - 0F - - - - - - - - 1 - 1
Other bacterial diseases NOS A48 M - - - - - - - - - - 0F - - - - - - - - - 1 1
Bacterial infection of unspecified site A49 M - - - - - - - - 1 3 4F - - - - - - 1 - 2 1 4
Atypical virus infections of the central nervous system
A81 M - - - - - - - 3 6 - 9F - - - - - - - 1 - 1 2
Other viral encephalitis, NOS A85 M - - - - - - - - - - 0F 1 - - - - - - - - - 1
Unspecified viral encephalitis A86 M - - - - - - - - - - 0F - 1 - - - - - - - - 1
Viral meningitis A87 M - - - - - - - - - - 0F - - - - - - - - - 1 1
Herpesviral [herpes simplex] infections B00 M - - - - - - - - 1 - 1F - - - - - - - - - - 0
Varicella [chickenpox] B01 M - - - - - - - - 1 - 1F - - - - - - - - - - 0
Zoster [herpes zoster] B02 M - - - - - - - 1 1 1 3F - - - - - - - - 2 4 6
Acute hepatitis B B16 M - - - - - - - - 1 - 1F - - - - - - - - - - 0
Chronic viral hepatitis B18 M - - - - - - 1 61 23 - 85F - - - - - - - 26 12 4 42
HIV resulting in infectious & parasitic diseases B20 M - - - - - 1 2 - 1 - 4F - - - - - - - 1 - - 1
HIV resulting in malignant neoplasms B21 M - - - - - - - 4 1 - 5F - - - - - - 1 - - - 1
HIV resulting in other specified diseases B22 M - - - - - - - 5 - - 5F - - - - - - - - - - 0
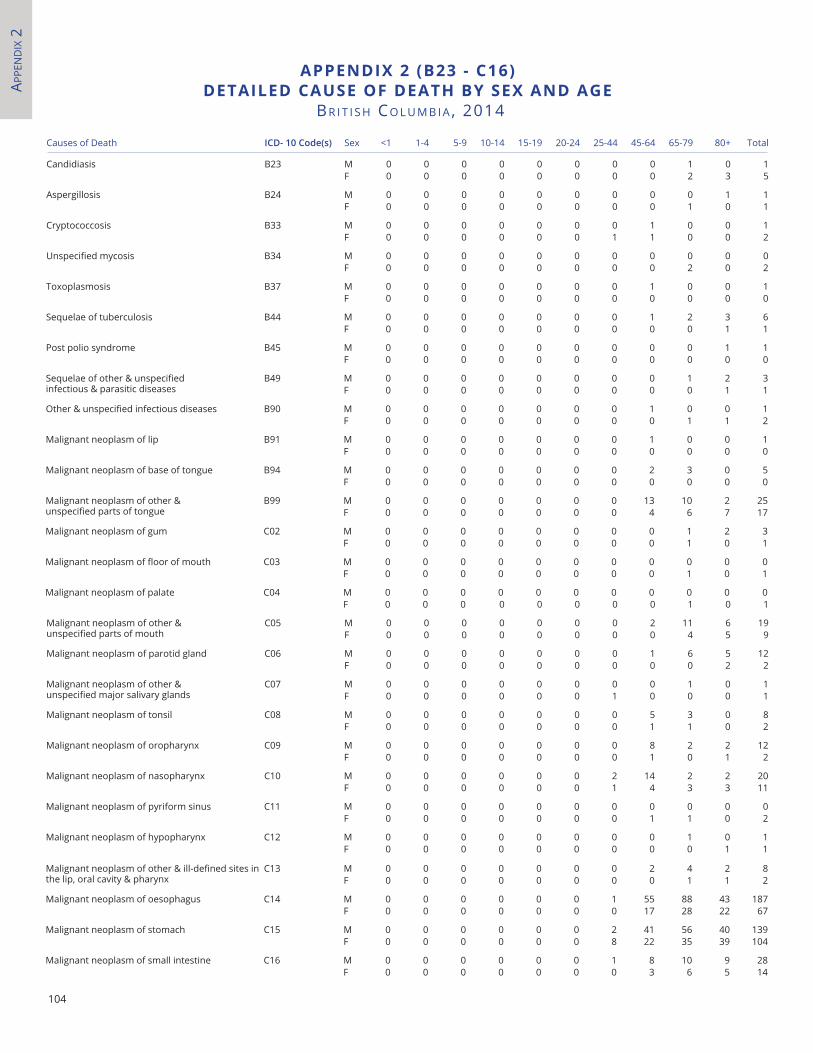
APPe
nd
Ix 2
104
aPPenDIX 2 (B23 - C16)DetaIleD CaUSe of DeatH BY SeX anD aGe
BR I t I S h Co L u M B I A , 2014
Causes of Death ICD- 10 Code(s) Sex <1 1-4 5-9 10-14 15-19 20-24 25-44 45-64 65-79 80+ Total
Candidiasis B23 M 0 0 0 0 0 0 0 0 1 0 1F 0 0 0 0 0 0 0 0 2 3 5
Aspergillosis B24 M 0 0 0 0 0 0 0 0 0 1 1F 0 0 0 0 0 0 0 0 1 0 1
Cryptococcosis B33 M 0 0 0 0 0 0 0 1 0 0 1F 0 0 0 0 0 0 1 1 0 0 2
Unspecified mycosis B34 M 0 0 0 0 0 0 0 0 0 0 0F 0 0 0 0 0 0 0 0 2 0 2
Toxoplasmosis B37 M 0 0 0 0 0 0 0 1 0 0 1F 0 0 0 0 0 0 0 0 0 0 0
Sequelae of tuberculosis B44 M 0 0 0 0 0 0 0 1 2 3 6F 0 0 0 0 0 0 0 0 0 1 1
Post polio syndrome B45 M 0 0 0 0 0 0 0 0 0 1 1F 0 0 0 0 0 0 0 0 0 0 0
Sequelae of other & unspecified infectious & parasitic diseases
B49 M 0 0 0 0 0 0 0 0 1 2 3F 0 0 0 0 0 0 0 0 0 1 1
Other & unspecified infectious diseases B90 M 0 0 0 0 0 0 0 1 0 0 1F 0 0 0 0 0 0 0 0 1 1 2
Malignant neoplasm of lip B91 M 0 0 0 0 0 0 0 1 0 0 1F 0 0 0 0 0 0 0 0 0 0 0
Malignant neoplasm of base of tongue B94 M 0 0 0 0 0 0 0 2 3 0 5F 0 0 0 0 0 0 0 0 0 0 0
Malignant neoplasm of other & unspecified parts of tongue
B99 M 0 0 0 0 0 0 0 13 10 2 25F 0 0 0 0 0 0 0 4 6 7 17
Malignant neoplasm of gum C02 M 0 0 0 0 0 0 0 0 1 2 3F 0 0 0 0 0 0 0 0 1 0 1
Malignant neoplasm of floor of mouth C03 M 0 0 0 0 0 0 0 0 0 0 0F 0 0 0 0 0 0 0 0 1 0 1
Malignant neoplasm of palate C04 M 0 0 0 0 0 0 0 0 0 0 0F 0 0 0 0 0 0 0 0 1 0 1
Malignant neoplasm of other & unspecified parts of mouth
C05 M 0 0 0 0 0 0 0 2 11 6 19F 0 0 0 0 0 0 0 0 4 5 9
Malignant neoplasm of parotid gland C06 M 0 0 0 0 0 0 0 1 6 5 12F 0 0 0 0 0 0 0 0 0 2 2
Malignant neoplasm of other & unspecified major salivary glands
C07 M 0 0 0 0 0 0 0 0 1 0 1F 0 0 0 0 0 0 1 0 0 0 1
Malignant neoplasm of tonsil C08 M 0 0 0 0 0 0 0 5 3 0 8F 0 0 0 0 0 0 0 1 1 0 2
Malignant neoplasm of oropharynx C09 M 0 0 0 0 0 0 0 8 2 2 12F 0 0 0 0 0 0 0 1 0 1 2
Malignant neoplasm of nasopharynx C10 M 0 0 0 0 0 0 2 14 2 2 20F 0 0 0 0 0 0 1 4 3 3 11
Malignant neoplasm of pyriform sinus C11 M 0 0 0 0 0 0 0 0 0 0 0F 0 0 0 0 0 0 0 1 1 0 2
Malignant neoplasm of hypopharynx C12 M 0 0 0 0 0 0 0 0 1 0 1F 0 0 0 0 0 0 0 0 0 1 1
Malignant neoplasm of other & ill-defined sites in the lip, oral cavity & pharynx
C13 M 0 0 0 0 0 0 0 2 4 2 8F 0 0 0 0 0 0 0 0 1 1 2
Malignant neoplasm of oesophagus C14 M 0 0 0 0 0 0 1 55 88 43 187F 0 0 0 0 0 0 0 17 28 22 67
Malignant neoplasm of stomach C15 M 0 0 0 0 0 0 2 41 56 40 139F 0 0 0 0 0 0 8 22 35 39 104
Malignant neoplasm of small intestine C16 M 0 0 0 0 0 0 1 8 10 9 28F 0 0 0 0 0 0 0 3 6 5 14
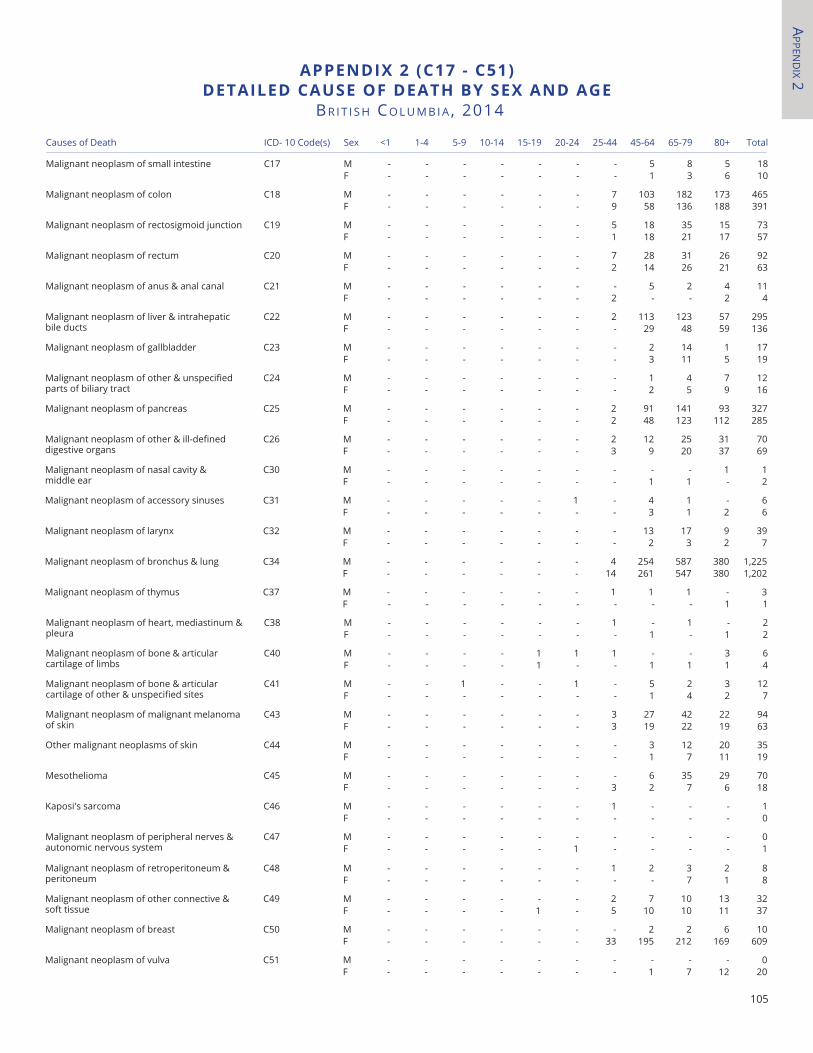
APPen
dIx 2
105
aPPenDIX 2 (C17 - C51)DetaIleD CaUSe of DeatH BY SeX anD aGe
BR I t I S h Co L u M B I A , 2014
Causes of Death ICD- 10 Code(s) Sex <1 1-4 5-9 10-14 15-19 20-24 25-44 45-64 65-79 80+ Total
Malignant neoplasm of small intestine C17 M - - - - - - - 5 8 5 18F - - - - - - - 1 3 6 10
Malignant neoplasm of colon C18 M - - - - - - 7 103 182 173 465F - - - - - - 9 58 136 188 391
Malignant neoplasm of rectosigmoid junction C19 M - - - - - - 5 18 35 15 73F - - - - - - 1 18 21 17 57
Malignant neoplasm of rectum C20 M - - - - - - 7 28 31 26 92F - - - - - - 2 14 26 21 63
Malignant neoplasm of anus & anal canal C21 M - - - - - - - 5 2 4 11F - - - - - - 2 - - 2 4
Malignant neoplasm of liver & intrahepatic bile ducts
C22 M - - - - - - 2 113 123 57 295F - - - - - - - 29 48 59 136
Malignant neoplasm of gallbladder C23 M - - - - - - - 2 14 1 17F - - - - - - - 3 11 5 19
Malignant neoplasm of other & unspecified parts of biliary tract
C24 M - - - - - - - 1 4 7 12F - - - - - - - 2 5 9 16
Malignant neoplasm of pancreas C25 M - - - - - - 2 91 141 93 327F - - - - - - 2 48 123 112 285
Malignant neoplasm of other & ill-defined digestive organs
C26 M - - - - - - 2 12 25 31 70F - - - - - - 3 9 20 37 69
Malignant neoplasm of nasal cavity & middle ear
C30 M - - - - - - - - - 1 1F - - - - - - - 1 1 - 2
Malignant neoplasm of accessory sinuses C31 M - - - - - 1 - 4 1 - 6F - - - - - - - 3 1 2 6
Malignant neoplasm of larynx C32 M - - - - - - - 13 17 9 39F - - - - - - - 2 3 2 7
Malignant neoplasm of bronchus & lung C34 M - - - - - - 4 254 587 380 1,225F - - - - - - 14 261 547 380 1,202
Malignant neoplasm of thymus C37 M - - - - - - 1 1 1 - 3F - - - - - - - - - 1 1
Malignant neoplasm of heart, mediastinum & pleura
C38 M - - - - - - 1 - 1 - 2F - - - - - - - 1 - 1 2
Malignant neoplasm of bone & articular cartilage of limbs
C40 M - - - - 1 1 1 - - 3 6F - - - - 1 - - 1 1 1 4
Malignant neoplasm of bone & articular cartilage of other & unspecified sites
C41 M - - 1 - - 1 - 5 2 3 12F - - - - - - - 1 4 2 7
Malignant neoplasm of malignant melanoma of skin
C43 M - - - - - - 3 27 42 22 94F - - - - - - 3 19 22 19 63
Other malignant neoplasms of skin C44 M - - - - - - - 3 12 20 35F - - - - - - - 1 7 11 19
Mesothelioma C45 M - - - - - - - 6 35 29 70F - - - - - - 3 2 7 6 18
Kaposi's sarcoma C46 M - - - - - - 1 - - - 1F - - - - - - - - - - 0
Malignant neoplasm of peripheral nerves & autonomic nervous system
C47 M - - - - - - - - - - 0F - - - - - 1 - - - - 1
Malignant neoplasm of retroperitoneum & peritoneum
C48 M - - - - - - 1 2 3 2 8F - - - - - - - - 7 1 8
Malignant neoplasm of other connective & soft tissue
C49 M - - - - - - 2 7 10 13 32F - - - - 1 - 5 10 10 11 37
Malignant neoplasm of breast C50 M - - - - - - - 2 2 6 10F - - - - - - 33 195 212 169 609
Malignant neoplasm of vulva C51 M - - - - - - - - - - 0F - - - - - - - 1 7 12 20
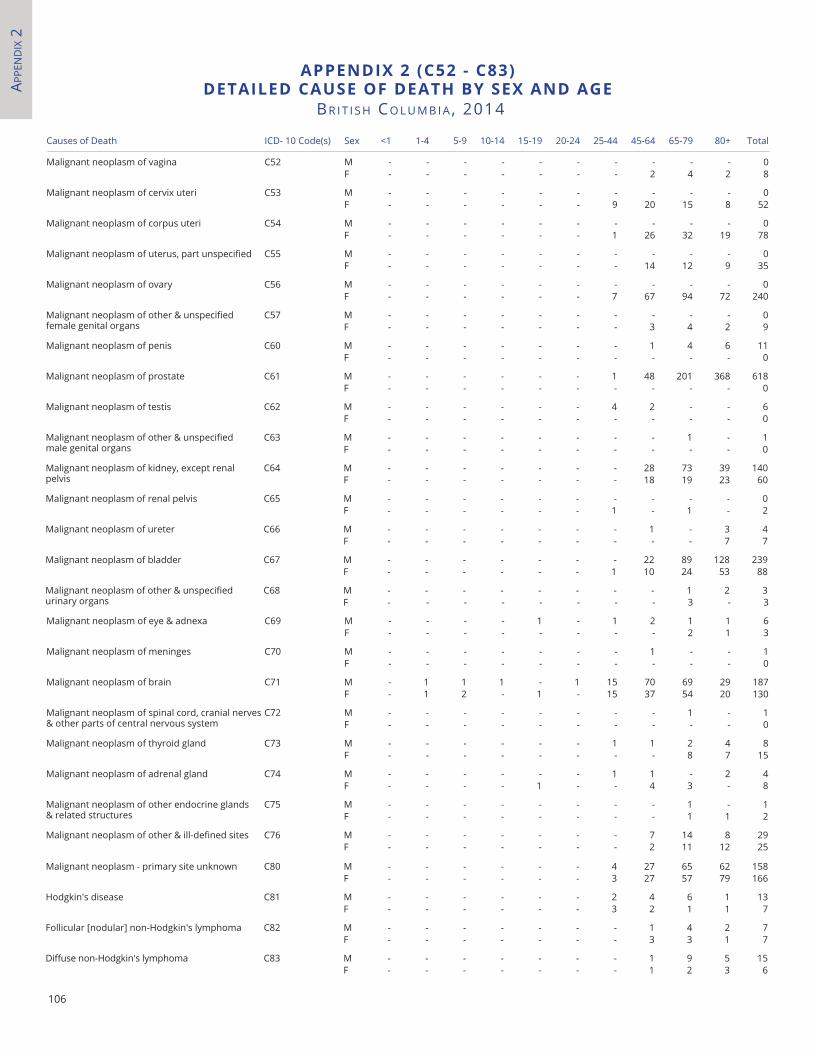
APPe
nd
Ix 2
106
aPPenDIX 2 (C52 - C83)DetaIleD CaUSe of DeatH BY SeX anD aGe
BR I t I S h Co L u M B I A , 2014
Causes of Death ICD- 10 Code(s) Sex <1 1-4 5-9 10-14 15-19 20-24 25-44 45-64 65-79 80+ Total
Malignant neoplasm of vagina C52 M - - - - - - - - - - 0F - - - - - - - 2 4 2 8
Malignant neoplasm of cervix uteri C53 M - - - - - - - - - - 0F - - - - - - 9 20 15 8 52
Malignant neoplasm of corpus uteri C54 M - - - - - - - - - - 0F - - - - - - 1 26 32 19 78
Malignant neoplasm of uterus, part unspecified C55 M - - - - - - - - - - 0F - - - - - - - 14 12 9 35
Malignant neoplasm of ovary C56 M - - - - - - - - - - 0F - - - - - - 7 67 94 72 240
Malignant neoplasm of other & unspecified female genital organs
C57 M - - - - - - - - - - 0F - - - - - - - 3 4 2 9
Malignant neoplasm of penis C60 M - - - - - - - 1 4 6 11F - - - - - - - - - - 0
Malignant neoplasm of prostate C61 M - - - - - - 1 48 201 368 618F - - - - - - - - - - 0
Malignant neoplasm of testis C62 M - - - - - - 4 2 - - 6F - - - - - - - - - - 0
Malignant neoplasm of other & unspecified male genital organs
C63 M - - - - - - - - 1 - 1F - - - - - - - - - - 0
Malignant neoplasm of kidney, except renal pelvis
C64 M - - - - - - - 28 73 39 140F - - - - - - - 18 19 23 60
Malignant neoplasm of renal pelvis C65 M - - - - - - - - - - 0F - - - - - - 1 - 1 - 2
Malignant neoplasm of ureter C66 M - - - - - - - 1 - 3 4F - - - - - - - - - 7 7
Malignant neoplasm of bladder C67 M - - - - - - - 22 89 128 239F - - - - - - 1 10 24 53 88
Malignant neoplasm of other & unspecified urinary organs
C68 M - - - - - - - - 1 2 3F - - - - - - - - 3 - 3
Malignant neoplasm of eye & adnexa C69 M - - - - 1 - 1 2 1 1 6F - - - - - - - - 2 1 3
Malignant neoplasm of meninges C70 M - - - - - - - 1 - - 1F - - - - - - - - - - 0
Malignant neoplasm of brain C71 M - 1 1 1 - 1 15 70 69 29 187F - 1 2 - 1 - 15 37 54 20 130
Malignant neoplasm of spinal cord, cranial nerves & other parts of central nervous system
C72 M - - - - - - - - 1 - 1F - - - - - - - - - - 0
Malignant neoplasm of thyroid gland C73 M - - - - - - 1 1 2 4 8F - - - - - - - - 8 7 15
Malignant neoplasm of adrenal gland C74 M - - - - - - 1 1 - 2 4F - - - - 1 - - 4 3 - 8
Malignant neoplasm of other endocrine glands & related structures
C75 M - - - - - - - - 1 - 1F - - - - - - - - 1 1 2
Malignant neoplasm of other & ill-defined sites C76 M - - - - - - - 7 14 8 29F - - - - - - - 2 11 12 25
Malignant neoplasm - primary site unknown C80 M - - - - - - 4 27 65 62 158F - - - - - - 3 27 57 79 166
Hodgkin's disease C81 M - - - - - - 2 4 6 1 13F - - - - - - 3 2 1 1 7
Follicular [nodular] non-Hodgkin's lymphoma C82 M - - - - - - - 1 4 2 7F - - - - - - - 3 3 1 7
Diffuse non-Hodgkin's lymphoma C83 M - - - - - - - 1 9 5 15F - - - - - - - 1 2 3 6
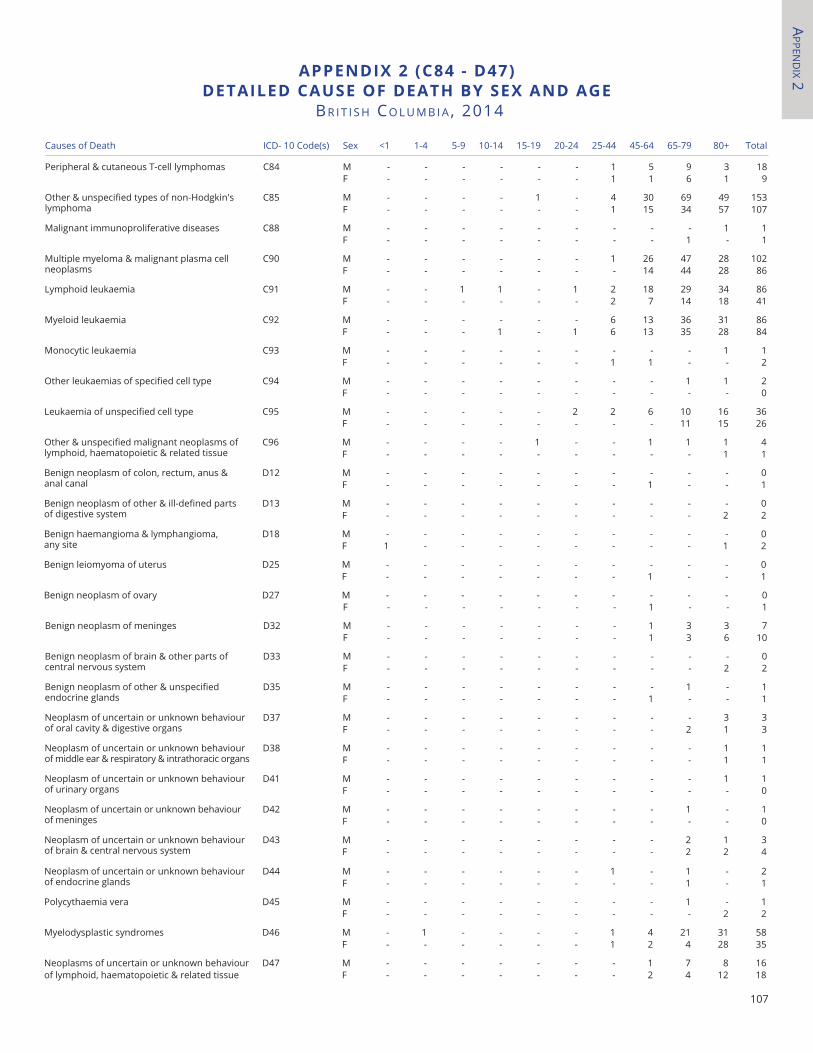
APPen
dIx 2
107
aPPenDIX 2 (C84 - D47)DetaIleD CaUSe of DeatH BY SeX anD aGe
BR I t I S h Co L u M B I A , 2014
Causes of Death ICD- 10 Code(s) Sex <1 1-4 5-9 10-14 15-19 20-24 25-44 45-64 65-79 80+ Total
Peripheral & cutaneous T-cell lymphomas C84 M - - - - - - 1 5 9 3 18F - - - - - - 1 1 6 1 9
Other & unspecified types of non-Hodgkin's lymphoma
C85 M - - - - 1 - 4 30 69 49 153F - - - - - - 1 15 34 57 107
Malignant immunoproliferative diseases C88 M - - - - - - - - - 1 1F - - - - - - - - 1 - 1
Multiple myeloma & malignant plasma cell neoplasms
C90 M - - - - - - 1 26 47 28 102F - - - - - - - 14 44 28 86
Lymphoid leukaemia C91 M - - 1 1 - 1 2 18 29 34 86F - - - - - - 2 7 14 18 41
Myeloid leukaemia C92 M - - - - - - 6 13 36 31 86F - - - 1 - 1 6 13 35 28 84
Monocytic leukaemia C93 M - - - - - - - - - 1 1F - - - - - - 1 1 - - 2
Other leukaemias of specified cell type C94 M - - - - - - - - 1 1 2F - - - - - - - - - - 0
Leukaemia of unspecified cell type C95 M - - - - - 2 2 6 10 16 36F - - - - - - - - 11 15 26
Other & unspecified malignant neoplasms of lymphoid, haematopoietic & related tissue
C96 M - - - - 1 - - 1 1 1 4F - - - - - - - - - 1 1
Benign neoplasm of colon, rectum, anus & anal canal
D12 M - - - - - - - - - - 0F - - - - - - - 1 - - 1
Benign neoplasm of other & ill-defined parts of digestive system
D13 M - - - - - - - - - - 0F - - - - - - - - - 2 2
Benign haemangioma & lymphangioma, any site
D18 M - - - - - - - - - - 0F 1 - - - - - - - - 1 2
Benign leiomyoma of uterus D25 M - - - - - - - - - - 0F - - - - - - - 1 - - 1
Benign neoplasm of ovary D27 M - - - - - - - - - - 0F - - - - - - - 1 - - 1
Benign neoplasm of meninges D32 M - - - - - - - 1 3 3 7F - - - - - - - 1 3 6 10
Benign neoplasm of brain & other parts of central nervous system
D33 M - - - - - - - - - - 0F - - - - - - - - - 2 2
Benign neoplasm of other & unspecified endocrine glands
D35 M - - - - - - - - 1 - 1F - - - - - - - 1 - - 1
Neoplasm of uncertain or unknown behaviour of oral cavity & digestive organs
D37 M - - - - - - - - - 3 3F - - - - - - - - 2 1 3
Neoplasm of uncertain or unknown behaviour of middle ear & respiratory & intrathoracic organs
D38 M - - - - - - - - - 1 1F - - - - - - - - - 1 1
Neoplasm of uncertain or unknown behaviour of urinary organs
D41 M - - - - - - - - - 1 1F - - - - - - - - - - 0
Neoplasm of uncertain or unknown behaviour of meninges
D42 M - - - - - - - - 1 - 1F - - - - - - - - - - 0
Neoplasm of uncertain or unknown behaviour of brain & central nervous system
D43 M - - - - - - - - 2 1 3F - - - - - - - - 2 2 4
Neoplasm of uncertain or unknown behaviour of endocrine glands
D44 M - - - - - - 1 - 1 - 2F - - - - - - - - 1 - 1
Polycythaemia vera D45 M - - - - - - - - 1 - 1F - - - - - - - - - 2 2
Myelodysplastic syndromes D46 M - 1 - - - - 1 4 21 31 58F - - - - - - 1 2 4 28 35
Neoplasms of uncertain or unknown behaviour of lymphoid, haematopoietic & related tissue
D47 M - - - - - - - 1 7 8 16F - - - - - - - 2 4 12 18
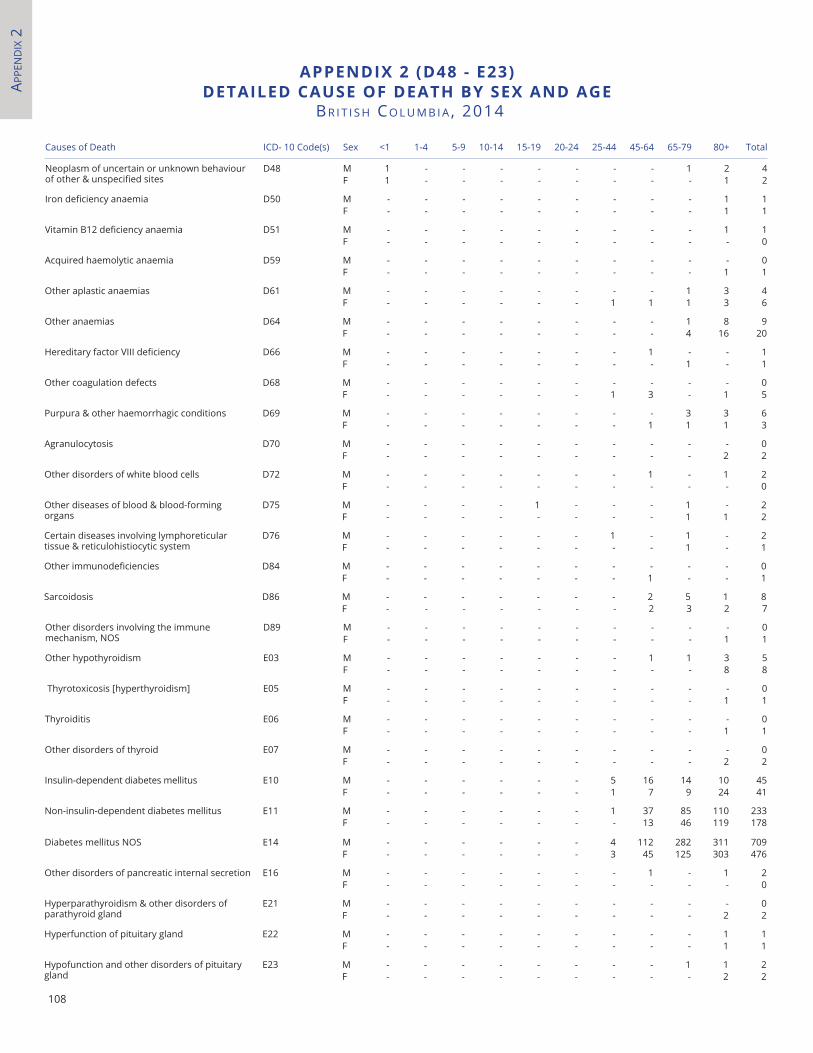
APPe
nd
Ix 2
108
aPPenDIX 2 (D48 - e23)DetaIleD CaUSe of DeatH BY SeX anD aGe
BR I t I S h Co L u M B I A , 2014
Causes of Death ICD- 10 Code(s) Sex <1 1-4 5-9 10-14 15-19 20-24 25-44 45-64 65-79 80+ Total
Neoplasm of uncertain or unknown behaviour of other & unspecified sites
D48 M 1 - - - - - - - 1 2 4F 1 - - - - - - - - 1 2
Iron deficiency anaemia D50 M - - - - - - - - - 1 1F - - - - - - - - - 1 1
Vitamin B12 deficiency anaemia D51 M - - - - - - - - - 1 1F - - - - - - - - - - 0
Acquired haemolytic anaemia D59 M - - - - - - - - - - 0F - - - - - - - - - 1 1
Other aplastic anaemias D61 M - - - - - - - - 1 3 4F - - - - - - 1 1 1 3 6
Other anaemias D64 M - - - - - - - - 1 8 9F - - - - - - - - 4 16 20
Hereditary factor VIII deficiency D66 M - - - - - - - 1 - - 1F - - - - - - - - 1 - 1
Other coagulation defects D68 M - - - - - - - - - - 0F - - - - - - 1 3 - 1 5
Purpura & other haemorrhagic conditions D69 M - - - - - - - - 3 3 6F - - - - - - - 1 1 1 3
Agranulocytosis D70 M - - - - - - - - - - 0F - - - - - - - - - 2 2
Other disorders of white blood cells D72 M - - - - - - - 1 - 1 2F - - - - - - - - - - 0
Other diseases of blood & blood-forming organs
D75 M - - - - 1 - - - 1 - 2F - - - - - - - - 1 1 2
Certain diseases involving lymphoreticular tissue & reticulohistiocytic system
D76 M - - - - - - 1 - 1 - 2F - - - - - - - - 1 - 1
Other immunodeficiencies D84 M - - - - - - - - - - 0F - - - - - - - 1 - - 1
Sarcoidosis D86 M - - - - - - - 2 5 1 8F - - - - - - - 2 3 2 7
Other disorders involving the immune mechanism, NOS
D89 M - - - - - - - - - - 0F - - - - - - - - - 1 1
Other hypothyroidism E03 M - - - - - - - 1 1 3 5F - - - - - - - - - 8 8
Thyrotoxicosis [hyperthyroidism] E05 M - - - - - - - - - - 0F - - - - - - - - - 1 1
Thyroiditis E06 M - - - - - - - - - - 0F - - - - - - - - - 1 1
Other disorders of thyroid E07 M - - - - - - - - - - 0F - - - - - - - - - 2 2
Insulin-dependent diabetes mellitus E10 M - - - - - - 5 16 14 10 45F - - - - - - 1 7 9 24 41
Non-insulin-dependent diabetes mellitus E11 M - - - - - - 1 37 85 110 233F - - - - - - - 13 46 119 178
Diabetes mellitus NOS E14 M - - - - - - 4 112 282 311 709F - - - - - - 3 45 125 303 476
Other disorders of pancreatic internal secretion E16 M - - - - - - - 1 - 1 2F - - - - - - - - - - 0
Hyperparathyroidism & other disorders of parathyroid gland
E21 M - - - - - - - - - - 0F - - - - - - - - - 2 2
Hyperfunction of pituitary gland E22 M - - - - - - - - - 1 1F - - - - - - - - - 1 1
Hypofunction and other disorders of pituitary gland
E23 M - - - - - - - - 1 1 2F - - - - - - - - - 2 2
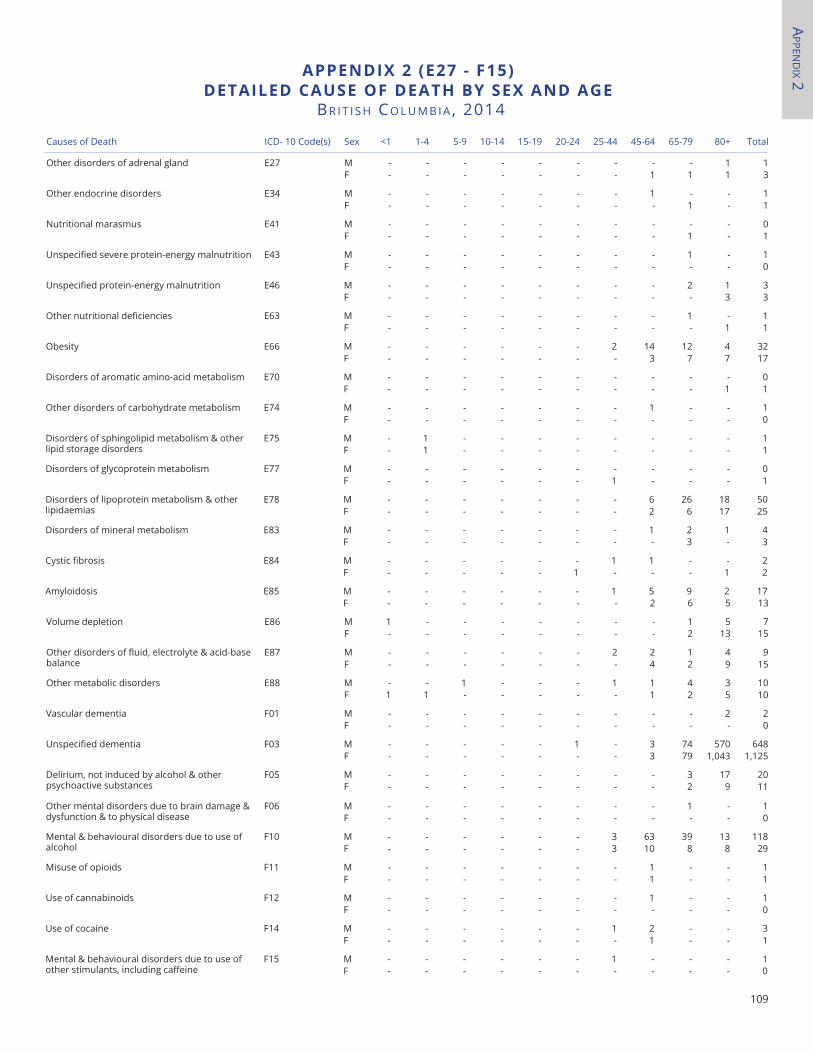
APPen
dIx 2
109
aPPenDIX 2 (e27 - f15)DetaIleD CaUSe of DeatH BY SeX anD aGe
BR I t I S h Co L u M B I A , 2014
Causes of Death ICD- 10 Code(s) Sex <1 1-4 5-9 10-14 15-19 20-24 25-44 45-64 65-79 80+ Total
Other disorders of adrenal gland E27 M - - - - - - - - - 1 1F - - - - - - - 1 1 1 3
Other endocrine disorders E34 M - - - - - - - 1 - - 1F - - - - - - - - 1 - 1
Nutritional marasmus E41 M - - - - - - - - - - 0F - - - - - - - - 1 - 1
Unspecified severe protein-energy malnutrition E43 M - - - - - - - - 1 - 1F - - - - - - - - - - 0
Unspecified protein-energy malnutrition E46 M - - - - - - - - 2 1 3F - - - - - - - - - 3 3
Other nutritional deficiencies E63 M - - - - - - - - 1 - 1F - - - - - - - - - 1 1
Obesity E66 M - - - - - - 2 14 12 4 32F - - - - - - - 3 7 7 17
Disorders of aromatic amino-acid metabolism E70 M - - - - - - - - - - 0F - - - - - - - - - 1 1
Other disorders of carbohydrate metabolism E74 M - - - - - - - 1 - - 1F - - - - - - - - - - 0
Disorders of sphingolipid metabolism & other lipid storage disorders
E75 M - 1 - - - - - - - - 1F - 1 - - - - - - - - 1
Disorders of glycoprotein metabolism E77 M - - - - - - - - - - 0F - - - - - - 1 - - - 1
Disorders of lipoprotein metabolism & other lipidaemias
E78 M - - - - - - - 6 26 18 50F - - - - - - - 2 6 17 25
Disorders of mineral metabolism E83 M - - - - - - - 1 2 1 4F - - - - - - - - 3 - 3
Cystic fibrosis E84 M - - - - - - 1 1 - - 2F - - - - - 1 - - - 1 2
Amyloidosis E85 M - - - - - - 1 5 9 2 17F - - - - - - - 2 6 5 13
Volume depletion E86 M 1 - - - - - - - 1 5 7F - - - - - - - - 2 13 15
Other disorders of fluid, electrolyte & acid-base balance
E87 M - - - - - - 2 2 1 4 9F - - - - - - - 4 2 9 15
Other metabolic disorders E88 M - - 1 - - - 1 1 4 3 10F 1 1 - - - - - 1 2 5 10
Vascular dementia F01 M - - - - - - - - - 2 2F - - - - - - - - - - 0
Unspecified dementia F03 M - - - - - 1 - 3 74 570 648F - - - - - - - 3 79 1,043 1,125
Delirium, not induced by alcohol & other psychoactive substances
F05 M - - - - - - - - 3 17 20F - - - - - - - - 2 9 11
Other mental disorders due to brain damage & dysfunction & to physical disease
F06 M - - - - - - - - 1 - 1F - - - - - - - - - - 0
Mental & behavioural disorders due to use of alcohol
F10 M - - - - - - 3 63 39 13 118F - - - - - - 3 10 8 8 29
Misuse of opioids F11 M - - - - - - - 1 - - 1F - - - - - - - 1 - - 1
Use of cannabinoids F12 M - - - - - - - 1 - - 1F - - - - - - - - - - 0
Use of cocaine F14 M - - - - - - 1 2 - - 3F - - - - - - - 1 - - 1
Mental & behavioural disorders due to use of other stimulants, including caffeine
F15 M - - - - - - 1 - - - 1F - - - - - - - - - - 0
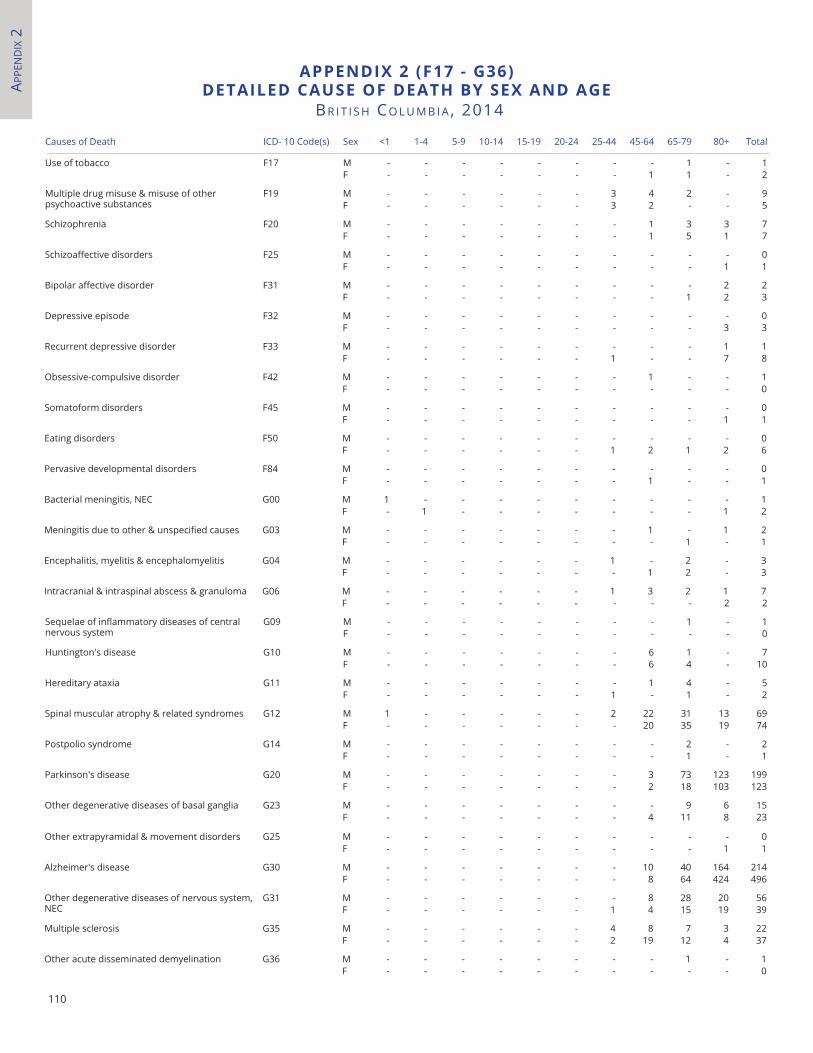
APPe
nd
Ix 2
110
aPPenDIX 2 (f17 - G36)DetaIleD CaUSe of DeatH BY SeX anD aGe
BR I t I S h Co L u M B I A , 2014
Causes of Death ICD- 10 Code(s) Sex <1 1-4 5-9 10-14 15-19 20-24 25-44 45-64 65-79 80+ Total
Use of tobacco F17 M - - - - - - - - 1 - 1F - - - - - - - 1 1 - 2
Multiple drug misuse & misuse of other psychoactive substances
F19 M - - - - - - 3 4 2 - 9F - - - - - - 3 2 - - 5
Schizophrenia F20 M - - - - - - - 1 3 3 7F - - - - - - - 1 5 1 7
Schizoaffective disorders F25 M - - - - - - - - - - 0F - - - - - - - - - 1 1
Bipolar affective disorder F31 M - - - - - - - - - 2 2F - - - - - - - - 1 2 3
Depressive episode F32 M - - - - - - - - - - 0F - - - - - - - - - 3 3
Recurrent depressive disorder F33 M - - - - - - - - - 1 1F - - - - - - 1 - - 7 8
Obsessive-compulsive disorder F42 M - - - - - - - 1 - - 1F - - - - - - - - - - 0
Somatoform disorders F45 M - - - - - - - - - - 0F - - - - - - - - - 1 1
Eating disorders F50 M - - - - - - - - - - 0F - - - - - - 1 2 1 2 6
Pervasive developmental disorders F84 M - - - - - - - - - - 0F - - - - - - - 1 - - 1
Bacterial meningitis, NEC G00 M 1 - - - - - - - - - 1F - 1 - - - - - - - 1 2
Meningitis due to other & unspecified causes G03 M - - - - - - - 1 - 1 2F - - - - - - - - 1 - 1
Encephalitis, myelitis & encephalomyelitis G04 M - - - - - - 1 - 2 - 3F - - - - - - - 1 2 - 3
Intracranial & intraspinal abscess & granuloma G06 M - - - - - - 1 3 2 1 7F - - - - - - - - - 2 2
Sequelae of inflammatory diseases of central nervous system
G09 M - - - - - - - - 1 - 1F - - - - - - - - - - 0
Huntington's disease G10 M - - - - - - - 6 1 - 7F - - - - - - - 6 4 - 10
Hereditary ataxia G11 M - - - - - - - 1 4 - 5F - - - - - - 1 - 1 - 2
Spinal muscular atrophy & related syndromes G12 M 1 - - - - - 2 22 31 13 69F - - - - - - - 20 35 19 74
Postpolio syndrome G14 M - - - - - - - - 2 - 2F - - - - - - - - 1 - 1
Parkinson's disease G20 M - - - - - - - 3 73 123 199F - - - - - - - 2 18 103 123
Other degenerative diseases of basal ganglia G23 M - - - - - - - - 9 6 15F - - - - - - - 4 11 8 23
Other extrapyramidal & movement disorders G25 M - - - - - - - - - - 0F - - - - - - - - - 1 1
Alzheimer's disease G30 M - - - - - - - 10 40 164 214F - - - - - - - 8 64 424 496
Other degenerative diseases of nervous system, NEC
G31 M - - - - - - - 8 28 20 56F - - - - - - 1 4 15 19 39
Multiple sclerosis G35 M - - - - - - 4 8 7 3 22F - - - - - - 2 19 12 4 37
Other acute disseminated demyelination G36 M - - - - - - - - 1 - 1F - - - - - - - - - - 0
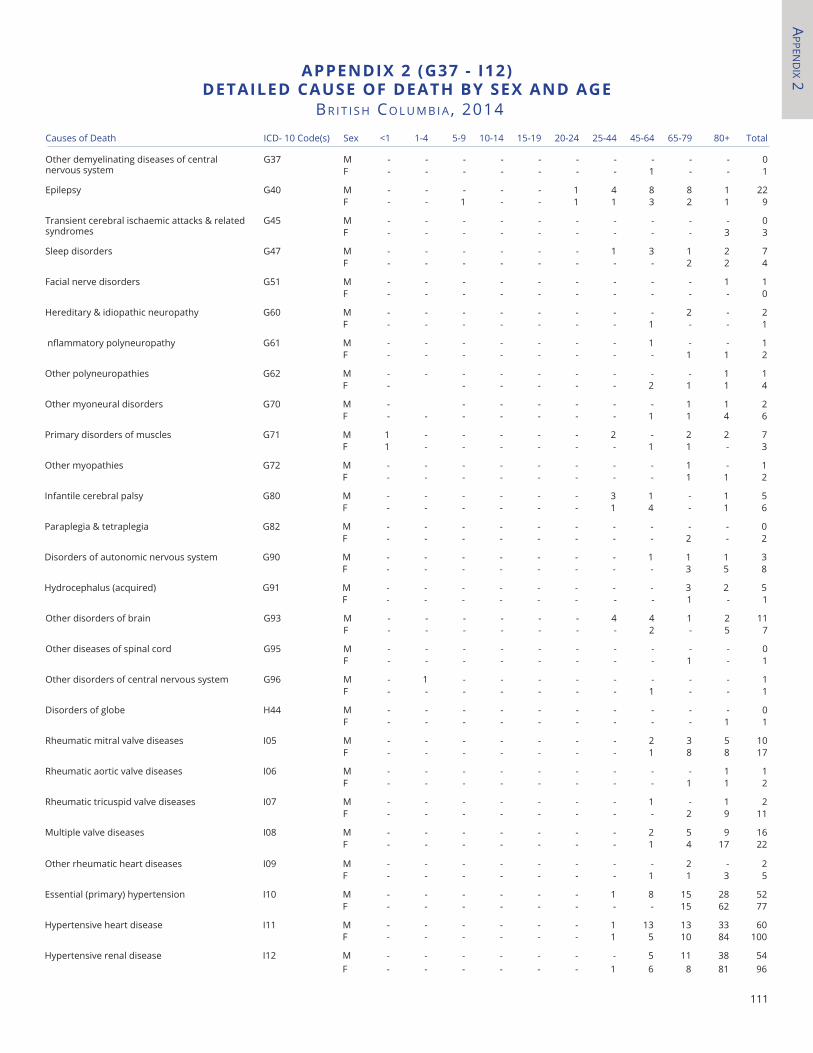
APPen
dIx 2
111
aPPenDIX 2 (G37 - I12)DetaIleD CaUSe of DeatH BY SeX anD aGe
BR I t I S h Co L u M B I A , 2014
Causes of Death ICD- 10 Code(s) Sex <1 1-4 5-9 10-14 15-19 20-24 25-44 45-64 65-79 80+ Total
Other demyelinating diseases of central nervous system
G37 M - - - - - - - - - - 0F - - - - - - - 1 - - 1
Epilepsy G40 M - - - - - 1 4 8 8 1 22F - - 1 - - 1 1 3 2 1 9
Transient cerebral ischaemic attacks & related syndromes
G45 M - - - - - - - - - - 0F - - - - - - - - - 3 3
Sleep disorders G47 M - - - - - - 1 3 1 2 7F - - - - - - - - 2 2 4
Facial nerve disorders G51 M - - - - - - - - - 1 1F - - - - - - - - - - 0
Hereditary & idiopathic neuropathy G60 M - - - - - - - - 2 - 2F - - - - - - - 1 - - 1
nflammatory polyneuropathy G61 M - - - - - - - 1 - - 1F - - - - - - - - 1 1 2
Other polyneuropathies G62 M - - - - - - - - - 1 1F - - - - - - 2 1 1 4
Other myoneural disorders G70 M - - - - - - - 1 1 2F - - - - - - - 1 1 4 6
Primary disorders of muscles G71 M 1 - - - - - 2 - 2 2 7F 1 - - - - - - 1 1 - 3
Other myopathies G72 M - - - - - - - - 1 - 1F - - - - - - - - 1 1 2
Infantile cerebral palsy G80 M - - - - - - 3 1 - 1 5F - - - - - - 1 4 - 1 6
Paraplegia & tetraplegia G82 M - - - - - - - - - - 0F - - - - - - - - 2 - 2
Disorders of autonomic nervous system G90 M - - - - - - - 1 1 1 3F - - - - - - - - 3 5 8
Hydrocephalus (acquired) G91 M - - - - - - - - 3 2 5F - - - - - - - - 1 - 1
Other disorders of brain G93 M - - - - - - 4 4 1 2 11F - - - - - - - 2 - 5 7
Other diseases of spinal cord G95 M - - - - - - - - - - 0F - - - - - - - - 1 - 1
Other disorders of central nervous system G96 M - 1 - - - - - - - - 1F - - - - - - - 1 - - 1
Disorders of globe H44 M - - - - - - - - - - 0F - - - - - - - - - 1 1
Rheumatic mitral valve diseases I05 M - - - - - - - 2 3 5 10F - - - - - - - 1 8 8 17
Rheumatic aortic valve diseases I06 M - - - - - - - - - 1 1F - - - - - - - - 1 1 2
Rheumatic tricuspid valve diseases I07 M - - - - - - - 1 - 1 2F - - - - - - - - 2 9 11
Multiple valve diseases I08 M - - - - - - - 2 5 9 16F - - - - - - - 1 4 17 22
Other rheumatic heart diseases I09 M - - - - - - - - 2 - 2F - - - - - - - 1 1 3 5
Essential (primary) hypertension I10 M - - - - - - 1 8 15 28 52F - - - - - - - - 15 62 77
Hypertensive heart disease I11 M - - - - - - 1 13 13 33 60F - - - - - - 1 5 10 84 100
Hypertensive renal disease I12 M - - - - - - - 5 11 38 54F - - - - - - 1 6 8 81 96
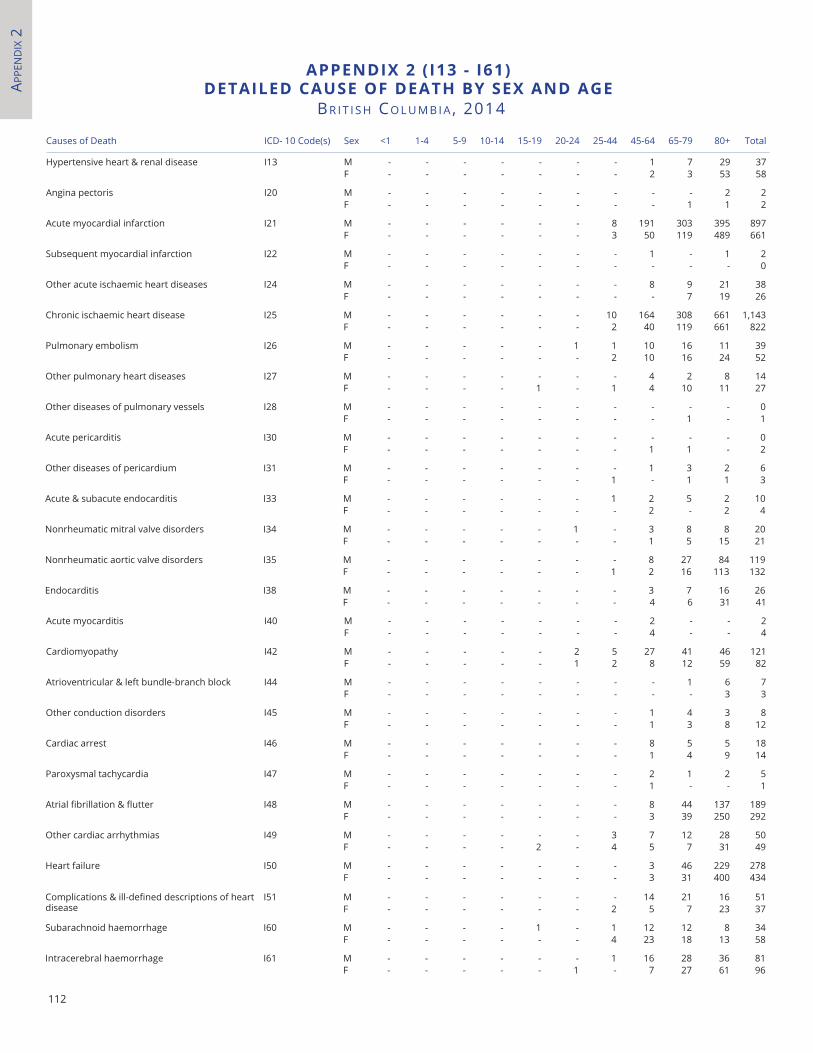
APPe
nd
Ix 2
112
aPPenDIX 2 ( I13 - I61)DetaIleD CaUSe of DeatH BY SeX anD aGe
BR I t I S h Co L u M B I A , 2014
Causes of Death ICD- 10 Code(s) Sex <1 1-4 5-9 10-14 15-19 20-24 25-44 45-64 65-79 80+ Total
Hypertensive heart & renal disease I13 M - - - - - - - 1 7 29 37F - - - - - - - 2 3 53 58
Angina pectoris I20 M - - - - - - - - - 2 2F - - - - - - - - 1 1 2
Acute myocardial infarction I21 M - - - - - - 8 191 303 395 897F - - - - - - 3 50 119 489 661
Subsequent myocardial infarction I22 M - - - - - - - 1 - 1 2F - - - - - - - - - - 0
Other acute ischaemic heart diseases I24 M - - - - - - - 8 9 21 38F - - - - - - - - 7 19 26
Chronic ischaemic heart disease I25 M - - - - - - 10 164 308 661 1,143F - - - - - - 2 40 119 661 822
Pulmonary embolism I26 M - - - - - 1 1 10 16 11 39F - - - - - - 2 10 16 24 52
Other pulmonary heart diseases I27 M - - - - - - - 4 2 8 14F - - - - 1 - 1 4 10 11 27
Other diseases of pulmonary vessels I28 M - - - - - - - - - - 0F - - - - - - - - 1 - 1
Acute pericarditis I30 M - - - - - - - - - - 0F - - - - - - - 1 1 - 2
Other diseases of pericardium I31 M - - - - - - - 1 3 2 6F - - - - - - 1 - 1 1 3
Acute & subacute endocarditis I33 M - - - - - - 1 2 5 2 10F - - - - - - - 2 - 2 4
Nonrheumatic mitral valve disorders I34 M - - - - - 1 - 3 8 8 20F - - - - - - - 1 5 15 21
Nonrheumatic aortic valve disorders I35 M - - - - - - - 8 27 84 119F - - - - - - 1 2 16 113 132
Endocarditis I38 M - - - - - - - 3 7 16 26F - - - - - - - 4 6 31 41
Acute myocarditis I40 M - - - - - - - 2 - - 2F - - - - - - - 4 - - 4
Cardiomyopathy I42 M - - - - - 2 5 27 41 46 121F - - - - - 1 2 8 12 59 82
Atrioventricular & left bundle-branch block I44 M - - - - - - - - 1 6 7F - - - - - - - - - 3 3
Other conduction disorders I45 M - - - - - - - 1 4 3 8F - - - - - - - 1 3 8 12
Cardiac arrest I46 M - - - - - - - 8 5 5 18F - - - - - - - 1 4 9 14
Paroxysmal tachycardia I47 M - - - - - - - 2 1 2 5F - - - - - - - 1 - - 1
Atrial fibrillation & flutter I48 M - - - - - - - 8 44 137 189F - - - - - - - 3 39 250 292
Other cardiac arrhythmias I49 M - - - - - - 3 7 12 28 50F - - - - 2 - 4 5 7 31 49
Heart failure I50 M - - - - - - - 3 46 229 278F - - - - - - - 3 31 400 434
Complications & ill-defined descriptions of heart disease
I51 M - - - - - - - 14 21 16 51F - - - - - - 2 5 7 23 37
Subarachnoid haemorrhage I60 M - - - - 1 - 1 12 12 8 34F - - - - - - 4 23 18 13 58
Intracerebral haemorrhage I61 M - - - - - - 1 16 28 36 81F - - - - - 1 - 7 27 61 96
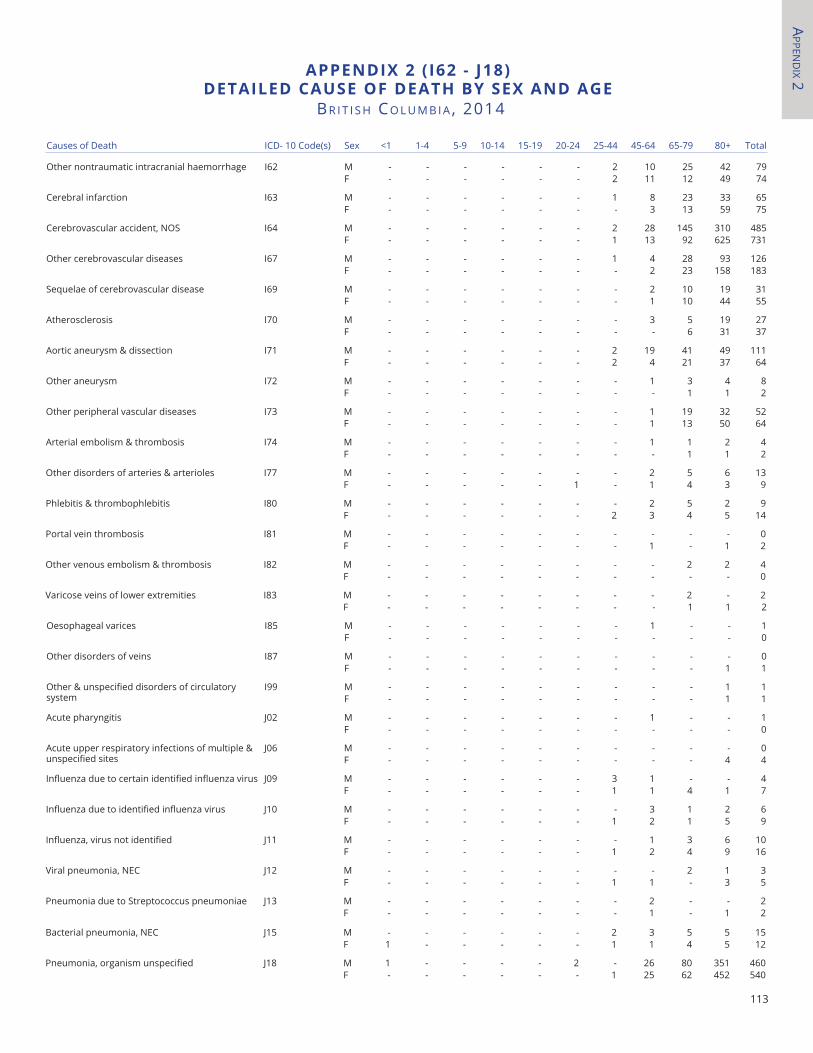
APPen
dIx 2
113
aPPenDIX 2 ( I62 - J18)DetaIleD CaUSe of DeatH BY SeX anD aGe
BR I t I S h Co L u M B I A , 2014
Causes of Death ICD- 10 Code(s) Sex <1 1-4 5-9 10-14 15-19 20-24 25-44 45-64 65-79 80+ Total
Other nontraumatic intracranial haemorrhage I62 M - - - - - - 2 10 25 42 79F - - - - - - 2 11 12 49 74
Cerebral infarction I63 M - - - - - - 1 8 23 33 65F - - - - - - - 3 13 59 75
Cerebrovascular accident, NOS I64 M - - - - - - 2 28 145 310 485F - - - - - - 1 13 92 625 731
Other cerebrovascular diseases I67 M - - - - - - 1 4 28 93 126F - - - - - - - 2 23 158 183
Sequelae of cerebrovascular disease I69 M - - - - - - - 2 10 19 31F - - - - - - - 1 10 44 55
Atherosclerosis I70 M - - - - - - - 3 5 19 27F - - - - - - - - 6 31 37
Aortic aneurysm & dissection I71 M - - - - - - 2 19 41 49 111F - - - - - - 2 4 21 37 64
Other aneurysm I72 M - - - - - - - 1 3 4 8F - - - - - - - - 1 1 2
Other peripheral vascular diseases I73 M - - - - - - - 1 19 32 52F - - - - - - - 1 13 50 64
Arterial embolism & thrombosis I74 M - - - - - - - 1 1 2 4F - - - - - - - - 1 1 2
Other disorders of arteries & arterioles I77 M - - - - - - - 2 5 6 13F - - - - - 1 - 1 4 3 9
Phlebitis & thrombophlebitis I80 M - - - - - - - 2 5 2 9F - - - - - - 2 3 4 5 14
Portal vein thrombosis I81 M - - - - - - - - - - 0F - - - - - - - 1 - 1 2
Other venous embolism & thrombosis I82 M - - - - - - - - 2 2 4F - - - - - - - - - - 0
Varicose veins of lower extremities I83 M - - - - - - - - 2 - 2F - - - - - - - - 1 1 2
Oesophageal varices I85 M - - - - - - - 1 - - 1F - - - - - - - - - - 0
Other disorders of veins I87 M - - - - - - - - - - 0F - - - - - - - - - 1 1
Other & unspecified disorders of circulatory system
I99 M - - - - - - - - - 1 1F - - - - - - - - - 1 1
Acute pharyngitis J02 M - - - - - - - 1 - - 1F - - - - - - - - - - 0
Acute upper respiratory infections of multiple & unspecified sites
J06 M - - - - - - - - - - 0F - - - - - - - - - 4 4
Influenza due to certain identified influenza virus J09 M - - - - - - 3 1 - - 4F - - - - - - 1 1 4 1 7
Influenza due to identified influenza virus J10 M - - - - - - - 3 1 2 6F - - - - - - 1 2 1 5 9
Influenza, virus not identified J11 M - - - - - - - 1 3 6 10F - - - - - - 1 2 4 9 16
Viral pneumonia, NEC J12 M - - - - - - - - 2 1 3F - - - - - - 1 1 - 3 5
Pneumonia due to Streptococcus pneumoniae J13 M - - - - - - - 2 - - 2F - - - - - - - 1 - 1 2
Bacterial pneumonia, NEC J15 M - - - - - - 2 3 5 5 15F 1 - - - - - 1 1 4 5 12
Pneumonia, organism unspecified J18 M 1 - - - - 2 - 26 80 351 460F - - - - - - 1 25 62 452 540
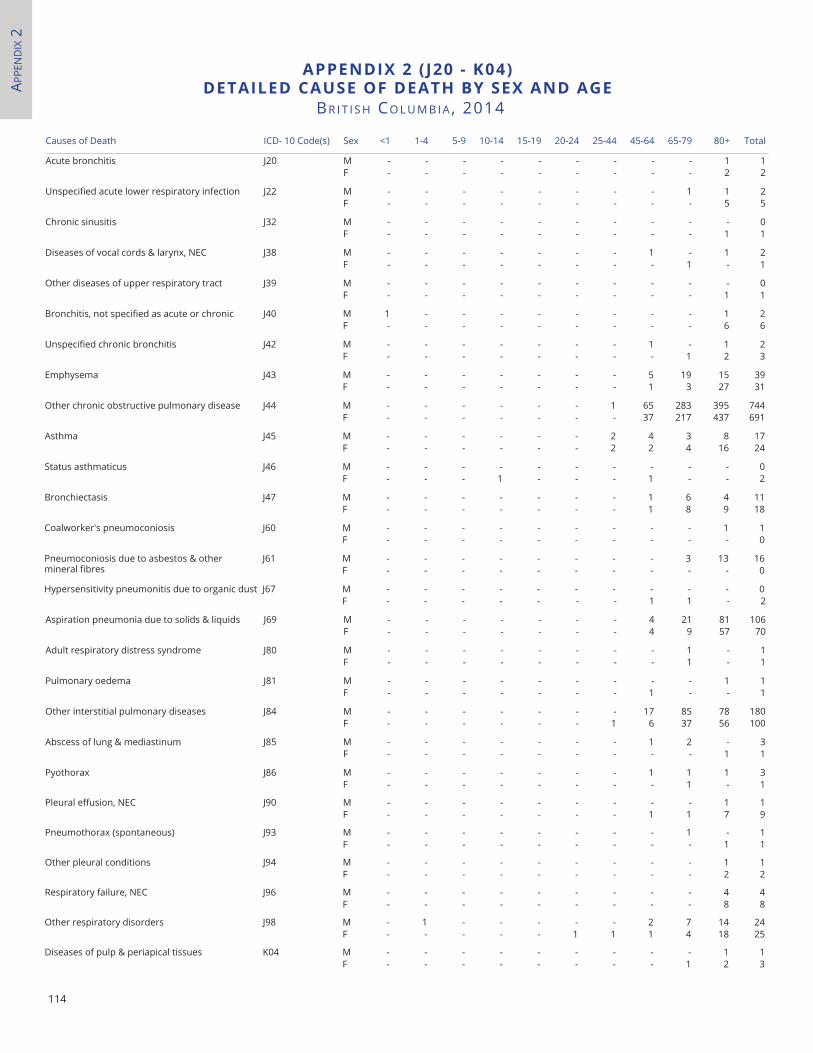
APPe
nd
Ix 2
114
aPPenDIX 2 ( J20 - K04)DetaIleD CaUSe of DeatH BY SeX anD aGe
BR I t I S h Co L u M B I A , 2014
Causes of Death ICD- 10 Code(s) Sex <1 1-4 5-9 10-14 15-19 20-24 25-44 45-64 65-79 80+ Total
Acute bronchitis J20 M - - - - - - - - - 1 1F - - - - - - - - - 2 2
Unspecified acute lower respiratory infection J22 M - - - - - - - - 1 1 2F - - - - - - - - - 5 5
Chronic sinusitis J32 M - - - - - - - - - - 0F - - - - - - - - - 1 1
Diseases of vocal cords & larynx, NEC J38 M - - - - - - - 1 - 1 2F - - - - - - - - 1 - 1
Other diseases of upper respiratory tract J39 M - - - - - - - - - - 0F - - - - - - - - - 1 1
Bronchitis, not specified as acute or chronic J40 M 1 - - - - - - - - 1 2F - - - - - - - - - 6 6
Unspecified chronic bronchitis J42 M - - - - - - - 1 - 1 2F - - - - - - - - 1 2 3
Emphysema J43 M - - - - - - - 5 19 15 39F - - - - - - - 1 3 27 31
Other chronic obstructive pulmonary disease J44 M - - - - - - 1 65 283 395 744F - - - - - - - 37 217 437 691
Asthma J45 M - - - - - - 2 4 3 8 17F - - - - - - 2 2 4 16 24
Status asthmaticus J46 M - - - - - - - - - - 0F - - - 1 - - - 1 - - 2
Bronchiectasis J47 M - - - - - - - 1 6 4 11F - - - - - - - 1 8 9 18
Coalworker's pneumoconiosis J60 M - - - - - - - - - 1 1F - - - - - - - - - - 0
Pneumoconiosis due to asbestos & other mineral fibres
J61 M - - - - - - - - 3 13 16F - - - - - - - - - - 0
Hypersensitivity pneumonitis due to organic dust J67 M - - - - - - - - - - 0F - - - - - - - 1 1 - 2
Aspiration pneumonia due to solids & liquids J69 M - - - - - - - 4 21 81 106F - - - - - - - 4 9 57 70
Adult respiratory distress syndrome J80 M - - - - - - - - 1 - 1F - - - - - - - - 1 - 1
Pulmonary oedema J81 M - - - - - - - - - 1 1F - - - - - - - 1 - - 1
Other interstitial pulmonary diseases J84 M - - - - - - - 17 85 78 180F - - - - - - 1 6 37 56 100
Abscess of lung & mediastinum J85 M - - - - - - - 1 2 - 3F - - - - - - - - - 1 1
Pyothorax J86 M - - - - - - - 1 1 1 3F - - - - - - - - 1 - 1
Pleural effusion, NEC J90 M - - - - - - - - - 1 1F - - - - - - - 1 1 7 9
Pneumothorax (spontaneous) J93 M - - - - - - - - 1 - 1F - - - - - - - - - 1 1
Other pleural conditions J94 M - - - - - - - - - 1 1F - - - - - - - - - 2 2
Respiratory failure, NEC J96 M - - - - - - - - - 4 4F - - - - - - - - - 8 8
Other respiratory disorders J98 M - 1 - - - - - 2 7 14 24F - - - - - 1 1 1 4 18 25
Diseases of pulp & periapical tissues K04 M - - - - - - - - - 1 1F - - - - - - - - 1 2 3
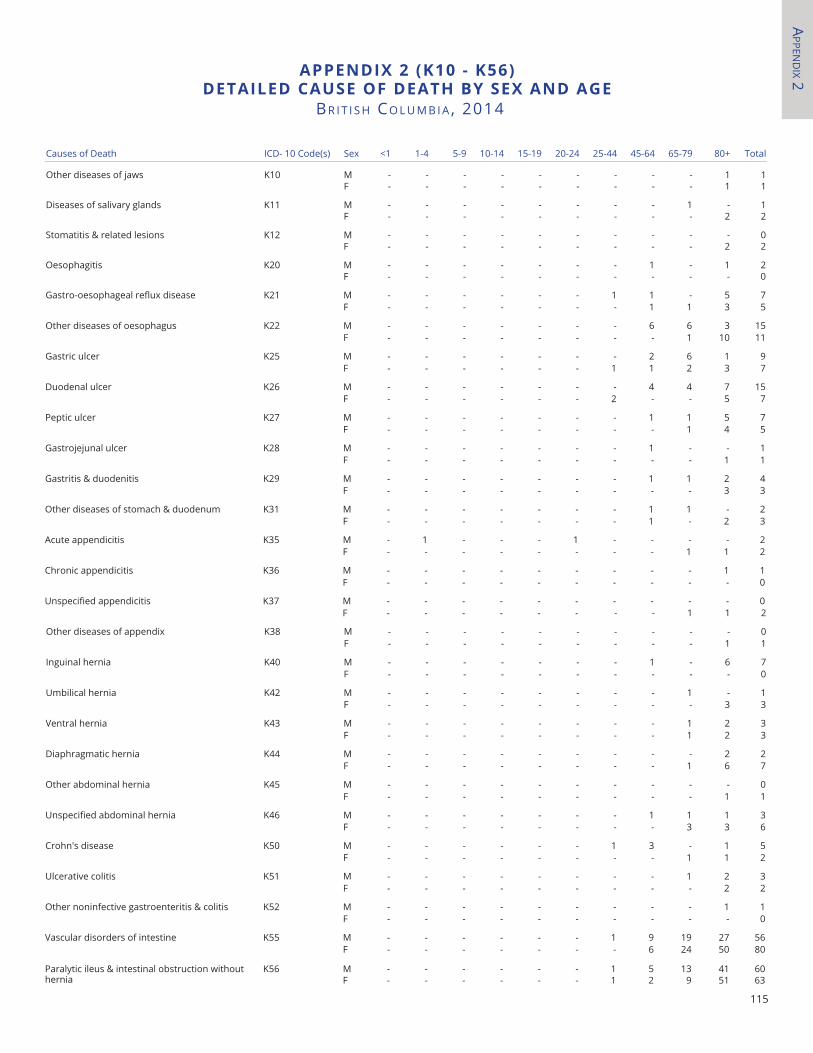
APPen
dIx 2
115
Causes of Death ICD- 10 Code(s) Sex <1 1-4 5-9 10-14 15-19 20-24 25-44 45-64 65-79 80+ Total
Other diseases of jaws K10 M - - - - - - - - - 1 1F - - - - - - - - - 1 1
Diseases of salivary glands K11 M - - - - - - - - 1 - 1F - - - - - - - - - 2 2
Stomatitis & related lesions K12 M - - - - - - - - - - 0F - - - - - - - - - 2 2
Oesophagitis K20 M - - - - - - - 1 - 1 2F - - - - - - - - - - 0
Gastro-oesophageal reflux disease K21 M - - - - - - 1 1 - 5 7F - - - - - - - 1 1 3 5
Other diseases of oesophagus K22 M - - - - - - - 6 6 3 15F - - - - - - - - 1 10 11
Gastric ulcer K25 M - - - - - - - 2 6 1 9F - - - - - - 1 1 2 3 7
Duodenal ulcer K26 M - - - - - - - 4 4 7 15F - - - - - - 2 - - 5 7
Peptic ulcer K27 M - - - - - - - 1 1 5 7F - - - - - - - - 1 4 5
Gastrojejunal ulcer K28 M - - - - - - - 1 - - 1F - - - - - - - - - 1 1
Gastritis & duodenitis K29 M - - - - - - - 1 1 2 4F - - - - - - - - - 3 3
Other diseases of stomach & duodenum K31 M - - - - - - - 1 1 - 2F - - - - - - - 1 - 2 3
Acute appendicitis K35 M - 1 - - - 1 - - - - 2F - - - - - - - - 1 1 2
Chronic appendicitis K36 M - - - - - - - - - 1 1F - - - - - - - - - - 0
Unspecified appendicitis K37 M - - - - - - - - - - 0F - - - - - - - - 1 1 2
Other diseases of appendix K38 M - - - - - - - - - - 0F - - - - - - - - - 1 1
Inguinal hernia K40 M - - - - - - - 1 - 6 7F - - - - - - - - - - 0
Umbilical hernia K42 M - - - - - - - - 1 - 1F - - - - - - - - - 3 3
Ventral hernia K43 M - - - - - - - - 1 2 3F - - - - - - - - 1 2 3
Diaphragmatic hernia K44 M - - - - - - - - - 2 2F - - - - - - - - 1 6 7
Other abdominal hernia K45 M - - - - - - - - - - 0F - - - - - - - - - 1 1
Unspecified abdominal hernia K46 M - - - - - - - 1 1 1 3F - - - - - - - - 3 3 6
Crohn's disease K50 M - - - - - - 1 3 - 1 5F - - - - - - - - 1 1 2
Ulcerative colitis K51 M - - - - - - - - 1 2 3F - - - - - - - - - 2 2
Other noninfective gastroenteritis & colitis K52 M - - - - - - - - - 1 1F - - - - - - - - - - 0
Vascular disorders of intestine K55 M - - - - - - 1 9 19 27 56F - - - - - - - 6 24 50 80
Paralytic ileus & intestinal obstruction without hernia
K56 M - - - - - - 1 5 13 41 60F - - - - - - 1 2 9 51 63
aPPenDIX 2 (K10 - K56)DetaIleD CaUSe of DeatH BY SeX anD aGe
BR I t I S h Co L u M B I A , 2014
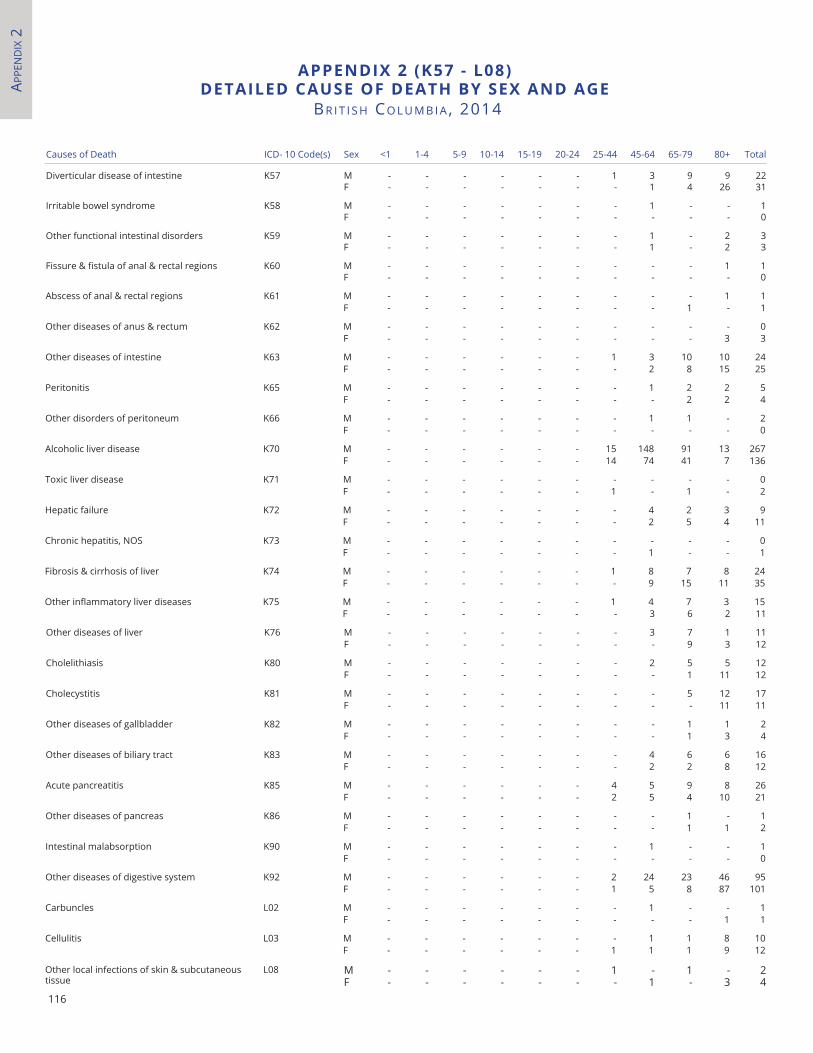
APPe
nd
Ix 2
116
Causes of Death ICD- 10 Code(s) Sex <1 1-4 5-9 10-14 15-19 20-24 25-44 45-64 65-79 80+ Total
Diverticular disease of intestine K57 M - - - - - - 1 3 9 9 22F - - - - - - - 1 4 26 31
Irritable bowel syndrome K58 M - - - - - - - 1 - - 1F - - - - - - - - - - 0
Other functional intestinal disorders K59 M - - - - - - - 1 - 2 3F - - - - - - - 1 - 2 3
Fissure & fistula of anal & rectal regions K60 M - - - - - - - - - 1 1F - - - - - - - - - - 0
Abscess of anal & rectal regions K61 M - - - - - - - - - 1 1F - - - - - - - - 1 - 1
Other diseases of anus & rectum K62 M - - - - - - - - - - 0F - - - - - - - - - 3 3
Other diseases of intestine K63 M - - - - - - 1 3 10 10 24F - - - - - - - 2 8 15 25
Peritonitis K65 M - - - - - - - 1 2 2 5F - - - - - - - - 2 2 4
Other disorders of peritoneum K66 M - - - - - - - 1 1 - 2F - - - - - - - - - - 0
Alcoholic liver disease K70 M - - - - - - 15 148 91 13 267F - - - - - - 14 74 41 7 136
Toxic liver disease K71 M - - - - - - - - - - 0F - - - - - - 1 - 1 - 2
Hepatic failure K72 M - - - - - - - 4 2 3 9F - - - - - - - 2 5 4 11
Chronic hepatitis, NOS K73 M - - - - - - - - - - 0F - - - - - - - 1 - - 1
Fibrosis & cirrhosis of liver K74 M - - - - - - 1 8 7 8 24F - - - - - - - 9 15 11 35
Other inflammatory liver diseases K75 M - - - - - - 1 4 7 3 15F - - - - - - - 3 6 2 11
Other diseases of liver K76 M - - - - - - - 3 7 1 11F - - - - - - - - 9 3 12
Cholelithiasis K80 M - - - - - - - 2 5 5 12F - - - - - - - - 1 11 12
Cholecystitis K81 M - - - - - - - - 5 12 17F - - - - - - - - - 11 11
Other diseases of gallbladder K82 M - - - - - - - - 1 1 2F - - - - - - - - 1 3 4
Other diseases of biliary tract K83 M - - - - - - - 4 6 6 16F - - - - - - - 2 2 8 12
Acute pancreatitis K85 M - - - - - - 4 5 9 8 26F - - - - - - 2 5 4 10 21
Other diseases of pancreas K86 M - - - - - - - - 1 - 1F - - - - - - - - 1 1 2
Intestinal malabsorption K90 M - - - - - - - 1 - - 1F - - - - - - - - - - 0
Other diseases of digestive system K92 M - - - - - - 2 24 23 46 95F - - - - - - 1 5 8 87 101
Carbuncles L02 M - - - - - - - 1 - - 1F - - - - - - - - - 1 1
Cellulitis L03 M - - - - - - - 1 1 8 10F - - - - - - 1 1 1 9 12
Other local infections of skin & subcutaneous tissue
L08 M - - - - - - 1 - 1 - 2F - - - - - - - 1 - 3 4
aPPenDIX 2 (K57 - l08)DetaIleD CaUSe of DeatH BY SeX anD aGe
BR I t I S h Co L u M B I A , 2014
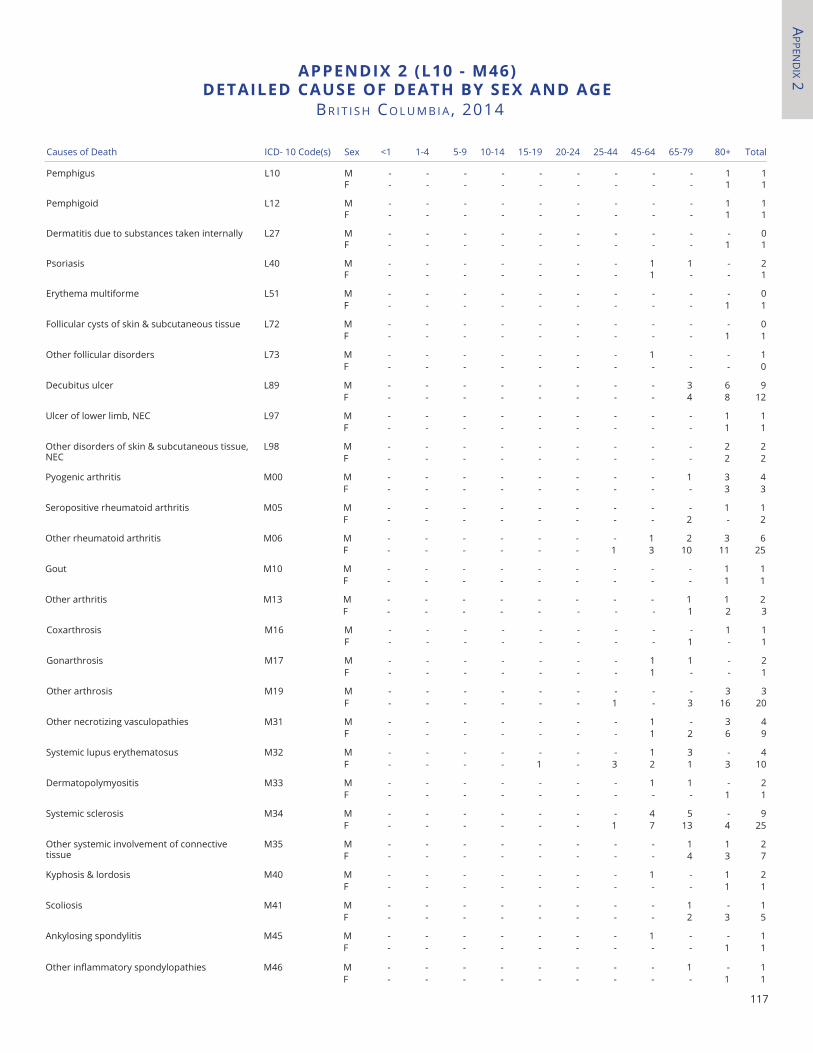
APPen
dIx 2
117
Causes of Death ICD- 10 Code(s) Sex <1 1-4 5-9 10-14 15-19 20-24 25-44 45-64 65-79 80+ Total
Pemphigus L10 M - - - - - - - - - 1 1F - - - - - - - - - 1 1
Pemphigoid L12 M - - - - - - - - - 1 1F - - - - - - - - - 1 1
Dermatitis due to substances taken internally L27 M - - - - - - - - - - 0F - - - - - - - - - 1 1
Psoriasis L40 M - - - - - - - 1 1 - 2F - - - - - - - 1 - - 1
Erythema multiforme L51 M - - - - - - - - - - 0F - - - - - - - - - 1 1
Follicular cysts of skin & subcutaneous tissue L72 M - - - - - - - - - - 0F - - - - - - - - - 1 1
Other follicular disorders L73 M - - - - - - - 1 - - 1F - - - - - - - - - - 0
Decubitus ulcer L89 M - - - - - - - - 3 6 9F - - - - - - - - 4 8 12
Ulcer of lower limb, NEC L97 M - - - - - - - - - 1 1F - - - - - - - - - 1 1
Other disorders of skin & subcutaneous tissue, NEC
L98 M - - - - - - - - - 2 2F - - - - - - - - - 2 2
Pyogenic arthritis M00 M - - - - - - - - 1 3 4F - - - - - - - - - 3 3
Seropositive rheumatoid arthritis M05 M - - - - - - - - - 1 1F - - - - - - - - 2 - 2
Other rheumatoid arthritis M06 M - - - - - - - 1 2 3 6F - - - - - - 1 3 10 11 25
Gout M10 M - - - - - - - - - 1 1F - - - - - - - - - 1 1
Other arthritis M13 M - - - - - - - - 1 1 2F - - - - - - - - 1 2 3
Coxarthrosis M16 M - - - - - - - - - 1 1F - - - - - - - - 1 - 1
Gonarthrosis M17 M - - - - - - - 1 1 - 2F - - - - - - - 1 - - 1
Other arthrosis M19 M - - - - - - - - - 3 3F - - - - - - 1 - 3 16 20
Other necrotizing vasculopathies M31 M - - - - - - - 1 - 3 4F - - - - - - - 1 2 6 9
Systemic lupus erythematosus M32 M - - - - - - - 1 3 - 4F - - - - 1 - 3 2 1 3 10
Dermatopolymyositis M33 M - - - - - - - 1 1 - 2F - - - - - - - - - 1 1
Systemic sclerosis M34 M - - - - - - - 4 5 - 9F - - - - - - 1 7 13 4 25
Other systemic involvement of connective tissue
M35 M - - - - - - - - 1 1 2F - - - - - - - - 4 3 7
Kyphosis & lordosis M40 M - - - - - - - 1 - 1 2F - - - - - - - - - 1 1
Scoliosis M41 M - - - - - - - - 1 - 1F - - - - - - - - 2 3 5
Ankylosing spondylitis M45 M - - - - - - - 1 - - 1F - - - - - - - - - 1 1
Other inflammatory spondylopathies M46 M - - - - - - - - 1 - 1F - - - - - - - - - 1 1
aPPenDIX 2 (l10 - m46)DetaIleD CaUSe of DeatH BY SeX anD aGe
BR I t I S h Co L u M B I A , 2014
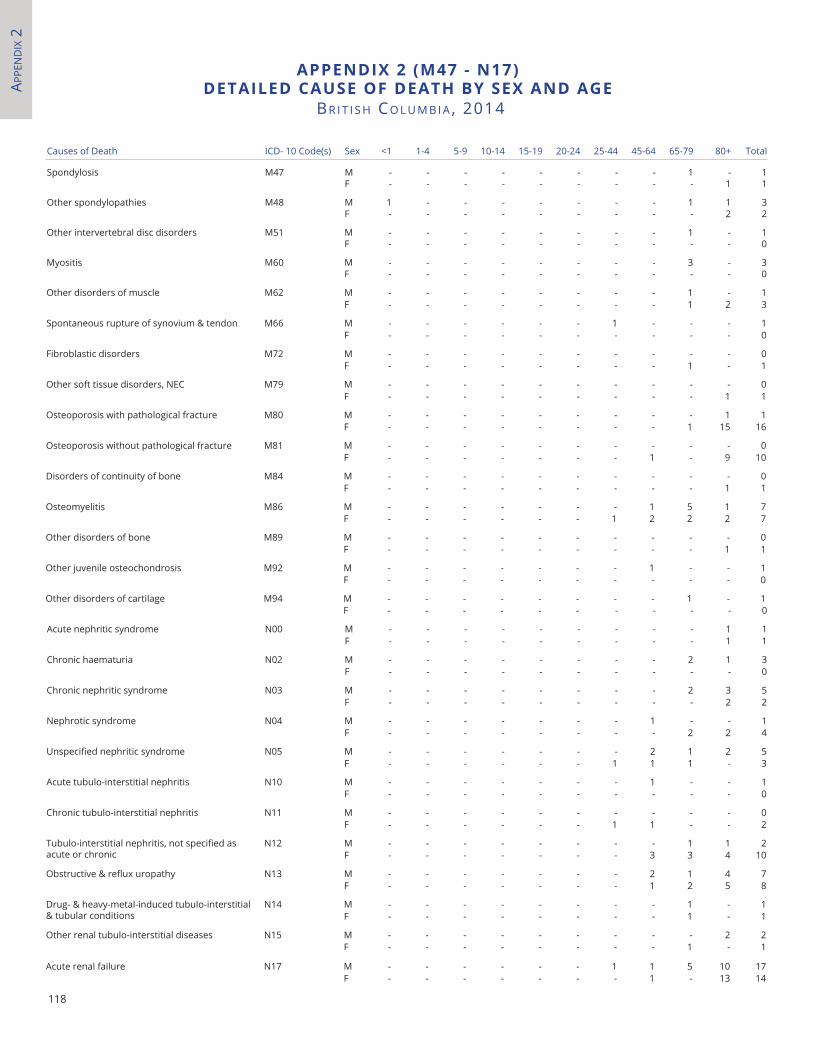
APPe
nd
Ix 2
118
Causes of Death ICD- 10 Code(s) Sex <1 1-4 5-9 10-14 15-19 20-24 25-44 45-64 65-79 80+ Total
Spondylosis M47 M - - - - - - - - 1 - 1F - - - - - - - - - 1 1
Other spondylopathies M48 M 1 - - - - - - - 1 1 3F - - - - - - - - - 2 2
Other intervertebral disc disorders M51 M - - - - - - - - 1 - 1F - - - - - - - - - - 0
Myositis M60 M - - - - - - - - 3 - 3F - - - - - - - - - - 0
Other disorders of muscle M62 M - - - - - - - - 1 - 1F - - - - - - - - 1 2 3
Spontaneous rupture of synovium & tendon M66 M - - - - - - 1 - - - 1F - - - - - - - - - - 0
Fibroblastic disorders M72 M - - - - - - - - - - 0F - - - - - - - - 1 - 1
Other soft tissue disorders, NEC M79 M - - - - - - - - - - 0F - - - - - - - - - 1 1
Osteoporosis with pathological fracture M80 M - - - - - - - - - 1 1F - - - - - - - - 1 15 16
Osteoporosis without pathological fracture M81 M - - - - - - - - - - 0F - - - - - - - 1 - 9 10
Disorders of continuity of bone M84 M - - - - - - - - - - 0F - - - - - - - - - 1 1
Osteomyelitis M86 M - - - - - - - 1 5 1 7F - - - - - - 1 2 2 2 7
Other disorders of bone M89 M - - - - - - - - - - 0F - - - - - - - - - 1 1
Other juvenile osteochondrosis M92 M - - - - - - - 1 - - 1F - - - - - - - - - - 0
Other disorders of cartilage M94 M - - - - - - - - 1 - 1F - - - - - - - - - - 0
Acute nephritic syndrome N00 M - - - - - - - - - 1 1F - - - - - - - - - 1 1
Chronic haematuria N02 M - - - - - - - - 2 1 3F - - - - - - - - - - 0
Chronic nephritic syndrome N03 M - - - - - - - - 2 3 5F - - - - - - - - - 2 2
Nephrotic syndrome N04 M - - - - - - - 1 - - 1F - - - - - - - - 2 2 4
Unspecified nephritic syndrome N05 M - - - - - - - 2 1 2 5F - - - - - - 1 1 1 - 3
Acute tubulo-interstitial nephritis N10 M - - - - - - - 1 - - 1F - - - - - - - - - - 0
Chronic tubulo-interstitial nephritis N11 M - - - - - - - - - - 0F - - - - - - 1 1 - - 2
Tubulo-interstitial nephritis, not specified as acute or chronic
N12 M - - - - - - - - 1 1 2F - - - - - - - 3 3 4 10
Obstructive & reflux uropathy N13 M - - - - - - - 2 1 4 7F - - - - - - - 1 2 5 8
Drug- & heavy-metal-induced tubulo-interstitial & tubular conditions
N14 M - - - - - - - - 1 - 1F - - - - - - - - 1 - 1
Other renal tubulo-interstitial diseases N15 M - - - - - - - - - 2 2F - - - - - - - - 1 - 1
Acute renal failure N17 M - - - - - - 1 1 5 10 17F - - - - - - - 1 - 13 14
aPPenDIX 2 (m47 - n17)DetaIleD CaUSe of DeatH BY SeX anD aGe
BR I t I S h Co L u M B I A , 2014
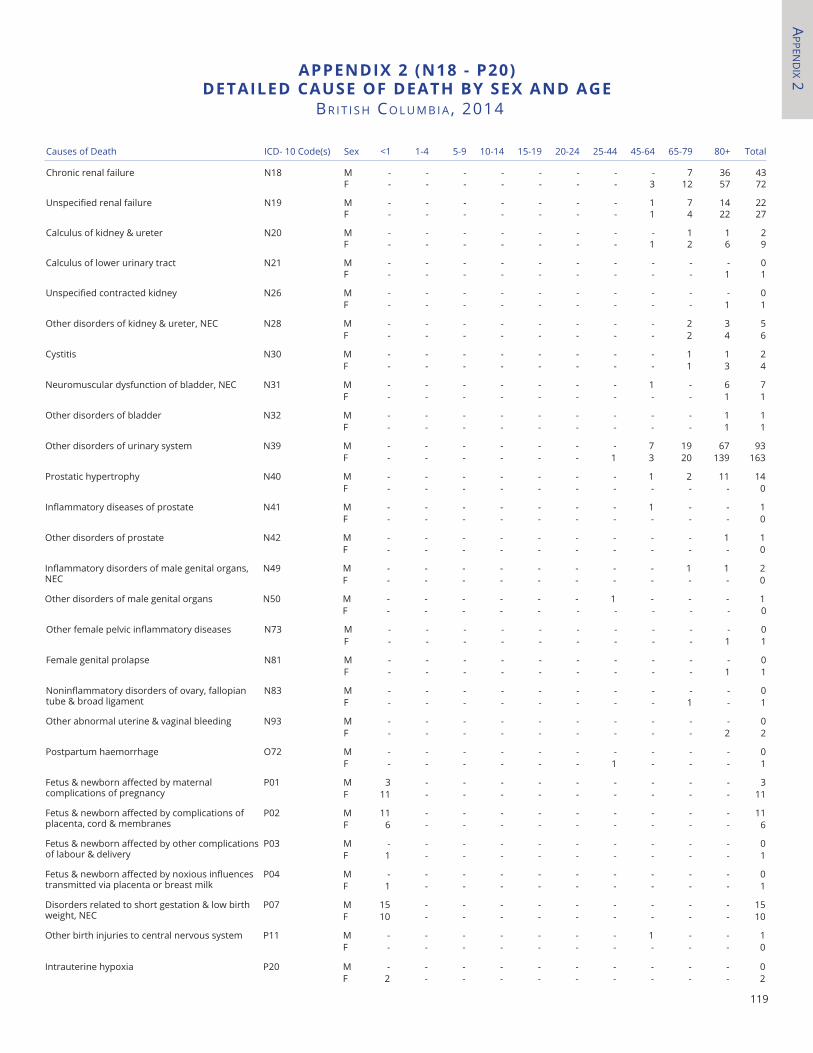
APPen
dIx 2
119
Causes of Death ICD- 10 Code(s) Sex <1 1-4 5-9 10-14 15-19 20-24 25-44 45-64 65-79 80+ Total
Chronic renal failure N18 M - - - - - - - - 7 36 43F - - - - - - - 3 12 57 72
Unspecified renal failure N19 M - - - - - - - 1 7 14 22F - - - - - - - 1 4 22 27
Calculus of kidney & ureter N20 M - - - - - - - - 1 1 2F - - - - - - - 1 2 6 9
Calculus of lower urinary tract N21 M - - - - - - - - - - 0F - - - - - - - - - 1 1
Unspecified contracted kidney N26 M - - - - - - - - - - 0F - - - - - - - - - 1 1
Other disorders of kidney & ureter, NEC N28 M - - - - - - - - 2 3 5F - - - - - - - - 2 4 6
Cystitis N30 M - - - - - - - - 1 1 2F - - - - - - - - 1 3 4
Neuromuscular dysfunction of bladder, NEC N31 M - - - - - - - 1 - 6 7F - - - - - - - - - 1 1
Other disorders of bladder N32 M - - - - - - - - - 1 1F - - - - - - - - - 1 1
Other disorders of urinary system N39 M - - - - - - - 7 19 67 93F - - - - - - 1 3 20 139 163
Prostatic hypertrophy N40 M - - - - - - - 1 2 11 14F - - - - - - - - - - 0
Inflammatory diseases of prostate N41 M - - - - - - - 1 - - 1F - - - - - - - - - - 0
Other disorders of prostate N42 M - - - - - - - - - 1 1F - - - - - - - - - - 0
Inflammatory disorders of male genital organs, NEC
N49 M - - - - - - - - 1 1 2F - - - - - - - - - - 0
Other disorders of male genital organs N50 M - - - - - - 1 - - - 1F - - - - - - - - - - 0
Other female pelvic inflammatory diseases N73 M - - - - - - - - - - 0F - - - - - - - - - 1 1
Female genital prolapse N81 M - - - - - - - - - - 0F - - - - - - - - - 1 1
Noninflammatory disorders of ovary, fallopian tube & broad ligament
N83 M - - - - - - - - - - 0F - - - - - - - - 1 - 1
Other abnormal uterine & vaginal bleeding N93 M - - - - - - - - - - 0F - - - - - - - - - 2 2
Postpartum haemorrhage O72 M - - - - - - - - - - 0F - - - - - - 1 - - - 1
Fetus & newborn affected by maternal complications of pregnancy
P01 M 3 - - - - - - - - - 3F 11 - - - - - - - - - 11
Fetus & newborn affected by complications of placenta, cord & membranes
P02 M 11 - - - - - - - - - 11F 6 - - - - - - - - - 6
Fetus & newborn affected by other complications of labour & delivery
P03 M - - - - - - - - - - 0F 1 - - - - - - - - - 1
Fetus & newborn affected by noxious influences transmitted via placenta or breast milk
P04 M - - - - - - - - - - 0F 1 - - - - - - - - - 1
Disorders related to short gestation & low birth weight, NEC
P07 M 15 - - - - - - - - - 15F 10 - - - - - - - - - 10
Other birth injuries to central nervous system P11 M - - - - - - - 1 - - 1F - - - - - - - - - - 0
Intrauterine hypoxia P20 M - - - - - - - - - - 0F 2 - - - - - - - - - 2
aPPenDIX 2 (n18 - P20)DetaIleD CaUSe of DeatH BY SeX anD aGe
BR I t I S h Co L u M B I A , 2014
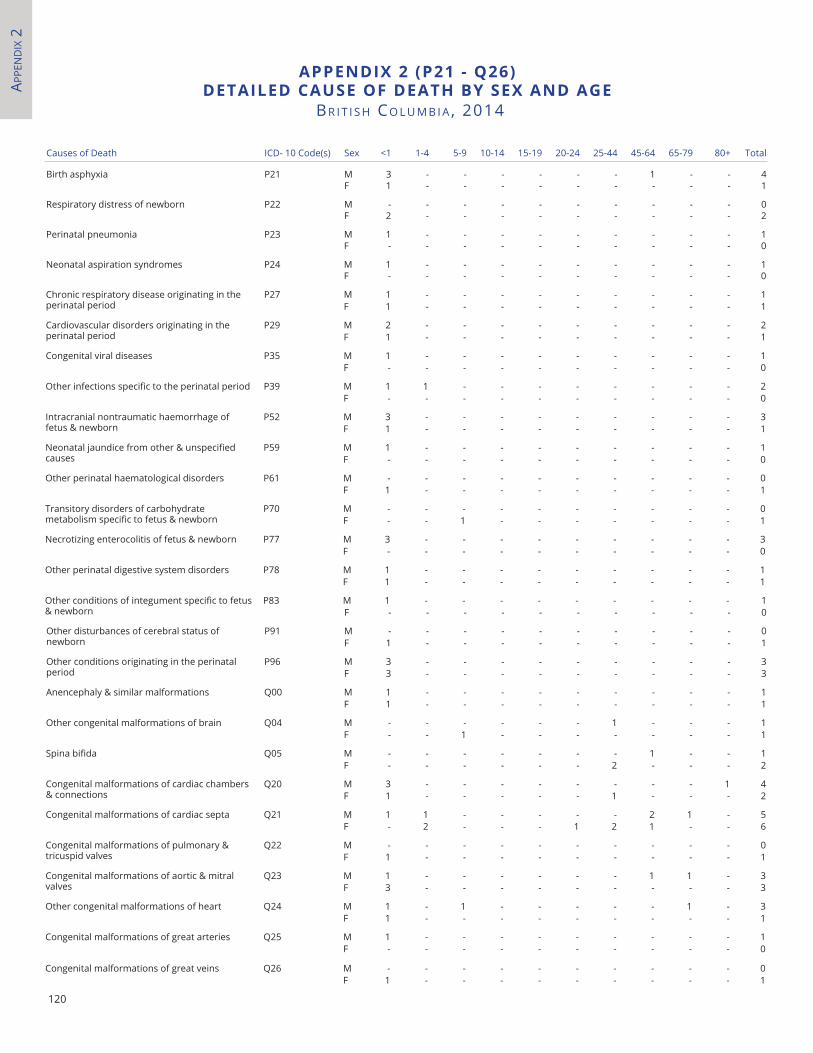
APPe
nd
Ix 2
120
Causes of Death ICD- 10 Code(s) Sex <1 1-4 5-9 10-14 15-19 20-24 25-44 45-64 65-79 80+ Total
Birth asphyxia P21 M 3 - - - - - - 1 - - 4F 1 - - - - - - - - - 1
Respiratory distress of newborn P22 M - - - - - - - - - - 0F 2 - - - - - - - - - 2
Perinatal pneumonia P23 M 1 - - - - - - - - - 1F - - - - - - - - - - 0
Neonatal aspiration syndromes P24 M 1 - - - - - - - - - 1F - - - - - - - - - - 0
Chronic respiratory disease originating in the perinatal period
P27 M 1 - - - - - - - - - 1F 1 - - - - - - - - - 1
Cardiovascular disorders originating in the perinatal period
P29 M 2 - - - - - - - - - 2F 1 - - - - - - - - - 1
Congenital viral diseases P35 M 1 - - - - - - - - - 1F - - - - - - - - - - 0
Other infections specific to the perinatal period P39 M 1 1 - - - - - - - - 2F - - - - - - - - - - 0
Intracranial nontraumatic haemorrhage of fetus & newborn
P52 M 3 - - - - - - - - - 3F 1 - - - - - - - - - 1
Neonatal jaundice from other & unspecified causes
P59 M 1 - - - - - - - - - 1F - - - - - - - - - - 0
Other perinatal haematological disorders P61 M - - - - - - - - - - 0F 1 - - - - - - - - - 1
Transitory disorders of carbohydrate metabolism specific to fetus & newborn
P70 M - - - - - - - - - - 0F - - 1 - - - - - - - 1
Necrotizing enterocolitis of fetus & newborn P77 M 3 - - - - - - - - - 3F - - - - - - - - - - 0
Other perinatal digestive system disorders P78 M 1 - - - - - - - - - 1F 1 - - - - - - - - - 1
Other conditions of integument specific to fetus & newborn
P83 M 1 - - - - - - - - - 1F - - - - - - - - - - 0
Other disturbances of cerebral status of newborn
P91 M - - - - - - - - - - 0F 1 - - - - - - - - - 1
Other conditions originating in the perinatal period
P96 M 3 - - - - - - - - - 3F 3 - - - - - - - - - 3
Anencephaly & similar malformations Q00 M 1 - - - - - - - - - 1F 1 - - - - - - - - - 1
Other congenital malformations of brain Q04 M - - - - - - 1 - - - 1F - - 1 - - - - - - - 1
Spina bifida Q05 M - - - - - - - 1 - - 1F - - - - - - 2 - - - 2
Congenital malformations of cardiac chambers & connections
Q20 M 3 - - - - - - - - 1 4F 1 - - - - - 1 - - - 2
Congenital malformations of cardiac septa Q21 M 1 1 - - - - - 2 1 - 5F - 2 - - - 1 2 1 - - 6
Congenital malformations of pulmonary & tricuspid valves
Q22 M - - - - - - - - - - 0F 1 - - - - - - - - - 1
Congenital malformations of aortic & mitral valves
Q23 M 1 - - - - - - 1 1 - 3F 3 - - - - - - - - - 3
Other congenital malformations of heart Q24 M 1 - 1 - - - - - 1 - 3F 1 - - - - - - - - - 1
Congenital malformations of great arteries Q25 M 1 - - - - - - - - - 1F - - - - - - - - - - 0
Congenital malformations of great veins Q26 M - - - - - - - - - - 0F 1 - - - - - - - - - 1
aPPenDIX 2 (P21 - Q26)DetaIleD CaUSe of DeatH BY SeX anD aGe
BR I t I S h Co L u M B I A , 2014
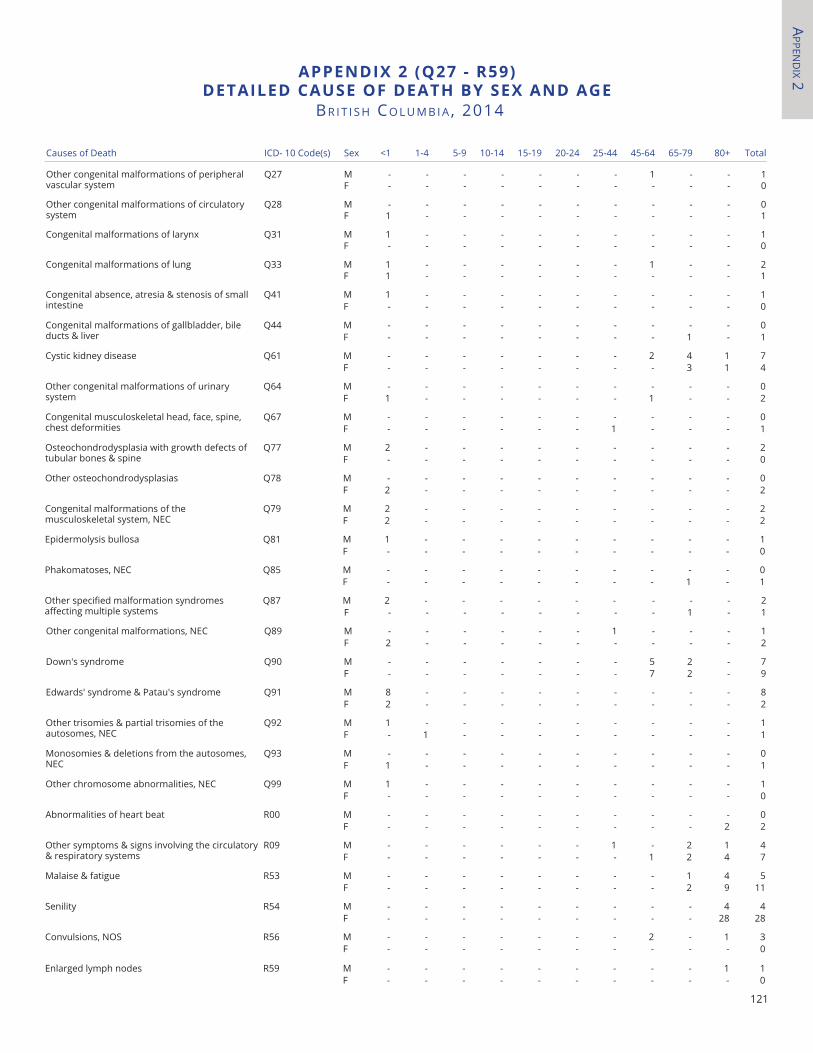
APPen
dIx 2
121
Causes of Death ICD- 10 Code(s) Sex <1 1-4 5-9 10-14 15-19 20-24 25-44 45-64 65-79 80+ Total
Other congenital malformations of peripheral vascular system
Q27 M - - - - - - - 1 - - 1F - - - - - - - - - - 0
Other congenital malformations of circulatory system
Q28 M - - - - - - - - - - 0F 1 - - - - - - - - - 1
Congenital malformations of larynx Q31 M 1 - - - - - - - - - 1F - - - - - - - - - - 0
Congenital malformations of lung Q33 M 1 - - - - - - 1 - - 2F 1 - - - - - - - - - 1
Congenital absence, atresia & stenosis of small intestine
Q41 M 1 - - - - - - - - - 1F - - - - - - - - - - 0
Congenital malformations of gallbladder, bile ducts & liver
Q44 M - - - - - - - - - - 0F - - - - - - - - 1 - 1
Cystic kidney disease Q61 M - - - - - - - 2 4 1 7F - - - - - - - - 3 1 4
Other congenital malformations of urinary system
Q64 M - - - - - - - - - - 0F 1 - - - - - - 1 - - 2
Congenital musculoskeletal head, face, spine, chest deformities
Q67 M - - - - - - - - - - 0F - - - - - - 1 - - - 1
Osteochondrodysplasia with growth defects of tubular bones & spine
Q77 M 2 - - - - - - - - - 2F - - - - - - - - - - 0
Other osteochondrodysplasias Q78 M - - - - - - - - - - 0F 2 - - - - - - - - - 2
Congenital malformations of the musculoskeletal system, NEC
Q79 M 2 - - - - - - - - - 2F 2 - - - - - - - - - 2
Epidermolysis bullosa Q81 M 1 - - - - - - - - - 1F - - - - - - - - - - 0
Phakomatoses, NEC Q85 M - - - - - - - - - - 0F - - - - - - - - 1 - 1
Other specified malformation syndromes affecting multiple systems
Q87 M 2 - - - - - - - - - 2F - - - - - - - - 1 - 1
Other congenital malformations, NEC Q89 M - - - - - - 1 - - - 1F 2 - - - - - - - - - 2
Down's syndrome Q90 M - - - - - - - 5 2 - 7F - - - - - - - 7 2 - 9
Edwards' syndrome & Patau's syndrome Q91 M 8 - - - - - - - - - 8F 2 - - - - - - - - - 2
Other trisomies & partial trisomies of the autosomes, NEC
Q92 M 1 - - - - - - - - - 1F - 1 - - - - - - - - 1
Monosomies & deletions from the autosomes, NEC
Q93 M - - - - - - - - - - 0F 1 - - - - - - - - - 1
Other chromosome abnormalities, NEC Q99 M 1 - - - - - - - - - 1F - - - - - - - - - - 0
Abnormalities of heart beat R00 M - - - - - - - - - - 0F - - - - - - - - - 2 2
Other symptoms & signs involving the circulatory & respiratory systems
R09 M - - - - - - 1 - 2 1 4F - - - - - - - 1 2 4 7
Malaise & fatigue R53 M - - - - - - - - 1 4 5F - - - - - - - - 2 9 11
Senility R54 M - - - - - - - - - 4 4F - - - - - - - - - 28 28
Convulsions, NOS R56 M - - - - - - - 2 - 1 3F - - - - - - - - - - 0
Enlarged lymph nodes R59 M - - - - - - - - - 1 1F - - - - - - - - - - 0
aPPenDIX 2 (Q27 - r59)DetaIleD CaUSe of DeatH BY SeX anD aGe
BR I t I S h Co L u M B I A , 2014
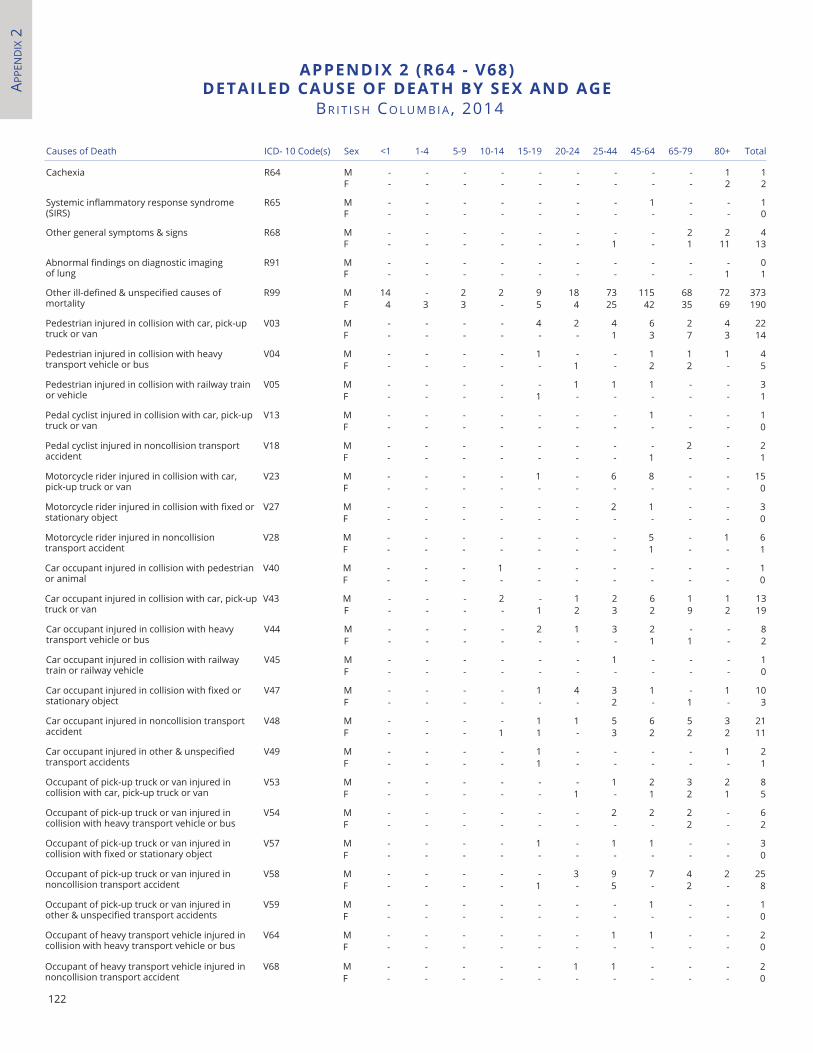
APPe
nd
Ix 2
122
Causes of Death ICD- 10 Code(s) Sex <1 1-4 5-9 10-14 15-19 20-24 25-44 45-64 65-79 80+ Total
Cachexia R64 M - - - - - - - - - 1 1F - - - - - - - - - 2 2
Systemic inflammatory response syndrome (SIRS)
R65 M - - - - - - - 1 - - 1F - - - - - - - - - - 0
Other general symptoms & signs R68 M - - - - - - - - 2 2 4F - - - - - - 1 - 1 11 13
Abnormal findings on diagnostic imaging of lung
R91 M - - - - - - - - - - 0F - - - - - - - - - 1 1
Other ill-defined & unspecified causes of mortality
R99 M 14 - 2 2 9 18 73 115 68 72 373F 4 3 3 - 5 4 25 42 35 69 190
Pedestrian injured in collision with car, pick-up truck or van
V03 M - - - - 4 2 4 6 2 4 22F - - - - - - 1 3 7 3 14
Pedestrian injured in collision with heavy transport vehicle or bus
V04 M - - - - 1 - - 1 1 1 4F - - - - - 1 - 2 2 - 5
Pedestrian injured in collision with railway train or vehicle
V05 M - - - - - 1 1 1 - - 3F - - - - 1 - - - - - 1
Pedal cyclist injured in collision with car, pick-up truck or van
V13 M - - - - - - - 1 - - 1F - - - - - - - - - - 0
Pedal cyclist injured in noncollision transport accident
V18 M - - - - - - - - 2 - 2F - - - - - - - 1 - - 1
Motorcycle rider injured in collision with car, pick-up truck or van
V23 M - - - - 1 - 6 8 - - 15F - - - - - - - - - - 0
Motorcycle rider injured in collision with fixed or stationary object
V27 M - - - - - - 2 1 - - 3F - - - - - - - - - - 0
Motorcycle rider injured in noncollision transport accident
V28 M - - - - - - - 5 - 1 6F - - - - - - - 1 - - 1
Car occupant injured in collision with pedestrian or animal
V40 M - - - 1 - - - - - - 1F - - - - - - - - - - 0
Car occupant injured in collision with car, pick-up truck or van
V43 M - - - 2 - 1 2 6 1 1 13F - - - - 1 2 3 2 9 2 19
Car occupant injured in collision with heavy transport vehicle or bus
V44 M - - - - 2 1 3 2 - - 8F - - - - - - - 1 1 - 2
Car occupant injured in collision with railway train or railway vehicle
V45 M - - - - - - 1 - - - 1F - - - - - - - - - - 0
Car occupant injured in collision with fixed or stationary object
V47 M - - - - 1 4 3 1 - 1 10F - - - - - - 2 - 1 - 3
Car occupant injured in noncollision transport accident
V48 M - - - - 1 1 5 6 5 3 21F - - - 1 1 - 3 2 2 2 11
Car occupant injured in other & unspecified transport accidents
V49 M - - - - 1 - - - - 1 2F - - - - 1 - - - - - 1
Occupant of pick-up truck or van injured in collision with car, pick-up truck or van
V53 M - - - - - - 1 2 3 2 8F - - - - - 1 - 1 2 1 5
Occupant of pick-up truck or van injured in collision with heavy transport vehicle or bus
V54 M - - - - - - 2 2 2 - 6F - - - - - - - - 2 - 2
Occupant of pick-up truck or van injured in collision with fixed or stationary object
V57 M - - - - 1 - 1 1 - - 3F - - - - - - - - - - 0
Occupant of pick-up truck or van injured in noncollision transport accident
V58 M - - - - - 3 9 7 4 2 25F - - - - 1 - 5 - 2 - 8
Occupant of pick-up truck or van injured in other & unspecified transport accidents
V59 M - - - - - - - 1 - - 1F - - - - - - - - - - 0
Occupant of heavy transport vehicle injured in collision with heavy transport vehicle or bus
V64 M - - - - - - 1 1 - - 2F - - - - - - - - - - 0
Occupant of heavy transport vehicle injured in noncollision transport accident
V68 M - - - - - 1 1 - - - 2F - - - - - - - - - - 0
aPPenDIX 2 (r64 - V68)DetaIleD CaUSe of DeatH BY SeX anD aGe
BR I t I S h Co L u M B I A , 2014
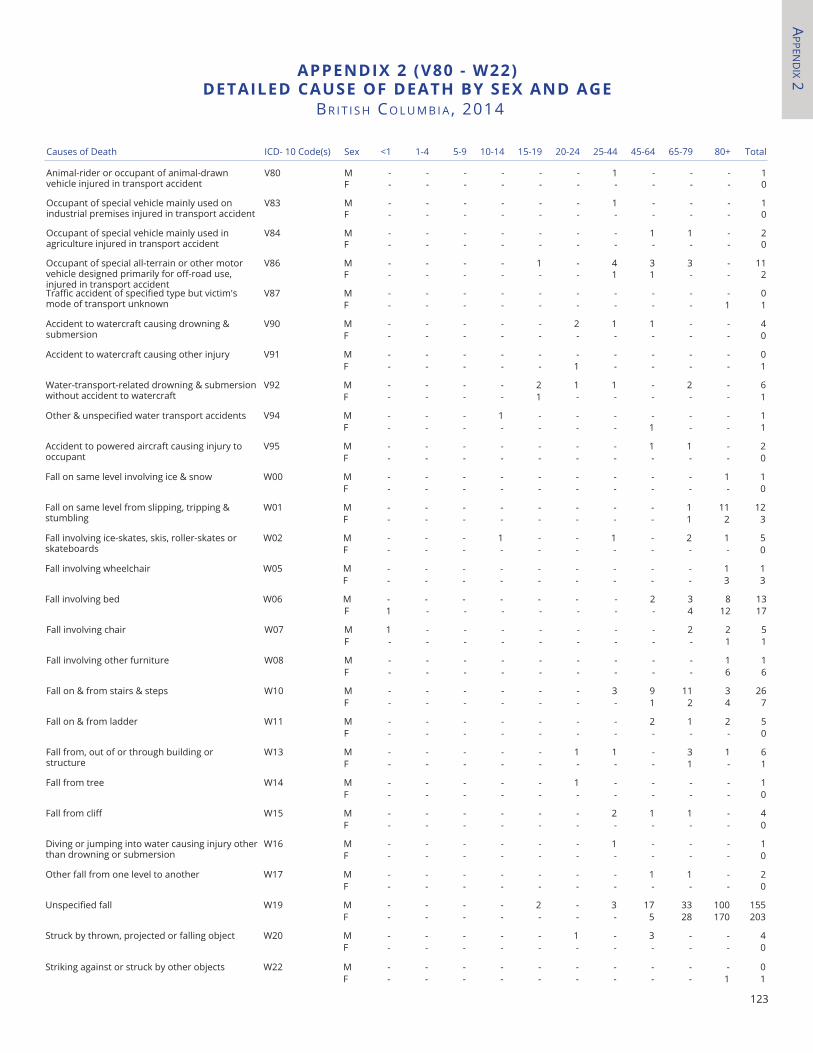
APPen
dIx 2
123
Causes of Death ICD- 10 Code(s) Sex <1 1-4 5-9 10-14 15-19 20-24 25-44 45-64 65-79 80+ Total
Animal-rider or occupant of animal-drawn vehicle injured in transport accident
V80 M - - - - - - 1 - - - 1F - - - - - - - - - - 0
Occupant of special vehicle mainly used on industrial premises injured in transport accident
V83 M - - - - - - 1 - - - 1F - - - - - - - - - - 0
Occupant of special vehicle mainly used in agriculture injured in transport accident
V84 M - - - - - - - 1 1 - 2F - - - - - - - - - - 0
Occupant of special all-terrain or other motor vehicle designed primarily for off-road use, injured in transport accident
V86 M - - - - 1 - 4 3 3 - 11F - - - - - - 1 1 - - 2
Traffic accident of specified type but victim's mode of transport unknown
V87 M - - - - - - - - - - 0F - - - - - - - - - 1 1
Accident to watercraft causing drowning & submersion
V90 M - - - - - 2 1 1 - - 4F - - - - - - - - - - 0
Accident to watercraft causing other injury V91 M - - - - - - - - - - 0F - - - - - 1 - - - - 1
Water-transport-related drowning & submersion without accident to watercraft
V92 M - - - - 2 1 1 - 2 - 6F - - - - 1 - - - - - 1
Other & unspecified water transport accidents V94 M - - - 1 - - - - - - 1F - - - - - - - 1 - - 1
Accident to powered aircraft causing injury to occupant
V95 M - - - - - - - 1 1 - 2F - - - - - - - - - - 0
Fall on same level involving ice & snow W00 M - - - - - - - - - 1 1F - - - - - - - - - - 0
Fall on same level from slipping, tripping & stumbling
W01 M - - - - - - - - 1 11 12F - - - - - - - - 1 2 3
Fall involving ice-skates, skis, roller-skates or skateboards
W02 M - - - 1 - - 1 - 2 1 5F - - - - - - - - - - 0
Fall involving wheelchair W05 M - - - - - - - - - 1 1F - - - - - - - - - 3 3
Fall involving bed W06 M - - - - - - - 2 3 8 13F 1 - - - - - - - 4 12 17
Fall involving chair W07 M 1 - - - - - - - 2 2 5F - - - - - - - - - 1 1
Fall involving other furniture W08 M - - - - - - - - - 1 1F - - - - - - - - - 6 6
Fall on & from stairs & steps W10 M - - - - - - 3 9 11 3 26F - - - - - - - 1 2 4 7
Fall on & from ladder W11 M - - - - - - - 2 1 2 5F - - - - - - - - - - 0
Fall from, out of or through building or structure
W13 M - - - - - 1 1 - 3 1 6F - - - - - - - - 1 - 1
Fall from tree W14 M - - - - - 1 - - - - 1F - - - - - - - - - - 0
Fall from cliff W15 M - - - - - - 2 1 1 - 4F - - - - - - - - - - 0
Diving or jumping into water causing injury other than drowning or submersion
W16 M - - - - - - 1 - - - 1F - - - - - - - - - - 0
Other fall from one level to another W17 M - - - - - - - 1 1 - 2F - - - - - - - - - - 0
Unspecified fall W19 M - - - - 2 - 3 17 33 100 155F - - - - - - - 5 28 170 203
Struck by thrown, projected or falling object W20 M - - - - - 1 - 3 - - 4F - - - - - - - - - - 0
Striking against or struck by other objects W22 M - - - - - - - - - - 0F - - - - - - - - - 1 1
aPPenDIX 2 (V80 - W22)DetaIleD CaUSe of DeatH BY SeX anD aGe
BR I t I S h Co L u M B I A , 2014
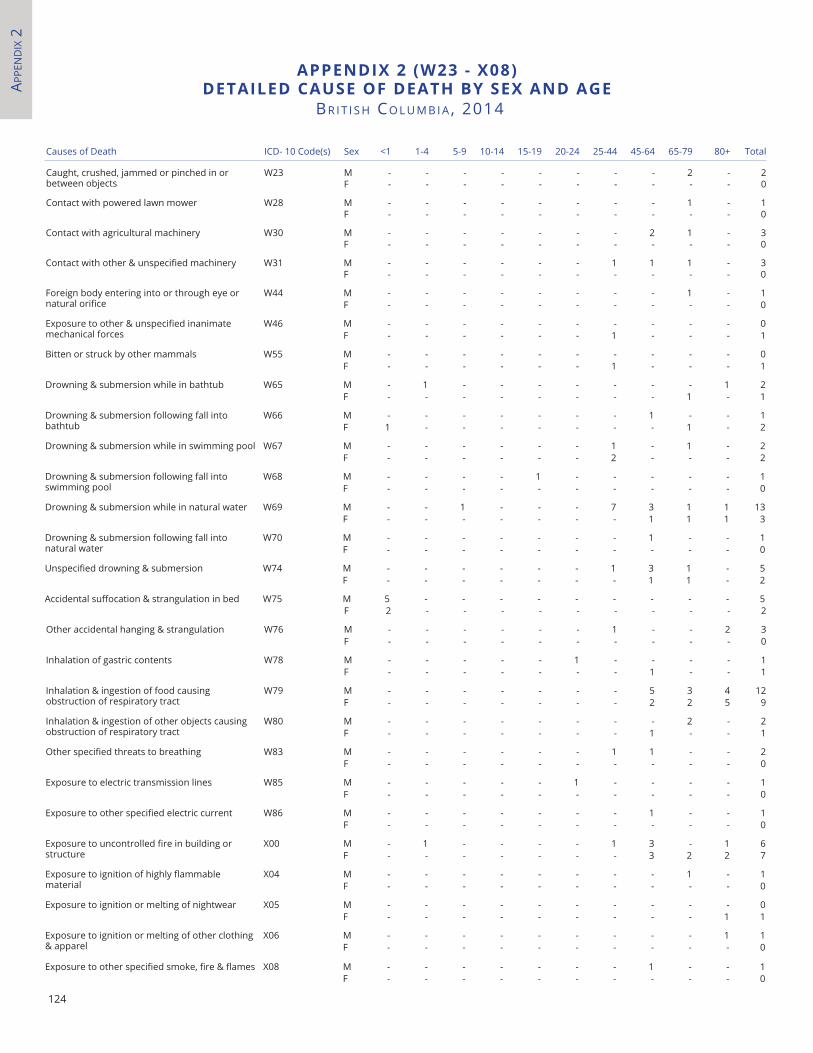
APPe
nd
Ix 2
124
Causes of Death ICD- 10 Code(s) Sex <1 1-4 5-9 10-14 15-19 20-24 25-44 45-64 65-79 80+ Total
Caught, crushed, jammed or pinched in or between objects
W23 M - - - - - - - - 2 - 2F - - - - - - - - - - 0
Contact with powered lawn mower W28 M - - - - - - - - 1 - 1F - - - - - - - - - - 0
Contact with agricultural machinery W30 M - - - - - - - 2 1 - 3F - - - - - - - - - - 0
Contact with other & unspecified machinery W31 M - - - - - - 1 1 1 - 3F - - - - - - - - - - 0
Foreign body entering into or through eye or natural orifice
W44 M - - - - - - - - 1 - 1F - - - - - - - - - - 0
Exposure to other & unspecified inanimate mechanical forces
W46 M - - - - - - - - - - 0F - - - - - - 1 - - - 1
Bitten or struck by other mammals W55 M - - - - - - - - - - 0F - - - - - - 1 - - - 1
Drowning & submersion while in bathtub W65 M - 1 - - - - - - - 1 2F - - - - - - - - 1 - 1
Drowning & submersion following fall intobathtub
W66 M - - - - - - - 1 - - 1F 1 - - - - - - - 1 - 2
Drowning & submersion while in swimming pool W67 M - - - - - - 1 - 1 - 2F - - - - - - 2 - - - 2
Drowning & submersion following fall into swimming pool
W68 M - - - - 1 - - - - - 1F - - - - - - - - - - 0
Drowning & submersion while in natural water W69 M - - 1 - - - 7 3 1 1 13F - - - - - - - 1 1 1 3
Drowning & submersion following fall into natural water
W70 M - - - - - - - 1 - - 1F - - - - - - - - - - 0
Unspecified drowning & submersion W74 M - - - - - - 1 3 1 - 5F - - - - - - - 1 1 - 2
Accidental suffocation & strangulation in bed W75 M 5 - - - - - - - - - 5F 2 - - - - - - - - - 2
Other accidental hanging & strangulation W76 M - - - - - - 1 - - 2 3F - - - - - - - - - - 0
Inhalation of gastric contents W78 M - - - - - 1 - - - - 1F - - - - - - - 1 - - 1
Inhalation & ingestion of food causing obstruction of respiratory tract
W79 M - - - - - - - 5 3 4 12F - - - - - - - 2 2 5 9
Inhalation & ingestion of other objects causing obstruction of respiratory tract
W80 M - - - - - - - - 2 - 2F - - - - - - - 1 - - 1
Other specified threats to breathing W83 M - - - - - - 1 1 - - 2F - - - - - - - - - - 0
Exposure to electric transmission lines W85 M - - - - - 1 - - - - 1F - - - - - - - - - - 0
Exposure to other specified electric current W86 M - - - - - - - 1 - - 1F - - - - - - - - - - 0
Exposure to uncontrolled fire in building or structure
X00 M - 1 - - - - 1 3 - 1 6F - - - - - - - 3 2 2 7
Exposure to ignition of highly flammable material
X04 M - - - - - - - - 1 - 1F - - - - - - - - - - 0
Exposure to ignition or melting of nightwear X05 M - - - - - - - - - - 0F - - - - - - - - - 1 1
Exposure to ignition or melting of other clothing & apparel
X06 M - - - - - - - - - 1 1F - - - - - - - - - - 0
Exposure to other specified smoke, fire & flames X08 M - - - - - - - 1 - - 1F - - - - - - - - - - 0
aPPenDIX 2 (W23 - X08)DetaIleD CaUSe of DeatH BY SeX anD aGe
BR I t I S h Co L u M B I A , 2014
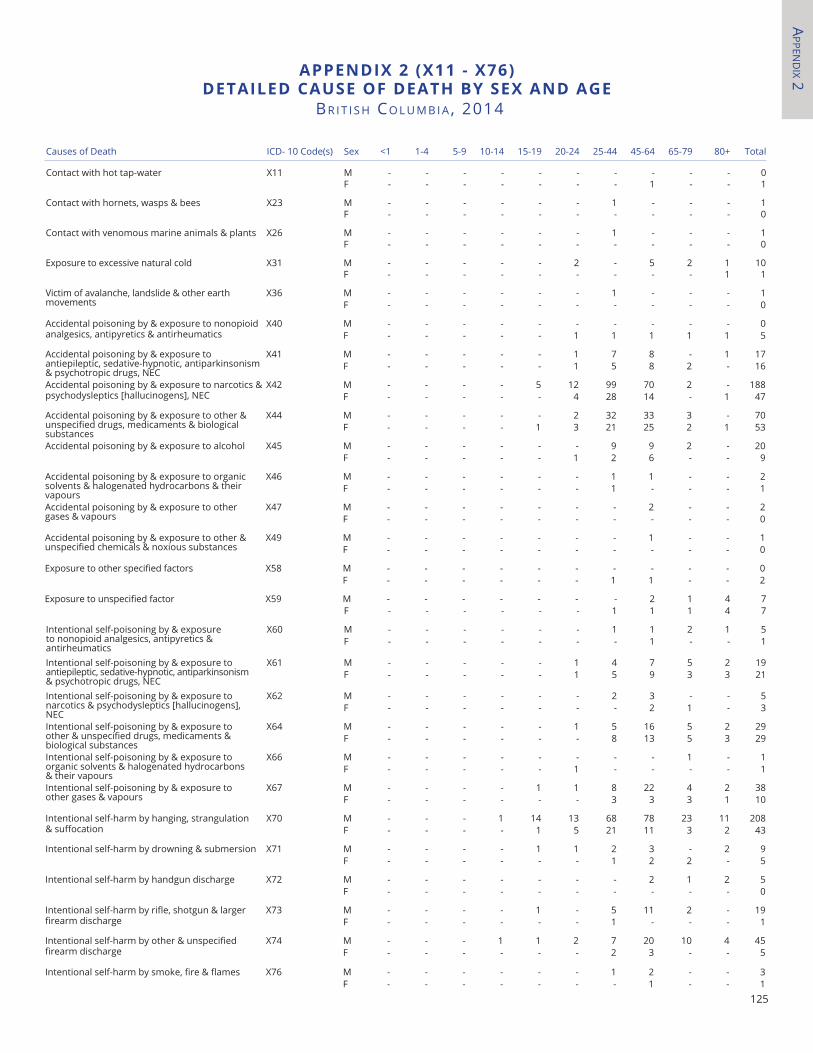
APPen
dIx 2
125
Causes of Death ICD- 10 Code(s) Sex <1 1-4 5-9 10-14 15-19 20-24 25-44 45-64 65-79 80+ Total
Contact with hot tap-water X11 M - - - - - - - - - - 0F - - - - - - - 1 - - 1
Contact with hornets, wasps & bees X23 M - - - - - - 1 - - - 1F - - - - - - - - - - 0
Contact with venomous marine animals & plants X26 M - - - - - - 1 - - - 1F - - - - - - - - - - 0
Exposure to excessive natural cold X31 M - - - - - 2 - 5 2 1 10F - - - - - - - - - 1 1
Victim of avalanche, landslide & other earth movements
X36 M - - - - - - 1 - - - 1F - - - - - - - - - - 0
Accidental poisoning by & exposure to nonopioid analgesics, antipyretics & antirheumatics
X40 M - - - - - - - - - - 0F - - - - - 1 1 1 1 1 5
Accidental poisoning by & exposure to antiepileptic, sedative-hypnotic, antiparkinsonism & psychotropic drugs, NEC
X41 M - - - - - 1 7 8 - 1 17F - - - - - 1 5 8 2 - 16
Accidental poisoning by & exposure to narcotics & psychodysleptics [hallucinogens], NEC
X42 M - - - - 5 12 99 70 2 - 188F - - - - - 4 28 14 - 1 47
Accidental poisoning by & exposure to other & unspecified drugs, medicaments & biological substances
X44 M - - - - - 2 32 33 3 - 70F - - - - 1 3 21 25 2 1 53
Accidental poisoning by & exposure to alcohol X45 M - - - - - - 9 9 2 - 20F - - - - - 1 2 6 - - 9
Accidental poisoning by & exposure to organic solvents & halogenated hydrocarbons & their vapours
X46 M - - - - - - 1 1 - - 2F - - - - - - 1 - - - 1
Accidental poisoning by & exposure to other gases & vapours
X47 M - - - - - - - 2 - - 2F - - - - - - - - - - 0
Accidental poisoning by & exposure to other & unspecified chemicals & noxious substances
X49 M - - - - - - - 1 - - 1F - - - - - - - - - - 0
Exposure to other specified factors X58 M - - - - - - - - - - 0F - - - - - - 1 1 - - 2
Exposure to unspecified factor X59 M - - - - - - - 2 1 4 7F - - - - - - 1 1 1 4 7
Intentional self-poisoning by & exposure to nonopioid analgesics, antipyretics & antirheumatics
X60 M - - - - - - 1 1 2 1 5F - - - - - - - 1 - - 1
Intentional self-poisoning by & exposure to antiepileptic, sedative-hypnotic, antiparkinsonism & psychotropic drugs, NEC
X61 M - - - - - 1 4 7 5 2 19F - - - - - 1 5 9 3 3 21
Intentional self-poisoning by & exposure to narcotics & psychodysleptics [hallucinogens], NEC
X62 M - - - - - - 2 3 - - 5F - - - - - - - 2 1 - 3
Intentional self-poisoning by & exposure to other & unspecified drugs, medicaments & biological substances
X64 M - - - - - 1 5 16 5 2 29F - - - - - - 8 13 5 3 29
Intentional self-poisoning by & exposure to organic solvents & halogenated hydrocarbons & their vapours
X66 M - - - - - - - - 1 - 1F - - - - - 1 - - - - 1
Intentional self-poisoning by & exposure to other gases & vapours
X67 M - - - - 1 1 8 22 4 2 38F - - - - - - 3 3 3 1 10
Intentional self-harm by hanging, strangulation & suffocation
X70 M - - - 1 14 13 68 78 23 11 208F - - - - 1 5 21 11 3 2 43
Intentional self-harm by drowning & submersion X71 M - - - - 1 1 2 3 - 2 9F - - - - - - 1 2 2 - 5
Intentional self-harm by handgun discharge X72 M - - - - - - - 2 1 2 5F - - - - - - - - - - 0
Intentional self-harm by rifle, shotgun & larger firearm discharge
X73 M - - - - 1 - 5 11 2 - 19F - - - - - - 1 - - - 1
Intentional self-harm by other & unspecified firearm discharge
X74 M - - - 1 1 2 7 20 10 4 45F - - - - - - 2 3 - - 5
Intentional self-harm by smoke, fire & flames X76 M - - - - - - 1 2 - - 3F - - - - - - - 1 - - 1
aPPenDIX 2 (X11 - X76)DetaIleD CaUSe of DeatH BY SeX anD aGe
BR I t I S h Co L u M B I A , 2014
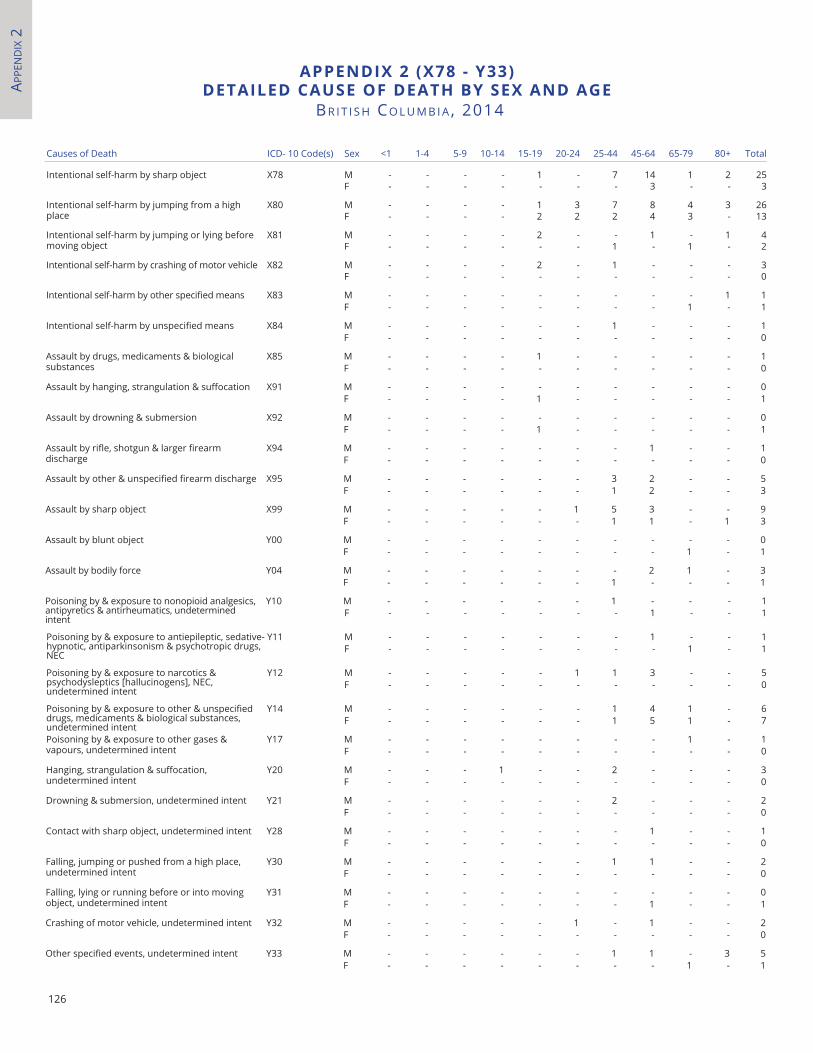
APPe
nd
Ix 2
126
Causes of Death ICD- 10 Code(s) Sex <1 1-4 5-9 10-14 15-19 20-24 25-44 45-64 65-79 80+ Total
Intentional self-harm by sharp object X78 M - - - - 1 - 7 14 1 2 25F - - - - - - - 3 - - 3
Intentional self-harm by jumping from a high place
X80 M - - - - 1 3 7 8 4 3 26F - - - - 2 2 2 4 3 - 13
Intentional self-harm by jumping or lying before moving object
X81 M - - - - 2 - - 1 - 1 4F - - - - - - 1 - 1 - 2
Intentional self-harm by crashing of motor vehicle X82 M - - - - 2 - 1 - - - 3F - - - - - - - - - - 0
Intentional self-harm by other specified means X83 M - - - - - - - - - 1 1F - - - - - - - - 1 - 1
Intentional self-harm by unspecified means X84 M - - - - - - 1 - - - 1F - - - - - - - - - - 0
Assault by drugs, medicaments & biological substances
X85 M - - - - 1 - - - - - 1F - - - - - - - - - - 0
Assault by hanging, strangulation & suffocation X91 M - - - - - - - - - - 0F - - - - 1 - - - - - 1
Assault by drowning & submersion X92 M - - - - - - - - - - 0F - - - - 1 - - - - - 1
Assault by rifle, shotgun & larger firearm discharge
X94 M - - - - - - - 1 - - 1F - - - - - - - - - - 0
Assault by other & unspecified firearm discharge X95 M - - - - - - 3 2 - - 5F - - - - - - 1 2 - - 3
Assault by sharp object X99 M - - - - - 1 5 3 - - 9F - - - - - - 1 1 - 1 3
Assault by blunt object Y00 M - - - - - - - - - - 0F - - - - - - - - 1 - 1
Assault by bodily force Y04 M - - - - - - - 2 1 - 3F - - - - - - 1 - - - 1
Poisoning by & exposure to nonopioid analgesics, antipyretics & antirheumatics, undetermined intent
Y10 M - - - - - - 1 - - - 1F - - - - - - - 1 - - 1
Poisoning by & exposure to antiepileptic, sedative-hypnotic, antiparkinsonism & psychotropic drugs, NEC
Y11 M - - - - - - - 1 - - 1F - - - - - - - - 1 - 1
Poisoning by & exposure to narcotics & psychodysleptics [hallucinogens], NEC, undetermined intent
Y12 M - - - - - 1 1 3 - - 5F - - - - - - - - - - 0
Poisoning by & exposure to other & unspecified drugs, medicaments & biological substances, undetermined intent
Y14 M - - - - - - 1 4 1 - 6F - - - - - - 1 5 1 - 7
Poisoning by & exposure to other gases & vapours, undetermined intent
Y17 M - - - - - - - - 1 - 1F - - - - - - - - - - 0
Hanging, strangulation & suffocation, undetermined intent
Y20 M - - - 1 - - 2 - - - 3F - - - - - - - - - - 0
Drowning & submersion, undetermined intent Y21 M - - - - - - 2 - - - 2F - - - - - - - - - - 0
Contact with sharp object, undetermined intent Y28 M - - - - - - - 1 - - 1F - - - - - - - - - - 0
Falling, jumping or pushed from a high place, undetermined intent
Y30 M - - - - - - 1 1 - - 2F - - - - - - - - - - 0
Falling, lying or running before or into moving object, undetermined intent
Y31 M - - - - - - - - - - 0F - - - - - - - 1 - - 1
Crashing of motor vehicle, undetermined intent Y32 M - - - - - 1 - 1 - - 2F - - - - - - - - - - 0
Other specified events, undetermined intent Y33 M - - - - - - 1 1 - 3 5F - - - - - - - - 1 - 1
aPPenDIX 2 (X78 - Y33)DetaIleD CaUSe of DeatH BY SeX anD aGe
BR I t I S h Co L u M B I A , 2014
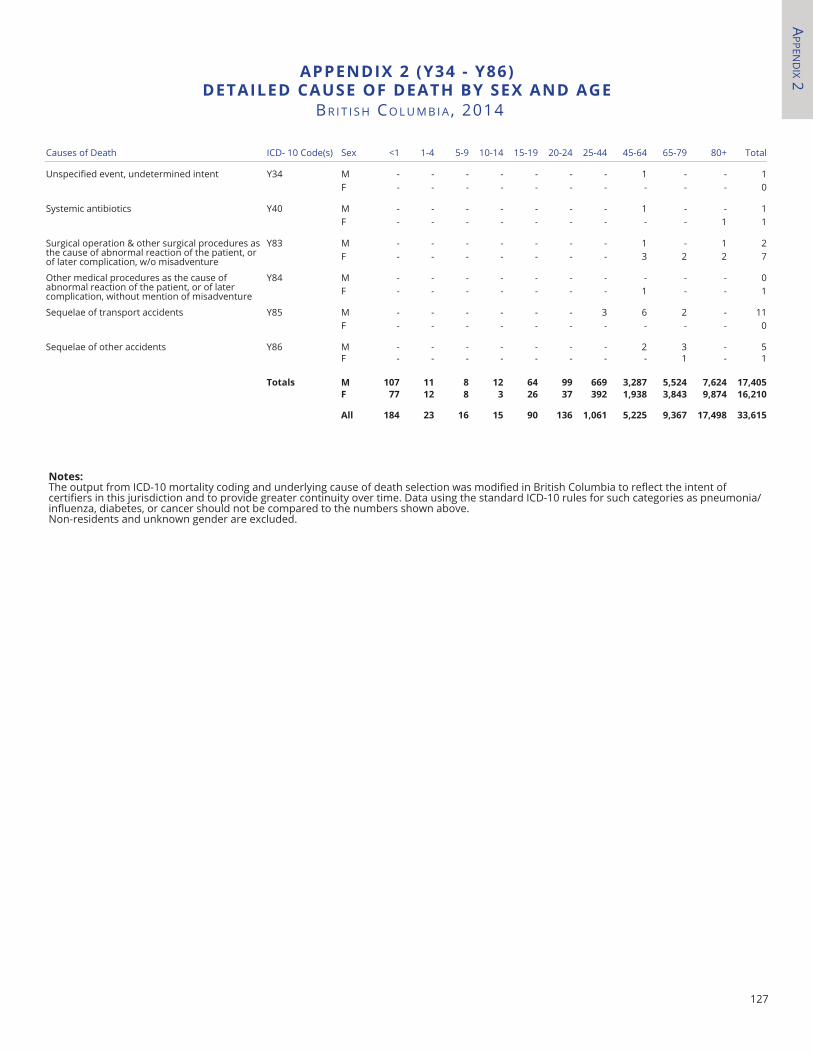
APPen
dIx 2
127
Causes of Death ICD- 10 Code(s) Sex <1 1-4 5-9 10-14 15-19 20-24 25-44 45-64 65-79 80+ Total
Unspecified event, undetermined intent Y34 M - - - - - - - 1 - - 1F - - - - - - - - - - 0
Systemic antibiotics Y40 M - - - - - - - 1 - - 1F - - - - - - - - - 1 1
Surgical operation & other surgical procedures as the cause of abnormal reaction of the patient, or of later complication, w/o misadventure
Y83 M - - - - - - - 1 - 1 2F - - - - - - - 3 2 2 7
Other medical procedures as the cause of abnormal reaction of the patient, or of later complication, without mention of misadventure
Y84 M - - - - - - - - - - 0F - - - - - - - 1 - - 1
Sequelae of transport accidents Y85 M - - - - - - 3 6 2 - 11F - - - - - - - - - - 0
Sequelae of other accidents Y86 M - - - - - - - 2 3 - 5F - - - - - - - - 1 - 1
totals m 107 11 8 12 64 99 669 3,287 5,524 7,624 17,405f 77 12 8 3 26 37 392 1,938 3,843 9,874 16,210
all 184 23 16 15 90 136 1,061 5,225 9,367 17,498 33,615
aPPenDIX 2 (Y34 - Y86)DetaIleD CaUSe of DeatH BY SeX anD aGe
BR I t I S h Co L u M B I A , 2014
notes:The output from ICD-10 mortality coding and underlying cause of death selection was modified in British Columbia to reflect the intent of certifiers in this jurisdiction and to provide greater continuity over time. Data using the standard ICD-10 rules for such categories as pneumonia/influenza, diabetes, or cancer should not be compared to the numbers shown above.Non-residents and unknown gender are excluded.

128
129
Selected Health Status Indicators by Local Health Area, Health Service Delivery Area and Health AuthorityBritish Columbia, 2010 - 2014
Appendix Three

130
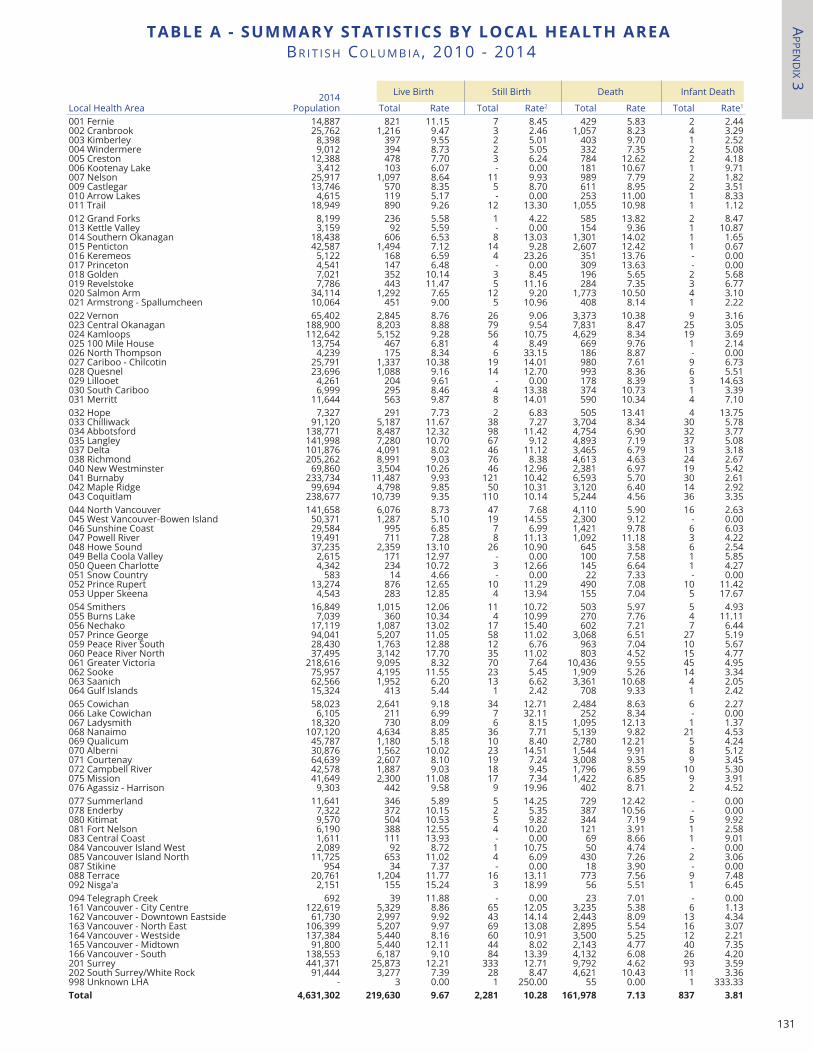
131
APPen
dIx 3
taBle a - SUmmarY StatIStICS BY loCal HealtH area BR I t I S h Co L u M B I A , 2010 - 2014
Live Birth Still Birth Death Infant Death
Local Health Area2014
Population Total Rate Total Rate2 Total Rate Total Rate1
001 Fernie 14,887 821 11.15 7 8.45 429 5.83 2 2.44002 Cranbrook 25,762 1,216 9.47 3 2.46 1,057 8.23 4 3.29003 Kimberley 8,398 397 9.55 2 5.01 403 9.70 1 2.52004 Windermere 9,012 394 8.73 2 5.05 332 7.35 2 5.08005 Creston 12,388 478 7.70 3 6.24 784 12.62 2 4.18006 Kootenay Lake 3,412 103 6.07 - 0.00 181 10.67 1 9.71007 Nelson 25,917 1,097 8.64 11 9.93 989 7.79 2 1.82009 Castlegar 13,746 570 8.35 5 8.70 611 8.95 2 3.51010 Arrow Lakes 4,615 119 5.17 - 0.00 253 11.00 1 8.33011 Trail 18,949 890 9.26 12 13.30 1,055 10.98 1 1.12012 Grand Forks 8,199 236 5.58 1 4.22 585 13.82 2 8.47013 Kettle Valley 3,159 92 5.59 - 0.00 154 9.36 1 10.87014 Southern Okanagan 18,438 606 6.53 8 13.03 1,301 14.02 1 1.65015 Penticton 42,587 1,494 7.12 14 9.28 2,607 12.42 1 0.67016 Keremeos 5,122 168 6.59 4 23.26 351 13.76 - 0.00017 Princeton 4,541 147 6.48 - 0.00 309 13.63 - 0.00018 Golden 7,021 352 10.14 3 8.45 196 5.65 2 5.68019 Revelstoke 7,786 443 11.47 5 11.16 284 7.35 3 6.77020 Salmon Arm 34,114 1,292 7.65 12 9.20 1,773 10.50 4 3.10021 Armstrong - Spallumcheen 10,064 451 9.00 5 10.96 408 8.14 1 2.22022 Vernon 65,402 2,845 8.76 26 9.06 3,373 10.38 9 3.16023 Central Okanagan 188,900 8,203 8.88 79 9.54 7,831 8.47 25 3.05024 Kamloops 112,642 5,152 9.28 56 10.75 4,629 8.34 19 3.69025 100 Mile House 13,754 467 6.81 4 8.49 669 9.76 1 2.14026 North Thompson 4,239 175 8.34 6 33.15 186 8.87 - 0.00027 Cariboo - Chilcotin 25,791 1,337 10.38 19 14.01 980 7.61 9 6.73028 Quesnel 23,696 1,088 9.16 14 12.70 993 8.36 6 5.51029 Lillooet 4,261 204 9.61 - 0.00 178 8.39 3 14.63030 South Cariboo 6,999 295 8.46 4 13.38 374 10.73 1 3.39031 Merritt 11,644 563 9.87 8 14.01 590 10.34 4 7.10032 Hope 7,327 291 7.73 2 6.83 505 13.41 4 13.75033 Chilliwack 91,120 5,187 11.67 38 7.27 3,704 8.34 30 5.78034 Abbotsford 138,771 8,487 12.32 98 11.42 4,754 6.90 32 3.77035 Langley 141,998 7,280 10.70 67 9.12 4,893 7.19 37 5.08037 Delta 101,876 4,091 8.02 46 11.12 3,465 6.79 13 3.18038 Richmond 205,262 8,991 9.03 76 8.38 4,613 4.63 24 2.67040 New Westminster 69,860 3,504 10.26 46 12.96 2,381 6.97 19 5.42041 Burnaby 233,734 11,487 9.93 121 10.42 6,593 5.70 30 2.61042 Maple Ridge 99,694 4,798 9.85 50 10.31 3,120 6.40 14 2.92043 Coquitlam 238,677 10,739 9.35 110 10.14 5,244 4.56 36 3.35044 North Vancouver 141,658 6,076 8.73 47 7.68 4,110 5.90 16 2.63045 West Vancouver-Bowen Island 50,371 1,287 5.10 19 14.55 2,300 9.12 - 0.00046 Sunshine Coast 29,584 995 6.85 7 6.99 1,421 9.78 6 6.03047 Powell River 19,491 711 7.28 8 11.13 1,092 11.18 3 4.22048 Howe Sound 37,235 2,359 13.10 26 10.90 645 3.58 6 2.54049 Bella Coola Valley 2,615 171 12.97 - 0.00 100 7.58 1 5.85050 Queen Charlotte 4,342 234 10.72 3 12.66 145 6.64 1 4.27051 Snow Country 583 14 4.66 - 0.00 22 7.33 - 0.00052 Prince Rupert 13,274 876 12.65 10 11.29 490 7.08 10 11.42053 Upper Skeena 4,543 283 12.85 4 13.94 155 7.04 5 17.67054 Smithers 16,849 1,015 12.06 11 10.72 503 5.97 5 4.93055 Burns Lake 7,039 360 10.34 4 10.99 270 7.76 4 11.11056 Nechako 17,119 1,087 13.02 17 15.40 602 7.21 7 6.44057 Prince George 94,041 5,207 11.05 58 11.02 3,068 6.51 27 5.19059 Peace River South 28,430 1,763 12.88 12 6.76 963 7.04 10 5.67060 Peace River North 37,495 3,142 17.70 35 11.02 803 4.52 15 4.77061 Greater Victoria 218,616 9,095 8.32 70 7.64 10,436 9.55 45 4.95062 Sooke 75,957 4,195 11.55 23 5.45 1,909 5.26 14 3.34063 Saanich 62,566 1,952 6.20 13 6.62 3,361 10.68 4 2.05064 Gulf Islands 15,324 413 5.44 1 2.42 708 9.33 1 2.42065 Cowichan 58,023 2,641 9.18 34 12.71 2,484 8.63 6 2.27066 Lake Cowichan 6,105 211 6.99 7 32.11 252 8.34 - 0.00067 Ladysmith 18,320 730 8.09 6 8.15 1,095 12.13 1 1.37068 Nanaimo 107,120 4,634 8.85 36 7.71 5,139 9.82 21 4.53069 Qualicum 45,787 1,180 5.18 10 8.40 2,780 12.21 5 4.24070 Alberni 30,876 1,562 10.02 23 14.51 1,544 9.91 8 5.12071 Courtenay 64,639 2,607 8.10 19 7.24 3,008 9.35 9 3.45072 Campbell River 42,578 1,887 9.03 18 9.45 1,796 8.59 10 5.30075 Mission 41,649 2,300 11.08 17 7.34 1,422 6.85 9 3.91076 Agassiz - Harrison 9,303 442 9.58 9 19.96 402 8.71 2 4.52077 Summerland 11,641 346 5.89 5 14.25 729 12.42 - 0.00078 Enderby 7,322 372 10.15 2 5.35 387 10.56 - 0.00080 Kitimat 9,570 504 10.53 5 9.82 344 7.19 5 9.92081 Fort Nelson 6,190 388 12.55 4 10.20 121 3.91 1 2.58083 Central Coast 1,611 111 13.93 - 0.00 69 8.66 1 9.01084 Vancouver Island West 2,089 92 8.72 1 10.75 50 4.74 - 0.00085 Vancouver Island North 11,725 653 11.02 4 6.09 430 7.26 2 3.06087 Stikine 954 34 7.37 - 0.00 18 3.90 - 0.00088 Terrace 20,761 1,204 11.77 16 13.11 773 7.56 9 7.48092 Nisga'a 2,151 155 15.24 3 18.99 56 5.51 1 6.45094 Telegraph Creek 692 39 11.88 - 0.00 23 7.01 - 0.00161 Vancouver - City Centre 122,619 5,329 8.86 65 12.05 3,235 5.38 6 1.13162 Vancouver - Downtown Eastside 61,730 2,997 9.92 43 14.14 2,443 8.09 13 4.34163 Vancouver - North East 106,399 5,207 9.97 69 13.08 2,895 5.54 16 3.07164 Vancouver - Westside 137,384 5,440 8.16 60 10.91 3,500 5.25 12 2.21165 Vancouver - Midtown 91,800 5,440 12.11 44 8.02 2,143 4.77 40 7.35166 Vancouver - South 138,553 6,187 9.10 84 13.39 4,132 6.08 26 4.20201 Surrey 441,371 25,873 12.21 333 12.71 9,792 4.62 93 3.59202 South Surrey/White Rock 91,444 3,277 7.39 28 8.47 4,621 10.43 11 3.36998 Unknown LHA - 3 0.00 1 250.00 55 0.00 1 333.33total 4,631,302 219,630 9.67 2,281 10.28 161,978 7.13 837 3.81
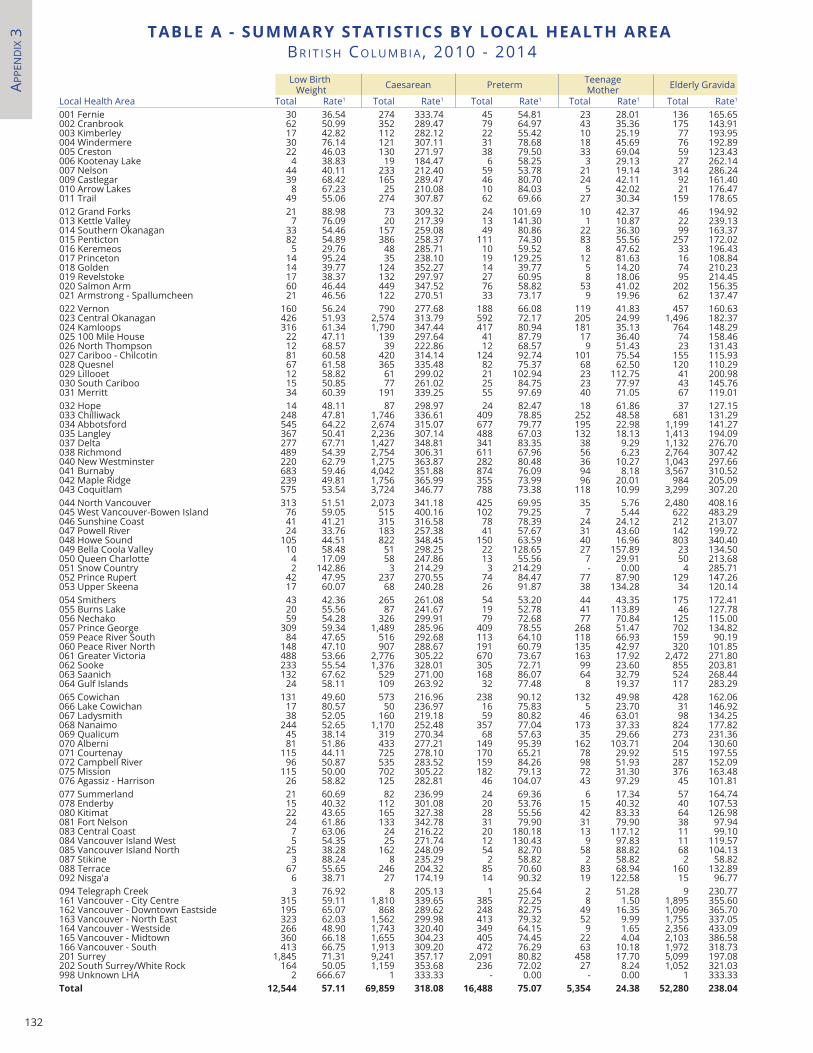
132
APPe
nd
Ix 3 taBle a - SUmmarY StatIStICS BY loCal HealtH area
BR I t I S h Co L u M B I A , 2010 - 2014Low Birth Weight Caesarean Teenage
Mother Elderly Gravida
Local Health Area Total Rate1 Total Rate1 Total Rate1 Total Rate1 Total Rate1
001 Fernie 30 36.54 274 333.74 45 54.81 23 28.01 136 165.65002 Cranbrook 62 50.99 352 289.47 79 64.97 43 35.36 175 143.91003 Kimberley 17 42.82 112 282.12 22 55.42 10 25.19 77 193.95004 Windermere 30 76.14 121 307.11 31 78.68 18 45.69 76 192.89005 Creston 22 46.03 130 271.97 38 79.50 33 69.04 59 123.43006 Kootenay Lake 4 38.83 19 184.47 6 58.25 3 29.13 27 262.14007 Nelson 44 40.11 233 212.40 59 53.78 21 19.14 314 286.24009 Castlegar 39 68.42 165 289.47 46 80.70 24 42.11 92 161.40010 Arrow Lakes 8 67.23 25 210.08 10 84.03 5 42.02 21 176.47011 Trail 49 55.06 274 307.87 62 69.66 27 30.34 159 178.65012 Grand Forks 21 88.98 73 309.32 24 101.69 10 42.37 46 194.92013 Kettle Valley 7 76.09 20 217.39 13 141.30 1 10.87 22 239.13014 Southern Okanagan 33 54.46 157 259.08 49 80.86 22 36.30 99 163.37015 Penticton 82 54.89 386 258.37 111 74.30 83 55.56 257 172.02016 Keremeos 5 29.76 48 285.71 10 59.52 8 47.62 33 196.43017 Princeton 14 95.24 35 238.10 19 129.25 12 81.63 16 108.84018 Golden 14 39.77 124 352.27 14 39.77 5 14.20 74 210.23019 Revelstoke 17 38.37 132 297.97 27 60.95 8 18.06 95 214.45020 Salmon Arm 60 46.44 449 347.52 76 58.82 53 41.02 202 156.35021 Armstrong - Spallumcheen 21 46.56 122 270.51 33 73.17 9 19.96 62 137.47022 Vernon 160 56.24 790 277.68 188 66.08 119 41.83 457 160.63023 Central Okanagan 426 51.93 2,574 313.79 592 72.17 205 24.99 1,496 182.37024 Kamloops 316 61.34 1,790 347.44 417 80.94 181 35.13 764 148.29025 100 Mile House 22 47.11 139 297.64 41 87.79 17 36.40 74 158.46026 North Thompson 12 68.57 39 222.86 12 68.57 9 51.43 23 131.43027 Cariboo - Chilcotin 81 60.58 420 314.14 124 92.74 101 75.54 155 115.93028 Quesnel 67 61.58 365 335.48 82 75.37 68 62.50 120 110.29029 Lillooet 12 58.82 61 299.02 21 102.94 23 112.75 41 200.98030 South Cariboo 15 50.85 77 261.02 25 84.75 23 77.97 43 145.76031 Merritt 34 60.39 191 339.25 55 97.69 40 71.05 67 119.01032 Hope 14 48.11 87 298.97 24 82.47 18 61.86 37 127.15033 Chilliwack 248 47.81 1,746 336.61 409 78.85 252 48.58 681 131.29034 Abbotsford 545 64.22 2,674 315.07 677 79.77 195 22.98 1,199 141.27035 Langley 367 50.41 2,236 307.14 488 67.03 132 18.13 1,413 194.09037 Delta 277 67.71 1,427 348.81 341 83.35 38 9.29 1,132 276.70038 Richmond 489 54.39 2,754 306.31 611 67.96 56 6.23 2,764 307.42040 New Westminster 220 62.79 1,275 363.87 282 80.48 36 10.27 1,043 297.66041 Burnaby 683 59.46 4,042 351.88 874 76.09 94 8.18 3,567 310.52042 Maple Ridge 239 49.81 1,756 365.99 355 73.99 96 20.01 984 205.09043 Coquitlam 575 53.54 3,724 346.77 788 73.38 118 10.99 3,299 307.20044 North Vancouver 313 51.51 2,073 341.18 425 69.95 35 5.76 2,480 408.16045 West Vancouver-Bowen Island 76 59.05 515 400.16 102 79.25 7 5.44 622 483.29046 Sunshine Coast 41 41.21 315 316.58 78 78.39 24 24.12 212 213.07047 Powell River 24 33.76 183 257.38 41 57.67 31 43.60 142 199.72048 Howe Sound 105 44.51 822 348.45 150 63.59 40 16.96 803 340.40049 Bella Coola Valley 10 58.48 51 298.25 22 128.65 27 157.89 23 134.50050 Queen Charlotte 4 17.09 58 247.86 13 55.56 7 29.91 50 213.68051 Snow Country 2 142.86 3 214.29 3 214.29 - 0.00 4 285.71052 Prince Rupert 42 47.95 237 270.55 74 84.47 77 87.90 129 147.26053 Upper Skeena 17 60.07 68 240.28 26 91.87 38 134.28 34 120.14054 Smithers 43 42.36 265 261.08 54 53.20 44 43.35 175 172.41055 Burns Lake 20 55.56 87 241.67 19 52.78 41 113.89 46 127.78056 Nechako 59 54.28 326 299.91 79 72.68 77 70.84 125 115.00057 Prince George 309 59.34 1,489 285.96 409 78.55 268 51.47 702 134.82059 Peace River South 84 47.65 516 292.68 113 64.10 118 66.93 159 90.19060 Peace River North 148 47.10 907 288.67 191 60.79 135 42.97 320 101.85061 Greater Victoria 488 53.66 2,776 305.22 670 73.67 163 17.92 2,472 271.80062 Sooke 233 55.54 1,376 328.01 305 72.71 99 23.60 855 203.81063 Saanich 132 67.62 529 271.00 168 86.07 64 32.79 524 268.44064 Gulf Islands 24 58.11 109 263.92 32 77.48 8 19.37 117 283.29065 Cowichan 131 49.60 573 216.96 238 90.12 132 49.98 428 162.06066 Lake Cowichan 17 80.57 50 236.97 16 75.83 5 23.70 31 146.92067 Ladysmith 38 52.05 160 219.18 59 80.82 46 63.01 98 134.25068 Nanaimo 244 52.65 1,170 252.48 357 77.04 173 37.33 824 177.82069 Qualicum 45 38.14 319 270.34 68 57.63 35 29.66 273 231.36070 Alberni 81 51.86 433 277.21 149 95.39 162 103.71 204 130.60071 Courtenay 115 44.11 725 278.10 170 65.21 78 29.92 515 197.55072 Campbell River 96 50.87 535 283.52 159 84.26 98 51.93 287 152.09075 Mission 115 50.00 702 305.22 182 79.13 72 31.30 376 163.48076 Agassiz - Harrison 26 58.82 125 282.81 46 104.07 43 97.29 45 101.81077 Summerland 21 60.69 82 236.99 24 69.36 6 17.34 57 164.74078 Enderby 15 40.32 112 301.08 20 53.76 15 40.32 40 107.53080 Kitimat 22 43.65 165 327.38 28 55.56 42 83.33 64 126.98081 Fort Nelson 24 61.86 133 342.78 31 79.90 31 79.90 38 97.94083 Central Coast 7 63.06 24 216.22 20 180.18 13 117.12 11 99.10084 Vancouver Island West 5 54.35 25 271.74 12 130.43 9 97.83 11 119.57085 Vancouver Island North 25 38.28 162 248.09 54 82.70 58 88.82 68 104.13087 Stikine 3 88.24 8 235.29 2 58.82 2 58.82 2 58.82088 Terrace 67 55.65 246 204.32 85 70.60 83 68.94 160 132.89092 Nisga'a 6 38.71 27 174.19 14 90.32 19 122.58 15 96.77094 Telegraph Creek 3 76.92 8 205.13 1 25.64 2 51.28 9 230.77161 Vancouver - City Centre 315 59.11 1,810 339.65 385 72.25 8 1.50 1,895 355.60162 Vancouver - Downtown Eastside 195 65.07 868 289.62 248 82.75 49 16.35 1,096 365.70163 Vancouver - North East 323 62.03 1,562 299.98 413 79.32 52 9.99 1,755 337.05164 Vancouver - Westside 266 48.90 1,743 320.40 349 64.15 9 1.65 2,356 433.09165 Vancouver - Midtown 360 66.18 1,655 304.23 405 74.45 22 4.04 2,103 386.58166 Vancouver - South 413 66.75 1,913 309.20 472 76.29 63 10.18 1,972 318.73201 Surrey 1,845 71.31 9,241 357.17 2,091 80.82 458 17.70 5,099 197.08202 South Surrey/White Rock 164 50.05 1,159 353.68 236 72.02 27 8.24 1,052 321.03998 Unknown LHA 2 666.67 1 333.33 - 0.00 - 0.00 1 333.33total 12,544 57.11 69,859 318.08 16,488 75.07 5,354 24.38 52,280 238.04
Preterm
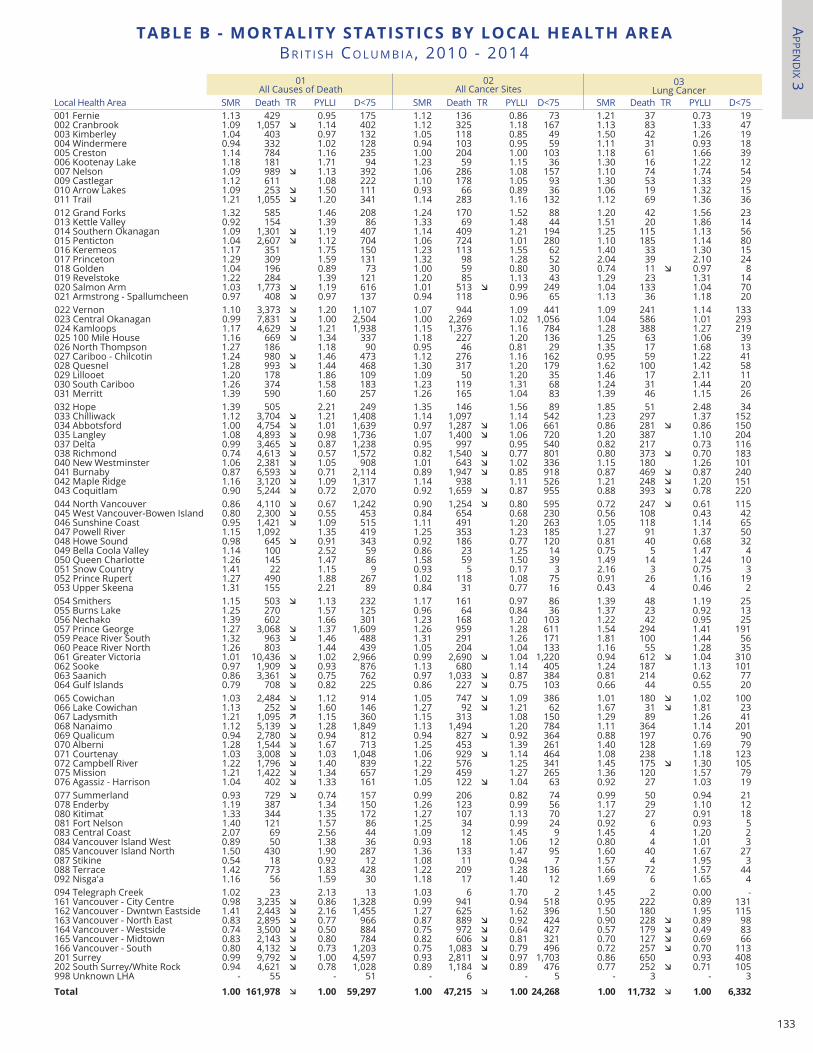
133
APPen
dIx 3
taBle B - mortalItY StatIStICS BY loCal HealtH area BR I t I S h Co L u M B I A , 2010 - 2014
03Lung Cancer
Local Health Area SMR Death TR PYLLI D<75 SMR Death TR PYLLI D<75 SMR Death TR PYLLI D<75001 Fernie 1.13 429 0.95 175 1.12 136 0.86 73 1.21 37 0.73 19 002 Cranbrook 1.09 1,057 æ 1.14 402 1.12 325 1.18 167 1.13 83 1.33 47 003 Kimberley 1.04 403 0.97 132 1.05 118 0.85 49 1.50 42 1.26 19 004 Windermere 0.94 332 1.02 128 0.94 103 0.95 59 1.11 31 0.93 18 005 Creston 1.14 784 1.16 235 1.00 204 1.00 103 1.18 61 1.66 39 006 Kootenay Lake 1.18 181 1.71 94 1.23 59 1.15 36 1.30 16 1.22 12 007 Nelson 1.09 989 æ 1.13 392 1.06 286 1.08 157 1.10 74 1.74 54 009 Castlegar 1.12 611 1.08 222 1.10 178 1.05 93 1.30 53 1.33 29 010 Arrow Lakes 1.09 253 æ 1.50 111 0.93 66 0.89 36 1.06 19 1.32 15 011 Trail 1.21 1,055 æ 1.20 341 1.14 283 1.16 132 1.12 69 1.36 36 012 Grand Forks 1.32 585 1.46 208 1.24 170 1.52 88 1.20 42 1.56 23 013 Kettle Valley 0.92 154 1.39 86 1.33 69 1.48 44 1.51 20 1.86 14 014 Southern Okanagan 1.09 1,301 æ 1.19 407 1.14 409 1.21 194 1.25 115 1.13 56 015 Penticton 1.04 2,607 æ 1.12 704 1.06 724 1.01 280 1.10 185 1.14 80 016 Keremeos 1.17 351 1.75 150 1.23 113 1.55 62 1.40 33 1.30 15 017 Princeton 1.29 309 1.59 131 1.32 98 1.28 52 2.04 39 2.10 24 018 Golden 1.04 196 0.89 73 1.00 59 0.80 30 0.74 11 æ 0.97 8 019 Revelstoke 1.22 284 1.39 121 1.20 85 1.13 43 1.29 23 1.31 14 020 Salmon Arm 1.03 1,773 æ 1.19 616 1.01 513 æ 0.99 249 1.04 133 1.04 70 021 Armstrong - Spallumcheen 0.97 408 æ 0.97 137 0.94 118 0.96 65 1.13 36 1.18 20 022 Vernon 1.10 3,373 æ 1.20 1,107 1.07 944 1.09 441 1.09 241 1.14 133 023 Central Okanagan 0.99 7,831 æ 1.00 2,504 1.00 2,269 1.02 1,056 1.04 586 1.01 293 024 Kamloops 1.17 4,629 æ 1.21 1,938 1.15 1,376 1.16 784 1.28 388 1.27 219 025 100 Mile House 1.16 669 æ 1.34 337 1.18 227 1.20 136 1.25 63 1.06 39 026 North Thompson 1.27 186 1.18 90 0.95 46 0.81 29 1.35 17 1.68 13 027 Cariboo - Chilcotin 1.24 980 æ 1.46 473 1.12 276 1.16 162 0.95 59 1.22 41 028 Quesnel 1.28 993 æ 1.44 468 1.30 317 1.20 179 1.62 100 1.42 58 029 Lillooet 1.20 178 1.86 109 1.09 50 1.20 35 1.46 17 2.11 11 030 South Cariboo 1.26 374 1.58 183 1.23 119 1.31 68 1.24 31 1.44 20 031 Merritt 1.39 590 1.60 257 1.26 165 1.04 83 1.39 46 1.15 26 032 Hope 1.39 505 2.21 249 1.35 146 1.56 89 1.85 51 2.48 34 033 Chilliwack 1.12 3,704 æ 1.21 1,408 1.14 1,097 1.14 542 1.23 297 1.37 152 034 Abbotsford 1.00 4,754 æ 1.01 1,639 0.97 1,287 æ 1.06 661 0.86 281 æ 0.86 150 035 Langley 1.08 4,893 æ 0.98 1,736 1.07 1,400 æ 1.06 720 1.20 387 1.10 204 037 Delta 0.99 3,465 æ 0.87 1,238 0.95 997 0.95 540 0.82 217 0.73 116 038 Richmond 0.74 4,613 æ 0.57 1,572 0.82 1,540 æ 0.77 801 0.80 373 æ 0.70 183 040 New Westminster 1.06 2,381 æ 1.05 908 1.01 643 æ 1.02 336 1.15 180 1.26 101 041 Burnaby 0.87 6,593 æ 0.71 2,114 0.89 1,947 æ 0.85 918 0.87 469 æ 0.87 240 042 Maple Ridge 1.16 3,120 æ 1.09 1,317 1.14 938 1.11 526 1.21 248 æ 1.20 151 043 Coquitlam 0.90 5,244 æ 0.72 2,070 0.92 1,659 æ 0.87 955 0.88 393 æ 0.78 220 044 North Vancouver 0.86 4,110 æ 0.67 1,242 0.90 1,254 æ 0.80 595 0.72 247 æ 0.61 115 045 West Vancouver-Bowen Island 0.80 2,300 æ 0.55 453 0.84 654 0.68 230 0.56 108 0.43 42 046 Sunshine Coast 0.95 1,421 æ 1.09 515 1.11 491 1.20 263 1.05 118 1.14 65 047 Powell River 1.15 1,092 1.35 419 1.25 353 1.23 185 1.27 91 1.37 50 048 Howe Sound 0.98 645 æ 0.91 343 0.92 186 0.77 120 0.81 40 0.68 32 049 Bella Coola Valley 1.14 100 2.52 59 0.86 23 1.25 14 0.75 5 1.47 4 050 Queen Charlotte 1.26 145 1.47 86 1.58 59 1.50 39 1.49 14 1.24 10 051 Snow Country 1.41 22 1.15 9 0.93 5 0.17 3 2.16 3 0.75 3 052 Prince Rupert 1.27 490 1.88 267 1.02 118 1.08 75 0.91 26 1.16 19 053 Upper Skeena 1.31 155 2.21 89 0.84 31 0.77 16 0.43 4 0.46 2 054 Smithers 1.15 503 æ 1.13 232 1.17 161 0.97 86 1.39 48 1.19 25 055 Burns Lake 1.25 270 1.57 125 0.96 64 0.84 36 1.37 23 0.92 13 056 Nechako 1.39 602 1.66 301 1.23 168 1.20 103 1.22 42 0.95 25 057 Prince George 1.27 3,068 æ 1.37 1,609 1.26 959 1.28 611 1.54 294 1.41 191 059 Peace River South 1.32 963 æ 1.46 488 1.31 291 1.26 171 1.81 100 1.44 56 060 Peace River North 1.26 803 1.44 439 1.05 204 1.04 133 1.16 55 1.28 35 061 Greater Victoria 1.01 10,436 æ 1.02 2,966 0.99 2,690 æ 1.04 1,220 0.94 612 æ 1.04 310 062 Sooke 0.97 1,909 æ 0.93 876 1.13 680 1.14 405 1.24 187 1.13 101 063 Saanich 0.86 3,361 æ 0.75 762 0.97 1,033 æ 0.87 384 0.81 214 0.62 77 064 Gulf Islands 0.79 708 æ 0.82 225 0.86 227 æ 0.75 103 0.66 44 0.55 20 065 Cowichan 1.03 2,484 æ 1.12 914 1.05 747 æ 1.09 386 1.01 180 æ 1.02 100 066 Lake Cowichan 1.13 252 æ 1.60 146 1.27 92 æ 1.21 62 1.67 31 æ 1.81 23 067 Ladysmith 1.21 1,095 ä 1.15 360 1.15 313 1.08 150 1.29 89 1.26 41 068 Nanaimo 1.12 5,139 æ 1.28 1,849 1.13 1,494 1.20 784 1.11 364 1.14 201 069 Qualicum 0.94 2,780 æ 0.94 812 0.94 827 æ 0.92 364 0.88 197 0.76 90 070 Alberni 1.28 1,544 æ 1.67 713 1.25 453 1.39 261 1.40 128 1.69 79 071 Courtenay 1.03 3,008 æ 1.03 1,048 1.06 929 æ 1.14 464 1.08 238 1.18 123 072 Campbell River 1.22 1,796 æ 1.40 839 1.22 576 1.25 341 1.45 175 æ 1.30 105 075 Mission 1.21 1,422 æ 1.34 657 1.29 459 1.27 265 1.36 120 1.57 79 076 Agassiz - Harrison 1.04 402 æ 1.33 161 1.05 122 æ 1.04 63 0.92 27 1.03 19 077 Summerland 0.93 729 æ 0.74 157 0.99 206 0.82 74 0.99 50 0.94 21 078 Enderby 1.19 387 1.34 150 1.26 123 0.99 56 1.17 29 1.10 12 080 Kitimat 1.33 344 1.35 172 1.27 107 1.13 70 1.27 27 0.91 18 081 Fort Nelson 1.40 121 1.57 86 1.25 34 0.99 24 0.92 6 0.93 5 083 Central Coast 2.07 69 2.56 44 1.09 12 1.45 9 1.45 4 1.20 2 084 Vancouver Island West 0.89 50 1.38 36 0.93 18 1.06 12 0.80 4 1.01 3 085 Vancouver Island North 1.50 430 1.90 287 1.36 133 1.47 95 1.60 40 1.67 27 087 Stikine 0.54 18 0.92 12 1.08 11 0.94 7 1.57 4 1.95 3 088 Terrace 1.42 773 1.83 428 1.22 209 1.28 136 1.66 72 1.57 44 092 Nisga'a 1.16 56 1.59 30 1.18 17 1.40 12 1.69 6 1.65 4 094 Telegraph Creek 1.02 23 2.13 13 1.03 6 1.70 2 1.45 2 0.00 - 161 Vancouver - City Centre 0.98 3,235 æ 0.86 1,328 0.99 941 0.94 518 0.95 222 0.89 131 162 Vancouver - Dwntwn Eastside 1.41 2,443 æ 2.16 1,455 1.27 625 1.62 396 1.50 180 1.95 115 163 Vancouver - North East 0.83 2,895 æ 0.77 966 0.87 889 æ 0.92 424 0.90 228 æ 0.89 98 164 Vancouver - Westside 0.74 3,500 æ 0.50 884 0.75 972 æ 0.64 427 0.57 179 æ 0.49 83 165 Vancouver - Midtown 0.83 2,143 æ 0.80 784 0.82 606 æ 0.81 321 0.70 127 æ 0.69 66 166 Vancouver - South 0.80 4,132 æ 0.73 1,203 0.75 1,083 æ 0.79 496 0.72 257 æ 0.70 113 201 Surrey 0.99 9,792 æ 1.00 4,597 0.93 2,811 æ 0.97 1,703 0.86 650 0.93 408 202 South Surrey/White Rock 0.94 4,621 æ 0.78 1,028 0.89 1,184 æ 0.89 476 0.77 252 æ 0.71 105 998 Unknown LHA - 55 - 51 - 6 - 5 - 3 - 3
total 1.00 161,978 æ 1.00 59,297 1.00 47,215 æ 1.00 24,268 1.00 11,732 æ 1.00 6,332
01All Causes of Death
02All Cancer Sites
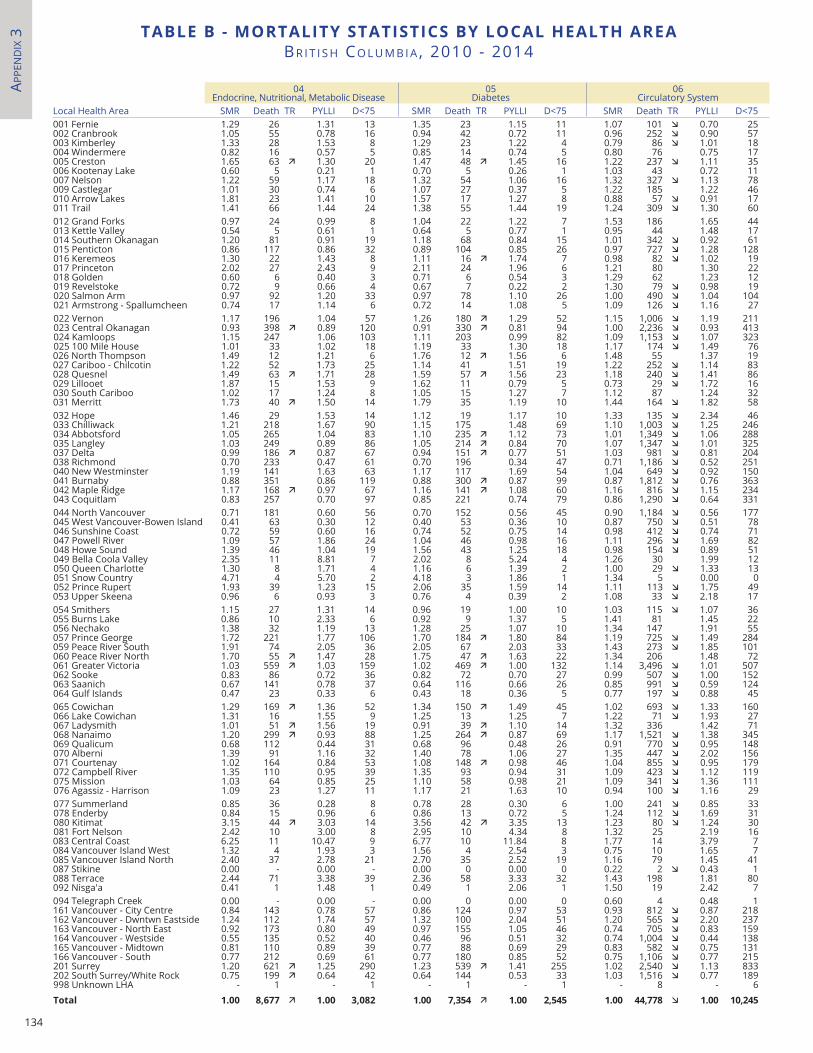
134
Local Health Area SMR Death TR PYLLI D<75 SMR Death TR PYLLI D<75 SMR Death TR PYLLI D<75001 Fernie 1.29 26 1.31 13 1.35 23 1.15 11 1.07 101 æ 0.70 25002 Cranbrook 1.05 55 0.78 16 0.94 42 0.72 11 0.96 252 æ 0.90 57003 Kimberley 1.33 28 1.53 8 1.29 23 1.22 4 0.79 86 æ 1.01 18004 Windermere 0.82 16 0.57 5 0.85 14 0.74 5 0.80 76 0.75 17005 Creston 1.65 63 ä 1.30 20 1.47 48 ä 1.45 16 1.22 237 æ 1.11 35006 Kootenay Lake 0.60 5 0.21 1 0.70 5 0.26 1 1.03 43 0.72 11007 Nelson 1.22 59 1.17 18 1.32 54 1.06 16 1.32 327 æ 1.13 78009 Castlegar 1.01 30 0.74 6 1.07 27 0.37 5 1.22 185 1.22 46010 Arrow Lakes 1.81 23 1.41 10 1.57 17 1.27 8 0.88 57 æ 0.91 17011 Trail 1.41 66 1.44 24 1.38 55 1.44 19 1.24 309 æ 1.30 60012 Grand Forks 0.97 24 0.99 8 1.04 22 1.22 7 1.53 186 1.65 44013 Kettle Valley 0.54 5 0.61 1 0.64 5 0.77 1 0.95 44 1.48 17014 Southern Okanagan 1.20 81 0.91 19 1.18 68 0.84 15 1.01 342 æ 0.92 61015 Penticton 0.86 117 0.86 32 0.89 104 0.85 26 0.97 727 æ 1.28 128016 Keremeos 1.30 22 1.43 8 1.11 16 ä 1.74 7 0.98 82 æ 1.02 19017 Princeton 2.02 27 2.43 9 2.11 24 1.96 6 1.21 80 1.30 22018 Golden 0.60 6 0.40 3 0.71 6 0.54 3 1.29 62 1.23 12019 Revelstoke 0.72 9 0.66 4 0.67 7 0.22 2 1.30 79 æ 0.98 19020 Salmon Arm 0.97 92 1.20 33 0.97 78 1.10 26 1.00 490 æ 1.04 104021 Armstrong - Spallumcheen 0.74 17 1.14 6 0.72 14 1.08 5 1.09 126 æ 1.16 27022 Vernon 1.17 196 1.04 57 1.26 180 ä 1.29 52 1.15 1,006 æ 1.19 211023 Central Okanagan 0.93 398 ä 0.89 120 0.91 330 ä 0.81 94 1.00 2,236 æ 0.93 413024 Kamloops 1.15 247 1.06 103 1.11 203 0.99 82 1.09 1,153 æ 1.07 323025 100 Mile House 1.01 33 1.02 18 1.19 33 1.30 18 1.17 174 æ 1.49 76026 North Thompson 1.49 12 1.21 6 1.76 12 ä 1.56 6 1.48 55 1.37 19027 Cariboo - Chilcotin 1.22 52 1.73 25 1.14 41 1.51 19 1.22 252 æ 1.14 83028 Quesnel 1.49 63 ä 1.71 28 1.59 57 ä 1.56 23 1.18 240 æ 1.41 86029 Lillooet 1.87 15 1.53 9 1.62 11 0.79 5 0.73 29 æ 1.72 16030 South Cariboo 1.02 17 1.24 8 1.05 15 1.27 7 1.12 87 1.24 32031 Merritt 1.73 40 ä 1.50 14 1.79 35 1.19 10 1.44 164 æ 1.82 58032 Hope 1.46 29 1.53 14 1.12 19 1.17 10 1.33 135 æ 2.34 46033 Chilliwack 1.21 218 1.67 90 1.15 175 1.48 69 1.10 1,003 æ 1.25 246034 Abbotsford 1.05 265 1.04 83 1.10 235 ä 1.12 73 1.01 1,349 æ 1.06 288035 Langley 1.03 249 0.89 86 1.05 214 ä 0.84 70 1.07 1,347 æ 1.01 325037 Delta 0.99 186 ä 0.87 67 0.94 151 ä 0.77 51 1.03 981 æ 0.81 204038 Richmond 0.70 233 0.47 61 0.70 196 0.34 47 0.71 1,186 æ 0.52 251040 New Westminster 1.19 141 1.63 63 1.17 117 1.69 54 1.04 649 æ 0.92 150041 Burnaby 0.88 351 0.86 119 0.88 300 ä 0.87 99 0.87 1,812 æ 0.76 363042 Maple Ridge 1.17 168 ä 0.97 67 1.16 141 ä 1.08 60 1.16 816 æ 1.15 234043 Coquitlam 0.83 257 0.70 97 0.85 221 0.74 79 0.86 1,290 æ 0.64 331044 North Vancouver 0.71 181 0.60 56 0.70 152 0.56 45 0.90 1,184 æ 0.56 177045 West Vancouver-Bowen Island 0.41 63 0.30 12 0.40 53 0.36 10 0.87 750 æ 0.51 78046 Sunshine Coast 0.72 59 0.60 16 0.74 52 0.75 14 0.98 412 æ 0.74 71047 Powell River 1.09 57 1.86 24 1.04 46 0.98 16 1.11 296 æ 1.69 82048 Howe Sound 1.39 46 1.04 19 1.56 43 1.25 18 0.98 154 æ 0.89 51049 Bella Coola Valley 2.35 11 8.81 7 2.02 8 5.24 4 1.26 30 1.99 12050 Queen Charlotte 1.30 8 1.71 4 1.16 6 1.39 2 1.00 29 æ 1.33 13051 Snow Country 4.71 4 5.70 2 4.18 3 1.86 1 1.34 5 0.00 0052 Prince Rupert 1.93 39 1.23 15 2.06 35 1.59 14 1.11 113 æ 1.75 49053 Upper Skeena 0.96 6 0.93 3 0.76 4 0.39 2 1.08 33 æ 2.18 17054 Smithers 1.15 27 1.31 14 0.96 19 1.00 10 1.03 115 æ 1.07 36055 Burns Lake 0.86 10 2.33 6 0.92 9 1.37 5 1.41 81 1.45 22056 Nechako 1.38 32 1.19 13 1.28 25 1.07 10 1.34 147 1.91 55057 Prince George 1.72 221 1.77 106 1.70 184 ä 1.80 84 1.19 725 æ 1.49 284059 Peace River South 1.91 74 2.05 36 2.05 67 2.03 33 1.43 273 æ 1.85 101060 Peace River North 1.70 55 ä 1.47 28 1.75 47 ä 1.63 22 1.34 206 1.48 72061 Greater Victoria 1.03 559 ä 1.03 159 1.02 469 ä 1.00 132 1.14 3,496 æ 1.01 507062 Sooke 0.83 86 0.72 36 0.82 72 0.70 27 0.99 507 æ 1.00 152063 Saanich 0.67 141 0.78 37 0.64 116 0.66 26 0.85 991 æ 0.59 124064 Gulf Islands 0.47 23 0.33 6 0.43 18 0.36 5 0.77 197 æ 0.88 45065 Cowichan 1.29 169 ä 1.36 52 1.34 150 ä 1.49 45 1.02 693 æ 1.33 160066 Lake Cowichan 1.31 16 1.55 9 1.25 13 1.25 7 1.22 71 æ 1.93 27067 Ladysmith 1.01 51 ä 1.56 19 0.91 39 ä 1.10 14 1.32 336 1.42 71068 Nanaimo 1.20 299 ä 0.93 88 1.25 264 ä 0.87 69 1.17 1,521 æ 1.38 345069 Qualicum 0.68 112 0.44 31 0.68 96 0.48 26 0.91 770 æ 0.95 148070 Alberni 1.39 91 1.16 32 1.40 78 1.06 27 1.35 447 æ 2.02 156071 Courtenay 1.02 164 0.84 53 1.08 148 ä 0.98 46 1.04 855 æ 0.95 179072 Campbell River 1.35 110 0.95 39 1.35 93 0.94 31 1.09 423 æ 1.12 119075 Mission 1.03 64 0.85 25 1.10 58 0.98 21 1.09 341 æ 1.36 111076 Agassiz - Harrison 1.09 23 1.27 11 1.17 21 1.63 10 0.94 100 æ 1.16 29077 Summerland 0.85 36 0.28 8 0.78 28 0.30 6 1.00 241 æ 0.85 33078 Enderby 0.84 15 0.96 6 0.86 13 0.72 5 1.24 112 æ 1.69 31080 Kitimat 3.15 44 ä 3.03 14 3.56 42 ä 3.35 13 1.23 80 æ 1.24 30081 Fort Nelson 2.42 10 3.00 8 2.95 10 4.34 8 1.32 25 2.19 16083 Central Coast 6.25 11 10.47 9 6.77 10 11.84 8 1.77 14 3.79 7084 Vancouver Island West 1.32 4 1.93 3 1.56 4 2.54 3 0.75 10 1.65 7085 Vancouver Island North 2.40 37 2.78 21 2.70 35 2.52 19 1.16 79 1.45 41087 Stikine 0.00 - 0.00 - 0.00 0 0.00 0 0.22 2 æ 0.43 1088 Terrace 2.44 71 3.38 39 2.36 58 3.33 32 1.43 198 1.81 80092 Nisga'a 0.41 1 1.48 1 0.49 1 2.06 1 1.50 19 2.42 7094 Telegraph Creek 0.00 - 0.00 - 0.00 0 0.00 0 0.60 4 0.48 1161 Vancouver - City Centre 0.84 143 0.78 57 0.86 124 0.97 53 0.93 812 æ 0.87 218162 Vancouver - Dwntwn Eastside 1.24 112 1.74 57 1.32 100 2.04 51 1.20 565 æ 2.20 237163 Vancouver - North East 0.92 173 0.80 49 0.97 155 1.05 46 0.74 705 æ 0.83 159164 Vancouver - Westside 0.55 135 0.52 40 0.46 96 0.51 32 0.74 1,004 æ 0.44 138165 Vancouver - Midtown 0.81 110 0.89 39 0.77 88 0.69 29 0.83 582 æ 0.75 131166 Vancouver - South 0.77 212 0.69 61 0.77 180 0.85 52 0.75 1,106 æ 0.77 215201 Surrey 1.20 621 ä 1.25 290 1.23 539 ä 1.41 255 1.02 2,540 æ 1.13 833202 South Surrey/White Rock 0.75 199 ä 0.64 42 0.64 144 0.53 33 1.03 1,516 æ 0.77 189998 Unknown LHA - 1 - 1 - 1 - 1 - 8 - 6
total 1.00 8,677 ä 1.00 3,082 1.00 7,354 ä 1.00 2,545 1.00 44,778 æ 1.00 10,245
04Endocrine, Nutritional, Metabolic Disease
05Diabetes
06Circulatory System
APPe
nd
Ix 3 taBle B - mortalItY StatIStICS BY loCal HealtH area
BR I t I S h Co L u M B I A , 2010 - 2014
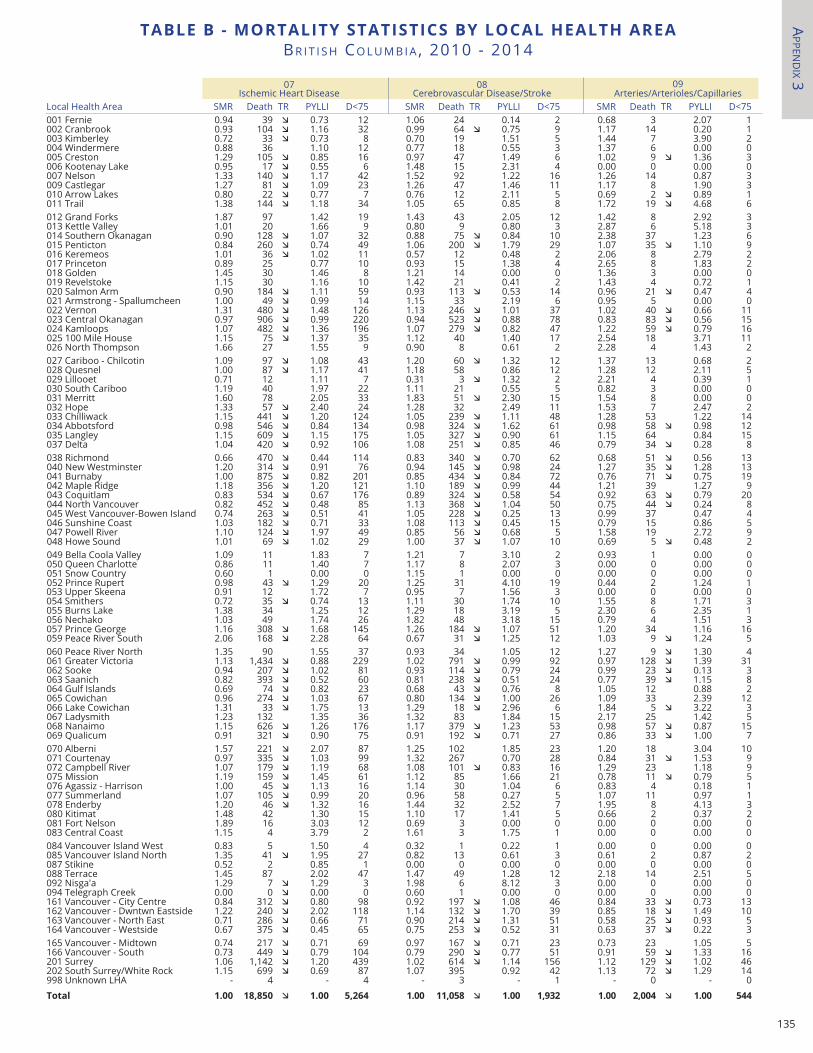
135
taBle B - mortalItY StatIStICS BY loCal HealtH areaBR I t I S h Co L u M B I A , 2010 - 2014
07Ischemic Heart Disease
08Cerebrovascular Disease/Stroke
09Arteries/Arterioles/Capillaries
Local Health Area SMR Death TR PYLLI D<75 SMR Death TR PYLLI D<75 SMR Death TR PYLLI D<75001 Fernie 0.94 39 æ 0.73 12 1.06 24 0.14 2 0.68 3 2.07 1002 Cranbrook 0.93 104 æ 1.16 32 0.99 64 æ 0.75 9 1.17 14 0.20 1003 Kimberley 0.72 33 æ 0.73 8 0.70 19 1.51 5 1.44 7 3.90 2004 Windermere 0.88 36 1.10 12 0.77 18 0.55 3 1.37 6 0.00 0005 Creston 1.29 105 æ 0.85 16 0.97 47 1.49 6 1.02 9 æ 1.36 3006 Kootenay Lake 0.95 17 æ 0.55 6 1.48 15 2.31 4 0.00 0 0.00 0007 Nelson 1.33 140 æ 1.17 42 1.52 92 1.22 16 1.26 14 0.87 3009 Castlegar 1.27 81 æ 1.09 23 1.26 47 1.46 11 1.17 8 1.90 3010 Arrow Lakes 0.80 22 æ 0.77 7 0.76 12 2.11 5 0.69 2 æ 0.89 1011 Trail 1.38 144 æ 1.18 34 1.05 65 0.85 8 1.72 19 æ 4.68 6012 Grand Forks 1.87 97 1.42 19 1.43 43 2.05 12 1.42 8 2.92 3013 Kettle Valley 1.01 20 1.66 9 0.80 9 0.80 3 2.87 6 5.18 3014 Southern Okanagan 0.90 128 æ 1.07 32 0.88 75 æ 0.84 10 2.38 37 1.23 6015 Penticton 0.84 260 æ 0.74 49 1.06 200 æ 1.79 29 1.07 35 æ 1.10 9016 Keremeos 1.01 36 æ 1.02 11 0.57 12 0.48 2 2.06 8 2.79 2017 Princeton 0.89 25 0.77 10 0.93 15 1.38 4 2.65 8 1.83 2018 Golden 1.45 30 1.46 8 1.21 14 0.00 0 1.36 3 0.00 0019 Revelstoke 1.15 30 1.16 10 1.42 21 0.41 2 1.43 4 0.72 1020 Salmon Arm 0.90 184 æ 1.11 59 0.93 113 æ 0.53 14 0.96 21 æ 0.47 4021 Armstrong - Spallumcheen 1.00 49 æ 0.99 14 1.15 33 2.19 6 0.95 5 0.00 0022 Vernon 1.31 480 æ 1.48 126 1.13 246 æ 1.01 37 1.02 40 æ 0.66 11023 Central Okanagan 0.97 906 æ 0.99 220 0.94 523 æ 0.88 78 0.83 83 æ 0.56 15024 Kamloops 1.07 482 æ 1.36 196 1.07 279 æ 0.82 47 1.22 59 æ 0.79 16025 100 Mile House 1.15 75 æ 1.37 35 1.12 40 1.40 17 2.54 18 3.71 11026 North Thompson 1.66 27 1.55 9 0.90 8 0.61 2 2.28 4 1.43 2027 Cariboo - Chilcotin 1.09 97 æ 1.08 43 1.20 60 æ 1.32 12 1.37 13 0.68 2028 Quesnel 1.00 87 æ 1.17 41 1.18 58 0.86 12 1.28 12 2.11 5029 Lillooet 0.71 12 1.11 7 0.31 3 æ 1.32 2 2.21 4 0.39 1030 South Cariboo 1.19 40 1.97 22 1.11 21 0.55 5 0.82 3 0.00 0031 Merritt 1.60 78 2.05 33 1.83 51 æ 2.30 15 1.54 8 0.00 0032 Hope 1.33 57 æ 2.40 24 1.28 32 2.49 11 1.53 7 2.47 2033 Chilliwack 1.15 441 æ 1.20 124 1.05 239 æ 1.11 48 1.28 53 1.22 14034 Abbotsford 0.98 546 æ 0.84 134 0.98 324 æ 1.62 61 0.98 58 æ 0.98 12035 Langley 1.15 609 æ 1.15 175 1.05 327 æ 0.90 61 1.15 64 0.84 15037 Delta 1.04 420 æ 0.92 106 1.08 251 æ 0.85 46 0.79 34 æ 0.28 8038 Richmond 0.66 470 æ 0.44 114 0.83 340 æ 0.70 62 0.68 51 æ 0.56 13040 New Westminster 1.20 314 æ 0.91 76 0.94 145 æ 0.98 24 1.27 35 æ 1.28 13041 Burnaby 1.00 875 æ 0.82 201 0.85 434 æ 0.84 72 0.76 71 æ 0.75 19042 Maple Ridge 1.18 356 æ 1.20 121 1.10 189 æ 0.99 44 1.21 39 1.27 9043 Coquitlam 0.83 534 æ 0.67 176 0.89 324 æ 0.58 54 0.92 63 æ 0.79 20044 North Vancouver 0.82 452 æ 0.48 85 1.13 368 æ 1.04 50 0.75 44 æ 0.24 8045 West Vancouver-Bowen Island 0.74 263 æ 0.51 41 1.05 228 æ 0.25 13 0.99 37 0.47 4046 Sunshine Coast 1.03 182 æ 0.71 33 1.08 113 æ 0.45 15 0.79 15 0.86 5047 Powell River 1.10 124 æ 1.97 49 0.85 56 æ 0.68 5 1.58 19 2.72 9048 Howe Sound 1.01 69 æ 1.02 29 1.00 37 æ 1.07 10 0.69 5 æ 0.48 2049 Bella Coola Valley 1.09 11 1.83 7 1.21 7 3.10 2 0.93 1 0.00 0050 Queen Charlotte 0.86 11 1.40 7 1.17 8 2.07 3 0.00 0 0.00 0051 Snow Country 0.60 1 0.00 0 1.15 1 0.00 0 0.00 0 0.00 0052 Prince Rupert 0.98 43 æ 1.29 20 1.25 31 4.10 19 0.44 2 1.24 1053 Upper Skeena 0.91 12 1.72 7 0.95 7 1.56 3 0.00 0 0.00 0054 Smithers 0.72 35 æ 0.74 13 1.11 30 1.74 10 1.55 8 1.71 3055 Burns Lake 1.38 34 1.25 12 1.29 18 3.19 5 2.30 6 2.35 1056 Nechako 1.03 49 1.74 26 1.82 48 3.18 15 0.79 4 1.51 3057 Prince George 1.16 308 æ 1.68 145 1.26 184 æ 1.07 51 1.20 34 1.16 16059 Peace River South 2.06 168 æ 2.28 64 0.67 31 æ 1.25 12 1.03 9 æ 1.24 5060 Peace River North 1.35 90 1.55 37 0.93 34 1.05 12 1.27 9 æ 1.30 4061 Greater Victoria 1.13 1,434 æ 0.88 229 1.02 791 æ 0.99 92 0.97 128 æ 1.39 31062 Sooke 0.94 207 æ 1.02 81 0.93 114 æ 0.79 24 0.99 23 æ 0.13 3063 Saanich 0.82 393 æ 0.52 60 0.81 238 æ 0.51 24 0.77 39 æ 1.15 8064 Gulf Islands 0.69 74 æ 0.82 23 0.68 43 æ 0.76 8 1.05 12 0.88 2065 Cowichan 0.96 274 æ 1.03 67 0.80 134 æ 1.00 26 1.09 33 2.39 12066 Lake Cowichan 1.31 33 æ 1.75 13 1.29 18 æ 2.96 6 1.84 5 æ 3.22 3067 Ladysmith 1.23 132 1.35 36 1.32 83 1.84 15 2.17 25 1.42 5068 Nanaimo 1.15 626 æ 1.26 176 1.17 379 æ 1.23 53 0.98 57 æ 0.87 15069 Qualicum 0.91 321 æ 0.90 75 0.91 192 æ 0.71 27 0.86 33 æ 1.00 7070 Alberni 1.57 221 æ 2.07 87 1.25 102 1.85 23 1.20 18 3.04 10071 Courtenay 0.97 335 æ 1.03 99 1.32 267 0.70 28 0.84 31 æ 1.53 9072 Campbell River 1.07 179 æ 1.19 68 1.08 101 æ 0.83 16 1.29 23 1.18 9075 Mission 1.19 159 æ 1.45 61 1.12 85 1.66 21 0.78 11 æ 0.79 5076 Agassiz - Harrison 1.00 45 æ 1.13 16 1.14 30 1.04 6 0.83 4 0.18 1077 Summerland 1.07 105 æ 0.99 20 0.96 58 0.27 5 1.07 11 0.97 1078 Enderby 1.20 46 æ 1.32 16 1.44 32 2.52 7 1.95 8 4.13 3080 Kitimat 1.48 42 1.30 15 1.10 17 1.41 5 0.66 2 0.37 2081 Fort Nelson 1.89 16 3.03 12 0.69 3 0.00 0 0.00 0 0.00 0083 Central Coast 1.15 4 3.79 2 1.61 3 1.75 1 0.00 0 0.00 0084 Vancouver Island West 0.83 5 1.50 4 0.32 1 0.22 1 0.00 0 0.00 0085 Vancouver Island North 1.35 41 æ 1.95 27 0.82 13 0.61 3 0.61 2 0.87 2087 Stikine 0.52 2 0.85 1 0.00 0 0.00 0 0.00 0 0.00 0088 Terrace 1.45 87 2.02 47 1.47 49 1.28 12 2.18 14 2.51 5092 Nisga'a 1.29 7 æ 1.29 3 1.98 6 8.12 3 0.00 0 0.00 0094 Telegraph Creek 0.00 0 æ 0.00 0 0.60 1 0.00 0 0.00 0 0.00 0161 Vancouver - City Centre 0.84 312 æ 0.80 98 0.92 197 æ 1.08 46 0.84 33 æ 0.73 13162 Vancouver - Dwntwn Eastside 1.22 240 æ 2.02 118 1.14 132 æ 1.70 39 0.85 18 æ 1.49 10163 Vancouver - North East 0.71 286 æ 0.66 71 0.90 214 æ 1.31 51 0.58 25 æ 0.93 5164 Vancouver - Westside 0.67 375 æ 0.45 65 0.75 253 æ 0.52 31 0.63 37 æ 0.22 3165 Vancouver - Midtown 0.74 217 æ 0.71 69 0.97 167 æ 0.71 23 0.73 23 1.05 5166 Vancouver - South 0.73 449 æ 0.79 104 0.79 290 æ 0.77 51 0.91 59 æ 1.33 16201 Surrey 1.06 1,142 æ 1.20 439 1.02 614 æ 1.14 156 1.12 129 æ 1.02 46202 South Surrey/White Rock 1.15 699 æ 0.69 87 1.07 395 0.92 42 1.13 72 æ 1.29 14998 Unknown LHA - 4 - 4 - 3 - 1 - 0 - 0
total 1.00 18,850 æ 1.00 5,264 1.00 11,058 æ 1.00 1,932 1.00 2,004 æ 1.00 544
APPen
dIx 3
taBle B - mortalItY StatIStICS BY loCal HealtH areaBR I t I S h Co L u M B I A , 2010 - 2014
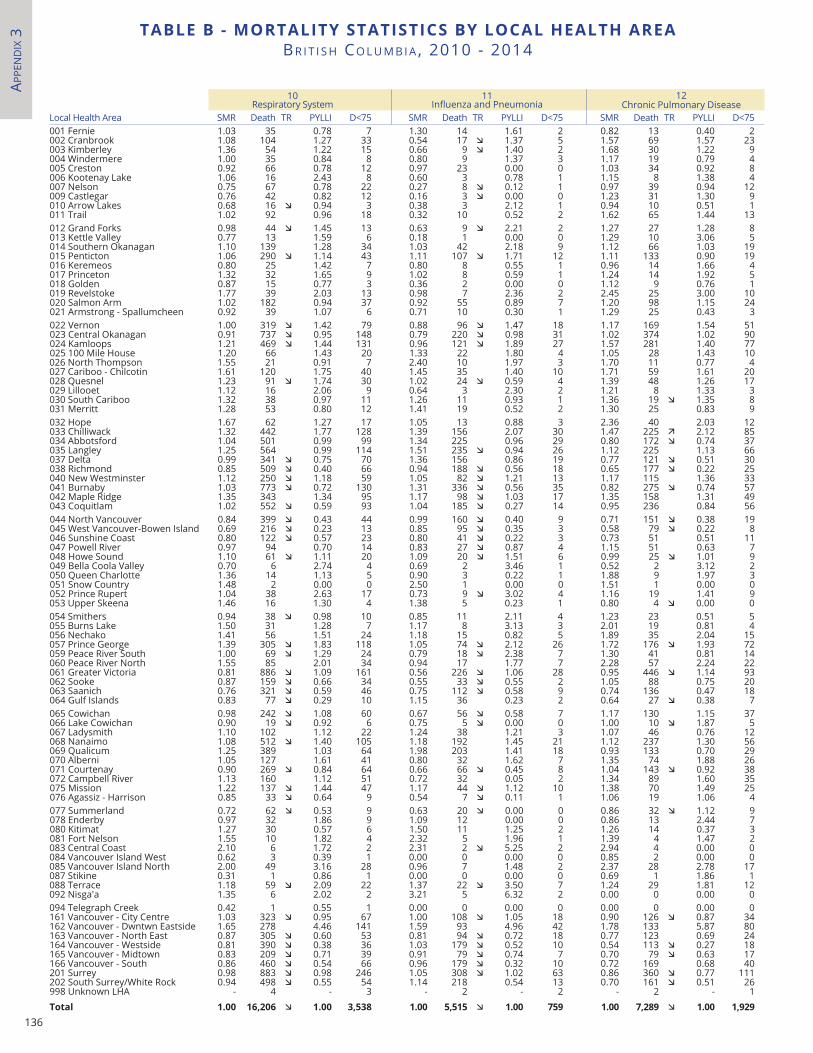
136
10Respiratory System
11Influenza and Pneumonia
12Chronic Pulmonary Disease
Local Health Area SMR Death TR PYLLI D<75 SMR Death TR PYLLI D<75 SMR Death TR PYLLI D<75001 Fernie 1.03 35 0.78 7 1.30 14 1.61 2 0.82 13 0.40 2002 Cranbrook 1.08 104 1.27 33 0.54 17 æ 1.37 5 1.57 69 1.57 23003 Kimberley 1.36 54 1.22 15 0.66 9 æ 1.40 2 1.68 30 1.22 9004 Windermere 1.00 35 0.84 8 0.80 9 1.37 3 1.17 19 0.79 4005 Creston 0.92 66 0.78 12 0.97 23 0.00 0 1.03 34 0.92 8006 Kootenay Lake 1.06 16 2.43 8 0.60 3 0.78 1 1.15 8 1.38 4007 Nelson 0.75 67 0.78 22 0.27 8 æ 0.12 1 0.97 39 0.94 12009 Castlegar 0.76 42 0.82 12 0.16 3 æ 0.00 0 1.23 31 1.30 9010 Arrow Lakes 0.68 16 æ 0.94 3 0.38 3 2.12 1 0.94 10 0.51 1011 Trail 1.02 92 0.96 18 0.32 10 0.52 2 1.62 65 1.44 13012 Grand Forks 0.98 44 æ 1.45 13 0.63 9 æ 2.21 2 1.27 27 1.28 8013 Kettle Valley 0.77 13 1.59 6 0.18 1 0.00 0 1.29 10 3.06 5014 Southern Okanagan 1.10 139 1.28 34 1.03 42 2.18 9 1.12 66 1.03 19015 Penticton 1.06 290 æ 1.14 43 1.11 107 æ 1.71 12 1.11 133 0.90 19016 Keremeos 0.80 25 1.42 7 0.80 8 0.55 1 0.96 14 1.66 4017 Princeton 1.32 32 1.65 9 1.02 8 0.59 1 1.24 14 1.92 5018 Golden 0.87 15 0.77 3 0.36 2 0.00 0 1.12 9 0.76 1019 Revelstoke 1.77 39 2.03 13 0.98 7 2.36 2 2.45 25 3.00 10020 Salmon Arm 1.02 182 0.94 37 0.92 55 0.89 7 1.20 98 1.15 24021 Armstrong - Spallumcheen 0.92 39 1.07 6 0.71 10 0.30 1 1.29 25 0.43 3022 Vernon 1.00 319 æ 1.42 79 0.88 96 æ 1.47 18 1.17 169 1.54 51023 Central Okanagan 0.91 737 æ 0.95 148 0.79 220 æ 0.98 31 1.02 374 1.02 90024 Kamloops 1.21 469 æ 1.44 131 0.96 121 æ 1.89 27 1.57 281 1.40 77025 100 Mile House 1.20 66 1.43 20 1.33 22 1.80 4 1.05 28 1.43 10026 North Thompson 1.55 21 0.91 7 2.40 10 1.97 3 1.70 11 0.77 4027 Cariboo - Chilcotin 1.61 120 1.75 40 1.45 35 1.40 10 1.71 59 1.61 20028 Quesnel 1.23 91 æ 1.74 30 1.02 24 æ 0.59 4 1.39 48 1.26 17029 Lillooet 1.12 16 2.06 9 0.64 3 2.30 2 1.21 8 1.33 3030 South Cariboo 1.32 38 0.97 11 1.26 11 0.93 1 1.36 19 æ 1.35 8031 Merritt 1.28 53 0.80 12 1.41 19 0.52 2 1.30 25 0.83 9032 Hope 1.67 62 1.27 17 1.05 13 0.88 3 2.36 40 2.03 12033 Chilliwack 1.32 442 1.77 128 1.39 156 2.07 30 1.47 225 ä 2.12 85034 Abbotsford 1.04 501 0.99 99 1.34 225 0.96 29 0.80 172 æ 0.74 37035 Langley 1.25 564 0.99 114 1.51 235 æ 0.94 26 1.12 225 1.13 66037 Delta 0.99 341 æ 0.75 70 1.36 156 0.86 19 0.77 121 æ 0.51 30038 Richmond 0.85 509 æ 0.40 66 0.94 188 æ 0.56 18 0.65 177 æ 0.22 25040 New Westminster 1.12 250 æ 1.18 59 1.05 82 æ 1.21 13 1.17 115 1.36 33041 Burnaby 1.03 773 æ 0.72 130 1.31 336 æ 0.56 35 0.82 275 æ 0.74 57042 Maple Ridge 1.35 343 1.34 95 1.17 98 æ 1.03 17 1.35 158 1.31 49043 Coquitlam 1.02 552 æ 0.59 93 1.04 185 æ 0.27 14 0.95 236 0.84 56044 North Vancouver 0.84 399 æ 0.43 44 0.99 160 æ 0.40 9 0.71 151 æ 0.38 19045 West Vancouver-Bowen Island 0.69 216 æ 0.23 13 0.85 95 æ 0.35 3 0.58 79 æ 0.22 8046 Sunshine Coast 0.80 122 æ 0.57 23 0.80 41 æ 0.22 3 0.73 51 0.51 11047 Powell River 0.97 94 0.70 14 0.83 27 æ 0.87 4 1.15 51 0.63 7048 Howe Sound 1.10 61 æ 1.11 20 1.09 20 æ 1.51 6 0.99 25 æ 1.01 9049 Bella Coola Valley 0.70 6 2.74 4 0.69 2 3.46 1 0.52 2 3.12 2050 Queen Charlotte 1.36 14 1.13 5 0.90 3 0.22 1 1.88 9 1.97 3051 Snow Country 1.48 2 0.00 0 2.50 1 0.00 0 1.51 1 0.00 0052 Prince Rupert 1.04 38 2.63 17 0.73 9 æ 3.02 4 1.16 19 1.41 9053 Upper Skeena 1.46 16 1.30 4 1.38 5 0.23 1 0.80 4 æ 0.00 0054 Smithers 0.94 38 æ 0.98 10 0.85 11 2.11 4 1.23 23 0.51 5055 Burns Lake 1.50 31 1.28 7 1.17 8 3.13 3 2.01 19 0.81 4056 Nechako 1.41 56 1.51 24 1.18 15 0.82 5 1.89 35 2.04 15057 Prince George 1.39 305 æ 1.83 118 1.05 74 æ 2.12 26 1.72 176 æ 1.93 72059 Peace River South 1.00 69 æ 1.29 24 0.79 18 æ 2.38 7 1.30 41 0.81 14060 Peace River North 1.55 85 2.01 34 0.94 17 1.77 7 2.28 57 2.24 22061 Greater Victoria 0.81 886 æ 1.09 161 0.56 226 æ 1.06 28 0.95 446 æ 1.14 93062 Sooke 0.87 159 æ 0.66 34 0.55 33 æ 0.55 2 1.05 88 0.75 20063 Saanich 0.76 321 æ 0.59 46 0.75 112 æ 0.58 9 0.74 136 0.47 18064 Gulf Islands 0.83 77 æ 0.29 10 1.15 36 0.23 2 0.64 27 æ 0.38 7065 Cowichan 0.98 242 æ 1.08 60 0.67 56 æ 0.58 7 1.17 130 1.15 37066 Lake Cowichan 0.90 19 æ 0.92 6 0.75 5 æ 0.00 0 1.00 10 æ 1.87 5067 Ladysmith 1.10 102 1.12 22 1.24 38 1.21 3 1.07 46 0.76 12068 Nanaimo 1.08 512 æ 1.40 105 1.18 192 1.45 21 1.12 237 1.30 56069 Qualicum 1.25 389 1.03 64 1.98 203 1.41 18 0.93 133 0.70 29070 Alberni 1.05 127 1.61 41 0.80 32 1.62 7 1.35 74 1.88 26071 Courtenay 0.90 269 æ 0.84 64 0.66 66 æ 0.45 8 1.04 143 æ 0.92 38072 Campbell River 1.13 160 1.12 51 0.72 32 0.05 2 1.34 89 1.60 35075 Mission 1.22 137 æ 1.44 47 1.17 44 æ 1.12 10 1.38 70 1.49 25076 Agassiz - Harrison 0.85 33 æ 0.64 9 0.54 7 æ 0.11 1 1.06 19 1.06 4077 Summerland 0.72 62 æ 0.53 9 0.63 20 æ 0.00 0 0.86 32 æ 1.12 9078 Enderby 0.97 32 1.86 9 1.09 12 0.00 0 0.86 13 2.44 7080 Kitimat 1.27 30 0.57 6 1.50 11 1.25 2 1.26 14 0.37 3081 Fort Nelson 1.55 10 1.82 4 2.32 5 1.96 1 1.39 4 1.47 2083 Central Coast 2.10 6 1.72 2 2.31 2 æ 5.25 2 2.94 4 0.00 0084 Vancouver Island West 0.62 3 0.39 1 0.00 0 0.00 0 0.85 2 0.00 0085 Vancouver Island North 2.00 49 3.16 28 0.96 7 1.48 2 2.37 28 2.78 17087 Stikine 0.31 1 0.86 1 0.00 0 0.00 0 0.69 1 1.86 1088 Terrace 1.18 59 æ 2.09 22 1.37 22 æ 3.50 7 1.24 29 1.81 12092 Nisga'a 1.35 6 2.02 2 3.21 5 6.32 2 0.00 0 0.00 0094 Telegraph Creek 0.42 1 0.55 1 0.00 0 0.00 0 0.00 0 0.00 0161 Vancouver - City Centre 1.03 323 æ 0.95 67 1.00 108 æ 1.05 18 0.90 126 æ 0.87 34162 Vancouver - Dwntwn Eastside 1.65 278 4.46 141 1.59 93 4.96 42 1.78 133 5.87 80163 Vancouver - North East 0.87 305 æ 0.60 53 0.81 94 æ 0.72 18 0.77 123 0.69 24164 Vancouver - Westside 0.81 390 æ 0.38 36 1.03 179 æ 0.52 10 0.54 113 æ 0.27 18165 Vancouver - Midtown 0.83 209 æ 0.71 39 0.91 79 æ 0.74 7 0.70 79 æ 0.63 17166 Vancouver - South 0.86 460 æ 0.54 66 0.96 179 æ 0.32 10 0.72 169 0.68 40201 Surrey 0.98 883 æ 0.98 246 1.05 308 æ 1.02 63 0.86 360 æ 0.77 111202 South Surrey/White Rock 0.94 498 æ 0.55 54 1.14 218 0.54 13 0.70 161 æ 0.51 26998 Unknown LHA - 4 - 3 - 2 - 2 - 2 - 1
total 1.00 16,206 æ 1.00 3,538 1.00 5,515 æ 1.00 759 1.00 7,289 æ 1.00 1,929
APPe
nd
Ix 3 taBle B - mortalItY StatIStICS BY loCal HealtH area
BR I t I S h Co L u M B I A , 2010 - 2014
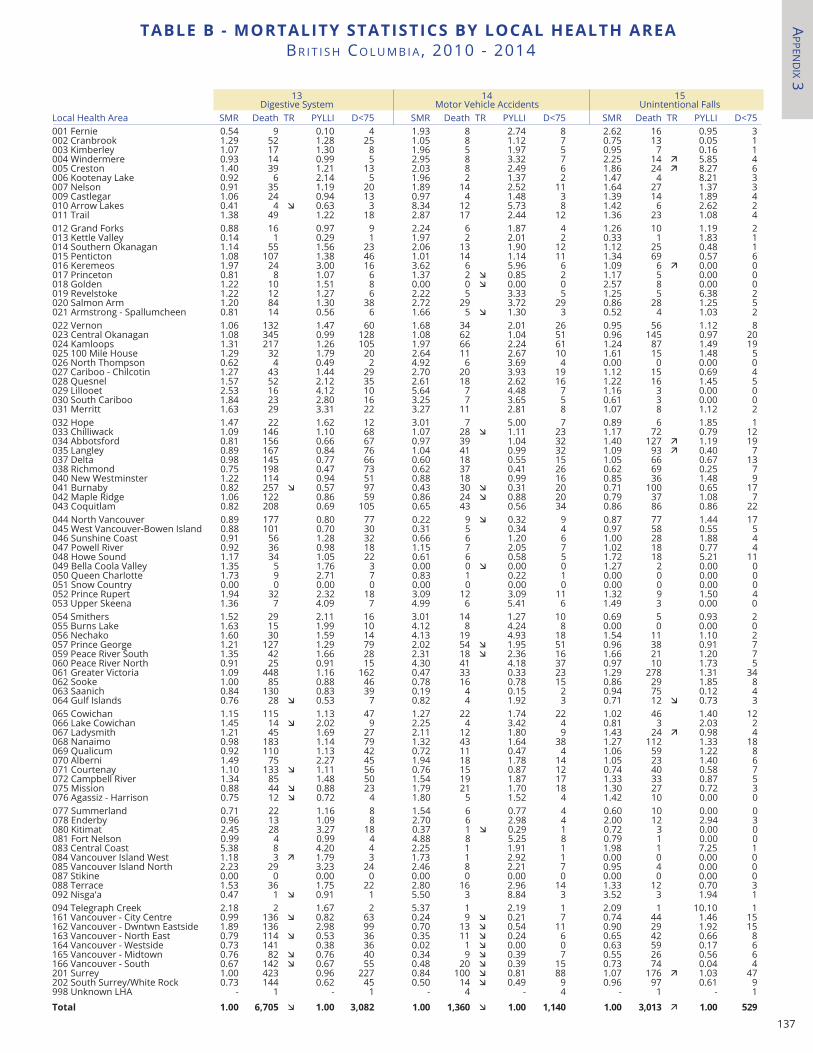
137
13Digestive System
14Motor Vehicle Accidents
15Unintentional Falls
Local Health Area SMR Death TR PYLLI D<75 SMR Death TR PYLLI D<75 SMR Death TR PYLLI D<75001 Fernie 0.54 9 0.10 4 1.93 8 2.74 8 2.62 16 0.95 3002 Cranbrook 1.29 52 1.28 25 1.05 8 1.12 7 0.75 13 0.05 1003 Kimberley 1.07 17 1.30 8 1.96 5 1.97 5 0.95 7 0.16 1004 Windermere 0.93 14 0.99 5 2.95 8 3.32 7 2.25 14 ä 5.85 4005 Creston 1.40 39 1.21 13 2.03 8 2.49 6 1.86 24 ä 8.27 6006 Kootenay Lake 0.92 6 2.14 5 1.96 2 1.37 2 1.47 4 8.21 3007 Nelson 0.91 35 1.19 20 1.89 14 2.52 11 1.64 27 1.37 3009 Castlegar 1.06 24 0.94 13 0.97 4 1.48 3 1.39 14 1.89 4010 Arrow Lakes 0.41 4 æ 0.63 3 8.34 12 5.73 8 1.42 6 2.62 2011 Trail 1.38 49 1.22 18 2.87 17 2.44 12 1.36 23 1.08 4012 Grand Forks 0.88 16 0.97 9 2.24 6 1.87 4 1.26 10 1.19 2013 Kettle Valley 0.14 1 0.29 1 1.97 2 2.01 2 0.33 1 1.83 1014 Southern Okanagan 1.14 55 1.56 23 2.06 13 1.90 12 1.12 25 0.48 1015 Penticton 1.08 107 1.38 46 1.01 14 1.14 11 1.34 69 0.57 6016 Keremeos 1.97 24 3.00 16 3.62 6 5.96 6 1.09 6 ä 0.00 0017 Princeton 0.81 8 1.07 6 1.37 2 æ 0.85 2 1.17 5 0.00 0018 Golden 1.22 10 1.51 8 0.00 0 æ 0.00 0 2.57 8 0.00 0019 Revelstoke 1.22 12 1.27 6 2.22 5 3.33 5 1.25 5 6.38 2020 Salmon Arm 1.20 84 1.30 38 2.72 29 3.72 29 0.86 28 1.25 5021 Armstrong - Spallumcheen 0.81 14 0.56 6 1.66 5 æ 1.30 3 0.52 4 1.03 2022 Vernon 1.06 132 1.47 60 1.68 34 2.01 26 0.95 56 1.12 8023 Central Okanagan 1.08 345 0.99 128 1.08 62 1.04 51 0.96 145 0.97 20024 Kamloops 1.31 217 1.26 105 1.97 66 2.24 61 1.24 87 1.49 19025 100 Mile House 1.29 32 1.79 20 2.64 11 2.67 10 1.61 15 1.48 5026 North Thompson 0.62 4 0.49 2 4.92 6 3.69 4 0.00 0 0.00 0027 Cariboo - Chilcotin 1.27 43 1.44 29 2.70 20 3.93 19 1.12 15 0.69 4028 Quesnel 1.57 52 2.12 35 2.61 18 2.62 16 1.22 16 1.45 5029 Lillooet 2.53 16 4.12 10 5.64 7 4.48 7 1.16 3 0.00 0030 South Cariboo 1.84 23 2.80 16 3.25 7 3.65 5 0.61 3 0.00 0031 Merritt 1.63 29 3.31 22 3.27 11 2.81 8 1.07 8 1.12 2032 Hope 1.47 22 1.62 12 3.01 7 5.00 7 0.89 6 1.85 1033 Chilliwack 1.09 146 1.10 68 1.07 28 æ 1.11 23 1.17 72 0.79 12034 Abbotsford 0.81 156 0.66 67 0.97 39 1.04 32 1.40 127 ä 1.19 19035 Langley 0.89 167 0.84 76 1.04 41 0.99 32 1.09 93 ä 0.40 7037 Delta 0.98 145 0.77 66 0.60 18 0.55 15 1.05 66 0.67 13038 Richmond 0.75 198 0.47 73 0.62 37 0.41 26 0.62 69 0.25 7040 New Westminster 1.22 114 0.94 51 0.88 18 0.99 16 0.85 36 1.48 9041 Burnaby 0.82 257 æ 0.57 97 0.43 30 æ 0.31 20 0.71 100 0.65 17042 Maple Ridge 1.06 122 0.86 59 0.86 24 æ 0.88 20 0.79 37 1.08 7043 Coquitlam 0.82 208 0.69 105 0.65 43 0.56 34 0.86 86 0.86 22044 North Vancouver 0.89 177 0.80 77 0.22 9 æ 0.32 9 0.87 77 1.44 17045 West Vancouver-Bowen Island 0.88 101 0.70 30 0.31 5 0.34 4 0.97 58 0.55 5046 Sunshine Coast 0.91 56 1.28 32 0.66 6 1.20 6 1.00 28 1.88 4047 Powell River 0.92 36 0.98 18 1.15 7 2.05 7 1.02 18 0.77 4048 Howe Sound 1.17 34 1.05 22 0.61 6 0.58 5 1.72 18 5.21 11049 Bella Coola Valley 1.35 5 1.76 3 0.00 0 æ 0.00 0 1.27 2 0.00 0050 Queen Charlotte 1.73 9 2.71 7 0.83 1 0.22 1 0.00 0 0.00 0051 Snow Country 0.00 0 0.00 0 0.00 0 0.00 0 0.00 0 0.00 0052 Prince Rupert 1.94 32 2.32 18 3.09 12 3.09 11 1.32 9 1.50 4053 Upper Skeena 1.36 7 4.09 7 4.99 6 5.41 6 1.49 3 0.00 0054 Smithers 1.52 29 2.11 16 3.01 14 1.27 10 0.69 5 0.93 2055 Burns Lake 1.63 15 1.99 10 4.12 8 4.24 8 0.00 0 0.00 0056 Nechako 1.60 30 1.59 14 4.13 19 4.93 18 1.54 11 1.10 2057 Prince George 1.21 127 1.29 79 2.02 54 æ 1.95 51 0.96 38 0.91 7059 Peace River South 1.35 42 1.66 28 2.31 18 æ 2.36 16 1.66 21 1.20 7060 Peace River North 0.91 25 0.91 15 4.30 41 4.18 37 0.97 10 1.73 5061 Greater Victoria 1.09 448 1.16 162 0.47 33 0.33 23 1.29 278 1.31 34062 Sooke 1.00 85 0.88 46 0.78 16 0.78 15 0.86 29 1.85 8063 Saanich 0.84 130 0.83 39 0.19 4 0.15 2 0.94 75 0.12 4064 Gulf Islands 0.76 28 æ 0.53 7 0.82 4 1.92 3 0.71 12 æ 0.73 3065 Cowichan 1.15 115 1.13 47 1.27 22 1.74 22 1.02 46 1.40 12066 Lake Cowichan 1.45 14 æ 2.02 9 2.25 4 3.42 4 0.81 3 2.03 2067 Ladysmith 1.21 45 1.69 27 2.11 12 1.80 9 1.43 24 ä 0.98 4068 Nanaimo 0.98 183 1.14 79 1.32 43 1.64 38 1.27 112 1.33 18069 Qualicum 0.92 110 1.13 42 0.72 11 0.47 4 1.06 59 1.22 8070 Alberni 1.49 75 2.27 45 1.94 18 1.78 14 1.05 23 1.40 6071 Courtenay 1.10 133 æ 1.11 56 0.76 15 0.87 12 0.74 40 0.58 7072 Campbell River 1.34 85 1.48 50 1.54 19 1.87 17 1.33 33 0.87 5075 Mission 0.88 44 æ 0.88 23 1.79 21 1.70 18 1.30 27 0.72 3076 Agassiz - Harrison 0.75 12 æ 0.72 4 1.80 5 1.52 4 1.42 10 0.00 0077 Summerland 0.71 22 1.16 8 1.54 6 0.77 4 0.60 10 0.00 0078 Enderby 0.96 13 1.09 8 2.70 6 2.98 4 2.00 12 2.94 3080 Kitimat 2.45 28 3.27 18 0.37 1 æ 0.29 1 0.72 3 0.00 0081 Fort Nelson 0.99 4 0.99 4 4.88 8 5.25 8 0.79 1 0.00 0083 Central Coast 5.38 8 4.20 4 2.25 1 1.91 1 1.98 1 7.25 1084 Vancouver Island West 1.18 3 ä 1.79 3 1.73 1 2.92 1 0.00 0 0.00 0085 Vancouver Island North 2.23 29 3.23 24 2.46 8 2.21 7 0.95 4 0.00 0087 Stikine 0.00 0 0.00 0 0.00 0 0.00 0 0.00 0 0.00 0088 Terrace 1.53 36 1.75 22 2.80 16 2.96 14 1.33 12 0.70 3092 Nisga'a 0.47 1 æ 0.91 1 5.50 3 8.84 3 3.52 3 1.94 1094 Telegraph Creek 2.18 2 1.67 2 5.37 1 2.19 1 2.09 1 10.10 1161 Vancouver - City Centre 0.99 136 æ 0.82 63 0.24 9 æ 0.21 7 0.74 44 1.46 15162 Vancouver - Dwntwn Eastside 1.89 136 2.98 99 0.70 13 æ 0.54 11 0.90 29 1.92 15163 Vancouver - North East 0.79 114 æ 0.53 36 0.35 11 æ 0.24 6 0.65 42 0.66 8164 Vancouver - Westside 0.73 141 0.38 36 0.02 1 æ 0.00 0 0.63 59 0.17 6165 Vancouver - Midtown 0.76 82 æ 0.76 40 0.34 9 æ 0.39 7 0.55 26 0.56 6166 Vancouver - South 0.67 142 æ 0.67 55 0.48 20 æ 0.39 15 0.73 74 0.04 4201 Surrey 1.00 423 0.96 227 0.84 100 æ 0.81 88 1.07 176 ä 1.03 47202 South Surrey/White Rock 0.73 144 0.62 45 0.50 14 æ 0.49 9 0.96 97 0.61 9998 Unknown LHA - 1 - 1 - 4 - 4 - 1 - 1
total 1.00 6,705 æ 1.00 3,082 1.00 1,360 æ 1.00 1,140 1.00 3,013 ä 1.00 529
APPen
dIx 3
taBle B - mortalItY StatIStICS BY loCal HealtH area BR I t I S h Co L u M B I A , 2010 - 2014
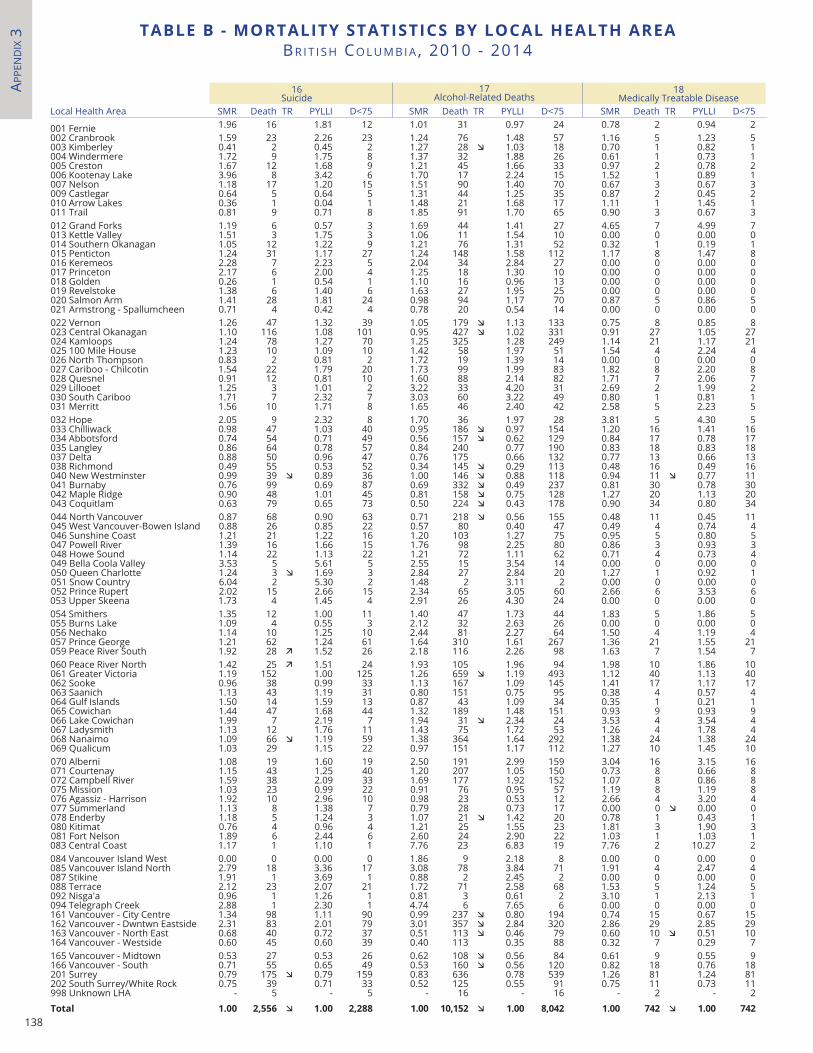
138
APPe
nd
Ix 3 taBle B - mortalItY StatIStICS BY loCal HealtH area
BR I t I S h Co L u M B I A , 2010 - 2014
16Suicide
17Alcohol-Related Deaths
18Medically Treatable Disease
Local Health Area SMR Death TR PYLLI D<75 SMR Death TR PYLLI D<75 SMR Death TR PYLLI D<75
001 Fernie 1.96 16 1.81 12 1.01 31 0.97 24 0.78 2 0.94 2002 Cranbrook 1.59 23 2.26 23 1.24 76 1.48 57 1.16 5 1.23 5003 Kimberley 0.41 2 0.45 2 1.27 28 æ 1.03 18 0.70 1 0.82 1004 Windermere 1.72 9 1.75 8 1.37 32 1.88 26 0.61 1 0.73 1005 Creston 1.67 12 1.68 9 1.21 45 1.66 33 0.97 2 0.78 2006 Kootenay Lake 3.96 8 3.42 6 1.70 17 2.24 15 1.52 1 0.89 1007 Nelson 1.18 17 1.20 15 1.51 90 1.40 70 0.67 3 0.67 3009 Castlegar 0.64 5 0.64 5 1.31 44 1.25 35 0.87 2 0.45 2010 Arrow Lakes 0.36 1 0.04 1 1.48 21 1.68 17 1.11 1 1.45 1011 Trail 0.81 9 0.71 8 1.85 91 1.70 65 0.90 3 0.67 3012 Grand Forks 1.19 6 0.57 3 1.69 44 1.41 27 4.65 7 4.99 7013 Kettle Valley 1.51 3 1.75 3 1.06 11 1.54 10 0.00 0 0.00 0014 Southern Okanagan 1.05 12 1.22 9 1.21 76 1.31 52 0.32 1 0.19 1015 Penticton 1.24 31 1.17 27 1.24 148 1.58 112 1.17 8 1.47 8016 Keremeos 2.28 7 2.23 5 2.04 34 2.84 27 0.00 0 0.00 0017 Princeton 2.17 6 2.00 4 1.25 18 1.30 10 0.00 0 0.00 0018 Golden 0.26 1 0.54 1 1.10 16 0.96 13 0.00 0 0.00 0019 Revelstoke 1.38 6 1.40 6 1.63 27 1.95 25 0.00 0 0.00 0020 Salmon Arm 1.41 28 1.81 24 0.98 94 1.17 70 0.87 5 0.86 5021 Armstrong - Spallumcheen 0.71 4 0.42 4 0.78 20 0.54 14 0.00 0 0.00 0022 Vernon 1.26 47 1.32 39 1.05 179 æ 1.13 133 0.75 8 0.85 8023 Central Okanagan 1.10 116 1.08 101 0.95 427 æ 1.02 331 0.91 27 1.05 27024 Kamloops 1.24 78 1.27 70 1.25 325 1.28 249 1.14 21 1.17 21025 100 Mile House 1.23 10 1.09 10 1.42 58 1.97 51 1.54 4 2.24 4026 North Thompson 0.83 2 0.81 2 1.72 19 1.39 14 0.00 0 0.00 0027 Cariboo - Chilcotin 1.54 22 1.79 20 1.73 99 1.99 83 1.82 8 2.20 8028 Quesnel 0.91 12 0.81 10 1.60 88 2.14 82 1.71 7 2.06 7029 Lillooet 1.25 3 1.01 2 3.22 33 4.20 31 2.69 2 1.99 2030 South Cariboo 1.71 7 2.32 7 3.03 60 3.22 49 0.80 1 0.81 1031 Merritt 1.56 10 1.71 8 1.65 46 2.40 42 2.58 5 2.23 5032 Hope 2.05 9 2.32 8 1.70 36 1.97 28 3.81 5 4.30 5033 Chilliwack 0.98 47 1.03 40 0.95 186 æ 0.97 154 1.20 16 1.41 16034 Abbotsford 0.74 54 0.71 49 0.56 157 æ 0.62 129 0.84 17 0.78 17035 Langley 0.86 64 0.78 57 0.84 240 0.77 190 0.83 18 0.83 18037 Delta 0.88 50 0.96 47 0.76 175 0.66 132 0.77 13 0.66 13038 Richmond 0.49 55 0.53 52 0.34 145 æ 0.29 113 0.48 16 0.49 16040 New Westminster 0.99 39 æ 0.89 36 1.00 146 æ 0.88 118 0.94 11 æ 0.77 11041 Burnaby 0.76 99 0.69 87 0.69 332 æ 0.49 237 0.81 30 0.78 30042 Maple Ridge 0.90 48 1.01 45 0.81 158 æ 0.75 128 1.27 20 1.13 20043 Coquitlam 0.63 79 0.65 73 0.50 224 æ 0.43 178 0.90 34 0.80 34044 North Vancouver 0.87 68 0.90 63 0.71 218 æ 0.56 155 0.48 11 0.45 11045 West Vancouver-Bowen Island 0.88 26 0.85 22 0.57 80 0.40 47 0.49 4 0.74 4046 Sunshine Coast 1.21 21 1.22 16 1.20 103 1.27 75 0.95 5 0.80 5047 Powell River 1.39 16 1.66 15 1.76 98 2.25 80 0.86 3 0.93 3048 Howe Sound 1.14 22 1.13 22 1.21 72 1.11 62 0.71 4 0.73 4049 Bella Coola Valley 3.53 5 5.61 5 2.55 15 3.54 14 0.00 0 0.00 0050 Queen Charlotte 1.24 3 æ 1.69 3 2.84 27 2.84 20 1.27 1 0.92 1051 Snow Country 6.04 2 5.30 2 1.48 2 3.11 2 0.00 0 0.00 0052 Prince Rupert 2.02 15 2.66 15 2.34 65 3.05 60 2.66 6 3.53 6053 Upper Skeena 1.73 4 1.45 4 2.91 26 4.30 24 0.00 0 0.00 0054 Smithers 1.35 12 1.00 11 1.40 47 1.73 44 1.83 5 1.86 5055 Burns Lake 1.09 4 0.55 3 2.12 32 2.63 26 0.00 0 0.00 0056 Nechako 1.14 10 1.25 10 2.44 81 2.27 64 1.50 4 1.19 4057 Prince George 1.21 62 1.24 61 1.64 310 1.61 267 1.36 21 1.55 21059 Peace River South 1.92 28 ä 1.52 26 2.18 116 2.26 98 1.63 7 1.54 7060 Peace River North 1.42 25 ä 1.51 24 1.93 105 1.96 94 1.98 10 1.86 10061 Greater Victoria 1.19 152 1.00 125 1.26 659 æ 1.19 493 1.12 40 1.13 40062 Sooke 0.96 38 0.99 33 1.13 167 1.09 145 1.41 17 1.17 17063 Saanich 1.13 43 1.19 31 0.80 151 0.75 95 0.38 4 0.57 4064 Gulf Islands 1.50 14 1.59 13 0.87 43 1.09 34 0.35 1 0.21 1065 Cowichan 1.44 47 1.68 44 1.32 189 1.48 151 0.93 9 0.93 9066 Lake Cowichan 1.99 7 2.19 7 1.94 31 æ 2.34 24 3.53 4 3.54 4067 Ladysmith 1.13 12 1.76 11 1.43 75 1.72 53 1.26 4 1.78 4068 Nanaimo 1.09 66 æ 1.19 59 1.38 364 1.64 292 1.38 24 1.38 24069 Qualicum 1.03 29 1.15 22 0.97 151 1.17 112 1.27 10 1.45 10070 Alberni 1.08 19 1.60 19 2.50 191 2.99 159 3.04 16 3.15 16071 Courtenay 1.15 43 1.25 40 1.20 207 1.05 150 0.73 8 0.66 8072 Campbell River 1.59 38 2.09 33 1.69 177 1.92 152 1.07 8 0.86 8075 Mission 1.03 23 0.99 22 0.91 76 0.95 57 1.19 8 1.19 8076 Agassiz - Harrison 1.92 10 2.96 10 0.98 23 0.53 12 2.66 4 3.20 4077 Summerland 1.13 8 1.38 7 0.79 28 0.73 17 0.00 0 æ 0.00 0078 Enderby 1.18 5 1.24 3 1.07 21 æ 1.42 20 0.78 1 0.43 1080 Kitimat 0.76 4 0.96 4 1.21 25 1.55 23 1.81 3 1.90 3081 Fort Nelson 1.89 6 2.44 6 2.60 24 2.90 22 1.03 1 1.03 1083 Central Coast 1.17 1 1.10 1 7.76 23 6.83 19 7.76 2 10.27 2084 Vancouver Island West 0.00 0 0.00 0 1.86 9 2.18 8 0.00 0 0.00 0085 Vancouver Island North 2.79 18 3.36 17 3.08 78 3.84 71 1.91 4 2.47 4087 Stikine 1.91 1 3.69 1 0.88 2 2.45 2 0.00 0 0.00 0088 Terrace 2.12 23 2.07 21 1.72 71 2.58 68 1.53 5 1.24 5092 Nisga'a 0.96 1 1.26 1 0.81 3 0.61 2 3.10 1 2.13 1094 Telegraph Creek 2.88 1 2.30 1 4.74 6 7.65 6 0.00 0 0.00 0161 Vancouver - City Centre 1.34 98 1.11 90 0.99 237 æ 0.80 194 0.74 15 0.67 15162 Vancouver - Dwntwn Eastside 2.31 83 2.01 79 3.01 357 æ 2.84 320 2.86 29 2.85 29163 Vancouver - North East 0.68 40 0.72 37 0.51 113 æ 0.46 79 0.60 10 æ 0.51 10164 Vancouver - Westside 0.60 45 0.60 39 0.40 113 0.35 88 0.32 7 0.29 7165 Vancouver - Midtown 0.53 27 0.53 26 0.62 108 æ 0.56 84 0.61 9 0.55 9166 Vancouver - South 0.71 55 0.65 49 0.53 160 æ 0.56 120 0.82 18 0.76 18201 Surrey 0.79 175 æ 0.79 159 0.83 636 0.78 539 1.26 81 1.24 81202 South Surrey/White Rock 0.75 39 0.71 33 0.52 125 0.55 91 0.75 11 0.73 11998 Unknown LHA - 5 - 5 - 16 - 16 - 2 - 2
total 1.00 2,556 æ 1.00 2,288 1.00 10,152 æ 1.00 8,042 1.00 742 æ 1.00 742
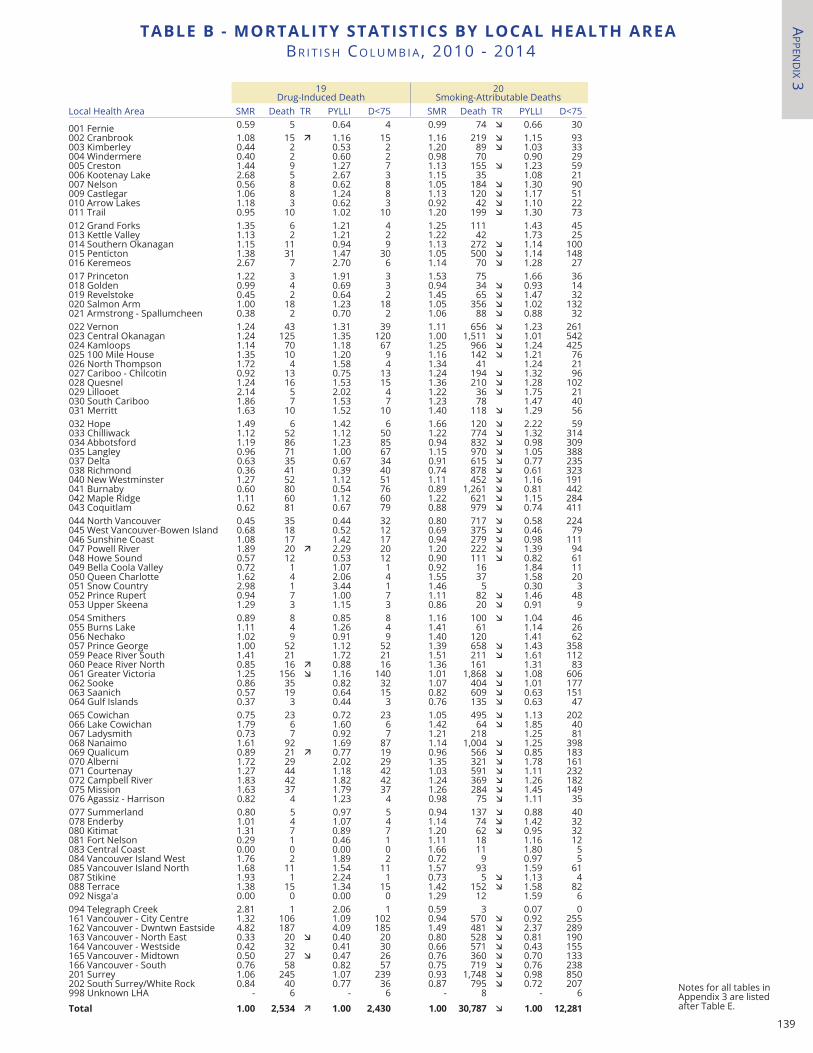
139
19Drug-Induced Death
20Smoking-Attributable Deaths
Local Health Area SMR Death TR PYLLI D<75 SMR Death TR PYLLI D<75
001 Fernie 0.59 5 0.64 4 0.99 74 æ 0.66 30002 Cranbrook 1.08 15 ä 1.16 15 1.16 219 æ 1.15 93003 Kimberley 0.44 2 0.53 2 1.20 89 æ 1.03 33004 Windermere 0.40 2 0.60 2 0.98 70 0.90 29005 Creston 1.44 9 1.27 7 1.13 155 æ 1.23 59006 Kootenay Lake 2.68 5 2.67 3 1.15 35 1.08 21007 Nelson 0.56 8 0.62 8 1.05 184 æ 1.30 90009 Castlegar 1.06 8 1.24 8 1.13 120 æ 1.17 51010 Arrow Lakes 1.18 3 0.62 3 0.92 42 æ 1.10 22011 Trail 0.95 10 1.02 10 1.20 199 æ 1.30 73012 Grand Forks 1.35 6 1.21 4 1.25 111 1.43 45013 Kettle Valley 1.13 2 1.21 2 1.22 42 1.73 25014 Southern Okanagan 1.15 11 0.94 9 1.13 272 æ 1.14 100015 Penticton 1.38 31 1.47 30 1.05 500 æ 1.14 148016 Keremeos 2.67 7 2.70 6 1.14 70 æ 1.28 27017 Princeton 1.22 3 1.91 3 1.53 75 1.66 36018 Golden 0.99 4 0.69 3 0.94 34 æ 0.93 14019 Revelstoke 0.45 2 0.64 2 1.45 65 æ 1.47 32020 Salmon Arm 1.00 18 1.23 18 1.05 356 æ 1.02 132021 Armstrong - Spallumcheen 0.38 2 0.70 2 1.06 88 æ 0.88 32022 Vernon 1.24 43 1.31 39 1.11 656 æ 1.23 261023 Central Okanagan 1.24 125 1.35 120 1.00 1,511 æ 1.01 542024 Kamloops 1.14 70 1.18 67 1.25 966 æ 1.24 425025 100 Mile House 1.35 10 1.20 9 1.16 142 æ 1.21 76026 North Thompson 1.72 4 1.58 4 1.34 41 1.24 21027 Cariboo - Chilcotin 0.92 13 0.75 13 1.24 194 æ 1.32 96028 Quesnel 1.24 16 1.53 15 1.36 210 æ 1.28 102029 Lillooet 2.14 5 2.02 4 1.22 36 æ 1.75 21030 South Cariboo 1.86 7 1.53 7 1.23 78 1.47 40031 Merritt 1.63 10 1.52 10 1.40 118 æ 1.29 56032 Hope 1.49 6 1.42 6 1.66 120 æ 2.22 59033 Chilliwack 1.12 52 1.12 50 1.22 774 æ 1.32 314034 Abbotsford 1.19 86 1.23 85 0.94 832 æ 0.98 309035 Langley 0.96 71 1.00 67 1.15 970 æ 1.05 388037 Delta 0.63 35 0.67 34 0.91 615 æ 0.77 235038 Richmond 0.36 41 0.39 40 0.74 878 æ 0.61 323040 New Westminster 1.27 52 1.12 51 1.11 452 æ 1.16 191041 Burnaby 0.60 80 0.54 76 0.89 1,261 æ 0.81 442042 Maple Ridge 1.11 60 1.12 60 1.22 621 æ 1.15 284043 Coquitlam 0.62 81 0.67 79 0.88 979 æ 0.74 411044 North Vancouver 0.45 35 0.44 32 0.80 717 æ 0.58 224045 West Vancouver-Bowen Island 0.68 18 0.52 12 0.69 375 æ 0.46 79046 Sunshine Coast 1.08 17 1.42 17 0.94 279 æ 0.98 111047 Powell River 1.89 20 ä 2.29 20 1.20 222 æ 1.39 94048 Howe Sound 0.57 12 0.53 12 0.90 111 æ 0.82 61049 Bella Coola Valley 0.72 1 1.07 1 0.92 16 1.84 11050 Queen Charlotte 1.62 4 2.06 4 1.55 37 1.58 20051 Snow Country 2.98 1 3.44 1 1.46 5 0.30 3052 Prince Rupert 0.94 7 1.00 7 1.11 82 æ 1.46 48053 Upper Skeena 1.29 3 1.15 3 0.86 20 æ 0.91 9054 Smithers 0.89 8 0.85 8 1.16 100 æ 1.04 46055 Burns Lake 1.11 4 1.26 4 1.41 61 1.14 26056 Nechako 1.02 9 0.91 9 1.40 120 1.41 62057 Prince George 1.00 52 1.12 52 1.39 658 æ 1.43 358059 Peace River South 1.41 21 1.72 21 1.51 211 æ 1.61 112060 Peace River North 0.85 16 ä 0.88 16 1.36 161 1.31 83061 Greater Victoria 1.25 156 æ 1.16 140 1.01 1,868 æ 1.08 606062 Sooke 0.86 35 0.82 32 1.07 404 æ 1.01 177063 Saanich 0.57 19 0.64 15 0.82 609 æ 0.63 151064 Gulf Islands 0.37 3 0.44 3 0.76 135 æ 0.63 47065 Cowichan 0.75 23 0.72 23 1.05 495 æ 1.13 202066 Lake Cowichan 1.79 6 1.60 6 1.42 64 æ 1.85 40067 Ladysmith 0.73 7 0.92 7 1.21 218 1.25 81068 Nanaimo 1.61 92 1.69 87 1.14 1,004 æ 1.25 398069 Qualicum 0.89 21 ä 0.77 19 0.96 566 æ 0.85 183070 Alberni 1.72 29 2.02 29 1.35 321 æ 1.78 161071 Courtenay 1.27 44 1.18 42 1.03 591 æ 1.11 232072 Campbell River 1.83 42 1.82 42 1.24 369 æ 1.26 182075 Mission 1.63 37 1.79 37 1.26 284 æ 1.45 149076 Agassiz - Harrison 0.82 4 1.23 4 0.98 75 æ 1.11 35077 Summerland 0.80 5 0.97 5 0.94 137 æ 0.88 40078 Enderby 1.01 4 1.07 4 1.14 74 æ 1.42 32080 Kitimat 1.31 7 0.89 7 1.20 62 æ 0.95 32081 Fort Nelson 0.29 1 0.46 1 1.11 18 1.16 12083 Central Coast 0.00 0 0.00 0 1.66 11 1.80 5084 Vancouver Island West 1.76 2 1.89 2 0.72 9 0.97 5085 Vancouver Island North 1.68 11 1.54 11 1.57 93 1.59 61087 Stikine 1.93 1 2.24 1 0.73 5 æ 1.13 4088 Terrace 1.38 15 1.34 15 1.42 152 æ 1.58 82092 Nisga'a 0.00 0 0.00 0 1.29 12 1.59 6094 Telegraph Creek 2.81 1 2.06 1 0.59 3 0.07 0161 Vancouver - City Centre 1.32 106 1.09 102 0.94 570 æ 0.92 255162 Vancouver - Dwntwn Eastside 4.82 187 4.09 185 1.49 481 æ 2.37 289163 Vancouver - North East 0.33 20 æ 0.40 20 0.80 528 æ 0.81 190164 Vancouver - Westside 0.42 32 0.41 30 0.66 571 æ 0.43 155165 Vancouver - Midtown 0.50 27 æ 0.47 26 0.76 360 æ 0.70 133166 Vancouver - South 0.76 58 0.82 57 0.75 719 æ 0.76 238201 Surrey 1.06 245 1.07 239 0.93 1,748 æ 0.98 850202 South Surrey/White Rock 0.84 40 0.77 36 0.87 795 æ 0.72 207998 Unknown LHA - 6 - 6 - 8 - 6
total 1.00 2,534 ä 1.00 2,430 1.00 30,787 æ 1.00 12,281
APPen
dIx 3
taBle B - mortalItY StatIStICS BY loCal HealtH areaBR I t I S h Co L u M B I A , 2010 - 2014
taBle B - mortalItY StatIStICS BY loCal HealtH area BR I t I S h Co L u M B I A , 2010 - 2014
Notes for all tables in Appendix 3 are listed after Table E.
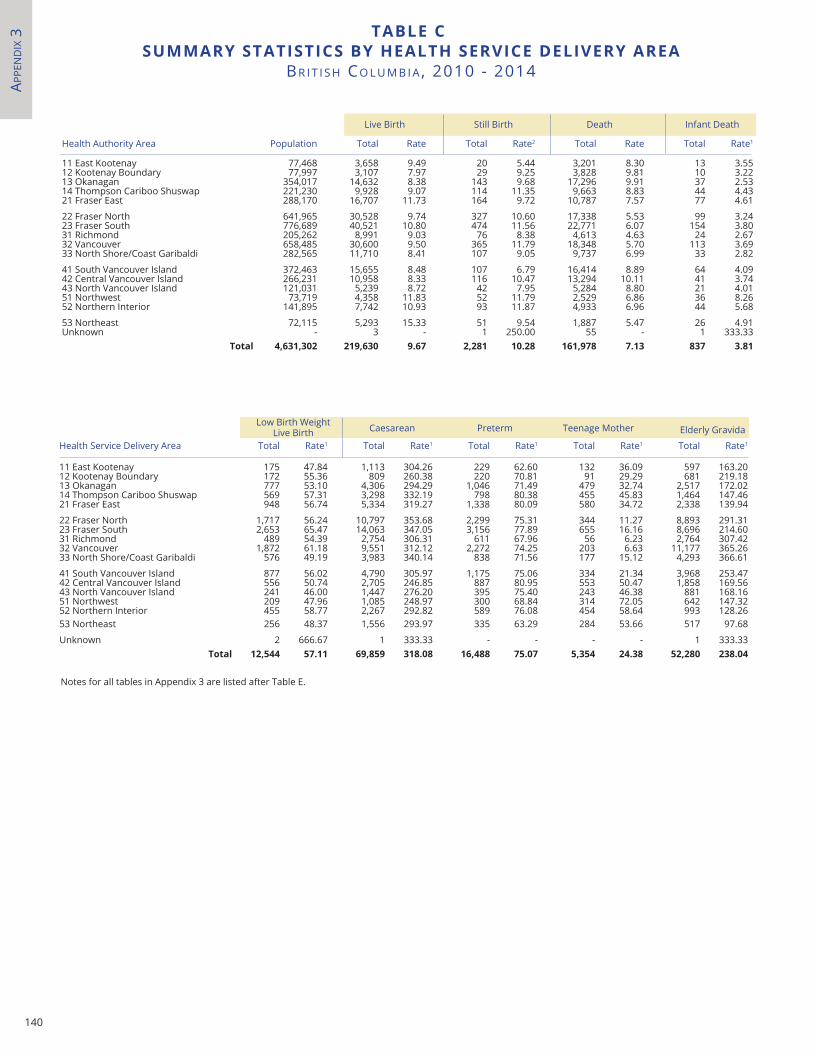
140
APPe
nd
Ix 3 taBle C
SUmmarY StatIStICS BY HealtH SerVICe DelIVerY area BR I t I S h Co L u M B I A , 2010 - 2014
Health Authority Area Population Total Rate Total Rate2 Total Rate Total Rate1
11 East Kootenay 77,468 3,658 9.49 20 5.44 3,201 8.30 13 3.5512 Kootenay Boundary 77,997 3,107 7.97 29 9.25 3,828 9.81 10 3.2213 Okanagan 354,017 14,632 8.38 143 9.68 17,296 9.91 37 2.5314 Thompson Cariboo Shuswap 221,230 9,928 9.07 114 11.35 9,663 8.83 44 4.4321 Fraser East 288,170 16,707 11.73 164 9.72 10,787 7.57 77 4.61
22 Fraser North 641,965 30,528 9.74 327 10.60 17,338 5.53 99 3.2423 Fraser South 776,689 40,521 10.80 474 11.56 22,771 6.07 154 3.8031 Richmond 205,262 8,991 9.03 76 8.38 4,613 4.63 24 2.6732 Vancouver 658,485 30,600 9.50 365 11.79 18,348 5.70 113 3.6933 North Shore/Coast Garibaldi 282,565 11,710 8.41 107 9.05 9,737 6.99 33 2.82
41 South Vancouver Island 372,463 15,655 8.48 107 6.79 16,414 8.89 64 4.0942 Central Vancouver Island 266,231 10,958 8.33 116 10.47 13,294 10.11 41 3.7443 North Vancouver Island 121,031 5,239 8.72 42 7.95 5,284 8.80 21 4.0151 Northwest 73,719 4,358 11.83 52 11.79 2,529 6.86 36 8.2652 Northern Interior 141,895 7,742 10.93 93 11.87 4,933 6.96 44 5.68
53 Northeast 72,115 5,293 15.33 51 9.54 1,887 5.47 26 4.91Unknown - 3 - 1 250.00 55 - 1 333.33
total 4,631,302 219,630 9.67 2,281 10.28 161,978 7.13 837 3.81
Live Birth Still Birth Death Infant Death
Health Service Delivery Area Total Rate1 Total Rate1 Total Rate1 Total Rate1 Total Rate1
11 East Kootenay 175 47.84 1,113 304.26 229 62.60 132 36.09 597 163.2012 Kootenay Boundary 172 55.36 809 260.38 220 70.81 91 29.29 681 219.1813 Okanagan 777 53.10 4,306 294.29 1,046 71.49 479 32.74 2,517 172.0214 Thompson Cariboo Shuswap 569 57.31 3,298 332.19 798 80.38 455 45.83 1,464 147.4621 Fraser East 948 56.74 5,334 319.27 1,338 80.09 580 34.72 2,338 139.94
22 Fraser North 1,717 56.24 10,797 353.68 2,299 75.31 344 11.27 8,893 291.3123 Fraser South 2,653 65.47 14,063 347.05 3,156 77.89 655 16.16 8,696 214.6031 Richmond 489 54.39 2,754 306.31 611 67.96 56 6.23 2,764 307.4232 Vancouver 1,872 61.18 9,551 312.12 2,272 74.25 203 6.63 11,177 365.2633 North Shore/Coast Garibaldi 576 49.19 3,983 340.14 838 71.56 177 15.12 4,293 366.61
41 South Vancouver Island 877 56.02 4,790 305.97 1,175 75.06 334 21.34 3,968 253.4742 Central Vancouver Island 556 50.74 2,705 246.85 887 80.95 553 50.47 1,858 169.5643 North Vancouver Island 241 46.00 1,447 276.20 395 75.40 243 46.38 881 168.1651 Northwest 209 47.96 1,085 248.97 300 68.84 314 72.05 642 147.3252 Northern Interior 455 58.77 2,267 292.82 589 76.08 454 58.64 993 128.2653 Northeast 256 48.37 1,556 293.97 335 63.29 284 53.66 517 97.68
Unknown 2 666.67 1 333.33 - - - - 1 333.33total 12,544 57.11 69,859 318.08 16,488 75.07 5,354 24.38 52,280 238.04
Low Birth WeightLive Birth Caesarean Preterm Teenage Mother Elderly Gravida
Notes for all tables in Appendix 3 are listed after Table E.
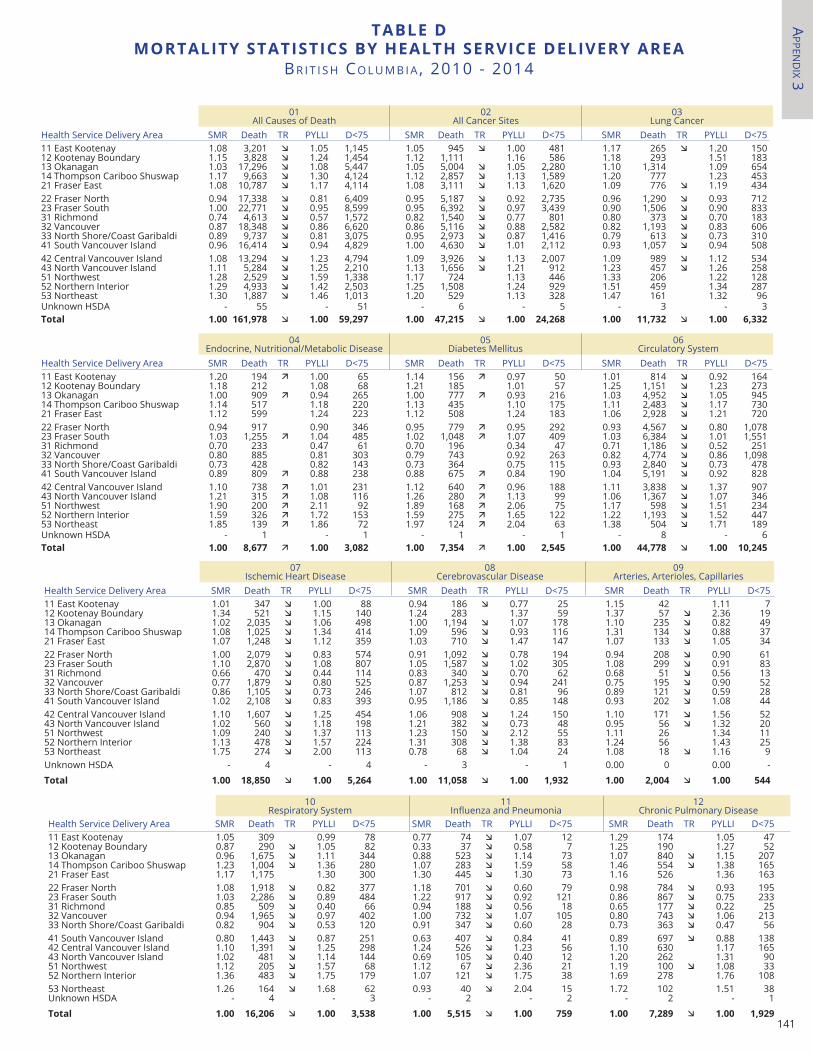
141
APPen
dIx 3
taBle C SUmmarY StatIStICS BY HealtH SerVICe DelIVerY area
BR I t I S h Co L u M B I A , 2010 - 2014
taBle DmortalItY StatIStICS BY HealtH SerVICe DelIVerY area
BR I t I S h Co L u M B I A , 2010 - 2014
Health Service Delivery Area SMR Death TR PYLLI D<75 SMR Death TR PYLLI D<75 SMR Death TR PYLLI D<7511 East Kootenay 1.08 3,201 æ 1.05 1,145 1.05 945 æ 1.00 481 1.17 265 æ 1.20 150 12 Kootenay Boundary 1.15 3,828 æ 1.24 1,454 1.12 1,111 1.16 586 1.18 293 1.51 183 13 Okanagan 1.03 17,296 æ 1.08 5,447 1.05 5,004 æ 1.05 2,280 1.10 1,314 1.09 654 14 Thompson Cariboo Shuswap 1.17 9,663 æ 1.30 4,124 1.12 2,857 æ 1.13 1,589 1.20 777 1.23 453 21 Fraser East 1.08 10,787 æ 1.17 4,114 1.08 3,111 æ 1.13 1,620 1.09 776 æ 1.19 434 22 Fraser North 0.94 17,338 æ 0.81 6,409 0.95 5,187 æ 0.92 2,735 0.96 1,290 æ 0.93 712 23 Fraser South 1.00 22,771 æ 0.95 8,599 0.95 6,392 æ 0.97 3,439 0.90 1,506 æ 0.90 833 31 Richmond 0.74 4,613 æ 0.57 1,572 0.82 1,540 æ 0.77 801 0.80 373 æ 0.70 183 32 Vancouver 0.87 18,348 æ 0.86 6,620 0.86 5,116 æ 0.88 2,582 0.82 1,193 æ 0.83 606 33 North Shore/Coast Garibaldi 0.89 9,737 æ 0.81 3,075 0.95 2,973 æ 0.87 1,416 0.79 613 æ 0.73 310 41 South Vancouver Island 0.96 16,414 æ 0.94 4,829 1.00 4,630 æ 1.01 2,112 0.93 1,057 æ 0.94 508 42 Central Vancouver Island 1.08 13,294 æ 1.23 4,794 1.09 3,926 æ 1.13 2,007 1.09 989 æ 1.12 534 43 North Vancouver Island 1.11 5,284 æ 1.25 2,210 1.13 1,656 æ 1.21 912 1.23 457 æ 1.26 258 51 Northwest 1.28 2,529 æ 1.59 1,338 1.17 724 1.13 446 1.33 206 1.22 128 52 Northern Interior 1.29 4,933 æ 1.42 2,503 1.25 1,508 1.24 929 1.51 459 1.34 287 53 Northeast 1.30 1,887 æ 1.46 1,013 1.20 529 1.13 328 1.47 161 1.32 96 Unknown HSDA - 55 - 51 - 6 - 5 - 3 - 3 total 1.00 161,978 æ 1.00 59,297 1.00 47,215 æ 1.00 24,268 1.00 11,732 æ 1.00 6,332
01All Causes of Death
02All Cancer Sites
03Lung Cancer
Health Service Delivery Area SMR Death TR PYLLI D<75 SMR Death TR PYLLI D<75 SMR Death TR PYLLI D<7511 East Kootenay 1.20 194 ä 1.00 65 1.14 156 ä 0.97 50 1.01 814 æ 0.92 164 12 Kootenay Boundary 1.18 212 1.08 68 1.21 185 1.01 57 1.25 1,151 æ 1.23 273 13 Okanagan 1.00 909 ä 0.94 265 1.00 777 ä 0.93 216 1.03 4,952 æ 1.05 945 14 Thompson Cariboo Shuswap 1.14 517 1.18 220 1.13 435 1.10 175 1.11 2,483 æ 1.17 730 21 Fraser East 1.12 599 1.24 223 1.12 508 1.24 183 1.06 2,928 æ 1.21 720 22 Fraser North 0.94 917 0.90 346 0.95 779 ä 0.95 292 0.93 4,567 æ 0.80 1,078 23 Fraser South 1.03 1,255 ä 1.04 485 1.02 1,048 ä 1.07 409 1.03 6,384 æ 1.01 1,551 31 Richmond 0.70 233 0.47 61 0.70 196 0.34 47 0.71 1,186 æ 0.52 251 32 Vancouver 0.80 885 0.81 303 0.79 743 0.92 263 0.82 4,774 æ 0.86 1,098 33 North Shore/Coast Garibaldi 0.73 428 0.82 143 0.73 364 0.75 115 0.93 2,840 æ 0.73 478 41 South Vancouver Island 0.89 809 ä 0.88 238 0.88 675 ä 0.84 190 1.04 5,191 æ 0.92 828 42 Central Vancouver Island 1.10 738 ä 1.01 231 1.12 640 ä 0.96 188 1.11 3,838 æ 1.37 907 43 North Vancouver Island 1.21 315 ä 1.08 116 1.26 280 ä 1.13 99 1.06 1,367 æ 1.07 346 51 Northwest 1.90 200 ä 2.11 92 1.89 168 ä 2.06 75 1.17 598 æ 1.51 234 52 Northern Interior 1.59 326 ä 1.72 153 1.59 275 ä 1.65 122 1.22 1,193 æ 1.52 447 53 Northeast 1.85 139 ä 1.86 72 1.97 124 ä 2.04 63 1.38 504 æ 1.71 189 Unknown HSDA - 1 - 1 - 1 - 1 - 8 - 6 total 1.00 8,677 ä 1.00 3,082 1.00 7,354 ä 1.00 2,545 1.00 44,778 æ 1.00 10,245
04Endocrine, Nutritional/Metabolic Disease
05Diabetes Mellitus
06Circulatory System
07Ischemic Heart Disease
08Cerebrovascular Disease
09Arteries, Arterioles, Capillaries
Health Service Delivery Area SMR Death TR PYLLI D<75 SMR Death TR PYLLI D<75 SMR Death TR PYLLI D<7511 East Kootenay 1.01 347 æ 1.00 88 0.94 186 æ 0.77 25 1.15 42 1.11 7 12 Kootenay Boundary 1.34 521 æ 1.15 140 1.24 283 1.37 59 1.37 57 æ 2.36 19 13 Okanagan 1.02 2,035 æ 1.06 498 1.00 1,194 æ 1.07 178 1.10 235 æ 0.82 49 14 Thompson Cariboo Shuswap 1.08 1,025 æ 1.34 414 1.09 596 æ 0.93 116 1.31 134 æ 0.88 37 21 Fraser East 1.07 1,248 æ 1.12 359 1.03 710 æ 1.47 147 1.07 133 æ 1.05 34 22 Fraser North 1.00 2,079 æ 0.83 574 0.91 1,092 æ 0.78 194 0.94 208 æ 0.90 61 23 Fraser South 1.10 2,870 æ 1.08 807 1.05 1,587 æ 1.02 305 1.08 299 æ 0.91 83 31 Richmond 0.66 470 æ 0.44 114 0.83 340 æ 0.70 62 0.68 51 æ 0.56 13 32 Vancouver 0.77 1,879 æ 0.80 525 0.87 1,253 æ 0.94 241 0.75 195 æ 0.90 52 33 North Shore/Coast Garibaldi 0.86 1,105 æ 0.73 246 1.07 812 æ 0.81 96 0.89 121 æ 0.59 28 41 South Vancouver Island 1.02 2,108 æ 0.83 393 0.95 1,186 æ 0.85 148 0.93 202 æ 1.08 44 42 Central Vancouver Island 1.10 1,607 æ 1.25 454 1.06 908 æ 1.24 150 1.10 171 æ 1.56 52 43 North Vancouver Island 1.02 560 æ 1.18 198 1.21 382 æ 0.73 48 0.95 56 æ 1.32 20 51 Northwest 1.09 240 æ 1.37 113 1.23 150 æ 2.12 55 1.11 26 1.34 11 52 Northern Interior 1.13 478 æ 1.57 224 1.31 308 æ 1.38 83 1.24 56 1.43 25 53 Northeast 1.75 274 æ 2.00 113 0.78 68 æ 1.04 24 1.08 18 æ 1.16 9 Unknown HSDA - 4 - 4 - 3 - 1 0.00 0 0.00 -
total 1.00 18,850 æ 1.00 5,264 1.00 11,058 æ 1.00 1,932 1.00 2,004 æ 1.00 544
10Respiratory System
11Influenza and Pneumonia
12Chronic Pulmonary Disease
Health Service Delivery Area SMR Death TR PYLLI D<75 SMR Death TR PYLLI D<75 SMR Death TR PYLLI D<7511 East Kootenay 1.05 309 0.99 78 0.77 74 æ 1.07 12 1.29 174 1.05 47 12 Kootenay Boundary 0.87 290 æ 1.05 82 0.33 37 æ 0.58 7 1.25 190 1.27 52 13 Okanagan 0.96 1,675 æ 1.11 344 0.88 523 æ 1.14 73 1.07 840 æ 1.15 207 14 Thompson Cariboo Shuswap 1.23 1,004 æ 1.36 280 1.07 283 æ 1.59 58 1.46 554 æ 1.38 165 21 Fraser East 1.17 1,175 1.30 300 1.30 445 æ 1.30 73 1.16 526 1.36 163 22 Fraser North 1.08 1,918 æ 0.82 377 1.18 701 æ 0.60 79 0.98 784 æ 0.93 195 23 Fraser South 1.03 2,286 æ 0.89 484 1.22 917 æ 0.92 121 0.86 867 æ 0.75 233 31 Richmond 0.85 509 æ 0.40 66 0.94 188 æ 0.56 18 0.65 177 æ 0.22 25 32 Vancouver 0.94 1,965 æ 0.97 402 1.00 732 æ 1.07 105 0.80 743 æ 1.06 213 33 North Shore/Coast Garibaldi 0.82 904 æ 0.53 120 0.91 347 æ 0.60 28 0.73 363 æ 0.47 56 41 South Vancouver Island 0.80 1,443 æ 0.87 251 0.63 407 æ 0.84 41 0.89 697 æ 0.88 138 42 Central Vancouver Island 1.10 1,391 æ 1.25 298 1.24 526 æ 1.23 56 1.10 630 1.17 165 43 North Vancouver Island 1.02 481 æ 1.14 144 0.69 105 æ 0.40 12 1.20 262 1.31 90 51 Northwest 1.12 205 æ 1.57 68 1.12 67 æ 2.36 21 1.19 100 æ 1.08 33 52 Northern Interior 1.36 483 æ 1.75 179 1.07 121 æ 1.75 38 1.69 278 1.76 108 53 Northeast 1.26 164 æ 1.68 62 0.93 40 æ 2.04 15 1.72 102 1.51 38 Unknown HSDA - 4 - 3 - 2 - 2 - 2 - 1
total 1.00 16,206 æ 1.00 3,538 1.00 5,515 æ 1.00 759 1.00 7,289 æ 1.00 1,929
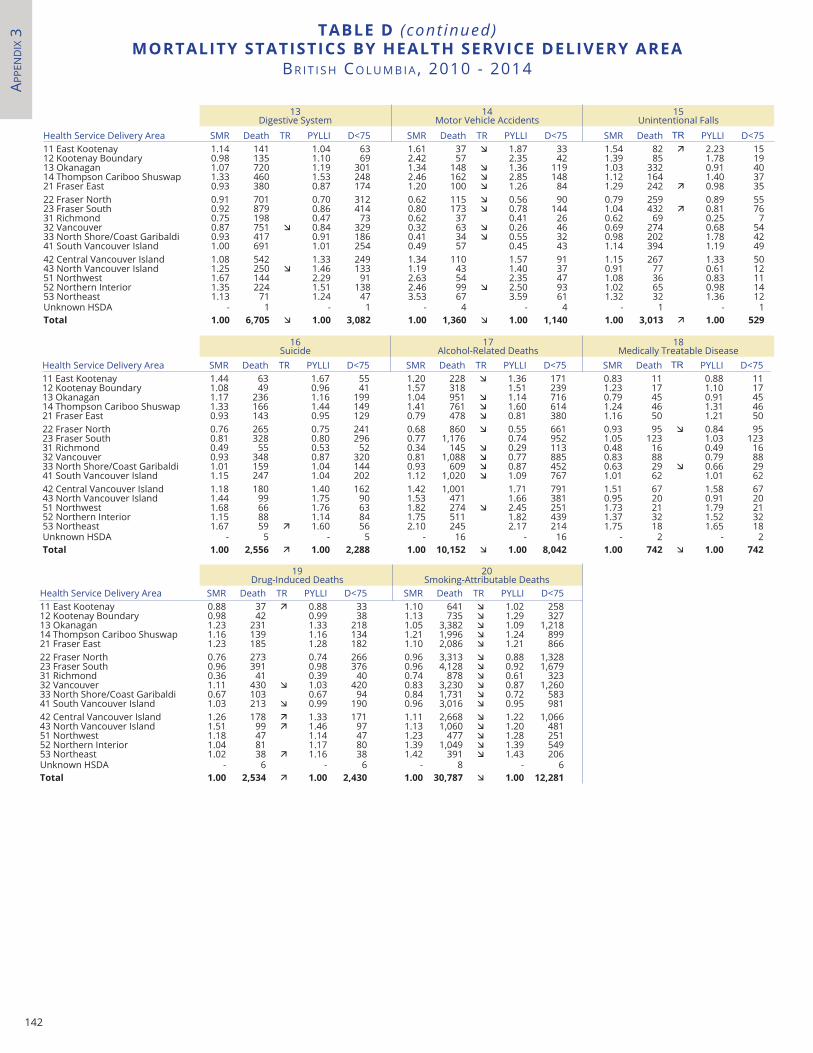
142
APPe
nd
Ix 3 taBle D (cont inued)
mortalItY StatIStICS BY HealtH SerVICe DelIVerY areaBR I t I S h Co L u M B I A , 2010 - 2014
Health Service Delivery Area SMR Death TR PYLLI D<75 SMR Death TR PYLLI D<75 SMR Death TR PYLLI D<7511 East Kootenay 1.14 141 1.04 63 1.61 37 æ 1.87 33 1.54 82 ä 2.23 15 12 Kootenay Boundary 0.98 135 1.10 69 2.42 57 2.35 42 1.39 85 1.78 19 13 Okanagan 1.07 720 1.19 301 1.34 148 æ 1.36 119 1.03 332 0.91 40 14 Thompson Cariboo Shuswap 1.33 460 1.53 248 2.46 162 æ 2.85 148 1.12 164 1.40 37 21 Fraser East 0.93 380 0.87 174 1.20 100 æ 1.26 84 1.29 242 ä 0.98 35 22 Fraser North 0.91 701 0.70 312 0.62 115 æ 0.56 90 0.79 259 0.89 55 23 Fraser South 0.92 879 0.86 414 0.80 173 æ 0.78 144 1.04 432 ä 0.81 76 31 Richmond 0.75 198 0.47 73 0.62 37 0.41 26 0.62 69 0.25 7 32 Vancouver 0.87 751 æ 0.84 329 0.32 63 æ 0.26 46 0.69 274 0.68 54 33 North Shore/Coast Garibaldi 0.93 417 0.91 186 0.41 34 æ 0.55 32 0.98 202 1.78 42 41 South Vancouver Island 1.00 691 1.01 254 0.49 57 0.45 43 1.14 394 1.19 49 42 Central Vancouver Island 1.08 542 1.33 249 1.34 110 1.57 91 1.15 267 1.33 50 43 North Vancouver Island 1.25 250 æ 1.46 133 1.19 43 1.40 37 0.91 77 0.61 12 51 Northwest 1.67 144 2.29 91 2.63 54 2.35 47 1.08 36 0.83 11 52 Northern Interior 1.35 224 1.51 138 2.46 99 æ 2.50 93 1.02 65 0.98 14 53 Northeast 1.13 71 1.24 47 3.53 67 3.59 61 1.32 32 1.36 12 Unknown HSDA - 1 - 1 - 4 - 4 - 1 - 1 total 1.00 6,705 æ 1.00 3,082 1.00 1,360 æ 1.00 1,140 1.00 3,013 ä 1.00 529
13Digestive System
14Motor Vehicle Accidents
15Unintentional Falls
Health Service Delivery Area SMR Death TR PYLLI D<75 SMR Death TR PYLLI D<75 SMR Death TR PYLLI D<7511 East Kootenay 1.44 63 1.67 55 1.20 228 æ 1.36 171 0.83 11 0.88 11 12 Kootenay Boundary 1.08 49 0.96 41 1.57 318 1.51 239 1.23 17 1.10 17 13 Okanagan 1.17 236 1.16 199 1.04 951 æ 1.14 716 0.79 45 0.91 45 14 Thompson Cariboo Shuswap 1.33 166 1.44 149 1.41 761 æ 1.60 614 1.24 46 1.31 46 21 Fraser East 0.93 143 0.95 129 0.79 478 æ 0.81 380 1.16 50 1.21 50 22 Fraser North 0.76 265 0.75 241 0.68 860 æ 0.55 661 0.93 95 æ 0.84 95 23 Fraser South 0.81 328 0.80 296 0.77 1,176 0.74 952 1.05 123 1.03 123 31 Richmond 0.49 55 0.53 52 0.34 145 æ 0.29 113 0.48 16 0.49 16 32 Vancouver 0.93 348 0.87 320 0.81 1,088 æ 0.77 885 0.83 88 0.79 88 33 North Shore/Coast Garibaldi 1.01 159 1.04 144 0.93 609 æ 0.87 452 0.63 29 æ 0.66 29 41 South Vancouver Island 1.15 247 1.04 202 1.12 1,020 æ 1.09 767 1.01 62 1.01 62 42 Central Vancouver Island 1.18 180 1.40 162 1.42 1,001 1.71 791 1.51 67 1.58 67 43 North Vancouver Island 1.44 99 1.75 90 1.53 471 1.66 381 0.95 20 0.91 20 51 Northwest 1.68 66 1.76 63 1.82 274 æ 2.45 251 1.73 21 1.79 21 52 Northern Interior 1.15 88 1.14 84 1.75 511 1.82 439 1.37 32 1.52 32 53 Northeast 1.67 59 ä 1.60 56 2.10 245 2.17 214 1.75 18 1.65 18 Unknown HSDA - 5 - 5 - 16 - 16 - 2 - 2 total 1.00 2,556 ä 1.00 2,288 1.00 10,152 æ 1.00 8,042 1.00 742 æ 1.00 742
16Suicide
18Medically Treatable Disease
17Alcohol-Related Deaths
Health Service Delivery Area SMR Death TR PYLLI D<75 SMR Death TR PYLLI D<7511 East Kootenay 0.88 37 ä 0.88 33 1.10 641 æ 1.02 258 12 Kootenay Boundary 0.98 42 0.99 38 1.13 735 æ 1.29 327 13 Okanagan 1.23 231 1.33 218 1.05 3,382 æ 1.09 1,218 14 Thompson Cariboo Shuswap 1.16 139 1.16 134 1.21 1,996 æ 1.24 899 21 Fraser East 1.23 185 1.28 182 1.10 2,086 æ 1.21 866 22 Fraser North 0.76 273 0.74 266 0.96 3,313 æ 0.88 1,328 23 Fraser South 0.96 391 0.98 376 0.96 4,128 æ 0.92 1,679 31 Richmond 0.36 41 0.39 40 0.74 878 æ 0.61 323 32 Vancouver 1.11 430 æ 1.03 420 0.83 3,230 æ 0.87 1,260 33 North Shore/Coast Garibaldi 0.67 103 0.67 94 0.84 1,731 æ 0.72 583 41 South Vancouver Island 1.03 213 æ 0.99 190 0.96 3,016 æ 0.95 981 42 Central Vancouver Island 1.26 178 ä 1.33 171 1.11 2,668 æ 1.22 1,066 43 North Vancouver Island 1.51 99 ä 1.46 97 1.13 1,060 æ 1.20 481 51 Northwest 1.18 47 1.14 47 1.23 477 æ 1.28 251 52 Northern Interior 1.04 81 1.17 80 1.39 1,049 æ 1.39 549 53 Northeast 1.02 38 ä 1.16 38 1.42 391 æ 1.43 206 Unknown HSDA - 6 - 6 - 8 - 6 total 1.00 2,534 ä 1.00 2,430 1.00 30,787 æ 1.00 12,281
19Drug-Induced Deaths
20Smoking-Attributable Deaths
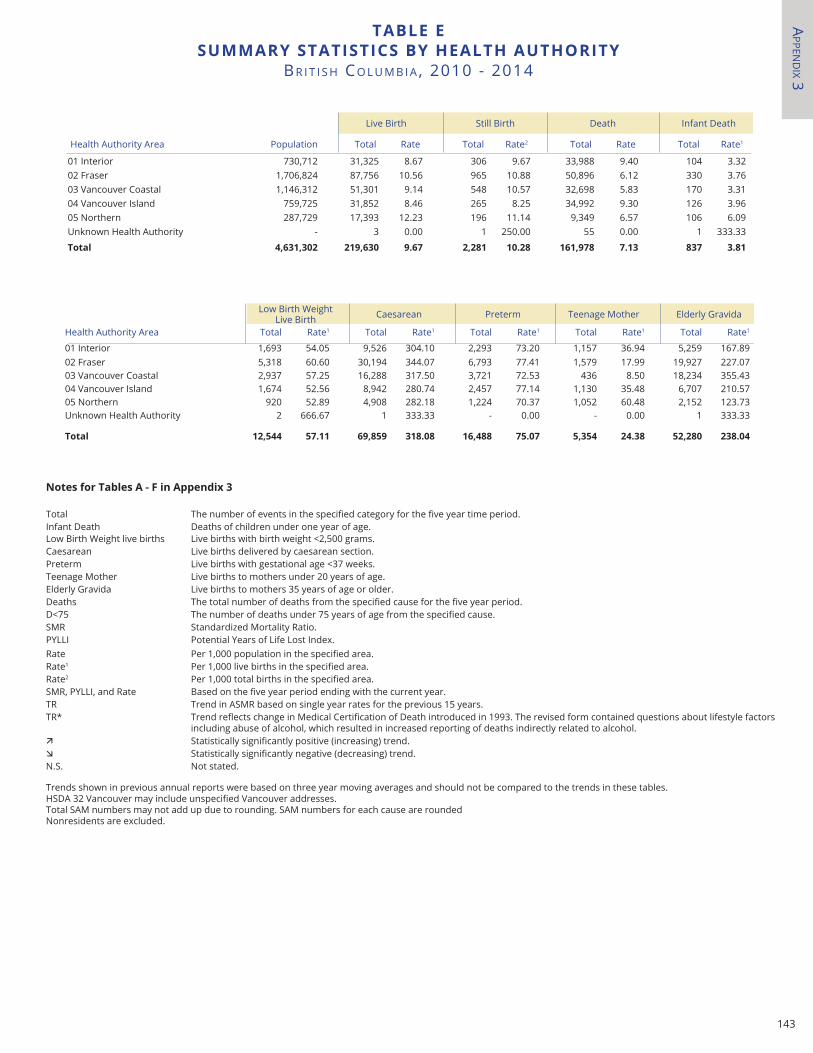
143
APPen
dIx 3
taBle eSUmmarY StatIStICS BY HealtH aUtHorItY
BR I t I S h Co L u M B I A , 2010 - 2014
notes for tables a - f in appendix 3
Total The number of events in the specified category for the five year time period.Infant Death Deaths of children under one year of age.Low Birth Weight live births Live births with birth weight <2,500 grams.Caesarean Live births delivered by caesarean section.Preterm Live births with gestational age <37 weeks.Teenage Mother Live births to mothers under 20 years of age.Elderly Gravida Live births to mothers 35 years of age or older.Deaths The total number of deaths from the specified cause for the five year period.D<75 The number of deaths under 75 years of age from the specified cause.SMR Standardized Mortality Ratio.PYLLI Potential Years of Life Lost Index.Rate Per 1,000 population in the specified area.Rate1 Per 1,000 live births in the specified area.Rate2 Per 1,000 total births in the specified area.SMR, PYLLI, and Rate Based on the five year period ending with the current year.TR Trend in ASMR based on single year rates for the previous 15 years.TR* Trend reflects change in Medical Certification of Death introduced in 1993. The revised form contained questions about lifestyle factors
including abuse of alcohol, which resulted in increased reporting of deaths indirectly related to alcohol.ä Statistically significantly positive (increasing) trend.æ Statistically significantly negative (decreasing) trend.N.S. Not stated.
Trends shown in previous annual reports were based on three year moving averages and should not be compared to the trends in these tables. HSDA 32 Vancouver may include unspecified Vancouver addresses. Total SAM numbers may not add up due to rounding. SAM numbers for each cause are rounded
Nonresidents are excluded.
Health Authority Area Population Total Rate Total Rate2 Total Rate Total Rate1
01 Interior 730,712 31,325 8.67 306 9.67 33,988 9.40 104 3.3202 Fraser 1,706,824 87,756 10.56 965 10.88 50,896 6.12 330 3.7603 Vancouver Coastal 1,146,312 51,301 9.14 548 10.57 32,698 5.83 170 3.3104 Vancouver Island 759,725 31,852 8.46 265 8.25 34,992 9.30 126 3.9605 Northern 287,729 17,393 12.23 196 11.14 9,349 6.57 106 6.09Unknown Health Authority - 3 0.00 1 250.00 55 0.00 1 333.33
total 4,631,302 219,630 9.67 2,281 10.28 161,978 7.13 837 3.81
Live Birth Death Infant Death
Health Authority Area Total Rate1 Total Rate1 Total Rate1 Total Rate1 Total Rate1
01 Interior 1,693 54.05 9,526 304.10 2,293 73.20 1,157 36.94 5,259 167.8902 Fraser 5,318 60.60 30,194 344.07 6,793 77.41 1,579 17.99 19,927 227.0703 Vancouver Coastal 2,937 57.25 16,288 317.50 3,721 72.53 436 8.50 18,234 355.4304 Vancouver Island 1,674 52.56 8,942 280.74 2,457 77.14 1,130 35.48 6,707 210.5705 Northern 920 52.89 4,908 282.18 1,224 70.37 1,052 60.48 2,152 123.73Unknown Health Authority 2 666.67 1 333.33 - 0.00 - 0.00 1 333.33
total 12,544 57.11 69,859 318.08 16,488 75.07 5,354 24.38 52,280 238.04
Still Birth
Low Birth WeightLive Birth Caesarean Preterm Teenage Mother Elderly Gravida
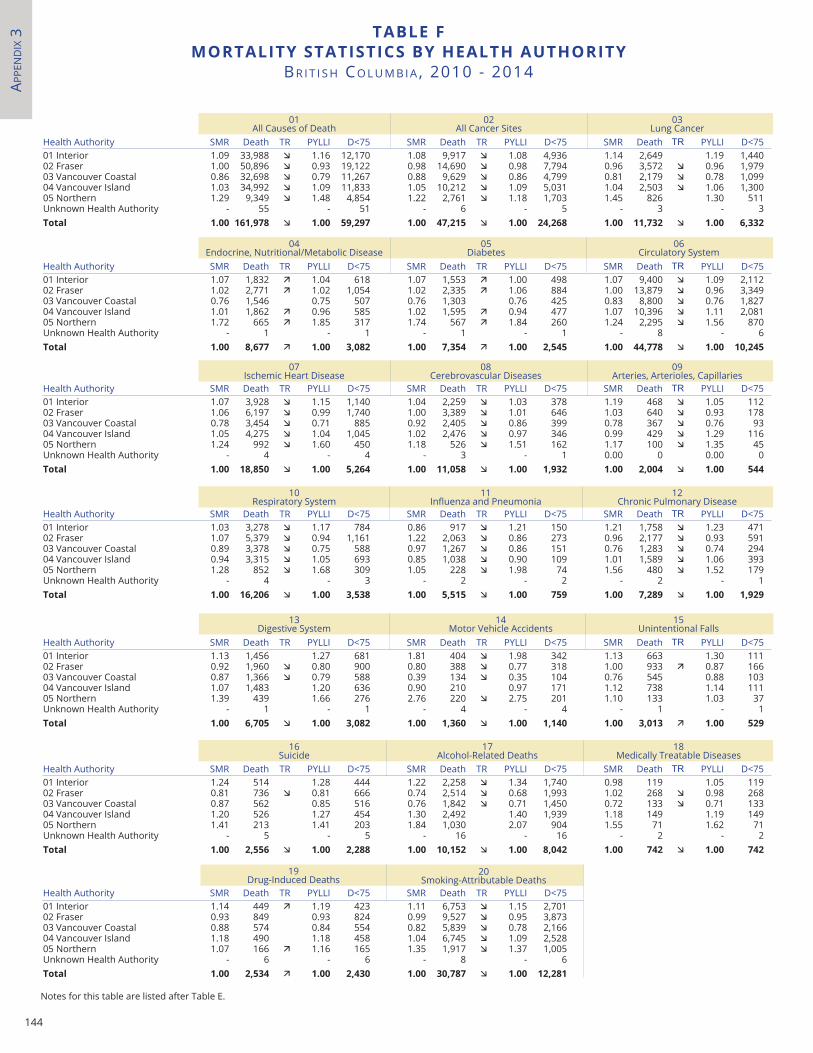
144
APPe
nd
Ix 3 taBle f
mortalItY StatIStICS BY HealtH aUtHorItYBR I t I S h Co L u M B I A , 2010 - 2014
Notes for this table are listed after Table E.
Health Authority SMR Death TR PYLLI D<75 SMR Death TR PYLLI D<75 SMR Death TR PYLLI D<7501 Interior 1.24 514 1.28 444 1.22 2,258 æ 1.34 1,740 0.98 119 1.05 11902 Fraser 0.81 736 æ 0.81 666 0.74 2,514 æ 0.68 1,993 1.02 268 æ 0.98 26803 Vancouver Coastal 0.87 562 0.85 516 0.76 1,842 æ 0.71 1,450 0.72 133 æ 0.71 13304 Vancouver Island 1.20 526 1.27 454 1.30 2,492 1.40 1,939 1.18 149 1.19 14905 Northern 1.41 213 1.41 203 1.84 1,030 2.07 904 1.55 71 1.62 71Unknown Health Authority - 5 - 5 - 16 - 16 - 2 - 2total 1.00 2,556 æ 1.00 2,288 1.00 10,152 æ 1.00 8,042 1.00 742 æ 1.00 742
Health Authority SMR Death TR PYLLI D<75 SMR Death TR PYLLI D<7501 Interior 1.14 449 ä 1.19 423 1.11 6,753 æ 1.15 2,70102 Fraser 0.93 849 0.93 824 0.99 9,527 æ 0.95 3,87303 Vancouver Coastal 0.88 574 0.84 554 0.82 5,839 æ 0.78 2,16604 Vancouver Island 1.18 490 1.18 458 1.04 6,745 æ 1.09 2,52805 Northern 1.07 166 ä 1.16 165 1.35 1,917 æ 1.37 1,005Unknown Health Authority - 6 - 6 - 8 - 6total 1.00 2,534 ä 1.00 2,430 1.00 30,787 æ 1.00 12,281
Health Authority SMR Death TR PYLLI D<75 SMR Death TR PYLLI D<75 SMR Death TR PYLLI D<7501 Interior 1.09 33,988 æ 1.16 12,170 1.08 9,917 æ 1.08 4,936 1.14 2,649 1.19 1,44002 Fraser 1.00 50,896 æ 0.93 19,122 0.98 14,690 æ 0.98 7,794 0.96 3,572 æ 0.96 1,97903 Vancouver Coastal 0.86 32,698 æ 0.79 11,267 0.88 9,629 æ 0.86 4,799 0.81 2,179 æ 0.78 1,09904 Vancouver Island 1.03 34,992 æ 1.09 11,833 1.05 10,212 æ 1.09 5,031 1.04 2,503 æ 1.06 1,30005 Northern 1.29 9,349 æ 1.48 4,854 1.22 2,761 æ 1.18 1,703 1.45 826 1.30 511Unknown Health Authority - 55 - 51 - 6 - 5 - 3 - 3total 1.00 161,978 æ 1.00 59,297 1.00 47,215 æ 1.00 24,268 1.00 11,732 æ 1.00 6,332
01All Causes of Death
02All Cancer Sites
03Lung Cancer
Health Authority SMR Death TR PYLLI D<75 SMR Death TR PYLLI D<75 SMR Death TR PYLLI D<7501 Interior 1.07 1,832 ä 1.04 618 1.07 1,553 ä 1.00 498 1.07 9,400 æ 1.09 2,11202 Fraser 1.02 2,771 ä 1.02 1,054 1.02 2,335 ä 1.06 884 1.00 13,879 æ 0.96 3,34903 Vancouver Coastal 0.76 1,546 0.75 507 0.76 1,303 0.76 425 0.83 8,800 æ 0.76 1,82704 Vancouver Island 1.01 1,862 ä 0.96 585 1.02 1,595 ä 0.94 477 1.07 10,396 æ 1.11 2,08105 Northern 1.72 665 ä 1.85 317 1.74 567 ä 1.84 260 1.24 2,295 æ 1.56 870Unknown Health Authority - 1 - 1 - 1 - 1 - 8 - 6total 1.00 8,677 ä 1.00 3,082 1.00 7,354 ä 1.00 2,545 1.00 44,778 æ 1.00 10,245
04Endocrine, Nutritional/Metabolic Disease
05Diabetes
06Circulatory System
Health Authority SMR Death TR PYLLI D<75 SMR Death TR PYLLI D<75 SMR Death TR PYLLI D<7501 Interior 1.07 3,928 æ 1.15 1,140 1.04 2,259 æ 1.03 378 1.19 468 æ 1.05 11202 Fraser 1.06 6,197 æ 0.99 1,740 1.00 3,389 æ 1.01 646 1.03 640 æ 0.93 17803 Vancouver Coastal 0.78 3,454 æ 0.71 885 0.92 2,405 æ 0.86 399 0.78 367 æ 0.76 9304 Vancouver Island 1.05 4,275 æ 1.04 1,045 1.02 2,476 æ 0.97 346 0.99 429 æ 1.29 11605 Northern 1.24 992 æ 1.60 450 1.18 526 æ 1.51 162 1.17 100 æ 1.35 45Unknown Health Authority - 4 - 4 - 3 - 1 0.00 0 0.00 0total 1.00 18,850 æ 1.00 5,264 1.00 11,058 æ 1.00 1,932 1.00 2,004 æ 1.00 544
07Ischemic Heart Disease
08Cerebrovascular Diseases
09Arteries, Arterioles, Capillaries
Health Authority SMR Death TR PYLLI D<75 SMR Death TR PYLLI D<75 SMR Death TR PYLLI D<7501 Interior 1.03 3,278 æ 1.17 784 0.86 917 æ 1.21 150 1.21 1,758 æ 1.23 47102 Fraser 1.07 5,379 æ 0.94 1,161 1.22 2,063 æ 0.86 273 0.96 2,177 æ 0.93 59103 Vancouver Coastal 0.89 3,378 æ 0.75 588 0.97 1,267 æ 0.86 151 0.76 1,283 æ 0.74 29404 Vancouver Island 0.94 3,315 æ 1.05 693 0.85 1,038 æ 0.90 109 1.01 1,589 æ 1.06 39305 Northern 1.28 852 æ 1.68 309 1.05 228 æ 1.98 74 1.56 480 æ 1.52 179Unknown Health Authority - 4 - 3 - 2 - 2 - 2 - 1total 1.00 16,206 æ 1.00 3,538 1.00 5,515 æ 1.00 759 1.00 7,289 æ 1.00 1,929
10Respiratory System
11Influenza and Pneumonia
12Chronic Pulmonary Disease
Health Authority SMR Death TR PYLLI D<75 SMR Death TR PYLLI D<75 SMR Death TR PYLLI D<7501 Interior 1.13 1,456 1.27 681 1.81 404 æ 1.98 342 1.13 663 1.30 11102 Fraser 0.92 1,960 æ 0.80 900 0.80 388 æ 0.77 318 1.00 933 ä 0.87 16603 Vancouver Coastal 0.87 1,366 æ 0.79 588 0.39 134 æ 0.35 104 0.76 545 0.88 10304 Vancouver Island 1.07 1,483 1.20 636 0.90 210 0.97 171 1.12 738 1.14 11105 Northern 1.39 439 1.66 276 2.76 220 æ 2.75 201 1.10 133 1.03 37Unknown Health Authority - 1 - 1 - 4 - 4 - 1 - 1total 1.00 6,705 æ 1.00 3,082 1.00 1,360 æ 1.00 1,140 1.00 3,013 ä 1.00 529
13Digestive System
14Motor Vehicle Accidents
15Unintentional Falls
16Suicide
17Alcohol-Related Deaths
18Medically Treatable Diseases
19Drug-Induced Deaths
20Smoking-Attributable Deaths