Selected Vital Statistics and Health Status Indicators - Gov.bc.ca
210
Selected Vital Statistics and Health Status Indicators ONE HUNDRED AND THIRTY-FOURTH ANNUAL REPORT 2005 British Columbia Vital Statistics Agency
-
Upload
khangminh22 -
Category
Documents
-
view
2 -
download
0
Transcript of Selected Vital Statistics and Health Status Indicators - Gov.bc.ca

Selected Vital Statistics andHealth Status Indicators
ONE HUNDRED AND THIRTY-FOURTHANNUAL REPORT 2005
British Columbia Vital Statistics Agency


Selected Vital Statistics andHealth Status Indicators
ONE HUNDRED AND THIRTY-FOURTHANNUAL REPORT 2005
British Columbia Vital Statistics Agency

Canadian Cataloguing in Publication Data
Main entry under title:Selected vital statistics and health status indicators
… annual report. -- 119th (1990) –
Annual.Continues: Vital statistics of the Province of
British Columbia, ISSN 0702–9446Report year ends Dec. 31.ISSN 1188–3642 = Selected vital statistics and
health status indicators … annual report.
1. British Columbia – Statistics, Vital. I.British Columbia. Division of Vital Statistics.
HA747.B7S44 304.6'09711'021 C92–092045–4
This annual report is also available on our website: http://www.vs.gov.bc.ca/

ForewordThe British Columbia Vital Statistics Agency is pleased to present the 2005 Annual Report, the one hundred and thirty-fourth published since the establishment of the Division of Vital Statistics in 1872. The tables, fi gures, and maps in this publication are based on information collected from registrations of live births, stillbirths, deaths, marriages, changes of name, and adoption as registered by the Agency for events occurring in the 2005 calendar year.
This publication contains approximately 100 tables, fi gures, and maps that summarize selected information about the vital events of British Columbians. Although some tables and information relate to events occurring in the province, the majority are specifi c to residents of British Columbia. The information relating only to residents is important for evaluating the health status of the province's population. Throughout the report, key indicators are presented for the province’s Health Authorities (HAs) and Local Health Areas (LHAs). The report includes a detailed Glossary, defi ning the terms used in the body of the publication; as well as a Methodology section, explaining the statistical computations in the main body. A set of Information Boxes supplement the standard tables with information on a wide range of subjects, from a profi le of a typical day in British Columbia to place of birth for midwife assisted births and usual residence of people married in 2005.
Beginning with the 2000 Annual Report the Agency has presented data using the tenth revision of the World Health Organization’s International Statistical Classifi cation of Diseases and Related Health Problems (ICD-10) coding scheme. Where possible, this report follows a format consistent with previous annual reports that presented statistics from the current year along with comparative statistics from the preceding fi ve years. However, some tables and fi gures present statistics prior to 2000 when an earlier version of the coding scheme (ICD-9) was in effect. Many changes in the codes and in the rules for selection of the underlying cause of death preclude direct comparison of ICD-9 and ICD-10 data. Extensive manual reviews using translation tables in conjunction with recoding of data from ICD-9 to ICD-10 enabled the production of trend data. This approach is unique to publications of this Agency.
The Vital Statistics Agency would like to acknowledge the many groups and individuals who ensure complete and accurate recording of vital events. Their contributions have resulted in continual improvement in the quality of vital event data and the quality of this report.
Andrew K. McBride Chief Executive Offi cer British Columbia Vital Statistics Agency
V

V I T A B L E O F C O N T E N T S
Table of ContentsI. GENERAL INFORMATIONINTRODUCTION .............................................................................................................................................................. 3REGISTRATIONS .............................................................................................................................................. 3FIGURE 1 Local Health Area Map, British Columbia (map) ..................................................................... 6FIGURE 2 Health Authority and Health Service Delivery Area, British Columbia (map) ......................... 7
II. TRENDS IN VITAL EVENTSTRENDS INTRODUCTION ...................................................................................................................................... 11OVERVIEW .............................................................................................................................................. 11TABLE 1 Live Births, Deaths, Marriages and Stillbirths, British Columbia, 1950–2005 ........................... 12FIGURE 3 Crude Rates of Live Births, Deaths, Marriages and Stillbirths, British Columbia, 1950–2005 ............................................................................................. 13TABLE 2 Natural Population Increases, British Columbia and Canada, 1950–2005 ................................ 14FIGURE 4 Natural Population Increases, British Columbia and Canada, 1950–2005 ................................ 14TABLE 3 Live Births, Deaths Marriages and Stillbirths by Month, British Columbia, 2005 .................... 15FIGURE 5 Live Births, Deaths Marriages and Stillbirths by Month, British Columbia, 2005 .................... 15FERTILITY AND LIVE BIRTH TRENDS ....................................................................................................................... 16TABLE 4 Total Fertility Rates, British Columbia, 1950–2005 ................................................................... 17FIGURE 6 Total Fertility Rates and Number of Live Births, British Columbia, 1986–2005 ....................... 17FIGURE 7 Live Births by Age of Mother, British Columbia, 1986–2005 .................................................... 18FIGURE 8 Multiple Births as a Percentage of Live Births, British Columbia, 1986–2005 .......................... 18FIGURE 9 Low Birth Weight Live Births, British Columbia, 1986–2005 ................................................... 19FIGURE 10 Low Birth Weight Live Births for Mother Aged 35+, British Columbia, 1986–2005 ................. 19FIGURE 11 Cesarean Sections, British Columbia, 1986–2005 ...................................................................... 20FIGURE 12 Cesarean Sections by Health Service Delivery Area, British Columbia, 2005 .......................... 20FIGURE 13 Cesarean Sections by Age of Mother, British Columbia, 1986–2005 ........................................ 21INFANT MORTALITY TRENDS ................................................................................................................................ 22FIGURE 14 Infant Mortality, British Columbia, 1986–2005 ........................................................................ 22TABLE 5 Infant Mortality, British Columbia and Canada, 1965–2005 .................................................... 23FIGURE 15 Infant Mortality by Age of Mother, British Columbia, 1986–2005 ............................................ 24FIGURE 16 Percentage of Infant Mortality by Age of Mother, British Columbia, 2005 .............................. 24DEATH TRENDS .............................................................................................................................................. 25FIGURE 17 Deaths and Death Rates, All Causes of Death, British Columbia, 1986–2005 ........................... 26FIGURE 18 Average Age at Death, British Columbia, 1986–2005 ............................................................... 27FIGURE 19 Deaths and Death Rates, Malignant Neoplasms (Cancer), British Columbia, 1986–2005 ........ 27FIGURE 20 Deaths and Death Rates, Malignant Neoplasm of Lung, British Columbia, 1986-2005 ............ 28FIGURE 21 Death Rates by Gender, Malignant Neoplasm of Lung, British Columbia, 1986-2005 ............. 28FIGURE 22 Deaths and Death Rates, Endocrine, Nutritional and Metabolic Diseases, British Columbia, 1986-2005 ............................................................................................. 29
T A B L E O F C O N T E N T S V I I
FIGURE 23 Deaths and Death Rates, Diabetes Mellitus, British Columbia, 1986–2005 .............................. 29FIGURE 24 Deaths and Death Rates, Nervous System Diseases, British Columbia, 1986-2005 .................. 30FIGURE 25 Deaths and Death Rates, Cardiovascular Disease, British Columbia, 1986-2005 ..................... 30FIGURE 26 Deaths and Death Rates, Cerebrovascular Diseases, British Columbia, 1986-2005 .................. 31FIGURE 27 Deaths and Death Rates, Motor Vehicle Accidents, British Columbia, 1986–2004 ................... 31MARRIAGE TRENDS ............................................................................................................................................. 32TABLE 6 Age of First and All Marriages, British Columbia, 1977–2005 .................................................. 32FIGURE 28 Age of First and All Marriages, British Columbia, 1977–2005 .................................................. 32
III. BIRTH-RELATED STATISTICSBIRTH INTRODUCTION ......................................................................................................................................... 35 BIRTHS-GENERAL INDICATORS .............................................................................................................................. 35TABLE 7 Births by Age of Mother and Live Births by Birth Order, British Columbia, 2005 ................... 38 TABLE 8 Total Live Births by Age of Father, Age of Mother and Out-of-Wedlock, British Columbia, 2005 ........................................................................................................ 39TABLE 9 Live Births by Age of Mother and Kind of Birth, British Columbia, 2005 ................................ 39TABLE 10 Live Birth Fertility Rates by Local Health Area, British Columbia, 2000–2004 and 2005 ......... 40FIGURE 29 Live Birth Teenage Fertility Rates by Local Health Area,
British Columbia, 2000–2004 (map) ..................................................................................... 41TABLE 11 Live Births by Mode of Delivery and Age of Mother, British Columbia, 2005 ......................... 42TABLE 12 Live Births by Local Health Area and Mode of Delivery, British Columbia, 2005 ................... 44FIGURE 30 Cesarean Deliveries of Live Born Infants by Local Health Area, British Columbia, 2005 (map) .................................................................................................. 45BIRTHS - BIRTH WEIGHT ...................................................................................................................................... 46TABLE 13 Live Births by Birth Weight, Gender, and Gestational Age, British Columbia, 2005 ............... 47TABLE 14 Live Births by Birth Weight and Age of Mother, British Columbia, 2005 ................................ 48TABLE 15 Low Birth Weight Live Births by Age of Mother and Gender, British Columbia, 2005 ........... 49FIGURE 31 Low Birth Weight Live Births by Age of Mother, British Columbia, 2005 ............................... 49TABLE 16 Low Birth Weight Live Births by Local Health Area and Gestational Age, British Columbia,
2000–2004 and 2005 ............................................................................................................. 50FIGURE 32 Low Birth Weight Live Births by Local Health Area, British Columbia, 2000–2004 (map) ..... 51BIRTHS - MATERNAL COMPLICATIONS AND PERINATAL COMPLICATIONS ..................................................................... 52TABLE 17 Maternal Complications of Pregnancy and Delivery in Live Births
by Age of Mother, British Columbia, 2000–2004 and 2005 .................................................. 54TABLE 18 Maternal Complications of Pregnancy and Delivery in Live Births by Local Health Area,
British Columbia, 2000–2004 and 2005 ................................................................................ 56FIGURE 33 Maternal Complications of Pregnancy and Delivery in Live Births by
Local Health Area, British Columbia, 2000–2004 (map) ...................................................... 57TABLE 19 Perinatal Complications in Live Births by Age of Mother,
British Columbia, 2000–2004 and 2005 ................................................................................ 58TABLE 20 Perinatal Complications in Live Births by Local Health Area,
British Columbia, 2000–2004 and 2005 ................................................................................ 60FIGURE 34 Perinatal Complications in Live Births by Local Health Area,
British Columbia, 2000–2004 (map) ..................................................................................... 61

V I I I T A B L E O F C O N T E N T S
IV. DEATH-RELATED STATISTICSDEATH INTRODUCTION ........................................................................................................................................ 65DEATHS - GENERAL INDICATORS ........................................................................................................................... 65TABLE 21 Causes of Death by Gender and Age, British Columbia, 2005 ................................................. 66LEADING CAUSES OF DEATH ................................................................................................................................ 67TABLE 22 Twelve Leading Causes of Death, British Columbia, 2000–2004 and 2005 .............................. 68FIGURE 35 Twelve Leading Causes of Death, British Columbia, 2005 ....................................................... 69TABLE 23 Leading Causes of Death by Age and Gender, British Columbia, 2005 ................................... 70INFANT MORTALITY ............................................................................................................................................ 72TABLE 24 Infant Mortality by Age of Mother and Birth Weight, British Columbia, 2005 ........................ 73TABLE 25 Infant Mortality by Gestational Age and Birth Weight, British Columbia, 2005 ...................... 73TABLE 26 Infant Mortality by Local Health Area, British Columbia, 2000–2004 and 2005 ....................... 74FIGURE 36 Infant Mortality by Local Health Area, British Columbia, 2000-2004 (map) ............................ 75TABLE 27 Selected Causes of Infant Deaths and Stillbirths, British Columbia, 2005 ................................ 76DEATHS DUE TO HIV ......................................................................................................................................... 76FIGURE 37 Deaths Due to HIV Disease by Age Group, British Columbia, 2000–2005 ............................... 77TABLE 28 Deaths Due to HIV Disease by Gender and Age Group,
British Columbia, 1990–2005 ............................................................................................... 78TABLE 29 Deaths Due to HIV Disease by Health Service Delivery Area, British Columbia, 1990–2005 .................................................................................................... 79EXTERNAL CAUSES OF DEATH ............................................................................................................................... 79TABLE 30 External Causes of Death by Gender, British Columbia, 2005 ................................................. 80TABLE 31 External Causes of Death by Local Health Area, British Columbia, 2005 ................................ 81TABLE 32 Suicide Deaths by Month and Gender, British Columbia, 2005 ............................................... 85GEOGRAPHIC MORTALITY .................................................................................................................................... 85TABLE 33 Standardized Mortality Ratio – All Causes of Death by Local Health Area,
British Columbia, 2000–2004 and 2005 ................................................................................ 86FIGURE 38 All Causes of Death by Local Health Area, British Columbia, 2000–2004 (map) ..................... 87POTENTIAL YEARS OF LIFE LOST ........................................................................................................................... 88TABLE 34 Potential Years of Life Lost and Age Standardized Mortality Rates by Selected
Causes of Death, British Columbia, 2005 ............................................................................. 90FIGURE 39 Potential Years of Life Lost and Age Standardized Mortality Rates by Selected
Causes of Death, British Columbia, 2005 ............................................................................. 91TABLE 35 Potential Years of Life Lost by Age Group and Major Causes of Death
(Age Under 75 Years), British Columbia, 2005 .................................................................... 92FIGURE 40 Potential Years of Life Lost Standardized Rates by Age Group and Gender,
Major Causes of Death (Age Under 75 Years), British Columbia, 2005 ............................... 93TABLE 36 Potential Years of Life Lost by Local Health Area, External Causes of Death
(Age Under 75 Years), British Columbia, 2000–2004 and 2005 ............................................ 94FIGURE 41 External Causes of Death by Local Health Area (Age Under 75 Years),
British Columbia, 2000–2004 (map) ..................................................................................... 95MEDICALLY TREATABLE DISEASES ......................................................................................................................... 96TABLE 37 Deaths Due to Medically Treatable Diseases by Selected Causes and Gender,
British Columbia, 2000–2004 and 2005 ................................................................................ 97TABLE 38 Standardized Mortality Ratio by Local Health Area, Deaths Due to
Medically Treatable Diseases, British Columbia, 2000–2004 and 2005 ................................ 98FIGURE 42 Deaths Due to Medically Treatable Diseases by Local Health Area,
British Columbia, 2000–2004 (map) ..................................................................................... 99

T A B L E O F C O N T E N T S I X
ALCOHOL-RELATED DEATHS ................................................................................................................................ 100TABLE 39 Alcohol-Related Deaths by Cause, British Columbia, 2000–2004 and 2005 .............................. 101FIGURE 43 Alcohol-Related Deaths by Cause, British Columbia, 2005 ...................................................... 102TABLE 40 Alcohol-Related Deaths by Age and Gender, British Columbia, 2005 .......................................... 103TABLE 41 Standardized Mortality Ratio by Local Health Area, Alcohol-Related Deaths,
British Columbia, 2000–2004 and 2005 ................................................................................ 104FIGURE 44 Alcohol-Related Deaths by Local Health Area, British Columbia, 2000–2004 (map) ............... 105SMOKING-ATTRIBUTABLE DEATHS ......................................................................................................................... 106FIGURE 45 Smoking-Attributable Mortality by Selected Causes and Gender, British Columbia, 2005 ..... 106TABLE 42 Smoking-Attributable Mortality, British Columbia, 2005 ........................................................ 107DRUG-INDUCED DEATHS ..................................................................................................................................... 108TABLE 43 Drug-Induced Deaths by Age and Gender, British Columbia, 2005 ........................................ 108TABLE 44 Drug-Induced Deaths by Cause, British Columbia, 2000–2004 and 2005 ................................. 109FIGURE 46 Drug-Induced Deaths by Cause, British Columbia, 2005 ......................................................... 109TABLE 45 Standardized Mortality Ratio by Local Health Area, Drug-Induced Deaths,
British Columbia, 2000–2004 and 2005 ................................................................................ 110FIGURE 47 Drug-Induced Deaths by Local Health Area, British Columbia, 2000–2004 (map) .................. 111DRUG OVERDOSE DEATHS ................................................................................................................................... 112Table 46 Unintentional Illicit/Illegal Overdose Deaths by Type of Drug, British Columbia, 2000-2005 ................................................................................................................. 113Figure 48 Unintentional Illicit/Illegal Overdose Deaths by Cause, British Columbia, 2000-2005 .............. 113Table 47 ASMR For Unintentional Illicit/Illegal Overdose Deaths by Health Authority, British Columbia, 2000-2005 ................................................................................................................. 114Table 48 ASMR For Unintentional Illicit/Illegal Overdose Deaths by Gender, British Columbia, 2000-2005 ................................................................................................................. 114Figure 49 ASMR For Unintentional Illicit/Illegal Overdose Deaths by Gender, British Columbia, 2000-2005 ................................................................................................................. 115BURIAL AND CREMATIONS .................................................................................................................................... 116TABLE 49 Method of Disposition of Decedent, British Columbia, 1986–2005 .......................................... 116
V. MARRIAGE-RELATED STATISTICSMARRIAGE INTRODUCTION ................................................................................................................................... 121TABLE 50 Marriages by Marital Status, British Columbia, 2005 ............................................................... 122TABLE 51 Marriages by Age, British Columbia, 2005 ............................................................................... 122TABLE 52 Religious Representatives on Register and Marriages Performed by
Religious Denomination, British Columbia, 2005 ................................................................ 123TABLE 53 Marriage Commissioners on Register by Type and Marriages Performed,
British Columbia, 2005 ........................................................................................................ 123
VI. INFORMATION BOXESOn a Typical Day in British Columbia in 2005 ......................................................................................................... 10Place of Birth for Midwife Assisted Births, British Columbia, 1999-2005 ............................................................. 43Top 25 Baby Names in 2005 ......................................................................................................................................... 55Births by Mother's Country of Birth and Deaths by Decedent's Country of Birth, British Columbia, 2005 .... 59Deaths Aged 65+ by Health Service Delivery Area, British Columbia, 2005 ....................................................... 64Age at Death of the Oldest Male and Female, British Columbia, 1986-2005 ........................................................ 64Updated External Causes of Death ............................................................................................................................ 82Method of Disposition by Decedent’s Local Health Area of Residence, British Columbia, 2005 ..................... 117
X T A B L E O F C O N T E N T S
Place of Death for Deaths from Natural Causes, British Columbia, 2001-2005 ................................................... 118Marriages by Other Non Christian Denominations, British Columbia, 2005 ...................................................... 120Usual Residence of Persons Married in British Columbia in 2005, Opposite Sex Marriages ............................ 124Usual Residence of Persons Married in British Columbia in 2005, Same Sex Marriages ................................... 125
GLOSSARY ...................................................................................................................................... 127
METHODOLOGY ..................................................................................................................................... 141
APPENDIX 1: STATISTICAL SUMMARIES BY HEALTH AUTHORITY,HEALTH SERVICE DELIVERY AREA, LOCAL HEALTH AREA,AND COMMUNITY, BRITISH COLUMBIA, 2005 ........................................................ 151
APPENDIX 2: DETAILED CAUSE OF DEATH BY GENDER AND AGE ........................................... 171
APPENDIX 3: SELECTED HEALTH STATUS INDICATORS BY LOCAL HEALTH AREA,HEALTH SERVICE DELIVERY AREA, AND HEALTH AUTHORITY,BRITISH COLUMBIA, 2001–2005 .............................................................................. 185
TABLE A Summary Statistics by Local Health Area, British Columbia, 2001–2005 ................................. 187TABLE B Mortality Statistics by Local Health Area, British Columbia, 2001–2005 ................................. 189TABLE C Summary Statistics by Health Service Delivery Area, British Columbia, 2001–2005 ............... 194TABLE D Mortality Statistics by Health Service Delivery Area, British Columbia, 2001–2005 ................ 195TABLE E Summary Statistics by Health Authority, British Columbia, 2001–2005 .................................. 197TABLE F Mortality Statistics by Health Authority, British Columbia, 2001–2005 ................................... 198
General Information

Introduction
The Vital Statistics Agency is responsible for the ascertainment, registration, and certifi cation of vital events through the administration of the Vital Statistics Act, Marriage Act, and Name Act. Statistical information contained in this report is summary data provided by the Agency for use by government agencies, health planners, researchers, and the general public. In order to maintain confi dentiality, the information does not disclose personally identifi able data.
3
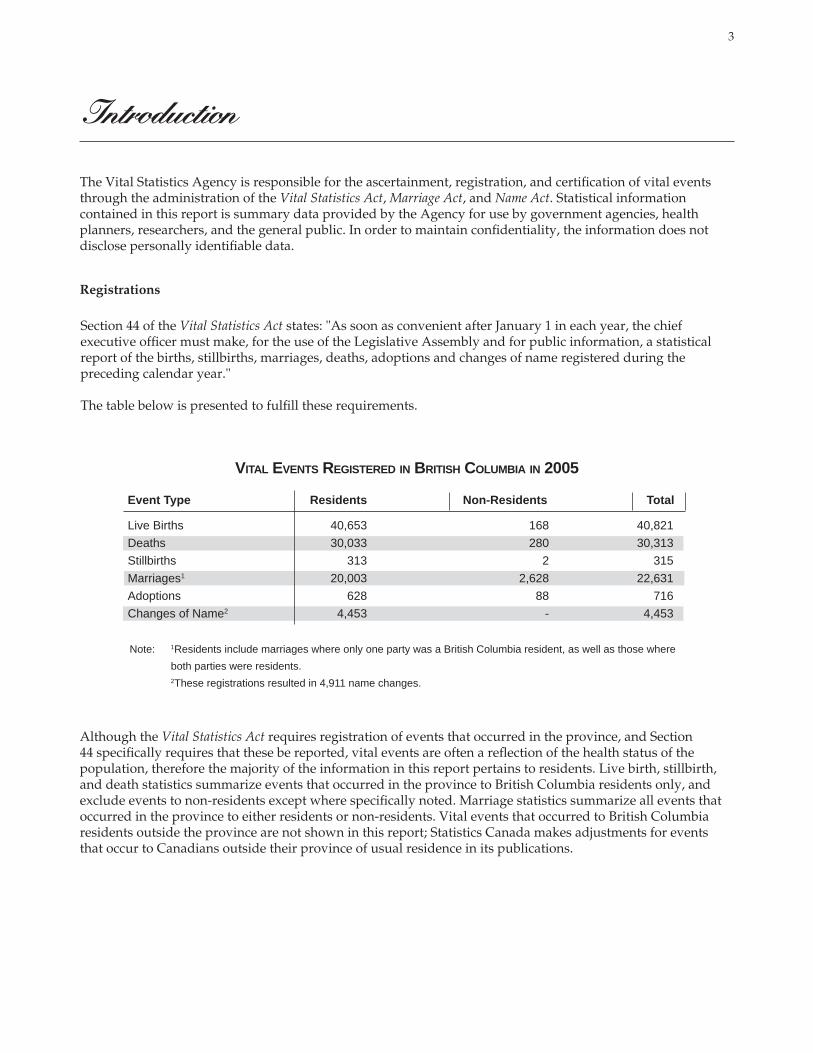
Section 44 of the Vital Statistics Act states: "As soon as convenient after January 1 in each year, the chief executive offi cer must make, for the use of the Legislative Assembly and for public information, a statistical report of the births, stillbirths, marriages, deaths, adoptions and changes of name registered during the preceding calendar year."
The table below is presented to fulfi ll these requirements.
Event Type Residents Non-Residents Total Live Births 40,653 168 40,821 Deaths 30,033 280 30,313 Stillbirths 313 2 315 Marriages1 20,003 2,628 22,631 Adoptions 628 88 716 Changes of Name2 4,453 - 4,453 Note: 1Residents include marriages where only one party was a British Columbia resident, as well as those where both parties were residents. 2These registrations resulted in 4,911 name changes.
VITAL EVENTS REGISTERED IN BRITISH COLUMBIA IN 2005
Registrations
Although the Vital Statistics Act requires registration of events that occurred in the province, and Section 44 specifi cally requires that these be reported, vital events are often a refl ection of the health status of the population, therefore the majority of the information in this report pertains to residents. Live birth, stillbirth, and death statistics summarize events that occurred in the province to British Columbia residents only, and exclude events to non-residents except where specifi cally noted. Marriage statistics summarize all events that occurred in the province to either residents or non-residents. Vital events that occurred to British Columbia residents outside the province are not shown in this report; Statistics Canada makes adjustments for events that occur to Canadians outside their province of usual residence in its publications.

4 I N T R O D U C T I O N
VITAL EVENT DATA
Data presented in this report are based on registrations of birth, stillbirth, death, and marriage as reported to the British Columbia Vital Statistics Agency. Registration requirements for each type of event are outlined briefl y as follows:
Live Births: The Vital Statistics Act prescribes the legal requirements for the registration of live births. The parent(s) of the child have the responsibility to complete the Registration of Live Birth within 30 days of the event. The physician or registered midwife who was in attendance at the birth must complete a Notice of Live Birth or Stillbirth (NOB) form. Other requirements must be met if the birth was not attended by a physician or registered midwife.
Stillbirths: In the event of a stillbirth, the parent(s) must complete the Registration of Stillbirth. The physician or registered midwife who was in attendance at the birth must complete a Notice of Live Birth or Stillbirth (NOB) form. In addition, a physician or coroner is required to complete the Medical Certifi cation of Stillbirth portion of the Registration of Stillbirth and deliver it to the funeral director who in turn submits it to the Agency.
Deaths: The physician in attendance at the last illness of the deceased person, or the coroner conducting an inquiry into the death of the person is required to complete a Medical Certifi cation of Death. In addition, the Registration of Death is completed by the informant with assistance from the funeral home. Funeral Directors obtain the Medical Certifi cation of Death, issue the burial permit, and submit the Medical Certifi cation of Death and the Registration of Death documents to the Agency to complete the registration.
Marriages: The Marriage Act prescribes the legal qualifi cations of individuals to marry, the authorization of Religious Representatives and Marriage Commissioners to perform the marriage ceremony, and the solemnization of marriage. Under the Marriage Act, the Agency licences Religious Representatives of established religious denominations who desire the authority to solemnize marriage. The Agency recommends for appointment Marriage Licence Issuers and Marriage Commissioners to perform civil ceremonies.
Couples who meet the legal qualifi cations to marry must obtain a marriage licence up to 90 days before the ceremony. They can choose a civil ceremony performed by a Marriage Commissioner or a religious ceremony performed by a Religious Representative. The Registration of Marriage is completed by the offi ciant after the ceremony, and must be signed by the offi ciant, the parties getting married, and two witnesses.
MEDICAL CODING
The Notice of Live Birth or Stillbirth includes information on birth weight, gestation, and mode of delivery, as well as abnormalities of the infant and complications of pregnancy, labour, and delivery. The Medical Certifi cation of Death and the Medical Certifi cation of Stillbirth include information on the immediate cause of death or stillbirth, antecedent causes giving rise to the immediate cause, and other signifi cant conditions contributing to the death or stillbirth. This information is processed by medically trained staff using the World Health Organization’s International Statistical Classifi cation of Diseases (ICD) coding scheme. In some instances the Agency's medical coding staff has determined that strict adherence to the automated ICD classifi cation process would misstate the intention of the physician completing the Medical Certifi cation of Death. In these cases the Agency deviates slightly from ICD coding for the material presented in this report. Data coded to automated ICD classifi cation standards are maintained by the Agency for comparison to other jurisdictions or submission to Statistics Canada. Data presented in this report does not necessarily correspond to data for British Columbia published elsewhere.
Since the early 1900s, the International Classifi cation of Diseases has been revised regularly in order to refl ect advances in medical science and changes in diagnostic terminology. The ninth revision of ICD (ICD-9) was used for medical coding of birth complications and causes of death from 1979 until 1999. Coding according to the tenth revision (ICD-10) was implemented at the beginning of the year 2000. Many changes in the codes and in the rules for selection of the underlying cause of death precluded direct comparison of data in ICD-10 with data from earlier years. Translation tables were used, and extensive manual reviews and recoding of data from ICD-9 to ICD-10 was completed in order to be able to provide trend data in this annual report.

I N T R O D U C T I O N 5
TIME PERIODS
This report pertains to events that occurred in the calendar year 2005. Selected tables present aggregate information for the previous fi ve-year period. These broader time periods permit more meaningful tests of statistical signifi cance when analyzing data at sub-provincial levels, and can smooth out random fl uctuations that occur when annual numbers are small. For regional health status profi les, readers are encouraged to refer to measures of statistical signifi cance and use data presented for the fi ve-year aggregates.
The data for earlier years have been updated and may differ from previous publications of the annual report. Readers should treat this report as a replacement of previous annual reports and avoid comparisons with tables in earlier annual reports.
POPULATION DATA
Population estimates for incorporated communities, local health areas, and health regions were provided by BC STATS, Ministry of Labour and Citizens' Services. In the mortality section of this report, a ‘standard population’ is used in the calculation of Age Standardized Mortality Rates (ASMR) and Potential Years Of Life Lost Standardized Rates (PYLLSR). The Agency has used the 1991 Canadian Census population as the ‘standard population’ in the calculation of these age-standardized measures since 1998. Please refer to Standard Population in the Glossary for a more detailed description and the Methodology for examples of computations of measures and statistical tests.
SPATIAL ANALYSIS AND MAPPING
This report presents regional analyses using data dissemination areas used by the Ministry of Health (Health Authority, Health Service Delivery Area, and Local Health Area) and for incorporated communities (see Figures 1 and 2). This continues the practice established in 2001 and provides Health Authorities a consistent time series of health status indicators for their regions. Health care services are managed and delivered by fi ve Health Authorities (HAs) that govern, plan, and coordinate services regionally within 16 Health Service Delivery Areas (HSDAs). The Interior Health Authority encompasses four HSDAs; Fraser, Vancouver Coastal, Vancouver Island, and Northern, each consist of three. HSDAs can be further divided in Local Health Areas (LHAs). Vital events are allocated to these data dissemination areas by the postal codes recorded on registration documents. Marriages are assigned geographically by the postal code of the location where the marriage ceremony was performed; other vital events are assigned by the usual residence of the parents (for live births and stillbirths) or the decedent (for deaths).
Converting statistical data to maps can often reveal relationships that are not readily discernable in tabular form. The maps in this report present local health area data ranked by quintiles and allow easy visual examination of spatial patterns. Although statistics for all LHAs are presented in the maps, emphasis should be placed on those that are statistically signifi cant.
Maps have been included in the Vital Statistics Annual Reports since 1989 in order to disseminate relevant community level health information to the public and to local health service providers, planners, andeducators. These allow communities to address their own specifi c health challenges and identify local health priorities; efforts that can result in locally based solutions and more appropriate decision making.
TERMS, METHODS, AND COMPUTATIONAL EXAMPLES
Readers are encouraged to refer to the Glossary for explanations of terms. The Methodology section provides examples of computations of measures and statistical tests.

6 I N T R O D U C T I O N
NNN
Inset 1Inset 150 kms50 kms0
300 kms0 100 200
see inset 2
10 kms10 kms0Inset 2Inset 2
see inset 1see inset 1
001 Fernie002 Cranbrook003 Kimberley004 Windermere005 Creston006 Kootenay Lake007 Nelson009 Castlegar010 Arrow Lakes011 Trail012 Grand Forks013 Kettle Valley014 Southern Okanagan015 Penticton016 Keremeos017 Princeton018 Golden019 Revelstoke020 Salmon Arm021 Armstrong-Spallumcheen022 Vernon023 Central Okanagan024 Kamloops025 100 Mile House026 North Thompson027 Cariboo-Chilcotin028 Quesnel029 Lillooet030 South Cariboo031 Merritt032 Hope033 Chilliwack034 Abbotsford035 Langley037 Delta038 Richmond040 New Westminster041 Burnaby042 Maple Ridge043 Coquitlam044 North Vancouver045 West Vancouver- Bowen Island
046 Sunshine Coast047 Powell River048 Howe Sound049 Bella Coola Valley050 Queen Charlotte051 Snow Country052 Prince Rupert053 Upper Skeena054 Smithers055 Burns Lake056 Nechako057 Prince George059 Peace River South060 Peace River North061 Greater Victoria062 Sooke063 Saanich064 Gulf Islands065 Cowichan066 Lake Cowichan067 Ladysmith068 Nanaimo069 Qualicum
070 Alberni071 Courtenay072 Campbell River075 Mission076 Agassiz-Harrison077 Summerland078 Enderby080 Kitimat081 Fort Nelson083 Central Coast084 Vancouver Island West085 Vancouver Island North087 Stikine088 Terrace092 Nisga’a094 Telegraph Creek161 Vancouver - City Centre162 Vancouver - Downtown Eastside163 Vancouver - North East164 Vancouver - Westside165 Vancouver - Midtown166 Vancouver - South201 Surrey202 South Surrey/White Rock
60
81
87
94
88
92
50
83
52
56
54
28
57
59
27
26
24 20
1918
49
85
85
72
72
3029
4847 31
78
102221
23
17
77
1614
15 13
12 11
9
7
5
6
4
3
21
32
46
33
84
70
71
33
7675
3435
201
42
43
40
41
38
4445
4846
61
63
64
62
65
66
37
68
67
69
71
70
202
4544
43161
162
163164 165
166
25
53
51
80
83
83
55
FIGURE 1LOCAL HEALTH AREA MAP
BR I T I S H CO L U M B I A

I N T R O D U C T I O N 7
NNN
Inset 1Inset 1
see inset 2
Inset 2Inset 2
see inset 1
Note: Richmond Health ServiceDelivery Area boundary is coterminouswith Richmond LHA. See Figure 1 forLHA clarification.
Health Authorities Health Service Delivery Areas01 Interior 11 East Kootenay
12 Kootenay Boundary13 Okanagan14 Thompson Cariboo Shuswap
02 Fraser 21 Fraser East22 Fraser North23 Fraser South
03 Vancouver Coastal 31 Richmond32 Vancouver33 North Shore/Coast Garibaldi
04 Vancouver Island 41 South Vancouver Island42 Central Vancouver Island43 North Vancouver Island
05 Northern 51 Northwest52 Northern Interior53 Northeast
06 Provincial Health Services Authority
10 kms0
50 kms0
300 kms0 100 200
FIGURE 2HEALTH AUTHORITY & HEALTH SERVICE DELIVERY AREA MAP
BR I T I S H CO L U M B I A


Trends in Vital Events
10 V I T A L E V E N T S
Vital Statistics Information Box
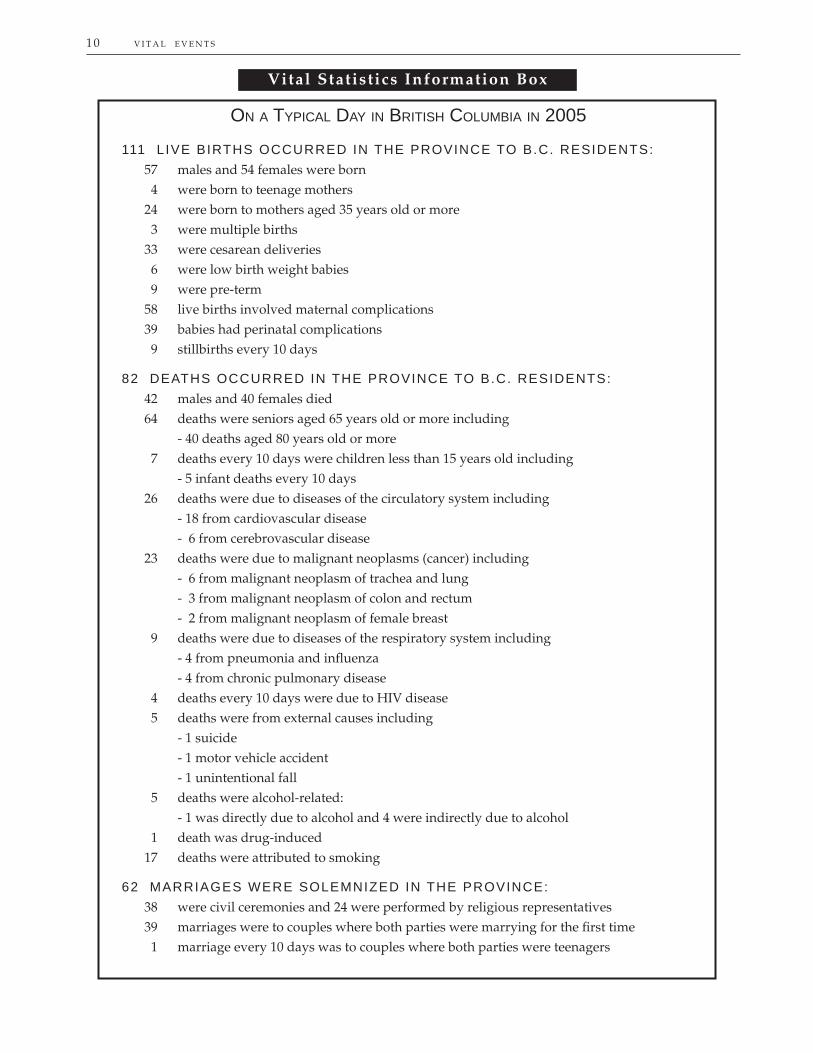
ON A TYPICAL DAY IN BRITISH COLUMBIA IN 2005
111 L IVE BIRTHS OCCURRED IN THE PROVINCE TO B.C. RESIDENTS: 57 males and 54 females were born 4 were born to teenage mothers 24 were born to mothers aged 35 years old or more 3 were multiple births 33 were cesarean deliveries 6 were low birth weight babies 9 were pre-term 58 live births involved maternal complications 39 babies had perinatal complications 9 stillbirths every 10 days
82 DEATHS OCCURRED IN THE PROVINCE TO B.C. RESIDENTS: 42 males and 40 females died 64 deaths were seniors aged 65 years old or more including - 40 deaths aged 80 years old or more 7 deaths every 10 days were children less than 15 years old including - 5 infant deaths every 10 days 26 deaths were due to diseases of the circulatory system including - 18 from cardiovascular disease - 6 from cerebrovascular disease 23 deaths were due to malignant neoplasms (cancer) including - 6 from malignant neoplasm of trachea and lung - 3 from malignant neoplasm of colon and rectum - 2 from malignant neoplasm of female breast 9 deaths were due to diseases of the respiratory system including - 4 from pneumonia and infl uenza - 4 from chronic pulmonary disease 4 deaths every 10 days were due to HIV disease 5 deaths were from external causes including - 1 suicide - 1 motor vehicle accident - 1 unintentional fall 5 deaths were alcohol-related: - 1 was directly due to alcohol and 4 were indirectly due to alcohol 1 death was drug-induced 17 deaths were attributed to smoking
62 MARRIAGES WERE SOLEMNIZED IN THE PROVINCE: 38 were civil ceremonies and 24 were performed by religious representatives 39 marriages were to couples where both parties were marrying for the fi rst time 1 marriage every 10 days was to couples where both parties were teenagers

Trends IntroductionThe tables and fi gures in this part of the Annual Report provide a long term historical review of birth, death, and marriage statistics during the past few decades. They provide a broad context for the recent vital event statistics shown in other parts of this report. Long term trends are always useful for evaluating recent events and trends, so the tables and fi gures are often cross referenced to related tables in subsequent parts of the report.
11
This section begins with a review of population, live birth, stillbirth, death, and marriage trends. This is followed by information on natural population increases, and vital events by month.
Table 1 summarizes vital events that occurred from 1950-2005 and includes the mid-year British Columbia populations. The B.C. population has shown a steady increase since 1950 so the columns, indicating the rates per 1,000 people in the B.C. population, are the most telling indicators.
The rate of live births to residents increased steadily from 1950 to 1957 (as shown in Table 1). It levelled until 1960, and then dropped quite rapidly during the next ten years after which the decline moderated but generally continued until 2005. The death rate, on the other hand, showed a slow regular decline from about ten per 1,000 population in 1950 to about seven per 1,000 in the mid 1980s and has remained at about that level until 2005.
Marriage information pertains to all marriages solemnized in the province, not only those to residents, but the rate is calculated per 1,000 population. The marriage rate was almost ten per 1,000 British Columbians in 1950 but declined to about seven per 1,000 by the mid 1960s, then rose again to almost the 1950 rate by 1970. Since then there has been a slow decline (see Table 1).
Regarding stillbirths, readers should be aware that there was a change in defi nition which led to the apparent ‘jump’ in numbers and rates in 1963 seen in Table 1. That change, and another in 1986, are explained under Stillbirth in the Glossary. Other than the increase in 1963 and irregularities due to small numbers of stillbirths, rates generally declined until the early 1990s and have fl uctuated around seven per 1,000 total births since then.
Table 2 and Figure 4 show the rate of natural population increase in B.C. and Canada over the 56 year period since 1950. Natural Population Growth is explained in the Glossary. Not counting migration into or out of B.C., the population grew “naturally” by 10,620 or at the rate of 2.5 per 1,000 British Columbians in 2005.
B.C.’s rate of natural population increase has been consistently below Canada’s except for the fi rst half of the 1980s (see Table 2). Both B.C.’s and Canada’s rates have gradually declined since the late 1950s. Canada’s NPI rate is projected to become negative in the mid 2020s. As the NPI rate declines, the importance of immigration in maintaining population levels increases.
Table 3 and Figure 5 show the number of live births, deaths, marriages, and stillbirths to residents according to the month in which they occurred. The number of marriages each month includes residents and non-residents. The Percent columns show the monthly percent of all events to residents, except marriages which show the percent of all marriages. The table also includes the number of live births, deaths, and stillbirths to non-residents.
There is continual speculation and anecdotal evidence that vital events tend to occur in particular months or seasons. Well, the data presented in Table 3 and Figure 5 may not put an end to that speculation, but live births and deaths were pretty evenly distributed across the months and seasons in 2005. On the other hand, there was a clear preference to marry during the summer months. Although there were fl uctuations in the number and percentage of stillbirths, due to the small number of events no trend was apparent.
Overview

12 V I T A L E V E N T S
TABLE 1LIVE BIRTHS, DEATHS, MARRIAGES AND STILLBIRTHS
BR I T I S H CO L U M B I A, 1950–2005
Mid-year Live Births Deaths Marriages StillbirthsYear Population Number Rate Number Rate Number Rate Number Rate
1950 1,137,000 27,116 23.85 11,581 10.19 11,110 9.77 369 13.431951 1,165,210 28,077 24.10 11,638 9.99 11,272 9.67 365 12.831952 1,205,000 29,827 24.75 12,080 10.02 11,081 9.20 375 12.421953 1,248,000 31,746 25.44 12,218 9.79 11,298 9.05 375 11.671954 1,295,000 32,946 25.44 12,414 9.59 10,991 8.49 373 11.191955 1,342,000 34,138 25.44 12,816 9.55 11,011 8.20 381 11.041956 1,398,464 36,241 25.91 13,415 9.59 11,950 8.55 413 11.271957 1,482,000 38,744 26.14 13,711 9.25 12,620 8.52 422 10.771958 1,538,000 39,577 25.73 13,741 8.93 12,094 7.86 414 10.351959 1,567,000 39,971 25.51 14,336 9.15 11,910 7.60 404 10.011960 1,602,000 40,116 25.04 14,696 9.17 11,203 6.99 437 10.781961 1,629,100 38,591 23.69 14,403 8.84 10,935 6.71 410 10.511962 1,660,000 38,128 22.97 14,912 8.98 11,196 6.74 377 9.791963 1,699,000 37,478 22.06 15,029 8.85 11,677 6.87 476 12.541964 1,745,000 35,897 20.57 16,051 9.20 12,158 6.97 485 13.331965 1,797,000 33,669 18.74 15,784 8.78 13,639 7.59 447 13.101966 1,873,674 32,502 17.35 16,290 8.69 14,682 7.84 409 12.431967 1,945,000 32,899 16.91 16,170 8.31 16,026 8.24 422 12.661968 2,003,000 33,687 16.82 16,828 8.40 16,914 8.44 433 12.691969 2,060,000 35,383 17.18 17,377 8.44 18,284 8.88 468 13.051970 2,128,000 36,861 17.32 17,020 8.00 20,020 9.41 407 10.921971 2,184,620 34,852 15.95 17,783 8.14 20,389 9.33 442 12.521972 2,241,400 34,563 15.42 18,021 8.04 20,659 9.22 356 10.201973 2,302,400 34,352 14.92 18,095 7.86 21,303 9.25 339 9.771974 2,375,700 35,450 14.92 19,177 8.07 21,734 9.15 364 10.161975 2,433,200 36,281 14.91 19,151 7.87 21,824 8.97 414 11.281976 2,466,610 35,848 14.53 18,788 7.62 21,536 8.73 361 9.971977 2,493,800 36,691 14.71 18,021 7.23 21,156 8.48 330 8.911978 2,530,100 37,231 14.72 19,057 7.53 21,388 8.45 331 8.811979 2,571,200 38,432 14.95 19,204 7.47 22,087 8.59 313 8.081980 2,640,100 40,104 15.19 19,371 7.34 23,830 9.03 316 7.821981 2,744,470 41,679 15.19 19,857 7.24 24,694 9.00 371 8.821982 2,787,700 42,942 15.40 20,704 7.43 23,831 8.55 317 7.331983 2,813,800 43,047 15.30 19,895 7.07 23,692 8.42 310 7.151984 2,847,700 44,040 15.47 20,781 7.30 23,394 8.22 303 6.831985 2,990,000 42,989 14.38 21,131 7.07 22,270 7.45 333 7.691986 3,004,104 41,714 13.89 21,008 6.99 21,843 7.27 308 7.331987 3,050,160 41,611 13.64 21,618 7.09 23,417 7.68 291 6.941988 3,115,357 42,860 13.76 22,357 7.18 24,514 7.87 295 6.841989 3,197,880 43,589 13.63 22,786 7.13 25,177 7.87 324 7.381990 3,290,814 45,347 13.78 23,415 7.12 25,226 7.67 298 6.531991 3,373,464 45,346 13.44 23,819 7.06 23,665 7.02 298 6.531992 3,468,445 46,030 13.27 24,463 7.05 23,762 6.85 297 6.411993 3,567,406 45,956 12.88 25,603 7.18 23,478 6.58 292 6.311994 3,675,699 46,837 12.74 25,830 7.03 23,772 6.47 312 6.621995 3,777,004 46,701 12.36 26,225 6.94 23,632 6.26 350 7.441996 3,874,276 45,960 11.86 27,390 7.07 22,882 5.91 292 6.311997 3,948,544 44,402 11.25 27,260 6.90 21,883 5.54 335 7.491998 3,983,077 42,871 10.76 27,807 6.98 21,778 5.47 278 6.441999 4,011,342 41,748 10.41 27,882 6.95 21,628 5.39 313 7.442000 4,039,198 40,497 10.03 27,327 6.77 22,096 5.47 311 7.622001 4,078,447 40,393 9.90 28,235 6.92 20,573 5.04 287 7.062002 4,115,413 39,905 9.70 28,710 6.98 21,261 5.17 307 7.632003 4,154,591 40,305 9.70 29,151 7.02 21,985 5.29 305 7.512004 4,201,867 40,339 9.60 29,710 7.07 22,081 5.26 281 6.922005 4,254,522 40,653 9.56 30,033 7.06 22,631 5.32 313 7.64
Note: Rates shown for live births, deaths and marriages are crude rates per 1,000 population. Stillbirth rate is per 1,000 total births (live births plus stillbirths). The defi nition of a stillbirth was revised in 1963 and 1986 (see Glossary). Population information from BC Stats, Ministry of Labour and Citizens’ Services. Above information includes late registrations and amendments. Gender unknown included. Non-residents are excluded from all data except marriages.

V I T A L E V E N T S 13
FIGURE 3CRUDE RATES OF LIVE BIRTHS, DEATHS,
MARRIAGES AND STILLBIRTHSBR I T I S H CO L U M B I A, 1950–2005
Note: Stillbirth rate per 1,000 total births
0
3
6
9
12
15
18
21
24
27
30
1950 1955 1960 1965 1970 1975 1980 1985 1990 1995 2000 2005
Year
Live Births Deaths Marriages Stillbirths
Rate Per 1,000 Population

14 V I T A L E V E N T S
FIGURE 4NATURAL POPULATION INCREASES
BR I T I S H CO L U M B I A A N D CA N A D A, 1950–2005
0
5
10
15
20
25
1950 1955 1960 1965 1970 1975 1980 1985 1990 1995 2000 2005Year
B.C. Canada
Rates Per 1,000 Population
TABLE 2NATURAL POPULATION INCREASES
BR I T I S H CO L U M B I A A N D CA N A D A, 1950–2005 Rate
Year B.C. Canada Rate Year B.C. Canada
1950 13.7 18.0 1978 7.2 8.11951 14.1 18.2 1979 7.5 8.41952 14.7 19.2 1980 7.9 8.31953 15.6 19.5 1981 8.0 8.01954 15.9 20.3 1982 8.0 7.91955 15.9 20.0 1983 8.2 7.81956 16.3 19.8 1984 8.2 7.81957 16.9 20.0 1985 7.3 7.51958 16.8 19.6 1986 6.9 7.21959 16.4 19.4 1987 6.6 7.01960 15.9 19.0 1988 6.6 7.01961 14.8 18.4 1989 6.5 7.41962 14.0 17.6 1990 6.7 7.71963 13.2 16.8 1991 6.4 7.41964 11.4 15.9 1992 6.2 7.11965 10.0 13.7 1993 5.7 6.41966 8.7 11.9 1994 5.7 6.11967 8.6 10.8 1995 5.4 5.71968 8.4 10.2 1996 4.8 5.21969 8.7 10.3 1997 4.3 4.41970 9.3 10.1 1998 3.8 4.11971 7.8 9.5 1999 3.5 3.81972 7.4 8.5 2000 3.3 3.71973 7.1 8.1 2001 3.0 3.61974 6.8 8.0 2002 2.7 3.41975 7.0 8.5 2003 2.7 3.41976 6.9 8.4 2004 2.5 3.31977 7.5 8.4 2005 2.5 3.2Note: Rates shown are rates of natural population increase per 1,000 population. Canadian rates from Statistics Canada. Non-residents are excluded.

V I T A L E V E N T S 15
TABLE 3LIVE BIRTHS, DEATHS, MARRIAGES AND STILLBIRTHS BY MONTH
BR I T I S H CO L U M B I A, 2005
Live Births Deaths Marriages StillbirthsMonth Number Percent Number Percent Number Percent Number Percent
January 3,360 8.3 2,996 10.0 772 3.4 24 7.7February 2,956 7.3 2,467 8.2 813 3.6 20 6.4March 3,390 8.3 2,616 8.7 1,002 4.4 22 7.0April 3,368 8.3 2,443 8.1 1,281 5.7 26 8.3May 3,533 8.7 2,525 8.4 2,091 9.2 40 12.8June 3,519 8.7 2,284 7.6 2,161 9.5 23 7.3July 3,484 8.6 2,354 7.8 4,183 18.5 34 10.9August 3,579 8.8 2,318 7.7 3,746 16.6 32 10.2September 3,634 8.9 2,379 7.9 2,929 12.9 19 6.1October 3,438 8.5 2,531 8.4 1,680 7.4 25 8.0November 3,241 8.0 2,439 8.1 826 3.6 23 7.3December 3,151 7.8 2,681 8.9 1,147 5.1 25 8.0Residents* 40,653 100.0 30,033 100.0 22,631 100.0 313 100.0Non-residents 168 280 * 2 TOTAL 40,821 30,313 22,631 315
Note: Total percentage may not add up to 100 due to rounding.*Marriage counts are based on event place and include non-residents.
FIGURE 5LIVE BIRTHS, DEATHS, MARRIAGES AND STILLBIRTHS BY MONTH
BR I T I S H CO L U M B I A, 2005
0
5
10
15
20
25
January February March April May June July August September October November December Month of Event
Percent
Live Births Deaths Marriages Stillbirths

16 V I T A L E V E N T S
1http://www.multiplebirthscanada.org/english/documents/low_birth_bro_fi nal2005.pdf.
Fertility and Live Birth Trends
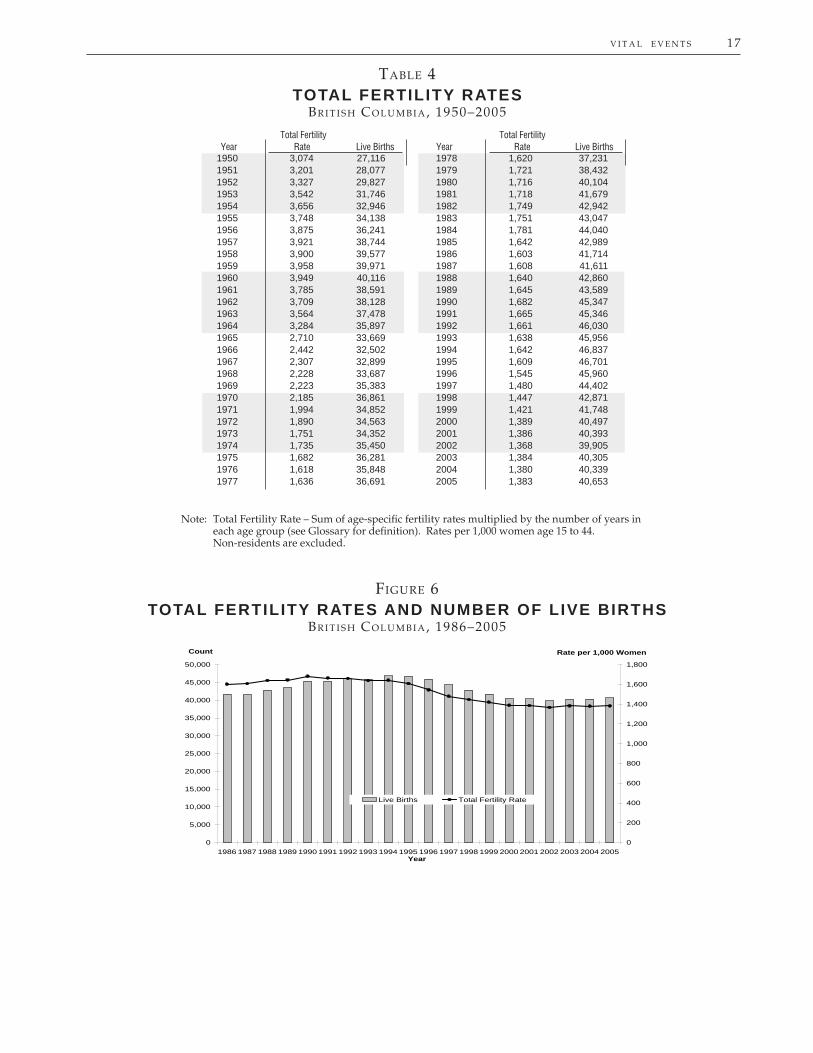
The Total Fertility Rate (TFR) is the number of births 1,000 women can expect during their child bearing years, that is, from 15 to 44 years of age. It is described more fully in the Glossary and an example of the calculation method is shown in the Methodology section.
Fertility in British Columbia has more than halved since 1950 (see Table 4). However, shortly after World War II, fertility began to increase, commonly referred to as the post war baby boom. As shown in Table 4, fertility rates increased from 1950 to 1960 after which there was a sharp decline until the late 1970s. Since then the declining trend has continued more slowly, with periodic fl uctuations, until 2005. Figure 6 shows that slow decline over the last two decades. Fertility by Local Health Areas and among teenagers is analysed in Table 10 and Figure 29 respectively.
In addition to trends in Total Fertility Rates, this section discusses trends in maternal age, multiple births, low birth weight, and Cesarean section deliveries.
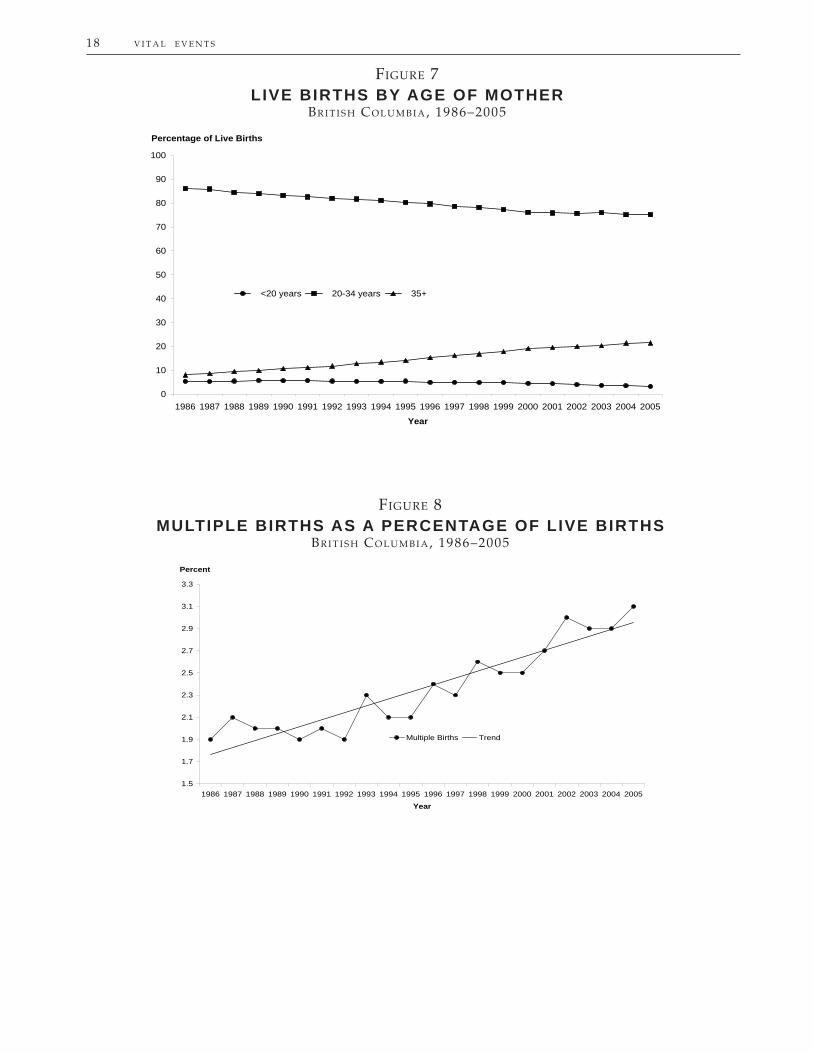
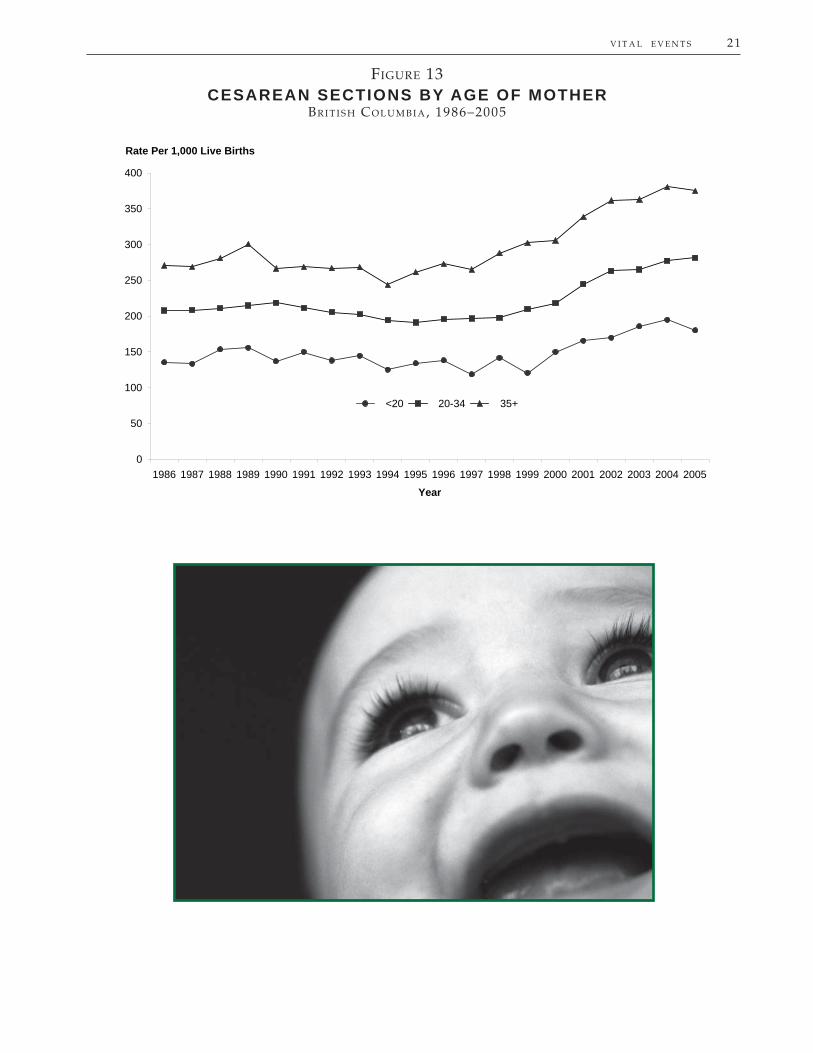
Figure 7 shows annual percentages of live births to women in three age groups for the years 1986-2005. The oldest group (aged 35 years or more) is gradually increasing its percentage at the expense of the two younger groups (less than 20 and 20-34 years old). The average age at which women are bearing children is increasing, but still three quarters of live births are to women in the 20-34 years age group. The long term trend for a higher percentage of elderly gravida (mothers aged 35 years old or more) and a lower percentage for teen mothers were both statistically signifi cant at the 95% level. Maternal age is related to other important birth characteristics and is a component of several tables in Birth-related Statistics section.
Multiple birth infants have a higher risk of preterm birth, low birth weight, perinatal death, and illness than singletons1. Although there were fl uctuations in multiple births as a percentage of live births, Figure 8 clearly indicates the increasing trend over the last two decades. The reader should be aware that multiple births are not counted as instances of multiple birth deliveries but rather as the number of live born babies delivered. Those babies accounted for 1.9% of all live births in 1986 and 3.1% in 2005 which was a statistically signifi cant increase at the 95% level.
Figures 9 and 10 both illustrate the occurrence of Low Birth Weight (less than 2,500 grams) live births over the period 1986-2005. Figure 9 shows both the counts of such births and the rates per 1,000 live births for all mothers. Figure 10 shows the rate per 1,000 live births for mothers 35 years and older. While LBW rates increased gradually (about nine per 1,000 live births over 20 years), the rate in older mothers has increased more sharply (about twenty-one per 1,000). The trends in each of these graphs is statistically signifi cant at the 95% level.
Low birth weight is further analysed in the Births – Birth Weight section of Birth-Related Statistics.
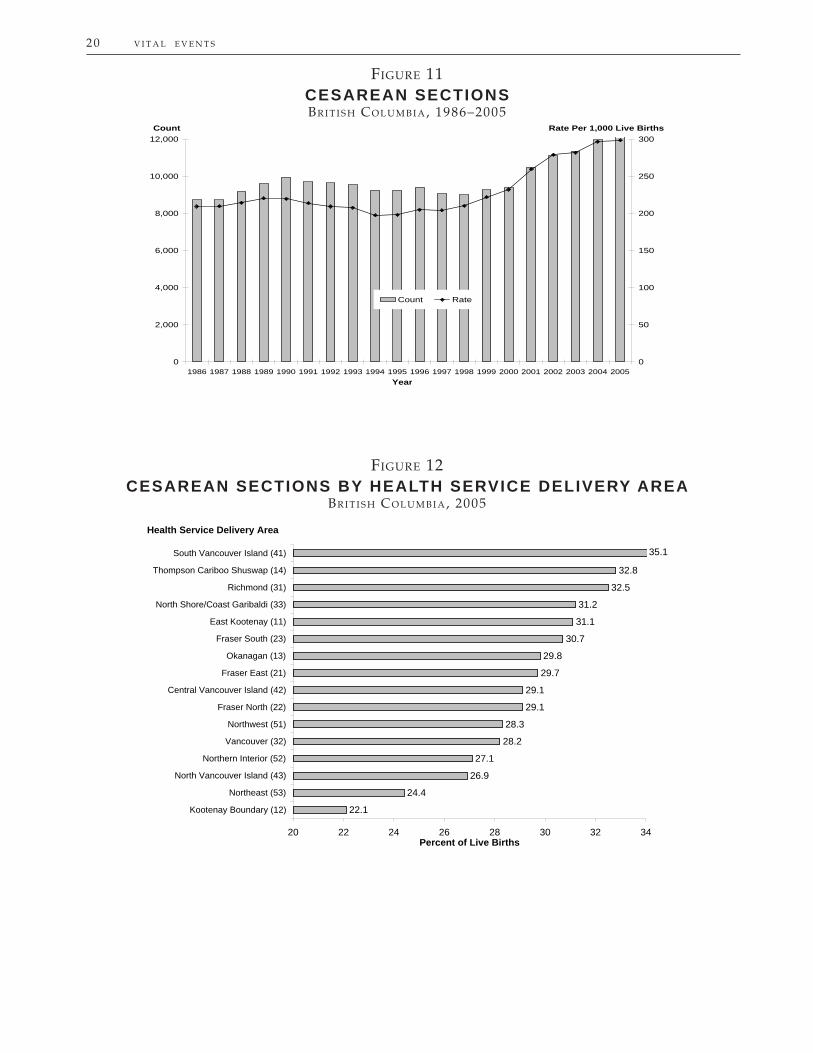
Cesarean sections have become a focus of medical practice and the administration of health care recently and three relevant indicators are presented in Figures 11 through 13. The upward trend in C-section rates since 1986 (Figure 11) is statistically signifi cant at the 95% level, and the increase appears greater in the last few years. C-sections by Health Service Delivery Area (HSDA) varied considerably in 2005 (Figure 12) from a low of 22.1% of live births to residents of Kootenay Boundary to a high of 35.1% of live births to South Vancouver Island residents. An important consideration regarding C-sections is the age of the mother, and there were clear differences between age groups (Figure 13). Cesarean rates were highest for mothers aged 35 or older and lowest for teen mothers, and all age groups showed upward trends that were statistically signifi cant at the 95% level.
Cesarean deliveries are shown in relation to the other modes of delivery in Table 11 and by Local Health Area in Table 12 and Figure 30.
V I T A L E V E N T S 17
Note: Total Fertility Rate – Sum of age-specifi c fertility rates multiplied by the number of years in each age group (see Glossary for defi nition). Rates per 1,000 women age 15 to 44. Non-residents are excluded.
TABLE 4TOTAL FERTILITY RATES
BR I T I S H CO L U M B I A, 1950–2005
Total Fertility Year Rate Live Births
Total Fertility Year Rate Live Births
1950 3,074 27,116 1978 1,620 37,231 1951 3,201 28,077 1979 1,721 38,432 1952 3,327 29,827 1980 1,716 40,104 1953 3,542 31,746 1981 1,718 41,679 1954 3,656 32,946 1982 1,749 42,942 1955 3,748 34,138 1983 1,751 43,047 1956 3,875 36,241 1984 1,781 44,040 1957 3,921 38,744 1985 1,642 42,989 1958 3,900 39,577 1986 1,603 41,714 1959 3,958 39,971 1987 1,608 41,611 1960 3,949 40,116 1988 1,640 42,860 1961 3,785 38,591 1989 1,645 43,589 1962 3,709 38,128 1990 1,682 45,347 1963 3,564 37,478 1991 1,665 45,346 1964 3,284 35,897 1992 1,661 46,030 1965 2,710 33,669 1993 1,638 45,9561966 2,442 32,502 1994 1,642 46,837 1967 2,307 32,899 1995 1,609 46,7011968 2,228 33,687 1996 1,545 45,9601969 2,223 35,383 1997 1,480 44,4021970 2,185 36,861 1998 1,447 42,8711971 1,994 34,852 1999 1,421 41,7481972 1,890 34,563 2000 1,389 40,4971973 1,751 34,352 2001 1,386 40,393 1974 1,735 35,450 2002 1,368 39,9051975 1,682 36,281 2003 1,384 40,3051976 1,618 35,848 2004 1,380 40,3391977 1,636 36,691 2005 1,383 40,653
FIGURE 6TOTAL FERTILITY RATES AND NUMBER OF LIVE BIRTHS
BR I T I S H CO L U M B I A, 1986–2005
0
5,000
10,000
15,000
20,000
25,000
30,000
35,000
40,000
45,000
50,000
1986 1987 1988 1989 1990 1991 1992 1993 1994 1995 1996 1997 1998 1999 2000 2001 2002 2003 2004 2005Year
Count
0
200
400
600
800
1,000
1,200
1,400
1,600
1,800
Rate per 1,000 Women
Live Births Total Fertility Rate
18 V I T A L E V E N T S
FIGURE 8MULTIPLE BIRTHS AS A PERCENTAGE OF LIVE BIRTHS
BR I T I S H CO L U M B I A, 1986–2005
1.5
1.7
1.9
2.1
2.3
2.5
2.7
2.9
3.1
3.3
1986 1987 1988 1989 1990 1991 1992 1993 1994 1995 1996 1997 1998 1999 2000 2001 2002 2003 2004 2005
Year
Percent
Multiple Births Trend
FIGURE 7LIVE BIRTHS BY AGE OF MOTHER
BR I T I S H CO L U M B I A, 1986–2005
0
10
20
30
40
50
60
70
80
90
100
1986 1987 1988 1989 1990 1991 1992 1993 1994 1995 1996 1997 1998 1999 2000 2001 2002 2003 2004 2005
Year
<20 years 20-34 years 35+
Percentage of Live Births

V I T A L E V E N T S 19
FIGURE 9LOW BIRTH WEIGHT LIVE BIRTHS
BR I T I S H CO L U M B I A, 1986–2005
0
500
1,000
1,500
2,000
2,500
1986 1987 1988 1989 1990 1991 1992 1993 1994 1995 1996 1997 1998 1999 2000 2001 2002 2003 2004 2005Year
Count
20
25
30
35
40
45
50
55
60
Count Rate
Rate Per 1,000 Live Births
FIGURE 10LOW BIRTH WEIGHT LIVE BIRTHS FOR MOTHERS AGED 35+
BR I T I S H CO L U M B I A, 1986–2005
40
45
50
55
60
65
70
1986 1987 1988 1989 1990 1991 1992 1993 1994 1995 1996 1997 1998 1999 2000 2001 2002 2003 2004 2005
Year
35+ Trend
Rate Per 1,000 Live Births
20 V I T A L E V E N T S
FIGURE 12CESAREAN SECTIONS BY HEALTH SERVICE DELIVERY AREA
BR I T I S H CO L U M B I A, 2005
22.1
24.4
26.9
27.1
28.2
28.3
29.1
29.1
29.7
29.8
30.7
31.1
31.2
32.5
32.8
35.1
20 22 24 26 28 30 32 34
Kootenay Boundary (12)
Northeast (53)
North Vancouver Island (43)
Northern Interior (52)
Vancouver (32)
Northwest (51)
Fraser North (22)
Central Vancouver Island (42)
Fraser East (21)
Okanagan (13)
Fraser South (23)
East Kootenay (11)
North Shore/Coast Garibaldi (33)
Richmond (31)
Thompson Cariboo Shuswap (14)
South Vancouver Island (41)
Percent of Live Births
Health Service Delivery Area
FIGURE 11CESAREAN SECTIONSBR I T I S H CO L U M B I A, 1986–2005
0
2,000
4,000
6,000
8,000
10,000
12,000
1986 1987 1988 1989 1990 1991 1992 1993 1994 1995 1996 1997 1998 1999 2000 2001 2002 2003 2004 20050
50
100
150
200
250
300
Count Rate
Year
Rate Per 1,000 Live BirthsCount
V I T A L E V E N T S 21
FIGURE 13CESAREAN SECTIONS BY AGE OF MOTHER
BR I T I S H CO L U M B I A, 1986–2005
0
50
100
150
200
250
300
350
400
1986 1987 1988 1989 1990 1991 1992 1993 1994 1995 1996 1997 1998 1999 2000 2001 2002 2003 2004 2005
Year
<20 20-34 35+
Rate Per 1,000 Live Births
22 V I T A L E V E N T S
Infant Mortality Trends
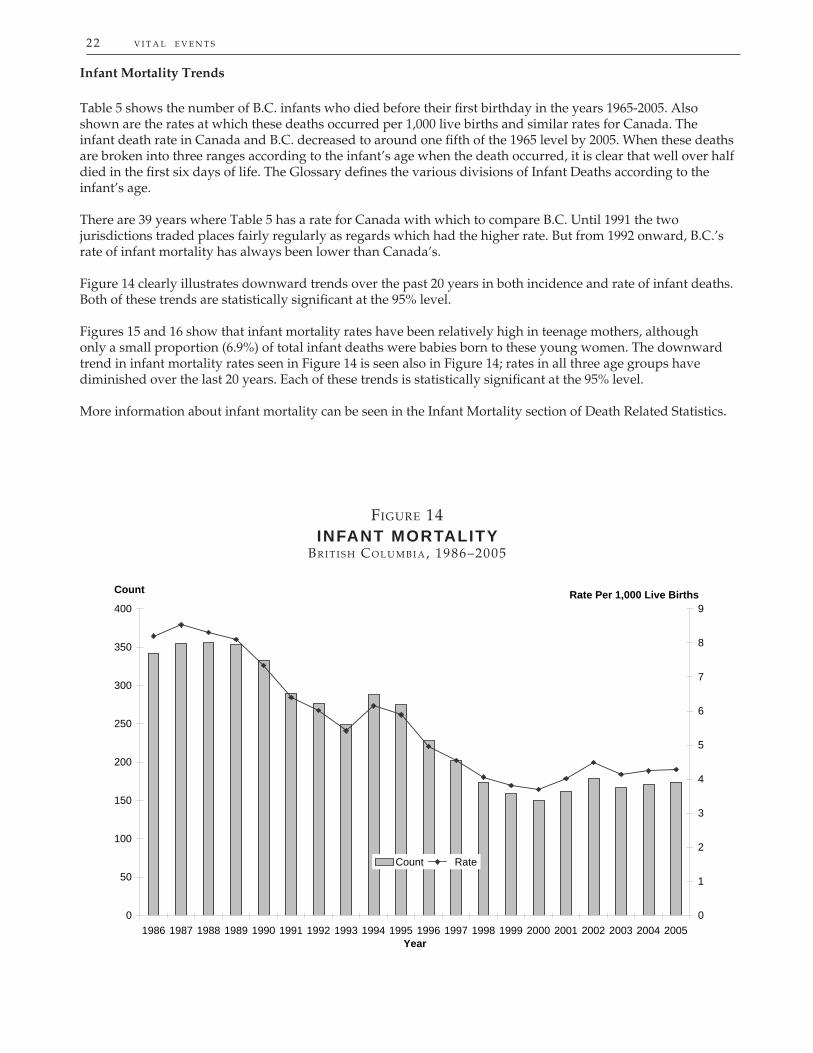
Table 5 shows the number of B.C. infants who died before their fi rst birthday in the years 1965-2005. Also shown are the rates at which these deaths occurred per 1,000 live births and similar rates for Canada. The infant death rate in Canada and B.C. decreased to around one fi fth of the 1965 level by 2005. When these deaths are broken into three ranges according to the infant’s age when the death occurred, it is clear that well over half died in the fi rst six days of life. The Glossary defi nes the various divisions of Infant Deaths according to the infant’s age.
There are 39 years where Table 5 has a rate for Canada with which to compare B.C. Until 1991 the two jurisdictions traded places fairly regularly as regards which had the higher rate. But from 1992 onward, B.C.’s rate of infant mortality has always been lower than Canada’s.
Figure 14 clearly illustrates downward trends over the past 20 years in both incidence and rate of infant deaths. Both of these trends are statistically signifi cant at the 95% level.
Figures 15 and 16 show that infant mortality rates have been relatively high in teenage mothers, although only a small proportion (6.9%) of total infant deaths were babies born to these young women. The downward trend in infant mortality rates seen in Figure 14 is seen also in Figure 14; rates in all three age groups have diminished over the last 20 years. Each of these trends is statistically signifi cant at the 95% level.
More information about infant mortality can be seen in the Infant Mortality section of Death Related Statistics.
FIGURE 14INFANT MORTALITY
BR I T I S H CO L U M B I A, 1986–2005
0
50
100
150
200
250
300
350
400
1986 1987 1988 1989 1990 1991 1992 1993 1994 1995 1996 1997 1998 1999 2000 2001 2002 2003 2004 2005Year
Count
0
1
2
3
4
5
6
7
8
9
Count Rate
Rate Per 1,000 Live Births

V I T A L E V E N T S 23
TABLE 5INFANT MORTALITY
BR I T I S H CO L U M B I A A N D CA N A D A, 1965–2005
British Columbia Canada Age at Death (in Days)
0–6 Days 0–27 Days 28–364 Days TotalYear Number Rate Number Rate Number Rate N.S. Number Rate Rate
Note: Rates per 1,000 live births in the specifi ed year.N.S. – Not stated.Above information includes late registrations and amendments.Canadian rates from Statistics Canada.*Rates were not available.Non-residents are excluded.
1965 415 12.33 453 13.45 227 6.74 3 683 20.29 24.01966 435 13.38 494 15.20 263 8.09 4 761 23.41 23.11967 429 13.04 470 14.29 218 6.63 1 689 20.94 22.01968 375 11.13 438 13.00 214 6.35 4 656 19.47 21.01969 329 9.30 374 10.57 199 5.62 - 573 16.19 19.01970 369 10.01 416 11.29 193 5.24 2 611 16.58 19.01971 409 11.74 450 12.91 185 5.31 - 635 18.22 17.51972 322 9.32 373 10.79 195 5.64 1 569 16.46 17.01973 317 9.23 363 10.57 185 5.39 3 551 16.04 16.01974 310 8.74 348 9.82 196 5.53 2 546 15.40 15.01975 278 7.66 321 8.85 169 4.66 1 491 13.53 14.31976 292 8.15 324 9.04 152 4.24 2 478 13.33 13.51977 246 6.70 276 7.52 200 5.45 - 476 12.97 12.41978 245 6.58 286 7.68 178 4.78 - 464 12.46 12.01979 196 5.10 239 6.22 167 4.35 - 406 10.56 10.91980 188 4.69 235 5.86 186 4.64 - 421 10.50 10.41981 232 5.57 259 6.21 140 3.36 3 402 9.65 9.61982 217 5.05 251 5.85 150 3.49 - 401 9.34 9.11983 193 4.48 212 4.92 145 3.37 2 359 8.34 8.51984 184 4.18 205 4.65 150 3.41 1 356 8.08 8.11985 180 4.19 198 4.61 133 3.09 - 331 7.70 8.01986 164 3.93 195 4.67 147 3.52 - 342 8.20 7.91987 159 3.82 195 4.69 160 3.85 - 355 8.53 7.31988 191 4.46 220 5.13 136 3.17 - 356 8.31 7.21989 186 4.27 215 4.93 138 3.17 - 353 8.10 7.31990 183 4.04 221 4.87 112 2.47 - 333 7.34 6.81991 140 3.09 164 3.62 126 2.78 - 290 6.40 6.41992 153 3.32 173 3.76 104 2.26 - 277 6.02 6.11993 121 2.63 139 3.02 110 2.39 - 249 5.42 6.31994 175 3.74 198 4.23 90 1.92 - 288 6.15 6.31995 158 3.38 181 3.88 94 2.01 - 275 5.89 6.11996 133 2.89 160 3.48 68 1.48 - 228 4.96 5.61997 125 2.82 146 3.29 56 1.26 - 202 4.55 5.51998 94 2.19 114 2.66 60 1.40 - 174 4.06 5.31999 87 2.08 108 2.59 51 1.22 - 159 3.81 5.32000 84 2.07 105 2.59 45 1.11 - 150 3.70 5.32001 103 2.55 126 3.12 36 0.89 - 162 4.01 5.22002 98 2.46 125 3.13 54 1.35 - 179 4.49 5.42003 104 2.58 120 2.98 47 1.17 - 167 4.14 5.32004 108 2.68 122 3.02 49 1.21 - 171 4.24 *2005 104 2.56 124 3.05 50 1.23 - 174 4.28 *

24 V I T A L E V E N T S
FIGURE 15INFANT MORTALITY BY AGE OF MOTHER
BR I T I S H CO L U M B I A, 1986–2005
0
2
4
6
8
10
12
14
16
18
20
1986 1987 1988 1989 1990 1991 1992 1993 1994 1995 1996 1997 1998 1999 2000 2001 2002 2003 2004 2005
Year
<20 years 20-34 years 35+
Rate Per 1,000 Live Births
FIGURE 16PERCENTAGE OF INFANT MORTALITY BY AGE OF MOTHER
BR I T I S H CO L U M B I A, 2005
Mother's Age 35+19.5%
Mother's AgeNot Stated
1.1%
Mother's Age <206.9%
Mother's Age 20-3472.4%
V I T A L E V E N T S 25
Death Trends
This section begins with an examination of counts and rates for all causes of death since 1986. This is followed by information on the average age at death, and cause of death trends for malignant neoplasms (cancer), endocrine, nutritional, and metabolic diseases, nervous system diseases, cardiovascular diseases, cerebrovascular diseases, and motor vehicle accidents.
While Figure 17 shows an increase in the absolute number of deaths from 1986-2005, the standardized rate steadily declined. The provincial ASMR has been on a downward trend since 1986 and the trend is not only statistically signifi cant (95% level) but reached an historic low in 2005. A comparison of the age standardized rates in this fi gure and the crude rates in Table 1 is a good example of the effect of standardization. An aging but growing population in B.C. allowed the ASMR to fall in the interim years.
Although Figure 18 shows the average age at death among British Columbians in 2005 was the same as in 2003 and marginally less than in 2004, the trend indicates a clear increase from 1986 to 2005. Average age at death increased from 69.6 years in 1986 to 73.6 years in 2005, and the trend was statistically signifi cant at the 95% level. This is the arithmetic average of the ages at which people died and is not equivalent to Life Expectancy which is explained in the Glossary.
Figures 19 through 27 refer to certain categories or groups of death causes. All cause groups are identifi ed according to the World Health Organization’s International Statistical Classifi cation of Diseases and Related Health Problems, Tenth Revision (ICD-10) which is a statistical coding system and the accepted international standard. Groups of codes are used in the following fi gures to defi ne particular cause groups and the ICD-10 codes are noted in the comments accompanying the fi gures. Although causes of death in 1986-1999 were originally coded using an earlier ICD version (ICD-9), all ICD-9 codes were recoded to ICD-10 using translation tables and extensive manual reviews (as described under Medical Coding). This approach, which is unique to the Agency’s publications, enables production of trends data.
Note that all causes are based on the Underlying Cause of Death which is explained in the Glossary. While other causes may have contributed, the underlying cause is the ‘primary’ or ‘main’ reason for the death.
The rates are quoted per 10,000 population and have been age standardized to permit yearly rate comparisons because they are adjusted to account for the changing age structure during the years covered. See the Glossary for an explanation of the Age Standardized Mortality Rate (ASMR) and the Methodology section for an example of the calculation method.
Figures 19, 20, and 21 illustrate trends in cancer death incidence and rates. The death rates are expressed as Age Standardized Mortality Rates, which are standardized to the age structure of the Canadian population in 1991. Figure 19 shows that in the years 1986-2005, while the number of deaths due to all types of cancer (malignant neoplasms, ICD-10 codes C00-C97) steadily climbed, the standardized death rates per 10,000 population have fallen. While the cancer death incidence climbed, the deaths occurred at the same time as the B.C. population size climbed even faster. Figure 20 is a similar graph showing incidence and rates of deaths due to lung cancer (malignant neoplasms of trachea and lung, ICD-10 codes C33-C34). Again, as in Figure 19, while the numbers of cancer deaths in B.C. have increased over the 19 years, this increase has been exceeded by the rise in B.C. population numbers, resulting in falling rates of lung cancer deaths.
Figure 21 provides some detail for the lung cancer information in Figure 20. Shown here are lung cancer death rates (per 10,000 standard population) for males and females separately. The falling trend in overall lung cancer death rates, discussed above in Figure 20, is composed of a more steeply declining trend for males and a less steeply increasing trend for females. Both of these trends are statistically signifi cant at the 95% level. Deaths due to cancer are shown in the context of other causes in tables 21, 22, and 23 in Death-Related Statistics.
Deaths due to endocrine, nutritional, and metabolic diseases in Figure 22 (ICD-10 codes E00-E89) include diseases such as diabetes and obesity but a more comprehensive list is shown in Appendix 2. Again, the rates are age standardized to permit comparisons despite the changing age structure during the intervening years.

26 V I T A L E V E N T S
While the overall death rate and the rates due to other causes may have declined, the number and rate of deaths due to endocrine, nutritional, and metabolic diseases have increased, most notably in the last few years. The upward trend in rates is statistically signifi cant at the 95% level. Diabetes mellitus accounted for the major portion of these deaths and is shown in Figure 23. The number of deaths due to diabetes in 2005 is almost three times that in 1986. The upward trend in the rate of death due to diabetes is statistically signifi cant at the 95% level.
Deaths due to diseases of the nervous system are shown in Figure 24 and include causes such as Alzheimer’s disease, Parkinson’s disease, and multiple sclerosis but a comprehensive list appears in Appendix 2 under ICD-10 codes G00-G99. The number and rate of these deaths increased from 1986-2000 after which the number levelled off then decreased in 2005, but the standardized rate has decreased from the high point in 2001. Although there was a statistically signifi cant increasing trend from 1986-2005, it will take a few more years to determine if the recent decline is a genuine reversal of the previous trend.
Figure 25 shows numbers of cardiovascular disease deaths (ICD-10 codes I00-I51) and death rates per 10,000 standard population from 1986-2005. A review of the specifi c causes in this category in Appendix 2 indicated slightly more male deaths than female deaths in 2005. While the incidence numbers rose from 1986-1996 and then generally declined, the death rate has quite consistently fallen over the 20 years (downward trend statistically signifi cant at the 95% level). See Tables 22-23 to compare deaths due to cardiovascular disease with other causes.
Cerebrovascular diseases shown in Figure 26 include ICD-10 codes I60-I69. A review of Appendix 2 indicated that females died from cerebrovascular diseases one and a half times as often as males in 2005. In spite of increases in the number of people dying from these diseases from 1986 until the late 1990s, the standardized rate decreased gradually from 1986-2005 and the downward trend was statistically signifi cant at the 95% level.
Figure 27 provides a visual display of incidence and death rates for motor vehicle accidents (ICD-10 codes V02-V04, V09, V12-V14, V190-V196, V20-V79, V803-V805, V820-V821, V823-V890, V892, V899, Y850) over the period 1986-2004. The incidence numbers are irregular but declining and the declining trend in the standardized death rate was statistically signifi cant at the 95% level. Although the rates are declining and motor vehicle accidents claimed only 1.2% of all deaths in 2005, they are mostly young British Columbians so they remain a concern. See Potential Years of Life Lost due to motor vehicle accidents in Tables 34 and 35.
FIGURE 17DEATHS AND DEATH RATES, ALL CAUSES OF DEATH
BR I T I S H CO L U M B I A, 1986–2005
0
5,000
10,000
15,000
20,000
25,000
30,000
35,000
1986 1987 1988 1989 1990 1991 1992 1993 1994 1995 1996 1997 1998 1999 2000 2001 2002 2003 2004 2005Year
Count
0
10
20
30
40
50
60
70
80
Rate per 10,000 Standard Population
Count Rate

V I T A L E V E N T S 27
FIGURE 18AVERAGE AGE AT DEATH
BR I T I S H CO L U M B I A, 1986–2005
Based on 5 year age groups to 85+
67
68
69
70
71
72
73
74
75
1986 1987 1988 1989 1990 1991 1992 1993 1994 1995 1996 1997 1998 1999 2000 2001 2002 2003 2004 2005
Year
Average Age at Death
Average Age Trend
FIGURE 19DEATHS AND DEATH RATES, MALIGNANT NEOPLASMS (CANCER)
BR I T I S H CO L U M B I A, 1986–2005
0
1,000
2,000
3,000
4,000
5,000
6,000
7,000
8,000
9,000
1986 1987 1988 1989 1990 1991 1992 1993 1994 1995 1996 1997 1998 1999 2000 2001 2002 2003 2004 2005
Year
Count
13
14
15
16
17
18
19
Rate per 10,000 Standard Population
Count Rate

28 V I T A L E V E N T S
FIGURE 20DEATHS AND DEATH RATES, MALIGNANT NEOPLASM OF LUNG
BR I T I S H CO L U M B I A, 1986-2005
0
500
1,000
1,500
2,000
2,500
1986 1987 1988 1989 1990 1991 1992 1993 1994 1995 1996 1997 1998 1999 2000 2001 2002 2003 2004 2005Year
Count
3.5
4.0
4.5
5.0
Rate per 10,000 Standard Population
Count Rate
FIGURE 21DEATH RATES BY GENDER, MALIGNANT NEOPLASM OF LUNG
BR I T I S H CO L U M B I A, 1986-2005
2
3
4
5
6
7
8
1986 1987 1988 1989 1990 1991 1992 1993 1994 1995 1996 1997 1998 1999 2000 2001 2002 2003 2004 2005Year
Rate per 10,000 Standard Population
Male Female Trend

V I T A L E V E N T S 29
FIGURE 22DEATHS AND DEATH RATES, ENDOCRINE,NUTRITIONAL AND METABOLIC DISEASES
BR I T I S H CO L U M B I A, 1986-2005
0
200
400
600
800
1,000
1,200
1,400
1986 1987 1988 1989 1990 1991 1992 1993 1994 1995 1996 1997 1998 1999 2000 2001 2002 2003 2004 2005Year
Count
0
1
2
3
Rate per 10,000 Standard Population
Count Rate
FIGURE 23DEATHS AND DEATH RATES, DIABETES MELLITUS
BR I T I S H CO L U M B I A, 1986–2005
0
200
400
600
800
1,000
1,200
1986 1987 1988 1989 1990 1991 1992 1993 1994 1995 1996 1997 1998 1999 2000 2001 2002 2003 2004 2005Year
Count
0.0
0.5
1.0
1.5
2.0
Rate per 10,000 Standard Population
Count Rate

30 V I T A L E V E N T S
FIGURE 24DEATHS AND DEATH RATES, NERVOUS SYSTEM DISEASES
BR I T I S H CO L U M B I A, 1986-2005
0
200
400
600
800
1,000
1,200
1,400
1986 1987 1988 1989 1990 1991 1992 1993 1994 1995 1996 1997 1998 1999 2000 2001 2002 2003 2004 2005Year
Count
0.0
0.5
1.0
1.5
2.0
2.5
Rate per 10,000 Standard Population
Count Rate
FIGURE 25DEATHS AND DEATH RATES, CARDIOVASCULAR DISEASE
BR I T I S H CO L U M B I A, 1986-2005
5,800
6,000
6,200
6,400
6,600
6,800
7,000
7,200
7,400
1986 1987 1988 1989 1990 1991 1992 1993 1994 1995 1996 1997 1998 1999 2000 2001 2002 2003 2004 2005
Year
Count
0
5
10
15
20
25
Rate per 10,000 Standard Population
Count Rate

V I T A L E V E N T S 31
FIGURE 26DEATHS AND DEATH RATES, CEREBROVASCULAR DISEASES
BR I T I S H CO L U M B I A, 1986-2005
0
500
1,000
1,500
2,000
2,500
1986 1987 1988 1989 1990 1991 1992 1993 1994 1995 1996 1997 1998 1999 2000 2001 2002 2003 2004 2005Year
Count
0
1
2
3
4
5
6
Rate per 10,000 Standard Population
Count Rate
FIGURE 27DEATHS AND DEATH RATES, MOTOR VEHICLE ACCIDENTS
BR I T I S H CO L U M B I A, 1986–2004*
Note: *Data for 2005 is not presented because of known delays in determining causes of death. This means that counts and rates for external causes of death calculated from current year data are known to be severe underestimates of the actual fi gures.
0
100
200
300
400
500
600
700
1986 1987 1988 1989 1990 1991 1992 1993 1994 1995 1996 1997 1998 1999 2000 2001 2002 2003 2004
Year
Count
0.0
0.5
1.0
1.5
2.0
Rate per 10,000 Standard Population
Count Rate

32 V I T A L E V E N T S
Marriage Trends
The topic of Table 6 and Figure 28 is the age at which men and women get married. For the 29 years from 1977-2005 the average marriage age is shown for each gender when marrying for the fi rst time. The table also shows the average age for all marriages, whether they were fi rst or subsequent, in each of the years. The clear and obvious trend is that, with the passage of years, people are waiting until later and later to get married. The average age at marriage rose steadily from 29.3 years in 1977 to 35.7 years in 2005 for men, and from 26.2 years to 33.2 for women over the same period. Similarly, the average age at fi rst marriage has risen by almost six years for men and by six and a half years for women over the same period.
The average age of men who married in 1977-2005 was two or three years older than the average age of women (see Table 6). This difference was slightly less for fi rst marriages compared to all marriages. This indicates that on average, men marry at older ages than women marry.
TABLE 6AGE OF FIRST AND ALL MARRIAGES
BR I T I S H CO L U M B I A, 1977–2005
1977 25.2 22.5 29.3 26.21978 25.2 22.7 29.3 26.31979 25.5 22.9 29.6 26.61980 25.5 23.1 29.6 26.61981 25.7 23.2 29.7 26.71982 26.0 23.6 30.0 26.91983 26.3 23.9 30.3 27.31984 26.6 24.2 30.8 27.71985 26.8 24.5 31.1 28.01986 27.1 24.7 31.6 28.51987 27.6 25.1 32.3 29.31988 27.6 25.3 32.2 29.21989 27.8 25.6 32.5 29.51990 28.0 25.7 32.6 29.61991 28.2 26.1 32.8 29.9
Average Age (in Years)Year of First Marriage All MarriagesMarriage Males Females Males Females
Average Age (in Years)Year of First Marriage All MarriagesMarriage Males Females Males Females1992 28.6 26.4 33.0 30.11993 28.7 26.5 33.1 30.31994 28.8 26.6 33.2 30.31995 28.9 26.8 33.4 30.71996 29.2 27.1 34.0 31.21997 29.4 27.3 34.1 31.31998 29.6 27.5 34.4 31.61999 29.8 27.7 34.7 31.82000 30.0 27.9 34.8 32.12001 30.1 27.9 35.0 32.22002 30.2 28.1 35.3 32.52003 30.9 28.7 35.6 32.92004 31.0 29.0 35.7 33.22005 31.0 29.0 35.7 33.2
FIGURE 28AGE OF FIRST AND ALL MARRIAGES
BR I T I S H CO L U M B I A, 1977–2005
20
22
24
26
28
30
32
34
36
1977 1979 1981 1983 1985 1987 1989 1991 1993 1995 1997 1999 2001 2003 2005Year of Marriage
Average Age (in Years)
1st Marriage Males 1st Marriage FemalesAll Males All Females

Birth-related Statistics

Birth Introduction
After a baby is born everyone asks about the baby’s gender and weight and the condition of the mother and newborn. The same questions are important with regard to births in populations and they are the subject matter in this part of the 2005 Annual Report.
Statistics based on birth events form a crucial part of the demographic profi le of communities, regions, provinces, and countries. They are used to derive important indicators of health status, fertility, infant mortality, and population growth. In turn, those indicators are used for health planning, policy formulation, research, and commerce. The tables in this part of the report present birth statistics categorized by maternal characteristics and other related measures, but all have been shown to relate in varying degrees to birth outcomes. The tables refer to live births although in some cases stillbirths are also included. The mother’s usual residence was used to identify geographic location, not the place where the birth occurred.
Births – General Indicators
Certain birth and parental characteristics that have been shown to be related to outcome or are of general interest and they are presented in this section. These characteristics include age of mother, age of father, kind of birth (single, twin, or other multiple), Local Health Area of usual residence, and mode of delivery.
Table 7 shows the number of live births that were delivered by women at each age. In other words, the columns indicate the number of live born babies that mothers have had up to 2005 including the present one. See also Birth Order in the Glossary. Of course, second, third, and subsequent live births tend to have been delivered to progressively older woman. Over 80% of 2005 live births were fi rst or second births.
Table 7 can also be used to calculate the average age of mothers who gave birth in 2005. The average was 29.9 for all live births, 28.4 years for fi rst live births, 30.8 years for second live births, and 31.9 years for three or more live births.
Additional calculations using the data in Table 7 showed that stillbirth rates were almost fl at across maternal age groups less than 40 years old. Mothers between 25 and 29 and between 30 and 34 years of age had the lowest stillbirth rates (6.40 and 6.82 per 1,000 total births respectively), followed by mothers between 35 and 39 years old (7.80 per 1,000 total births). Mothers between 20 and 24 and teenagers each had somewhat higher rates (8.06 and 8.26 per 1,000 respectively), but mothers 40 years and older had the highest rate at 20.83 per 1,000 total births.
Table 8 shows the number of live births in B.C. in 2005 cross tabulated by the age of mother and the age of father. It also has a line at the bottom showing the percentage of each column’s births that occurred to couples who were not formally married to each other. The Percent row below TOTAL shows the percentage of live births to each age group of mothers. Likewise, the Percent column on the right of the table shows the percentage of live births to fathers in the various age groups.
35

36 B I R T H - R E L A T E D S T A T I S T I C S
Half of the births (50.1%) in 2005 were to mothers 30 to 39 years old and 42.6% were to mothers in their twenties (see Table 8). Only 3.2% were to mothers less than 20 years and 4.0% to those 40 or older. For fathers, almost half (49.5%) were in their thirties, a quarter (25.1%) were in their twenties, 12.6% were in their forties or older and 0.8% were less than 20 years old. In 11.9% of births the father’s age was not indicated.
Less than 1% (0.7%) of births (269) were to couples who were both in their teens; births to couples in which only one was a teen made up 2.8% (1,138) of all births and the mother was the teen for almost all of these (93.5%) as shown in Table 8. While there were only 64 births (0.2%) to mothers over 44 years old, 3.6% (1,461) of newborns had fathers over that age.
Table 8 also shows, for each age range of mothers, the number of infants born to couples who were not formally married to each other (Out-of-Wedlock). While this might once have been an indicator of unstable family structure, this is now more a point of interest than an indicator of social dysfunction.
In general, the greatest potential value of Table 8 lies in its showing the incidence of live births to individuals at the upper and lower extremes of the age ranges.
Table 9 shows the number of births where a single baby was delivered, the number of births that were twin deliveries, and the number that were triplets or more according to the mother’s age group. You should be aware that multiple births are not counted as instances of multiple birth deliveries but rather as the number of live born babies delivered in each kind of delivery. The table confi rms that the likelihood of a multiple pregnancy increases with maternal age. In 2005, 4.2% of births to mothers 35 years and older were multiple live births; whereas, 2.9% of births to mothers aged 20 to 34 were multiples and teenagers had the lowest proportion (1.2%). Although older mothers had more multiple births than younger ones in 2005, we cannot conclude that a woman’s likelihood of having a twin or triplet will increase as she grows older.
In recent decades there has been a gradual increase in multiple birth rates in British Columbia (see Figure 7). The proportions of multiple live births increased from 1.9% of all live births in 1986 to 3.1% in 2005., but most deliveries (96.9%) are still singletons.
Table 10 shows 2005 fertility rates in the Local Health Area (LHA) where the mother resided and by maternal age groups. The table also shows the number of live births to women 15-19 years of age over the fi ve year period 2000-2004 and the fertility rate for that age group.
The columns in Table 10 (from left to right) show the number and name of the Local Health Area (with a B.C. total line), the number of live births that occurred (Observed) to 15-19 year olds over the years 2000-2004, and the age specifi c fertility rate (ASFR) in the same age group and time period. The ASFRs in 2005 are shown for six age ranges as well as the Total Fertility Rate or TFR, a measure of the potential effect of the current fertility rates on family size. After the ASFR for 2000-2004 and the TFR for 2005 there is a column labelled (p) which indicates the results of a statistical test of signifi cance. For the defi nition of the Age Specifi c Fertility Rate (ASFR) and Total Fertility Rate (TFR) see the Glossary. For computational descriptions of both rates see Fertility Rates in the Methodology section, which also provides an example of the statistical test of signifi cance.
An area’s fertility rate is affected by the age distribution of its population. As seen in Table 10, live birth fertility rates for 2005 reached a peak between the ages of 25 and 34 years; areas where the age distribution is skewed away from that age range (either more younger or more older people) will have a lower proportion of individuals in the most fertile part of life.
Fertility rates are one determinant of an area’s population increase or decrease. If the average number of children born to each woman in an area falls below 2.1, the total population will begin to decline unless there is suffi cient counterbalancing population increase from in-migration.

B I R T H - R E L A T E D S T A T I S T I C S 37
The focus on teenage fertility in this table is due to the potentially disruptive effects of pregnancy and birth on young women and to possible adverse outcomes to their babies. In B.C. the 15-19 year old fertility rate for 2005 (9.69) was less than the rate for the years 2000-2004 (11.96) as shown in Table 10.
In Figure 29 the ASFR statistics for 15-19 year olds from 2000 to 2004 are shown by LHA. The LHAs are grouped into fi ve groups from those with the highest ASFRs (dark green) to those with the lowest (dark grey). In general, more rural LHAs have higher ASFRs than more urban; more northerly higher than more southerly.
Table 11 shows the number and percentage of births in each maternal age group according to their mode of delivery. Generally, the percent of age group births that were delivered by spontaneous vertex, and to a lesser extent by vacuum extraction, decreased as mothers got older. On the other hand, deliveries by cesarean section increased proportionally as mothers got older (see also Figure 12). However, it is noteworthy that the percentage of fi rst cesareans remained relatively stable from 15-19 up to the 35-39 year age group after which there was a dramatic increase, while repeat cesareans increased with increasing maternal age.
The number of cesarean deliveries in B.C. increased from 21.0% of all live births in 1986 to 29.8% in 2005 (see Figure 10).
Table 12 shows live births by the Local Health Area (LHA) where the mother usually resided and focuses on spontaneous vertex and cesarean modes of delivery. Spontaneous breech, forceps, and vacuum deliveries are combined into the ‘Other’ category. The table shows the number and percent of live births that were delivered by cesarean. The ratios indicate the number of observed cesarean births to residents of the LHA divided by the number that would be expected if the LHA had the provincial rates. The (p) indicates which observed values were signifi cantly different from the expected value. The Methodology section shows an example of the calculation method for the Observed versus Expected Ratio and the Statistical Test of Signifi cance.
The columns on the right side of Table 12 indicate the total number of live births in 2005 to residents of each LHA and the birth rate per 1,000 population. Expressing the number of births this way allows comparison of LHAs with regard to the birth ‘productivity’. The LHA with the highest live birth rate had nearly four times the rate of the lowest. In areas where a high birth rate sustained over a number of years, the proportion of infants and young people may rise and the need for services dealing with that part of the population could increase.
This look at births with regard to the mode of allows health care practitioners, administrators, and others to monitor delivery modes in their local area, make comparisons to other areas, and see their relative place in the province. To repeat, the cesarean section rate per 1,000 live births in B.C. has risen consistently over the past few years from 21.0% in 1986 to 29.9% in 2005. For more comparisons of cesarean rates see also Figures 10, 11, and 12.
In Figure 30 the Local Health Areas (LHAs) are grouped with regard to their Ratio of observed number of cesarean live births over expected number of cesarean live births for 2005. The fi gure shows the LHAs in quintiles (that is fi ve groups with equal numbers of LHAs) from those with the highest cesarean Ratios (quintile 5) to those with the lowest such rates (quintile 1).
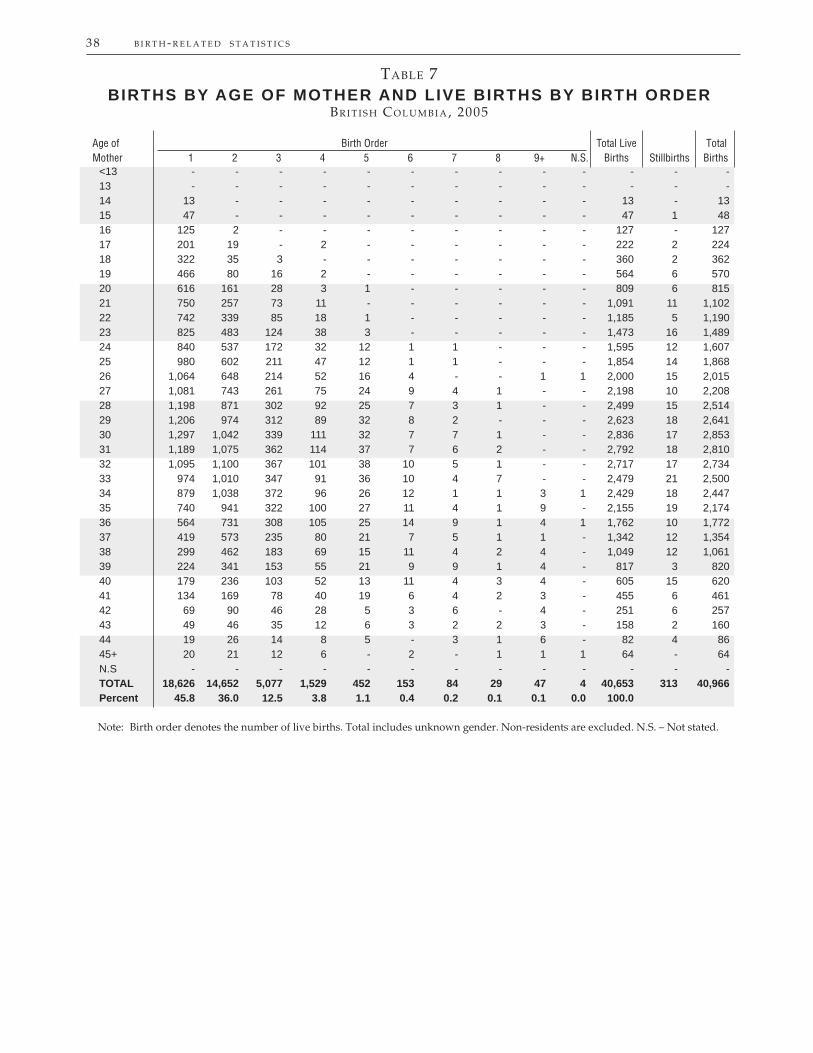
38 B I R T H - R E L A T E D S T A T I S T I C S
TABLE 7BIRTHS BY AGE OF MOTHER AND LIVE BIRTHS BY BIRTH ORDER
BR I T I S H CO L U M B I A, 2005
Age of Birth Order Total Live TotalMother 1 2 3 4 5 6 7 8 9+ N.S. Births Stillbirths Births
Note: Birth order denotes the number of live births. Total includes unknown gender. Non-residents are excluded. N.S. – Not stated.
<13 - - - - - - - - - - - - -13 - - - - - - - - - - - - -14 13 - - - - - - - - - 13 - 1315 47 - - - - - - - - - 47 1 4816 125 2 - - - - - - - - 127 - 12717 201 19 - 2 - - - - - - 222 2 22418 322 35 3 - - - - - - - 360 2 36219 466 80 16 2 - - - - - - 564 6 57020 616 161 28 3 1 - - - - - 809 6 81521 750 257 73 11 - - - - - - 1,091 11 1,10222 742 339 85 18 1 - - - - - 1,185 5 1,19023 825 483 124 38 3 - - - - - 1,473 16 1,48924 840 537 172 32 12 1 1 - - - 1,595 12 1,60725 980 602 211 47 12 1 1 - - - 1,854 14 1,86826 1,064 648 214 52 16 4 - - 1 1 2,000 15 2,01527 1,081 743 261 75 24 9 4 1 - - 2,198 10 2,20828 1,198 871 302 92 25 7 3 1 - - 2,499 15 2,51429 1,206 974 312 89 32 8 2 - - - 2,623 18 2,64130 1,297 1,042 339 111 32 7 7 1 - - 2,836 17 2,85331 1,189 1,075 362 114 37 7 6 2 - - 2,792 18 2,81032 1,095 1,100 367 101 38 10 5 1 - - 2,717 17 2,73433 974 1,010 347 91 36 10 4 7 - - 2,479 21 2,50034 879 1,038 372 96 26 12 1 1 3 1 2,429 18 2,44735 740 941 322 100 27 11 4 1 9 - 2,155 19 2,17436 564 731 308 105 25 14 9 1 4 1 1,762 10 1,77237 419 573 235 80 21 7 5 1 1 - 1,342 12 1,35438 299 462 183 69 15 11 4 2 4 - 1,049 12 1,06139 224 341 153 55 21 9 9 1 4 - 817 3 82040 179 236 103 52 13 11 4 3 4 - 605 15 62041 134 169 78 40 19 6 4 2 3 - 455 6 46142 69 90 46 28 5 3 6 - 4 - 251 6 25743 49 46 35 12 6 3 2 2 3 - 158 2 16044 19 26 14 8 5 - 3 1 6 - 82 4 8645+ 20 21 12 6 - 2 - 1 1 1 64 - 64N.S - - - - - - - - - - - - -TOTAL 18,626 14,652 5,077 1,529 452 153 84 29 47 4 40,653 313 40,966Percent 45.8 36.0 12.5 3.8 1.1 0.4 0.2 0.1 0.1 0.0 100.0

B I R T H - R E L A T E D S T A T I S T I C S 39
TABLE 8TOTAL LIVE BIRTHS BY AGE OF FATHER,AGE OF MOTHER AND OUT-OF-WEDLOCK
BR I T I S H CO L U M B I A, 2005
Age of Mother (in Years)Age of Father <15 15–19 20–24 25–29 30–34 35–39 40–44 45+ N.S. Total Percent
Note: Total percentage may not add up to 100 due to rounding. Out-of-Wedlock - Indicates mother and father of child were not legally married to each other and excludes 1,919 cases where marital status was not stated. Non-residents are excluded. N.S. – Not stated.
< 15 - 1 - - - - - - - 1 0.0 15-19 5 263 66 7 1 - - - - 342 0.8 20-24 2 470 1,738 427 75 14 3 - - 2,729 6.7 25-29 - 130 2,042 4,093 1,050 163 14 2 - 7,494 18.4 30-34 - 33 758 3,700 5,839 1,114 95 - - 11,539 28.4 35-39 - 13 238 1,247 3,710 3,057 323 9 - 8,597 21.1 40-44 - 2 75 344 1,044 1,581 601 17 - 3,664 9.0 45+ - 2 32 149 352 575 325 26 - 1,461 3.6 N.S. 6 406 1,204 1,207 1,182 621 190 10 - 4,826 11.9 TOTAL 13 1,320 6,153 11,174 13,253 7,125 1,551 64 - 40,653 Percent 0.0 3.2 15.1 27.5 32.6 17.5 3.8 0.2 - 100.0Out-of-Wedlock 12 1,106 3,212 2,810 1,975 1,147 335 16 - 10,613
TABLE 9LIVE BIRTHS BY AGE OF MOTHER AND KIND OF BIRTH
BR I T I S H CO L U M B I A, 2005
Age of Kind of BirthMother Single Twin Triplets+ Total
< 15 13 - - 13 15-19 1,304 16 - 1,320 20-24 6,014 139 - 6,153 25-29 10,866 302 6 11,174 30-34 12,823 430 - 13,253 35-39 6,829 287 9 7,125 40-44 1,486 62 3 1,551 45 + 54 10 - 64 N.S. - - - - TOTAL 39,389 1,246 18 40,653
Note: For the multiple births which include stillbirths, only live births are shown in this table. Triplets+ : included in this column are the live births from multiple births of three or more. Non-residents are excluded. N.S.- Not stated.

40 B I R T H - R E L A T E D S T A T I S T I C SL
IVE
BIR
TH
FE
RT
ILIT
Y R
AT
ES
BY
LO
CA
L H
EA
LT
H A
RE
A,
BR
ITIS
H C
OL
UM
BIA
, 20
00–2
004
AN
D 2
005
Tab
le
10
2000–2004 Teenage Fertility Rate (15–19 yrs) 2005 ASFR1 TFR2
Local Health Area Observed ASFR1 (p) 15–19 20–24 25–29 30–34 35–39 40–44 Rate (p) 001 Fernie 38 13.04 4.92 36.86 83.87 97.04 33.60 2.72 1,295.02 002 Cranbrook 108 21.34 * 8.31 56.55 84.11 62.75 28.57 4.79 1,225.38 003 Kimberley 18 13.40 4.13 33.96 66.67 115.58 33.11 2.51 1,279.79 004 Windermere 20 11.34 6.21 35.05 65.28 74.40 22.50 2.04 1,027.41 * 005 Creston 86 37.47 * 22.36 95.82 120.44 96.90 22.88 8.64 1,835.17 * 006 Kootenay Lake 8 13.20 - 51.47 187.50 179.78 45.87 16.00 2,403.09 * 007 Nelson 27 5.72 * 5.49 22.70 91.73 126.52 41.78 6.83 1,475.27 009 Castlegar 10 4.04 * 4.33 20.68 76.73 84.66 27.40 5.68 1,097.37 * 010 Arrow Lakes 6 7.47 - 41.18 35.71 79.37 7.35 - 818.04 * 011 Trail 23 5.71 * 10.84 44.28 55.56 142.86 27.07 5.08 1,428.43 012 Grand Forks 28 16.83 3.44 34.16 86.73 110.47 40.54 5.93 1,406.36 013 Kettle Valley 12 20.10 8.62 60.34 129.03 108.11 11.11 8.40 1,628.10 014 Southern Okanagan 35 13.67 9.11 52.24 53.06 56.51 34.86 9.85 1,078.15 * 015 Penticton 100 15.41 * 11.57 43.06 79.53 84.57 27.97 5.77 1,262.33 016 Keremeos 11 17.71 - 54.05 61.40 90.00 22.22 5.59 1,166.33 017 Princeton 7 9.51 27.78 122.95 72.92 60.98 23.62 5.05 1,566.47 018 Golden 20 15.47 8.26 57.24 140.19 65.84 32.84 5.33 1,548.52 019 Revelstoke 22 14.12 12.50 58.02 111.70 87.14 28.17 - 1,487.64 020 Salmon Arm 53 9.33 * 10.45 48.01 101.90 83.22 33.05 4.52 1,405.83 021 Armstrong - Spallumcheen 14 6.82 * - 46.88 102.65 67.26 26.42 11.63 1,274.16 022 Vernon 119 10.92 14.22 46.65 89.20 100.64 37.10 1.62 1,447.13 023 Central Okanagan 287 10.84 8.96 43.34 77.98 87.94 36.51 6.38 1,305.51 * 024 Kamloops 255 13.80 * 10.02 49.19 76.20 73.40 34.47 4.80 1,240.40 * 025 100 Mile House 38 13.40 8.98 33.27 154.26 71.63 19.31 3.24 1,453.39 026 North Thompson 19 18.22 9.76 34.65 106.38 119.05 13.95 4.63 1,442.12 027 Cariboo - Chilcotin 139 24.13 * 19.75 62.86 88.15 58.62 28.73 1.76 1,299.32 028 Quesnel 82 15.89 * 27.86 58.13 87.76 67.99 19.41 2.81 1,319.78 029 Lillooet 30 28.74 * 9.17 68.57 189.78 88.24 29.85 - 1,928.06 * 030 South Cariboo 30 20.56 * 27.59 73.95 100.00 88.05 24.79 - 1,571.92 031 Merritt 45 18.77 * 18.11 74.83 114.29 62.67 34.91 3.92 1,543.64 032 Hope 50 31.11 * 27.12 63.12 158.47 59.78 25.00 2.86 1,681.76 033 Chilliwack 308 22.71 * 16.79 72.89 116.50 101.18 44.34 5.29 1,784.94 * 034 Abbotsford 319 14.40 * 8.94 71.29 145.12 96.47 36.86 5.94 1,823.12 * 035 Langley 200 9.34 * 6.31 33.89 103.00 118.28 43.77 6.49 1,558.75 * 037 Delta 100 5.21 * 1.24 30.48 84.05 105.16 55.45 7.77 1,420.74 038 Richmond 92 3.35 * 2.62 15.14 59.00 103.08 60.46 9.96 1,251.32 * 040 New Westminster 101 15.29 * 8.76 52.80 90.96 80.46 48.05 7.69 1,443.54 041 Burnaby 206 6.77 * 5.63 21.35 68.82 98.15 53.79 10.95 1,293.42 * 042 Maple Ridge 139 9.34 * 7.00 33.27 83.48 102.98 36.82 7.22 1,353.83 043 Coquitlam 225 6.48 * 3.28 23.13 63.82 114.53 55.64 7.99 1,341.96 044 North Vancouver 89 4.20 * 2.90 16.25 50.09 111.87 64.86 9.32 1,276.41 * 045 West Vancouver - Bowen Is. 14 1.72 * 3.54 4.78 32.00 95.46 85.98 19.06 1,204.09 * 046 Sunshine Coast 36 7.28 * 10.18 28.14 74.90 84.53 41.18 9.34 1,241.35 047 Powell River 46 13.38 15.65 44.75 91.12 79.37 18.92 3.49 1,266.48 048 Howe Sound 73 16.82 * 14.43 32.49 63.77 94.66 56.07 14.08 1,377.48 049 Bella Coola Valley 32 42.95 * 66.67 122.64 141.03 112.07 40.65 14.08 2,485.69 * 050 Queen Charlotte 23 27.81 * 12.42 89.55 107.84 84.66 21.65 4.29 1,602.05 051 Snow Country 1 9.17 - - 62.50 60.61 54.05 - 885.80 052 Prince Rupert 136 41.92 * 23.32 68.38 61.90 57.32 21.41 11.14 1,217.30 053 Upper Skeena 48 44.61 * 35.18 117.15 111.11 63.41 19.92 4.15 1,754.63 054 Smithers 77 20.86 * 23.07 82.92 128.34 85.80 40.60 6.60 1,836.59 * 055 Burns Lake 42 26.50 * 13.79 91.77 130.23 82.61 18.18 6.90 1,717.42 056 Nechako 98 28.82 * 31.70 85.94 181.30 59.39 21.74 7.04 1,935.51 * 057 Prince George 382 18.76 * 14.37 73.83 91.87 73.83 26.55 4.98 1,427.09 059 Peace River South 119 23.17 * 21.67 70.86 105.94 53.36 11.37 7.03 1,351.11 060 Peace River North 197 31.89 * 22.83 109.89 165.23 89.54 39.57 7.30 2,171.86 * 061 Greater Victoria 298 10.08 * 8.70 30.92 60.71 82.18 45.87 9.90 1,191.41 * 062 Sooke 108 11.00 10.94 43.15 99.66 139.73 43.75 11.07 1,741.49 * 063 Saanich 68 7.06 * 7.47 25.84 62.54 109.85 50.59 9.37 1,328.32 064 Gulf Islands 10 4.56 * 9.11 16.53 58.14 87.95 61.22 6.33 1,196.41 065 Cowichan 201 20.55 * 16.19 47.86 78.56 98.82 34.44 8.62 1,422.48 066 Lake Cowichan 24 19.93 9.09 53.64 75.34 120.00 9.22 - 1,336.45 067 Ladysmith 58 20.63 * 21.78 60.87 139.34 111.11 30.82 7.60 1,857.62 * 068 Nanaimo 248 14.56 * 12.53 47.19 81.56 76.62 27.74 4.61 1,251.32 * 069 Qualicum 55 9.90 6.11 45.73 75.88 76.57 29.81 5.96 1,200.29 * 070 Alberni 157 29.00 * 26.29 63.38 105.03 129.03 27.52 6.77 1,790.14 * 071 Courtenay 159 14.57 * 11.11 36.03 84.47 90.72 37.28 8.88 1,342.44 072 Campbell River 141 18.77 * 21.40 37.60 106.20 81.50 21.17 3.45 1,356.64 075 Mission 116 15.33 * 13.54 51.75 131.51 129.06 40.68 4.83 1,856.83 * 076 Agassiz - Harrison 35 24.49 * 30.82 57.55 116.82 138.46 35.09 13.79 1,962.70 * 077 Summerland 12 5.75 * 18.52 20.27 42.35 137.57 48.78 - 1,337.40 078 Enderby 33 23.26 * 11.32 78.43 147.73 40.94 50.42 9.17 1,690.05 080 Kitimat 33 12.30 15.21 52.26 111.94 55.87 23.76 3.77 1,314.02 081 Fort Nelson 39 28.85 * 34.09 108.47 110.34 80.00 34.60 4.15 1,858.31 * 083 Central Coast 17 47.09 * 27.40 214.29 150.00 84.51 64.52 - 2,703.53 * 084 Vancouver Island West 25 48.26 * 29.13 100.00 117.65 31.25 32.00 - 1,550.12 085 Vancouver Island North 108 36.47 * 24.39 72.87 112.12 43.31 37.74 8.20 1,493.13 087 Stikine 9 48.65 * - 93.02 30.30 56.60 - - 899.65 088 Terrace 128 28.97 * 24.52 79.17 105.12 70.59 21.16 3.38 1,519.72 092 Nisga’a 30 75.19 * 56.34 146.67 76.92 107.14 50.85 - 2,189.59 094 Telegraph Creek 7 59.32 * - 150.00 - 80.00 93.75 - 1,618.75 161 Vancouver - City Centre 23 3.86 * 5.26 10.29 23.35 39.36 38.39 13.39 650.15 * 162 Vancouver - Downtown E.side 92 21.18 * 20.74 49.69 69.07 58.31 41.74 11.64 1,255.90 * 163 Vancouver - North East 84 6.25 * 5.63 34.00 87.17 99.01 58.06 14.93 1,494.03 * 164 Vancouver - Westside 17 0.92 * 1.35 5.56 23.64 75.15 80.60 19.73 1,030.14 * 165 Vancouver - Midtown 119 11.79 5.59 36.21 72.69 92.60 54.02 14.54 1,378.22 166 Vancouver - South 94 4.62 * 6.44 32.45 63.47 91.83 54.64 15.40 1,321.18 201 Surrey 684 13.24 * 9.06 71.40 138.69 105.01 42.51 8.82 1,877.46 * 202 South Surrey/White Rock 19 1.76 * 4.29 14.30 61.32 143.03 65.13 7.76 1,479.19 PROVINCIAL TOTAL 8,104 11.96 9.69 41.64 80.80 90.86 44.99 8.65 1,383.13 Notes for this table follow the map.
40

B I R T H - R E L A T E D S T A T I S T I C S 41
Note: ASFR - Age-Specifi c Fertility Rate - Live births per 1,000 women age 15 to 19 years. Refer to Figure 1 to clarify geographical location of Local Health Area
N
Statistically Significant
QUINTILE (Rates)
5 ( > 26.50)
2 (7.28 - 13.31)
1 ( < 7.28)
4 ( 17.97 - 26.50)
3 ( 13.31 - 17.97)
Inset 1
see inset 2
Inset 2
see inset 1
10 kms0
50 kms0
300 kms0 100 200
FIGURE 29LIVE BIRTH TEENAGE FERTILITY RATES BY LOCAL HEALTH AREA
BR I T I S H CO L U M B I A, 2000-2004
Notes for Table 10
Note: 1Age-Specifi c Fertility Rate (ASFR): Live births per 1,000 women in each specifi c age group ofchildbearing age. 2Total Fertility Rate (TFR): Sum of age-specifi c (15 to 44 years) fertility rates multiplied by the number of years in each age group (see Glossary fordefi nition). *Statistical testing indicates that fertility rate is signifi cantly different from the average rate(p<0.05, two tailed). Total includes residents with unknown LHA.

42 B I R T H - R E L A T E D S T A T I S T I C S
TABLE 11LIVE BIRTHS BY MODE OF DELIVERY AND AGE OF MOTHER
BR I T I S H CO L U M B I A, 2005
Age of Mother (in Years)Mode of Delivery <15 15–19 20–24 25–29 30–34 35–39 40–44 45+ N.S. Total
Spontaneous vertex 8 971 4,064 6,909 7,776 3,872 757 20 - 24,377Percent 61.5 73.6 66.0 61.8 58.7 54.3 48.8 31.3 60.0Spontaneous breech - 2 14 36 44 28 6 - - 130Percent - 0.2 0.2 0.3 0.3 0.4 0.4 - 0.3Forceps 1 21 202 427 504 264 54 4 - 1,477Percent 7.7 1.6 3.3 3.8 3.8 3.7 3.5 6.3 3.6Vacuum 1 90 446 740 794 368 84 3 - 2,526Percent 7.7 6.8 7.2 6.6 6.0 5.2 5.4 4.7 6.2First cesarean 3 220 1,084 2,030 2,470 1,339 367 23 - 7,536Percent 23.1 16.7 17.6 18.2 18.6 18.8 23.7 35.9 18.5Repeat cesarean - 16 343 1,032 1,665 1,254 283 14 - 4,607Percent - 1.2 5.6 9.2 12.6 17.6 18.2 21.9 11.3N.S. - - - - - - - - - -TOTAL 13 1,320 6,153 11,174 13,253 7,125 1,551 64 - 40,653Percent 100.0 100.0 100.0 100.0 100.0 100.0 100.0 100.0 100.0
Note: Breech presentations may be coded to forceps, vacuum, fi rst cesarean or repeat cesarean mode of delivery, as well as spontaneous breech. Total percentage may not add up to 100 due to rounding. Non-residents are excluded. N.S. - Not stated.
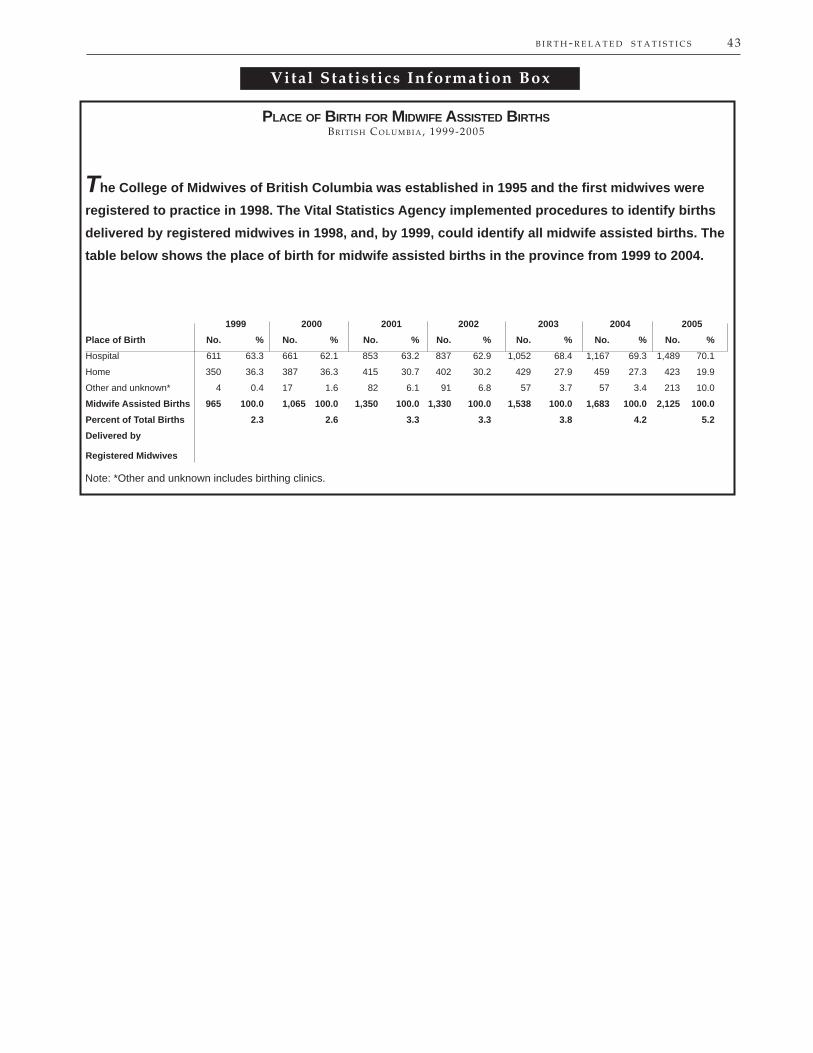
B I R T H - R E L A T E D S T A T I S T I C S 43
Vital Statistics Information BoxVital Statistics Information Box
PLACE OF BIRTH FOR MIDWIFE ASSISTED BIRTHSBR I T I S H CO L U M B I A, 1999-2005
The College of Midwives of British Columbia was established in 1995 and the fi rst midwives were registered to practice in 1998. The Vital Statistics Agency implemented procedures to identify births delivered by registered midwives in 1998, and, by 1999, could identify all midwife assisted births. The table below shows the place of birth for midwife assisted births in the province from 1999 to 2004.
Note: *Other and unknown includes birthing clinics.
1999 2000 2001 2002 2003 2004 2005Place of Birth No. % No. % No. % No. % No. % No. % No. %Hospital 611 63.3 661 62.1 853 63.2 837 62.9 1,052 68.4 1,167 69.3 1,489 70.1
Home 350 36.3 387 36.3 415 30.7 402 30.2 429 27.9 459 27.3 423 19.9
Other and unknown* 4 0.4 17 1.6 82 6.1 91 6.8 57 3.7 57 3.4 213 10.0
Midwife Assisted Births 965 100.0 1,065 100.0 1,350 100.0 1,330 100.0 1,538 100.0 1,683 100.0 2,125 100.0Percent of Total Births 2.3 2.6 3.3 3.3 3.8 4.2 5.2Delivered by
Registered Midwives

44 B I R T H - R E L A T E D S T A T I S T I C S Spontaneous Cesarean Total Live BirthsLocal Health Area Vertex First Repeat Total Ratio (p) Percent Other N.S. Number Rate
001 Fernie 68 28 18 46 1.28 38.3 6 - 120 7.55 002 Cranbrook 132 50 24 74 1.14 34.1 11 - 217 8.24 003 Kimberley 38 10 11 21 1.15 34.4 2 - 61 6.74 004 Windermere 47 14 8 22 1.00 29.7 5 - 74 6.98 005 Creston 90 14 9 23 0.65 * 19.3 6 - 119 9.18 006 Kootenay Lake 33 1 4 5 0.40 * 11.9 4 - 42 11.63 007 Nelson 156 24 12 36 0.58 * 17.2 17 - 209 8.38 009 Castlegar 56 15 13 28 1.04 31.1 6 - 90 6.61 010 Arrow Lakes 14 7 3 10 1.39 41.7 - - 24 4.62 011 Trail 97 26 12 38 0.81 24.2 22 - 157 7.72 012 Grand Forks 42 7 8 15 0.85 25.4 2 - 59 6.42 013 Kettle Valley 23 - 2 2 0.26 + 7.7 1 - 26 7.22 014 Southern Okanagan 55 17 14 31 0.99 29.5 19 - 105 5.38 015 Penticton 189 46 31 77 0.86 25.7 34 - 300 7.22 016 Keremeos 18 3 2 5 0.60 17.9 5 - 28 5.42 017 Princeton 25 4 - 4 0.38 + 11.4 6 - 35 7.14 018 Golden 50 13 9 22 0.94 28.2 6 - 78 9.86 019 Revelstoke 41 14 10 24 1.10 32.9 8 - 73 8.50 020 Salmon Arm 148 49 46 95 1.22 36.5 17 - 260 7.68 021 Armstrong - Spallumcheen 42 19 10 29 1.23 36.7 8 - 79 7.72 022 Vernon 337 100 72 172 1.08 32.2 25 - 534 8.54 023 Central Okanagan 845 254 173 427 1.02 30.5 130 - 1,402 8.35 024 Kamloops 512 190 117 307 1.18 * 35.1 55 - 874 8.26 025 100 Mile House 58 12 12 24 0.88 26.4 9 - 91 6.09 026 North Thompson 26 8 4 12 0.93 27.9 5 - 43 8.05 027 Cariboo - Chilcotin 160 36 39 75 0.94 28.0 33 - 268 9.13 028 Quesnel 152 32 24 56 0.83 24.8 18 - 226 8.69 029 Lillooet 36 8 9 17 1.02 30.4 3 - 56 11.67 030 South Cariboo 54 9 4 13 0.60 * 17.8 6 - 73 9.24 031 Merritt 70 23 19 42 1.20 35.9 5 - 117 9.96 032 Hope 46 11 12 23 1.03 30.7 6 - 75 8.44 033 Chilliwack 564 150 127 277 1.03 30.7 62 - 903 11.51 034 Abbotsford 956 269 200 469 0.98 29.3 178 - 1,603 12.51 035 Langley 745 217 146 363 1.01 30.2 94 - 1,202 9.74 037 Delta 507 161 132 293 1.09 32.4 103 - 903 8.75 038 Richmond 907 300 211 511 1.09 * 32.5 152 - 1,570 9.05 040 New Westminster 380 110 53 163 0.88 26.2 80 - 623 10.84 041 Burnaby 1,259 364 221 585 0.94 28.2 232 - 2,076 10.16 042 Maple Ridge 499 151 94 245 0.98 29.2 95 - 839 9.30 043 Coquitlam 1,134 379 234 613 1.03 30.8 243 - 1,990 9.46 044 North Vancouver 696 233 126 359 1.02 30.6 120 - 1,175 8.67 045 West Vancouver - Bowen Is. 173 59 42 101 1.13 33.8 25 - 299 5.80 046 Sunshine Coast 131 33 19 52 0.90 26.9 10 - 193 6.76 047 Powell River 78 27 23 50 1.23 36.8 8 - 136 6.56 048 Howe Sound 223 90 37 127 1.12 33.3 31 - 381 11.76 049 Bella Coola Valley 42 3 7 10 0.62 18.5 2 - 54 15.91 050 Queen Charlotte 26 8 5 13 0.93 27.7 8 - 47 8.92 051 Snow Country 3 1 1 2 1.12 33.3 1 - 6 7.66 052 Prince Rupert 84 28 17 45 1.00 30.0 21 - 150 9.02 053 Upper Skeena 51 5 6 11 0.50 * 14.9 12 - 74 12.86 054 Smithers 132 42 39 81 1.17 34.9 19 - 232 12.83 055 Burns Lake 63 12 6 18 0.68 20.5 7 - 88 11.15 056 Nechako 153 39 21 60 0.87 26.1 17 - 230 12.81 057 Prince George 686 191 113 304 0.95 28.3 84 - 1,074 10.52 059 Peace River South 197 34 19 53 0.67 * 20.1 14 - 264 9.14 060 Peace River North 373 73 57 130 0.82 * 24.4 29 - 532 15.82 061 Greater Victoria 1,011 453 185 638 1.21 * 36.3 111 - 1,760 8.26 062 Sooke 387 152 85 237 1.22 * 36.3 29 - 653 10.96 063 Saanich 272 82 44 126 1.02 30.5 15 - 413 6.50 064 Gulf Islands 59 18 3 21 0.84 25.0 4 - 84 5.60 065 Cowichan 322 73 46 119 0.86 25.8 21 - 462 8.39 066 Lake Cowichan 31 13 - 13 0.93 27.7 3 - 47 7.28 067 Ladysmith 114 25 22 47 0.95 28.3 5 - 166 9.59 068 Nanaimo 494 147 111 258 1.06 31.6 64 - 816 8.18 069 Qualicum 154 31 30 61 0.88 26.2 18 - 233 5.59 070 Alberni 206 64 37 101 1.01 30.1 29 - 336 10.28 071 Courtenay 311 79 39 118 0.85 25.3 38 - 467 7.57 072 Campbell River 185 63 39 102 1.04 31.1 41 - 328 8.02 075 Mission 276 78 49 127 0.96 28.5 42 - 445 11.16 076 Agassiz - Harrison 60 15 14 29 1.07 31.9 2 - 91 10.22 077 Summerland 41 12 5 17 0.85 25.4 9 - 67 5.63 078 Enderby 51 13 8 21 0.94 28.0 3 - 75 9.71 080 Kitimat 64 11 15 26 0.94 28.0 3 - 93 7.93 081 Fort Nelson 57 20 18 38 1.18 35.2 13 - 108 16.02 083 Central Coast 21 5 3 8 0.89 26.7 1 - 30 17.52 084 Vancouver Island West 20 3 2 5 0.62 18.5 2 - 27 11.18 085 Vancouver Island North 85 23 10 33 0.81 24.3 18 - 136 9.71 087 Stikine 7 - 1 1 0.42 12.5 - - 8 6.44 088 Terrace 164 34 32 66 0.91 27.3 12 - 242 10.81 092 Nisga’a 23 2 3 5 0.60 17.9 - - 28 14.94 094 Telegraph Creek 7 1 - 1 0.42 12.5 - - 8 12.46 161 Vancouver - City Centre 458 214 43 257 0.99 29.6 152 - 867 8.29 162 Vancouver - Downtown E.side 325 82 26 108 0.73 * 21.8 63 - 496 9.53 163 Vancouver - North East 659 215 121 336 0.99 29.6 139 - 1,134 11.46 164 Vancouver - Westside 625 233 116 349 1.05 31.3 142 - 1,116 8.99 165 Vancouver - Midtown 588 192 82 274 0.93 27.7 128 - 990 11.44 166 Vancouver - South 797 210 131 341 0.88 * 26.3 157 - 1,295 10.20 201 Surrey 2,465 822 538 1,360 1.01 30.1 693 - 4,518 13.52 202 South Surrey/White Rock 308 127 61 188 1.15 * 34.5 49 - 545 6.91 PROVINCIAL TOTAL 24,377 7,536 4,607 12,143 1.00 29.9 4,133 - 40,653 9.56
Tab
leL
IVE
BIR
TH
S B
Y L
OC
AL
HE
AL
TH
AR
EA
AN
D M
OD
E O
F D
EL
IVE
RY
, B
RIT
ISH
CO
LU
MB
IA,
2005
12
Notes for this table follow the map.
44

B I R T H - R E L A T E D S T A T I S T I C S 45
Note: Ratio - Observed over the expected. Refer to Figure 1 to clarify geographical location of Local Health Area
N
Statistically Significant
QUINTILE (Ratio)
5 ( > 1.09)
2 (0.82 - 0.93)
1 ( < 0.82)
4 ( 1.01 - 1.09)
3 ( 0.93 - 1.01)
Inset 1
see inset 2
Inset 2
see inset 1
300 kms0 100 200
10 kms0
50 kms0
FIGURE 30CESAREAN DELIVERIES OF LIVE BORN INFANTS
BY LOCAL HEALTH AREABR I T I S H CO L U M B I A, 2005
Notes for Table 12
Note: Ratio – observed over the expected cesareans in the specifi ed area. Percent based upon live births in the specifi ed area. Rate per 1,000 population in the specifi ed area. *Statistical testing indicates that observed cesarean births are signifi cantly different from the expected (p<0.05, two tailed). +Denotes signifi cance based on less than fi ve births. Other is comprised of spontaneous breech, forceps, and vacuum. Total includes residents with unknown LHA. N.S. - Not Stated.

46 B I R T H - R E L A T E D S T A T I S T I C S
Births – Birth Weight
There are good reasons for family and friends to ask about a newborn baby’s weight. Size at birth is recognized as the primary indicator of newborn health not only in British Columbia and Canada but worldwide. It is also an important predictor of subsequent health and well being , as well as disability and death, among newborn infants. In British Columbia a baby is weighed (in grams) immediately after birth and weight is used as one of the diagnostic indicators of fetal growth.
The following tables show birth weight categorized by other indicators related to birth weight, such as gender, gestational age, and maternal age.
Birth weight for gestational age is the most widely accepted indicator of health status of newborns and predictor of their subsequent well being. Birth weight alone is considered a valuable indicator of the infant’s health status but the addition of gestational age can provide an indication of potential growth restriction during pregnancy. Unfortunately reliable estimates of gestational age are not available in some jurisdictions so birth weight has to suffi ce, but in B.C. recording methods are well established so birth weight for gestational age is an accepted indicator of fetal growth. In recognition of its importance the Vital Statistics Agency periodically publishes reports dedicated to the analysis of birth weight for gestational age for various sub-populations in the province.
Babies born at term (37 to 41 weeks) and between 2,500 and 4,499 grams have been shown to have the most favourable prospects for good health and Table 13 indicates that 35,802 births or 88.1% of all live births in 2005 were in that category. There were 3,119 pre-term births (less than 37 weeks) which accounted for 7.7% of all live births.
In British Columbia in 2005, the average weight for a baby boy (calculated using the data in Table 13) was 3,449 grams while the average for a baby girl was 3,346 grams.
Table 14 shows the number of live births to residents of British Columbia in 2005 according to maternal age group and infant birth weight category. By far, most of the babies in each age group had healthy weights (from 2,500 to 4,499 grams).
In B.C. healthy birth weight is distributed in an inverted “U” shape across maternal age groups. Table 14 shows that mothers in the mid-age categories had the largest proportions of healthy weight babies and the lowest proportions of low birth weight babies.
Table 15 displays the number and percent of low birth weight (less than 2, 500 grams) babies by gender according to the mother’s age group. Female babies generally have a lower birth weight than males (see Table 13), so it is not surprising that they have a higher rate of low birth weight (60.3 per 1,000 female live births) than males (52.1 per 1,000 male live births).
Figure 31 graphically shows the pattern of low birth weight by maternal age groups. Women aged 20-24, 25 -29, and 30-34 years old had the lowest rates of low birth weight babies in 2005 with increasing rates in subsequent age groups. Older mothers not only have increased rates of LBW babies but the rate has been consistently increasing since 1986 as indicated in Figure 9.
Table 16 shows the incidence of low birth weight (LBW) babies in the period 2000-2004 and the year 2005, stratifi ed by the LHA in which the mother resided with statistics for the whole province. As well as the incidence of such births, the 2000-2004 part of the table shows the LBW rate per 1,000 live births and the ratio of the observed number of LBW births in the LHA divided by the number that would be expected if the LHA had the provincial rates. The (p) column indicates those LHAs where the observed number was signifi cantly different from the expected. See Expected Low Birth Weight in the Glossary and an example of the computational method of the ratio with a reference to the statistical test under Observed versus Expected Ratios in the Methodology section. There were 24 LHAs with statistically signifi cant ratios, of these only nine were high. The 2005 part of the table shows the incidence fi gures broken down by three categories of gestational age of the newborn, the total number of LBW births, and the rate. In some LHAs the number of LBW babies was quite low in 2005 so the rates should be viewed with caution.
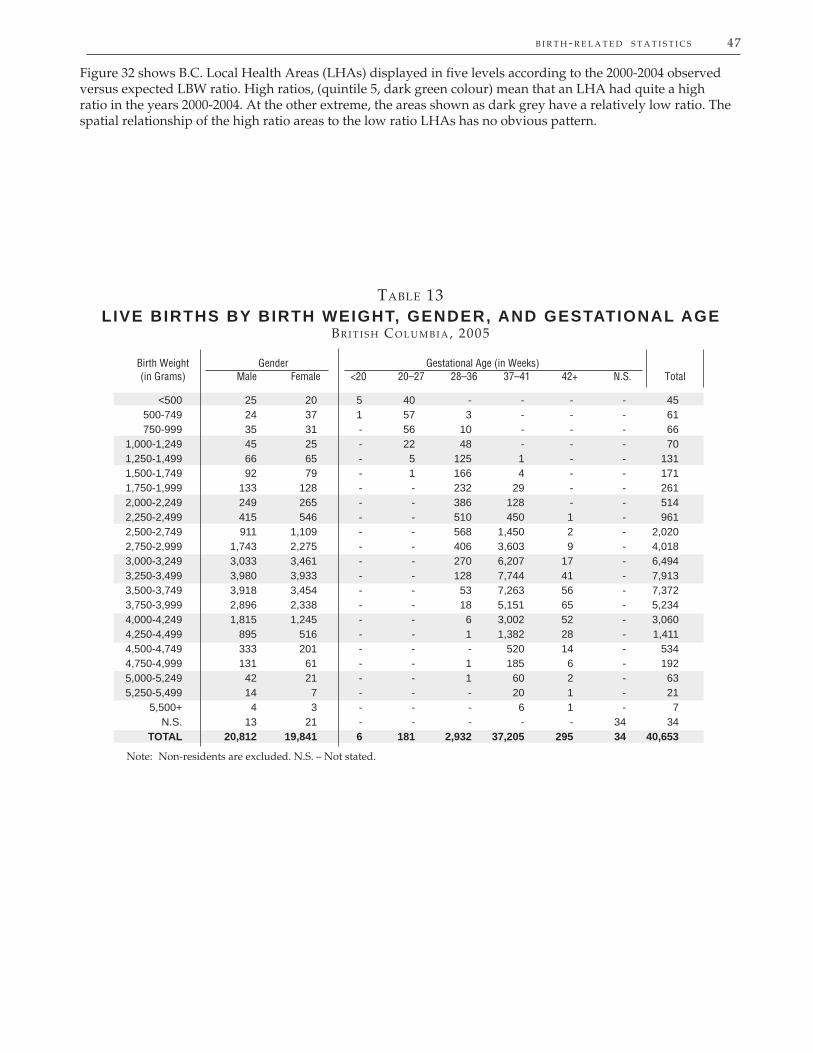
B I R T H - R E L A T E D S T A T I S T I C S 47
Figure 32 shows B.C. Local Health Areas (LHAs) displayed in fi ve levels according to the 2000-2004 observed versus expected LBW ratio. High ratios, (quintile 5, dark green colour) mean that an LHA had quite a high ratio in the years 2000-2004. At the other extreme, the areas shown as dark grey have a relatively low ratio. The spatial relationship of the high ratio areas to the low ratio LHAs has no obvious pattern.
TABLE 13LIVE BIRTHS BY BIRTH WEIGHT, GENDER, AND GESTATIONAL AGE
BR I T I S H CO L U M B I A, 2005
Birth Weight Gender Gestational Age (in Weeks) (in Grams) Male Female <20 20–27 28–36 37–41 42+ N.S. Total
Note: Non-residents are excluded. N.S. – Not stated.
<500 25 20 5 40 - - - - 45 500-749 24 37 1 57 3 - - - 61 750-999 35 31 - 56 10 - - - 66 1,000-1,249 45 25 - 22 48 - - - 70 1,250-1,499 66 65 - 5 125 1 - - 131 1,500-1,749 92 79 - 1 166 4 - - 171 1,750-1,999 133 128 - - 232 29 - - 261 2,000-2,249 249 265 - - 386 128 - - 514 2,250-2,499 415 546 - - 510 450 1 - 961 2,500-2,749 911 1,109 - - 568 1,450 2 - 2,020 2,750-2,999 1,743 2,275 - - 406 3,603 9 - 4,018 3,000-3,249 3,033 3,461 - - 270 6,207 17 - 6,494 3,250-3,499 3,980 3,933 - - 128 7,744 41 - 7,913 3,500-3,749 3,918 3,454 - - 53 7,263 56 - 7,372 3,750-3,999 2,896 2,338 - - 18 5,151 65 - 5,234 4,000-4,249 1,815 1,245 - - 6 3,002 52 - 3,060 4,250-4,499 895 516 - - 1 1,382 28 - 1,411 4,500-4,749 333 201 - - - 520 14 - 534 4,750-4,999 131 61 - - 1 185 6 - 192 5,000-5,249 42 21 - - 1 60 2 - 63 5,250-5,499 14 7 - - - 20 1 - 21 5,500+ 4 3 - - - 6 1 - 7 N.S. 13 21 - - - - - 34 34 TOTAL 20,812 19,841 6 181 2,932 37,205 295 34 40,653

48 B I R T H - R E L A T E D S T A T I S T I C S
TABLE 14LIVE BIRTHS BY BIRTH WEIGHT AND AGE OF MOTHER
BR I T I S H CO L U M B I A, 2005
Birth Weight Age of Mother (in Years) (in Grams) <15 15–19 20–24 25–29 30–34 35–39 40–44 45+ N.S. Total
Note: Low birth weight <2,500 grams. Healthy birth weight 2,500 - 4,499 grams. High birth weight 4,500+ grams. Percent of age category in birth weight group. Non-residents are excluded. N.S. - Not stated.
<500 - 1 2 14 15 12 1 - - 45 500-749 - 3 12 20 11 11 4 - - 61 750-999 - 5 11 16 26 5 3 - - 66 1,000-1,249 - 1 13 23 13 12 6 2 - 70 1,250-1,499 1 4 13 41 36 27 9 - - 131 1,500-1,749 - 10 27 36 66 25 4 3 - 171 1,750-1,999 - 9 36 53 79 60 24 - - 261 2,000-2,249 - 21 76 132 154 100 29 2 - 514 2,250-2,499 1 33 122 272 292 197 41 3 - 961 2,500-2,749 - 63 314 555 641 350 92 5 - 2,020 2,750-2,999 2 132 636 1,100 1,290 691 160 7 - 4,018 3,000-3,249 3 202 961 1,807 2,144 1,141 229 7 - 6,494 3,250-3,499 2 270 1,216 2,188 2,574 1,341 311 11 - 7,913 3,500-3,749 3 256 1,095 2,051 2,411 1,294 252 10 - 7,372 3,750-3,999 1 158 820 1,398 1,707 937 209 4 - 5,234 4,000-4,249 - 85 468 849 1,020 528 105 5 - 3,060 4,250-4,499 - 41 203 379 497 242 47 2 - 1,411 4,500-4,749 - 16 82 157 170 94 15 - - 534 4,750-4,999 - 4 31 50 67 32 7 1 - 192 5,000-5,249 - 1 13 14 21 12 1 1 - 63 5,250-5,499 - 2 1 7 6 5 - - - 21 5,500+ - - - 2 3 2 - - - 7 Low 2 87 312 607 692 449 121 10 - 2,280 Percent 15.40 6.6 5.1 5.4 5.2 6.3 7.8 15.6 - 5.6 Healthy 11 1,207 5,713 10,327 12,284 6,524 1,405 51 - 37,522 Percent 84.6 91.4 92.8 92.4 92.7 91.6 90.6 79.7 - 92.3 High - 23 127 230 267 145 23 2 - 817 Percent - 1.7 2.1 2.1 2.0 2.0 1.5 3.1 - 2.0 N.S. - 3 1 10 10 7 2 1 - 34 TOTAL 13 1,320 6,153 11,174 13,253 7,125 1,551 64 - 40,653
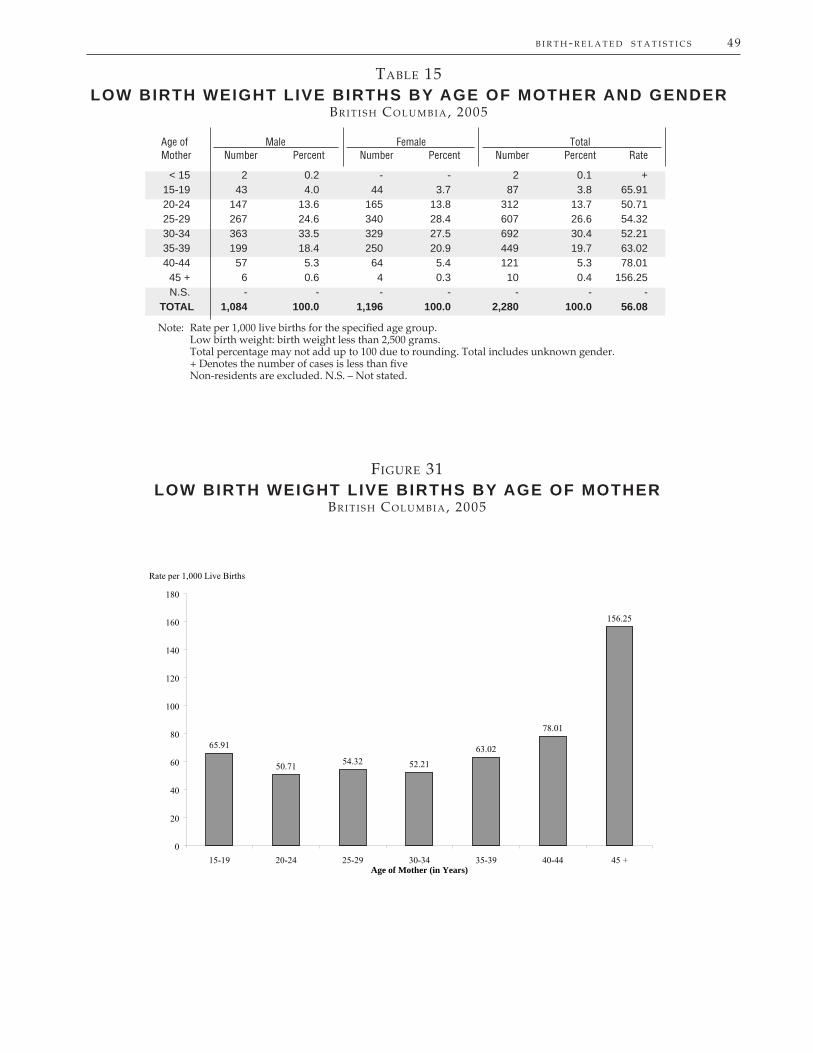
B I R T H - R E L A T E D S T A T I S T I C S 49
TABLE 15LOW BIRTH WEIGHT LIVE BIRTHS BY AGE OF MOTHER AND GENDER
BR I T I S H CO L U M B I A, 2005
Age of Male Female TotalMother Number Percent Number Percent Number Percent Rate
< 15 2 0.2 - - 2 0.1 + 15-19 43 4.0 44 3.7 87 3.8 65.91 20-24 147 13.6 165 13.8 312 13.7 50.71 25-29 267 24.6 340 28.4 607 26.6 54.32 30-34 363 33.5 329 27.5 692 30.4 52.21 35-39 199 18.4 250 20.9 449 19.7 63.02 40-44 57 5.3 64 5.4 121 5.3 78.01 45 + 6 0.6 4 0.3 10 0.4 156.25 N.S. - - - - - - - TOTAL 1,084 100.0 1,196 100.0 2,280 100.0 56.08
Note: Rate per 1,000 live births for the specifi ed age group. Low birth weight: birth weight less than 2,500 grams. Total percentage may not add up to 100 due to rounding. Total includes unknown gender. + Denotes the number of cases is less than fi ve Non-residents are excluded. N.S. – Not stated.
65.91
50.71 54.32 52.21
63.02
78.01
156.25
0
20
40
60
80
100
120
140
160
180
15-19 20-24 25-29 30-34 35-39 40-44 45 +Age of Mother (in Years)
Rate per 1,000 Live Births
FIGURE 31LOW BIRTH WEIGHT LIVE BIRTHS BY AGE OF MOTHER
BR I T I S H CO L U M B I A, 2005

50 B I R T H - R E L A T E D S T A T I S T I C S
2000–2004 2005 Low Birth Weight Live Births Gestational Age (in Weeks)
Local Health Area Observed Ratio (p) Rate <37 37–41 42+ N.S. Total Rate
001 Fernie 19 0.60 * 31.77 3 1 - - 4 33.33 002 Cranbrook 37 0.63 * 33.24 10 2 - - 12 55.30 003 Kimberley 13 0.89 46.93 2 1 - - 3 49.18 004 Windermere 10 0.59 30.96 - 2 - - 2 27.03 005 Creston 28 0.85 44.80 5 1 - - 6 50.42 006 Kootenay Lake 13 1.37 72.22 - 1 - - 1 23.81 007 Nelson 47 0.81 42.84 5 2 - - 7 33.49 009 Castlegar 21 0.86 45.45 6 - - - 6 66.67 010 Arrow Lakes 16 1.60 84.21 3 - - - 3 125.00 011 Trail 50 1.37 * 72.25 12 4 - - 16 101.91 012 Grand Forks 15 0.87 46.01 1 - - - 1 16.95 013 Kettle Valley 9 1.30 68.18 - - - - - - 014 Southern Okanagan 30 0.89 47.02 3 1 - - 4 38.10 015 Penticton 85 1.12 59.03 10 4 - - 14 46.67 016 Keremeos 11 1.06 55.56 2 - - - 2 71.43 017 Princeton 8 1.26 66.12 4 1 - - 5 142.86 018 Golden 8 0.48 * 25.32 1 1 - - 2 25.64 019 Revelstoke 21 1.03 54.12 1 - - - 1 13.70 020 Salmon Arm 51 0.89 46.96 9 2 - - 11 42.31 021 Armstrong - Spallumcheen 14 0.70 36.84 2 1 - - 3 37.97 022 Vernon 163 1.20 * 63.25 16 9 - - 25 46.82 023 Central Okanagan 327 0.93 48.98 65 17 - - 82 58.49 024 Kamloops 260 1.12 58.70 36 16 - - 52 59.50 025 100 Mile House 40 1.43 * 75.05 5 - - - 5 54.95 026 North Thompson 12 0.99 52.17 - - - - - - 027 Cariboo - Chilcotin 92 1.16 60.97 15 3 - - 18 67.16 028 Quesnel 67 1.12 58.93 7 5 - - 12 53.10 029 Lillooet 12 0.80 42.25 1 1 - - 2 35.71 030 South Cariboo 13 0.91 47.79 3 2 - - 5 68.49 031 Merritt 28 1.00 52.83 1 2 - - 3 25.64 032 Hope 13 0.66 34.57 3 - - - 3 40.00 033 Chilliwack 177 0.81 * 42.78 39 11 - - 50 55.37 034 Abbotsford 419 1.00 52.47 57 20 - - 77 48.03 035 Langley 270 0.84 * 44.33 46 19 - - 65 54.08 037 Delta 234 0.91 47.60 43 13 - - 56 62.02 038 Richmond 403 0.98 51.70 65 28 - - 93 59.24 040 New Westminster 207 1.22 * 64.29 30 5 - - 35 56.18 041 Burnaby 607 1.12 * 58.74 84 45 - - 129 62.14 042 Maple Ridge 226 0.98 51.35 31 15 - - 46 54.83 043 Coquitlam 539 0.98 51.47 83 26 - - 109 54.77 044 North Vancouver 304 0.89 * 46.99 56 16 - - 72 61.28 045 West Vancouver - Bowen Is. 66 0.83 43.88 10 4 - - 14 46.82 046 Sunshine Coast 28 0.59 * 30.84 6 1 - - 7 36.27 047 Powell River 29 0.73 38.62 4 - - - 4 29.41 048 Howe Sound 117 1.14 59.69 5 2 - - 7 18.37 049 Bella Coola Valley 13 1.04 54.62 3 - - - 3 55.56 050 Queen Charlotte 16 0.92 48.19 2 - - - 2 42.55 051 Snow Country 1 0.45 23.81 - 1 - - 1 166.67 052 Prince Rupert 43 0.79 41.59 3 - - - 3 20.00 053 Upper Skeena 13 0.67 35.04 3 - - - 3 40.54 054 Smithers 42 0.70 * 36.62 14 2 1 - 17 73.28 055 Burns Lake 9 0.38 * 19.87 2 2 - - 4 45.45 056 Nechako 58 0.97 51.01 7 2 - - 9 39.13 057 Prince George 283 1.03 53.92 44 14 - - 58 54.00 059 Peace River South 52 0.71 * 37.20 4 4 - - 8 30.30 060 Peace River North 108 0.83 * 43.90 15 10 - - 25 46.99 061 Greater Victoria 453 1.00 52.58 75 22 - - 97 55.11 062 Sooke 147 0.99 51.82 35 8 - - 43 65.85 063 Saanich 115 1.10 57.62 11 5 - - 16 38.74 064 Gulf Islands 19 0.82 43.08 3 1 - - 4 47.62 065 Cowichan 137 1.08 56.61 26 6 - - 32 69.26 066 Lake Cowichan 10 0.88 46.30 2 3 - - 5 106.38 067 Ladysmith 41 1.15 60.65 10 1 - - 11 66.27 068 Nanaimo 196 0.94 49.27 29 11 - - 40 49.02 069 Qualicum 40 0.67 * 35.46 12 5 - - 17 72.96 070 Alberni 56 0.73 * 38.44 17 - - - 17 50.60 071 Courtenay 130 1.08 56.69 14 1 - - 15 32.12 072 Campbell River 95 1.00 52.49 14 3 - - 17 51.83 075 Mission 110 1.00 52.76 19 8 - - 27 60.67 076 Agassiz - Harrison 15 0.66 34.64 6 1 - - 7 76.92 077 Summerland 17 0.91 47.75 - - - - - - 078 Enderby 21 1.37 72.16 4 2 - - 6 80.00 080 Kitimat 18 0.65 34.09 3 2 - - 5 53.76 081 Fort Nelson 15 0.61 * 31.85 2 - - - 2 18.52 083 Central Coast 9 1.53 80.36 2 - - - 2 66.67 084 Vancouver Island West 7 0.79 41.42 - 1 - - 1 37.04 085 Vancouver Island North 43 0.99 52.31 3 2 - - 5 36.76 087 Stikine 4 2.17 114.29 - - - - - - 088 Terrace 56 0.80 42.14 11 1 - - 12 49.59 092 Nisga’a 6 0.76 40.00 - 1 - - 1 35.71 094 Telegraph Creek 4 1.69 88.89 - - - - - - 161 Vancouver - City Centre 191 0.94 49.41 36 10 - - 46 53.06 162 Vancouver - Downtown E.side 163 1.36 * 71.33 29 7 - - 36 72.58 163 Vancouver - North East 327 1.12 * 58.73 62 16 - - 78 68.78 164 Vancouver - Westside 239 0.85 * 44.87 41 22 - - 63 56.45 165 Vancouver - Midtown 286 1.07 56.31 37 16 - - 53 53.54 166 Vancouver - South 390 1.18 * 62.18 48 28 - - 76 58.69 201 Surrey 1,312 1.14 * 60.00 203 103 - - 306 67.73 202 South Surrey/White Rock 110 0.85 44.66 26 6 - - 32 58.72 PROVINCIAL TOTAL 10,593 1.00 52.59 1,667 612 1 - 2,280 56.08
16L
OW
BIR
TH
WE
IGH
T L
IVE
BIR
TH
S B
Y L
OC
AL
HE
AL
TH
AR
EA
AN
D G
ES
TA
TIO
NA
L A
GE
,
B
RIT
ISH
CO
LU
MB
IA,
2000
–200
4 A
ND
200
5T
able
16
Note: Low Birth Weight – birth weight less than 2,500 grams. Ratio – observed over the expected low birth weight live births. * Statistical testing indicates that observed low birth weight live births are signifi cantly different from the expected (p<0.05, two tailed). Rate per 1,000 live births in the specifi ed area. Total includes residents with unknown LHA. N.S. - Not Stated.
50
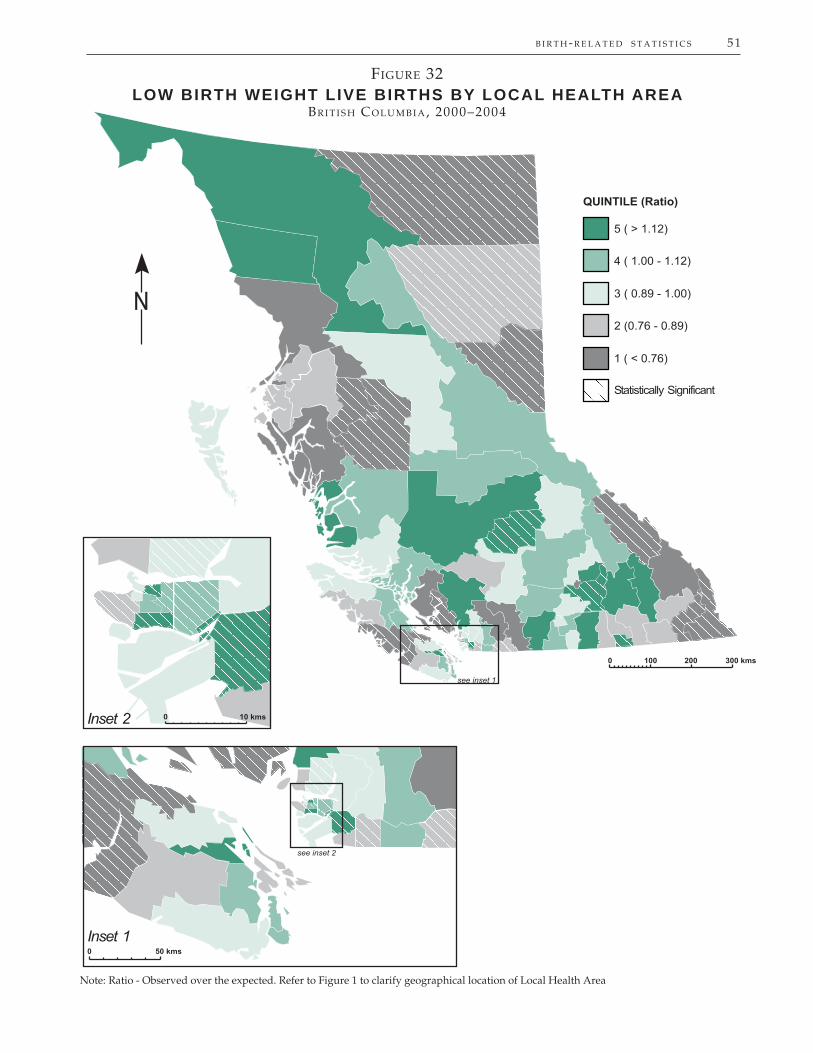
B I R T H - R E L A T E D S T A T I S T I C S 51
N
Statistically Significant
QUINTILE (Ratio)
5 ( > 1.12)
2 (0.76 - 0.89)
1 ( < 0.76)
4 ( 1.00 - 1.12)
3 ( 0.89 - 1.00)
Inset 1
see inset 2
Inset 2
see inset 1
300 kms0 100 200
10 kms0
50 kms0
FIGURE 32LOW BIRTH WEIGHT LIVE BIRTHS BY LOCAL HEALTH AREA
BR I T I S H CO L U M B I A, 2000–2004
Note: Ratio - Observed over the expected. Refer to Figure 1 to clarify geographical location of Local Health Area
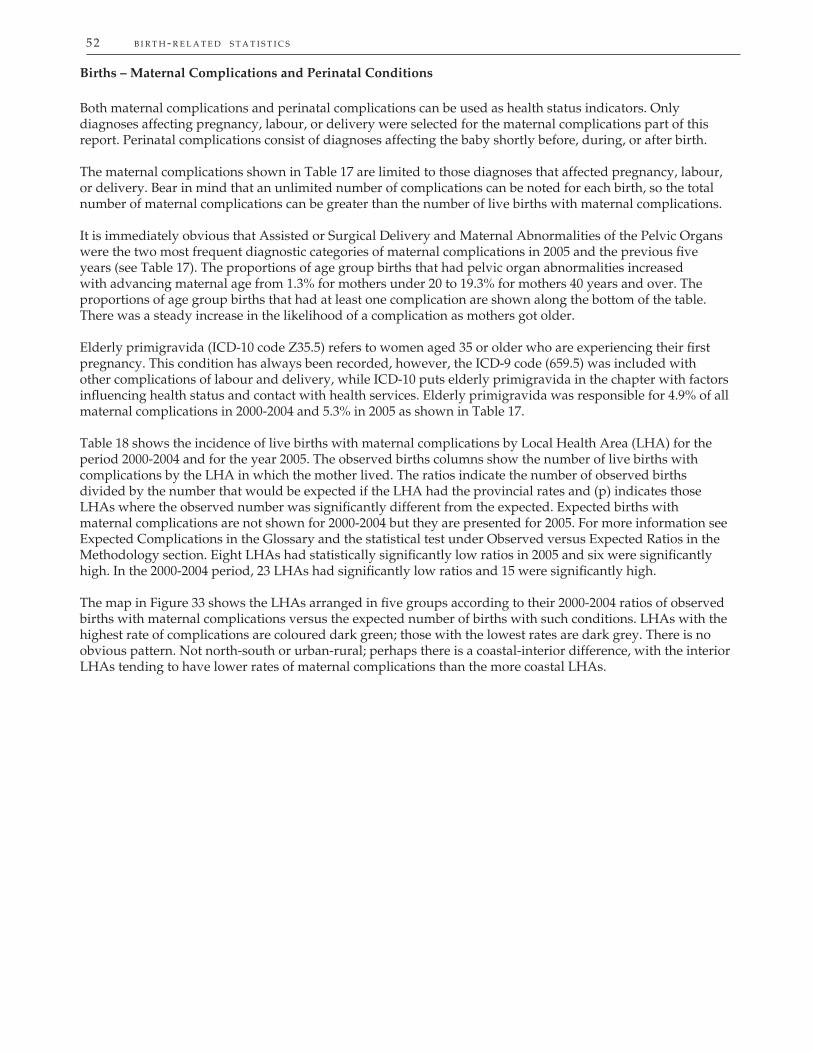
52 B I R T H - R E L A T E D S T A T I S T I C S
Births – Maternal Complications and Perinatal Conditions
Both maternal complications and perinatal complications can be used as health status indicators. Only diagnoses affecting pregnancy, labour, or delivery were selected for the maternal complications part of this report. Perinatal complications consist of diagnoses affecting the baby shortly before, during, or after birth.
The maternal complications shown in Table 17 are limited to those diagnoses that affected pregnancy, labour, or delivery. Bear in mind that an unlimited number of complications can be noted for each birth, so the total number of maternal complications can be greater than the number of live births with maternal complications.
It is immediately obvious that Assisted or Surgical Delivery and Maternal Abnormalities of the Pelvic Organs were the two most frequent diagnostic categories of maternal complications in 2005 and the previous fi ve years (see Table 17). The proportions of age group births that had pelvic organ abnormalities increased with advancing maternal age from 1.3% for mothers under 20 to 19.3% for mothers 40 years and over. The proportions of age group births that had at least one complication are shown along the bottom of the table. There was a steady increase in the likelihood of a complication as mothers got older.
Elderly primigravida (ICD-10 code Z35.5) refers to women aged 35 or older who are experiencing their fi rst pregnancy. This condition has always been recorded, however, the ICD-9 code (659.5) was included with other complications of labour and delivery, while ICD-10 puts elderly primigravida in the chapter with factors infl uencing health status and contact with health services. Elderly primigravida was responsible for 4.9% of all maternal complications in 2000-2004 and 5.3% in 2005 as shown in Table 17.
Table 18 shows the incidence of live births with maternal complications by Local Health Area (LHA) for the period 2000-2004 and for the year 2005. The observed births columns show the number of live births with complications by the LHA in which the mother lived. The ratios indicate the number of observed births divided by the number that would be expected if the LHA had the provincial rates and (p) indicates those LHAs where the observed number was signifi cantly different from the expected. Expected births with maternal complications are not shown for 2000-2004 but they are presented for 2005. For more information see Expected Complications in the Glossary and the statistical test under Observed versus Expected Ratios in the Methodology section. Eight LHAs had statistically signifi cantly low ratios in 2005 and six were signifi cantly high. In the 2000-2004 period, 23 LHAs had signifi cantly low ratios and 15 were signifi cantly high.
The map in Figure 33 shows the LHAs arranged in fi ve groups according to their 2000-2004 ratios of observed births with maternal complications versus the expected number of births with such conditions. LHAs with the highest rate of complications are coloured dark green; those with the lowest rates are dark grey. There is no obvious pattern. Not north-south or urban-rural; perhaps there is a coastal-interior difference, with the interior LHAs tending to have lower rates of maternal complications than the more coastal LHAs.

B I R T H - R E L A T E D S T A T I S T I C S 53
The conditions listed in Table 19 consist of diagnoses affecting the baby shortly before, during, or after birth. The table shows the number and percent of all perinatal conditions in each condition category for 2000-2004 and 2005. The 2005 portion of the table also shows the conditions by maternal age group. Again, an unlimited number of complications can be noted for each birth, so the total number of perinatal conditions at the bottom of the table can exceed the number of live births with at least one perinatal condition. Note that mothers between 30 and 39 years old had the lowest proportion of live births with perinatal conditions and there were small increases in the proportions for older or younger mothers.
Intrauterine hypoxia and birth asphyxia accounted for most of the perinatal conditions shown in Table 19 in both time periods (48.0% in 2000-2004 and 43.5% in 2005). Conditions related to short gestation and those related to long gestation or high birth weight together accounted for over a third (34.9%) of the conditions in 2005 and somewhat less (27.1%) in the 2000-2004 period.
Table 20 shows the incidence of live births with perinatal conditions, by the mother’s Local Health Area (LHA) of residence for the period 2000-2004 and for the year 2005. This table is in the same format as Table 18 with the same indicators and statistical computations so they will not be reviewed here. Refer to the Glossary for a defi nition of Expected Perinatal Conditions.
In 2005, there were 23 LHAs where the observed number of perinatal complications was signifi cantly different from the expected number, and in 10 of these the observed number was signifi cantly lower (see Table 20).
Figure 34 shows B.C. divided into its 89 LHAs, each coloured to show its allocation to one of fi ve groups according to the value of its perinatal complications ratio for the 2000-2004 period. Those coloured dark green have the highest ratios; these are the areas where there was a high number of live births with perinatal complications relative to the expected number. The other LHAs are shown by colour to have a relatively lower number of these conditions, down to those coloured dark grey, with the lowest relative number of live births with perinatal complications. There was no obvious pattern of variation in the geographic distribution of the LHAs regarding perinatal complications.
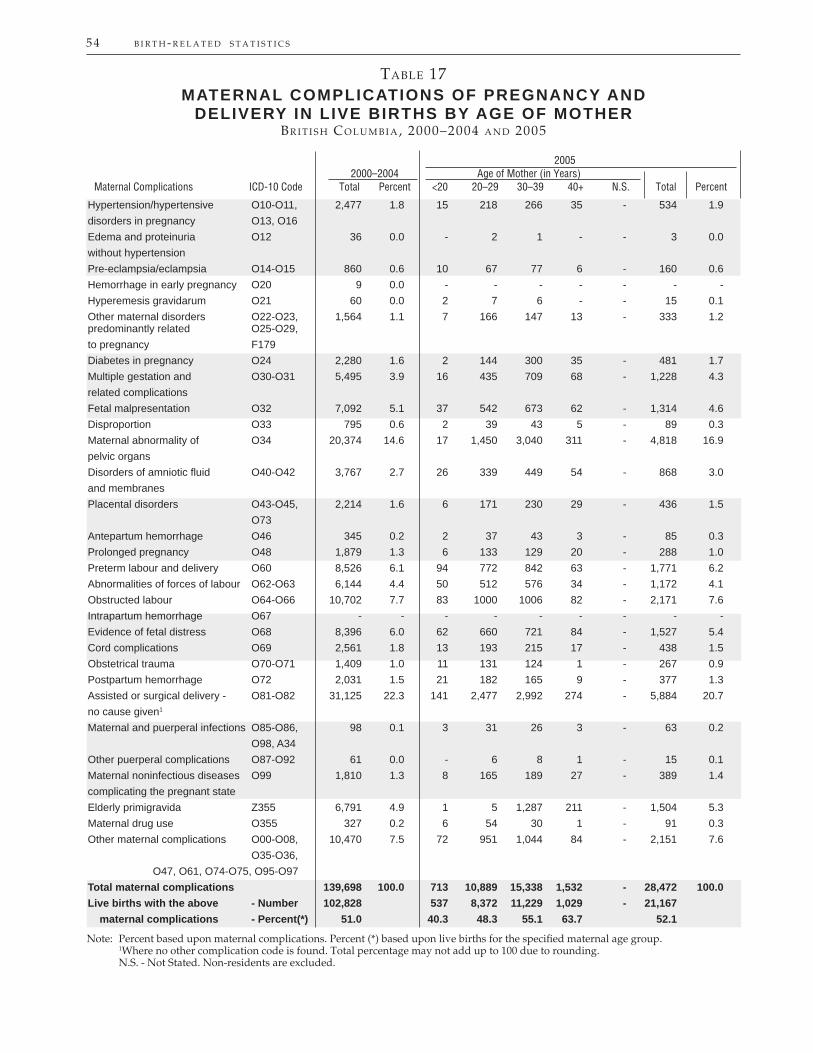
54 B I R T H - R E L A T E D S T A T I S T I C S
TABLE 17MATERNAL COMPLICATIONS OF PREGNANCY AND
DELIVERY IN LIVE BIRTHS BY AGE OF MOTHERBR I T I S H CO L U M B I A, 2000–2004 A N D 2005
2005 2000–2004 Age of Mother (in Years)Maternal Complications ICD-10 Code Total Percent <20 20–29 30–39 40+ N.S. Total Percent
Note: Percent based upon maternal complications. Percent (*) based upon live births for the specifi ed maternal age group. 1Where no other complication code is found. Total percentage may not add up to 100 due to rounding. N.S. - Not Stated. Non-residents are excluded.
Hypertension/hypertensive O10-O11, 2,477 1.8 15 218 266 35 - 534 1.9disorders in pregnancy O13, O16Edema and proteinuria O12 36 0.0 - 2 1 - - 3 0.0without hypertension Pre-eclampsia/eclampsia O14-O15 860 0.6 10 67 77 6 - 160 0.6Hemorrhage in early pregnancy O20 9 0.0 - - - - - - -Hyperemesis gravidarum O21 60 0.0 2 7 6 - - 15 0.1Other maternal disorders O22-O23, 1,564 1.1 7 166 147 13 - 333 1.2 predominantly related O25-O29,to pregnancy F179Diabetes in pregnancy O24 2,280 1.6 2 144 300 35 - 481 1.7Multiple gestation and O30-O31 5,495 3.9 16 435 709 68 - 1,228 4.3related complications Fetal malpresentation O32 7,092 5.1 37 542 673 62 - 1,314 4.6Disproportion O33 795 0.6 2 39 43 5 - 89 0.3Maternal abnormality of O34 20,374 14.6 17 1,450 3,040 311 - 4,818 16.9pelvic organsDisorders of amniotic fl uid O40-O42 3,767 2.7 26 339 449 54 - 868 3.0and membranesPlacental disorders O43-O45, 2,214 1.6 6 171 230 29 - 436 1.5 O73Antepartum hemorrhage O46 345 0.2 2 37 43 3 - 85 0.3Prolonged pregnancy O48 1,879 1.3 6 133 129 20 - 288 1.0Preterm labour and delivery O60 8,526 6.1 94 772 842 63 - 1,771 6.2Abnormalities of forces of labour O62-O63 6,144 4.4 50 512 576 34 - 1,172 4.1Obstructed labour O64-O66 10,702 7.7 83 1000 1006 82 - 2,171 7.6Intrapartum hemorrhage O67 - - - - - - - - -Evidence of fetal distress O68 8,396 6.0 62 660 721 84 - 1,527 5.4Cord complications O69 2,561 1.8 13 193 215 17 - 438 1.5Obstetrical trauma O70-O71 1,409 1.0 11 131 124 1 - 267 0.9Postpartum hemorrhage O72 2,031 1.5 21 182 165 9 - 377 1.3Assisted or surgical delivery - O81-O82 31,125 22.3 141 2,477 2,992 274 - 5,884 20.7no cause given1
Maternal and puerperal infections O85-O86, 98 0.1 3 31 26 3 - 63 0.2 O98, A34Other puerperal complications O87-O92 61 0.0 - 6 8 1 - 15 0.1Maternal noninfectious diseases O99 1,810 1.3 8 165 189 27 - 389 1.4complicating the pregnant stateElderly primigravida Z355 6,791 4.9 1 5 1,287 211 - 1,504 5.3Maternal drug use O355 327 0.2 6 54 30 1 - 91 0.3Other maternal complications O00-O08, 10,470 7.5 72 951 1,044 84 - 2,151 7.6 O35-O36, O47, O61, O74-O75, O95-O97Total maternal complications 139,698 100.0 713 10,889 15,338 1,532 - 28,472 100.0Live births with the above - Number 102,828 537 8,372 11,229 1,029 - 21,167 maternal complications - Percent(*) 51.0 40.3 48.3 55.1 63.7 52.1

B I R T H - R E L A T E D S T A T I S T I C S 55
Vital Statistics Information BoxVital Statistics Information Box
Baby Boys Baby Girls
Rank Name Number Name Number
1 Ethan 292 Emma 245 2 Joshua 265 Emily 233 3 Matthew 241 Olivia 202 4 Jacob 222 Hannah 189 5 Nathan 206 Madison 177 6 Ryan 206 Ava 172 7 Alexander 202 Sarah 160 8 Liam 180 Ella 151 9 Nicholas 179 Isabella 149 10 Noah 179 Grace 137 11 Daniel 174 Sophia 134 12 Benjamin 172 Samantha 130 13 James 164 Maya 118 14 William 159 Abigail 117 15 Owen 154 Jessica 114 16 Dylan 153 Hailey 112 17 Logan 153 Chloe 107 18 Evan 152 Megan 97 19 Tyler 149 Julia 96 20 Jack 143 Lauren 93 21 Samuel 142 Rachel 90 22 Lucas 138 Elizabeth 89 23 Andrew 137 Sydney 88 24 Jordan 126 Taylor 86 25 Connor 125 Alyssa 83
TOP 25 BABY NAMES IN 2005
Each year the British Columbia Vital Statistics Agency produces a list of the most chosen baby names. The table below provides the top 25 names. Alternate spellings of names that sound alike (such as Catherine, Katherine, and Katharine) are not combined. The complete list for 2005, as well as lists for several previous years can be found at http://www.vs.gov.bc.ca/babynames/index.html. In 2005, 580 boys’ names and 675 girls’ names were chosen for fi ve or more newborns.
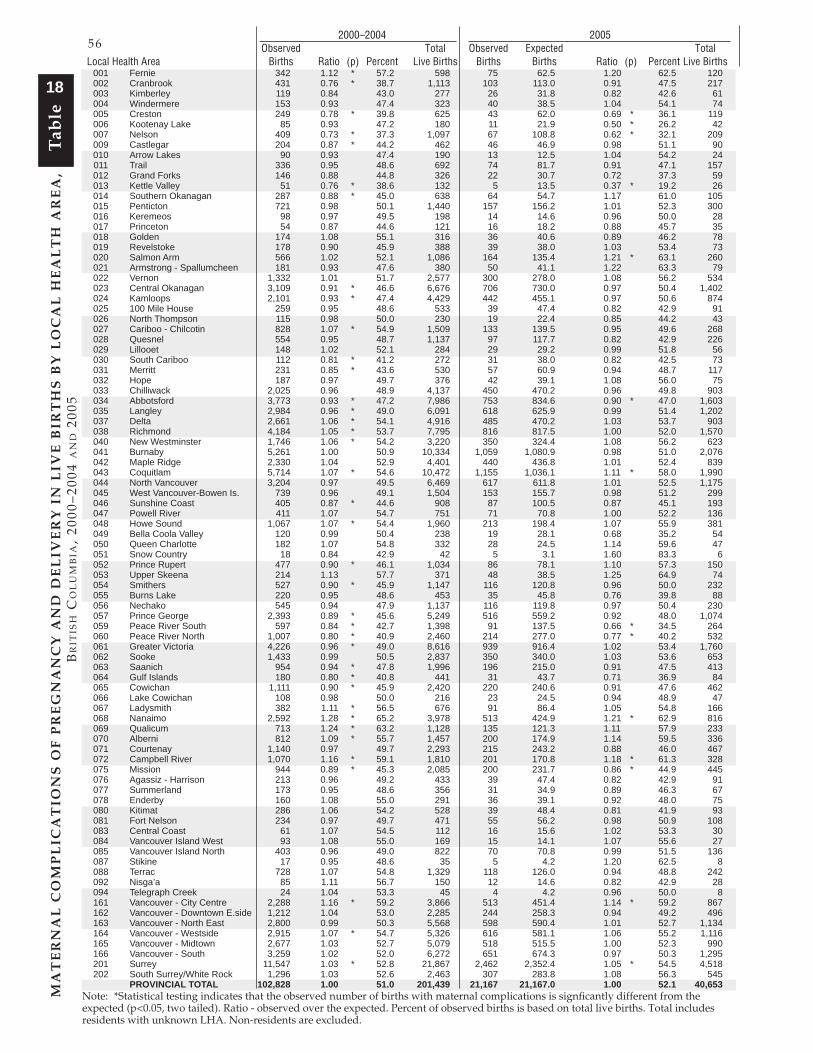
56 B I R T H - R E L A T E D S T A T I S T I C S
MA
TE
RN
AL
CO
MP
LIC
AT
ION
S O
F P
RE
GN
AN
CY
AN
D D
EL
IVE
RY
IN
LIV
E B
IRT
HS
BY
LO
CA
L H
EA
LT
H A
RE
A,
BR
ITIS
H C
OL
UM
BIA
, 20
00–2
004
AN
D 2
005
Tab
le
18
2000–2004 2005 Observed Total Observed Expected Total Local Health Area Births Ratio (p) Percent Live Births Births Births Ratio (p) Percent Live Births
001 Fernie 342 1.12 * 57.2 598 75 62.5 1.20 62.5 120 002 Cranbrook 431 0.76 * 38.7 1,113 103 113.0 0.91 47.5 217 003 Kimberley 119 0.84 43.0 277 26 31.8 0.82 42.6 61 004 Windermere 153 0.93 47.4 323 40 38.5 1.04 54.1 74 005 Creston 249 0.78 * 39.8 625 43 62.0 0.69 * 36.1 119 006 Kootenay Lake 85 0.93 47.2 180 11 21.9 0.50 * 26.2 42 007 Nelson 409 0.73 * 37.3 1,097 67 108.8 0.62 * 32.1 209 009 Castlegar 204 0.87 * 44.2 462 46 46.9 0.98 51.1 90 010 Arrow Lakes 90 0.93 47.4 190 13 12.5 1.04 54.2 24 011 Trail 336 0.95 48.6 692 74 81.7 0.91 47.1 157 012 Grand Forks 146 0.88 44.8 326 22 30.7 0.72 37.3 59 013 Kettle Valley 51 0.76 * 38.6 132 5 13.5 0.37 * 19.2 26 014 Southern Okanagan 287 0.88 * 45.0 638 64 54.7 1.17 61.0 105 015 Penticton 721 0.98 50.1 1,440 157 156.2 1.01 52.3 300 016 Keremeos 98 0.97 49.5 198 14 14.6 0.96 50.0 28 017 Princeton 54 0.87 44.6 121 16 18.2 0.88 45.7 35 018 Golden 174 1.08 55.1 316 36 40.6 0.89 46.2 78 019 Revelstoke 178 0.90 45.9 388 39 38.0 1.03 53.4 73 020 Salmon Arm 566 1.02 52.1 1,086 164 135.4 1.21 * 63.1 260 021 Armstrong - Spallumcheen 181 0.93 47.6 380 50 41.1 1.22 63.3 79 022 Vernon 1,332 1.01 51.7 2,577 300 278.0 1.08 56.2 534 023 Central Okanagan 3,109 0.91 * 46.6 6,676 706 730.0 0.97 50.4 1,402 024 Kamloops 2,101 0.93 * 47.4 4,429 442 455.1 0.97 50.6 874 025 100 Mile House 259 0.95 48.6 533 39 47.4 0.82 42.9 91 026 North Thompson 115 0.98 50.0 230 19 22.4 0.85 44.2 43 027 Cariboo - Chilcotin 828 1.07 * 54.9 1,509 133 139.5 0.95 49.6 268 028 Quesnel 554 0.95 48.7 1,137 97 117.7 0.82 42.9 226 029 Lillooet 148 1.02 52.1 284 29 29.2 0.99 51.8 56 030 South Cariboo 112 0.81 * 41.2 272 31 38.0 0.82 42.5 73 031 Merritt 231 0.85 * 43.6 530 57 60.9 0.94 48.7 117 032 Hope 187 0.97 49.7 376 42 39.1 1.08 56.0 75 033 Chilliwack 2,025 0.96 48.9 4,137 450 470.2 0.96 49.8 903 034 Abbotsford 3,773 0.93 * 47.2 7,986 753 834.6 0.90 * 47.0 1,603 035 Langley 2,984 0.96 * 49.0 6,091 618 625.9 0.99 51.4 1,202 037 Delta 2,661 1.06 * 54.1 4,916 485 470.2 1.03 53.7 903 038 Richmond 4,184 1.05 * 53.7 7,795 816 817.5 1.00 52.0 1,570 040 New Westminster 1,746 1.06 * 54.2 3,220 350 324.4 1.08 56.2 623 041 Burnaby 5,261 1.00 50.9 10,334 1,059 1,080.9 0.98 51.0 2,076 042 Maple Ridge 2,330 1.04 52.9 4,401 440 436.8 1.01 52.4 839 043 Coquitlam 5,714 1.07 * 54.6 10,472 1,155 1,036.1 1.11 * 58.0 1,990 044 North Vancouver 3,204 0.97 49.5 6,469 617 611.8 1.01 52.5 1,175 045 West Vancouver-Bowen Is. 739 0.96 49.1 1,504 153 155.7 0.98 51.2 299 046 Sunshine Coast 405 0.87 * 44.6 908 87 100.5 0.87 45.1 193 047 Powell River 411 1.07 54.7 751 71 70.8 1.00 52.2 136 048 Howe Sound 1,067 1.07 * 54.4 1,960 213 198.4 1.07 55.9 381 049 Bella Coola Valley 120 0.99 50.4 238 19 28.1 0.68 35.2 54 050 Queen Charlotte 182 1.07 54.8 332 28 24.5 1.14 59.6 47 051 Snow Country 18 0.84 42.9 42 5 3.1 1.60 83.3 6 052 Prince Rupert 477 0.90 * 46.1 1,034 86 78.1 1.10 57.3 150 053 Upper Skeena 214 1.13 57.7 371 48 38.5 1.25 64.9 74 054 Smithers 527 0.90 * 45.9 1,147 116 120.8 0.96 50.0 232 055 Burns Lake 220 0.95 48.6 453 35 45.8 0.76 39.8 88 056 Nechako 545 0.94 47.9 1,137 116 119.8 0.97 50.4 230 057 Prince George 2,393 0.89 * 45.6 5,249 516 559.2 0.92 48.0 1,074 059 Peace River South 597 0.84 * 42.7 1,398 91 137.5 0.66 * 34.5 264 060 Peace River North 1,007 0.80 * 40.9 2,460 214 277.0 0.77 * 40.2 532 061 Greater Victoria 4,226 0.96 * 49.0 8,616 939 916.4 1.02 53.4 1,760 062 Sooke 1,433 0.99 50.5 2,837 350 340.0 1.03 53.6 653 063 Saanich 954 0.94 * 47.8 1,996 196 215.0 0.91 47.5 413 064 Gulf Islands 180 0.80 * 40.8 441 31 43.7 0.71 36.9 84 065 Cowichan 1,111 0.90 * 45.9 2,420 220 240.6 0.91 47.6 462 066 Lake Cowichan 108 0.98 50.0 216 23 24.5 0.94 48.9 47 067 Ladysmith 382 1.11 * 56.5 676 91 86.4 1.05 54.8 166 068 Nanaimo 2,592 1.28 * 65.2 3,978 513 424.9 1.21 * 62.9 816 069 Qualicum 713 1.24 * 63.2 1,128 135 121.3 1.11 57.9 233 070 Alberni 812 1.09 * 55.7 1,457 200 174.9 1.14 59.5 336 071 Courtenay 1,140 0.97 49.7 2,293 215 243.2 0.88 46.0 467 072 Campbell River 1,070 1.16 * 59.1 1,810 201 170.8 1.18 * 61.3 328 075 Mission 944 0.89 * 45.3 2,085 200 231.7 0.86 * 44.9 445 076 Agassiz - Harrison 213 0.96 49.2 433 39 47.4 0.82 42.9 91 077 Summerland 173 0.95 48.6 356 31 34.9 0.89 46.3 67 078 Enderby 160 1.08 55.0 291 36 39.1 0.92 48.0 75 080 Kitimat 286 1.06 54.2 528 39 48.4 0.81 41.9 93 081 Fort Nelson 234 0.97 49.7 471 55 56.2 0.98 50.9 108 083 Central Coast 61 1.07 54.5 112 16 15.6 1.02 53.3 30 084 Vancouver Island West 93 1.08 55.0 169 15 14.1 1.07 55.6 27 085 Vancouver Island North 403 0.96 49.0 822 70 70.8 0.99 51.5 136 087 Stikine 17 0.95 48.6 35 5 4.2 1.20 62.5 8 088 Terrac 728 1.07 54.8 1,329 118 126.0 0.94 48.8 242 092 Nisga’a 85 1.11 56.7 150 12 14.6 0.82 42.9 28 094 Telegraph Creek 24 1.04 53.3 45 4 4.2 0.96 50.0 8 161 Vancouver - City Centre 2,288 1.16 * 59.2 3,866 513 451.4 1.14 * 59.2 867 162 Vancouver - Downtown E.side 1,212 1.04 53.0 2,285 244 258.3 0.94 49.2 496 163 Vancouver - North East 2,800 0.99 50.3 5,568 598 590.4 1.01 52.7 1,134 164 Vancouver - Westside 2,915 1.07 * 54.7 5,326 616 581.1 1.06 55.2 1,116 165 Vancouver - Midtown 2,677 1.03 52.7 5,079 518 515.5 1.00 52.3 990 166 Vancouver - South 3,259 1.02 52.0 6,272 651 674.3 0.97 50.3 1,295 201 Surrey 11,547 1.03 * 52.8 21,867 2,462 2,352.4 1.05 * 54.5 4,518 202 South Surrey/White Rock 1,296 1.03 52.6 2,463 307 283.8 1.08 56.3 545 PROVINCIAL TOTAL 102,828 1.00 51.0 201,439 21,167 21,167.0 1.00 52.1 40,653Note: *Statistical testing indicates that the observed number of births with maternal complications is signfi cantly different from theexpected (p<0.05, two tailed). Ratio - observed over the expected. Percent of observed births is based on total live births. Total includesresidents with unknown LHA. Non-residents are excluded.
56

B I R T H - R E L A T E D S T A T I S T I C S 57
Note: Ratio - Observed over the expected. Refer to Figure 1 to clarify geographical location of Local Health Area
N
Statistically Significant
QUINTILE (Ratio)
5 ( > 1.07)
2 (0.90 - 0.95)
1 ( < 0.90)
4 ( 0.99 - 1.07)
3 ( 0.95 - 0.99)
Inset 1
see inset 2
Inset 2
see inset 1
50 kms0
10 kms0
300 kms0 100 200
FIGURE 33MATERNAL COMPLICATIONS OF PREGNANCY AND
DELIVERY IN LIVE BIRTHS BY LOCAL HEALTH AREABR I T I S H CO L U M B I A, 2000–2004

58 B I R T H - R E L A T E D S T A T I S T I C S
TABLE 19PERINATAL COMPLICATIONS IN LIVE BIRTHS BY AGE OF MOTHER
BR I T I S H CO L U M B I A, 2000–2004 A N D 2005
2005 2000–2004 Age of Mother (in Years)Perinatal Complications ICD-10 Code Total Percent <20 20–29 30–39 40+ N.S. Total Percent
Fetus/newborn affected by P00 58 0.1 1 6 - - - 7 0.0maternal conditions that maybe unrelated to presentpregnancyComplications of pregnancy, P01, P03 12,204 13.7 57 988 1,306 119 - 2,470 13.6labour and deliveryFetus/newborn affected by P02 3,875 4.4 20 275 337 44 - 676 3.7complications of placenta,cord and membranesFetus affected by noxious P04 11 0.0 - 4 1 - - 5 0.0infl uences transmitted viaplacenta or breast milkSlow fetal growth and P05 4,426 5.0 24 230 206 26 - 486 2.7malnutritionPerinatal disorders related P072, P073 13,832 15.5 121 1,208 1,523 160 - 3,012 16.6to short gestationDisorders related to long P08 10,311 11.6 97 1,398 1,715 111 - 3,321 18.3gestation or high birth weightPerinatal birth trauma P10-P15 291 0.3 3 28 18 1 - 50 0.3Intrauterine hypoxia P20-P21 42,684 48.0 295 3,543 3,734 308 - 7,880 43.5and birth asphyxiaRespiratory conditions of P22-P28 709 0.8 8 51 55 3 - 117 0.6fetus and newbornCardiovascular disorders P29 - - - - - - - - -originating in the perinatal periodInfections specifi c to the P35-P39 53 0.1 - 1 7 - - 8 0.0perinatal periodFetal and neonatal hemorrhage P50-P52, P54 120 0.1 1 10 5 1 - 17 0.1Perinatal jaundice/other P53, P55-P61 58 0.1 - 5 3 - - 8 0.0hematological disordersPerinatal endocrine and P70-P74 29 0.0 - 5 3 - - 8 0.0metabolic disordersDigestive system disorders P76-P78 4 0.0 - - - - - - -of fetus and newbornPerinatal conditions of the P80-P83 118 0.1 1 7 11 - - 19 0.1integument and oftemperature regulationOther disorders originating P90-P96 205 0.2 2 13 21 1 - 37 0.2in the perinatal periodAll Perinatal Complications 88,988 100.0 630 7,772 8,945 774 - 18,121 100.0Live births with the above - Number 68,835 512 6,135 6,979 581 - 14,207 perinatal complications - Percent(*) 34.2 38.4 35.4 34.2 36.0 34.9
Note: Percent based upon perinatal complications. Percent (*) based upon live births for the maternal age group. Total percentage may not add up to 100 due to rounding. N.S. - Not stated. Non-residents are excluded.

B I R T H - R E L A T E D S T A T I S T I C S 59
Vital Statistics Information BoxVital Statistics Information Box
Vital Statistics Information Box
Area Province/Country Births DeathsCanada Total 26,704 20,121 British Columbia 18,760 7,759 Alberta 2,360 2,889 Saskatchewan 777 3,840 Ontario 2,531 2,081 Manitoba 819 2,088 Quebec 657 668 Nova Scotia 293 368 New Brunswick 161 209 Newfoundland 183 112 Yukon 81 28 Prince Edward Island 36 51 Northwest Territories and Nunavut 44 17 Unknown Province 2 11
North and Central America Total 1,422 915 United States 683 749 Other North and 463 101 Central American Countries
South America 276 65
Europe Total 1,988 6,315 England 445 1,902 Scotland 91 634 Other United Kingdom 182 373 Germany 198 675 Poland 121 275 Former USSR 122 233 Scandinavian Countries 33 320 Italy 24 314 Former Yugoslavia 66 85 Other European Countries 706 1,504 Asia and the Middle East Total 8,997 2,224 India 2,712 513 China 1,817 925 Philippines 1,224 140 Vietnam 603 59 Hong Kong 448 152 Korea 418 72 Japan 316 69 Taiwan 287 36 Other Asian and 1,172 258 Middle Eastern CountriesAfrica 519 143
Oceania Total 431 166 Fiji 251 86 Australia 173 80 Other Oceanic Countries 7 -
Unknown 592 149
Total 40,653 30,033
Note: Births consist of live births only. Non-residents are excluded.
BIRTHS BY MOTHER’S COUNTRY OF BIRTH AND DEATHS BY DECEDENT’S COUNTRY OF BIRTHBR I T I S H CO L U M B I A, 2005
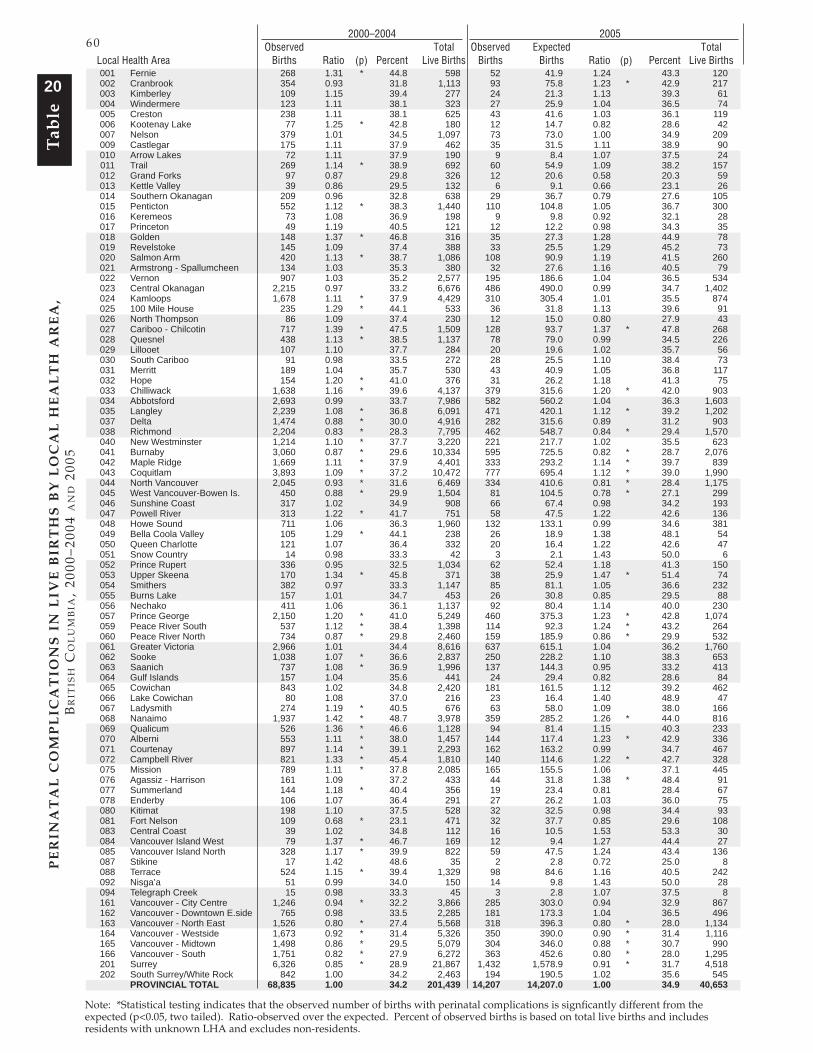
60 B I R T H - R E L A T E D S T A T I S T I C S
2000–2004 2005 Observed Total Observed Expected Total Local Health Area Births Ratio (p) Percent Live Births Births Births Ratio (p) Percent Live Births
001 Fernie 268 1.31 * 44.8 598 52 41.9 1.24 43.3 120 002 Cranbrook 354 0.93 31.8 1,113 93 75.8 1.23 * 42.9 217 003 Kimberley 109 1.15 39.4 277 24 21.3 1.13 39.3 61 004 Windermere 123 1.11 38.1 323 27 25.9 1.04 36.5 74 005 Creston 238 1.11 38.1 625 43 41.6 1.03 36.1 119 006 Kootenay Lake 77 1.25 * 42.8 180 12 14.7 0.82 28.6 42 007 Nelson 379 1.01 34.5 1,097 73 73.0 1.00 34.9 209 009 Castlegar 175 1.11 37.9 462 35 31.5 1.11 38.9 90 010 Arrow Lakes 72 1.11 37.9 190 9 8.4 1.07 37.5 24 011 Trail 269 1.14 * 38.9 692 60 54.9 1.09 38.2 157 012 Grand Forks 97 0.87 29.8 326 12 20.6 0.58 20.3 59 013 Kettle Valley 39 0.86 29.5 132 6 9.1 0.66 23.1 26 014 Southern Okanagan 209 0.96 32.8 638 29 36.7 0.79 27.6 105 015 Penticton 552 1.12 * 38.3 1,440 110 104.8 1.05 36.7 300 016 Keremeos 73 1.08 36.9 198 9 9.8 0.92 32.1 28 017 Princeton 49 1.19 40.5 121 12 12.2 0.98 34.3 35 018 Golden 148 1.37 * 46.8 316 35 27.3 1.28 44.9 78 019 Revelstoke 145 1.09 37.4 388 33 25.5 1.29 45.2 73 020 Salmon Arm 420 1.13 * 38.7 1,086 108 90.9 1.19 41.5 260 021 Armstrong - Spallumcheen 134 1.03 35.3 380 32 27.6 1.16 40.5 79 022 Vernon 907 1.03 35.2 2,577 195 186.6 1.04 36.5 534 023 Central Okanagan 2,215 0.97 33.2 6,676 486 490.0 0.99 34.7 1,402 024 Kamloops 1,678 1.11 * 37.9 4,429 310 305.4 1.01 35.5 874 025 100 Mile House 235 1.29 * 44.1 533 36 31.8 1.13 39.6 91 026 North Thompson 86 1.09 37.4 230 12 15.0 0.80 27.9 43 027 Cariboo - Chilcotin 717 1.39 * 47.5 1,509 128 93.7 1.37 * 47.8 268 028 Quesnel 438 1.13 * 38.5 1,137 78 79.0 0.99 34.5 226 029 Lillooet 107 1.10 37.7 284 20 19.6 1.02 35.7 56 030 South Cariboo 91 0.98 33.5 272 28 25.5 1.10 38.4 73 031 Merritt 189 1.04 35.7 530 43 40.9 1.05 36.8 117 032 Hope 154 1.20 * 41.0 376 31 26.2 1.18 41.3 75 033 Chilliwack 1,638 1.16 * 39.6 4,137 379 315.6 1.20 * 42.0 903 034 Abbotsford 2,693 0.99 33.7 7,986 582 560.2 1.04 36.3 1,603 035 Langley 2,239 1.08 * 36.8 6,091 471 420.1 1.12 * 39.2 1,202 037 Delta 1,474 0.88 * 30.0 4,916 282 315.6 0.89 31.2 903 038 Richmond 2,204 0.83 * 28.3 7,795 462 548.7 0.84 * 29.4 1,570 040 New Westminster 1,214 1.10 * 37.7 3,220 221 217.7 1.02 35.5 623 041 Burnaby 3,060 0.87 * 29.6 10,334 595 725.5 0.82 * 28.7 2,076 042 Maple Ridge 1,669 1.11 * 37.9 4,401 333 293.2 1.14 * 39.7 839 043 Coquitlam 3,893 1.09 * 37.2 10,472 777 695.4 1.12 * 39.0 1,990 044 North Vancouver 2,045 0.93 * 31.6 6,469 334 410.6 0.81 * 28.4 1,175 045 West Vancouver-Bowen Is. 450 0.88 * 29.9 1,504 81 104.5 0.78 * 27.1 299 046 Sunshine Coast 317 1.02 34.9 908 66 67.4 0.98 34.2 193 047 Powell River 313 1.22 * 41.7 751 58 47.5 1.22 42.6 136 048 Howe Sound 711 1.06 36.3 1,960 132 133.1 0.99 34.6 381 049 Bella Coola Valley 105 1.29 * 44.1 238 26 18.9 1.38 48.1 54 050 Queen Charlotte 121 1.07 36.4 332 20 16.4 1.22 42.6 47 051 Snow Country 14 0.98 33.3 42 3 2.1 1.43 50.0 6 052 Prince Rupert 336 0.95 32.5 1,034 62 52.4 1.18 41.3 150 053 Upper Skeena 170 1.34 * 45.8 371 38 25.9 1.47 * 51.4 74 054 Smithers 382 0.97 33.3 1,147 85 81.1 1.05 36.6 232 055 Burns Lake 157 1.01 34.7 453 26 30.8 0.85 29.5 88 056 Nechako 411 1.06 36.1 1,137 92 80.4 1.14 40.0 230 057 Prince George 2,150 1.20 * 41.0 5,249 460 375.3 1.23 * 42.8 1,074 059 Peace River South 537 1.12 * 38.4 1,398 114 92.3 1.24 * 43.2 264 060 Peace River North 734 0.87 * 29.8 2,460 159 185.9 0.86 * 29.9 532 061 Greater Victoria 2,966 1.01 34.4 8,616 637 615.1 1.04 36.2 1,760 062 Sooke 1,038 1.07 * 36.6 2,837 250 228.2 1.10 38.3 653 063 Saanich 737 1.08 * 36.9 1,996 137 144.3 0.95 33.2 413 064 Gulf Islands 157 1.04 35.6 441 24 29.4 0.82 28.6 84 065 Cowichan 843 1.02 34.8 2,420 181 161.5 1.12 39.2 462 066 Lake Cowichan 80 1.08 37.0 216 23 16.4 1.40 48.9 47 067 Ladysmith 274 1.19 * 40.5 676 63 58.0 1.09 38.0 166 068 Nanaimo 1,937 1.42 * 48.7 3,978 359 285.2 1.26 * 44.0 816 069 Qualicum 526 1.36 * 46.6 1,128 94 81.4 1.15 40.3 233 070 Alberni 553 1.11 * 38.0 1,457 144 117.4 1.23 * 42.9 336 071 Courtenay 897 1.14 * 39.1 2,293 162 163.2 0.99 34.7 467 072 Campbell River 821 1.33 * 45.4 1,810 140 114.6 1.22 * 42.7 328 075 Mission 789 1.11 * 37.8 2,085 165 155.5 1.06 37.1 445 076 Agassiz - Harrison 161 1.09 37.2 433 44 31.8 1.38 * 48.4 91 077 Summerland 144 1.18 * 40.4 356 19 23.4 0.81 28.4 67 078 Enderby 106 1.07 36.4 291 27 26.2 1.03 36.0 75 080 Kitimat 198 1.10 37.5 528 32 32.5 0.98 34.4 93 081 Fort Nelson 109 0.68 * 23.1 471 32 37.7 0.85 29.6 108 083 Central Coast 39 1.02 34.8 112 16 10.5 1.53 53.3 30 084 Vancouver Island West 79 1.37 * 46.7 169 12 9.4 1.27 44.4 27 085 Vancouver Island North 328 1.17 * 39.9 822 59 47.5 1.24 43.4 136 087 Stikine 17 1.42 48.6 35 2 2.8 0.72 25.0 8 088 Terrace 524 1.15 * 39.4 1,329 98 84.6 1.16 40.5 242 092 Nisga’a 51 0.99 34.0 150 14 9.8 1.43 50.0 28 094 Telegraph Creek 15 0.98 33.3 45 3 2.8 1.07 37.5 8 161 Vancouver - City Centre 1,246 0.94 * 32.2 3,866 285 303.0 0.94 32.9 867 162 Vancouver - Downtown E.side 765 0.98 33.5 2,285 181 173.3 1.04 36.5 496 163 Vancouver - North East 1,526 0.80 * 27.4 5,568 318 396.3 0.80 * 28.0 1,134 164 Vancouver - Westside 1,673 0.92 * 31.4 5,326 350 390.0 0.90 * 31.4 1,116 165 Vancouver - Midtown 1,498 0.86 * 29.5 5,079 304 346.0 0.88 * 30.7 990 166 Vancouver - South 1,751 0.82 * 27.9 6,272 363 452.6 0.80 * 28.0 1,295 201 Surrey 6,326 0.85 * 28.9 21,867 1,432 1,578.9 0.91 * 31.7 4,518 202 South Surrey/White Rock 842 1.00 34.2 2,463 194 190.5 1.02 35.6 545 PROVINCIAL TOTAL 68,835 1.00 34.2 201,439 14,207 14,207.0 1.00 34.9 40,653
PE
RIN
AT
AL
CO
MP
LIC
AT
ION
S I
N L
IVE
BIR
TH
S B
Y L
OC
AL
HE
AL
TH
AR
EA
,
B
RIT
ISH
CO
LU
MB
IA,
2000
–200
4 A
ND
200
5T
able
20
Note: *Statistical testing indicates that the observed number of births with perinatal complications is signfi cantly different from theexpected (p<0.05, two tailed). Ratio-observed over the expected. Percent of observed births is based on total live births and includesresidents with unknown LHA and excludes non-residents.
20
60

B I R T H - R E L A T E D S T A T I S T I C S 61
Note: Ratio - Observed over the expected. Refer to Figure 1 to clarify geographical location of Local Health Area
N
Statistically Significant
QUINTILE (Ratio)
5 ( > 1.17)
2 (0.97 - 1.04)
1 ( < 0.97)
4 ( 1.11 - 1.17)
3 ( 1.04 - 1.11)
Inset 1
see inset 2
Inset 2
see inset 1
50 kms0
10 kms0
300 kms0 100 200
FIGURE 34PERINATAL COMPLICATIONS IN LIVE BIRTHS
BY LOCAL HEALTH AREABR I T I S H CO L U M B I A, 2000–2004


Death-related Statistics

Vital Statistics Information Box
AGE AT DEATH OF THE OLDEST MALE AND FEMALEBR I T I S H CO L U M B I A, 1986-2005
Gender 1986 1987 1988 1989 1990 1991 1992 1993 1994 1995 1996 1997 1998 1999 2000 2001 2002 2003 2004 2005 Male 105 107 111 110 113 105 111 111 109 108 108 106 109 108 109 104 104 107 106 107 Female 110 107 110 110 110 113 107 110 110 108 109 111 113 108 111 113 111 107 108 110
Vital Statistics Information Box
Age at Death %Health Service Delivery Area Gender 65-69 70-74 75-79 80-84 85-89 90-94 95-99 100+ Total 65+11 East Kootenay M 22 41 58 56 46 19 5 - 247 76.0 F 11 32 33 41 52 47 17 9 242 79.912 Kootenay Boundary M 32 38 53 47 52 35 6 - 263 73.5 F 19 39 31 55 54 65 19 1 283 81.313 Okanagan M 115 192 239 294 228 153 45 10 1,276 76.0 F 74 119 194 281 319 239 87 18 1,331 86.514 Thompson Cariboo Shuswap M 79 116 120 143 95 48 7 1 609 68.2 F 61 61 114 132 135 81 35 4 623 80.721 Fraser East M 98 132 164 157 143 87 14 8 803 74.8 F 59 82 128 186 189 140 51 18 853 84.122 Fraser North M 133 175 223 279 221 152 37 4 1,224 73.2 F 97 135 204 316 294 295 93 23 1,457 83.523 Fraser South M 147 199 280 321 276 139 49 7 1,418 71.0 F 104 136 220 340 353 250 100 24 1,527 80.531 Richmond M 30 50 57 72 55 47 14 4 329 75.6 F 22 35 50 83 70 69 20 8 357 84.432 Vancouver M 136 206 270 304 239 157 42 - 1,354 68.9 F 83 119 201 295 341 295 152 32 1,518 84.233 North Shore/Coast Garibaldi M 82 119 152 162 115 85 27 2 744 76.8 F 39 68 126 158 174 174 68 17 824 85.541 South Vancouver Island M 95 131 214 279 262 174 48 7 1,210 78.9 F 68 92 182 346 352 248 126 29 1,443 86.842 Central Vancouver Island M 96 150 200 218 153 89 22 2 930 75.9 F 57 100 136 209 187 128 42 15 874 81.343 North Vancouver Island M 43 40 58 74 44 25 11 1 296 64.2 F 29 40 57 69 62 43 18 5 323 79.251 Northwest M 20 34 39 29 19 7 2 - 150 66.1 F 13 16 20 21 27 21 3 - 121 72.952 Northern Interior M 55 50 56 46 24 20 6 - 257 57.4 F 33 30 49 48 44 33 6 4 247 73.753 Northeast M 14 24 25 27 16 4 2 - 112 59.3 F 11 12 14 13 9 18 3 1 81 67.5 Provincial Total M 1,198 1,698 2,208 2,508 1,988 1,241 337 46 11,224 72.6
F 780 1,117 1,759 2,593 2,662 2,146 840 208 12,105 83.0Note: %65+ is the percentage of deaths aged 65 or older out of all deaths to residents of the specifi ed area. Provincial Total includes residents with unknown addresses.
DEATHS AGED 65+ BY GENDER AND HEALTH SERVICE DELIVERY AREABR I T I S H CO L U M B I A, 2005
Death Introduction
In recognition of the importance of mortality statistics for health planning and research a comprehensive array of tables is presented in this part of the report. Causes of death and/or age at death form the base of most tables because they are crucial components of health status for regional, national, and international comparisons. While other causes may have contributed to the death, the Underlying Cause of Death (see Glossary) is widely accepted as the ‘main’ or ‘important’ reason for the death and was used for these tabulations. All causes are identifi ed according to the World Health Organization’s International Statistical Classifi cation of Diseases and Related Health Problems, Tenth Revision (ICD-10) which is a statistical coding system and the accepted international standard. The groups of codes used to defi ne particular topics are noted in the tables.
Deaths – General Indicators
An overall view of the number of deaths by ICD-10 chapters by age group and gender is shown in Table 21. It provides a summary of the contribution of the main cause groups to total deaths in British Columbia in 2005. More detailed information for the same age groups appears in Appendix 2, which provides counts at the “3-character level” for causes responsible for at least fi ve deaths. Although the causes shown in Appendix 2 are fairly specifi c, most ICD-10 codes consist of four or fi ve characters, and are therefore even more detailed than the “roll ups” shown in Appendix 2. Neoplasms and diseases of the circulatory system accounted for most of the deaths in 2005 for both genders. Deaths in those two cause categories are further analysed in the following sections.
65

66 D E A T H - R E L A T E D S T A T I S T I C S
TABLE 21CAUSES OF DEATH BY GENDER AND AGE
BR I T I S H CO L U M B I A, 2005
Age Group (in Years) TotalICD-10 Code(s) Causes of Death Gender <1 1–4 5–9 10–14 15–19 20–24 25–44 45–64 65–79 80+ Number Percent ASMR
A00-B99 Certain infectious and parasitic M 1 - - - - 1 73 122 77 75 349 2.3 1.43 diseases F 2 1 1 - - 1 24 40 45 103 217 1.5 0.69 T 3 1 1 - - 2 97 162 122 178 566 1.9 1.05C00-D48 Neoplasms M - - 1 2 5 8 86 1,113 2,021 1,369 4,605 29.8 18.67 F - 2 - 2 3 6 126 969 1,513 1,344 3,965 27.2 13.24 T - 2 1 4 8 14 212 2,082 3,534 2,713 8,570 28.5 15.59D50-D89 Diseases of blood and blood- M - 1 - - - - 5 7 6 20 39 0.3 0.17 forming organs,certain immune F - - - - - - 4 3 10 34 51 0.3 0.15 mechanisms T - 1 - - - - 9 10 16 54 90 0.3 0.16E00-E90 Endocrine/nutritional/metabolic M 3 2 - 1 2 2 10 132 267 237 656 4.2 2.69 diseases F - - - 1 1 5 13 77 180 361 638 4.4 1.91 T 3 2 - 2 3 7 23 209 447 598 1,294 4.3 2.27F00-F99 Mental and behavioural disorders M - - - - - - 21 58 87 198 364 2.4 1.49 F - - - - - 2 11 30 49 406 498 3.4 1.25 T - - - - - 2 32 88 136 604 862 2.9 1.38G00-G99 Diseases of the nervous system M 4 1 2 2 1 6 11 65 163 242 497 3.2 2.05 F - - 1 2 2 1 9 66 135 385 601 4.1 1.69 T 4 1 3 4 3 7 20 131 298 627 1,098 3.7 1.86H00-H59 Diseases of the eye and adnexa M - - - - - - - - - - - - - F - - - - - - - - - - - - - T - - - - - - - - - - - - -H60-H95 Diseases of the ear and mastoid M - - - - - - - - - - - - - process F - - - - - - - - 1 - 1 0.0 + T - - - - - - - - 1 - 1 0.0 +I00-I99 Diseases of the circulatory M 1 1 - 1 1 5 80 685 1,512 2,402 4,688 30.3 19.05 system F 1 - - - - 4 34 261 968 3,671 4,939 33.9 13.00 T 2 1 - 1 1 9 114 946 2,480 6,073 9,627 32.1 15.78J00-J99 Diseases of the respiratory M 1 1 - - 1 - 17 146 489 943 1,598 10.3 6.51 system F - - 1 - - - 11 102 381 1,168 1,663 11.4 4.51 T 1 1 1 - 1 - 28 248 870 2,111 3,261 10.9 5.33K00-K93 Diseases of the digestive M 3 1 - - - 1 34 160 194 203 596 3.9 2.42 system F - - - - - - 18 88 140 339 585 4.0 1.71 T 3 1 - - - 1 52 248 334 542 1,181 3.9 2.05L00-L99 Diseases of the skin and M - - - - - - 2 5 6 16 29 0.2 0.12 subcutaneous tissue F - - - - - - - 1 10 28 39 0.3 0.10 T - - - - - - 2 6 16 44 68 0.2 0.11M00-M99 Diseases of the musculoskeletal M - - - - 1 - 1 11 22 21 56 0.4 0.23 system and connective tissue F - - - - - - 4 13 33 76 126 0.9 0.37 T - - - - 1 - 5 24 55 97 182 0.6 0.31N00-N99 Diseases of the genitourinary M - - - 1 - - 3 21 91 210 326 2.1 1.33 system F - - - - - - 1 12 78 257 348 2.4 0.92 T - - - 1 - - 4 33 169 467 674 2.2 1.08O00-O99 Complications of pregnancy, M - - - - - - - - - - - - - childbirth and the puerperium F - - - - - - 2 - - - 2 0.0 + T - - - - - - 2 - - - 2 0.0 +P00-P96 Certain conditions originating M 53 - - - - - - - - - 53 0.3 0.37 in the perinatal period F 37 - 1 - - - - - - - 38 0.3 0.28 T 90 - 1 - - - - - - - 91 0.3 0.33Q00-Q99 Congenital anomalies M 21 3 1 1 - 2 6 7 2 1 44 0.3 0.25 F 16 2 - 2 1 1 1 8 4 4 39 0.3 0.21 T 37 5 1 3 1 3 7 15 6 5 83 0.3 0.23R00-R99 Symptoms, signs and ill-defi ned M 20 5 3 3 17 38 138 151 38 39 452 2.9 2.07 conditions, unknown causes F 11 2 - 3 2 9 60 73 29 87 276 1.9 1.04 T 31 7 3 6 19 47 198 224 67 126 728 2.4 1.57V01-Y98 External causes M - 1 1 5 40 92 343 350 129 144 1,105 7.1 4.89 F - 2 1 - 22 26 117 116 80 185 549 3.8 2.01 T - 3 2 5 62 118 460 466 209 329 1,654 5.5 3.42 All causes M 107 16 8 16 68 155 830 3,033 5,104 6,120 15,457 100.0 63.75 F 67 9 5 10 31 55 435 1,859 3,656 8,449 14,576 100.0 43.09 PROVINCIAL TOTAL T 174 25 13 26 99 210 1,265 4,892 8,760 14,569 30,033 100.0 52.52
Note: ASMR – Age Standardized Mortality Rate per 10,000 standard population (Canada 1991 Census). Total percentage may not add up to 100 due to rounding. + Denotes the number of cases is less than fi ve. Non-residents are excluded. Total includes unknown
gender. The output from ICD-10 mortality coding and underlying cause of death selection was modifi ed in British Columbia to refl ect the intent of certifi ers in this jurisdiction and to provide greater continuity over time. Data using the standard ICD-10 rules for such categories as pneumonia/infl uenza, diabetes, or cancer should not be compared to the numbers shown above.

D E A T H - R E L A T E D S T A T I S T I C S 67
Leading Causes of Death
Important causes of death, that is, those that account for the greatest number of deaths, provide good measures of the health status of a population because they portray the relative risks for members of the population of dying from particular diseases (“natural causes”) or external causes. Further, Age Standardized Mortality Rates permit comparisons to other jurisdictions or time periods where the same standard population was used. See Age Standardized Mortality Rate (ASMR) in the Glossary and an example of the computation method in the Methodology section.
Table 22 shows the twelve leading causes of death in B.C.. The two leftmost columns list the cause and the corresponding codes in ICD-10. For 2000-2004 and the year 2005, the following four values are shown: number of deaths, the rank by number of deaths, the ASMR, and the rank by ASMR. The numbers demonstrate the absolute impact of each cause of death by showing how many individuals died from that cause in B.C. during the time period. The rows of the table are in the order of the 2005 ASMR rank.
For 2005 the twelve leading causes of death shown in Table 22 were responsible for 85.0% of all deaths. The top three causes of death were the same for both time periods, not only in the rank by number of deaths but in the ASMR rank as well; they are (in non-clinical terms) cancer, heart disease, and stroke. For 2005 these three leading causes account for 57.6% of deaths.
Figure 35 shows visually the statistics in the Number column for 2005 in Table 22. It shows clearly the impact of cancer and heart disease on our population: causing over half (50.2%) of the deaths.
Table 23 shows the fi ve leading causes of death in the seven different age groups. Over half of the deaths under one year were due to conditions originating in the perinatal period (the period before, during, or shortly after birth) and seven out of ten of those (72.1%) occurred less than seven days after birth (see Table 27). Except for certain infectious and parasitic diseases, a substantially greater number of males died from each of the causes in Table 23 compared to females. Infant mortality (less than 1 year) is more fully examined in the next section.
Unintentional injuries were a major cause of death, particularly for males, in each of the three age groups from 1 year to 44 years of age. Those causes include events such as motor vehicle accidents, falls, and unintentional poisonings, but examine the specifi c list by using ICD codes in Appendix 2. Unintentional injuries cause particular concern because they are usually preventable, the victims are young, and the death is often sudden. Premature deaths are further considered in the section on Potential Years of Life Lost.
Among children 1-14 years old, congenital malformations and chromosome abnormalities caused the same number of deaths as unintentional injuries as shown in Table 23. Counts of deaths due to unintentional injuries, suicide, and homicide in the current year underestimate the actual fi gures due to known delays in determining causes of death. See the Information Box Updated External Causes of Death for more details.
Between 15 and 24 years of age, suicides ranked second as the leading cause after unintentional injuries (see Table 23). There were substantially fewer female deaths due to these two causes, nevertheless the two causes accounted for half of all deaths (56.3%) in this age group. Given the large proportion of suicides in this age group, awareness and prevention are important and a number of programs have been established to address the issue.
Unintentional injuries remained the leading cause of death among residents from 25 to 44 years and again, there were substantially fewer female deaths as shown in Table 23. However, malignant neoplasms caused a substantially greater number of female deaths compared to males and the largest proportion of female deaths in this age group.
Cancers (malignant neoplasms) were the leading cause for those between 45 and 64 years and they claimed a somewhat larger number of males compared to females, although a greater proportion of females in this age group died of cancer (see Table 23). The proportions were different because the remaining leading causes in this age group; cardiovascular disease, unintentional injuries, liver disease, and diabetes; claimed a substantially greater number of males.
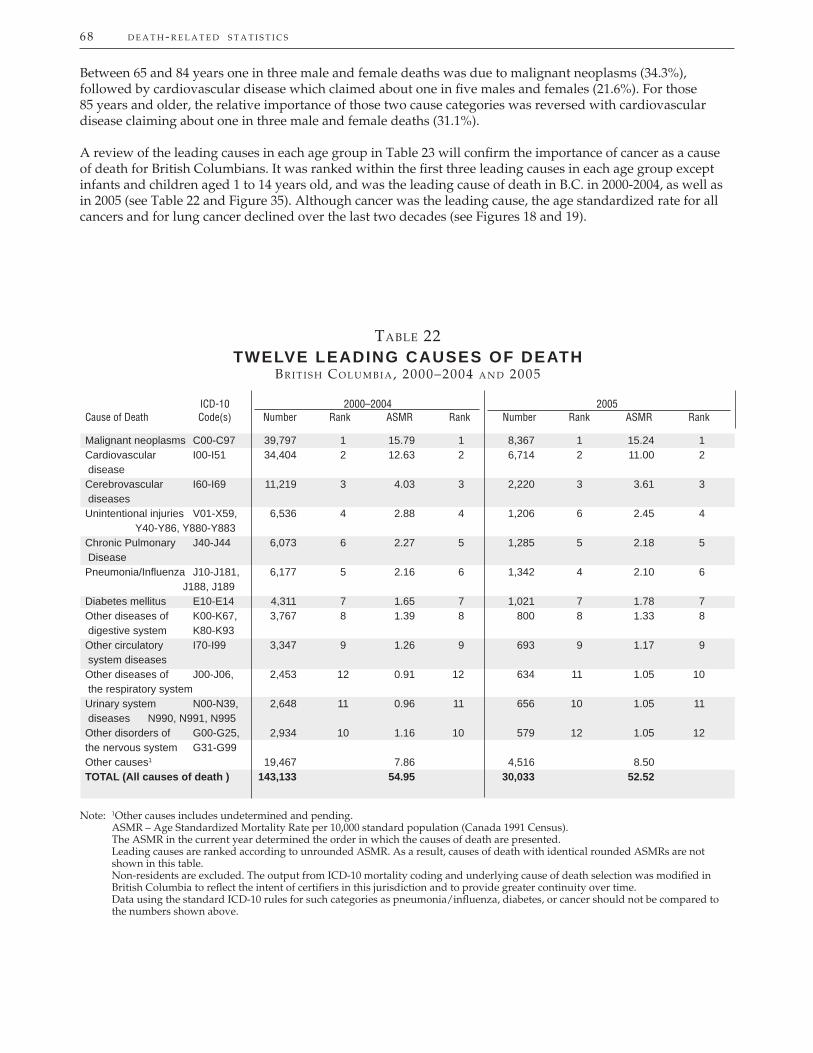
68 D E A T H - R E L A T E D S T A T I S T I C S
Malignant neoplasms C00-C97 39,797 1 15.79 1 8,367 1 15.24 1Cardiovascular I00-I51 34,404 2 12.63 2 6,714 2 11.00 2 diseaseCerebrovascular I60-I69 11,219 3 4.03 3 2,220 3 3.61 3 diseases Unintentional injuries V01-X59, 6,536 4 2.88 4 1,206 6 2.45 4 Y40-Y86, Y880-Y883Chronic Pulmonary J40-J44 6,073 6 2.27 5 1,285 5 2.18 5 DiseasePneumonia/Infl uenza J10-J181, 6,177 5 2.16 6 1,342 4 2.10 6 J188, J189Diabetes mellitus E10-E14 4,311 7 1.65 7 1,021 7 1.78 7 Other diseases of K00-K67, 3,767 8 1.39 8 800 8 1.33 8 digestive system K80-K93Other circulatory I70-I99 3,347 9 1.26 9 693 9 1.17 9 system diseasesOther diseases of J00-J06, 2,453 12 0.91 12 634 11 1.05 10 the respiratory systemUrinary system N00-N39, 2,648 11 0.96 11 656 10 1.05 11 diseases N990, N991, N995Other disorders of G00-G25, 2,934 10 1.16 10 579 12 1.05 12 the nervous system G31-G99Other causes1 19,467 7.86 4,516 8.50 TOTAL (All causes of death ) 143,133 54.95 30,033 52.52
Note: 1Other causes includes undetermined and pending. ASMR – Age Standardized Mortality Rate per 10,000 standard population (Canada 1991 Census). The ASMR in the current year determined the order in which the causes of death are presented. Leading causes are ranked according to unrounded ASMR. As a result, causes of death with identical rounded ASMRs are not
shown in this table. Non-residents are excluded. The output from ICD-10 mortality coding and underlying cause of death selection was modifi ed in British Columbia to refl ect the intent of certifi ers in this jurisdiction and to provide greater continuity over time. Data using the standard ICD-10 rules for such categories as pneumonia/infl uenza, diabetes, or cancer should not be compared to
the numbers shown above.
TABLE 22TWELVE LEADING CAUSES OF DEATH
BR I T I S H CO L U M B I A, 2000–2004 A N D 2005
ICD-10 2000–2004 2005Cause of Death Code(s) Number Rank ASMR Rank Number Rank ASMR Rank
Between 65 and 84 years one in three male and female deaths was due to malignant neoplasms (34.3%), followed by cardiovascular disease which claimed about one in fi ve males and females (21.6%). For those 85 years and older, the relative importance of those two cause categories was reversed with cardiovascular disease claiming about one in three male and female deaths (31.1%).
A review of the leading causes in each age group in Table 23 will confi rm the importance of cancer as a cause of death for British Columbians. It was ranked within the fi rst three leading causes in each age group except infants and children aged 1 to 14 years old, and was the leading cause of death in B.C. in 2000-2004, as well as in 2005 (see Table 22 and Figure 35). Although cancer was the leading cause, the age standardized rate for all cancers and for lung cancer declined over the last two decades (see Figures 18 and 19).

D E A T H - R E L A T E D S T A T I S T I C S 69
FIGURE 35TWELVE LEADING CAUSES OF DEATH
BR I T I S H CO L U M B I A, 2005
8,367
6,714
2,220
1,206
1,285
1,342
1,021
800
693
634
656
579
0 1,000 2,000 3,000 4,000 5,000 6,000 7,000 8,000 9,000
Malignant neoplasms
Cardiovascular disease
Cerebrovascular diseases
Unintentional injuries
Chronic Pulmonary Disease
Pneumonia/Influenza
Diabetes mellitus
Other diseases of digestive system
Other circulatory system diseases
Other diseases of the respiratory system
Urinary system diseases
Other disorders of the nervous system
Cause of Death
Number of Deaths
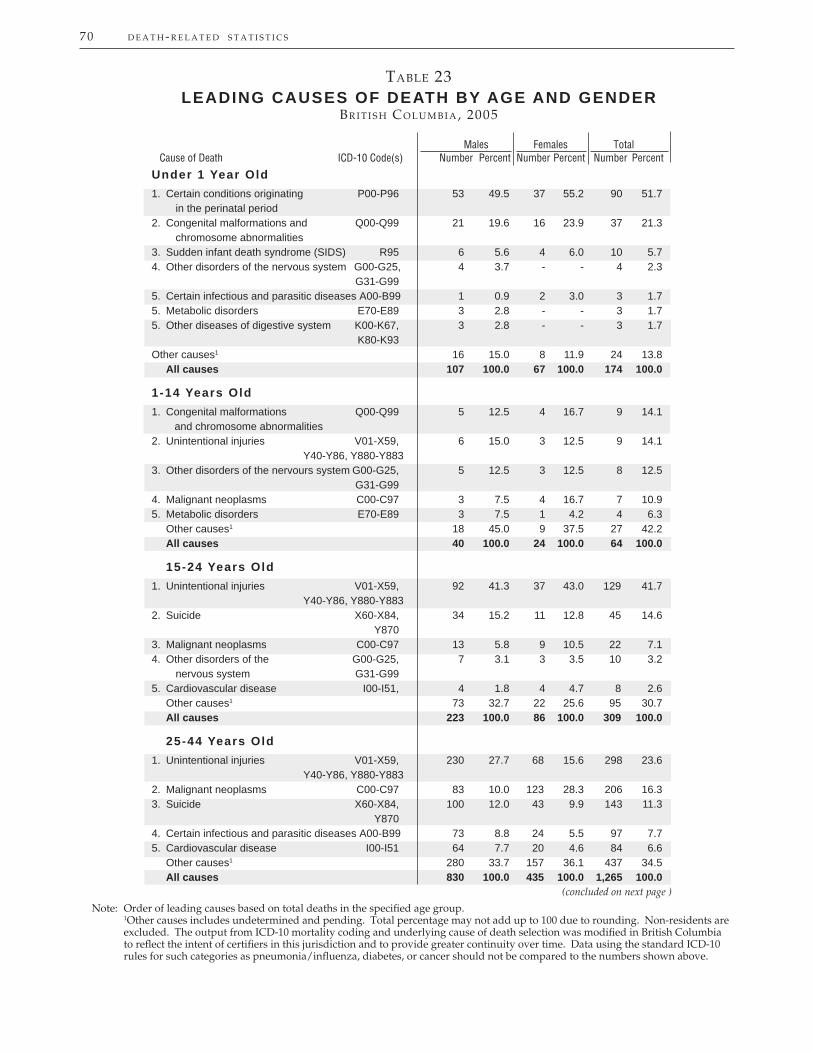
70 D E A T H - R E L A T E D S T A T I S T I C S
TABLE 23LEADING CAUSES OF DEATH BY AGE AND GENDER
BR I T I S H CO L U M B I A, 2005
Males Females TotalCause of Death ICD-10 Code(s) Number Percent Number Percent Number Percent
Under 1 Year Old 1. Certain conditions originating P00-P96 53 49.5 37 55.2 90 51.7 in the perinatal period 2. Congenital malformations and Q00-Q99 21 19.6 16 23.9 37 21.3 chromosome abnormalities 3. Sudden infant death syndrome (SIDS) R95 6 5.6 4 6.0 10 5.74. Other disorders of the nervous system G00-G25, 4 3.7 - - 4 2.3 G31-G995. Certain infectious and parasitic diseases A00-B99 1 0.9 2 3.0 3 1.75. Metabolic disorders E70-E89 3 2.8 - - 3 1.75. Other diseases of digestive system K00-K67, 3 2.8 - - 3 1.7 K80-K93Other causes1 16 15.0 8 11.9 24 13.8 All causes 107 100.0 67 100.0 174 100.0
1-14 Years Old1. Congenital malformations Q00-Q99 5 12.5 4 16.7 9 14.1 and chromosome abnormalities2. Unintentional injuries V01-X59, 6 15.0 3 12.5 9 14.1 Y40-Y86, Y880-Y8833. Other disorders of the nervours system G00-G25, 5 12.5 3 12.5 8 12.5 G31-G994. Malignant neoplasms C00-C97 3 7.5 4 16.7 7 10.95. Metabolic disorders E70-E89 3 7.5 1 4.2 4 6.3 Other causes1 18 45.0 9 37.5 27 42.2 All causes 40 100.0 24 100.0 64 100.0
15-24 Years Old1. Unintentional injuries V01-X59, 92 41.3 37 43.0 129 41.7 Y40-Y86, Y880-Y8832. Suicide X60-X84, 34 15.2 11 12.8 45 14.6 Y8703. Malignant neoplasms C00-C97 13 5.8 9 10.5 22 7.14. Other disorders of the G00-G25, 7 3.1 3 3.5 10 3.2 nervous system G31-G995. Cardiovascular disease I00-I51, 4 1.8 4 4.7 8 2.6 Other causes1 73 32.7 22 25.6 95 30.7 All causes 223 100.0 86 100.0 309 100.0
25-44 Years Old 1. Unintentional injuries V01-X59, 230 27.7 68 15.6 298 23.6 Y40-Y86, Y880-Y8832. Malignant neoplasms C00-C97 83 10.0 123 28.3 206 16.33. Suicide X60-X84, 100 12.0 43 9.9 143 11.3 Y8704. Certain infectious and parasitic diseases A00-B99 73 8.8 24 5.5 97 7.75. Cardiovascular disease I00-I51 64 7.7 20 4.6 84 6.6 Other causes1 280 33.7 157 36.1 437 34.5 All causes 830 100.0 435 100.0 1,265 100.0
Note: Order of leading causes based on total deaths in the specifi ed age group. 1Other causes includes undetermined and pending. Total percentage may not add up to 100 due to rounding. Non-residents are
excluded. The output from ICD-10 mortality coding and underlying cause of death selection was modifi ed in British Columbia to refl ect the intent of certifi ers in this jurisdiction and to provide greater continuity over time. Data using the standard ICD-10 rules for such categories as pneumonia/infl uenza, diabetes, or cancer should not be compared to the numbers shown above.
(concluded on next page )
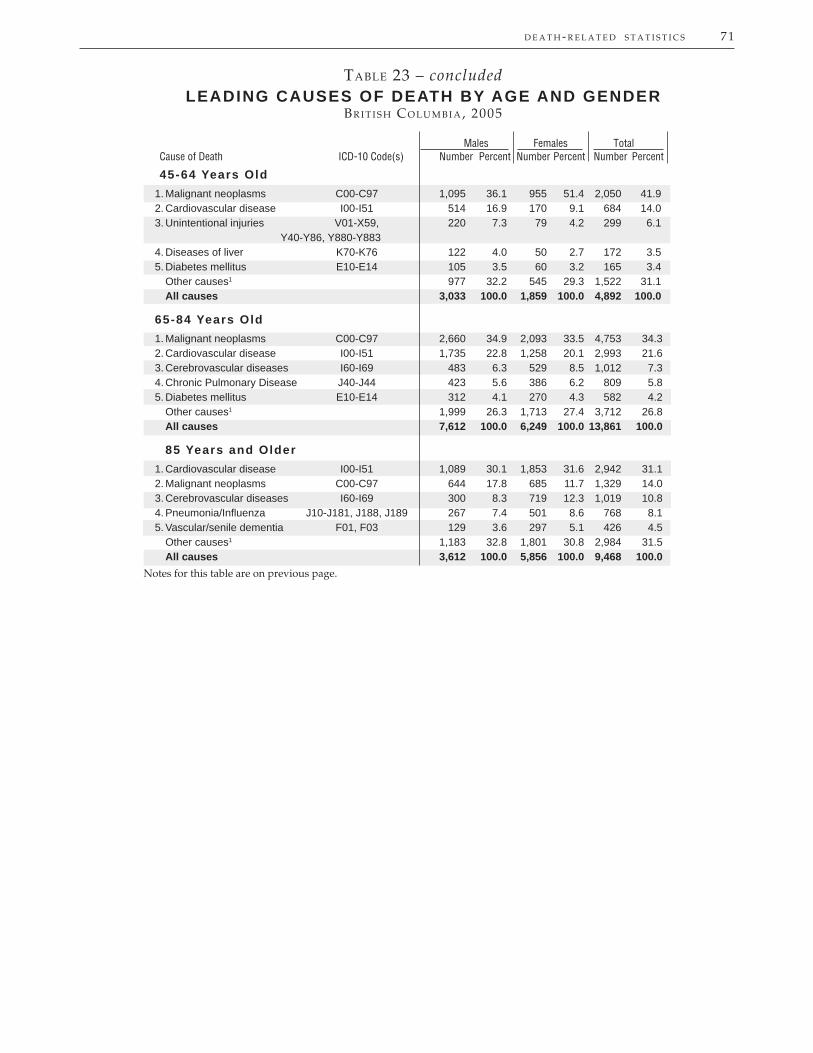
D E A T H - R E L A T E D S T A T I S T I C S 71
TABLE 23 – concludedLEADING CAUSES OF DEATH BY AGE AND GENDER
BR I T I S H CO L U M B I A, 2005
Males Females TotalCause of Death ICD-10 Code(s) Number Percent Number Percent Number Percent
45-64 Years Old 1. Malignant neoplasms C00-C97 1,095 36.1 955 51.4 2,050 41.92. Cardiovascular disease I00-I51 514 16.9 170 9.1 684 14.03. Unintentional injuries V01-X59, 220 7.3 79 4.2 299 6.1 Y40-Y86, Y880-Y8834. Diseases of liver K70-K76 122 4.0 50 2.7 172 3.55. Diabetes mellitus E10-E14 105 3.5 60 3.2 165 3.4 Other causes1 977 32.2 545 29.3 1,522 31.1 All causes 3,033 100.0 1,859 100.0 4,892 100.0
65-84 Years Old 1. Malignant neoplasms C00-C97 2,660 34.9 2,093 33.5 4,753 34.32. Cardiovascular disease I00-I51 1,735 22.8 1,258 20.1 2,993 21.63. Cerebrovascular diseases I60-I69 483 6.3 529 8.5 1,012 7.34. Chronic Pulmonary Disease J40-J44 423 5.6 386 6.2 809 5.85. Diabetes mellitus E10-E14 312 4.1 270 4.3 582 4.2 Other causes1 1,999 26.3 1,713 27.4 3,712 26.8 All causes 7,612 100.0 6,249 100.0 13,861 100.0
85 Years and Older 1. Cardiovascular disease I00-I51 1,089 30.1 1,853 31.6 2,942 31.12. Malignant neoplasms C00-C97 644 17.8 685 11.7 1,329 14.03. Cerebrovascular diseases I60-I69 300 8.3 719 12.3 1,019 10.84. Pneumonia/Infl uenza J10-J181, J188, J189 267 7.4 501 8.6 768 8.15. Vascular/senile dementia F01, F03 129 3.6 297 5.1 426 4.5 Other causes1 1,183 32.8 1,801 30.8 2,984 31.5 All causes 3,612 100.0 5,856 100.0 9,468 100.0
Notes for this table are on previous page.

72 D E A T H - R E L A T E D S T A T I S T I C S
Infant Mortality
Infant mortality (number of deaths less than 1 year old per 1,000 live births) is commonly used as an international indicator of a country’s general standard of living and health status. A society’s infant mortality rate is considered an important indicator of its health status because infant mortality is associated with socio-economic conditions, access to health care, and the health status of women of childbearing age. British Columbia had lower infant mortality rates than Canada as a whole from 1992 until 2003, the most recent year for Canadian infant mortality rates (see Table 4). There were 174 infant deaths in B.C. in 2005 or 4.28 deaths per 1,000 live births. The rate 20 years ago was around eight per 1,000 live births and that has been progressively reduced to about four per 1,000 in the last few years.
Table 24 shows the number of infants who died in 2005 by birth weight (in three bands) and the mother’s age group. The fi rst column has the mother’s age groups from less than 20 years up to 40 years or older, and the infants’ birth weights are grouped across the top of the table. Across the bottom and down the right side, the table shows row and column totals, percents, and rates per 1,000 live births. The difference in infant mortality rates across the three birth weight categories is quite distinct: for infants with birth weights of 2,500 grams or more about one in 650 dies in their fi rst year. Infants in the next birth weight category down suffer nearly a seven fold increase in death rate over heavier babies with one in 95 dying and infants less than 1,500 grams have over a 150 fold increase, with one in four dying within a year. Looking more positively, three out of four of the 373 infants born in 2005 weighing less than 1500 grams (75.9% see Tables 13 and 14) survived till their fi rst birthday.
When these infant deaths are broken out across mother’s age, the effect is not so dramatic. The one thing that is consistently seen in recent decades is that the infant mortality rate to mothers below the age of 20 years is about twice the rate to older women (see Figure 14). Fortunately, during the same period, the rates for all ages (including those under 20 years) have shown a downward trend.
Table 25 repeats the birth weight categories and general format shown in Table 24 but replaces maternal age groups with gestational periods. As mentioned in connection with Table 13, birth weight for gestational age is an important predictor of the health status of newborns and their subsequent well being. Table 25 confi rms that importance with regard to infant mortality. Of the 174 infant deaths in 2005 only 50 were term births (37 to 41 weeks) with weights of 2,500 grams or more. There was a dramatic increase in infant mortality as birth weight and gestational age decreased. Almost half (79 out of 174 or 45.4% ) the infant deaths were extremely premature (less than 28 weeks) and low birth weight (less than 2,500 grams), but these births accounted for only 0.5% of all 2005 live births. Almost two thirds of infant deaths were low birth weight (63.2%) or premature (65.5% less than 37 weeks) and three out of fi ve (59.8%) were both low birth weight and premature.
Table 26 shows infant mortality in each Local Health Area (LHA) for 2000-2004 and for the year 2005. The two columns on the left show the LHA number and name. The three columns for 2000-2004 show the number of infant deaths in the LHA (Observed Deaths), the ratio, and the rate of infant deaths per 1,000 live births. The ratio is the number of observed deaths divided by the number that would be expected if the LHA had the provincial rate per 1,000 live births. See Observed Deaths in the Glossary and Observed versus Expected Ratio in Methodology section for an example of the computation method. For 2005, the table indicates the number of deaths in three age ranges (0-6 days, 0-27 days, and 28-364 days), the total number of infant deaths (0-364 days), and the infant death rate per 1,000 live births. The most outstanding characteristic of this table is the small numbers in the observed deaths columns. This means a very small increase or decrease in infant deaths in a single year can result in quite large shifts in the rate per 1,000 live births.
As might be expected from the small numbers that the LHA ratio values are based on, Figure 36 does not show any obvious geographical pattern. Neither north-south, interior-coastal, or urban-rural distinctions are apparent.

D E A T H - R E L A T E D S T A T I S T I C S 73
TABLE 24INFANT MORTALITY BY AGE OF MOTHER
AND BIRTH WEIGHTBR I T I S H CO L U M B I A, 2005
Age of Birth Weight (in Grams) TotalMother <1500 1500–2499 2500+ N.S. Number Percent Rate
<20 4 2 6 - 12 6.9 9.00 20-24 13 3 19 1 36 20.7 5.85 25-29 25 5 17 - 47 27.0 4.21 30-34 29 5 9 - 43 24.7 3.24 35-39 15 3 5 2 25 14.4 3.51 40+ 4 2 3 - 9 5.2 5.57 N.S. - - - 2 2 1.1 TOTAL 90 20 59 5 174 100.0 4.28 Percent 51.7 11.5 33.9 2.9 100.0 Rate 243.24 10.53 1.54 4.28
Note: Infant Mortality – Age at death less than one year. Rate per 1,000 live births in the specifi ed age or birth weight group. +Denotes the number of cases is less than fi ve. Total percentage may not add up to 100 due to rounding. Non-residents are excluded. N.S. – Not stated.
TABLE 25INFANT MORTALITY BY GESTATIONAL AGE
AND BIRTH WEIGHTBR I T I S H CO L U M B I A, 2005
Gestational Age Birth Weight (in Grams) Total(In Weeks) <1500 1500–2499 2500+ N.S. Number Percent Rate
<20 5 - - - 5 2.9 833.33 20-27 73 1 - 1 75 43.1 414.36 28-36 12 13 8 1 34 19.5 11.61 37-41 - 5 50 1 56 32.2 1.51 42+ - 1 1 - 2 1.1 + N.S. - - - 2 2 1.1 TOTAL 90 20 59 5 174 100.0 4.28 Percent 51.7 11.5 33.9 2.9 100.0 Rate 243.24 10.53 1.54 4.28
Note: Infant Mortality – Age at death less than one year. Rate per 1,000 live births in the specifi ed age or birth weight group. + Denotes the number of cases is less than fi ve. Total percentage may not add up to 100 due to rounding. Non-residents are excluded. N.S. – Not stated.
Causes of infant deaths and stillbirths are shown in Table 27. The numbers are small, so the rates are per 10,000 live births for infant deaths and per 10,000 total births (live births plus stillbirths) in the case of stillbirths. Infant deaths are often sub-divided into early neonatal (less than 7 days), late neonatal (7-27 days), and post-neonatal (28-364 days) deaths but note that, in this table, the time periods are different from those in Table 26. Three out of fi ve infant deaths (104 or 59.8%) in 2005 occurred in the early neonatal period and 91.3% of them (95) were due to congenital anomalies or perinatal conditions. Bear in mind that Table 23 indicated that perinatal conditions claimed about an equal number of male and female infants but congenital anomalies claimed twice the number of female infants.

INF
AN
T M
OR
TA
LIT
Y B
Y L
OC
AL
HE
AL
TH
AR
EA
, B
RIT
ISH
CO
LU
MB
IA,
2000
–200
4 A
ND
200
5T
able
26
2000–2004 2005 Observed Age at Death (in Days) TotalLocal Health Area Deaths Ratio (p) Rate 0–6 0–27 28–364 Number Rate
001 Fernie - - - 1 1 - 1 8.33 002 Cranbrook 4 0.87 3.59 - - - - - 003 Kimberley 1 0.88 3.61 - - - - - 004 Windermere 2 1.50 6.19 - - 1 1 13.51 005 Creston - - - - - - - - 006 Kootenay Lake 1 1.35 5.56 - - - - - 007 Nelson 6 1.33 5.47 - - - - - 009 Castlegar - - - 1 1 - 1 11.11 010 Arrow Lakes 1 1.28 5.26 - - - - - 011 Trail 5 1.76 7.23 - 1 - 1 6.37 012 Grand Forks 3 2.24 9.20 1 1 1 2 33.90 013 Kettle Valley - - - - - - - - 014 Southern Okanagan - - - - - - - - 015 Penticton 5 0.84 3.47 3 4 - 4 13.33 016 Keremeos 2 2.45 10.10 - - - - - 017 Princeton - - - - - - - - 018 Golden 1 0.77 3.16 1 1 - 1 12.82 019 Revelstoke 1 0.63 2.58 1 1 2 3 41.10 020 Salmon Arm 7 1.57 6.45 2 3 1 4 15.38 021 Armstrong - Spallumcheen - - - - - - - - 022 Vernon 10 0.94 3.88 2 2 - 2 3.75 023 Central Okanagan 25 0.91 3.74 4 5 1 6 4.28 024 Kamloops 21 1.15 4.74 1 1 1 2 2.29 025 100 Mile House 3 1.37 5.63 - - - - - 026 North Thompson 2 2.11 8.70 - - - - - 027 Cariboo - Chilcotin 12 1.93 7.95 1 2 - 2 7.46 028 Quesnel 7 1.50 6.16 - - - - - 029 Lillooet 1 0.86 3.52 - - - - - 030 South Cariboo 1 0.89 3.68 1 1 1 2 27.40 031 Merritt 1 0.46 1.89 - - - - - 032 Hope 2 1.29 5.32 - - 1 1 13.33 033 Chilliwack 18 1.06 4.35 4 4 - 4 4.43 034 Abbotsford 29 0.88 3.63 4 5 - 5 3.12 035 Langley 23 0.92 3.78 2 2 1 3 2.50 037 Delta 16 0.79 3.25 2 2 1 3 3.32 038 Richmond 29 0.90 3.72 1 1 2 3 1.91 040 New Westminster 7 0.53 2.17 1 1 - 1 1.61 041 Burnaby 35 0.82 3.39 2 2 - 2 0.96 042 Maple Ridge 12 0.66 2.73 2 3 1 4 4.77 043 Coquitlam 37 0.86 3.53 7 8 3 11 5.53 044 North Vancouver 17 0.64 2.63 2 3 1 4 3.40 045 West Vancouver-Bowen Is. 3 0.48 1.99 2 2 - 2 6.69 046 Sunshine Coast 2 0.54 2.20 - - - - - 047 Powell River 4 1.29 5.33 1 1 - 1 7.35 048 Howe Sound 8 0.99 4.08 2 2 1 3 7.87 049 Bella Coola Valley 4 4.08 + 16.81 - - - - - 050 Queen Charlotte 2 1.46 6.02 - - - - - 051 Snow Country - - - - - - - - 052 Prince Rupert 5 1.18 4.84 - - - - - 053 Upper Skeena 1 0.65 2.70 - - 1 1 13.51 054 Smithers 7 1.48 6.10 3 3 - 3 12.93 055 Burns Lake 3 1.61 6.62 - - - - - 056 Nechako 5 1.07 4.40 1 1 1 2 8.70 057 Prince George 21 0.97 4.00 5 5 2 7 6.52 059 Peace River South 11 1.91 7.87 - - - - - 060 Peace River North 5 0.49 2.03 1 1 - 1 1.88 061 Greater Victoria 40 1.13 4.64 4 4 3 7 3.98 062 Sooke 11 0.94 3.88 3 3 - 3 4.59 063 Saanich 12 1.46 6.01 1 1 1 2 4.84 064 Gulf Islands 5 2.75 11.34 - - - - - 065 Cowichan 11 1.10 4.55 1 2 1 3 6.49 066 Lake Cowichan 1 1.12 4.63 - - - - - 067 Ladysmith 6 2.16 8.88 - 1 - 1 6.02 068 Nanaimo 20 1.22 5.03 2 3 3 6 7.35 069 Qualicum 4 0.86 3.55 - - - - - 070 Alberni 10 1.67 6.86 2 2 - 2 5.95 071 Courtenay 11 1.17 4.80 - - 1 1 2.14 072 Campbell River 8 1.07 4.42 1 2 1 3 9.15 075 Mission 5 0.58 2.40 2 2 2 4 8.99 076 Agassiz - Harrison 1 0.56 2.31 - - - - - 077 Summerland 2 1.37 5.62 - - - - - 078 Enderby 3 2.51 10.31 - - - - - 080 Kitimat 3 1.38 5.68 - - - - - 081 Fort Nelson 1 0.52 2.12 - - - - - 083 Central Coast 5 10.85 * 44.64 - - - - - 084 Vancouver Island West 1 1.44 5.92 - - - - - 085 Vancouver Island North 12 3.55 * 14.60 - - - - - 087 Stikine - - - - - - - - 088 Terrace 6 1.10 4.51 - - 2 2 8.26 092 Nisga’a 3 4.86 20.00 - - - - - 094 Telegraph Creek 1 5.40 22.22 - - - - - 161 Vancouver - City Centre 10 0.63 2.59 1 1 1 2 2.31 162 Vancouver - Downtown E.side 13 1.38 5.69 - - 1 1 2.02 163 Vancouver - North East 30 1.31 5.39 3 3 1 4 3.53 164 Vancouver - Westside 26 1.19 4.88 1 2 2 4 3.58 165 Vancouver - Midtown 12 0.57 2.36 2 3 2 5 5.05 166 Vancouver - South 16 0.62 2.55 4 6 - 6 4.63 201 Surrey 104 1.16 4.76 15 18 6 24 5.31 202 South Surrey/White Rock 8 0.79 3.25 1 1 - 1 1.83 PROVINCIAL TOTAL 829 1.00 4.12 104 124 50 174 4.28
Notes for this table follow the map.
74

D E A T H - R E L A T E D S T A T I S T I C S 75
Note: Ratio - Observed over the expected. Refer to Figure 1 to clarify geographical location of Local Health Areas.
N
Statistically Significant
QUINTILE (Ratio)
5 ( > 1.50)
2 (0.62 - 0.90)
1 ( < 0.62)
4 ( 1.17 - 1.50)
3 ( 0.90 - 1.17)
Inset 1
see inset 2
Inset 2
see inset 1
50 kms0
10 kms0
300 kms0 100 200
FIGURE 36INFANT MORTALITY BY LOCAL HEALTH AREA
B R I T I S H C O L U M B I A, 2000-2004
Notes to Table 26Note: *Statistical testing indicates thatobserved deaths are signfi cantly different from the expected deaths (p<0.05, two tailed). +Denotes signifi cance based on less than fi ve deaths. Rate per 1,000 live births in thespecifi ed Local Health Area. Ratio – observed over the expected deaths. Total includesresidents with unknown LHA.

76 D E A T H - R E L A T E D S T A T I S T I C S
Note: 1Rate per 10,000 live births. 2Rate per 10,000 total births (live births plus stillbirths).
3 Some of the infant deaths that were still under investigation (ICD-10 code R99) may later be identifi ed as SIDS. Non-residents are excluded.
Congenital anomal ies - of the nervous system Q00-Q07 1 1 1 3 0.74 2 0.49 - of the eye, ear, face & neck Q10-Q18 1 - - 1 0.25 - - - of the heart and circulatory system Q20-Q28 6 3 4 13 3.20 1 0.24 - of the respiratory system Q30-Q34 - 1 1 2 0.49 - - - of the digestive system Q35-Q45 1 - - 1 0.25 1 0.24 - of the genital organs Q50-Q56 - - - - - - - - of the urinary system Q60-Q64 2 - - 2 0.49 2 0.49 - of the musculoskeletal system Q65-Q79 - - 1 1 0.25 - - Other and multiple system syndromes Q80-Q89 2 1 1 4 0.98 7 1.71 Chromosomal anomalies Q90-Q99 7 2 1 10 2.46 7 1.71 Total deaths due to congenital anomalies Q00-Q99 20 8 9 37 9.10 20 4.88Perinatal condit ions Infant affected by maternal factors P00-P04 28 - - 28 6.89 119 29.05 Premature/postmature and fetal growth disorders P05-P08 24 4 1 29 7.13 6 1.46 Birth trauma P10-P15 1 - - 1 0.25 - - Respiratory and cardiovascular disorders P20-P29 3 - 3 6 1.48 5 1.22 Infections specifi c to the perinatal period P35-P39 2 2 1 5 1.23 - - Hemorrhage and hematological disorders P50-P61 3 1 - 4 0.98 5 1.22 Transitory endocrine and metabolic disorders P70-P74 - - - - - 2 0.49 Digestive system disorders of fetus and newborn P75-P78 - 1 1 2 0.49 - - Other disorders originating in the perinatal period P80-P94, P96 14 1 - 15 3.69 113 27.58 Fetal death of unknown cause P95 - - - - - 43 10.50 Total deaths due to perinatal conditions P00-P96 75 9 6 90 22.14 293 71.52Pneumonia/infl uenza J10-J18.1, J18.8-J18.9 - - 1 1 0.25 - -Sudden infant death syndrome (SIDS)3 R95 - - 10 10 2.46 - -Other causes3 9 3 24 36 8.86 - -TOTAL 104 20 50 174 42.80 313 76.40
Infant Deaths – Age Group (in Days) Stillbirths
Cause of Death ICD-10 Code(s) <7 7–27 28–364 Total Rate 1 Number Rate 2
TABLE 27SELECTED CAUSES OF INFANT DEATHS AND STILLBIRTHS
BR I T I S H CO L U M B I A, 2005
Deaths Due to HIV
Compared to other infectious diseases Human Immunodefi ciency Virus (HIV) mortality reached unprecedented rates in recent decades. Continued monitoring of HIV mortality is an important measure of the effectiveness of our public health initiatives. Mortality peaked in 1994 but there has been a fl uctuating decline since then.
Table 28 shows the number of deaths due to HIV broken out by gender and six age groups for each of the 16 years from 1989-2005. For each year the table shows the number of male, female, and total deaths due to HIV where the decedents were less than 20 years of age, in their 20s, 30s, 40s, 50s, and 60 or over. The percentage of the total deaths in each year is shown for each age group. At the bottom of the table are counts and percentages for the entire sixteen year period. The Total column on the right shows the number of females dying from HIV disease increased rapidly from low single digit levels in the early 1990s to 19 or more in recent years. The number of male deaths also rose rapidly from 1991 to 1994, then fell steeply until 1997, and since then it has fl uctuated between 84 and 104 deaths per year until 2005 when there were 120 male deaths from HIV. Close inspection of the age group percentages in each year indicated that the age at death from HIV has risen over this 16 year span.

D E A T H - R E L A T E D S T A T I S T I C S 77
Figure 37 shows clearly that in the period from 2000-2005 most deaths due to HIV disease in B.C. occurred in individuals who were in their 30s, 40s, and 50s, with the greatest toll being taken in those between 40 and 49 years.
Although there were fl uctuations in the yearly numbers of HIV deaths in Table 29, there was a clear increasing trend until 1994 after which the numbers have generally decreased each year. The high point was also apparent in each of the Health Service Delivery Areas (HSDA) where frequencies permitted trend comparisons. The Vancouver HSDA had the largest population so the highest number would be expected in that area, but the rate per 100,000 population (19.3) was also highest in Vancouver. In 2005 there were 78 deaths due to HIV disease in that area, far higher than any other HSDA. Bear in mind that death statistics are based on the usual residence of the deceased, and people who die from HIV disease are usually diagnosed with the condition long before their death, so high numbers in Vancouver might simply refl ect availability of services for people with HIV disease.
FIGURE 37DEATHS DUE TO HIV DISEASE BY AGE GROUP
BR I T I S H CO L U M B I A, 2000–2005
0
10
20
30
40
50
60
20-29 30-39 40-49 50-59 60+Age Group (in Years)
Number of Deaths
200020012002200320042005

78 D E A T H - R E L A T E D S T A T I S T I C S
TABLE 28DEATHS DUE TO HIV DISEASE BY
GENDER AND AGE GROUPBR I T I S H CO L U M B I A, 1990–2005
Year of Age at Death (in Years) Death Gender <20 20–29 30–39 40–49 50–59 60+ Total
Note: HIV Disease – ICD-10 codes B20–B24.Total percentage may not add up to 100 due to rounding. Non-residents are excluded.
1990 M - 17 71 73 18 6 185 F - 1 - 1 1 - 3 T - 18 71 74 19 6 188 Percent - 9.6 37.8 39.4 10.1 3.2 100.0 1991 M - 14 79 54 23 6 176 F - - 1 - - 1 2 T - 14 80 54 23 7 178 Percent - 7.9 44.9 30.3 12.9 3.9 100.0 1992 M - 28 101 89 22 5 245 F - 1 3 2 - - 6 T - 29 104 91 22 5 251 Percent - 11.6 41.4 36.3 8.8 2.0 100.0 1993 M - 28 114 95 34 15 286 F - 3 8 2 1 1 15 T - 31 122 97 35 16 301 Percent - 10.3 40.5 32.2 11.6 5.3 100.0 1994 M - 19 147 101 29 12 308 F 2 5 10 2 2 2 23 T 2 24 157 103 31 14 331 Percent 0.6 7.3 47.4 31.1 9.4 4.2 100.0 1995 M - 17 116 103 31 9 276 F - 6 7 4 1 1 19 T - 23 123 107 32 10 295 Percent - 7.8 41.7 36.3 10.8 3.4 100.0 1996 M 3 9 106 73 34 10 235 F - 4 6 6 - 1 17 T 3 13 112 79 34 11 252 Percent 1.2 5.2 44.4 31.3 13.5 4.4 100.0 1997 M - 11 40 33 11 6 101 F - 2 7 4 1 2 16 T - 13 47 37 12 8 117 Percent - 11.1 40.2 31.6 10.3 6.8 100.0 1998 M - 6 32 44 7 4 93 F - 4 8 3 1 1 17 T - 10 40 47 8 5 110 Percent - 9.1 36.4 42.7 7.3 4.5 100.0 1999 M 1 3 37 32 13 4 90 F - - 4 7 2 - 13 T 1 3 41 39 15 4 103 Percent 1.0 2.9 39.8 37.9 14.6 3.9 100.0 2000 M - 5 31 31 23 8 98 F - 4 6 9 3 2 24 T - 9 37 40 26 10 122 Percent - 7.4 30.3 32.8 21.3 8.2 100.0 2001 M - - 30 33 19 9 91 F - 4 8 4 3 1 20 T - 4 38 37 22 10 111 Percent - 3.6 34.2 33.3 19.8 9.0 100.0 2002 M - 4 20 37 15 8 84 F - 1 6 12 3 - 22 T - 5 26 49 18 8 106 Percent - 4.7 24.5 46.2 17.0 7.5 100.0 2003 M - 2 34 26 32 10 104 F - 4 6 10 3 - 23 T - 6 40 36 35 10 127 Percent - 4.7 31.5 28.3 27.6 7.9 100.0 2004 M - - 17 30 29 10 86 F - 1 7 8 1 2 19 T - 1 24 38 30 12 105 Percent - 1.0 22.9 36.2 28.6 11.4 100.0 2005 M - 1 27 43 31 18 120 F - - 8 12 5 - 25 T - 1 35 55 36 18 145 Percent - 0.7 24.1 37.9 24.8 12.4 100.01990 - 2005 M 4 164 1,002 897 371 140 2,578 F 2 40 95 86 27 14 264 T 6 204 1,097 983 398 154 2,842 Percent 0.2 7.2 38.6 34.6 14.0 5.4 100.0

D E A T H - R E L A T E D S T A T I S T I C S 79
TABLE 29DEATHS DUE TO HIV DISEASE BY HEALTH SERVICE DELIVERY AREA
BR I T I S H CO L U M B I A, 1990–2005
Health Service 1990–2005Delivery Area 1990 1991 1992 1993 1994 1995 1996 1997 1998 1999 2000 2001 2002 2003 2004 2005 Number Percent Rate
11 East Kootenay - 1 - - - 1 - 2 - - - 1 - 1 - 1 7 0.2 0.5612 Kootenay Boundary 2 - - 1 1 3 2 - 1 1 - - 2 - 1 - 14 0.5 1.1113 Okanagan 1 1 9 9 6 9 7 2 4 2 3 3 3 6 2 5 72 2.5 1.5314 Thompson Cariboo 3 3 3 4 3 - 3 2 2 2 2 6 2 4 6 2 47 1.7 1.41 Shuswap21 Fraser East 2 1 4 6 7 6 7 1 5 3 3 2 4 1 5 6 63 2.2 1.7122 Fraser North 16 14 15 22 25 21 15 8 6 7 11 8 10 10 8 7 203 7.1 2.5623 Fraser South 6 10 14 12 18 17 23 6 4 11 7 11 10 8 5 12 174 6.1 1.9831 Richmond 6 6 5 1 6 4 4 5 2 2 1 1 - 1 2 3 49 1.7 1.9632 Vancouver 124 109 149 197 203 182 145 66 65 53 73 60 62 74 50 78 1,690 59.5 19.3033 North Shore/ 11 9 14 16 15 12 11 7 5 5 3 3 2 6 3 7 129 4.5 3.17 Coast Garibaldi41 South Vancouver 12 16 20 21 28 17 21 10 10 13 7 9 3 8 9 9 213 7.5 4.02 Island42 Central Vancouver 1 4 16 6 13 14 6 4 3 4 8 4 4 4 5 6 102 3.6 2.78 Island43 North Vancouver 2 1 1 3 3 2 1 1 - - 4 2 - 1 2 3 26 0.9 1.45 Island51 Northwest 1 - 1 1 - 2 1 - - - - - - - 1 2 9 0.3 0.6552 Northern Interior 1 1 - 2 2 4 5 2 2 - - 1 3 3 5 4 35 1.2 1.4653 Northeast - 2 - - 1 1 - - 1 - - - 1 - 1 - 7 0.2 0.69 N.S. - - - - - - 1 1 - - - - - - - - 2 0.1 PROVINCIAL 188 178 251 301 331 295 252 117 110 103 122 111 106 127 105 145 2,842 100.0 4.60 TOTAL
Note: Health Service Delivery Area based on usual residence. Rate per 100,000 population in specifi ed area. Total percentage may not add up to 100 due to rounding. Non-residents are excluded. N.S. – Not stated.
External Causes of Death
As the name implies, these causes of death arise from sources external to the individual (as opposed to endogenous or natural physiological processes), and include events such as motor vehicle accidents, poisonings, falls, suicide, and fi re. With the exception of unintentional falls, where most of the deaths are elderly females, males are far more susceptible to these causes than females and gender differences are most apparent in the younger age groups.
All causes of death are coded according to the World Health Organization’s International Classifi cation of Diseases and Related Health Problems, Tenth Revision (ICD-10); the codes for external causes begin with V, W, X, or Y. Note that unintentional deaths are called accidents in ICD-10. See Appendix 2 for a gender- and age-specifi c listing of these deaths according to individual ICD-10 codes.
Counts of deaths due to unintentional injuries, suicide, and homicide in the current year underestimate the actual fi gures due to known delays in determining causes of death. See the Information Box Updated External Causes of Death for more details.
Table 30 shows the number of deaths for males and females from external causes. Also shown are ASMRs (Age Standardized Mortality Rates). These rates of death per 10,000 standard population are used to compare statistics from other time periods and other jurisdictions. The Glossary explains Age Standardized Mortality Rates and the Methodology section gives an example of the calculation method.
Although not age standardized, during 2005 there were 55 deaths due to external causes for each 1,000 deaths in B.C. (see Table 30). Approximately;

80 D E A T H - R E L A T E D S T A T I S T I C S
• 13 were suicides (403) • 1 was a victim of homicide (31)
• 12 were motor vehicle accidents (369) • 1 was an unintentional drowning (29)
• 11 were unintentional falls (339) • 1 was from exposure to smoke, fi re, and fl ames (22)
• 8 were unintentional poisonings (243) • 7 were due to other external causes (218)
More than two thirds of deaths by external causes were males as shown in Table 30. The leading four causes of external deaths in males were (in rank order): suicide, motor vehicle accidents, poisoning, and falls. For females the leading four were falls, motor vehicle accidents, suicide, and poisoning – the same four but in different order.
Table 31 shows the allocation of external death causes according to the Local Health Area where the deceased lived, not where the incident occurred. Each of the major external causes are listed across the top of the table along with the total number and the Age Standardized Mortality Rate (ASMR) for each LHA. The provincial totals and the percent of all external cause deaths are shown along the bottom of the table. Deaths due motor vehicle accidents, falls, and suicides were the major external causes of death, with suicides leading the list for the province as a whole. However, the LHAs varied as to which of these cases was the most important in 2005.
External causes occur mostly in younger age groups (see Appendix 2) so the ASMR column in Table 31 is particularly useful because it accounts for the different age distributions in the LHAs by adjusting the mortality rates to a standard age distribution. See Age Standardized Mortality Rate in the Glossary and the calculation method in the Methodology section
Table 32 shows numbers of deaths from suicide classifi ed by month of occurrence and by gender. Percentages across months are also given. The data for 2005 supports the hypothesis that November and December are the low suicide months.
In 2005 males died from suicide at a rate of three to one compared to females (see Table 32). The incidence numbers, especially for females, are quite small and therefore any conclusions based on them should be approached with caution.
TABLE 30EXTERNAL CAUSES OF DEATH BY GENDER
BR I T I S H CO L U M B I A, 2005
Male Female TotalCause of Death ICD-10 Code Number ASMR Number ASMR Number ASMRMotor vehicle accidents V02-V04, V09, V12-V14, V190-V196, 244 1.14 125 0.53 369 0.84 V20-V79, V803-V805, V820-V821, V823-V890, V892, V899, Y850Other transport accidents V01, V05-V06, V10-V11, V15-V18, 22 0.11 3 0.01 25 0.06V198-V199, V800-V802, V806-V809, V812-V819, V822-V829, V891, V893, V91, V93-V99, Y859Accidental falls W00-W19 173 0.72 166 0.43 339 0.56Accident caused by machinery W24, W28-W31 10 0.04 - - 10 0.02Accidental fi rearm discharge W32-W34 1 0.01 - - 1 0.00Exposure to smoke, X00-X09 15 0.06 7 0.03 22 0.04fi re and fl amesAccidental drowning V90, V92, W65-W74 23 0.10 6 0.03 29 0.06(including water transport)Accidental poisoning X40-X49 177 0.81 66 0.29 243 0.55All other accidents W20-W23, W25-W27, W35-W64, 97 0.41 51 0.15 148 0.28 W75-W99, X10-X39, X50-X59, Y35-Y36, Y40-Y84, Y88Suicide X60-X84, Y870 302 1.31 101 0.44 403 0.87Homicide X85-Y09, Y871 21 0.10 10 0.04 31 0.07External events of Y10-Y34, Y872 5 0.02 8 0.03 13 0.03undetermined intentSequelae of other Y86, Y89 15 0.06 6 0.02 21 0.04external causesTOTAL 1,105 4.89 549 2.01 1,654 3.42Note: ASMR – Age Standardized Mortality Rate per 10,000 standard population (Canada 1991 Census). Non-residents are excluded.
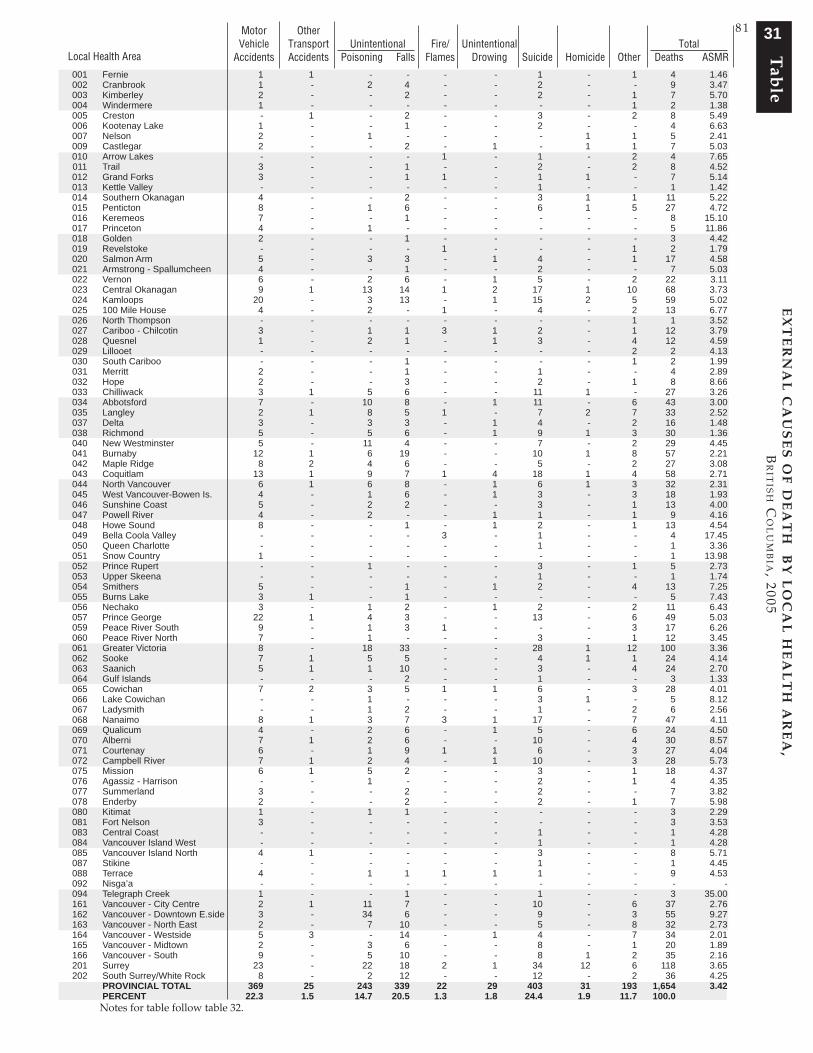
D E A T H - R E L A T E D S T A T I S T I C S 81
Local Health Area
Motor Other Vehicle Transport Unintentional Fire/ Unintentional Total
Accidents Accidents Poisoning Falls Flames Drowing Suicide Homicide Other Deaths ASMR
001 Fernie 1 1 - - - - 1 - 1 4 1.46 002 Cranbrook 1 - 2 4 - - 2 - - 9 3.47 003 Kimberley 2 - - 2 - - 2 - 1 7 5.70 004 Windermere 1 - - - - - - - 1 2 1.38 005 Creston - 1 - 2 - - 3 - 2 8 5.49 006 Kootenay Lake 1 - - 1 - - 2 - - 4 6.63 007 Nelson 2 - 1 - - - - 1 1 5 2.41 009 Castlegar 2 - - 2 - 1 - 1 1 7 5.03 010 Arrow Lakes - - - - 1 - 1 - 2 4 7.65 011 Trail 3 - - 1 - - 2 - 2 8 4.52 012 Grand Forks 3 - - 1 1 - 1 1 - 7 5.14 013 Kettle Valley - - - - - - 1 - - 1 1.42 014 Southern Okanagan 4 - - 2 - - 3 1 1 11 5.22 015 Penticton 8 - 1 6 - - 6 1 5 27 4.72 016 Keremeos 7 - - 1 - - - - - 8 15.10 017 Princeton 4 - 1 - - - - - - 5 11.86 018 Golden 2 - - 1 - - - - - 3 4.42 019 Revelstoke - - - - 1 - - - 1 2 1.79 020 Salmon Arm 5 - 3 3 - 1 4 - 1 17 4.58 021 Armstrong - Spallumcheen 4 - - 1 - - 2 - - 7 5.03 022 Vernon 6 - 2 6 - 1 5 - 2 22 3.11 023 Central Okanagan 9 1 13 14 1 2 17 1 10 68 3.73 024 Kamloops 20 - 3 13 - 1 15 2 5 59 5.02 025 100 Mile House 4 - 2 - 1 - 4 - 2 13 6.77 026 North Thompson - - - - - - - - 1 1 3.52 027 Cariboo - Chilcotin 3 - 1 1 3 1 2 - 1 12 3.79 028 Quesnel 1 - 2 1 - 1 3 - 4 12 4.59 029 Lillooet - - - - - - - - 2 2 4.13 030 South Cariboo - - - 1 - - - - 1 2 1.99 031 Merritt 2 - - 1 - - 1 - - 4 2.89 032 Hope 2 - - 3 - - 2 - 1 8 8.66 033 Chilliwack 3 1 5 6 - - 11 1 - 27 3.26 034 Abbotsford 7 - 10 8 - 1 11 - 6 43 3.00 035 Langley 2 1 8 5 1 - 7 2 7 33 2.52 037 Delta 3 - 3 3 - 1 4 - 2 16 1.48 038 Richmond 5 - 5 6 - 1 9 1 3 30 1.36 040 New Westminster 5 - 11 4 - - 7 - 2 29 4.45 041 Burnaby 12 1 6 19 - - 10 1 8 57 2.21 042 Maple Ridge 8 2 4 6 - - 5 - 2 27 3.08 043 Coquitlam 13 1 9 7 1 4 18 1 4 58 2.71 044 North Vancouver 6 1 6 8 - 1 6 1 3 32 2.31 045 West Vancouver-Bowen Is. 4 - 1 6 - 1 3 - 3 18 1.93 046 Sunshine Coast 5 - 2 2 - - 3 - 1 13 4.00 047 Powell River 4 - 2 - - 1 1 - 1 9 4.16 048 Howe Sound 8 - - 1 - 1 2 - 1 13 4.54 049 Bella Coola Valley - - - - 3 - 1 - - 4 17.45 050 Queen Charlotte - - - - - - 1 - - 1 3.36 051 Snow Country 1 - - - - - - - - 1 13.98 052 Prince Rupert - - 1 - - - 3 - 1 5 2.73 053 Upper Skeena - - - - - - 1 - - 1 1.74 054 Smithers 5 - - 1 - 1 2 - 4 13 7.25 055 Burns Lake 3 1 - 1 - - - - - 5 7.43 056 Nechako 3 - 1 2 - 1 2 - 2 11 6.43 057 Prince George 22 1 4 3 - - 13 - 6 49 5.03 059 Peace River South 9 - 1 3 1 - - - 3 17 6.26 060 Peace River North 7 - 1 - - - 3 - 1 12 3.45 061 Greater Victoria 8 - 18 33 - - 28 1 12 100 3.36 062 Sooke 7 1 5 5 - - 4 1 1 24 4.14 063 Saanich 5 1 1 10 - - 3 - 4 24 2.70 064 Gulf Islands - - - 2 - - 1 - - 3 1.33 065 Cowichan 7 2 3 5 1 1 6 - 3 28 4.01 066 Lake Cowichan - - 1 - - - 3 1 - 5 8.12 067 Ladysmith - - 1 2 - - 1 - 2 6 2.56 068 Nanaimo 8 1 3 7 3 1 17 - 7 47 4.11 069 Qualicum 4 - 2 6 - 1 5 - 6 24 4.50 070 Alberni 7 1 2 6 - - 10 - 4 30 8.57 071 Courtenay 6 - 1 9 1 1 6 - 3 27 4.04 072 Campbell River 7 1 2 4 - 1 10 - 3 28 5.73 075 Mission 6 1 5 2 - - 3 - 1 18 4.37 076 Agassiz - Harrison - - 1 - - - 2 - 1 4 4.35 077 Summerland 3 - - 2 - - 2 - - 7 3.82 078 Enderby 2 - - 2 - - 2 - 1 7 5.98 080 Kitimat 1 - 1 1 - - - - - 3 2.29 081 Fort Nelson 3 - - - - - - - - 3 3.53 083 Central Coast - - - - - - 1 - - 1 4.28 084 Vancouver Island West - - - - - - 1 - - 1 4.28 085 Vancouver Island North 4 1 - - - - 3 - - 8 5.71 087 Stikine - - - - - - 1 - - 1 4.45 088 Terrace 4 - 1 1 1 1 1 - - 9 4.53 092 Nisga’a - - - - - - - - - - - 094 Telegraph Creek 1 - - 1 - - 1 - - 3 35.00 161 Vancouver - City Centre 2 1 11 7 - - 10 - 6 37 2.76 162 Vancouver - Downtown E.side 3 - 34 6 - - 9 - 3 55 9.27 163 Vancouver - North East 2 - 7 10 - - 5 - 8 32 2.73 164 Vancouver - Westside 5 3 - 14 - 1 4 - 7 34 2.01 165 Vancouver - Midtown 2 - 3 6 - - 8 - 1 20 1.89 166 Vancouver - South 9 - 5 10 - - 8 1 2 35 2.16 201 Surrey 23 - 22 18 2 1 34 12 6 118 3.65 202 South Surrey/White Rock 8 - 2 12 - - 12 - 2 36 4.25 PROVINCIAL TOTAL 369 25 243 339 22 29 403 31 193 1,654 3.42 PERCENT 22.3 1.5 14.7 20.5 1.3 1.8 24.4 1.9 11.7 100.0
EX
TE
RN
AL
CA
US
ES
OF
DE
AT
H B
Y L
OC
AL
HE
AL
TH
AR
EA
, B
RIT
ISH
CO
LU
MB
IA, 2005
Tab
le31
Notes for table follow table 32.
81

82 D E A T H - R E L A T E D S T A T I S T I C S
Vital Statistics Information Box
UPDATED EXTERNAL CAUSES OF DEATH
(continued on next page)
Vital Statistics Annual Reports for specifi c years are based on data from the spring of the following calendar year. Current year counts and rates for deaths due to external causes underestimate the actual fi gures due to known delays in determining causes of death. Analysis of external causes of death will be incomplete unless the analysis is based on updated data for previous years. The graphs that follow show numbers of deaths and Age Standardized Mortality Rates (ASMRs) for 1994-2004 as of March 2006.
DEATHS DUE TO ALL EXTERNAL CAUSES BR I T I S H CO L U M B I A, 1994-2004
ASMRS FOR EXTERNAL CAUSES OF DEATH BR I T I S H CO L U M B I A, 1994-2004
2,158 2,1152,226
2,282 2,233
2,043
1,879 1,855
1,9981,898 1,853
1,6041,6211,588
1,4221,493
1,780
2,0162,049
1,8931,7791,817
0
600
1,200
1,800
2,400
1994 1995 1996 1997 1998 1999 2000 2001 2002 2003 2004
Number of Deaths
Number Shown in Annual Report Number as of March, 2006
5.485.19 5.27 5.27
5.05
4.53
4.124.27
4.464.18
3.964.24
3.97 4.044.27
4.74
4.11
3.403.19
3.46 3.563.40
0.0
1.0
2.0
3.0
4.0
5.0
6.0
1994 1995 1996 1997 1998 1999 2000 2001 2002 2003 2004
Rate
ASMR Shown in Annual Report ASMR as of March, 2006

D E A T H - R E L A T E D S T A T I S T I C S 83
Vital Statistics Information Box
(concluded on next page)
(continued from previous page)
DEATHS DUE TO MOTOR VEHICLE ACCIDENTS BR I T I S H CO L U M B I A, 1994-2004
DEATHS DUE TO UNINTENTIONAL FALLS BR I T I S H CO L U M B I A, 1994-2004
DEATHS DUE TO DROWNING BR I T I S H CO L U M B I A, 1994-2004
370
495468
442423 428
390 397379
453 444428440
404 396 388 398
353 342
307
399376
0
100
200
300
400
500
600
1994 1995 1996 1997 1998 1999 2000 2001 2002 2003 2004
Number of Deaths
Number Shown in Annual Report Number as of March, 2006
321316336
385 380 379 389
310 319337 348
329309296
274
367358364367
306290
321
0
100
200
300
400
500
600
1994 1995 1996 1997 1998 1999 2000 2001 2002 2003 2004
Number of Deaths
Number Shown in Annual Report Number as of March, 2006
40 43 44 47
33 3641
3441
5651
86
6571 71
5551
5967 64
68
56
0
50
100
150
1994 1995 1996 1997 1998 1999 2000 2001 2002 2003 2004
Number of Deaths
Number Shown in Annual Report Number as of March, 2006

84 D E A T H - R E L A T E D S T A T I S T I C S
Vital Statistics Information BoxVital Statistics Information Box(continued from previous page)
DEATHS DUE TO POISONING BR I T I S H CO L U M B I A, 1994-2004
DEATHS DUE TO SUICIDE BR I T I S H CO L U M B I A, 1994-2004
DEATHS DUE TO ASSUALT (HOMICIDE) BR I T I S H CO L U M B I A, 1994-2004
436
492520
542558
499485
462 457
508
459
497
424396
315344
421419
480460
423416
0
100
200
300
400
500
600
1994 1995 1996 1997 1998 1999 2000 2001 2002 2003 2004
Number of Deaths
Number Shown in Annual Report Number as of March, 2006
73 7277
81
55
4639
3037
23
40
106112
120116
89 91
8175
102
63 63
0
50
100
150
1994 1995 1996 1997 1998 1999 2000 2001 2002 2003 2004
Number of Deaths
Number Shown in Annual Report Number as of March, 2006
212
384
301
384407
504
362335 337
285 273 283
207185
241233
298
433
304286
230
282
0
100
200
300
400
500
600
1994 1995 1996 1997 1998 1999 2000 2001 2002 2003 2004
Number of Deaths
Number Shown in Annual Report Number as of March, 2006
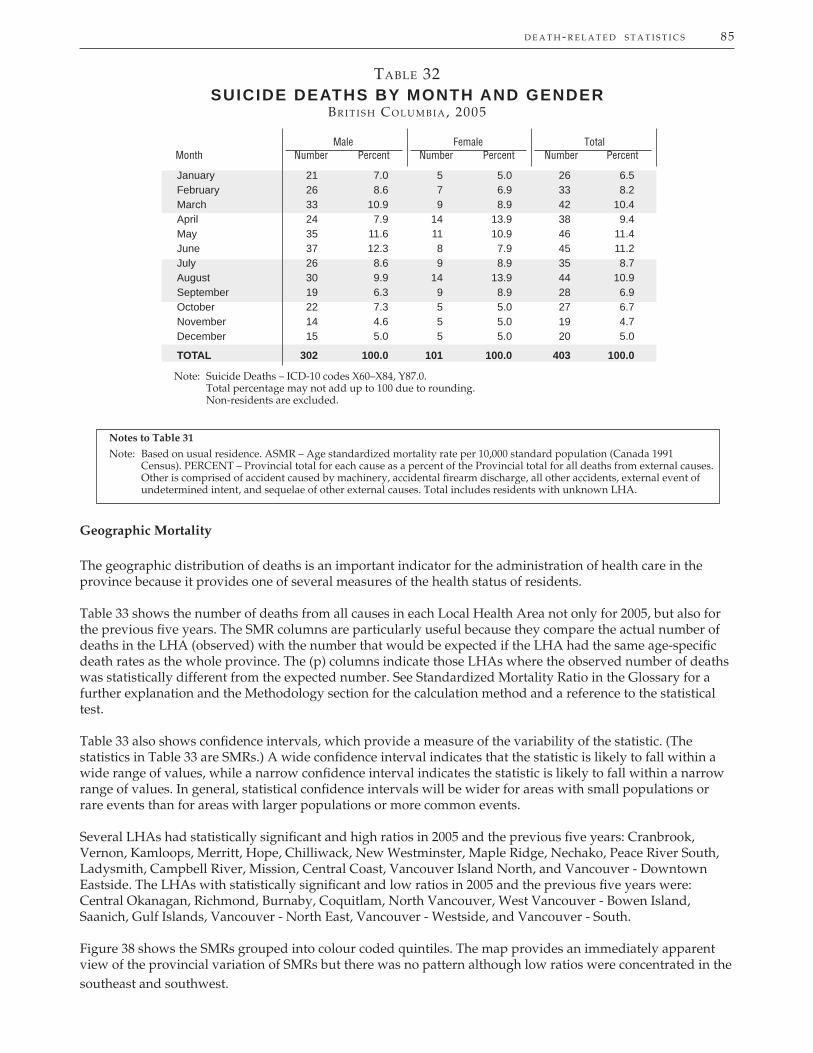
D E A T H - R E L A T E D S T A T I S T I C S 85
TABLE 32SUICIDE DEATHS BY MONTH AND GENDER
BR I T I S H CO L U M B I A, 2005
Male Female TotalMonth Number Percent Number Percent Number Percent
Note: Suicide Deaths – ICD-10 codes X60–X84, Y87.0.Total percentage may not add up to 100 due to rounding.Non-residents are excluded.
January 21 7.0 5 5.0 26 6.5February 26 8.6 7 6.9 33 8.2March 33 10.9 9 8.9 42 10.4April 24 7.9 14 13.9 38 9.4May 35 11.6 11 10.9 46 11.4June 37 12.3 8 7.9 45 11.2July 26 8.6 9 8.9 35 8.7August 30 9.9 14 13.9 44 10.9September 19 6.3 9 8.9 28 6.9October 22 7.3 5 5.0 27 6.7November 14 4.6 5 5.0 19 4.7December 15 5.0 5 5.0 20 5.0
TOTAL 302 100.0 101 100.0 403 100.0
Notes to Table 31
Note: Based on usual residence. ASMR – Age standardized mortality rate per 10,000 standard population (Canada 1991 Census). PERCENT – Provincial total for each cause as a percent of the Provincial total for all deaths from external causes. Other is comprised of accident caused by machinery, accidental fi rearm discharge, all other accidents, external event of undetermined intent, and sequelae of other external causes. Total includes residents with unknown LHA.
Geographic Mortality
The geographic distribution of deaths is an important indicator for the administration of health care in the province because it provides one of several measures of the health status of residents.
Table 33 shows the number of deaths from all causes in each Local Health Area not only for 2005, but also for the previous fi ve years. The SMR columns are particularly useful because they compare the actual number of deaths in the LHA (observed) with the number that would be expected if the LHA had the same age-specifi c death rates as the whole province. The (p) columns indicate those LHAs where the observed number of deaths was statistically different from the expected number. See Standardized Mortality Ratio in the Glossary for a further explanation and the Methodology section for the calculation method and a reference to the statistical test.
Table 33 also shows confi dence intervals, which provide a measure of the variability of the statistic. (The statistics in Table 33 are SMRs.) A wide confi dence interval indicates that the statistic is likely to fall within a wide range of values, while a narrow confi dence interval indicates the statistic is likely to fall within a narrow range of values. In general, statistical confi dence intervals will be wider for areas with small populations or rare events than for areas with larger populations or more common events.
Several LHAs had statistically signifi cant and high ratios in 2005 and the previous fi ve years: Cranbrook, Vernon, Kamloops, Merritt, Hope, Chilliwack, New Westminster, Maple Ridge, Nechako, Peace River South, Ladysmith, Campbell River, Mission, Central Coast, Vancouver Island North, and Vancouver - Downtown Eastside. The LHAs with statistically signifi cant and low ratios in 2005 and the previous fi ve years were: Central Okanagan, Richmond, Burnaby, Coquitlam, North Vancouver, West Vancouver - Bowen Island, Saanich, Gulf Islands, Vancouver - North East, Vancouver - Westside, and Vancouver - South.
Figure 38 shows the SMRs grouped into colour coded quintiles. The map provides an immediately apparent view of the provincial variation of SMRs but there was no pattern although low ratios were concentrated in the southeast and southwest.
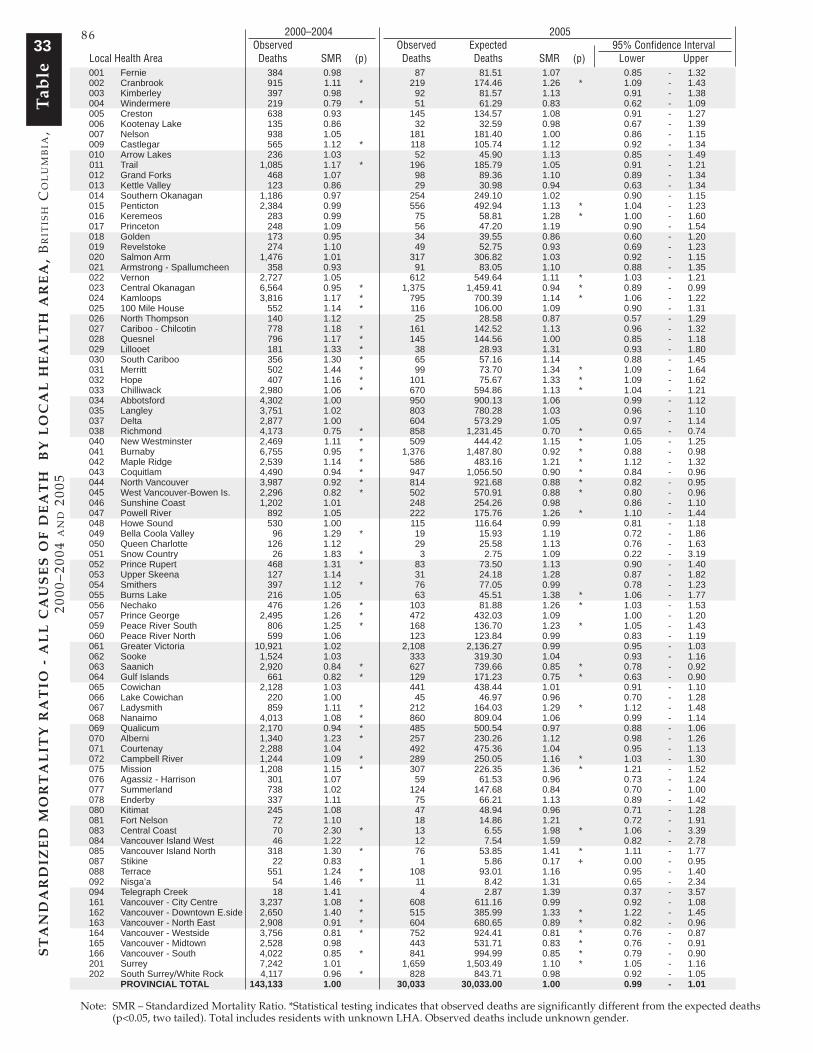
86 D E A T H - R E L A T E D S T A T I S T I C S 2000–2004 2005 Observed Observed Expected 95% Confi dence Interval
Local Health Area Deaths SMR (p) Deaths Deaths SMR (p) Lower Upper 001 Fernie 384 0.98 87 81.51 1.07 0.85 - 1.32 002 Cranbrook 915 1.11 * 219 174.46 1.26 * 1.09 - 1.43 003 Kimberley 397 0.98 92 81.57 1.13 0.91 - 1.38 004 Windermere 219 0.79 * 51 61.29 0.83 0.62 - 1.09 005 Creston 638 0.93 145 134.57 1.08 0.91 - 1.27 006 Kootenay Lake 135 0.86 32 32.59 0.98 0.67 - 1.39 007 Nelson 938 1.05 181 181.40 1.00 0.86 - 1.15 009 Castlegar 565 1.12 * 118 105.74 1.12 0.92 - 1.34 010 Arrow Lakes 236 1.03 52 45.90 1.13 0.85 - 1.49 011 Trail 1,085 1.17 * 196 185.79 1.05 0.91 - 1.21 012 Grand Forks 468 1.07 98 89.36 1.10 0.89 - 1.34 013 Kettle Valley 123 0.86 29 30.98 0.94 0.63 - 1.34 014 Southern Okanagan 1,186 0.97 254 249.10 1.02 0.90 - 1.15 015 Penticton 2,384 0.99 556 492.94 1.13 * 1.04 - 1.23 016 Keremeos 283 0.99 75 58.81 1.28 * 1.00 - 1.60 017 Princeton 248 1.09 56 47.20 1.19 0.90 - 1.54 018 Golden 173 0.95 34 39.55 0.86 0.60 - 1.20 019 Revelstoke 274 1.10 49 52.75 0.93 0.69 - 1.23 020 Salmon Arm 1,476 1.01 317 306.82 1.03 0.92 - 1.15 021 Armstrong - Spallumcheen 358 0.93 91 83.05 1.10 0.88 - 1.35 022 Vernon 2,727 1.05 612 549.64 1.11 * 1.03 - 1.21 023 Central Okanagan 6,564 0.95 * 1,375 1,459.41 0.94 * 0.89 - 0.99 024 Kamloops 3,816 1.17 * 795 700.39 1.14 * 1.06 - 1.22 025 100 Mile House 552 1.14 * 116 106.00 1.09 0.90 - 1.31 026 North Thompson 140 1.12 25 28.58 0.87 0.57 - 1.29 027 Cariboo - Chilcotin 778 1.18 * 161 142.52 1.13 0.96 - 1.32 028 Quesnel 796 1.17 * 145 144.56 1.00 0.85 - 1.18 029 Lillooet 181 1.33 * 38 28.93 1.31 0.93 - 1.80 030 South Cariboo 356 1.30 * 65 57.16 1.14 0.88 - 1.45 031 Merritt 502 1.44 * 99 73.70 1.34 * 1.09 - 1.64 032 Hope 407 1.16 * 101 75.67 1.33 * 1.09 - 1.62 033 Chilliwack 2,980 1.06 * 670 594.86 1.13 * 1.04 - 1.21 034 Abbotsford 4,302 1.00 950 900.13 1.06 0.99 - 1.12 035 Langley 3,751 1.02 803 780.28 1.03 0.96 - 1.10 037 Delta 2,877 1.00 604 573.29 1.05 0.97 - 1.14 038 Richmond 4,173 0.75 * 858 1,231.45 0.70 * 0.65 - 0.74 040 New Westminster 2,469 1.11 * 509 444.42 1.15 * 1.05 - 1.25 041 Burnaby 6,755 0.95 * 1,376 1,487.80 0.92 * 0.88 - 0.98 042 Maple Ridge 2,539 1.14 * 586 483.16 1.21 * 1.12 - 1.32 043 Coquitlam 4,490 0.94 * 947 1,056.50 0.90 * 0.84 - 0.96 044 North Vancouver 3,987 0.92 * 814 921.68 0.88 * 0.82 - 0.95 045 West Vancouver-Bowen Is. 2,296 0.82 * 502 570.91 0.88 * 0.80 - 0.96 046 Sunshine Coast 1,202 1.01 248 254.26 0.98 0.86 - 1.10 047 Powell River 892 1.05 222 175.76 1.26 * 1.10 - 1.44 048 Howe Sound 530 1.00 115 116.64 0.99 0.81 - 1.18 049 Bella Coola Valley 96 1.29 * 19 15.93 1.19 0.72 - 1.86 050 Queen Charlotte 126 1.12 29 25.58 1.13 0.76 - 1.63 051 Snow Country 26 1.83 * 3 2.75 1.09 0.22 - 3.19 052 Prince Rupert 468 1.31 * 83 73.50 1.13 0.90 - 1.40 053 Upper Skeena 127 1.14 31 24.18 1.28 0.87 - 1.82 054 Smithers 397 1.12 * 76 77.05 0.99 0.78 - 1.23 055 Burns Lake 216 1.05 63 45.51 1.38 * 1.06 - 1.77 056 Nechako 476 1.26 * 103 81.88 1.26 * 1.03 - 1.53 057 Prince George 2,495 1.26 * 472 432.03 1.09 1.00 - 1.20 059 Peace River South 806 1.25 * 168 136.70 1.23 * 1.05 - 1.43 060 Peace River North 599 1.06 123 123.84 0.99 0.83 - 1.19 061 Greater Victoria 10,921 1.02 2,108 2,136.27 0.99 0.95 - 1.03 062 Sooke 1,524 1.03 333 319.30 1.04 0.93 - 1.16 063 Saanich 2,920 0.84 * 627 739.66 0.85 * 0.78 - 0.92 064 Gulf Islands 661 0.82 * 129 171.23 0.75 * 0.63 - 0.90 065 Cowichan 2,128 1.03 441 438.44 1.01 0.91 - 1.10 066 Lake Cowichan 220 1.00 45 46.97 0.96 0.70 - 1.28 067 Ladysmith 859 1.11 * 212 164.03 1.29 * 1.12 - 1.48 068 Nanaimo 4,013 1.08 * 860 809.04 1.06 0.99 - 1.14 069 Qualicum 2,170 0.94 * 485 500.54 0.97 0.88 - 1.06 070 Alberni 1,340 1.23 * 257 230.26 1.12 0.98 - 1.26 071 Courtenay 2,288 1.04 492 475.36 1.04 0.95 - 1.13 072 Campbell River 1,244 1.09 * 289 250.05 1.16 * 1.03 - 1.30 075 Mission 1,208 1.15 * 307 226.35 1.36 * 1.21 - 1.52 076 Agassiz - Harrison 301 1.07 59 61.53 0.96 0.73 - 1.24 077 Summerland 738 1.02 124 147.68 0.84 0.70 - 1.00 078 Enderby 337 1.11 75 66.21 1.13 0.89 - 1.42 080 Kitimat 245 1.08 47 48.94 0.96 0.71 - 1.28 081 Fort Nelson 72 1.10 18 14.86 1.21 0.72 - 1.91 083 Central Coast 70 2.30 * 13 6.55 1.98 * 1.06 - 3.39 084 Vancouver Island West 46 1.22 12 7.54 1.59 0.82 - 2.78 085 Vancouver Island North 318 1.30 * 76 53.85 1.41 * 1.11 - 1.77 087 Stikine 22 0.83 1 5.86 0.17 + 0.00 - 0.95 088 Terrace 551 1.24 * 108 93.01 1.16 0.95 - 1.40 092 Nisga’a 54 1.46 * 11 8.42 1.31 0.65 - 2.34 094 Telegraph Creek 18 1.41 4 2.87 1.39 0.37 - 3.57 161 Vancouver - City Centre 3,237 1.08 * 608 611.16 0.99 0.92 - 1.08 162 Vancouver - Downtown E.side 2,650 1.40 * 515 385.99 1.33 * 1.22 - 1.45 163 Vancouver - North East 2,908 0.91 * 604 680.65 0.89 * 0.82 - 0.96 164 Vancouver - Westside 3,756 0.81 * 752 924.41 0.81 * 0.76 - 0.87 165 Vancouver - Midtown 2,528 0.98 443 531.71 0.83 * 0.76 - 0.91 166 Vancouver - South 4,022 0.85 * 841 994.99 0.85 * 0.79 - 0.90 201 Surrey 7,242 1.01 1,659 1,503.49 1.10 * 1.05 - 1.16 202 South Surrey/White Rock 4,117 0.96 * 828 843.71 0.98 0.92 - 1.05 PROVINCIAL TOTAL 143,133 1.00 30,033 30,033.00 1.00 0.99 - 1.01
Note: SMR – Standardized Mortality Ratio. *Statistical testing indicates that observed deaths are signifi cantly different from the expected deaths (p<0.05, two tailed). Total includes residents with unknown LHA. Observed deaths include unknown gender.
ST
AN
DA
RD
IZE
D M
OR
TA
LIT
Y R
AT
IO -
AL
L C
AU
SE
S O
F D
EA
TH
B
Y L
OC
AL
HE
AL
TH
AR
EA
, B
RIT
ISH
CO
LU
MB
IA,
2000
–200
4 A
ND
200
5T
able
3386

D E A T H - R E L A T E D S T A T I S T I C S 87
Note: SMR - Standardized Mortality Ratio. Refer to Figure 1 to clarify geographical location of Local Health Areas.
N
Statistically Significant
QUINTILE (SMR)
5 ( > 1.17)
2 (0.95 - 1.02)
1 ( < 0.95)
4 ( 1.09 - 1.17)
3 ( 1.02 - 1.09)
Inset 1
see inset 2
Inset 2
see inset 1
300 kms0 100 200
10 kms0
50 kms0
FIGURE 38ALL CAUSES OF DEATH BY LOCAL HEALTH AREA
BR I T I S H CO L U M B I A, 2000-2004
88 D E A T H - R E L A T E D S T A T I S T I C S
Potential Years of Life Lost
Potential Years of Life Lost (PYLL) gives an indication of “premature” death by totalling the number of years British Columbians “lost” prior to age 75 years. For example, an infant death (under one year old) would have lost 74.5 years of life. The upper limit of 75 is used for both genders. PYLL indicates the importance of the various causes of premature death by giving more weight to deaths that occurred at younger ages than those that occurred later in life. Bear in mind that the total potential years of life lost (total PYLL) includes all ages or age groups up to 75 years old, so many deaths at an older age can have the same total PYLL as one death at a younger age.
The tables and fi gures in this section are comprehensive and, at times, may seem complex but they are particularly useful because they portray the impact of premature mortality. The Glossary further defi nes Potential Years of Life Lost (PYLL). The precise calculation methods for the various indicators derived from PYLL are referenced in the tables in this section and are shown in Methodology section.
Table 34 shows several PYLL based indicators for deaths of those under 75 years old as well as deaths of all ages for various causes of death. The No. (number) of Deaths column shows the number of persons under 75 years of age who died due to each cause group. Total PYLL counts the number of years all decedents would have lived if they reached the age of 75. Percent of PYLL shows each disease category’s proportion of the Total PYLL for all causes. Average PYLL is the disease category’s Total PYLL divided by its No. of Deaths. PYLLSR is the rate of PYLL per 1,000 population, standardized to Canada’s 1991 age group population numbers. See PYLL Standardized Rate in the Glossary and the Methodology section for computation details.
The three rightmost columns in Table 34 relate to deaths at all ages for comparison. No. of Deaths is the total number of deaths due to each disease category. Percent of Deaths shows the number of deaths that occurred due to the Cause of Death out of one hundred total deaths. ASMR shows the death rate due to each cause standardized per 1,000 standard population. See Age Standardized Mortality Rate in the Glossary and Methodology section for an example of the calculation method.
Because PYLL focuses on premature mortality rather than on the simple fact of death, it is useful in assessing causes of death in terms of the extent to which each contributes to reduction in lifespan. In Table 34 the column labelled Average PYLL is helpful in exploring this effect. The larger the value in this column, the more premature are the deaths due to this category. The extreme case is certain conditions originating in the perinatal period. Most of the deaths from this cause are less than one year old (see Table 21) and the PYLL for deaths under one year old is 74.5 years. Motor vehicle accidents, which claim many young lives, have a high value for average PYLL at 37.0 years. Malignant neoplasms, on the other hand, although claiming many lives (4,378 under 75) have a relatively low average PYLL at 12.6 years.
The PYLLSR and ASMR columns give standardized statistics which allow the comparison of PYLL and death rates between jurisdictions in Canada and between this year and other years. Such comparisons permit one to put B.C. in a larger context and to see change over time.
Figure 39, by directly and visually contrasting PYLLSR and ASMR for several major causes of death, allows one to see, by comparing the profi les of the two sides of the graph, where there are signifi cant differences in the impact of the various causes of death on PYLL and death rate. The clearest contrast is for external causes of death: a relatively moderate ASMR but very high PYLLSR. External causes are responsible for relatively few deaths but ‘waste’ much potential life.
In Table 35 causes of death in 2005 have been ranked according to the importance of Total PYLL in four age groups which correspond to what most people consider childhood and the young, middle, and later adult years. The central portion of the table indicates the number of deaths and number of years lost for males, females, and both genders. The PYLL column shows all the years lost in the age group due to each cause category. PYLL % indicates the percent of all PYLL in the age group due to each cause. As explained previously, PYLLSR is the ‘standardized’ rate adjusted to the Canada 1991 census, permitting comparisons among places and times where the rates have been standardized to the same Canadian population.

D E A T H - R E L A T E D S T A T I S T I C S 89
Most of the PYLL under 15 years was due to conditions originating in the period around birth (see Table 35). Most of those deaths occurred less than seven days after birth (see Table 27) and caused more male than female deaths (see Table 21).
The PYLL due to motor vehicle accidents (MVA) between 15 and 24 years remains a major concern because they are largely preventable. Males accounted for the most of the deaths and most of the PYLL by far as shown in Table 35.
Males and females differed in their contributions to total PYLL between 25 and 44 years. Among females, malignant neoplasms were responsible for almost the same number of PYLL as all the other major causes combined. Among males, suicides accounted for the largest number of PYLL, although PYLL due to MVA and malignant neoplasms were important as well. Note that male deaths due to MVA were responsible for a greater number of deaths than in the 15 to 24 year age group but fewer PYLL.
Malignant neoplasms accounted for more PYLL than all other major causes combined for both genders in the 45-74 year age group (see Table 35).
Figure 40 presents the PYLLSR values from Table 35 so the gender differences are immediately apparent. Males in the four age groups consistently ‘lost’ more years than females, although the standardized PYLL rates due to malignant neoplasms were similar in the two adult age groups.
External causes have been covered in a previous section but Table 36 presents their geographic distribution in terms of PYLL, because of their impact on the relatively young. These causes, often seen to be more avoidable than the contrasting ‘natural’ causes of death, attract attention because of the greater potential for their reduction. PYLL Index is a way of displaying PYLL for a jurisdiction but adjusting it for population size, age distribution, and gender makeup so that areas can compare themselves with the province or each other. The table shows potential years of life lost (PYLL) due to external causes of death by Local Health Area (LHA) for the period 2000 through 2004 and for the year 2005. It also displays the observed number of lost years in each LHA for both periods and, for 2005, the expected PYLL based on the age distribution in the LHA adjusted to the provincial age and gender specifi c rate. The PYLL Index is the ratio of observed to expected deaths with (p), a test of statistical signifi cance and the 95% Confi dence Interval of the ratio. See Expected Potential Years of Life Lost and PYLL Index in the Glossary and the Methodology section for a computational example.
In the fi ve year period, almost half of the LHAs (43) had statistically signifi cant observed versus expected deaths and 29 of those were high. Only one of the populated areas in the lower mainland (Vancouver – Downtown Eastside) was statistically signifi cant and high.
Figure 41 displays B.C.’s 89 local health areas, coloured according to their level of PYLL Index (PYLLI) for the years 2000-2004. They are grouped into quintiles, fi ve groups from those with the lowest (dark grey) to those with the highest PYLLI values (dark green). Looking at this map, the pattern is one of an urban/rural distinction. The more urban areas, in general, are in the quintiles with lower PYLLI values.

90 D E A T H - R E L A T E D S T A T I S T I C S
TABLE 34POTENTIAL YEARS OF LIFE LOST AND AGE STANDARDIZED
MORTALITY RATES BY SELECTED CAUSES OF DEATHBR I T I S H CO L U M B I A, 2005
PYLL (Age Under 75 Years) Mortality (All Ages) No. of Total Percent Average No. of Percent
Cause of Death ICD-10 Code(s) Deaths PYLL of PYLL PYLL PYLLSR Deaths of Deaths ASMR
Certain infectious and parasitic A00-B99 348 7,571 3.9 21.8 1.73 566 1.9 1.05 diseases - HIV disease B20-B24 144 3,975 2.1 27.6 0.94 145 0.5 0.31Malignant neoplasms C00-C97 4,378 55,234 28.5 12.6 11.27 8,367 27.9 15.24 - Malignant neoplasm of C33-C34 1,253 13,438 6.9 10.7 2.66 2,193 7.3 4.09 trachea and lung - Malignant neoplasm of C500-C509 344 5,635 2.9 16.4 2.24 570 1.9 1.93 female breast - Malignant neoplasm of C18-C21 432 4,960 2.6 11.5 1.01 927 3.1 1.66 colon and rectumEndocrine nutritional and E00-E89 488 6,710 3.5 13.8 1.48 1,294 4.3 2.27 metabolic diseases - Diabetes mellitus E10-E14 375 4,503 2.3 12.0 0.94 1,021 3.4 1.78Diseases of the circulatory system I00-I99 2,333 27,151 14.0 11.6 5.63 9,627 32.1 15.78 - Ischemic heart diseases I20-I25 1,134 12,585 6.5 11.1 2.55 4,361 14.5 7.20 - Cerebrovascular diseases I60-I69 471 5,135 2.7 10.9 1.08 2,220 7.4 3.61Diseases of the respiratory system J00-J98 702 7,282 3.8 10.4 1.56 3,261 10.9 5.33 - Pneumonia/Infl uenza J10-J181, J188, J189 196 2,697 1.4 13.8 0.61 1,342 4.5 2.10 (excluding hypostatic) - Chronic Pulmonary Disease J40-J44 326 2,270 1.2 7.0 0.48 1,285 4.3 2.18Diseases of the digestive system K00-K92 490 7,786 4.0 15.9 1.69 1,181 3.9 2.05 - Chronic liver disease/cirrhosis K70, K73-74, 248 4,040 2.1 16.3 0.82 300 1.0 0.57 K760-K761Congenital malformations and Q00-Q99 75 4,174 2.2 55.7 1.42 83 0.3 0.23 chromosome abnormalitiesCertain conditions originating P00-P96 91 6,773 3.5 74.4 2.54 91 0.3 0.33 in the perinatal periodExternal causes of death V01-Y98 1,236 38,954 20.1 31.5 9.89 1,654 5.5 3.42 - Motor vehicle accidents V02-V04, V09, 326 12,075 6.2 37.0 3.18 369 1.2 0.84 V12-V14, V190-V196, V20-V79, V803-V805, V820-V821, V823-V890, V892, V899, Y850 - Suicide X60-X84, Y870 367 11,293 5.8 30.8 2.80 403 1.3 0.87Other causes1 1,356 32,061 16.6 23.6 8.14 3,909 13.0 6.82All causes 11,497 193,693 100.0 16.8 45.34 30,033 100.0 52.52
Note: PYLL – Potential Years of Life Lost, denotes the total number of years of life lost from an established life expectancy (75 years). PYLLSR – PYLL Standardized Rate per 1,000 standard population (Canada 1991 Census). ASMR – Age Standardized Mortality Rate per 10,000 standard population (Canada 1991 Census). 1Other causes includes undetermined and pending. Total percentage may not add up to 100 due to rounding. Non-residents are excluded. The output from ICD-10 mortality coding and underlying cause of death selection was modifi ed in British Columbia to refl ect the intent of certifi ers in this jurisdiction and to provide greater continuity over time. Data using the standard ICD-10 rules for such categories as pneumonia/infl uenza, diabetes, or cancer should not be compared to the numbers shown above.

D E A T H - R E L A T E D S T A T I S T I C S 91
FIGURE 39POTENTIAL YEARS OF LIFE LOST AND AGE STANDARDIZED
MORTALITY RATES BY SELECTED CAUSES OF DEATHBR I T I S H CO L U M B I A, 2005
Note: PYLLSR - Potential Years of Life Lost Standardized Rate (age under 75 years) per 1,000 standard population. ASMR - Age Standardized Mortality Rate per 10,000 standard population.
PYLLSR Causes of Death ASMR
Malignant neoplasms
External causes of death
Diseases of thecirculatory system
Certain conditions orginatingin the perinatal period
Certain infectious andparasitic diseases
Diseases of thedigestive systemDiseases of the
respiratory system
Endocrine, nutritional andmetabolic diseases
Congenital malformations and chromosome abnormalities
20 15 10 5 0 0 5 10 15 20
11.27
9.89
5.63
2.54
1.73
1.69
1.56
1.48
1.42
15.24
3.42
15.78
0.33
1.05
2.05
5.33
2.27
0.23
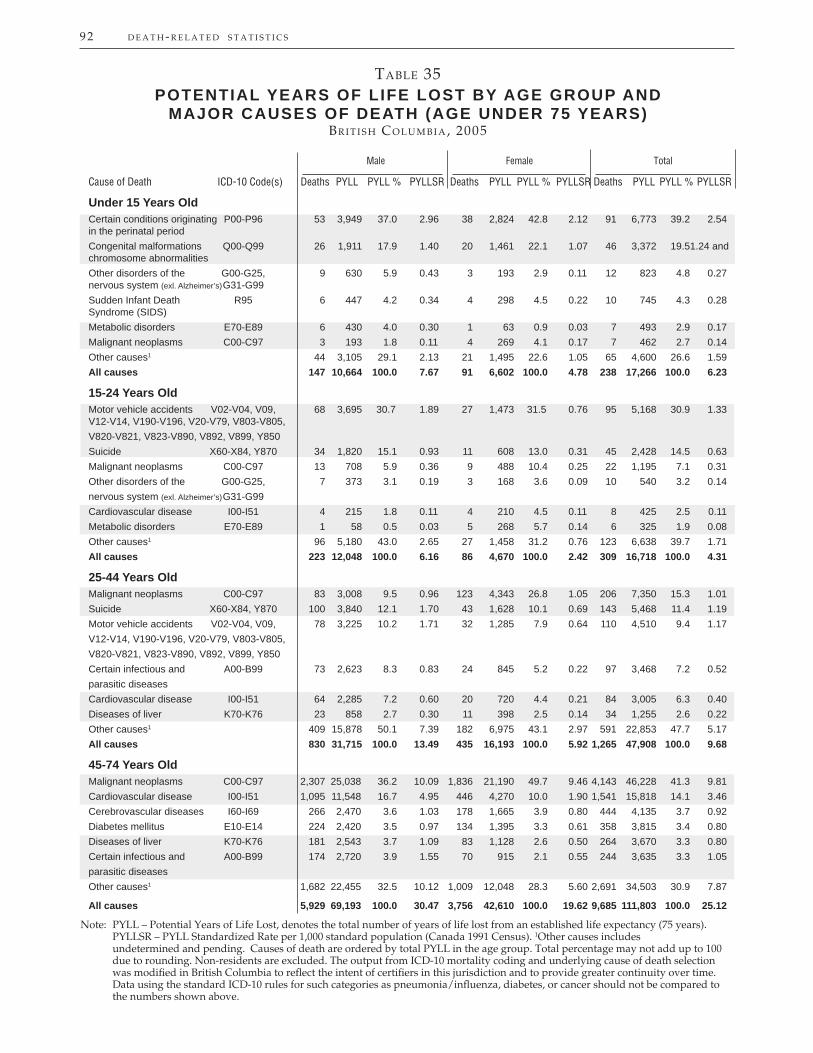
92 D E A T H - R E L A T E D S T A T I S T I C S
TABLE 35POTENTIAL YEARS OF LIFE LOST BY AGE GROUP AND
MAJOR CAUSES OF DEATH (AGE UNDER 75 YEARS)BR I T I S H CO L U M B I A, 2005
Male Female Total
Cause of Death ICD-10 Code(s) Deaths PYLL PYLL % PYLLSR Deaths PYLL PYLL % PYLLSR Deaths PYLL PYLL % PYLLSR
Under 15 Years OldCertain conditions originating P00-P96 53 3,949 37.0 2.96 38 2,824 42.8 2.12 91 6,773 39.2 2.54 in the perinatal periodCongenital malformations Q00-Q99 26 1,911 17.9 1.40 20 1,461 22.1 1.07 46 3,372 19.5 1.24 and chromosome abnormalitiesOther disorders of the G00-G25, 9 630 5.9 0.43 3 193 2.9 0.11 12 823 4.8 0.27 nervous system (exl. Alzheimer’s) G31-G99 Sudden Infant Death R95 6 447 4.2 0.34 4 298 4.5 0.22 10 745 4.3 0.28 Syndrome (SIDS)Metabolic disorders E70-E89 6 430 4.0 0.30 1 63 0.9 0.03 7 493 2.9 0.17Malignant neoplasms C00-C97 3 193 1.8 0.11 4 269 4.1 0.17 7 462 2.7 0.14Other causes1 44 3,105 29.1 2.13 21 1,495 22.6 1.05 65 4,600 26.6 1.59All causes 147 10,664 100.0 7.67 91 6,602 100.0 4.78 238 17,266 100.0 6.23
15-24 Years Old Motor vehicle accidents V02-V04, V09, 68 3,695 30.7 1.89 27 1,473 31.5 0.76 95 5,168 30.9 1.33 V12-V14, V190-V196, V20-V79, V803-V805,V820-V821, V823-V890, V892, V899, Y850Suicide X60-X84, Y870 34 1,820 15.1 0.93 11 608 13.0 0.31 45 2,428 14.5 0.63Malignant neoplasms C00-C97 13 708 5.9 0.36 9 488 10.4 0.25 22 1,195 7.1 0.31Other disorders of the G00-G25, 7 373 3.1 0.19 3 168 3.6 0.09 10 540 3.2 0.14nervous system (exl. Alzheimer’s) G31-G99Cardiovascular disease I00-I51 4 215 1.8 0.11 4 210 4.5 0.11 8 425 2.5 0.11Metabolic disorders E70-E89 1 58 0.5 0.03 5 268 5.7 0.14 6 325 1.9 0.08Other causes1 96 5,180 43.0 2.65 27 1,458 31.2 0.76 123 6,638 39.7 1.71All causes 223 12,048 100.0 6.16 86 4,670 100.0 2.42 309 16,718 100.0 4.31
25-44 Years Old Malignant neoplasms C00-C97 83 3,008 9.5 0.96 123 4,343 26.8 1.05 206 7,350 15.3 1.01Suicide X60-X84, Y870 100 3,840 12.1 1.70 43 1,628 10.1 0.69 143 5,468 11.4 1.19Motor vehicle accidents V02-V04, V09, 78 3,225 10.2 1.71 32 1,285 7.9 0.64 110 4,510 9.4 1.17V12-V14, V190-V196, V20-V79, V803-V805, V820-V821, V823-V890, V892, V899, Y850Certain infectious and A00-B99 73 2,623 8.3 0.83 24 845 5.2 0.22 97 3,468 7.2 0.52parasitic diseasesCardiovascular disease I00-I51 64 2,285 7.2 0.60 20 720 4.4 0.21 84 3,005 6.3 0.40Diseases of liver K70-K76 23 858 2.7 0.30 11 398 2.5 0.14 34 1,255 2.6 0.22Other causes1 409 15,878 50.1 7.39 182 6,975 43.1 2.97 591 22,853 47.7 5.17All causes 830 31,715 100.0 13.49 435 16,193 100.0 5.92 1,265 47,908 100.0 9.68
45-74 Years Old Malignant neoplasms C00-C97 2,307 25,038 36.2 10.09 1,836 21,190 49.7 9.46 4,143 46,228 41.3 9.81Cardiovascular disease I00-I51 1,095 11,548 16.7 4.95 446 4,270 10.0 1.90 1,541 15,818 14.1 3.46Cerebrovascular diseases I60-I69 266 2,470 3.6 1.03 178 1,665 3.9 0.80 444 4,135 3.7 0.92Diabetes mellitus E10-E14 224 2,420 3.5 0.97 134 1,395 3.3 0.61 358 3,815 3.4 0.80Diseases of liver K70-K76 181 2,543 3.7 1.09 83 1,128 2.6 0.50 264 3,670 3.3 0.80Certain infectious and A00-B99 174 2,720 3.9 1.55 70 915 2.1 0.55 244 3,635 3.3 1.05parasitic diseasesOther causes1 1,682 22,455 32.5 10.12 1,009 12,048 28.3 5.60 2,691 34,503 30.9 7.87
All causes 5,929 69,193 100.0 30.47 3,756 42,610 100.0 19.62 9,685 111,803 100.0 25.12
Note: PYLL – Potential Years of Life Lost, denotes the total number of years of life lost from an established life expectancy (75 years). PYLLSR – PYLL Standardized Rate per 1,000 standard population (Canada 1991 Census). 1Other causes includes undetermined and pending. Causes of death are ordered by total PYLL in the age group. Total percentage may not add up to 100
due to rounding. Non-residents are excluded. The output from ICD-10 mortality coding and underlying cause of death selection was modifi ed in British Columbia to refl ect the intent of certifi ers in this jurisdiction and to provide greater continuity over time. Data using the standard ICD-10 rules for such categories as pneumonia/infl uenza, diabetes, or cancer should not be compared to the numbers shown above.
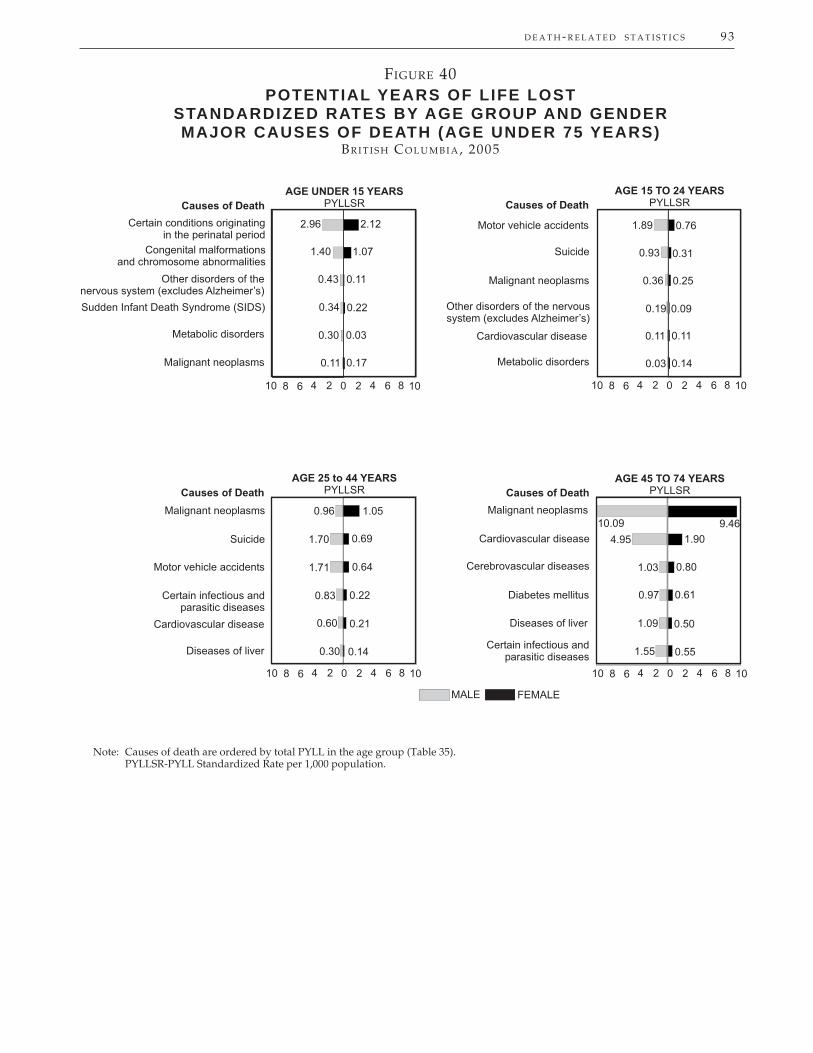
D E A T H - R E L A T E D S T A T I S T I C S 93
FIGURE 40POTENTIAL YEARS OF LIFE LOST
STANDARDIZED RATES BY AGE GROUP AND GENDERMAJOR CAUSES OF DEATH (AGE UNDER 75 YEARS)
BR I T I S H CO L U M B I A, 2005
Note: Causes of death are ordered by total PYLL in the age group (Table 35). PYLLSR-PYLL Standardized Rate per 1,000 population.
AGE UNDER 15 YEARSPYLLSR
AGE 45 TO 74 YEARSPYLLSR
AGE 15 TO 24 YEARSPYLLSR
AGE 25 to 44 YEARSPYLLSR
0 2 4 6 8 10246810
0 2 4 6 8 10246810
0 2 4 6 8 10246810
0 2 4 6 8 10246810
MALE FEMALE
Causes of Death
Causes of Death
Causes of Death
Causes of Death
Malignant neoplasms
Motor vehicle accidents
Suicide
Other disorders of the nervoussystem (excludes Alzheimer’s)
Cardiovascular disease
Metabolic disorders
Malignant neoplasms
Cardiovascular disease
Cerebrovascular diseases
Diabetes mellitus
Diseases of liver
Certain infectious andparasitic diseases
Certain conditions originatingin the perinatal period
Congenital malformationsand chromosome abnormalities
Other disorders of thenervous system (excludes Alzheimer’s)
Sudden Infant Death Syndrome (SIDS)
Metabolic disorders
Malignant neoplasms
Malignant neoplasms
Suicide
Motor vehicle accidents
Certain infectious andparasitic diseases
Diseases of liver
Cardiovascular disease
2.96
1.40
0.43
0.34
0.30
0.11
2.12
1.07
0.11
0.22
0.03
0.17
1.89
0.93
0.36
0.19
0.11
0.03
0.76
0.31
0.25
0.09
0.11
0.14
0.96
1.70
1.71
0.83
0.60
0.30
1.05
0.69
0.64
0.22
0.21
0.14
10.09
4.95
1.03
0.97
1.09
1.55
9.46
1.90
0.80
0.61
0.50
0.55

94 D E A T H - R E L A T E D S T A T I S T I C S 2000–2004 2005 Observed Observed PYLL Observed Observed Expected PYLL 95% Confi dence LimitLocal Health Area Deaths PYLL Index (p) Deaths PYLL PYLL Index (p) Lower Upper
001 Fernie 33 1,213 1.22 4 85 157.29 0.54 0.00 - 1.08 002 Cranbrook 49 1,525 0.99 8 220 238.35 0.92 0.12 - 1.73 003 Kimberley 14 485 0.98 4 115 78.77 1.46 0.00 - 3.16 004 Windermere 26 950 1.63 2 30 100.31 0.30 + 0.00 - 0.72 005 Creston 29 962 1.47 7 188 102.37 1.84 0.39 - 3.29 006 Kootenay Lake 15 428 2.17 3 53 29.38 1.80 0.00 - 4.04 007 Nelson 55 1,712 1.15 5 143 229.49 0.62 0.03 - 1.22 009 Castlegar 26 965 1.20 6 225 122.74 1.83 0.28 - 3.38 010 Arrow Lakes 18 725 2.54 * 3 118 43.78 2.70 0.00 - 5.88 011 Trail 49 1,772 1.54 * 6 185 175.95 1.05 0.09 - 2.02 012 Grand Forks 15 383 0.76 6 145 78.33 1.85 0.13 - 3.57 013 Kettle Valley 11 318 1.55 1 18 30.96 0.58 0.00 - 1.69 014 Southern Okanagan 40 1,255 1.42 7 268 143.61 1.87 0.28 - 3.45 015 Penticton 89 2,939 1.39 * 15 553 331.82 1.67 0.77 - 2.56 016 Keremeos 25 888 3.76 * 7 263 38.13 6.90 * 1.30 - 12.49 017 Princeton 13 528 2.15 5 178 37.51 4.75 0.44 - 9.05 018 Golden 16 560 1.16 2 100 77.60 1.29 0.00 - 3.08 019 Revelstoke 20 730 1.40 1 28 79.94 0.35 0.00 - 1.02 020 Salmon Arm 83 2,663 1.52 * 13 373 283.09 1.32 0.48 - 2.16 021 Armstrong - Spallumcheen 19 623 1.09 6 205 89.34 2.29 0.20 - 4.39 022 Vernon 144 4,420 1.31 * 16 525 534.75 0.98 0.48 - 1.49 023 Central Okanagan 278 8,967 1.01 51 1,607 1,454.48 1.10 0.77 - 1.44 024 Kamloops 258 8,677 1.39 * 48 1,315 965.25 1.36 0.92 - 1.81 025 100 Mile House 50 1,560 1.88 * 12 385 129.32 2.98 * 1.06 - 4.89 026 North Thompson 19 740 2.32 * 1 43 50.30 0.85 0.00 - 2.51 027 Cariboo - Chilcotin 78 2,572 1.42 * 11 268 278.58 0.96 0.31 - 1.61 028 Quesnel 70 2,125 1.36 12 225 240.52 0.94 0.23 - 1.64 029 Lillooet 21 553 1.93 1 13 43.22 0.30 + 0.00 - 0.87 030 South Cariboo 34 835 1.89 * 2 75 69.55 1.08 0.00 - 2.69 031 Merritt 48 1,735 2.56 * 3 88 105.37 0.84 0.00 - 1.92 032 Hope 36 1,047 2.18 * 5 188 74.50 2.52 0.11 - 4.94 033 Chilliwack 139 4,667 1.10 23 793 677.36 1.17 0.65 - 1.69 034 Abbotsford 230 8,245 1.12 32 960 1,149.76 0.83 0.51 - 1.16 035 Langley 153 5,148 0.73 * 20 565 1,137.14 0.50 * 0.24 - 0.75 037 Delta 114 3,936 0.63 * 12 345 950.34 0.36 * 0.14 - 0.59 038 Richmond 138 4,639 0.44 * 21 628 1,597.34 0.39 * 0.21 - 0.58 040 New Westminster 123 3,693 1.02 22 770 533.65 1.44 0.80 - 2.09 041 Burnaby 249 8,442 0.67 * 35 963 1,904.69 0.51 * 0.31 - 0.70 042 Maple Ridge 153 5,312 1.03 18 680 850.25 0.80 0.40 - 1.20 043 Coquitlam 226 7,784 0.61 * 49 1,543 2,016.55 0.77 0.52 - 1.01 044 North Vancouver 128 4,102 0.50 * 23 938 1,227.27 0.76 0.44 - 1.09 045 West Vancouver-Bowen Is. 51 1,513 0.57 * 7 233 416.77 0.56 0.11 - 1.01 046 Sunshine Coast 50 1,630 1.12 12 340 239.26 1.42 0.50 - 2.35 047 Powell River 33 953 0.84 8 250 171.66 1.46 0.33 - 2.59 048 Howe Sound 82 3,175 1.47 * 11 368 346.61 1.06 0.37 - 1.75 049 Bella Coola Valley 19 708 3.38 * 4 160 30.71 5.21 0.00 - 10.58 050 Queen Charlotte 22 605 1.78 1 48 51.85 0.93 0.00 - 2.72 051 Snow Country 9 353 7.07 * 1 48 7.37 6.51 0.00 - 19.15 052 Prince Rupert 55 1,998 1.89 * 5 178 160.79 1.11 0.10 - 2.11 053 Upper Skeena 15 503 1.37 1 53 54.08 0.98 0.00 - 2.88 054 Smithers 43 1,720 1.49 * 12 425 173.60 2.45 0.90 - 4.00 055 Burns Lake 25 848 1.81 * 4 150 72.25 2.08 0.00 - 4.19 056 Nechako 62 2,356 2.16 * 8 225 167.84 1.34 0.35 - 2.33 057 Prince George 248 8,124 1.24 * 42 1,400 996.35 1.41 0.93 - 1.88 059 Peace River South 70 2,320 1.38 * 13 438 268.53 1.63 0.65 - 2.61 060 Peace River North 73 2,806 1.37 * 12 465 329.11 1.41 0.55 - 2.28 061 Greater Victoria 390 12,631 1.02 57 1,723 1,907.18 0.90 0.64 - 1.17 062 Sooke 82 2,729 0.80 * 19 558 554.14 1.01 0.48 - 1.54 063 Saanich 64 2,085 0.65 * 13 338 506.86 0.67 0.24 - 1.09 064 Gulf Islands 33 1,113 1.60 1 33 114.00 0.29 + 0.00 - 0.85 065 Cowichan 106 3,751 1.25 22 655 471.60 1.39 0.74 - 2.04 066 Lake Cowichan 8 255 0.71 5 188 56.89 3.30 0.22 - 6.39 067 Ladysmith 33 1,113 1.27 3 113 140.47 0.80 0.00 - 1.76 068 Nanaimo 196 6,615 1.20 * 35 1,153 878.07 1.31 0.83 - 1.80 069 Qualicum 60 1,760 0.91 13 428 309.72 1.38 0.56 - 2.20 070 Alberni 84 3,004 1.60 * 23 688 292.62 2.35 * 1.23 - 3.47 071 Courtenay 111 3,543 1.07 19 598 531.17 1.13 0.56 - 1.70 072 Campbell River 105 3,393 1.40 * 24 780 376.37 2.07 * 1.16 - 2.98 075 Mission 79 2,563 1.11 17 458 367.55 1.25 0.57 - 1.92 076 Agassiz - Harrison 24 810 1.57 4 140 84.22 1.66 0.00 - 3.39 077 Summerland 18 675 1.14 4 135 93.32 1.45 0.00 - 3.08 078 Enderby 14 490 1.20 3 128 65.81 1.94 0.00 - 4.26 080 Kitimat 20 685 0.92 3 53 111.35 0.48 0.00 - 1.05 081 Fort Nelson 16 705 1.59 3 88 71.78 1.23 0.00 - 2.64 083 Central Coast 7 233 2.13 1 18 16.03 1.12 0.00 - 3.26 084 Vancouver Island West 6 215 1.29 1 53 23.47 2.26 0.00 - 6.64 085 Vancouver Island North 43 1,512 1.67 * 8 295 136.86 2.16 0.59 - 3.72 087 Stikine 4 145 1.93 1 18 11.55 1.56 0.00 - 4.53 088 Terrace 52 1,727 1.22 8 160 212.35 0.75 0.10 - 1.41 092 Nisga’a 13 423 3.38 * - - 18.23 - - - - 094 Telegraph Creek 5 158 4.09 3 148 5.89 25.11 0.00 - 54.23 161 Vancouver - City Centre 215 6,433 0.88 27 838 1,235.72 0.68 * 0.40 - 0.96 162 Vancouver - Downtown E.side 328 10,155 2.92 * 53 1,608 522.07 3.08 * 2.17 - 3.99 163 Vancouver - North East 133 4,148 0.68 * 17 623 902.67 0.69 0.35 - 1.03 164 Vancouver - Westside 108 3,425 0.43 * 18 510 1,240.25 0.41 * 0.19 - 0.63 165 Vancouver - Midtown 120 4,165 0.74 * 16 420 814.26 0.52 * 0.24 - 0.79 166 Vancouver - South 154 5,202 0.67 * 21 678 1,169.98 0.58 * 0.31 - 0.85 201 Surrey 562 20,659 1.04 102 3,315 3,130.54 1.06 0.83 - 1.29 202 South Surrey/White Rock 79 2,538 0.65 * 20 750 634.74 1.18 0.63 - 1.74 PROVINCIAL TOTAL 7,474 249,887 1.00 1,236 38,954 38,953.50 1.00 0.94 - 1.06
PO
TE
NT
IAL
YE
AR
S O
F L
IFE
LO
ST
BY
LO
CA
L H
EA
LT
H A
RE
A
E
XT
ER
NE
L C
AU
SE
S O
F D
EA
TH
(A
GE
UN
DE
R 7
5 Y
EA
RS
), B
RIT
ISH
CO
LU
MB
IA,
2000
–200
4 A
ND
200
5T
able
36
Notes for this table follow the map.
94

D E A T H - R E L A T E D S T A T I S T I C S 95
Note: PYLLI - Potential Years of Life Lost Index. Refer to Figure 1 to clarify geographical location of Local Health Areas.
N
Statistically Significant
QUINTILE (PYLLI)
5 ( > 1.88)
2 (0.91 - 1.18)
1 ( < 0.91)
4 ( 1.40 - 1.88)
3 ( 1.18 - 1.40)
Inset 1
see inset 2
Inset 2
see inset 1
300 kms0 100 200
10 kms0
50 kms0
FIGURE 41EXTERNAL CAUSES OF DEATH BY LOCAL HEALTH AREA
(AGE UNDER 75 YEARS)BR I T I S H CO L U M B I A, 2000–2004
Notes to Table 36PYLL - Potential years of Life Lost denotes the total number of years of life lost from an established life expectancy (75 years).
PYLLSR - PYLL Standardized Rate per 1,000 standard population (Canada 1991 Census).* Statistical testing indicates that observed deaths are signifi cantly different from the ex-pected deaths (p<0.05, two tailed). + Denotes signifi cance based on less than fi ve deaths.
Total includes residents with unknown LHA.

96 D E A T H - R E L A T E D S T A T I S T I C S
Medically Treatable Diseases
A list of causes have been identifi ed where death could potentially have been avoided through appropriate medical intervention and treatment. The incidence of deaths from medically treatable diseases can be used by public health professionals as a way of monitoring the effect of health promotion programs. It should be noted that the causes are considered to have been medically treatable only if the death occurred to persons within specifi c age ranges. See Table 37 for a list of the causes and ages included in this category.
There were only 163 deaths due to these causes in 2005 which represents half of one percent (0.54 %) of all deaths in the province.
Table 37 indicates the number and percent of all medically treatable diseases by cause of death for 2005 and the fi ve-year period 2000-2004. Bacterial infections accounted for most of the male and female deaths due to medically treatable diseases in 2005 and the previous fi ve years (41.2% of male and 29.5% of female deaths due to medically treatable diseases in 2005 and 29.4% in 2000-2004). Two cause categories, hypertension and hypertensive diseases and pneumonia and unqualifi ed bronchitis, accounted for almost half the male (49.4%) and a third of the female (33.4%) deaths in 2005 due to medically treatable diseases.
Two time periods are detailed in Table 38 showing the incidence of deaths due to medically treatable diseases classifi ed by the Local Health Area in which the decedent lived and provincial totals. For the current year, 2005, the table shows the actual number of deaths observed in the LHA and the expected deaths based on the age adjusted provincial death rate. The SMR is the ratio of observed to expected deaths. The upper and lower limits of the 95% Confi dence Interval are an indication of the amount of variation in the SMR. A narrow confi dence interval generally indicates a larger population or a more common event than a wider confi dence interval. The column headed (p) indicates those LHAs where observed deaths were signifi cantly different from expected deaths. The observed deaths, SMR, and (p) are also shown for the fi ve years 2000-2004. See the Glossary for an explanation of Standardized Mortality Ratio (SMR) and the Methodology section for the precise calculation method. More information on Confi dence Intervals and Statistical Tests of Signifi cance for Ratios are also available in the Methodology section.
This analysis of deaths which were attributed to diseases considered treatable, and which therefore should not be fatal, is useful in assessing the use and availability of medical treatment. There were nine LHAs that had no deaths due to these conditions in 2000-2004 and 37 in 2005 as shown in Table 38. Further, there were only four LHAs in 2000-2004 that showed statistically signifi cant differences between observed and expected deaths and only one LHA with fi ve or more deaths that was statistically signifi cant in 2005.
Figure 42 shows the province divided up into its 89 Local Health Areas, with each area indicated as to whether its SMR for deaths due to medically treatable diseases was high or low on a fi ve category scale: dark green indicates the highest SMRs and dark grey indicates the lowest. As might be expected from a table containing such low incidence numbers, this map shows no obvious geographic pattern of location of the quintiles.

D E A T H - R E L A T E D S T A T I S T I C S 97
TABLE 37DEATHS DUE TO MEDICALLY TREATABLE DISEASES BY
SELECTED CAUSES AND GENDERBR I T I S H CO L U M B I A, 2000–2004 A N D 2005
2005 2000–2004 Male Female Total
Cause of Death ICD-10 Code(s) Number Percent Number Percent Number Percent Number Percent
Hypertension and I10-I15 133 18.8 22 25.9 13 16.7 35 21.5hypertensive diseasesPneumonia and unqualifi ed J12-J181, J188, 112 15.8 20 23.5 13 16.7 33 20.2bronchitis J189, J40Malignant neoplasm of cervix C53 151 21.3 - - 22 28.2 22 13.5Tuberculosis A15-A19, B90 14 2.0 2 2.4 2 0.0 4 2.5Asthma J45-J46 31 4.4 6 7.1 1 0.0 7 4.3Chronic rheumatic heart disease I05-I09 8 1.1 - - - - - -Acute respiratory infections J00-J06, J10-J11, 4 0.6 - - - - - -and infl uenza J20-22Bacterial Infections* A00-A05, ..., M871 208 29.4 35 41.2 23 29.5 58 35.6Hodgkin’s disease C81 14 2.0 - - 1 0.0 1 0.6Abdominal hernias, cholecystitis K35-K37, K40-K46, 32 4.5 - - 2 2.6 2 1.2 and cholelithiasis, appendicitis K80, K81Nutritional anemias D50-D53 1 0.1 - - 1 0.0 1 0.0TOTAL 708 100.0 85 100.0 78 100.0 163 100.0
Note: Medically Treatable Diseases based on Charlton’s defi nition (see Glossary). *ICD–10 codes A00–A05, A20–A49, B95–B96, G00, H66, H70, H95.0–H95.1, I00–I01, I02.0, I02.9, L01–L08, M00, M02.8–M02.9, M46.2,
M86, M87.1. Deaths due to medically treatable diseases exclude all deaths less than age 5 years old. Deaths due to medically treatable diseases also exclude - deaths aged 65 or more from hypertensive disease. - deaths aged 50 or more from pneumonia and unqualifi ed bronchitis. - deaths aged 65 or more from cervical cancer. - deaths aged 65 or more from tuberculosis. - deaths aged 50 or more from asthma. - deaths aged 45 or more from chronic rheumatic heart disease. - deaths aged 50 or more from acute respiratory infections and infl uenza. - deaths aged 65 or more from bacterial infections. - deaths aged 35 or more from Hodgkin's disease. - deaths aged 65 or more from abdominal hernias, cholecystitis and cholelithiasis, appendicitis. - deaths aged 65 or more from defi ciency nutritional anemias. Total percentage may not add up to 100 due to rounding. The output from ICD-10 mortality coding and underlying cause of death selection was modifi ed in British Columbia to refl ect the
intent of certifi ers in this jurisdiction and to provide greater continuity over time. Data using the standard ICD-10 rules for such categories as pneumonia/infl uenza, diabetes, or cancer should not be compared to the numbers shown above.

98 D E A T H - R E L A T E D S T A T I S T I C S
2000–2004 2005 Observed Observed Expected 95% Confi dence Interval
Local Health Area Deaths SMR (p) Deaths Deaths SMR (p) Lower Upper 001 Fernie 1 0.35 1 0.66 1.53 0.02 - 8.49 002 Cranbrook 7 1.57 - 1.01 - - - - 003 Kimberley - - 2 0.39 5.17 0.58 - 18.66 004 Windermere 2 1.16 - 0.43 - - - - 005 Creston 1 0.48 2 0.46 4.32 0.49 - 15.60 006 Kootenay Lake - - - 0.15 - - - - 007 Nelson - - 1 1.00 1.00 0.01 - 5.54 009 Castlegar 3 1.24 1 0.54 1.86 0.02 - 10.36 010 Arrow Lakes 2 2.13 - 0.21 - - - - 011 Trail 3 0.84 1 0.79 1.27 0.02 - 7.07 012 Grand Forks 1 0.62 - 0.37 - - - - 013 Kettle Valley - - - 0.15 - - - - 014 Southern Okanagan 4 1.29 1 0.76 1.32 0.02 - 7.37 015 Penticton 4 0.62 2 1.47 1.36 0.15 - 4.90 016 Keremeos 1 1.16 - 0.21 - - - - 017 Princeton 1 1.08 - 0.22 - - - - 018 Golden 2 1.52 2 0.31 6.50 0.73 - 23.47 019 Revelstoke 1 0.67 - 0.33 - - - - 020 Salmon Arm 7 1.24 2 1.32 1.51 0.17 - 5.46 021 Armstrong - Spallumcheen 1 0.58 - 0.39 - - - - 022 Vernon 9 0.89 4 2.33 1.72 0.46 - 4.40 023 Central Okanagan 23 0.88 6 6.18 0.97 0.35 - 2.11 024 Kamloops 19 1.04 6 4.12 1.46 0.53 - 3.17 025 100 Mile House 5 1.86 - 0.61 - - - - 026 North Thompson 1 1.12 - 0.21 - - - - 027 Cariboo - Chilcotin 4 0.81 3 1.11 2.70 0.54 - 7.88 028 Quesnel 5 1.13 - 0.99 - - - - 029 Lillooet 2 2.62 2 0.17 11.99 + 1.35 - 43.30 030 South Cariboo 1 0.74 2 0.31 6.43 0.72 - 23.23 031 Merritt 4 2.12 1 0.42 2.40 0.03 - 13.33 032 Hope 3 2.01 - 0.35 - - - - 033 Chilliwack 13 1.13 2 2.71 0.74 0.08 - 2.67 034 Abbotsford 20 1.06 1 4.39 0.23 0.00 - 1.27 035 Langley 19 0.95 5 4.84 1.03 0.33 - 2.41 037 Delta 14 0.77 8 4.16 1.92 0.83 - 3.79 038 Richmond 18 0.57 * 5 7.04 0.71 0.23 - 1.66 040 New Westminster 17 1.65 1 2.38 0.42 0.01 - 2.33 041 Burnaby 34 0.97 5 7.88 0.63 0.20 - 1.48 042 Maple Ridge 14 1.00 5 3.41 1.47 0.47 - 3.42 043 Coquitlam 19 0.53 * 4 8.44 0.47 0.13 - 1.21 044 North Vancouver 20 0.81 3 5.65 0.53 0.11 - 1.55 045 West Vancouver-Bowen Is. 7 0.74 1 2.20 0.45 0.01 - 2.53 046 Sunshine Coast 7 1.47 - 1.12 - - - - 047 Powell River 8 2.18 1 0.85 1.17 0.02 - 6.52 048 Howe Sound 6 1.16 - 1.22 - - - - 049 Bella Coola Valley 2 3.68 - 0.12 - - - - 050 Queen Charlotte 1 1.07 - 0.22 - - - - 051 Snow Country - - - 0.03 - - - - 052 Prince Rupert 3 1.16 2 0.58 3.44 0.39 - 12.40 053 Upper Skeena - - - 0.19 - - - - 054 Smithers 2 0.68 2 0.65 3.08 0.35 - 11.11 055 Burns Lake 1 0.78 1 0.29 3.43 0.04 - 19.06 056 Nechako 5 1.84 - 0.61 - - - - 057 Prince George 25 1.46 5 3.81 1.31 0.42 - 3.06 059 Peace River South 8 1.86 2 1.02 1.97 0.22 - 7.10 060 Peace River North 8 1.63 1 1.18 0.85 0.01 - 4.71 061 Greater Victoria 32 0.90 6 8.16 0.74 0.27 - 1.60 062 Sooke 10 1.01 4 2.42 1.65 0.44 - 4.23 063 Saanich 8 0.72 2 2.60 0.77 0.09 - 2.78 064 Gulf Islands 1 0.37 - 0.65 - - - - 065 Cowichan 7 0.77 1 2.09 0.48 0.01 - 2.66 066 Lake Cowichan 1 0.92 1 0.24 4.08 0.05 - 22.72 067 Ladysmith 2 0.70 - 0.68 - - - - 068 Nanaimo 16 0.99 6 3.75 1.60 0.58 - 3.48 069 Qualicum 3 0.44 - 1.60 - - - - 070 Alberni 6 1.07 - 1.27 - - - - 071 Courtenay 8 0.77 2 2.41 0.83 0.09 - 2.99 072 Campbell River 9 1.25 1 1.65 0.61 0.01 - 3.38 075 Mission 5 0.79 - 1.49 - - - - 076 Agassiz - Harrison 2 1.45 - 0.33 - - - - 077 Summerland 1 0.52 - 0.44 - - - - 078 Enderby 2 1.60 - 0.29 - - - - 080 Kitimat 1 0.50 - 0.44 - - - - 081 Fort Nelson 1 1.06 - 0.22 - - - - 083 Central Coast 1 3.68 - 0.06 - - - - 084 Vancouver Island West - - - 0.07 - - - - 085 Vancouver Island North 6 2.46 - 0.54 - - - - 087 Stikine 1 4.21 - 0.06 - - - - 088 Terrace 6 1.69 2 0.79 2.53 0.28 - 9.15 092 Nisga’a - - - 0.06 - - - - 094 Telegraph Creek - - - 0.02 - - - - 161 Vancouver - City Centre 26 1.51 6 3.92 1.53 0.56 - 3.33 162 Van. - Downtown E.side 33 3.57 * 14 2.11 6.63 * 3.62 - 11.13 163 Vancouver - North East 20 1.23 4 3.59 1.11 0.30 - 2.85 164 Vancouver - Westside 8 0.39 * 4 4.45 0.90 0.24 - 2.30 165 Vancouver - Midtown 8 0.53 1 3.40 0.29 0.00 - 1.64 166 Vancouver - South 21 0.98 1 4.75 0.21 0.00 - 1.17 201 Surrey 63 1.22 12 12.22 0.98 0.51 - 1.72 202 South Surrey/White Rock 11 0.81 3 3.29 0.91 0.18 - 2.67 PROVINCIAL TOTAL 708 1.00 163 163.00 1.00 0.85 - 1.17
ST
AN
DA
RD
IZE
D M
OR
TA
LIT
Y R
AT
IO B
Y L
OC
AL
HE
AL
TH
AR
EA
DE
AT
HS
DU
E T
O
ME
DIC
AL
LY
TR
EA
TA
BL
E D
ISE
AS
ES
, B
RIT
ISH
CO
LU
MB
IA,
2000
–200
4 A
ND
200
5T
able
38
Note: Medically Treatable Diseases based on Charlton’s defi nition (see glossary - Medically Treatable Diseases). *Statistical testing indicates that observed deaths are signifi cantly different from the expected deaths (p<0.05, two tailed). +Denotes signifi cance based on less than fi ve deaths. SMR - Standardized Mortality Ratio. Total includes residents with unknown LHA.

D E A T H - R E L A T E D S T A T I S T I C S 99
Note: SMR - Standardized Mortality Ratio. Refer to Figure 1 to clarify geographical location of Local Health Areas.
N
Statistically Significant
QUINTILE (SMR)
5 ( > 1.52)
2 (0.57 - 0.83)
1 ( < 0.57)
4 ( 1.10 - 1.52)
3 ( 0.83 - 1.10)
Inset 1
see inset 2
Inset 2
see inset 1
10 kms0
50 kms0
300 kms0 100 200
FIGURE 42DEATHS DUE TO MEDICALLY TREATABLE DISEASES
BY LOCAL HEALTH AREABR I T I S H CO L U M B I A, 2000–2004
100 D E A T H - R E L A T E D S T A T I S T I C S
Alcohol-Related Deaths
Alcohol-related deaths provide information on deaths due to alcohol (directly related) as well as those where alcohol was a contributing factor (indirectly related). Alcohol-related and drug overdose deaths are the only cause of death categories that are not based entirely upon the underlying causes of death. See the Glossary for a further explanation of alcohol-related deaths and Table 39 for the list of causes used for deaths directly due to alcohol.
Table 39 shows the number and percent of deaths that were directly and indirectly related to alcohol in 2005 and in the fi ve preceding years. One in fi ve (19.3%) of the 1,878 deaths related to alcohol in 2005 were directly attributable to alcohol (362 deaths). Alcohol was a contributing factor in the remaining 80.7% of these deaths. The table indicates that most of the deaths directly attributable to alcohol were caused by liver disease. The percents attributed to each cause in 2005 were quite consistent with those in the previous fi ve years.
The 1,878 alcohol-related deaths represented 6.3% of all deaths in British Columbia in 2005, a decrease from 6.6% in the previous fi ve years (see Table 39). On the other hand, 362 of those deaths (1.2% of all deaths) were directly related to alcohol which was the same percentage as in the previous fi ve years. Figure 43 graphically shows the pattern of alcohol-related deaths by cause.
Table 40 shows numbers and percentages of alcohol-related deaths by age group for males, females, and the total population. All alcohol-related deaths, whether directly or indirectly related to alcohol (see Table 39), are included in this table. Details of the causes of these deaths are shown in the Glossary under Alcohol-Related Deaths.
Alcohol-related deaths constitute 6.3% of all deaths in 2005 and 9.3% of all male deaths (see Table 40). Males died of such causes three times more frequently as women in 2005.
Approaching half (44.3%) of all alcohol deaths were of seniors (65 or older); 38.9% were people between the ages of 45 and 64 as shown in Table 40.
The number of deaths directly and indirectly related to alcohol are shown for each of the Local Health Areas in Table 41 as well as the number that would be expected according to the age- and gender-specifi c death rates in the whole province. The SMR is the ratio of the observed to the expected deaths and indicates the degree to which the number of deaths in the LHA is above or below the expected number. The (p) columns indicate those LHAs where the observed number of deaths was statistically different from the expected numbers. See Standardized Mortality Ratio in the Glossary for a further explanation and the Methodology section for the precise calculation method. The 95% Confi dence Interval columns provide an indication of the variability of the SMR. A wide confi dence interval indicates that the statistic is likely to fall within a wide range of values, while a narrow confi dence interval indicates the statistic is likely to fall within a narrow range of values. In general, statistical confi dence intervals will be wider for areas with small populations or rare events than for areas with larger populations or more common events.
There were 12 LHAs with at least fi ve deaths where the observed values were statistically signifi cant and above the expected values in both 2000-2004 and 2005 as shown in Table 41. There were 11 LHAs with SMRs that were statistically signifi cant and low in both time periods. The map in Figure 44 shows the SMR quintiles and statistical signifi cance patterns in each LHA during 2000-2004.

D E A T H - R E L A T E D S T A T I S T I C S 101
TABLE 39ALCOHOL-RELATED DEATHS BY CAUSE
BR I T I S H CO L U M B I A, 2000–2004 A N D 2005
Year of Death 2000–2004 2005
Cause of Death ICD-10 Code(s) Number Percent Number Percent
Directly Related to AlcoholAlcohol intoxication F100 228 2.4 39 2.1Alcoholic psychoses and dependence F101-F109 428 4.5 108 5.8Alcoholic neurological disorders G312, G621, G721 - - - -Alcoholic cardiomyopathy I426 86 0.9 17 0.9Alcoholic gastritis K292 5 0.1 3 0.2Alcoholic liver disease K70 858 9.0 180 9.6Alcohol induced chronic pancreatitis K860 16 0.2 3 0.2Alcohol poisoning X45, X65 82 0.9 12 0.6Other alcohol causes E244, O354, O993, - - - - P043, Q860, R780 T510-T512, T519
SUBTOTAL 1,703 17.9 362 19.3Indirectly Related to Alcohol1
Certain infectious and A00-B99 234 2.5 67 3.6parasitic diseasesNeoplasms C00-D48 1,207 12.7 235 12.5Endocrine/Nutritional/Metabolic E00-E243, E248-E89 266 2.8 60 3.2Mental disorders F00-F09, F11-F99 105 1.1 28 1.5Neurological diseases G00-G311, G318- 124 1.3 18 1.0 G620, G622-G720, G722-G99Circulatory I00-I425, I427-I99 2,214 23.3 407 21.7Diseases of the respiratory system J00-J98 665 7.0 107 5.7Digestive system diseases K00-K291, K293-K69, 637 6.7 124 6.6 K71-K85, K861-K92Urinary system diseases N00-N39, N990, 105 1.1 12 0.6 N991, N995 Unintentional injury V01-X44, X46-X59, 1,377 14.5 248 13.2 Y40-Y86, Y88Suicide X60-X64, X66-X84, 586 6.2 101 5.4 Y87Homicide X85-Y09, Y871 59 0.6 4 0.2All other causes 214 2.3 105 5.6
SUBTOTAL 7,793 82.1 1,516 80.7TOTAL 9,496 100.0 1,878 100.0
Note: 1ICD-10 codes for indirectly related to alcohol exclude the codes for directly related to alcohol and will not match the list of codes used for these categories in other tables.
Total percentage may not add up to 100 due to rounding. Non-residents are excluded. Coding practices from 1995 to 1999 may have produced over-counting of alcohol-related mortality. With the introduction of ICD-10
in 2000, more specifi c codes are available. Currently produced data should not be used in combination with data produced prior to 2000.
The output from ICD-10 mortality coding and underlying cause of death selection was modifi ed in British Columbia to refl ect the intent of certifi ers in this jurisdiction and to provide greater continuity over time. Data using the standard ICD-10 rules for such categories as pneumonia/infl uenza, diabetes, or cancer should not be compared to the numbers shown above.
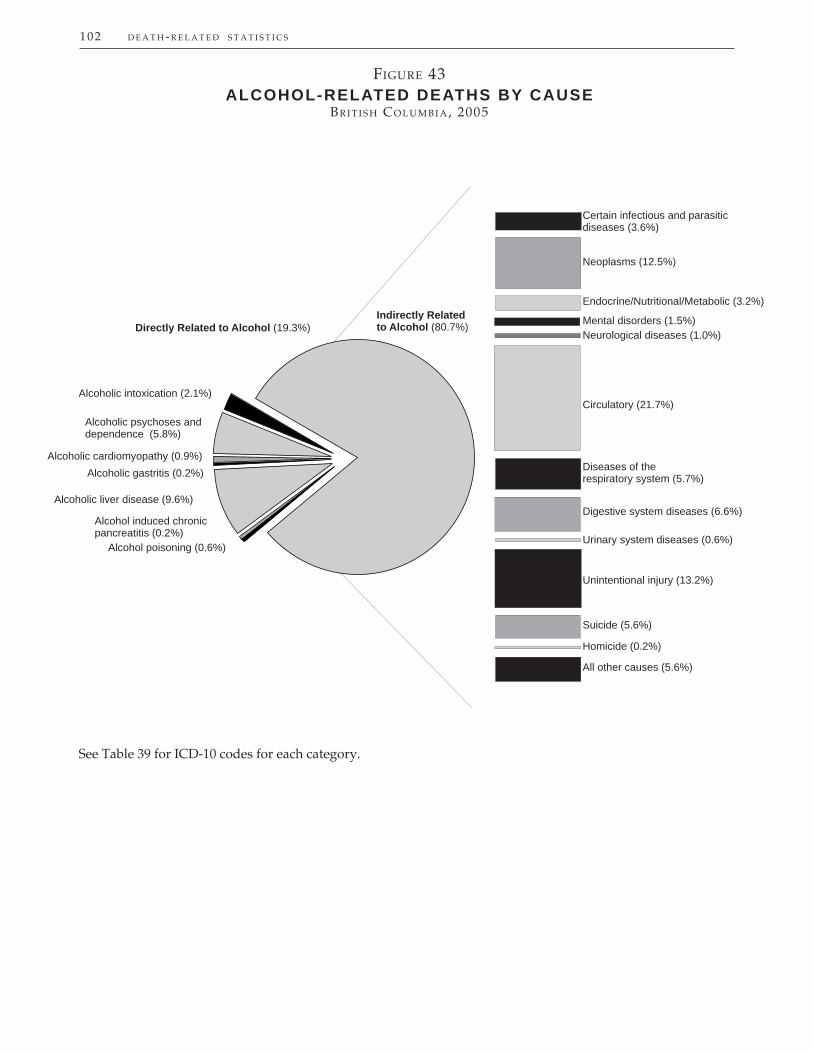
102 D E A T H - R E L A T E D S T A T I S T I C S
FIGURE 43ALCOHOL-RELATED DEATHS BY CAUSE
BR I T I S H CO L U M B I A, 2005
See Table 39 for ICD-10 codes for each category.
Directly Related to Alcohol (19.3%)
Alcoholic intoxication (2.1%)
Alcoholic psychoses anddependence (5.8%)
Alcoholic cardiomyopathy (0.9%)Alcoholic gastritis (0.2%)
Alcoholic liver disease (9.6%)
Alcohol induced chronic pancreatitis (0.2%)
Indirectly Relatedto Alcohol (80.7%)
Certain infectious and parasiticdiseases (3.6%)
Neoplasms (12.5%)
Endocrine/Nutritional/Metabolic (3.2%)
Mental disorders (1.5%)Neurological diseases (1.0%)
Circulatory (21.7%)
Diseases of therespiratory system (5.7%)
Digestive system diseases (6.6%)
Urinary system diseases (0.6%)
Unintentional injury (13.2%)
Suicide (5.6%)
Homicide (0.2%)
All other causes (5.6%)
Alcohol poisoning (0.6%)

D E A T H - R E L A T E D S T A T I S T I C S 103
Note: Alcohol-related deaths – see Table 39 for ICD-10 codes and Glossary for more details. Total percentage may not add up to 100 due to rounding. Non-residents are excluded. Coding practices from 1995 to 1999 may have produced over-counting of alcohol-related mortality. With the introduction of ICD-10 in 2000, more specifi c codes are available. Currently produced data should not be used in combination with data produced prior to 2000.
TABLE 40ALCOHOL-RELATED DEATHS BY AGE AND GENDER
BR I T I S H CO L U M B I A, 2005
Male Female Total Age Number Percent Number Percent Number Percent
<15 - - - - - - 15-19 15 1.0 4 0.9 19 1.0 20-24 29 2.0 10 2.2 39 2.1 25-44 197 13.8 61 13.7 258 13.7 45-64 560 39.1 170 38.1 730 38.9 65-84 551 38.5 164 36.8 715 38.1 85+ 80 5.6 37 8.3 117 6.2 TOTAL 1,432 100.0 446 100.0 1,878 100.0

104 D E A T H - R E L A T E D S T A T I S T I C S 2000–2004 2005 Observed Observed Expected 95% Confi dence Interval
Local Health Area Deaths SMR (p) Deaths Deaths SMR (p) Lower Upper 001 Fernie 41 1.24 7 6.62 1.06 0.42 - 2.18 002 Cranbrook 82 1.39 * 19 11.67 1.63 0.98 - 2.54 003 Kimberley 39 1.56 * 7 4.85 1.44 0.58 - 2.98 004 Windermere 21 0.94 5 4.65 1.07 0.35 - 2.51 005 Creston 50 1.28 10 7.27 1.38 0.66 - 2.53 006 Kootenay Lake 16 1.60 3 1.94 1.55 0.31 - 4.52 007 Nelson 84 1.40 * 17 11.61 1.46 0.85 - 2.34 009 Castlegar 48 1.43 * 6 6.50 0.92 0.34 - 2.01 010 Arrow Lakes 26 1.81 * 4 2.77 1.45 0.39 - 3.70 011 Trail 91 1.67 * 18 10.29 1.75 * 1.04 - 2.76 012 Grand Forks 28 1.02 8 5.22 1.53 0.66 - 3.02 013 Kettle Valley 11 1.04 2 2.04 0.98 0.11 - 3.53 014 Southern Okanagan 92 1.36 * 31 13.00 2.38 * 1.62 - 3.38 015 Penticton 151 1.23 * 27 23.37 1.16 0.76 - 1.68 016 Keremeos 20 1.15 5 3.41 1.46 0.47 - 3.42 017 Princeton 23 1.48 3 3.08 0.97 0.20 - 2.85 018 Golden 16 1.04 6 3.09 1.94 0.71 - 4.23 019 Revelstoke 23 1.22 2 3.70 0.54 0.06 - 1.95 020 Salmon Arm 111 1.21 18 18.02 1.00 0.59 - 1.58 021 Armstrong - Spallumcheen 22 0.89 6 4.98 1.21 0.44 - 2.62 022 Vernon 181 1.15 37 30.91 1.20 0.84 - 1.65 023 Central Okanagan 411 1.00 88 81.75 1.08 0.86 - 1.33 024 Kamloops 299 1.24 * 65 47.76 1.36 * 1.05 - 1.73 025 100 Mile House 52 1.33 11 7.71 1.43 0.71 - 2.55 026 North Thompson 14 1.28 2 2.26 0.88 0.10 - 3.19 027 Cariboo - Chilcotin 111 1.95 * 19 11.53 1.65 0.99 - 2.57 028 Quesnel 73 1.33 * 7 10.87 0.64 0.26 - 1.33 029 Lillooet 36 3.56 * 4 2.00 2.00 0.54 - 5.11 030 South Cariboo 55 2.69 * 6 4.03 1.49 0.54 - 3.24 031 Merritt 48 1.89 * 9 5.01 1.80 0.82 - 3.41 032 Hope 38 1.61 * 7 4.69 1.49 0.60 - 3.08 033 Chilliwack 164 0.94 30 34.62 0.87 0.58 - 1.24 034 Abbotsford 175 0.66 * 32 52.11 0.61 * 0.42 - 0.87 035 Langley 164 0.64 * 41 52.54 0.78 0.56 - 1.06 037 Delta 138 0.63 * 29 43.01 0.67 * 0.45 - 0.97 038 Richmond 178 0.46 * 29 78.04 0.37 * 0.25 - 0.53 040 New Westminster 166 1.24 * 35 25.59 1.37 0.95 - 1.90 041 Burnaby 348 0.76 * 62 90.22 0.69 * 0.53 - 0.88 042 Maple Ridge 162 0.97 41 34.33 1.19 0.86 - 1.62 043 Coquitlam 268 0.69 * 53 80.73 0.66 * 0.49 - 0.86 044 North Vancouver 220 0.73 * 27 59.63 0.45 * 0.30 - 0.66 045 West Vancouver-Bowen Is. 84 0.55 * 21 29.24 0.72 0.44 - 1.10 046 Sunshine Coast 73 0.97 16 15.00 1.07 0.61 - 1.73 047 Powell River 82 1.49 * 20 10.76 1.86 * 1.14 - 2.87 048 Howe Sound 59 1.12 9 10.97 0.82 0.37 - 1.56 049 Bella Coola Valley 18 2.78 * 6 1.28 4.68 * 1.71 - 10.18 050 Queen Charlotte 23 2.26 * 3 2.08 1.44 0.29 - 4.21 051 Snow Country 4 2.43 - 0.33 - - - - 052 Prince Rupert 71 2.38 * 13 5.85 2.22 * 1.18 - 3.80 053 Upper Skeena 29 2.92 * 5 2.02 2.48 0.80 - 5.79 054 Smithers 34 1.07 3 6.37 0.47 0.09 - 1.38 055 Burns Lake 25 1.52 8 3.27 2.44 * 1.05 - 4.81 056 Nechako 58 1.80 * 12 6.51 1.84 0.95 - 3.22 057 Prince George 243 1.30 * 38 37.28 1.02 0.72 - 1.40 059 Peace River South 84 1.61 * 21 10.63 1.98 * 1.22 - 3.02 060 Peace River North 61 1.16 21 10.95 1.92 * 1.19 - 2.93 061 Greater Victoria 631 1.16 * 126 103.10 1.22 * 1.02 - 1.46 062 Sooke 122 1.05 30 23.85 1.26 0.85 - 1.80 063 Saanich 119 0.62 * 19 37.28 0.51 * 0.31 - 0.80 064 Gulf Islands 47 0.98 6 9.32 0.64 0.24 - 1.40 065 Cowichan 141 1.05 31 26.56 1.17 0.79 - 1.66 066 Lake Cowichan 28 1.76 * 4 3.15 1.27 0.34 - 3.25 067 Ladysmith 71 1.50 * 12 9.34 1.29 0.66 - 2.25 068 Nanaimo 272 1.15 * 55 47.32 1.16 0.88 - 1.51 069 Qualicum 95 0.70 * 24 26.68 0.90 0.58 - 1.34 070 Alberni 138 1.78 * 31 15.28 2.03 * 1.38 - 2.88 071 Courtenay 174 1.17 53 29.87 1.77 * 1.33 - 2.32 072 Campbell River 148 1.66 * 27 18.02 1.50 0.99 - 2.18 075 Mission 65 0.83 21 15.89 1.32 0.82 - 2.02 076 Agassiz - Harrison 23 1.12 2 4.24 0.47 0.05 - 1.70 077 Summerland 23 0.61 * 4 7.12 0.56 0.15 - 1.44 078 Enderby 24 1.24 4 3.86 1.04 0.28 - 2.65 080 Kitimat 24 1.06 5 4.46 1.12 0.36 - 2.61 081 Fort Nelson 13 1.54 1 1.80 0.56 0.01 - 3.09 083 Central Coast 18 5.65 * 5 0.63 7.97 * 2.57 - 18.60 084 Vancouver Island West 11 2.65 * 1 0.75 1.32 0.02 - 7.37 085 Vancouver Island North 54 2.08 * 14 5.18 2.70 * 1.48 - 4.53 087 Stikine 4 1.51 1 0.54 1.86 0.02 - 10.33 088 Terrace 58 1.43 * 14 8.06 1.74 0.95 - 2.91 092 Nisga’a 15 4.71 * 1 0.64 1.57 0.02 - 8.75 094 Telegraph Creek 10 9.40 * 2 0.21 9.31 + 1.05 - 33.62 161 Vancouver - City Centre 268 1.31 * 37 40.90 0.90 0.64 - 1.25 162 Vancouver - Downtown E.side 417 3.18 * 79 25.05 3.15 * 2.50 - 3.93 163 Vancouver - North East 170 0.78 * 23 42.81 0.54 * 0.34 - 0.81 164 Vancouver - Westside 126 0.47 * 21 51.51 0.41 * 0.25 - 0.62 165 Vancouver - Midtown 159 0.87 25 35.21 0.71 0.46 - 1.05 166 Vancouver - South 173 0.60 * 26 57.12 0.46 * 0.30 - 0.67 201 Surrey 481 0.82 * 110 118.41 0.93 0.76 - 1.12 202 South Surrey/White Rock 126 0.56 * 27 43.87 0.62 * 0.41 - 0.90 PROVINCIAL TOTAL 9,496 1.00 1,878 1,878.00 1.00 0.96 - 1.05
ST
AN
DA
RD
IZE
D M
OR
TA
LIT
Y R
AT
IO B
Y L
OC
AL
HE
AL
TH
AR
EA
AL
CO
HO
L-R
EL
AT
ED
DE
AT
HS
,
BR
ITIS
H C
OL
UM
BIA
, 20
00–2
004
AN
D 2
005
Tab
le41
Notes for this table follow the map.
104
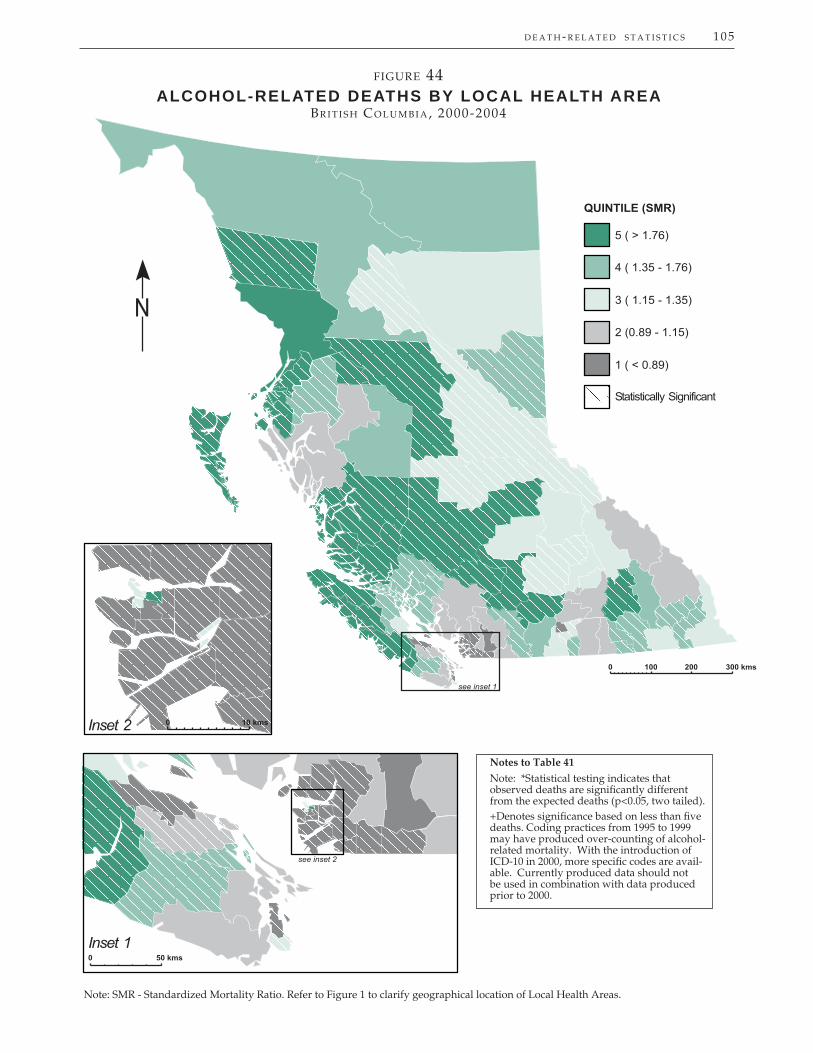
D E A T H - R E L A T E D S T A T I S T I C S 105
Note: SMR - Standardized Mortality Ratio. Refer to Figure 1 to clarify geographical location of Local Health Areas.
N
Statistically Significant
QUINTILE (SMR)
5 ( > 1.76)
2 (0.89 - 1.15)
1 ( < 0.89)
4 ( 1.35 - 1.76)
3 ( 1.15 - 1.35)
Inset 1
see inset 2
Inset 2
see inset 1
50 kms0
10 kms0
300 kms0 100 200
FIGURE 44ALCOHOL-RELATED DEATHS BY LOCAL HEALTH AREA
BR I T I S H CO L U M B I A, 2000-2004
Notes to Table 41
Note: *Statistical testing indicates that observed deaths are signifi cantly different from the expected deaths (p<0.05, two tailed). +Denotes signifi cance based on less than fi ve deaths. Coding practices from 1995 to 1999 may have produced over-counting of alcohol-related mortality. With the introduction of ICD-10 in 2000, more specifi c codes are avail-able. Currently produced data should not be used in combination with data produced prior to 2000.
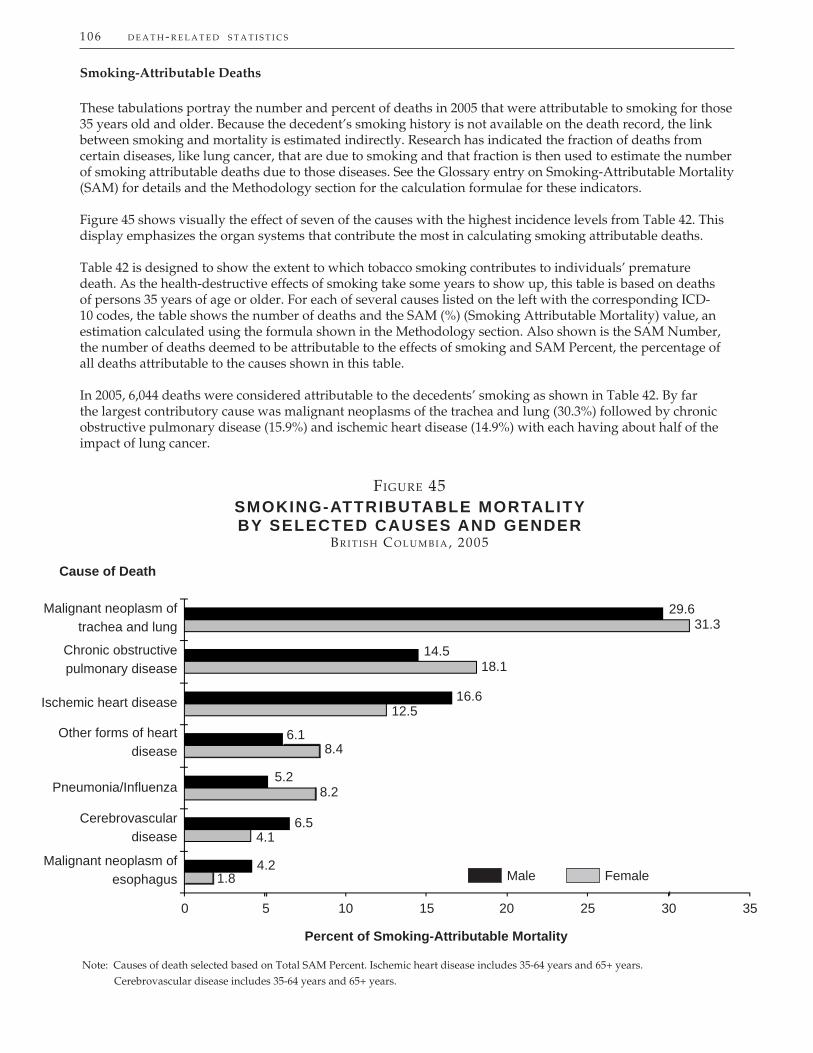
106 D E A T H - R E L A T E D S T A T I S T I C S
Smoking-Attributable Deaths
These tabulations portray the number and percent of deaths in 2005 that were attributable to smoking for those 35 years old and older. Because the decedent’s smoking history is not available on the death record, the link between smoking and mortality is estimated indirectly. Research has indicated the fraction of deaths from certain diseases, like lung cancer, that are due to smoking and that fraction is then used to estimate the number of smoking attributable deaths due to those diseases. See the Glossary entry on Smoking-Attributable Mortality (SAM) for details and the Methodology section for the calculation formulae for these indicators.
Figure 45 shows visually the effect of seven of the causes with the highest incidence levels from Table 42. This display emphasizes the organ systems that contribute the most in calculating smoking attributable deaths.
Table 42 is designed to show the extent to which tobacco smoking contributes to individuals’ premature death. As the health-destructive effects of smoking take some years to show up, this table is based on deaths of persons 35 years of age or older. For each of several causes listed on the left with the corresponding ICD-10 codes, the table shows the number of deaths and the SAM (%) (Smoking Attributable Mortality) value, an estimation calculated using the formula shown in the Methodology section. Also shown is the SAM Number, the number of deaths deemed to be attributable to the effects of smoking and SAM Percent, the percentage of all deaths attributable to the causes shown in this table.
In 2005, 6,044 deaths were considered attributable to the decedents’ smoking as shown in Table 42. By far the largest contributory cause was malignant neoplasms of the trachea and lung (30.3%) followed by chronic obstructive pulmonary disease (15.9%) and ischemic heart disease (14.9%) with each having about half of the impact of lung cancer.
FIGURE 45SMOKING-ATTRIBUTABLE MORTALITYBY SELECTED CAUSES AND GENDER
BR I T I S H CO L U M B I A, 2005
Note: Causes of death selected based on Total SAM Percent. Ischemic heart disease includes 35-64 years and 65+ years. Cerebrovascular disease includes 35-64 years and 65+ years.
Male Female
Cause of Death
Percent of Smoking-Attributable Mortality
Malignant neoplasm oftrachea and lung
Chronic obstructivepulmonary disease
Ischemic heart disease
Other forms of heart disease
Pneumonia/Infl uenza
Cerebrovasculardisease
Malignant neoplasm ofesophagus
0 5 10 15 20 25 30 35
29.631.3
14.518.1
16.612.5
6.18.4
5.28.2
6.54.1
4.21.8
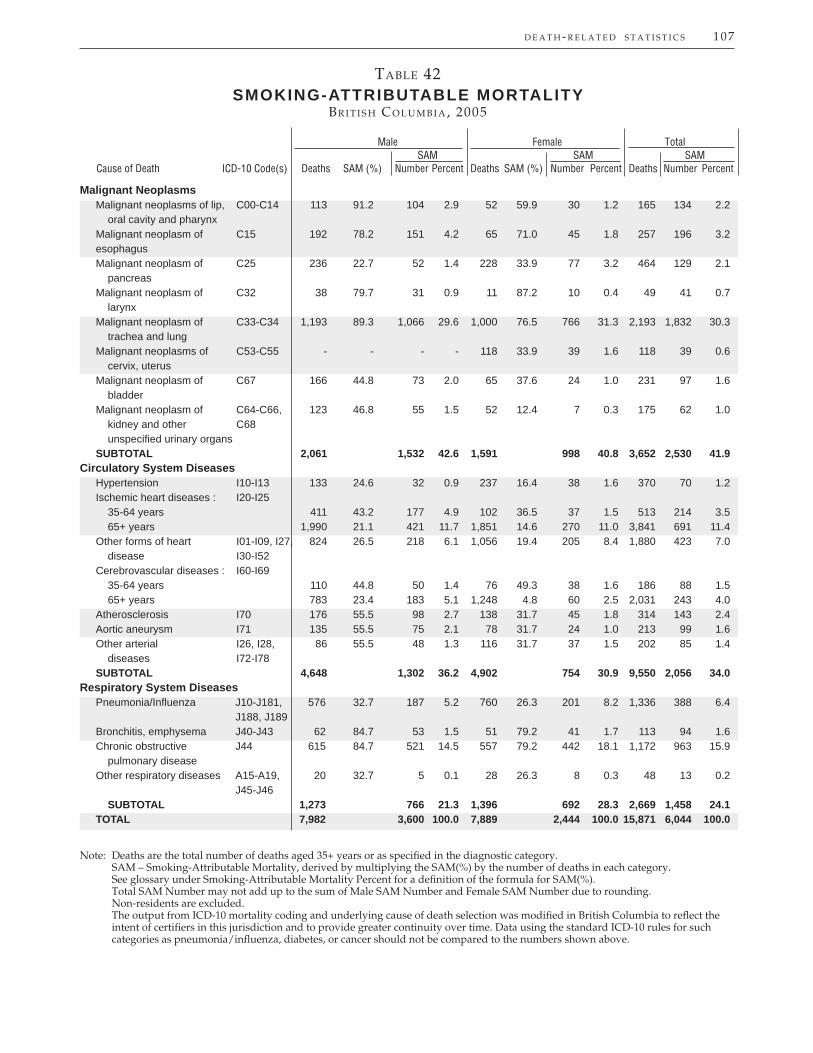
D E A T H - R E L A T E D S T A T I S T I C S 107
TABLE 42SMOKING-ATTRIBUTABLE MORTALITY
BR I T I S H CO L U M B I A, 2005
Male Female Total SAM SAM SAMCause of Death ICD-10 Code(s) Deaths SAM (%) Number Percent Deaths SAM (%) Number Percent Deaths Number Percent
Malignant NeoplasmsMalignant neoplasms of lip, C00-C14 113 91.2 104 2.9 52 59.9 30 1.2 165 134 2.2 oral cavity and pharynxMalignant neoplasm of C15 192 78.2 151 4.2 65 71.0 45 1.8 257 196 3.2 esophagusMalignant neoplasm of C25 236 22.7 52 1.4 228 33.9 77 3.2 464 129 2.1 pancreas Malignant neoplasm of C32 38 79.7 31 0.9 11 87.2 10 0.4 49 41 0.7 larynx Malignant neoplasm of C33-C34 1,193 89.3 1,066 29.6 1,000 76.5 766 31.3 2,193 1,832 30.3 trachea and lung Malignant neoplasms of C53-C55 - - - - 118 33.9 39 1.6 118 39 0.6 cervix, uterus Malignant neoplasm of C67 166 44.8 73 2.0 65 37.6 24 1.0 231 97 1.6 bladder Malignant neoplasm of C64-C66, 123 46.8 55 1.5 52 12.4 7 0.3 175 62 1.0 kidney and other C68 unspecifi ed urinary organsSUBTOTAL 2,061 1,532 42.6 1,591 998 40.8 3,652 2,530 41.9
Circulatory System DiseasesHypertension I10-I13 133 24.6 32 0.9 237 16.4 38 1.6 370 70 1.2Ischemic heart diseases : I20-I25 35-64 years 411 43.2 177 4.9 102 36.5 37 1.5 513 214 3.5 65+ years 1,990 21.1 421 11.7 1,851 14.6 270 11.0 3,841 691 11.4Other forms of heart I01-I09, I27, 824 26.5 218 6.1 1,056 19.4 205 8.4 1,880 423 7.0 disease I30-I52Cerebrovascular diseases : I60-I69 35-64 years 110 44.8 50 1.4 76 49.3 38 1.6 186 88 1.5 65+ years 783 23.4 183 5.1 1,248 4.8 60 2.5 2,031 243 4.0Atherosclerosis I70 176 55.5 98 2.7 138 31.7 45 1.8 314 143 2.4Aortic aneurysm I71 135 55.5 75 2.1 78 31.7 24 1.0 213 99 1.6Other arterial I26, I28, 86 55.5 48 1.3 116 31.7 37 1.5 202 85 1.4 diseases I72-I78SUBTOTAL 4,648 1,302 36.2 4,902 754 30.9 9,550 2,056 34.0
Respiratory System DiseasesPneumonia/Infl uenza J10-J181, 576 32.7 187 5.2 760 26.3 201 8.2 1,336 388 6.4 J188, J189Bronchitis, emphysema J40-J43 62 84.7 53 1.5 51 79.2 41 1.7 113 94 1.6Chronic obstructive J44 615 84.7 521 14.5 557 79.2 442 18.1 1,172 963 15.9 pulmonary diseaseOther respiratory diseases A15-A19, 20 32.7 5 0.1 28 26.3 8 0.3 48 13 0.2 J45-J46 SUBTOTAL 1,273 766 21.3 1,396 692 28.3 2,669 1,458 24.1TOTAL 7,982 3,600 100.0 7,889 2,444 100.0 15,871 6,044 100.0
Note: Deaths are the total number of deaths aged 35+ years or as specifi ed in the diagnostic category. SAM – Smoking-Attributable Mortality, derived by multiplying the SAM(%) by the number of deaths in each category. See glossary under Smoking-Attributable Mortality Percent for a defi nition of the formula for SAM(%). Total SAM Number may not add up to the sum of Male SAM Number and Female SAM Number due to rounding. Non-residents are excluded. The output from ICD-10 mortality coding and underlying cause of death selection was modifi ed in British Columbia to refl ect the
intent of certifi ers in this jurisdiction and to provide greater continuity over time. Data using the standard ICD-10 rules for such categories as pneumonia/infl uenza, diabetes, or cancer should not be compared to the numbers shown above.

108 D E A T H - R E L A T E D S T A T I S T I C S
Drug-Induced Deaths
Drug-induced deaths are all deaths directly due to drug use, and include illicit and prescribed drugs. This category excludes causes indirectly related to drug use. See Table 44 for a list of the causes associated with these deaths but they do not include those due to alcohol or smoking.
It is immediately apparent in Table 43 that males (229 deaths) were twice as susceptible to drug-induced causes compared to females (113 deaths). Also, they were centred among residents aged 25-44 (46.5%) and those aged 45-64 (40.1%), although drug-induced deaths appeared in every age group. Note that, compared to the two age groups with the highest fatalities, the percentages of progressively decreased in younger and older age groups not only overall but for males and females as well.
Table 44 shows the incidence, for 2000-2004 and 2005, of drug-induced deaths by cause. Two thirds (66.7%) of those deaths in 2005 and in 2000-2004 (66.0%) were the result of unintentional poisoning (called accidental poisoning in ICD-10). Of the 403 suicide deaths in B.C. in 2005 (see Table 30), about one in fi ve (19.4%) were drug-induced.
Figure 46 makes the results in Table 44 more dramatic by visual display. Clearly, drug-induced deaths are almost all due to poisoning, suicide, and non-medical use of drugs.
Table 45 shows the number of observed and expected drug-induced deaths and the ratio of observed to expected deaths (SMR) in each Local Health Area in 2005 and in the previous fi ve years. The calculation method for Standardized Mortality Ratio (SMR) appears in the Methodology section, supplemented by the defi nition in the Glossary. Notice that 32 LHAs had no deaths due to drugs in 2005 and nine had no drug-induced deaths in 2000-2004. New Westminster and Vancouver - Downtown Eastside were the only LHAs where the observed number was statistically signifi cant and higher than the expected number (SMR ratio) in 2005 and the previous fi ve years.
Figure 47 provides an immediately visible pattern of the variation of SMRs in the LHAs divided into quintiles. The map shows SMR quintiles for 2000-2004 because the low 2005 frequencies in the LHAs would be susceptible to variation.
TABLE 43DRUG– INDUCED DEATHS BY AGE AND GENDER
BR I T I S H CO L U M B I A, 2005
Male Female TotalAge Number Percent Number Percent Number Percent
<15 1 0.4 - - 1 0.3
15-19 2 0.9 2 1.8 4 1.2
20-24 8 3.5 6 5.3 14 4.1
25-44 114 49.8 45 39.8 159 46.5
45-64 90 39.3 47 41.6 137 40.1
65-84 13 5.7 12 10.6 25 7.3
85+ 1 0.4 1 0.9 2 0.6
TOTAL 229 100.0 113 100.0 342 100.0Note: Excludes tobacco and alcohol. Drug-induced deaths – see Table 44 for ICD-10 codes and Glossary for more details. Total percentage may not add up to 100 due to rounding. Non-residents are excluded.

D E A T H - R E L A T E D S T A T I S T I C S 109
TABLE 44DRUG-INDUCED DEATHS BY CAUSE
BR I T I S H CO L U M B I A, 2000–2004 A N D 2005
Year of Death 2000–2004 2005
Cause of Death ICD-10 Code(s) Number Percent Number Percent
Psychoactive substance F11-F16, F19 106 5.1 23 6.7 and drug use/abuseAccidental poisoning by drugs X40-X44 1,383 66.0 228 66.7Suicide by drugs X60-X64 525 25.0 78 22.8Assault by drugs and medicaments X85 2 0.1 - -Poisoning by drugs and medicaments Y10-Y14 65 3.1 7 2.0 undetermined if accidental or intentionalAdverse effects of drugs Y40-Y574, 15 0.7 5 1.5 and medicaments in therapeutic use Y577-Y579, Y598, Y880Other drug causes* - - 1 0.3 TOTAL 2,096 100.0 342 100.0
Note: Excludes tobacco and alcohol. Total percentage may not add to 100 due to rounding. Non-residents are excluded. *ICD-10 codes D521, D590, D592, D611, D642, E032, E064, E231, E242, E273, F55, F551, G210, G211, G240, G251, G254,
G256, G444, G620, G720, H263, I427, I952, J702, J703, J704, L105, L233, L244, L251, L270, L271, L432, L560, L561, L640, M022, M102, M320, M804, M814, M835, M871, N140, N141, N142, O355, P040, P041, P044, P584, P961, P962, R781, R782, R783, R784, R785, R786, R825.
FIGURE 46DRUG-INDUCED DEATHS BY CAUSE
BR I T I S H CO L U M B I A, 2005
Psychoactive substanceand drug use/abuse
Accidental poisoning by drugs
Suicide by drugs
Poisoning by drugs and medicamentsundetermined if accidental or intentional
Adverse effects of drugs andmedicaments in therapeutic use
Other drug causes
0 10 20 30 40 50 60 70 80
Percent of Drug-Induced Deaths
6.7
66.7
22.8
2.0
1.5
0.3
Cause of Death

110 D E A T H - R E L A T E D S T A T I S T I C S 2000–2004 2005 Observed Observed Expected 95% Confi dence Interval
Local Health Area Deaths SMR (p) Deaths Deaths SMR (p) Lower Upper
001 Fernie 5 0.62 - 1.31 - - - - 002 Cranbrook 8 0.64 2 2.02 0.99 0.11 - 3.58 003 Kimberley 3 0.68 - 0.74 - - - - 004 Windermere 3 0.62 - 0.87 - - - - 005 Creston 4 0.71 - 0.90 - - - - 006 Kootenay Lake 4 2.28 - 0.27 - - - - 007 Nelson 14 1.12 1 1.99 0.50 0.01 - 2.79 009 Castlegar 4 0.59 1 1.07 0.93 0.01 - 5.19 010 Arrow Lakes 5 2.01 - 0.39 - - - - 011 Trail 10 0.99 - 1.59 - - - - 012 Grand Forks 1 0.23 - 0.70 - - - - 013 Kettle Valley - - - 0.28 - - - - 014 Southern Okanagan 9 1.08 - 1.41 - - - - 015 Penticton 25 1.32 2 3.09 0.65 0.07 - 2.33 016 Keremeos 3 1.32 - 0.39 - - - - 017 Princeton 3 1.29 1 0.38 2.65 0.03 - 14.76 018 Golden - - - 0.66 - - - - 019 Revelstoke 3 0.69 - 0.69 - - - - 020 Salmon Arm 17 1.12 4 2.54 1.57 0.42 - 4.03 021 Armstrong - Spallumcheen 1 0.21 1 0.78 1.28 0.02 - 7.14 022 Vernon 52 1.82 * 5 4.72 1.06 0.34 - 2.47 023 Central Okanagan 93 1.22 13 12.97 1.00 0.53 - 1.71 024 Kamloops 66 1.28 5 8.31 0.60 0.19 - 1.40 025 100 Mile House 9 1.27 1 1.13 0.88 0.01 - 4.90 026 North Thompson 2 0.78 - 0.43 - - - - 027 Cariboo - Chilcotin 11 0.77 2 2.31 0.87 0.10 - 3.12 028 Quesnel 12 0.96 4 2.02 1.98 0.53 - 5.08 029 Lillooet 3 1.33 - 0.36 - - - - 030 South Cariboo - - - 0.60 - - - - 031 Merritt 10 1.84 - 0.88 - - - - 032 Hope 6 1.47 - 0.67 - - - - 033 Chilliwack 30 0.87 10 5.81 1.72 0.82 - 3.16 034 Abbotsford 57 0.97 12 9.63 1.25 0.64 - 2.18 035 Langley 29 0.49 * 13 9.80 1.33 0.71 - 2.27 037 Delta 34 0.67 * 4 8.05 0.50 0.13 - 1.27 038 Richmond 24 0.27 * 8 14.20 0.56 0.24 - 1.11 040 New Westminster 60 1.84 * 14 5.12 2.73 * 1.49 - 4.58 041 Burnaby 70 0.65 * 9 17.12 0.53 * 0.24 - 1.00 042 Maple Ridge 44 1.04 5 7.33 0.68 0.22 - 1.59 043 Coquitlam 65 0.61 * 16 17.52 0.91 0.52 - 1.48 044 North Vancouver 37 0.52 * 6 11.21 0.54 0.20 - 1.16 045 West Vancouver-Bowen Is. 9 0.38 * 3 3.83 0.78 0.16 - 2.29 046 Sunshine Coast 16 1.23 3 2.17 1.38 0.28 - 4.04 047 Powell River 11 1.10 4 1.61 2.49 0.67 - 6.38 048 Howe Sound 9 0.53 1 2.85 0.35 0.00 - 1.95 049 Bella Coola Valley 1 0.61 - 0.26 - - - - 050 Queen Charlotte 4 1.40 1 0.46 2.18 0.03 - 12.12 051 Snow Country - - - 0.06 - - - - 052 Prince Rupert 10 1.21 3 1.32 2.27 0.46 - 6.62 053 Upper Skeena 3 1.08 - 0.44 - - - - 054 Smithers 4 0.45 - 1.43 - - - - 055 Burns Lake - - - 0.59 - - - - 056 Nechako 3 0.36 1 1.36 0.73 0.01 - 4.09 057 Prince George 46 0.90 5 8.17 0.61 0.20 - 1.43 059 Peace River South 8 0.60 1 2.22 0.45 0.01 - 2.50 060 Peace River North 5 0.33 * 1 2.62 0.38 0.00 - 2.12 061 Greater Victoria 189 1.75 * 24 17.24 1.39 0.89 - 2.07 062 Sooke 21 0.74 6 4.84 1.24 0.45 - 2.70 063 Saanich 23 0.78 3 4.84 0.62 0.12 - 1.81 064 Gulf Islands 6 0.90 - 1.11 - - - - 065 Cowichan 20 0.79 3 4.15 0.72 0.15 - 2.11 066 Lake Cowichan 3 0.99 2 0.50 4.03 0.45 - 14.55 067 Ladysmith 6 0.77 2 1.31 1.53 0.17 - 5.52 068 Nanaimo 64 1.37 * 6 7.74 0.77 0.28 - 1.69 069 Qualicum 9 0.49 * 2 3.07 0.65 0.07 - 2.35 070 Alberni 20 1.27 3 2.53 1.19 0.24 - 3.47 071 Courtenay 28 0.98 1 4.76 0.21 0.00 - 1.17 072 Campbell River 30 1.49 * 1 3.24 0.31 0.00 - 1.72 075 Mission 22 1.18 6 3.12 1.92 0.70 - 4.19 076 Agassiz - Harrison 6 1.41 1 0.73 1.37 0.02 - 7.63 077 Summerland 1 0.19 - 0.87 - - - - 078 Enderby 1 0.29 1 0.58 1.73 0.02 - 9.63 080 Kitimat 2 0.34 2 0.90 2.21 0.25 - 7.98 081 Fort Nelson 1 0.31 - 0.56 - - - - 083 Central Coast 1 1.18 - 0.13 - - - - 084 Vancouver Island West - - - 0.19 - - - - 085 Vancouver Island North 7 0.98 - 1.12 - - - - 087 Stikine - - - 0.10 - - - - 088 Terrace 9 0.83 1 1.71 0.58 0.01 - 3.24 092 Nisga’a - - - 0.14 - - - - 094 Telegraph Creek - - - 0.05 - - - - 161 Vancouver - City Centre 104 1.64 * 14 10.62 1.32 0.72 - 2.21 162 Vancouver - Downtown E.side 199 6.33 * 37 5.03 7.36 * 5.18 - 10.14 163 Vancouver - North East 47 0.92 8 8.17 0.98 0.42 - 1.93 164 Vancouver - Westside 33 0.51 * 4 10.42 0.38 + 0.10 - 0.98 165 Vancouver - Midtown 50 1.03 7 7.61 0.92 0.37 - 1.90 166 Vancouver - South 39 0.61 * 7 10.28 0.68 0.27 - 1.40 201 Surrey 168 1.06 32 26.61 1.20 0.82 - 1.70 202 South Surrey/White Rock 19 0.53 * 5 6.06 0.83 0.27 - 1.93 PROVINCIAL TOTAL 2,096 1.00 342 342.00 1.00 0.90 - 1.11 Note: *Statistical testing indicates that observed deaths are signifi cantly different from the expected deaths (p<0.05, two tailed). +Denotes signifi cance based on less than fi ve deaths. SMR - Standardized Mortality Ratio. Total includes residents with unknown LHA.
ST
AN
DA
RD
IZE
D M
OR
TA
LIT
Y R
AT
IO B
Y L
OC
AL
HE
AL
TH
AR
EA
DR
UG
-IN
DU
CE
D D
EA
TH
S,
BR
ITIS
H C
OL
UM
BIA
, 20
00–2
004A
ND
200
5T
able
45 110

D E A T H - R E L A T E D S T A T I S T I C S 111
Note: SMR - Standardized Mortality Ratio. Refer to Figure 1 to clarify geographical location of Local Health Areas.
N
Statistically Significant
QUINTILE (SMR)
5 ( > 1.27)
2 (0.38 - 0.67)
1 ( < 0.38)
4 ( 0.98 - 1.27)
3 ( 0.67 - 0.98)
Inset 1
see inset 2
Inset 2
see inset 1
300 kms0 100 200
10 kms0
50 kms0
FIGURE 47DRUG-INDUCED DEATHS BY LOCAL HEALTH AREA
BR I T I S H CO L U M B I A, 2000–2004

112 D E A T H - R E L A T E D S T A T I S T I C S
Drug Overdose Deaths
This section provides information on deaths due to unintentional poisoning by illicit/illegal drugs. These deaths are a small portion of deaths due to unintentional poisoning by drugs, and excludes accidental poisoning by drugs in theraputic use.
The tables and fi gures update the Information Box entitled “Accidental Illicit Drug Deaths” found in last year’s Annual Report.
Data on unintentional illicit/illegal drug deaths are retrieved from the Coroners’ Medical Certifi cate of Death and only include deaths where an overdose occurred and was determined to be the underlying cause of death. Deaths due to conditions that may arise from substance abuse, such as Hepatitis ‘B’ and ‘C’ and HIV, are excluded. Inclusion of these events would increase the numbers signifi cantly.
Among the substances implicated in these overdoses there are those generally referred to as “illicit drugs” – heroin, cocaine, and “psychostimulants with abuse potential” including “crystal meth” (methamphetamine hydrochloride) and “ecstasy” (methylenedioxymethamphetamine). A more precise term for these chemicals might be “illegal” drugs as there is no medically recognized, legal use for either “ecstasy” or “crystal meth”. Although both heroin and cocaine have very limited therapeutic uses, in circumstances where a fatal overdose has occurred it is almost certain that these drugs would have been obtained via illegal means. On the other hand, where morphine is implicated, it is possible that some of the deaths involved legally obtained drugs because morphine is prescribed for chronic and/or severe pain (such as that associated with advanced cancer) and if taken improperly could result in an unintentional overdose. Unfortunately it is not always possible to differentiate whether an opiate overdose was caused by heroin or morphine, as the information received on the Coroners’ fi nal reports does not consistently specify this, rather recording “morphine type” overdose, (hence the label “heroin / morphine type”). Of continuing note is the fact that deaths are occurring as the result of unintentional methadone overdoses. The legal use of this drug is most often in the treatment of opiate addiction, but it would appear that it is being used in unsanctioned ways that are resulting in death.
It is important to note that the data presented in Table 46 and Figure 48 for 2005 (and to some extent earlier years) will be revised upwards as fi nal reports from the investigating Coroners are submitted to the Vital Statistics Agency for processing and coding. For example, last year’s Information Box showed 51 heroin / morphine and 72 cocaine overdose fatalities in 2004. A year later, the 2004 counts have risen to 64 and 94 fatal overdoses attributable to the drugs respectively. Cocaine use appears to be eclipsing heroin as the most common cause of fatal overdoses. Psychostimulant overdoses as a cause of death appear to be remaining fairly low in number.
Age standardized mortality rates (ASMR) provide a means of comparing death rates across different populations and geographic areas. Table 47 shows deaths due to unintentional overdoses are not confi ned to any one area in the province. Both the Vancouver Island Health Authority and the Interior Health Authority have ASMRs due to unintentional illicit / illegal drug overdose similar to or greater than those of the Vancouver Coastal Health Authority. In fact, from 2001 to 2004, the Vancouver Island Health Authority had the highest ASMRs due to unintentional drug overdoses in the province. ASMRs for 2005 at the time of reporting appear to have declined in all areas except the Fraser Health Authority. However, these results should be viewed with caution for the reasons cited above regarding delayed reporting.
As evidenced by Table 48 and Figure 49, although drug overdose fatalities appear to be declining generally, males consistently succumb to unintentional overdoses at a greater rate than females. Why this happens is open to debate, but it does show a need to particularly target this group in treatment and prevention strategies.
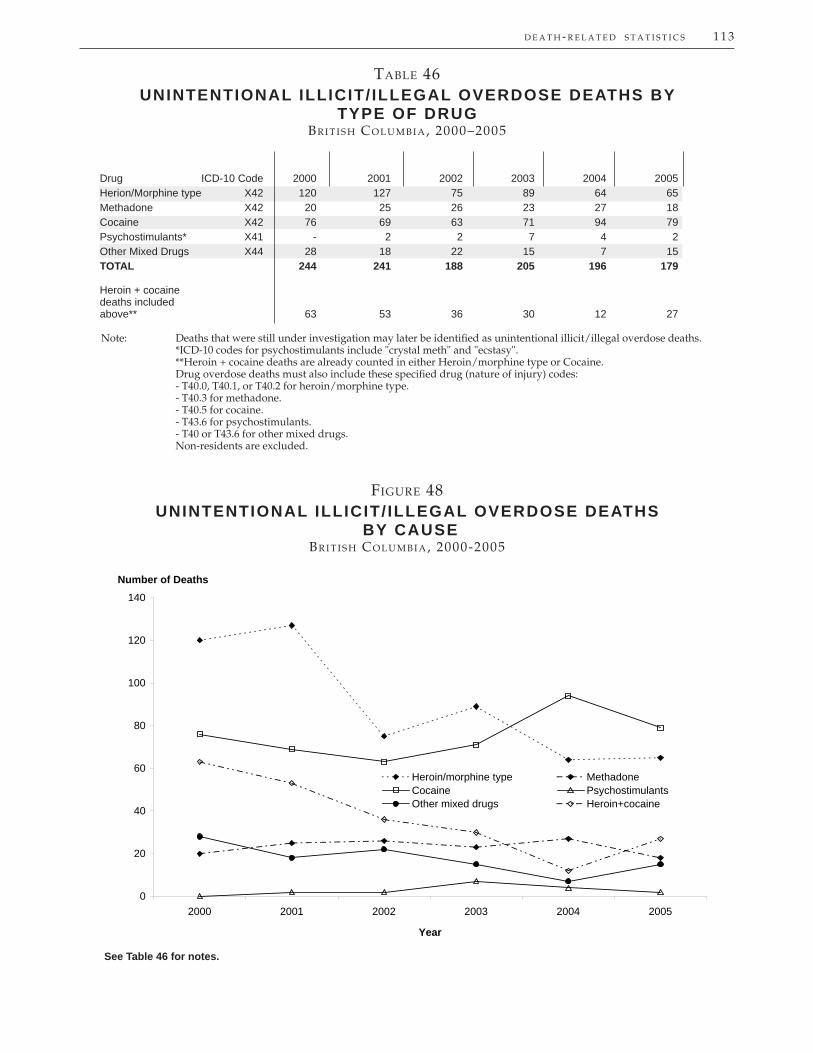
D E A T H - R E L A T E D S T A T I S T I C S 113
TABLE 46UNINTENTIONAL ILLICIT/ ILLEGAL OVERDOSE DEATHS BY
TYPE OF DRUGBR I T I S H CO L U M B I A, 2000–2005
Drug ICD-10 Code 2000 2001 2002 2003 2004 2005Herion/Morphine type X42 120 127 75 89 64 65Methadone X42 20 25 26 23 27 18Cocaine X42 76 69 63 71 94 79Psychostimulants* X41 - 2 2 7 4 2Other Mixed Drugs X44 28 18 22 15 7 15TOTAL 244 241 188 205 196 179
Heroin + cocaine deaths includedabove** 63 53 36 30 12 27
Note: Deaths that were still under investigation may later be identifi ed as unintentional illicit/illegal overdose deaths. *ICD-10 codes for psychostimulants include "crystal meth" and "ecstasy". **Heroin + cocaine deaths are already counted in either Heroin/morphine type or Cocaine. Drug overdose deaths must also include these specifi ed drug (nature of injury) codes: - T40.0, T40.1, or T40.2 for heroin/morphine type. - T40.3 for methadone. - T40.5 for cocaine. - T43.6 for psychostimulants. - T40 or T43.6 for other mixed drugs. Non-residents are excluded.
FIGURE 48UNINTENTIONAL ILLICIT/ ILLEGAL OVERDOSE DEATHS
BY CAUSEBR I T I S H CO L U M B I A, 2000-2005
0
20
40
60
80
100
120
140
2000 2001 2002 2003 2004 2005
Year
Number of Deaths
Heroin/morphine type MethadoneCocaine PsychostimulantsOther mixed drugs Heroin+cocaine
See Table 46 for notes.
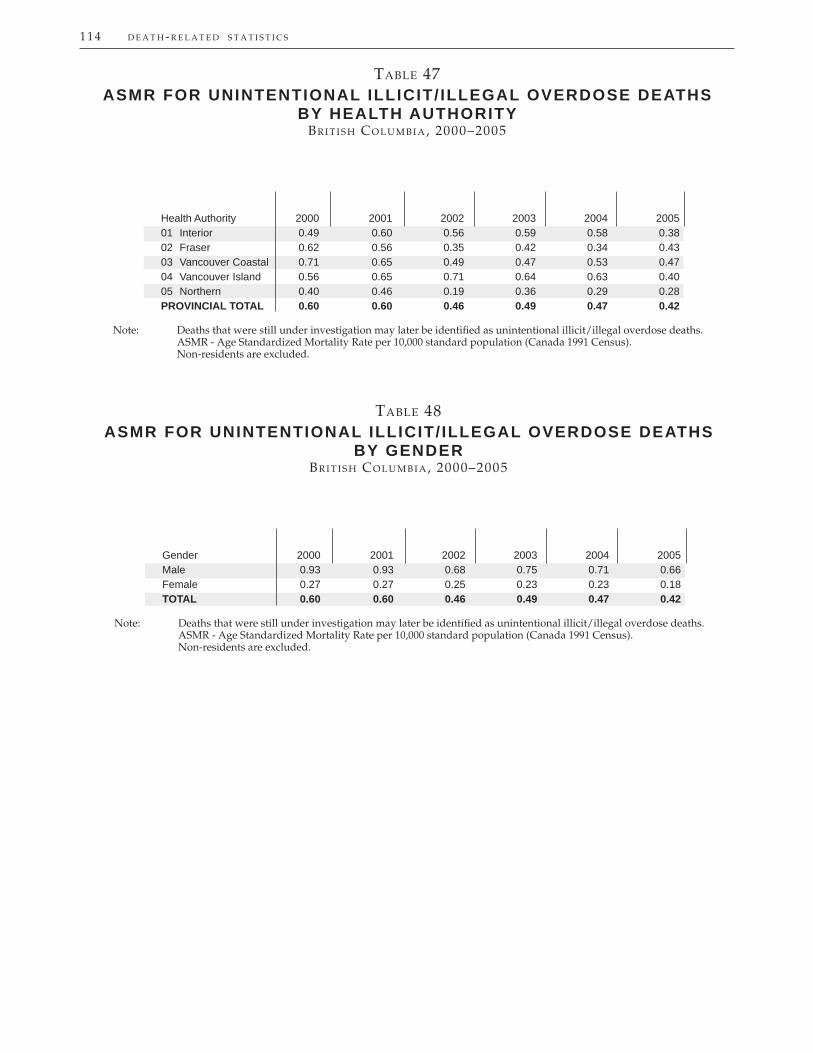
114 D E A T H - R E L A T E D S T A T I S T I C S
TABLE 47ASMR FOR UNINTENTIONAL ILLICIT/ ILLEGAL OVERDOSE DEATHS
BY HEALTH AUTHORITYBR I T I S H CO L U M B I A, 2000–2005
Health Authority 2000 2001 2002 2003 2004 200501 Interior 0.49 0.60 0.56 0.59 0.58 0.3802 Fraser 0.62 0.56 0.35 0.42 0.34 0.4303 Vancouver Coastal 0.71 0.65 0.49 0.47 0.53 0.4704 Vancouver Island 0.56 0.65 0.71 0.64 0.63 0.4005 Northern 0.40 0.46 0.19 0.36 0.29 0.28PROVINCIAL TOTAL 0.60 0.60 0.46 0.49 0.47 0.42
Note: Deaths that were still under investigation may later be identifi ed as unintentional illicit/illegal overdose deaths. ASMR - Age Standardized Mortality Rate per 10,000 standard population (Canada 1991 Census). Non-residents are excluded.
TABLE 48ASMR FOR UNINTENTIONAL ILLICIT/ ILLEGAL OVERDOSE DEATHS
BY GENDERBR I T I S H CO L U M B I A, 2000–2005
Gender 2000 2001 2002 2003 2004 2005Male 0.93 0.93 0.68 0.75 0.71 0.66Female 0.27 0.27 0.25 0.23 0.23 0.18TOTAL 0.60 0.60 0.46 0.49 0.47 0.42
Note: Deaths that were still under investigation may later be identifi ed as unintentional illicit/illegal overdose deaths. ASMR - Age Standardized Mortality Rate per 10,000 standard population (Canada 1991 Census). Non-residents are excluded.

D E A T H - R E L A T E D S T A T I S T I C S 115
FIGURE 49ASMR FOR UNINTENTIONAL ILLICIT/ ILLEGAL OVERDOSE DEATHS
BY GENDERBR I T I S H CO L U M B I A, 2000-2005
See Table 48 for notes.
0.0
0.1
0.2
0.3
0.4
0.5
0.6
0.7
0.8
0.9
1.0
2000 2001 2002 2003 2004 2005Year
Rate per 10,000Standard Population
Male Female TOTAL

116 D E A T H - R E L A T E D S T A T I S T I C S
TABLE 49METHOD OF DISPOSITION OF DECEDENT
BR I T I S H CO L U M B I A, 1986–2005
Burial Cremation Year Number Percent Number Percent Other N.S. Total
1986 8,204 39.1 12,686 60.4 98 20 21,0081987 8,211 38.0 13,279 61.4 104 24 21,6181988 8,319 37.2 13,926 62.3 96 16 22,3571989 8,061 35.4 14,616 64.1 81 28 22,7861990 8,208 35.1 15,088 64.4 91 28 23,4151991 8,035 33.7 15,675 65.8 75 34 23,8191992 7,818 32.0 16,512 67.5 97 36 24,4631993 7,987 31.2 17,214 67.2 151 251 25,6031994 7,710 29.8 17,888 69.3 177 55 25,8301995 7,616 29.0 18,361 70.0 185 63 26,2251996 7,639 27.9 19,546 71.4 193 12 27,3901997 7,359 27.0 19,649 72.1 206 46 27,2601998 7,197 25.9 20,376 73.3 225 9 27,8071999 7,060 25.3 20,625 74.0 197 - 27,8822000 6,465 23.7 20,675 75.7 186 1 27,3272001 6,684 23.7 21,327 75.5 223 1 28,2352002 6,540 22.8 21,978 76.6 189 3 28,7102003 6,606 22.7 22,359 76.7 186 - 29,1512004 6,373 21.5 23,155 77.9 182 - 29,7102005 6,264 20.9 23,595 78.6 174 - 30,033
Note: Percent is based on total deaths in the specifi ed year. Other includes remains not recovered and donations as per will of deceased. N.S. – Not stated. Non-residents are excluded.
Burials and Cremations
Table 49 shows the method used to dispose of decedents’ remains. This table, which covers the years from 1986 through 2005, primarily shows the declining popularity of burial and increasing preference for cremation. At the beginning of this time span the ratio of cremations to burials was three to two, in 2005 it was almost four to one.
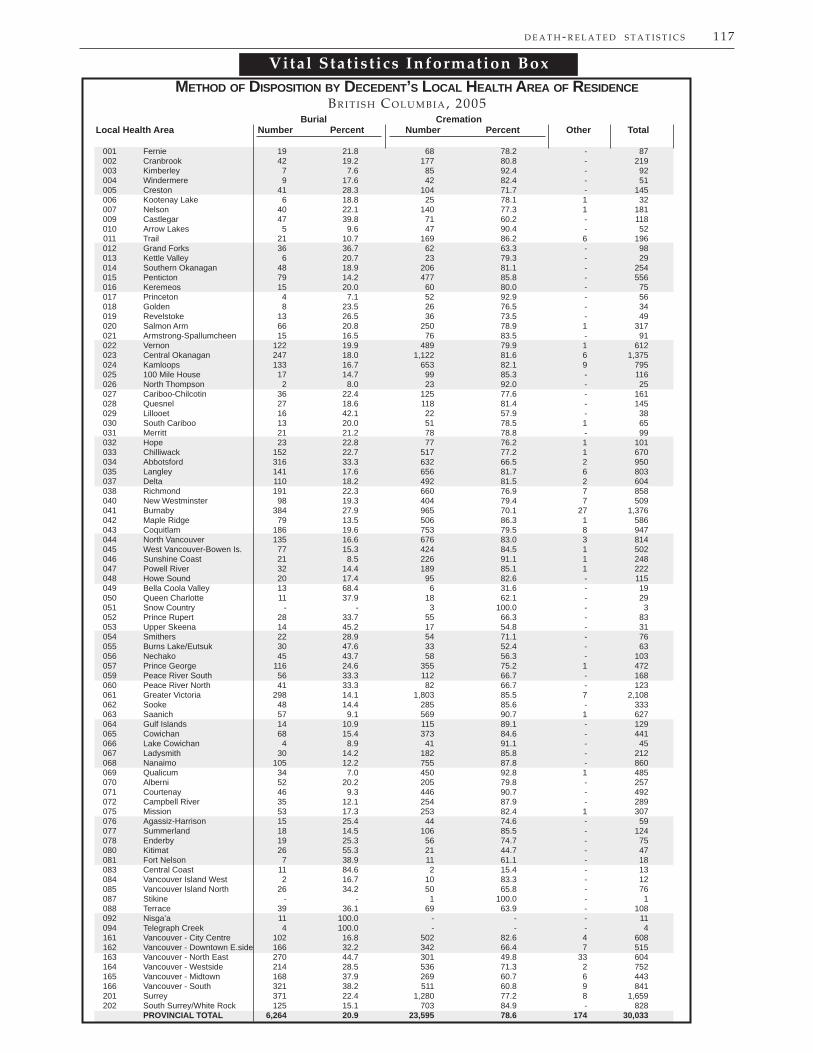
D E A T H - R E L A T E D S T A T I S T I C S 117
METHOD OF DISPOSITION BY DECEDENT’S LOCAL HEALTH AREA OF RESIDENCEBR I T I S H CO L U M B I A, 2005
Burial CremationLocal Health Area Number Percent Number Percent Other Total
001 Fernie 19 21.8 68 78.2 - 87 002 Cranbrook 42 19.2 177 80.8 - 219 003 Kimberley 7 7.6 85 92.4 - 92 004 Windermere 9 17.6 42 82.4 - 51 005 Creston 41 28.3 104 71.7 - 145 006 Kootenay Lake 6 18.8 25 78.1 1 32 007 Nelson 40 22.1 140 77.3 1 181 009 Castlegar 47 39.8 71 60.2 - 118 010 Arrow Lakes 5 9.6 47 90.4 - 52 011 Trail 21 10.7 169 86.2 6 196 012 Grand Forks 36 36.7 62 63.3 - 98 013 Kettle Valley 6 20.7 23 79.3 - 29 014 Southern Okanagan 48 18.9 206 81.1 - 254 015 Penticton 79 14.2 477 85.8 - 556 016 Keremeos 15 20.0 60 80.0 - 75 017 Princeton 4 7.1 52 92.9 - 56 018 Golden 8 23.5 26 76.5 - 34 019 Revelstoke 13 26.5 36 73.5 - 49 020 Salmon Arm 66 20.8 250 78.9 1 317 021 Armstrong-Spallumcheen 15 16.5 76 83.5 - 91 022 Vernon 122 19.9 489 79.9 1 612 023 Central Okanagan 247 18.0 1,122 81.6 6 1,375 024 Kamloops 133 16.7 653 82.1 9 795 025 100 Mile House 17 14.7 99 85.3 - 116 026 North Thompson 2 8.0 23 92.0 - 25 027 Cariboo-Chilcotin 36 22.4 125 77.6 - 161 028 Quesnel 27 18.6 118 81.4 - 145 029 Lillooet 16 42.1 22 57.9 - 38 030 South Cariboo 13 20.0 51 78.5 1 65 031 Merritt 21 21.2 78 78.8 - 99 032 Hope 23 22.8 77 76.2 1 101 033 Chilliwack 152 22.7 517 77.2 1 670 034 Abbotsford 316 33.3 632 66.5 2 950 035 Langley 141 17.6 656 81.7 6 803 037 Delta 110 18.2 492 81.5 2 604 038 Richmond 191 22.3 660 76.9 7 858 040 New Westminster 98 19.3 404 79.4 7 509 041 Burnaby 384 27.9 965 70.1 27 1,376 042 Maple Ridge 79 13.5 506 86.3 1 586 043 Coquitlam 186 19.6 753 79.5 8 947 044 North Vancouver 135 16.6 676 83.0 3 814 045 West Vancouver-Bowen Is. 77 15.3 424 84.5 1 502 046 Sunshine Coast 21 8.5 226 91.1 1 248 047 Powell River 32 14.4 189 85.1 1 222 048 Howe Sound 20 17.4 95 82.6 - 115 049 Bella Coola Valley 13 68.4 6 31.6 - 19 050 Queen Charlotte 11 37.9 18 62.1 - 29 051 Snow Country - - 3 100.0 - 3 052 Prince Rupert 28 33.7 55 66.3 - 83 053 Upper Skeena 14 45.2 17 54.8 - 31 054 Smithers 22 28.9 54 71.1 - 76 055 Burns Lake/Eutsuk 30 47.6 33 52.4 - 63 056 Nechako 45 43.7 58 56.3 - 103 057 Prince George 116 24.6 355 75.2 1 472 059 Peace River South 56 33.3 112 66.7 - 168 060 Peace River North 41 33.3 82 66.7 - 123 061 Greater Victoria 298 14.1 1,803 85.5 7 2,108 062 Sooke 48 14.4 285 85.6 - 333 063 Saanich 57 9.1 569 90.7 1 627 064 Gulf Islands 14 10.9 115 89.1 - 129 065 Cowichan 68 15.4 373 84.6 - 441 066 Lake Cowichan 4 8.9 41 91.1 - 45 067 Ladysmith 30 14.2 182 85.8 - 212 068 Nanaimo 105 12.2 755 87.8 - 860 069 Qualicum 34 7.0 450 92.8 1 485 070 Alberni 52 20.2 205 79.8 - 257 071 Courtenay 46 9.3 446 90.7 - 492 072 Campbell River 35 12.1 254 87.9 - 289 075 Mission 53 17.3 253 82.4 1 307 076 Agassiz-Harrison 15 25.4 44 74.6 - 59 077 Summerland 18 14.5 106 85.5 - 124 078 Enderby 19 25.3 56 74.7 - 75 080 Kitimat 26 55.3 21 44.7 - 47 081 Fort Nelson 7 38.9 11 61.1 - 18 083 Central Coast 11 84.6 2 15.4 - 13 084 Vancouver Island West 2 16.7 10 83.3 - 12 085 Vancouver Island North 26 34.2 50 65.8 - 76 087 Stikine - - 1 100.0 - 1 088 Terrace 39 36.1 69 63.9 - 108 092 Nisga’a 11 100.0 - - - 11 094 Telegraph Creek 4 100.0 - - - 4 161 Vancouver - City Centre 102 16.8 502 82.6 4 608 162 Vancouver - Downtown E.side 166 32.2 342 66.4 7 515 163 Vancouver - North East 270 44.7 301 49.8 33 604 164 Vancouver - Westside 214 28.5 536 71.3 2 752 165 Vancouver - Midtown 168 37.9 269 60.7 6 443 166 Vancouver - South 321 38.2 511 60.8 9 841 201 Surrey 371 22.4 1,280 77.2 8 1,659 202 South Surrey/White Rock 125 15.1 703 84.9 - 828 PROVINCIAL TOTAL 6,264 20.9 23,595 78.6 174 30,033
Vital Statistics Information Box

118 D E A T H - R E L A T E D S T A T I S T I C S
Vital Statistics Information BoxVital Statistics Information Box
Deaths from natural causes in 2001 to 2005 were examined to determine the place of death. The majority of these deaths to British Columbia residents occurred in hospital (57.7% over the fi ve year period). About one in six deaths from natural causes (16.2%) occurred at home and almost a quarter (24.7%) occurred in extended care facilities.
PLACE OF DEATH FOR DEATHS FROM NATURAL CAUSESBR I T I S H CO L U M B I A, 2001-2005
2001 2002 2003 2004 2005 2001-2005Place of Death Number % Number % Number % Number % Number % Number %Home 4,233 16.0 4,268 16.0 4,441 16.3 4,588 16.5 4,604 16.2 22,134 16.2
Extended Care 5,189 19.7 5,213 19.5 7,342 26.9 7,915 28.4 8,128 28.6 33,787 24.7
Hospital 16,710 63.3 16,907 63.3 15,109 55.4 14,991 53.8 15,118 53.3 78,835 57.7
Other and Unknown 248 0.9 324 1.2 361 1.3 363 1.3 528 1.9 1,824 1.3
Total Deaths from 26,380 100.0 26,712 100.0 27,253 100.0 27,857 100.0 28,378 100.0 136,580 100.0Natural Causes
Note: Natural Causes includes deaths that are still under investigation (ICD-10 code R99).
PERCENT OF DEATHS FROM NATURAL CAUSES BY PLACE OF DEATHBR I T I S H CO L U M B I A, 2001-2005
0.0
10.0
20.0
30.0
40.0
50.0
60.0
70.0
2001 2002 2003 2004 2005
Home Extended Care Hospital Other and Unknown
Percent

Marriage-related Statistics

120 M A R R I A G E - R E L A T E D S T A T I S T I C S
Vital Statistics Information Box
MARRIAGES BY OTHER NON CHRISTIAN DENOMINATIONSBR I T I S H CO L U M B I A, 2005
Number of Religious Number Who Performed Number of Marriages Religious Denomination Representatives Marriages Performed
Baha’i 104 30 47Buddhist 22 10 15Hindu 42 20 88Muslim 54 32 149Sikh 129 59 550Spiritualist 55 19 243Wiccan 7 3 8Other* 39 9 9Total Other 452 182 1,109Non Christian Religions
Note: *Other consists of religious denominations where the representatives performed less than 5 marriages in 2005: Eckankar, Konko-Kyo, Scientology, and Zoroastrian.
Table 49, Religious Representatives on Register and Marriages Performed by Religious Denomination, uses religious denomination categories from Statistics Canada. In 2005, a total of 1,109 marriages in British Columbia were solemnized by representatives of Other Non Christian religions. The table below provides additional details about these marriages.

Marriage Introduction
The British Columbia Vital Statistics Agency records all marriages that occurred in British Columbia. Unlike the birth and death statistics, which are based on usual residence, marriage information includes all marriages performed in the province whether the parties were residents or non-residents. The Agency does not record divorce decrees. The tables in this section contain information about marriages by previous marital status, ages of the parties involved, and type of ceremony. To avoid double counting, the cells in tables 50 and 51 provide information for each combination of marital status or age.
In Table 50 the 22,631 marriages are categorized by the previous marital status of each partner. In 2005, 62.8% (14,214) of couples were marrying for the fi rst time and in 19.7% (4,455) one of the partners was marrying for the fi rst time. There were 3,099 marriages (13.7%) where both partners were previously divorced.
Table 51 shows number of marriages by ages of those marrying in 2005. There were 6,975 marriages (30.8%) where both parties were in their twenties and 4,032 marriages (17.8%) where both parties were in their thirties.
Of the 22,631 marriages occurring in B.C. in 2005, there were 409 marriages (1.8%) where at least one party was in their teens (see Table 51). There were 1,236 marriages (5.5%) where at least one of those marrying was 60 years or older.
Table 52 indicates that there were 7,186 registered religious representatives in B.C. but less than half of them (3,114) solemnized marriages in 2005. Almost 40% of marriages in 2005 (8,795) were solemnized by religious representatives.
Table 53 shows the number of marriages performed by marriage commissioners, both private and public servant, and the number of each type of commissioner with appointments in 2005.
Reviewing Tables 52 and 53, in 2005 61.1% of marriages were of the civil type, performed by commissioners. The other 38.9% were religious ceremonies performed by representatives of religious denominations. Since 1988, when 42.5% of marriages were performed by commissioners, the percentage of marriages that were of the civil type has risen quite steadily.
121

122 M A R R I A G E - R E L A T E D S T A T I S T I C S
TABLE 50MARRIAGES BY MARITAL STATUS
BR I T I S H CO L U M B I A, 2005
Single Widowed Divorced N.S.
Single 14,214 Widowed 204 229 Divorced 4,251 634 3,099 N.S. - - - -
Note: N.S. - Not stated.
TABLE 51MARRIAGES BY AGE
BR I T I S H CO L U M B I A, 2005
15-19 52 20-24 277 1,842 25-29 61 2,049 3,084 30-34 14 459 2,674 1,774 35-39 3 139 741 1,493 765 40-44 - 42 203 498 857 517 45-49 1 12 52 156 338 650 387 50-59 1 12 29 65 161 392 715 775 60+ - - 5 5 21 53 116 502 534 N.S. - 1 - - - - - - - 104
Note: N.S. – Not stated.
Age (in Years) 15–19 20–24 25–29 30–34 35–39 40–44 45–49 50–59 60+ N.S.

M A R R I A G E - R E L A T E D S T A T I S T I C S 123
TABLE 52RELIGIOUS REPRESENTATIVES ON REGISTER AND
MARRIAGES PERFORMED BY RELIGIOUS DENOMINATIONBR I T I S H CO L U M B I A, 2005
Number of Religious Number Who Performed Number of Marriages Religious Denomination Representatives Marriages Performed
Anglican 560 242 665Baptist 756 325 761Eastern Orthodox 56 21 86Jewish 27 13 36Lutheran 242 111 243Mennonite / Hutterite 436 231 455Pentecostal 816 313 785Presbyterian 201 87 176Catholic 515 262 1,126Salvation Army 173 40 76Jehovahs Witness 87 62 148United Church 543 303 1,099Other Christian Religions 2,311 919 2,016Other Non Christian Religions 452 182 1,109Unknown / Not Stated 11 3 14Total 7,186 3,114 8,795
Note: Religious categories shown above are from Statistics Canada. Individuals with temporary appointments are counted once for each appointment.
TABLE 53MARRIAGE COMMISSIONERS ON REGISTER
BY TYPE AND MARRIAGES PERFORMEDBR I T I S H CO L U M B I A, 2005
Number of Number Who Performed Number of Marriages Type of Commisioner Commissioners Marriages Performed
Private Commissioner* 510 476 13,836 Public Servant 11 - - Total 521 476 13,836
Note: Individuals with temporary appointments are counted once for each appointment.* Includes 147 temporary appointments.

124 M A R R I A G E - R E L A T E D S T A T I S T I C S
USUAL RESIDENCE OF PERSONS MARRIED IN BRITISH COLUMBIA IN 2005OP P O S I T E SE X MA R R I A G E S
Vital Statistics Information Box
Area Province/State or Country Males Females
Canada Total 20,680 20,769 British Columbia 19,197 19,364 Alberta 1,006 974 Ontario 276 247 Saskatchewan 76 68 Manitoba 44 37 Quebec 36 30 Northwest Territories 12 14 Yukon 13 11 Nova Scotia 11 11 New Brunswick 4 6 Newfoundland 4 6 Prince Edward Island 1 1
United States Total 641 529 Washington 196 175 California 113 91 Oregon 44 42 Florida 24 20 Texas 26 18 Arizona 20 19 New York 21 15 Illinois 13 14 Massachusetts 12 8 Pennsylvania 13 7 Colorado 1 9 Minnesota 11 8 Idaho 8 9 Virginia 9 8 Michigan 1 5 Missouri 8 6 Nevada 8 6 Hawaii 7 7 Alaska 7 6 New Jersey 9 4 Other 71 52 Mexico, Central & 9 14South America
Europe Total 208 188 England 66 55 Scotland 22 18 Other United Kingdom 57 47 Germany 30 33 Scandinavian Countries 3 2 Other 30 33 Asia & Middle East Total 43 83 Japan 18 25 Hong Kong 9 25 Other 16 33
Africa - 1
Oceania 37 30
Unknown 1 5
TOTAL 21,619 21,619

Vital Statistics Information Box
USUAL RESIDENCE OF PERSONS MARRIED IN BRITISH COLUMBIA IN 2005SA M E SE X MA R R I A G E S
Area Province/State or Country Males Females
Canada Total 413 503 British Columbia 377 426 Alberta 32 63 Ontario 2 4 Manitoba - 4 Quebec - 4 Saskatchewan 2 - Yukon - 2
United States Total 429 597 California 111 127 Washington 54 130 Texas 54 59 Oregon 29 60 Colorado 6 30 New York 18 13 Florida 16 14 Arizona 20 8 Georgia 12 10 Missouri 12 10 Illinois 12 8 Idaho 4 15 Minnesota 7 10 Nevada 12 2 Ohio 6 7 Other 56 94
Mexico, Central & 1 5South America
Europe Total 20 9 England 4 6 Scotland 8 - Other United Kingdom 4 1 Other 4 2
Asia & Middle East Total 10 8 Hong Kong 4 - Japan 2 2 Other 4 6
Africa 2 -
Oceania 11 16
TOTAL 886 1,138
M A R R I A G E - R E L A T E D S T A T I S T I C S 125


Glossary


G L O S S A R Y 129
ACQUIRED IMMUNODEFICIENCY SYNDROME (AIDS)
(See HIV Disease.)
AGE-SPECIFIC FERTILITY RATE (ASFR)
The rate of live births per 1,000 women for the specifi c age group. This is a more detailed measure than the crude birth rate, as it refl ects variations in the birth rate by age groups of the female population.
(See ASFR under Fertility Rate in the Methodology section for an example.)
AGE STANDARDIZATION
Age standardized is a method of calculation which adjusts a statistical measure for differences in the age/gender structures between populations. With standardized measures, more meaningful comparisons can be made between genders, different time periods, or geographic areas, because the age standardized statistic is calculated as if all populations had the same age/gender population distribution.
The age standardized measures in this report include Age Standardized Mortality Rate (ASMR), Standardized Mortality Ratio (SMR), Potential Years of Life Lost Standardized Rate (PYLLSR), and Potential Years of Life Lost Index (PYLLI). (See the above headings in the Methodology section for examples.)
AGE STANDARDIZED MORTALITY RATE (ASMR)
A summary of age adjusted death rates by age and gender, which have been standardized to a ‘standard’ population (1991 Canada Census) for the purpose of rate comparisons between genders, different time periods or different geographic locations. The ASMR is the theoretical number of deaths that would occur per 10,000 population, if the specifi c population had the same age structure as the standard population. Age standardization is used for comparisons because populations vary in the proportions of the various ages of the individuals that comprise them, and such differences would in themselves tend to affect the disease occurring in each of the populations.
(See also Age Standardization and Standard Population. See Age Standardized Mortality Rate in the Methodology section for an example.)
AIDS
(See HIV Disease.)
ALCOHOL-RELATED DEATHS
Alcohol-related deaths include deaths where alcohol was a contributing factor (indirectly related) as well as those due to alcohol (directly related). Alcohol-related and drug overdose deaths are the only cause of death categories that are not based entirely upon underlying causes of death.
The ICD-10 codes for deaths due to the use or abuse of alcohol (directly related) are shown in Table 39. If any of the conditions listed as directly related to alcohol are noted on the Medical Certifi cate as antecedent causes giving rise to the underlying cause or as other signifi cant conditions contributing to the death, the death is considered to be indirectly related to alcohol.
Coding practices from 1995 to 1999 may have produced over-counting of alcohol-related mortality. With the introduction of ICD-10 in 2000, more specifi c codes are available. Currently produced data should not be used in combination with data produced prior to 2000.
ASFR
(See Age Specifi c Fertility Rate.)
ASMR
(See Age Standardized Mortality Rate.)
Glossary Terms

130 G L O S S A R Y
AVERAGE AGE
The average ages of brides, grooms, and mothers of newborns in this annual report are calculated based on information provided on marriage or birth registration forms. The average ages of the population living in data dissemination areas are based on the mid-year population estimates for fi ve-year age groups.
AVERAGE AGE POPULATION
The average age of the population is a grouped average based on the mid-year population estimates for fi ve year age groups. This information is provided by BCSTATS, Ministry of Labour and Citizens' Services.
BIRTH ORDER
Denotes the number position of the present birth relative to previous live births. That is, whether the live birth being counted is the 1st, 2nd, 3rd, etc. live born infant to a particular mother.
BIRTH RATE
The number of live births divided by the mid-year population and converted to a rate per 1,000 population.
BIRTH RELATED STATISTICS
The birth related statistics shown in this report include teenage mother, elderly gravida, C-section, low birth weight, and pre-term live birth rates.
BIRTH WEIGHT The fi rst weight of the fetus or newborn after birth. For live births this weight should be measured within the fi rst hour of life before signifi cant postnatal weight loss has occurred. Hospitals in B.C. measure weight in grams; the approximate equivalents in imperial measures are included below for comparisons to other jurisdictions. For statistical and risk assessment purposes, birth weights are grouped as:
• Low Birth Weight (LBW) less than 2,500 grams (< 5 lb 8 oz)• “Healthy” Weight 2,500 to 4,499 grams (5 lb 8 oz - 9 lb 15 oz) • High Birth Weight 4,500 grams or more (> 9 lb 15 oz)
Low birth weight is sometimes further divided into these overlapping categories:
• Extremely Low Birth Weight less than 500 grams (< 1 lb 2 oz)• Very Low Birth Weight less than 1,500 grams (< 3 lb 5 oz)
In recent years there has been an increasing preference to identify high birth weight as Large for Gestational Age, which is above the 90th percentile of the birth weight distribution at each gestational age.
BIRTHS
(See Total Births.)
BREECH
A delivery in which the buttocks or feet appear fi rst.See also Mode of Delivery.
C-SECTION
A delivery by cesarean, involving the surgical incision of the abdomen and uterine walls.See also Mode of Delivery.
C-SECTION RATES
The number of live births, delivered by cesarean divided by the number of live births and converted to a rate per 1,000 live births.

G L O S S A R Y 131
CESAREAN
A delivery involving the surgical incision of the abdomen and uterine walls.See also Mode of Delivery.
COMMUNITY
A geographical area defi ned by a municipal (city, town, village, district municipality, Indian Government district, island minicipality, or resort municipality) boundary. In this report, data are only provided for incorporated communities.
CONFIDENCE INTERVAL
A measure of the variability of a statistic. A wide confi dence interval indicates that the statistic is likely to fall within a wide range of values, while a narrow confi dence interval indicates the statistic is likely to fall within a narrow range of values. In general, statistical confi dence intervals will be wider for areas with small populations or rare events than for areas with larger populations or more common events. (See Statistical Tests of Signifi cance at the end of the Methodology section.)
CONGENITAL ANOMALIES
Physical defects that existed or date from birth.
CRUDE RATES
For live births:the crude rate is the number of live births divided by the mid-year population and converted to a rate per 1,000 population.
For birth-related statistics (teenage mother, elderly gravida, C-section, low birth weight, and pre-term):the rate is the number of these births divided by the number of live births and converted to a rate per 1,000 live births.
For stillbirths and perinatal deaths:the rate is the number of stillbirths or perinatal deaths divided by the number of total births (live births plus stillbirths) and converted to a rate per 1,000 total births.
For infant deaths:the crude rate is the number of infant deaths divided by the number of live births and converted to a rate per 1,000 live births.
For maternal deaths:the rate is the number of maternal deaths divided by the number of live births, and converted to a rate per 10,000 live births.
For deaths and mortality statistics:the crude rate is the number of deaths divided by the mid-year population and converted to a rate per 1,000 population.
For marriages:the crude rate is the number of marriages divided by the mid-year population and converted to a rate per 1,000 population.
DEATH RATE
The number of deaths divided by the mid-year population and converted to a rate per 1,000 population.
DEATHS DUE TO MEDICALLY TREATABLE DISEASES
(See Medically Treatable Diseases.)

132 G L O S S A R Y
DRUG-INDUCED DEATHS
Deaths due to drug-induced causes. This category of deaths excludes unintentional injuries, homicides, and other causes that could be indirectly related to drug use. Deaths directly due to alcohol are also excluded. The causes of death classifi ed as being drug-induced (shown in Table 44 with their ICD-10 codes) are based on those used by the National Center for Health Statistics.1
DRUG OVERDOSE DEATHS
Deaths where the underlying cause of death was determined to be unintentional poisoning by illicit/illegal drugs. These deaths are a small portion of the deaths due to unitentional poisoning by drugs, and exclude accidental poisoning by drugs in therapeutic use. Deaths due to conditions that may arise from substance abuse, such as Hepatitis 'B' and 'C' and HIV, are also excluded.
Drug overdose deaths can be divided according to drug type: heroin/morphine, methadone, cocaine, psychostimulants including "crystal meth" (methamphetamine hydrochloride) and "ecstasy" (methylenedioxymethamphetamine), and other mixed drugs. The ICD-10 codes for these deaths are shown in Table 46. It should be noted that specifi ed drug (nature of injury) codes must also be listed on the Medical Certifi cate for the death to be considered a drug overdose.
EARLY NEONATAL DEATHDeath of a child under seven days of age.See also Infant Death.
ELDERLY GRAVIDA
Any woman who was 35 years of age or older at the time of delivery of a live born infant.
ELDERLY GRAVIDA RATE
The number of live births delivered by women aged 35 years or older divided by the number of live births and converted to a rate per 1,000 live births.
EXPECTED CESAREAN BIRTHS
The number of live births delivered by cesarean section that would be expected to be born to residents of a sub-provincial geographic area, based on the C-section rate for the province as a whole, and the number of births in the sub-provincial geographic area.(See Observed versus Expected Ratio in the Methodology section for an example.)
EXPECTED DEATHS
The number of deaths expected for residents of a sub-provincial geographic area, based on the age specifi c mortality rates for the province as a whole and the population age structure of the sub-provincial geographic area. (See Standardized Mortality Ratio in the Methodology section for an example.)
EXPECTED LOW BIRTH WEIGHT
The number of live births with low birth weight (less than 2,500 grams) that would be expected to be born to residents of a sub-provincial geographic area, based on the low birth weight rate for the province as a whole, and the number of live births in the sub-provincial geographic area.(See Observed versus Expected Ratio in the Methodology section for an example.)
EXPECTED MATERNAL COMPLICATIONS
The number of live births with maternal complications that would be expected to be born to residents of a sub-provincial geographic area, based on the complication rate for the province as a whole, and the number of live births in the sub-provincial geographic area.(See Observed versus Expected Ratio in the Methodology section for an example.)
1National Center for Health Statistics (1993). Technical notes. Monthly Vital Statistics Report. 41 (Suppl. 7), 48.

G L O S S A R Y 133
EXPECTED PERINATAL COMPLICATIONS
The number of live births with perinatal conditions that would be expected to be born to residents of a sub-provincial geographic area, based on the rate of those conditions for the province as a whole, and the number of live births in the sub-provincial geographic area. (See Observed versus Expected Ratio in the Methodology section for an example.)
EXPECTED POTENTIAL YEARS OF LIFE LOST
The number of potential years of life lost (to age 75 in this report) expected for residents of a sub-provincial geographic area based on the age specifi c mortality rates for the province as a whole and the population age structure of the sub-provincial geographic area. (See Potential Years of Life Lost Index in the Methodology section for an example.)
EXTREMELY LOW BIRTH WEIGHT
A birth weight of less than 500 grams.See also Birth Weight.
EXTREMELY PREMATURE
A gestational age of less than 28 weeks.See also Gestational Age.
FERTILTIY RATE
The number of live births occurring in a given time period divided by the number of women of childbearing age for residents of a geographic area. B.C. rates are per 1,000 women aged 15 to 44; Canadian rates are per 1,000 women aged 15 to 49.See also Total Fertility Rate.
FORCEPS
An assisted delivery employing forceps.See also Mode of Delivery.
GESTATIONAL AGE Fetal age or duration of pregnancy measured from the fi rst day of the last normal menstrual period. Gestational age is expressed in completed days or completed weeks (e.g., events occurring 280 to 286 days after the onset of the last normal menstrual period are considered to have occurred at 40 weeks of gestation).
Measurements of fetal growth, as they represent continuous variables, are expressed in relation to a specifi c week of gestational age as follows:
• Pre-term gestational age less than 37 weeks• Term gestational age of 37 to 41 weeks • Post-term gestational age of 42 weeks or more
Pre-term births can be further divided as follows:
• Extremely premature gestational age of less than 28 weeks• Moderately premature gestational age of 28 to 36 weeks
HA
(See Health Authority.)
HEALTH AUTHORITY (HA)
A geographic subdivision of the province used by the Ministry of Health for administrative and data dissemination purposes. There are fi ve health authorities plus the provincial HA. Health authorities can be subdivided into 16 Health Service Delivery Areas (HSDAs) or 89 Local Health Areas (LHAs). See Figure 2 for a map of the province by HAs.

134 G L O S S A R Y
HEALTH SERVICE DELIVERY AREA (HSDA)
A geographic subdivision of the province used by the Ministry of Health for data dissemination purposes. The 16 Health Service Delivery Areas can be aggregated into the fi ve Health Authorities (HAs) plus the provincial HA, or subdivided into 89 Local Health Areas (LHAs). See Figure 2 for a map of the province by HSDAs.
"HEALTHY" WEIGHT
A birth weight of 2,500 to 4,499 grams.See also Birth Weight.
HIGH BIRTH WEIGHT
A birth weight of 4,500 grams or more.See also Birth Weight.
HIV DISEASE
In 1987 the World Health Organization added new codes to the International Classifi cation of Diseases (ICD) to identify Acquired Immunodefi ciency Syndrome (AIDS) and Human Immunodefi ciency Virus (HIV). In ICD-10, these conditions are coded to B20–B24 and are called HIV disease.
HSDA
(See Health Service Delivery Area.)
HUMAN IMMUNODEFICIENCY VIRUS (HIV)
The virus that causes HIV disease.
ICD-9 CODES
The World Health Organization’s International Classifi cation of Diseases, Ninth Revision. This version of ICD was used by the B.C. Vital Statistics Agency for coding birth complications and causes of death from 1979 until 1999. Translation tables were developed and extensive manual reviews conducted in order to recode causes of death from ICD-9 to ICD-10, permitting direct comparison of cause of death trends including deaths from 1999 and earlier that were originally coded in ICD-9.
ICD-10 CODES
The World Health Organization’s International Statistical Classifi cation of Diseases and Related Health Problems, Tenth Revision, implemented by the B.C. Vital Statistics Agency on January 1, 2000. The Preamble to Appendix 2 presents a summary of ICD-10 codes.
INFANT DEATH Death of a child under one year of age. These deaths are divided according to age at death because of the high mortality rates that occur in the periods soon after birth and because different environmental factors underlie the cause of death in the different time periods.
• Neonatal death death of children less than 28 days after birth• Post neonatal death death of children from 28 to 364 days after birth
Neonatal deaths are further divided as follows:
• Early neonatal death death of children less than 7 days after birth• Late neonatal death death of children from 7 to 27 days after birth
INFANT MORTALITY RATE
The number of deaths of children under one year of age expressed as a rate per 1,000 live births. The infant mortality rate is an internationally accepted indicator of the health status of a population.
G L O S S A R Y 135
LATE NEONATAL DEATH
Death of a child from 7 to 27 days of age.See also Infant Death.
LBW
(See Low Birth Weight.)
LHA
(See Local Health Area.)
LIFE EXPECTANCY
Life expectancy at birth represents the mean number of years a birth cohort (persons born in the same year) may expect to live given the present mortality experience of a population. The life expectancy for a population is a summary measure that refl ects the mortality rates for all ages combined, weighted in accordance with a life-table population structure. Life expectancy is an internationally accepted indicator of the health status of a population. Life expectancy is provided by BCSTATS, Ministry of Labour and Citizens' Services.
LIVE BIRTH
The Vital Statistics Act defi nes a live birth as “The complete expulsion or extraction from its mother, irrespective of the duration of the pregnancy, of a product of conception in which, after the expulsion or extraction, there is:(a) breathing;(b) beating of the heart;(c) pulsation of the umbilical cord; or(d) unmistakable movement of voluntary muscle, whether or not the umbilical cord has been cut or the placenta attached.”
LIVE BIRTH RATE
The number of live births divided by the mid-year population and converted to a rate per 1,000 population.
LOCAL HEALTH AREA (LHA)
A geographic subdivision of the province used by the Ministry of Health for data dissemination purposes. The 89 local health areas can be aggregated into 16 Health Service Delivery Areas (HSDAs) or fi ve Health Authorities (HAs) plus the provincial HA. See Figure 1 for a map of the province by LHAs.
LOW BIRTH WEIGHT (LBW)
A birth weight of less than 2,500 grams. Low birth weight babies have increased risks of morbidity and premature death.See also Birth Weight.
LOW BIRTH WEIGHT RATE
The number of low birth weight live born babies per 1,000 live births.
MARRIAGE RATE
The number of marriages divided by the mid-year population and converted to a rate per 1,000 population.
MATERNAL DEATH
Death of a woman while pregnant or within 42 days of termination of pregnancy from causes related to the pregnancy, but not from accidental or incidental causes.
MATERNAL DEATH RATE
The number of maternal deaths divided by the number of live births, and converted to a rate per 10,000 live births.

136 G L O S S A R Y
MEDICALLY TREATABLE DISEASES, DEATHS DUE TO
Deaths due to medically treatable diseases are based on Charlton’s2 classifi cation. The disease categories are ones for which mortality could potentially have been avoided through appropriate medical intervention. It should be noted that the causes are considered to have been medically treatable only if the death occurred to persons within a specifi ed age range (see footnotes to Table 37).
The incidence of deaths from medically treatable diseases can be used by public health professionals as a way of monitoring the effect of health promotion programs.
MODE OF DELIVERY
The modes of delivery presented in this report consist of cesarean, forceps, spontaneous breech, spontaneous vertex, and vacuum (or suction).
Cesarean:A delivery involving the surgical incision of the abdomen and uterine walls.
Forceps:An assisted delivery employing forceps.
Spontaneous Breech:An unassisted (spontaneous) delivery in which the buttocks or feet of the fetus appear fi rst.
Spontaneous Vertex:An unassisted (spontaneous) delivery in which the head of the fetus appears fi rst.
Vacuum:An assisted delivery employing suction or vacuum.
MODERATELY PREMATURE
A gestational age of 28 to 36 weeks.See also Gestational Age.
MVA DEATHS
Motor Vehicle Accidental Deaths.
NATURAL POPULATION INCREASE (NPI)
The component increase in a population due to the number of live births less deaths; also called Natural Population Growth. This increase is often expressed as a rate, such as per 1,000 population. It does not include increases due to immigration or decreases due to emigration.
NEONATAL DEATH
Death of a child under 28 days of age.See also Infant Death.
NPI
(See Natural Population Growth.)
OBSERVED DEATHS
The actual number of deaths that occurred to residents of a sub-provincial geographic area in a specifi ed time period.
2Charlton, J.R.H. (1987). Avoidable Deaths and Diseases as Monitors of Health Promotion. In T. Abelin, Z.J. Brzezinski, & V. Carstairs (Eds.), Measurement in Health Promotion and Protection (pp.467-479). Copenhagen, Denmark: World Health Organization, Regional Offi ce for Europe.

G L O S S A R Y 137
OBSERVED LOW BIRTH WEIGHT LIVE BIRTHS
The actual number of low birth weight live births that occurred to residents of a sub-provincial geographic area in a specifi ed time period.
OBSERVED MATERNAL COMPLICATIONS
The actual number of maternal complications that occurred to residents of a sub-provincial geographic area in a specifi ed time period.
OBSERVED PERINATAL CONDITIONS
The actual number of perinatal conditions that occurred to residents of a sub-provincial geographic area in a specifi ed time period.
OBSERVED PYLL
The actual number of potential years of life lost (to age 75) from deaths that occurred to residents of a sub-provincial geographic area in a specifi ed time period.
OUT-OF-WEDLOCK BIRTHS
Births where the mother of the baby is not lawfully married to the father of the baby.
OVERDOSE DEATHS
(See Drug Overdose Deaths.)
P-VALUE
The probability of rejecting the null hypothesis when a specifi ed test procedure is used on a given data set. The data are statistically signifi cant when the null hypothesis is rejected and not signifi cant otherwise.(See Statistical Test in the Methodology section for examples.)
PERINATAL
Pertaining to or occurring in the period shortly before, during and after birth, starting at 22 completed weeks of gestation and ending seven completed days after birth.
PERINATAL DEATH RATE
The number of perinatal deaths divided by the number of total births (live births plus stillbirths) and converted to a rate per 1,000 total births.
POPULATION
Mid-year population estimates used in the preparation of this report were obtained from BC STATS, Ministry of Labour and Citizens' Services.
POST MATURE
(See Post-Term.)
POST NEONATAL DEATH
Death of a child between the ages of 28 days and 364 days.See also Infant Death.
POST TERM
A gestational age of 42 weeks or more.See also Gestational Age.
POTENTIAL YEARS OF LIFE LOST (PYLL)
The number of years of life lost when a person dies before a specifi ed age (75 years). In this report, all deaths are assumed to occur at the midpoint of fi ve-year age groups.(See Potential Years of Life Lost (PYLL) in the Methodology section for an example.)
138 G L O S S A R Y
PREMATURE
(See Pre-Term.)
PRE-TERM
A gestational age less than 37 weeks.See also Gestational Age.
PRE-TERM RATE
The number of pre-term live births divided by the number of live births and converted to a rate per 1,000 live births.
PYLL INDEX (PYLLI)
The ratio of an area’s observed PYLL to its expected PYLL. This is a health status indicator.(See Potential Years of Life Lost Index (PYLLI) in the Methodology section for an example.)
PYLL STANDARD RATE (PYLLSR)
An age-standardized measure of an area’s PYLL, expressed in terms of a rate per 1,000 population, adjusted to a standard population (1991 Canada Census). This is a health status indicator.(See PYLLSR under Potential Years of Life Lost (PYLL) in the Methodology section for an example.)
PYLL
(See Potential Years of Life Lost.)
PYLL %
The percent of all PYLL in the age group due to a specifi ed cause of death.
PYLLI
(See PYLL Index.)
PYLLSR
(See PYLL Standardized Rate.)
QUINTILE
A ranking is derived by dividing a group (e.g., LHAs within British Columbia) into fi ve subgroups, each with equal numbers of LHAs. (Since there are 89 LHAs and 89 is not evenly divisible by fi ve, there is one less LHA in the middle group.) These divisions are derived from a ranking of the group members according to the value of a measure, such as the SMR or the PYLLI.
SAM
(See Smoking-attibutable Mortality.)
SIDS
Sudden Infant Death Syndrome.
SMOKING-ATTRIBUTABLE MORTALITY (SAM)
The absence on death certifi cations of complete and reliable data on smoking requires the use of estimation techniques to approximate the extent of smoking-attributable deaths. Estimation methods, while not precise, may at least provide a general indication of the extent of such deaths. This report uses an estimation method based on the concept of attributable risk, which is described in the Methodology section.
Smoking-attributable deaths are derived by multiplying a smoking-attributable mortality percentage by the number of deaths aged 35+ in specifi ed cause of death categories. These categories are comprised of selected malignant neoplasms, circulatory system diseases, and respiratory system diseases, and are listed in Table 42.(See Smoking-Attributable Mortality in the Methodology section for more details.)

G L O S S A R Y 139
SMR
(See Standardized Mortality Ratio.)
STANDARD POPULATION
A reference population of known age distribution used in the calculation of standardized indicators to adjust for variations in population age structures in different geographic areas or time periods. For SMR and PYLLI calculations the standard population is the British Columbia population for the year(s) concerned. The 1991 Canadian Census is used as the standard population in the calculation of ASMR and PYLLSR.
STANDARDIZED MORTALITY RATIO (SMR)
The ratio of the number of deaths occurring to residents of a geographic area (e.g., LHA) to the expected number of deaths in that area based on provincial age-specifi c mortality rates. The SMR is a good measure for comparing mortality data that are based on a small number of cases or for readily comparing mortality data by geographical area. SMR is an internationally recognized health status indicator.See also Age Standardization and Standard Population.(See Standardized Mortalilty Ratio in the Methodology section for an example.)
STILLBIRTH
Since 1986, the Vital Statistics Act defi nes a stillbirth as “The complete expulsion or extraction from its mother after at least 20 weeks of pregnancy, or after attaining a weight of at least 500 grams, of a product of conception in which, after the expulsion or extraction, there is no breathing, beating of the heart, pulsation of the umbilical cord, or unmistakable movement of voluntary muscle.”
The defi nition of a stillbirth has changed over the years. From 1950 until July 1, 1962, the defi nition of a still-birth was the birth of a viable fetus after at least 28 weeks pregnancy in which pulmonary respiration does not occur, whether death occurs before, during, or after birth. From July 1, 1962 until January 1, 1986, the defi nition of a stillbirth did not include the phrase “or after attaining a weight of at least 500 grams.”
STILLBIRTH RATE
The number of stillbirths divided by the number of total births (live births plus stillbirths) and converted to a rate per 1,000 total births.See also Crude Rates.
TEENAGE MOTHERS
Mothers less than 20 years of age.
TEENAGE MOTHER LIVE BIRTH RATE
The number of live births to teenage mothers divided by the number of live births and converted to a rate per 1,000 live births.
TERM
A gestational age of 37 to 41 weeks.See also Gestational Age.
TFR
(See Total Fertility Rate.)
TOTAL BIRTHS
The number of live births plus stillbirths.
TOTAL FERTILITY RATE (TFR)
The number of births that a group of 1,000 women would have if, during their childbearing years, they had the age-specifi c birth rates observed in a given calendar year. TFR is a hypothetical measure of completed family size based on current levels of fertility by age.(See TFR under Fertility Rate in the Methodology section for an example.)

140 G L O S S A R Y
TOTAL PYLL
The total number of potential years of life lost prior to an established cut-off point of 75 years.
UCOD
(See Underlying Cause of Death.)
UNDERLYING CAUSE OF DEATH (UCOD)
The World Health Organization defi nes the underlying cause of death as “(a) the disease of injury which initiated the train of events leading directly to death, or (b) the circumstances of the accident or violence which produced the fatal injury.”
VACUUM
An assisted delivery employing suction or vacuum.See also Mode of Delivery.
VERTEX
A delivery in which the head of the fetus appears fi rst.See also Mode of Delivery.
VERY LOW BIRTH WEIGHT
A birth weight of less than 1,500 grams.See also Birth Weight.

Methodology


M E T H O D O L O G Y 143
MethodologyPopulation statistics inevitably involve comparisons of sub-populations, regions, and time periods. To many, such comparisons are often too complex so that interpretation becomes a formidable task. However, those comparisons are necessary in order to understand the health status of specifi c populations within British Columbia. The text that accompanies the tables and fi gures in this report explains the basic meaning of the comparisons but, for some, a more in depth explanation is useful and necessary.
This section provides the reader with computational examples of how various measures are calculated. All data shown in the examples are hypothetical. These routines are referenced in the discussion accompanying specifi c tables and fi gures where they are used and are arranged alphabetically. In some cases a test of statistical signifi cance is noted in the discussion and those routines will be found at the end of this part of the report.
Examples of the these statistical computations follow:
RATES • Age Standardized Mortality Rate (ASMR)• Fertility Rates Total Fertility Rate (TFR) Age Specifi c Fertility Rates (ASFRs)
• Potentional Years of Life Lost (PYLL) and Standardized Rate (PYLLSR)
RATIOS • Observed versus Expected Ratios Low Birth Weight (LBW) Live Births Potential Years of Life Lost Index (PYLLI) Standardized Mortality Ratio (SMR)
ESTIMATION OF SMOKING ATTRIBUTABLE MORTALITY (SAM)
STATISTICAL TESTS OF SIGNIFICANCE • Chi-Square• Confi dence Intervals • P-Value
RATES • Age Standardized Mortality Rate (ASMR)
Although a hypothetical LHA is used in the example cited here, the ASMR was also calculated for yearly death data, for example Figure 16, and specifi c cause groups, for example Table 21, to permit comparisons between items in those tables or fi gures. The example shown below can be applied to those measures as well. The test of statistical signifi cance is described under Rates in Statistical Tests of Signifi cance at the end of this Appendix.
LHA Age Standard Estimated Death ObservedGroup Population Population Rate/10,000 Deaths (i) (πi) (pi) (mi) (di)
< 1 403,061 1,339 22.4 3 1 – 4 1,550,285 5,483 1.8 1
. . . . . . . . . . . . . . .
80 – 84 382,303 1,198 701.2 84 85 + 287,877 908 1596.9 145 TOTAL 28,120,065 81,016 561

144 M E T H O D O L O G Y
For the Local Health Area:
Where: pi = area population in age group i;πi = standard population in age group i;
∏ =∑πi = total standard population; di = deaths in LHA population in age group i; and mi = di/pi x 10,000 = mortality rate per 10,000 LHA population in age group i.
• Fertility Rates
Fertility Rates include the Total Fertility Rate (TFR) and Age Specifi c Fertility Rates (ASFRs). Although the TFR is calculated for a hypothetical LHA in the example cited here, the calculation method was applied to each year in Table 3 and Figure 5 and to each of the LHAs in Table 10. The teenage fertility rates shown in Table 10 and Figure 29 are the teenage-specifi c fertility rates, that is the ASFRs for 15-19 year olds, exemplifi ed below.
For the Local Health Area:
1) the age specifi c fertility rate (ASFR) for age group 15–19 years is:
Where: bi = number of live births for age group i; and wi = number of female population for age group i.
2) the total fertility rate (TFR) is:
TFR = a x ∑ASFRi = 5 x (31.8 + … + 3.4) = 1,871
Where: ASFRi = age specifi c fertility rate for age group i; and a = number of years in each age group i.
ASMR = = = 46.2�mi � �i
�
22.4 � 403,061 + ... + 1,596.9 � 287,877
28,120,065
3 x 10,0001,339e.g., mi = = 22.4, for age group 1.
LHA Age Live Female Age Specifi cGroup Births Population Fertility Rate (i) (bi) (wi) (ASFRi)
15 – 19 19 598 31.820 – 24 46 440 104.525 – 29 74 498 148.630 – 34 51 745 68.535 – 39 12 690 17.440 – 44 2 581 3.4TOTAL 204 3,552 374.2
ASFRi = x 1,000 = x 1,000 = 31.8 bi
wi
19598

M E T H O D O L O G Y 145
• Potential Years of Life Lost (PYLL) and Standardized Rate (PYLLSR)
The Potential Years of Life Lost (PYLL) measures presented in this report are based on the number of years of life lost when a person dies before the age of 75 years. Infant deaths (age less than one year old) are included.
For the Local Health Area:
PYLL = ∑di x (75 – Yi )
Where: di = number of deaths in age group i; Yi = age at midpoint of age group i; and ∑ = summation.
2.2 � 403,061 � 74.5 + ... + 28.8 � 834,024 � 2.5
28,120,065PYLLSR = = = 37.0
�mi � �i � (75 - Yi)
�
Where: pi = LHA population in age group i; πi = standard population in age group i; ∏ = ∑πi = total standard population; di = deaths in LHA population in age group i; Yi = age at midpoint of age group i; and mi = (di/pi) x 1,000 = mortality rate per 1,000 LHA population in age group i.
RATIOS • Observed versus Expected Ratios
The following are hypothetical examples that apply to the vital event ratios shown in this report. The fi rst example shows low birth weight (LBW) live births (less than 2,500 grams), but other live birth ratios, such as cesarean deliveries or live births with maternal or perinatal complications, as well as infant deaths ratios can be substituted. Tables 12, 16, 18, 20, and 26 and Figures 30, 32, 33, 34, and 36 present these ratios. Ratios for live births to teenage mothers, elderly gravida live births, pre-term live births, or live births by cesarean, although not shown in this report, would also be calculated the same way as the low birth weight ratios. These ratios based on live births should not be confused with observed versus expected ratios that involve age and gender standardization, such as Standardized Mortality Ratio (SMR) and Potential Years of Life Lost Index (PYLLI). The test of statistical signifi cance is described under Ratios in Statistical Tests of Signifi cance at the end of this Appendix.
LHA Age Age Standard Estimated Death Observed ObservedGroup Factor Population Population Rate/1,000 Deaths PYLL (i) (75–Yi) (πi) (pi) (mi) (di) (di(75–Yi))
< 1 74.5 403,061 1,339 2.2 3 223.51 – 4 72.0 1,550,285 5,483 0.2 1 72.05 – 9 67.5 1,953,045 6,553 0.2 1 67.5 . . . . . . . . . . . . . . . . . . . . .65 – 69 7.5 1,084,588 3,538 18.7 66 495.070 – 74 2.5 834,024 2,779 28.8 80 200.0TOTAL 28,120,065 79,140 239 3,183.0
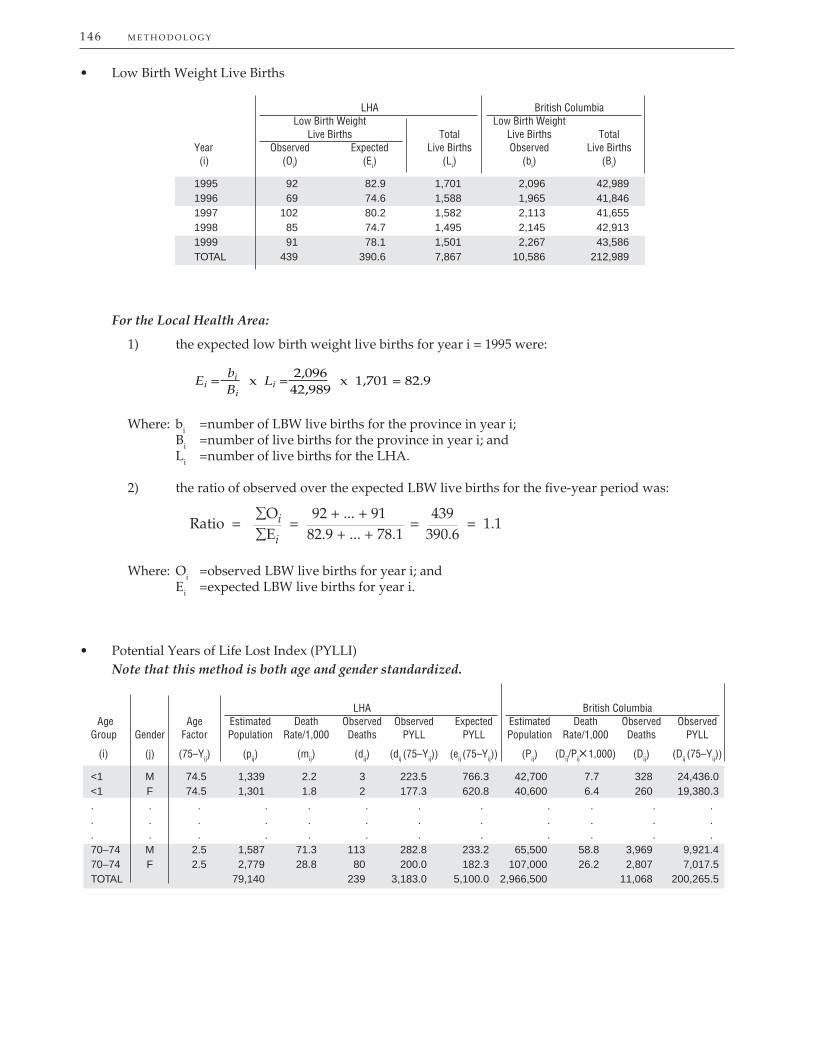
146 M E T H O D O L O G Y
• Low Birth Weight Live Births
For the Local Health Area:
1) the expected low birth weight live births for year i = 1995 were:
Where: bi = number of LBW live births for the province in year i; Bi = number of live births for the province in year i; and Li = number of live births for the LHA.
2) the ratio of observed over the expected LBW live births for the fi ve-year period was:
Where: Oi = observed LBW live births for year i; and Ei = expected LBW live births for year i.
• Potential Years of Life Lost Index (PYLLI) Note that this method is both age and gender standardized.
LHA British Columbia Low Birth Weight Low Birth Weight Live Births Total Live Births TotalYear Observed Expected Live Births Observed Live Births (i) (Oi) (Ei) (Li) (bi) (Bi)
1995 92 82.9 1,701 2,096 42,9891996 69 74.6 1,588 1,965 41,8461997 102 80.2 1,582 2,113 41,6551998 85 74.7 1,495 2,145 42,9131999 91 78.1 1,501 2,267 43,586TOTAL 439 390.6 7,867 10,586 212,989
Ei = x Li = x 1,701 = 82.9bi
Bi
2,09642,989
Ratio = = = = 1.1�Oi 92 + ... + 91 439
�Ei 82.9 + ... + 78.1 390.6
LHA British Columbia Age Age Estimated Death Observed Observed Expected Estimated Death Observed ObservedGroup Gender Factor Population Rate/1,000 Deaths PYLL PYLL Population Rate/1,000 Deaths PYLL
(i) (j) (75–Yij) (pij) (mij) (dij) (dij (75–Yij)) (eij (75–Yij)) (Pij) (Dij/Pij×1,000) (Dij) (Dij (75–Yij))
<1 M 74.5 1,339 2.2 3 223.5 766.3 42,700 7.7 328 24,436.0<1 F 74.5 1,301 1.8 2 177.3 620.8 40,600 6.4 260 19,380.3. . . . . . . . . . . .. . . . . . . . . . . .. . . . . . . . . . . .70–74 M 2.5 1,587 71.3 113 282.8 233.2 65,500 58.8 3,969 9,921.470–74 F 2.5 2,779 28.8 80 200.0 182.3 107,000 26.2 2,807 7,017.5TOTAL 79,140 239 3,183.0 5,100.0 2,966,500 11,068 200,265.5

M E T H O D O L O G Y 147
For the Local Health Area:
Where: O = observed PYLL; E = expected PYLL; dij = observed deaths in age group i and gender j; eij = expected deaths in age group i and gender j; Yij = age at midpoint of age group i and gender j; pij = LHA population for age group i and gender j; Pij = provincial population for age group i and gender j; Dij = provincial deaths for age group i and gender j.
1) Observed PYLL (O) The number of potential years of life lost (PYLL) based on the number and age at death of deaths that
occurred in the LHA. For example, for age group under one year of age and gender j, the observed PYLL are:
Observed PYLL = deaths x age factor = dij (75-Yij) = 3 x 74.5 = 223.5
2) Expected PYLL (E) The number of potential years of life lost (PYLL) expected for residents of the LHA based on the PYLL
from the expected deaths in the age group. For example, for age group under one year of age and gender j, the expected PYLL are: Expected PYLL = expected deaths x age factor = eij (75 – Yij) = Dij x pij x (75 – Yij) Pij = 328 x 1,339 x 74.5 = 766.3 42,700
• Standardized Mortality Ratio (SMR) Note that this method is both age and gender standardized.
For the Local Health Area:
Where: dij = observed deaths in age group i and gender j; and eij = expected deaths in age group i and gender j.
LHA British Columbia Age Estimated Death Observed Expected Estimated Death ObservedGroup Gender Population Rate/1,000 Deaths Deaths Population Rate/1,000 Deaths (i) (j) (pij) (mij) (dij) (eij) (Pij) (Mij) (Dij)
< 1 M 1,339 2.2 3 10.3 42,700 7.7 328< 1 F 1,301 1.8 2 8.3 40,600 6.4 260. . . . . . . . .. . . . . . . . .. . . . . . . . .85 + M 1,198 70.1 84 87.2 48,100 72.8 3,50285 + F 908 159.7 145 138.8 34,500 152.8 5,272TOTAL 81,016 561 595.1 3,131,700 23,389
SMR = = = = 0.9∑dij
∑eij
3 + 2 + … + 110 + 14510.3 + 8.3 + … + 92.6 + 138.8
561595.1

148 M E T H O D O L O G Y
1) Observed Deaths (d) The actual number of deaths that occurred in the LHA. For example, for age group under one year of
age and gender j, the observed deaths are three.
2) Expected Deaths (e) The number of deaths expected for residents of the LHA based on the age specifi c mortality rates for
the province as a whole and the population age structure of the LHA. For age group under one year and gender j, the expected deaths are:
Where: pij = LHA population for age group i and gender j; Dij = provincial deaths for age group i and gender j; and Pij = provincial population for age group i and gender j.
• Estimation of Smoking Attributable Mortality (SAM)
This report uses an estimation method to approximate the extent of smoking-attributable deaths based on the concept of attributable risk. To defi ne attributable risk mathematically, consider d0 and d1 respectively to represent the death rates, in a given time period, in two cohorts from a population — those not exposed and those exposed to a given risk factor. The attributable risk of this factor, AR1 , would then be:
Where: r1 = d1/d0 is the relative risk of the exposed cohort.
The relative risk of the unexposed cohort is r0 = 1; the attributable risk of this cohort is AR0 = 0.
The attributable risk (AR) for the population as a whole (exposed plus unexposed cohorts) is given by:
Where: p1 = the proportion or fraction of the population exposed to the risk factor; and 1-p1 = the proportion or fraction of the population not exposed to the risk factor.
This may be extended to account for multiple levels of exposure, as follows:
Where: pi = the proportion (prevelance) of the population in the ith level of exposure group; ri = the relative risk at the ith level of exposure; and i = the ith risk category.
When applied to smoking-attributable mortality (SAM), the attributable risk is often expressed as a percentage: SAM (%) = AR x 100
eij = x pij = x 1,339 = 10.3Dij
Pij
32842,700
AR1 = =d1 - d 0
d1
r1 - 1
r1
AR = =(p1) (r1 - 1)
(p1) (r1 - 1) + 1
p1 (r1 - 1)
p1 (r1) + (1 - p 1) (r0)
AR =
pi (ri - 1)n
�i = 1
pi (ri - 1) + 1n
�i = 1

M E T H O D O L O G Y 149
Smoking-attributable deaths are derived by multiplying the smoking-attributable mortality percentage expressed as a decimal fraction by the number of deaths aged 35+ in each of 19 specifi ed cause of death categories. These categories are comprised of selected malignant neoplasms, circulatory system diseases, and respiratory system diseases, and are listed in the Glossary.
Relative-risk data from the American Society’s Cancer Prevention Study (CPS-II) 1982–19881 were selected for use, as they have been widely used for similar analyses. The data from CPS–II established the age groups and the classifi cation of smokers (current, former, and never) for which smoking prevalence data were required. The relative risk age categories were for 35+, or 35-64 and 65+. B.C. prevalence rates for smoking wereprovided in the Tobacco Use in B.C. (1997) survey commissioned by the B.C. and Yukon Health and Stroke Foundation.2
STATISTICAL TESTS OF SIGNIFICANCE • Chi Square
For ratios, such as SMRs, a Chi-square ( ) test is applied to determine whether the observed number of cases is statistically signifi cantly different from the expected number. For LHA l:
(with one degree of freedom).
Where: Ol = Observed number for LHA l; and El = Expected number for LHA l.
If �2
l > 3.84, the ratio is statistically signifi cant at 5% signifi cance level.
For SMR values, the Chi-square statistic that is applied is:
Where: Ôl = Ol if Ol > El; otherwise Ôl = Ol + 1.
• Confi dence Intervals
For rates, such as ASMRs, the test employed to determine statistical signifi cance is a confi dence interval. The 95% confi dence interval for the difference (D) between a LHA and a provincial rate is defi ned by the upper and lower limits of the interval as follows:
1Centres for Disease Control. (1990). Smoking and health: A national status report. (DHSS publication no. (CDC) 87-8396). 2nd Edition.Rockville, MD: U.S. Department of Health and Human Services.2Tobacco Use in B.C., ANGUS REID GROUP survey results, September 1997.
� = (Ol - El)2
El
2
l
El?Ôl
X = 9Ôl (1 - - ( )1/3)2
2l
19Ôl
Lower Limit = D - 1.96 R 2 l R 2
p
O l Op
+
Upper Limit = D + 1.96 R 2l R 2
p
O l O p
+
�2
l

150 M E T H O D O L O G Y
Where: Rl = Rate for LHA l; Rp = Rate for the province; Ol = Observed number for LHA l; and Op = Observed number for the province.
If the Lower Limit > 0, then Rl is statistically signifi cantly higher than Rp;if the Upper Limit < 0, then Rl is statistically signifi cantly lower than Rp; otherwise,there is no statistically signifi cant difference.
• P Value
The p-value is the probability of rejecting the null hypothesis when a specifi ed test procedure is used on a given data set. This probability is the smallest level of signifi cance at which the null hypothesis would be rejected. Once the p-value has been determined, the conclusion at any particular level α results from comparing the p-value to α (e.g., 0.05):
(a) p-value ≤ α reject null hypothesis at level α,
(b) p-value > α do not reject the null hypothesis at level α,
and we call the data statistically signifi cant when the null hypothesis is rejected and not signifi cant otherwise.

Appendix One
Statistical Summaries by Health Authority, Health Service Delivery Area, Local Health Area, and Community
British Columbia, 2005
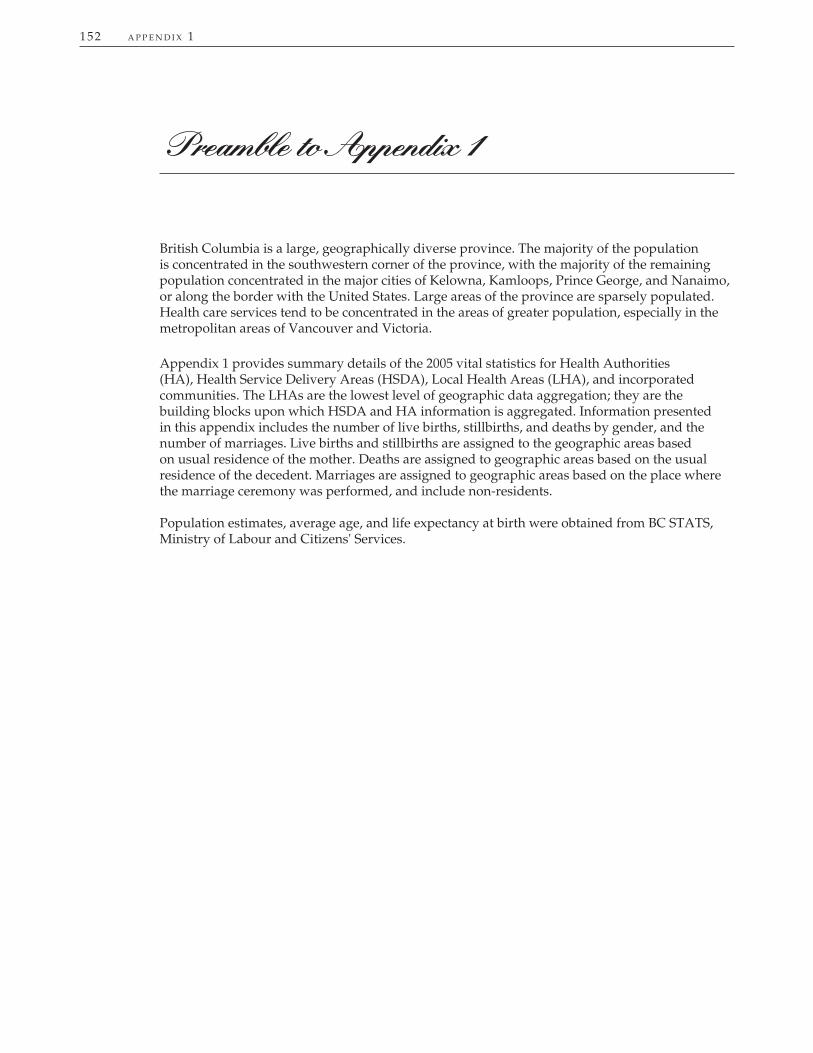
152 A P P E N D I X 1
Preamble to Appendix 1
British Columbia is a large, geographically diverse province. The majority of the population is concentrated in the southwestern corner of the province, with the majority of the remaining population concentrated in the major cities of Kelowna, Kamloops, Prince George, and Nanaimo, or along the border with the United States. Large areas of the province are sparsely populated. Health care services tend to be concentrated in the areas of greater population, especially in the metropolitan areas of Vancouver and Victoria.
Appendix 1 provides summary details of the 2005 vital statistics for Health Authorities (HA), Health Service Delivery Areas (HSDA), Local Health Areas (LHA), and incorporated communities. The LHAs are the lowest level of geographic data aggregation; they are the building blocks upon which HSDA and HA information is aggregated. Information presented in this appendix includes the number of live births, stillbirths, and deaths by gender, and the number of marriages. Live births and stillbirths are assigned to the geographic areas based on usual residence of the mother. Deaths are assigned to geographic areas based on the usual residence of the decedent. Marriages are assigned to geographic areas based on the place where the marriage ceremony was performed, and include non-residents.
Population estimates, average age, and life expectancy at birth were obtained from BC STATS, Ministry of Labour and Citizens' Services.

A P P E N D I X 1 153
APPENDIX 1STATISTICAL SUMMARIES BY HEALTH AUTHORITY, HEALTH
SERVICE DELIVERY AREA, LOCAL HEALTH AREA AND COMMUNITYBR I T I S H CO L U M B I A, 2005
Health Authority/Health Service Delivery Area/Local Health Area/Community (Incorporated Only)
Type†
Gender Population Live Births Deaths Marriages StillbirthsAverage AgePopulation
LifeExpectancy(2001-2005)
HSDA 11 EAST KOOTENAY
LHA 001 Fernie M 8,317 61 50 - 37.8 77.8 F 7,577 59 37 - 38.2 83.6 T 15,894 120 87 109 - 38.0 80.6 Elkford DM M 7 3 - F 9 4 - T 2,670 16 7 9 - Fernie C M 24 27 - F 29 22 - T 5,126 53 49 67 - Sparwood DM M 14 11 - F 15 3 - T 3,973 29 14 10 - LHA 002 Cranbrook M 13,091 108 113 - 38.4 77.8 F 13,230 109 106 2 39.7 82.0 T 26,321 217 219 136 2 39.1 79.9 Cranbrook C M 94 95 - F 89 92 2 T 19,774 183 187 89 2 LHA 003 Kimberley M 4,497 34 38 - 42.8 80.1 F 4,552 27 54 - 43.9 82.2 T 9,049 61 92 45 - 43.4 81.2 Kimberley C M 28 33 - F 24 47 - T 7,049 52 80 38 - LHA 004 Windermere M 5,386 38 31 - 38.8 79.1 F 5,213 36 20 1 39.7 86.4 T 10,599 74 51 110 1 39.2 82.6 Canal Flats VL M 5 2 - F 4 2 - T 680 9 4 2 - Invermere DM M 8 16 - F 12 8 - T 3,256 20 24 29 - Radium Hot VL M 7 - - Springs F 10 - - T 813 17 - 19 - LHA 005 Creston M 6,424 63 77 - 41.8 78.2 F 6,537 56 68 - 43.7 84.6 T 12,961 119 145 57 - 42.8 81.3 Creston T M 23 53 - F 18 51 - T 5,097 41 104 30 - LHA 018 Golden M 4,131 38 16 - 36.7 79.0 F 3,783 40 18 - 37.2 85.3 T 7,914 78 34 126 - 36.9 81.9 Golden T M 37 14 - F 35 17 - T 4,399 72 31 54 - TOTAL M 41,846 342 325 - 39.2 78.6 F 40,892 327 303 3 40.3 83.4 T 82,738 669 628 583 3 39.7 80.9

154 A P P E N D I X 1
APPENDIX 1 – continuedSTATISTICAL SUMMARIES BY HEALTH AUTHORITY, HEALTH
SERVICE DELIVERY AREA, LOCAL HEALTH AREA AND COMMUNITYBR I T I S H CO L U M B I A, 2005
Health Authority/Health Service Delivery Area/Local Health Area/Community (Incorporated Only)
Type†
Gender Population Live Births Deaths Marriages StillbirthsAverage AgePopulation
LifeExpectancy(2001-2005)
10
13
12 11
9
7
6
HSDA 12 KOOTENAY BOUNDARY
LHA 006 Kootenay Lake M 1,844 26 17 - 41.6 79.5 F 1,766 16 15 - 43.4 86.9 T 3,610 42 32 33 - 42.5 82.8 Kaslo VL M 13 10 - F 9 11 - T 1,075 22 21 18 - LHA 007 Nelson M 12,452 116 81 2 39.6 78.3 F 12,478 93 100 1 40.8 82.7 T 24,930 209 181 151 3 40.2 80.5 Nelson C M 46 46 - F 41 58 - T 9,797 87 104 81 - Salmo VL M 18 6 1 F 7 10 - T 1,133 25 16 7 1 Slocan VL M 3 3 - F 4 2 - T 357 7 5 4 - LHA 009 Castlegar M 6,857 49 54 - 40.0 77.6 F 6,757 41 64 - 41.2 81.8 T 13,614 90 118 41 - 40.6 79.7 Castlegar C M 35 36 - F 23 43 - T 7,821 58 79 29 - LHA 010 Arrow Lakes M 2,642 11 29 - 41.6 76.9 F 2,552 13 23 - 43.2 83.4 T 5,194 24 52 45 - 42.4 80.1 Nakusp VL M 4 12 - F 7 12 - T 1,779 11 24 25 - New Denver VL M 2 10 - F 3 7 - T 549 5 17 10 - Silverton VL M 1 1 - F 1 2 - T 230 2 3 5 - LHA 011 Trail M 9,975 80 107 1 41.1 75.8 F 10,350 77 89 - 43.1 80.9 T 20,325 157 196 90 1 42.1 78.4 Fruitvale VL M 12 19 - F 16 6 - T 2,083 28 25 21 - Montrose VL M 2 2 - F 1 4 - T 1,086 3 6 4 - Rossland C M 17 10 - F 15 5 - T 3,725 32 15 12 - Trail C M 43 68 1 F 29 62 - T 7,889 72 130 43 1 Warfi eld VL M 5 5 - F 11 7 - T 1,751 16 12 7 -

A P P E N D I X 1 155
APPENDIX 1 – continuedSTATISTICAL SUMMARIES BY HEALTH AUTHORITY, HEALTH
SERVICE DELIVERY AREA, LOCAL HEALTH AREA AND COMMUNITYBR I T I S H CO L U M B I A, 2005
Health Authority/Health Service Delivery Area/Local Health Area/Community (Incorporated Only)
Type†
Gender Population Live Births Deaths Marriages StillbirthsAverage AgePopulation
LifeExpectancy(2001-2005)
LHA 012 Grand Forks M 4,667 30 50 1 43.0 78.7 F 4,524 29 48 - 45.0 81.1 T 9,191 59 98 36 1 44.0 79.8 Grand Forks C M 24 41 - F 27 46 - T 4,200 51 87 25 - LHA 013 Kettle Valley M 1,912 7 20 1 42.8 80.5 F 1,690 19 9 - 43.2 94.0 T 3,602 26 29 16 1 43.0 85.4 Greenwood C M 2 9 - F 6 1 - T 668 8 10 3 - Midway VL M 1 7 - F 1 4 - T 630 2 11 6 - TOTAL M 40,349 319 358 5 40.8 77.6 F 40,117 288 348 1 42.3 82.1 T 80,466 607 706 412 6 41.6 79.8
HSDA 13 OKANAGAN
LHA 014 Southern M 9,555 50 128 1 47.1 77.4 Okanagan F 9,966 55 126 - 48.0 82.6 T 19,521 105 254 111 1 47.6 80.0 Oliver T M 31 71 - F 32 61 - T 4,379 63 132 51 - Osoyoos T M 9 34 - F 8 46 - T 4,801 17 80 38 - LHA 015 Penticton M 19,896 158 282 1 42.8 76.8 F 21,665 142 274 - 45.4 82.7 T 41,561 300 556 256 1 44.1 79.8 Penticton C M 131 250 1 F 112 255 - T 33,061 243 505 186 1 LHA 016 Keremeos M 2,615 12 45 - 47.2 74.1 F 2,550 16 30 - 45.9 80.2 T 5,165 28 75 22 - 46.5 76.8 Keremeos VL M 6 29 - F 11 23 - T 1,306 17 52 10 - LHA 017 Princeton M 2,475 18 29 - 46.2 75.9 F 2,424 17 27 - 46.2 82.2 T 4,899 35 56 20 - 46.2 78.9 Princeton T M 17 27 - F 17 27 - T 2,688 34 54 12 - LHA 021 Armstrong- M 4,980 38 52 - 40.3 78.8 Spallumcheen F 5,253 41 39 - 41.4 84.1 T 10,233 79 91 33 - 40.9 81.4 Armstrong C M 29 39 - F 31 34 - T 4,526 60 73 24 - Spallumcheen DM M 9 13 - F 10 5 - T 5,707 19 18 9 -

156 A P P E N D I X 1
APPENDIX 1 – continuedSTATISTICAL SUMMARIES BY HEALTH AUTHORITY, HEALTH
SERVICE DELIVERY AREA, LOCAL HEALTH AREA AND COMMUNITYBR I T I S H CO L U M B I A, 2005
Health Authority/Health Service Delivery Area/Local Health Area/Community (Incorporated Only)
Type†
Gender Population Live Births Deaths Marriages StillbirthsAverage AgePopulation
LifeExpectancy(2001-2005)
LHA 022 Vernon M 30,509 281 318 2 40.2 76.9 F 32,008 253 294 3 42.3 82.4 T 62,517 534 612 332 5 41.3 79.7 Coldstream DM M 36 31 - F 31 20 1 T 10,102 67 51 83 1 Lumby VL M 18 18 - F 17 10 - T 1,738 35 28 23 - Vernon C M 188 230 2 F 167 250 1 T 36,232 355 480 176 3 LHA 023 Central Okanagan M 81,901 703 722 5 40.1 78.9 F 86,035 699 653 6 42.1 83.5 T 167,936 1,402 1,375 996 11 41.1 81.3 Kelowna C M 480 528 2 F 469 488 1 T 109,490 949 1,016 742 3 Lake Country DM M 41 34 2 F 33 32 2 T 10,367 74 66 79 4 Peachland DM M 22 15 - F 23 15 - T 5,230 45 30 35 - LHA 077 Summerland M 5,721 27 61 - 44.2 79.5 F 6,170 40 63 - 46.6 82.3 T 11,891 67 124 74 - 45.4 80.9 Summerland DM M 27 61 - F 40 63 - T 11,405 67 124 74 - LHA 078 Enderby M 3,838 32 43 - 40.4 75.5 F 3,886 43 32 - 41.6 82.4 T 7,724 75 75 52 - 41.0 78.8 Enderby C M 25 35 - F 38 29 - T 3,073 63 64 45 - TOTAL M 161,490 1,319 1,680 9 41.3 78.0 F 169,957 1,306 1,538 9 43.1 83.0 T 331,447 2,625 3,218 1,896 18 42.2 80.5
HSDA 14 THOMPSON CARIBOO SHUSWAP
LHA 019 Revelstoke M 4,381 43 29 1 38.0 77.0 F 4,212 30 20 - 38.8 82.5 T 8,593 73 49 53 1 38.4 79.6 Revelstoke C M 43 29 1 F 30 20 - T 7,964 73 49 53 1 LHA 020 Salmon Arm M 16,746 136 171 1 41.7 76.7 F 17,126 124 146 1 43.5 82.3 T 33,872 260 317 183 2 42.6 79.4 Salmon Arm C M 84 106 - F 67 93 1 T 16,800 151 199 109 1

A P P E N D I X 1 157
APPENDIX 1 – continuedSTATISTICAL SUMMARIES BY HEALTH AUTHORITY, HEALTH
SERVICE DELIVERY AREA, LOCAL HEALTH AREA AND COMMUNITYBR I T I S H CO L U M B I A, 2005
Health Authority/Health Service Delivery Area/Local Health Area/Community (Incorporated Only)
Type†
Gender Population Live Births Deaths Marriages StillbirthsAverage AgePopulation
LifeExpectancy(2001-2005)
Sicamous DM M 11 17 - F 11 17 - T 3,043 22 34 22 - LHA 024 Kamloops M 52,536 447 420 2 38.9 76.4 F 53,265 427 375 3 40.3 81.7 T 105,801 874 795 531 5 39.6 79.0 Chase VL M 20 26 - F 22 24 - T 2,568 42 50 49 - Kamloops C M 377 312 1 F 355 315 3 T 82,714 732 627 380 4 Logan Lake DM M 6 17 - F 6 5 - T 2,314 12 22 4 - LHA 025 100 Mile House M 7,642 48 66 1 41.5 77.0 F 7,303 43 50 - 40.6 81.2 T 14,945 91 116 74 1 41.0 78.8 100 Mile House DM M 22 27 1 F 22 28 - T 1,826 44 55 32 1 LHA 026 North Thompson M 2,786 20 15 - 37.7 77.4 F 2,554 23 10 - 36.9 80.9 T 5,340 43 25 33 - 37.3 79.4LHA 027 Cariboo-Chilcotin M 14,986 150 81 3 36.4 75.8 F 14,372 118 80 1 37.0 81.1 T 29,358 268 161 122 4 36.7 78.3 Williams Lake C M 81 42 1 F 56 44 1 T 11,872 137 86 59 2 LHA 029 Lillooet M 2,442 26 19 - 36.7 75.5 F 2,358 30 19 - 37.2 80.7 T 4,800 56 38 26 - 37.0 77.9 Lillooet DM M 25 15 - F 25 17 - T 2,755 50 32 14 - LHA 030 South Cariboo M 4,062 31 38 - 41.2 75.4 F 3,841 42 27 1 40.2 79.7 T 7,903 73 65 27 1 40.7 77.3 Ashcroft VL M 10 16 - F 9 13 1 T 1,836 19 29 9 1 Cache Creek VL M 5 10 - F 18 8 - T 1,134 23 18 9 - Clinton VL M 5 5 - F 2 2 - T 654 7 7 3 - Lytton VL M 10 6 - F 12 3 - T 334 22 9 4 -

158 A P P E N D I X 1
APPENDIX 1 – continuedSTATISTICAL SUMMARIES BY HEALTH AUTHORITY, HEALTH
SERVICE DELIVERY AREA, LOCAL HEALTH AREA AND COMMUNITYBR I T I S H CO L U M B I A, 2005
Health Authority/Health Service Delivery Area/Local Health Area/Community (Incorporated Only)
Type†
Gender Population Live Births Deaths Marriages StillbirthsAverage AgePopulation
LifeExpectancy(2001-2005)
LHA 031 Merritt M 5,901 65 54 1 37.5 74.0 F 5,848 52 45 - 37.5 77.6 T 11,749 117 99 53 1 37.5 75.7 Merritt C M 56 48 1 F 41 40 - T 7,561 97 88 40 1 TOTAL M 111,482 966 893 9 39.1 76.3 F 110,879 889 772 6 40.0 81.5 T 222,361 1,855 1,665 1,102 15 39.5 78.8HA 01 INTERIOR M 355,167 2,946 3,256 23 40.3 77.5 TOTAL F 361,845 2,810 2,961 19 41.8 82.5 T 717,012 5,756 6,217 3,993 42 41.0 80.0
HSDA 21 FRASER EAST
LHA 032 Hope M 4,567 38 53 - 41.2 76.8 F 4,324 37 48 1 41.8 79.6 T 8,891 75 101 30 1 41.5 77.9 Hope DM M 34 49 - F 34 43 1 T 6,591 68 92 23 1 LHA 033 Chilliwack M 38,548 445 337 - 37.6 77.4 F 39,879 458 333 2 39.5 82.0 T 78,427 903 670 415 2 38.6 79.7 Chilliwack C M 415 290 - F 407 303 2 T 70,522 822 593 312 2 LHA 034 Abbotsford M 63,877 852 490 8 36.0 78.3 F 64,289 751 460 7 38.2 83.1 T 128,166 1,603 950 564 16 37.1 80.7 Abbotsford C M 847 490 8 F 749 460 7 T 127,434 1,596 950 561 15 LHA 075 Mission M 20,394 231 160 1 36.3 76.9 F 19,496 214 147 3 37.1 81.6 T 39,890 445 307 186 4 36.7 79.1 Mission DM M 211 142 1 F 194 136 3 T 34,742 405 278 156 4 LHA 076 Agassiz-Harrison M 4,855 42 33 1 39.2 78.1 F 4,048 49 26 - 39.7 81.0 T 8,903 91 59 152 1 39.4 79.4 Harrison Hot VL M 7 5 1 Springs F 10 2 - T 1,585 17 7 87 1 Kent DM M 35 28 - F 39 24 - T 5,680 74 52 65 - TOTAL M 132,241 1,608 1,073 10 36.8 77.7 F 132,036 1,509 1,014 13 38.6 82.3 T 264,277 3,117 2,087 1,347 24 37.7 80.0

A P P E N D I X 1 159
APPENDIX 1 – continuedSTATISTICAL SUMMARIES BY HEALTH AUTHORITY, HEALTH
SERVICE DELIVERY AREA, LOCAL HEALTH AREA AND COMMUNITYBR I T I S H CO L U M B I A, 2005
Health Authority/Health Service Delivery Area/Local Health Area/Community (Incorporated Only)
Type†
Gender Population Live Births Deaths Marriages StillbirthsAverage AgePopulation
LifeExpectancy(2001-2005)
HSDA 22 FRASER NORTH
LHA 040 New Westminster M 28,407 308 243 2 39.7 76.8 F 29,073 315 266 6 42.1 82.2 T 57,480 623 509 305 9 40.9 79.6 New C M 308 243 2 Westminster F 315 266 6 T 57,480 623 509 305 8 LHA 041 Burnaby M 100,806 1,083 692 10 38.9 79.5 F 103,518 993 684 10 40.9 84.1 T 204,324 2,076 1,376 877 20 39.9 81.9 Burnaby C M 1,083 692 10 F 993 684 10 T 204,324 2,076 1,376 877 20 LHA 042 Maple Ridge M 45,076 412 302 3 36.2 77.3 F 45,139 427 284 7 37.5 81.3 T 90,215 839 586 414 10 36.8 79.4 Maple Ridge DM M 339 258 3 F 352 249 5 T 73,280 691 507 279 8 Pitt Meadows DM M 71 44 - F 70 35 2 T 16,673 141 79 135 2 LHA 043 Coquitlam M 104,999 1,010 436 2 36.6 79.9 F 105,429 980 511 9 38.1 83.2 T 210,428 1,990 947 572 11 37.4 81.6 Anmore VL M 12 4 - F 9 2 - T 1,673 21 6 5 - Belcarra VL M 6 2 - F 3 2 - T 723 9 4 1 - Coquitlam C M 541 257 1 F 545 314 6 T 121,973 1,086 571 376 7 Port Coquitlam C M 292 114 - F 267 138 2 T 57,563 559 252 94 2 Port Moody C M 159 59 1 F 156 55 1 T 28,458 315 114 96 2 TOTAL M 279,288 2,813 1,673 17 37.7 79.0 F 283,159 2,715 1,745 32 39.5 83.2 T 562,447 5,528 3,418 2,168 50 38.6 81.2
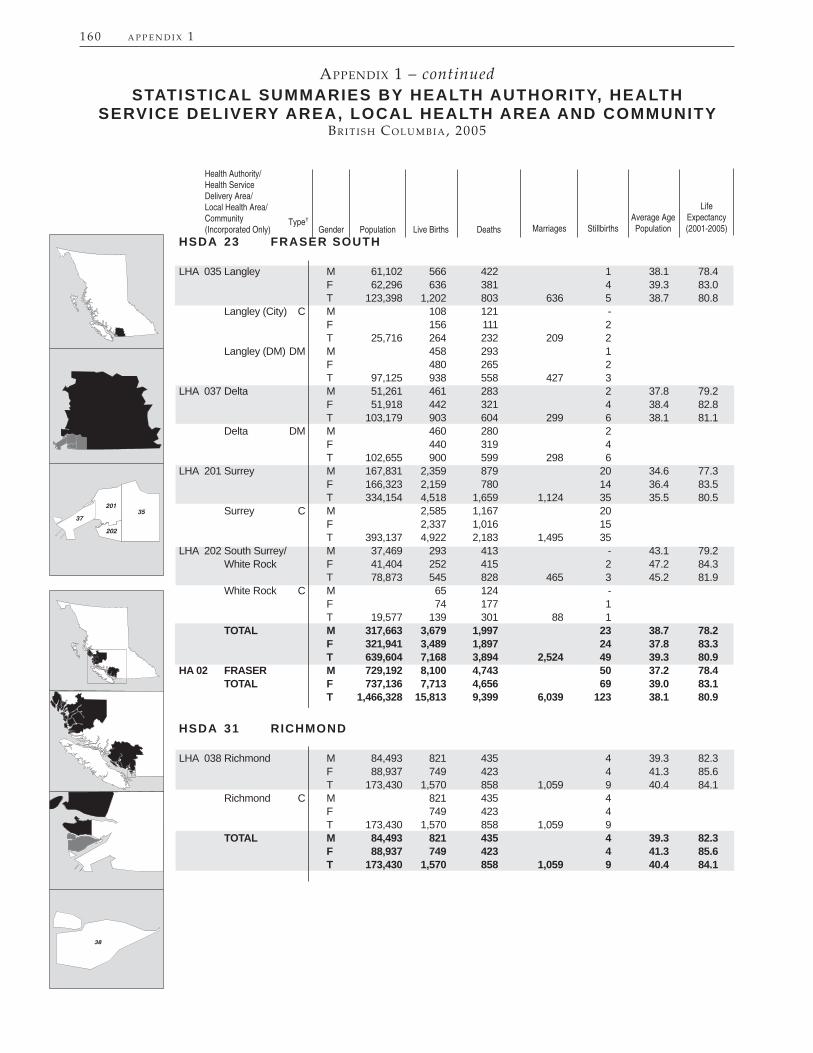
160 A P P E N D I X 1
APPENDIX 1 – continuedSTATISTICAL SUMMARIES BY HEALTH AUTHORITY, HEALTH
SERVICE DELIVERY AREA, LOCAL HEALTH AREA AND COMMUNITYBR I T I S H CO L U M B I A, 2005
Health Authority/Health Service Delivery Area/Local Health Area/Community (Incorporated Only)
Type†
Gender Population Live Births Deaths Marriages StillbirthsAverage AgePopulation
LifeExpectancy(2001-2005)
HSDA 23 FRASER SOUTH
LHA 035 Langley M 61,102 566 422 1 38.1 78.4 F 62,296 636 381 4 39.3 83.0 T 123,398 1,202 803 636 5 38.7 80.8 Langley (City) C M 108 121 - F 156 111 2 T 25,716 264 232 209 2 Langley (DM) DM M 458 293 1 F 480 265 2 T 97,125 938 558 427 3 LHA 037 Delta M 51,261 461 283 2 37.8 79.2 F 51,918 442 321 4 38.4 82.8 T 103,179 903 604 299 6 38.1 81.1 Delta DM M 460 280 2 F 440 319 4 T 102,655 900 599 298 6 LHA 201 Surrey M 167,831 2,359 879 20 34.6 77.3 F 166,323 2,159 780 14 36.4 83.5 T 334,154 4,518 1,659 1,124 35 35.5 80.5 Surrey C M 2,585 1,167 20 F 2,337 1,016 15 T 393,137 4,922 2,183 1,495 35 LHA 202 South Surrey/ M 37,469 293 413 - 43.1 79.2 White Rock F 41,404 252 415 2 47.2 84.3 T 78,873 545 828 465 3 45.2 81.9 White Rock C M 65 124 - F 74 177 1 T 19,577 139 301 88 1 TOTAL M 317,663 3,679 1,997 23 38.7 78.2 F 321,941 3,489 1,897 24 37.8 83.3 T 639,604 7,168 3,894 2,524 49 39.3 80.9HA 02 FRASER M 729,192 8,100 4,743 50 37.2 78.4 TOTAL F 737,136 7,713 4,656 69 39.0 83.1 T 1,466,328 15,813 9,399 6,039 123 38.1 80.9
HSDA 31 RICHMOND
LHA 038 Richmond M 84,493 821 435 4 39.3 82.3 F 88,937 749 423 4 41.3 85.6 T 173,430 1,570 858 1,059 9 40.4 84.1 Richmond C M 821 435 4 F 749 423 4 T 173,430 1,570 858 1,059 9 TOTAL M 84,493 821 435 4 39.3 82.3 F 88,937 749 423 4 41.3 85.6 T 173,430 1,570 858 1,059 9 40.4 84.1

A P P E N D I X 1 161
APPENDIX 1 – continuedSTATISTICAL SUMMARIES BY HEALTH AUTHORITY, HEALTH
SERVICE DELIVERY AREA, LOCAL HEALTH AREA AND COMMUNITYBR I T I S H CO L U M B I A, 2005
Health Authority/Health Service Delivery Area/Local Health Area/Community (Incorporated Only)
Type†
Gender Population Live Births Deaths Marriages StillbirthsAverage AgePopulation
LifeExpectancy(2001-2005)
HSDA 32 VANCOUVER
LHA 161 Vancouver - M 53,127 438 338 4 39.1 77.2 City Centre F 51,459 429 270 2 40.1 83.0 T 104,586 867 608 1,319 6 39.6 80.1LHA 162 Vancouver - M 28,261 266 354 1 41.2 70.4 Downtown F 23,769 230 161 1 41.4 80.6 Eastside T 52,030 496 515 410 2 41.3 74.5LHA 163 Vancouver - M 49,066 585 301 7 38.2 80.0 North East F 49,895 549 303 2 40.0 84.0 T 98,961 1,134 604 474 9 39.1 82.0LHA 164 Vancouver - M 59,274 590 358 2 38.1 81.7 Westside F 64,931 526 394 2 40.3 85.0 T 124,205 1,116 752 1,263 4 39.3 83.5LHA 165 Vancouver - M 42,725 505 243 4 37.9 79.2 Midtown F 43,847 485 200 8 39.7 83.9 T 86,572 990 443 398 12 38.8 81.6LHA 166 Vancouver - M 61,415 656 369 6 39.1 81.3 South F 65,504 639 472 7 41.3 84.7 T 126,919 1,295 841 387 13 40.2 83.0 TOTAL M 293,868 3,046 1,966 25 38.8 78.8 F 299,405 2,862 1,802 22 40.4 84.0 T 593,273 5,908 3,768 4,256 48 39.6 81.4
HSDA 33 NORTH SHORE/COAST GARIBALDI
LHA 044 North Vancouver M 66,085 576 395 4 39.1 81.0 F 69,512 599 419 1 41.0 83.9 T 135,597 1,175 814 461 5 40.1 82.5 North C M 338 231 1 Vancouver F 329 261 - T 46,759 667 492 326 1 North DM M 228 158 2 Vancouver F 256 155 1 T 87,083 484 313 129 3 LHA 045 West Vancouver- M 24,390 148 245 3 43.8 82.3 Bowen Island F 27,148 151 257 - 46.2 85.3 T 51,538 299 502 322 3 45.1 83.9 Bowen Island IM M 17 7 - F 21 3 - T 3,424 38 10 35 - Lions Bay VL M 7 3 - F 7 2 - T 1,421 14 5 11 - West DM M 118 228 3 Vancouver F 114 244 - T 44,149 232 472 271 3 LHA 046 Sunshine Coast M 13,925 89 130 1 42.0 78.9 F 14,632 104 118 - 42.8 82.3 T 28,557 193 248 165 1 42.4 80.5 Gibsons T M 30 38 - F 37 35 - T 4,349 67 73 52 - Sechelt/ DM/ M 32 55 1 Sechelt IGD F 36 57 - Indian Gov. Dist. T 9,713 68 112 54 1

162 A P P E N D I X 1
APPENDIX 1 – continuedSTATISTICAL SUMMARIES BY HEALTH AUTHORITY, HEALTH
SERVICE DELIVERY AREA, LOCAL HEALTH AREA AND COMMUNITYBR I T I S H CO L U M B I A, 2005
Health Authority/Health Service Delivery Area/Local Health Area/Community (Incorporated Only)
Type†
Gender Population Live Births Deaths Marriages StillbirthsAverage AgePopulation
LifeExpectancy(2001-2005)
LHA 047 Powell River M 10,483 60 121 1 41.3 77.3 F 10,237 76 101 - 42.8 81.8 T 20,720 136 222 88 1 42.0 79.5 Powell River C M 38 86 - F 52 85 - T 13,831 90 171 43 - LHA 048 Howe Sound M 17,073 208 65 1 35.0 78.0 F 15,320 173 50 1 35.0 83.8 T 32,393 381 115 415 3 35.0 80.8 Pemberton VL M 34 2 - F 21 2 - T 2,517 55 4 15 - Squamish DM M 99 45 1 F 101 39 1 T 15,726 200 84 56 2 Whistler RM M 38 9 - F 31 2 - T 9,775 69 11 289 - LHA 049 Bella M 1,793 30 7 - 34.6 72.5 Coola Valley F 1,601 24 12 1 35.6 80.4 T 3,394 54 19 12 1 35.1 76.1LHA 083 Central Coast M 902 18 6 - 34.9 68.8 F 810 12 7 - 34.7 70.4 T 1,712 30 13 2 - 34.8 70.2 TOTAL M 134,651 1,129 969 10 39.8 80.2 F 139,260 1,139 964 3 41.6 83.7 T 273,911 2,268 1,933 1,465 14 40.7 82.0HA 03 VANCOUVER M 513,012 4,996 3,370 39 39.1 79.7 COASTAL F 527,602 4,750 3,189 29 40.9 84.2 TOTAL T 1,040,614 9,746 6,559 6,780 71 40.0 82.0
HSDA 41 SOUTH VANCOUVER ISLAND
LHA 061 Greater Victoria M 101,005 923 977 6 40.6 78.1 F 111,956 837 1,131 2 43.8 82.7 T 212,961 1,760 2,108 1,293 8 42.3 80.6 Esquimalt DM M 74 63 - F 78 58 - T 17,156 152 121 116 - Oak Bay DM M 43 105 2 F 39 109 - T 18,313 82 214 129 2 Victoria C M 333 478 2 F 292 634 - T 77,369 625 1,112 788 2 View Royal T M 51 27 - F 53 26 - T 8,382 104 53 21 -

A P P E N D I X 1 163
APPENDIX 1 – continuedSTATISTICAL SUMMARIES BY HEALTH AUTHORITY, HEALTH
SERVICE DELIVERY AREA, LOCAL HEALTH AREA AND COMMUNITYBR I T I S H CO L U M B I A, 2005
Health Authority/Health Service Delivery Area/Local Health Area/Community (Incorporated Only)
Type†
Gender Population Live Births Deaths Marriages StillbirthsAverage AgePopulation
LifeExpectancy(2001-2005)
LHA 062 Sooke M 29,876 334 171 1 37.1 78.9 F 29,682 319 162 1 38.2 82.0 T 59,558 653 333 374 2 37.6 80.4 Colwood C M 71 43 - F 91 52 - T 15,253 162 95 119 - Highlands DM M 8 6 - F 11 2 - T 2,114 19 8 5 - Langford DM M 136 58 1 F 125 60 - T 21,845 261 118 53 1 Metchosin DM M 18 17 - F 15 13 - T 5,353 33 30 34 - Sooke DM M 101 43 - F 76 36 1 T 10,117 177 79 153 1 LHA 063 Saanich M 30,749 183 314 3 44.3 80.8 F 32,764 230 313 3 46.3 84.2 T 63,513 413 627 329 6 45.3 82.5 Central DM M 57 77 1 Saanich F 82 80 1 T 16,821 139 157 58 2 North DM M 22 45 1 Saanich F 29 28 - T 11,274 51 73 80 1 Saanich DM M 467 405 2 F 429 392 4 T 110,387 896 797 355 6 Sidney T M 32 78 1 F 33 104 - T 11,862 65 182 52 1 LHA 064 Gulf Islands M 7,186 47 72 - 46.0 78.3 F 7,805 37 57 - 47.3 85.7 T 14,991 84 129 208 - 46.7 82.0 TOTAL M 168,816 1,487 1,534 10 40.9 78.9 F 182,207 1,423 1,663 6 43.5 83.0 T 351,023 2,910 3,197 2,204 16 42.2 81.1
HSDA 42 CENTRAL VANCOUVER ISLAND
LHA 065 Cowichan M 27,135 243 226 4 39.8 78.2 F 27,911 219 215 3 41.0 81.8 T 55,046 462 441 334 7 40.4 80.0 Duncan C M 23 54 - F 26 58 - T 4,898 49 112 36 - North DM M 119 129 3 Cowichan F 125 133 2 T 28,519 244 262 125 5 LHA 066 Lake Cowichan M 3,304 20 32 - 40.1 79.2 F 3,156 27 13 - 39.5 85.3 T 6,460 47 45 28 - 39.8 82.0 Lake Cowichan T M 14 22 - F 26 11 - T 3,029 40 33 15 -

164 A P P E N D I X 1
APPENDIX 1 – continuedSTATISTICAL SUMMARIES BY HEALTH AUTHORITY, HEALTH
SERVICE DELIVERY AREA, LOCAL HEALTH AREA AND COMMUNITYBR I T I S H CO L U M B I A, 2005
Health Authority/Health Service Delivery Area/Local Health Area/Community (Incorporated Only)
Type†
Gender Population Live Births Deaths Marriages StillbirthsAverage AgePopulation
LifeExpectancy(2001-2005)
LHA 067 Ladysmith M 8,555 88 113 2 42.0 76.5 F 8,756 78 99 - 43.6 81.3 T 17,311 166 212 106 2 42.8 78.8 Ladysmith T M 37 51 2 F 37 41 - T 7,292 74 92 41 2 LHA 068 Nanaimo M 48,742 418 453 1 39.8 77.9 F 51,029 398 407 5 41.3 81.7 T 99,771 816 860 433 6 40.6 79.8 Lantzville DM M 10 15 1 F 16 11 - T 3,819 26 26 35 1 Nanaimo C M 341 390 - F 329 359 4 T 79,626 670 749 316 4 LHA 069 Qualicum M 20,342 116 241 2 46.0 78.7 F 21,346 117 244 1 47.8 83.4 T 41,688 233 485 348 3 46.9 81.0 Parksville C M 31 88 1 F 42 96 1 T 11,709 73 184 151 2 Qualicum T M 13 56 - Beach F 10 47 - T 8,807 23 103 57 - LHA 070 Alberni M 16,639 170 160 3 39.2 75.6 F 16,053 166 97 2 40.1 80.2 T 32,692 336 257 429 5 39.6 77.8 Port Alberni C M 103 109 2 F 91 78 2 T 18,688 194 187 81 4 Tofi no DM M 16 8 - F 22 2 - T 1,846 38 10 242 - Ucluelet DM M 14 4 1 F 10 2 - T 1,900 24 6 5 1 TOTAL M 124,717 1,055 1,225 12 40.9 77.7 F 128,251 1,005 1,075 11 42.3 81.8 T 252,968 2,060 2,300 1,678 23 41.6 79.8
HSDA 43 NORTH VANCOUVER ISLAND
LHA 071 Courtenay M 30,405 247 255 1 40.2 77.8 F 31,263 220 237 1 41.5 82.6 T 61,668 467 492 359 2 40.8 80.2 Comox T M 41 63 1 F 38 79 - T 12,835 79 142 68 1 Courtenay C M 118 89 - F 105 76 1 T 21,801 223 165 124 1 Cumberland VL M 17 19 - F 10 15 - T 2,817 27 34 9 -
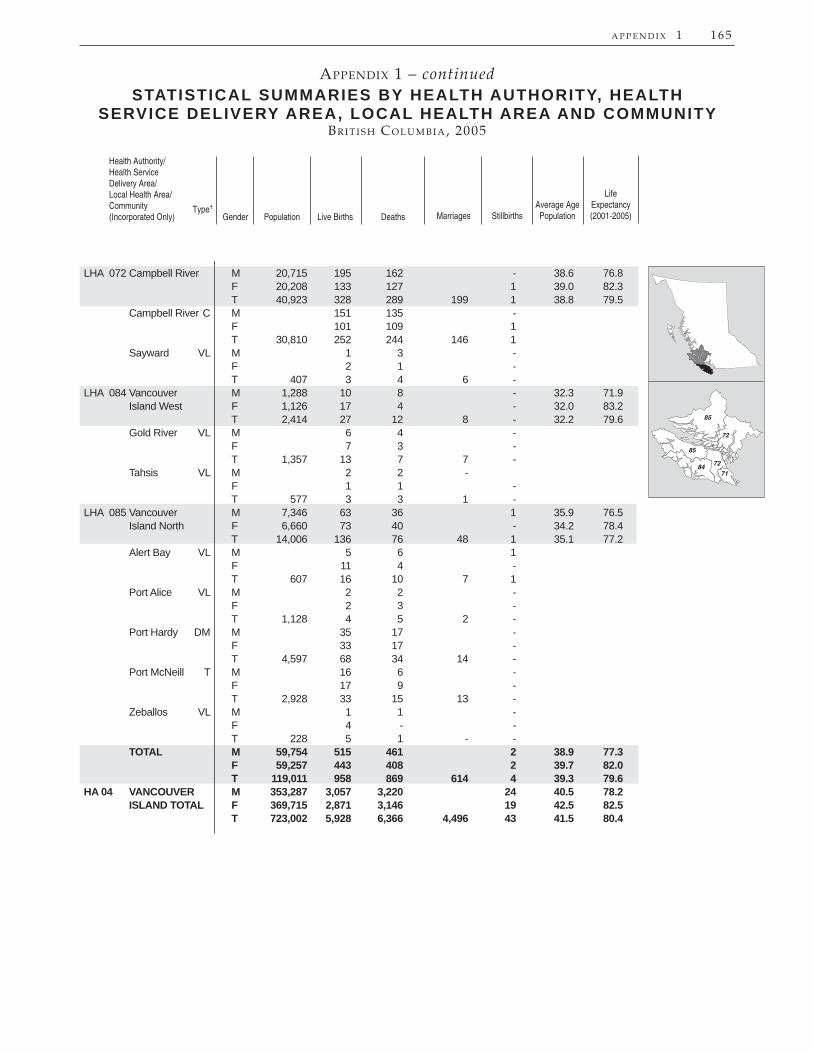
A P P E N D I X 1 165
APPENDIX 1 – continuedSTATISTICAL SUMMARIES BY HEALTH AUTHORITY, HEALTH
SERVICE DELIVERY AREA, LOCAL HEALTH AREA AND COMMUNITYBR I T I S H CO L U M B I A, 2005
Health Authority/Health Service Delivery Area/Local Health Area/Community (Incorporated Only)
Type†
Gender Population Live Births Deaths Marriages StillbirthsAverage AgePopulation
LifeExpectancy(2001-2005)
LHA 072 Campbell River M 20,715 195 162 - 38.6 76.8 F 20,208 133 127 1 39.0 82.3 T 40,923 328 289 199 1 38.8 79.5 Campbell River C M 151 135 - F 101 109 1 T 30,810 252 244 146 1 Sayward VL M 1 3 - F 2 1 - T 407 3 4 6 - LHA 084 Vancouver M 1,288 10 8 - 32.3 71.9 Island West F 1,126 17 4 - 32.0 83.2 T 2,414 27 12 8 - 32.2 79.6 Gold River VL M 6 4 - F 7 3 - T 1,357 13 7 7 - Tahsis VL M 2 2 - F 1 1 - T 577 3 3 1 - LHA 085 Vancouver M 7,346 63 36 1 35.9 76.5 Island North F 6,660 73 40 - 34.2 78.4 T 14,006 136 76 48 1 35.1 77.2 Alert Bay VL M 5 6 1 F 11 4 - T 607 16 10 7 1 Port Alice VL M 2 2 - F 2 3 - T 1,128 4 5 2 - Port Hardy DM M 35 17 - F 33 17 - T 4,597 68 34 14 - Port McNeill T M 16 6 - F 17 9 - T 2,928 33 15 13 - Zeballos VL M 1 1 - F 4 - - T 228 5 1 - - TOTAL M 59,754 515 461 2 38.9 77.3 F 59,257 443 408 2 39.7 82.0 T 119,011 958 869 614 4 39.3 79.6HA 04 VANCOUVER M 353,287 3,057 3,220 24 40.5 78.2 ISLAND TOTAL F 369,715 2,871 3,146 19 42.5 82.5 T 723,002 5,928 6,366 4,496 43 41.5 80.4
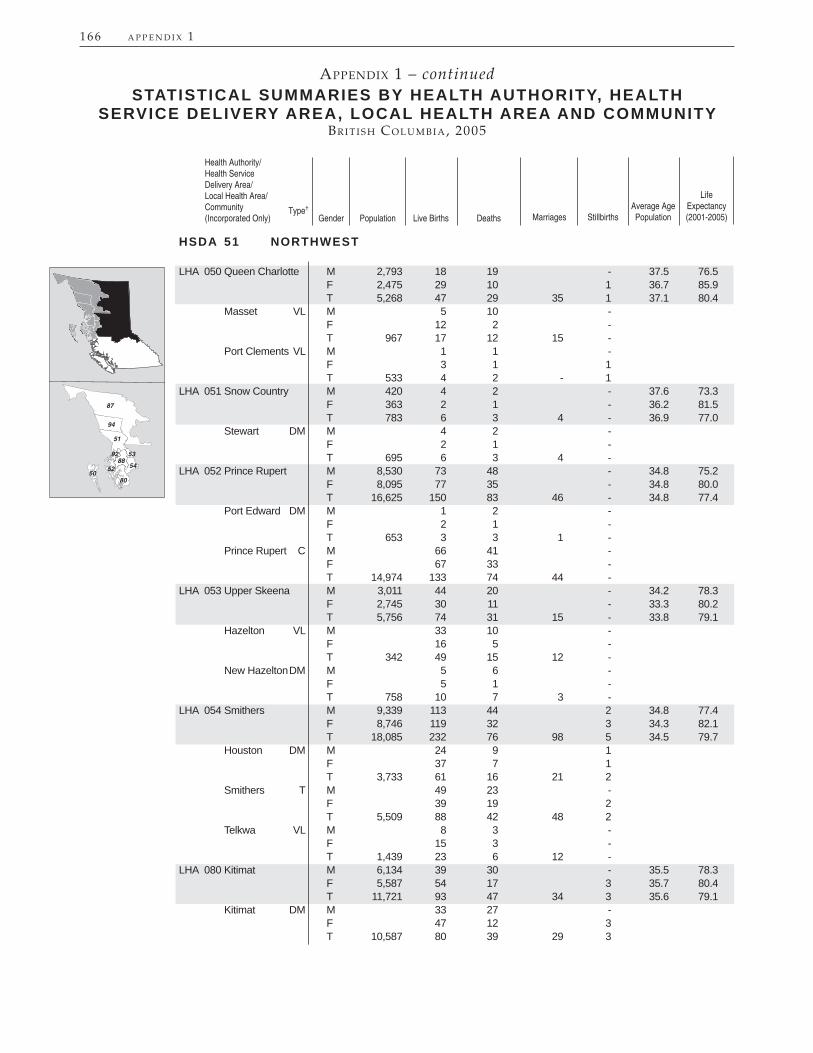
166 A P P E N D I X 1
APPENDIX 1 – continuedSTATISTICAL SUMMARIES BY HEALTH AUTHORITY, HEALTH
SERVICE DELIVERY AREA, LOCAL HEALTH AREA AND COMMUNITYBR I T I S H CO L U M B I A, 2005
Health Authority/Health Service Delivery Area/Local Health Area/Community (Incorporated Only)
Type†
Gender Population Live Births Deaths Marriages StillbirthsAverage AgePopulation
LifeExpectancy(2001-2005)
HSDA 51 NORTHWEST
LHA 050 Queen Charlotte M 2,793 18 19 - 37.5 76.5 F 2,475 29 10 1 36.7 85.9 T 5,268 47 29 35 1 37.1 80.4 Masset VL M 5 10 - F 12 2 - T 967 17 12 15 - Port Clements VL M 1 1 - F 3 1 1 T 533 4 2 - 1 LHA 051 Snow Country M 420 4 2 - 37.6 73.3 F 363 2 1 - 36.2 81.5 T 783 6 3 4 - 36.9 77.0 Stewart DM M 4 2 - F 2 1 - T 695 6 3 4 - LHA 052 Prince Rupert M 8,530 73 48 - 34.8 75.2 F 8,095 77 35 - 34.8 80.0 T 16,625 150 83 46 - 34.8 77.4 Port Edward DM M 1 2 - F 2 1 - T 653 3 3 1 - Prince Rupert C M 66 41 - F 67 33 - T 14,974 133 74 44 - LHA 053 Upper Skeena M 3,011 44 20 - 34.2 78.3 F 2,745 30 11 - 33.3 80.2 T 5,756 74 31 15 - 33.8 79.1 Hazelton VL M 33 10 - F 16 5 - T 342 49 15 12 - New Hazelton DM M 5 6 - F 5 1 - T 758 10 7 3 - LHA 054 Smithers M 9,339 113 44 2 34.8 77.4 F 8,746 119 32 3 34.3 82.1 T 18,085 232 76 98 5 34.5 79.7 Houston DM M 24 9 1 F 37 7 1 T 3,733 61 16 21 2 Smithers T M 49 23 - F 39 19 2 T 5,509 88 42 48 2 Telkwa VL M 8 3 - F 15 3 - T 1,439 23 6 12 - LHA 080 Kitimat M 6,134 39 30 - 35.5 78.3 F 5,587 54 17 3 35.7 80.4 T 11,721 93 47 34 3 35.6 79.1 Kitimat DM M 33 27 - F 47 12 3 T 10,587 80 39 29 3
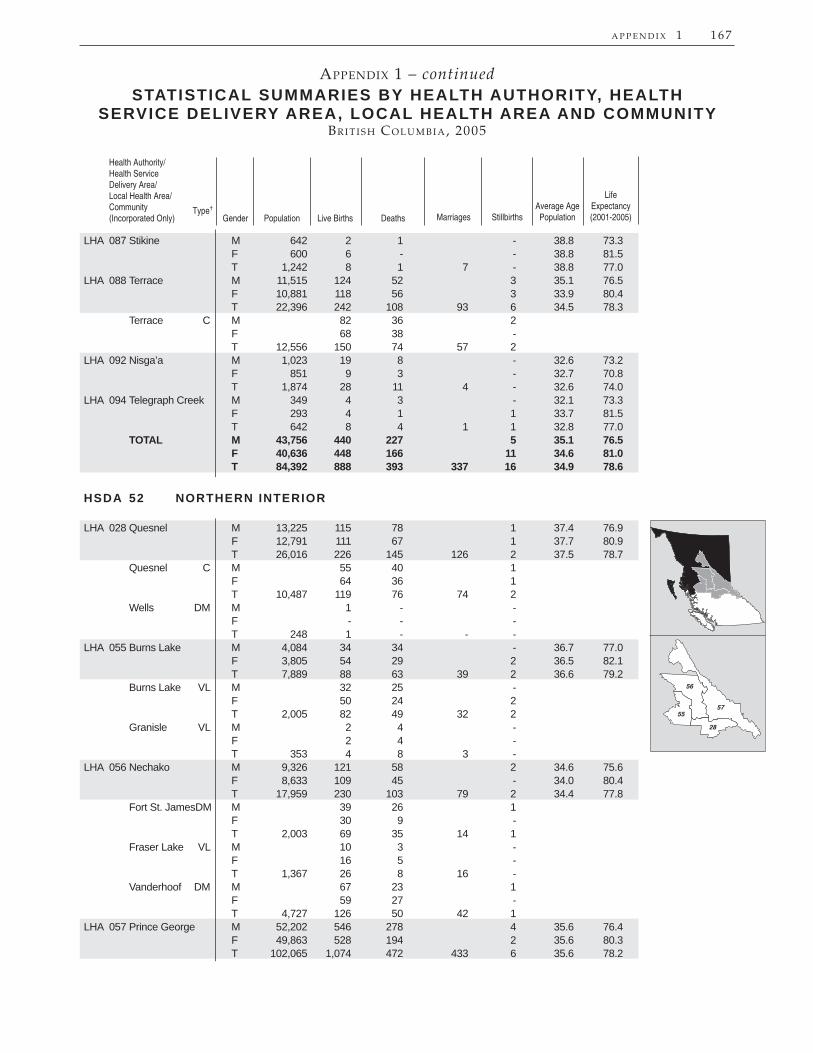
A P P E N D I X 1 167
APPENDIX 1 – continuedSTATISTICAL SUMMARIES BY HEALTH AUTHORITY, HEALTH
SERVICE DELIVERY AREA, LOCAL HEALTH AREA AND COMMUNITYBR I T I S H CO L U M B I A, 2005
Health Authority/Health Service Delivery Area/Local Health Area/Community (Incorporated Only)
Type†
Gender Population Live Births Deaths Marriages StillbirthsAverage AgePopulation
LifeExpectancy(2001-2005)
LHA 087 Stikine M 642 2 1 - 38.8 73.3 F 600 6 - - 38.8 81.5 T 1,242 8 1 7 - 38.8 77.0LHA 088 Terrace M 11,515 124 52 3 35.1 76.5 F 10,881 118 56 3 33.9 80.4 T 22,396 242 108 93 6 34.5 78.3 Terrace C M 82 36 2 F 68 38 - T 12,556 150 74 57 2 LHA 092 Nisga’a M 1,023 19 8 - 32.6 73.2 F 851 9 3 - 32.7 70.8 T 1,874 28 11 4 - 32.6 74.0LHA 094 Telegraph Creek M 349 4 3 - 32.1 73.3 F 293 4 1 1 33.7 81.5 T 642 8 4 1 1 32.8 77.0 TOTAL M 43,756 440 227 5 35.1 76.5 F 40,636 448 166 11 34.6 81.0 T 84,392 888 393 337 16 34.9 78.6
HSDA 52 NORTHERN INTERIOR
LHA 028 Quesnel M 13,225 115 78 1 37.4 76.9 F 12,791 111 67 1 37.7 80.9 T 26,016 226 145 126 2 37.5 78.7 Quesnel C M 55 40 1 F 64 36 1 T 10,487 119 76 74 2 Wells DM M 1 - - F - - - T 248 1 - - - LHA 055 Burns Lake M 4,084 34 34 - 36.7 77.0 F 3,805 54 29 2 36.5 82.1 T 7,889 88 63 39 2 36.6 79.2 Burns Lake VL M 32 25 - F 50 24 2 T 2,005 82 49 32 2 Granisle VL M 2 4 - F 2 4 - T 353 4 8 3 - LHA 056 Nechako M 9,326 121 58 2 34.6 75.6 F 8,633 109 45 - 34.0 80.4 T 17,959 230 103 79 2 34.4 77.8 Fort St. James DM M 39 26 1 F 30 9 - T 2,003 69 35 14 1 Fraser Lake VL M 10 3 - F 16 5 - T 1,367 26 8 16 - Vanderhoof DM M 67 23 1 F 59 27 - T 4,727 126 50 42 1 LHA 057 Prince George M 52,202 546 278 4 35.6 76.4 F 49,863 528 194 2 35.6 80.3 T 102,065 1,074 472 433 6 35.6 78.2

168 A P P E N D I X 1
APPENDIX 1 – continuedSTATISTICAL SUMMARIES BY HEALTH AUTHORITY, HEALTH
SERVICE DELIVERY AREA, LOCAL HEALTH AREA AND COMMUNITYBR I T I S H CO L U M B I A, 2005
Health Authority/Health Service Delivery Area/Local Health Area/Community (Incorporated Only)
Type†
Gender Population Live Births Deaths Marriages StillbirthsAverage AgePopulation
LifeExpectancy(2001-2005)
Mackenzie DM M 27 12 1 F 33 6 - T 5,454 60 18 17 1 McBride VL M 6 9 - F 10 7 - T 752 16 16 13 - Prince George C M 448 194 3 F 415 168 2 T 77,148 863 362 346 5 Valemount VL M 5 11 - F 1 3 - T 1,250 6 14 9 - TOTAL M 78,837 816 448 7 35.8 76.5 F 75,092 802 335 5 35.8 80.5 T 153,929 1,618 783 677 12 35.8 78.4
HSDA 53 NORTHEAST
LHA 059 Peace River M 14,733 138 104 - 35.3 75.5 South F 14,147 126 64 1 35.4 81.3 T 28,880 264 168 115 1 35.3 78.2 Chetwynd DM M 31 14 - F 31 10 1 T 2,770 62 24 18 1 Dawson Creek C M 73 55 - F 62 36 - T 11,394 135 91 52 - Pouce Coupe VL M 3 19 - F 4 13 - T 887 7 32 6 - Tumbler DM M 11 2 - Ridge F 6 - - T 2,526 17 2 10 - LHA 060 Peace River M 17,483 261 71 2 33.2 78.4 North F 16,140 271 52 3 33.2 81.9 T 33,623 532 123 166 5 33.2 80.1 Fort St. John C M 159 38 2 F 156 31 - T 17,781 315 69 93 2 Hudson’s DM M 3 4 - Hope F 6 2 - T 1,157 9 6 - - Taylor DM M 14 6 - F 11 5 - T 1,346 25 11 15 - LHA 081 Fort Nelson M 3,615 58 14 - 31.1 77.6 F 3,127 50 4 - 30.9 83.4 T 6,742 108 18 18 - 31.0 79.8 Fort Nelson T M 55 13 - F 48 4 - T 4,823 103 17 18 - TOTAL M 35,831 457 189 2 33.8 76.9 F 33,414 447 120 4 33.9 81.7 T 69,245 904 309 299 6 33.9 79.2

A P P E N D I X 1 169
APPENDIX 1 – continuedSTATISTICAL SUMMARIES BY HEALTH AUTHORITY, HEALTH
SERVICE DELIVERY AREA, LOCAL HEALTH AREA AND COMMUNITYBR I T I S H CO L U M B I A, 2005
Health Authority/Health Service Delivery Area/Local Health Area/Community (Incorporated Only)
Type† Gender Population Live Births Deaths Marriages Stillbirths
Average AgePopulation
LifeExpectancy(2001-2005)
Note: Live births, stillbirths and deaths are assigned to communities based on the postal code of usual residence.Marriages are assigned according to the place where the marriage ceremony was performed, and include non-residents.Totals for gender include cases with unknown gender.Population estimates, average age (2005) and life expectancy (2001–2005) from BC Stats, Ministry of Labour and Citizens' Services.† C=City, T=Town, VL=Village, DM=District Municipality, IGD=Indian Government District, IM=Island Municipality, RM=Resort Municipality.Some communities span the boundaries of more than one LHA. When this occurs, the community is shown under the LHA
containing the larger portion of the population. HSDA 32 Vancouver Total may include unspecifi ed Vancouver addresses.
HA 05 NORTHERN M 158,424 1,713 864 14 35.2 76.6 TOTAL F 149,142 1,697 621 20 35.1 80.9 T 307,566 3,410 1,485 1,313 34 35.1 78.6HA 06 PROVINCIAL M 2,109,082 20,812 15,457 150 38.6 78.5 HEALTH F 2,145,440 19,841 14,576 156 40.2 83.0 SERVICE T 4,254,522 40,653 30,033 22,631 313 39.4 80.8 AUTHORITY (PROVINCIAL TOTAL)

Appendix Two
Detailed Cause of Death by Gender and Age

172 A P P E N D I X 2
Preamble to Appendix 2Appendix 2 provides detailed causes of death by gender and age group for deaths that occurred in British Columbia to provincial residents in the current year. Causes of death are coded according to the World Health Organization’s International Classifi cation of Diseases, tenth revision (ICD-10). ICD-10 defi nes the underlying cause of death as “(a) the disease or injury which initiated the train of events leading directly to death, or (b) the circumstances of the accident or violence which produced the fatal injury.” ICD-10 codes consist of a letter followed by a two-digit number, and sometimes include a third digit to provide more specifi city. In this appendix, the ICD-10 codes have been summed to the letter plus two-digit level and are presented only where there were at least fi ve deaths from the specifi ed cause.The list below provides a summary of ICD-10 codes, including many of the subgroups used for underlying causes of death in this report:
Cause of Death Category ICD-10 Code(s)
Certain infectious and parasitic diseases A00-B99 Tuberculosis A15-A19, B90 HIV disease B20-B24Neoplasms C00-D48 Malignant neoplasms C00-C97 Malignant neoplasm of colon and rectum C18-C21 Malignant neoplasm of lung C34 Malignant neoplasm of female breast C500-C509Diseases of blood and blood-forming organs and D50-D89 disorders involving the immune mechanismEndocrine, nutritional, and metabolic diseases E00-E90 Diabetes mellitus E10-E14Mental and behavioural disorders F00-F99 Vascular/senile dementia F01, F03 Psychoactive substance and drug use/abuse F11-F16, F19Diseases of the nervous system G00-G99 Alzheimer’s disease G30Diseases of the eye and adnexa H00-H59Diseases of the ear and mastoid process H60-H95Diseases of the circulatory system I00-I99 Cardiovascular disease I00-I51 Ischemic heart diseases I20-I25 Cerebrovascular diseases I60-I69 Atherosclerosis I70Diseases of the respiratory system J00-J99 Pneumonia/Infl uenza (excluding hypostatic) J10-J181, J188, J189 Chronic Pulmonary Disease J40-J44 Asthma J45-J46Diseases of the digestive system K00-K93 Diseases of liver K70-K76 Chronic liver disease/cirrhosis K70, K73-74, K760-K761Diseases of the skin and subcutaneous tissue L00-L99Diseases of the musculoskeletal system and M00-M99 connective tissueDiseases of the genitourinary system N00-N99

A P P E N D I X 2 173
Complications of pregnancy, childbirth, and O00-O99 the puerperiumCertain conditions originating in the perinatal P00-P96 periodCongenital malformations and chromosome Q00-Q99 abnormalitiesSymptoms, signs and abnormal fi nding, R00-R99 unknown causes Sudden infant death syndrome (SIDS) R95 Cause of death unknown or pending R96-R99
External causes V01-Y98 Motor vehicle accidents V02-V04, V09, V12-V14, V190- V196, V20-V79, V803-V805, V820- V821, V823-V890, V899, Y850 Other transport accidents V01, V05-V06, V10-V11, V15-V18, V198-V199, V800-V802, V806- V809, V812-V819, V822-V829, V891, V893, V91, V93-V99, Y859 Unintentional drowning (including water V90, V92, W65-W74 transport) Unintentional falls W00-W19 Exposure to smoke, fi re and fl ames X00-X09 Unintentional poisoning X40-X49 Suicide X60-X84, Y870 Homicide X85-Y09, Y871
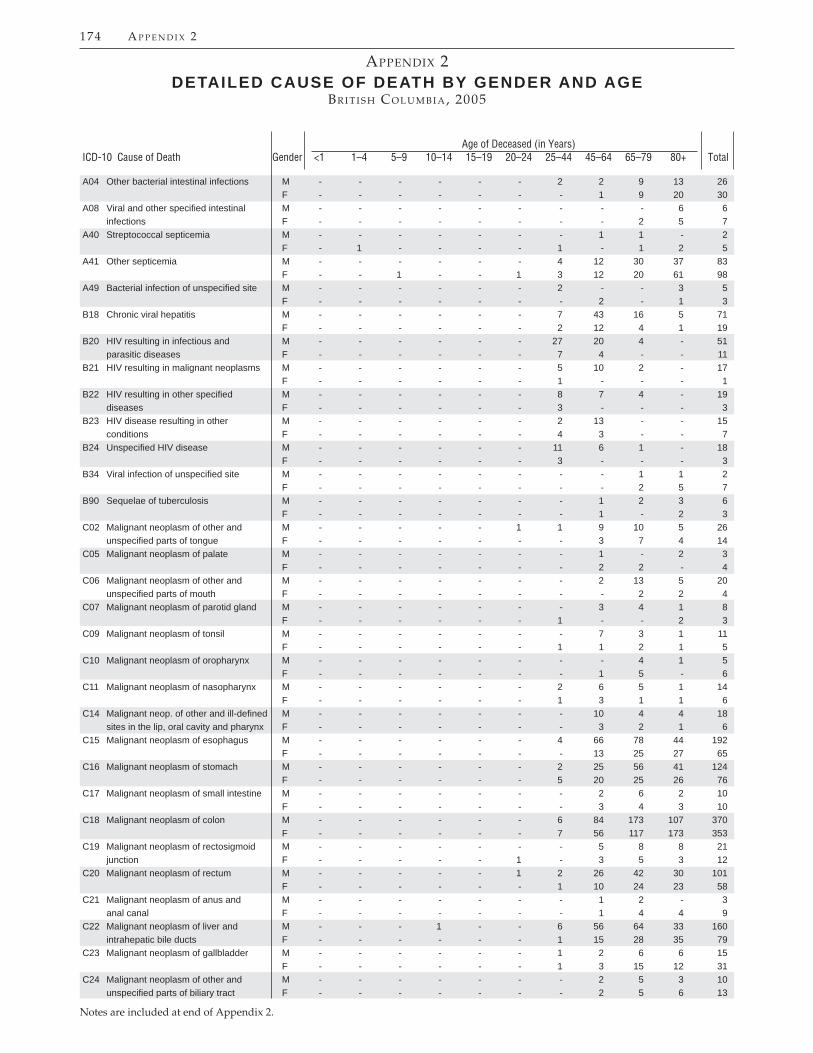
174 A P P E N D I X 2
Notes are included at end of Appendix 2.
APPENDIX 2DETAILED CAUSE OF DEATH BY GENDER AND AGE
BR I T I S H CO L U M B I A, 2005
Age of Deceased (in Years)ICD-10 Cause of Death Gender <1 1–4 5–9 10–14 15–19 20–24 25–44 45–64 65–79 80+ Total
A04 Other bacterial intestinal infections M - - - - - - 2 2 9 13 26 F - - - - - - - 1 9 20 30A08 Viral and other specifi ed intestinal M - - - - - - - - - 6 6 infections F - - - - - - - - 2 5 7A40 Streptococcal septicemia M - - - - - - - 1 1 - 2 F - 1 - - - - 1 - 1 2 5A41 Other septicemia M - - - - - - 4 12 30 37 83 F - - 1 - - 1 3 12 20 61 98A49 Bacterial infection of unspecifi ed site M - - - - - - 2 - - 3 5 F - - - - - - - 2 - 1 3B18 Chronic viral hepatitis M - - - - - - 7 43 16 5 71 F - - - - - - 2 12 4 1 19B20 HIV resulting in infectious and M - - - - - - 27 20 4 - 51 parasitic diseases F - - - - - - 7 4 - - 11B21 HIV resulting in malignant neoplasms M - - - - - - 5 10 2 - 17 F - - - - - - 1 - - - 1B22 HIV resulting in other specifi ed M - - - - - - 8 7 4 - 19 diseases F - - - - - - 3 - - - 3B23 HIV disease resulting in other M - - - - - - 2 13 - - 15 conditions F - - - - - - 4 3 - - 7B24 Unspecifi ed HIV disease M - - - - - - 11 6 1 - 18 F - - - - - - 3 - - - 3B34 Viral infection of unspecifi ed site M - - - - - - - - 1 1 2 F - - - - - - - - 2 5 7B90 Sequelae of tuberculosis M - - - - - - - 1 2 3 6 F - - - - - - - 1 - 2 3C02 Malignant neoplasm of other and M - - - - - 1 1 9 10 5 26 unspecifi ed parts of tongue F - - - - - - - 3 7 4 14C05 Malignant neoplasm of palate M - - - - - - - 1 - 2 3 F - - - - - - - 2 2 - 4C06 Malignant neoplasm of other and M - - - - - - - 2 13 5 20 unspecifi ed parts of mouth F - - - - - - - - 2 2 4C07 Malignant neoplasm of parotid gland M - - - - - - - 3 4 1 8 F - - - - - - 1 - - 2 3C09 Malignant neoplasm of tonsil M - - - - - - - 7 3 1 11 F - - - - - - 1 1 2 1 5C10 Malignant neoplasm of oropharynx M - - - - - - - - 4 1 5 F - - - - - - - 1 5 - 6C11 Malignant neoplasm of nasopharynx M - - - - - - 2 6 5 1 14 F - - - - - - 1 3 1 1 6C14 Malignant neop. of other and ill-defi ned M - - - - - - - 10 4 4 18 sites in the lip, oral cavity and pharynx F - - - - - - - 3 2 1 6C15 Malignant neoplasm of esophagus M - - - - - - 4 66 78 44 192 F - - - - - - - 13 25 27 65C16 Malignant neoplasm of stomach M - - - - - - 2 25 56 41 124 F - - - - - - 5 20 25 26 76C17 Malignant neoplasm of small intestine M - - - - - - - 2 6 2 10 F - - - - - - - 3 4 3 10C18 Malignant neoplasm of colon M - - - - - - 6 84 173 107 370 F - - - - - - 7 56 117 173 353C19 Malignant neoplasm of rectosigmoid M - - - - - - - 5 8 8 21 junction F - - - - - 1 - 3 5 3 12C20 Malignant neoplasm of rectum M - - - - - 1 2 26 42 30 101 F - - - - - - 1 10 24 23 58C21 Malignant neoplasm of anus and M - - - - - - - 1 2 - 3 anal canal F - - - - - - - 1 4 4 9C22 Malignant neoplasm of liver and M - - - 1 - - 6 56 64 33 160 intrahepatic bile ducts F - - - - - - 1 15 28 35 79C23 Malignant neoplasm of gallbladder M - - - - - - 1 2 6 6 15 F - - - - - - 1 3 15 12 31C24 Malignant neoplasm of other and M - - - - - - - 2 5 3 10 unspecifi ed parts of biliary tract F - - - - - - - 2 5 6 13

A P P E N D I X 2 175
Notes are included at end of Appendix 2.
APPENDIX 2 – continuedDETAILED CAUSE OF DEATH BY GENDER AND AGE
BR I T I S H CO L U M B I A, 2005
Age of Deceased (in Years)ICD-10 Cause of Death Gender <1 1–4 5–9 10–14 15–19 20–24 25–44 45–64 65–79 80+ Total
C25 Malignant neoplasm of pancreas M - - - - - - 5 78 98 55 236 F - - - - - - 2 59 86 81 228C26 Malignant neoplasm of other and M - - - - - - 1 24 24 16 65 ill-defi ned digestive organs F - - - - - - - 19 33 45 97C31 Malignant neoplasm of accessory M - - - - - - - 1 3 - 4 sinuses F - - - - - - - 2 1 - 3C32 Malignant neoplasm of larynx M - - - - - - - 17 17 4 38 F - - - - - - - 1 7 3 11C34 Malignant neoplasm of bronchus M - - - - - - 6 277 629 281 1,193 and lung F - - - - - - 12 274 457 256 999C41 Malignant neop of bone and articular M - - - - 2 1 - 2 6 2 13 cartilage of other and unspecifi ed sites F - - - - - 1 1 2 1 - 5C43 Malignant melanoma of skin M - - - - - - 8 25 22 21 76 F - - - - - - 5 17 13 11 46C44 Other malignant neoplasms of skin M - - - - - - - 11 12 14 37 F - - - - - - 2 2 3 7 14C45 Mesothelioma M - - - - - - - 15 34 16 65 F - - - - - - 1 2 2 6 11C48 Malignant neoplasm of peritoneum M - - - - - - - 1 1 - 2 and retro-peritoneum F - - - - - - 1 3 6 1 11C49 Malignant neoplasm of other M - - - - - 1 6 6 7 9 29 connective and soft tissue F - - - - - - 3 2 7 7 19C50 Malignant neoplasm of breast M - - - - - - - 2 4 - 6 F - - - - - - 41 198 174 157 570C51 Malignant neoplasm of vulva M - - - - - - - - - - - F - - - - - - 1 1 2 7 11C53 Malignant neoplasm of cervix uteri M - - - - - - - - - - - F - - - - - - 5 17 13 8 43C54 Malignant neoplasm of corpus uteri M - - - - - - - - - - - F - - - - - - - 10 16 14 40C55 Malignant neoplasm of uterus, M - - - - - - - - - - - part unspecifi ed F - - - - - - 1 6 14 15 36C56 Malignant neoplasm of ovary M - - - - - - - - - - - F - - - - - 1 7 60 82 54 204C57 Malignant neoplasm of other and M - - - - - - - - - - - unspecifi ed female genital organs F - - - - - - - 1 3 3 7C61 Malignant neoplasm of prostate M - - - - - - - 40 202 269 511 F - - - - - - - - - - -C64 Malignant neoplasm of kidney, M - - - - - - 2 37 53 22 114 except renal pelvis F - - - - - - - 10 21 18 49C67 Malignant neoplasm of bladder M - - - - - - - 29 64 73 166 F - - - - - - - 8 24 33 65C71 Malignant neoplasm of brain M - - - - 1 - 11 56 47 14 129 F - 2 - 2 2 2 11 24 29 14 86C73 Malignant neoplasm of thyroid gland M - - - - - - - 3 5 1 9 F - - - - - - - 2 4 5 11C74 Malignant neoplasm of adrenal gland M - - - - - - - 1 - - 1 F - - - - - - - 1 5 1 7C76 Malignant neoplasm of other and M - - - - - - 1 6 8 5 20 ill-defi ned sites F - - - - - - - 2 7 10 19C78 Secondary malignant neoplasm of M - - - - - - - 2 2 1 5 respiratory and digestive organs F - - - - - - - 2 4 2 8C80 Malignant neoplasm - primary M - - - - - - 3 54 67 59 183 site unknown F - - - - - - 2 32 69 69 172C81 Hodgkin’s disease M - - - - - - - 3 5 3 11 F - - - - - - 1 1 - - 2C82 Follicular [nodular] non-Hodgkin’s M - - - - - - - 1 2 1 4 lymphoma F - - - - - - - 2 - 2 4C83 Diffuse non-Hodgkin’s lymphoma M - - - - - - - 3 7 8 18 F - - - - - - 1 3 1 7 12C84 Peripheral and cutaneous M - - - - - - - 7 3 2 12 T-cell lymphomas F - - - - - - 1 - 2 2 5

176 A P P E N D I X 2
Notes are included at end of Appendix 2.
APPENDIX 2 – continuedDETAILED CAUSE OF DEATH BY GENDER AND AGE
BR I T I S H CO L U M B I A, 2005
Age of Deceased (in Years)ICD-10 Cause of Death Gender <1 1–4 5–9 10–14 15–19 20–24 25–44 45–64 65–79 80+ Total
C85 Other and unspecifi ed types of M - - - - - 2 8 33 74 47 164 non-Hodgkin’s lymphoma F - - - - - - 3 15 38 46 102C88 Malignant immunoproliferative M - - - - - - - - 3 2 5 diseases F - - - - - - - 1 1 - 2C90 Multiple myeloma and malignant M - - - - - - 1 13 36 37 87 plasma cell neoplasms F - - - - - - - 14 34 25 73C91 Lymphoid leukemia M - - 1 1 2 1 - 10 18 23 56 F - - - - - - - 2 15 15 32C92 Myeloid leukemia M - - - - - - 4 12 23 18 57 F - - - - - - 2 11 19 14 46C95 Leukemia of unspecifi ed cell type M - - - - - - - 5 17 15 37 F - - - - 1 1 - 1 12 20 35D32 Benign neoplasm of meninges M - - - - - - 1 1 - - 2 F - - - - - - 1 2 1 4 8D37 Neoplasm of uncer./unk. behaviour of M - - - - - - - - 1 4 5 oral cavity and digestive organs F - - - - - - - 1 - 5 6D43 Neoplasm of uncer./unk. behaviour of M - - - - - - 2 8 5 5 20 brain & central nervous system F - - - - - - - 6 12 5 23D46 Myelodysplastic syndromes M - - - - - - - 2 21 28 51 F - - - - - - 1 1 2 17 21D47 Neoplasm of uncer./unk. behaviour of M - - - - - - - 3 6 7 16 lymphoid, hematopoietic and rel. tissue F - - - - - - - - 3 11 14D48 Neoplasm of uncer./unk. behaviour of M - - - - - - - - - 1 1 other and unspecifi ed sites F - - - - - - - - 2 7 9D61 Other aplastic anemias M - - - - - - 1 - 1 2 4 F - - - - - - - 1 1 4 6D64 Other anemias M - - - - - - - - 3 8 11 F - - - - - - - 1 4 17 22D65 Disseminated intravascular coagulation M - - - - - - 2 1 - - 3 [defi brination syndrome] F - - - - - - - - 1 5 6D68 Other coagulation defects M - - - - - - - 1 - 1 2 F - - - - - - 1 1 - 2 4D69 Purpura and other hemorrhagic M - - - - - - - 1 1 4 6 conditions F - - - - - - - - - - -E03 Other hypothyroidism M - - - - - - - 1 1 1 3 F - - - - - - - - - 5 5E10 Insulin-dependent diabetes mellitus M - - - - - 1 2 12 15 6 36 F - - - - - - 2 8 11 13 34E11 Non-insulin-dependent diabetes M - - - - - - - 20 52 50 122 mellitus F - - - - - - - 12 23 55 90E14 Diabetes mellitus NOS M - - - - 1 - 4 73 155 153 386 F - - - - - 1 6 40 111 194 352E46 Unspecifi ed protein-energy malnutrition M - - - - - - - 1 1 2 4 F - - - - - - 1 - 4 9 14E66 Obesity M - - - - - 1 2 6 7 1 17 F - - - - - - - 5 7 6 18E78 Disorders of lipoprotein metabolism M - - - - - - - 12 23 6 41 and other lipidemias F - - - - - - - 3 7 8 18E83 Disorders of mineral metabolism M - 1 - - - - - 2 - - 3 F - - - - - - - 2 1 5 8E84 Cystic fi brosis M - - - - - - 1 - - - 1 F - - - - - 4 2 1 - - 7E85 Amyloidosis M - - - - - - - - 5 5 10 F - - - - - - - 2 4 5 11E86 Volume depletion M - - - - - - - 2 2 7 11 F - - - - - - - - 2 36 38E87 Other disorders of fl uid, electrolyte and M - - - - - - - 2 3 5 10 acid-base balance F - - - - - - 1 - 2 12 15E88 Other metabolic disorders M 1 1 - 1 1 - - - - - 4 F - - - 1 1 - 1 2 1 4 10F03 Unspecifi ed dementia M - - - - - - - 6 38 173 217 F - - - - - - - 4 29 370 403

A P P E N D I X 2 177
Notes are included at end of Appendix 2.
APPENDIX 2 – continuedDETAILED CAUSE OF DEATH BY GENDER AND AGE
BR I T I S H CO L U M B I A, 2005
Age of Deceased (in Years)ICD-10 Cause of Death Gender <1 1–4 5–9 10–14 15–19 20–24 25–44 45–64 65–79 80+ Total
F05 Delirium, not induced by alcohol M - - - - - - - - 1 6 7 and other psychoactive substances F - - - - - - - - 2 5 7F06 Oth. mental disord. due to brain M - - - - - - - - 1 - 1 damage & dysfunction & phys. dis. F - - - - - - - 1 - 5 6F10 Mental and behavioural disorders due M - - - - - - 11 43 38 12 104 to use of alcohol F - - - - - - 7 19 12 4 42F14 Use of cocaine M - - - - - - 3 1 1 - 5 F - - - - - - 1 - - - 1F17 Use of tobacco M - - - - - - - 2 2 2 6 F - - - - - - - 2 2 3 7F19 Multiple drug misuse and misuse of M - - - - - - 6 5 1 - 12 other psychoactive substances F - - - - - 1 2 2 - - 5F20 Schizophrenia M - - - - - - - 1 3 - 4 F - - - - - - - 1 - 4 5F50 Eating disorders M - - - - - - - - 1 2 3 F - - - - - 1 1 - 1 5 8G00 Bacterial meningitis, NEC M 1 - - - - - - 1 2 - 4 F - - - - - - - 2 - - 2G10 Huntington’s disease M - - - - - - - 2 4 - 6 F - - - - - - - 5 3 - 8G12 Spinal muscular atrophy and related M - - - - - - 2 17 34 10 63 syndromes F - - - - - - 1 15 23 14 53G20 Parkinson’s disease M - - - - - - - 3 40 70 113 F - - - - - - - 1 23 62 86G30 Alzheimer’s disease M - - - - - - - 9 44 131 184 F - - - - - - - 6 51 278 335G31 Other degenerative diseases of M - 1 1 - - - - 5 10 12 29 nervous system, NEC F - - - - - - 1 - 8 8 17G35 Multiple sclerosis M - - - - - - - 7 7 1 15 F - - - - - - 3 13 11 5 32G40 Epilepsy M - - - - 1 1 3 7 - 2 14 F - - - - 1 1 1 5 3 1 12G47 Sleep disorders M - - - - - - - 3 2 1 6 F - - - - - - - 3 - 1 4G61 Infl ammatory polyneuropathy M - - - - - - - 1 3 1 5 F - - - - - - - 1 1 - 2G71 Primary disorders of muscles M 1 - - 2 - - 1 4 1 - 9 F - - - - - - - 5 - - 5G80 Infantile cerebral palsy M - - 1 - - 3 2 1 - - 7 F - - - 1 - - 1 3 1 - 6G82 Paraplegia and tetraplegia M - - - - - 1 1 - 3 1 6 F - - - - - - 1 1 - - 2G90 Disorders of autonomic nervous M - - - - - - - - 2 - 2 system F - - - - - - - 3 - 2 5G91 Hydrocephalus (acquired) M - - - - - - - - 3 3 6 F - - - - - - - - - 1 1G93 Other disorders of brain M - - - - - 1 1 3 7 5 17 F - - - - - - 1 4 7 3 15I05 Rheumatic mitral valve diseases M - - - - - - - 1 5 6 12 F - - - - - - - 1 7 12 20I07 Rheumatic tricuspid valve diseases M - - - - - - - 1 1 - 2 F - - - - - - - - 2 2 4I08 Multiple valve diseases M - - - - - - - 1 1 1 3 F - - - - - - - - 2 5 7I09 Other rheumatic heart diseases M - - - - - - - - - - - F - - - - - - - - 3 3 6I10 Essential (primary) hypertension M - - - - - - - 11 21 24 56 F - - - - - - - 8 17 79 104I11 Hypertensive heart disease M - - - - - - 1 5 14 13 33 F - - - - - - - 3 17 62 82I12 Hypertensive renal disease M - - - - - - 1 4 9 24 38 F - - - - - - - 2 11 26 39

178 A P P E N D I X 2
Notes are included at end of Appendix 2.
APPENDIX 2 – continuedDETAILED CAUSE OF DEATH BY GENDER AND AGE
BR I T I S H CO L U M B I A, 2005
Age of Deceased (in Years)ICD-10 Cause of Death Gender <1 1–4 5–9 10–14 15–19 20–24 25–44 45–64 65–79 80+ Total
I13 Hypertensive heart and renal disease M - - - - - - - - 2 4 6 F - - - - - - - - 1 11 12I20 Angina pectoris M - - - - - - - 2 1 1 4 F - - - - - - - - 1 9 10I21 Acute MI M - - - - - - 22 222 423 572 1,239 F - - - - - - 4 47 222 742 1,015I24 Other acute ischemic heart diseases M - - - - - - - 9 16 18 43 F - - - - - - - 1 12 21 34I25 Chronic ischemic heart disease M - - - - - - 14 148 367 591 1,120 F - - - - - - 3 48 145 699 895I26 Pulmonary embolism M - - - 1 - - 7 6 8 12 34 F - - - - - 1 1 12 11 26 51I27 Other pulmonary heart diseases M - - - - - - 1 2 7 4 14 F - - - - - - 3 3 10 4 20I31 Other diseases of pericardium M - - - - - - - 1 4 - 5 F - - - - - - - 1 - 3 4I33 Acute and subacute endocarditis M - - - - - - 1 6 2 - 9 F - - - - - - - 1 2 1 4I34 Nonrheumatic mitral valve disorders M - - - - - - - 4 4 10 18 F - - - - - - - 1 2 11 14I35 Nonrheumatic aortic valve disorders M - - - - - - 1 5 17 38 61 F - - - - - - - 5 17 71 93I38 Endocarditis M - - - - - - 1 6 9 16 32 F - - - - - - 2 6 15 34 57I42 Cardiomyopathy M - 1 - - - 2 8 37 36 16 100 F 1 - - - - 1 2 9 13 29 55I44 Atrioventricular and left bundle-branch M - - - - - - - - 2 1 3 block F - - - - - - - - - 3 3I45 Other conduction disorders M - - - - 1 - - 2 - 2 5 F - - - - - - - 2 - 1 3I46 Cardiac arrest M - - - - - - - 9 6 12 27 F - - - - - - 1 2 4 12 19I48 Atrial fi brillation and fl utter M - - - - - - - 3 31 75 109 F - - - - - - - 3 21 130 154I49 Other cardiac arrhythmias M - - - - - - 1 6 12 22 41 F - - - - - 1 1 4 13 31 50I50 Heart failure M - - - - - - 1 12 63 276 352 F - - - - - - - 6 69 429 504I51 Complications and ill-defi ned M - - - - - - 5 10 9 10 34 descriptions of heart disease F - - - - - 1 1 3 9 25 39I60 Subarachnoid hemorrhage M - - - - - - 3 17 10 5 35 F - - - - - - 6 21 26 6 59I61 Intracerebral hemorrhage M - - - - - - 5 25 40 32 102 F - - - - - - 4 16 34 61 115I62 Other nontraumatic intracranial M - - - - - - 1 7 17 20 45 hemorrhage F - - - - - - - 3 15 22 40I63 Cerebral infarction M - - - - - 1 1 7 19 19 47 F - - - - - - - 4 11 40 55I64 CVA, NOS M - - - - - - 2 35 177 332 546 F - - - - - - 1 15 143 714 873I67 Other cerebrovascular diseases M 1 - - - - - - 4 21 48 74 F - - - - - - 1 5 16 90 112I69 Sequelae of cerebrovascular disease M - - - - - - - 2 17 25 44 F - - - - - - 1 - 21 48 70I70 Atherosclerosis M - - - - - - 3 29 78 66 176 F - - - - - - - 11 33 94 138I71 Aortic aneurysm and dissection M - - - - - - - 28 46 61 135 F - - - - - - - 3 22 53 78I72 Other aneurysm M - - - - - 1 - 1 1 3 6 F - - - - - - - 1 - 2 3I73 Other peripheral vascular diseases M - - - - - - - 5 9 23 37 F - - - - - - - 1 8 36 45

A P P E N D I X 2 179
Notes are included at end of Appendix 2.
APPENDIX 2 – continuedDETAILED CAUSE OF DEATH BY GENDER AND AGE
BR I T I S H CO L U M B I A, 2005
Age of Deceased (in Years)ICD-10 Cause of Death Gender <1 1–4 5–9 10–14 15–19 20–24 25–44 45–64 65–79 80+ Total
I74 Arterial embolism and thrombosis M - - - - - - - - 1 4 5 F - - - - - - 1 4 2 4 11I77 Other disorders of arteries and M - - - - - - - 4 - 5 9 arterioles F - - - - - - - 1 3 2 6I80 Phlebitis and thrombophlebitis M - - - - - - - 4 1 6 11 F - - - - - - - 1 4 11 16J10 Infl uenza due to identifi ed infl uenza M - - - - - - - - 1 3 4 virus F - - - - - - - - - 4 4J11 Infl uenza, virus not identifi ed M - - - - - - - - 3 14 17 F - - - - - - - 1 4 21 26J12 Viral pneumonia, NEC M 1 1 - - - - 1 - - 2 5 F - - - - - - - - - 2 2J15 Bacterial pneumonia, NEC M - - - - - - 2 3 2 2 9 F - - - - - - 3 - - 3 6J18 Pneumonia, organism unspecifi ed M - - - - - - 9 42 114 382 547 F - - - - - - 6 30 96 596 728J22 Unspecifi ed acute lower respiratory M - - - - - - - - - 3 3 infection F - - - - - - - 1 - 3 4J40 Bronchitis, not specifi ed as acute or M - - - - - - - 1 - 4 5 chronic F - - - - - - - - - 1 1J42 Unspecifi ed chronic bronchitis M - - - - - - - - 3 4 7 F - - - - - - - 1 1 3 5J43 Emphysema M - - - - - - - 4 26 20 50 F - - - - - - - 2 21 21 44J44 Other chronic obstructive pulmonary M - - - - - - 1 43 235 336 615 disease F - - - - - - - 31 194 332 557J45 Asthma M - - - - - - 2 4 2 7 15 F - - - - - - - 6 5 16 27J47 Bronchiectasis M - - - - - - - - 2 6 8 F - - - - - - - 1 6 17 24J69 Aspiration pneumonia due to solids M - - - - 1 - 1 10 21 77 110 and liquids F - - - - - - - 2 11 69 82J80 Adult respiratory distress syndrome M - - - - - - - 3 2 1 6 F - - - - - - - 1 - 1 2J84 Other interstitial pulmonary diseases M - - - - - - - 20 65 45 130 F - - - - - - - 15 34 38 87J86 Pyothorax M - - - - - - - 3 - 1 4 F - - - - - - - 1 1 3 5J90 Pleural effusion, NEC M - - - - - - - 4 1 6 11 F - - - - - - - 1 3 5 9J96 Respiratory failure, NEC M - - - - - - - 1 - 3 4 F - - - - - - - - 1 3 4J98 Other respiratory disorders M - - - - - - - 2 5 15 22 F - - - - - - 1 - 3 19 23K21 Gastro-esophageal refl ux disease M - - - - - - - - 3 5 8 F - - - - - - - - 2 8 10K22 Other diseases of esophagus M - - - - - - - 3 3 4 10 F - - - - - - - - - 6 6K25 Gastric ulcer M - 1 - - - - - 1 3 3 8 F - - - - - - - - 3 4 7K26 Duodenal ulcer M - - - - - - 1 4 3 5 13 F - - - - - - - - 4 6 10K27 Peptic ulcer M - - - - - - - 1 2 7 10 F - - - - - - - - 1 7 8K35 Acute appendicitis M - - - - - - - - 2 2 4 F - - - - - - - - - 2 2K43 Ventral hernia M - - - - - - - - 1 1 2 F - - - - - - - 1 2 1 4K50 Crohn’s disease M - - - - - - - - 1 1 2 F - - - - - - 1 1 2 1 5K51 Ulcerative colitis M - - - - - - - 1 - - 1 F - - - - - - 1 1 1 3 6

180 A P P E N D I X 2
Notes are included at end of Appendix 2.
APPENDIX 2 – continuedDETAILED CAUSE OF DEATH BY GENDER AND AGE
BR I T I S H CO L U M B I A, 2005
Age of Deceased (in Years)ICD-10 Cause of Death Gender <1 1–4 5–9 10–14 15–19 20–24 25–44 45–64 65–79 80+ Total
K52 Other noninfective gastroenteritis and M 2 - - - - - 1 2 2 6 13 colitis F - - - - - - - - 7 19 26K55 Vascular disorders of intestine M 1 - - - - - 2 4 17 12 36 F - - - - - - 2 7 16 29 54K56 Paralytic ileus and intestinal M - - - - - 1 1 2 7 24 35 obstruction without hernia F - - - - - - 1 3 16 65 85K57 Diverticular disease of intestine M - - - - - - - 1 4 10 15 F - - - - - - - 1 10 27 38K62 Other diseases of anus and rectum M - - - - - - 1 - - 1 2 F - - - - - - - 1 - 4 5K63 Other diseases of intestine M - - - - - - - - 8 7 15 F - - - - - - - 6 6 15 27K65 Peritonitis M - - - - - - - 2 2 4 8 F - - - - - - 1 - 1 2 4K70 Alcoholic liver disease M - - - - - - 13 72 35 5 125 F - - - - - - 7 31 15 2 55K72 Hepatic failure M - - - - - - 3 13 13 6 35 F - - - - - - - 5 5 11 21K74 Fibrosis and cirrhosis of liver M - - - - - - 4 32 31 9 76 F - - - - - - - 12 16 9 37K76 Other diseases of liver M - - - - - - 3 5 4 4 16 F - - - - - - 2 2 2 2 8K80 Cholelithiasis M - - - - - - - - - - - F - - - - - - - 1 2 9 12K81 Cholecystitis M - - - - - - - - 6 7 13 F - - - - - - - - 3 5 8K83 Other diseases of biliary tract M - - - - - - 1 2 3 8 14 F - - - - - - - - 2 5 7K85 Acute pancreatitis M - - - - - - - 6 7 9 22 F - - - - - - - 7 6 9 22K86 Other diseases of pancreas M - - - - - - 1 2 4 2 9 F - - - - - - - 1 1 - 2K92 Other diseases of digestive system M - - - - - - 1 4 25 53 83 F - - - - - - 1 5 10 69 85L03 Cellulitis M - - - - - - 2 2 3 7 14 F - - - - - - - - 5 8 13L89 Decubitus ulcer M - - - - - - - - - 6 6 F - - - - - - - - - 7 7L98 Other disorders of skin and M - - - - - - - 1 1 2 4 subcutaneous tissue, NEC F - - - - - - - - 1 4 5M06 Other rheumatoid arthritis M - - - - - - - - 4 1 5 F - - - - - - - - 10 11 21M13 Other arthritis M - - - - - - - - - 3 3 F - - - - - - - - 2 2 4M19 Other arthrosis M - - - - - - - - - 3 3 F - - - - - - - - 1 15 16M31 Other necrotizing vasculopathies M - - - - - - - 1 1 1 3 F - - - - - - 1 2 1 2 6M32 Systemic lupus erythematosus M - - - - - - - - 1 - 1 F - - - - - - - 2 3 3 8M34 Systemic sclerosis M - - - - - - - 2 5 - 7 F - - - - - - 2 3 6 3 14M35 Other systemic involvement of M - - - - - - - 1 2 - 3 connective tissue F - - - - - - - 1 1 1 3M48 Other spondylopathies M - - - - - - - - 4 2 6 F - - - - - - - - 1 - 1M62 Other disorders of muscle M - - - - - - - 1 1 - 2 F - - - - - - - 1 4 1 6M72 Fibroblastic disorders M - - - - 1 - 1 - 1 - 3 F - - - - - - - 2 1 - 3M80 Osteoporosis with pathological M - - - - - - - - - 5 5 fracture F - - - - - - - - 2 15 17

A P P E N D I X 2 181
Notes are included at end of Appendix 2.
APPENDIX 2 – continuedDETAILED CAUSE OF DEATH BY GENDER AND AGE
BR I T I S H CO L U M B I A, 2005
Age of Deceased (in Years)ICD-10 Cause of Death Gender <1 1–4 5–9 10–14 15–19 20–24 25–44 45–64 65–79 80+ Total
M81 Osteoporosis without pathological M - - - - - - - - - 1 1 fracture F - - - - - - - - - 10 10M86 Osteomyelitis M - - - - - - - 1 1 1 3 F - - - - - - - - - 5 5N12 Tubulo-interstitial nephritis, not M - - - - - - - - 1 2 3 specifi ed as acute or chronic F - - - - - - - - 1 4 5N13 Obstructive and refl ux uropathy M - - - - - - - 1 3 4 8 F - - - - - - - - 1 4 5N17 Acute renal failure M - - - - - - 1 3 7 8 19 F - - - - - - - - 10 12 22N18 Chronic renal failure M - - - 1 - - 1 4 22 36 64 F - - - - - - - 3 18 44 65N19 Unspecifi ed renal failure M - - - - - - 1 9 38 86 134 F - - - - - - - 6 29 77 112N20 Calculus of kidney and ureter M - - - - - - - - 1 1 2 F - - - - - - - 2 2 1 5N28 Other disorders of kidney and ureter, M - - - - - - - - 1 1 2 NEC F - - - - - - - - 1 5 6N30 Cystitis M - - - - - - - - - 2 2 F - - - - - - - - 1 3 4N39 Other disorders of urinary system M - - - - - - - 4 13 56 73 F - - - - - - - 1 10 100 111N40 Prostatic hypertrophy M - - - - - - - - 2 7 9 F - - - - - - - - - - -P01 Fetus and newborn affected by M 9 - - - - - - - - - 9 maternal complications of pregnancy F 6 - - - - - - - - - 6P02 Fetus and newborn affected by comp. M 8 - - - - - - - - - 8 of placenta, cord and membranes F 3 - - - - - - - - - 3P07 Disorders related to short gestation M 11 - - - - - - - - - 11 and low birth weight, NEC F 18 - - - - - - - - - 18P96 Other conditions originating in the M 8 - - - - - - - - - 8 perinatal period F 4 - - - - - - - - - 4Q23 Congenital malformations of aortic M 2 - - - - - - 2 1 - 5 and mitral valves F 3 - - - - - - - - - 3Q24 Other congenital malformations of M 2 - - - - - 1 1 - - 4 heart F 3 - - - - - - 1 - - 4Q87 Other specifi ed malformation M 1 - 1 - - 2 1 1 - - 6 syndromes affecting multiple systems F 1 - - - - - - - - - 1Q90 Down’s syndrome M - - - - - - 1 2 - - 3 F 1 - - - - 1 - 3 1 - 6R53 Malaise and fatigue M - - - - - - - - - 3 3 F - - - - - - - - - 8 8R54 Senility M - - - - - - - - - 7 7 F - - - - - - - - - 38 38R56 Convulsions, NOS M - - - - - - 2 2 - - 4 F - - - - - - 2 - - - 2R68 Other general symptoms and signs M - - - - - - - - - - - F - - - - - - - - 1 5 6R95 Sudden infant death syndrome M 6 - - - - - - - - - 6 F 4 - - - - - - - - - 4R97 Unknown cause of mortality M - - - - - - - 6 - - 6 F - - - - - 1 2 2 - - 5R99 Other ill-defi ned and unspecifi ed M 14 5 3 3 17 38 136 141 37 24 418 causes of mortality F 7 2 - 3 2 8 56 70 27 28 203V03 Pedestrian injured in collision with car, M - - - 1 - 2 5 5 6 3 22 pick-up truck or van F - - - - - - 2 6 2 6 16V04 Pedestrian injured in collision with M - - - - - 1 - 2 - 1 4 heavy transport vehicle or bus F - - - - - - 2 - - 2 4V05 Pedestrian injured in collision with M - - - - 1 - 1 1 1 - 4 railway train or vehicle F - - - - 1 - - - - 1 2V09 Pedestrian injured in other and M - - - - - - 2 2 1 - 5 unspecifi ed transport accident F - - - - - 1 - - - - 1

182 A P P E N D I X 2
Notes are included at end of Appendix 2.
APPENDIX 2 – continuedDETAILED CAUSE OF DEATH BY GENDER AND AGE
BR I T I S H CO L U M B I A, 2005
Age of Deceased (in Years)ICD-10 Cause of Death Gender <1 1–4 5–9 10–14 15–19 20–24 25–44 45–64 65–79 80+ Total
V23 Motorcycle rider injured in collision M - - - - 2 6 6 3 1 - 18 with car, pick-up truck or van F - - - - - - 1 - - - 1V27 Motorcycle rider injured in collision M - - - - 1 2 - 1 1 - 5 with fi xed or stationary object F - - - - - - - 1 - - 1V28 Motorcycle rider injured in noncollision M - - - - 1 1 3 3 1 1 10 transport accident F - - - - - - 1 - - - 1V43 Car occupant injured in collision with M - - 1 - 1 6 16 5 2 4 35 car, pick-up truck or van F - - - - 3 6 7 11 7 5 39V44 Car occupant injured in collision with M - - - - 4 3 4 2 - 1 14 heavy transport vehicle or bus F - - 1 - 1 - 1 4 - 1 8V47 Car occupant injured in collision with M - - - 1 3 5 5 1 - - 15 fi xed or stationary object F - - - - 1 3 2 1 1 - 8V48 Car occupant injured in noncollision M - - - - 4 4 10 2 2 - 22 transport F - - - - 2 3 4 4 - - 13V49 Car occupant injured in other and M - - - - 1 4 - - - 1 6 unspecifi ed transport accidents F - - - - 2 1 1 - - - 4V53 Occupant of pick-up truck or van injured M - - - - - - 3 3 1 - 7 in collision with car, pick-up truck or van F - - - - - - 1 1 - 1 3V54 Occupant of pick-up truck or van injured M - - - - 1 2 3 3 1 1 11 in coll. with heavy trans. vehicle or bus F - - - - - - - 1 - - 1V58 Occupant of pick-up truck or van injured M - 1 - 1 3 3 5 9 - - 22 in noncollision transport accident F - - - - - 1 4 1 1 - 7V68 Occupant of heavy transport vehicle M - - - - - - 2 5 - - 7 injured in noncollision transport F - - - - - - - - - - -V86 Occupant of special A.T./other m.v. for M - - - - 1 1 2 1 - - 5 off-road use, injured in transport acc. F - - - - - - 1 1 1 - 3V87 Traffi c of specifi ed type but victim’s M - - - - - 1 1 1 - 2 5 mode of transport unknown F - - - - - - 1 - 1 - 2V89 Motor or nonmotor vehicle, type of M - - - - 1 - 4 - - 2 7 vehicle unspecifi ed F - - - - - 1 2 - 1 - 4V95 Accident to powered aircraft causing M - - - - - 1 8 3 1 - 13 injury to occupant F - - - - - 1 - - - - 1W01 Fall on same level from slipping, M - - - - - - - - - 9 9 tripping and stumbling F - - - - - - - - 2 9 11W06 Fall involving bed M - - - - - - - - 1 4 5 F - - - - - - - - 3 6 9W10 Fall on and from stairs and steps M - - - - - - 1 6 7 7 21 F - - - - - - - 1 5 2 8W13 Fall from, out of or through building M - - - - 1 1 3 1 3 1 10 or structure F - - - - - - - - - - -W18 Other fall on same level M - - - - - - 2 6 3 9 20 F - - - - - - - 1 6 11 18W19 Unspecifi ed fall M - - - - - - 1 5 25 61 92 F - - - - - - - 4 18 92 114W20 Struck by thrown, projected or falling M - - - - - 2 6 7 - - 15 object F - - - - - - - - - - -W31 Contact with other and unspecifi ed M - - - - - - 3 5 - - 8 machinery F - - - - - - - - - - -W69 Drowning and submersion while in M - - - - - 1 2 4 1 1 9 natural water F - - - - - - 1 - - - 1W74 Unspecifi ed drowning and submersion M - - - - - - 2 3 - - 5 F - - - - 1 - - - - - 1W79 Inhalation and ingestion of food M - - - - - - - 3 - - 3 causing obstruction of respiratory tract F - - - - - - - - 1 2 3W80 Inhalation and ingestion of other objects M - - - 1 - 1 2 2 7 5 18 causing obstruction of respiratory tract F - - - - - - - 2 5 3 10X00 Exposure to uncontrolled fi re in M - - - - - - 2 7 2 2 13 building or structure F - - - - - - 3 1 - - 4X31 Exposure to excessive natural cold M - - - - - - 1 5 - - 6 F - - - - - - - - - 2 2X41 Acc. poisoning by & exp. to antiepileptic, M - - - - - - 5 3 1 - 9 sed.-hypn., antipark. & psych drugs, NEC F - - - - - 1 2 6 1 - 10

A P P E N D I X 2 183
Notes are included at end of Appendix 2.
APPENDIX 2 – continuedDETAILED CAUSE OF DEATH BY GENDER AND AGE
BR I T I S H CO L U M B I A, 2005
Age of Deceased (in Years)ICD-10 Cause of Death Gender <1 1–4 5–9 10–14 15–19 20–24 25–44 45–64 65–79 80+ Total
X42 Acc. poisoning by & exp. to narcotics & M - - - - 1 7 75 55 - - 138 psychodysleptics [hallucin.], NEC F - - - - - 2 18 19 - - 39X44 Acc. poisoning by & exp. to other & M - - - - 1 - 10 5 - - 16 unspec. drugs, med. and biolo. sub. F - - - - 2 - 5 5 1 - 13X45 Accidental poisoning by and exposure M - - - - - - 5 5 - - 10 to alcohol F - - - - - 1 1 - - - 2X59 Exposure to unspecifi ed factor M - - - - - - 4 2 1 4 11 F - - - - - - - - 3 11 14X61 Suicide by antiepileptic, sed-hypno, M - - - - - - 7 7 2 1 17 antiparkins & psychotropic drugs, NEC F - - - - - - 6 3 1 3 13X62 Suicide by narcotics and M - - - - - - 2 6 - - 8 psychodysleptics [hallucinogens], NEC F - - - - - 1 3 2 - 1 7X64 Suicide by other and unspecifi ed drugs, M - - - - - - 3 6 2 1 12 medicaments and biological substances F - - - - - 1 6 8 4 - 19X67 Suicide by other gases and vapours M - - - - - 4 9 13 2 1 29 F - - - - - - 4 - 1 - 5X70 Suicide by hanging, strangulation and M - - - 1 5 15 46 37 9 6 119 suffocation F - - - - 4 3 16 7 2 3 35X71 Suicide by drowning and submersion M - - - - - 1 1 5 - 1 8 F - - - - - - 1 - - - 1X73 Suicide by rifl e, shotgun and larger M - - - - - 1 2 5 - - 8 fi rearm discharge F - - - - - - - - - - -X74 Suicide by other and unspecifi ed M - - - - 1 3 12 33 11 1 61 fi rearm discharge F - - - - - - 1 3 1 - 5X78 Suicide by sharp object M - - - - - 1 2 4 1 - 8 F - - - - - - 2 2 1 - 5X80 Suicide by jumping from a high place M - - - - - 1 9 3 2 - 15 F - - - - 2 - 2 4 1 - 9X95 Assault by other and unspecifi ed M - - - - 1 3 7 1 - - 12 fi rearm discharge F - - - - - - 2 1 - - 3X99 Assault by sharp object M - - - - - - 2 4 - - 6 F - - - - - - - 1 - - 1Y83 Surg. oper and othr. surg. proc. causing M - - - - - - 1 - 4 4 9 abno. reaction or later compl., w/o misadv. F - - - - - - 1 - 5 7 13Y85 Sequelae of transport accidents M - - - - - - - 3 1 - 4 F - - - - - - - 4 - - 4Y86 Sequelae of other accidents M - - - - 1 - 2 5 5 2 15 F - - - - - - 2 1 - 3 6 All Causes of Death M 107 16 8 16 68 155 830 3,033 5,104 6,120 15,457 F 67 9 5 10 31 55 435 1,859 3,656 8,449 14,576
Note: The output from ICD-10 mortality coding and underlying cause of death selection was modifi ed in British Columbia to refl ect the intent of certifi ers in this jurisdiction and to provide greater continuity over time. Data using the standard ICD-10 rules for such categories as pneumonia/infl uenza, diabetes, or cancer should not be compared to the numbers shown above. Causes with less than fi ve deaths are not shown separately, but are included in the total.
Non-residents and unknown gender are excluded.


Appendix Three
Selected Health Status Indicators by Local Health Area, Health Service Delivery Area and Health Authority
British Columbia, 2001-2005

186 A P P E N D I X 3
Preamble to Appendix 3
186
This appendix consists of six tables:
Table A Summary Statistics by Local Health Area
Table B Mortality Statistics by Local Health Area
Table C Summary Statistics by Health Service Delivery Area
Table D Mortality Statistics by Health Service Delivery Area
Table E Summary Statistics by Health Authority
Table F Mortality Statistics by Health Authority.
Assignment of events to geographic areas was based on the usual residence of the mother for live births and stillbirths, and the usual residence of the decedent for deaths.
Tables A, C and E provide population estimates for the current year, and counts and rates for the fi ve-year period ending with the current year for live births, stillbirths, deaths, infant deaths, low birth weight live births, cesarean live birth deliveries, pre-term live births, live births to teenage mothers, and live births to elderly gravida (mothers aged 35 or older).
Tables B, D and E provide the Standardized Mortality Ratios (SMR) with statistical signifi cance, number of deaths (in the column labeled Death), trends in Age Standardized Mortality Rates based on three-year moving averages from 1986 to the current year (in the column labeled TR), Potential Years of Life Lost Index (PYLLI) with statistical signifi cance, and the number of deaths under age 75 (in the column labeled D <75). ICD-10 codes for the causes of death in these tables are listed below.
Category Cause of Death ICD-10 Codes
01 All causes of death A00-Y89 02 Malignant neoplasms C00-C97 03 Malignant neoplasm of lung C34 04 Endocrine nutritional and metabolic diseases E00-E89 05 Diabetes mellitus E10-E14 06 Diseases of the circulatory system I00-I99 07 Ischemic heart diseases I20-I25 08 Cerebrovascular diseases I60-I69 09 Diseases of arteries, arterioles and capillaries I70-I78 10 Diseases of the respiratory system J00-J98 11 Infl uenza and pneumonia J10-J18 12 Chronic Pulmonary Disease J40-J44 13 Diseases of the digestive system K00-K92 14 Motor vehicle accidents V02-V04, V09, V12-V14, V190- V196, V20-V79, V803-V805, V820-V821, V823-V890, V892, V899, Y850 15 Unintentional falls W00-W19 16 Suicide X60-X84, Y870 17 Alcohol-related deaths see Glossary 18 Medically treatable diseases see Glossary 19 Drug-induced deaths see Glossary
Some cause of death categories are different from those used previously, so readers should avoid comparisons with tables in earlier publications.
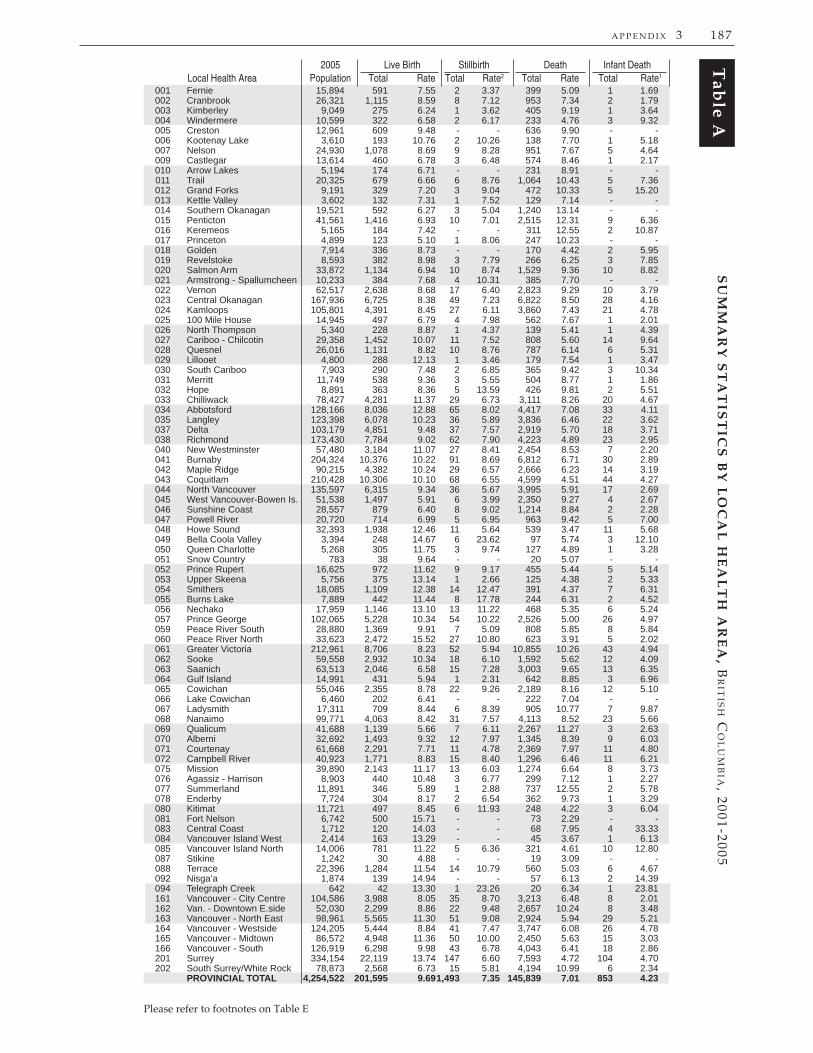
A P P E N D I X 3 187
2005 Live Birth Stillbirth Death Infant Death Local Health Area Population Total Rate Total Rate2 Total Rate Total Rate1
SU
MM
AR
Y S
TA
TIS
TIC
S B
Y L
OC
AL
HE
AL
TH
AR
EA
, BR
ITIS
H C
OL
UM
BIA
, 2001-2005T
able A
001 Fernie 15,894 591 7.55 2 3.37 399 5.09 1 1.69 002 Cranbrook 26,321 1,115 8.59 8 7.12 953 7.34 2 1.79 003 Kimberley 9,049 275 6.24 1 3.62 405 9.19 1 3.64 004 Windermere 10,599 322 6.58 2 6.17 233 4.76 3 9.32 005 Creston 12,961 609 9.48 - - 636 9.90 - - 006 Kootenay Lake 3,610 193 10.76 2 10.26 138 7.70 1 5.18 007 Nelson 24,930 1,078 8.69 9 8.28 951 7.67 5 4.64 009 Castlegar 13,614 460 6.78 3 6.48 574 8.46 1 2.17 010 Arrow Lakes 5,194 174 6.71 - - 231 8.91 - - 011 Trail 20,325 679 6.66 6 8.76 1,064 10.43 5 7.36 012 Grand Forks 9,191 329 7.20 3 9.04 472 10.33 5 15.20 013 Kettle Valley 3,602 132 7.31 1 7.52 129 7.14 - - 014 Southern Okanagan 19,521 592 6.27 3 5.04 1,240 13.14 - - 015 Penticton 41,561 1,416 6.93 10 7.01 2,515 12.31 9 6.36 016 Keremeos 5,165 184 7.42 - - 311 12.55 2 10.87 017 Princeton 4,899 123 5.10 1 8.06 247 10.23 - - 018 Golden 7,914 336 8.73 - - 170 4.42 2 5.95 019 Revelstoke 8,593 382 8.98 3 7.79 266 6.25 3 7.85 020 Salmon Arm 33,872 1,134 6.94 10 8.74 1,529 9.36 10 8.82 021 Armstrong - Spallumcheen 10,233 384 7.68 4 10.31 385 7.70 - - 022 Vernon 62,517 2,638 8.68 17 6.40 2,823 9.29 10 3.79 023 Central Okanagan 167,936 6,725 8.38 49 7.23 6,822 8.50 28 4.16 024 Kamloops 105,801 4,391 8.45 27 6.11 3,860 7.43 21 4.78 025 100 Mile House 14,945 497 6.79 4 7.98 562 7.67 1 2.01 026 North Thompson 5,340 228 8.87 1 4.37 139 5.41 1 4.39 027 Cariboo - Chilcotin 29,358 1,452 10.07 11 7.52 808 5.60 14 9.64 028 Quesnel 26,016 1,131 8.82 10 8.76 787 6.14 6 5.31 029 Lillooet 4,800 288 12.13 1 3.46 179 7.54 1 3.47 030 South Cariboo 7,903 290 7.48 2 6.85 365 9.42 3 10.34 031 Merritt 11,749 538 9.36 3 5.55 504 8.77 1 1.86 032 Hope 8,891 363 8.36 5 13.59 426 9.81 2 5.51 033 Chilliwack 78,427 4,281 11.37 29 6.73 3,111 8.26 20 4.67 034 Abbotsford 128,166 8,036 12.88 65 8.02 4,417 7.08 33 4.11 035 Langley 123,398 6,078 10.23 36 5.89 3,836 6.46 22 3.62 037 Delta 103,179 4,851 9.48 37 7.57 2,919 5.70 18 3.71 038 Richmond 173,430 7,784 9.02 62 7.90 4,223 4.89 23 2.95 040 New Westminster 57,480 3,184 11.07 27 8.41 2,454 8.53 7 2.20 041 Burnaby 204,324 10,376 10.22 91 8.69 6,812 6.71 30 2.89 042 Maple Ridge 90,215 4,382 10.24 29 6.57 2,666 6.23 14 3.19 043 Coquitlam 210,428 10,306 10.10 68 6.55 4,599 4.51 44 4.27 044 North Vancouver 135,597 6,315 9.34 36 5.67 3,995 5.91 17 2.69 045 West Vancouver-Bowen Is. 51,538 1,497 5.91 6 3.99 2,350 9.27 4 2.67 046 Sunshine Coast 28,557 879 6.40 8 9.02 1,214 8.84 2 2.28 047 Powell River 20,720 714 6.99 5 6.95 963 9.42 5 7.00 048 Howe Sound 32,393 1,938 12.46 11 5.64 539 3.47 11 5.68 049 Bella Coola Valley 3,394 248 14.67 6 23.62 97 5.74 3 12.10 050 Queen Charlotte 5,268 305 11.75 3 9.74 127 4.89 1 3.28 051 Snow Country 783 38 9.64 - - 20 5.07 - - 052 Prince Rupert 16,625 972 11.62 9 9.17 455 5.44 5 5.14 053 Upper Skeena 5,756 375 13.14 1 2.66 125 4.38 2 5.33 054 Smithers 18,085 1,109 12.38 14 12.47 391 4.37 7 6.31 055 Burns Lake 7,889 442 11.44 8 17.78 244 6.31 2 4.52 056 Nechako 17,959 1,146 13.10 13 11.22 468 5.35 6 5.24 057 Prince George 102,065 5,228 10.34 54 10.22 2,526 5.00 26 4.97 059 Peace River South 28,880 1,369 9.91 7 5.09 808 5.85 8 5.84 060 Peace River North 33,623 2,472 15.52 27 10.80 623 3.91 5 2.02 061 Greater Victoria 212,961 8,706 8.23 52 5.94 10,855 10.26 43 4.94 062 Sooke 59,558 2,932 10.34 18 6.10 1,592 5.62 12 4.09 063 Saanich 63,513 2,046 6.58 15 7.28 3,003 9.65 13 6.35 064 Gulf Island 14,991 431 5.94 1 2.31 642 8.85 3 6.96 065 Cowichan 55,046 2,355 8.78 22 9.26 2,189 8.16 12 5.10 066 Lake Cowichan 6,460 202 6.41 - - 222 7.04 - - 067 Ladysmith 17,311 709 8.44 6 8.39 905 10.77 7 9.87 068 Nanaimo 99,771 4,063 8.42 31 7.57 4,113 8.52 23 5.66 069 Qualicum 41,688 1,139 5.66 7 6.11 2,267 11.27 3 2.63 070 Alberni 32,692 1,493 9.32 12 7.97 1,345 8.39 9 6.03 071 Courtenay 61,668 2,291 7.71 11 4.78 2,369 7.97 11 4.80 072 Campbell River 40,923 1,771 8.83 15 8.40 1,296 6.46 11 6.21 075 Mission 39,890 2,143 11.17 13 6.03 1,274 6.64 8 3.73 076 Agassiz - Harrison 8,903 440 10.48 3 6.77 299 7.12 1 2.27 077 Summerland 11,891 346 5.89 1 2.88 737 12.55 2 5.78 078 Enderby 7,724 304 8.17 2 6.54 362 9.73 1 3.29 080 Kitimat 11,721 497 8.45 6 11.93 248 4.22 3 6.04 081 Fort Nelson 6,742 500 15.71 - - 73 2.29 - - 083 Central Coast 1,712 120 14.03 - - 68 7.95 4 33.33 084 Vancouver Island West 2,414 163 13.29 - - 45 3.67 1 6.13 085 Vancouver Island North 14,006 781 11.22 5 6.36 321 4.61 10 12.80 087 Stikine 1,242 30 4.88 - - 19 3.09 - - 088 Terrace 22,396 1,284 11.54 14 10.79 560 5.03 6 4.67 092 Nisga’a 1,874 139 14.94 - - 57 6.13 2 14.39 094 Telegraph Creek 642 42 13.30 1 23.26 20 6.34 1 23.81 161 Vancouver - City Centre 104,586 3,988 8.05 35 8.70 3,213 6.48 8 2.01 162 Van. - Downtown E.side 52,030 2,299 8.86 22 9.48 2,657 10.24 8 3.48 163 Vancouver - North East 98,961 5,565 11.30 51 9.08 2,924 5.94 29 5.21 164 Vancouver - Westside 124,205 5,444 8.84 41 7.47 3,747 6.08 26 4.78 165 Vancouver - Midtown 86,572 4,948 11.36 50 10.00 2,450 5.63 15 3.03 166 Vancouver - South 126,919 6,298 9.98 43 6.78 4,043 6.41 18 2.86 201 Surrey 334,154 22,119 13.74 147 6.60 7,593 4.72 104 4.70 202 South Surrey/White Rock 78,873 2,568 6.73 15 5.81 4,194 10.99 6 2.34 PROVINCIAL TOTAL 4,254,522 201,595 9.69 1,493 7.35 145,839 7.01 853 4.23
Please refer to footnotes on Table E

188 A P P E N D I X 3
001 Fernie 20 33.84 180 304.57 29 49.07 34 57.53 89 150.59 002 Cranbrook 41 36.77 311 278.92 71 63.68 93 83.41 141 126.46 003 Kimberley 13 47.27 77 280.00 15 54.55 14 50.91 56 203.64 004 Windermere 10 31.06 80 248.45 10 31.06 19 59.01 41 127.33 005 Creston 29 47.62 122 200.33 43 70.61 76 124.79 71 116.58 006 Kootenay Lake 13 67.36 43 222.80 11 56.99 6 31.09 36 186.53 007 Nelson 45 41.74 204 189.24 58 53.80 25 23.19 189 175.32 009 Castlegar 25 54.35 117 254.35 27 58.70 11 23.91 79 171.74 010 Arrow Lakes 14 80.46 47 270.11 17 97.70 5 28.74 19 109.20 011 Trail 50 73.64 182 268.04 67 98.67 26 38.29 120 176.73 012 Grand Forks 15 45.59 92 279.64 22 66.87 23 69.91 68 206.69 013 Kettle Valley 6 45.45 27 204.55 9 68.18 9 68.18 13 98.48 014 Southern Okanagan 25 42.23 144 243.24 34 57.43 28 47.30 84 141.89 015 Penticton 75 52.97 326 230.23 118 83.33 89 62.85 202 142.66 016 Keremeos 12 65.22 40 217.39 16 86.96 10 54.35 28 152.17 017 Princeton 9 73.17 18 146.34 14 113.82 10 81.30 15 121.95 018 Golden 9 26.79 100 297.62 10 29.76 15 44.64 48 142.86 019 Revelstoke 16 41.88 114 298.43 30 78.53 20 52.36 63 164.92 020 Salmon Arm 52 45.86 374 329.81 67 59.08 53 46.74 173 152.56 021 Armstrong - Spallumcheen 16 41.67 111 289.06 31 80.73 10 26.04 49 127.60 022 Vernon 165 62.55 761 288.48 189 71.65 125 47.38 395 149.73 023 Central Okanagan 346 51.45 1901 282.68 538 80.00 274 40.74 1193 177.40 024 Kamloops 268 61.03 1363 310.41 347 79.03 230 52.38 618 140.74 025 100 Mile House 33 66.40 138 277.67 40 80.48 32 64.39 68 136.82 026 North Thompson 12 52.63 64 280.70 10 43.86 17 74.56 31 135.96 027 Cariboo - Chilcotin 94 64.74 538 370.52 137 94.35 123 84.71 146 100.55 028 Quesnel 69 61.01 302 267.02 77 68.08 89 78.69 126 111.41 029 Lillooet 12 41.67 81 281.25 19 65.97 27 93.75 33 114.58 030 South Cariboo 14 48.28 55 189.66 20 68.97 32 110.34 37 127.59 031 Merritt 28 52.04 143 265.80 42 78.07 43 79.93 75 139.41 032 Hope 14 38.57 96 264.46 41 112.95 44 121.21 39 107.44 033 Chilliwack 199 46.48 1202 280.78 301 70.31 298 69.61 555 129.64 034 Abbotsford 411 51.14 2145 266.92 516 64.21 282 35.09 912 113.49 035 Langley 285 46.89 1635 269.00 419 68.94 179 29.45 1129 185.75 037 Delta 245 50.51 1498 308.80 312 64.32 80 16.49 1171 241.39 038 Richmond 415 53.31 2347 301.52 514 66.03 84 10.79 2196 282.12 040 New Westminster 191 59.99 872 273.87 241 75.69 82 25.75 753 236.49 041 Burnaby 611 58.89 2848 274.48 791 76.23 188 18.12 2676 257.90 042 Maple Ridge 236 53.86 1278 291.65 323 73.71 132 30.12 835 190.55 043 Coquitlam 546 52.98 3011 292.16 729 70.74 192 18.63 2696 261.60 044 North Vancouver 313 49.56 1811 286.78 430 68.09 82 12.98 2163 342.52 045 West Vancouver-Bowen Is. 68 45.42 452 301.94 97 64.80 18 12.02 656 438.21 046 Sunshine Coast 28 31.85 194 220.71 41 46.64 37 42.09 195 221.84 047 Powell River 24 33.61 247 345.94 35 49.02 44 61.62 100 140.06 048 Howe Sound 98 50.57 603 311.15 149 76.88 70 36.12 481 248.19 049 Bella Coola Valley 12 48.39 55 221.77 21 84.68 37 149.19 34 137.10 050 Queen Charlotte 14 45.90 93 304.92 30 98.36 21 68.85 51 167.21 051 Snow Country 2 52.63 9 236.84 2 52.63 1 26.32 4 105.26 052 Prince Rupert 39 40.12 231 237.65 78 80.25 129 132.72 121 124.49 053 Upper Skeena 13 34.67 82 218.67 22 58.67 45 120.00 45 120.00 054 Smithers 51 45.99 327 294.86 77 69.43 71 64.02 152 137.06 055 Burns Lake 12 27.15 109 246.61 15 33.94 36 81.45 37 83.71 056 Nechako 59 51.48 282 246.07 63 54.97 102 89.01 114 99.48 057 Prince George 289 55.28 1493 285.58 376 71.92 353 67.52 632 120.89 059 Peace River South 48 35.06 275 200.88 49 35.79 121 88.39 124 90.58 060 Peace River North 105 42.48 634 256.47 113 45.71 174 70.39 243 98.30 061 Greater Victoria 477 54.79 2797 321.27 677 77.76 284 32.62 2019 231.91 062 Sooke 165 56.28 941 320.94 269 91.75 109 37.18 536 182.81 063 Saanich 109 53.27 605 295.70 170 83.09 76 37.15 481 235.09 064 Gulf Islands 18 41.76 94 218.10 29 67.29 11 25.52 114 264.50 065 Cowichan 142 60.30 601 255.20 211 89.60 191 81.10 359 152.44 066 Lake Cowichan 12 59.41 62 306.93 18 89.11 19 94.06 21 103.96 067 Ladysmith 46 64.88 194 273.62 81 114.25 58 81.81 93 131.17 068 Nanaimo 201 49.47 1183 291.16 316 77.78 250 61.53 593 145.95 069 Qualicum 49 43.02 340 298.51 79 69.36 55 48.29 210 184.37 070 Alberni 59 39.52 379 253.85 107 71.67 153 102.48 187 125.25 071 Courtenay 125 54.56 569 248.36 174 75.95 158 68.97 429 187.25 072 Campbell River 92 51.95 563 317.90 128 72.28 133 75.10 209 118.01 075 Mission 117 54.60 543 253.38 167 77.93 114 53.20 310 144.66 076 Agassiz - Harrison 20 45.45 115 261.36 37 84.09 38 86.36 54 122.73 077 Summerland 9 26.01 90 260.12 20 57.80 16 46.24 65 187.86 078 Enderby 21 69.08 89 292.76 24 78.95 32 105.26 40 131.58 080 Kitimat 18 36.22 193 388.33 23 46.28 36 72.43 60 120.72 081 Fort Nelson 15 30.00 166 332.00 24 48.00 42 84.00 44 88.00 083 Central Coast 9 75.00 25 208.33 19 158.33 17 141.67 9 75.00 084 Vancouver Island West 6 36.81 34 208.59 11 67.48 22 134.97 25 153.37 085 Vancouver Island North 42 53.78 182 233.03 64 81.95 102 130.60 103 131.88 087 Stikine 3 100.00 8 266.67 5 166.67 4 133.33 4 133.33 088 Terrace 58 45.17 361 281.15 101 78.66 131 102.02 139 108.26 092 Nisga’a 4 28.78 38 273.38 13 93.53 29 208.63 14 100.72 094 Telegraph Creek 2 47.62 5 119.05 3 71.43 7 166.67 13 309.52 161 Vancouver - City Centre 195 48.90 1131 283.60 272 68.20 27 6.77 1186 297.39 162 Van. - Downtown E.side 170 73.95 573 249.24 242 105.26 93 40.45 634 275.77 163 Vancouver - North East 339 60.92 1496 268.82 421 75.65 84 15.09 1497 269.00 164 Vancouver - Westside 260 47.76 1566 287.66 388 71.27 19 3.49 2174 399.34 165 Vancouver - Midtown 275 55.58 1346 272.03 363 73.36 102 20.61 1522 307.60 166 Vancouver - South 378 60.02 1704 270.56 465 73.83 96 15.24 1735 275.48 201 Surrey 1365 61.71 6397 289.21 1598 72.25 632 28.57 3480 157.33 202 South Surrey/White Rock 119 46.34 852 331.78 193 75.16 24 9.35 752 292.83 PROVINCIAL TOTAL 10,793 53.54 57,134 283.41 14,630 72.57 7,642 37.91 41,544 206.08
SU
MM
AR
Y S
TA
TIS
TIC
S B
Y L
OC
AL
HE
AL
TH
AR
EA
, B
RIT
ISH
CO
LU
MB
IA,
2001
-200
5T
able
A
Low Birth Wt. Teenage Elderly Live Birth Cesarean Pre-term Mother Gravida Local Health Area Total Rate1 Total Rate1 Total Rate1 Total Rate1 Total Rate1
Please refer to footnotes on Table E

A P P E N D I X 3 189
001 Fernie 1.00 399 0.94 190 0.98 116 0.85 68 1.20 37 0.92 21 1.58 * 25 1.25 13 002 Cranbrook 1.13 * 953 0.99 405 1.07 263 1.16 168 1.18 76 1.15 50 1.43 * 49 1.13 21 003 Kimberley 0.99 405 0.95 143 1.14 129 1.21 67 1.13 33 1.53 20 0.84 14 0.21 * 4 004 Windermere 0.81 * 233 0.91 113 0.80 70 0.77 38 0.89 21 0.48 * 10 0.26 * 3 0.10 * 1 005 Creston 0.93 636 0.98 217 0.99 188 1.03 94 0.87 43 1.05 30 0.85 24 1.10 10 006 Kootenay Lake 0.87 138 1.27 66 1.10 49 1.25 27 0.95 11 1.05 6 0.46 3 0.08 * 1 007 Nelson 1.05 951 0.94 365 1.03 259 0.98 140 0.97 63 0.87 40 0.99 36 1.04 17 009 Castlegar 1.11 * 574 1.02 213 0.95 136 0.77 * 65 0.95 35 1.08 20 1.63 * 34 1.48 16 010 Arrow Lakes 1.00 231 1.25 88 1.12 72 1.25 37 1.25 21 1.95 16 0.95 9 1.09 4 011 Trail 1.14 * 1,064 1.30 * 366 1.03 259 1.00 124 0.85 55 0.99 32 1.48 * 56 1.93 22 012 Grand Forks 1.07 472 1.14 193 1.07 135 1.19 75 0.99 33 1.52 25 1.15 21 0.50 * 5 013 Kettle Valley 0.87 129 0.92 68 0.94 42 0.86 28 0.75 9 1.12 9 0.49 3 0.08 * 1 014 Southern Okanagan 1.00 1,240 1.22 * 417 1.06 372 1.11 168 1.05 97 1.02 43 1.41 * 73 1.44 18 015 Penticton 1.03 2,515 1.29 * 741 1.10 * 709 1.16 296 1.25 * 205 1.32 101 0.83 83 1.61 30 016 Keremeos 1.07 311 1.84 * 144 1.03 87 1.14 49 1.38 31 1.72 21 0.49 6 0.46 2 017 Princeton 1.06 247 1.36 * 120 1.07 75 1.04 48 1.44 27 1.55 19 0.72 7 0.46 * 4 018 Golden 0.90 170 0.92 87 0.91 50 0.82 30 1.06 15 0.63 8 0.81 6 0.58 2 019 Revelstoke 1.04 266 1.14 126 1.00 74 0.89 41 1.08 21 1.03 13 1.35 14 1.11 7 020 Salmon Arm 1.03 1,529 1.26 * 618 1.03 441 1.29 * 244 1.03 117 1.11 66 0.80 49 0.77 16 021 Armstrong - Spallumcheen 0.97 385 1.08 154 1.04 116 1.11 59 1.18 34 1.74 22 0.81 13 0.68 4 022 Vernon 1.07 * 2,823 1.22 * 1,076 1.10 * 811 1.17 * 414 1.23 * 235 1.37 * 135 1.09 118 1.60 41 023 Central Okanagan 0.97 * 6,822 0.99 2,293 0.97 1,885 1.02 943 1.03 520 1.11 283 0.90 258 0.85 87 024 Kamloops 1.15 * 3,860 1.24 * 1,752 1.13 * 1,121 1.11 * 638 1.27 * 333 1.30 * 204 1.27 * 174 1.20 67 025 100 Mile House 1.12 * 562 1.36 * 298 1.05 165 1.23 107 0.94 40 1.18 24 0.67 14 1.02 9 026 North Thompson 1.05 139 1.24 80 1.26 50 1.22 34 1.81 * 19 1.94 14 1.32 7 1.47 4 027 Cariboo - Chilcotin 1.19 * 808 1.26 * 446 1.02 211 1.07 143 0.97 53 1.06 39 1.73 * 47 1.18 19 028 Quesnel 1.13 * 787 1.17 * 402 1.12 234 0.95 130 1.20 66 0.82 37 1.35 38 1.32 20 029 Lillooet 1.29 * 179 1.48 * 96 1.17 47 1.53 32 1.23 13 0.95 7 0.71 4 0.08 * 1 030 South Cariboo 1.31 * 365 1.66 * 209 1.00 85 0.96 58 1.44 33 1.35 24 1.47 17 1.02 9 031 Merritt 1.41 * 504 1.70 * 268 1.23 * 127 1.30 77 0.96 26 1.00 17 1.18 17 1.25 10 032 Hope 1.18 * 426 1.60 * 211 1.06 111 1.18 69 1.34 37 1.48 25 2.15 * 32 2.81 15 033 Chilliwack 1.08 * 3,111 1.18 * 1,207 1.08 * 863 1.16 * 463 1.10 230 1.48 * 151 1.12 132 1.69 * 60 034 Abbotsford 1.01 4,417 1.05 1,608 1.04 1,225 1.04 625 0.96 291 1.06 168 1.12 198 1.29 77 035 Langley 1.03 3,836 0.84 * 1,445 1.08 * 1,167 0.97 602 1.14 * 318 1.09 179 0.96 146 0.85 60 037 Delta 1.02 2,919 0.77 * 1,096 0.99 843 0.91 459 0.85 * 190 0.79 * 111 0.78 * 91 0.79 40 038 Richmond 0.73 * 4,223 0.60 * 1,532 0.81 * 1,311 0.81 * 696 0.87 * 360 0.76 * 189 0.81 * 186 0.66 * 70 040 New Westminster 1.10 * 2,454 1.11 * 891 1.09 * 634 1.07 314 1.21 * 176 1.31 103 1.15 102 1.43 36 041 Burnaby 0.94 * 6,812 0.77 * 2,272 0.92 * 1,821 0.89 * 913 0.89 * 448 0.79 * 246 0.94 272 0.88 101 042 Maple Ridge 1.16 * 2,666 1.05 1,165 1.16 * 758 1.14 * 449 1.41 * 238 1.51 * 155 1.08 99 0.99 43 043 Coquitlam 0.92 * 4,599 0.79 * 2,049 0.98 1,415 0.95 877 1.01 376 0.93 243 1.02 201 0.74 * 76 044 North Vancouver 0.90 * 3,995 0.66 * 1,339 0.86 * 1,082 0.79 * 570 0.72 * 234 0.63 * 144 0.96 171 0.75 55 045 West Van.-Bowen Is. 0.83 * 2,350 0.58 * 546 0.83 * 629 0.76 * 268 0.52 * 100 0.42 * 43 0.56 * 64 0.36 * 11 046 Sunshine Coast 1.00 1,214 0.99 468 1.08 376 1.05 195 1.13 103 1.19 62 0.56 * 28 0.71 12 047 Powell River 1.12 * 963 1.17 * 379 1.22 * 297 1.18 151 1.27 * 81 1.30 49 1.31 46 0.93 15 048 Howe Sound 0.98 539 0.95 310 0.83 * 135 0.70 * 85 0.72 30 0.44 * 18 1.33 28 0.67 15 049 Bella Coola Valley 1.27 * 97 2.40 * 68 0.82 19 1.13 14 0.49 3 0.68 3 1.31 4 3.05 4 050 Queen Charlotte 1.09 127 1.22 85 1.00 34 0.91 25 1.37 12 1.39 9 1.54 7 1.24 4 051 Snow Country 1.55 20 2.12 18 1.29 6 0.47 * 5 0.78 1 - - 1.93 1 0.40 1 052 Prince Rupert 1.25 * 455 1.34 * 229 1.04 110 1.00 63 1.02 28 0.68 15 1.46 21 1.12 9 053 Upper Skeena 1.09 125 1.28 73 1.06 36 0.93 21 0.90 8 0.91 5 2.00 9 3.94 6 054 Smithers 1.07 391 1.12 213 0.97 104 0.88 70 1.30 36 1.52 28 1.05 15 1.21 8 055 Burns Lake 1.14 * 244 1.39 * 122 0.97 62 0.99 36 0.72 12 0.61 7 1.39 12 0.32 * 3 056 Nechako 1.21 * 468 1.36 * 271 1.10 126 1.27 79 0.93 28 0.83 18 1.69 * 26 1.38 15 057 Prince George 1.24 * 2,526 1.20 * 1,481 1.26 * 790 1.18 * 538 1.45 * 240 1.21 165 1.56 * 126 1.40 67 059 Peace River South 1.23 * 808 1.27 * 402 1.15 * 222 1.18 141 1.54 * 78 1.59 * 50 1.56 * 41 1.27 18 060 Peace River North 1.07 623 1.01 359 0.99 172 0.95 124 1.04 47 1.01 38 1.32 30 0.85 17 061 Greater Victoria 1.01 10,855 1.06 * 2,972 1.05 * 2,838 1.09 * 1,193 1.02 683 1.10 324 0.89 * 384 1.39 * 132 062 Sooke 1.05 1,592 0.90 * 688 1.11 * 495 1.05 279 1.19 138 0.97 76 1.04 63 0.75 28 063 Saanich 0.85 * 3,003 0.82 * 843 0.96 923 1.01 433 0.64 * 158 0.64 * 76 0.65 * 94 0.42 * 20 064 Gulf Islands 0.78 * 642 1.01 239 0.90 213 1.02 106 0.73 * 45 0.86 22 0.50 * 17 0.38 * 5 065 Cowichan 1.03 2,189 1.14 * 884 1.07 644 1.18 * 357 1.07 170 1.31 * 105 0.77 * 67 0.62 * 24 066 Lake Cowichan 0.99 222 1.29 120 1.10 73 1.56 * 47 1.48 26 1.76 18 0.87 8 1.06 6 067 Ladysmith 1.15 * 905 1.23 * 328 1.19 * 265 1.22 141 1.21 71 1.32 37 0.68 22 0.70 6 068 Nanaimo 1.07 * 4,113 1.16 * 1,564 1.04 1,116 1.10 593 1.14 * 316 1.22 183 1.12 175 0.96 58 069 Qualicum 0.95 * 2,267 1.00 764 1.04 715 1.11 350 0.95 174 1.14 92 0.93 93 1.22 36 070 Alberni 1.21 * 1,345 1.36 * 606 1.14 * 369 1.05 207 1.24 * 105 0.98 59 1.90 * 86 1.53 35 071 Courtenay 1.05 * 2,369 1.03 927 1.12 * 736 1.11 395 1.13 195 1.22 118 0.84 78 0.73 33 072 Campbell River 1.10 * 1,296 1.22 * 621 1.20 * 416 1.28 * 238 1.53 * 139 1.60 * 86 1.13 54 0.61 14 075 Mission 1.18 * 1,274 1.22 * 600 1.19 * 368 1.25 * 238 1.24 * 99 1.27 67 1.39 * 60 1.33 26 076 Agassiz - Harrison 1.03 299 1.32 * 158 0.92 78 0.95 47 0.93 21 1.20 17 1.18 14 1.54 7 077 Summerland 1.01 737 0.95 178 1.01 198 1.05 82 0.93 47 0.88 23 0.66 20 0.23 * 4 078 Enderby 1.16 * 362 1.31 * 145 1.33 * 118 1.50 * 64 1.38 32 1.45 20 0.70 9 0.81 4 080 Kitimat 1.07 248 0.93 144 0.99 75 0.85 54 1.03 21 0.93 17 1.28 12 1.13 6 081 Fort Nelson 1.08 73 0.99 58 0.98 20 0.92 18 0.77 4 0.84 3 1.66 4 0.90 1 083 Central Coast 2.19 * 68 2.76 * 48 0.97 10 1.24 7 0.36 1 0.10 * 1 5.59 * 7 4.29 4 084 Vancouver Island West 1.20 45 1.49 39 0.95 11 1.06 10 1.31 4 1.62 4 0.69 1 0.83 1 085 Vancouver Island North 1.27 * 321 1.59 * 224 1.18 94 1.44 * 71 0.90 19 1.26 17 1.11 11 0.54 5 087 Stikine 0.69 19 0.94 15 0.55 5 0.27 * 4 1.23 3 1.00 3 0.89 1 0.77 1 088 Terrace 1.23 * 560 1.22 * 324 1.09 151 0.98 95 1.04 38 1.01 25 1.72 * 31 2.26 17 092 Nisga’a 1.47 * 57 2.50 * 41 0.81 9 1.23 6 0.34 1 - - 2.60 4 1.75 2 094 Telegraph Creek 1.55 20 4.03 * 18 1.09 4 1.04 3 - - - - - - - - 161 Vancouver - City Centre 1.06 * 3,213 1.05 1,323 0.98 768 0.91 400 0.98 190 0.95 107 0.87 103 0.85 43 162 Van. - Downtown E.side 1.39 * 2,657 2.70 * 1,657 1.11 * 581 1.35 * 359 1.34 * 181 1.43 * 107 1.22 94 1.90 * 49 163 Vancouver - North East 0.89 * 2,924 0.87 * 1,149 0.88 * 817 0.93 445 0.89 215 0.74 * 119 1.08 143 0.63 * 44 164 Vancouver - Westside 0.81 * 3,747 0.66 * 1,001 0.82 * 961 0.84 * 436 0.67 * 193 0.70 * 98 0.72 * 132 0.72 35 165 Vancouver - Midtown 0.94 * 2,450 0.83 * 949 0.85 * 612 0.83 * 314 0.87 161 0.64 * 75 1.02 105 0.76 40 166 Vancouver - South 0.84 * 4,043 0.74 * 1,265 0.80 * 1,040 0.75 * 474 0.80 * 262 0.63 * 122 0.93 179 1.00 56 201 Surrey 1.04 * 7,593 1.04 3,774 0.95 * 2,051 0.95 1,292 0.85 * 484 0.89 319 1.26 * 366 1.20 178 202 South Surrey/White Rock 0.98 4,194 0.77 * 1,009 0.99 1,137 0.92 470 0.88 * 260 0.79 * 121 0.77 * 135 0.81 37 PROVINCIAL TOTAL 1.00 145,839 1.00 56,291 1.00 40,642 1.00 21,524 1.00 10,485 1.00 6,041 1.00 5,882 1.00 2,260
01 02 03 04 All Causes of Death Malignant Neoplasms Malignant Neoplasm of Lung End/Nut/Met. Diseases Local Health Area SMR (p) Death TR PYLLI (p) D<75 SMR (p) Death TR PYLLI (p) D<75 SMR (p) Death TR PYLLI (p) D<75 SMR (p) Death TR PYLLI (p) D<75
Please refer to footnotes on Table E
MO
RT
AL
ITY
ST
AT
IST
ICS
BY
LO
CA
L H
EA
LT
H A
RE
A, B
RIT
ISH
CO
LU
MB
IA, 2001-2005
Tab
le B

190 A P P E N D I X 3
05 06 07 08 Diabetes Mellitus Diseases of the Circulatory System Ischemic Heart Diseases Cerebrovascular Diseases Local Health Area SMR (p) Death TR PYLLI (p) D<75 SMR (p) Death TR PYLLI (p) D<75 SMR (p) Death TR PYLLI (p) D<75 SMR (p) Death TR PYLLI (p) D<75
Please refer to footnotes on Table E
001 Fernie 1.61 20 1.79 11 0.94 116 0.92 39 0.89 53 0.84 20 0.82 22 0.67 4 002 Cranbrook 1.21 33 0.73 13 1.10 304 0.73 * 76 1.08 144 0.84 40 0.91 57 0.37 * 8 003 Kimberley 0.76 10 0.30 * 4 0.97 137 1.04 34 0.67 * 45 0.73 17 0.93 30 0.90 5 004 Windermere 0.22 * 2 - - 0.80 71 0.96 31 0.75 33 1.28 20 1.23 24 1.49 7 005 Creston 0.67 15 0.79 6 1.00 241 1.05 51 0.96 111 1.07 27 0.91 50 1.30 11 006 Kootenay Lake 0.39 2 - - 0.62 * 34 0.57 9 0.85 22 0.79 6 0.64 8 0.10 * 1 007 Nelson 1.01 29 0.91 12 1.20 * 366 1.06 93 1.26 * 183 1.03 45 1.09 76 1.27 21 009 Castlegar 1.88 * 31 2.04 15 1.27 * 222 1.26 65 1.17 98 0.94 33 1.33 53 1.50 11 010 Arrow Lakes 0.67 5 0.69 2 0.96 77 0.81 18 0.81 31 0.80 8 0.49 * 9 0.52 3 011 Trail 1.60 * 48 2.43 19 1.19 * 389 1.42 * 94 1.19 * 184 1.23 41 0.84 64 0.75 11 012 Grand Forks 1.37 20 0.57 4 1.06 161 0.99 54 1.33 * 97 1.13 35 0.91 31 0.92 11 013 Kettle Valley 0.61 3 0.12 * 1 0.76 37 0.97 17 0.71 17 0.81 8 0.75 8 1.69 3 014 Southern Okanagan 1.44 * 60 1.91 17 0.89 * 391 1.23 99 0.75 * 158 0.90 43 0.94 95 1.55 23 015 Penticton 0.74 * 59 0.82 19 0.92 * 818 1.20 160 0.95 399 1.34 93 0.89 185 1.22 29 016 Keremeos 0.51 5 0.08 * 1 1.20 122 1.39 34 0.85 42 0.82 10 1.36 31 1.68 7 017 Princeton 0.77 6 0.63 4 1.26 * 98 1.85 * 37 1.31 50 2.08 * 24 1.51 26 3.22 8 018 Golden 1.03 6 0.87 2 1.08 63 1.06 24 0.70 20 0.94 10 1.24 16 1.98 6 019 Revelstoke 1.47 12 1.35 6 1.07 88 1.83 * 35 0.70 28 1.44 14 1.02 19 1.41 5 020 Salmon Arm 0.81 40 0.57 13 1.02 516 1.07 142 0.85 * 208 1.03 66 1.05 121 1.13 30 021 Armstrong - Spallumcheen 0.86 11 0.10 * 2 0.98 132 1.10 39 0.87 56 0.95 21 1.01 31 1.88 9 022 Vernon 1.12 96 1.07 32 1.03 944 1.25 * 238 0.99 430 1.15 120 1.02 215 1.27 44 023 Central Okanagan 0.86 * 196 0.75 65 0.97 2,361 0.91 506 0.83 * 965 0.85 * 244 0.94 527 1.03 103 024 Kamloops 1.30 * 141 1.02 50 1.09 * 1,179 1.20 * 357 1.13 * 590 1.47 * 223 0.88 214 0.63 * 41 025 100 Mile House 0.72 12 1.09 7 1.06 168 1.10 64 1.08 85 0.97 32 1.00 34 1.58 12 026 North Thompson 1.43 6 2.19 4 0.93 38 0.57 * 13 0.95 19 0.76 8 0.57 5 - - 027 Cariboo - Chilcotin 1.69 * 36 1.36 14 1.23 * 251 1.04 90 1.04 104 0.83 42 1.28 57 1.34 21 028 Quesnel 1.39 31 0.78 14 1.04 227 1.23 85 0.90 96 1.30 44 0.98 47 0.88 10 029 Lillooet 0.90 4 0.11 * 1 0.98 44 1.40 18 0.60 13 0.74 5 1.30 13 3.14 6 030 South Cariboo 1.51 14 1.28 6 1.17 106 1.51 45 1.08 48 1.61 23 1.06 21 1.61 8 031 Merritt 1.31 15 1.82 9 1.60 * 186 2.23 * 76 1.54 * 87 2.09 * 33 2.00 * 52 3.46 * 27 032 Hope 2.28 * 27 2.94 14 1.17 142 1.58 * 47 1.21 71 1.64 26 0.99 27 2.07 8 033 Chilliwack 1.21 * 113 1.99 * 53 1.12 * 1,096 1.39 * 275 1.28 * 597 1.41 * 155 1.03 232 1.19 49 034 Abbotsford 1.20 * 167 1.44 63 1.05 1,576 1.14 343 1.14 * 808 1.24 * 191 0.98 339 1.15 60 035 Langley 0.94 113 0.79 43 1.02 1,249 0.90 312 1.12 * 652 1.06 192 1.03 287 0.83 53 037 Delta 0.80 73 0.77 35 1.15 * 1,044 0.86 * 262 1.16 * 505 0.83 139 1.16 * 238 0.78 44 038 Richmond 0.83 * 151 0.70 * 55 0.74 * 1,410 0.61 * 326 0.74 * 673 0.54 * 153 0.78 * 342 0.84 69 040 New Westminster 1.13 78 1.35 27 1.15 * 890 1.27 * 199 1.30 * 467 1.49 * 124 1.00 182 1.09 30 041 Burnaby 0.94 214 0.94 80 0.99 2,439 0.80 * 498 1.19 * 1,376 0.95 307 0.84 * 477 0.63 * 71 042 Maple Ridge 1.11 80 1.31 39 1.28 * 941 1.15 257 1.39 * 488 1.22 142 1.20 * 199 1.01 39 043 Coquitlam 1.04 159 0.85 61 0.93 * 1,444 0.72 * 401 0.93 687 0.75 * 219 1.02 353 0.82 81 044 North Vancouver 1.00 140 0.73 41 0.98 1,434 0.65 * 291 0.95 662 0.66 * 156 1.12 * 376 0.69 * 56 045 West Van.-Bowen Is. 0.57 * 52 0.26 * 10 0.88 * 891 0.45 * 105 0.80 * 381 0.32 * 50 1.08 255 0.35 * 20 046 Sunshine Coast 0.58 * 23 0.88 10 1.00 418 1.12 113 0.88 177 1.15 53 1.17 111 0.71 18 047 Powell River 1.04 29 0.88 9 1.09 319 1.28 95 1.08 152 1.44 53 1.13 75 1.05 21 048 Howe Sound 1.41 23 0.82 12 1.02 158 0.77 64 0.97 73 0.70 26 0.85 28 0.71 10 049 Bella Coola Valley 1.66 4 4.72 4 0.92 21 1.20 11 0.71 8 0.84 4 1.21 6 1.74 2 050 Queen Charlotte 1.13 4 1.04 2 0.79 28 0.86 14 0.53 * 9 0.31 * 5 0.78 6 2.14 4 051 Snow Country 2.45 1 0.58 1 1.27 4 0.73 3 0.58 1 1.08 1 1.78 1 0.52 1 052 Prince Rupert 1.51 17 0.67 6 1.33 * 147 1.72 * 55 1.12 60 1.48 24 1.27 31 2.66 11 053 Upper Skeena 1.70 6 1.46 3 0.77 26 0.74 11 0.60 10 0.72 5 0.69 5 0.10 * 1 054 Smithers 1.17 13 1.79 7 0.98 106 0.87 38 0.89 47 1.05 24 0.42 * 10 0.09 * 1 055 Burns Lake 1.46 10 0.49 3 1.03 69 1.43 23 1.03 34 0.85 12 0.69 10 2.46 5 056 Nechako 1.90 * 23 1.58 12 1.13 133 1.20 56 1.02 59 1.23 33 1.14 29 0.92 7 057 Prince George 1.50 * 95 1.40 53 1.08 637 1.13 275 0.91 264 0.98 127 1.10 140 1.09 48 059 Peace River South 1.84 * 38 1.56 16 1.29 * 262 1.68 * 103 1.39 * 138 1.98 * 62 0.96 43 0.54 7 060 Peace River North 1.36 24 1.19 14 1.10 184 1.24 83 1.19 98 1.71 * 55 0.94 34 0.80 9 061 Greater Victoria 0.86 * 293 1.33 97 1.00 3,905 0.97 587 0.94 * 1,715 0.96 299 1.08 * 1,015 1.08 119 062 Sooke 0.88 42 0.47 * 18 1.02 489 0.90 144 0.95 219 1.04 88 1.16 124 0.74 23 063 Saanich 0.69 * 80 0.51 * 17 0.77 * 978 0.70 * 169 0.68 * 411 0.65 * 88 0.90 262 0.76 30 064 Gulf Islands 0.40 * 11 0.44 * 4 0.70 * 203 0.77 51 0.62 * 86 0.75 29 0.91 60 1.00 11 065 Cowichan 0.78 54 0.78 20 1.00 711 1.07 172 0.99 341 1.05 90 0.97 157 1.34 26 066 Lake Cowichan 0.68 5 0.54 3 0.97 72 1.69 30 0.83 30 0.81 11 1.03 17 2.24 6 067 Ladysmith 0.73 19 0.31 * 5 1.14 * 310 1.07 80 0.97 126 0.75 32 1.36 * 84 0.96 17 068 Nanaimo 1.13 140 0.91 44 1.12 * 1,458 1.22 * 372 1.23 * 768 1.46 * 215 1.04 312 0.98 56 069 Qualicum 0.95 76 1.07 29 0.95 786 1.00 181 0.95 381 1.29 110 0.81 * 153 0.57 * 27 070 Alberni 1.89 * 68 1.57 25 1.27 * 465 1.47 * 150 1.25 * 221 1.41 * 86 1.19 98 1.89 * 27 071 Courtenay 0.88 65 0.75 27 0.97 733 0.91 195 0.94 340 0.97 105 1.14 194 1.30 48 072 Campbell River 1.11 42 0.44 * 11 0.97 366 1.02 119 0.83 * 153 1.03 57 0.94 79 1.18 22 075 Mission 1.38 * 47 1.62 20 1.13 * 393 1.31 * 129 1.18 * 198 1.20 70 1.04 81 1.53 23 076 Agassiz - Harrison 1.38 13 2.26 7 0.96 91 1.41 40 1.09 50 1.56 24 0.86 18 1.44 7 077 Summerland 0.79 19 0.32 * 4 0.96 253 1.04 45 0.97 121 0.94 21 1.11 68 1.43 13 078 Enderby 0.69 7 1.11 3 1.07 115 1.12 29 1.19 61 1.69 18 0.86 21 0.33 * 2 080 Kitimat 1.35 10 0.77 4 1.16 76 0.69 * 33 1.09 36 0.84 20 1.49 20 0.86 7 081 Fort Nelson 1.65 3 1.51 1 1.12 17 1.25 13 1.18 9 1.61 8 1.01 3 0.61 2 083 Central Coast 5.05 * 5 5.59 3 1.69 14 2.27 7 1.18 5 1.46 2 3.00 5 0.28 * 1 084 Vancouver Island West 0.89 1 1.33 1 1.31 13 2.29 11 1.62 8 4.12 8 0.97 2 0.22 * 1 085 Vancouver Island North 1.03 8 0.82 5 1.16 81 1.71 * 48 1.34 47 2.11 * 32 1.19 17 1.06 5 087 Stikine 1.13 1 1.11 1 0.88 7 1.26 4 0.51 2 1.10 1 - - - - 088 Terrace 1.62 * 23 1.61 10 1.16 155 1.31 65 1.02 67 0.90 30 0.98 28 1.37 13 092 Nisga’a 3.32 4 2.87 2 1.36 16 2.93 12 1.74 10 3.44 8 1.55 4 7.55 4 094 Telegraph Creek - - - - 1.51 6 4.48 5 1.52 3 3.76 2 1.20 1 12.42 1 161 Vancouver - City Centre 0.72 * 66 0.79 28 1.02 1,029 1.02 264 0.97 459 0.80 * 122 1.08 257 1.01 39 162 Van. - Downtown E.side 1.12 68 2.08 * 40 1.15 * 740 2.46 * 325 0.98 302 1.60 * 126 1.24 * 182 2.80 * 66 163 Vancouver - North East 1.15 121 0.67 * 36 0.89 * 963 0.93 256 0.87 * 453 0.80 * 117 1.00 247 0.91 52 164 Vancouver - Westside 0.60 * 85 0.42 * 21 0.76 * 1,239 0.57 * 183 0.71 * 535 0.45 * 73 0.80 * 309 0.71 36 165 Vancouver - Midtown 1.05 85 0.92 36 0.94 801 0.90 220 0.91 369 0.72 * 93 1.01 198 0.98 53 166 Vancouver - South 0.91 138 0.85 42 0.84 * 1,392 0.78 * 291 0.81 * 632 0.67 * 147 0.98 376 1.08 64 201 Surrey 1.33 * 302 1.44 * 153 1.14 * 2,514 1.15 * 829 1.27 * 1,340 1.31 * 500 1.06 523 0.96 130 202 South Surrey/White Rock 0.70 * 97 0.55 * 26 1.05 1,596 0.69 * 211 1.24 * 881 0.65 * 108 0.94 341 0.79 44 PROVINCIAL TOTAL 1.00 4,643 1.00 1,769 1.00 48,947 1.00 12,177 1.00 23,295 1.00 6,436 1.00 11,234 1.00 2,186
MO
RT
AL
ITY
S
TA
TIS
TIC
S B
Y L
OC
AL
HE
AL
TH
AR
EA
, B
RIT
ISH
CO
LU
MB
IA,
2001
-200
5T
able
B

A P P E N D I X 3 191M
OR
TA
LIT
Y S
TA
TIS
TIC
S B
Y L
OC
AL
HE
AL
TH
AR
EA
, BR
ITIS
H C
OL
UM
BIA
, 2001-2005T
able B
001 Fernie 0.71 6 1.23 4 1.06 39 1.00 13 0.74 11 - - 1.38 21 0.83 8002 Cranbrook 0.96 18 1.22 9 1.21 103 1.70 30 1.21 42 1.91 8 1.24 44 1.42 14003 Kimberley 1.28 12 2.05 4 0.93 41 0.85 7 0.81 15 0.19 * 2 1.06 19 1.77 4004 Windermere 0.64 4 0.47 1 0.92 25 0.52 5 1.14 12 0.73 2 0.94 11 0.66 2005 Creston 0.87 14 0.39 * 4 0.63 * 48 0.97 12 0.63 * 20 0.67 4 0.64 * 20 1.11 6006 Kootenay Lake 0.28 1 1.53 1 0.59 10 0.07 * 1 0.98 7 0.23 * 1 0.44 3 - -007 Nelson 1.63 * 33 2.68 12 0.78 * 74 0.51 * 13 0.60 * 24 0.33 * 3 0.95 36 0.94 8009 Castlegar 1.81 * 21 1.80 9 0.86 47 1.50 12 0.91 21 2.32 5 0.91 20 0.87 5010 Arrow Lakes 2.45 * 13 1.73 3 0.60 * 15 0.73 2 0.38 * 4 2.13 1 0.80 8 0.13 * 1011 Trail 2.11 * 45 3.50 * 16 1.02 104 1.48 24 0.78 34 1.87 6 1.46 * 60 1.84 15012 Grand Forks 0.78 8 2.07 4 1.05 50 1.06 9 1.33 26 1.66 2 0.90 18 0.97 6013 Kettle Valley 1.46 5 2.31 3 0.86 13 0.36 * 3 0.17 * 1 - - 1.38 9 0.18 * 1014 Southern Okanagan 1.15 34 1.66 11 0.92 128 1.16 24 1.14 65 0.39 * 3 0.75 44 1.40 15015 Penticton 0.68 * 39 0.55 8 1.03 292 1.34 47 0.99 121 1.47 15 1.14 130 1.40 24016 Keremeos 1.43 10 1.99 4 0.81 26 0.61 11 0.54 7 0.15 * 1 1.17 16 0.75 7017 Princeton 0.91 5 1.12 2 0.78 19 0.57 4 0.73 7 - - 0.67 7 0.67 2018 Golden 1.76 7 0.56 2 0.91 16 0.85 7 0.84 6 - - 1.10 8 2.18 6019 Revelstoke 2.32 * 13 4.41 8 1.07 27 1.05 8 1.27 13 1.39 3 1.05 11 1.58 5020 Salmon Arm 1.39 * 48 1.59 20 0.95 152 0.81 35 0.80 52 0.74 6 1.25 84 1.03 24021 Armstrong - Spallumcheen 1.45 13 1.85 4 0.89 37 1.27 8 0.69 12 0.09 * 1 1.11 19 1.65 5022 Vernon 1.30 * 79 1.91 28 0.98 282 1.04 64 0.86 103 1.14 16 1.24 * 146 1.23 39023 Central Okanagan 0.98 158 0.94 41 0.98 750 0.63 * 105 0.94 303 0.43 * 20 0.99 313 0.64 * 55024 Kamloops 1.06 79 0.93 24 1.12 * 373 1.54 * 126 0.84 112 1.53 28 1.39 * 196 1.45 * 68025 100 Mile House 0.79 9 1.23 5 1.26 61 1.43 21 1.52 * 28 0.73 5 0.98 21 1.49 11026 North Thompson 1.05 3 0.19 * 1 0.41 * 5 0.06 * 1 0.21 1 - - 0.39 2 0.17 * 1027 Cariboo - Chilcotin 1.54 22 1.34 9 1.02 62 1.57 29 0.75 18 1.39 6 1.16 30 1.27 14028 Quesnel 1.38 21 2.33 12 1.37 * 91 1.14 31 1.29 34 1.12 7 1.77 * 50 1.90 22029 Lillooet 2.30 7 2.19 4 1.54 21 2.75 10 1.08 6 1.96 2 1.93 11 4.43 7030 South Cariboo 1.88 12 2.03 5 1.29 36 2.41 9 0.74 8 1.87 1 1.99 * 24 1.15 5031 Merritt 1.00 8 1.23 4 1.53 * 55 2.89 * 27 1.02 15 3.35 7 1.99 * 30 3.14 * 13032 Hope 1.33 11 0.86 5 1.17 44 1.27 12 0.98 15 1.67 5 1.20 19 0.79 4033 Chilliwack 0.72 * 47 0.57 14 1.20 * 369 1.48 * 96 1.19 * 151 1.37 21 1.26 * 161 1.90 * 58034 Abbotsford 0.87 86 0.46 * 13 0.96 452 1.08 84 1.04 208 0.83 20 0.93 177 1.36 44035 Langley 0.68 * 56 0.45 * 13 1.15 * 430 0.79 91 1.31 * 201 0.83 29 1.11 173 0.88 49037 Delta 1.26 78 0.86 24 1.08 293 0.83 54 1.22 * 134 1.05 15 0.93 106 0.64 * 25038 Richmond 0.85 108 0.80 40 0.77 * 451 0.36 * 65 0.79 * 196 0.28 * 17 0.69 * 164 0.25 * 26040 New Westminster 1.10 54 0.78 9 1.11 265 1.24 54 1.25 * 132 1.70 24 0.95 88 0.93 19041 Burnaby 0.70 * 113 0.67 29 1.07 816 0.72 * 142 1.17 * 380 0.47 * 34 1.02 312 0.81 74042 Maple Ridge 1.02 50 0.81 17 1.20 * 269 1.59 * 85 1.21 112 1.59 24 1.16 107 1.60 42043 Coquitlam 0.56 * 58 0.26 * 15 0.99 460 0.72 * 115 1.05 201 0.68 30 0.94 179 0.75 56044 North Vancouver 1.05 102 0.53 * 22 0.97 438 0.84 83 1.12 212 1.07 22 0.83 * 152 0.76 45045 West Van.-Bowen Is. 0.99 65 0.62 12 0.86 * 273 0.51 * 27 1.18 * 163 0.91 10 0.62 * 78 0.25 * 13046 Sunshine Coast 1.07 30 1.49 12 1.13 147 1.10 34 1.42 * 76 1.49 13 0.90 49 1.16 17047 Powell River 1.07 21 1.61 7 0.93 85 1.15 18 0.92 35 1.25 6 0.96 36 0.74 7048 Howe Sound 0.93 10 0.76 7 0.88 40 0.88 15 0.78 14 0.74 6 1.17 22 0.89 6049 Bella Coola Valley 1.25 2 1.95 2 0.88 6 0.10 * 1 0.38 1 - - 1.70 5 0.30 * 1050 Queen Charlotte 1.67 4 1.00 1 0.86 9 1.09 5 1.17 5 0.85 1 0.47 2 1.20 2051 Snow Country 3.90 1 - - - - - - - - - - - - - -052 Prince Rupert 1.58 12 2.45 7 1.11 37 0.43 * 9 1.05 14 0.47 2 1.14 16 0.35 * 5053 Upper Skeena 0.42 1 0.66 1 1.36 14 1.06 4 0.99 4 0.87 1 1.37 6 - -054 Smithers 1.48 11 1.99 6 1.18 38 1.50 15 0.77 10 0.11 * 2 1.49 20 1.50 9055 Burns Lake 1.48 7 2.49 3 0.96 20 1.84 6 0.73 6 0.84 1 1.13 10 2.44 3056 Nechako 1.58 13 1.06 4 1.32 47 1.09 17 0.85 12 1.33 2 2.06 * 31 1.67 13057 Prince George 1.50 * 63 1.87 * 36 1.43 * 251 1.23 85 1.17 79 1.12 19 1.68 * 126 1.15 43059 Peace River South 1.35 19 1.52 10 1.27 * 79 1.26 19 1.33 33 1.52 5 1.34 35 0.93 10060 Peace River North 1.37 16 1.23 9 1.20 60 0.68 13 1.02 20 0.99 4 1.53 * 32 0.73 7061 Greater Victoria 0.94 230 0.83 45 0.91 * 1,115 1.03 161 0.78 * 431 0.65 * 31 0.97 460 1.33 92062 Sooke 0.95 31 0.35 * 5 1.00 146 0.95 43 1.00 59 0.78 12 0.99 60 0.98 20063 Saanich 0.85 71 0.54 * 13 0.85 * 341 0.89 44 0.80 * 135 1.14 11 0.81 * 133 0.54 * 21064 Gulf Islands 0.56 11 0.50 2 0.64 * 58 0.72 13 0.66 * 25 0.44 2 0.60 * 23 0.79 8065 Cowichan 0.85 41 0.80 14 1.13 252 1.36 72 0.98 89 0.89 15 1.22 * 114 1.47 40066 Lake Cowichan 1.37 7 3.28 5 0.96 22 1.51 6 0.87 8 2.39 1 1.24 12 1.85 5067 Ladysmith 1.26 23 1.59 13 1.19 101 1.57 20 1.27 44 1.70 9 1.01 36 0.76 8068 Nanaimo 1.20 104 1.31 32 0.95 386 0.96 91 0.83 * 140 0.92 20 1.04 175 1.28 58069 Qualicum 0.99 56 0.97 19 0.88 232 0.52 * 32 0.84 88 0.55 7 0.91 102 0.55 * 17070 Alberni 0.80 20 0.28 * 6 0.89 100 0.99 30 0.68 * 31 0.80 9 1.00 47 0.94 14071 Courtenay 0.99 51 0.63 16 1.06 247 1.04 56 0.74 * 70 1.34 12 1.33 * 131 1.07 30072 Campbell River 1.31 34 1.17 14 0.84 97 1.11 28 0.64 * 30 1.21 6 0.92 44 0.69 12075 Mission 1.06 25 1.08 6 1.21 * 130 1.64 30 0.93 41 0.67 7 1.35 * 60 1.15 12076 Agassiz - Harrison 0.77 5 1.96 4 1.20 35 1.78 13 1.45 17 2.47 4 0.97 12 1.66 6077 Summerland 0.64 11 0.37 1 0.92 77 0.67 6 0.87 31 0.38 1 0.99 34 1.27 4078 Enderby 0.56 4 0.12 * 1 1.16 39 1.72 12 1.08 15 0.12 * 1 1.51 21 4.29 * 11080 Kitimat 1.24 6 0.37 * 2 0.93 18 1.47 8 0.87 6 2.91 2 0.91 8 0.61 3081 Fort Nelson 2.73 3 3.96 2 0.97 4 2.03 3 1.35 2 3.01 2 1.16 2 3.05 1083 Central Coast - - - - 1.23 3 4.14 3 1.20 1 0.54 1 - - - -084 Vancouver Island West 1.39 1 0.54 1 1.06 3 0.62 2 - - - - 0.81 1 0.52 1085 Vancouver Island North 0.39 2 0.52 1 1.50 * 30 1.41 12 0.80 6 0.59 1 1.98 * 17 2.13 7087 Stikine 5.17 * 3 1.34 2 - - - - - - - - - - - -088 Terrace 1.27 12 0.94 4 1.58 * 63 1.76 28 2.03 * 31 2.42 11 1.40 24 1.73 13092 Nisga’a - - - - 1.11 4 0.21 * 1 1.40 2 - * - 0.66 1 0.68 1094 Telegraph Creek - - - - - - - - - - - - - - - -161 Vancouver - City Centre 1.41 * 91 2.05 * 41 1.12 * 347 1.15 74 1.26 * 172 1.62 30 1.03 124 1.20 33162 Van. - Downtown E.side 1.98 * 85 4.27 * 53 1.33 * 263 4.16 * 130 1.11 93 4.69 * 44 1.55 * 125 4.07 * 60163 Vancouver - North East 0.77 * 56 0.74 15 0.79 * 268 0.54 * 49 0.84 117 0.53 * 19 0.74 * 103 0.45 * 18164 Vancouver - Westside 0.88 90 0.95 23 1.04 529 0.75 59 1.25 * 286 1.06 26 0.65 * 126 0.30 * 12165 Vancouver - Midtown 1.15 65 1.22 24 0.99 262 0.72 46 1.04 116 0.84 11 0.94 100 0.88 23166 Vancouver - South 0.92 99 1.21 26 0.79 * 408 0.91 76 0.92 205 1.27 33 0.62 * 129 0.59 * 30201 Surrey 1.01 152 0.85 45 1.09 * 719 0.97 195 1.21 * 315 1.01 59 1.03 288 0.91 83202 South Surrey/White Rock 0.74 * 73 0.24 * 11 0.97 460 0.54 * 53 1.04 210 0.46 * 15 0.82 * 156 0.56 * 24 PROVINCIAL TOTAL 1.00 3,247 1.00 1,026 1.00 15,155 1.00 3,244 1.00 6,359 1.00 871 1.00 6,185 1.00 1,638
09 10 11 12 Dis. of Arteries/Arterioles/Capillaries Diseases of the Respiratory System Infl uenza and Pneumonia Chronic Pulmonary Disease Local Health Area SMR (p) Death TR PYLLI (p) D<75 SMR (p) Death TR PYLLI (p) D<75 SMR (p) Death TR PYLLI (p) D<75 SMR (p) Death TR PYLLI (p) D<75
Please refer to footnotes on Table E

192 A P P E N D I X 3
13 14 15 16 Diseases of the Digestive System Motor Vehicle Accidents Unintentional Falls Suicide Local Health Area SMR (p) Death TR PYLLI (p) D<75 SMR (p) Death TR PYLLI (p) D<75 SMR (p) Death TR PYLLI (p) D<75 SMR (p) Death TR PYLLI (p) D<75
MO
RT
AL
ITY
ST
AT
IST
ICS
BY
LO
CA
L H
EA
LT
H A
RE
A,
BR
ITIS
H C
OL
UM
BIA
, 20
01-2
005
Tab
le B
Please refer to footnotes on Table E
001 Fernie 0.81 13 0.38 * 5 1.65 13 1.50 11 1.41 6 2.17 2 1.12 10 1.15 9 002 Cranbrook 1.08 36 1.01 19 1.16 15 0.95 13 1.07 10 1.81 5 0.98 14 1.06 13 003 Kimberley 0.88 14 0.30 * 3 1.31 6 2.12 5 1.48 7 0.67 1 0.77 4 0.97 4 004 Windermere 0.62 7 0.37 * 2 2.04 10 2.27 10 0.68 2 0.60 1 1.25 7 1.07 7 005 Creston 0.88 23 0.33 * 4 1.64 11 1.20 9 1.01 8 1.28 1 1.70 12 2.09 12 006 Kootenay Lake 1.28 8 1.88 4 4.44 * 8 4.04 7 2.19 4 - * - 1.95 4 1.14 4 007 Nelson 0.59 * 21 0.48 * 8 1.42 18 1.13 16 1.91 * 20 0.52 1 0.57 8 0.54 * 8 009 Castlegar 1.44 29 1.31 12 1.30 9 1.66 9 2.00 * 12 3.51 4 0.52 4 0.55 3 010 Arrow Lakes 0.88 8 0.39 2 2.65 * 7 4.60 * 7 0.74 2 - - 0.68 2 0.85 2 011 Trail 1.19 43 1.01 13 1.24 13 1.56 11 1.36 15 1.32 4 1.47 17 1.81 16 012 Grand Forks 1.53 26 1.54 11 1.23 6 1.18 5 1.40 7 0.13 * 1 1.12 6 0.79 5 013 Kettle Valley 1.04 6 0.91 2 3.18 * 6 3.10 6 0.64 1 - - 1.87 4 1.55 4 014 Southern Okanagan 1.15 54 2.25 * 33 1.56 16 1.59 11 1.14 16 2.72 6 1.28 14 1.54 11 015 Penticton 1.28 * 118 1.35 33 1.21 26 1.46 22 0.94 28 2.55 5 1.57 * 36 1.75 * 35 016 Keremeos 0.81 9 1.87 5 6.56 * 17 9.15 * 16 0.62 2 - - 2.38 7 2.97 7 017 Princeton 1.32 12 0.51 3 3.67 * 9 5.94 * 9 0.80 2 - - 0.70 2 1.35 2 018 Golden 0.27 * 2 0.25 * 1 1.87 7 1.82 7 0.99 2 0.15 * 1 1.16 5 1.54 5 019 Revelstoke 1.28 13 0.38 * 4 1.43 6 1.44 6 0.72 2 0.42 1 0.63 3 0.78 3 020 Salmon Arm 1.13 65 0.91 24 1.84 * 31 1.91 * 27 0.85 14 0.57 3 1.14 21 1.13 19 021 Armstrong - Spallumcheen 0.85 13 0.88 5 2.34 * 12 2.67 * 11 0.89 4 - - 1.63 9 1.66 9 022 Vernon 0.95 97 1.14 40 1.38 * 43 1.38 37 0.82 25 1.15 6 1.22 41 1.20 39 023 Central Okanagan 0.88 239 1.03 96 0.96 78 0.85 63 1.08 88 1.19 22 1.00 89 1.09 79 024 Kamloops 1.24 * 164 1.49 * 87 1.58 * 82 1.49 * 74 1.59 * 57 1.07 19 1.44 * 83 1.47 * 75 025 100 Mile House 1.66 * 33 1.56 18 2.86 * 21 3.47 * 21 1.19 6 1.12 2 1.80 * 15 1.88 15 026 North Thompson 1.13 6 0.78 3 3.94 * 10 3.80 * 10 0.72 1 - - 0.35 1 0.15 * 1 027 Cariboo - Chilcotin 1.50 * 41 1.85 26 1.71 * 24 1.67 24 1.15 8 0.66 2 0.90 14 0.67 13 028 Quesnel 0.65 18 0.58 10 2.55 * 32 2.06 * 28 1.63 12 0.37 * 4 0.72 10 0.47 * 9 029 Lillooet 2.39 * 13 2.11 5 3.03 * 7 2.36 6 1.33 2 3.07 2 1.19 3 0.87 2 030 South Cariboo 3.47 * 38 4.53 * 26 5.07 * 20 3.15 * 17 0.69 2 3.21 1 1.37 6 1.06 6 031 Merritt 1.51 21 3.10 * 15 2.67 * 15 2.47 12 1.53 6 2.14 2 1.47 9 1.39 9 032 Hope 1.07 15 1.91 9 1.81 8 2.39 8 2.02 8 2.37 3 2.04 10 1.58 9 033 Chilliwack 1.04 115 1.00 42 1.05 39 1.18 34 0.80 26 1.47 10 1.16 46 1.20 43 034 Abbotsford 0.82 * 138 0.78 53 1.19 73 1.26 67 0.60 * 31 0.77 6 0.90 59 0.99 57 035 Langley 0.88 130 0.82 59 0.67 * 39 0.67 * 32 1.00 41 0.50 * 9 0.69 * 45 0.72 * 43 037 Delta 0.93 108 0.70 * 46 0.74 37 0.62 * 32 0.78 24 0.91 5 0.60 * 34 0.55 * 31 038 Richmond 0.69 * 156 0.42 * 59 0.51 * 44 0.58 * 41 0.58 * 38 0.37 * 7 0.53 * 52 0.42 * 43 040 New Westminster 1.01 88 1.20 46 0.60 * 17 0.69 16 0.81 22 1.29 9 1.47 * 50 1.27 48 041 Burnaby 0.94 265 0.77 * 95 0.52 * 53 0.53 * 48 0.86 73 0.73 16 0.79 * 91 0.77 * 81 042 Maple Ridge 1.10 100 1.04 50 1.05 43 1.13 41 0.83 21 0.46 * 4 1.14 53 1.10 51 043 Coquitlam 0.86 * 172 0.81 84 0.61 * 60 0.64 * 57 0.79 43 0.32 * 9 0.70 * 79 0.66 * 72 044 North Vancouver 0.81 * 142 0.51 * 48 0.44 * 29 0.43 * 22 0.82 41 0.88 8 0.67 * 51 0.62 * 45 045 West Van.-Bowen Is. 0.90 98 0.41 * 19 0.52 * 14 0.60 * 12 0.76 26 0.63 4 0.85 25 0.61 * 19 046 Sunshine Coast 0.97 46 1.09 24 0.65 9 0.87 9 0.51 7 1.66 3 1.23 19 1.28 18 047 Powell River 0.98 33 0.71 14 1.46 15 1.51 13 1.13 11 1.54 2 0.77 9 0.39 * 6 048 Howe Sound 1.13 25 1.05 15 2.22 * 34 2.18 * 33 1.59 9 2.36 6 0.85 15 0.79 13 049 Bella Coola Valley 1.32 4 3.43 2 5.09 * 8 5.96 * 8 - - - - 1.69 3 2.36 3 050 Queen Charlotte 0.84 4 0.81 4 0.81 2 0.74 2 2.39 3 2.64 2 2.00 6 2.13 6 051 Snow Country 1.76 1 1.52 1 15.82 * 6 20.52 * 6 - - - - - - - - 052 Prince Rupert 1.68 * 24 1.77 14 1.01 8 1.13 8 0.52 2 0.07 * 1 1.58 14 1.70 14 053 Upper Skeena 0.89 4 1.34 2 1.11 3 1.10 3 1.69 2 0.43 2 1.69 5 2.45 5 054 Smithers 1.23 18 0.56 10 2.72 * 23 3.35 * 23 0.26 1 - - 1.47 14 1.11 13 055 Burns Lake 1.44 12 2.13 10 3.17 * 12 2.92 * 11 1.77 4 1.56 2 1.45 6 1.67 6 056 Nechako 1.24 19 1.75 12 2.78 * 23 2.56 * 21 1.47 6 0.56 2 0.88 8 1.08 7 057 Prince George 1.35 * 112 1.46 * 80 1.99 * 97 1.69 * 93 1.12 23 0.98 8 1.11 61 1.25 61 059 Peace River South 0.85 22 0.47 * 9 3.16 * 41 3.11 * 39 1.86 13 0.18 * 2 0.41 * 6 0.56 6 060 Peace River North 0.90 21 1.36 16 2.31 * 35 2.09 * 34 1.50 9 1.17 5 0.90 15 1.15 15 061 Greater Victoria 1.03 427 0.99 132 0.46 * 51 0.48 * 38 1.21 * 165 1.02 20 1.14 138 1.12 121 062 Sooke 0.92 56 0.75 27 0.85 23 0.70 18 1.29 21 0.53 3 0.83 26 0.77 25 063 Saanich 0.58 * 79 0.34 * 13 0.73 24 0.76 18 0.93 39 0.95 7 0.72 26 0.62 * 20 064 Gulf Islands 1.00 32 0.99 14 0.79 6 1.15 5 1.38 13 0.51 2 1.42 12 1.98 12 065 Cowichan 1.27 * 104 1.60 * 60 1.11 30 1.26 26 1.06 25 1.98 9 1.19 35 1.43 33 066 Lake Cowichan 1.70 15 1.74 10 0.95 3 0.84 2 - - - - 1.98 7 2.18 6 067 Ladysmith 1.22 37 1.37 15 1.29 11 1.50 11 1.25 11 1.87 3 1.27 12 1.59 10 068 Nanaimo 1.06 157 1.23 69 0.90 44 0.91 37 1.24 54 0.58 7 1.29 * 69 1.34 60 069 Qualicum 0.82 74 0.78 22 0.89 19 0.82 13 1.11 29 0.10 * 1 0.95 22 1.12 21 070 Alberni 0.92 40 1.34 25 1.31 21 1.36 18 1.32 16 1.82 5 1.78 * 32 1.88 * 30 071 Courtenay 1.14 101 0.91 39 0.94 28 1.14 25 1.37 34 1.69 14 1.09 36 1.19 35 072 Campbell River 1.38 * 65 1.69 * 38 1.06 21 0.97 18 1.33 17 2.29 8 1.34 30 1.34 28 075 Mission 1.22 52 1.13 25 1.51 * 28 1.39 24 0.58 7 0.03 * 1 1.11 23 1.20 22 076 Agassiz - Harrison 1.50 17 2.43 11 1.84 8 2.74 8 0.95 3 2.45 2 1.22 6 1.32 6 077 Summerland 0.90 25 0.27 * 4 1.42 9 1.78 6 1.94 * 17 6.59 6 1.19 8 1.56 7 078 Enderby 1.82 * 22 1.11 7 2.38 * 9 2.65 8 1.69 6 - - 0.97 4 0.93 3 080 Kitimat 1.38 13 1.41 7 1.42 8 1.82 8 1.38 3 1.11 3 0.48 3 0.31 * 2 081 Fort Nelson 0.73 2 0.74 2 3.01 * 9 2.76 9 1.58 1 - - 0.90 3 0.96 3 083 Central Coast 4.78 * 6 2.21 5 1.25 1 1.77 1 3.63 1 - - 2.19 2 1.93 2 084 Vancouver Island West 0.66 1 0.38 1 0.91 1 1.12 1 - - - - 2.31 3 2.87 3 085 Vancouver Island North 1.53 16 1.20 13 0.91 6 0.85 6 1.64 4 1.08 3 1.18 9 1.21 9 087 Stikine - - - - 1.71 1 2.86 1 - - - * - 2.89 2 2.23 2 088 Terrace 1.49 27 1.91 19 1.61 17 1.32 16 1.53 7 1.79 2 1.11 13 1.08 13 092 Nisga’a 2.67 4 3.25 2 3.27 3 0.28 * 2 4.83 2 10.22 2 4.22 * 4 6.74 4 094 Telegraph Creek - - - - 3.47 1 5.18 1 14.18 * 2 68.29 2 9.59 * 3 10.66 3 161 Vancouver - City Centre 1.29 * 152 1.34 70 0.30 * 16 0.21 * 14 0.93 34 1.58 11 1.27 * 81 1.09 73 162 Van. - Downtown E.side 1.96 * 146 3.78 * 102 0.68 18 0.38 * 15 1.33 29 3.62 * 18 2.23 * 74 2.28 * 71 163 Vancouver - North East 0.92 117 0.95 54 0.48 * 23 0.40 * 20 0.96 35 0.43 * 4 0.98 54 0.92 48 164 Vancouver - Westside 0.88 158 0.51 * 38 0.34 * 22 0.27 * 16 0.77 45 1.14 12 0.69 * 48 0.59 * 43 165 Vancouver - Midtown 1.07 109 0.96 47 0.39 * 16 0.34 * 12 0.74 22 0.90 6 1.05 52 1.03 48 166 Vancouver - South 0.70 * 131 0.68 * 50 0.72 * 46 0.63 * 35 0.79 45 0.99 9 0.59 * 42 0.58 * 39 201 Surrey 0.95 276 1.03 151 1.10 166 1.08 152 0.85 64 0.82 24 0.98 166 1.02 162 202 South Surrey/White Rock 1.00 166 0.84 43 0.85 34 0.74 23 1.14 58 0.87 4 0.91 40 0.99 33 PROVINCIAL TOTAL 1.00 5,689 1.00 2,457 1.00 2,073 1.00 1,830 1.00 1,664 1.00 409 1.00 2,324 1.00 2,141

A P P E N D I X 3 193
001 Fernie 1.22 41 0.96 32 0.66 2 0.82 2 0.52 4 0.52 4 002 Cranbrook 1.38 * 82 0.83 58 1.48 7 1.54 7 0.67 8 0.77 8 003 Kimberley 1.36 34 0.86 18 1.14 2 1.16 2 0.47 2 0.61 2 004 Windermere 1.05 24 1.09 19 1.07 2 0.93 2 0.63 3 0.39 * 3 005 Creston 1.28 49 1.90 * 36 1.37 3 1.27 3 0.38 2 0.51 2 006 Kootenay Lake 1.79 * 18 2.37 * 14 - - - - 2.43 4 1.80 4 007 Nelson 1.38 * 83 0.98 48 0.21 1 0.15 * 1 0.93 11 1.03 11 009 Castlegar 1.22 41 1.26 31 1.17 3 1.04 3 0.78 5 0.97 5 010 Arrow Lakes 1.74 * 25 1.73 18 1.01 1 1.36 1 1.28 3 1.22 3 011 Trail 1.74 * 94 1.90 * 59 1.06 4 1.31 4 0.74 7 0.54 6 012 Grand Forks 1.14 31 1.57 27 0.58 1 1.02 1 - - - - 013 Kettle Valley 1.23 13 1.19 12 - - - - - - - - 014 Southern Okanagan 1.56 * 105 1.96 * 74 1.49 5 1.38 5 0.63 5 0.87 5 015 Penticton 1.24 * 152 1.66 * 117 0.88 6 1.03 6 1.28 23 1.27 22 016 Keremeos 1.09 19 2.48 * 16 1.08 1 1.50 1 1.37 3 1.84 3 017 Princeton 1.08 17 2.01 16 1.01 1 0.54 1 1.36 3 1.89 3 018 Golden 1.15 18 1.14 16 2.13 3 2.80 3 - - - - 019 Revelstoke 1.05 20 1.40 17 0.64 1 0.30 * 1 0.74 3 0.97 3 020 Salmon Arm 1.22 * 113 1.29 83 1.50 9 1.61 9 1.31 19 1.49 19 021 Armstrong - Spallumcheen 0.96 24 1.07 19 0.55 1 0.59 1 0.44 2 0.29 * 2 022 Vernon 1.16 * 184 1.37 * 145 1.11 12 1.09 12 1.94 * 53 1.90 * 52 023 Central Okanagan 1.03 427 1.10 305 0.93 26 0.95 26 1.27 * 94 1.32 * 88 024 Kamloops 1.27 * 309 1.42 * 252 1.25 24 1.32 24 1.14 56 1.25 55 025 100 Mile House 1.25 49 1.95 * 47 1.76 5 2.05 5 1.20 8 1.07 8 026 North Thompson 0.99 11 1.62 9 1.05 1 1.11 1 0.82 2 1.05 2 027 Cariboo - Chilcotin 1.98 * 115 2.03 * 96 1.35 7 1.14 7 0.74 10 0.84 10 028 Quesnel 1.25 69 1.04 59 0.43 2 0.53 2 1.26 15 1.17 15 029 Lillooet 2.74 * 28 2.51 * 21 3.74 3 4.55 3 1.40 3 1.68 3 030 South Cariboo 2.87 * 59 3.69 * 50 2.08 3 2.45 3 - - - - 031 Merritt 1.76 * 45 2.04 * 37 2.02 4 2.01 4 1.55 8 1.37 8 032 Hope 1.51 * 36 2.07 * 31 1.88 3 1.84 3 1.28 5 1.29 5 033 Chilliwack 0.93 164 1.12 127 0.81 10 0.84 10 1.05 35 1.03 31 034 Abbotsford 0.66 * 176 0.67 * 141 0.84 17 0.77 17 0.86 48 0.89 48 035 Langley 0.68 * 178 0.56 * 133 1.02 22 0.95 22 0.69 * 39 0.66 * 38 037 Delta 0.63 * 140 0.59 * 106 1.13 22 1.15 22 0.73 35 0.72 * 34 038 Richmond 0.44 * 172 0.33 * 125 0.60 * 20 0.52 * 20 0.32 * 27 0.27 * 23 040 New Westminster 1.25 * 167 1.04 126 1.19 13 1.35 13 1.93 * 59 1.90 * 57 041 Burnaby 0.74 * 342 0.56 * 216 0.84 31 0.75 31 0.56 * 57 0.59 * 56 042 Maple Ridge 1.01 172 0.90 136 1.12 17 1.16 17 0.92 38 0.87 37 043 Coquitlam 0.67 * 269 0.64 * 222 0.55 * 21 0.56 * 21 0.66 * 67 0.67 * 66 044 North Vancouver 0.64 * 197 0.59 * 148 0.65 17 0.67 17 0.52 * 35 0.53 * 32 045 West Vancouver-Bowen Is. 0.61 * 93 0.51 * 52 0.69 7 0.81 7 0.35 * 8 0.31 * 7 046 Sunshine Coast 0.92 70 0.75 48 1.18 6 1.11 6 0.97 12 1.03 12 047 Powell River 1.63 * 90 1.89 * 72 1.79 7 1.83 7 1.27 12 0.79 9 048 Howe Sound 1.07 58 0.88 47 1.08 6 1.14 6 0.43 * 7 0.41 * 6 049 Bella Coola Valley 3.68 * 24 4.14 * 22 3.54 2 3.91 2 0.65 1 0.68 1 050 Queen Charlotte 2.03 * 21 1.79 19 1.00 1 1.02 1 1.85 5 2.00 5 051 Snow Country 1.20 2 2.86 2 - - - - - - - - 052 Prince Rupert 2.14 * 65 2.33 * 57 1.08 3 0.74 3 1.39 11 1.21 11 053 Upper Skeena 2.58 * 26 2.20 18 - - - - 1.15 3 1.58 3 054 Smithers 0.90 29 0.85 22 0.98 3 0.80 3 0.35 3 0.41 * 3 055 Burns Lake 1.68 * 28 1.32 22 1.48 2 2.13 2 - - - - 056 Nechako 1.80 * 59 1.45 51 1.74 5 1.81 5 0.51 4 0.39 * 4 057 Prince George 1.27 * 240 1.26 * 208 1.44 26 1.30 26 0.85 41 0.83 41 059 Peace River South 1.59 * 84 1.65 * 70 1.75 8 1.74 8 0.63 8 0.67 8 060 Peace River North 1.40 * 76 1.51 * 70 1.51 8 1.93 8 0.40 * 6 0.34 * 5 061 Greater Victoria 1.16 * 626 1.12 421 0.90 34 0.97 34 1.65 * 169 1.64 * 159 062 Sooke 1.15 137 1.03 111 1.02 11 1.03 11 0.84 23 0.83 23 063 Saanich 0.60 * 115 0.42 * 62 0.67 8 0.73 8 0.88 25 0.82 21 064 Gulf Islands 0.96 46 1.25 35 0.34 1 0.19 * 1 0.94 6 1.26 6 065 Cowichan 1.09 148 1.18 104 0.62 6 0.73 6 0.83 20 0.85 20 066 Lake Cowichan 1.50 24 1.57 21 1.74 2 2.04 2 1.73 5 1.28 4 067 Ladysmith 1.43 * 68 1.22 43 0.65 2 0.66 2 0.80 6 0.76 5 068 Nanaimo 1.12 269 1.22 * 211 0.93 16 0.93 16 1.32 * 59 1.32 56 069 Qualicum 0.75 * 102 0.88 70 0.14 * 1 0.10 * 1 0.57 10 0.65 10 070 Alberni 1.92 * 150 1.84 * 113 1.01 6 0.89 6 1.21 18 1.21 17 071 Courtenay 1.32 * 199 1.02 128 0.73 8 0.88 8 0.88 24 0.96 24 072 Campbell River 1.57 * 142 1.54 * 113 1.05 8 1.02 8 1.36 26 1.45 26 075 Mission 0.91 73 0.99 63 0.59 4 0.41 * 4 1.17 21 1.08 21 076 Agassiz - Harrison 1.00 21 1.56 18 0.67 1 0.57 1 1.46 6 1.37 6 077 Summerland 0.70 26 0.69 20 0.49 1 0.35 1 0.20 1 0.24 * 1 078 Enderby 1.23 24 1.54 19 1.51 2 1.49 2 0.60 2 0.36 * 2 080 Kitimat 1.19 27 1.01 22 0.48 1 0.49 1 0.73 4 0.58 4 081 Fort Nelson 1.49 13 1.50 13 0.99 1 1.07 1 0.32 1 0.30 * 1 083 Central Coast 6.22 * 20 6.71 * 17 3.49 1 2.85 1 1.25 1 1.46 1 084 Vancouver Island West 1.97 8 1.79 7 - - - * - - - - - 085 Vancouver Island North 2.02 * 53 2.21 * 51 2.34 6 2.49 6 0.89 6 0.86 6 087 Stikine 1.48 4 2.00 4 3.94 1 3.62 1 - - - - 088 Terrace 1.54 * 63 1.65 * 54 1.89 7 1.93 7 0.68 7 0.71 7 092 Nisga’a 4.99 * 16 7.80 * 15 - - - - - - - - 094 Telegraph Creek 9.32 * 10 14.08 * 10 - - - - - - - - 161 Vancouver - City Centre 1.20 * 249 1.04 209 1.64 * 30 1.47 30 1.59 * 97 1.28 * 93 162 Van. - Downtown E.side 3.22 * 422 3.67 * 380 4.57 * 45 4.52 * 45 6.40 * 190 6.45 * 189 163 Vancouver - North East 0.71 * 156 0.70 * 124 1.11 19 0.97 19 0.89 43 0.87 42 164 Vancouver - Westside 0.49 * 130 0.41 * 90 0.42 * 9 0.42 * 9 0.50 * 31 0.52 * 29 165 Vancouver - Midtown 0.86 157 0.84 122 0.37 * 6 0.36 * 6 1.09 50 1.08 49 166 Vancouver - South 0.55 * 161 0.66 * 123 0.89 20 0.95 20 0.62 * 38 0.63 * 38 201 Surrey 0.86 * 513 0.89 * 432 1.17 65 1.09 65 1.06 162 1.11 160 202 South Surrey/White Rock 0.56 * 127 0.56 * 76 0.88 13 0.83 13 0.63 * 22 0.60 * 17 PROVINCIAL TOTAL 1.00 9,583 1.00 7,350 1.00 753 1.00 753 1.00 1,999 1.00 1,929
17 18 19 Alcohol-Related Deaths Medically Treatable Disease Drug-Induced Deaths Local Health Area SMR (p) Death TR PYLLI (p) D<75 SMR (p) Death TR PYLLI (p) D<75 SMR (p) Death TR PYLLI (p) D<75
Please refer to footnotes on Table E
MO
RT
AL
ITY
ST
AT
IST
ICS
BY
LO
CA
L H
EA
LT
H A
RE
A, B
RIT
ISH
CO
LU
MB
IA, 2001-2005
Tab
le B
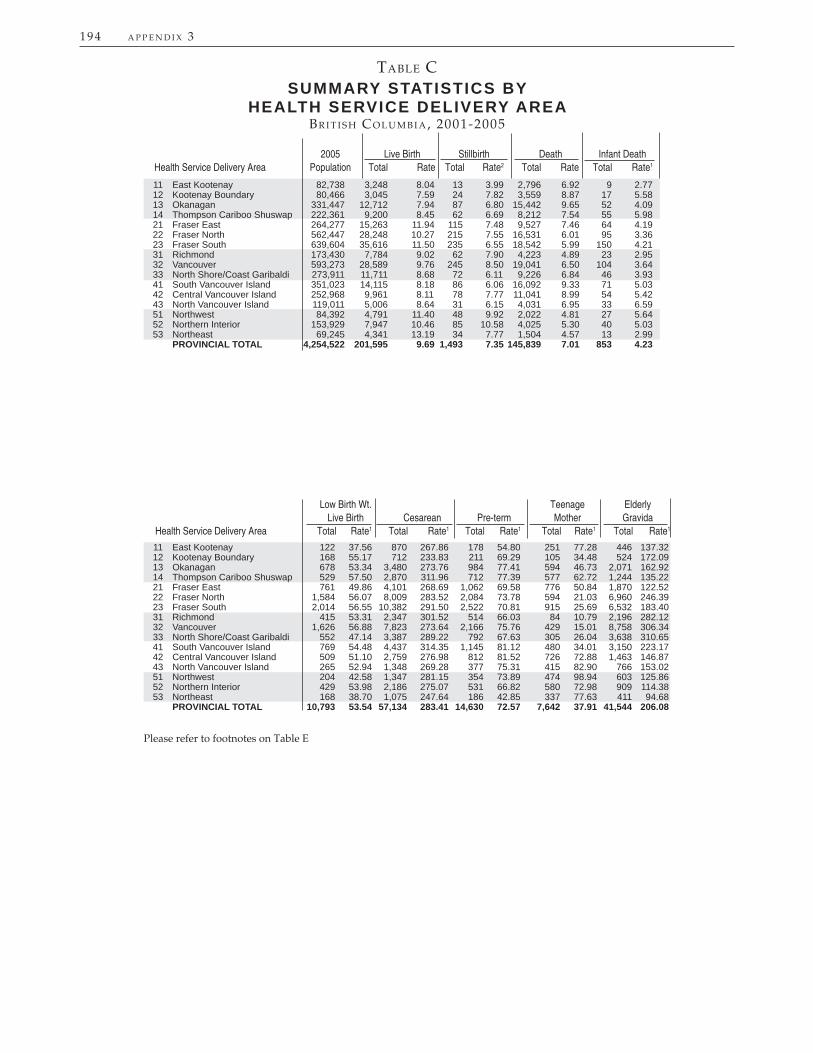
194 A P P E N D I X 3
11 East Kootenay 82,738 3,248 8.04 13 3.99 2,796 6.92 9 2.77 12 Kootenay Boundary 80,466 3,045 7.59 24 7.82 3,559 8.87 17 5.58 13 Okanagan 331,447 12,712 7.94 87 6.80 15,442 9.65 52 4.09 14 Thompson Cariboo Shuswap 222,361 9,200 8.45 62 6.69 8,212 7.54 55 5.98 21 Fraser East 264,277 15,263 11.94 115 7.48 9,527 7.46 64 4.19 22 Fraser North 562,447 28,248 10.27 215 7.55 16,531 6.01 95 3.36 23 Fraser South 639,604 35,616 11.50 235 6.55 18,542 5.99 150 4.21 31 Richmond 173,430 7,784 9.02 62 7.90 4,223 4.89 23 2.95 32 Vancouver 593,273 28,589 9.76 245 8.50 19,041 6.50 104 3.64 33 North Shore/Coast Garibaldi 273,911 11,711 8.68 72 6.11 9,226 6.84 46 3.93 41 South Vancouver Island 351,023 14,115 8.18 86 6.06 16,092 9.33 71 5.03 42 Central Vancouver Island 252,968 9,961 8.11 78 7.77 11,041 8.99 54 5.42 43 North Vancouver Island 119,011 5,006 8.64 31 6.15 4,031 6.95 33 6.59 51 Northwest 84,392 4,791 11.40 48 9.92 2,022 4.81 27 5.64 52 Northern Interior 153,929 7,947 10.46 85 10.58 4,025 5.30 40 5.03 53 Northeast 69,245 4,341 13.19 34 7.77 1,504 4.57 13 2.99 PROVINCIAL TOTAL 4,254,522 201,595 9.69 1,493 7.35 145,839 7.01 853 4.23
TABLE CSUMMARY STATISTICS BY
HEALTH SERVICE DELIVERY AREABR I T I S H CO L U M B I A, 2001-2005
2005 Live Birth Stillbirth Death Infant Death Health Service Delivery Area Population Total Rate Total Rate2 Total Rate Total Rate1
11 East Kootenay 122 37.56 870 267.86 178 54.80 251 77.28 446 137.32 12 Kootenay Boundary 168 55.17 712 233.83 211 69.29 105 34.48 524 172.09 13 Okanagan 678 53.34 3,480 273.76 984 77.41 594 46.73 2,071 162.92 14 Thompson Cariboo Shuswap 529 57.50 2,870 311.96 712 77.39 577 62.72 1,244 135.22 21 Fraser East 761 49.86 4,101 268.69 1,062 69.58 776 50.84 1,870 122.52 22 Fraser North 1,584 56.07 8,009 283.52 2,084 73.78 594 21.03 6,960 246.39 23 Fraser South 2,014 56.55 10,382 291.50 2,522 70.81 915 25.69 6,532 183.40 31 Richmond 415 53.31 2,347 301.52 514 66.03 84 10.79 2,196 282.12 32 Vancouver 1,626 56.88 7,823 273.64 2,166 75.76 429 15.01 8,758 306.34 33 North Shore/Coast Garibaldi 552 47.14 3,387 289.22 792 67.63 305 26.04 3,638 310.65 41 South Vancouver Island 769 54.48 4,437 314.35 1,145 81.12 480 34.01 3,150 223.17 42 Central Vancouver Island 509 51.10 2,759 276.98 812 81.52 726 72.88 1,463 146.87 43 North Vancouver Island 265 52.94 1,348 269.28 377 75.31 415 82.90 766 153.02 51 Northwest 204 42.58 1,347 281.15 354 73.89 474 98.94 603 125.86 52 Northern Interior 429 53.98 2,186 275.07 531 66.82 580 72.98 909 114.38 53 Northeast 168 38.70 1,075 247.64 186 42.85 337 77.63 411 94.68 PROVINCIAL TOTAL 10,793 53.54 57,134 283.41 14,630 72.57 7,642 37.91 41,544 206.08
Please refer to footnotes on Table E
Low Birth Wt. Teenage Elderly Live Birth Cesarean Pre-term Mother Gravida Health Service Delivery Area Total Rate1 Total Rate1 Total Rate1 Total Rate1 Total Rate1

A P P E N D I X 3 195
05 06 07 08 Diabetes Mellitus Diseases of the Circulatory System Ischemic Heart Diseases Cerebrovascular Diseases Health Service Delivery Area SMR (p) Death TR PYLLI (p) D<75 SMR (p) Death TR PYLLI (p) D<75 SMR (p) Death TR PYLLI (p) D<75 SMR (p) Death TR PYLLI (p) D<75
TABLE DMORTALITY STATISTICS BY HEALTH SERVICE DELIVERY AREA
BR I T I S H CO L U M B I A, 2001-2005
01 02 03 04 All Causes of Death Malignant Neoplasms Malignant Neoplasms of Lung End/Nut/Met. Diseases Health Service Delivery Area SMR (p) Death TR PYLLI (p) D<75 SMR (p) Death TR PYLLI (p) D<75 SMR (p) Death TR PYLLI (p) D<75 SMR (p) Death TR PYLLI (p) D<75 11 East Kootenay 1.00 2,796 0.96 1,155 1.01 816 1.01 465 1.07 226 1.02 140 1.06 121 0.87 51 12 Kootenay Boundary 1.07 * 3,559 1.10 * 1,359 1.03 952 1.00 496 0.95 228 1.12 149 1.20 * 162 1.18 66 13 Okanagan 1.01 15,442 1.11 * 5,268 1.04 * 4,371 1.09 * 2,123 1.12 * 1,229 1.22 * 668 0.93 587 1.08 194 14 Thompson Cariboo Shuswap 1.14 * 8,212 1.29 * 3,893 1.09 * 2,321 1.15 * 1,374 1.16 * 655 1.21 * 408 1.17 * 343 1.09 142 21 Fraser East 1.06 * 9,527 1.15 * 3,784 1.07 * 2,645 1.11 * 1,442 1.06 678 1.24 * 428 1.20 * 436 1.49 * 185 22 Fraser North 0.99 16,531 0.86 * 6,377 0.99 4,628 0.97 2,553 1.04 1,238 1.00 747 1.01 674 0.90 256 23 Fraser South 1.02 * 18,542 0.92 * 7,324 0.99 5,198 0.94 * 2,823 0.92 * 1,252 0.90 * 730 1.00 738 1.00 315 31 Richmond 0.73 * 4,223 0.60 * 1,532 0.81 * 1,311 0.81 * 696 0.87 * 360 0.76 * 189 0.81 * 186 0.66 * 70 32 Vancouver 0.94 * 19,041 1.00 7,346 0.88 * 4,783 0.89 * 2,430 0.88 * 1,205 0.79 * 629 0.94 756 0.91 267 33 North Shore/Coast Garibaldi 0.92 * 9,226 0.79 * 3,158 0.91 * 2,548 0.84 * 1,290 0.76 * 552 0.68 * 320 0.86 * 348 0.72 * 116 41 South Vancouver Island 0.97 * 16,092 0.98 4,742 1.03 4,469 1.06 * 2,011 0.94 * 1,024 0.97 498 0.83 * 558 1.04 185 42 Central Vancouver Island 1.06 * 11,041 1.16 * 4,266 1.07 * 3,182 1.13 * 1,695 1.10 * 862 1.21 * 494 1.05 451 0.99 165 43 North Vancouver Island 1.08 * 4,031 1.17 * 1,811 1.15 * 1,257 1.20 * 714 1.24 * 358 1.36 * 225 0.95 144 0.67 * 53 51 Northwest 1.16 * 2,022 1.24 * 1,160 1.02 534 0.92 346 1.08 148 1.02 102 1.47 * 101 1.62 * 54 52 Northern Interior 1.20 * 4,025 1.22 * 2,276 1.19 * 1,212 1.14 * 783 1.29 * 346 1.07 227 1.52 * 202 1.33 105 53 Northeast 1.15 * 1,504 1.12 * 819 1.07 414 1.05 283 1.28 * 129 1.26 91 1.46 * 75 1.03 36 PROVINCIAL TOTAL 1.00 145,839 1.00 56,291 1.00 40,642 1.00 21,524 1.00 10,490 1.00 6,045 1.00 5,882 1.00 2,260
09 10 11 12 Dis. of Arteries,Arterioles,Capillaries Diseases of the Respiratory System Infl uenza and Pneumonia Chronic Pulmonary Disease Health Service Delivery Area SMR (p) Death TR PYLLI (p) D<75 SMR (p) Death TR PYLLI (p) D<75 SMR (p) Death TR PYLLI (p) D<75 SMR (p) Death TR PYLLI (p) D<75
Please refer to footnotes on Table E
11 East Kootenay 0.97 81 0.68 * 34 0.99 924 0.93 262 0.94 429 0.94 146 0.93 195 0.84 39 11 East Kootenay 0.95 86 0.81 36 1.00 932 0.91 255 0.91 * 406 0.93 134 0.95 199 0.92 41 12 Kootenay Boundary 1.29 * 138 1.33 53 1.13 * 1,286 1.13 350 1.16 * 632 1.04 176 0.95 249 1.05 61 13 Okanagan 0.92 459 0.86 147 0.98 5,234 1.08 1,187 0.89 * 2,282 1.02 594 0.97 1,199 1.22 * 238 14 Thompson Cariboo Shuswap 1.20 * 280 1.06 110 1.11 * 2,576 1.23 * 840 1.05 1,182 1.29 * 446 1.03 536 1.11 150 21 Fraser East 1.28 * 367 1.73 * 157 1.08 * 3,298 1.27 * 834 1.19 * 1,724 1.32 * 466 1.00 697 1.27 147 22 Fraser North 1.02 531 1.01 207 1.04 * 5,714 0.88 * 1,355 1.16 * 3,018 0.97 792 0.96 1,211 0.81 * 221 23 Fraser South 1.01 585 1.06 257 1.09 * 6,403 0.98 1,614 1.21 * 3,378 1.07 939 1.04 1,389 0.88 271 31 Richmond 0.83 * 151 0.70 * 55 0.74 * 1,410 0.61 * 326 0.74 * 673 0.54 * 153 0.78 * 342 0.84 69 32 Vancouver 0.89 * 563 0.85 203 0.90 * 6,165 0.99 1,539 0.85 * 2,750 0.77 * 678 0.98 1,569 1.12 310 33 North Shore/Coast Garibaldi 0.87 * 276 0.74 * 89 0.97 * 3,255 0.74 * 686 0.91 * 1,458 0.72 * 344 1.11 * 856 0.66 * 128 41 South Vancouver Island 0.80 * 426 0.98 136 0.94 * 5,575 0.89 * 951 0.87 * 2,431 0.90 * 504 1.04 1,461 0.96 183 42 Central Vancouver Island 1.06 362 0.95 126 1.07 * 3,802 1.18 * 985 1.09 * 1,867 1.27 * 544 1.01 821 1.12 159 43 North Vancouver Island 0.96 116 0.66 * 44 0.98 1,193 1.06 373 0.93 548 1.17 202 1.08 292 1.21 76 51 Northwest 1.46 * 79 1.29 36 1.11 * 571 1.18 240 0.97 245 1.05 120 0.96 106 1.40 43 52 Northern Interior 1.52 * 159 1.26 82 1.07 * 1,066 1.17 * 439 0.93 453 1.06 216 1.05 226 1.11 70 53 Northeast 1.62 * 65 1.38 31 1.20 * 463 1.43 * 199 1.30 * 245 1.82 * 125 0.95 80 0.67 18 PROVINCIAL TOTAL 1.00 4,643 1.00 1,769 1.00 48,947 1.00 12,177 1.00 23,295 1.00 6,436 1.00 11,234 1.00 2,186
11 East Kootenay 0.88 53 0.94 19 0.90 251 1.16 70 0.84 97 0.85 14 1.04 121 1.61 * 45 11 East Kootenay 0.97 61 1.03 24 0.95 272 1.13 74 0.91 106 0.82 16 1.03 123 1.26 40 12 Kootenay Boundary 1.66 * 126 2.52 * 48 0.88 * 313 0.96 64 0.79 * 117 1.30 18 1.07 154 1.00 36 13 Okanagan 0.99 353 1.14 100 0.98 1,650 0.88 281 0.94 663 0.66 * 58 1.05 730 1.05 162 14 Thompson Cariboo Shuswap 1.25 * 201 1.31 80 1.11 * 792 1.49 * 266 0.88 * 250 1.41 58 1.35 * 409 1.46 * 148 21 Fraser East 0.86 * 174 0.66 * 42 1.08 * 1,030 1.32 * 235 1.07 425 1.05 55 1.10 429 1.49 * 124 22 Fraser North 0.76 * 275 0.55 * 70 1.07 * 1,810 0.91 396 1.15 * 818 0.85 112 1.01 686 0.91 191 23 Fraser South 0.91 359 0.68 * 93 1.07 * 1,902 0.85 * 393 1.18 * 851 0.91 118 0.98 723 0.80 * 181 31 Richmond 0.85 108 0.80 40 0.77 * 451 0.36 * 65 0.79 * 194 0.28 * 17 0.69 * 164 0.25 * 26 32 Vancouver 1.09 486 1.52 * 182 0.97 2,077 1.14 434 1.08 * 987 1.43 * 163 0.83 * 707 0.99 176 33 North Shore/Coast Garibaldi 1.03 230 0.78 62 0.95 992 0.84 181 1.15 * 500 1.05 58 0.81 * 342 0.68 * 89 41 South Vancouver Island 0.90 343 0.68 * 65 0.89 * 1,660 0.97 261 0.79 * 645 0.76 56 0.92 * 676 1.07 141 42 Central Vancouver Island 1.05 251 1.07 89 0.98 1,093 1.02 251 0.88 * 397 0.93 61 1.04 486 1.10 142 43 North Vancouver Island 1.06 88 0.81 32 1.01 377 1.10 98 0.70 * 104 1.18 19 1.24 * 193 1.04 50 51 Northwest 1.39 * 50 1.31 23 1.19 * 183 1.22 70 1.20 71 1.27 18 1.18 77 1.02 33 52 Northern Interior 1.48 * 104 1.90 * 55 1.37 * 409 1.23 139 1.12 130 1.13 29 1.71 * 217 1.42 81 53 Northeast 1.41 * 38 1.57 21 1.23 * 143 1.04 35 1.18 54 1.40 11 1.42 * 69 0.97 18 PROVINCIAL TOTAL 1.00 3,247 1.00 1,026 1.00 15,155 1.00 3,244 1.00 6,313 1.00 868 1.00 6,185 1.00 1,638

196 A P P E N D I X 3
TABLE DMORTALITY STATISTICS BY HEALTH SERVICE DELIVERY AREA
BR I T I S H CO L U M B I A, 2001-2005
13 14 15 16 Diseases of the Digestive System Motor Vehicle Accidents Unintentional Falls Suicide Health Service Delivery Area SMR (p) Death TR PYLLI (p) D<75 SMR (p) Death TR PYLLI (p) D<75 SMR (p) Death TR PYLLI (p) D<75 SMR (p) Death TR PYLLI (p) D<75
17 18 19 Alcohol-Related Deaths Medically Treatable Disease Drug-Induced Deaths Health Service Delivery Area SMR (p) Death TR PYLLI (p) D<75 SMR (p) Death TR PYLLI (p) D<75 SMR (p) Death TR PYLLI (p) D<75
Please refer to footnotes on Table E
11 East Kootenay 0.86 95 0.55 * 34 1.52 * 62 1.46 * 55 1.12 35 1.37 11 1.15 52 1.26 50 12 Kootenay Boundary 1.08 141 0.95 52 1.62 * 67 1.75 * 61 1.58 * 61 1.10 10 0.98 45 0.97 42 13 Okanagan 1.00 589 1.14 226 1.33 * 219 1.38 * 183 1.05 188 1.53 45 1.17 * 210 1.27 * 192 14 Thompson Cariboo Shuswap 1.40 * 394 1.60 * 208 1.98 * 216 1.89 * 197 1.27 * 98 1.07 32 1.28 * 155 1.25 * 143 21 Fraser East 0.97 337 1.01 140 1.24 * 156 1.34 * 141 0.73 * 75 0.98 22 1.06 144 1.11 137 22 Fraser North 0.95 625 0.87 * 275 0.64 * 173 0.68 * 162 0.83 * 159 0.59 * 38 0.88 * 273 0.83 * 252 23 Fraser South 0.94 680 0.90 299 0.92 276 0.89 239 0.94 187 0.78 42 0.85 * 285 0.88 * 269 31 Richmond 0.69 * 156 0.42 * 59 0.51 * 44 0.58 * 41 0.58 * 38 0.37 * 7 0.53 * 52 0.42 * 43 32 Vancouver 1.03 813 1.14 361 0.47 * 141 0.38 * 112 0.88 210 1.26 60 1.03 351 0.96 322 33 North Shore/Coast Garibaldi 0.90 354 0.66 * 127 0.82 * 110 0.90 98 0.83 95 1.12 23 0.81 * 124 0.72 * 106 41 South Vancouver Island 0.93 594 0.82 * 186 0.58 * 104 0.59 * 79 1.16 * 238 0.90 32 1.03 202 1.01 178 42 Central Vancouver Island 1.06 427 1.27 * 201 1.03 128 1.07 107 1.16 135 1.05 25 1.29 * 177 1.44 * 160 43 North Vancouver Island 1.24 * 183 1.20 91 0.98 56 1.04 50 1.36 * 55 1.79 25 1.21 78 1.28 75 51 Northwest 1.37 * 95 1.39 59 1.80 * 72 1.94 * 70 1.24 22 1.56 14 1.43 * 64 1.46 * 62 52 Northern Interior 1.20 * 161 1.37 * 112 2.23 * 164 1.91 * 153 1.31 45 0.86 16 1.04 85 1.12 83 53 Northeast 0.86 45 0.93 27 2.73 * 85 2.57 * 82 1.69 * 23 0.65 7 0.70 24 0.89 24 PROVINCIAL TOTAL 1.00 5,689 1.00 2,457 1.00 2,073 1.00 1,830 1.00 1,664 1.00 409 1.00 2,324 1.00 2,141
11 East Kootenay 1.27 * 248 1.08 179 1.27 19 1.36 19 0.50 * 19 0.54 * 19 12 Kootenay Boundary 1.45 * 305 1.44 * 209 0.66 10 0.75 10 0.80 30 0.79 29 13 Okanagan 1.11 * 978 1.30 * 731 0.98 55 0.99 55 1.29 * 186 1.33 * 178 14 Thompson Cariboo Shuswap 1.44 * 749 1.66 * 612 1.42 * 57 1.48 57 1.08 109 1.17 108 21 Fraser East 0.83 * 470 0.94 380 0.83 35 0.76 35 1.00 115 0.99 111 22 Fraser North 0.81 * 950 0.69 * 700 0.81 82 0.81 82 0.80 * 221 0.81 * 216 23 Fraser South 0.73 * 958 0.73 * 747 1.10 122 1.04 122 0.88 * 258 0.91 249 31 Richmond 0.44 * 172 0.33 * 125 0.60 * 20 0.52 * 20 0.32 * 27 0.27 * 23 32 Vancouver 0.98 1,276 1.00 1,049 1.23 * 129 1.18 129 1.46 * 449 1.40 * 440 33 North Shore/Coast Garibaldi 0.85 * 552 0.80 * 406 0.89 46 0.93 46 0.58 * 76 0.55 * 68 41 South Vancouver Island 1.03 924 0.98 629 0.85 54 0.91 54 1.35 * 223 1.36 * 209 42 Central Vancouver Island 1.17 * 761 1.25 * 562 0.74 33 0.76 33 1.06 118 1.07 11 43 North Vancouver Island 1.48 * 402 1.37 * 299 1.02 22 1.11 22 1.03 56 1.09 56 51 Northwest 1.69 * 263 1.79 * 223 1.12 16 1.01 16 0.84 33 0.84 33 52 Northern Interior 1.35 * 396 1.24 * 340 1.30 35 1.27 35 0.84 60 0.79 60 53 Northeast 1.50 * 173 1.57 * 153 1.56 17 1.77 17 0.49 * 15 0.47 * 14 PROVINCIAL TOTAL 1.00 9,583 1.00 7,350 1.00 753 1.00 753 1.00 1,999 1.00 1,929

A P P E N D I X 3 197
01 Interior 717,012 28,205 8.07 186 6.55 30,009 2.83 133 4.72 02 Fraser 1,466,328 79,127 11.10 565 7.09 44,600 3.64 309 3.91 03 Vancouver Coastal 1,040,614 48,084 9.35 379 7.82 32,490 3.74 173 3.60 04 Vancouver Island 723,002 29,082 8.23 195 6.66 31,164 6.18 158 5.43 05 Northern 307,566 17,079 11.32 167 9.68 7,551 5.00 80 4.68 PROVINCIAL TOTAL 4,254,522 201,595 9.69 1,493 7.35 145,839 7.01 853 4.23
01 Interior 1,497 53.08 7,932 281.23 2,085 73.92 1,527 54.14 4,285 151.92 02 Fraser 4,359 55.09 22,492 284.25 5,668 71.63 2,285 28.88 15,362 194.14 03 Vancouver Coastal 2,593 53.93 13,557 281.94 3,472 72.21 818 17.01 14,592 303.47 04 Vancouver Island 1,543 53.06 8,544 293.79 2,334 80.26 1,621 55.74 5,379 184.96 05 Northern 801 46.90 4,608 269.81 1,071 62.71 1,391 81.45 1,923 112.59 PROVINCIAL TOTAL 10,793 53.54 57,134 283.41 14,630 72.57 7,642 37.91 41,544 206.08
Note: Total is the number of events in the specifi ed category for the fi ve year time period. Infant Death - deaths of children under one year of age. Low Birth Weight live births - live births with birth weight <2,500 grams. Cesarean - live births delivered by cesarean section. Pre-term - live births with gestational age <37 weeks. Teenage Mother - live births to mothers under 20 years of age. Elderly Gravida - live births to mothers 35 years of age or older. Death is the total number of deaths from the specifi ed cause for the fi ve year period. D<75 is the number of deaths under 75 years of age from the specifi ed cause. SMR - Standardized Mortality Ratio. PYLLI - Potential Years of Life Lost Index. Rate - per 1,000 population in the specifi ed area. Rate1 - rate per 1,000 live births in the specifi ed area. Rate2 - per 1,000 total births in the specifi ed area. SMR, PYLLI, and Rate are based on the fi ve year period ending with the current year. * Statistical testing indicates that observed deaths are statistically different from the expected deaths (p<0.05, two tailed). TR - Trend in ASMR based on single year rates for the previous 15 years: indicates a statistically signifi cantly positive (increasing) trend, and indicates a statistically signifi cantly negative (decreasing) trend. Trends are not shown in areas with less than 15 deaths in the 15 year period. Trends shown in previous annual reports were based on three year moving averages and should not be compared to the trends in
these tables. TR* - Trend refl ects change in Medical Certifi cation of Death introduced in 1993. The revised form contained questions about lifestyle
factors including abuse of alcohol, which resulted in increased reporting of deaths indirectly related to alcohol. HSDA 32 Vancouver may include unspecifi ed Vancouver addresses. N.S. - Not Stated. Non-residents are excluded.
TABLE ESUMMARY STATISTICS BY HEALTH AUTHORITY
BR I T I S H CO L U M B I A, 2001-2005
2005 Live Birth Stillbirth Death Infant Death Health Authority Population Total Rate Total Rate2 Total Rate Total Rate1
Low Birth Wt. Teenage Elderly Live Birth Cesarean Pre-term Mother Gravida Health Authority Total Rate1 Total Rate1 Total Rate1 Total Rate1 Total Rate1
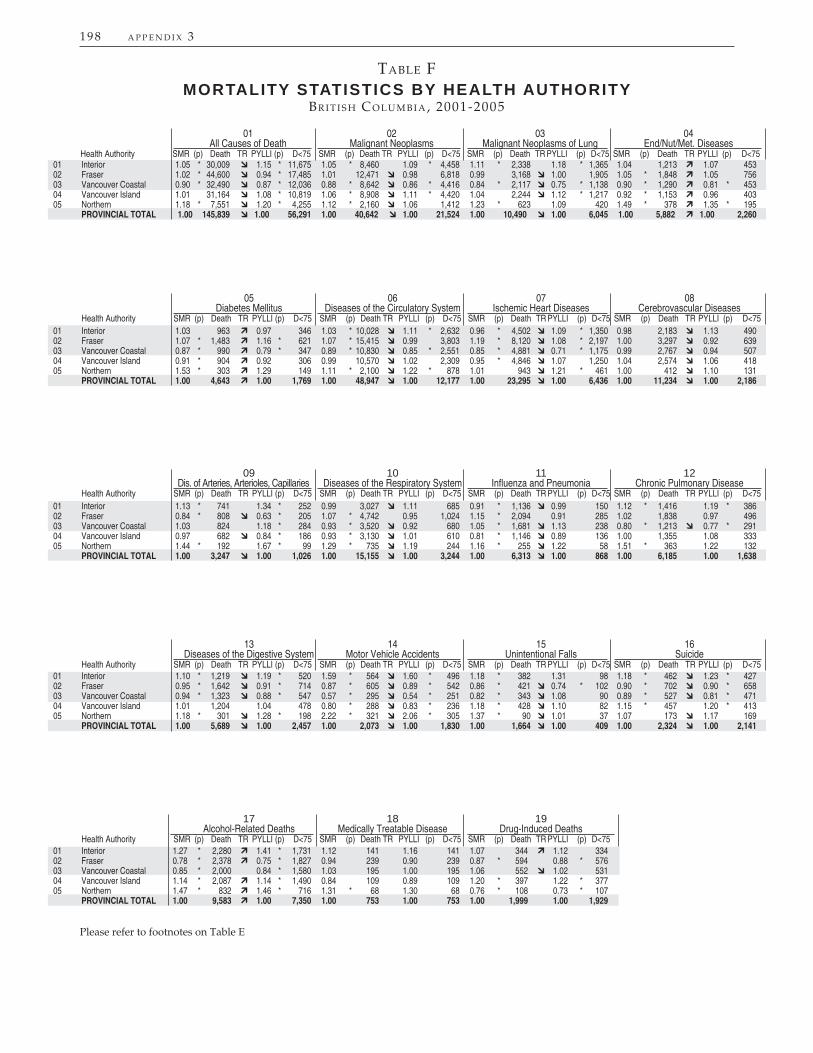
198 A P P E N D I X 3
01 Interior 1.27 * 2,280 1.41 * 1,731 1.12 141 1.16 141 1.07 344 1.12 334 02 Fraser 0.78 * 2,378 0.75 * 1,827 0.94 239 0.90 239 0.87 * 594 0.88 * 576 03 Vancouver Coastal 0.85 * 2,000 0.84 * 1,580 1.03 195 1.00 195 1.06 552 1.02 531 04 Vancouver Island 1.14 * 2,087 1.14 * 1,490 0.84 109 0.89 109 1.20 * 397 1.22 * 377 05 Northern 1.47 * 832 1.46 * 716 1.31 * 68 1.30 68 0.76 * 108 0.73 * 107 PROVINCIAL TOTAL 1.00 9,583 1.00 7,350 1.00 753 1.00 753 1.00 1,999 1.00 1,929
01 Interior 1.13 * 741 1.34 * 252 0.99 3,027 1.11 685 0.91 * 1,136 0.99 150 1.12 * 1,416 1.19 * 386 02 Fraser 0.84 * 808 0.63 * 205 1.07 * 4,742 0.95 1,024 1.15 * 2,094 0.91 285 1.02 1,838 0.97 496 03 Vancouver Coastal 1.03 824 1.18 * 284 0.93 * 3,520 0.92 680 1.05 * 1,681 1.13 238 0.80 * 1,213 0.77 * 291 04 Vancouver Island 0.97 682 0.84 * 186 0.93 * 3,130 1.01 610 0.81 * 1,146 0.89 136 1.00 1,355 1.08 333 05 Northern 1.44 * 192 1.67 * 99 1.29 * 735 1.19 244 1.16 * 255 1.22 58 1.51 * 363 1.22 132 PROVINCIAL TOTAL 1.00 3,247 1.00 1,026 1.00 15,155 1.00 3,244 1.00 6,313 1.00 868 1.00 6,185 1.00 1,638
05 06 07 08 Diabetes Mellitus Diseases of the Circulatory System Ischemic Heart Diseases Cerebrovascular Diseases Health Authority SMR (p) Death TR PYLLI (p) D<75 SMR (p) Death TR PYLLI (p) D<75 SMR (p) Death TR PYLLI (p) D<75 SMR (p) Death TR PYLLI (p) D<75
13 14 15 16 Diseases of the Digestive System Motor Vehicle Accidents Unintentional Falls Suicide Health Authority SMR (p) Death TR PYLLI (p) D<75 SMR (p) Death TR PYLLI (p) D<75 SMR (p) Death TR PYLLI (p) D<75 SMR (p) Death TR PYLLI (p) D<75
09 10 11 12 Dis. of Arteries, Arterioles, Capillaries Diseases of the Respiratory System Infl uenza and Pneumonia Chronic Pulmonary Disease Health Authority SMR (p) Death TR PYLLI (p) D<75 SMR (p) Death TR PYLLI (p) D<75 SMR (p) Death TR PYLLI (p) D<75 SMR (p) Death TR PYLLI (p) D<75
17 18 19 Alcohol-Related Deaths Medically Treatable Disease Drug-Induced Deaths Health Authority SMR (p) Death TR PYLLI (p) D<75 SMR (p) Death TR PYLLI (p) D<75 SMR (p) Death TR PYLLI (p) D<75
01 Interior 1.03 963 0.97 346 1.03 * 10,028 1.11 * 2,632 0.96 * 4,502 1.09 * 1,350 0.98 2,183 1.13 490 02 Fraser 1.07 * 1,483 1.16 * 621 1.07 * 15,415 0.99 3,803 1.19 * 8,120 1.08 * 2,197 1.00 3,297 0.92 639 03 Vancouver Coastal 0.87 * 990 0.79 * 347 0.89 * 10,830 0.85 * 2,551 0.85 * 4,881 0.71 * 1,175 0.99 2,767 0.94 507 04 Vancouver Island 0.91 * 904 0.92 306 0.99 10,570 1.02 2,309 0.95 * 4,846 1.07 1,250 1.04 2,574 1.06 418 05 Northern 1.53 * 303 1.29 149 1.11 * 2,100 1.22 * 878 1.01 943 1.21 * 461 1.00 412 1.10 131 PROVINCIAL TOTAL 1.00 4,643 1.00 1,769 1.00 48,947 1.00 12,177 1.00 23,295 1.00 6,436 1.00 11,234 1.00 2,186
01 Interior 1.10 * 1,219 1.19 * 520 1.59 * 564 1.60 * 496 1.18 * 382 1.31 98 1.18 * 462 1.23 * 427 02 Fraser 0.95 * 1,642 0.91 * 714 0.87 * 605 0.89 * 542 0.86 * 421 0.74 * 102 0.90 * 702 0.90 * 658 03 Vancouver Coastal 0.94 * 1,323 0.88 * 547 0.57 * 295 0.54 * 251 0.82 * 343 1.08 90 0.89 * 527 0.81 * 471 04 Vancouver Island 1.01 1,204 1.04 478 0.80 * 288 0.83 * 236 1.18 * 428 1.10 82 1.15 * 457 1.20 * 413 05 Northern 1.18 * 301 1.28 * 198 2.22 * 321 2.06 * 305 1.37 * 90 1.01 37 1.07 173 1.17 169 PROVINCIAL TOTAL 1.00 5,689 1.00 2,457 1.00 2,073 1.00 1,830 1.00 1,664 1.00 409 1.00 2,324 1.00 2,141
01 Interior 1.05 * 30,009 1.15 * 11,675 1.05 * 8,460 1.09 * 4,458 1.11 * 2,338 1.18 * 1,365 1.04 1,213 1.07 453 02 Fraser 1.02 * 44,600 0.94 * 17,485 1.01 12,471 0.98 6,818 0.99 3,168 1.00 1,905 1.05 * 1,848 1.05 756 03 Vancouver Coastal 0.90 * 32,490 0.87 * 12,036 0.88 * 8,642 0.86 * 4,416 0.84 * 2,117 0.75 * 1,138 0.90 * 1,290 0.81 * 453 04 Vancouver Island 1.01 31,164 1.08 * 10,819 1.06 * 8,908 1.11 * 4,420 1.04 2,244 1.12 * 1,217 0.92 * 1,153 0.96 403 05 Northern 1.18 * 7,551 1.20 * 4,255 1.12 * 2,160 1.06 1,412 1.23 * 623 1.09 420 1.49 * 378 1.35 * 195 PROVINCIAL TOTAL 1.00 145,839 1.00 56,291 1.00 40,642 1.00 21,524 1.00 10,490 1.00 6,045 1.00 5,882 1.00 2,260
Please refer to footnotes on Table E
TABLE FMORTALITY STATISTICS BY HEALTH AUTHORITY
BR I T I S H CO L U M B I A, 2001-2005
01 02 03 04 All Causes of Death Malignant Neoplasms Malignant Neoplasms of Lung End/Nut/Met. Diseases Health Authority SMR (p) Death TR PYLLI (p) D<75 SMR (p) Death TR PYLLI (p) D<75 SMR (p) Death TR PYLLI (p) D<75 SMR (p) Death TR PYLLI (p) D<75