VITAL STATISTICS - DSpace@GIPE
61
Bulletin No . 9 DEPARTMENT OF ECONOMICS STATISTICS UNITED PROVINCES VITAL STATISTICS IN UNITED PROVINCES (A CRITICAL ANALYSIS OF FORTY YEARS DATA) BY A. R. SEN, M. Sc ., F.S.S. (LONDON) ASSISTANT STATISfiCIAN Department ot Economics and Statistics, United Provmces Government .!..L!,ARABAD: IIC'G £liD UlfrTi:O PBOVINOBB, I N9J ". 19 48.
-
Upload
khangminh22 -
Category
Documents
-
view
4 -
download
0
Transcript of VITAL STATISTICS - DSpace@GIPE

Bulletin No. 9
g~~~~~bd~~~~
DEPARTMENT OF ECONOMICS .~NO STATISTICS
UNITED PROVINCES
VITAL STATISTICS IN
UNITED PROVINCES
(A CRITICAL ANALYSIS OF FORTY YEARS DATA)
BY
A. R. SEN, M. Sc., F.S.S. (LONDON)
ASSISTANT STATISfiCIAN
Department ot Economics and Statistics,
United Provmces Government
.!..L!,ARABAD:
IIC'G £liD S~A'l'IONEBY, UlfrTi:O PBOVINOBB, IN9J". 19 48.

The statements made and opinion expressed in the ·Bulletin are those of the author in his personal capacity and do not necessarily commit the Government in any way.

COXTENTS
PAGI!i
I. CHAPTER I-l.NTRODUCTION I
~- CHAPTER ll-RESULTS OF A~ALYSIS 3
·a) PERCE'I"TAGE MORTAI.ITY :l
(b) SECULAR TRE>IL 6
(C) SllASON AL DISTRillUTIO>r !)
(d) Zo:IIES OF lliGH, :l'ORMAL A}ID LOW :U:ORTAHTY 21
3. CHAPIER III-CONCLUSro;,;- 0. 3:1
4. APPENDIX 39

LIST OF TABLES
TABLE I-A:s"KUAL !!ORTALITY FROJI! CHOLERA, SMALLPOX AND PLAGUE l!;XPRESSED AS PERCEN~AGE OF TOTAL MORTALITY FROM ALL CAUSES IN UNIT:ii:D F ROVINCES DURING 1906--45
TABLE II-A:!i"NUAL MORTALITY BATE PER ONE THOUSAl'D POPULATION FROM CHOLERA, SMALL-POX ANJJ
PAGE
PLAGUE DURING 1906-45 7
TABLE III-MoNTHLY DEA~HS FROM CHOLERA IN U:r;ITED PROVIJS'CES EXPRESSEO:> AS PERCENTAGE OF TOTAL DEATHS FROM CB.OLERA DURING TB.E YEAR, FOR THE YEARS 1906- 45 10•
TABL "F. IV -l\IONTHLY DEATHI> FIWM SMALL-POX IN UNITED PROVINCES EXPRESSED AS PERCEFTAGE OF TOTAL DEATB.S FROM SMALL-POX DURIFG THE YEAR, FOR TB.E YEARS 1906-45 14~
TABLE V-:MONTHLY DEATHS FROM PLAGUE no UFITED PROVINCES EXPRESSEO AS PEROEKTAGE OF TOTAL DEATHS O'ROM PLAGUE JJURING THE YEAR, FOR THE YEARS 1906-45 , • 1 S;
TABLE VI-ADJUSTED VALUES OF f>EASONAL INDICES (NORMAL=100) FOR CHOLERA, SMALL-POX AND PLAGUE FOR THE Ul'IITED PROVD'CES BASED 0::< DATA FOR THE PERIOD 1906--45 • • 21
LIST 01' GRAPHS
GRAPH 1-'lROWING PJ;.RCEl'T.&G:E. MORTALITY AND GENERAL TENDEXCY FOR CHOLERA, SMALL-POX AND PLAGUE I:s" U~ITED PROTIJ>CES DURING 1906--45,
GRAPH II-SHOWING MORTALITY RATE (DEATHS PER THOUf>AND OF POPULATION) AND GENERAL TE DENCY FOR CHOLEBA, SMALL-POX AND PLAGt'"E IN Ul'ITED PROVINCES DURING; 1906-45.
GRAPH Iii-SHOWING SEASONAL Il>'l>ICES CF !IORTALITY FROM CHOLERA IN U:tJITED PROVlliCES BASED ON DATA OVER THE PERIOD 1906-45.
GRAPH IV-SHOWlliG SEASOFAL IJ!TDICES OF MORTALITY FROM SMALL-POX IF UNITED PROVINCES BASED ON DATA OVER THE PERIOD 1901:-45.
GRAPH V-SHOWING SEASONAL INDICES OF MORTALITY FROM PLAGUE IN UNITED PROVINCES BASED OF DATA OVER THE PERIOD 1906-45.

iii
GRAFH VI-DoT-DIAGRA~t1-SHownoG I•ISTRICTS oF HIGH. NORMAL A:!>"D LOW MEAN MORTALITY FRO~! Cli.CLERA IN U"ITED PROVINCES BASED ON DATA OVER THE l'ERIOD 1906--45.
GRAPH VII-DoT-DIAGRAM 2- SnowrNG l:ISTRICTS oF HIGH, NORMAL ANl> LOW VARIATION TRO!ol CJIOLERA IN U~ITED PROVINCES BASED ON DATA OVER THE l'EIU01) 1906--45.
GR • .u>R VIII-DoT-DIAGRAM 3--SHOWING DISTRICTS oF HIGH, NORMAL AND LOW MEAN MORTALITY AND VARIATION FROM CHOLERA IX U~JTED PROVINCES BASED Ol'il" DATA OVER THE PERIOD 1906--45.
GRAPH IX-DcT-DIAGRAlll 4--SHOWING DISTRICTS oF HIGII, NORMAL AND LOW MEAN MORTALiiY FROM SMALL-POX IN UNITED PROVJNC:FS BASED 0~ DATA OVER TTlE PERICD 1906-45.
GRAPH X- DoT-DIAGRAl\15-SHowrl"G DISTRICTS CF t.IGR, NORMAL Al'D LOW VARIATION FROM Sli!AI,Ll'OX IF UFITED PROV~CES BAShD ON DATA OVER THE PERIOI> 1906--45.
GRAPH Xl-DoT-r.IAGRAllr f-SHowrNo DISTRICTS OF HIGH, NORMAL A"ND LOWMEANMORTALI'IY A>iD VARIATION FROM SMALL-POX IN U:!!<ITED PROVINCES BASED ON DATA OVER ThE l'ERIOD 1906-45.
GRAPH XIT-DoT-DIAGRAM 7--SHOWING DISTRICTS OF HIGH, NORMAL AND LOW MEAN MORTALITY FROM l'LAUUE IN UNITED PROVll'CES BASED ON DATA OVER TRE l'EBIOD 1906--45.
GRAPH xnr-DoT-DIAGB-~M 8-S;aowiNG DISTRICTs oF liiGll., NORMAL AND LOW VARIATION FROM !'LAGUE IF UNITED PROVINCES BASED ON DATA OVER THE l'ERIOD 1906--45.
GRAPH XIV-DOT-DIAGRAM 9-SHOWP"G DISTRICTS OF HIGH, NORMAL A:!OD MEAN MORTALITY AND VARIATION FROM !'LAGUE IN UNITED PROVINCES BASE'l ON DATA OVER ThE l'ERIOD 1906-45.
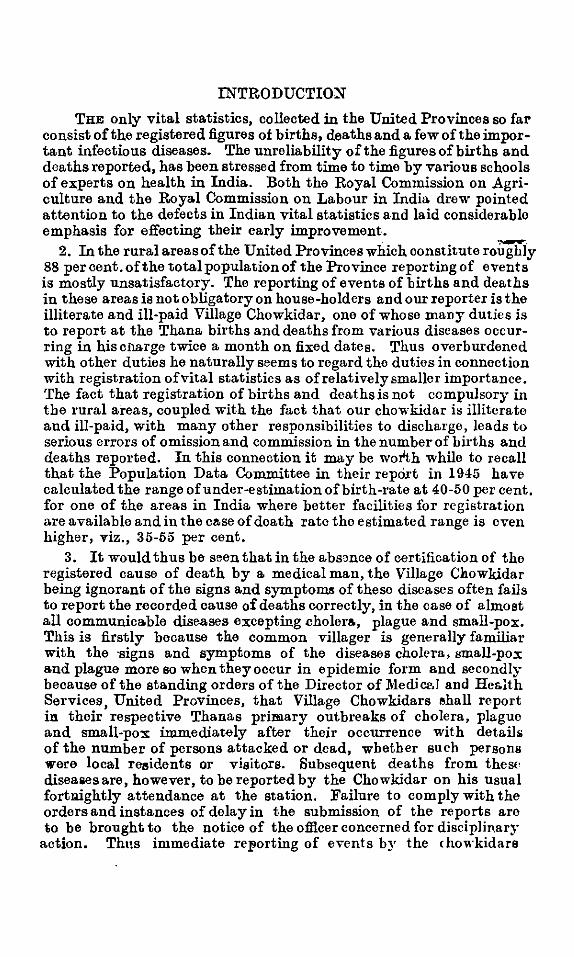
INTRODUCTIO~
THE only vital statistics, collected in the United Provinces so far consist of the registered figures ot births, deaths and a few of the important infectious diseases. The unreliability ofthe figures of births and deaths reported, has been stressed from time to time by various schools of experts on health in India. Both the Royal Commission on Agri· culture and the Royal Commission on Labour in India drew pointed attention to the defects in Indian vital statistics and laid considerable emphasis for effecting their early improvement.
.,_.-, 2. In the rural areasofthe United Provinces which constitute roughly
88 per cent. of the total population of the Province reporting of events is mostly unsatisfactory. The reporting of events of births and deaths in these areas is not obligatory on house-holders and our reporter is the illiterate and ill-paid Village Chowkidar, one of whose many duties is to report at the Thana births and deaths from various diseases occurring in hisc11.arge twice a month on fixed dates. Thus overburdened with other duties he naturally seems to regard the duties in connection with registration of vital statistics as ofrelativelysma!ler importance. The fact that registration of births and deaths is not compulsory in the rural areas, coupled with the fact that our chowkidar is illiterate and ill-paid, with many other responsibilities to discharge, leads to serious errors of omission and commission in thenumberofbirths and deaths reported. In this connection it may be wofth while to recall that the Population Data Committee in their repcirt in 1945 have calculated the range of under-estimation of birth-rate at 40-50 per cent. for one of the areas in India where better facilities for registration are available and in the c~se of death rate the estimated range is even higher, viz., 35-55 per cent.
3. It would thus be seen that in the abs3nce of certification of the registered cause of death by a medical man, the Village Chowkidar being ignorant of the signs and symptoms of these diseases often fails to report the recorded cause of deaths correctly, in the case of almost all communicable diseases excepting choler&, plague and small-pox. This is firstly because the common villager is generally familiar with the ·signs and symptoms of the diseases cholera, small-pox and plague more so when they occur in epidemic form and secondly because of the standing orders of the Director of 1\ledi ce.I and Heslth Services, United Provinces, that Village Chowkidars ehall report i11 their respective Thanas primary outbreaks of cholera, plague and sma.ll-po:x immediately after their occurrence with detail& of the number of persons attacked or dead, whether such persons were local re11idents or visitors. Subsequent deaths from the&• diseaaesare, however, to be reported by the Chowkidar on his usual fortuightly attendance at the station. Failure to comply with the orders and instances of delay in the submission of the reports are to be brought to the notice of the officer concerned for disciplinary
action. Thns immediate reporting of events by the chowkidars
reduces by far the possibility of errors of omission which he is likely to commit otherwise, by trying to remember events (being generally unable to record such events on account of his illiteracy) of deaths and births during a fortnight till his fortnightly report of such events
·at the Thana on scheduled dates. · 4. It is mainly for the ccmparative reliability of the statistical re
ports of the epidemic disf'ascs, cholera, small-pox and plague which form an important part of the vital statisties of the United Provinces, that these alone have been selected for the purpose of study. Although the individual figures would naturally be subject to certai1i. pe1 c~ntag~" errors, the recorded figures m·e likely to giYe a fairly clear indication of the trend of eyents.
5. One of the main objects of the statistic?) examinatiou of the marhli•y d~ta in :respects< f the diseases has been to enable us to
·find out whryth"r on the wh')le nnrt<tlity from a p<trticular disease has a declining o• a ,.;sing t•end, wh~ther th<" disease under exan~inntion e"hibits any m1.· ked se~sonal periodicity and locate as f,cr 8 s possible flr such a dise:tse, the dish·icts ofhigh mortality in the Province and fi·1 tlly suggost wherever p:ssible means fN era.dicating them. It is obvious th 1t answers t3 these questions would provide the fieldwwker in the Pt1hlic Hc~It.h Dep~rtmcm with a powe1ful weapon to CJmbat th9Se dise<tqt>s, P'rticuhrly in the districts of high mortality. Attempt h1s been m~de in the following pages to answer theBe problemq by subjectin~ 1;he data over a pt>•iod of 40 years, 1906--45, to st1.tistical amJysis (details in spf.cial cases explained in the appendx) and in this due consideration h"ts been made of the changes in the meth')ds of ctlculotion of death rates after 1941. In fact calculations af.er 1941 h<ove been m"tde on the same lines as befcre tba.t date to m'\intain uniformity. ){y thanks in this connPxion arc due to Dr. A. C. B.merjee (Director of Medical p,nd Health Sorvices, United Provinces) and his staff for kindly placing at my disposal all the annual repJrts of the DepA.rtment of P11b1ic Ht>alth duling the period under investigatioo. I am indebted to :i\!r. Knnwar Kisben /Statistician to D1recto1 of Ag:iculture, United Provinces) for his valuable sug testions on cPrtain aspects of the problem and also to Dr. Chandra Sekhar (fltatistician, Health and Hygiene Institute, Calcutta) with whom I discussed epidemic invest.iga tions in general; when he last visited Lucknow. ·

3
RESULTS OF A~ALYSIS
(a) Percentage Modality
In table I is presented the deaths during any year for each of thP three diseases cholera. small-pcxandplague, for the I rovince ex:pressed as percentage cf total deaths from all causes during the year L·r the years 1906-45. In column 6 ofthetablcis shown the sum total of the percentage mortality due to the three diseases for the ye~trs 1906-45. A glance at the table would show tba• the percentage mortality from cholera was highest during 1921 (which was the year of highest mortality on record for the Province during the period under examination), viz., 8· 34 per cent. of the total deaths from all causes for the Province and lowest d~ring subsequent year, viz., 0· 20 during 1922. In the case of small-pox the range was 0·05 per cent.-2·39 per cent_ the highest percentage figure being attained during 1908, which was perhaps the mcst fatal year of mortality for the Province. For plague the range ofvaria~;ion was sufficiently wide, viz., O· 36 per cent.-15· 88 per cent. the highest figure< f 15· 88 per cent. of the total deaths from all causEs being attHined during the year 1907 which was an acute epidemic year for the Province. The total percentage mortality from the three diseases wasashigl:! as 21·42 per cent. during 1911, i.e., about cue-fifth of the total mortality from all causes and as low as 2·06 during 1942, i.e., 1/50 of the totr 1 mortality. The mean percentage mottalities over the period for t.he three diseases chole:a, small-pox a.nd plague were respectively 2·97, 0•69 and 3·76 per cent. the total forthethreediseasesbeing 7·42 per cent. or roughly lfl4 oft.hemortality from all causes.
TABLE !-Annual mortality from cholera. small-pox and plague expressed as percentage of total mortality from all causes in United Provinces during 1906-45.
I Totnl of Serial Y€ars Cholera. Smull-pox :Plugue columna no. 3, 4, 5
I 2 3 4 5 6
I I906 .. .. 8'04 o·12 3'74 12'50
2 I9U7 .. .. I'08 I'08 i5' 88 I8'04 ' 3 1908 . . .. 3'32 2'39 0'9I 6'62
4 1909 .. .. 1' 23 0'32 2'14 3'69
5 1910 .. .. 5'56 o·os 8'66 14'17
6 )gt) .. .. 5'58 i'07 15' 77 21•42 .

4
Total of Serial Years Cholera Smallpox Plague columns-
no. 3, 4, 5
---1 2 3 4 5 6
7 191~ . . .. 1"34 0"23 8"19 9"76
8 1913 .. .. 3"70 0"49 6"60 10"7S»
9 1914 .. .. 2"06 1"14 &·a3 9"83
10 1915 .. .. 6"42 0"17 4" 13 10"72•
11 1916 .. .. 2"41 0"10 3'56 6"0T
12 1917 .. .. J• 21 0"11 7"28 8"60·
13 1918 .. .. ~·u o·o7J 4'53 7"7l
14 1919 .. .. 4"17 0"551 o·59 5"61
15 1920 .. .. o·•o o· 33 , 1"42 2"17
16 1921 .. .. 8"34 o·o8j 1" 34 9"76
17 1922 .. .. 0"20 0"04 2"04 2"28
IS 1923 .. .. 0.26 . o·o9J 6"97 7" 32
19 !924 .. . . 5"23 0"21 4"38 9"82 •
!0 !fi2J .. .. 0"69 0'85 -4."36 5"90
21 1926 .. .. 0"52 1"04 5"02 a· ss
22 1927 .. . . 2"74 0"75 1" 51 i 5·oo
23 19~8 .. .. 4,"10 0"29 7"37 11"76
24 1929 .. .. 4'6! t·o; 3"42 9"11
25 1930 .. .. 4"96 . o·ss o·ss 6" 72"
26 1931 .. .. 2"37 0"26 2"37 5"00
27 1932 .. .. o·9o 0'27 ]"981 3"15
28 1933 .. .. 0"!1 1"07 1"07 2"35
29 1934 .. .. 2"47 1"16 3"661 7"29
30 1985 .. .. o·s;; 2"18 J• 90 I 4,"93
II 1936 .. . . 0"62 1"33 06"6 2"61
3! 1937 .. . . 0"61 o·a3 2"34 3"28
33 183S .. . . 5'6,'; o·35 1' OS : 7"88
34 1939 .. . . 2'47 0"91 t·Gsl 5"33
a;; 1940 .. . . 2"48 1' l':•"l .,_ 1·1o 1 5"li
M 1941 .. .. I 4,"93 J• 24 0"36 i 6"i3 -- I
..

5
--·-Serial Totnl of
no. Years Cholera Smallpox Plngue columns 3, 4, 5
1 2 3 4 6 6
---··-··· __ ., __
37 1942 .. .. 0'76 0'43 0'87 2'06
38 1943 .. .. 2'34 0'.52 0' 68 3'54
39 19H .. .. 3'H 0'96 1'H 6'1-1.
40 1945 .. .. 7'07 2'01 1'27 10'35 ----~--
:\Ie.!m .. .. 2'97 0'69 3'76 7'42
2. It may be ir.teresting to observe that thetot.al percentage mortality from the three diseases shows a somewhat declining tendency with years. The percentage mortality figures have been plotted in graph. I, and A, B, and C represent respectively the peJcentage mortality curves for chole;a, smail-pox and plague. The curves Al> B 1 and C1 represent respect;velytheir general tendenc•es (as cbtamed bymoving averages). It would appear frcm the graph C1 that percentage mortality frcm plague, has a visibl.v declir·ing tendency shewing thereby that the share of plague in total mortality conti11ued to decline with years. In the case uf cholera. the curve A 1 represents the declining tendency which, is, however, not so marked as that in the case of plague. It would be noticeable, however, from the curve A 10 that the declining trend was visible till 1931 and thereaftf'r the curve ceased to have any tendency wratever, either for decline or for rise. In other words the share of chclora in total mortaiity continue•~ to decline till 1931 and thereafter remained more or less unchanged. In the case <>f small-pox the wrve of general tendency B 1 indicates that the share of smal'-pox in total mortality remained mere cr less constant over the period under ex:a.mir~a.tion. ·

6
(b) Secular Trend
In columns 3, 4 and 5 of table II, are set out the annual death rates (deaths perthousamd populaticn per year) from the three diseases and in column 6 of the table are shown the death rates from all causes for the Province for the years 1906-45.
2. It would appear from the table that mortality from cJ-.olera was highest during 1921, i. e., 3· 30 per thousand pcpu!P.tior and lowest during 1933, i.e., 0·04 per thousar.d population. As bas also oeen seen before, the year 1921 figured as the year of highest percentage mort"'lity from chdera for the Province during the period under examination. In the case of small-pox, the year 1908 recorded the highest mortality, viz. of 1·26 per thousand uouulation, the lowest figure cf O·Ol per thousand or 10 per million being attained during
· 1922. For plague, the mortality ranged between 0·07 and 7·09 ner · thousM,d the lowest and highest fignres being att"'ined during the
years 1941 and 1911 resnectively, the year 1911 being an e.pidemic year of highest mortality for the Pre vince. The tvtal mort"'iity from all c'tuses was highest during 1918, viz., 82·37 ner thousand, partly because the year 1918 was year of high mcrtality both for
. chc•lora and plague and mainly because of the large number of deaths due to influenza eoidemic which unshed uo the figures ef mortality from fevers to 68· 72 uer thousand. The mortality rates in table 2 .J.re presented in graph. The curves A, Band C represert -respectively the mortality rates from ch< !era, small·p< x and plague and the straight lines At> B1 and Ct> their general tendencies as obtained by fitting regression lines (see Appendix). It would appear from the tiend of thr Htra.ight line A1 th"'t mortality rate from cholera has on the whde a visibly declining tendency with years, the rate of decline (as wculd he seen from the equation to the straight line y=-0·02962:~:+1·55651 fitted) being 0·02962 per thousand per year or roughly 30 per millicn ner ye!l.r. In the case cf smallpcx, the straight line B1 representing the general trend shows no such tendency for d<cline or rise (the line y =-0·00135x+O· 22424 being almost parallel to the axis of x). In other wcrds the number cf deatns per year for the Province seems to remain more or less unch!l.nged thr<'ugh<'ut the entire period under examination. As regards plague, it would be seen from the graph that the line of general tendency cl (equatioc to the line is y= -O·OS306x+2·98723) shows a marked decr-easing trend with years, i.e. t'l say mortality from plague shows a real decrease during the period 1906-45 under e:s:maination, the rate CJf decrease being approxim.,tely 0·083, per thcusaud per year cr rcughly 83 per million per year. Au examination of the distribution of mortality rates from plague for the years 1906-45 for all the districts of t.he Province ( '\S given in the annual reports issued by the DireLtor of Medical an<J, He,Jth Services) shows that during recent years except for the districts of B:maras and Gorakhpur Divisions, the rest of the Province h9.s almost been free from plague mortality. In tho case Qf chliera also, it is noticeable that mortality is not sc pronounced during recent years as it used to be in the beginning c.f the pericd und~r e:s:~mination although the decline is not so marked as in the

7
ease of plague. Thus although mo~tality rates from smull·poX remained unaltered duting the period, those from plague and c~o.l~ra. show a real fall which may be due to the improved faCthtws afforded by the Public Health. Department to combat the epidomio diseases in the province.
TABLE II-Annutzl mortality ?'ate per 1,000 population from cltolera, · smallpox and plague in U. P. during I!J06-45
Serial I I Smallpox MoTtalitv
Years Cholera Plague from all no. en. uses
i I ---
I 2 3 4 5 &
1 1906 .. .. 3·14 0·28 1-4ti 39·07
2 1907 .. .. 0-47 0·47 6-00 43· 4\l
3 1908 .. .. 1-75 }. 26 0-48 ii2· 7:l
4 1909 .. .. Q . .j.(j 0·12 0-80 37·34
5 1910 .. .. 2·15 0-02 3-31 38·67
6 19ll .. .. 2·51 0·03 ' 7-09 u.o5
7 1912 .. .. 0-40 0·07 2-45 2Q.g1
8 1913 .. .. 1-29 0·17 2·30 34-84
9 1914 . . .. 0-69 0-38 2·2:1 33-46
10 1915 .. .. 1·93 0-05 1-24 30-04
ll 1916 .. .. 0·71 0·03 1· 05 29·50
12 1917 .. .. 0·46 0-041 2-76 37·91
13 1918 .. .. 2·56 0·06 3·73 82·37
14 1919 .. .. 1·74 0·231 0·37 41-69
15 1920 .. .. 0·15 0-13 0·53 37·23
16 1921 .. .. 3·30 0·031 0·53 39·57
17 1922 .. .. 0·05 0·01 I 0-51 25·01
18 192:J .. .. 0·06 0-02 1-63 23·37
19 1924 .. .. 1-48 0·06 1-24 28·29
20 1925 .. . . 0·17 o. 21 1·08 24·78
21 1926 .. .. 0·13 0·26 1·26 25·10
22 1927 .. .. 0·62 0·17 0-34 22·;)9
23 1928 .. .. 0·99 0-07 I 1-78 24·15
24 1929 . . .. 1·12 0·26 0-83 2-!·26
.. -·-

8
i Mortality Serial Years Cholera. ! SmGUpo:< Plague from all
no. causes
1 2 3 I '
4 5 6
25 1930 .. . . 1·351 0· 24 0·24 27·20
26 1031 .. .. 0·64 0·07 0·64 ' 26·97
27 1032 .. .. 0·20 0·06 0·441 22·23
28 1933 .. . . 0·04 0·20 0·20 . 18·69 I
1934 ' 26·75 29 .. .. 0·66 0·31 0·98 .• I
3() 1935 0·21 0·54 • 4 I 24·7S .. .. O·o 1
' 22·61 31 1936 ... .. o,u 0·30 0·15 . I
32 1937 .. .. 0·13 0·07 0·50 ~ 21·3S
33 1938 .. .. 1·46 0-09 o-28 I 25·82
34 1939 .. . . 0·57 0·21 0·45 23·09
35 1!.140 .. .. O·M 0·33 0·24 21·78
36 1941 .. . . 0·95 0·24 0·07 19·28
37 194:~ .. . . 0·14 0·08 0·16 18·7S
38 1943 .. . . 0·47 0·11 0·14 19·76
39 1944 .. . . 0·13 0-18 0·28 1 19·19
40 1945 .. . . 1·41 0·40 o-2; I 19·94 !
~--lleo.n .. . . 0·95 0·20 ' 1· 28 l 30·:l

9
(c) Seasonal Dlstribut!on
It has frequently been observed in everyday life that mortality from a putimdar epidemic is higl- during a particular t'me of the year and that other periuds of the year are characterised by low ll'.Or•
ta.lity and sometimes by its complete absence. We now procet>d to study this seasonal behaviour in respect oftbe three diseases, cholera, small-l)ox and plague.
2. With this object in view the number of deaths in the Province for each of the tbre6 diseases during any month of a. year have been exvressed as nercentagr> of the total doa.tbs during the year. Ir other words for nurposes of comparison assuming that the total deaihs for ;,be Province during any year xemained 100, we have worked out the monthly deaths for the year in respect of each of tne diseases. We now proceec! to study the season•} oha.ra.ctersin respect of the diseases.
3. Cholera-In table III are presented the moPtbly deathq from cholera during any ye'Lr exptessed as pe1centage of the tnal dt>atbs during the year for the Irovince for che years 1906-45. The first. two months h order of maximum percentage mortality during any year have been 'll!nclerlined it would a.ppeax from an examination of the maxima that mortality from cholera. is most ptonounced du,ing the 6 months ohhe year, viz., May to October. The average seasonal indices* for the Ptovince have next been oalcdated and p1 esented in graph III. The height of the bar against eaoh month indicates the relat.ive importance of that cause tf mortality. The horizontalline corresponding to a. seasonal index of 100 represents the level of a. verage mortality from cholera. The bars wbcse heights exceed this level repl'esent cases of mortality higher then the average. It would be noticeable from the graph that the months May to October &.'~' cha,a.cte:ised by high cholera. mortality, mortaiity during the remaining six months November to April, being bPlc.w nonrai ( =lO<l). It wonld further be seen that the highest index of 174 is a:.tained during the month of August. It is interesting to obse1 ve t.hat mortality is most pronounce d during the four months June to September, which rtngbly coincide with the rainy season in the Province and this seems to indicate that the rainy months are generally the months of high mortality. It may be useful to extend the study t.t· individual distri<>ts and parti· cula.rly study this fact in respect of the distticts of high mortality.
•.Analysis ofTizn.e Series-S~a.tistica.l Methods, by F. C. Mills.

TanLE Ili-MontMy deatl1s from cholera in U.P. expreMed all pet·ccntage of .total deaths from clwlrra during the yeaft" for the years l!l06-45
------- Month~ , January Febnw.rylll!ureh
I April May June July Augu~t Soptem- Octobor Novem- Decom· ----- •, bor ber ·bor her
~Oilrs ~ -- ---·
1906 0'50 J• 85 1'35 12"32 21'[0 16·69 •!' 89 6'07 12'37 13'41 7' 13 2'27 . . .. --1907 3' 20 3'99 3 'l)i) r.· 22 2'81 0'40 7'.'i0 6'50 16•49 25'46 13'811 0'02 .. .. ----1908 7'90 7'80 12'04 19"40 20• 79 lfi. fi4· 9"511 3'67 1"34 f)' 42 II" 117 o· 87 .. .. --1909 .. · o'.J9 0'05 (1'62 4'93 10"80 L!J· !l:l 12'08 16' 67 16'68 16''/3 4'68 0'03 .. 1910 .. .. '0'02 o- oa 0':12 •. 50 10'71 10'03 30'51 Jt·JJ .s· 19 10' OJ 4'24 o· 112 ---- ----1911 .. · o·o8 .. 0"07 O"ll 1' 23 2' !l·l 16'80 u·2.; 13'81 4'18 7' 28 7'70 I· 49 -
1912 .. . . 1'38 o· 99 2'43 18'65 26"64 -- 13'70 1"96 7'94 13'fi9 o·or; a· J8 O''lHJ
1913 .. .. 0'07 - o·.o8 0'42 8"76 27"32 24"90 .1 o· 82 12' 71 ti' 85 1'85 - 1' 03 0"19
1914 .. .. o·8o 0'82 1'42 7'11 8"48 13'20 6'03 0'3!i 16"56 14'50 13'.11 8"56
1915 .. .. 0'05 0'05 0'47 2'10 6"58 9'85 4'42 6' 7.4 8'38 29"41 ·£1' 90 11' 06
19!6 . . .. 0'87 o· 10 h' OS 8'98 17'26 8"93 10' 47 17"29 13' .79 -Ul'85 6'H .0'34
1917 .. . . 0"16 0'17 .0'58 2'85 l' 79 5"38 3'51 6'99 10'28 29' 58 2?•15 6'.50
1918 .. 0'23 o· 08 0' 38 :.·oo 13'00 J1'11 ·22"61 12'22 3'53 -~··J8 7"09 2,30 .. 1919 0'04 0'08 19'62 26"12 ~ .. . . 0'07 8'34 12'07 13'02 11'-83 (1'88 . I' 31 0'02

1920
1021
1922
1923
1924
192G
1926
JD27
1028
1929
1930
1931
1932
1035 ' .1936
l037 1938
1939
1940
..
.. .. .. .. .. .. .. .. .. .. .. .. .. .. . . .. .. .. .. ..
.. ~
t·os
.. 0'02
.. I 8'07
.. 0'12
.. 0' oo
.. 0'46
.. 0' 78
.. 0'04
.. o·os
.. 0' 29
. . 0'20
.. o·os
.. 0'40
.. 0'63
. . 0'01
.. 1'39
. . 0'18
. . 0.16
.. 0'18
.. 0'161
.. 0'20
1' 3ri 1'~7 2'53 3'44
0'03 0'33 3'38 s·r;n
0'39 4'68 24''/5 20•00
o· 1 r. I 0'93 2'0!i 3'13
0'20 7'53 39· 30 ]8'.15
I' 02 o· 6:1 2'01) 4'09
0'92 ;)' 01 11 ·Do 11' 21
o·os 0'4-2 6'57 26·72
o·os t· :u; 11.47 n·u -0'15 0'49 6'8S
'15'511
o· 71 I I' 49 14'83 18'90
0'10 0'39 2' 11 I 5'82 I
0'17 t· 36 2'79 3'91
0'52 6' 37 55•29 18•49
0'02 0'10 0'28 a· 20
1'40 6'19 18'13 13' 36
0'36 1'30 5'30 11' t.;
0'87 0'46 3·66 2.89
o·o8 0'41 2"92 19'97
0":?0 0'43 3'10 4'18
0'06 o· 39 ~·55 4'68
3'39 3'65 1(}'53
8'37 II' 93 ,'J.'j·99
1 ()" 65 7'77 8'63
5'52 7' 18 ]8·99
n· 7n 4' (II) 8'29
3'63 4' 27 16' fi2
14' II 14'6.1 1,;· ].1 ---32•96 17' 90 8'311
20·74 12' 3:1 0'7fi
1!)'56 16'04 16• 11
18'39 9'80 II' 54
]6'83 13'94 30·09 ----7' ,,., 11' 90 19' 75
6'27 5'01 3'97
12'83 20·56 21'88
. 10'54: 13'42 1'1'55
23•28 13'25 12' tO
6'3< 3"50 ]5"23
29·76 )6'97 10'25
10'80 23•25 ~~·uj 10'9{ ~-~ 21' 7J
3&·90 IS· 6.1
JS· 4.1 9' 48
!i'24 2'01)
41•Qfj 17'114
·S'01 1'64
u·ss 10'22
II' (iii 10' 33
4'24 1' 8:?
G':?S 8'78
13' 23 8' 5:l
14' II 7'14
16'00 10' 13
33•32 15' 12
o· 811 I' 72
16'-09 10' 03
13'02 3' ;}5
10'23 7" 12
10·01 19'21
5'74 6" 65
I fi" SG 9"9;j
23'91 13' Ul
S'S!i
2'20
0'47
3' 20
o· .13
28·22
:r 7i'i
()'[12
s· Li
4.'77
2'22
3'70
3'28
0'84
5'24
0'47
6'29
24'03
4'90
3'94
3"32
J· G8
I' 16
()' 3!)
0'04
O'IU
11'44
.,. f•7
0'37
3'fi2
2'44
0'67
0'81
0'78
U'Oo
2'80
0'08
2'78
13·64
2' 17
l. l!i
o·ua
.... ....

-·-----
1941
1042
1943
1944
1 U4l)
..
..
..
..
..
Months Jununry
---- --- -0'25 .. 1'66 ..
.. o· 14
.. 0'67
.. 0'48
--=--February Murch April Muy Juno
...
o·o8 o· 73 10'66 21•79 21' 61
o· 33 t· 74 2'69 1'02 1'97
0'37 o· 26 o·so 1" 51 4'63
0'28 o· 32 0'64 3'26 s· 21r
0'28 o· 33 2"30 23· 02 27'54 ---
July Augw~t Soptem· Qt;tnbor Novom- De com bo• bo• bor~
·24'25 12'90 4'18 1' 57 1'44 0'64
5"04 21'73 21•95 U'42 11' 68 4'07
9"53 13'41 19'47 29'85 13'49 6'45 ---8'01 25· 60 21'82 14' 70 o· 13 o·ao
_!!_:_~I IG' 03 8'88 3'64 1'31 l'Hil
-

13
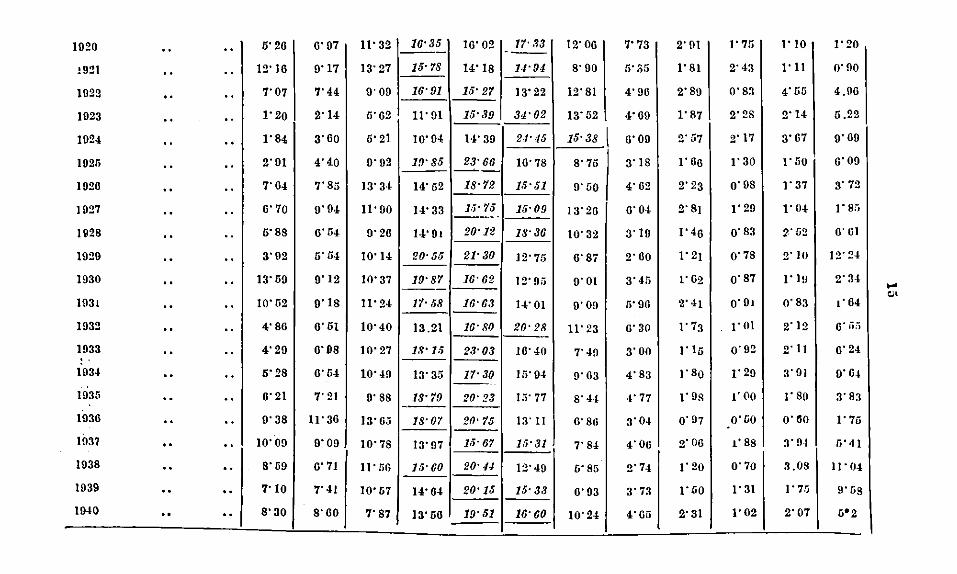
4. Small-pox-In table IV is presented the percentage mcnthly mortality from small-pox for the Province for the years 1906 to 1945. Here again the two months with the highest monthly mortnJity in order, during any year have been italicised. It w0uld appea.- fron1 an ex;<tmination of such months that mmtality from small-pox is generally acute during the three months, April, 1\I"Y and J~ne of the year. Ex:cept for the month <-f Decemoet during the ye•u 1918 which figured rather unusually in being the month of highest mctt>tlity it would appear th'l.t the months April, 1\Jay and June are generally the months of p:·onounced mortality during the period under investigation. It would also be noticeable thg,t the seasonn.l periodicity is more reguln.r in this c:1se th"'n in the cn.se cf cholera, The scn.sonal indices as given in gr.\ ph IV would seem to confirm tho conclusions arrived at above. It would appear from this graph tlvtt mortality from sm1ll-pox: rem<tined above noTinP.l (tho horizontal line representing the line of av,rage mGrtelity index:=lOO) during the five months-::\latoh, Ap!"il, :i't!a.y, Jtme and July, mortality during the remo.ining seven months being below normal. H w0uld also appeat t.:.at the 3 rocnths April, May and June are months of acute mmtality and th~t mortality is must pronounced during the month of 1\Iay, the index; being as high as 216.
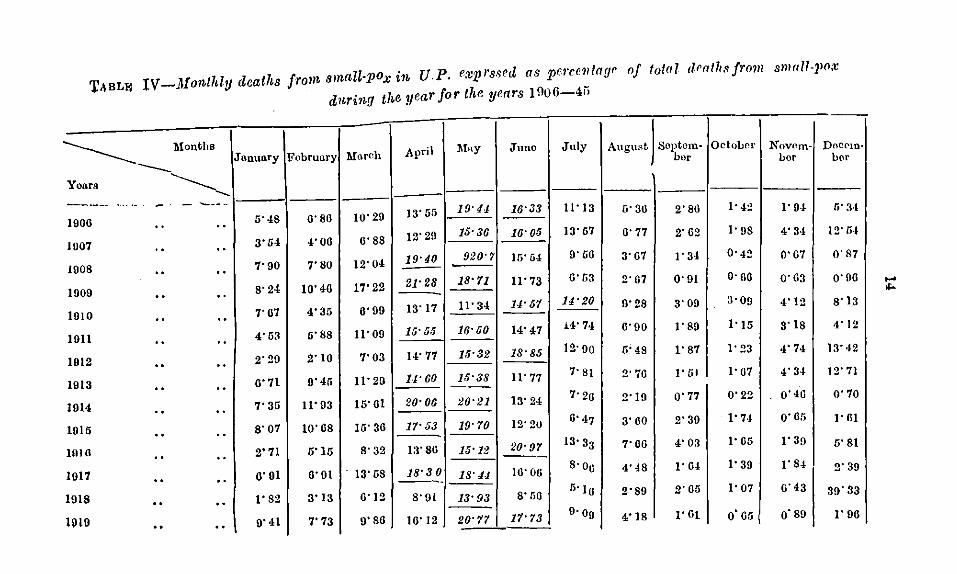
TABLW IV-lofonlhly deaths from smct!l-pox itb U.P. exprssed as pe~·ce!llage nf total death.•Jrnm smrtli-JlO;~ d1tring the yenr for the yenrs 1 !l06-4ii
Yoars
------1906
1007
1008
1909
1010
lOll
I 912
1 913
014
015
016
017
I
1
1
I
I
I
918
910
... ·-
Months
----------------- - -----
.. ..
.. "
.. ..
.. "
" .. .. "
.. "
.. .. " .. " .. .. .. .. .. .. " .. ..
Janunry February Mtlr<~h April
6'48 6'86 10'29 13'55
3'54 4'06 6'88 12'29
7'90 7'80 12'04 19'40 -8'24 10'46 17'22 21•28
7'67 4'35 6'99 13'17
4'63 6'88 11'09 15' 5/j
2'29 2'10 7'03 14'77
6'71 0'46 11' 20 U·60
7'35 11'03 16'01 20'06
8'07 10'68 16'36 1'1'53
2" 71 o'1o 8'32 13'80
6'01 6'91 · 13· us 18'3 0 ----1'82 3'13 0'12 8'91
0'41 7'73 9'80 16' 12
1\lny Juno July August Soptom· bor
OctoLor Novf'm- DocPm· bor bor
19•41 16'33 11'13 6'30 2'86 ]• 4~ 1'0-1 li' !H
15•36 16'05 13'67 6'77 2'62 1'98 4' 3·1 12' fi-t
920'7 15'04 0'66 3'67 1'34 0'42 0'67 0'87 -18'11 11' 73 6'u3 2'67 0'91 o·oo o·63 0'06
11' 34 u·o1 14•20 0'28 3'00 3·09 4'12 8'13
16•50 14'47 i'1'74 6'90 1'89 1'15 3'18 4'12
15'32 18'85 12·90 r.· 48 1'87 1'23 4' 74 13' ·12
15'38 Jl• 77 7• 81 2' 70 I' 51 I· U7 4'34 12' 71 --
20•21 13'24 7'26 2'19 o· 77 0'22 o· 4G 0'70
19'70 12'20 6'47 3'60 2'30 t·u 0'65 1' Gl
15'12 20•97 13·33 7'06 4'03 ]• 65 1'39 o'8l ---
18.41 10'00 S·o0 4'48 I' 64 J• 39 1'84 2'39
13'93 8'06 5·16 2'89 2' Gl:i 1'07 6'43 39'33
20'71 11'13 9·o0 4'18 I' Gt o·or, o·so I' 06
1020 .. .. 5'20 0" 97 II' 32 16•35 10'02 ---!921 .. .. 12'10 0'17 13'27 15•78 14'1S
1922 .. .. 7'07 7'44 9'09 16'91 15'27
1023 .. .. 1'20 2'14 5'62 II' 91 15'39
1024 .. .. J'S4 3'00 5'21 10' 04 14'39
102r. .. .. 2'01 4'40 9'92 19'85 23'66 ~-
1920 .. .. 7' 04 7'S5 13' 3·1 14'52 18•72
1027 . . .. 0'70 9'94 II' 90 14'33 1.;· 75 ---·~-
192S .. .. 5'S8 0'54 9'20 H'Ot 20•12
1029 . . .. 3'92 5'54 10'14 20·55 21•30
1930 .. .. 13'59 9'12 10'37 19'87 16• 62 ---
1031 .. .. 10'52 o· ts II' 24 1'1·58 16•63
1932 .. .. 4'80 0'51 10'40 13.21 16'80
1033 .. .. 4' 29 o·os 10'27 18'J.> 23'03
1034 .. .. 5'28 0'64 10'49 13'35 17•30 --·
1935 .. .. 0'21 7'21 0'8S 18•79 20'23 ---1036 .. .. o· 38 11.30 )3'05 18•07 20•75
1037 .. .. 10'09 9'09 10'78 13'97 15'67
1038 .. .. 8'59 0'71 11' liG 15'60 20·u
1939 .. .. 7'10 7'41 10'57 14'64 20'15
1940 .. .. 8'30 8'00 7'87 13' 56 19'51
17• .13 12' 00 7' 73 2'91 ·--
].1•91 S'90 fi'S!i I'S1
13' 22 12'Sl 4'90 2'SU
34'02 13'52 4'09 1'87
24'45 15·38 I o·oo 2'57
10'78 S'75 3'1S 1'0o
1·;·51 0'50 4'02 2'23
15•09 13' 20 0" 04 2'8t
18'36 10'32 3'10 1'40
12' 75 0'87 2'00 )'2!
12' 95 9'01 3'45 1'02
14'01 9'09 5'90 2' 41
20•28 II' 23 0'30 1'73
10'40 7' 49 3'00 I' l5
)!\'94 9'03 4'S3 I' So
1,;· 77 8'44 ·I' 77 !'OS
13' 11 o·so 3'04 0'97
1;;•31 7' S4 4'00 2'00
12'40 6'85 2'74 1'20
15·33 0'93 3'73 1' 50
16'60 10'24 4'05 2'31
]' 7fj I' 10
2'43 I'll
O'S3 4' 55
2'28 2'14
2' 17 3'07
1'30 I' 50
o·os 1'37
1'29 1'04
o·s3 2'02
0'78 2' 10
0'87 I' 1 !I
O'Ot O'S3
!' 01 2'12
0'92 2'11
1' 29 3'91
]' oo ]'so
0'00 O'M
1' 88 3'9-1
0'70 3.08
)' 31 l' 7lj
1'02 2'07
I" 20
0' 90
4.90
5.22
0'09
0'09
3' 72
I' sa
0'01
12'24
2' 34
,. 04
o· iiii
6'24
o· 0.1
3'S3
)' 75
fi ... 1
II' 04
9'58
o•2
.... '"

I 0 I Oetubor I Nuvem. -------- · Months ~ JonunryiFcbrunry Mnrch APril Mny Juno .Tu1y AugusL ~eptem- Do com-
v~nrs bur bor ber
- ---·------- ·-··
1041 6'01 6'23 10'66 20•31 18'95 13'50 0'36 5'49 2'8J 1'15 1'72 2'80 0- 0-
1042 10'63 10'00 0'51 14'31 19"19 11•19 6·oo 3' ·IS 2'30 1'67 1' 25 3"48 " 0- ---
1043 5"04 4"74 0'36 15"17 17'44 14' 74 11'17 6'33 3'04 2'00 2' 38 s·uo 0- .. --- ---
1044 s· 35 o·s6 12' oo ll' 70 ]4•35 13'89 10'64 4'04 2'47 1' 14 2"li5 8'02 0- 0- --
1945 . - 5'02 5'08 11'05 17' 51 22•18 11·68 11' 23 4'60 2'07 o·o3· 0'63 1"42 . -I __ .i,

li
5. Plague-In table V is presented the per~entage monthly mortality from plague_ for the Provinces. The two nwnths in a year with the highest percentage mortality in order have again been i talicised. It would appear from the table that mortality from plague is generally high during the three months-February, J\farch and April, mortality being most pronounced during the month of l\farcb in almost all the years. It would appear from seasonal indices presented in graph V that mortality from plague is gonornlly pronounced during the first four months of the year, the seasonal indices during these months being a.bcve the normal, viz., 100. The highest. index of 349 which is more than thrice the normal is attained dming the month of March which seems to cor.firm the conclusion arrived at previously from a study rf the mortality percentages during each year a.s presented in .Table V.

1006
1007
1008
1000
1010
lOll
1012
1013
1014
I oro
1016
1017
1018
1910
TABLE V-"llontMy deaths from pla.gne in U.P. expressed as porcentaae of total deaths from play no clnring the year for the years 1906-45
J unthU'Y ~'ubruury/ Murch
I
1\!onths April YoartJ -.........__
.. 00 0·30 13·12 23·961 23· 88
6· ·15 11•15 26·63 33·34 0 0 00 --- ---II· 00 22·60 34·62 22·04 00 00 --
00 0 0 3·48 u·o2 11·42 7·03
17·10 20· 97 27· 00 13•65 .. 0 0
00 00 13·01 !5·62 31·20 26· 71
.. 00 lo·u3 25·21 30·37 I7·72
0 0 0 0 7·30 [2·97 28·97 27·12 ---- ----
.. 00 16·08 20· 79 32·62 HI·05
.. .. 8•4! 16·40 30·66 28·67 ---.. .. I3 .46 18•!8 3hl0 II· oO
00 0 0 8·60 16·46 23·64 17·33 -0 0 0 0 23•21 26·06 27·92 16·72
0 0 .. 6•26 10· 68 36·48 23·18 ----
I 1\Iay Juno July August I S<•ptum.
ber
0.24 o· 30 0·21 0·00 1·27
18.83 2·24 0·11 o·oo 0·10
3.UU 0·30 o·u 0·17 0·41
6 .I3 o· 70 1·65 4·56 4·39
3 .OS 0· 2·! O• 13 2·57 0··!0
7.00 0·20 o·OO 0·03 0·08
3.38 0·32 o·o5 0•!7 0·44
0.10 1· -14 I·33 I·l7 O· 71
5.55 0·60 0·05 0·11 O·IU
6· 45 0.23 O·Oo 0·11 o· 33
I· 08 0.11 0·21 0· 77 0•74
6·62 1.50 0·52 1· 01 0·72
•.1:·57 0.46 O· 31 0•05 0·05
4·021 0.40 o·os 0·43 0•37
Odo· NuVt.•lll· bor hor
I
2· 24 u· so
0·21 o· 26
0·35 o·o1
·!· 67 13·29 ---0· DO 4·4I
O· 30 I· 13
O· 70 !• 81
0·08 3·32
0·27 1·25
0.58 !•02
1•08 8· 07
1·40 u·Ol
o·IO 0·25
o·zs 1•62
D oeotnbcr
15·00
0·60
37·07
I 0•80
2·65
4•80
o· 41
3•57
0·30
II· 60
!6•08
o·30
6·24
.... 00

18·01 31.311 22· 79
21·96 39· 47 14· 77
I9·87 21·10 10· 86
23·00 35·29 18·64
1920 0 .,
11· 23
!921 0 0 15·54
1922 ll·03
1923 13•47
4· 221 0·63 0·10 0·78 I· 02 O·OO !·SO 7·21
I· 60 0·10 0·02 0·10 0·23 0•26 I· 46 4·40
2·19 0•48 0·24 0•64 O· 56 J 0·85 4•81 21·37
J·H 3·38 3·17 0·48 0·05 0·13 0·23 o· 72 ---
!6•29 26·11 25· '/8 --1924 8·78 0·96 2·02 0·40 o·13 0·36 J• 02 2•52 6·57
18·12 29·91 22·81 --1025 13· 57 6·58 0•68 0·29 0•56 0·35 . 0·52 !•60 4·05
1026 8·99 16·16 26·20 25·82 15•45 2·91 0·54 o· 22 0•!2 0·36 j• 01 2·22
1027 12·02 17·19 26·09 18·39 5·48 o·r.s 0·23 o· 19 0·61 0·82 3·87 H·u3
15·93 32·19 30·04 JU28 0·69 9·10 0·83 0·29 o· 38 0·!2 O· 17 o·04 3·32
27·12 31·53 17·30 IU2D 15•07 3·33 0•27 o·o8 0'05 0·09 0·12 o·oo 1·38
14·26 27·/3 21·30
12·93 31·24 32· 61
1030 8·70
!931 S·H
8·37 I·Io 0·23 0'45 0·30 0·04 3•55 10·28 .... 0·13 1·17 "" 7·04 I· 53 0·25 o·Is 0·!2 0·13
IU32 J.l·fi3 21·01 30·50 20•53 6·63 I·3J 0·18 0'05 0·09 0·21 0·5!} 1·37
ll· 65 17· 70 16·75 1933 5·00 12·29 2•17 0·40 o·6o 0·5U 1·79 6·16 21·27 --I9·00 29·5.J 25· 04 1034 13•15 7· 2·1 I . I· 03 O· 13 0'33 0·28 o· ·12 o·06 2·88
---14·86 23·26 27·92 1035 0·25 16·69 3•2j 0·43 0"23 0·38 0·58 !·15 2·04
12·57 21·21 18·80 1036 8•06 6· 21 I· 89 0·60 J• ~I I· 89 1•82 6·18 19·44
14·48 29·71 28·.J2 1037 8·96 10·40 I·4u o·u7 Q•07 0·62 o· -12 I· 40 2·80
1038 I5·03 14·I6 25•45 24·03 6·30 I· 03 I· 06 1.91 1·2!} 0•87 !•94 6·03
10· 781 32·70! U·53
18·23 29·37 24·30
·-
1U3'J 9·40
1040 H·35
7· 36 1· oo I O·IO o· fil I 0·84 J• 02 1·40 4•25
8·24 2·38 0·56 0·08 O·H 0•25 0•56 1· fi 1
----- -·~ ·-- _, ..•.

·--~--- --..__ -
~· y January Fcbrunry March April M:ny Juno July
·--- --)941 .. . . 12·37 19·83 31·94 17•03 3·20 I· 02 0·72
]942 .. .. 8·86 15·87 31·36 25·98 0·77 I· 13 2· II
]043 .. .. II· 43 10•41 21·15 22·95 0•97 2·37 I· 06
]944 .. . . 4•28 8•43 24·19 30·19 15·70 2·10 0•84
]045 .. .. 13· 21 !6·72 29·11 21·93 8· 67 2·22 0·07
----·------····------ ..__ .. ___ --·--
S''Ptf'm-August. bor Octo-
bor
0·64 0·57 0·99
O·OI O· 23 0·47
0•04 I· 00 0•98
0·37 0·62 I· 09
0•27 0·20 0·46
-
Novem-bt'r
2·50
0·99
!•40
3•70
]• 31
D(C('ffi
bor
0·19
3·22
3•65
7• 71
4•!!4
"' 0

21
6. The seasonal indices for three diseases are assembled in tabl6 VI. It is clear that our seasonalindices, being based on the mortality la.ta fc·r Lhe Province as a whole, have their own PI acticd limitations ;n that they would give rougbly, on a broad basis, an idea oft he sc•~sonal distribution fer the pro.,-ince as a whcle. As it is known that such seasonal distributions differ from distlict to district it m~. y ho useful if detailed study be made by calculating on enctly similar lilies seas(Jnal indices separately fer each district, l!t lenbt for tho districts of high mortality. TABLE VI-Adjusted values of ·•easonal indices of m{)rtality (normal
=1 00) from cholera, smallpcx and plague fo1' the Fnit<d Prot'inrea based on data over the pPriod 1906-45
--·-January
Februuty
:'If arch
April
May
June
July
August
September
October
November
December
-Diseas('
:!\Ion th Cholera Smallpox
··- -.. .. 10
I 7S
.. .. 8 S.i
20 127 ' .. .. ' I .. .. 100 190 I
0 141 216
.. I 174 192
151 liS
I'76 53
169 ·--" 140 16
81 26
30 71
(d) Zones of High, NormalJand Low Mortality
-- """-... -
Plnguo
134
210
349
~64
00
14
r,
0
7
9
20
83
Before we proceed to classify the districts of the Province into the three main zones of high, normal and low mortality in respect of "ach of the diseases the statistical technique utilized in this conn-.,ction may be briefly explained as under.
2. The mean mortality rates for each of the districts in respect of a disease have been first worked out by dh·iding the sum total of the mortality rates (deaths por thousand of population ) for tho districts over the 40 yoars 1906-45 under examination by 40. We next proceed to measure the variation in mortality from year to year over tho 40 years for a district by subtracting from the sum of the squares of the mortality rates for the 40 years for the district the square oft he sum total of the mortality over the period divided by the number of years

22
which in this cas'~ is 40. The figure so obtained is ne:s:t divided by the number of years minus one (in this case 39) and the square root of the figures thus obtained known in statistical lc,nguage as Standard deviation· represents our index of variation for each district in respect of a disease. ·we next obtain a normal range of th3 mean mortality rates for each of thA districts in respect of a disease (see appendix) based on the m >rtalit.y rates over the 40 years for all the districts such that a district with its mean mortality less than the upper limit and higher than the lower limit of the range may for all practical purposes b·3 called a district of normal mean mortality. A district with a mean mortality higher than the upper limit of the range may be called a district of high mean mortality : convPrsely a district with mean mortality lower than the lower limit of the range may be termed a district oflow mean mortality. Border districts whh mean mortality rates equal to the upper or lower limit of the range of normal mortality may for all practical purposes be called districts of normal mean mortal'ty. This has been illustrated in respect of each of the diseases by m9ans of dot·diagrams.
3. In the dot·diagram the mean mortality rates for the districts· in respect of each of the diseases, are represented by blue dots and measured along the vertical sca.le (y-e,xis)the districtsbeingrepresented horizontally on the x-axis. The blue horizontal lines enclose a space of normal mean mortality for the districts for a disease, such that a district with its corresponding blue dot falling w:thin the enclosed space represents a district of normal mean mortality. The blue dots lying outsid" tho boundary lims and above the upper line repre&9nt districts ~ith high mean mortalit.y and those lying below th9 lower boundary ll!l·? repreS''llt districts of low mean mortality. Districts for which the corresponding bJu.o dots lie on the border ofthe boundary lines may be called border districts and as said above have been included amogst districts of normal m?an mortality.
4. The procedure for classifving the districts in respect of standard deviation is exactly similar to· that adopted for mean mortality. A range has likewise been obtaJ!ed in respect of a district for standard deviation (m"thod explained in appendix) which may be considered as normal range of variation for all the districts for the disco.se. On similar reasoning a district with a standard deviation higher than the upper value of the range may be called a district of high variation, a district with standard deviation lower than the upper value of the range and higher than the lower value of the range may be called a district of normal variation and finally a district with a standard deviation lower than the lower limit of the range may be called on t,he whole a district of low variation. This has similarly been represented O'raphically by red dots in the dot·diagram for mean mortality and ~!so separately in respect of each of the diseases. Hera again standard deviations for the districts are shown by red dots and measured on the same vertical scale. The red horizontal lines likewise enclosed

23
a space of normal variation. A district for which tho corresponding red dot lins within the space enclosed by the red lines n·presPnts a. district ofnorm»l variation. If, however, the red dot liesoutsid,· nnd above the upper horizontal red line the corresponding district will bo one of high variation and conve1·sely a district with its red dot lying below the lower value of the range, i.e. be low t h•J lower line repros< nts a district of low variation.
5. We thus have finally from statistical comiderations the follow-ing main divisions of dist1icts of mean mortality;
(1) hlgh mortality districts; (2) average mortality districts; (3) low mortality districts;
with the following classifications of districts in 1·espect of variation within each such main division of districts ;
(1) high variation districts; (2) normal vadation districts; (3) low variation districts;
with ultimately nine combination of divisions of districts. 6. We next study in respect of each of the diseas~s special fea
tures, if any, of the districts lying within each such group from a consideration of the number of the years of high and low mortality over the period (date available in the annual reports of the department of Public Health, Unitrd Provinces). R<'m<·mbering that an < piclemic area is characterised by occasional and distinct sudden pc•aks the intection being probably brought in from outside we should generally expect a. district with high mBan mortn.lit.y (sometimes normal mean mortality) and high variation an epidemic district;, If, however, in a district with high mean mortality the variation be low it would generally follow that high mortality was more or k·ss a regular feature in the district leading to low variation from year to year. Such a district where annual mortality generally remains high may be t&rm9d epidemic the diseas0 being more or kss localisad.
~
7. Cholera-In dot-diagram 1 is presented the mean mortality by blue dots, in dot-diagram 2 the standard deviation by red dots and in dot-diagram 3 both the maan mortality and stand~trd deviation by blue and red dots respactivly for each district of the Province. It would appear from dot-diagram I and from what Explained above that uhe following are the districts of high average and low mean mortality :
(i) High mean mortality district8-Pilibhit, Hamirpur, Banda, Mirzapur, Jaunpur, Ghazipur, Ballia, Gorakhpur, Basti, Azamgarh, Garhwal, Sitapur, Kheri, F&izabad, Gonda, Bahraich, Sultanpur, Pratapgarh: ·
(ii) A. verage or normal-mean mortality districts.-Barcilly, Shahjahanpur, Allahabad, Jhansi, Jalaun, Banaras, Xaini Tal, Almora, Lucknow, Rae Bareli, Hardoi and Bara Banki.

(iii) Low-mean mortality districts.-Dchra Dun, Sabaranpur, 1\{uzaffarnagar, 1\feerut, Bulandsbahr, Aligarb, Mathura, Agra, Mainpuri, Etah, Bijnor, Budaun, Moradabad, Etawah, Farrukhabad, Kanpur, Fatehpur and Unnac.
8. We now proceed to sub-divide the districts within each group nto districts of high, normal and low variation with the help of
dot-diagrams 2 2.nd 3 and on the basis of the method explained above-
(i) High mean mortality districts :-(a) Districts of high va.riation:-Pilibhit, Banda, Jaunpur,
Garhwal, Sitapur, Kheri, Gonda, Bahraich, Sultanpur, and Pratapgarh.
(b) Districts of normal variation:-Hamirpur, 1\Iirzapur, Gbazipur, Ballia, Gorakhpur, Basti, Azamgarh and Faizabad.
(c) Districts of low variation.-Kil. (ii) Average or normal mean mortality districts :
(a) Districts of high variation-Jhansi, Almora and Bara Banki.
(b) Districts of normal variation-Bareilly, Shahjahanpur> Jalaun, Naini Tal and Rae Bareli.
(c) Districts of low variation :-Allahabad, Bt nan s, Lucknow and . Hardoi.
(iii) Low-mean mortality districts :-(a) Districts of high variation :-Unnao. (b) Districts of normal variation :-Budaun. (c) Districts of low variation :-Debra Dun, Saharanpur,
1\{uzaffarnagar, Meerut, Bulandshahr, Aligarh, Matbura, Agra, Mainpuri, Etah, Bijnor, Jlloradabad, Farrukhabad, Etawah, Kanpur and Fatehpur.
9. It would be seen that on the statistical basis. of mean mortality and standard de·dation, the districts Pilibhit, Banda, Jaunpur, Garhwal, Sitapur, Kheri, Gonda, Bahraich, Sultanpur and Pratapgarh with high mean mortality and high variation may be called epidemic districts as defined above, there being technically no epidemic districts (i.e. districts with high mean mortality and low variation) fro 1 cholera in the Province. We next proceed to study special features, if any, during any year from an examination of the distribution of annual mortality rates (over the period 1906-45) of high and low mortality for the districts within each sub-group arrived at above from statistical considerations.
10. In the Pilibhit district mortality was high (being above normal) during eight years and normal during four years, the years of high mortality being more frequent during the beginning of the period 1906-45. The remaining 28 years of the period witnessed lew and sometimes no mortality. Ofthe 8 years of high mortality the si:s:years were 1906, 1908, 19.J.l, 1915, 1921. and 1929 which were

25
also epidemic years for the proYince as a wht•lo. Banda witm·ssrd 13 _years of high morta!it.y and 4 y<'ars of normal mortality. Thr years of pronounced mortality were 1906, 1910, 1924 and 1938. In tho Jaunpur district th<·re were 9 years of high mortality and 8 yrars of normal m )rta!ity, the year in which mortality was last high bdng 1945. In both the districts of Garhwal and Sitapur th<·re were 10 ytars of high mortality· there being 7 and 4 years of normal mor· tality respectively. In the district of Garhwal mortality wns last high during 1927 there being a noticeable decline thPreaftor nnd from this vi<Jw point although the district on tho whole b<·hayed ns a district of high mortality tho low mortality rates since 1928 seem to indicaiu the behaviour of the district as a normal area during recent yrars. Khori had 11 years of high mortality tho years buing more or less uniformly spaced over the pericd. Th" eastern districts of Bahrakh and Sultanpur witnessed each 15 years of high mortality and 4 :r•·ars of normal mortality, mortality bdng ncnst pronounced during tho first half of the period. Gonda and Prata pgmh hnd respedin ly 17 and 16 yEar·s of high mortality there being only one yt·arofnormal mortality at Gonda and 3 years of normal mortality at Pmtargat'h. In as much as epidemic years are characterised by oeeasional and district peaks· the eastern districts of Gonda, Bahraich, Sultanpm and Pratapgarh behaved as epidemic districts.
11. Coming to the districts of high mortality with normal Y>niation wa notice that of the dght districts in this group high mortality is morefrequ~nt in the districts of Mirza pur, Bai!ia, Gcrakhpur, Basti and Faizabad, mortality in the l\Iirzapnr district b<,ing high during 16 years and normal during 8 years. There were 17 y<•ars of high mortality and 6 years of normal mortalit.y in Ballia district : in Basti mortality was high during 19 years and normal during two years. Gorakhpur district, howevn, witnessed 20 years of high mortality and 5 years of normal mortality. In Fe, iza bad district, mortality was high iluriog 16 years and normal during 5 years. It would thus be seen that all the four districts Ballia, Gorakhpur, Basti and F:-.i zabad are conspicuous by years of high mortality, t.he districtsofGorakhpur, Bai!ia and Basti behaving as acute epidemic districts. Tho districts of JI>Iirzapur and Fr"izabad resemble the districts of Gorakhpur, Bai!ia, and Basti in as much as mortality in those districts remained abovo normal for a large number of years. Hamirpur and Ghazipur witnessed each 12 and 11 years of high mortality respectively, mortality remaining normal in these districts for 6 and 12 y<'ars respectively.
12. Amongst the districts of average mortality with high variation the number of years of high mortality is maximum in the Bara Banki ilistrict boing 12 years and considering the distribution of the annual mortality rates it can be classed as an epidemic district. Although av6rage mortality in Almora is normal, examination of the individual rate of mortality reveal that mortality in this district remained sub-normal after 1927 except during 1938 when it beer me high. JhanBj witnessed 8 years of high mortality and 6 years of normal mortality.

26
13. C'vn>idcr now the· awiaf,e mot·tality <;istrids with norn:al variat i<•n. Rae Bareli witnes"d 14 years of high mortality and 5 years of normal mortality. In the disti-ids of Jalaun and Kaini Tal there wt·re 7 y<'ars of high mmta.!ity, the latter distri< t >h< wins a definite dedine after 1921 the year 1938 bting the only exc~ptwn of high mortality then·after. There is nothing sp<·cial to r< puit abvut other districts in the group.
14. Amongst the a•erage mortality dish·iets with low variatkn, Banar:,.s witn<·ssed 14 y<·ars cf high mortality, the mortality years being more or less uniformly distributed vnr the peri< d and in this respect s<,emed to bt•haw as an f'pidemic district. Allahabad witnessed 10 years of high mortality and 7 years of nmmalmurtality. Although Ludmow has been classed as an average mortality district, mortality in the dist.rict showed a definite decline after 1918 the year 19391Jeing the only year of high mortality after that date. Hardoi witnessed 6 years of high mortality and 7 yearsofnormalmortality.
15. Coming finally to the low mortality districts, Unnao witnessed 5 years of high mortality, the last yE-ar of high mortality being 1924. There WPre only 3 years of high mortality in Budaun dist.t·ict, mortality in this district being last high during the epidemic year 1921. In the western districts of 1:iaharanpur, Meerut, l\Iathura, Ag1a andEtah there was not a single year of high mortality, and only one year ofnmmal mortality in the first 3 districts. The districts of l\Iuzaffarnagar, !IIainpuri and Farmkhabad witnessed each a year of high mortality there being only one year of normal mortality in the l\fuzaffarnagar district, no year of normal mortality in the l\fainpuri district, and 4 years of normal mortality in the Farrukhabad district. There were only 2 yea1·s of high mortality in the districts of Debra Dun, Bulandshahr, Aligm·h and Eta wah. Bijnor, l\Ioradabad and Fatehpureaeh witnessed 5 years of high mortality. Mortality rates in the Bijnor and J';Ioradabad districts were last high during the epidemic year 1921, there being no year of high mortality thereafter. Mortality was last high at Fatehpur during 1942. There were only 3 years of high mortality at Kanpur, martality being last high during 1919.
16. Small-pox.-The moan mortality and the standard deviation for each district have been presented separately in dot-diagrams 4 and 5 r~speetivelyand in dot-diagram 6 both the mean mortality and standP.rd deviations have been prEsented together. Here again the blue dots represents mean mortality rates and red dots standard deviations for the districts. We n.ow classify as under the districts of high, normal and low mean mortality as would appear from the dot-diagram 4:
(i) High mean mortalitydistricts.-Bijnor,Budinn, JIIoradabad Allahabad: l\Iirzapur, Jaunpur, Ghazipur, Gorakhpur, Azamgarh: Rae Bareli, Sultan pur, and Pratapgarh.
(ii) Average or normal mean mo-rtality districts.-Saharanpur, Meerut, Bulandshahr, Aligarh, l\Iathura, Agra, l\Iainpuri, Etah,
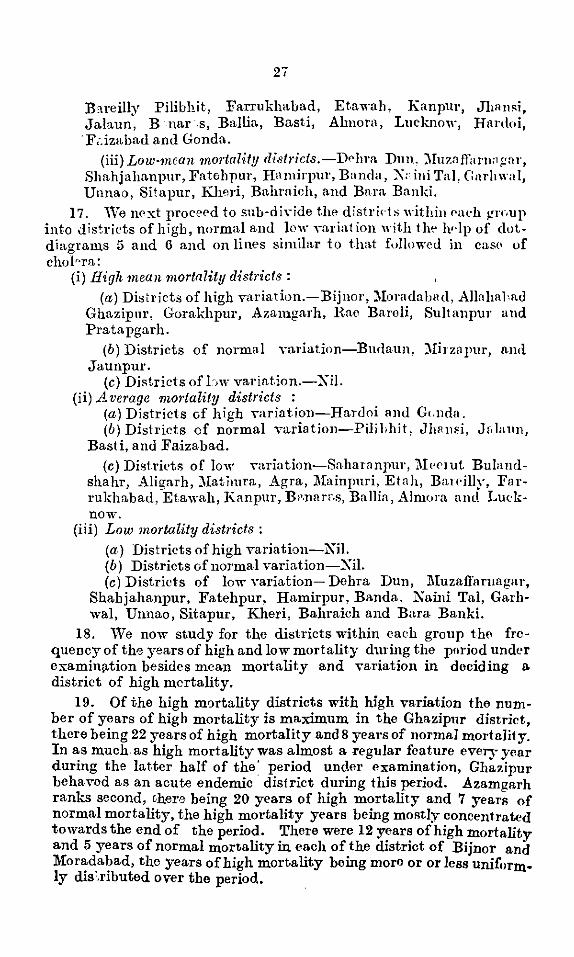
27
B~reilly Pilibhit, Farrukhabad, Etawah, Kanpur, JlH1nRi, Jalaun, B nar s, Ballin., Basti, Almora, Lucknow, H•1rdoi, 'Fdzabad and Gonda.
(iii) Low-mean mortality d·istricts.-Ddmt Dun. )[uznffarnn).'ar, Shahjahanpur, Fatehpur, Hamirpur, Banda,::'\:· ini Tal, C:nrhwal, Unnao, Sitapur, Khe.ri, Bahraich, and Bara Banld.
17. 'Ve next proc?cd to sub-d ;,-ide the distrid' within Paeh ).'rr.up into districts of high, normal and lew ·mriat ion with tlw h•·lp of dotdiagrams 5 and 6 and onlin<>s similar to that fullowed in caso of chol"ra:
(i) High mean mortality districts : (a) Districts of high variadon.-Bijnor, Moradahnd, Allahnl•nd
Ghnzipur, Gorakhpur, Aza.mgarh, Rae Baroli, Sultanpur and Pra. ta. pga.rh.
(b) Districts of normal nuia.tion-Budaun, )lirza pur, and Jaunpur.
(c) Districts of bw variat.ion.-Kil. (ii) Average mortality districts :
(a) Districts vf high -.ariat.ion-Ha.rdoi and G<.nda. (b) Districts of normal -.ariation-Pilihhit, Jlwmi, Jlila11n,
Ba.sti, and Faizabad. (c) Districts of low -.nriation-Saharanpur, l\l,·erut Buland
shahr, Alignrh, )latimra, Agra, 1\Iainpuri, Etah, Bn1Pilly, Farrukhabad, Etawah, Kanpur, BP.narr.s, Ballin, Almora and LuekUO\V.
(iii) Low mortality districts : (a) Districts of high variation-Kil. (b) Districts of normal variation-Kil. (c) Districts of low Yariation- Dobra Dun, l'IIuzaffarnagar,
Shabjahanpur, Fatehpur, Hamirpur, Banda. Kaini Tal, Garhwal, Unnao, Sitapur, Kheri, Bahraich and Bara Banki.
18. We now study for the districts within eaeh group tb!l frequency of th-3 years of high and low mortality during the poriod under examin~ttion besides mean mortality and variation in deciding a district of high mortality.
19. Of the high mortality districts with high variation the number of years of high mortality is maximum in the Ghazipur district, there being 22 years of high mortality and 8 years of normal mortality. In as much as high mortality was almost a regular feature every- year during the latter half of the· period under Axamination, Ghazipur behaved as an acute endemic district during this period. .Azamgarh ranks second, there being 20 years of high mortality and 7 years of normal mortality, the high mortality years being mostly concentrated towards the end of the period. There were 12 years of high mortality and 5 years of normal mortality in each of the district of Bijnor and Mor~d.ai_Jad, the years of high mortality being moro or or less unifimnly drs ,nbuted over the period.

28
20. In the Gorakhpur district there were 12 years of high mortality and 10 years of normal mortality, the years of high mortality boing 'more concentrated towards the latter half of the period. In the Allahabad district mortality is almost uniformly spaced over the period, there being 9 years of high mortality and 15 years of normal mortality. In the Rae Bareli and Sultanpur districts, mortality was most pronounced during the 3 years 1906-08 of the period under examination, lortality during 1908 being as high as 3 and 5 per thousand of population respectively, the year 1908 being the most acute epidemic year for the province as a whole. Although mean mortality r~t tos in these districts are high, it would be seen that except for the Jhst 3 years of the period under examination which has considerably pushed up the general average, the remaining years are practically conspicuous by the absence of mortality in the Rae Ba1·eli district and by normal mortality in the Sultanpur district. It would bo seen from the dot-diagram that the Pratapgarh district has a high mean mortality and a very high variation. A study of the individual figures reveal that there are only 4 years of high mortality and 7 years of normal mortality in the district and that mortality was most pronounced during the years 1907 and 1908 respectively, mortality rate during the latter year reaching as high as 5·79 per thousand, which was the highest rate attained amongst the districts of the Province. Except, therefore, for the years of high mortality in the beginning of the period, the district of Pratapgarh behaved as a low mortality district. • ·•
~-21. Amongst the districts of high mortality with normal varia:-
tion, there are 12 years of high mortality and 7 years of normal mortality in the Budaun district. In the Mirza pur and Jaunpur districts of the Banaras division, there are 11 and 12 years of high mortality, 9 and 14 years of average mortality respectively. The individual figures further reveal that the years of high mortality are mostly concentrated in the latter part of the period under examination.
. - ---~-::.;.... •. ---22. Amongst the average mortality districts, the eastern dib':
tricts of Hardoi and Gonda have high variation as would appear from dot-diagram 4, there being 6 and 4 years of high mortality respectively in these districts. The years of high mortality in the districts also include the 3 epidemic years 1906-08. It would thus be seen that excluding the high epidemic years in the beginning of the period under examination the districts during the remaining period behaved as low mortality districts.
23. It would further appear from dot-diagram 4 that. amongst t.h:' average mortality districts the districts of Pilibhit, Jhansi, Jalaun Basti and Faizabad lie within the normal range of variation. Of the~ the Jhansiand Faizabaddistrictshave 11 and 12 yearsofhighmortality .and 4 and 5 years respectively of normal mortality. In as much as ·the years of high mortality are almost uniformly distributed over the _ P?rio_d, the districts of Jhan;rl and ~aizabad _behave as epidemic d1stncts although mean mortality rates m these district are normal.

29
2-!. There were 6 y~ars of high mortality in the Pilihhit. disllkt and 4 years of high mortality in the Jalaun district the districts be~avin~ more or less as pandemic areas, the years of l~gh mortality b?I.ng :Wid_ely_ spaced over the period under study. In the case of the Pilibhi~ diSt;nct, the years of significantly high mortality coincid<'d with the epidemic years for the Pronnce, viz., 1908, 1930 and 1945 and those for the Jalaun district the years of high mo1·tality were 1906, 1930 and 1945.
25. Of the 9 years of high mortality in the Basti district two years coincided with the epidemic years 1907 and 1908 for the Proyince, the remaining years of high mortality being mostly concentrated In the last decade 1936-45.
26. Amongst the average mortality districts with low variation, years of high mortality are more frequent in the B!tnaras and Ballia districts, there being 14 years of high mortality in these districts. ~here were 5 years of high mortality and 8 years of normal mortality m the Saharanpur district. An examination of the annual mortality rates reveals that the years of high mortality are mostly concentrated in the latter half of the period under examination. In tho Aligarh and J.ucknow districts there were 11 yee,rs of high mortality and 6 years of normal mortality. Farrukhabad and Etawah distriets each had 8 years of high mortality, the years 1926, 1930, 1935 and 1945 being high mortality years for both the districts. The districts of :r.Iee1ut and Bulandshahr witnessed each 8 years of high mortality, the years 1925, 1929. 1930, 1935, 1939 and 1944 being years of high mortality districts, there being no high mortality years prior to 1925. It would appear from above that there is a cyclical tendency of high mortality with a cycle of 4 or 5 years in these districts and working on this basis the future occurrence of high mortality may be during 1948 or 1949. Agra witnessed 10 years of high mortality. Mainpuri and Etah each 7 years of high mortality. There were 5,years of high mortality and 8 years of normal mortality in the Bareilly district. In the Mathura and Kanpur districts there were 4 years of high mortality. There were 6 years of high mortality and 4 years of normal mortality in the Almora district.
27. Amongst the low mortality districts with low variation mortality at Garhwal was throughout low, there being not a single year o'r high mortality in the district. Mortality at Unnao was high only during 1914, and low during remaining.period: Sitapur witnessed b~gh mortality during 1940, normal mortality durmg 5 years, the rema.ming peried being years of low mortality. There. were two years of h!gh mortality in the Bahraich district and 9 year3 of average mortality. Dahra Dun, Hamirpur, Banda and Bara Bank witnsessed each 3 years of high mortality. In the Bara. Banki district, the years 1908, 1914 and 1945 were years of high mortality, and the years 1906 and 1907 were years of normal mortality, the remaining ~riod being. characterised by low mortality. There were 4 years of h1gh mortality each in the Muzaffarnagar and Kheri districts;· Although Naini Tal had 6
30
years of high mortality, mortality during the remaining period was consistently low there being only 2 years of average mortality. Shahjahanpur and Fatehpur witnessed each 5 years of high mortality the remaining period being conspicuous by low mortality.
28. Plague.-As usual the mean mortality rates for the districts have been shown by blue dots in dot-diagram 7, the standard devia- · tion by red dots in dot-diagram 8 and in dot-diagram 9 both these have been presented together. The districts of high, normal and low mortality as obtained from dot-diagram 7 are classified as under;
(i) High mortality districts.-Saharanpur, :Muzaffarnagar, Meerut, Jaunpur, Ghazipur, Ballia, Azamgarh and Unnao.
(ii) Normal mortality districts.-Bulandshahr, Aligarh, :Mathura, Agra, l\Iainpuri, Etah, Bareilly, Bijnor, Budaun, :Moradabad, Pilibhit, Farrukhabad, Etawah, Kanpur, Fatehpur, Allahabad, Banaras, ~Iirzapur, Gorakhpur, Basti, Lucknow, Rae Bareli, Sitapur, Hardoi, Faizabad, Sultanpur and Bara Banki.
(iii) Low mortality districts.-Dehra Dun, Shahjahanpur, Jhansi, Jalaun, 1\Iainpuri, Banda, Naini Tal, Almora, Garhwal, Kheri, Gonda, Bahraich and Pratapgarh.
29. Tho districts within each group are now further divided into districts of high, normal and low variation, with the help of dot. diagrams 8 and 9, th(\ division being exactly on the lines discussed under cholera and small-pox :
(i) High mortality districts :
(a) Districts of high variation.--Saharanpur, :Muzaffarnagar :Meerut, Ghazipur, Ballia and Azamgarh.
(b) Districts of normal variation-Jaunpur, Unnao. I c) Districts of low variation-Nil.
(ii) Normal mortality districts : . (a) Didtricta of high variation-Nil. (b) Districts of normal variation-Bulandshahr; 11Iathura,
Bijnor, Budaun, Moradabad, Kanpur, Lucknow ar.d Bara Banki. ·
\c)_ Districts of lowvariation-Aligarh, Agra, Mainpuri,Etah• B~rmlly, Farrukhabad, Eta wah, Fatehpur,[Allahabad, J3anarr.s. 111't:zapur, Gorakhpur, Basti, Rae Bareli, Sitapur, Hardoi, Fatzabad and Sult:mpur.
\iiij Low mortality districts :
(a) Districts of high variation-Nil. tb) Districts of normal variation-· Nil.
(c) ~iatriots of low variation-Debra Dun, Sbabjahanpur, Jhan~t, Jalaun, Hamirpur, Banda, Naini Tal, Almora, Garhwal,. Khen, Gonda, Bahraich and Pratapgarb:

31
30. We now proceed to study details about the districts within each grcup. In the high mortality districts with hi<;h varia.tior; Ghazipur and BaHia witnessed each 23 years of high mc.rtality, tl,ere being 25 years of high mortality in the district of Azan,gnl'lt. A fltudy of the individual years of mortality would further show that during the period 1906-31, the distric•o of Ghazipur, Balha nnd Azamgarh behaved as endemic areas in as much as high mortality was a regular feature in these districts dur·r.g the pnicd. :Mortalit-y thereafter declined and becair.e less frequent. There were 10 years {)fhigh mortality and 13 years of normal mortality in the Saharan pur District, 13 years of high mortality and 8 years of normal n,orta.lity in the :i\Iuzaff.ornagar District. Although mean n'ortality in the dis· trict of 1\!eerut was high, there were only 10 years of high mortality, b<>ing last high. during 1926.
31. Air.ongst the high mortality districts of normul vo riatior· there were 16 years of high mortulity in the Jaunpur District o.nd 13 years of high mcrtality in the Unnac· District. it i~ intorcstiPg to note that mortality in Unnao was last high during 1926 and there was practically no mortality after 1929. Althcugh mean mortality ir Unna.o District was high, the general situaticn is satisfactory in aR much there was practically no me rtality r.fter 19211.
32. In the average mortality districts of normal variation, Ir.or· tality was last high at Bular.dshahr Br:d 1\[r.t}-.ura durirg 1926, tJJC period 1906-26 being mostly year. of high mortality. In the districts of Bijnor, Budaun and l't!oradabad, the last epid€mic occurred during 1934 followed by vractically the absence of Ir.ortality thereafter. ·In the district of Kanpur there were 10 years of high mortality, 9 years of normal mortality, motrality l eing last higi:J during 1924, followed by a steep decline in mcrta lity. Amongst the ncrmal mortality districts oi Lucknow and Bara Banki, there we1·e 8 and 10 years of high mortality respectively in these di&tricts, mortality; being la.st high in the Lucknow District durirg 1918 and in the Bara Banl<i District during 1928.
33. Coming to normal mortality districts c-f low variation we noticetha t tnere wt-re 5 years of high mortality in the Aligarh District, the last enidemio worthy of record being during 1925. Except for anothEr 5 years during which mortality remained norn!al, Ir.ortality during the remaining pericd remained below normal and mcstly nE>gligible. In the Agra District there were 4 years of high mortality, the year 1926 being last year of occurrence of the epid<:mic. During the rest of the period mortaliLy was mostly negligible and in this respect the dist-rict behaved as a low mortality district although mean mortality over the period under examination remained normal. In the MainPuri Dis~rict, mortality remained b igb during the year 1910, 1911 and 1918. Except for another 6 years during which mor· ~ality remained normal, mortality durin!' the rest of the neriod was .almcst negligible. In district Etab, mortality during 4 years crossed the uPner boundary of the normal range for mortality, the year 1934 being the last epidemic year for the district. During another 6 years
32
morte.!ity remained normal, mc.rtality duriP.g the rest of the pericd remaining below norma.!, e.lthcugb, on the whole, the district behaved as a. normal district. In the Be.reilly and I ilibi1it Districts there were only 3 years of high mortdity, marblity being mostly negliginle after 1928, which was the Ia. st. year of high mcrtality for the discric .• In the Farrukho.bad, Eta wah andAllahe.l:ad Districts, tl10 le.~t epidemic year was 1918, there being utactically 110 mr rta lit y therea ft.er. There were 6 year& of high w.crtality in the Fant.kl1abe rl H d Fatehpur Districts and 5 and 7 years cf high mGrt:dity respectively in the districts of Eta wah ar:.d AllaJ,abad. B1'naras witnessed 6 yea.rs 0i high mortalit.y and 16 years of nonnal mort.a lity. TJ·£re wne cp.Jy 4 ye~ rs of high mortality in the Mirza pur District, mortality being last high during 1918. The east<>rn districts of Gorakhpur and Basti witneosed e~ch 14 and 10 years of high mortality, mortality during the rew.aining period being mostly normal. In as much as these r.re districts of normal mean mortality with occasional sudden peaks of high mortality, the districts of Gorakhpnr and Basti may be regarded as important epidemic areas. In the easten1 districts of Rae Bareli, Sitapur, Hardoi and Sultan pur mortality was last high during the epidemic year of 1918. There were 7 years of high mortality a.t Rae Bareli atod 6 years of high mortality at Hard.oi. There were only 3 and 4 yee.rs of high mortality in the Sitapur and Sultanpur Districts but on tl1e whole tbe districts behaved as areas of nonnal mortality.
34. Amongst the low mortality districts, w.ort2Jity at .Almolr> and Garhwa 1 remained consistently. belcw nonr.al throughout 1 he period under examination, there being practically no n:ortv.lity in these districts, except for a few years cf · low mortality. l\Iorta.lity at Ha.mirpur was norw.a.l only during 1924. there being practically no mortality during the rest of the period. Banda resembled Haw.irpur, the only year of pronounced mortality in the district beiP.g 1923. At Dehra Dun, the years 19ll and 1912 were years of norw.a,l mot"tr~lity, the rema.iP.ing years being almost free from. mortality. ThNe is nothing speci:tl to report about other districts in this grcup.

33
COXClX::liOX
Attempt h!ts been made in this chapter to sum.u:ariRI'l in brief tl1o sot lien~ points discussed· in the foregoing chapters and suggeRt w!Jf'reever practicable means for fighti.ug the diseases in the epiden:ic diP-tricts. ·
2. It may oe mentioned he1·e that nothing has been said il~ tho foregoing p!tges regarding cyclical tendencies in these diseas<'R, us investigation bas shown th[>,t there was no such marked cyclieal t<'ndency for the province during the period under investigation in rt•Rp<'et of the diseases. It has already been seen in the case of plague that during recent years, there wr.s practically no mortality in the province except in the districts of the B!tnaras and Gcrakhpur Divi"ions. This has evidently disturbed the cyclical tendency of znortality pattern in the province. It may, however, be useful to study tho cyeliml behaviour in respect of the districts of high mortality in tho Gorakhpur and Banaras Divisions.
3. Although no m'l.rked cyclical tendency is visible in tho case of small-pox, it h"'s bean mughly estimated from a study of tho peaks of annual nwrta!ity that there is an average five-yearly periodicity in the provincial nwrtv.lity rates, tb,e last epidemic year bcir.g 1945. Working on this basis it may be fore casted that the year 1!150 n~ay in all probability be an epidemic year for the province A some· what detailed study revealed that tho years 1950-51 Hre the prcobablo years Gf future epidemic for the Province.
4. As regards chc.lem there was unifcnnly a 3-year epidemio cycle till 1930 and thereafter tht' pattern se£>w.s to h•we changed. '!he years 1930, 1938 and 1945 were high epidemic years for the provinc£>. Although the three years cf high epidcznic are not sufficient to forPcast the advent of an epidemic, it may be roughly said within the limitations of the data that the future epidemic is likely to occur during the period 1052-53. We now proceed to deal with the disoases separately.
5. Cholera-It would be seen from the foregoing chapter that men-tality from cholera fc~ the Province showed a real decline with years, m01-tality being gonorally acute during tho first 20 years of the period 1906--45. lhe decline in provincial nWiiality appearb to be due to the d1ive of the Pul-Jic Health Department during recent yenrs for imnroved sanitation and better medical facilities in the districts of the Province. 'lb.e dismtso took a hoavy toll oflife in the Province during the two yeftt's 1906 and 1921 when the provincial mortality rates reached as high a fgure as 3·14 and :J<JO per thousand of populatit·n respectively. '!he epidcn'.ic "'"'"" durir.g these years touched even the districts of Bijnor, 11Iorada1ad and Shohjahanpur wHch remeined practically immune from n:crtP.lity during the rest of the period. The westGm •Jistricts vf Dehra Dun, Sah'l.mnpur, l\Iuzaflarnagnr, :lreerut, Buhmdsho.hr, Alignh, Mdhura,

Agra, l't!ainnuri ar>d Etah behaved as low mortality districts ar.d fronl this point of view, these districts may be regarded as safe areas.
6. It would appear from the results {f the analysis that mor· tality from cholera is f1·equent and most pronounced in the eastern districts of Gorakhpur, Basti, Faizabad, Gonda, Bahraich, Sul+anpur and Pratapgarh, the centrally situated districts of the Province be· hwing more or less as normal mortality districts. tl:o sum up, the western districts are areas of low mortality, the cencra.lly situated districts are areas of normal mortality, &nd the eastem and the far eastern districts are arez.s of high mortality.
7. It appears from what has been discussed in the foregdng p~ges that the districts of :i\firzapur, Ballia, Gorakhpur, Basti and F<·.izahad behave more or less as acute epidemic centres in as much as these are districts of high meanmortality2,nd normal variation. '!he district ofGunda with high mean mortality and high variaticn behaved as an acute epidemic district and the annual mortality rates for the district revealed tbt in a maJority of the years, morta.litywas highly pronounced in the dis' rict. It would be seen that the d.istricts d high mortality are generally economically backward and suffer mostly from poor sanitaticn. It is st:ggested that measures to combat the disease should i.Je permanently enforced in these acute epidemic area E
of the Province, measures including provision for 'Protected w~tter supnly, suitable disposal of nights;)il, rubbish and proper control over food and drink on the lines recommended by the Bhor Corr.ndttee, Immunisation of the people by anti-cholera inoculation for concrol· Jir,g the spread of the disease during specific outbreaks should, cf ccnrse, be a temporary measure in the direction.
8. It would anpear from dot-diagram 1 that Fe.izabad, which is a pilgrim centre, is a district of high mean mortality. It was also seen that although the pilgrim centre ofBanaras behaved as an avera.g"e me rtality district, individual figures revealed that mtrtality is a regular feature in the district. It may be useful to mention in thi@ connection that it has been observed from a study of the course of the epidemic in United Provinces that the rr.ost impcrtant cause cf the 1938 enidemic in the Pre vince was disserr.ina tion of infection follow· ing a large festival held at Hard war during March l9 38. It is suggested tuat special precautions should be taken in controlling the spread of the disease in such "Oilgrim centres and as recommer ded by the Bhor Committee, there shculd be comnlete inoculation cf nt>rscns ag-•tinst cholera before they are nPrmitted to enter thEo centres on festive occasions.
9. It bas ~lso bet>n not.iced tbst the rainy months of June, July, August and Sentember are generally the months of nroncunced me-r. t.a!ity for the Province, tbe nrovincial seasc nal index reaclling a neak level cf 176 during the me nth of August. The fact that the highly humid and moist districts of the east are acute epidemic districts col'pled with the f~>ct that mortality :irom cholera is mere nronounced during the rainy season, seem to indicate that the meteorological f<tctors humidity and rainfall l:a ve a tendency to incre~tse the mortality from cholera in the province. It would thus seem

35
useful to take up a detailed study • of the effect of such climatic factors as humidity, rainfall and temperature on mortality in the districts of high mortality and work out. details of the s<'asotml indices in respect of suoh di~tricts on t.he lit!<'S obtainPd for th province.
10. Small·pox.-A glance at the provinc~al mortality rates rr<'sented in table II would reveal that mortality rat<'s cl.id not on the whole show any variation from year to year (as would bo S<'en from the equation of the regression line) and that mortality during the period was highest during 1908, when the provincial mortality rate reached a peak level of 1·26 per thomand.
11. It was noticed that mortality from small-pox remained mostly high in the districts of Gorakhpur and Br nan s divisions in the westem di~tricts of Bjjnor, Budaun, Jlloradabad and partly in the eastem districts of the Fr.izabad Division. An examinfltion of the district mortality rates for the individual districts would rev< al cl.isquieting feature in the situation that high mortality was aln,ust a regular feature during recent years in the districts of tr.e Banara s and the Gorakhpur Divisions, mean mortality being highest in the Ghazi. pur District, viz. 583 per million per year approximately. Although mean mortality rates in the districts of Bijnor, Budaun, Moradabad , Sultanpur and Pratapgarn are high as would appear from tho dotdiagram tho aunual mortality rates as discussed in tlo ptectding chapter would seem to show that the situation in these districts is not so serious particularly in the eastem dh;tricts of Sultanpur and Prata pgarb where tne high epidemic years were during the beginning of the period. viz., 1906-08 which pushed up the mean mortanty rates above normal. It is surprising to find that tr.e westem districts of the Meerut and Agra Divisions remained practically immune from the violent outbreak during 1908 of cholera epidemic wl'.ich took a heavy toll of deaths throughout the Province.
12. Small-pox is perhaps the most easily controllable among the infecti9us diseasns, if vaccination be performed at regular intervals. It may not be out of place to mention in this connection that the introduction of an Health Organisation in 1922 introaucing primary vaccination in the province of Madras led to a fall in avl'rag" mortality for all ages from o· 77 per thousand during 1917-21 to o· 46 per thousand during 1922-26 and this was followed by a gradual lowering in mortality thereafter, the average mortality rate during 1937-41 being as low as o· 06 per thousand after the introduction of compulsory revaccinat~on in 1932. It is indeed surprising that compulsory vaccination nas 'not yet been enforced in a single rural circle of tr.e Unitl'd Provinces although the Province has distirct amas of high mortality.
13. It is sugested that primary vaccination be made compulsory throughout the Province and immediate steps taken to make primary vaccination compulsory in the highly epidemic districts of Ghazipur, Azamgarb, Bijnor, Bud.aun, JIIoradabad, Gorakhpur, Allahabad, Banarrs, Mirzapur and Jaunpur. Attempt should also be made to introduce compulsory rl'vaccination in these districts.
36
14. It would be seen tlu~ot various factors including poor housing conditions leading to overcrowding, pressure of population and above all the ·general economic backwardness of the eastem districts have contributed towards making these districts areas of high mortality. Allahabad and Bcnans are pilgrim cent.res and this fact has. to a considerable degree been responsible for tl:e :high mortality in t:hese districts.
15. Tile seasonal indices pr6sented in Table VI would swm to indicate that mortalit.y for tv_e Province is most pronounced during the months of April, l\Iay and June. . The indices being based on the province as a whole are, of course, bound to suffer from practical limitations in that these do not give any information of mortality in individual clist1 icts. It will be useful, J~owever, if seasori.alindices be obtained for at least the districts of high mortality. It is suggest~ d that provision for vaccination with potent vaccine lymph be made during the hot wea.ther April, 1\Iay a.nd June (when the quality is likely to deteriorate with exposure to heat in districts where mortality is most pronounced in the Province. in this connection it may be recalle·d tha.t tn.e Bhor Committee recommended that possibility of providing for cold storage to maintain the potency of the lymph at its original strength, should be investigated for districts with pronounced morta.lity.
16. Plague.-It is gratifying to note from the results of the analysis tha.t mortality from plague showed a significant d,ecUne dur·ing the period 1906-45 the rate of decline being 83 per millon per year. A study of the d;istrict-wise mortality rates from the annual reports of the Public Health Department would further show that during recent yea.rs there was practicaliy no mortality from plague in the Province except in the districts of the Gorakhpur and Banar• s Divisions.
17. It has been observed that mortality from plague is generally acute during the 3 months February, 1\Iarch ancl. April of the year, mortality boing most pronounced cl,uring March. It is sugg€ste~. that dur~ng these months when the outbreak of plague is irr,minent or has actually taken place, temporary measures like preventive inoculation, rat destruction, short period clearing of houses particularly during the months of December and January which are generally the months pr-oc •cl.ing tho plagu-" S'a • .on and provision of acl.equate treatm'"nt for patients are salutary measures in tl1e direction.
18. It has been noticed from a study of the mean mortality rates as given in dot-diagram 7 that mean mortality from plague has been high in the Saharanpur, 1\Ieerut, 1\Iuzaffarnagar, Jaunpur, and Unnao districts and unusually high in the Ghazipur, Ballia and Azamgarh districts, tho latter districts behaving more or less as endemic foci for the Province. It is known that the eastern districts of Ghazipur, Ballia and Azamgarh are economically backward and the sanitary oonditious in these districts :>,re far from satisf.octory. Besides the moderately damp climate in these districts seems to favour the spread of the disease in these areas. Abo.-e all, the human dwellings in these districts might be haunting houses for rats which are the primary reservoir of infection from which the disease <·asily spreads to man.
37
The poor hygienic sense of the people (particularly in the eastern dis· tricts of the Province) who generally throw garbage in public places which encourages the breeding of rats may be another cause of high mortality in these districts.
19. It is suggested that as an important measme in the dil·Action, may be taken the systematic destruction of rats in residential m·ens particularly in the ende:mic districts of the Pruvince. It may be worth· while to recall in· this connection the recommendations of the Bhor Committee, viz.:
(a) construction of rat-proof dwellings and rat-proufgrain sioiT& and railway godowns;
(b) control over the location of certain trades and industries which attract rats ; and
(c) an improvement ot the general sanitary condition of towns and villages and finally publicity work inculcating in the citizens and villagers the need for hygienic sense as an aduquate measure to keep down the rat population.
20. It is worthy to note that among the district of low mortality are the hilly districts ofNaini Tal, AlmoN> and Garhwal, all the four districts of the Jhansi Division, Dehra Dun and Shahjahn.npur. The plausible reason for the comparative immunity of Naini Tal, Almot·a and Garhwal seems to be mainly the vigilance and control exercised by the Municipal authorities in taking pteventive measmes against the possible outbreak of the disease in these districts and partly because the public in these districts have comparatively a better hygienio sense. The same vigilance on the part of the authorities and bt~ttcr hygienic sense in the people may be responsible for the low mort!Llii.y prevailllig in the districts of the Jhansi Division which are mostly important military stations and consequently public health authorities in these centres are required to take special precauticns.
21. It has thus been seen that in the districts where there are better medical facilities and where the sanitaty services nrc alw improved, the virulence of the disease is greatly mitigated. The con· trol on the admission oft.he diseased persons p!Lrticularly among~t the military keeps the hilly districts comparaHvcly free from tho di· s~ase. It may be recalled in this connection that plague is one of tho most serious diseas~s known to humanity which, if it breaks out in an epidemic form, results in tremendous loss of life. Th" Black Death of the 14th century took a toll of 25 million lives in Europo alone which constituted three quarter of its population. In England the last epidemic of the diseas3 caused untold havoc and loss of life. D1·. John Drew in his book entitled " 1\lan, Microbe and $Ialady " ha~ ass3rted that the relative freedom of England frcm plague since the last epidemic is the result of (a ) better living conditions especially as ro· gardshousing, (b)improved sanitat.ion and personal communal hygient•, (c) the provision of a nutritional health service and (d) the unceasing vigilance on the part of the authorities in England and their rigid control over all ships coming to England from known plague ports

38
abroad. He further observes, "We have the animal reservoir in abundance in this country and we do not possess any natural immunity against plague. We have to thank our island position and the concientious work of the members of our medical and sanitary services at our sea and air ports that the disease does not gain entrance to our land."
22. It would be seen frcm Dr. Drew's observations quoted above that it is possible to render a district immune from plague if housing and sanitary conditions are sufficiently improved and rigid vigilance is exercised by the Public Health Department in regard to the entrance of persons coming from known plague areas to the districts. Of course, it would be unreasonable to expect that the housing and sanitary conditions, in the districts of our Province would improve to the extent these have done in England but it is certain that considerable mitigation of nhe disease could be brought about, if the Public Health authorities in the Province are provided with better facilities and the sanitary conditions in the districts are improved. The statistical evidence goes to show that amongst the average mortality districts, mortality in almost all the districts (excepting the districts of the Gorakhpur and Banaras Divisions), has been practically insignificant during recent years, although in previous years it was'often average and sometimes high, and this may be due to the recent improvement in medical facilities and better sanitation in the districts.
23. Attempt has "!Jeen made to present the statistical data in this bulletin in a popular form, it being mainly intended for the layman. It has thus not been possible to make full use of advanced statistical methods which have been avoided as far as practicable partly because the object is to make the subject ll!atter interesting and mainly because the application of such methods to the crude data available is likely to lead to erroneous conclusions. The statistical methods wherever used have been separately explained in the appendix. Besides, limitations of time and space made me confine only to certain important aspects of the problem. It is hoped, howt~ver, that the results arrived at will J>e helpful to workers in the field to study the problem in details and extend the analysis in most cases to individual districts.

39
APPENDIX
RESULTS OF A:t~ALYSIS
Secular Trend
The eque.tions to the regression lims Ato l31, ar:d Cto shcwir.g the general tendencies of cholera, small-pox and plague are respectively :
Cholera Y =-0·02962x+l-5565l...... (1)
Small-pox Y =--0·00135x+0·22424, . • . • . (2)
Plague Y =--O·o 8306x+2·98723... ... • . (3) We now proceed to test the significance of each cf regression coeffi
cients.
Oholero::--Sampling error of the regres~ion coefficient 0·02962 is o·ouos so that t=2·6733.
5 per cent. value oft for SO degreesolfreedom is 2.042
, ,, , 40 , , , 2•021
Therefore the value of t =2·6733 fer 38 degrees of freedom is significant at 5 per cent. For our practwal purposes this means that the difference of the regression c~efficient 0·02962 from zero is real.
Small-pox.--Samplir g error of tbe regre&ion codlicient O·Cvl3c ~0·003015and t-0·4488. 5 percent. values oft for 30 a.rd 40 degrees
of freedom are respectively 2·042 and 2·021. Therefore t ==0·4488 against 38 degrees of freedom is not at all signific~.nt ard for our purposestberegressior. coefficient o·oo135 may be takEn to be equivalent to zero and tbe line reduces toY =0·22424 which is e line parallel to thex--axis.
--~
PlagUe. -Sampling error of t-he regression coEfficient o·C830 6 is 0·01778 so that t =4:6715 which is signif1.cant a,t 0·1 per cent.
0·1 per cent. value cf t for 30 d. f. is 3•646 and for 40 d. f. is 3·551. -·-'II; -For further details see art. 26, Statistical ~metbcds for R~EEarch
Workers.
Zones of higk, normal and low mortality.
Oonsider tbe mortality data for p districts ever g years. De:r.ding the mortality in the ith district for the jtb year by Xij.
We have xij =m+di+yi+eij.

48
Wherem is the general mean, di the district effect for theith district, YJ the yearly effect for the jth year and Ejj the sampling errcr for tl>e itb district ir. the jth year other than that. due to district and yearly effect.
lt can be easily shown that-
D Y 62
v <Z"·· >=- +- + p q pq
where;-,. is the estimat!' of the general mean and
E (di2) D
E (yj") y
E (eij2) =6• E denot;ng · e:q1ecta tion.
If now, vl, v2, v •. be the mean squares due to districts, years and error as Gbtained from an:tlyois of variar ce it easily follows that
V(x .. )
. andS.E.ofx .. = v V1 +V2-V3
pq
Considering;:. asthemeanof thep district means each district mean being obtained as an average of the mortality rates for the dLtricts over the q years. We have the critical difference for 'X •. . S. E. (x .. ) x t p-1 where t p- 1 is the 5 per cent. value of t for
p-1 degrees of freedom and hence fiducial range for-;; •. finally is
x •• ± vVt+V2 -V3 Xtp-1
Pq and this may be taken as the normal range of mean mortality.
The fiducia 1 mnge for
Cholera is . 0·8835±0·3021 or 1·18 and 0·58 roughly;
Smal1-pJxis 0·1797±0·0664 cr 0"25 and O·llroughly;
Plague is· 1·1431±0·6006or 0·54and 1·74 ronghly.
We Lext obtain th~ normal range of standard devia.tion for the disoricts. If 8 1
2, Sl, ........ Sp2 be the estimates of variances for the P districts over the q years we hav .. , if s• denotes the average 7 ariance over the p districts,
p l:8i2 St2+S 2
2+ ...... +Sp2 p

41
Now for normal parer>.t estimate of
s• V (8} =
2n I see page 210, The Advance(! Theory of 8t a·
tistics, Vd. I by Kendall).
Hore n =q-1
82 ap.d V(s) = 2 (q-1)
8. E. (8) 3f4 = v' v (s} - v' S' 2(q~1)
Fiducial range of S is 8 ± v' 2 (q-1)
X tq-1
where t q-1 is the 5 per cent. value oft for q-1 d. f.
which may be taken as the ncrmal rar.ge for standard deviation.
In our present c!>se 1or : ·
Cholera: q=39,
s• =2·703143.
V (s)= ( 82
=0·0346594. 2 q~I)
Fiducial or normal ra;nge for 8.
is 1·6441 ± 0·3767.
or 1·27 and 2·02 roughly.
Small-pox 8 2 =0·13906875.
Fiducial range for 8 is 0·3729 ± 0"0854 or 0·4583 and 0'2875,
Plague 82 =7·805531.
Fiducial range for S
is 2·794 ± 0·6401 or 3·4341 and 2·1539.

42
LIST OF PUBLICATIONS OF THE ECONOMICS AND STATISTICS DEPARTMENT, UNITED PROVINCES
I.-PUBLICATIOXS OF THE BUREAU OF STATISTICS AND ECOXO:.llCS RESEARCH (1931-38)
*Bulletin no. 1. Agricultural prices in the United Provinces by Raj Bahadur Gupta, M.A., I'.HD. (1937), Rs.2.
* "
* "
* "
* "
, 2. The Foods of a Hindu Village of Northern India, by Charlotte V. Wiser, P.H.n:, M.sc., (1937), price Rs.2-8-o.
, 3. Wages and Labour conditions in Kanpur, by S. P. Saxena, Jlr.A., B.coM. (1938), price Rs.3-8-0.
, 4. Prices of Cereals in the United Provinces, How they are determined at various stages by J. K. Pan de, M.A. (1938), price Re.1. ·
, 5. Sugar in the Fields, Workshops, and the Factories. A survey of the prospects of Sugar Industry in.Rohilkhand, by N. K. Kaitha, ~r.A. (1938), price Rs.1-4.0.
!I.-PUBLICATIONS OF THE BUREAU OF ECONO:NIICS Ic~TELLIGENCE (1938-42)
Bulletin no. 1. The Cawnpore Wholesale Clothing Trade, by C.
"
"
"
Ackroyd and Devraj (1938). , 2. The United Provinces Wheat in 1938-39 and Days to
come, by J. K. Pande, M.A. (1939). , 3. A Study of the Im!)ort and Export Trade of the U. P.
during the year 1938-39 (1939). , 4. Report on Housing Conditions of Mill workers in
Cawnpore (1936 ). · · III.-PUBLICATIONS OF THE DEPARTMENT OF ECONOMICS
AND STATISTICS Monograph: Our Food: Lucknow City, by ProfessorS. K. Rudra, M.A.
(CANTAB.) (1944), price Re. 1-0-0. Bulletin no.1. Report on an Enquiry into Labour Conditions in the
Brassware Industry of Moradabad, by R. D. Pant (1945), price Re. 0-12-0.
"
"
"
, *2. Crop Estimation in the U. P. by J. K. Pande, li!,A. (1945), price Re.0-12-0.
, 3. Growth of Population, Consumption, and Production of Foodgrains in the U. P. by J. K. Pande, M.A.
(1946), price Re.-0-4.0. , 4. Rationing of Foodgrains in the U. P. during World
War II, byProf.S.K. Rudra, M.A. (CANTAB.) (1946), price Re. 0-6-0.
----------------• Spare copies not available.
43
BUlletin no. 5. Rural Wages in the U. P. by S.C. Chaturvedi, )I.A..,
(1947), price Rs.2-4-0.
"
"
"
"
"
"
, 6. Sanukt Prant Ke Dehaton men Majoori (Hindi) by S.C. Chaturvedi, :\I.A..
, 7. Development of Agricultural Marketing in U. P. and need for its Reorganisation, by R. C. Pande, JI.A., LL.B. (1947). price Re. 0·4·0.
, 8. Some Facts about our Life and Living (1947), priee Re. 0-5-0.
, 9. Vital Statistics in U. P., by A. R. Sen, M.so., F.s.s., (Lond.) (1948).
, 10. A Handbook of Statistical Information (1947), price Re. 0-3· 0.
, 11. Industrial Relations and Trade Disputes in U. P. by J. Singh, nr.A. (in Press). Hindi Version price Re. 0-5-0.
NOTE-All publications of the .Department of Economics aml StntiHtics including the monthly Bulletin of Statistics, con be had from the Supcrintrndl'nt. Printing and Stationery, United Provinces, AUnhnbad, on payment.
l'SUP-173 Genl.-1948-l,OOO(M).

I--t+ f-U
i L:; !
II
I~ r'-,.._ I+ i+ r+
·'-:
~ht tf
•It
p I+-~
·~ :ttr ' rP.:f-~ ll
~ H
H II 1-' ·
1-t h + - .. . ,
1.;
'*~f •t ...
~t::: H I-.- . -: I~
+ • I++ -
:·
U. H'l; ~ ~ " !"" ~T~_.., [[t: i)t
::,
il. r.~ ~ ~J ·r
I I t• II ij Ti, b ~ ·~ ~~
± r-:,t: if ~ -~ :!: ~. Jffil ft"fr # :r 1-
~ f.. H 1"
Jl r: f ·~ fr t l ri
Ri 4 fi; I~ :j'
:t
I i!11"1 H+ : 1 m.!t -tilt


P.a.U.P< R)2, GUifiU.-1,46-1000


1 1.
H+ l'+j.:
l ·i:...j.
1:- h
r
I
,,.,..
~
rt:
H
-..
~t
r ~
fJ H rt l r
r+
rt
h d
4
! I~
~~~ ' r • '1 ±l it :t ·t :1:!::1: ,.. f ~
ll 111 r
I!
~ Sll r. I ~ tllt
li j.0- 11
fH~ if u :t
lr If H: lt: I:! u ~
! I ~~~; !i# , ro· ~ t
I• li 'l I t- I+· IJ It t~r.
u :; ~t ,, t:.f~ l~f
.....
~rJ ~4 ~ w~
L: ~l ~. !lilt ~t
I flu [I 11~ ~ ,,
~·~'·
11
!
!
I
~ ~.
I' n ~ ~ IT
'1 11
ll~ l t ~ lf~ll ~ ~
p •l ,P12~ ·· t t. ' 1- • l:i46• 10..J C.

1»-!an mort a l ity
0 - ~ N N .
DEHRA DUN ra» ~ 0 ~ P '"" RAHARANPUR ·
rft ~A ~ >J.H-~14-f-1 ~DSHAHR 1! • ;AJtH ~ iURA FIW -l lPURI .
-M..MI
I :ILLY , · - - .., tn
lOR ~ = WN - ~ i M)ABAI) ~ £ ~ ~~ a 0 ~ lBHIT - -- ~ H
ruKHABAD - [~ ~ ~H ~ ~ UR - ~~~ ~ ;h
~~A-1) \Jil .. . _l rt fT - ~ ~ lSI I c ~J+ ~ z H -~lJtt.__ I .., ;! o-t 0 IRPUR_ ' _, '- ~ P1 ?-
DA I '-i II I~ ~ ARAS - aJ -- ~ ! I ZAPUR ~~ r--~PUR ;ti • ZIPUR 1~ ~ LIA. ~ ~~~ ~ ~ TI · ~ iC MGARH o ~ NITAL ~ :z: ~
~~ 1• rt ~ ~ wvvKN0\'1 , ' e umuo a ~ ~LI. ~ ~ SITAPUR HAROOI KHERI FYZABAD GONDA B.AHRAICH SULTANPUR PRATAPGAS-1 -.: , BARAB ANK1 T •

0 Standard deviat ion lV VI .... .
CJ1 0 0 0
Dehndun •• 0 ..
Sahranpur ~ -~ Muza.ff~"' ~ i Meerut - • (") ~
Bulandshahr ' ::c 0
Al~garh Eo; t:J t;
Mathura. ~ :d :r~ Jl ~ 1-1
-. 0 Ulpurl.
-~ ~ ~ c!
!tah Bare illy. - ~ 0
'10
Bijnor - . § • Budaun ~ a Moradabad - iii1 ~ . . "' Shahjahanpur g 1:1 - a: Pilibhit l- · ;8 0
J'srrukha.bad , ~ ~ ~ i Ita wah !i! t"'
KANPUR (")
~ M
.FATEHPUR en
A118.ha.bad ~ ~ Jhansi
en M
J'alaun 0
H8.111irpur 0
~ :z:
Banda 1:1
~ Banaru ~ Jtirzapur
>-
Jaun~ur ~ ~ Ghaz1pur Ballia Gorakhpur Basti A7i811fP.'J"h Jlain1tal Alaora Cuhwal Ltlclcnow • Unao ~bareli
pur Hardoi Kberi . Fyu.bed Gonda &hreich Sultan pur Partapguh _,_
&.rabanki 4-

• P 5 UP <nJZ, Ci£11ERl · 1948 1000

D!:HRA DUN SAHRANPUR MUZ.AFFA.RWAGA
Jo££RUT BULANDSJJ.&UII ALIGARH W.THURA ACRA MAIN PUR I ITAH SARi ILLY BIJNOR
0 0 0 . . 0 ~
•
BUD AUN HOJUDABAD SHAHJAHAWPUI? PILIBHIT 'N..RR UIUiABA n KTA'IiAH KAHPl.R f£'WiPUR ALUHABAD JlLUIS I JALAUN H»>IRPUR BAN-DA .BENll&S ¥l.F..1.A PUR JA"'UNf'tJR CHAZIPUft CORAJrnetlR BASTl KUGARH MAin TAL ALICIRA -~· ~ LOCKNOW tJaAO a..,B BAREL! Sl'UPUR HARDOI lEER I XIZABAl> BARRAICH SUL T AJiPUB. PARTABGAMf BARABAA1U SALLIA GOOl!
0 . \N
0 0 0 . . . ~ "' · a-
rT
IT
0
--.)
0 . Q)
0 • '>D
1';1 ~ !i~
I:Z:
Q
~ ~u u Ji ttl .. "' ~~ ><s '11!4
.i~ ~ ~-~:r:: . ~
a I :X:
II

RADUN A}:P"rq SA
MU -ME
FF.Al\NAGA UT
B ftDSHARR JJ.. MA. A MA E BARE B B MO
ARH URA
PURI
ILLY OR UN DABAD
s p
JAHANPUR BHIT
F E KA F.
tTKHABAD
A D JHAN J. HAMIR B. B MIRZAPOR J. G llA G BAS AZ.AMC NA ~ GARHWAl L 1:J'HA
~ RAE Fs ~ H ~ mER ~ FT ~G ':" BA.HRA ~s 0
a
~
R
-
~p Ulcvi.U
8 BARABAHD.
• c= 0 ... · · ~
-F 1.1
'
It
I
f+r.-
.
'
sm . .D£nxrrow c c:> c 0 0 : .: .... ;,i ~ eli a\ .... • 0 .
, lttfi r+ -'-I I
__. . If tf- +- _. tP.= ~;:. ... I t . ~ .. - r+. • 1-h r l
"' ~ -
. ~
-, p- -;1: - -T
I T T
I
'_._j (3~ ~i 6~ ~~ lr. I ~~'r r+
~ · "' tn .... ·- ----.-t- ... I ';J q:.r_1
I
~~ ---~ l
• ..._:..L 0
• . .;... - . 0..., :z:
X
~~ ;!
~i ~: ~ '
- f-L. L . IZ
• - - '" 1 ~c::l :::! r• t+ :1 ~ ~· -~ • ~ -1
~
< > :>0
"" • .... • ill"' ,....
1 ... :>0
i . (/l
~ . ~ .
(J
T

CAR.
SAHRANPUR
1'1UZA FJ"AR NA.
11EERur
Bt1LA.IYD3HI\
AUC.ItRH
MATHURA
AG~A
HA._
1'1AIH PUR. I
ETA.H
BAREILLY
8/VIYOR..
J/UDA.UN
/'tORADAIJAD
SHAH.JAHAIY
PillS HIT
PU~-
FARRUHHA/!!J
ETA WAH
kANPUR,
.CA. TE H PC/A.
ALLAHABAD
vHAN~I
.IAL.AU/11
lfAHIRPUR.
BANDA
LJ.<\NARAS
l'tl R ZA.PUR.
vA ONPUR.
C.HAZJPUR.
IJALLIA
C.OR. A I(HPU
BASn A.ZAI'tC.ARH
IVAINITAL
AL/'tO~A
CA~HWAL
L l/CI(NOW
l/NAO
J?AE8ARELI
,S,TAPUR.
J.IAR.DOI
lfHEA/
F"YZA.8AD
AD
-
~
--
--
C. OI'VOA
BAHRAICH
SULTA NPUR.
PA'/lTAPGA
B A-'t"'\BAI'VI{ R.H..-I
:~
' ~
~
-
P'
- - ! --r
. -
-'
• -
t '-.t.
I - -
t-
:;-~-{ • •