ol. I - DSpace@GIPE
391
ol. I
-
Upload
khangminh22 -
Category
Documents
-
view
0 -
download
0
Transcript of ol. I - DSpace@GIPE

ol. I
EDUCATION IN
INDIA
VOL. I-REPORT 1961-62
MINISTRY OF EDUCATION GOVERNM(:NT OF INDIA

PREFACE
This Annual Report surveys the progress of education in the country during 1961-62. It deals with the various a..~pects of education and gives detailed statistics likely to be of interest to planners, educationists, educational administrators and students of education.
The Report is mainly factual except the last Chapter, which gives quinquennial statistical progress and innicates broad trends of developments in selected fields of education.
The statistics of Goa, Daman and Diu have not been received in full for the year 1961-62 and the Union Territory has, therefore, been excluded from the body of this report. However, the available statistics of this Territory are given separately in the form of an appendix. The consolidated all-India statistics and appendices on State Directorates and Inspectorates and the scales of pay of teachers in Primary, Middle and High/Higher Secondary Schools are being publiehed in Vol. II and Vol. II-A respectively of this publication.
I should like to express my thanks to the Directorates of Education and other educational authorities in the States for their co-operation in supplying the requisite data for this Report.
NEW DELHI Pated 11th A.pn-1, 1966
MJB(D)04MofEdD.-2(a)
P. N. KIRPAL
Secretary and Educational A.d'Viser Gooemment of India

EXPLANATIONS
Cl!AP'l'ERS
CONTENTS
I-GENERAL SURVEY
II--EDUCATIONAL ORGANISATION AND PERSONNEL
JII-PRIMARYEDUCATION
IV- BASIC EDUCATION
V-SECONDARYEDUCATION .
VI- UNIVERSITY EDUCATION.
VII- TRAINING OF TEACHERS .
VIII- PROl!'ESSIONAL AND TECHNICAL EDUCATION
. IX-SOCIAL EDUCATION •
X-MISCELLANEOUS
1. Pre-Primary Educat.ion
2. Aesthetic Educalion
3. Education of the Handicapped .
4. Education of the Srheduled Cast.es. Scheduled Tribes and Other Backward Communit.ies
5. Education of Girls .
6. Physical Education and Sports .
7. Youth Welfare
8. Scouting and Guiding
9. National and Auxiliary Cadet Corps
10. School Meals .
11. Education of Displaced Students
12. Indian Students Abroad
XI-STATISTICAL SURVEY .
.PPENDIX--EDUCATIONAL STATISTICS OF GOA, DAMAN & DIU
X
I
30
36
69 . 95
155
205
235
283
295 295
297 306
311
312
317
320
322
325
327 329
330
339
360

iLLusT&Arlo:Ns FACING
PAGE
i. PROGRESS OF EDUCATION IN INDIA 10
2. INSTITUTIONS BY TYPE, 1961-62 14
3. RECOGNISED INSTITUTIONS BY MANAGEMENT, 1961-62 15
4. PUPILS RECEIVING GENERAL EDUCATION, 1961-62 21
5. ExPENDITURE ON EDUCATION BY SouRCES, 1961-62 . 23
6. ExPEl.'."'DITURE ON EDuCATION BY HEADs oF CHARGE 24
7. COST PER CAPITA (OF POPULATION) ON EDUCATION 29
8. ScHooLs BY MANAGEMENT, 1961-62 46
9. WASTAGE AT PRIMARY CLASSES, 1958-59 TO 1961-62 53
10. TEACHER-PUPIL RATIO, 1961-62 62
11. PERCENTAGE OF TRAINED TEACHERS IN PRIMARY SCHOOLS 63
12. PERCENTAGE OF TRAINED TEACHERS IN MIDDLE ScHooLs 126
13. PERCENTAGE OF TRAINED TEACHERS IN HIGH/HIGHER
SECONDARY SCHOOLS 140
14. OuTPUT OF GRADUATES 199
15. DIS'l'RIBUTION OF PUPILS RECEIVING PROFESSIONAL EDU-
CA'l'ION 260
16. SociAL EDUCATION 293
17. Em:rcATION OF THE HANDICAPPED, 1961-62 307
TABLES
General Survey
I-N umber of Institutions by Type
II-Number of Institutions by Management
Ill-Number of Institutions by States
IV- Number of Pupils by Type of Institutions
V-Number of Pupils in Recognised Institutions by
14
15 16 18
Management 20 VI-Number of Pupils in Institutions by Stages of
Instructions 21
VII-Number of Pupils by States 22
VIII-Expenditure on Education by Sources 23
IX-Expenditure on Education according to Heads of Charge 24
X-Indirect Expenditure on Education by Sources 25
XI-Direct Expenditure on Institutions by Manage-ment 25
XII-Distribution of Governm'}nt Expenditure on Education 26
XIII-Expenditurc on Education by States 28
Educational Organisatirm and Personnel
XIV-Strengtb of State Educational Service according to Branches 31
XV-State Educational Service--Class I and Class II 32 XVI-Expenditure on Direction and Inspection 35
Primay Erlucation
XVII--System of School Classes at Primary Stage 44
XVIII--Numher of Primary School~ by Management 46
XIX-Numher of Primary Schools by State~ 48
XX-Number of Pupils in Primary Schools by Manage-ment 50
XXI--Numbor of Pupils in Primary Schools by States 51 XXII- -Number of Pupils at tho Primary Stage 52
XXIII-Educational Facilities for the Children of the Age-Group 6-11 54
(iii)

XXIV-Girls in Primary Schools.
XXV-Number of and Enrolment in Single-Teacher Primary Schools 57
XXVI-Sta.tistics of Compulsory Primary Education by ~~ M
XXVII--Number of Teachers in Primary Schools 60
XXVIII-Minima and 1\iaxima. of Pay Scales :>f Teachers in Government Primary Schools 63
XXIX--Direct Expenditure on Primary Schools by Sources 64
XXX--Direct Expenditure on Primary Schools by 1\fanagement 65
XXXJ-Direct Expenditure on Primary SchooL~ by States 66
Basic Education
XXXII-Number of Basi(l Schools by Management 74
XXXIII- Number of Basic Schools by States 76
XXXIV-Number of Pupils in Basic School!! . 78
XXXV-Number of Teachers in Basic Schools 82
XXXVI-Direct Expenditure on Basic Schools by Sources 86
XXXVII-Direct Expenditure on Basic Schools by States 88
XXXVIIJ-StatiRtics of Basic Teachers' Training Schools 91
XXXIX--Statistics of Basic Teachers' Training Colleges 92
Secondary· Education
XL-System of School ClasseE at Secondary Stage 105
XLI(A)-1\iinima and 1\iaxima. of Pay Scales of Trained Teachers in Government Middle Schools 108
XLI(B)-1\iinima and Maxima. of Pay Scales of Trained ' Gradu:~.tes in Government High/Higher Secondary
Schools 109
XLII- Public Examinations 110
XLIII--Teaching of Hindi . 112
XLIV-Tcaching of English 114
XLV-Numbcr of Middle-Schools by Management 115
XL VI-Number of 1\iiddle Schools by States 116
XLVII- Number of Pupils in 1\iiddle Schools by Manage-ment 118
XL VIII--Number of Pupils in Middle Schools by States 120 ·
XLJX-Number of Pupils at the Middle Stage 121 (iv)

TABLES-contd.
t -Educational Facilities for the Children of the Age-Group 11-14 . 122
LI-Girls in :1\Iiddle Schools . 123
LII-Number of Teachers in Middle Schools 124
LUI-Direct Expenditure on 1lfiddle Schools by Sources 127
LIV-Direct Expenditure on Middle Schools by Manage-ment 127
LV-Direct Expe1~diture on Middle. Schools by States 128
LVI-Number of High/Higher Secondary Schools by Management 132
LVII-Number of High/Higher Secondary Schools by States 133
LVIII --Percentage of High and Higher Secondary SchooJ..q by Management 13!
UX-Number of Pupils in High and Higher Secondary Schools by Management . 137
LX-Number of Pupils in High and Higher Secondary Schools by States . 139
LXI-Number of Pu~ils at the High/Higher Secondary ·Stage 140
LXII-Educational Facilities for the Children of the Age-Group 14-17 U,2
LXIII-Girls in High/Higher Secondary Schools H3
LXIV-Number of Teachers in High/Higher Secondary Schoe>ls 14±
LXV--Direct Expenditure on High/Higher Secondary Schools by Sources 146
LXVI-Direct Expenditure on High and Higher Secondary Schools by l\lanagcment . 1J7
LXVII--Direct Expen1.iture on High/Higher Secondary Schools by States • . . . . 148
LXVIII-Results of l\IatriculationjHigher Secondary und Equivalent Examinations 152
Unirersity Education
LXIX- Universities in India (Jurisdiction, Type ann Faculties) 173
LXX-Number of Colleges by Management 179 LX.."'\:1-Number of Colleges by States . 180
LXXII-Number of Pupils in Universities and Colleges 181 (v)

LXXIII-Number of Pupils receiving General, Professional and Special Education at the University Stage 183
LXXIV-Distribution of Pupils at the University Stage • 185
LXXV-Number of Girls Studying for Higher Education • 186
LXXVI-Number of Teachers in Universities and Colleges by States . . . . . . . . 188
LXXVII-Pay Scales of TcachP-rs in University Teaching Depar~ments 190
LXXVIII-·Statistics of Evening Colleges . 192
LXXIX-·Direct Expenditure on Universities and Colleges by Source;: 192
LXXX-Direct Expenditure on UniversitieS and Colleges by States 19!
LXXXI-Examination Results 199
LXXXII- University Examination Results by States 200
Training of Teachers
LXXXIII- Number of Teachers' Training Schools 212
LXXXIV---Number cf Pupils in Teachers' Training Schools . 214
LXXXV--Direct Expenditure on Teachers' Training Schools by Sources 215
LXXXVI-Direct Expenditure on Teachers' Training Schools by States 216
LXXXVII-Number of Post-Graduate Teachers' Training College8 220
LXXXVIII-Number of Under-Graduate Teachers' Training Colleges 221
LXxXIX- Number of Pupils in Teachers' Training Colleges . 222
XC-Direct Expenditure on Teachers' Training Colleges by Sources 223
XCI-Direct Expenditure on Post-Graduate Teachers' Training Colleges by Sources 223
XCII-Diroct Expenditure on Under-Graduate Teachers' Training Colleges by Sources 223
XCID- Direct Exp:mditure on Post-Graduate Teachers' Training Colleges by States 226
XCIV-Direct Expenditure on Under-Graduate Teachers' Training Colleges by States 229
XCV-Output in Teachers' Training 232 (vi)

t.ABtES-contd.
Professional and Technical Education
XCVI-Statistics of Vocational and Technical Schools by Type 246
XCVII- Number of Pupils by Type of Vocation of S<'hool Standard 248
XCVIII-Statistics' of Vocational and Technical Schools by States 250
XCIX-Statistics of Agricultural Schools 252
C--Statistics of Commerce Schools 253
Cl-Statistics of Engineering Schools and Poly-technics 254
Oil-Statistics of Forestry Schools o 255
CIII-Statistics of Marine Training Schools o 255
CIV-Statistics cf Schools for 1\Jedicine 256_
CV-Statistics of Schools for Physical Education 257
CVI-Statistics of Technical, Industrial and Arts and Crafts Schools 258
CVII--Statistics of Veterinary Science Schools 259
CVIII- Statistics of Professional and Technical Colleges by Type 260
CIX-Statistics of Professional and Technical Colleges by States 264
OX-Statistics of Agricultural Colleges 266
CXI-Statistics cf Commerce Colleges 270
CXII-Statistics of Engineering Colleges 272
CXIII-Statistics of Forestry Colleges 274
CXIV-Statietics of Law Colleges 276
CXV-Statistics of Medical Colleges 277
CXVI-Sta.tistics of Physical Education Colleges 278 CXVII..:... Statistics of Technological Colleges 280
CXVIII-Sta.tistics of Veterinary Science Colleges . o 282
Social Education
CXIX-Statistics of Social Education 293
M isccl/aneous
CXX-Statistics of Pre-Primary Schools ·296
CXXI--Statistics of Pre-Primary Teachers' Training Schools 297
(\iii
TABL;ES-eontc/. ·
C:XXII-Statistics of Schools for Music; Dancing and Other Fino Arts
CXXIII- Statistics of Colleges for MUEic, Dancing and Other Fine Arts
CXXIV- Statistic~> of Schools for the Handicapped .
CXXV-Statistics of Education of the Scheduloo Castes, Scheduled Tribes and Other Backward Classes •
CXXVI-Distribution of Girls and Boys in Recognised Institutions
CXXVII--Number of Students/Trainees Who Went Abroad dl•ring 1961-62 by Subjects
CXXVIII--Number of Students/Trainees Who Went Abroad during 1961-62 by Countries
CXXI.X-Number of Students/Trainees Who We-nt Abroad dming 1961-62 by States
CXXX-- Indian Students/Trainees StudyingfR.eceiving Practical Training Abroad as on 1-1-62
Statistical SurvP-y
CXXXI--Enrolment in Classe,o;l-VIII, 1956-62
CXXXII-Educational Facilities for the Age-Group 6-14~ 1956-62 •
CXXXIII--Numher of Primary Schools, 1956-62
CXXXIV- Number of Priinary Scl10ols by 1\ianagement, 1956-62
CXXXV- Educational Facilities tor the Age-Group 6-11, 1956-62 .
CXXXVI-Pupils. outside the Ago-Group 6-11 in Classes , I-V, 1956-62 .
CXXXVII- Wastage and Stagnat·on, 1956-62
CXXXVIII- -Indices of Enrolment. in Classes I--IV CXXXIX- Teachers in Primary Schools, 1956-62
302
303
307
313
315
333
334
335
.. 336
339
339
340
341
341
342
343 "344
344
CXL- Expenditure on Primary Schools by Sources, 19~~!- M5
CXLI-Teachers' salaries in Primary Schools, 1956-62 345
CXLII--Number of Middle Schools, 1956-62 346
CXLIII--Number of Middle Schools by Management, 1956-62 • 346
CXLIV-Eurolment in Classes VI-VIII, 1956-62 347
CXI"V--Tcachers in Middle Schools, 1956-62 347 lviiil

·rA..BL.ES- wntd.
PAGE
CXLVI-Direct Expenditure on Middle Schools by Sources, 1956-62 348
CXLVII-Expenditure on Salaries of Middle Schools Tea-chers, 1956-62 348
CXJ ... VIII-Number of Basic School~, 1956-62 349
CXLIX-Proportion of Junior and Senior Basic Schools, 1956-62 349
CL--Enrolment in Basic Schools, 1956-62 350
CLI-Expenditure on Basic Schools, 1956-62 351
CLII--Teachers in Basic Schocls, 1956-62 . 351
CLIIJ- Number of High/Higher Secondary Schools, 1956-62 352
CLIV-EnNlment in Classes IX-XJXI, 1956-62 353
CLV-Tea.chers in High/Higher Secondary Schools, 1956-62 353
CLVI-Expenditure on High/Higher Sewndary Schools, by Sources, 1956-62 354
CL VII- Salaries of Tea.chllrs in High/Higher Secondary Schools, 1956-62 354
CLVIII- Results of Matriculation and Equivalent Exa-minations, 1956-62 355
CLIX-Number of Institutions for Higl1er _ Education, 1956-62 355
CLX-Enrolment at the University Sta.ge, 1956-62 356
CLXI-Enrolment in Colleges for General Education by Stages, I 956-62 336
CLXII-Enrolment in Professional Subjects, Collegiate Stage, 1956-62 357
CLXIU-Expenditure on Institutions for Higher Educa-tion, 1956-62 357
CLXIV--Expenditure on Universities and Colleges by - SourcPs, 1956-62 358
CLXV-Examination Results, 1956-62 358
CLXVI-Number of Vocational and Special Schools, 1956-~ M9
CLXVII -Emolment in Vocational and Special Schools, 1956-62 359

EXPLANATIONS
1. AcADE:MIC YEAR-For the sake of uniformity the academic year in these tables is taken to coincide with the financial year, i.e. from 1st April, 1961 to 3let March, 1962.
2. RECOG:r-.'lSED INSTITUTIONS are those in which the courses of study followed are those prescribed or reccgnised by the Government or by a University or by a Board of Secondary and Intermediate Education constituted by law and which satisfy one or more of these authorities, as the case may be, that they attain to a reasonable standard of efficiency. They are open to iDBpection and their pupils are ordinarily eligible for admission to public examinations and tests held by the Government or the University or the Board.
3. UNRECOG:r-.'lSED INSTITUTIONS are those which do not come under the above definition of recognised institutions.
4. ENROLMENT-For definiteMss, the enrolment in the institutions on 31st March of the year in question i~ taken.
5. ExPENDITURE- In calculating the expenditure from Government, District Board or Municipal Board Funds, all payments or contribution from fees and other sources which are credited to such f1mds, are deducted.
6. LoCAL BomFs- Include District, Municipal and Cantonment Boards as well as Town Area Committees and Janapad Sabhas, Zila Parishads andTerritorial Councils.
7. EXAMINATION RESULTS-Refer to those students who were educated during the current year. These include results of private candidates also.
8. lNniREcT ExPENDITURE represents the amount incurred on direction, inspection, buildings, furniture, scholarships, hostels and other miscellaneous items. Its nature is such that it cannot be apportioned to each type of institution.
9. All statistics refer to Recognised InstitutilmS only.
10. Institutions which are exclusively or mainly meant for girls have been classified as girls' institutions and the remaining as boys' institutions.
!XI

EDUCATION IN INDIA
1961--61
VOL. I-REPORT
CHAPTER!
GENERAL SURVEY
The year under review marked the beginning of the Third Five Year Plan. A short review of the activities of the Central Government in selected fields of education is recorded below:-·
PTUnary Education
In tho field of education the most important programme before the country under the Third Five Year Plan was the expansion of facilities of education for tho children of the age-group 6-11. In the first year of the Third Plan the additional enrolment in classes I-V (corresponding to the age-groups 6-11) was 3 · 87 million which exceeded the original target fixed for the year by_ I· 62 million. This was achieved mainly by intensive enrolment drives organised in many parts of the country during the year. . ·
The Rtate Governments were directed to introduce courses in Cooperation and Panchayati Raj in primary teachers training schools. The centrally sponsored scheme for improvement of science teaching at the elementary stage introduced in 1960-61 was transferred to the state sector. During the year a Seminar of the Science Consultants of the States was organised in Feb. '62 which made suggestions for improving and expanding the scheme further. The Central Govt. recommended to the State Governments to prepare a comprehensive scheme of old age provision for the primary school teachers. The scheme for the relief of the educated unemployed by utilifing them for eA1m.nsion of the primary education was also continued. Efforts were made to improve the economic conditions of the primary school teachers. The Seventh National Prize Competition for Children's Books was organised during the year.
Basic Education
All the important schemes of basic education introduced in earlier years wore also carried out during the year under review. The most imp01tant oft.he schem~ is the re-orientation of elementar~ soh)ols towards the basic pattern.
A National Board of Basic Edur.a.tion was constituted during the year to assess the progress of basic education and to advise the Government. on the fmmulat:on of policies regarding this typ11 of education. As in the previou~ years the National Institute of Basic Education continued ita activitit>.s.
'M/B(D)254 Mof Edu-3

2
Secondary Education
The process of reconstruction of secondary education was carried out through various schemes included in the Third Plan for which a provision of Rs. 880 million was made. The Ministry of Education at the centre sponsored some of the programmes directly and some others through the National Council of Educational Research and Training. One of the main programmes was the strengthening of multi-purpoRe schools .. A committee was appointed for the promotion of Emotional Integration and Interstate Understanding. The Central Board of Secondary Education, A]mer, was reconstituted to form the All-India Board of Secondary Education with its headquarters at Delhi. Seminars and training courses were organised at the Central Institute of Hyderabad, with a view to improve the standard of English especially at the secondary stage of education. The National Council of Educational Research and Trailing continued its various activities through the Central Bureau of Education and Vocational Guidance, the Central Bureau of Textbook Research and the Directorate of Extension Programme for Secondary Education.
Higher Education Four central universities at Aligarh, Banaras, Delhi and Viswabharati
developed further during the year. New courses and departments were opened and new colleges were established under them. Besides the maintenance of these universities, the Central Govt. gave grants to tht> Jamia Millia Islamia, New Delhi, Gurukul Viswavidyalaya, Brindaban and other all-India institutions of higher education. The University Grants Commission held a series of meetings with the representatives of the State Governments and the Universities for processing a number of development schemes. The Commission also increaRed the scales of pay of teachers in the four central universities.
A number of important development projects were taken up with external assistance. These include, among others, Home Science Education and Research, introduction of 'General Education' Programme in seleeted Indian universities through a grant from the Ford Foundation. The Govt. of Australia gave under the Colombo Plan a set of reference books M a gift. Preparation of reading materials and supply of books and equipment under the India Wl10at Loan PrograiDllle was continue<;!. Exchange of teams of Indian and American educationist. also continued under the Indo-U. S. agreement for financing education exchange programme.
Two more Rural Institutes we1·e started during the year at Wardha (Maharashtra) and Hanumanamatt.i (Mysore) thus bringing the total number of Rural Institut11s of Highe11 Education to 13. The Nat.ional Council for Rural Higher Education mPt in New Delhi in November, 1961 to consider various aspects of development of education in the Rural Institutes .. A number of ori11ntation courses and seminar• for the teachers of the Rural lnstJtutes wE're also organised during tl1e year.
Engineering and Technical Education The most important developments in the engineering. and t~hnical eon
cation durine: t.his year was the pa!tsing by the Central Parliament m December

3
1961 of a comprehenaive Bill called the Institute .?f T~h1;1olo~ Act,. 1~61, thereby declaring all the existing higher technological !DBtttuhoDB as mst!tutions of national importance w.e.f. 1st April, 1962.
One Regional Engineering Cvllege, eight in the chain, w_as establishe~ at Allahabad in August, 1961. 3 engineering colleges-one each m Kerala, Onssa and West Bengal and 15 polytechniC!! were also newly established during the year.
Social Education Some of the important activities in the field of social education during
the year were the production of literature for the nco-literates and the new reading public conducting of some pilot proj~cts for the education of indtmt_ria.l workers and training of persona in Library Science. The voluntary orgamsation and institutions engaged in social education were given financial a~sistance. Research and training courses on audio-visual education were conducted and various kinds of equipments of audio-visual education were produced,
Devslopment of Hindi and Sanskrit Efforts to propagate Hindi, especially in the non-Hindi epeaking areas
of the country were actively followed during this year. To increase the supply of Hindi teachers, two Hinr1i teachers' training colleges, one each in Kerala and Mysore were started. Hindi teachers were appointed in High/Higher Secondary schools in non-Hindi speaking States. Hindi books were arranged to be supplied to school and college libraries free of cost. In order to coordinate and supervise the work on the propagation and development of Hindi in the eastern and southern zones, two regional offices were established, one at Calcutta and the other at Madras. To encourge students from non-Hindi speaking States to study Hind., scholarships weregiven, Bi-lingualprimersandreaders were prepared and pubLshed. A scheme for the translation of standard works in Hindi to other regional languages was sponsored and financial assistance was given for preparation of Hindi dictionarit>s. A number of publications on technical terms in important educational subjects was also prepared. '
The important activities in the case of Sanskrit education include inter alia award of research scholarships for students of Sanskrit pathsh.alas, preparat;ion of Sanskrit readers and giving assistance to voluntary Sanskrit <'rganisations. A decision was taken by the Govt. of India to set up a Kendriya Sanskrit Vidyapeeth at Tirupathi during the year. ·
Physical Education
Physical education is gradually getting more and more importance in the country. Many of the schemes of physics! P-ducation included in the St>cond Five Year Plan were continued during the Year. The pattPrn of implementing tho scheme of National Physical Efficiency Drive launched in 1960 was reviewed by the Government of India in consultation with the representatives of the State Governments and others at an all-India Seminar held in July '61. The Central Advisory Board of Physical Education and Recreation was reconstituted and its first meeting was held in December '61,
M/BlD)254'!1tsf Edu-3

'.4
. Ednoation of the Handicapped
The Central Ministry of Education continued its efforts to promote the education, welfare and rehabilitation of the handicapped. Special efforts were made to re-appraise the existing schemes and to orient policies to be adopted during th~ Third Five Year Plan.
As many as 339 awards were made comprising of 87 blind, 83 deaf and 169 other medically handicapped students for which an expenditure of Rs. 385 thousand war. incurred. The first National Seminar on the Training and Eruployment of the Physically Handicapped was convened by the Central Ministry of Edue&tion at Bangalo~e in December, 1961. - An exhibition called the first National. Exhibi1ion with the _theme 'Utility and Freedom for the Physically Handicapped' was also organised at this time.
_ A brief account of the activities of the Stl\tes and Union Territories in the field o£ education is given below :. ::
Andhra Pradesh
Universal free and compulsory primary education was introduced in the State .with effect from lOth April, 1961 for all children of the age-group 6-7.
Government ~nctioned in August, 1961 the scale of pay recommended by :the University Grants Cotnmission for the teaching staff of colleges with retrospective effect from 1st March, 1961 in all Government colleges and in thoEe non-Government colleges in which these scales had not been introduced already. The scales recommended by the U.G.C. were as follows:-. .
Rs.
Principal 600--40-800
Head of a post-graduate department or Head of a graduate department having not less th!ln fo~members of teaching staff 400-25-700
Senior Lecturer 300-25-600
Lecturer. 200-15-320-20-lSOO
Tutor/Demonstrator 150-10-200
These scales (excluding that of Head of a department) were implemented in these Government colleges which had the scales of Senior Lecturer and Lecturer (gazetted) and Assistant Lecturers.
During the year the State G~vernment nationalised and published two text-books. In addition, four more text-books were prepared. The Government also directed that the existing nationalised text-books for Class V should be changed and got re-written according to the integrate~ and c~nde~d syllabus. Accordingly, steps were taken for the preparatiOn ofnat~onalised text-books for classes IV and V, and six books were under preparatiOn.

5
For the propagation of Hindi in the State, various training courses were conducted for training teachers in Hindi. Vohmtary Hindi organisations like Dakshirw, Bharat Hindi Prachar Sabha (Andhra), Hyderabad; Hindi Prachar Sabha, Hyderabad; Aaarsha Mahila Smastha, Raja.mundry; Jhansi Aaarsha Maliila Samastl~a, Masulipatnam; Hindi Premi-Mandali Mahavidyalaya, Tenali and Maltila Samajam, Malakpet, contributed much to the cause of propagation of Hindi in the State. The three institutions in the State coaching up students in Hindi were admitted for grant-in-aid during the year under the Plan programme.
Assam The scheme of national award for teachers sponsored by the Central Govern
ment continued and two headmasters of high schools and two head panrlits of L.P. schools in the State were the recipients of this .award during the year.
The Government sanctioned non-recurring building grants for schools the buildings of which were damaged by storm. Grants and loans were also sanctioned to Rchools and colleges specially for building purposes. Provision was made for more special scholarships for scheduled caste, scheduled tribe and other backward class students in schools as well as in the post-matric courses, Special scholar~hips were also provided for poor students and for the schoolgoing children of political sufferers. The value of research scholarship was raised toRs. 100 within the State and RR, 150 outside the State.
In respect of text-books the Government instituted prizes for the best books in subjects which do not ordinarily attract commercial publishers on account oflimited demands. The publication of selected imoks was also undertaken.
The University of Gauhati introduced pre-university courses in the aililiated colleges from the session 1961-62 e.nd necessary syllabus; regulations etc. for different subjects in this connectin were prepared ~nd circulated to the colleges.
Bihar
The Magadh University with headquarters at Bodh Gaya was established in March 1962. Post-graduate teaching in seven subjects was approved for this university. The Bihar State University Commission, and the Universitv Service Commission were C<'nstituted with effect from 1st March, 1962. The powers and functions of the Bihar State University Commission lire to recommend to the Universities the measu.res necessary for the improvement of university education and advise them on the action to be taken for the purpose of implementing such recommendations. The functions of the University Service Commission is to look after the affairs of affiliated colleges not managed by the State Government.
A total of n~. 7 ·359 ruilliollS was spout on the developm('nt of the RiX universities in t l1e State dtu·ing the year.
The Kashi Pm,ad J«iswa.l Research Institute at Patna, devoted to historical research and archaeology, brought at a valuable book of Bhudhist l"[(ic and philosophy namerl 'Varti K<~lamahararf Prajrw,J.:er Gupta'. On the

6
occasion of the 2500th Birth Anniversary of the Buddha, the Mittila Institute of Post-Graduate Studies and Research in Sanskrit undertook various impor-tant publications. . . . .
Teaching of English was completely abolished from classes IV to VII. Hindi was made compulsory,in all school classes for both Hindi and non-Hindi speaking students. '
Gujarat Primary education was made compulsory in the &ga-group 7-8 almost
throughout the State. .All scheduled caste and scheduled tribe students at all stages of education were exempted from the payment (If tuition and examination fees. The .award of free education to the newly constituted economically backward classes cost the Government a total expenditure of Rs .. 10·494 millions· by way of re-imbursement of fees to non-Government educational institutions.
A Vocational Guidance Institute was set up at Ahmedabad. 14 Career Conferences for university students were organised mostly with financial and other assistance of the Institute. Six educational exhibitions were also organised with the cooperation and material of the Institute.
Gover:D.ment appointed a Central Committee for Children's Literature under the Chairmanship of the Director of Education for the encouragement of children's literature. A . catalogue of existing children's books from 1932 to 1957 was prepared and distributed free of cost to all educational institutions and libraries of the State. A book on bird'i was also published by the same Committee.
lammu & Kashmir One of the special features of education during the year was the efforts
of the Education Department to gear up its activities to the demands of the national emergency by introducing an eight-point programme which includes training in A.C.C. and N.C.C., scouting and girl guide, national discipline, nursing, physical efficiency drive, light vehicle driving, first aid and mass P.T. and parades. It was envisaged in the programme to train about 40,000 boys and girls.
During the y~r seventytwo text books were got printed by the Text Book Section of the Department of Education; In a phased programme the Department proposed to replace all existing text books by more suitable books.
With a view to giving an impetus to women's education in the State, the State Council of Women's Education came into existence with prominent educationists and public spirited persollR as members. The Council met two times during the year and considered some very important problems conner.ted with the progress of women's education in the State.
Kerala A significant development during the year was the constitution of the
State Education Advisory Board. This was the first statutory body set up in any Smte in India to advise Government on educational matters. The

7
Board held three sittings during the year and dealt with problems relating to the improvement of standards, toning up of discipline, improvement of S.S.L.C. reRults and other ma.tters connected with educational policy and administration. Most of the recommf.'ndations of the Board were approved by the Government and orders were passed sanctioning the implementation of the proposals submitted.
Revision of the syllabi for primary, secondary a.nd training schools wa.s a major work taken up during the year. At every stage in the preparation and refinement of the syllabi, expel'ienced and outstanding teachers working at diffiJrent levels were closely associated and the work was completed after discussion and scrutiny by experts in the respective fields of study. Ted books for the various subjects were prepared by expert committees including writers who had received special training in the work in the text book work:ahop, the first of it11 kind in India., for the purpose.
During the year rules regarding triple benefit scheme for teacher~ in aided solwola were framed by Govt. Admissions in training schools were alllo regulated by framing appropriate rules. Three school teachers of the Sta.te_. ware selected for the national award during the year.
Uu.der tho scheme of conducting refresher courses lllluer soiDina.rs, teacherl!l anu officers were deputed to stationl!l outside the state to attend conferenoes and seminars sponsored under the auspices of other States anrl of the Govern· ment of India. Refresher coursel!l for heads of basic training schools, seconaary school teachers, heads of secondary schools and teachers teaching English in primary classes were conducted during the year.
Hindi was introduced as a compulsory subject in the upper primary and high school stA.ges. There were official and non-official agencies· in the field of education engaged in the propagation of Hindi. To coordinate the various a~.tivities of these agencies a Hindi Educational Officer was appointed who worked directly tmder the control of the D.P.I. A sum of Rs. 3,00,000 was sanctioned to the State for the appointment of Hindi teachers and for populariSIIotion of Hindi, t.en scholarships for post-matric studies in Hindi were sanctioned to the students of the State from the Central Government. A Hindi Training Collcga was started at Ramavaramapuram, Trichur with cent per cent Central airl,
Madhya Pradesh
The expansion of education e.t the primary stage was very rapid during the year. At the secondary stage also the demand for educational facilities was observed to be growing rapidly. The State Government revised the pay of all Government servants induding teachers in Government Mrvice. The new departmental set-up for the administrative machinery was enforced which e.imed at bringing tmiformity in the educational administration in diffcrt>nl intt>grating tmits.
Madras
The ba.siu education course in the Statt> was reol'ganised into one of seven years' integrate:! course with a view to bringing it in conformity with the ordinary elementary course of seven years' duration already existing in the

8
State. . ~ revised syllabus for basio school grades I to VII was drawn up by a committee constituted for the purpose and the revised syllabus as finalised by the Coinillittee was approved by the Government. Two Regional Basic Fiducation Conferences held at l:>evakottai and Mettur Dam, made several Ulleful suggestions fot the improvement of basic education. The Basic Education Week was organised and celebrated throughout the State in a befitting manner from 2lst.January to 26th January, 1962.
. : t1nd9r the scheme of nationalisa.tion of text boob arrangements wer~ !!lade for publication of English text books for standard VII for use in all schools during 1962-63.
· · · Fresh statutes were framed in connection with the pension-cum· provident fund gratuity-cum-insurance scheme for the university teachers and staff. A visiting committee of the University Grants Commission consisting of three members, visited the Madras University in December, 1961 to assess the needs of the departments of studies for implementation of development schemes
• ~der "Humanities" during the .Third Plan period.
The D.P.!. of the State went to USSR on deputation as a member of a three-man delegation of Indian Educationists for studying the working of Soviet Schools. He attended the Second Commonwealth Education Conference at Delhi from 11th tO 25th January, 1962, as a member of the delegation. He ~o presided over the UNESCO Regional Symposium on overall educational planning in ABia "St Delhi from 29th January, 1962 to 23rd February, 1962 as the leader of the Indian delegation. .
1fuii Under the scheme for the award of prizes to the best books for children co:n.ducted by the Government of India during 1961-62, two authors of Tamil books were awarded Rs.l500 each a.s prize. The State awards for elementary school teachers were distributed to 47 teachers at a. public function held at Madras under the auspices of the Governor of Madras.
Facilities. to teach Hindi as an additional language were provided in eaoh of those· Anglo-Indian Schools where the Second language taught was one of the South Indian languages, provided there was a minimum strength of fifteen children offering Hindi as an additional language in the school.
Maharashtra The scheme of educational concessions to economincally backward pupils
was transferred from the Social Welfare Department to the Educational Department ftom this year. During the year an expenditure of Rs. 25 · 612 millions was incurred under the normal and p~ budget for educational concessions to economically backward class ·pupils and there were about 442 thousand beneficiaries under this scheme.
Vuring ·the year some non-gazetted p<>sts of assistant lecturers in Government colleges were converted into gazetted posts of lecturers and the post of demonstrator was upgraded. Some additional Class I posts were also introduced in Government colleges. Grants amounting to Rs. 35 0 thousands were paid to the universities for the development programmes approved by the U.G.C. Some grants were also given for int~du?tion of three years• •degree ~ourse and towards. revision of pay scales of umvers1ty teachers.

9
The Bombay University introduced the following revised scales ut pay approved by the U.G.C. for teachers in the university departments ;
Rs.
Senior Professor 1600-1800 Professor Reader Lecturer
1000-1500 700-1100 400-600
During the year the School Book Committee recommended four text books, three in En<rlish and one in Marathi, f01 use in schools out of a total of 31 books received by the Committee for consid~ration.
The Basic Education Week was observed with much celebration and varied activities throughout the State in January, 1962.
Mysore Compulsory primary education was introduced in the age-group 6-7 .. The
now syllabuses introduced at the primary and secondary levels during the past_ two years were progressively extended to other standards. A committee was constituted to assess the existing facilities at the pre-primary stage and to suggest ways and means of improving education at this stage; the eorrunittee submitted ita report to the Government for consideration.
A sum of Rs. 50,000 was provided for the payment of grants to Hindi organisations in the State towards developmental activities. A Hindi Shikshak College was started at Gulbarga at a cost of Rs. 43,370 to train secondary grade teachers in Hindi Shikshak Course. ·
Orissa With effect from September, 1961, the Pancliayat Samities were entrusted
with the functions relating to management control and spread of primary and junior basic education in the State. The pay scales of primary school teachers in non-Government schools were revised. Under the scheme of expan~ion of primary education, 1,000 posts of primary school teachers for the newly opened schools and 2,000 posts for the existing ones were sanctioned. Seminars of inspecting officers were arranged at Bolangir and Berhampur to acquaint the officers in the teaching of English in the structural pattern in the secondary schools. ·
The 49th Session of the Indian Science Congress was held at Cuttack undcr the auspices of the Utkal University from 3rd to 9th January, 1962. T~e. Science Congres:· was inaugurated by Pandit Jawaharlal Nehru, Prime Mm1ster of India.
During the year the scales of pay of lecturers of Government as well as Non-Government Colleges in the State were revised as under :-Lecturer in Government College
Lecturer in Non-Government College
Rs. 260-15-320-20--400-EB-30- 520-EB--40-680 --lS0--780. RR. 245-15-320-20--400-30--520--40--600.

10
. In order to enable women students to prosecute higher studies, 2~ maintenance st~pends were awarded ~n colleges during the year. The monthly value of the stipend was Rs. 20 and It was tenable for ten months a year. ·
Punjab Under the Compulsory Primary Education Act passed in 1960, compul
sory primary education was introduced in the age-group 6-7 with effect from April, 1961.
An ad-hoc committee wae appointed in consultation with the Government of India and the Punjab University for reviewing the question of introducing higher secondary syllabus in post basic ochools. A departmental coordination committee, consisting of the D.P.I. as Chairman and two Joint Directore as members, was also constituted which held frequent meetings to discuss policy matters and to make recommendations to Government. The State Council for Women's Education was also set up during the year.
Under the scheme of conyersion of the four years' degree course into three years' degree pattern, all Government and Non-Government colleges were
- switched over to the three years' degree pattern. The Punjab University revised the pay scalea of university teachers with effect from 1st April, 1961, as follows :-
Professor Reader
Lecturer
Rs.1,000-l'i0-1,~00
Rs. 700-40-980-EB-40-1,100
Rs. 400-30-640-EB-40-800.
During the year, 32 text books in Hindi and Punjabi for classes Ito V and mathematics for classes II to VIII were replaced by new ones selected from the books invited for the purpose from authors and publishers. New syllabi of general science for classes I-VIII and social studies for cla.~ses I-V were framed in collaboration with the Government of India.
Rajasthan The Government took a decision of upgrading middle schools to junior
higher secondary ones. Accordingly 100 junior higher secondary schools were opened during the year as against the target of only ~2.
The Board of Secondary Education, Rajasthan, in a number of meetings, took some important decisions towards finalising courses of study, scheme of examination, etc.
A seminar of deputy inspectors of secondary schools and one for inspectors of schools for orientation in community development were held at Pushkar and Bikaner rPspectively during the year.
Uttar Pradesh The year under report saw the introduction of the schemes of the Third
Five Year Plan on primary education with the ultimate aim of providing universal free primary educat.ion for children of the age-group 6-11 by the end

PROGRESS OF EDUCATION IN INDIA
1957-58 TO 1961-62
RS. IN CROR£$
400
300
.... 200
roo
0 1957-58 1958-59
I NSTlTUTIONS
E)(PENDITURE
._,-..
1959-60
YEAR
1957-5 8
1958-59
1959-60
1960-6 I
1961-62
400
~ ~ ~
300
200
roo
1960- 131 e
1961·62
ENROLMENT
2 3 4 5 IN CRORES

11
of the Plan. Extensive enrolment drives were launched to increase the num: bar of school-going children, specially girls. A number of special measures. like free education upto elMs VIII in villages and sma.ller towns, opening of continuation cla.sse~, appointment of school mothers, financial aid for purchase of books and stationery, award of prizes, provision of residential quarters for women teachers, hostel facilities, etc., were taken to give impetus to girls' education. ·
The sphere of secondary education also showed much activities. Some senior basic schools were upgraded to higher secondary ones, some were opened on grant-in-aid basis, some existing ones were brought under the grant-in-aid list and some others introduced science courses and other new subjects. ·
The Mctn()!Jigyanshala at Allahabad with psychological centres and school psychologists tested and guided about 10,000 students of classes VIII-XII. A project regarding the gifted children was also planned by the Manavigyanshala.
The Uttar Pradesh Universities Act was enforced with the aim of improving the administration of the State universitie~ by changing the proccduro of appointment of the Vice-ChancPllor~.
West Bengal
The Government revised the scales of pay of school teachers at the elementary and secondary stages of education. The pay scales of college teachers were also revised as detailed below :-
Principal
Head of Department
Senior Lecturer
Lecturer
Rs. 600-40-800
Rs. 403-25-700
Rs. 300-26--600
Rs. 200-15-320--20--500
A total amount of Rs. 10,61,879 was released as matching grant for the purpose during the year. ·
Thrt>e years' degree course scheme was introduced in colle..,es and additional staff was appointed under the scheme.
0
For providing housing facilities for teachers, 182 new units of twin t<!achers' quarhlrs at the est-imated cost of Rs. 10,000 for each unit were sanctioned for accommodating 364 t()achers.
Hindi WtlS introduced as a. compulsory subject in classes VI and VII from the year under review inst()ad of classes V and VI.
Andaman & Nicobar Islands
The year under review marker! the expansion of facilities for education at tho school and hight>r stages. A numoor of scholarships wer() gra.ntod for

12
students for higher studies in the Mainland. Teachers, training schools were .strengthened to increase the supply of teacher~. Facilities for girls' education were expanded, school buildings were newly constructed and expanded. Two Principals and a number of teachers were recruited to man the educational institutions. · Provision of special facilities were made for the education of students from the tribal areas of Nicobar group of Islands.
Dadra & Nagar Haveli
The Administration organised grouping of schools selecting some welldeveloped schools as central schools and their surrounding schools as subordinate schools. The headmaster of a central school was authorised for constant checkup of his subordinate schools through visits and giving guidance to their teachers.
Delhi
Introduction of crafts, gradual conversion of primary schools to the basic type, opening of non-basic elementary schools, introduction of compulsory primary education, reorientation of primary teachers' training institutes and introduction of television in schools for educational purposes were some of the highlights of the development programme carried out by the Delhi Administration.
Himachal Pradesh
The Himachal Pradesh Board of Basic Education was const;tuted during tl>e year.
A sum of Rs. 1,15,000 was provided in the current year's non-Plan budget to be given as grant-in-aid to the privately managed educational institutions in the :r'erritory.
L.M. & A. Islands
General development was observed. in the field of education. Some of the important aspects were the opening of new schools, appointment of new teachers, providing quarters for teachers,' supply of teaching aids and apparatus, running of social education camps wherever necessary and organisation of reorientation training camps.
Manipur
To meet the needs of the people in the field of education, diffl'!rent measures were taken to speed up the development of education by opening more N. E. S. Blocks, more schools and more literacy centres and by forming Development Committees. Various recurring and non-recurring grants-in-aid were given for the
13
maintenance of the schools for construction of school buildings, hostels, teachers' quarters, commtmity centres, youth clubs and science blocks, for purchase of furniture and as schol~Uships and stipends.
Pre-University classes were opened for the first time in all the general education colleges. One Sar>..skrit school having 'Upadhy' classes and twenty Hindi schools having 'Vsharad' and 'Kobid' classes were upgraded to special c.olleges.
Nagaland
Some new schools were started during the year. The Government proposed to take over the Mokokchung Art College and an amount of Rs. 2,00,000 was allotted for buildings and pay of staff of the college.
NEFA During the year most of the existing primary schools were converted into
the basic pattern. Indigenous music, dance and drama figured prominently aa. co curricular activities.
Thirtyone NEFA tribal people from border areas were sent on a spe<-ia.l 'Bharat Darshan' tour to see the important places in India and a sum of Rs. 30,000 was sanctioned for the purpose.
Pondicherry
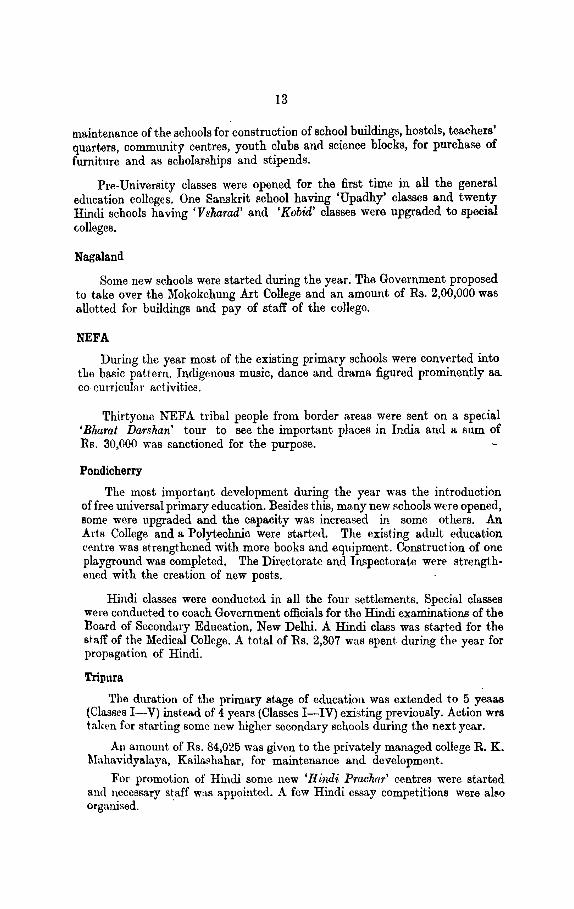
The most important development during the year was the introduction of free universal primary education. Besides this, many new schools were opened, some were upgraded and the capacity was increased in some others. An Arts College and a Polytechnic were started. The existing adult education centre was strengthened with more books and equipment. Colli!truction of one playground was completed. The Directorate and IIU!pectorate were strengthened with the creation of new posts.
Hindi classes wore conducted in all the four settlements. Special classes were conducted to coach Government officials for tho Hindi examinatiolli! of the Board of Secondary Education, New Dellti. A Hindi class was started for the staff of the Medical College. A total of Rs. 2,307 wus spent during tl1P year for propagation of Hindi.
Tripura
Tho duration of the primary stage of education was extended to 5 yeaas (Clasf!es I-V) instead of 4 years (Classes I-IV) existing previously. Action wrs talwn for starting some new higher secondary schools during the next year.
An amount of Rs. 84,025 was given to the privately managed college R. K. Mahavidyalaya, Kaila~hahar, for maintenance and development.
For promotion of Hindi some new 'Hindi Prachar' r-entres were started and necessary staff was appointed. A few Hindi essay competitions were also orgt~n.isod. ·

Type
RooognieedUnlvoraitieo Boarda of SO('()ndary
and Intormodiato Education.
Rcooaroh Inotitutlono Arto & Science Colleges.
CoUe.ges for Profeasional and Toohnioal Education-Agrloultu"' Commoroo Education (Toachora'
Training) Engineering Forestry. Law Jdodicino Phyoioal Education •
. Technology Vot.rinary Scionoo. Olhcra
Total
CoUegeo for Special Education-Home Science . Mosie, Dancing and Other Fino Arto Oriental Studioo. Sociology. Otheno
Total
Schools for General EdurationHlgh/Higbor Seocn-!Bry Middle ' Primary Pro-Primary
Total
Schoobo for Vocational & Technical Educa· tion-Agnoultnro Commerce • • Engineering & Techno--
logy • · Forootry • •
Marino Training • Modioine and Veteri-
nary Soi~nce. Phyoical Education • Toachon' Training • Technical, Industrial
and Arto & Crllfto. Otbera
Total
14
Table I-Number of Institutions by Type
For Boys ~
1960-61 1961-62
ll 3
44. 13
41 874
36 42
386
66 ·3 38
129 19 12 18 6
755
101 8
31
187
14,736 44.,997
3,Io,mo 1,679
3,71,982
101 1,183
282
4 5
49
41 881 727
15
3,288
44 957
38 62
44.9
78 3
44. 139 19 11 18 4
855
4.7
107 7
35
196
16,522 60,765
3,29,473 1,944.
3,98,704
104 766 293
4 6
66
43 873 696
14
2,8M
For Girlo
1960-61 1961-62
16~
92
97
4 7
10
21
2,521 4,66~
19,829 230
181
101
106
4 7
10· I. 4
26
2,784. 5,150 22,0,';7
396
Total Increase ( + or
1960·61 1961-62 Decreaae (-)
6 7 8
45
13
41 1,039
36 42
478
·,66 3
38 133 .
20 12 18 6
852
Ill 8
31
208
17,267 49,663
3,30,399 1,909
44 1,138
38 ~2
660
78 3
44. 143 20 ll 18 4
961
117 8
39
222
19,306 5~,916
3,51,630 2,240
!+) 1 l+l 1
l+l s (+)99
It) ll 1+)10 1+)71
1+)12
l+l 6 1+)10
(-)1
(-)J
1+)109
1+)6
1+!8
1+!14
l+l 2,049 l+l 6,262 I+ )21,131 l+l 331
27,246 30,287 3,99,228 4,28,991 1+)29,763
I 6 1
121
267 471
867
2 4
' 121
260 51)()
897
102 1,189
283
4 6
170
41 1,138 1,198
16
4,146
106 770 297
4 5
183
43 1,133 1,196
14
3,751
(+) ' 1-)4111 (+) 14
(+)IS
(+) I (-) 5 1-l 2
1-l (-)394

I NST·ITUTIONS BY TYPE, 1961·62 J ALL INSTITUTIONS 6,85,602 ~
~0
' 40
30
20
10
0 -4nD~~-------C~==L------UNIVERSITIES BOARDS OF SECONDARY
& INSTITUTIONS INTERMEDIATE EDUCATION
IN THOU~NOS
60
50 ---------------
40 --------------------
30 -------- ----
10-------
0 31
POST-BASIC HlGH/HIGHER SCHOOLS SECONDARY
SCHOOLS
50
40
30
2 0
10 ------0

RECOGNISED INSTITUTIONS BY MANAGEMENT 1961-62
MANAGEMENT
GOVERNMENT
DISTRICT BOARDS
MUNICIPAL BOARDS
PRIVATE AIDED
PRIVATE UNAIDED
(EACH FULL SYMBOL = 2~.000)
INSTITUTIONS
6,85.602
PERCENTAGE
15.()/.
~ ~ (~
476 1.

15
Table !-Humber of Institutions by Type-(Contd.)
2 3 "' 5 8 7 8
&U.ool• for Special Edu-caiion-For the Ha.n:die•pped 138 158 ~ 14( 18» !+)18 Yor School Worken 41 3~ 7 3 4i (! (-)T 1faJio, D~f'ini aad o\ht-r Fine Arta , 17( 15~ 8( 6( ~38 21ft (-)22 Orient.! Sludi .. 3,462 3,424 24 20 3,488 3,((9 (-)37 &!ol'tiiAiory 84 37 8 12 43 (9 <+l' 8oeiaJ (Mull\ Edu-
O&tion (Q,672 1,61,703 13,143 84,505 62,815 1,46,208 ( + )1,83,393 0\hra 273 275 35 35 308 310 <+>•
Total 53,7g7 1,65,783 12,287 84,652 67,084 2,00,43~ <+ )1,83,301
GaANo TorAt.. (,30,081 5,60,452 {1,67( 1,16,150 4,72,6M 6,80,602 <+ )2,12,94.7
STATISTICAL SURVEY lnJtitutio!lll
The number of recogaised educa.tivnal institutions in India were 6,85,602 in 1961-62. Tblli showed an increase of 2,12,947 institutions over the previous year. This increase works out to about 4G per cent. Th<' corresponding increase in the previous year was only 7 · 5 per cent. In table I is given the details of the institution,~ by type. It will be seen from the table that even though there was_a decrease iu the number of institutions of certain type the decrease was very nominal. Majority of the type of inst-itutions showed increase and a few remained stationary in num1wr. On percentage basis tho highest decrease of 35·2 in commerce schools was due to the fact th<~.t many institutions which had no educational contents (e.g., typing sc-hools) were dropped from reckoning while the abnormal increase (292·0 per cent) in the case of social (adult) education schools gives a glimp&l of the hit impetus that social education received during the ye:~r. Other notable increase was recorded by commerce collecrea (23 ·8 per cent), engineering coll•,ges (18·2 per cent) and pre primary scho~ls (17 · 3 per cent). Higb/Higher Secondary schools increased by 12 per cent during the year and middle schools by 12 · 6 per cent.
Table II-Number of Recognised Institutions by Managemen~
U.iliO-lil 1961-62 .--··------_J'-· --------,
:\umbur "I>ert:eutage .---. --.A.-----.
N um h0r Percentage
~ ~ 4 6 -- ·---- ------ ---- ---------~.
Go\"ernulL•nt :lti,E:!V :!0·6 1,03,2o19 n·1 Dia trit:t B0n.rdo 2,UO,:!S6 43·t.) 2,30,6<;5 33·6 llunicipr.l B._~f\rtb l~.lj~'; 2·7 12,901 1·~ PriYat(\ Bntht'~:-
Aided 1,43.~1-);) .i0·5 3,2G,370 47·6 l.'nai1it>J l:!):h.iS 2·7 1~.467 1·8
Total 4."7~.:;,).1 IOo·o . ,85,602 100·0
'II;B(. ·)5!)lvF\lucation-4(u)
16
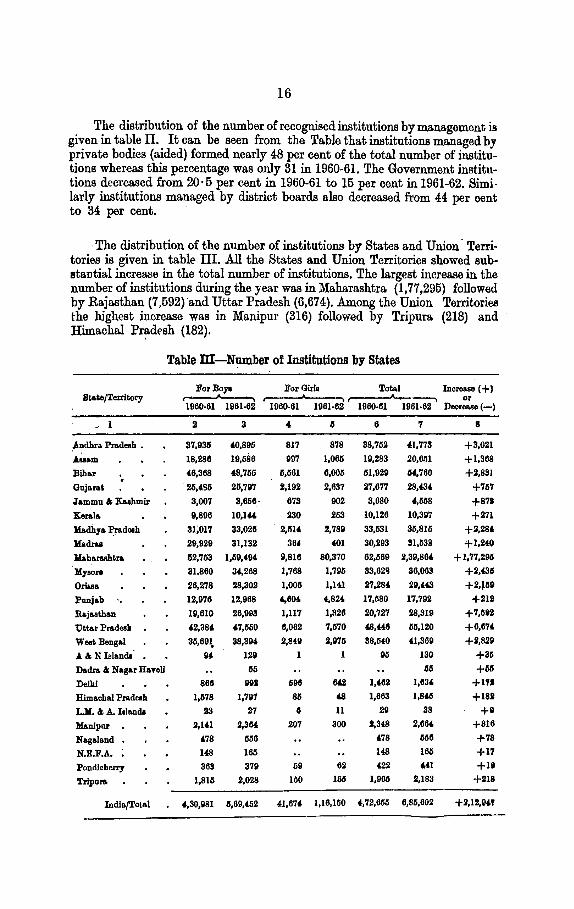
The distribution of the number of recognised institutions by management is given in table II. It can be seen from the Table that institutions managed by private bodies (aided) formed nearly 48 per cent of the total number of institutions whereas this percentage was only 31 in 1960-61. The Government institutions decreased from 20·5 per eent in 1960-61 to 15 per cent in 1961-62. Similarly institutions managed by district boards also decreased from 44 per cent to 34 per cent.
·The distribution of the number of institutions by States and Union- Territories is given in tablt> III . .All the States and Union Territories showed substantial increase in the total number of institutions. The largest increase in the number of institutions during the year was in Maha.rashtra (1,77,295) followed by Rajasthan (7,592) and Uttar Pradesh {6,674). Among the Union Territoriea the rughest increase was in Manipur (316) followed by Tripura (218) and Himachal Pr~d~sh (182).
S~atejTerrltory
~ 1
Andhra Prade8h .
.luam
Bihar ·• Jammu & Kashmir
Keralo.
Madhya Pradeeh
Uadru
ll&barMh~rt.
My son
on.... Punjab
R&j ... than
U~tar Pradeslo
Weet Bengal
A & N lelandl
Dadr& & Nagar Ha'fell
DeiiU
Himachal Pradeeh
L.lf. & A. laliiildl
Jllanlpur
Nagaland •
N.E.F.A. ; Pond! cherry
Tripara
IndlajTo~al
Table ID-N~ber of Institutions by States
ForBo;ya ~ 1960-61 1961-62
37,935
18,286
~.368
25,495
3,007
9,896
81;017
29,929
52,753
31.860
26,278
12,976
19,610
42,384
35,69\
94
866
1,578
23
2,141
478
148
369
1,815
4,30,981
3
40,895
19,586
48,755
25,7117
3,656-
10,144
33,026
31,132
1,59,494
34,268
28,302
12,968
26,993
4.7,550
38,394
129
55
992
1,7117
27
2,364
056
165
379
2,028
For Girla Total Increase ( +) -. ,-----"----, or
1960-61 1961-62 1960-61 1961-62 Decrease(-)
817
997
5,561
2,192
673
230
2,514
364
9,816
1,768
1,006
4,604
1,117
6,062
2,849
1
696
85
0
207
59
150
878
1,065
6,005
2,637
902
253
2,789
401
80,370
1,795
1,1<11
4,824
1,326
7,570
2,975
642
48
11
300
62
166
1,16,150
6
38,752
19,283
51,929
27,677
3,680
10,126
33,531
30,293
62,569
33,62~
27,284
17,1180
20,727
48,446 38,540
95
1,462
1,663
29
1,348
"8 148
422
1,965
7
41,773
20,661
04,760
28,43'
4,558
10,3117
35,815
31,533
ll,39,804
36,063
29,4.43
17,792
28,319
50,120
4.1,369
130
55
1,634.
1,84.11
38
2,604
566
165
441
2,183
6,85,602
8
+3,021
+1,368
+2,831
+7117
+871
+271
+2,28'
+1,240
+1,77,296
+2,435
+2,J59
+212
+7,512
+6,674.
+ll,829
+35
+55
+l7J
+182
+D +316
+78
+17 +19
+218

17
The number of recognised institutions in rural areas increased from 4,10,028 in 1960-61 to 5,93,497 during 1961-62. This shows an increase of 44·7 por cent as compared to 6 · 2 per cent in the previous year. The po::cen~g~ of number of institutions in the rural areas to the total number of mst1tutions decreased slightly from 86·8 por cent in 1960-61 to 86·6 in 1961-62. The break-up of these institutions is given below l-
Institutions in Rural Areas
Type of Institutions
Universities
Rooearch Institutions
Colleges
Secondary Schools
Primary (incluiling Pre-Primary) School•
Vocational & Technical Schools .
Social (Adult) Education Centre;
Other Special Education Schools
Total
1960-61 1961-62
4 4
3 3
263 270
49,464 66,239
3,01,518 3,21,122
984 789
55,546 2,ll,390
2,246 3,680
-------4,10,028 5,93,497
Enrolment-The enrolment by type of institutions in 1960-61 and 1961-62 is given in Table IV. The total enrolment in recogniBed institutions in Inrlia. increased from 48 million in 1960-61 to 54 million in 1961-62 which gives an increase of 13·2 per cent. The corresponding increase in the last year was only 7 · 7 per cent. Girls constituted 31 per cent of the total enrolment as compared to 29·7 per cent during 1960-61. • . •
Barring a few, all types of institutions showed an increase in enrolment. AB is to be expected, tbe maximum increare in enrolment was in primary schools followed by middle and high/higher secondary schools. Institutions for social (adult) education also showed substantial increase in enrolment.

!'able IV-Number o! Pupils bJ '1'ypes o! Institution&
Boys Girla Total Incwease (+)or derre ... e(-) Type
1960-61 1961-62 196C'-61 1961-62 1960-61 1961-62 Number Percentage
I 2 3 4 0 6 7 s 9
~ rta and Science C •llegea (Including Reae&rch Ins-titutions and University Departments) . . 6,28,183 6,61,467 1,30,782 1,64,631 7,67,96~ 8,06,098 +38,133 + 5·0
<'oUeges for tof06sional and Technical • ducation-Agriculture 10,601 12,326 103 141 10,704 12,467 + 1,763 + 16·5 Applied Mts and Archi-1>. tecturo 1,273 o/ 1,940 164 179 1,437 2,Il9 + i82 + 47·5 Commcr<:e ' 27,403 36,395 l~ducn.tion (Teachers'
783 !)40 28,186 37,236 + 9,049 + 32·1
Training) 33,381 38,623 17,354 20,960 50,735 59,583 + 8,8·!8 + 17·4 Engineering E. 39,625 I 44,652 q.-'l.~o, 169 25o51~ 39,794. 44,902 '1-'l :l.l-1+ 5,108 + 12·8 ,_. Forestry 0 626 698 626 698 + 72 + 11·5 00 1.-aw 15,239 16,43!) 591 "605 15,830 17,044 + 1,214 + 7·7 nrcdicine :J0,225 33,306 7,790 8,8i9 38,024 42,125 + 4,101 + 10·8 Phyr:;i('nl Education 1,107 1,2:J5 299 330 1,406 1,565 + 159 + ll·3 Technology E 1,797 ../ 2,117 162 83 1,959 2,200 + 241 + 12·3 Vnt t·.rinn.ry Rcienrc 5;158 5,176 32 38 5,190 5,21' + 24 + 0·5 Ot.ho" 396 41(1 4 6 400 422 + 22 + 5·5
ToW I,66,B:n l,U:l,:l23 27,460 32,251 ] ,94,291 2,25,57' +31,283 + 16·1
; 'dlcgt'.·> for Rpcc:ial Edu-rntion-Home Sl'ir-nt.:o 2,089 2,416 2,089 2,.!16 + 327 + 16·7 ~Iusic, Dl1nein~ and 01 her Fi11o Art H :!,492 3,474 5,138 5,392 8,630 8,btl6 + 2:l6 + 2·7 Orient~ I St.udit'" 8,862 9,o:;w 2,65i 2,15U 11,519 11,176 :l4:l - 3·1) Sociology 775 63:; 182 180 057 815 142 - 14·8 Ot her• 1,991 . 2,39! Ill 681 2,102 3,075 + 973 + 46·3
Tots! 15,120 lfi.G23 10.177 10,825 25.2U7 26,348 + 1,051 + 4·2
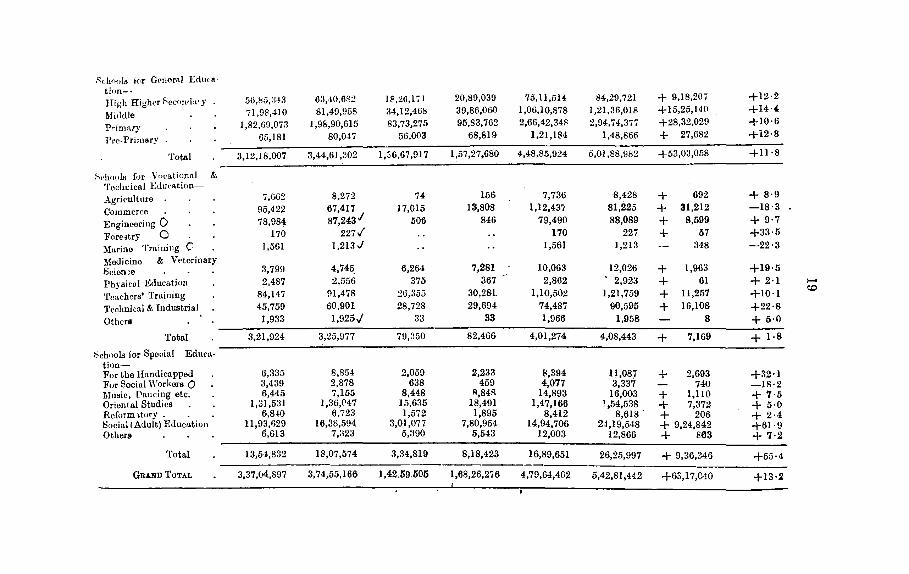
St:l.Iool.s tor General Edw·tt· tion-~
High Hight:r f-iecowla• y 56,HG,:H3 63,40,682 18,26,171 20,89,039 75,11,5a 84,29,721 + 9,18,207 +12·2
Mi•ldle 71,98,410 81,49,!158 :J4,12,46S 39,86,060 1,06,10,878 1,21,36,018 +15,25,140 +14·4.
p .. jrnniJ' 1,82,69,073 1,98,90,615 83,73,275 95,83,762 2,66,42,34~ 2,94,74,377 +28,32,029 +10·6
1-'re-Primary 65,181 80,047 56,003 68,819 1,21,184 1,48,866 + 27,682 +12·8
Total 3,12,18,007 3,44,61,302 1,:56,67,917 1,57,27,680 4,48,85,924 5,01,88,982 +53,03,058 +!1·8
S1·hools for Vocational & Tochcical Edu<'ation-
Agriculture 7,662 8,272 74 156 7,736 -8,428 + 692 + 8·9
Commerco 95,422 67,417 J 7,015 13,808 1,12,43'i 81,225 + 31,212 -18·3
Engincoring 0 78,984 87,243/ 506 846 79,490 88,089 + 8,599 + 9·7
Fore<try 0 170 227./ 170 22i + 57 +33·5
)!arino Training 0 1,561 1,213/ 1,561 J ,21:l :l48 -22·3
Modicino & Veterinary Bcion~e 3,799 4,745. 6,264 7,281 1(),063 12,026 + 1,963 +19·5
Pbyaicul Education 2,487 2,556 375 367 2,862 2,923 + 61 + 2·1 ...... 'l'eat'hers' Training 84,147 91,478 26,355 :J0,28L 1,10,502 1,21,759 + !1,257 +10·1
~
Technical & Industrial 45,759 60,901 28,728 29,694 74,487 90,595 + 16,108 +22·8
Others 1,933 1,925/ 33 33 1,966 1,958 8 + 5·0
Total 3,21,924 3,25,!)77 79,350 82,466 4,01,274 4,08,443 + 7,169 + 1·8
Schools lor Special Educu.-tion-Fur the Handicapped 6,335 8,854 2,059 2,233 8,394 ll,087 + 2,693 +32·1 For Social \Vorkers 0 3,439 2,878 6:J8 459 4,077 3,337 740 -IR·2 JHuHic, Dancing etc. 6,44.5 7,155 8,448 R,84S 14,893 16,003 + 1,ll0 + '1·5 Orien1 al Studios l,al,531 1,36,<'47 15,635 18,491 1,47,166 1,54,538 + 7,372 + 5·0 Reform 1.tury . 6,8!0 6,723 1,572 1,895 8,412 8,618. + 206 + 2·4 Social I Adult) l~ducation ll,93,629 16,38,594 3,01,077 7,80,954 14,94,706 24,19,548 + 9,24,842 +61·9 Others 6,613 7,:!23 5,~90 5,543 12,003 12,866 + 863 + 7·2
Total 13,54,832 18,07,574 3,34,819 8,18,423 16,89,651 26,25,997 + 9,36,346 +55·4
GnA.ND ToTAL 3,37,U4,897 3,74,55,166 1,42.591505 1,68,26,276 4,79,64,402 5,42,81,44.2 +63,17,040 +13·2

20 .
Table V-Number of Pupils in Recognised Institutions by Management
1960-61 1961-62 Increa£e ( +) Management or Decrease(-)
Number Percen-,--A------,
Number Percen---,
Number Percen-tage tage tage
2 3 4 5 6 7
Government 97,55,459 20·4 1,11,82,933 20-6 +14,27,474 +14·6
District Board 1,86,25, 754 38·8 2,13,92,613 39.·4 +27,66,759 +14·9
Municipal Bo&rd 34,70,666 7·2 34,69,252 6·4 1,414 - 0·0
Private Bodies-
Aided 1,46,44,0!)4 30·5 I ,67 ,98,840 30·9 +21,54,716 +14·7
Unaided 14,68,429 3·1 14,37,90! 2·7 - 30,625 - 2·1
Total '· 79,6-1,402 100·0 5,42,81,442 100·0 +63,17,040 +13·2
Table V gives tho distribution of this enrolmmt according to type of ma.nagement. Of the total enrolment, above 40 per cent were in institutions managed by District Boards. 31 per cent of the enrolment was in private aided institutions. Government institutions enrolled about 21 per cent of the pupils. The balance were in Municipal Board institutions and private unaided inFtitution.S. Even though there was a substant-ial increase in the number of institutions managed by privat-e aided bodies as compared to 1960-61, the percentage enrolment in this type of institution has not increased as compared to enrolment in Gove=ent and District Board institutions.
The distribution of the total enrolment of IJUpils by stage of education and sex is given in table VI. There was a general increase in enrolment at a.ll stages of education excepting the int-ermediat-e and post-graduate diploma stage. The decrease in the intermediate stage may be due to the gradual abolition of this stage in the country. The maximum increase in enrolment was in social (adult) education (61· 9 per cent) followed by B. A., B.Sc. (21· 3 per cent) and pre-primary (21·1 per cent.)
The number of pupils enrolled from rural areas rose from 34 million in 1960 61 to 39 million during 1961-62 whichconstitutes72·2percentofthetotal enrolment as against 71· 6 pei: cent in the previous year. The percentage breakup of these students in pre-primary schools, 0 ·1 per ~nt, primary s~hools 61·1 per cenl;, secondary schools 31· 8 per cent, professiOnal and special schools 6 ·1 per c-ent and l'nllpg,-.s and universities 0 · 9 per cent.

PUPILS RECEIVING GENERAL EDUCATION 1961-62.
POST GRADUATE t? 52,116 t •30.00,000 i -50,000
FIRST DEGREE t t ~ ~ ~ ~ ~ ( 3,62,065
INTERMEDIATE ~ ~ t ~ ~ ; t ~ ; 4,45.6<5
SECONDARY ; t ~ t ~ 1,22,35,666
PRIMARY t t t ~ t ~ ~ t t t t t 1 3'75
'7s,o>g
PRE-PRIMARY t ~;; ~ 2,6,311
----------..1

Table VI-Number or Pnpi.IJ in lnltitutiont by Stagea of Instructioill
Total In creMe ( +) or Deerell86 (-) r- -----------"----~ ,--- __ ___,.,__ ___ ..
1B60-61 I !)61-62 Number Percentage
Boys Girlo .-------A-------. r-------_____.A...-----~
J9(l\J~tll 1961 ~62 19GIJ.til I !!6!-6~
2 3 4 5 6 7 8 9
~~·---·-----
c -~nf)rnl Edu(·nt iu11-
Pre-Primary 96,520 1,22,()81) 82,1~2 93,631 1,78,642 2,lG,317 + ~7.675 +~1·1
Prillla.ry 2,26,87,:~-~w 2,4~},67,!?2:! 1.09,-1~ ,051 I ,26,10,907 ~.36.~1 ,:)91 ;l, 75,78,129 +39,46,738 +11·7
~liddlo 55,3~.~1.16~ t)IJ,:~5,324 19,11,178 21 ,53,63"5 jJ,79,58~ 81,8~.959 + 7,09,375 + 9·5
I [i~h I J{i ~~lu~r Soc1 >nd.ar y :.!7,7G,3l4 :u ,\l~.oz;, f'.80,?9() 8,48,682 34,6~.709 40,46,707 + 5,8:),998 +16·9
lt1h·rmedin.~ c . 3,81,384 3,68,824 76,517 77,021 4,57,901 -4,45,845 12,056 - 2·6
IJ. A.,IB. Sr. 2.~5,6:$:1 2,81,950 63,:179 80,715 2,99,012 3,62,665 + 63,65:l +21·3
~L A.,I'/IL Sc. :Ht,87J 40,945 9,21[) 10,763 4G,0Sh 51.708 + 5.620 +12·2
Pu~t Grnduat~ ])ip. 3115 322 12 31 :177 35:l 24 - 6·4 ~
Ht·~cflrr·h :l,S79 4,178 768 779 4,647 4,957 + 310 + 6·7 ....
Total 3,17,56,iJ.! 3,50,19,476 I ,38,0:l,G37 1,5b, 76,164 4,55,60,351 5,08,95,640 +53,35,289 +ll·7
Pr1.·ft"'tdonal & Tochnirnl Education (Collegiate) :!,38,087 2,66,695 ~6.124 29,889 2,65,1J I 2,96,584 + :u ,473 +11·9 Special Ecluca..l ion (Colle-~itLI.u) 14,500 15,572 t,..:;,t) S,413 21,855 23,985 + ~.130 + 9·7 Voc.atioual & T('\chni<·al Educ11t.ion (School) 3,~9,498 3,47,891 81!,45(1 91,405 4,25,047 -4,3!!,2% + 14,24\l + 3·4 Social (A dulL) Ellucation 11,93,629 16,38,594 3,01,0i7 7,80,554 14,94,706 24,19,148 +9,24,«2 +61·8 Speciu.l El1ucation (School) 1,61,569 1,66,968 35,763 30,851 1,97,332 2,06,789 + 9,4~7 + 4·8
GRJ.ND TOTAL 3,37,04,8!!7 3,74,55,166 1,-42,59,5C5 '1,68,2e,276 4,79,&!,402 5,42,81,442 +63,17,0-40 +13·!

Table VD-Number of Pupils in Recognised institutions b:v States For Boys ForGirla Total Increase ( +) or Decrease (-)
State/Territory ,- --") ,---------"- r-----.A. ,-- -, 1960-61 1961-62 1960-61 1961-62 1960-61 1961-62 Number Percent3.2e
2 3 4 9 6 7 8 9
Andhrn Pradesh 35,65,252 40,49,492 1,63,843 1,85,401 37,29,095 42,34,893 + 5,05,7118 + 13-6 Assam 14.41,079 15,66,131 1,02,903 1,10,495 15,43,982 16,76,626 + 1,32,644 + 8·6 "Bihar 41,36,176 43,98,522 3,66,504 3,90,628 45,02,680 ~7.89,150 + 2,86,470 + 6·4 Gujarat 24,91,580 28,18,734 3,60,197 4,20,076 28,71,777 32,38,810 + 3,67,033 + 12·8 Jammu & Kashmir 2,44,253 2,80,733 71,521 83,444 3,15,774 3,64,177 + 48,403 + 15•3 K••al& 32,09,756 ~3.93,793 1,19,P26 1,39,8PI 33,29,582 35,?3,674 + 2,04,092 + 6•1 Madhya Pradesh 22,99,237 25,36,451 2,73,980 3,17,241 25,73,217 28,53,692 + 2,80,475 + 10·9 Madras 43,10,553 47,79,423 1,41,590 1,53,645 44,52,143 49,33,068 + 4,80,925 + 10·8 M~h&rash t "' 50,51,937 58,28,214 0,08,350 ll,24,647 - 56,60,287 69,52,861 + 12,92,574- + 22•8 Mysore 25.~6,402 29,77,476 3,07,287 3,30,802 28,93,689 33,08,278 + 4,14,589 + 1'·3 K OriBBa 16,25,67;3 17,20,828 52,015 54,4-34. 16,77,690 17,75,262 + 97,572 + 5•8 1:-:J
Punjab 16,84,067 21,10,781 4,71,618 6,21,101 21,55,685 27,31,882 + 5,76,197 + ~6·7 Rajasthan 13,86,578 1!1,25,609 1,38,779 1,55,501 15,25,357 17,81,110 + 2,55,753 + 16•8 Utt&r Pradeah 49,81,(\l:l 57,51,384 6,63,997 8,28,908 56,45,010 65,80,292 + 9,35,282 + 16·6 West Bengal 36,69,424 39,33,701 4,10,420 4-,49,595 40,79,844 43,83,296 + 3,03,452 + 7·4. A. & !'i. Islan<h 6,011 7,~60 164 307 6,175 7,667 + 1,492 + 24·2 Dadra & Nagar H>n-eli 4,096 4,096 + 4,096 + 100·0 Delhi 3,07,947 3,51,236 I ,80,061 2,02,467 4,88,008 5,53,703 + 65.6~5 + 13·5 Himachal Pradesh 1,07,615 1,19,932 6,774 7,160 .1,14,389 1,27,092 + 12,703 + ll·l L. M. & A. Island• 3,508 3,813 601 882 4,109 4,695 + 586 + 14•3 Manipur 1,39,531 1,54,213 21,290 25,745 1,60,830 1,70,958 + 10,128 + 11·9 !'iugaland. 47,635 52,655 47,635 52,655 + 5,020 + 10·6 N.E.F.A .. 7,155 7,896 7,155 7,895 + 740 + 10•3 Pondicherry 36,192 -!3,818 9,776 10,596. 45,968 54,4.14 + P,446 + 18•, Tripura 1,27,176 1,44,18~ 7,145 8,007 1,34,321 1,52,196 + 17,875 + 13·3
INDIA TOTAL .4-,34,65,752 4,86,60,479 44,98,650 56,20,963 4, 79,64,402 5,42,81,,'42 +6?.17,0!() + 1:!•2

~;EN-;ITURE 8~N EDUCATION
1 =~~:: 70·S4 SOURCES ., 1------ 1961-62
10
so
40
10
0 GOVERNMENT
FUNDS BOARD FUNDS FE S CT !NDOWMENTS
BOARD FUNDS

'23
The Sta.tewise distribution of enrolment of pupils at d.ifferoo.t stage<~ of education is given in table VII. In all the Stat:s and Union Terri~ories there is l'_n increase in the total enrolment. The maxrmum percentage mcrease was Ill
Punjab (26·7 per cent) followed by :\Iaharashtra (22·8 per cent). Among the UniOJ, Territories the maximum increase in enrolment wa& in Andame~n and Kicubar Islan<h (24· 2 per cent) followed by Pondicherry (18· 4 per eent.). A.t the all-India basis, the enrolment increased by 13·2 per cent over the previous year.
Expenditure
1'he total expenditure on all recognised institutions in India came to 396· 35 crores in 1961-62 as agaimt 344· 38 crores in the previous year. This shows an increase of 15·1 per cent as against 14· 6 per cent in 1960-61. Of "the total expenditure Rs. 293·32 crorcs (74·0 per cent) constituted direct expenditure and the balance indirect expenditure. The corresponding figures for 1960-61 are Rs. 257 · 36 crores and R~. 87 · 02 crores. Fw'ther, the total expenditure 011 institutions for boys came to Rs. 357 · 25 crores and that on institutiollB for girls toR~. 39·10 CJ·ores, the corresponding expenditure for 1960-61 being 310 · 77 crores and 33·61 erores.
Table Vm-Expenditure on Education by Sources
1960-61 1961-62 Sources -,
Amount Percent- Amount Percent-_age age
2 3 4 5
Government Funds 2,3~,09,13,831 68·0 2,71,83,64,789 68·6
Diot rioi Board Funds 11,83,36,226 3·4 13,96,73,107 3·5
ldun:cipal Board Fundo 10,65,78,153 3·1 12,22,32,412 3·1
Fees 59,02,58,393 17•2 65,60,69,434 16·fl
Endowment! ~.80,81,799 2·8 10,02,48,678 2·.5
Other Source• 18,96,32,738 5·5 22,69, 71,362 5·7
Total 3,«,38,01,HO 100·0 3,96,35,59, 782 100·0
, . Table VIII giv:s the distributi01~ of e~penditure on education by sourceRSligh~ly more than 213 of the expenditure IS met from Government funds. Fee. contnbuted 17 I~er ?ent of the total exP?~ditnre. The rest of the expenditure was met from D1gtnct Boarcl funds, liiuuimp>>l Board funds, Endowments and Other ~ources. The percentage contribution of the different sourc~s to the total ('I:pennitur~ has not changed very much from the previous year.
24
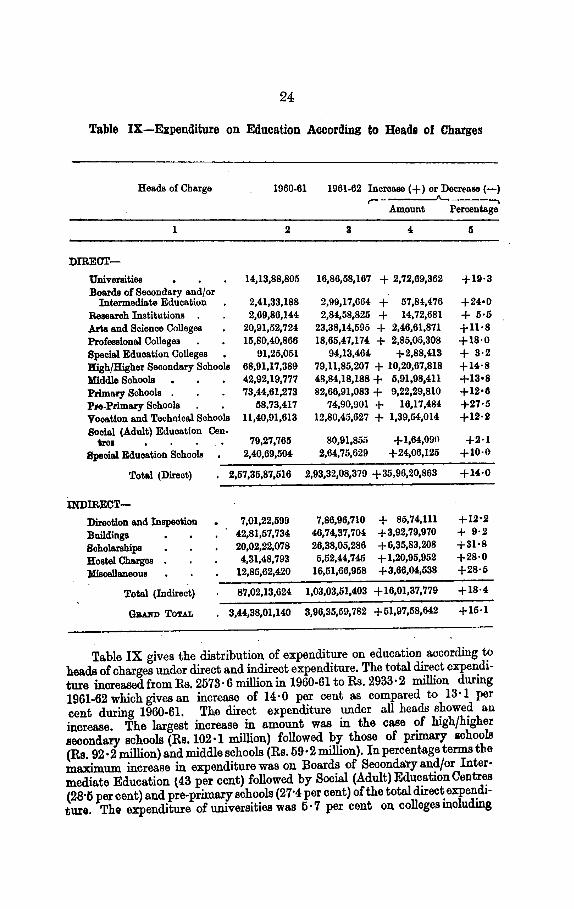
Table IX-Expenditure on Education According to Heads of Charges
Heads of Charge 1960-61 1961-62 Increase(+) or Decrease(-)
1
DffiEOT-
Universities Boards of Secondary and/or
Intermediate Education Research Institutions . Aria and Science Colleges ProfeBBional Colleges Special Education Colleges l'lighjHigher Second11ry Schools 11!ddie Schools Primary Schools . Pre-Primary Schools Vooatlon and Technical Schools Social (Adult) Education Cen-
tres Special Education Schools
2
14,13,88,805
2,41,33,188 2,69,86,144
20,91,52,724 15,80,40,866
91,25,051 68;91,17,389 42,92,19,777 73,44,61,273
118,73,417 11,40,91,613
79,27,761! 2,40,69,504
r- ~....., ___ ......,
Amount Percentage
3 4
16,86,58,167 + 2,72,69,362
2,99,17,664 + 57,8!,476 2,84,58,825 + 14,72,681
23,38,14,595 + 2,46,61,871 18,65,47,174 + 2,85,06,308
94,13,464 +2,88,413 79,11,85,207 + 10,20,67,818 48,84,18,188 + 5,91,98,411 82,66,91,083 + 9,22,29,810
74,90,901 + 16,17,484 12,80,45,627 + 1,39,54,014
80,91,855 +1,64,090 2,64,75,629 +24,06,125
+19·3
+24•0 + 5·5 +11·8 +18·0 + 3·2 +14·8 +13•8 +12•8 +27·5 +12·2
+2·1 +10·0
Total (Direct) • 2,57,35,87,516 2,93,32,08,379 +36,96,20,863
INDffiECT-
Direotlon and lnspeo\ioo Buildings Scholarships Hostel Charges • Miscellaneous
Total (Indirect)
GBAND TOTAL
7,01,22,699 42,81,67,734 20,02,22,078 4,31,48,793
12,85,62,420
87,02,13,624
3,44,38,01,140
7 ,86,96, 710 + 85,74,111 +12•2 46,74,37,704 +3,92,79,970 + 9·2 26,38,05,286 + 6,35,83,208 +31·8 6,52,44,745 + 1,20,95,952 +28·0
16,51,66,958 +3,66,04,538 +28·5
1,03,03,51,403 +16,01,37,779 +18·4
3,96,35,59, 782 +51,97,58,642 +15·1
Table IX gives the distribution of expenditure on education according to heads of charges under direct and indirect expenditure. The total direct expenditure increased from Rs. 2573 · 6 million in 1960-61 toRs. 2933 · 2 million during 1961-62 which gives an increase of 14·0 per cent as compared to 13·1 per cent during 1960-61. The direct expenditure under all heads showed au increase. The largest increase in amount was in the case of highjhigher secondary schools (Rs. 102 ·1 million) followed by those of primary 11chools (Rs. 92 • 2 million) and middle schools (Rs. 59· 2 million). In percentage terms the maximum increase in expenditure was on Boards of Secondary andfor Intermediate Education {43 per cent) followed by Social (Adult) Education Centres (28·1) per cent) and pre-primary schools (27·4 per cent) of the total direct expenditure. Thi expenditure of universities was 5 · 7 per cent on colleges including

EXPENDITURE ON EDUCATION BY HEADS OF CHARGE
1951-52
UNIVERSITIES 8. BOARDS
ARTS 8. SCIENCE COL. LEGES
COLL.EGES FOR PROFESSIONAL 8. SPECIAL EDU.
HIGH/ HIGHER SECONDARY SCHOOLS
MIDDLE SC H OOLS,
PRE-PRIMA RY & PRIM ARY SC H O O L S
VOCAT IONAL &SPEC I AL SCHOO LS
INDI RECT EXP(NDI TURE
RS IN CRORES 0 15 30 45 60 75 90 105
MJB(D)54MofEduoation- 5

research institutions 15 · 5 per cent, Boards of Education 1· 2 per cent, high/ higher secondary education 27·0 ~er cent, middl? schools 16·6percent, primary schools 28 · 4 per cent, vocatiOnal and techmcal schools 4·4 per cent and special education schools 1· 2 per cent.
Table X- Indirect Expenditure on Education J.,y fources
Source
Government Funds
Local l!orlie• Funds
Fees
Endowment~
Other Sources
Totnl
r-
1060-61
Amount Pereentage
2 3
n.,: 60,70,08,408 80·1
2,77,15,214 3·2
3,94,06,116 4·5
3,66,.>9,654 4·2
6,94,~4.142 8·0
87,02,13,624 100·0
1061-62 ---,
Amount '
Percentage
4 .5
Rs.
81,68,88,820 79·3
3,91,04,668 3-8
4,95,30,4!)5 4·8
3,99,93,654 3·9
8,48,33,7;)7 8·2-
1,03,03,.51,403 100·0
The indirect expenditure as gi,·en in tahlo X also rose from Rs. 870 · 2 million in 1960-61 toRs. 1030·4 million during the year under report. This forms an increase of 18· 4 per cent as against an increase of19·6 per cent during the previous ye(lr. The incre,Ec ·n expenditme on scholar~hips was the largest in amount (Rs. 63 · 6 million) as wPII as in lwrccntage terms (31· 8 per cent).
Table XI -Direct Exvenditure on In~1titutions by l\lanagement
~ft\nagement
Government
Di~trict Boards
Municipal Bnards
Private Borlic>s--
Aidcd
Un.ided
Total
1%0-61 1%1-62 Percentage .-----A..·------, r- Increase Amount Percentage .:\mount. Percentage ( -t) or
2
Rs.
73,27,19,3,itl
54,38, Q8,59G
1ii,80,58,3~0
1,04,00,09,21:>
9,sn,o2,019
2,57 ,3,),87 ,:il (j
3
28·5
21·1
6·1
4
Rs.
8.1,00,64,307
62,38,26,263
17,0~,71,10fi
40·4 1,18,33,07,632
3. 9 [O,,il,39,072
100 · 0 2,93,:J2,0R,379
Iiecreasc (-)
5 6
29·0 +IG·O
21·3 +14·7
.5·8 + 8·1
40·3 + 13·8
3·6 + 6·3
100·0 +14·0
The direct t'X]Jl'Uditnre acc:onliug to manag•mtent is given in table XI Go~·cr~nc!lt institutions which formed only 15-1 per cent of the t.ota.l numher of tustltut10ns acoounted for 29·0 per cent ,,f the total dirert expenditure whil,
'\[ B1 .1.-1 .:.r .. rE!hl<';t! ;un-~.)(a}

26
institution man~ged by local and private bodies formed 35·5 per cent arid 49· per cent respectively of the total number of institutions accounted for 27·
per cent and 43 · 9 per cent respe~tively of the total direct expenditure.
Table XU-Distribution of Government Expenditure on Education
1960-61 1961-62
Item Amount Percentage Amount Percentage of Total of Total Expen- Expen-diture diture
1 2 3 4 6
Re. Ra. :rn;.titutions for Men 2,13,48,60,521 91·2 2,47,64,88,159 91·1
Institutions for Women 20,60,53,310 8·8 24,18,76,630 8·9
Total 2,34,09,13,831 100·0 2,71,83,64,789 100·0
DISTRIBUTION BY HEADS OF CHARGE
Universities 6,52,51,854 2·8 7,61,62,855 2·8
Bo&rds of Secondary &nd/or Interme-diate Education 1,93,598 0·0 12,74,094 0·0
Research Institutions 2,44,97,168 1·0 2,53,81,904 0·9
Arts & Science College~ 8,20,57,133 3·5 9,48,42,491 8·6
Professional Colleges • 11,17,33,930 4·8 13,59, 73,693 11·0
Special Education Colleges 59,24,536 0·3 60,93,571 0·1
High & Higher Secondary Schools 33,10,31,894 14·1 40,44,98,800 14·9
Middle Schools 31,80, 76,587 13·6 36,50,83,126 13·4
Primary Schools 59,12,21,812 25·3 66,21,10,152 24·4
Pre-Primary Schools • 15,74,021 0·1 20,41,435 0·1
VoO&tion&l Schools 9,05,51,308 3·9 10,37,i6,358 1·8
Special Education Schools 2,17,91,492 0·9 2,42,37,481 0·9
Direction & Inspection 6,80,42,466 2·9 7,50, 79,6J3 ll·8
Buildings 18,57,65,624 7·9 35,58,10,754 13·1
Scholarships 1,38,08,463 0·6 24,59,97,716 9·0
Hostel Charges 33,36,36,258 14·2 1,80, 74,107 0·7
Miscellaneous 9,57,55,687 4·1 12,19,26,579 1.·5
Gaun ToTAL 2,34,09,13,831 100·0 2, 71,83,64, 789 100·0
The total Government expenditure on education on the different types of institutions is given in table XII. As usual the general education schools continued to enjoy the largest portion of Government expenditure.

27
The Rtatewisl' details of tht> total expenditure on education are shown in table Xill. All the States and Union Territories spent more on education as compared to the previous year. The highest increase was reported among States by Maharashtra (Rs. 72·0 million) followed by Madras (Rs. 69 ·0 million\, U.P. (Rs. 52·2 million), Madhya Pradesh (Rs. 46·8 million), Mysore (Rs. 41·0 million) and West Bengal (Rs. 40 4 million) and among Union Territories by Delhi (Rs. 17 · 7 million) .. The lowest increase, it may be noted, was reported by Orissa (Rs. 6·0 million) among States and by L.M. & A. Islands (Rs. 1,85,155) among Union Territories (Dadra and Nagar Haveli, of course, reported statistics for the first time). In terms of percentage however the top place among States was shared by Madhya Pradesh and Mysore (23·2 per cent) which was followed by Madras (21· 7 per cent) and Rajasthan (16· 4 per cent); among Union Territories leaving out Dadra and Nagar Haveli, A. & N. Islands showed by far the biggest increase (88·9 per cent) followed by Pondicherry (50·7 per cent) and L.M. & A. Islands (35 · 8 per cent).
Columns (10) to (14) of table XIIT shows the distribution of the percentage of expenditure on education met from different sources. It will be observed thatGovernment share was by f~r the bigge~t in every State or Union Territory except in Himachal Pradesh and M~nipur where the local bodies met 80 · 7 per cent and 68·6 per cent respectively of the total expenditure. The Government contribution was as in 1960-61 highest among States in Jammu and Kashmir (92·6 per cent); it was more than 75 per cent in Rajasthan (84·8 per cent); Kerala (83·6 per cent), Madhya Pradesh (82 · 9 per cent), Orissa (78·7 per cent) and Assam (76·7 per cent) and more than 60 per cent in all other States except Uttar Pradesh (58· 9 per cent) where it was the least. Among Union Territories, Government met all expenditure on education in A. & N. Islands, Dadra and Nagar Haveli, L.M. & A. Islands and N.E.F.A.; it also met most of the expenditure in Tripura (96 · 7 per cent). Nagaland (96· 3 per cent) and Pondicherry (86·6 per cent), while in Delhi the Government share was 59·6 per cent.
The average annual cost per pupil for the two years1960-61 a~d 1961-62 !s given in cols. (15) and (16) in table XIII. The all-India average rose from Rs-71·8 to 73·0. The cost was highest in Madhya Pradesh (Rs. 87·2) among States and NEFA (Rs. 350·9) among Union Territories and it was lowest in Orissa (Rs. 45·4) among States and Dadra and Nagar Haveli (Rs. 50·1) among Union Territories. In the previous year, these four positions were respectively occupied by Punjab (Rs. 87·4), NEFA (Rs. 321·4), Orissa (Rs. 44·5) and llanipur (Rs. 68·3).
The last column of table XIII com pareR the average per capita expenditure on education in different States and Union Territories. The all-India expenditure per head of population came toRs. 8·8 as against Rs. 7·8 in 1960-61. It ranged from Rs. 13 · 9 in Maharashtra to Rs. 4 · 5 in Orissa among States and from Rs. '3· 7 in Delhi toRs. 3·5 in Dadra and Nagar Haveli among tTn.on Territor ea. This showed the same position as the previous year except that in the case of Union Territories the last place was occupied by NEFA.

28
Table XITI-Expenditure on Education by States
On Institutions for Boys On Institutions for Girls State/Territor.v
1960-61 1961-62 1960-61 1961-62
2 3 4 5
Andhra Pradesh 23,79,15,835 25,25,01,877 1,90,41,550 2,02,38,365 As•am 8,29,71,101 9,61,57,09-J, 67,98,056 78,57,531 Bih!Lr 21,03,35,037 23,16,08,135 1,54,45,510 1,79,56,656 Gujarat 16,87 ,44,08S 19,09,80, 740 2,08,91,123 2,33,37,400 Jammu & Kashmir 1,69,66,067 2,54,37,190 34.75,856 46,86,462 Kerala 18,28,63,213 20,76,92,323 1,mJ.57,231 1,26,13,847 Madhya Pradesh . 18,09,40,295 22,22,58,48•) 2,11,87,777 2,66, 77' 115 Madras 29,31,3!,216 35,82,06,100 2,45.10,570 2,84,72,997 :M:aharnsh tra 44,30,67,734 50,81,16,919 4,62,48,601 5,31,56,025 Mysore 16,11,66,710 20.06,6!.911 1.55,32,058 1, 70,61, 708 Orissa 7,10,80,708 7,62,02,371 3;;,zs,149 44,27,368 Punjab - 15,84,!13,6){. 17,91,06,;;8! 2,98.17,294 3,()!!,07,397 Rcjastb.r.H 11,60,!11,398 13,53,90,443 1,06,98,95 J 1,2t,08,511 Uttar Pradesh 35,87,12,575 40,28,66,669 3,83. 73,421 4,64,53,551 West Bengal 29,89,45,300 33,52,74,982 4,19,20,301i 4,.'\9,90,306 A. & N. Islands 7,16,719 13,68,816 1,33,607 2.37,339 Dadra & Nagar Haveli 2,05,24~
Delhi 7,70,66,196 s,96,Si,G78 2,42,04,393 2,9:l,tl1,718 Himachal Pradesh 1,13,02,983 1,33,28,67i) 4,46,494 5,60,876 L. l\f. & A. Islands 4,98,022 6,49,459 19,770 53,488 Manipur 1,00,47,658 1,13,49,59.) 9,34,758 13,76,.582 Nagl\land 42,97,567 -50,22,417 N.E.F.A. 22,99,48-! 27,70,060 Pondicherry 50,82,721 88,10,401 7,34,054 8,57,127 Tripurl\ 1,43,80,033 1,68,19,496 11,82,334 13,90,750
INDIA/TOTAL 3,10,77,19,266 3,57,24,r.a,-;6,6G:I 33,60,81,8N 39,10.~3.1 w
Total Increase (+}/Decrease (-} State/Territories r-
1960-61 1961-62 Amount Percentage
6 7 8 9
Andhra Pradesh 25,69,57,385 27,27,40,242 + 1,57,82,857 + 6·1 Assam 8,97,69,157 10,40,14,625 + 1,42,45,468 + 15-9 Bihar 22,57,80,547 24,9-i,G-!,791 + 2,37,84,244 + 10·5 Gujarat 18,96,35,211 21,43,18,140 + 2,46,82,929 + 13·0 Jammu-& Kashmir 2,04,41,923 3,01,23,652 + 96,81,729 + 4·7 Kerall\ 19,38,20,447 22,03,06,170 + 2,64,85,723 + 13·7 Madhya Pradesh . 20,21,28,072 24,89,35,:l~t;; + 4,68,07 .~2:{ + 23·2 Madras 31,76,44,786 38,66,7U,097 + 6,90,31,'{ 11 + 21·7 Mahnrashtra 48,93,16,335 56,12,72,944 + 7,19,56,609 + 14-7 J\Iysore 17,66,98,768 21,77,26,619 -;- 4,10,27,851 + 23-2 Orissa 7,46,08,857 8,06,29, 739 60,20,882 + 8·1 Punjab 18,83,10,900 21,53,13,981 + 2,70,03,081 + 14·3 Rajasthan 12,67,90,357 14,75,98,954 + 2,08,08,597 + 16-4 Uttar Pradesh 39,70,85,996 44,93,20,220 + 5,22,34,224 + 13-2 West Bengal 34,08,65,606 38,12,65,288 + 4,03,99,682 + 11·9 A. & N. Islands 8,50,326 16,06,155 + 7,55,829 + 88·9 Dadrn & Nagar Ha\'eli 2,05,248 + 2,05,248 -t-100·0 Delhi 10,1 2,70,5S\I 11,89,49,39ti + 1, 76,i8,80i + 17-;) Himachal Pradesh 1,17,4!1,477 1,38,89,551 --r- 21,40,074 + 18·2 L. M. & A. Islands 5,17,792 7,02,9-!7 + 1,85,155 + 35·8 Manipur 1,09,82,416 1,27 ,26,177 + 17,43,761 + 15·9 Nagaland. 42,97,567 li0,22,417 + 7,24,850 + 16-!l N.E.F.A. 22,99,484 27,70,060 + 4,70,576 + 20·6
ondirherry 64,16,775 !16,67,528 + 32,50,753 + 50·7 'J'ripura. 1,55,62,367 1,82,10,2-!6 + 26,47,879 + 17·0
lNDIA.,'TOT4L 3,44,38,01,140 3,96,35,5~,7S2 + 51,97,58,6!2 + 15·1

COST PER CAPITA [OF POPULATION] ON EDUCATION ffiM-~ ~
ANDHRA PRADESH
ASSAM
BIHAR
GU.JARAT
.JAMMU II. KASHMIR
KERALA
MADHYA PRADESH
MADRAS
MAHARASHTRA
MYSORE
NAGALAND
ORISSA
PUNJAS
!IAJASTifAN
UTTAR PRADESH
WEST BENGAL.
A.& N.ISL.AN.OS
I
I
DADRA II. NAGAR HAVEL I .. I eEL.HI
&,. .... & A, ISLANDS
MANIPUR
N.E.F. A.
PONDICHERRY
TIUI'VRA
~0 6 I
12 I
18 24 30 36 42 48

29
Table XIII-Expenditnre on Education by States-(Contd.)
Average Annual Expen-Percentage of Expenditure met from Cost per Pupil ditlll'e
~tate/Territory ,....----"---- per Govt, Local Board Fees Endow- Other 1960-61 1961-62 Capita Fund Funda menta Sources
1 10 11 12 13 14 15 16 17
Andhra Pradesh 66·0 12·8 14·2 3·4 3·6 68·9 64·4 '1·2 Assam 76·7 0·7 16·7 4·7 1·2 58·1 62·0 8·6 Bihar 68·9 2·6 19·6 1·5 7·4 50·1 52·1 5·2 Guje.rat • 69·8 6·2 16·9 1·0 6·1 66·0 66·2 10·1 Jammu & Kashmir 92·6 4·8 0·1 2·5 64·7 82·7 8·2 Kerala 83·6 0·1 9·6 0·2 6·5 58·2 62·8 12·7 Madhya Pradesh 82·9 4·6 7·7 0·8 4·0 78·6 87·2 'T·IS Madras 65·0 13·5 11·6 8·7 1·2 71·3 78·4 11·2 Maharashtra 61·0 8·9 22·1 0·8 7·2 86·4 80·7 13·9 Hysore 74·1 3·7 9·8 0·4 12·0 61·1 65·8 9·0 Orissa 78·7 0·5 10·6 4·3 5·9 44·5 45·4 4·5 Puujab 71·8 0·3 19·2 5·8 2·9 87·4 78·8 10·4 Rajasthan 84·8 0·3 8·7 4·6 1·6 83·1 82·9 7·1 Uttar Pradesh 58·9 7·2 21·7 1·3 10·9 70·3 68·3 5·9 West Bengal , 63·9 2·5 26·8 2·2 <i·6 83·5 87·0 10·6 A. & N. lelanda 100·0 137·7 209·4 24·'7 Dadra & Nagar Havell 100·0 50·1 3·5 Delhi . . • 59·6 18·3 15·1 0·9 6·1 207·5 214·8 43'"'1' Himachal Pradesh 15·4 80·7 2·3 0·3 1·8 102·7 109·3 10·0 L. M. & A. Islands 100·0 126·0 149·7 29·8 Hanipur 22·7 68·6 5·1 3·6 0·0 68·3 70·7 15·9 Nagaland 96·3 0·8 1·2 1·7 90·2 95·4 13·6 N.E.F.A. 100·0 321·4 350·9 8·2 Pondioherry 86·6 0·0 4·7 1·8 6·9 139·6 177·7 25·6 TJipura • 96·7 2·2 1·0 0·1 115·9 119·6 15·6
IInu./Tooz,u, 68·6 6·6 16·6 2·5 5·7 71·8 73·0 8·8

CHAPTER II
EDUCATIONAL ORGANlSATIJN AND PERSON:iEL
· This chapter deals with the main developments which took place during 1961-62 in regard to Educational Organisation and Educational S3rvices both at the Centre and in the States and in respect of Educational Directorates and Inspectorates in. the States,
Educational Organisation
At the Centre, the items of work relating to (a) the collecres for displaced students and the training of displaced teachers in West Be;;galand (b) the administrative control of the Homes/Infirmaries and Children's in~titutions for displaced persons from East Pakistan were transferred from the Ministry of Rehabilitation to the Ministry of Education. Besides, a separate unit was created in the Education Ministry to deal with the education of refugee children from Tibet, The L'nesco Section in the Ministry was made into au independent Unit with effect from 11th May, 1961, to serve as the secretariat of the Indian National Commission for Unesco and to deal with other matters pertaining to Unesco. In collaboration with Unesco, a Regional Centre for the Training of Educational Planners, Administrators and Supervisors in Asia was set up in New Delhi as a subordinate office of the Education Ministry.
As regards the States, no major change was reported in the organisational set-up of the Education Department anywhere except in Andhra Pradesh, Kerala and Mysore. In Andhra Pradesh, consequent on the transfer oflocal Administration of Development Blocks to P.tnchayat Samitis the Deputy Inspectors of Schools, having jurisdiction over Panchayat Samiti Blocks, were also required to function as Extension Officers (Education) of the Panchayat Samitis in addition to continuing as Departmental Inspecting Officers. Moreover, the number of ranges under the Deputy Inspectors were reorganised so as to haye as many ranges as development blocks in the rural areas. In addition, the following separate ranges were also constituted : -( i) One range for all elementary schools in urban areas in each revenue district and 5 such ranges in Hyderabad city; (ii) Ten ranges for Urdu Elementary schools in Andhra Ar~a, (iii) Fifteen ranges for elementary schools in Agency Areas. In Kerala State, deCfmtralisation of administration was effected with the creation of three posts of Regional Deputy Directors of Education with headquarters at Trivandrum, Eruakulam in Kozhikode and many powers hitherto vested in the Director, of Public Instruction, were delegated to these Regional Deputy Directors. In Mysore State, for the successful implementation of the Compulsory Primary Education Programme, the Inspectorate was reorganised with effect from October, 1961. The main features of the reorganisation was the formation of Ranges whose boundaries were co-terminus with revenue talukas. Each range wa.s placed under a.n Inspector who exercised complete control over primary schools in the area. In the case of high schools, the system of Subject Inspector3 sanctioned on an experiruental basis for two divisions was extended to three more divisions.

Educational Servic"8
The cadre of educational services in almost all the States continued to consi~t of two broad categories, viz., (i) State Educational Services, gene~ally divided into Class I and Class II and (ii) Subordinate Educational ServiCes, divided into different dasses with different scale~ ofpay.
The total stren(J'th of the State Educational Services {including equivalent posts where such s~rvices did not exist) increased fr'lm 12,924 to 13,8~2. Of these, 1,405 were Class I posts and 12,'1:37 Class II posts. The branch-wise and class-wise <listribution of these posts is given in table XIV below.
'l'able XIV-- Strength of ~tate Educational Service according to Brauches
--~-~-~---
Cla.s I Cla"s II Brarwhe:'; .... ---.... Tot" I
~len Women l\Ien \Vomcn
Dircc:tion and In . ..;pectiun 28:i 28 8!17 137 1,318
Collegiate R.),j 5.> 6,858 1,0Xl 8,7!\8
School 127 10 2,623 ii9S 3,3:>8
Other. 41 2S:l 41 368
Total 1,312 !)3 IO,finl 1.771\ 13,R!?.
--·- ---------
Of the 1,405 Class I posts, nearly 64 per cent were filled up by promotion, 23 per cent by dire<Jt recruitment, 6 per cent by officiating arrangements, while the remaining 7 per cent posts were held in abeyance. As regards 12,-!37 Class II posts, altout 43 per eeut we're filled up by direct recruitment, 45 pPr cent by promotion, 6 per cent by officiating arrangements and the remaining 6 per cent posts were hdu in abeyance. The distribution of Class I and Class II posts in the educational services of the different States is given in table XV. It will be observed from this tal•le that Madhya Pradesh continued to have the largest 8crvice \1 ith 3,324 officers in both the classes. It ',vas followed by Rajasthan with 1,9()0 officers and Kera!a with 1,504 officers. -
During the year, no major changes in the pay ~eales of erlucational service were reported by the State GoYeruments.
Direction and Inspection
With the rapid increase in the numLer of educational institutions as a result of educational deYelopment under the Five Year Plans, the strength of Directorate and Inspectorate increased in varying <legrees in almost all the States. !~ormation about the strength of the Directorates and Inspectorates in the diii~rcnt States, the minimum educational qualifications prescribed for the 'I' a.nous posts therein, their scales of pay and duties are given in Appendix A of \'ol. II-A of this Report which has been published separately.
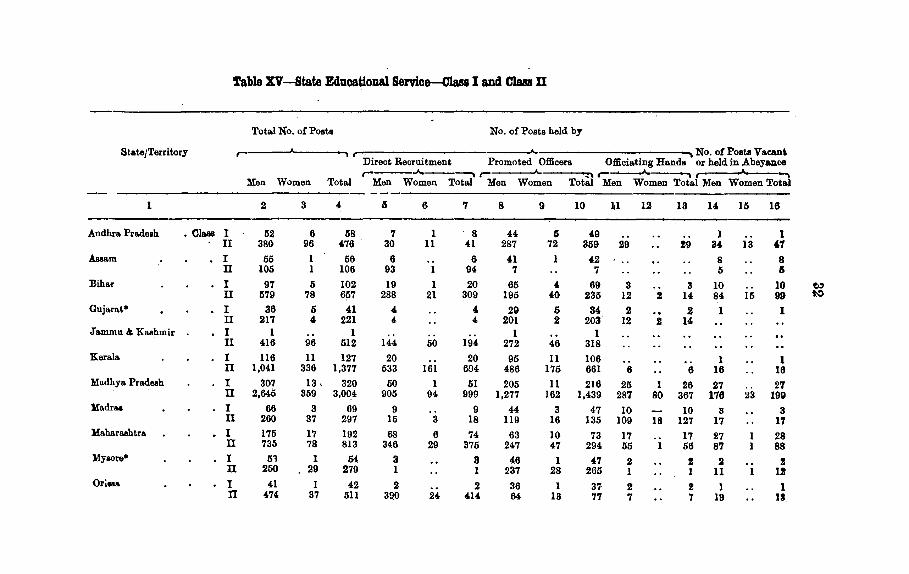
'fable XV -State Educational Servic&-Clasa I and Claa II
Total No. of Posts No. of Posts held by
St&tejTerrltory No. of Poato Vaeant r-Direct Recruitment Promoted Officers Officiating Hands or held in Abeyance r----..A.----., r- • r-------.A.------. r--.A.---.
Men Women Total Men Women Total Men Women Total Men Women Total Men Women Total
1 2 3 4 a 6 7 8 9 10 l1 12 13 14 15 16
Andhra Pradeoh • Olass I 52 6 58 7 1 8 44 6 4.9 1 1 II 380 96 4.76 30 11 41 287 72 359 29 !9 34. 13 '7
Assam ,. I 55 56 6 6 41 1 42 8 8 II 105 106 93 1 94 7 7 5 a
Bihar I 97 5 102 19 1 20 65 4 69 3 3 10 10 w II 579 78 657 288 21 309 195 40 235 12 ! 14 84 15 99 ,0
Gnjarat• I 36 6 41 4 4 29 6 34 2 2 1 1 II 217 4 221 4 4 201 2 203 12 2 14
Jammu & Kashmir I 1 1 1 1 II 416 96 512 144 50 194 272 46 318
Koral& I 116 11 127 20 20 95 11 106 1 1 n 1,041 336 1,377 533 161 694 486 175 661 6 6 16 16 Madhya Pradeah I 307 13' 320 50 1 51 205 11 216 25 1 26 27 27
n 2,645 359 3,004 905 94 999 1,277 162 1,439 287 80 367 176 23 190 :Hadra.o I 66 3 69 9 9 44, 3 47 10 10 3 3 n 260 37 297 15 3 18 119 16 135 109 18 127 17 11 :Haharashtr& I 175 17 192 68 6 74 63 10 73 17 17 27 28 n 735 78 813 346 29 375 247 47 294 55 56 87 88 Jdyaora• I 51 1 54 3 8 46 1 47 2 ! ll ! n 250 29 279 1 1 237 28 265 1 1 11 1! Oril8& I 41 I 42 2 2 36 I 37 2 2 I 1 n "' 37 511 390 24 4.14. 64 18 7'1 7 7 19 II

Punjab I 49 14. 63 9 s 12 32 8 40 8 3 11
II 288 94. SBJ 69 16 85 142 63 196 12 12 77 13 00'
RajiUithiW I 3 3 3 3
II 1,756 231 1,987 1,058 142 1,200 697 89 786 1
U.P. I 73 8 81 32 " 36 36 " 40 1 1 4o 4o
II 258 43 301 151 12 163 70 10 80 30 20 60 7 1 8
West Bengal I 167 7 174 65 5 70 89 2 91 13 13
II 858 151 1.009 457 9' 651 351 49 400 49 ·r 56 1 2
A. & N. Isla.ndi I II ..
Dadra & Nagar Havoli I II 1 1
Delhi* I 3 3 1 1 1 1 1 1
II 148 98 246 \4.9 30 79 60 46 106 37 19 56 2 3 6
Himachal Prad .. h* I 12 12 6 6 2 2 \4, ' II 29 29 3 3 5 5 9 9 12 12
L. M. & A. Islanda I ~
II ~
Manipnr I 2 2 2 2 II 72 3 75 54. ll 56 18 19
Nag&!and I II
N.E.F.A. I 1 1 2 1 1 1 II 17 1 18 8 9 9 9
Pondicherry I II 20 2 22 18 19 2 3
Tripara I 3 3 1 1 2 2 II 112 2 114 75 76 22 23 1 1 14 14
TCYI'.u.j!IIDU. . I 1,312· 93 i.405 305 21 326 833 67 900 80 1 81 94 ' 98 II 10,661 1,776 12,437 4,691 693 5,384 4,768 851 5,619 645 161 806 557 71 628
• Fignres relate to 1960-61.

34
'fhe total expe.nditl).re on Direc,ti9n and Inspection increased, .during the year, by Rs: o·· 86 cr6res to Rs. 7:87 _..rores. It constituted about I· 8 per cent of the total expenditure on Education. Of . the t?tal . expenditure on Direction and· Inspection, 95 · 4 per cent was met from Government funds, 4 · 4 per cent from local boards ftmds and the balance came from other sources.
Table' XVI gives the distribution of the expenditure on DirE>Ction and Inspection in the various States during 196.()-61 antl1961-62. Except Andhra Pradesh, 'Bihar, Rajasthan and Nagaland, the expenditure on this account increased in all the States and Union Territories. The highest increase among the States was reported by West Bengal (Rs. 19·04lakh~) followed by Madra5 (Rs. 14·99lakhs), Punjab (Rs. 13·07 lakhs), Madhya Pradesh (Rs. 12·,13lakhs), JHysore {Rs. 8·53 lakhs), Uttar Pradesh (Rs. 6·45 lakhs), Gujarat (Rs. 4·82 lakhs), Assam (Rs. 2·74 lakhs), Jammu and Kashmir (R~. 2·46lakhA), Kerala (Rs. 2·41 lakhs) and Maharashtra (Rs. 2·39 lakhs). In Union Territories, the increase ranged from Rs. 5 · 35 lakhs in Delhi to only Rs. 130 in L. M. & A. Islands.
It will be seen from Col. {8) of table XVI that the percentage of expenditure on Direction and Inspection to the total expenditure on Education ranged from 3·7 per cent in Jammu and Kashmir to 1·1 per cent in Gujarat and Maharashtra among the States and from 11· 3 per cent in N.E.F.A. to 1· 0 per cent in Delhi among the Union Territories.
Figures in Cols. (9) to (12) give the percentage of expenditure on Dire0tion and Inspection met from the various sources in the different States. It will be seen that in almost all the States and Union Territories except Madras, Delhi, Manipur and Himachal Pradesh, cent per ccrt or nearly cent per cent expenditure was met from Government funds. In these four States, Union Tl;)rritories, however, local boards made a. sizeable contribution.

Table XVI-EXj)enditure on Direction and Inspection
Percen-tage of Percentage of expenditure on
Expenditure total Direction nnd Inspection :--:•n.tr·.TefTitrlry \ e~pen- (1961-62) met from
,---------------~ __ __,. ___________ ----------, diture on r----~-----"- ---------.. On Direction On Inspectiont Total Educll.- Govt. Local Other
r- ---------'"--- ----... r- ------J"--- ----. r- --- ---A- tion Funds B01trds Fees 19fi0-61 lOGl-62 ln60-61 1961-62 196~-61 1961-62 1961-62 Funds snurccs
;! :l 4 5 6 7 8 9 10 ll 12
Its. R•. Ik Rs. R"- Rs. Andhru. Pradesh 8,79,041 ~.73,021 47,90,193 33,46,619 56,69,234 42,19.640 I-ll 100-0 Astmm 5,34,079 5,63,773 22,62,419 23,93,:~11 27,96,498 :!!J,07,084 2·9 99·9 0·1 Bihar 6,95,763 7,05,241 74,89,825 74,22,915 81,85,588 81,28,156 3·3 97·2 1·3 1·5 Gujamt 3,!:;9,376 4,4!1,220 V;,OR,-H7 19,00,603 18,67,793 23,49,823 1·1 98·8 1·2 Ju.mmu & Kashmir 2,28,205 3,0·1,504 6,34,413 8,04,965 8,62,618 ll,09,469 3·7 100·0 Kern Ia 20,78,274 21,55,.')09 27,2!1,295 28,93,232 48,07,569 50,48,741 2·3 100·0 }fadbya. Pradesh 8,89,471 9,81,389 35,29,192 46,79,8ll 44,18,663 56,61,200 2·3 n~-8 0 2 M.odrus 10,04,290 11,9-!,435 38,3~.099 51,46,828 48,42,3S9 63,41,263 1·6 83·0 17·0 ~
Ma.htuatthtru. 15.69,215 15,16,644 46,4:j,855 49,37,827 62,15,070 64,54,471 1· I !)!)·6 0·4 "' My•oro 11,70,217 14,31,959 33,56,760 39,48,066 45,26,977 53,80,025 2·5 100·0 Orissa 3,05,473 -I,!Jl,OS~ 13,60,449 1!1,15,9:ll 16,65,922 24,07,013 3·0 100·0 Punjab 13,13,93o 20,07,85\J 30,64,295 36,77,681 43,78,230 56,85,540 2·6 99·0 1·0 Raja.~than 13,19,055 11,08,182 18,21,967 13,44,767 31,41,022 24,52,949 1·7 100·0 U ttur Pradesh 31,50,720 35,90,394 68,31,410 70,36,745 99,82,130 1,06,27,139 2·4 93·7 6·3 West Bengal 9,60,095 15,76,311 27,92,965 40,80,723 37,53,060 56,57,034 1·5 96·8 3·2 A. & N. Is lunch! 37,224 46,208 16,245 25,081 53,469 71,289 4-4 100·0 Dadra. & Ngr. H11veli . 2,237 2,825 5,062 2·5 100·0 Delhi 4,52,630 5,58,441 1,97,612 6,27,161 6,50,242 11,85,602 1·0 64-1 35·9 Himachal Prade•b 1,30,639 1,64,436 2,82,798 4,67,495 4,13,437 6,31,931 4·5 3·6 96·4 L. M. & A. Island.• 3,107 6,933 14,495 10,799 17,602 17,732 2·5 100·0 Manipur 5,41,743t 6,99,139 5,41,7·!3 6,99,139 5·5 56·9 43·1 Nagalnnd . 1,51,347 1,43,032 1,51,347 1,43,032 2·8 100·0 N.E.l•'.A. 2,42,310 2,46,070 64,110 66,210 3,06,420 3,12,280 ll·ll 100·0 Pondicherry 99,227 1,72,999 24,717 46,233 1,23,9-14 2,19,232 2·3 100·0 'fripurn. 2,71,014 3,54,930 4,80,618 5,76,934 7,51,632 9,31,864 5·1 100·0
ToTA.L.il:sDI.\ 1,82,35,103 2,U,00,9H.; 5,18,87,496 5,74,!15,794 7,01,22,599 7 ,8fi,96, 7 10 2·0 95·4 4·4 0·1 0·1 tfncludos expenditure on Direction of Girl~ B~Lw . ..::Ltion. tincludes expenditure on Inspection al" '·

CHAPTER III
PRIMARY EDUCATION
The moat important scheme of school education included in the Third Plan was the expansion of facilities of education for the children in the agegroup 6-11. The progress made in this direction even in the first year of the Third Plan (1961-62) was very encouraging, as the additional enrolment of classes I-V rose to 3·87 millions as against the original target of 2·25 milliona and the total enrolment in these classes, constituted nearly 67% of the total population of this age-group.
During the year under review, the Governments of Andhra Pradesh, Gujarat, Madhya Pradesh, Mysore and Punjab enacted new laws for compulsory Prim~ry Education on the Model of Delhi Compulsory Primary Education Act, 1960. Enrolment drives were organised during the year with very substantial :results of additional enrolment in primary schools.
The State Governments were requested to introduce courses in 'Cooperation' and 'Panchayati Raj' as part of the syllabus of Primary schools and primary teachers' training schools in order to enable the pupils to learn the functioning of the various bodies set up at the village, block and district leve1J under the programme of Democratic Decentralisation. The topics were to bo learnt more through practical activities than through formal instruction. Mon of the States reported the introduction of craft work in primary schools as a. part of the plan of eventually converting these schools into basic ones. In some States, the elements of 'Community Development" were introduced in the syllabus of the courses for the training of primary teachers.
In February, 1962, a seminar of the Science Consultants working in the States was organised. The seminar made several suggestions to improve and expand the programme further.
Efforts were continued to improve the economic conditions of the primary eohool teachers. Some States revised the pay scales, while others sanctioned ad-hoo increases in pay or allowances. During the period under review, the State Govt. of Andhra Pradesh introduced the triple benefit scheme for primary teachers and the Govt. of Gujarat introduced the pension echeme for primary teachers working under the local authorities. The Union Ministry recommended to other States to take similar steps to provide a good scheme of old age provision for the primary school teachers. A proposal to equalise the dearness allowances paid to primary teachers with those admissible to Government serTants drawing the same basic salary was mooted. When implemented this proposal was estimated to cost Rs. 48 crores. The scheme for relief to tho educated unemployed for the expansion of elementary education with lOOo/. Govt. of India's assistance was continued during the year. .
A study group to chalk out a programme for the improvement of teacher training at the primary stage, on the recommendation of the All India Council of Elementary Education was appointed. The report of the first National
36

37
Seminar on Training of Teachers wa.s published. The Seminar made several useful suggestions on this subject. A prot,rramme for the orientation of !J1e pr~mary school teachers in community development wa.s also taken up durrng this period. The main object of this programmf' was to train the primary school teachers so that they ma.y be enabled to pby an effective role in the community development programmes and mr~lw primr~ry school r~ centre of the community. For this purpose seminarR of prineipals of the training institutions were organised.
The Vllth National Prize Competition for Children's Books was held during the year under review. In all 531 booksfm::muscripts were entered for the competition in a.ll the modern Indian languages. Seven prizes of Rs. 1,000 each and 21 prizes of Rs. 500 each to 28 book8 were awarded.
Six State-Governments were requested to organise Sahitya Rachanala.yas for training authorities in the teclmiquc of writing literature for children. Two Raehanabyas, one in Andhra Pradesh and the other in 1\iaharashtra were held.
A scheme for the production of books in Hindi and other modern languages for the use of children and teachers in primary a.nd secondary schools was included in the Illrd Plan and was approved by the Ministry of Finance for implementation during tho year 1961-62. The scheme envisaged production of (i) Handbook of Suggestion for Teachers; (ii) Collection of poems for use in primary and secondary schools; (iii) Anthologies of one-set plays or musical pagements for production in schools and (iv) Genera.! reading books. The production of hand books of suggestions (item No. 1) was entrusted to a writer. The production of other items was decided to he kept pending till the report of the N::~tional Emotional Integration Committee was published.
A brief account of the activities of the State Governments in the field of primary education is given bclow-
Andhra Pradesh The Andhra Pradetih Primary Education Act, 1961, according to which
the children of tho age-group 6-7 were brought undPr the sphPre of universal, free and compulsory primary education, came into force from lOth April, 1961, throughout the State excepting the Hchcduled areas. "\Yith a view to bringing as many children of compulsory school age as possible into schools by propaganda and persuation "Enrolment Drives" were organised all over the State for one week in the beginning of the academic year. As a result of the drive the total uumber of additional children enrolled exceeded the target figures of 1·2 lakhs for the ye:.u 1961-62. Other steps taken in this direction were the appointment of 3,300 addition:.>! te:.1chers, contingencies and equipment, free eupply of mid-day meab, free supply of books and stationery grants-in-aid to Panchayat Samities towards the construction of Primary School buildings, etc.
The government sanctioned Contributory Provident Fund-cum-Pcnsicn and Gmtuity scheme applicable to all teachers employed in elementary nongovernment schools run by aided matmgements, l\Iuui.cipal Council9, Zilla Parishads and Pancha.yatas. The rules for the eligibility to peusion were similar to those applicable to Government servants. ~IJ B( 1 >)GniofJ·:du- ;

38
Assam
During the year an All India. Primary Education Conference was held at Ga~~ti whic~ provided opportunities to the teachers of the State to exchange thell' 1dea:s With the teachers of other States of the country. Also 500 primary scholarshi_tJs were created under the Development scheme. These scholarships were ilistributed among different sub-divisions according to population basis to be awarded for 3 years with effect from 1st March 1961.
The control and management of primary schools in Garo Hills. Mizo district and Nilier Hills was transferred from the Education Department to the respective District Councils.
Bihar
A pilot project for the improvement of science teaching in elementary schools was introduced. Besides a similar project of "Free and Compulsory Education" of age group 6-11 in rural areas was introduced in 40 Blocks.
The pay scales of primary and middle school teachers were revi8ed during tbe year as under-
Qualification of Teachers
Matric Paseed Non-Matrio Trained Middle Passed
Old Scale Revised Scale
Rs. 40-60 Rs. 45-75 Rs. 40-75 Rs. 45-75 Rs. 30--40 Rs. 40-60
Besides these teachers were allowed D.A. at the rate of Rs. 15 plus Rs. 5 to those getting less than Rs. 100 as total emolument. An amount of Rs. 22 · 00 akhs was spent during the year on this account. '
Gujarat The legislation for introduction of compulsory education was passed with a
view to introduce compulsory Primary Education throughout the State in the age-groups 7-8 in the districts of Saurashtra and Kutch except Amreli. The compulsory Primary Education was already in force in the remaining part of the State. With the introduction of compulsion 2·13 lakhs additional children were brought to school. This nec~ssitated appointment of 4,241 t~achers tmd 21 A.D.E.I.'s etc. at the cost of Rs. 29·25lakhs.
The pay scales of primary school teachers being revised during second plan period it was proposed to introduce pension benefit scheme in lieu of Provident Fund for the primary teachers and they were asked during the year to opt for either of the schemes.
Under the training programme for primary teachers, 2 additional divisions in each of the 9 training colleges opened during 1960-61 under the Government of India scheme were started.
Jammu & Kashinir With a view to meetina the growing need for trained teachen required
for the newly opened schoo~, the intake capacity in the Teachers' Training

39
Schools W<t~ iacrcasc<l. Besides refr<1sher course for primn.ry school teachers were conducted to understand the new developments and new techniques of education.
In order to provirl.e suitable reading material to children, the rl.epartment adopted a phased programme of replacing old text books by new ones. During the year, 17 such books were got printed and rephtced.
Kerala
The Text Book Research Officers completed the preparation of Guide Books in Malayalam and Arithmetic for teachers of lower primary schools. A vocabulary list in l\Ialayalam was prepared based on utility of words. This list would be of great help to text books writers in future. The vocabulary study of Kerala Readers I to VII was completed. The Text Book Research Wing also took active part in the revision of the syllabus.
During the year the rules regarding triple benefit scheme for teachers in aided schools were framed by the Government.
Madhya Pradesh
Legislation for the introduction of compulsory primary education was enact-ed during the year.
Madras
Compulsory Primary Education was extended, dm:ing the year, to t!J.e age group 7-8 in the 1st group of habitations where corupuL~ory education was in force for the ap group 6-7 since 1960-61. During 1961-62, compulsion was brought into force for the age group 6-7 in the second group of habitations. With this phased programme the state hopes to introduce compulsion for the age group 6-11 in the whole of the State by the end of the Third Plan Period.
During the year the revised syllabus for the integrated Elementary Course for standards I-VII was introduced in standard VI in all non-Basic Elementary schools and in form I of secondary schools, the nomenclature of which was changed into standard VI.
The scheme of organising School Improvement Conferences was continued during the year and 17 such conferences were helcl bringing the total number to 155 by the 31st March, 1962. This helped a lot in the improvement of the standard of school teaching.
Consequent on the abolit.ion of levy of fees in standards I to V, the managements fow1d it difficult to meet certain recurring items of expenditure such as rent, contingency etc. From 1961-62, therefore, the Government gave an advance payment of maintenance grant based on 50 per cent of thr grant given in tho previous year to rueet the expenditure on contingencies.
Maharashtra
Under the scheme of expansion of primary education, 3,560 additional teachers were sanctioned. Teachers working in Koyna Project area were allowed compens>\tion allowance from the year under report. Loans amountin" to Rs. 1· 72 lakhs were given to District School Boards for construction of b~ilings. ~Ijll(. l/GniofEdu...:6(a)

40
Mysore
Mysore Compulsory Primary Education Act, 1961 was introduced from 1st August 1961. According to the provision of this Act, compulsion was introduced during the year for the age-group 6-7 to be extended to other age groups in the later years so as to cover the entire age group of 6-11 by 1965-66. CoURequent to this Act, a State-wide enumeration of children of the age group 6 to 7 years was conducted. Besides, a Seminar at State level was also conducted at Nandi Hills to consider the problem likely to arise in the implementation of Compulsory Primary Education. The :findings of the Educational Survey of 1957 was reviewed and it was found that many more villages needed schools for the sucnessful implementation of Compulsory Education.
Seminars for . primary school teachers were conducted at each District headquarters and at each centre having 50 teachers to discuss, among other things, the new integrated primary school curriculum.
With a view to stepping up the percentage of the trained teachers at primary stage four new Teachers' Training institutions were opened under the Government of India scheme, each with an intake capacity of 100 trainoos.
Orissa
With a view to ensuring democratic decentralisation of administration of education in the State,. the. function relating to the managements, control and spread of primary education in the blocks have been entrusted to the Panchayat Samities with effect from 1st September, 1961.
The management and control of primary education were, therefore, provided at three different tiers of administration viz. (i) The Zilla Parishads, (ii) Tlte Panchayat Samities and liii) The Gram Panchayats. In order to avoid confusion and to promote smooth and efficient discharge of responsibilities entrusted to each of the tiers a set of instructions for guidance of Zilla Parishads, Panchayat Samities, Gram Panchayats and Officers of the Education Department concerned with the Primary Education in the State was issued by the Government. Further, to ensure uniformity of management and control of primary schools in the State, all schools within the jurisdiction of each Panchayat Samit.i, whether Government or non-Government, have been transferred to the
· control of that Samiti. In Urban areas, however, the control vested with the municipalities or notified areas councils.
The scales of pay of primary school teachers employed in government and non government primary schools were revised and new scales brought into effect from the year under report as given below-
Government Primary Schools 1. Lower Elementary Trained Teachers
2. Higher Elementary Trained Teachers . 3. JWlior Trained Non-Matric Teachers
· 4. Senior Trained Non-Matric Teachers (WomPn)
Rs.65--1-75--E.B.--2--77--3--80--5-85.
Rs. 70--1--75--2/95. Do.
Do.

41
15, Untrained Matrio Teachers
6. Trained :Matric Teachers
Rs. 80-3-110-E.B.-3-116 -4---120
Rs. 100-4-120-5-130-E.B.-5-155.
Non-Government Primary Schools
1. Trained Matrio Teachers Rs. 100-4-120-5-130-E.B.-5-150.
2. Untrained Matric Teachers Rs. 80-3-115-E.B.-5-125,
3. 9th Standard Trained Teachers Rs. 75-1-84-2-90. 4. 9th Standard Untrained Teachers and
Trained M. E. and M. V. Teachers Rs. 70-1-79-2-85. 5. Untrained M. E. Teachers Rs. 60 fixed. ·
The Echemc of Orientation of Primary schools towards the Basio patter~ was sanctioned and a sum of Rs. 5 lakhs provided for that purpose. A scheme to hold orientation seminars at the State, District and Block levels was drawn. The State level seminar was held at Angul. All the Inspectors and District Inspectors of Schools and Headmasters of Secondary Training Sohools attended this seminar. District level seminars on this subject were held in 13 districts of the State while block-level seminars were held at all Circle Inspectors' levels. At each seminar 20 Primary teachers participated.
Under the scheme of "Introduction of one year condensed course training Primary ~chool Teachers" 10 training centres were opened in 10 different High Schools in the State for imparting one year condensed course training to inservice Primary school teachers having more than one year's experience as well as to fresh candidates who had passed Class IX.
Under the scheme of Compulsory Universal free education, 300 additional posts of Primary school teachers were sanctioned. An enrolment drive was also launched which proved succes.sful.
Punjab
To cope with the increased enrolment under univqrsal and free ·compulsory education, 4,500 additional t-eachers were appointed and in order to meet the further demand of teachers 244 J.B.T. Units were set up. 1,600 Primary Schools were given a grant of Rs. 100 each for reorientation to the Basic ptlthrn. Rdresher courses were arranged which were attended by 12 A. D. !.'11 and 1,200 non-Basic teachers.
Rajasthan
Und<.'r the scheme of Compulsory Primary Education, 2,082 Primary s0hools were opened and for their inspection 25 additional sub· Deputy Inspec· tors of schools were appointed.
Uttar Pradesh
Under the Scheme of Compulsory Education, extensive enrolment drive1 were launched to increase the enrolment of school going children. As a result

42
of these drives about 8 lakhs additional children were enrolled. 6,470 Junior Basic Schools were opened during the year which was a historic achievement.
The scales of pay of teachers of the Junior Bwic Schools run by the local bodies were 1 l:lvised during the year as shown below-
Category of Teachers Scale of Pay Rate of Dearness Allowance etc.
Head Teachers of Junior Rs. 55-1-60-EB-1-65- Rs. 19 p.m. upto a pay ofRs. 46. Basic Schools. EB-1-70. Rs. 20 p.m. upto Rs. 50;
Asstt. Teachers (Trained) Rs. 60-1-65-EB-1-60 Rs. 17 p.m. upto Rs. 70; ofJuniorBasicSchools. Rs. 19·50 p.m. upto Rs.86.
Asstt. Teacher (Untrained) Rs. 40 (Fixed). Rs. 17 p.m. upto Rs. 100. of Junior Basic Schools. Rs. 12 p.m. upto Rs. 106.
For the introduction of English in Class III in 9,000 selected JUllior Basic Schools from July, 1962, an advance action was taken this year for the provision of teaching aids and other materials by way of grants of Rs. 4,05,000 to local bodies.
West Bengal
The Bengal (Rural) Primary Education Act (1930) was extended during the year to the District of Coach Behar for making better provision for the progress of Primary Education in the area. This step brought 12 · 65 lakhs of children of the age-group 6-11 under the scheme of compulsory education. In order to attract more children to schools under compulsory education, 25 per cent of the students enrolled at the Primary Stage were given, during the year, IT()e supply of all approved text books and writing materials, particularly to the needy children.
The salary scales of teachers of Elementary schools were revised and higher pay scales introduced as por details below-
Category of Teachers Existing Scale of pay Revised Scale of pay Rate of D.A.
Headmaster Rs. 55-1-60 !/us Rs. 80-1-90-2- Rs. 12·50 an allowance o Rs. 110-3-125 plus 6. a spl. pay of Rs. 6
per month.
Asstt. Teachers Rs. 65-1-60 tUB Rs. 80-1-90-2- Re.12·50 an allowance o Rs. 110-3-125. 5 per month.
'B' Category Teaohem Rs. 50 (fu:ed) Rs. 75-1-80 Rs.12·~0 (Non-Matrio Primary Trained or Untrained Mstrio or other equivaJ. ents).
'C' Category Teachers Rs. 40 (fixed) Re. 65-1-70 Rs.l2·60 (Untrained Non-matric or its equivalents)

43
Besides improvement of pay scales, benefits of a. Contributory Provid~nt Fund and Retirement Gratuity were introduced and free Secondary EducatiOn for Primary Teachers' children was provided.
A & N Islands
Seventeen new Primary schools were opened and buildings of 14 Primary schools were constructed as against the target of eight only.
Dadra & Nagar Haveli
Because the inhabitants are poor and cannot afford to send their children in regular school hours, as they are wanted on farms, night camp schools of the Primary ~<tandard were opened by the Administration on an experimental basis to provide facilities of Primary education to these helpless children.
Delhi
Irtroduction of crafts, gradual conversion of Primary schools into Baaic ones, intensification of compulsory Primary education and reorientation <lf Primary Teachers Training institutes are some cf the high lights of the development programme carried out by the Delhi Administration during the year.
Himachal Pradesh
Due to intensive enrolment drive in tho Union Territory, 24,000 students were attracterl and enrolled in Primary schools. An Orientation Camp was organised in which 250 Primary teachers were trained.
L. M. & A. Islands
Three girls primary schools were opened during the year. A &orientation Training Camp was conducted at Kanarathy Island in January, 1962, which was attended by 18 teachers.
!:Ianipur
Seminars on Orientation of elementary schools towards Basic pattern were organised in different centres. To improve the methods of teaching in Elem(!ntary schools and to impart general knowledge to the school children a system of teaching with the help of Wall Charts and pictorial shows was i nt.roduced.
Pondicherry
Free & Universal Primary education was introduced in the Territory during the year. Under this programme, an intensive enrolment drive was caiTied out as a result of which an additional enrolment of 7,009 children of the age-group 6-11 was secured, as against the annual target of 2,500. To cope with this additional enrolment, new classes were opened with necessary staff and equipment.
Under the scheme of Orientation of Schools to Basic pattern, 246 teachers of Primary Schools (non-Basic) were given shot term training in Basic education. Equipment worth Rs. 100 per school was also supplied to 125 Primary Schools iu this connection.

44
Nagaland
64 new Primary schools were started during the year.
Tripura
In Tripura the duration of Primary stage was extended to 5 years in lieu of 4 years which was previously followed in the Territory. An action-cumresearch project for the study of the possibilities for introduction of Compulsory education in Tripura was carried out during the year.
176 schools were started in the hilly areas where there were no school facilities of the childre11 of the age-group 6-11.
Table XVll-System of School Classes at Primary Stage
State
I
Andhra Pradesh
Assam
Bihar
Gujarat-
(i) Gujarat Region
(ii) Saurashtra Region
(iii) Kutch Region
Jammu and Kashmir
Kerala
Madhya Pradesh
Madra•
Maharashtra-
(i) Erstwhile Bombay State
Name of Classes
2
I, II, III, IV and V
A, B, I, II and ill .
I, II, III, IV and V
I, II, III and IV
I, II, ill and IV
Infant, I, II, III and IV .
I, II, III, IV and V
Standarda I, II, III and IV
I, II, III, IV and V
Classes I to V of Secondary Sohooil and Standards I to V of Elementary Sohooil .
I, II, III and IV
(ii) Erstwhile Madhya Pradesh I, II, III and IV . (Vidarbha Region).
(iii) Erstwhile Hyderabad Area Infant, I, II, III and IV (Marathwada Region).
Duration (years)
3
li
5
5
5
5

45
Table XVU-System of School Classes at Primary Stage-(Contd.)
:Hysore-
(t) Erotwhile Mysore State Are-
2
(a) In Civil Areae and Bel· I, II, III, IV and V lary District.
(b) Other Areas Claoses I, II, III and IV
(H) Erstwhile Bombay State . I, II, III and IV
(iii) Erotwhile Madras and Coorg I, II, III,IV and V Area.
(iu) Erotwhile Area.
Oriua
Punjab
Rajaoth"n
Uttar Pradeoh
Weot Bengal
A. & N. leland•
Dadra & Ngr. HaV"el!
Delhi
Him,.oh"l Pradelh
L.M. & A. Iolando
Manipur
Nagaland
N.E.F.A.
Pondioherry
Trlpura
Hyderabad Infant, I, II, III and IV
I, II, III, IV and V
I, II, III, IV and V
I, II, III, IV and V
I, II, Ill, IV and V
I, II, III and IV .
I, II, Ill, IV and V
I, II, III and IV
I, II, III, IV and V
I, II, III, IV and V
Standards I, II, III "nd IV
A, B, I and II .
A, B, I and II
A, B, I, II and III
English Schools only: Infant, Standards I, II, III and IV.
. I, II, Ill, IV and V
3
'
·5
IS
4.
5
4
5
5
4
4
4.
5
5
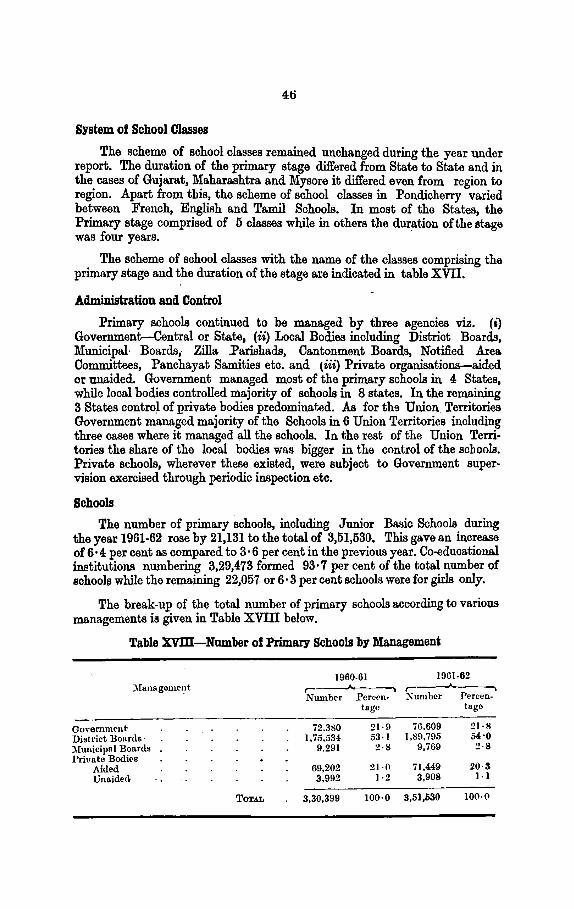
4ti
System of School Classes
The scheme of school classes remained unchanged during the year under report. The duration of the primary stage differed from State to State and in the cases of Gujarat, Maharashtra and Mysore it differed even from region to region. Apart from this, the scheme of school classes in Pondicherry varied between French, English and Tamil Schools. In most of the States, the Primary stage comprised of 5 classes while in others the dur_ation of the stage was four years.
The scheme of school classes with the name of the classes comprising the primary stage and the duration of the stage are indicated in table XVII.
Administration and Control
Primary schools continued to be managed by three agencies viz. (i) Government-Central or State, (ii) Local Bodies including District Boards, Municipal· Boards, Zilla .Parishads, Cantonment Boards, Notified Area Committees, Panchayat Samities etc. and (iii) Private organisations-aided or unaided. Government managed most of the primary schools in 4 States, while local bodies controlled majority of schools in 8 states. In the remaining 3 States control of private bodies predominated. As for th~ Union Territories Government managed majority of the Schools in 6 Union Territories including three cases where it managed all the schools. In the rest of the Union Territories the share of the local bodies was bigger in the control of the schools. Private schools, wherever these existed, were subject to Government supervision exercised through periodic inspection etc.
Schools
The number of primary schools, including Junior Basic Schools during the year 1961-62 rose by 21,131 to the total of 3,51,530. This gave an increase of 6·4 per cent as compared to 3·6 per cent in the previous year. Co-educational institutions numbering 3,29,473 formed 93·7 per cent of the total number of school~ while the remaining 22,057 or 6 · 3 per cent schools were for girls only.
The break-up of the total number of primary schools according to various managements is given in Table XVITI below.
Table XVID-Number of Primary Schools by Management
1960-61 1961-62 )!aJlngenteJ~t ,..- ,..-______.______,
Number Perc-en· X umber Perccn-tage tago
Go""emntentr 72,380 21·9 76.609 2I ·8 District Boards· 1,75,534 53·1 1,89,79.5 54·0 j\[unicipa I Boards 9,291 2·8 9,769 2·8 Private Bodies
20-S Aided 69,202 2I ·0 7I,449 Unaidecl 3,992 1·2 3,908 I -1
TOTAL 3,30,399 100·0 3,51,530 100·0

r-------------------------------------------------------------~ I SCHOOLS BY MANAGEMENTS
PRIMARY SCHOOLS
1961-62
·MIDDLE SCHOOLS
1'MOUSANDS :so::.:.::=------
.•.
HtGH / HIGHER SECONDARY
114DS SCHOOLS ao--__;_ __ _
16--~---
a----

47
The increase iu the number of primary schools was noticed under all managements except private unaided bodies which however reported a decrease of 2 ·1 per cent. The increase was of the order of 5 · 8 per cent under Government, 8 ·1 par cent under District Boards, 5 ·1 per cent under Municipal Boards and 3·2 per cent under private aided bodies. The corresponding increases in the previous year were 4 · 3 per cent, 4 ·1 per cent, 0 · 8 per cent and 3 · 8 per cent resp€ctively.
The number of primary scho~ls located in rural areas rose from 3,00,672 to 3,20,282 in 1961-62 and constituted 91·1 per cent of the total number of primary school~ in the country against 91·0 per cent in the previous year.
The distribution of Primary schools according to various States during the years 1960-61 and 1961-62 is given in table XIX . Excepting Dadra & Nagar Haveli which reported statistics for the first time in 1961-62 almost all the States and Union Territories reported an increase except Gujarat and Madras where the decrease was only by 186 and 60 respectively. Among the States, the increase was the highest (6,350) in Uttar Pradesh and lowest (98) in Maharashtra and among Union Territories it was highest (229) in Manipur and lowest (1) in L.M. & A. Islands. On percentage basis, the highest and lowest increase was reported by Jammu & Kashmir (18 · 6 per cent) and Madras(0·3percent) respectively among states and by A. & N. Island (26· 3 per cent) and Pondicherry (1· 3 per cent) among th~ Union Territories._
Col. {10) to (14) of table XIX shows the percentage of primary sohools under varioM managements in different states. Government managed cent percent schools in A. & N. Islands, L.M.&A. Islands, Nagaland andN.E.F.A., more than three-fourths in Jammu & Kashmir (99·5 per cent), Punjab (97 · 6 per cent), Pondicherry (81·8 per cent), and Mysore (75· 3 per cent) and between 50 per cent and 75 per cent in Madhya Pradesh (61· 7 per cent), and Dadra & Nagar Haveli (58· 3 per centY. In other States and Union Territories eitherlocal boards or private bodies predominated in the management of primary schools. The ehare of the local boards was maximum in Himachal Pradesh (96·0 per cent), followed by Tripura (95·7) Delhi (94·7 percent), Uttar Pradesh (92·6 pl'r cent), Rajasthan (90·3 per cent), Gujarat (87·7 per cent), Andhra Pradesh (84·1 per cent), West Bengal (81·5 per cent), Assam (81·4 per cent) Manipur (74·5 per cent) Madras (69·1 per cent), and Maharashtra (67 ·7 per cent). In other stt\tes the local bodies share was less than 50 per cent and ranged from 36·2 per cent in Madhya Pradesh to 0 · 2 per cent in Punjab while it was very insignificant in Kerala. Private organisations predominated in the control of Primary eohools in the remaining three States viz. Orissa (74·1 per cent) Bihar (72·9 per cent) and Kerala (56·9 per cent). In other States their share was less tha~ one fourt.h of the total ranging from 24 · 9 per cent in Madras to 0 · 5 per cent in Jammu & Kashmir. · ·
l'upila
On 31st March, 1962, Primary soh.ools enrolled 2,94,74,377 (1,98,90,615 boys and 95,83,762 girls) students of whioh 2,74,18,444 were in co-educational

48
Table XIX-Number of Primary
For Boys For Girls Total
State/Territory r--:----"-----, .-----"-----,
1960-61 1961-62 1960-61 1961-62 1960-61 1961-62
Andhra Pradesh 33,613 36,255 "27 435 34,040 36,690
Assam 15,310 16,264 669 697 15,979 16,961
Bihar 33,094. 34,952 4,229 4,435 37,323 39,387
Gujarat 11,744 11,572 288 274 12,032 11,846
lammu & Kashmir 2,314 2,702 545 690 2,859 3,392
Kerala 6,968 7,ll8 24 33 6,992 7,146
Madhya Pradesh 25,~36 27,324 1,845 1,981 27,781 29,305
Madras 23,711 23,651 23,711 23,651
Maharashtrr. 24,614 24,687 804 829 25,418 25,516
Mysore 20,220 21,120 882 856 21,102 21,976
Orissa 21,606 22,478 252 248 21,858 22,726
Punjab 10,363 10,297 2,895 3,070 13,258 13,367
Rajasthan 13,984 15,1196 614 634 14,548 16,330
Uttar Pradesh 35,156 40,095 4,927 6,338 40,083 46,433
West Bengal . 27,009 29,564 963 971 2'1,972 30,536
A. & N. Islands 76 95 76 116
Dadra & Ngr. Haveli 24 24.
Delhi 445 494 275 299 720 793
Himachal Pradesh 1,121 1,331 8 10 1,129 1,361
L.JIL & A. Island• 7 5 4 7 11 12
Manipur 1,493 1,650 167 239 1,660 1,889
Nagaland 407 475 407 475
N.E.F.A. 127 140 127 140
l'ondioherry 228 !31 11 11 239 242
Tripura 1,074 1,257 1,074 1,257
INDIA 3,10,570 3,29,473 19,829 22,057 3,30,339 3,51,530

49
Schools by States
Increase ( +) or Decreaee ( -) Percentage of primary Schools (1961-62)
managed by
Number Percent. Govt. Dietrict Muni- Privat~ Bodies age Boards cipal ,..---A---, State/Territory
Boards Aided Unaided
+ 2,650 7·8 10·2 81·1 3·0 5·6 0·1 Andhra Pradesh
+ 982 15·1 6·9 81·4 3·4 8·3 Assam
+ 2,064 6·2 0·3 24·3 2·5 71·3 1·6 Bihar
186 1·5 4·4 84·8 2·9 5·4 2·5 Gnjarat
+ 538 18·15 99·5 0•5 0·0 Jammu & Kashmir
+ 154 2·2 43·1 0·0 56·7 0·2 Kerala
+ 1,524 5·5 151·7 33·5 1·7 2·8 0·3 Madhya. Pradesh
M 0·8 ti·O 65·6 3·5 24·7 0·2 Madras
+ 98 0·4 22·0 63·2 4·5 9·3 1·0 Maharashtra
+ 874 4·1 75·B ll·O 0·7 13·0 0·0 Mysore
+ 868 4·0 25·4 0·5 73·4 0•7 Orissa
+ 1011 0·8 97·«1 0·2 1·2 1·0 Punjab
+ 1,782 12·2 7·6 90·0 0•3 1·3 0·9 Rajasthan
+ «1,350 15·8 2·«1 85·8 6·8 3·9 0·9 Uttar Pradesh
+ li,56S IH 2·S 711·8 1·7 15·8 0·4 West Bengal
+ 20 26·8 100·0 A. & N. Islands
+ 24 N.A. 58·3 41·7 Dadra. & Ngr, Haveli
+ 78 9·9 94·7 5·3 Delhi
+ 212 18·8 95·5 0·5 4·0 Himachal Pradesh
+ 9·0 100·0 L.M. & A. Islanda
+ 229 13·8 2·6 71·9 2·15 14·0 8·9 Manipur
+ 68 84·2 100·0 Nagaland
+ 13 8·1 100·0 N.E.F.A.
+ 8 1·3 81·8 0·8 17·4 Pondicherry
+ 183 1·7 0·2 91·6 4·1 1·5 2·6 Tripura
+21,131 6·4 21·8 5.f.·O li·S 20·3 1·1 INDIA

50
institutions and the remaining 20,55,933 in girls~ institutions. The corresponding total enrolm~nt in th~ previous year was 2,66,42,348 (1,82,69,073 boys and 83,73,275 grrls). This gave an increase of 10·8 per cent in 1961-62 as compared to 2 · 8 per cent in 1960-61.
The distribution of pupils in Primary schools by management is given in Table XX below.
Table XX-Number of Pupils in Primary Schools by Management
1960.61 1961·62 Management
Number Percent. Number Pecent· age. age
Government 54,01,454 20·3 61,47,616 20·9
District Boards 1,32,23,525 49·6 1,49,11,446 ISO·li
Municipal Boards 18,98,051 7·1 19,98,055 6·8
Private Bodies
Aided 57,65,793 21•7 60,67,349 20·6
Un·Aided 3,53,525 1•3 . 3,49,911 1·2
ToTAL 2,66,42,348 100·0 2,94, 74,377 100·0
The number of pupils increased in schools ·U!!der all managements except in the case of private unaided bodies where there was a decrease of 1·0 per eent. The increase was13·8per centinGovernment schools, 12·8 per cent in district board schools, 5 · 3 per cent in municipal board schools and 5 · 2 per cent in private aided schools.
The number of pupils coming from rural areas and studying in primary 11chools' increased from 2,13,422 to 2,38,53,868 in 1961-62 and constituted 80·9 per cent of the total number of pupils in primary schools as against 80 per cent in the previous year ..
The distribution of pupils in primary schools in various states is given in Table XXI. An increase in the number of pupils was reported by all the states and Union Territories except L.M. & A. Islands. Among the States, the increase was highest in Uttar Pradesh (7,64,591) and lowest in Orissa. (53,982). Among the Union Territories, excepting Dadra & Nagar Ha.veli whose statistics were reported for the first time, Delhi reported the highest increase (19,392) and Naga.la.nd the lowest increase (287). On percentage basis, the highest and lowest increase was reported by Pnnjab (38·8 per cent) and Kerala (2·0 per oent) respectively among the f:?ta.tes and by L. M. & A. Islands (25·5 per cent) and A&N Island (1· 3 per cent), respectively among the Union Territories.

Table XXI-Number of Pupils in Primary Schools by States
In Schools for Boys In Schools for Girls Total Increase ( +) Decrease(-) Htate;Territory
1960-61 1961-62 1960-61 1961-62 1960-61 1961-62 Number Percentage
.\ndhra Pradesh 26,29,197 30,08,370 48,623 56,039 26,77,820 30,64,409 + 3,86,589 14•4
.Assam 9,96,694 10,82,729 49,836 53,588 10,46,530 11,36,317 + 89,787 8·6
Bihar 24,71,528 2.3,99,832 2,40,463 2,54,97a 27,11,991 28,54,805 + 1,42,814 5·2
Gujarat 6,59,506 7,29,409 51,510 56,392 7,11,016 7,85,801 + 74,78[) 10·6
Jammu & Kashmir 1,12,781 .. 1,19,912 35,213 38,137 1,47,994 1,58,049 + 10,055 6·8
Kerala 17,96,779 18,28,397 7,493 12,682 18,04,272 18,41,079 + 36,807 2·0 M.adbyn Pradeoh 15,31,751 16,66,175 1,49,969 1,74,015 16,81,720 18,40,190 + 1,58,470 9·4 Madras 24,96,411 26,14,257 24,96,411 26,14,257 + 1,17,846 4·7 Maharashtra 16,46,234 17,21,636 1,34,695 1,43,959 17,80,929 18,65,595 + 84,666 4·8 Myaore 11,80,728 13,39,503 95,188 99,060 12,75,916 14,38,563 + 1,62,647 12·7 Orissa 13,30,812 13,84,381 22,826 23,239 13,53,638 14,07,620 + 53,982 4·0
Ol Punjab 7,91,231 10,82,049 2,00,460 2,94,334 9,91,691 13,76,383 + 3,84,692 38·8 lto.jast.h<trl 8,26,298 9,18,625 55,349 58,991 8,81,647 9,77,616 + 95,969 10·9 Uttar l'mdeslt 35,50,135 41,80,868 -4,,08,693 5,4:2,551 39,58,828 47,23,41!) + 7,64,591 19·3 West Bengal 24,92,869 26,95,481 1,42,120 1,47,821 26,34,989 28,43,302 + 2,08,313 7·9 A. & N. Ialands 4,823 5,460 4,823 5,460 + 637 1·3 Dadra & Nagar Havcli 7Hl 716 + 7IG 100·0 Delhi 1,19,853 1,29,234 68,303 78,314 1,88,156 2,07,548 + 19,392 10·3 Himachal Pradesh 51,487 59,246 450 1,354 51,937 60,600 + 8,663 16·7 L.M. & A. Ialands 1,360 651 560 788 1,920 1,439 481 25·7 Manipur 90,851 1,00,860 15,471 18,905 1,06,322 1,19,765 + 13,443 12·6 Nllgnlllnd 32,906 35,140 32,906 35,140 + 2,234 6·8 N.E.F.A. 4,595 4,882 4,595 4,882 + 287 6·2 Pondioherry 14,236 16,938 703 791 14,939 17,729 + 2,790 18·7 Tripuro. 81,358 93,693 81,358 93,693 + 12,335 15·2
INDIA 2,49, I 4,423 2,74,18,444 17,27,925 20,.55,933 2,6&,42,348 2,94, 74,377 +28,32,079 10·6
M;ll( ••)o4.1\Ioilldu 7

Table xm-Number of Pupils at the Primary Stage
Boys Girls Total Increase ( +) Decrease (-) State/Territory
1960-61 1961-62 1960-61 1961-62 1960-61 1961-62 Number Percentage
Andhra pradesh 18,40,664 20,40,347 11,35,391 13,61,318 29,76,055 34,01,665 + 4,25,610 + 14-3 Asaam 7,10,842 7,61,401 4,14,742 4,69,573 11,25,584 12,20,974 + 95,390 + 8·5 Bihar 24,45,627 25,98,355 7,38,868 8,09,220 31,84,495 34,07,575 + 2,23,080 + 7-0 Gujarat 11,61,131 12,94,985 6,59,438 7,60,965 18,20,569 20,55,~50 + 2,35,381 + 12-9 Jammu & Kashmir 1,64,808 1,82,465 44,988 52,041 2,09,796 2,34,606 + 24,710 + 11·8 Kera1a 10,82,592 11,37,704 9,49,638 10,06,896 20,32,230 21,44,699 + 1,12,369 + 6·5 Madhya Pradesh 15,61,778 17,03,786 4,48,914 5,18,037 20,1o,eo2 22,21,823 + 2,11,131 + ;o·5 Madras 20,53,136 22,49,389 12,80,253 14,68,079 33,33,389 37,17,468 + 3,84,079 + 11·5 Maharashtra 22,29,873 23,37,562 13,39,110 14,29,429 35,68,983 37,66,991 + 1,98,008 + 5·5 Mysore 12,53,575 13,77,395 7,61,618 9,25,161 20,15,193 23,02,556 + 2,87,363 + 14·3 Orissa 9,70,899 10,07,666 4,39,961 4,58,660 14,10,860 14,66,326 + 55,4!6 + 3·9 01
~ Punjab 9,76,740 12,54,111 4,62,926 6,96,231 14,39,666 19,50,342 + 5,10,676 + 3·5 Rajasthan 8,99,042 10,12,069 2,15,460 2,42,367 11,14,502 12,54,436 + 1,39,934 + 12·5 Uttar Pradesh 32,24,830 37,27,156 8,68,171 11,3~,522 40,93,001 48,6(',678 + 7,67,&77 + 18·8 West Bengal 17,01,350 18,31,160 9,50,967 10,22,835 26,52,317 28,53,995 + 2,01,678 + 7·8 A. & N. Islands 2,719 3,349 1,717 2,140 4,436 5,489 + 1,053 + 23·5 Dadra & Nagar Haveli 2,620 662 3,282 + 3,282 Delhi 1,65,656 1,79,643 1,20,730 1,3~·.680 2,86,386 3,14,323 J ~ + l 27,ft37 + 9·8 Himachal Pradesh 67,221 76,362 16,810 17,702 84,031 94,064 ~ +1 10,{33 + 11·9 L.M. & A. Islands 1,920 2,240 1,255 1,547 3,175 3,787- i> + 612 + 19·3 Manipur 69,069 70,328 37,253 45,328 1,06,322 1,15,656 n. + 9,334 + 8·8 Nagaland 22,306 23,869 13,339 13,915 35,645 37,784 + 2,139 + 6·0 N.E.F.A. 5,464 5,741 709 919 6,173 6,660 + 487 + 7·9 Pondioherry 18,984 22,799 12,250 lli,444 31,234 38,243= +~ 7,009 + 22·4 Tripura 57,114 64,720 29,543 34,237 86,657 98,957 + 12,300 + 14·2
INDIA 2,26,87,340 2,49,67,222 1,09,44,051 1,26,10,907 3,36,31,391 3,75,78,129 +39,46,738 + 11·'

WASTAGE AT PRIMARY CLASSES 1958-59 TO 1961-62
NO. Of STUDENTS
IN LAKHS
1001. ---------------------
YEAR 1958-59 1959-60 1960-61 1961-62
CLASS l 11 111 lV
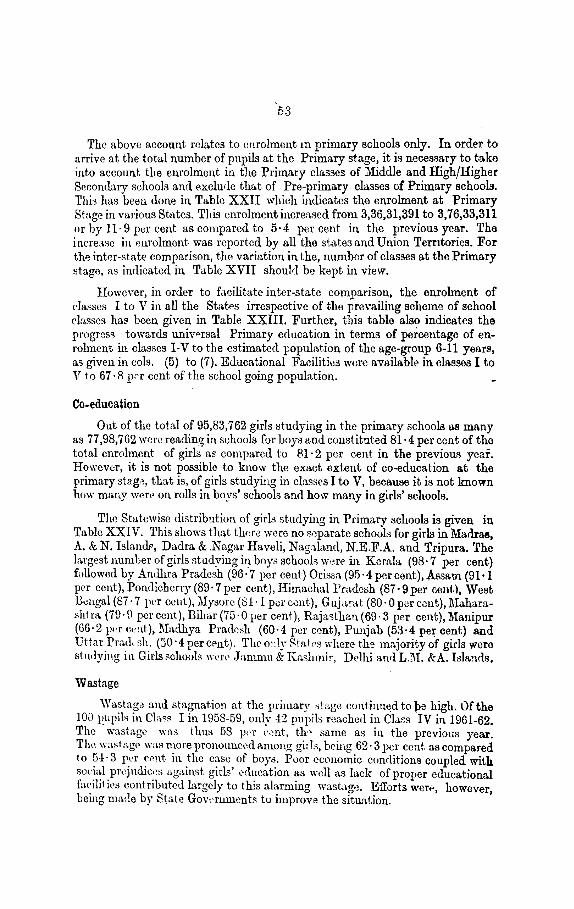
53
The above account. r•;latcs to enrolment m primary schools only. In order to arrive at the total number of pupils at the Primary stage, it is necessary to tako into account the enrolment iu the Primary classes of 1'Iiddle and High/Higher Secondary schools and exclude that of Pre-primary classes of Primary schools. Thi,; has been done in Table XXII which indicates the enrolment at Primary Stage in various States. This enrolment increased from 3,36,31,391 to 3,76,33,311 or by 11· 9 per cent as compared to 5 · 4 per cent in the previous year. The increase in enrolment. was reported by all the stv.tes and Union Terntories. For thiJ inkr-state comparison, the variation in the, number of classes at the Primary stage, as indicated in Table XVII should be kept in view.
However, in order to f<•cilitate inter-state comparison, the enrolment of dasscs I to V in all the Sta!Rs irrespective of the pre\·ailiug scheme of school rbsscs ha~ been given in Table XXIII. Further, this table also indicates the progress towards tmiv<>rsal Primary education in terms of percentage of enrohneut in classes I-V to the estimated populn.tion of the age-group 6-11 years, as given in cols. (5) to (7). EJ.ucational Facilities were available in classes I to V to 67 · R p~r cent of the school going population.
Co-education
Out of the total of 95,83,762 girls studying in the primary schools as many as 77,98,762 were reading in schools for boys and constituted 81·4 percent of tho total enrolment of girls as compared to 81· 2 per cent in the previous year. Howevur, it is not possible to know the exact extent of co-education at the primary stag.~, that is, of girls studying in classes I to V, because it is not known how many werP on rolls in boys' schools and how many in girls' schools.
The Statewise distribution of girl~ studying in Primary schools is given in Table XXIV. This shows th,•t thP-rc were no s"parate school~ for girls in Madras, A. & N. Islando, D<J.dra & .Nagar Havcli, Naphnd, N.E.F.A. and Tripura. The largest number of girls studying in boys school~ w·cre in Kemla (98· 7 per cent) followed by AnJ.hra Pradesh (96 · 7 per cent) Orissa (95 · 4 per cent), -i\ssam (91·1 p~r cent), Pondichcrry (89· 7 per cent), Himachal Pradesh (87 · 9 per eeuj.), West B.mgal (87 · 7 per ccnt),l\Iysorc (81·1 p0r cent), G uja,!·at (80 · 0 per cout), Mahara· Bhtra (79·\1 pcrcent),Bilmr(75·0per cent), Rajasthan(69·3 per cent),:Manipur (G6·2 p<'r c~:1t), Madhya Prad~sh (60·4 per cent), Punjab (53·4 per cent) and Uttar Pmd, ~.h. (50 ·4 percPnt). The o~:ly Rtat~s where the majority of girls were studying itl Girls schools wert' Jammu & K>1slunir, Drlhi anrl L.M. &A. Isl11.!1ds,
Wastage
Wastaga and stagnation at the primary '"2-ge continued tope high. Of the lOD l~upil;; in Cb~s I in 1958-59, only 42 pupils rcache•l in Cb~s IV in 1961-62. The wastag<' was thus 58 pn ,.,,nt, th" same as in the previous year. The wastagt' waR more pronounced among girl~, being 62 · 3 per cent as compared to 54· 3 per ccnt in the case of boys. Poor economic conrlitions coupled with stwi;;l pr.,judic.~s against. girls' cO.ucation as well as bck ofpro}Jer educational f,wiliti,·~ contributed brgcly to this abrming wasta"•). Efforts wer•· however being made by State Gowt:lllllents to improve the sltJL"'tion. ' '
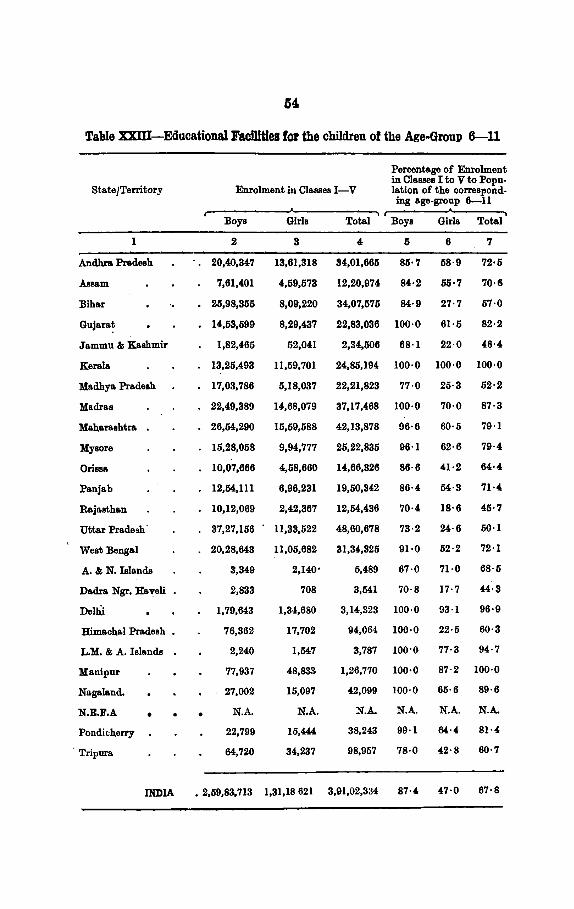
54
Table XXIII-Educational FaoDHles for the children of the Age-Group 6-ll
StatejTerritory Enrolment in Cl888es I-V
Percentage of Enrolment in Classes I to V to Popu-lation of the oorre~ond-ing age-group 6-11
Boys Girls Total Boys Girls Total
1 2 3 4 5 6 7
Andhra Pradesh 20,40,347 13,61,318 34,01,665 85·7 58·9 72·5
Asaam 7,61,401 4,59,573 12,20,974 34·2 55·7 70·6
Bihar 25,98,355 8,09,220 34,07,575 84·9 27·7 57·0
Gujara~ 14,53,599 8,29,437 22,83,036 100·0 61·5 82·2
Jammu & Kashmir 1,82,465 52,041 2,34,506 68·1 22·0 46·4
Kerala 13,25,493 11,59,701 24,85,194 100·0 100·0 100·0
Madhya Pradesh 17,03,786 5,18,037 22,21,823 77·0 25·3 52·2
Madras 22,49,389 14,68,079 37,17,468 100·0 70·0 87·3
Maharashtra 26,54,290 15,59,588 42,13,878 96·6 60·5 79·1
Mysore 15,28,058 9,94,777 25,22,835 96·1 62·6 79·4
Ori888 10,07,666 4,58,660 14,66,826 86·6 41·2 64·4
Panjab 12,54,111 6,96,231 19,50,842 86·4 54·3 71·4
Rajasthan 10,12,069 2,42,867 12,54,436 70·4 18·6 45·7
Uttar Pradesh- 37,27,156 11,33,522 48,60,678 73·2 24·6 50·1
West Bengal 20,28,643 11,05,682 31,34,325 91·0 52·2 72·1
A. & N. Ialanda 3,349 2,140• 5,489 67·0 71·0 68·5
Dadra Ngr. Haveli 2,833 708 3,541 70·8 17·7 44·3
Delhi 1,79,643 1,34,680 3,14,323 100·0 93·1 96·9
Himachal Pradesh 76,362 17,702 94,064 100·0 22·5 60·3
L.M. & A. Islands 2,240 1,547 3,787 IOO·O 77·3 94·7
Manipur 77,937 48,833 1,26,770 100·0 87·2 100·0
Nage.Ie.nd. 27,002 15,097 42,099 100·0 65·6 89·6
N.E.F.A • • N.A. N.A.. N.A. N.A.. N.A. N.A.
Pondicherry 22,799 15,444. 38,243 99·1 64·4 81·4
Tripura 64,720 34,237 98,957 78·0 42·8 60·7
INDIA • 2,59,83, 713 1,81,18 621 3,91,02,334 87·4 47·0 67·8

55
Table XXIV -Girls in Primary Schools
Percentage of girls in boya
State/Territory No. of girls in No. of girls in Total No. of sohools to boys' schools girls' sohoolo girls tote.! num.
ber of girlo
2 3 4 5
Andhre. Pradesh • 11,91,824 40,956 12,32,779 96•7
Assam 3,88,526 38,018 4,26,544 91·1
Bihar 5,14,582 1,72,236 6,86,818 74·9
Gujar&t 2,13,590 53,401 2,66,991 80•0
Jammu & Kashmir 1,679 38,137 39,816 4·2
Kerala 8,55,0ll 11,476 8,66,487 98·7
Madhya Pradesh 2,56,331 1,68,134 4,24,465 60·4
Madras 10,17,925 10,17,925 100·0
Moharashtra 5,39,653 1,35,417 6,75,070 79·9
MyBDre 4,78,091 90,672 5,68,763 M·l
Orissa 4,24,384 20,447 4,44,831 95·4
Punjab 2,63,583 2,29,805 4,93,388 113·4
Rajasth&n 1,20,708 53,540 1,74,248 69·3
Uttar Pradesh 5,27,662 5,18,4118 10,46,120 50•4
West Bengal 8,95,480 1,24,485 10,19,965 87·8
A. & N. Islands 2,137 2,137 100·0
Dadra & Ngr. Haveli 128 128 100·0
Delhi 15,389 71,282 8fl,671 17•8
Himachal Pradesh 8,804 1,212 10,0!6 87·0
L.M. & A. Islando 289 788 1,077 26·8
Manipnr 30,964 15,844 46,808 66·2
Nagaland 13,184 13,184 100·0
N.E.F.A. 52! 521 100·0
Pondicherry 6,015 693 6,708 89·7
Trip urn 32,302 32,302 100·0
INDIA 77,98,762 17,85,000 95,83,762 81·4
Single Teacher Schools
Of the total number of 3,51,530 primary schools, 1,55,0!7 were single teacher schools. The corresponding figures for the previous year were 3,30,399 for total number of schools and 1,45,246 for single teacher schools. Single teacher schools thus formed 44·1 per cent of the total number of Primary schools as compared to 43 • 8 per cent during the previous year.
The number of pupils in single teacher primary schools increased from 56,19,928 to 61,29,030 and formed 20·8 per cent of the total enrolment in pri· mary schools as against 21·1 per cent in the previous year.
The Statewise statistics of single-teacher primary schools are given in Table XXV. A decrease in the number of such schools was reported by the States ofGujarat, Kerala, 1\iaharashtra, Mysore, Punjab, West Bengal, Manipur and Nagaland while in Delhi their. number remained unchanged. Dadra & Nagar Haveli reported statistics for the first time. In the rest of the States and Union Territories, the number of single teacher schools increased. The proportion of single teacher schools to the total number of Primary schools was the highest in Jammu & Kashmir, (81·4per cent). Next in order were the States of Gujarat (69·3 per cent), Bihar (63 · 9 p••r cent) Mysore (63·7 per cent), Maharashtra (61·9percent), Rajasthan(61·1percent),and the Union Territory ofPondicherry (58·3 per cent). The least number of single-teacher schools was in Kerala (0·1 pe~ cent).
Col. (9) gives the percentage of enrolment in single teacher schools to the total enrolment in primary schools in various states. This percentage was highest in Jammu & Kashmir (69·4 per cent) and lowest in Kerala where it is negligible.
During the year under report, compulsory education in some form was in force in all the States except Jammu & Kashmir, and among Union Territories only Delhi was under compulsion. 1,445 towns and 98,706 villages were under compulsion as against 1,257 towns and 70,827 villages in the previous year; The number of schools in the compulsory areas was 20,980 in towns and 1,02,943 in villages. The corresponding figures for the previous year were 15,746 for towns and 58,815 for villages. The number of pupils on rolls in these schools increased from 85,30,338 (33,31,481 in schools in urban areas and 51,SI8,857 in schools in rural areas) to 90,35,113 (31,60,384 in schools in urban areas and 58, 74,729 in schools in rural areas).
For the enforcement of compulsion, as many as 5,15,768 notices for nonenrolment and 1,81,027 attendance orders for being absent from school were

Table XXV-Number of and Enrolment in Single-Teacher Primary Schools
Percentage of enrolment Percentage of single in S.T. Schools to the
teacher schools of the total total enrolment in State/Territory Number of Schools Number of Pupils No. of Primary Schools Primary Schools
~----.. ~-~-- ...... .-----"-----.. 1960-61 1961-62 1960-61 1961-62 1960-61 1961-62 1960-61 1961-62
.Andhra Pradesh 14,614 17,182 4,35,500 6,90,900 42-9 46·8 20-0 22·5 Assam 9,299 9,787 4,ll,537 4,42,907 58·2 57-7 39·3 39·0 Bihar 23,628 .25,154 ll,36,867 ll,31,697 63·3 63·9 41·9 39-!i Gujarat 8,703 8,213 2,82,709 2,88,543 72·3 69·3 ~ 39·8 36·7 Jammu & Kashmir 1,974 2,761 92,910 1,09,700 69·0 81·4 62·8 69·4 Kern !a 15 10 722 429 0·2 0·1 0·0 0·0 Madhya Pradesh 13,929 14,746 4,37,440 4,82,669 50·1 50·3 26·0 26·2 Madras 4,979 4,718 2,01,109 2,00,111 21·0 19·9 8·1 7·7 Maharash tra 16,126 15,793 5,96,342 5,98,555 63·4 61·9 33·5 32·1 Or Mysore 13,356 14,000 4,66,915 5,22,651 63·3 • 63·7 36·6 36·3 ...:)
Orissa 12,129 12,277 4,61,447 4,56,444 55·5 54·0 34·1 32·4 Punjab 5,002 3,869 1,75,090 1,74,585 37·7 28·9 17·7 12·7 Rajasthan. 8,603 9,970 2,93,541 3,31,828 59·1 61·1 33·3 33·9 Uttar Pradesh 8,450 12,364 3,52,843 5,35,693 21·1 26-6 8·9 ll·3 We•t Bengal 2,917 2,6ll 1,22,129 1,10,905 10·4 8·6 4·6 3·9 A & N Islands 49 JD 1,589 2,974 64·5 61·5 32·9 54·5 Dadra & Ngr. Haveli 10 138 47·7 19·3 Delhi • • 2 2 95 100 0·3 o·3 0·1 0·0 Himachal Pradesh 191 357 4,959 7,321 16·9 26·6 9·5 12·1 L.M. & A. Islands · 1 19 8·3 1·3 Manipur 302 260 6,890 6,279 18·2 13·8 6·5 5·2 Nagaland • 303 233 14,152 9,413 74·4 49·1 43·0 26·8 N.E.F.A. 25 30 484 723 19·7 21·4 10·5 14·8 Pondicherry 153 141 5,638 6,073 64·0 58·3 37-7 34·3 'fripur,. 497 499 19,020 18,373 46·3 39·7 23·4 19·6
INDIA 1,45,246 1,55,047 56,19,928 61,29,030 43·8 44·1 21·1 20·8

Table XXVI-Statistics of Compulsory Primary Education by States
No. of schools where Compulsion age· No. of Areas under compulsion was in No. of Pupils under
State/Territory Group Compulsion force compulsion in Total
Towns Villages Towns Villages Towns Villages Towns Villages
2 3 4 5 6 7 8 9 10
Andhra Pradesh 6-7 6-7 212 25,637 3,219 32,782 1,45,863 5,38,297 6,84,160
Assam 6-ll 6-11 16 4,394 153 4,074 28,857 3,58,235 3,87,092 Bihar 6-10 6-ll/14 16 8,131 810 4,643 97,147 4,10,603 5,07,750 Gujarat 6-II 6-ll 103 13,397 1,286 12,5ll 3,40,609 8,79,632 12,20,241 Madhya Pradesh 6-ll 6-ll 247 6,633 1,059 3,925 1,79,527 2,l1,647 3,91,174
Ot 6-14 6-14 ~
Madra.a f5-10} 5-10} 461 l6-12 6-12 5,542 5,570 7,94,242 9,69,05-! 17,63,296
Mahara.shtra 6-ll/14 6-ll/14 274 15,559 3,463 17,172 8,73,166 12,44,421 21,17,587 Mysore
Orissa 6-11 6-ll 2 8 27* 7 2,618 859 3,477 Punjab 6-7 6-7 11 3,910* 4,821 11,651 72,111 2,80,382 3,52,493 Rajasthan. 6-11 6-11 6 706 139 547 31,547 42,693 74,240 Uttar Pradesh 6-11 6-11 95 1,687 2,741 575 5,30,620 73,437 6,04,057 West Bengal 6-10 6-11 1 12,753 67 9,137 7,980 8,43,162 8,51,142 Delhi 6-11* 6-11 1 349 536 349 56,097 22,307 78,404
INDIA 1,445 98,706 20,980 1,02,943 31,60,384 58,74,729 90,35,113
*1960·61 Figures.

Table XXVI-Statistics of Compulsory PrimarY Education by States-contd.
Coercive Measures taken
Number of Prosecutions Stat..fTerritories ---~------No. of No. of For non- For non- Fine No. of
Notices issued Attendance enrolment attendance realised Attendance Orders passed Officers
ll 12 13 14 15 16
Andhra Pradesh
ABBS.m 17,474 6,323 345 3,103 19 84 Bihar 4,916 17 14 28 25 Gujarat 1,51,468 61,178 3,315 7,085 1,3ll Madhya Pradesh 13,528 6,315 99 1,178 542 122 Ol
Madras 149 144 <:0
Maharashtra 1,94,957 36,159 1,ll8 869 60 34 Mysore Orissa 36 36 30 32 Punjab 338 Rajasthan. 232 2:32 1,828 17 Uttar Pradesh 1,31,367 70,569 4,267 7,813 14,248 302 West Bengal 1,87:! 54 5 16 1U Dolhi 8
INDIA 5,15,768 1,81,027 9,381 20,108 18,068 950
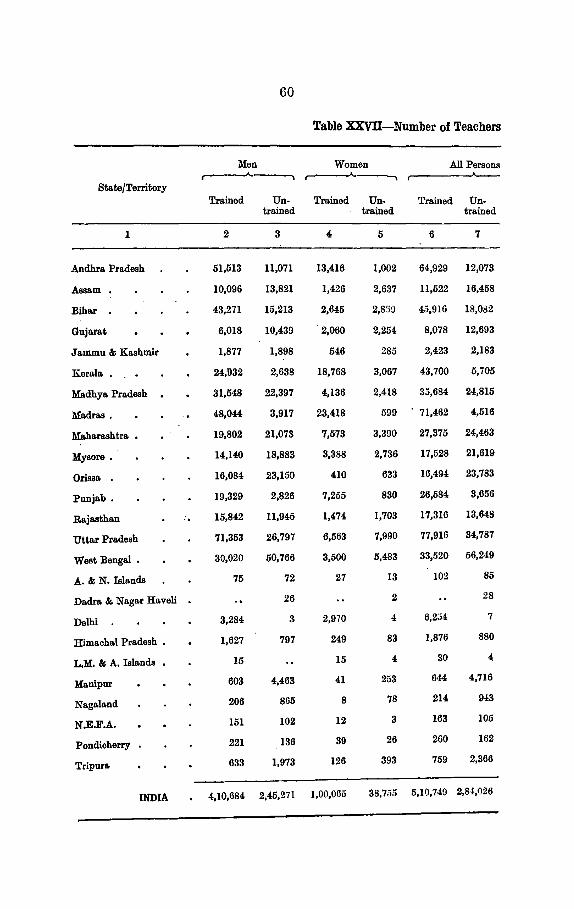
60
Table XXVU-Number of Teachers
Men Women All Persons ----., ----., ,...-----A--
State/Territory Trained Un- Trained Un- Trained Un-
trained trained trained
1 2 3 4 5 6 7
Andhra Pradesh 51,513 11,071 13,416 1,002 64,929 12,073
Assa.m 10,096 13,821 1,426 2,637 11,622 16,458
Bihar 43,271 15,213 2,645 2,839 45,916 18,082
Gujarat 6,018 10,439 2,060 2,254 8,078 12,693
Jammu & Kashmir 1,877 1,898 546 285 2,423 2,183
Kerala • 24,932 2,638 18,768 3,067 43,700 5,705
Madhya Pradesh 31,548 22,397 4,136 2,418 35,684 24,815
Madras. 48,044 3,917 23,418 599 71,462 4,516
Maharashtra , 19,802 21,073 7,573 3,390 27,375 24,463
Mysore. 14,140 18,883 3,388 2,736 17,528 21,619
Orissa. 16,084 23,150 410 633 16,494 23,783
Punjab. 19,329 2,826 7,255 830 26,584 3,656
Raja.sthan .. 15,842 11,945 1,474 1,703 17,316 13,648
Utta.r Pradesh 71,353 26,797 6,563 7,990 77,916 34,787
West Bengal • 30,020 50,766 3,500 5,483 33,520 56,249
A. & N. Islands 75 72 27 13 102 86
Dadra &. Nagar Haveli 26 2 28
Delhi 3,284 3 2,970 4 6,2J4 7
Himachal Pradesh • 1,627 797 249 83 1,876 880
L.M. & A. Islands 15 15 4 30 4
Ma.nipur 603 4,463 41 253 644 4,716
Nagaland 206 865 8 78 214 9-!3
N.E.F.A. 161 102 12 3 163 105
Pondioherry 221 136 39 26 260 162
Tripur& 633 1,973 126 393 759 2,366
INDIA 4,10,684 2,45,271 1,00,065 38,755 5,10,749 2,8-!,026

61
Primary Schools
Percentage of Average number - --. Total Increase trained teachers of pupils per
Total No. of + or teacher StatejTerritory teachers Decrease r- ---.A.--, r- __ J.__ -- ~
in (-) 1960-61 1961-62 1960-61 1961-62 1960-61
8 9 10 11 12 13 14 I
77,002 73,886 + 3,116 82·9 84·3 36 40 Andbra Pradesh
27,980 26,354 + 1,626 39•3 41•2 40 41 Assam
63,9!!8 59,663 + 4,335 71·2 71·7 45 4ij Bihar
20,771 19,265 + 1,506 35·6 38·9 37 38 Gujarat
4,606 4,404 + 202 54·1 52·6 34 34 Jammu & K.;.hmir
49,405 46,609 + 2,796 90·8 88·5 39 37 Kerala
60,499 57,064 + 3,435 51·0 59·0 20 30 Madhya Pradesh
75,978 74,168 + 1,810 95·9 94·0 34 34 Madras
61,838 50,371 + 1,467 49·8 52·8 35 36 Maharashtra
:W,147 38,191 + 956 43·4 44·8 33 37 Mysore
40,277 37,325 + 2,952 38·5 41·0 36 35 Orissa
30,240 26,329 + 3,911 92·1 87·9 38 45 Punjab
30,964 28,502 + 2,462 50·8 55·9 31 32 Rajasthan
1,12,703 99,054 + 13,649 74·8 69·1 40 42 Uttar Pradesh
8!!,769 83,732 + 6,037 38·1 37·3 31 32 West Bengal
187 138 + 49 58·7 54·5 35 29 A. & N. Islands
28 + 28 0·0 26 Dadra & Nagar Ha.veli
6,261 5,444 + 817 99·3 99·9 35 33 Delhi
2,756 2,307 + 449 60·1 68·0 23 22 Himachal Pradesh
34 46 12 80·4 88·2 42 42 L.M. & A. Islands
5,360 4,305 + 1,055 10·4 12·0 25 22 Manipur
1,157 814 + 3!3 21·1 18·5 40 30 Nagaland
268 263 + 15 68·0 60·8 18 18 N.E.F.A.
422 432 10 57·0 61·6 35 42 Pondicherry
3,1~5 2,859 + 266 21·0 24·3 28 30 Tripura
7 .~l-!,775 7,41,515 + 53,2ti0 64·1 6-1·3 36 37 INDIA ------- -----~--

62
issued to the guardian of school-going children. The number of prosecutions launched during the year was 9,381 for non-enrolement and 20,108 for nonattendance. The total amount realised as fines was Rs. 18,068.
~e number of Attendance Officers for the enforcement of compulsory educatiOn was 5,570. The Statewise statistics of compulsory education is given in Table XXVI.
Teachers
The number of teachers in Primary schools increased from 7,41,515 to 7,49,775 or by 4·2 percent as compared to 1·4 percent in the previous year. These figures relate only to Primary schools and exclude the number of teachers in Primary departments of Middle and High/Higher Secondary schools where the number is not available. .
Women teachers formed 17 · 5 per· cent of the total number of teachers as against 17 ·1 per cent in the previous year. Further, of the total number of teachers, 64 ·3 per cent were trained teachers as compared to 64·1 per cent in the previous year.
Table XXVII shows the distribution of teachers in Primary schools in different states. The number of teachers increased in all the States and Union Territories except L.M. & A. Islands and Pondicherry. In Delhi, almost all the teachers were trained. Among the other States and Union Territories, the highest percentage of trained teachers to the total number of teachers was in Madras (94·0 percent) followed by Kerala (88·5 percent),L.M. &A. Islands (88· 2 per cent), Punjab (87·9 per cent), Andhra Pradesh (84 · 3 per cent), eto., the least being in Dadra & Nagar Haveli where all the teachers were untrained.
The percentage of trained teachers, however reported a decline in many States and Union Territories as will be seen in cols. (ll) and (12) of Table :xxvrr. Teacher-Pupil Ratio
The average number of pupils per teacher was 37 as against 36 in the previous year. Figures in cols. (13) and (14) of. Table XXVII show the position in various States and Union Territories during 1960-61 and 1961-62. The average during the year varied from 30 pupils per teacher in Madhya Pradesh to 45 in Bihar among the States and from 18 in N.E.F.A. to 42 in L.M. & A. Islands among the Un10n Territories. These ratios do not take into account the enrolment and teachers of the Primary sections of the Middle and HighjHigher Secondary Schools.
Pay Scales of Teachers
The details of pay scales of teachers according to their qualification and management of schools in which they were employed, are given in Appendix

STATES
ANDHRA PRADESH
ASSAM
BIHAR
GUJARAT
JAMMU & I'ASHMIR
I(£RALA
MADHYA Pf!ADESM
MADRAS
MAHAAAS,.T RA
MY SORE
ORISSA
PUNJAB
RAJASTHAN
UTTAR PRADESH
WEST BENGAL
A.B. N. ISLANDS
DADAA & NAGAR 11Al/ELI
DELHI
HIMACHAL AAADESI'l
L.M.,& A• ISLANDS
M.I\NIPUR
NAGALAND
N. (..f'. A.
PONDIC:HERRV
TRIPURA
INDIA 01:). ~ PUPIL5 P£0 TEAO<l:R
TEACHER-PUPIL RATIO 1961-62 PRIMARY SCHOOL MIDDLE SCHOOL HIGH/HIGHER SECONDAFlY SCHOOL
I
= I
~
"
'
~0 0 10 20 30 40

PERCENTAGE OF TRAINED TEACHERS IN
NAceALAND
WEST SENGAL
GUJARAT
ASSAM
ORISSA
MYSORE
JAMMU & KASHMIR
MAHARASHTRA
RAJASTHAN
MADHYA PRADESH
UTTAR PRADESH
BIHAR
ANDHRA PRADESH
PUNJAB
KERALA
MADRAS
MANIPUR,
TRIPURA
A& N.ISLANDS
N. E.F,A.
PONDICHERRY
HIMACHAL PRADESH
L. M. & A. ISLANDS
DE.LHI
PRIMARY SCHOOLS 1961-62
I PEACENTtt.G~ to I
10 20 3o 40 5o 6o 80 90

Table XXVIU--Minima and Maxima of Pay Scales of School Teachers in Government Primary Schools
Number State/Territory Prescrjbed minimum Pay Scale of years
Qualifications ,----A.-~ required tc Minimum Maximum reach the
maximum
1 2 3 4 5
I. Uttar Pradesh Passed Junior High School and Trained 35 6(i 15
2. Kerala Passed S.S.L.C. and Trained , 40 120 11 3. Bihar. Passed l\1iddle and Trained 45 75 15
4. (a) Assam Passed !\fiddle and Trained 50 65 15 (b) ~!ani pur Passed ;\Iiddle and Trained 50 65 15 (c) Maharashtra. Passed Primary and Junior
Trained 50 70 12 (d) Gujarat Passed Primary and Junior
'l'rained 50 70 12 (e) Dadra & Nagar Passed !\fiddle and Junior
Haveli. Tra.inod. 50 70 12 (f) Jammu & Kashmir . Passed Middle and Trained 50 120 13
5. (a) Nagaland Passed Matric and Trained 55 75 17 (h) Tripura Passed Middle and Trained 55 130 2!
6. (a) N.E.F.A. Passed Middle and Tra.ined 60 100 18-(b) Punjab Passed 1\Iiddle and Trained 60 120 13 (c) Himachal Pradesh Passed l\1iddle and Trained 60 120 13
7. (a) Madras Passed High Ele ncntary and Trained 65 90 15
(b) Pondicherry Passed High Elementary and Trained 65 90 15
(c) Anrlhra Passed Middle and Tra.ined 65 9.> 15
8. (a) Ori~~a .. Passed Middle and Trained 70 05 15 (b) ~Iy:sorc Passed ~fiddle and Trained 70 110 15 (r) West llcngal Passed ~fiddle and Trained 70 160 11
9. Rajasthan Passed Middle and Trained 75 160 18 10. Madhya Pradesh . Passed )fiddle and Tmined 90 170 20 11. A. & N. Islands Passed l\liddle and Trnuied 100 142 14 1~. L.~I. & A. blands Passed Lower Elementary
Examination and Trained 110 180 19 13. Delhi . Passed Middle and Trained 118 225 19
B. Yol. II-.il., or the report. The scales, as in the previous year, varied not only from State to State but also from management to management within the same. State.
Tal•le XXVIII r.ompares the minimum and maximum of the scales preSL'l"ilwd by Sbte Governments for teachers in Government Primary schools nud thP JWried in which the ma;ximum of the time-scale is reached. The States a1Hl the rnion. Territories have been grouped together according to the ~tartiug salt11·y. )l, ll( I l)oHlufEduea.liun-~

ExpenditUre
The total direct expenditure on Primary schools increased from Rs. 73,44,61,273 toRs. 82,66,91,083during the year, thus giving the rate of increase as 12 · 6 per cent as compared to 5 · 4 per cent in the previous year. Of the total Rs. 76,57,98,568 were expended on schools for boys and Rs. 6,08,92,515 on schools for girls. The corresponding figures for the previous year were Rs. 68,17,05,350 and Rs. 5,27,55,927 respectively.
The break-up of the total direct expenditure according to various sources from which it was met is shown in table XXIX below.
Table XXIX-Direct Expenditure on Primary Schools by Sources
Source
1
Government Funds
District Board Funds
J\funicipal Board l!'unds .
Fees
~ndowmenta
Other Sources
~l'otal
1960-61
,... Amount
2
Rs. 59,12,21,812
6,01,59,930
4,65,40,455
1,71,69,286
72,78,222
1,20,91,568
73,44,61,273
Percentage
3
80·5
8·2
6·3
2·3
1•0
1·7
100·0
1961-62 .
,... Amount Percentage
4 5
Rs. 66,21,10,152 81•1
7,26,12,033 8·8
5,21,21,424 6·3
2,03,92,315 2·4
72,02,109 0·9
1,21,63,050 1·5·
82,66,91,083 100·0
An increase in direct expenditure in Primary schools was reported by all sources. The largest increase was from the contribution of district boards, being 20 · 7 per cent, followed by those of fees 18 · 8 per cevt, municipal boards 12 · 0 per cent, other ~ources 0 · 6 per cent, government I· 2 per cent, and other sources 0 • 6 per cent and ndowments 0 ·1 per cent. The corresponding figures for the previous year were: district boards 9·0 percent, fees 3·4 percent, municipal boards 5· 8 percent, government funds 5 · 0 per cent, endowments I· 5 per cent and other sources 1· 5 percent. The Government as usual, continued to contribute the major share (80·1 per cent) in spitt> of the fact that it managed only 2I·8 per cent of the schools as compared to 56·8 per cent managed by local boards where contribution to the expenditure was however I5 ·I per cent only.
The distribution of the total direct expenditure on Primary schools under various management; without regard to the source from which this expenditure was met, is given in Table XXX.

65
Table XXX-Direct Expenditure on Primary SchooL~ by Management
Management 1960-61 1961-62
' Amount Percentage Amount Percentage 2 3 4 5
Rs. Rs. Gpvernment 18,09,40,156 24-5 20,29,28,238 24-5 District Boards . 33,39,69,987 45-5 38,05,87,574 46-0 Municipal Boards • . 7,17,21,195 9·8 8,14,70,255 9-9 Private Bodies-
Aided 13,72,72,725 18·7 14,96,80,606 i8·l Unaided 1,05,57,010 1·4 1,20,24,410 1·5
Total 73,44,61,273 100·0 82,66,91,083 100·0
The Statewise distribution of direct expenditure on Prima.ry schools is given in Table XXXI. All the States and Union Territories excepting Pondicherry reported an increase. The decrease in Pondicherry was due to upgrading of some of the bigger primary schools"' ith larger enrolment and expenditure into middle school.e. The highest increase among the States was reported by Uttar PradeF.h (Rs. 1,58,41,747) and the lowest by Jammu & Kashmir (Rs. 4,08,962). The corresponding positions among the Union Territories were occupied by Delhi (Rs. 23,13,885) and L.M. & A. Islands (Rs. 13,782). On percentage basis, Rajasthan reported the highest increase of 23 · 5 per cent and Gujarat the lowest increase of 3·2 per cent among the states while in Union Territories, excepting Dadra & Nagar Haveli which reported statistics for the fir&t time, the highest and lowest positions were occupied by A. & N. Island~ (31· 2 per cent) and ~Himachal PraJ.e;h (2 · 6 per cent).
The percentage of direct expenditure on Primary schools. to ~he total <lireet expenditure on education as a whole is indicated ia col. (10) of table XXXI. These figures show wide inter-State variations which is'partly due to the vari,1tions in the number of classes in primary schools.
Cols. (ll) to (16) of Table XXXI give the percentage of expenditure on Primary schools met from different sources. It \viii be observed that the Government met the major part of expenditure in all the States and Union Territories excepting Delhi, Himachal Pradesh and Mauipur. ·In A & N Islands, Dadra & Nagar Haveli, L.l\I. & A. Islands, Nagaland and N.E.F.A, its contribution was cent percent. Besides that, in 14 States and Union Territories, its contribution was between 75 per cent. and 100 per cl)nt and in 3 States it was between 50 per cent and 75 per cent. In Delhi, Himachal Pradesh and Manipur the largest contribution was from local bodies and, ranged between 95 ·9 percent and 97 · 8 percent The highest contribution from fees wa.s only 12·0 per cent (in l\lalmrashtra.). The shares of endowments and other sources wore al.so not much-thl:' combined figure ranged from 0 · 3 per cent in A.ndhra Pradesh and Jammu & Kashmir to 7 ·8 per cent in Assam. The all India average annual cost. of educ11ting a pupil in primary schools increased from Rs. 27.6 to Rs. 28 · 0. Its contribution according to different sources was government funds Rs. ~3 · 3, district hoards funds Rs. 2 · 6, municipal boards funds Rs. 1· 9, foes Rs. 0·7 endowments Re. 0·3, and other sources Re. 0·4. The averaae nnmml costs per pupil in various States during l96ll-61 and 1951-62 are indicated in cols. (17) and (18) of Table XXXI. )I,l.l(J)51)I·,f '<lueatiou-8("
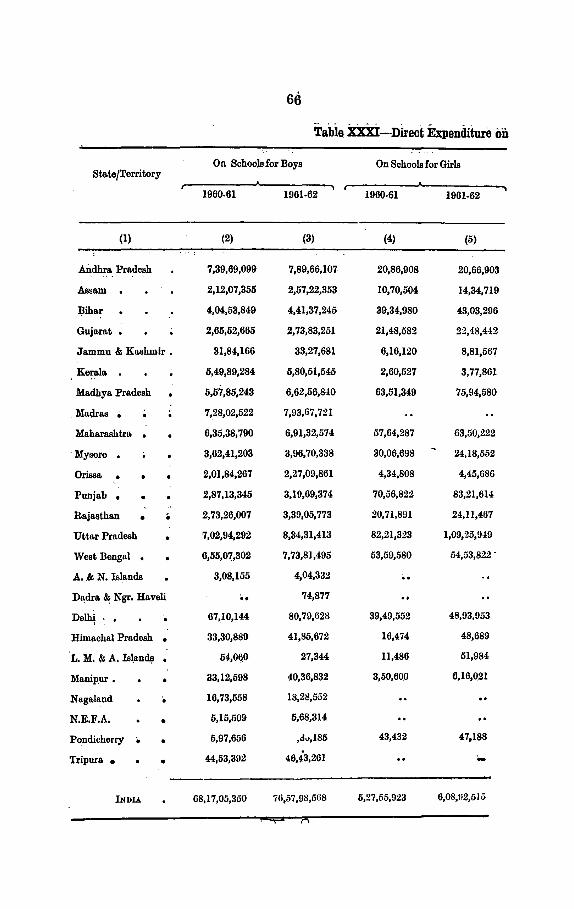
66
Table Xxxi--Direct Expenditure oii
Sta.tejTerritory On Schools for Boys On Schools for Girls
1960-61 1961-62 1960-61 1961-62
(1) (2) (3) (4) (5)
Andhra. Pradesh 7,39,69,099 7,89,66,107 20,86,908 20,66,903
Assam 2,12,07,355 2,57,22,353 10,70,504 14,34,719
Biha.r 4,04,53,849 4,41,37,245 39,34,980 43,03,296 . . Gujara.t 2,65,52,665 2, 73,83,251 21,48,582 22,48,442
Jammu & Kashmir • 31,84,166 33,27,681 6,16,120 8,81,567
Kera.la 5,49,89,284 5,80,51,545 2,60,527 3,77,861
Madhya. Pradesh 5,57,85,243 6,62,56,840 63,51,349 75,94,580
. Madras . 7 ,_28,02,522 7,93,67, 721
Maha.ra.shtra . 6,35,38, 790 6,91,32,574 57,64,287 63,50,222
· Mysore 3,62,41,203 3,96, 70,338 30,06,698 24,18,552
Orissa 2,01,84,267 2,27,09,861 4,34,808 4,45,686
Punjab • 2,87,13,345 3,19,69,374 70,56,822 83,21,614
Rajasthan • • 2, 73,26,007 3,39,05, 773 20,71,891 24,11,467
Uttar Pradesh 7,02,94,292 8,34,31,413 82,21,323 1,09,25,949
West Bengal . 6,55,0(,302 7,73,81,495 53,59,580 54,53,822 .
A . . & N. Islands 3,08,155 4,04,332
Dl\dra. &, Ngr. Haveli •• 74,877
De~, 67,10,144, 80,79,62S 39,49,552 48,93,953
Himachal Pradesh • 33,30,889 41,85,672 16,474 48,689
L. M. & A. Islan~ . 54,060 27,344 11,486 51,984
Ma.nipur. 33,12,598 40,36,832 3,50,600 6,16,021
Naga.land 16,73,558 18,28,552
N.E.F.A. • 5,15,509 6,68,314
Pondicherry ;, 5,97,656 ,dv,l86 43,432 47,188
'fripura. • • 44,53,302 46,43,261 -INDIA 68,17,05,350 76,57,98,568 5,27,55,023 6,08,U2,515

67
Primary Schools by States
Total Increase ( +) or State/Territory Decrease (-)
1960-61 1961-62 Amount Percentage
(6) (7) (8) (9)
;Rs. 7,60,56,007 8,10,33,010 + 49,77,003 6·5 Andhra. Pradesh
2,22,77,859 2,71,57,072 + 48,79,213 21·9 Assam
4,43,88,829 4,84,40,541 + 40,51,712 9·1 Bihar
2,87,01,247 2,96,31,693 + 9,30,446 3·2 Gujara.t
38,00,286 42,09,248 + 4,08,962 10·8 J.&K.
5,52,49,811 5,84,2!1,406 + 31,79,595 5·6 Kerala.
6,21,36,592 7,38,51,42) + 1,17,14,8·!8 18·9 Madhya Pradesh
7,28,02,522 7,93,67,721 + 65,65,199 9·0 Madras
6,93,03,077 7,54,82, 796 + 61,79,719 8·9 Maharashtra.
3,92,47,901 4,20,88,890 + 28,40,989 7·2 1\lysore
2,06,19,075 2,31,55,5! 7 + 25,36,472 12·3 Orissa.
3,57. 70,167 4,02,90;988 + 45,20,821 12·6 Punjab
2,93,97,898 3,63,17,240 + 69,19,342 23·5 Rajasthan
7,85,15,615 9,43,57·,,62 +1,58,41,747 20·2 Uttar Pradesh
7,08,66,882 8,28,35,317 + 1,19,68,435 17·8 West Bengal
3,08,155 4,04,332 + 96,i77 31·2 A. & N. Islands
74,877 + 74,877 100·0 Dadra. & Ngr. Ha.veli
1,06,59,696 1,29,73,581 + 23,13,885 21·7 Delhi
33,47,363 42,34,361 + 8,86,998 2·6 Himachal Pradesh
65,546 79,328 + 13,782 21·0 L. 111. & A. Islands
36,63,198 46,52,853 + 9,89,655 27·0 Manipur
16,73,558 18,28,552 + 1,54,994 9·3 Nagaland
5,15,509 5,68,314 + 52,805 10·2 N.E.F.A.
6,41,088 5,83,373 57,715 9·0 Pondichcrry
44,53,392 46,43,261 + 1;89,869 4·5 Tripura
73,'-l,61,2i3 82,66,91,08:! +9,22,29,810 i2·6 L'fDU.

68
Table XXXI-Direct Expenditure on Primary Schools by States-(contd.)
Per-centage
of Percentage.of Expenditure met from Average Annual Expen- cost per Pupil diture ,------A-----, on Pry. Govt. Distt. Munici- Fees Endow- Other 1960- 1961-
State/ Schools Funds Board pal menta Sources 61 62 Territory to Funds Board
total Funds Direct
Expendi-ture on
Educa-tion
1 10 11 12 13 14 15 16 17 18
Andhra Pra-desh 33·7 69·0 27·1 3·3 0·3 0·3 0·0 28·4 26·4
Aasam 34·6 90·5 1·4 0·1 0·2 7·7 0·1 21·3 23·9.
Bihar 29·4 88·8 6·3 1·9 0·0 0·0 3·0 16·4 16·9
Gujarat 17·4 77·4 5·1 7·7 6·0 1·0 2~7 40·4 37·7
Jnmmu & Kashmir 18·0 99·7 0·1 0·0 0·3 25·7 26·6
Kerala 33·9 98·5 0·0 0·0 1·5 30·6 31·7
Madhya Pradesh 36· 5 88·0 4·8 4·7 0·5 0·4 1·6 36·9 40·1
Madras 30·8 71-5 16·9 8·7 0·3 2·4 0·2 29·2 30·4
Maharashtra 19·1 66·7 3·5 12·6 12·0 0·4 4·8 38·9 40·5
Mysore 27·1 90·3 4·3 2·2 0·1 0·3 2·8 30·8 29·3
Orissa 41·3 96·3 0·9 0·0 0·7 1·7 15·2 16·5
Punjab 26·8 96·8 0·5 0·5 1·3 1·7 36·1 29·3"
Rajasthan 30·0 96·0 0·3 1·5 1·8 0·4 33·3 37·1 Uttar Pra-
desh 26·8 75·9 13·2 8·3 1·2 0·1 1·3 19·8 20·0
West Bengal 29·9 82·2 3·9 5·2 7·9 0·5 0·3 26·9 29·1 A. &N·. Is-
lands 32·0 100·0 63·9 74·1
Dadra & Ngr. Haveli 84·8 100·0 20·8
Delhi 13·4 0·0 97·4 1·5 1·1 56·3 62·5 Himachal
Pradesh • 37·4 0·0 97·8 1·2 0·2 0·8 64·5 69·6 L.M.& A.
Islands 26·4 100·0 34·1 55·4
Manipur . 51·4 2·2 95·9 0·0 1·9 34·5 38·8
Nagaland 47•7 100·0 50·8 52·0
N.E.F.A. 42·4 100·0 112·2 116·4
Pondicherry 12·1 95·9 0·7 1·9 1·5 42·9 32·9
Tripura 46·7 99·2 0·3 0·5 0·0 54·7 49·5
INDIA 28•2 80·1 8·8 6·3 2·4 0·9 1·5 27·6 28·0

CHAPTER IV
BASIC EDUCATION
Most of the schemes of Basic education which were implemented during the Second Five Year Plan were included in the Third Plan also. A sum of Rs. 28 crores was provided for them. One of these schemes related to the orientation of elemantary schools towards the Basic pattern, which envisaged the introduction of such main features of Basic education in traditional type of primary schools which did not require large-scale expenditure on equipment. The implementation of this scheme was taken up in right earnest during the year and thenecessaryprogramme nf orientation of teaching and inspectorate staff was also started. Moreover, the teaching of crafts was introduced in a number of primary schools towards the same end. Also, a National Board of Basic Education was set up to assess the progress of Basic education and to advise the Central and State Governments on the formulation of sound policies and programmes.
As a. first step towards the ultimate goal of converting primary schools to the Basic type, it was felt that all training schools for primary teachers should be converted into Basic training schools by the end of the Third Five-Year Plan. Accordingly, new Basic training institutions were opened and some ofthe traditional type of training institutions were converted to the BaBic type during the year.
The National Institute of Basic Education continued its activities in the fields of research, training, art and crafts and extension and production of literature in Basic education during the )Car. A brief account of these activities is given below.
Research
A study on "Expenditure on education incurred by parents at the elementary stage of education in Delhi" was completed. A number of projects "'ere in .progress. These included:-{!) An analysis of Hindi Primers; (ii) standardisatiOn of check-lists for the evaluation of Basic schools; (iii) Ensuring Standards of achievements in Basic schools: (iv) Comparative study of the practical problems involving competence of pupils of Basic and non-Basic schools; (v) Relationship between students' self-government and social experiences of Basic 1.1ehool pupils; (\'i) The problems of elementary education in a. selected village and the preparation of village study manual; (vii) Suitable crafts for urban schools (viii) An evaluation study of the orientation programme at the school level; (ix) Unit cost of starting a. Basic school; and (x) A pilot study on how students spend their holidays.
Three short-terms training courses for craft education were organised. 69

70
Production of Literature
The following publications were brought out during the year.
(i) Basic Education Abstracts (half-yearly). (i1') Buniydi Talim (Quarterly Journal).
(iii) Tantu Udyoga-f]J:afts for Basic Schools. ' (iv) Inspection of Basic schools. • (v) Buniyadi Shiksl~a aur Naveen Sarru1j Viyavasta (vi) Building up a Curriculum for Basic Schools. (vii) Utilising Festivals for Education.
(viii) Sam'asya Nidan Pariksha. (i:~,) Elementary Bamboo-work. (x) Targets for Craft work •
. · . (xi) Principles and Problems of correlated teachings. (:~,ii) Elementary Doll-Making.
· (xiii) The Practice of correlated teachings. (:~,iv) Evaluation in Basic Education. (Xi!) Research Problems iii Basic Education. (xvi) Buniyadi School aur Samaj Seva.
(:~,11ii) A Framework of Correlated Syllabus. (xviii) Gardening and Agriculture for Grade V.
(xix) Correlated Teaching for Grades I & II.
Besides, linder the scheme of imparting ~urrent practices in Basic schools and extension work the Institute continued an experiment in action research at the Senior Basic School, Chhatarpur, Delhi.
Main Developments
. An account of the progress made in the field of basic education in the various States iS given below:
Assam Primary and Middle vernacular schools were gradually being converted
into Basic schools; For this purpose, untrained teacters and sub"inspectors of schools were deputed for Basic training. Seminars were organised under Orientation Scheme for the Inspecting Officers and teachers.
Bihar .
. Depl;ty Superintendents of Basic education were appointed in all districts.
Gujarat During the year, 375 ordinary schools were converted into Basic schools.
Moreovei;, grants amouting to Rs. 3·46 lakhs were paid to District School Boards for the construction of H crafts sheds.

71
Madhya Pradesh
Some Junior Basic Schools were upgradecl to Senior Basic Schools. A post-graduate Basic training College was opened at Sagar.
Madras · A syllabus for the four-year post-Basic course framed by a Committee
constituted for the purpose, was approved by the Government. An ad hoc Committee was constituted to assess the attainments of the final year students of the post-Basic SchooL'!. On the basis of this assessment 75 out of 101 students were declared as passed. .
To implement the programme of orientation of elementary Schools towards the Basic pattern, Headmasters and teachers of elementary schools were given training in the principles and methods of introducing salient features of Basic education without incurring heavy expenditure in making them fully craftcentres.
The head'! of B~sic Schools met for five days at different centres and discussed such important questions as literature for Basic Schools, administration of Basic School8, correlated methods of teaching et<'.
Maharashtra
The scheme of extension services introduced in 20 training Colleges was continued and as a result, 20 to 25 Schools in the neighbourhood of each of these Colleges were benefited. Besides a short-term course in crafts was or" ganised from 1st May, 1961 to 7th June, 1961.
Mysore
As a part of the programme of the expansion of Basic education contemplated in the Third Plan, 500 primary Schools were converted to the Basic typo. The new syllabus of seven-year integrated primary course, which included also the important features of Basic education, was introduced in the V and VI standards of all Schools both BaJic and Non-Basic.
Orissa
The admini'ltration of B:1aic Schools, except those situated in urban areas was passed on to the Panchayat Samities.
A seminar on the Orientation of primary Schools towards the Basic pattern was organised at the State Level in the last week of October, 1961. It was followed by district seminars held under the direction of District Inspectors and block seminars conducted in each circle by the respective sub-Inspectors. The object of this programme was to find out the methods of introducing essential features of Basic education in the traditional primary Schools. A sum of Rs. 5 lakhs was sanctioned for thEI purpose.
Sums of Rs. 5,000 each were srmctioned for the purchase of black boards and library books for the Senior Basic Schools. Rs. 6,000 were given for the purchase of library books to 6 Basic training Schools,

72
Ptmjab
' A scheme for providing one week orientation training in Basic education to 120 A.D.I.'s and 1,200 teachers was implemented. Under the Community Development programme of orient11tion in Block areas, a three-day seminar was organised at Nilokheri for the heads of Junior Basic Training Institutes. Subseque:ntly, a. one-month training course was conducted in which 64 Headmasters and 71 teachers took part. Three Divisional and 17 District seminars were also organised for teachers of training institutions. One thousand and six hundred primary schools were given a grant of Rs. 100 each for introducing essential features of Basic education. An extension service department was attached to the Government Basic Training School, Jagraon, for arranging inservice training to teachers of primary schools in the area ..
Rajasthan
The programme of orientation of Primary Schools towards the Basic pattern was implemented. Ten middle S:)hools were converted into Senior ]3asic Schools during the year;
Uttar Pradesh
All Primary Schools in the State were said to be Basic oriented. During the year, a record number of 6,470 Junior Basic Schools were opened. The scales of pay of Junior Basic School teachers were revised.
West Bengal
Under the scheme of improvement and extension of Basic education in classes I--VIII, Hi units of complete Basic Schools were set up during 1961-62. Besides, 64 t•nits of Basic Schools with classes VI to VIII only were also established. The State Government provided Rs. 31· 81lakhs for the purpose.
To increase facilities for teacher training in Basic education, 60 seats were added to training Colleges bringing the total intake capacity to 4,900. Besides, orientation training programme was continued and upto the end of the year under review, 33,506 teachers had undergone training under this programme. Thirty Bhutanese teachers were also given a condensed training of two months in Basic education.
The scale of pay of Basic trained teachers were revised as under:-
Category of teachers
Head Teacher
Asstt. Teacher
Existing scale
Rs. 55-4/2- 75-- 5/2- 95 plus a special pay of Rs. 15 per month and D.A. at the rate of25% of pay
Rs. 55-4/2-75-5/2-90 and D.A. at the rate of 25%of pay
Revised scale
Rs. 80--2-100-3-130 --4-150 plus a spec;al
-pay ofRs.15 per month
Rs. 80-2-100-3-130 -4-150

73
Andaman & Nicobar Islands
17 Junior Basic and 5 Senior Basic Schools were established. Additional staff and equipment were provided to the Basic Teacht>r Training Schools.
Dadra & Nagar Haveli
Necessary equipment was provided for introducing_ carpent~y and tai!oring (for girls) in the Primary School at Silvassa and agrwulture m the pr1mary school at·Naroli.
Delhi
Introduction of crafts, gradual conversion of primary Schools to the Basic type and reorientation of primary teachers' training institutes were some of the highlights ofthe Basic education programme in the Territory.
Himachal Pradesh
A Board of Basic Education was constituted to serve as an advi~ory body for the developing of Basic education in the Territory.
One more Basic Training School was opened at Bilaspur. Besides, the intake capauity of the Basic Training College, Solan, was raised from 60 to 100.
L. M. & A. Islands
The programme of organising reorientation training camps was continued and 18 teachers attended a camp conducted at Karasathy island in January 1962, under this programme. Coir-spinning continued as Basic craft in all Schools.
Manipur
The programmes of orientation of elementary Schools towards the Basic pattern was carried out extensively.
One B.~ic Training College and two practising Junior Ba..~ic Schools were started. 4. M.E. Schools with lower classes situated in the remote areas were converted into Junior Basic SchooL~.
N.E.F.A.
Thirteen lower Primary Schools wt>re started as Junior Basic Schools and 11 Non-Basic lower primary Sehools were converted to the Basic type.
Pondicherry
Under the scht>me of Orientation of Schools towards the Basic pattern, 246 teachers of primary schools were given short-time training in Basic educa-tion. Equipment worth Rs. 100 per School was also supplied to 1125 Primary Schools under the same programme,

Trlpura
Forty scho:>ls were converted into the basic type. Craft teaching was introducedin··a number of Primary schools. Primary school teachers were given a short-time training course of one month's duration in basic education. Primary schools were directed to spend 75% of their contingencies on craft work.
Main Statistics
Schools
The number of basic schools increased from 80,249 to 89,498 or by il·5 per cent during the year as against 6 · 5 per cent in 1960-61. These schools were distributed as : junior basic 73,982, senior basic 15,485 and post-basio 31. The distribution of these schools according to managements is given in table XXXII. More than three-fourths of the junior basic schools were managed by local bodies while Government and private bodies managed these schools almost in equal proportions (10·6 per cent and 9·4 per cent respectively). About three-fourths (72·4 per cent) of the senior basic schools were managed by local bodies and the remaining were shared by Government and private bodies in.the ratio of 1 : 2. In the management of post basic schools also, private bodies predominated with 80·6 per cent share followed by government 19·4 per cent.
Table XXXIT-Number of Basic Schools by Management
Junior Baaic Schools Senior Basic Schools Post-Basic Schools Management
Number Peroen- Number Peroen- Number Peroen-tage tage tage
1 2 3 4 5 6 7
Government • 7,842 10·6 1,515 9·8 6 19·4 Local Bodies .. 59,159 80·0 11,216 72·4 .... Private Bodies 6,981 9·4 2,754 17·8 25 80·6
Total 73,982 100·0 15,485 100·0 31 100·0
The Statewise details of the basic schools separately for junior basic, senior basic and post basio schools during the year 1960-61 and 1961-62 are given in table XXXIII. Basic schools were in existence in all the States and Union Territories except Jammu & Kashmir and Naga.land. The. bigh~.t increase in the number of basic schools was reported by Uttar Pradesh (6,586), followed by Punjab (672), Maharashtra (542) and Madras (383) Among the Union Territories, the increase ranged from 17 in A. & N.·Island to 232 in Tripura,

75
The junior basic schools increased in all the States and Union Territorii's except in Orissa where the number remained unchanged and in Madhya Pradesh and Rajasthan where their decrease was on account of the junior basic schools having been upgraded to middle schools.
The number of ~enior basic Schools remained the same in Kerala, Orissa, L.M. & A. Islands and Pondicherry. In the rest of the States and Union Territories, wherever these existed, their number increased except in Himachal Pradesh where one senior basic school was raised to higher Eecondary school during the year under report. The highest and lowest increase were reported by Uttar Pradesh (236) and Andhra Pradesh and Punjab (1 each) respectively among the States and by Dadra and Nagar Haveli (27) and Delhi (10) respectively among the Union Territories. Post basic schools were reported for by the States of Andhra Pradesh, Bihar, Kerala, Madras, Orissa and Punjab and their number remained unchanged in all these States.
Pupils
The total number of pupils in junior basic, senior basic and post basic schools increased from 97,25,772 to 1,12,37,674 or by 15·8 per cent as against 8·00 per cent in the previous year. The enrolment in junior basic schools, alone increased from 65,01,134 to 76,43,412 or by 17 · 8 per cent while that in senior basic schools increased from 32,20,298 to 35,89,550 or by 11·1 per cent. The enrolment in post basic schools increased from 4,320 to 4,712 or by 8·3 percent.
The State wise distribution of enrolment in Lasic schools during 1960-61 and 1962-62 is given in table XXXII. The enrolment increased in all the States and Union Territories except in Kerala, Madhya Pradesh, Rajasthan and L.M. and A. Islands. While the decrease in L.M. & A. Islands was insignificant, that in Madhya Pradesh was due to decrease in the number of institutions. The greatest rise was reported by Uttar Pradesh (8,15,996) and next to come were Gujarat (1,38,649) Punjab (1,23,092), Madras (1,15,568) and Maharashtra ( 1,12,362) the least being in Orissa (65).
Taking different types of schools separately, it is observed tb,at in junior basic schools, the enrolment increased in all the States and Union Territories except in Kerala, Madhya Pradesh and Rajasthan. The decrease in Madhya Pradesh and Rajasthan being due to the decrease in the number of institutions. The eiu:olment in ~enior basic &chools increased in all the States and Union Territories except in Himachal Pradesh where the decrease was due to the decrease in the number of institutions and in Orissa L.M. & A. Islands and Pondichnrry where the decrease was insignificant. The post hasic r-chools in all t.hf! States, whewwr these existed, reported an incrc.<l.SC in enrolment.

"16
Table X XXIII Number of
Junior Basic Schools Senior Basic Schools .--
For Boys For Girls For Boys For Girls ~ ,-------"----,
State/Te:ritor.)' 1960- 1961- 1960- 1961- 1960- 1961- 1960- 1961-61 62 61 62 61 62 61 62
1 2 3 4 5 6 7 8 9
.Andhra Pradesh 2,526 2,688 6 4 336 336 2 3
Assam 2,4il 2,529 80 89 199 201 20 20
Bihar 2,487 2,509 333 372 787 814 9 9
Gujarat 1,638 1,628 86 81 2,850 3,061 331 344
Jammu & Kashmir
Kerala 428 431 2 2 83 83
Madhya P ro.desh 2,735 2,336 2 14 325 336 4
Madras 3,322 3,437 682 950
Mahe.ra.shtra 1,483 1,803 30 27 2,617 2,833 113 122
Mysore 2,023 2,0!4 45 51 950 1,079 109 110
Orissa 359 359 25 25
Punjab 5dl 1,088 187 331 49 49 23 24
Rajasthan 1,939 1,903 102 80 46 48 9 9
Uttar Pradesh 35,156 40,095 4,927 6,338 3,674 3,855 661 716
West Bengal 1,458 1,557 32 39 204 227 35 43
A & N leland 23 40
Do.dra & Nagar Haveli 14 27
Delhi 180 189 68 67 M 56 24 82
Himachal Pradesh 799 1,028 . 7 7 7 6 .. L.M. & A. Islands
1 1
:Manipur 149 221 12 19
Nagaland
N.E.F.A. 83 106
Pondicheuy 6 6
Tripara 234 450 42 58 1 1
INDIA 60,030 66,461 5,919 7,521 12,932 14,046 1,337 1,439

77
Basic Schools by States
Post Basic Schools ,---
For Boys For Girls Total Increase ( +) or
Decrease(-) ,--'-----, ,---..J-----., ~~------. State; Territory
1960· 1961- 1960- 1961- 1960-61 1961-62 1961-1962 61 62 61 62
10 ll 12 13 14 15 16
2 2 2,872 3,033 +161 Andhra Pradesh
2,740 2,839 +99 Assam
15 15 1 3,632 3,720 +88 Bihar
4,905 5,ll4 +209 Gujarat
Jammu & Kashmir
3 3 516 519 +3 Kerala
3,062 2,690 -372 Madhya Pradesh
3 3 1 4,008 4,391 +383 Madras
4,243 4,785 +542 Maharashtra
3,127 3,284 +157 Mysore
2 2 386 386 Orissa
II 2 2 2 824 1,496 +672 Punjab
2,096 2,040 -56 Rajasthan
44,418 51,004 +6,586 Uttar Pradesh
1,729 1,868 +139 West Bengal
23 40 +17 A. & N. Islands
41 +41 Dadra & Nagar Haveli
326 344 +IS Delhi
813 1,041 +228 Himachal Pradesh
1 1 L.M. & A. Islands
161 240 +79 Manipur
Nagaland
83 106 +23 N.E.F.A.
7 7 Pondicherry
277 509 +232 Tripura
27 27 4 4 80,249 8'1,498 +9,249 INDIA

78
Table XXXIV--'-Number of Pupils
In Junior Basic Schools
StatejTerritory Boye Girls
1960-61 1961-62 1960-61 1961-62
1 2 3 4 15
Andhra Pradesh 1,83,320 2,09,213 1,07,873 1,32,541
Assam 1,38,713 1,46,535 84,264 91,025
Bihar 1,54,981 1,75,599 46,737 48,266
Gujarat 92,402 1,08,931 44,814 54,946
Jammu & Kashmir
Kerala . 53,807 51,438 43,969 42,675
Madhya Pradesh 1,81,770 1,59,805 29,673 28,094
Madras 2,66,718 2,91,314 1,68,963 1,94,783
Maharashtra 1,14,672 1,37,181 45,877 55,216
Mysore 1,41,S39 1,63,213 66,401 82,038
Oriss& 21,191 21,417 8,814 8,641
Punjab 47,978 1,20,019 23,073 68,692
Rajasthan 1,65,329 1,59,797 32,834 32,330
Uttar Pradesh 31,70,868 36,77,299 7,87,960 10,46,120
West Bengal 1,04,60-l 1,18,772 54,329 62,218
A. & N. lalands 1,322 1,578 978 1,143
Dadra & Nagar Haveli 459 119
Delhi 21,870 25,609 8,679 10,214
Himachal Pradesh 28,845 36,137 5,646 6,677
L.M. & A. Islands
M&nipur. 8,690 14,154 4,291 7,166
Naga.!a.nd
N.E.F.A. 2,900 3,242 250 382
Pondicherry 335 480 87 187
Tripara • 21,111 30,094 12,357 17,M3
INDIA. 49,23,265 56,52,2n6 15,77,869 19,91,ll6

79
in Basic Schools
In Senior Basic Schools
Boys Girls State)Territory
1960-61 1961-62 1960-61 1961-62
6 7 8 9
62,382 62,006 20,558 24,116 Andhra Prade~~h
24,226 24,831 14,437 15,053 Assam
1,30,780 1,37,378 23,354 24,305 Bihar •
5,38,36.5 6,04,601 2,66,949 3,12,701 Gujarat
Jammu & Kashmir
20,420 20,627 14,911 15,188 Kerala
65,941 66,911 7,023 8,429 l\Ie.dhya Pradesh
1,41,463 1,79,811 94,252 1,21,029 Madras
6,25,924 6,77,837 2,47,133 2,75,734 Maharashtro.
2,00,157 2,16,004 84,655 94,835 Mysore
4,345 4,329 1,232 1,239 Orissa
14,920 18,018 5,057 7,149 Punjab
8,654 10,158 3,858 4,204 Rajasthan
4,46,139 4,90,980 1,03,688 1,10,252 Uttar Pradesh
15,254 17,532 5,330 6,987 West Bengal
A. & N. Islands
2,478 647 Dadra & Nagar Haveli
a,464 15,812 6,459 9,044 Delhi
1,252 1,079 285 269 Himachal Pradesh
2Q6 262 16 9 L.M. & A. Islands
Manipur
Nagaland
N.E.F.A.
120 114 Pondicherry 4,206 5,322 1,793 2,270 Tripura
23,19,308 25,56,090 9,00,990 10,33,460 L>iDIA
~I/B( F>DioCducation

so
Table XXXIV-Number of Pupils
In Post Basic --.A.---
Sta.teJTerritory Boys Girls
1960- 1961- 1960- 1961-61 62 61 62
10 . 11 12 13
Andhra Pradesh 107 142 21 19
.ABII&IIl
Bihar • 2,342 ~.417 216 146
Guje.ra.t
Jammu & Ka.shmlr .. Kera.la. 156 174 57 82
Madhya. Pradesh
Ma.dra.s ~
125 136 110 126
Ma.he.ra.shtra.
Mysore
Orissa. 98 119 1 1
Punjab 271 356 837 994
Ra.ja.stha.n
Utte.r Pradesh
West Benga.l
A. & N. Is!a.nds
Dadra. & Nager Haveli
Delhi
Hima.obal Pradesh
L.M. & A. Islands
Manipur.
Naga.la.nd
N.E.P'.A ..
Pondiobeny
Tripura. •
' JlrDIA 8,099 3,344 1,241 1,868

bl
in Basic Schools-concld.
Schools ------------. Total Increase ( +) or Btaw/Territory
Deoreaae (-) 1960· 1961-6:1
61
u 16 18
3,74,261 4.,28,037 +53,776 Andhra Pradesh
2,61,64.0 2,77,«4. +16,81» All8&IIl
3,68,4.09 3,88,111 +29,702 Bih~
9,4.2,630 10,81,179 +1,38,64.9 Gujarat
Jammu & Kashmir
1,33,320 1,80,184. --3,136 Kera1a
2,84.,4.07 2,63,239 -21,16@ Madhya PradeBh
6,71,631 7,87,199 +1,15,568 Madras
10,33,606 11,4.11,968 +1,12,362 Maha.raBhna
4.,93,052 5,56,090 +63,038 Mysore
35,681 35,74.6 +66 Orissa
92,136 2,15,228 +1,23,092 Punjab
2,10,676 2,06,489 --4,186 Rajasthan
t5,08,655 113,24,651 +8,15,996 Uttar Pradesh
1,79,517 2,05,509 +25,992 Weai Bengal
2,300 %,721 +4.21 A. & N. Isla.nda
3,703 +3,703 Dadra & Nagar ll&veli
61,472 80,679 +9,207 Delhi
86,028 4.4,162 +8,134. HimBOhal Pradesh
312 271 --41 L.M. & A. Islanda
12,981 21,330 +8,349 ManiplU'
Nagaland
3,1110 3,624. +4.74. N.E.E'.A.
~42 781 +239 Pondioherry
39,467 66,329 +15,862 Tripura.
97,25,772 1,12,37,674 +15,11,902 1m> a
!ti/B(. )64Mof :ducat_ion-. (a)

82
Table XXXV-Number of Teachers
In Junior Busic Sdwols In RPnior Basic S('hf!o1f' State I r- .A.------., r-----.A.--------,
Territory llfen Women ~Ien 'Vomen r----"---.r----"---.r----"---,.-----J'---,
Train- Un-Tra- '!rain- Un-Tra. 'Irain- L'ntra- Train- Un-Tra-e<l ine<l ed incd ed ined erl inetl
--- ·---------·-----~· -- ----------2 3 4 5 6 7 8 9
Andlu·o Pra(lt•Flh 1),987 966 1,·180 38 1,78!! 729 309 52
As'"'m 3,.!.55 1.479 709• 556 724 596 127 1-M-
Bihar ~.0-~2 1,073 129 93 4,676 50fi 253 24
Gujarat· 1,927 1,736 760 601 10,636 7,084 4,100 9,482
Jammu & Ka•hmir ·
Kern Ia 1,623 120 973 96 697 101 471 OS
Madhya Prnd•·•h 4,308 1,883 153 68 1,803 1,023 57 ll
MadrM 8,560 333 4,947 75 5,359 281 4,002 75
:IIaharaah\ra 2,769 1,768 39.) 264 16,252 3.819 3,2~3 1,233
J\ty~oro 3,801 2,291 6!i8 270 6,250 1,003 1,091 453
Orie'3a 902 13 5 208 ll 5
PWljnb 2,622 . 219 1,159 72 475 39 207 10
Haja>lban 3,943 1,663 246 295 462 99 124 2!1
Uttar Pra<lct-h 71,353 26,797 0,563 . 7,!l90 IG,205 4,091 3,1;i9 1,2411
West llengal 4,341 1,132 M4 244 450 529 ll7 1311
A- & N. Islands 68 17 22 8
Dadra & Nagar Ha.-eli 16 2 3 56 4 :!0
Delhi 866 284 646 338
Himn<·bal Prarlesb 1,203 iil2 157 07 53 10 4 2
J,, llf. & A, I•lands 7 3
1\lanipur 210 668 9 23
Nagaland
X.Rl".A. 122 so 12 3
Poudielwn·y 12 2 4 2
Tripum ~94 758 115 317 243 168 49 64
]:-JDJA . 1.22,49H 4a,528 19,330 1l,Oi3 66,942 20,149 17,ti60 7,05,

83
in Basic Schools
In Po:-~t Uat-:ir S<'hools In All Srhools ,...---~---·---"'- ------., ,.-------·~- -----~
)fr-n \Vom(>n Train- Un- Total State/Territory ,------"'----.,,---...A---~ rd Truinf:>rl
Train- Cn- Train- rn-<·tl Trained ed Trained
------------Ill II 12 13 J.t IS HI
ft 0 2 !),573 1,791 I 1,364 Andhra Prndr~h
.';,015 2.775 7,7ll0 ARsam
M 92 3 9,136 1,790 10,926 Bihar
17,423 12,903 3f\,326 Gnjarat
Jammu & Kashmir
II II 3 2 3,7i8 426 4,204 Kerala
6,321 2,!l!l7 9,30!! l\Iadhya PradrRh
17 6 6 3 22,890 773 23,063 Madras
22,659 7,084 29,743 )fahara•htra
11,800 4,1117 15,817 :\lysore
5 8 1,125 34 1,);39 Orisf'a
14 9 25 3 4,502 352 4,854 Punjab
4,775 2,077 0,852 Rajasthan
97.280 411,118 1,37,398 l;ttar Pradesh
5,462 2.(13;) 7,4!)7 \Y ••t Bengal
811 25 105 A, & N, Islands
7 94 101 Dadra & ~agar Haveli
2,134 2,134 D"lhi
1,417 581 1.998 Himarhal Pradesb
7 3 10 L,:\f, & A. !•lands
219 6(11 9111 ~1anipur
!1/agnlnnd
13-l sa 217 N.E.F.A.
16 4 20 Pondichcrry
SOl 1,3117 2.1118 'L'ri}•tu-a
-------- ---------------~~ J:lll 3ti II :!,:!li.!):i4 81.930 3.08,504 h~OJA

84
Table XXXV-Number of Teachera iJl Basio Sohools-contd.
Percentage of Trained Toacher-Pnpil Ratio State/ Teachers to Total number
Territory of Teachers
In In In In In ......
In In In Junior Senior Post All Junior Senior Post All Basic Basic Basic Schools Basic Basic Basic Scilools Schools Schools Schools Schools Schools Schools
1 i7 18 19 20 21 22 23 24
Andhra Pradesh 88·1 72·9 57·1 84·2 40 30 11 38
Assam 67·2 53·5 64·4 38 25 36
Bihar 78·2 90·3 27·5 83•6 42 30 20 3!1
Gujarat 53·5 58·2 57·5 83 36 36
JaDlmu & Kashmir .
Ker .. la 92·3 85·4 56·0 90·6 3& 26 31
Madhya Pradesh 69·6 64·3 67·9 29 26 28
Madras 97·1 96·3 71·0 96·7 35 31 8 33
Mabarashtra 60·0 79·4 76·2 37 39 38
Mysore 63·5 83·4 74·6 35 35 3!1
OrisAA 98·6 94·7 38·5 97·1 33 25 II 31
Punjab 92·11 93·3 76·5 97·7 46 34 26 44
Rajasthan 68·1 83·1 69•7 31 20 30
Uttar Pradesh 69·1 78·4 70·8 42 24 39
West Bengal 78·1 46·2 72·9 29 20 27
.A, & N. Islands 76·2 76·2 26 26
Dad~a & Ngr. Haveli 0·0 8·4 6·9 82 38 37
Delhi 100·0 100·0 100·0 31 25 29
mmachal Pradesh 70•5 R2·6 70·9 22 20 23
L. M. & A. Isiands 70•0 70·0 27 27
Manipur 24•1 24·1 23 23
Nagala.nd
N.E.F.A .• 61·8 61·8 17 17
Pondicherry 85·7 66·7 80·0 48 33
Tripura 32·1 55·7 38·0 30 14 26
INDIA 72·2 75·7 46·8 73·4 89 32 20 36

85
feachers
The total number of teachers in basic schools increased from 2, 77,938 (2,08,661 men and 69,277 women) to 3,08,504 (2,53,335 men and 55,169 women) or by ll·O per cent. Of the totall,96,429 teachers were working in junior basic schools, 1,11,810 in senior basic schools and the rest of 265 in post basic schools. The corresponding figures for the previous year were 1,75,606; 1,02,083 and 249 respectively. The percentage increase in junior basic school was 11·8, in senior basic schools 4·5 and the post basic schools 6 · 4.
The distribution of basic schools te>\chers in the various States is given in table XXXV. The number of teachers increased in all the States and Union Territories except in Kerala, Madhya Pradesh and Rajasthan. The decrease in Kerala and L.l\L & A. Islands was slight while that in Madhya Pradesh and Rajasthan was due to the decrease in the number of institutions.
Tho proportion of trained teachers in basic schools in the country received a slight set-back as it decreased from 75 ·1 per cent of the total number of teachersto 73·4 pmcent. The percentage WBS 72·2 in junior basic schools, 75·7 in seniorbasicschoolsand46·8 in post basic schools as compared to 75·0, 75·3 and 53· 4 respectively in the previous year. The Union Administration of Delhi had their entire staff trained and in Madras, Orissa and Punjab it was nearly so. Out of every ten teachers in basic schools in And.hra Pradesh, Bihar and Kerala, more than eight teachers were trained. In Maharashtra, Mysore, Uttar Pradesh, West Bengal, A. & N. Islands, Himachal Pradesh, L.l\I. & A. Islands and Pondicherry trained teachers were between 70 and 80 per cent. l\Ianipur had the lowest proportion of trained teachers-about one-fourth of the previous year. In the rest of the States, the percentage of trained teachers was between 38 and 70. The teacher-pupil ratio in basic schools was 1 : 36. It was 1 : 39 in junior basic schools, 1 : 32 in senior basic schools and 1 : 20 in post basic .schools.
Expenditure
The total direct expenditure on all types of basic schools recorded an increase of Rs. 4,06,40,145 (14·3 per cent) that is, from Rs. 28,38,85,201 to Rs. 32,45,25,346 during the year. The total direct expenditure on junior ba8ic schools amounted Rs. 18,86,85,240, on senior basic schools to Rs. 13,53,27,760 and that on post basic schools toRs. 5,12,346. The corresponding figures for the previous year were Rs. 15,98,67,971, Rs. 12,35,86,125 and Rs. 4,31,105 respectively. On percentage basis, the increase in expenditure on these scltools works out to be: j1mior basic schools 18· 8 per cent, senior basic schools 9 · 0 per cent and post basic schools 18 · 8 per cent.
The distribution of total direct expenditure on basic schools according to various sources of income is given in table XXXVI below 1

Table XXXVI-Direct E%IIenditure on Basic Schools by Sources
Junior Basic Schools Senior Basic Schools Post Basic Schools All School•
Source "- ...., r-------A-.-....... r---·--..A-------.
Amount Percentage Amount Percentage Amount Percentage Amount Percent a~e
2 3 5 6 7 8 9
Government Funds 14,91,58,875 79·1 10,49,03,868 77·5 3,25,621 63·6 25,43,88,364 71!·4
00 Local Board Fundo 3,55,47,287 18·8 I ,52,39,033 11·3 5,o7 ,86,320 15·6 ~
Fl't'• 15,69,365 0·8 98,88,468 7·3 85,2611 16·6 1,15,43,102 3·6
Jt~ndownwnta 5,93,343 0·3 11,89,351 0·9 36,843 7·0 18,18,537 0·6
Othrr Rources 18,16,370 1·0 41,07,040 3·0 65,613 12· 8 59,89,023 I·S
----
To1'AL 18,86,85,240 100·0 13,53,27,760 100·0 5.12,346 100·0 32,45,25,346 100·0

87
Government met. more than three fourth of the expenditure and its share in creased only slightly from 78 · 1 per cent to 78 · 4 per c~nt. The proportion of the expendihtrP. met from local board funds and fees mcreo.sed from 15·5 per.cent and 3·5 per cent respectively to 15·6 per cent and 3·6 per cent respectively whereas those of endowments and other sources decreased from 2·9 per cent to 2 • 4 per rent.
The average annual cost per pupil in three type of basic schools separately worked out as under :-
J wuor Basic Schools Senior Basic Schools Post Basic Schools
Rs. 24·6 Rs. 37·8 Rs. 108·7
The Statewise details of direct expenditure on basic schools are given in table XXXVII. The expenditure increased in all the States and Union Territories significantly, the expenditure in basic schools in the States of Madhya Pradesh, Rajasthan and Himachal Pradesh increased in spite of the decrease in tho number of institutions.
The total direct expenditure on basic schools formed 11· I per cent of the total direct expenditure on education. Its statewise details are given in col. (11) of Table XXXVII. The figures show wide variations due to variation in tho number of classes in these schools.
The sourcewise distribution of direct expenditure on basic schools in various states are given in cols. (12) to (16). Government met cent per cent expenditure in A. & N. Islands, L.M. & A. Islands and N.E.F.A., between 75 per cent and 100 per cent in all other States and Union Territories except Manipur and Delhi where in the major portion of expenditure to the extent of 97 · 9 per cent was met by local boards. Local boards met entire expenditure in Himachal Pradesh while in the rest of the States and Union Territories its share ranged from 0 · 4 per cent in Orissa to 23 • 8 per cent in Andhra Pradesh. The share of feos, endowments and other sources in all the State.~ and U1uon Territories was insignificant.
Teachers' Training Schools
The number of basic training schools increased during the year by 5 to 84 7. These number of pupil teachers enrolled in these schools as well as attached classes also rose by 15,218 to 1,20,476 (89,4.12 men and 31,064 women) out of which 49,576 men a.nd 16,344 women qualified themselves for the a. ward of diploma/certificate in basic teachers training. The total direct expenditure incurred on these basic training schools increased from Rs. 3,11,91,727 to Rs. 3,52156,587. The average annual cost of training a. pupil teacher ca.me to Rs. 301· 5 as compared toRs. 329·1 in the previous year. The statewise details of basic training schools are given in table XXXVIII. The number of such schools among the States was highest in Uttar Pradesh (167) followed by Maha.rashtra. (132), Bihar (101),. Andhra ~ra.~esh (~8), Kerala. {80), the least being in Mysore (6). Among Uruon Temtones, Himachal Pradesh and Marupur reported the highest number of basic training Schools (4 ea.ch) while the Union
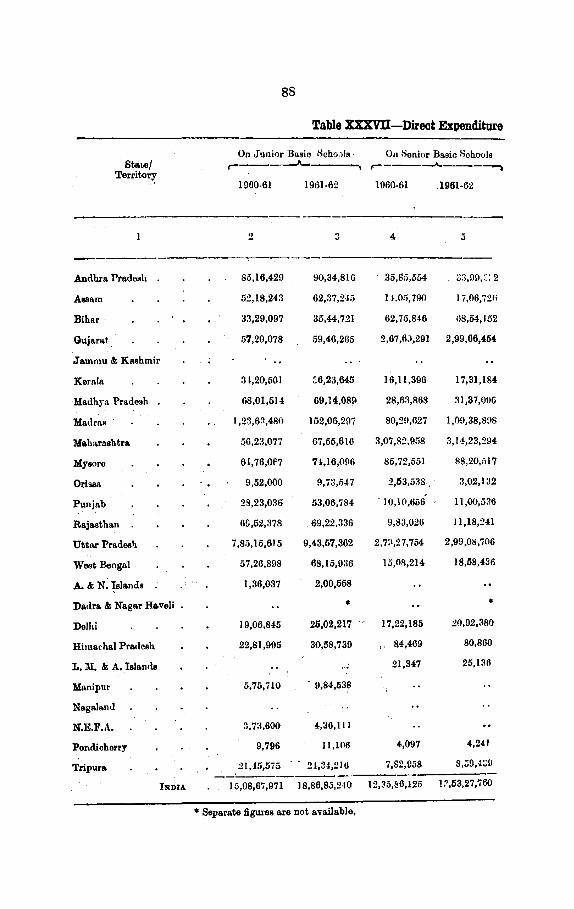
Sta-.e/ Territory
88
Table XXXV:U-Direct Expenditure
On Junior Basic Hcho.Jis · On l:lenior Basic Hchouls r----~----. r-------'----~
1960-61 1961-62 1060-61 .1961-62
2 3 4 5
-------------------· .Andbra Pradesh 85,16,~29 90,3~,816 35,S;i,554 :J3,9f!,::: 2
Assam 52,18,2~3 62,37,24;) H,O;i,790 l7,06,72fi
Bihar· 33,29,097 35,«,721 62,75,846 li8,54,152
Gujarat. 57,20,078 59,~6.265 2,67,6;1,291 2,99,66,454
Jammu & Kashmir
Kerala 3!,20,501 ::6,23,645 16,11,396 17,31,184
Madhya. Pradesh 68,01,514 69,14,089 28,63,868 31,37,0\.16
Matlrn• I ,23,6~,480 152,06,207 80,2!1,627 I ,O!l,38,8!18
MahiU'ashtra 56,23,077 67,55,6!0 3,07,82,958 3,14,23,294
My sore 6!,76,0f7 7!,16,096 85,72,551 88,20,517
Orissa 9,52,000 9,73,5-.17 2,113,538,. 3,02,132
Punjab 29,23,036 53,06,'784 'IO,H•,6oS II ,00,536
Rajasthan 6~,52,378 69,22,336 9,83,026 ll,l8,2·U
Uttll.l'PradMh 7,85,15,615 9,43,57,362 2,7:1,27,754 2,99,0o,706
West Bengal · 57,26,898 68,15,036 15,01!,214 18,58,436
A. & N. ~slands 1,36,037 2,00,558
Dadra. & Na.gar Ha.veli • • Delhi 19,06,845 25,02,217 17,22,185 20,92,380
Hima<•hal Pradesh 22,81,905 30,58,739 ,. 84,469 80,860
L. M. & A. Islands 21,347 25,138
Manipur 5,75,710 . 9,84,638
Nagalancl
N.E.F.A. :l,7:l,600 4,36,111
Pondicharry 9,796 11,106 4,097 4,241
Tripura 21,45,575 21-,2!,216 7,82,958 s,:;o,.;.:;o
INDIA I 5,08,67,971 18,86,8:;,2~0 12,35,86,125 1?,153,27,760
• Separate figures are not available,

89
on Basic SchoolB by States
On ost Ba.io Schools Total ~---. r-------Jo------.
1960-61 1961·62 1960-61 1\!61-62
------0 ., 8 9
31,982 34,393 1,21,33,965 I ,24,68,541 Andhra Pr•deob
66.24,033 79,43,971 AMom
1,57,423 I ,60,431 97,62,366 1 ,05,59.?04 Bihar
3,24.80,369 3,59,12,719 Gujarat
Jammu & Kashmir
31,460 M,llfi 60.6~,367 54,11,944 Kemla
96,65,282 1,00,51,185 1\ladhya Proc!l'l!h
~8,991> 93,893 2,04,62,102 2,62,29,088 Madra a
3,64,06,035 3,81,78,910 M nha.rash t rP.
1,50,48,618 I ,62,36.613 MyflllJ'e
16,662 24,390 12.22,200 13,00,069 Oris•&
1,24,583 1,45,124 39,(;8,275 65,52,444 rtmjsb
79,35,404 80,40.577 RajnstbRn
10,58,43,369 12,42,66,068 Uttar rracleoh
72,35,ll2 86,74,372 West Bt>n~RI
1,36,037 2,00,568 A. & ~.Islands
Dadra & Ngr. Ha'l'eli
36,29,030 45,1)4,697 Delhi
23,6fl,464 31,39,599 Himaohol Pr•d..,h
21,347 25,131! L.H. t: A. ls1R~.d.
11,75,710 9,84,68R :Manipur
Nagalanc!
3,7~,600 4,36,111 N.E.F.A.
13,893 15,347 Pondicht-rry
29.28,533 32,93,655 Tripura
4,31,105 ~.12,:>-HI 28,38,85,201 32,45,25,346 I!WU

t!O
Table XXXVll-Direct Expenditure on Basic Schools by States-contd.
Percen- Percentage of E.x.pew.liture met frtJm State/ Inerease( +) tage of r-
Territory or 8xptln- Govt. l.o<>cal Fees Em\. w- Other Decrease(-) diture Funds Board Jllf:llt S •urc·es
on Basic Funds kchonls to Direct Exp,ndi-ture on. E<lu- ., cation
10 II 12 13 14 lij 16
An<lhrn Prn•lesh . +3.:14,;)76 5·8 75·3 23·S 0·6 n·a 0·0
.As~nm + 1 ~.1!1,!138 . 10·1 H9·3 0·1 0·6 0·0
Bihar +7.!Hl,U38 6·4 !15·4 o·u 2·1 0·1 I ·5
Gujarat +34,32,350 !!1 ·1 88·4 10·3 0·1 0·1 I ·I
Januuu & Kashmir
1\eralu +3,48,587 :l·l 78·9 0·1 0·1 n-9
~In<U1ya Prndc•h +3,85,803 5·0 87·7 10·0 I ·I n-o 1·2
::lladras +;>7 ,7n,nR6 10·2 78·7 Hl·7 0·2 4·1 0·3
"\!aharashtra +17,72,875 9·7 88·5 8·7 0·3 0·0 2·5
::IIysore +11,87,9()5 10•5 89·1 6·7 0·1 0·0 4·1
Orissa +77,86!1 2·3 96·0 0·4 1•4 0·9 1•3
l'unjah +25,!14,16!1 4·3 99·2 0·3 0·3 0·2
H.ajusthnn +1,05,173 C·6 99·2 0·7 0·0 0·1
Uttar Prnde•h +I,N,22,699 35·2 68·9 20·0 8·0 0·4 2·7
'Yost Bengal +14,39,260 3·1 80·8 8·0 8·9 0·5 1-g
A. & N. hlancls +6!,521 25·8 100·11
Tiadra & 1\gr, Hu,·e!i
Delhi +9,65,567 4·8 97·9 2·0 0·1
HimMhal Pradesh +7,73,135 ~7·7 100·0
J,, ::11. & A. Islands +3,7811 8·4 100·0
:lfanipnr +4.08,828 10·8 I ·8 !17·9 0•1 0 3
~agalnnd
X.E.F.A. +62,511 32·5 100·0
Pondiobcrry +1,45! 0·3 78 !) 21·1
Tripura +3,o5,122 33·2 !lU·6 O·:l 11·0 11·1
INDIA +4,06,40,145 11·1 78·4 15·6 3·6 0·6 I·S


92
Table x x xI x-Statistics of Basic Number of Enrolment• Expenditure
StatetTerritory Basic Training Colleges
,----'\-----, Post- Under- Men 'Vomen Total Poet• Under-
Gradu- gradu- gradunte graduate ate ate
2 3 4 6 6 7 8
Rs. Rs.
Andhra Pradesb. 32 13 4il 26,388 .. A681lm 29 2!1 98,351
Bihar 3 430 48 47ft 2.3:1,704
Gnjarat 2 65 11 66 90,678
Jammu & Kashmir
Koral a .. lbdb.y& Pradesh 10 58 5,867 I,:JJ2 7,179 20,99,028 37,39,026
:Madras 107 6,097 3,365 9,462 63,6!2 30,97,656
:Maharaahtra . 3 98 8 106 I,16,367
llyaore 40 2,I54 516 2,670 1,06,619 17,14,627
OriBBa 6 400 400 OG,667 1,07,267
Punjab IO 766 926 I,690 8,66,272
Rajasthan 5 113I 95 626 6,119,488
Uttar Pradl'tlh 4 553 3I 584 I,27,258 2,96,408
West Bengal . 2 5 337 I29 466 2,I6,066 I ,I0,623
A. & N. blands
Dadra &.Ngr. Haveli
Delhi 27 I5 42
Himaoha1 Pradesh . 50 29 79 I ,32,I93
L.M.&A. Isla'lds
Manipur 30 5 35 11,074
Nags1and
N.E.F.A.
Pondicherry 33 I3 46 I5,365
Tripura 2 I86 25 2IO 69,2~4 94,99I
l!IDU. 43 224 I7,673 6,640 24,2I<; 49,61,865 9I,SI,036

93
Teachers' Training Colleges Averalle Annua.l Output Cost Per Pupil r-
Graduate Post Graduate State/ ,---.A.------- r-----J.------. ,---~-----. Territory
Post Under )1en \\'oman All Men Women All gra<luate grad•lste persona persons
9 10 11 12 13 14 15 16 I
Ro. Ro.
586·4 :J4 14 43 Andhra Pradesh
:J,:I91 ·4 .A.&l&!U
48U·IJ 994 51 1,045 24 4- 28 Bihar
I ,3TJ·9 4<1 11 ;'il Gujarat
Jammu & Kas'.t:nir
Kerala
1.~2~J .;j 67fl·5 871 2H 1,102 7:l 13 86 )fahdya Pradesh
1,815·5 179·4 32 32 )fadras
1,097·~ 575 370 915 Maharashtra
:l,041l·3 4\17·7 )fyoorc
61•5·8 :1:!5·2 Orissa
:Jon 4 ;51 875 1,6~6 Punjab
Sj;; 5 4!13 H:! ;jt{.j 20 20 Raja.than
I ,871 ·4 574·~ 1,115 :JO!l l,U5 7S 33 Ill Uttar Pradesh
l,:ln7 ·2 3~11·5 .:;; IG 73 w.,.~ r..,uMal
A. &'N. loland•
Dadra & Ngr. H ""•li 31 :!0 51 Delhi
1.1173 ·1 46 23 0') Himaoral Prndesh
I.. )f. & A. Isln ndo
14.5·0 1:1 2 );) :1Ianipur
XagRIRnd
~.E.F.A.
:J:l~·U PunJ.ichcrry
877·0 7~5·1 12 2 14 'fripura
77~·8 333•0 5,':1:l!! :!,O')J 7,057 ~U'; 5~ ~59 1,;-n:A
•Jn,.ludes Enrolinent in attached classes.

94
Territories of A. & N. Islands, Delhi, Nagaland and NEFA reporwd one school each. Decrease in the number of schools WS;S reported by Assam (1), Madras (9), Mysore (12) and Rajasthan (5). Apart from the classes of one school in Mysore the huge decrease in Mysore as well as in Madras was due to upgrading of these schools as under-graduate basic training colleg<>fl. In Rajasthan 4 basic training schools were closed down and one converted to crafts school.
Teacher's Training Colleges
The number of basic training colleges-both post graduate as well as under graduaw increased from 235 to 267. Of the total 43 were post gra.duaw and 224 under graduaw. These colleges together with the training clauses attached to other institutions enrolled 24,213 (17 ,673 men and 6,540 women) trainees as compared to 16,101 (1,629 men and 4,472 women during previous year). This number, however,· excludes the number of trainees in training classes of school standard attached to these training colleges. The total direct expenditure increased from 1,07,42,753 (Rs. 43,71,163 on post graduaw training colleges) to Rs. 1,41,42,901 (49,61,865 on post graduaw training colleges and Rs. 91,81,036 on undergraduate training colleges). The a verge annual cost of training a pupil teacher in these colleges worked out to R8. 775 · 3 for a post graduate training colleg<> and Rs. 333 · 0 for an undergraduate training college. The corresponding figures for the previous year wereRs. 887·9 andRs. 273·4xespectively. The output of graduaws and post graduates from the colleges during the year was 7,057 (5,052 men and 2,005 women) and 259 (207 men· and 52 women) as compared to 3,644 (2,812 men and 832 women) and 69 (60 men and 9 women) in 1960-61.
The Stare-wise statistics of basic training colleges are given in table XXXIX. It will be observed that increase in the number of postgraduate basic training colleges was reporwd by Madhya Pradesh (1) and Rajasthan (1} while increase in the number of undergraduate training colleges was reported by Madras (8), Mysore (19), West Bengal (1), Manipur (1) and Pondicherry (1).
CHAPTER V
SECONDARY EDUCATION
This chapter deals with the progress of education in the field of middle and high/higher secondary school education. As far as possible, account has been given for these types of schools separatdy.
The process of reconstruction of secondary education was carried out through various schemes of secondary education included i~ the Third Plan for which a provision of Rs. 88 crores was made. It was enVIsaged in the Plan that the enrolment of classes VI-VIII would increase from 63· 5 lakhs in 1961 to 97 · 5 lakhs in 1966 and that of classes IX to XI from 28·8lakhs to 45·6ln.khs, by the end of the Third Plan period. However, the enrolment of classes VI to VIII ro3efrom 67·59 in 1960-61 to 74·82lakhs in 1961-62 and that of classes IX to XI rose from 28 · 8 lakhs to 32 · 34 lakJ;ts in the same period. .
To supplement the schemes for the improvement of secondary education, which are in the State sector of the Plan, the :Ministry of Education sponsored certain programmes directly as well as through National Council of Educational R0scarch and Training. A brief account of the activities under these programmes during 1961-62 is given below :-
1. Assistance to voluntary Educational Organisations working in the field of Secondary Education:
During 1961-62, 18 institutions received a sum of Rs. 2,79,555 under this scheme.
2. Promotion of Inter-State Understanding.
Under the above scheme, the emotional Integration Committee was set-up at the end of :r.Iay, 1961 under the chairmanship of Dr. Sampurnananrl. The Committee was to study the role of education in considering and promoting the processes of emotional integration in national life and to examine the operation of tendencies which come in the way of their development and in the light of such study, to advise on the positive educational programmes for Youth in general and student<~ in schools and colleges in particular, to strengthen in them the processes of emotional integration. Wbile suggesting a numboc of measures for the reorientation of education, the Committee emphasized the need for evolving a philosophy of education against the background of cultural education in India. It emphasized the continuous need for co-ordina~ion between the Centre and the variou.~ States in evolvin(l' an All-India Educational Policy: It also recommended for the improvement in the service conditions of kachers etc. In all, the Committ{)e made 213 recommendations on a wide v:uicty of subjects including changes in legislation, organi<>ation of educa.tion in the cmmtry, curriculum and text-books, medium of instructions, pattern of education, diversification of courses, youth programmes etc. The recommendations were under study of the Central Government during the year under review,
95

96
3. Central Board of Secondary Education
The Central Board of Secondary Education, Ajmer, was reconstituted into the All-India Board of Secondary Education and was located in Delhi. It was made to conduct examinations of secondary and higher secondary stages of education of schools located in the territory of Delhi and schools in other parts of the country, which sought affiliation to this Board. This Board is specially designed to help the Government in providing educational facilities with a common syllabus and medium of examination to the children of Central Government employees who are frequently. transferred from one place to another and all other similar floating population in the country.
4. Strengthening of Multipurpose Schools
Following the recommendation of the Secondary Education Commission regarding introduction of diversification of courses, multipurpose schools were established during the second plan period. For further growth and improvement of these schools, the schemes were included in the Third Plan in the State sector. Nevertheless the Central Government proposed to help some selected schools to achieve high level of effectiveness to serve as models for future pla!ll'.
5. Central Institute of English, Hyderabad
This institute was established in 1958 to stem fall in the standard of English in India especially at secondary stage of education. During the year, the institute organised two seminars in Srinagar in May and July, 1961. The first Seminar was meant for the directors of education and Chairmen of boards of secondary education and the second for university professors of English and chairmen of the university boards of studies in English. The Institute also organised a short training course of a fortnight's duration for the secondary school teachers of Jammu & Kashmir State at the latter's request. A fourday course was run by the institute's staff in Bombay and in Aurangabad for the benefit of pre-university teschers of English at the request of the S.N.D. T. University for Women and the Mara.thwada university. The sixth regular four month training course was held from lOth July, 1961. Fifty-two trainees drawn from teschers of training colleges, arts and science colleges and higher secondary schools attended the course, bringing the total number of persons trained at the institute to 404.
In February 1961 a Committee was set up by the Ministry of Education to review the work and progress of the institute. One of the main recommendations of the Committee relates to the starting of a nine-month training course. This course was intended to train key personnel so that they are thoroughly equipped for conduct-ing training courses for the teaching of English in their own States.
6. National Awards for Teachers
As in the previous year, the Vice President gave National Awards to t~e distinguished primary and secondary teachers at a special function held m New Delhi on 31st Oct., 1961. 41 secondary school teachers were selected for this award.

\:17
7. Educational Delegations to and from India
(i) A 15 member delegfl.tion of students and teachers from .Nepal ~.ited India from 19th October to 17th November, 1961. The delegatiOn also Jomed the Youth Festival held in Delhi during that period.
(ii) A student teacher delegation from Sikkim consisting of 10 students and 2 teachers visited India from lOth to 24th February 1962 at the invitation of the Government of India.
(iii) A three-member de1egation of Indian educationists led by Shri R.R. Singh, the Joint Educational Adviser in this Ministry, visited U.S.S.R. in Sept., Oct., 1961 for a period of three weeks to study the Soviet High School System.
8. National Council of Educational Research and Training
1. Central Bureau of Educational and Vocational Guidance
The training activity of the Bureau through one year diploma course, continued during the year. The second and third diploma course classes were_ held during the years in which 36 trainees were trained.
In addition to continuing its normal work of collecting occupational information from all over the country, the Bureau conducted a study of employment trend and prepared model class talks for the occupational orientation of stu.:dcnts as well as a pamphlet on 'courses in Health occupation'. The Bureau also organised a 'Plan your career' exhibition in the Delhi Public Library and a career conference in the context of the Common Wealth technical training week.
The preparation of psychological wsts continued to be the major activity of the Bureau. During the year 'Teachers check-list of student's Behaviours' was prepared and the preparation of a 'Student Problem check-list' and a 'vocabulary Test in Hindi' was taken in hand. Norm.'! on various tests for classes VIII and XI were under preparation.
2. Central Bureau of Text Book Research
Three exhibitions of text books and curriculum materials were organised by the Bureau, two in Delhi and the third in Bangalore at the time of the All India Conference of Periodieals of training colleges. A seminar of physics teachPrs of local higher secondary schools on assignments in physics and a pilot project of writing text books in social studies with the help of local teachers wore undertaken. In connection with the promotion of national integration, the Bureau. developed analysis sheets for scrutinising current text books in languages, H1story, Geography and Social Studies and scrutinised about 80 text books from 8 States to judge the role of the existing text books in the promotion of nati~lllll.unity ~nd understanding. The Bureau completed an~ made ready for publicatiOn, gwde books for metric system, for text book writers, a report on exiH;riment in curriculwn construction in social studies, a brochure, an analysis of !ill tory text books taught in primary classes and another for assignment in science for middle classes,

98
8. The Directorate ol Extension Programme lor SecondarJ Education
The activities of the Directorate in connection with Secondary Education all under the following 5 sections:- ·
(a) Extension Services Pmject-54 departments of extension services continued their work of in-service training to teachers of secondary schools. In order to achieve greater co-ordination between the work of the Centre and the States, meetings were held in six States.
' (b) Examination Reform-The illustrative Jist material, which the unit had
developed through workshops, was printed. Three workshops were held for orientation lecturers of the training colleges to the evaluation approach. Three workshops on research in educational valuation were conducted in various regions for the teachers, co-ordination and experienced headmasters.
An analysis of the question papers set by the examining boards at higher secondary level was undertaken by the unit in four subjects, namely English, social studies, general science and general mathematics and the stu die!! were completed in respect of States of Punjab and Delhi. The unit completed a study of cummulative record cards being used in different boards of secondary education for internal assessment and guidance and prepared a manual of instruction for the teachers to :fill the.se cards.
(c) Science Teaching-A sum of Rs. 2· 60 lakhs was provided .for establishing central science clubs in 129 highjhigher Secondary schools and 3 departments of extension service . were selected for the purpose. The scheme of assessment of the work of science clubs was also taken up and 220 science clubs were . assessed by the end of the year under report.
(d) Experimental projects-During the year, Rs. 33,000 were sanctioned to 60 secondary Schools for implementing the projects selected by working group.
(e) Seminars and Workshops-During 1961-62 four all-India seminars for teachers of multipurpose schools on the subjects of Agriculture, Commerce, Technology and Fine Arts, 15 State level seminars on the teaching of Mathematics in difterent classes of secondary schools, one seminar for the teachers of Mathematics for all the Union territories were held.
'Main Developments in the States A brief account of the progress made by various States in the field of
Secondary Education is given below -
Andhra Pradesh
The introduction of new integrated secondary school syllabus for class IX was put off till1964-65. ·
The State Government exempted students belonging to scheduled castes, scheduled tribes and other backward classes from the payment of special fees in secondary schools under all managements. As a special case, the departmental officers were allowed to grant age-exemption upto one y~r to t~e school final class pupils who fall short of the prescribed age for taking Pubho Examinations during March/April, 1962 pending final decision of the St.ates Educational Advisory Committee.

!:J9
Assam. The Secondary Education Board was formed during the yoar under report
under provisions of the Secondary Education Act of 1961.
A large number of M. V. Middle Schools were converted into 8enior basic schools. 7 High Schools were converted into Higher Secondary Schools under the movement started two ye.a.rs back. The first batch of the Higher Secondary Schools appeared in the final examination during the year, when 538 candidates were deelared successful out of 976 appeared for the same.
Grants for the improvement of M. V. Middle Schools, Senior Basic Schools; Science and Craft activities of higher Secondary Schools were increased.
Bihar The Government of Bihar constituted the Bihar State Secondary Educa
tion Committee to review the system of Secondary education in the State and make requisite recommendations for its reconstruction.
The scale of pay of middle School teachers was revised as follows-
Qualifications ---------------
Matric Passed .• Non-Matrio (trained)
Old Scale
Rs. 40-60 40-75
Revised Scale~
Rs. 45-75 45-75
Besides subsidising 20 new Higher Secondary schools, the State Government opened three Government managed higher secondary schools during the year. The Govt. Girls' Higher Secondary Schools at Gardanbagh and Dhan· bad were upgraded into multipurpose schools. Besides the Govt. sanctioned Rs. 29·87 lakhs for the improvement and expansion of existing non-government multipurpose schools. A sum of Rs. 3·00 lakhs was also sanctioned as non-recurring grants to 54 government multipurpose schools for the purchase of equi].•ment, books and furniture. FC'r the improvement of recognised high scho0ls, the State Govt. gave Rs. 3 ·12 lakhs as grant-in-aid. A sum of Rs. 500 each as non-recurring grants for purchase of equipments for physical education and a sum of Rs. 400 each as recurring grants for the appointment of trained physical training teachers was given to 39 non-government secondary schools.
Jammu & Kashmir During the year, 10 schools were raised to the level of higher secondary
schools, 20 to the level of high schools and 20 to the level of lower high schouls. Of the 42 higher secondary schools, 25 provided agricultural courses, 13 technical and commerce courses a.nd 4 domestic science courses.
Gujarat
BL'<"icles allotting multipurpose courses to 5 secondary schools during the yem, 107 now secondary schools were opened. The State government providcci five lnkJJ~ of rupees for allotment of di!Torent div.:lrdified courJs viz. Agriculture, Fine Art.~, Colhlllerce and Home Science to secondary schooLq.

100
A seminar of science teachers was organised in which 25 teachers participated. Science clubs were started in 6 non-government secondary schools at the cost of Rs. 72,000. Eight district level exhibitioilB were organised.
Kerala Coi!Bequent on the reorganisation of the State Directorate and Inspectorate
the overall control of secondary schools passed on to the Regional Deputy Directors in each region. More powers were delegated to the D.E.Os. for the speedy disposal of files both on the administrative and academic sides.
· The extei!Bion services conducted refresher courses, week-end-studyclasses, seminars and exhibitioilB. These activities helped in tbe improvement of Science. teaching studies, in curriculum planning, experimentation in schools, examination reforms and a variety of problems relating to secondary and multipurpose schoolr.
The triple benefit of pension-cum-pNvident-fund-cum-insurance scheme was extended to aided sLhool teachers.
Madhya Pradesh An increase was registered in all type.q of secondary schools excepting high
schools. The decrease in the number of high schools was· due to the Government policy of converting such schools into higher secondary ones.
Maharashtra The Education Department continued to provide advisory and guidance
service through seminars and workshops, audio-visual aids, libraries, studygroups and conferences, science club activities, publicatioilB, excursioilB, exhibitioilB etc.
Loans amounting to Rs. 2 lakhs were paid to 17 secondary schools for the purchase of sites for buildings and playgrounds.
New courses of Agriculture, Commerce, Home Science, Fine Arts, Humanities and Science were introduced in multipurpose higher secondary schools.
During the year, the standard rates of tuition fee of Rs. 4 for the lowest and Rs. 7 for the highest standards of second2.ry schools were introduced in Nagpur and similar rates of Rs. 3 and Rs. 6 r68pactively were brought into force in secondary schools of Vidarbha area.
Madras In 1961-6~, revised syllabus was introduced in Form VI and the no
menclature of the Form was changed to standard X. Similarly in Standard VI in non-basic elementary s~;hools and in Form I of secondary schools, the revised syllabus was introduced and the nomenclature of Form I was changed into standard VI. The pupils in the new standard X were the first batch to appear for the standard X Public Examination held in March, 196~.
A short training course for a period of 6 weeks in social studies for 50 teachers employed in secondary schcols was held at the Govt. Training College, Komarapalayam so as to enable them to acquire nece.~sary background knowledge in Geography.
1

101
Eight schools were sl'lected for improvement of teaching in Science, 54 for improvement of teaching in core-subjects, 36 for the introduction of crafts and 108 for the improvement of libraries.
Mysore New syllabus of IX standard was introduced in all the high schools
in the State during the year under report, thus bringing uniformity in the first two stanuanls of high school course. Craft was introduced as a compulsory subject of study in high schools.
A sum of Rs. 6 lakhs was sanctioned to private agencies for the purchase of equ.ipment and maintenance grants for starting new high schools. 100 schools out of the target of 200 for the entire 3rd Plan period were converted into higher secondary schools during the year under report.
During the year, 2-10 week-end seminars for secondary school teachers were organi~ed and conducted by the subject inspectors in English Language Social stl'dieE, Science and Mathematics.
The Educational Bureau undertook the work of revision of syllabus for -primary and sccond:wy scho:>ls and also preparation of guide and text books, for whiclt Rs. 10 lakhs, were provided. The Bureau also conducted a workshop at B<1ngalore for production of children's literature for which a sum of Rs.l5,000 was provided. A competition for awarding prizes to author~ of children's litcrMnre wa.s also held. The Educational and Vocational GuidanceBureau conducted two training programmes for career masters. Two subburcax with field counsellors were started at Gulbarga and Belgaum. A last construction unit for standardiS3tion of intelligence test were started. A State level seminar for career Masters was held.
Orissa
Grants-in-aid were given to 20 new high schools besides a non-recurring grant of R~. 1,82,479 given to 55 high schools for boys for the purchase of new furniture and other teaching appliances. Under the scheme.d introduction of crafts in high schools; a sum ofRs. 7,500 was paid to 10 non-government high school~ and Rs. 1,51,200 to 36 government high schools in the State at the rate of lh 3,200 and Rs. 1,000 each for the coiL~truction of craft schoe>lt~ and purclmse of craft materials during the year under report. Craft subjects such as agriculture, carpentry anol tailoring were introduced.
Rc'lric'ntMion courses for the English teachers of M.E. schools and senior basic ~cho,L; wo·r,, helcl during the year at 16 different centres for imparting training on the structural pattern of teaching English. 342 participants attended. A rcrreshcr course in English was held under the auspices of the Boatd of Secondary Edttcation, Orissa., at Puri Zilla school during the year. 35 participants attended. Besides, a refresher course for training undergraduate untraincll women te,.chers was held at the Rameshwar Girl's High School, Cuttack. 23 teachers from different high schools participated.
. A State l?vel sem!n:>r for 40 mathematics teachers was organised by the Dtreetoratc ot Exrcnswn Programmes for Secondary Education at Puri for 10 ,h•p. A S<'miuar on Education was held at the Radh<1nath Tminill" Collecre Cuttack for a period of fi,-e days in which 43 teachers f..:om different high scho~l~

102
participated. Besides, seminars of Inspecting officers were organised at B:>langir and Berhampur to acquaint the officers in teaching English in structural pattern in the ~econdary schools. Some of the Hindi teachers of high schools attended a seminar of Hindi teachers organised by the Govt. of India at Tirupathi in Andhra Pradesh from 19-9-61 to 28-9-61.
5 new high schools and 25 new M.K schools were opened for girle besides opening of XI class in 7 existing girls high schools.
Punjab
Free education, which was in existence up to 8th class in Govt. secondary schools, was extended to all the girls studying in 9th class and ha.lf fee concession for boys whose parents income did not exceed Rs. 100 p.m.
84 Middle/High Schools were upgraded to higher secondary pattern. A sum of Rs. 33·50 lakhs was given as grant-in-aid to middle/high/higher secondary schools for the PU:chase of science material and equipment.
The Department of Extension Services organised a number of refresher courses, seminars, workshops, conferences, discussions etc. in the field of (a) teaching over crowded classes and (b) modern trends in teaching.
Rajasthan
Two workshop method seminars-cum-short training courses for the headmasters and headmistresses of high and higher secondary schools for 30 days and 16 days duration were held at Bikaner and Jaipur respectively. A science Seminar was also held at Dungar College, Bikaner. Besid€s seminars of Dy. Inspectors of secondary schools and inspectors of schools for orientation in community development were held at Pushkar and Bikaner respectively.
A sum of Rs. 72,000 was allotted to 6 secondary sclwols f-1r the strengtheni·ng of science teaching at the rate of Rs. 1,200 per school during the year.
Uttar Pradesh
Two Govt. Senior basic schools for girls were upgraded into high school standard in both literary and scienWic groups, one being upgraded for literary group only.
The Govt. reviewed the position of dearness allowance allowed to teachers of-private higher secondary schools and allowed additional dearness allowance at Rs. 4 p.m. to whole tin:e tcach;Jrs, clerks and peons of aided higher secondary sJhools drawing pay upto Rs. 100 p.m. subject to marginal adjustment upto Rs.103.
A sum of Rs. 9 ·54 lakhs was given to 116 aided higher secondary schools for the purchase of science equipment .",nd construction of science laboratories, 131 aided schools received a grant of Rs. 5 · 48 lakhs as furniture and bus grant!> and 91 a:d~d schools received Rs. 2·78 lakhs for the improvement of libraries.

103
West Bengal
The scal<s of pay of secondary school teachers were revised during the year as follows :-
De.-;ignat ion and qualification of teachers
Existing scale Revised scale
Headmasters (Trained Hons. Rs. 200- 10- 370--15 or Post-graduate) -400 plus Rs. 25 for X
class schools, and Rs. 75 for XI e~ass schools with two streams, Rs. 100 for XI class schools with more than two streams.
Rs. 350-10-450-15 --525 plus monthly special pay of Rs. 25 for X class schools, Rs. 50 for XI class schools with two streams, Rs. 75 for XI class schools with more than two streams.
Asstt. Headmasters (same qualification)
M.A.fM.Sc.fM. Com. B.T. B.A.(Hons)/B.Sc.(Hons)B.T. B.A.fB.Sc.fB.Com. B.T.
Trained under-graduate
Matric V.l\1. Classical Teacher M.A.fl\l.Sc.(untrained) B.A.(Hons)/B.Sc. (Hons)
(untrained) Untrained under-graduate
Pay according to qualifications as prescribed for assistant teachers. Special allowance of Rs. 35 for class X schools, Rs. 40 for XI class schools with one stream and Rs. 50 for class XI schools with more than one stream.
Rs. 130-5-150-10- Rs. 210-10-450 350.
Do. Do. Rs. 100-5-215-10- Rs. 160-7-223-8-275 295 Rs. 70-3-118--4--130
Rs. 70-5/2-100 Rs. 70-3-118--4--130 Rs. 130 fixed
Rs. 100 fixed Rs. 70 fixed
Rs. 115--5-133-4--185
Do: Do.
Rs. 210 fixed
Rs. 160 fixed Rs. 115 fixed
106 higher secondary schools were added during the year as a result of establishment of new institutions and conversion, thus raising the total number of such schools to 284. A sum of Rs. 3 ·53 lakhs was provided to 201 selected schools. Besides a sum of Rs. 6,000 was provided to organise seminars and refresher courses to increase the proficiency of the teachers in the reorganised pattern of secondary education. With a view to carrying out experiments and research in education, two research units were set up and an amount of Rs. J,OOO was spent during the year. Elementary general science was made compulsory upto matriculation stage of education.

104
Career I Masters' courses were introduced at the David Hare Training College, Calcutta to train the teachers of class XI schools to give educational and vocational guidance.
_Dallra and Nagar Haveli
Both the secondary schools at Silvassa and Naroli were upgraded upto S. S. C. standards and experienced teachers were appointed. Sufficient equip· ment for science laboratories and reference books for the libraries were supp· lied.
Delhi
Children studyirig in recognised secondary schools were exempted from tuition fee upto and including VIII class from the year under review. Television project was launched in most of the schools and the facilities in multipurpose schools both in respect of courses and equipment were extended. Workshops and seminars for. secondary school teachers were organised. To meet the increased demand for science learning, intake capacity in the schools was increased and laboratories were strengthened.
Himachal Pradesh Six middle schools and 3 high schools were upgraded into higher secondary
schools with humanities and science groups. Science group was also introduced in five girls' higb,er secondary schools.
An evaluation unit was established in the basic training college, Solan with a view to bringing about necessary reforms in the examination system, syllabi, curriculum etc.
L. M. & A. Islands
Standard IX was opened in the high school at Ameni, which was opened in the previous year.
Manipur
Free education upto VIII standard was introduced in the Territory.
Holding of seminars on different subjects, deputation of teachers for training inside and outside Manipur, deputation of Headmasters to regional seminars and of teachers for training in career Master's courses and introduction of Audio-visual aid in teaching were some of the necessary measures taken up to improve the methods and standard of teaching.
Nagaland Three new high schools were opened during the year.
Pondicherry Two new high schools out of the target of 6 for the III Plan were opened
during the year. Diversified courses in Agriculture and Secretariat subjects were started in two multipurpose schools during the year under report.
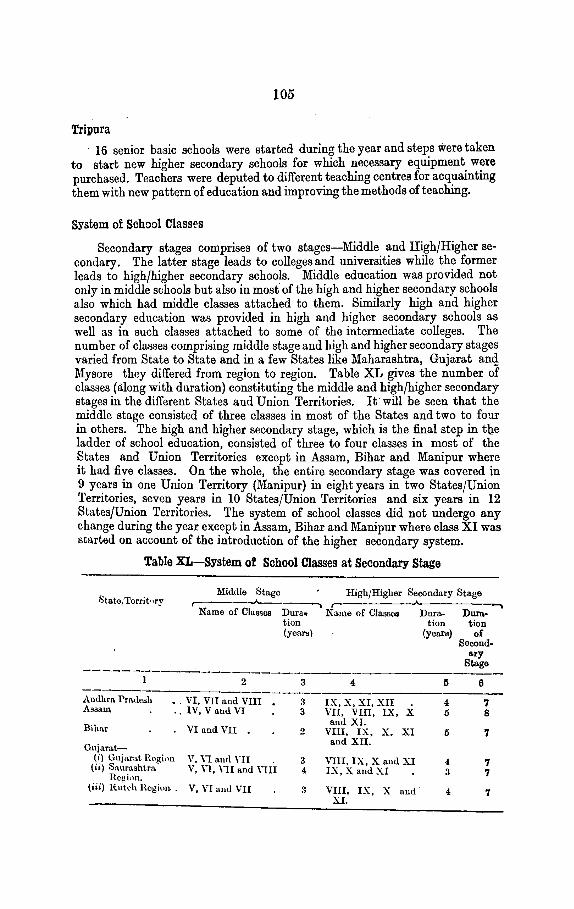
105
Tripura
16 senior basic schools were started during the year and steps were taken to start new higher secondary schools for which necessary equipment were purchased. Teachers were deputed to different teaching centres for acquainting them with new pattern of education and improving the methods of teaching.
System of School Classes
Secondary stages comprises of two stages-Middle and High/Higher secondary. The latter stage leads to collegesand universities while the former leads to high/higher secondary schools. Middle education was provided not only in middle schools but also in most of the high and higher secondary schools also which had middle classes attached to them. Similarly high and higher secondary education was provided in high and higher secondary schools as well as in such classes attached to some of the intermediate colleges. The number of classes comprising middle stage and high and higher secondary stages varied from State to State and in a few States like Maharashtra, Gujarat ant! Mysore they differed from region to region. Table XL gives the number of classes (along with duration) constituting the middle and high/higher secondary stages in the different States and Union Territories. It will be seen that the middle stage consisted of three classes in most of the States and two to four in others. The high and higher secondary stage, which is the final step in the ladder of school education, consisted of three to four classes in most of the States and Union Territories except in Assam, Bihar and Manipur where it had five classes. On the whole, the entire secondary stage was covered in 9 years in one Union Territory (Manipur) in eight years in two States/Union Territories, seven years in 10 States/Union Territories and six years in 12 StatesjUni~n Territories. The system of school classes did not undergo any change durmg the year except in Assam, Bihar and Manipur where class XI was started on account of the introduction of the higher secondary system.
Table XL-System of School Classes at Secondary Stage
Middle Stage
Name of Classes
HighjHigher Secondary Stage -....., r-Dura. Name of Class011 Dura
tion (years)
Duration of
Second· ary
Stage
tion (yeal'!l)
------... -------2 ------3 ----4-----~~----6--Audhra Pmdcsh •. VI, VII and VIII 3 IX, X, XI, XII 4 7 Assam .. IV, V and VI 3 VII, VUI, IX, X 5 8
Bihar VI and VII and XI.
2 VIII, IX:, x. XI 5 7 Gnjnrat--
and XII.
(i) Gujura.t Rogi\ln V, YI and YII 3 VIII, IX, X and XI 4 7 (ii) Saurashtm V, n, \"II and nri 4 IX,XandXI 3 7 Reg inn. (iii) Rutch Hogiun .. V, \'I ami VII ,, VIII, IX, X and 4 7
XI.

106
Table XL-- Sya~em ol Schoal Classes at Secondary Stage- contd.
1 2 3 -----------------------lammu and Kashmir Kerala
VI, VII and VIII V, VI and VII.
M'l.dhya Pradesh M~dras
Maharaahtra-
V, VII and VIII • Forms I, II, III of
Secondary Schools/ Standards VI, VII and VIII of Higher Elementary Schools.
(i) E·J~wJ.ile V, VI and VII Bvmbay State.
(ii) Erstwhile V, VI, VII and VIII Madhya Pra-desh (Vi dar bha Region).
(iii) Erstwhile Hy- V, VI and VII derabad Area {Marathwada Region).
My sore-
( i) Erstwhile Mysore State Area-(a) In Civil
a.reas and Bellary Dis-trict.
(b) Other Areas
(ii) Eca~while Bombay State.
(iii) Erstwhile Madras and Coorg Area.
(iv) F.r.<iwhile Hyderal)ad Area.
Orissa
Punjab Rajasthan Uttar Pradesh West Bengal A. & N. Islands Dadra and Nagar
Haveli. Delhi. Himachal Pradesh L.'M. & A. Islands Manipur
Nagaland
N.E.F.A .• Pondioherry Tripara
Forms I, II and III
Classes I, II, III and IV.
V, VIand VII
Forms I, II and III of Secondary SchoolsfStandarcL> VI, VIIand VIII of Higher Elementary Schools.
V, VIand VII
VIand VII
VI, VII and VIII VI, VII and VIII VI, VII and VIII V, VI, VII and VIII VI, VII and VIII V, VI and VII
VI, VII an<l VIII VI, VII and VIII V, VI and VII Ill, IV, V and VI
III, IV, V and VI
IV, V andVI Forms I, I I and III VI, VII and VIII
3 IX,XandXI 3 VIII, IX, X and XI. 3 IX,XandXI 3 Furms IV, V and VI
3 VIII, IX, X and XI
4 IX, X and XI
3 VIII, IX, X and XI
3 Fot"ms IV, V and VI
4 Classes I, II and III
3 VIII, IX, X and XI
3 Forms IV, V and VI
3 VIII, IX, X and XI
2 VIII, IX, X, XI and XII.
3 IX,XandXI 3 IX,XandXI 3 IXandX 4 IX, X and XI 3 IX,XandXI 3 VIII, IX, X and XI
3 .IX,XandXI 3 IX, X and XI 3 VIII, IX and X 4 VII, VIII, IX, X
and XI. 4 VII, VITI, IX and
x. 3 VII, VIII, IX and X 3 Forms IV, V and VI 3 IX, X and XI
3 4 3 3
4
3
3
3
4
3
4
5
3 3 2 3 3 4
3 3 3 5
4
4 3 3
6 7 6 6
7
7
7
6
7
7
8
7
7
6 6 5
' 6 7
6 6 6 0
8
7 6 6

107
Administration and Control As before secondary schools continued to be managed by the three agencies
(\) Governme~t-Central and State (ii) Local bodies including district boards, municipal boards cantonment boards, notified area committees, Territorial Councils Zilla P~rishads and Panchayat Samities and (iii) private bodies aided-u~aided. In most of the States, majority of the high/higher secondary schools were managed by private b?dies, ~hile ~ case of most of the Union Territories, Government predommated m their contr.ol. So far as middle schools are concerned, government and local bodies predominated in their managements. Government exercised some kind of control over private schools also which was in the form of granting recognition, inspection, prescription of syllabus and provision of grant in-aid.
Pay scales of Teachers 1>ay scales of teachers were revised in the States of Andhra Pradesh, Bihar,
Quja.rat, Orissa, Maharashtra, Rajasthan, · Uttar Pradesh and West Bengal. In Andl!ra Pradesh the scales of pay were revised with retrospective effect from 1st November, 1961. In Bihar, the scales of pay for teachers in non-government secondary schools were raised so as to give maximum financial relier possible to the teachers and to bring at least the starting salary on par with that of teachers serving in government schools. In Gujarat where the pay scales of teachers in non-government secondary schools were revised earlier, the government with a view to giving the same benefits to the Assistant Maste_Is working in government secondary schools decided to revise the pay scale of Assistant Masters and Assistant Deputy Educational Inspectors with effect from 1-10-1961. These pay scales were the same as in non-government secondary schools. In Maharashtra, on the recommendation of the Integration Committee for Secondary Education, uniform scales of pay were sanctioned in nongovernment secondary schools since 1-11-1959. In Uttar Pradesh whole time teachers of aided higher secondary schools drawing pay upto Rs. 100 p.m. subject to marginal adjustment upto Rs. 103 were allowed additional allowance of Rs. 4 per month. In West Bengal, pay scales were again revised and improved during 1961-62 with effect from 1st April, 1961. Under this scheme, untrained graduate or under-graduate teachers with 10 years of teaching experience or who were 50 years of age or above on 31st December, 1957 were given the benefit of the pay scales of trained graduate or under-graduate teachers. Further, in order to attract qualified trained teachers in rural schools, a special allowance in lieu of quarters was sanctioned @ Rs. 25 each per month to trained honours graduate and trained M.A.fM.Sc. and @RR. 15 each per month to trained graduates serving in schools in rural areas. The details of pay scales of teachers in middle and high/higher secondary schools according to qualifications of teachers are given in appendices B and C of Vol. H-A of this report. Tables XLI(A) & XLI(B) of this volume compares the minima and .maxima of the scales prescribed in government schools for graduate trained teachers in various States. The States have been grouped to<Jether according to the starting salary offered by them. " Public Examinations
The names of public examinations and classes at the end of which these examinations were con.ducted in 1961-62· at the secondary lltage in the different States are shown m table XLII. These examinations broadly speakllg

108
are of three categories (i) Middle School Leaving Certificate Examination which was generally held at the end of class VIII (Form III) or class VII according to £U:al class ~f the middl~ sta~e in the res~ectiv~ States (i~) S~condary School I.eavmg Certificate exammatwn (or Matriculation exammatwn) which was held at the end of class X (Form VI) and (iii) Higher Secondary School.
Table XLI( A)-Minima and Maxima of Pay Scales of Trained Teachers in Government Middle Schools
Number
StatejTerritory Minimum of years
Maximum required to reach the
maximum
1 2 3 4
Rs. Rs. Kera.la. 40 120 . 17 Bihar 50 90 20 Jammu & Kashmir 55 120 12 Punjab 60 120 13 Uttar Pradesh 60 120 13 Himachal Pradesh 60 120 13 Ma.harashtra 61 140 21 Dadra. and Nagar Havdi 70 150 22
Guja.rat 70 150 22
Tripura 70 130 19
Assa.m 75 150 18
Manipur 75 125 15
Nagaland 75 125 15
N.E.F.A. 75 125 15
Andhra.,Pradesh 80 150 15
My sore 80 150 19
Madras 90 140 16
Pondioherry 90 140 16
Rajasthan 91 160 14
Madhya Pradesh 95 170 18
Orissa 100 156 12
A. & N. Islands 118 226 24
Delhi 118 225 24
L.M. & A. Islands 118 225 24
Wedt Benga.l • 125 200 20

109
':!.'able XLI(B)-Minimum and Maximum of Pay Scales of Trained Graduates in Government High/Higher Secondary Schools
StateTorritory
Jammu and Kashmir
ll!ahnrnshtra
Kcrala
Bihar
Tripuro.
Gujarat
Dndra and Nagar Haveli
Punjab
Hinmchal Pradesh
Rajasthan
Uttar Prnuesh
Manipur
My sore
Mndras
Pondicherry
Assam
N.E.F.A.
Napland
Antlhra Pradesh
Matlhya Pradesh
A. & N. Island~'
Delhi.
L.:I.I. & A. Islands
West Ben~al
Orbsa
Number of years
Minimum ~Jaximum required to reach
the maximum
2
Rs.
70
75
80
100
100
llO
llO
llO
llO
ll5
120
125
130
J.IO
140
140
140
140
145
IGO
170
170
170
175
lS5
3
Rs.
90
200
165
190
225
200
200
2;30
250
2:JO
300
27.5
250
250
250
275
275
275
250
290
380
380
380
32J,
325
4
4
21
14
16
24
20
20
16-
16
17
20
17
15
15
15
15
15
15
16
17
18
18
18
20
II

uo
Table XLII-Public Examinations
State/Territory
Andhra Pradeeh
Erstwhile Andhra
Assam
llihar
Gujarat-Erstwhile Bombay
Erstwhile Saurashtra
Erstwhile Kutch State Jammu and Kashmir
Kerala
Madhya PradeshErstwhile Bhopal, 'Madhya
llharat and U.P.
Erstwhile Madhya Pradesh
Madras
Hah!Lrashtra-Ers£while Bombay
Erstwhile Madhya Pradesh
Erstwhile Hyderabad
Mysor&-Erstwhile :ltlysore State
Erstwhile Bombay State
E"'ltwhile Madras State
Erstwhile Hyderabad State Erstwh'le Coorg State
Name of the final class at the end of which pub- N~>me of the Public Examination lie examination is held
Class VIII
Class XI
Class XII
Class VI
·clas8 X Class XI
2
Class XI (Special)
ClaBB VII Class XI
Class VIII
Class XI Class XI Class VIII Class X
.Standard X
Class VIII Class X Class XI
Class X Class XI
Class VIII
Form VI
Class VII Class XI Class X Class XI
Class X Class XI
Form VI·
Class VII Class XI Standard VIII
Form VI
Clara X Form III Form VI
3
Elementary School Leaving Certificate.
Secondary School Leaving Certificate.
Higher Secondary and Multipurpose School Leaving Certi. ficate.
Middle School Scholarship Exa-mination.
:l.ratriCulation Examination. Secondary School Leaving Certifie~ite. ·
Higher Secondary School Leav-ing Certificate.
Primary School C-ertificate. Secondary School Leaving Cer
tificate. Shalant or Primary School Cer-
tificate. Secondary School Certificate. Secondary School Certificate. :ltliddle School Certificate. Matriculation Examination. Secondary School Leaving Cer-
tificate.
Middle School Certificate. High School Certificate. Higher Secondary School Leaving
Certificate. Secondary School Certificate. Higher Secondary School Leaving Certificate.
Elementary School Leaving Certificate.
Secondary School Leaving Certificate.
Primnry School Certificate. Secondary School Certificate. Secondary School Certificate. Higher Secondary School Certi-
ficate. Secondary School Certificate. Higher Secondary Certificate Ex
amination.
Secondary School Leaving Cer-tificate.
Primary School Certificate. Secondary School Certificate. Elementary School Leaving Cer-tificate. Secondary School Leaving Certificate.
Secondarv School Certificate. Common ·Entrance Examination. Secondary School Leaving Cer-tificate.

111
Table XLll-Public Examinations-contd.
1.
Orissa
runjab
Rajasthan
Uttar Pradesh
W ,·~t Bengal .
A. & N. Islands
Iladm & Nagar Haveli
Delhi
Himachal Pradesh.
L.M. & A. Islands
Manipnr
Nagalnnu
N.E.F.A.
Pvnd.ioh~rry
'l'ripura .
MJB( f'l)J!:IIoffiud-ll
2
Class VII
Class VII
Class XI-Part I
Class XII-Part II
Class VIII Claee X Class XI
Class X Class XI
Class VIII Class X
Class VI
Class X Class XI
Class X
Class XI
Class X Class XI
Class VIII Class X Class XI
Class X
Class VI Class X Clasa YI
Class X Class VI
Class X 7th Standard
3
Middle School Scholarship Examir.ati0n.
Middle School Common Examina1ion.
Higher Secondary School Examination.
Higher Secondary School Exa-mination.
Middle School Certificate. l\latriculation Examination. Higher Secondary School Exa-
mination. Matriculation Examination. Higher Secondary School Exa
mination. Junior High Schoo) Certificate. High School Certificate and High
School Technical Certificate. Central Examination for Girls
and Middle Scholarship Examination for Boys.
High School Certificate. Higher Secondary School Certi
ficate. High Sch~ol Certificate.
Scc~ndary School Leaving Cer• tificate.
High School Certillcate. Higher Secondary School Certi-
ficate. Middle School Certificate. Matriculation Examination. Higher Secondary School Certi-
licate. Secondary School Leaving Certi-
ficate. Middle School CertificatP. :Matriculation Examination. Middle School Leaving Certi-
ficate. Matriculation Examination. Middle School Leaving Certificate.
Matriculation Examination. Primary School Leaving Certi
ficate. 3 erne annoo Tamil School Secondary Sch%1 Lea. ving Certi
ficate. 7 eme (French School) Primary School Leaving Certi-
ficate. Class 3 erne (French School).
Form VI {English School)
Class VI
Class X Class XI
Secondary School Leaving Certificate.
Scco!ldary School Leaving Certificate.
Middle Scholarship Examination.
High School Certificate. Higher Secondnry School Certi-
ficate. '

112
Leaving Certificate Examination which was held generally at the end of class XI of the higher secondary school. In most cases, there were two public examinations at the secondary stage, namely (iJ at the end of the middle stage and (ii) at the end of high and higher secondary stage.
Teaching of Hindi There was no change in the position of teaching of Hindi as a compulsory
and an optional subject in various States and Union Territories except in Madras where it was made an optional subject, in Orissa where it was made compulsory in classes X and XI also, in West Bengal where it was made compulsory in class VI to VII instead of class V to VI. In Nagaland where Hindi was an optional subject in class VII to VI in 1960-61 it was instead made compulsory for classes IV to VIII in 1961-62. The statewise details are given in table XLIII. Teaching of English
The position regarding the teaching of English in secondary schools in various States and Union Territories is indicated in table XLIV. The table shows wide variations from State to State. The teaching of English was started mostly in middle dasses.
Main Statistics
The main statistics of middle school education and high and higher secondary school education are given below:
Middle Schools
Institutions The number of middle schools including those of senior basic schools increas
ed by 6,252, that is from 49,663 (44,997 for boysand4,056 for girls) in 1960-61 to 55,915 (50,765 for boys and 5,150 for girls) during the year under report. This represented a percentage increase of 12 · 6 as against 18 · 9 in the previous year. The number of senior basic schools included in the total number of school was 15,4 75 (14,036 for boys and 1,439 for girls) whose account has been given in the preceding chapter.
The distribution of Middle schools according to management is given in Table XLV below:
Table XLIII-Teacbing of Hindi
Name of Classes in which Hindi is taught as BtatejTerritory
a Compulsory Subject
2
Andhra Pradesh-Areas of Erstwhile AndlUa VI to XI
State. Areas of Erstwhile Hyderabad
State.
Assam
(i) in all classes for students whose mother tonguej is Hindi.
(ii) Class IV to XII other Students.
IV to X
an Optional Subject
3
Grade VI to VIII of Senior basic Schools.

113
Table XLIII-Teaching of Hindi-contd.
Bih.u
Gujarat
Jammu and Kash:nir Koral<> Madh;-a Pradesh
Madras llaharashtra-Areas of erstwhile BJQlbay State
Area> of er.twhile llladhya Pradesh.
Areas of erstwhile Hyderabad State ("larathwada Region).
Mysore • Orissa. Punjab-
Hindi Region Punjabi Region
Raja~ than
Uttar Prntlosh •
West Bongal • A. & N. Islands
Dadm & Nagar Havoli Delhi ·. . Himachal Pradesh L .. \1. & A. Islands ~II\.nipur N11.gal:\nd N.J.::.F.A. l'on lil'ltl'rry Tripurn.
)lfll( J)5UiofEud ll(a)
2
(i) Class I to XI in Schools where medium of instruction is Hindi.
(ii) Classes IV to XI in other Schools.
(i) in all classes of schools where medium of instruction is Hindi.
(ii) Classes V to XI in other Schools.
Standards VI ;,; VI (i) Classes I to XI in schools
where medium of instruction is Hindi.
(ii) Classes VI to XI of other 8-chonls.
(i) All classes in schools where medium of instruction is Hindi.
(ii) Classes V to XI in other schools.
(i) All classes in schools where medium of instruction is Hindi.
(ii) Classes V to XI in other Schools.
(i) Classes III to XI for those students whose mothel: tongue is other than Hindi. Classes VI to X Classes VI to XI
ti) Classes I to VIII ( ii) Classes IV to VIII (i) All classes for students
whuse mother tongue is Hindi.
(ii) Cla-;ses III to XI for others · (i) All classes in Schools where
modium of instruction is Hindi.
(i i) Classes III to XII in other Schools.
Cla,.es VI to VII In all classes for those students
whose mother tongue is Hindi.
In classea III to VIII for other students.
Clasoes V to XI Classes I to VIII Cla.,_,.. I to VIII Classea VI to X C lasoos I II to VIII Classes IV to VIII Claose• III to VIII C'l.lsse,; YIU to X Clasooo VI to VIII
3
VI to VIII
Standards VIII to X
Classes IX and X
Classes IX to XI
-Classes IX t; XI Classes IX to XI
Classes IX ~~d X
Classes IX ~~d X Forms I to YI. Classes IX to XI

114
Table XLIV-Teaching of English
Nn.me; of c!Mses in which teaching of English is compulsory
Andhra Pradesh-Higher Secondary Schools
Classes VI to XII .Assam-
Classes IV to XI Bihar-. Higher Secondary Schools
Classes VI to XI Post Basic Schools
Classes IX to XII Gujarat--
l
Erstwhile Bombay area---()lasses VIII to X Erstwhile Kutch Area-Classes VII to X
Jammu and Kashmir-For Boys-Classes VI to Xi For Girls-Classes IX to XI
Kerala-· Classes V to XI
Madhya PradeshClasses VI to XI
Madras--Secondary Schools-'ltandard V to X.
Maharashtra Classes V to XI •
Mysore-Erstwhile Mysore-V to XI . Eretwhile Bombay-Classes V to XI
Orissa-Class VI to XII • • •
Punjab-Secondary Schools-Classes VI to X
Rajasthan-'-Classes V to XI
Uttar Pradesh-High Schools-Classes IX to XII
West Bengal-Glasses III to XI
A. & N. Islands-Classes IV to XI •
Dadra and Nagar HaveliClasoea VIII to X
Delhi-Classes VI to XI
Himachal PradeshClasses VI to XI
L.M. & A. IslandsClasses V to X
Manipur-Classes III to X
Nagalo.nd-Ciasses ill to X
N.E.F.A.-Classes IV to X
Pondicherry-English Schools-Classes I to XI French Schools-Classes VI to X I Tamil Schools-Standards V to X
Tripura-C!a w•s V to XI
No. of classes
2
7
8
6
- 3 4
6 3
7
6
6
7
7 7
7
6
7
4
9
8
3
6
6
6
8
8
7
lJ 6 6
7

115
Table XLV-Number of Middle Schools by Management
)Ianagemont
Go\12rnmrnt District Board :Municipal Board Private Bodies-
Aided rnnided
ToTAL
1960-61 -.
Number Percent-ago
2 3
9,695 19·5 23,866 48·1
2,615 5·3
10,444 21·0 3,043 6·1
49,663 100·0
1961-62 -.
Number Pbrrer.t-age
4 5
lt,420 20 4 27.293 48 8
2,306 4-1
11,621 20·8 3,275 5·9
55,915 100-0
It will be seen that the number of schools increased under all the management except municipal boards. About one half of the schools were managed bv district boards and one-fourth by private bodies and one-fifth by govern~ent. The number of i Government middle schools increased by 17 · 8 percent,_ district board schools by 14·4. percent, private aided schools by 11· 3 percent and private unaided schools by 7 · 6 percent while those of municipal boards decreased by 11· 8 percent.
Of the 55,915 middle schools 45,714 schools were located in rural areas as against 40,499 in the previous year, thus showing an increase of 5,215 (12· 9 percent). The proportion of these schools to the total number of middle schools was 81· 8 per cent dming 1961-62 as compared to 81· 6 percent in the previous year. The State-wise distribution of Middle schools is given in table XLVI. The increase in the number of such schools was reported by all the States ancl Union Territories except Manipur where the number of schools decreased by 25. This decrensc was due to upgrading of a few schools as high schools and conversion of remaining schools having lower classes only into Junior Basic schools. The increase was the highest among the States in Madras (1,324) followed by l\Iysore (1,000), Gujarat (576), Madhya Pradesh (567), Mahara:,htra (423), Bihar (411), Orism (298), Ja=u & Kashmir (256), Uttar Pradesh (236), Rajasthan (200), Punjab (186), Andhra Pradesh (161), Assam (160) and W c,:t Bengal (113). Kerala was the only State where the increase was less than 100, that is, of 34 only. Among the Union Territories, the highest increase was reported by Delhi and the lowest by N.E.F.A. On percentage basi~, A&N hhuds topped the list among all the States.and Union Territories by reporting rm increase ofl66 · 7. This was followed by L.M. & A Islands (cent per cent). In tho remaining States and Union Territories the percentage increase was less than 50 per cent and ranged from 1·8 (the lowest) in Kerala to37·6percent (the highest) inl\Iadms among the States and from 13·1 percent in Himachal Prndesh to ::o · 2 percent in Delhi among the Union Territories.
The proportion of middle schools managed by government, district ~Joa_rds_, municipal bo::~rds, private aided bodies and private unaided bodies IS mdJC;lted 111 cols. (10) to (1-!) of table XLVI. Government managed cent porce"t schools in L. IlL & A Islands and N. E. F. A., between 75 percent and cent percent in Nagaland (98·4 percent) Ja=u and Kashnur (97 · 8 percent), Dadra Nagar Haveli (92 · 6) percent, Punjab
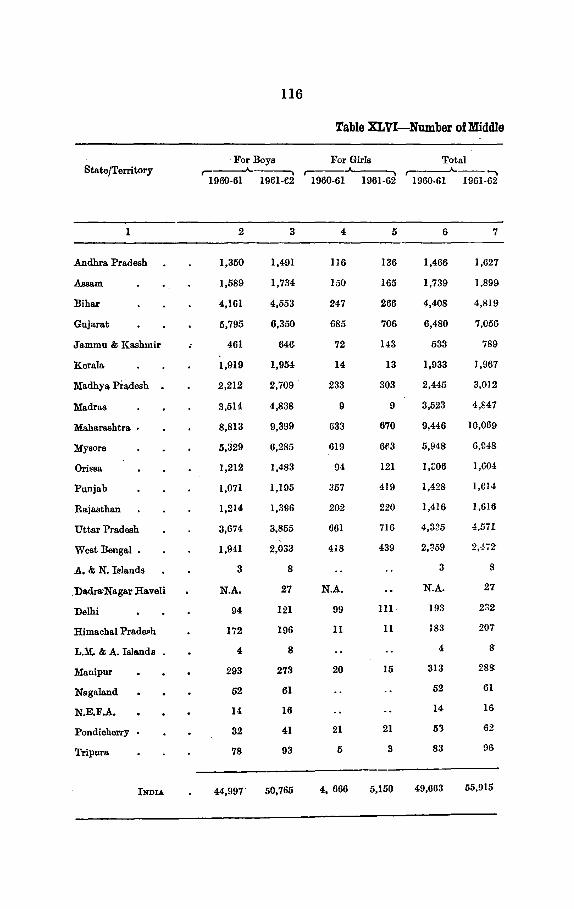
116
Table XLVI-Number of Middle
StatejTerritory -For Boys For Girla
,-----.A---.. r-1960-61 1961-£2 1960-61 1961-62
Total -.
1960-61 1961-62
2 3 4 5 6 7
Andhra Pradesh 1,350 1,491 ll6 136 1,466 1,627
Assam 1,589 1,734 15(1 165 1,739 1,899
Bihar 4,161 4,553 24-7 266 4,408 4,819
Gujarat 5,795 6,350 685 706 6,480 7,056
Ja.mmu & Kashmir 461 646 72 143 533 789
Kerala 1,919 1,954 14 13 1,933 1,967
Madhya Pi-~esh 2,212 2,709 233 303 2,445 3,012
Madras 3,514. 4,838 9 9 3,523 4,847
Maharashtra • 8,813 9,399 633 670 9,446 10,069
Mysore 5,:i29 6,285 619 6P.3 5,948 6,948
Ori•aa 1,212 1,483 94 121 1,Z06 1,004
Punjab 1,071 1,195 357 419 1,428 1,614
Rajasthan 1,214 1,396 202 220 1,416 1,616
Uttar Pradesh 3,674 3,855 661 716 4,325 4,571
West Bengal • 1,941 2,033 418 439 2,~59 2,-!72"
A. & N. Iele.nds 3 8 3 8
_Dadra·Na.ga.r Ra.veli N.A. 27 N.A. N.A. 27
Delhi 94 121 99 Ill 193 2~2
Hima.che.l Pradeph 172 196 11 11 183 207
L,M. & A. Islands 4 8 4 8
Manipur 293 273 20 15 313 288
Naga.la.nd 52 61 52 61
N.E.F.A. 14 16 14 16
Pondicherry 32 41 21 21 53 62
Tripura 78 93 5 3 83 9&
INDIA 44,997" 50,765 4, 666 5,150 49,663 55,915

117
Schools by States
Inc1·t~J:><.:: or D.Jcrea-Se Perren tag·> of schools managed by r------"- -------, ,-----------A. -----,
St atejTeJ ritory Nu:nher Percent- Govt. District :lluni- Private Bodies age BoJ.rds dpal ,----"----.
B >ards Aided Un-aided
s 9 10 II 12 13 14_
+ 1&1 + ll·O 8·5 7l ·6 5·9 13·2 0·8 Amlhra Pradesh
+ ]I]() + 9·2 6·9 30·6 0·2 49·2 13·1 Assam
+ ·li l + 9·3 11·9 38·5 2·5 31·8 15·3 Bihar
+ 516 + 8·9 1·7 86·6 6·5 3·9 1·4 Gujarat
+ 256 + 48·0 97·8 2·2 J<'tmmu & Kashmir
+ :H + 1·8 28·4 0·0 71·6 Kcrala
+ 507 + 23·2 61 ·7 32·2 1·1 4·1 0·9 l\Iadhya Pradosh
-f ! ,'124 + 37·6 3·1 49·7 5·~ 41·5 0·1 1\ladrns
+ .!2~ + 4·5 5·4 82·2 7·1 4·9 0·4 lllahara.,htra
-f-!,1;:"10 + 16·8 42·5 41 ·5 2·3 1~·6 0·1 1\!ysnre
+ !!~8 + 22·8 18·5 1·1 49·8 30·6 Orissa
+ 186 + 1~·0 91·0 0·1 2·6 6·3 Punjab
+ ::r;t) + H·l 89·5 0·2 8·6 1·7 Rajasthan
+ ~.16 + 5·4 4·8 57·7 4·6 8·9 24·0 t:"'tlar Pradesh
-~ 113 + 4·8 1 ·I 1·1 0·2 85·2 12·4 West Bongal
+ 5 +166·7 87·5 12·5 A. & N. Isiancls
+ 27 92-·6 O·O 0•0 7·4 O·O Dadra Nagar Ha.vell
+ 3\1 + 20·2 78·9 21·1 Delhi
+ 24 + 13·1 72·!! 0·5 26·6 Himachal Pradeeh
+ -1 +100·0 100·0 L.:I.L & A. Isl .. nds
2~i 8·0 53·8 5·6 14·2 26·4 :IIanipur
+ 9 + 17·3 98·4 1·6 Nagaland
.,f 2 + 14·3 100·0 N.E.F.A.
+ 9 + 17·0 69·4 ~0·6 Pondicherry
+ ]:1 + 15·7 5·2 75·0 !0·4- 8·3 1·1 Tripur11.
+ti.~52 + 12·6 20·4 48·8 4·1 20·8 5·9 INDIA

118
(91·0 percent), Rajasthan (89·5 percent) and A. & N. Islands (87 ·5 percent), between 50 percent and 75 percent in Pondicherry (69·4 percent) and l\Iadhya Pradesh (61· 7 percent), less th:m 60 percent in the 11 States and one Union Territory while it had no share in the management of these schools in Delhi, Himachal Pradesh and Manipur. Local Boards managed a large majority of schools in Gujarat (93·1 p~rcent), Mahara.shtn (89· 3 percent), Tripnra. (85·4 percent), Delhi (78·9 percent), Andhra Pradesh (77·5 percent), Himachal Pradesh (73·4 percent), Uttar Pradesh (62·3 percent), Manipur (59·4 percent) and Madras (55· 3 percent). The share of private bodies predominatil.d only in 4 States of West Bengal (97 ·6 percent), Orissa (80·4 percent), Kerala (71 · 6 percent) and Assam (62·3 percent).
Pupils
During the year 1961-62, all the recognised middle school~ cmolled 1,21,36,018 students (81,49,958 boys and 39,86,060 girls) as ag1inst l,!lG,l0,878 students (94,96,026 boys and 11,14,852 girls) in the previouf yea.r. TL!s shows an increase of 15,25,140 students or 14·4 percent as compared to the increase of 19·4 percent in the previous year. Of the total number of students 35,89,550 (25,56,090 boys and 10,33,460 girls) were on rolls of senior basic schools.
The total number of students in middle schools managed by different authorities is shown in table XL VII below:
Table XLVll-Numbsr of Pupils in Middle Sahools by Management
1960-61 1961-62 Management
Number Percent- Nnmber Percent· age age
Government 20,72,670 19·5 25,1il,Oi8 20·7
Distrio~ B~a.rd 47,43,486 4!·7 56,38,0!7 46·5 Munioipa.l Bo:J.rds . 12,71,8!2 12·0 11,53,.)19 9·5
Private Bodies-Aided 21,83,888 20·6 24,71,059 20·4
Una.lded 3,38,992 3•2 3,57,315 2·9
Tote! 1,06,10,878 100·0 1,21,35,018 100·0
The enrolment increased in schools under all management except tho municipal board where the decrease was of 9·3 percent and was due to decrease in the number of such schools. It increased by 21· 4 percent in go\•ermncnt schools by 18·9 percent in district board schools and by 12·1 percent in private bodies schools. The corresponding figures for the previous year were 24 · 9 percent, 11· 8 percent and 18 · 3 percent respectively.

119
The numbP.r of pupils coming from rural areas and studying in middle schools rose by 10,68,792 from 74,00,052 (53,84,967 boys and 20,15,085 girls) to 8!,68,844 (60,63,681 boys and 24,05,163 girls). This constituted 69 · 8 percent of the total number of pupils in middle school~ as against 69 · 7 percent in the previous year.
Tablo XLVIII oives the number of pupils reading in middle schools in various States durin~ 1960-61 and 1961-62. It will be seen that increase in enrolment was reported by all the States and Union Territories except Mauipur where the decren.se was to the extent of 1,284 and .was due to decr~se in the number of institutions. Among the States, Madras reported the highest increase, (2,91,818). Next to follow were Mysore (2,26,699), Maharashtra (2,09,524), Gujarat (2,02,130) and Punjab (1,17,646). In the rest of the States the increase was less than one lakh and ranged from 13,117 in Assam to 90;783 in Bihar. In Union Territories, Delhi recorded the highest increase (19,435) and N.E.F.A. the lowest (232). On percentage basis, the highest increase was reported by Pnnjab (37 ·1 percent) <tmong the States and by Himachal Pradesh (75·9 percent) among the Union Territories.
In order to have the exact picture of enrolment at the middle stage, the pupils attending primary classes in middle schools need be excluded from the enrolment in middle schools and the pupils receiving middle school education in high/higher secondary schools or intermediate c:>lleges (having middle classes also) included therein. This has been done in table XLIX which gives the Statewise figures for the years 1960-61 and 1961-62. The enrolment at the middle stage increased from 74,79,584 (55,38,406 boys and 19,41,178 girls) to 81,54,900 (60,35,830 boys and 21,19,070 girls) during the year under report or by 9·0 percent. The enrolment increased in all the States and Union Territories except Kerala. \Ybile comparing the State figures, variations in the number of classes comprising middle stage in different States, as shown in table XL need be taken into consideration.
T;>ble L gives the enrolment in classes VI-VIII uniformly in all the States as co:npared to the population of the age-group 11-14. On anaverv.ge, 26 ·4 percent of tho total pupulation in the age-group was in schools as_sgainst 22 ·6 percent in 1960-61.
to-education
. Of the 39.86,086 girls studying in middle schools, 27,96,041 were reading m schools for boys. The proportion of girls studying in boys' schools to the total numlh·r of girls in all the middle t>chools rose from 68 · 9 percent to 70 ·1 pere;nt.,m 1~61-fi?. Leaving A & N Islands, L.M. & A. Islands, Nagaland and NEI• A" luch did not have ~eparate schools for girls, Madras recorded the highest propor"ion ofgirb in schools fc·r boys (99·6 percent), followed by 'Kerala (98 · 3 percent l. In the rest of the States and union territories out of everv ten m.i'l~lle ~··hool girls, about nine were on rolls in boys' schools in Tripura, mght. Ill Andhra PrauP~h, Assam and 1\Iaharashtra, seven in Mysore, Himachal Pm~e,.h and Manipur and six in· Gujarat, Orissa and Bihar. In Rajasthan, Punpb, West Bengal, Madhya Pradesh and Pond;eherry co-education ranged hctwc·t'i\ 31•4 percent aud 45 ·1 percent. In the rest of the States and Union Terr;tmies, the number of girls reading in boys' schools was su1liciently low. Table LI gives further details.

Table XL VIII-Number of Pupils in Middle Schools by States
For Boys· For Girls Total Increase ( +) or Decrease (-) State/Territory
1960-61 1961-62 1960-61 1961-62 1960-61 1961-62 Number Percentage
1 2 3 4 5 6 7 8 9
Andhra. Pradesh 3,23,763 3,46,598 28,555 31,649 3,52,318 3,18,247 + 25,929 + 7·4 Assam 1,82,640 1,95,168 19,294 19,883 2,01,934 2,15,051 + 13,117 + 6·5 Bihar 7,58,557 8,41,874 53,466 60,932 8,12,023 9,02,806 + 90,783 +ll·2 Gujarat • 12,86,625 14,69,669 2,49,472 2,68,558 15,36,097 17,38,227 + 2,02,130 +13·2 Jammu & Kashmir 52,494 76,783 12,751 17,641 65,245 94,424 + 29,179 +44·7 Kerala. 7,63,571 8,34,268 7,119 7,228 7,70,690 8,41,496 + 70,806 + 9·2 Madhya Pradesh 4,34,681 4,98,742 54,003 62,429 4,88,684 5,61,171 + 72,487 +14·8 Madras 11,04,692 13,96,951 3,143 2,702 ll,07,835 13,99,653 + 2,91,818 +26·3 Maharashtra 22,17,189 24,09,399 2,19,586 2,36,900 24,36,775 26,46,299 + 2,09,524 + 8·6 Mysore 10,09,800 12,19,334 1,60,476 1,77,641 ll,70,276 13,96,975 + 2,26,699 +19·4 ...... Orissa 1,01,758 1,16,173 6,816 7,787 1,08,574 1,23,960 + 15,386 +14·2 t-:1 Punjab 2,42,017 3,28,127 74,785 1,06,321 3,16,802 4,34,448 + 1,17,646 +37·1 0 Rajasthan 2,64,333 3,10,104 52,042 59,105 3,16,375 3,69,209 + 52,834 +16·7 Uttar Pradesh 4,56,926 5,01,057 92,901 1,00,175 5,49,827 6,01,232 + 52,405 + 9·7 West Bengal 1,86,157 2,04,580 39,506 45,207 2,25,663 2,49,787 + 24,124 +10·7 A. & N. Islands 288 798 288 798 + 510 +17·7 Dadra & Na.ga.r Haveli 3,125 3,125 +• 3,125 Delhi 32,963 45,228 31,856 39,026 64,819 84,254 + 19,435 +30·0 Himachal Pradesh 20,693 22,160 1,409 1,512 22,102 23,672 + 1,570 + 7·1 L.M. & A. Islands 1,313 2,310 1,313 2,310 + 997 +75·9 Manipur 22,738 21,914 2,867 2,407 25,605 24,321 1,284 - 5•0 Nagaland 10,425 11,628 . 10,425 11,628 + 1,203 +ll·5 N.E.F.A. 1,458 1,690 1,458 1,690 + 232 +15·9 Pondicherry 10,812 13,850 4,143 4,570 14,955 18,420 + 3,465 +23·2 Tripura 10,133 12,397 662 418 10,795 12,815 + 2,020 +18·7
INDIA 94,96,026 1,08,81,1127 11,14,852 12,52,0!ll 1,06,10,878 1,21,36,018 +15,25,140 +14·4

Table XLIX-Number of Pupil~ at the Middle Stage
BJY• Girt. Total Increase ( + ) Decren.se (-) Stato'Torritory --"-------, .----A..-----., ' ' 1960-61 1961-62 1900-61 1901-62 1960-61 1961-62 Numbor Percentage
2 3 4 5 6 7 8 9
Andhra Pradosh 3,1.5,800 3,55,247 92,085 1,07,384 4,07,885 4,62,631 + 54,746 +13·4 Assam 1,59,079 1,69,226 (10,812 67,183 2,19,891 2,36,409 + 16,518 + 7·5 Bihar 3,45,fiR7 3,55,954 44,539 70,927 3,90,126 4,26,881 + 36,755 + 9·4 Gujarat 3,52.516 3,83,129 1.48,704 1,62,025 5,01,240 5,45,154 + 43,914 + 8·8 Jammu & Kashmir 47,784 52,170 11,643 16,466 59,427 68,636 + 9,209 +15·5 Kcrala 5,06,486 4,99,160 3,94,121 3,86,914 9,00,607 8,86,074 14,533 - 1·6 Madhya Pro.dosh 2,67,670 3,01,693 49,322 64,548 3,16,992 3,66,241 + 49,249 +15·5 Madras 4,81,408 5,27,975 2,09,537 1,75,168 6,90,945 7,03,143 + 12,198 + 1·8 MaharMhtra 7,18,003 7,70,923 2,72,411 3,02,4()7 9,90,414 10,73,390 + 82,976 + 8·4
,_. ~~ 1\Iysore 3,42,728 3,61,958 1,37,614 1,56,414 4,79,892 5,18,372 + 38,480 + 8·0 ,_.
Orissa 74,313 1,11,026 10,050 15,497 84,363 1,26,523 + 42,160 +50·0 Punjab 3,49,660 3,77,013 88,941 1,04,853 4,38,601 4,81,866 + 43,265 + 9·9 Rajasthan 1,79,499 2,06,588 27,571 33,798 2,07,070 2,40,386 + 33,316 +16·1 Uttar Pradesh 7,01,784 7,97,304 1,22,431 1,39,407 8,24,215 9,36,711 +1,12,496 +13·6 West Bongal 5,64,056 6,15,405 2,03,473 2,38,472 7,67,529 8,53,877 + 86,348 +11·3 A. & N. Islands 360 526 120 236 480 762 + 282 +58·8 Do.dra & Nagar Haveli 414 109 523 + 523 Dolhi • • • 65,975 76,826 46,491 52,026 1,12,466 1,28,852 + 16,386 +14·6 Himachal Pradesh 16,577 17,849 3,252 3,488 19,829 21,337 + 1,508 + 7·6 L.M. & A. Islands 465 534 42 74 507 608 + 101 +19·9 Mo.nipur 25,684 27,569 8,470 10,337 34,154 37,906 + 3,752 +11·0 Nagaland 6,553 8,162 3,228 3,778 9,781 11,940 + 2,159 +22·1 N.E.F.A 505 673 111 105 616 778 + 162 +26·3 Pondicherry 5,280 5',505 1,841 2,018 7,121 7,523 + 402 + 5·6 Tripura 11,064 13,001 4,369 5,376 15,433 18,377 + 2,944 +19·1
IN•>IA 55,38,406 60,15,8'l0 19,41,178 21,19,070 74,79,584 81,54,900 +6,75,316 + 9·0

122
Table L-Educational Facilities for the Children of the Age Group 11-14
Enrolment in classes VI-VITI Percentage of enrolment in State/Territory Classes VI-VITI to the popula.-
tion of age group 11-14
Boys Girls Total Boys Girls Total
1 2 3 4 5 6 7
Andhra Pradesh 3,55,247 1,07,384 4,62,631 30·3 9·2 19·8
Assam 1,69,226 67,183 2,36,409 43·3 18·4 31·3
Bihar 5,00,245 61,086 5,61,331 34·2 4·2 19·3
·Gujara.t 3,04,531 1,21,238 4,25,769 43·8 18·3 31·4
.Jammu & Kashmir 52,170 16,466 68,636 39·5 14·1 27·6
Kera.la. 4,43,736 3,33,414 7,77,150 81·8 58·5 69·9
Madhya. Pradesh 3,01,693 64,548 3,66,241 28·6 6·5 17·9
Madras 5,27,975 2,33,562 7,61,537 48·8 21·5 35·1
Maharashtra. 6,16,925 2,23,4ll 8,40,336 46·1 17·6 32·2
Mysore 2,87,162 1,14,150 4,01,312 36·6 14·1 25·6
Orissa. 1,11,028 15,497 1,26,525 19·9 2·9 ll·5
Punjab 3,77,013 1,04,853 4,81,866 53·3 16·3 35·7
Rajasthan 2,06,588 33,798 2,40,386 29·4 5·4 18·0
Uttar Pradesh 7,96,967 1,37,264 9,34,231 32·2 6·1 19·7
West Bengal 4,17,922 1,55,625 5,73,547 35·6 14·0 25·1
A. & N. Islands 526 236 762 26·3 ll·8 19·1
Dadra & Nagar Ha.veli 304 88 392 15·2 4·4 9·8
Delhi 76,826 52,046 1,28,872 84·6 64·2 75·0
Himachal Pradesh 17,849 3,488 21,337 45·8 9·2 27·7
L.M. & A. Islands 381 33 414 38·1 3·3 20·7
ll:lanipur 27,569 10,337 37,906 100·0 43·1 77·4
Nagaland 5,034 2,596 7,630 42·0 23·6 33·2
N.E.F.A. 673 105 778 6·1 1·1 3·7
Pondicherry 5,505 2,018 7,523 45·9 15·5 30·1
Tripura. 13,001 5,376 18,377 36·1 14·1 24·8
INDIA 56,16,096 18,65,802 74,81;898 38·7 13·5 26·4

123
Table LI-Girls in Middle Schools
No. of Girls No. of Girls Total Percentage of Girls in StatejTerritory in Boys' in Girls' Number Boys' Schools to total
Schools Schools of Girls Number of girls
1960-61 1961-62
1 2 3 4 5 6
Andhra Pradesh 1,01,511 26,365 1,27,876 79·7 79·4
Assam 53,599 17,147 70,746 . 74·2 75·8
Bihar 1,06,103 56,216 1,62,310 64·5 65·4
Gujarat 3,74,308 2,58,883 6,33,191 56·5 59·1
Jammu & Kashmir 955 17,637 18,592 3·3 5·1
Kerala 3,67,601 6,375 3,73,976 98·3 98·3
:Madhya I'radesh 44,344 60,840 1,05,184 39·8 42·2
:Madras 5,39,110 2,250 5,41,360 99·4 99·6
Maharashtra . 7,12,729 2,33,211 9,45,940 75·0 76· :t
My sore 3,40,888 1,71,558 5,12,446 62·5 66·5
Orissa. 12,918 7,670 20,588 60·3 62·7
Punjab 45,927 95,594 1,41,521 27·1 32·5
Rajasthan 25,373 55,529 80,902 30·1 31·4
Uttar Pradesh 17,309 92,943 1,10,252 16·3 15·7
West Bengal • 30,351 44,622 74,973 38·4 40·5
A. & N. Islands 265 265 100·0 100·0
Dadra & Nagar Haveli 647 647 100·0
Delhi 3,444 35,300 38,744 9·0 8·9
Himachal Pradesh 3,444 1,192 4,636 74·7 74·3
L. M. & A. lalands 486 486 100·0 100·0·
:Manipur 4,142 2,175 6,317 61·9 65·6
Nagaland 3,564 3,564 100·0 100·0
N.E.f.A. 297 297 100·0 100·0 Pon<licherry 3,358 4,094 7,452 36·4 45·1 Trlpura 3,368 418 3,786 80·7 89·0
INDIA. 27,96,041 ll,90,019 39,86,086 68·9 70·1

124
Table Lll-Number of Teachers
:Men Women Total State/Territory ----.
1960-61 1961-62 1960-61 1961-62 1960-61 1961-62
1 2 3 4 5 6 7
Andhra Pradesh 10,134 10,710 3,218. 3,350 13,352 14,060
Assam 7,850 8,413 1,102 1,229 8,952 9,642
Bihar 22,859 24,684 2,059 2,207 24,918 26,891
·Gujarat 27,845 29,557 11,697 12,079 39,542 41,636
. Jammu & Kashmir 2,139 2,549 273 548 2,412 3,197
Kerala. 16,398 17,930 12,301 13,320 28,699 31,250
:Madhya. Pradesh 19,191 21,704 2,707 3,292 . 21,898 24,996
:Madras 22,087 26,755 14,414 18,423 36,501 45,178
1\laharashtra. 48,671. 51,696 15,568 16,500 64,239 68,196
·:Myaore 27,315 30,930 7,063 8,088 34,378 39,018
Orissa. 5,235 5,814 352 422 5,587 6,236
Punja.b 7,478 8,486 2,856 3,805 10,334 12,291
Rajasthan 11,375 12,594 2,261 2,437 13,636 15,031
Utta.r Pradesh 19,057 20,296 4,202 4,399 23,259 24,695
·West Bengal • 9,175 9,692 1,692 1,983 10,867 11,675
A. & N. ~slanda 7 24 9 9 16 33
Dadra. & Ngr •. Ha.veli 59 24 83
Delhi 1,022 1,577 1,149 1,447 2,171 3,024
Himachal Pradesh 1,295 1,489 179 194 1,474 1,683
L. 111:. & A. Islanda • 36 58 3 4 39 62
1\lanipur 1,224 1,202 63 66 1,287 1,268
Nagaland 357 424 16 32 373 456
N.E.F.A. 85 96 5 6 90 102
Pondioherry 297 346 221 252 518 598
· Tripura 564 610 122 135 686 745
INDIA 2,61,696 2,87,795 83,532 94,251 3,45,228 3.8~,046

125
in Middle Schools
Increase(+) Number of Trained Percentage of Average Number Decrease(-) Teachers Trained teachers of students per
to total teachers ,.---J'----, r-----"----. State/Territory 1960-61 1961-62 1960-61 1961-62 1960-61 1961-62
8 9 10 11 12 13 14
+ 708 10,286 10,886 77·0 77·4 26 27 Andhra Pradesh
+ 690 2,326 2,522 26·0 26·2 23 22 Assam
+ 1,973 15,854 17,891 63·6 66·5 33 34 Bihar
+ 2,094 21,469 23,360 54·3 56·1 39 42 Gujarat
+ 785 1,368 1,757 56·7 55·0 27 30 Jamm11. & Kashmir
+ 2,551 22,349 23,514 77·9 75·2 27 27 Kerala
+ 3,098 11,116 13,972 50·8 55·9 22 22 Madhya Pradesl:
+ 8,677 35,211 43,000 96·5 95•2 30 31 Madras
+ 3,957 46,755 50,086 72·8 73·4 38 39 Maharashtra
+ 4,640 21,087 25,070 61·3 64·3 34 36 Mysore
+ 649 1,895 2,074 33·9 33·3 19 20 Orissa
+ 1,957 9,359 10,703 90·5 87·1 31 35 Punjab
+ 1,395 6,856 8,607 50·3 57·3 23 25 Rajasthan
+ 1,486 18,093 19,364 77·8 78·4 24 24 Uttar Pradesh
+ 808 1,612 1,987 14·8 17·0 21 21 West Bengal
+ 17 9 23 56·2 69·7 18 24 A. & N. Islands
+ 83 7 8·4 38 Dadra & Ngr. Haveli
+ 8S3 2,150 3,006 99·2 99·4 30 28 Delhi
+ 209 1,043 1,251 70·8 74·3 15 14 IDmachal Pradesh
+ 211 37 55 94·9 88-7 34 37 L. M. & A. Islands
19 95 129 7·4 10·2 20 19 Manipur
+ 83 42 48 11·3 10·5 28 26 Nagaland
+ . 12 69 76 76·7 74·5 16 17 N.E.F.A.
+ 80 331 379 63·9 63·4 29 31 Pondicherry
+ 59 194 336 28·2 45·1 16 17 Tripura
+36,818 2,29,606 2,60,103 66·5 68·1 31 32 INDIA.

126
reachers
During the year under report, the total number of teachers in middle schools rose from 3,45,228 (2,61,696 men and 83,532 women) to 3,84,399 (2,89,767 men and 94,632 women) the rate of increase being 11· 4 percent (10 · 7 percent for men teacher and 13· 3percent for women teachers)·as compared to 18·2 percent (17 ·8 percent in case of me;1 teachers and 19·3 percent increase of women teachers) in the preyious year. Vi' omen teachers constitute 24·6 percent of the total number of teachers as compared to 24·2 percent in the previous year. Of the total number of · teachers, the number of trained teachers was 2,60,103 as against 2,29,606 in the previous year. The percentage of trained teachers to the total number of teachers improved from 66·5 to 68·1 during the year under report. Women trained teach'ers constit.nted 26 · 9 percent of tha trained teachers and 7 4 · 2 percent of the total number of women teachers. The number of teachers in senior basic schools included in the total number of teachers in middle schools was 1,11,810. Furcher details about these teachers are given in chapter IV.
Table LII compares the number of teachers in middle/senior basic schools in different States and Ui:tion . Territories during 1960-61 and 1961-62. The number of teachers increased in all the States and Union Territories except Manipur where the decrease was on account of decrease in the number of middle schools. The percentage of trained teachers to the total number of teachers in middle schools is indicated in cols (11) and (12) of table LII. This percentage improved in the States of Andhra Pradesh, Assam, Bihar, Gujarat, Madhya Pradesh, Maharal'htra, Mysore, Rajasthan, Uttar Pradesh, West Bengal and in the Union Territories of A. & N Islands, Delhi, Himachal Pradesh, Manipur and Tripura. Significant improvement was reported by Delhi where cent percent teachers were in middle schools during the year. Apart from Delhi, the percentage of trained teachers was highest in Madras (95·2), followed by
· L.M. & A. Islands (88 · 7 percent), Punjab (87 ·1 percent), Uttar Pradesh (78 · 4 percent), Andhra Pradesh (77 ·4 percent), Kerala (75·2 percent), NEFA (74·5 percent}, Himachal Pradesh (7 4 · 3 percent), Maharashtra (73 · 4 percent), A.&N. Islands (69·7 percent), Bihar (66·5 percent), Mysore (64·3 percent), Pondicherry (63·4 percent),. Rajasthan (57·3 percent), Gujarat (56·1 percent}; Madhya Pradesh (55·9 percent) and Jammu & Kashmir (55·0 percent). In other States, where more than half the number of teachers were untrained this percentage varied from 10 · 2 in Manipur to 45 ·1 in Tripura.
Teacher-Pupil Ratio Durii:lg the year under report, on an average, the number of pupils por
teacher in middle schools was 32 as against 31 in 1960-61. This average was exceeded by 5 States and one Union Territory namely Bihar, Gujarat, Maharashtra, Mysore, Punjab and L.M. &A. Islands. Teacher-pupil ratio in middle schools in various States is given in col (14) of table LII.
Expenditure The total direct expendit-ure on middle schools increased from Rs. 42,92, 19,777
in 1960 61 to Rs. 48,84,18,188 or by 13 · 79 percent during the year. The corresfonding percentage increase during the previous year was 22 ·1 percent. Of the total direct expenditure Rs. 43,45,25,672 were expended on middle

PERCENTAGE OF TRAINED TEACHERS IN
M I DDL~6~f2HOOLS ··\.,
I'JAGALANO
WEST BENGAL
.ASSAM
ORISSA
.JAMMU & KASHMIR
MADHYA PRADESH
GUJARAT
RAJASTHAN
MY SORE
BIHAR
MAHARASHTRI\
KERALA
ANOHRA PRADESH
UTTAR PRADESH
PUNJAB
MADRAS
DADRA & NAGAR HAVEL!
MANIPUR
TRIPURA
PONDICHERRY
A. & N. ISLANDS
HIMACHAL PRADESH
N.E.fi'.A,
L. M. & A. ISLANDS
lPERCENTAGJt.O 10 20 30 40 50 60 70 80 90 100
HJB(D)MMof~duoatio~-13

127
schools for boys and Rs. 5,38,92,516 on middle schools for girls as against Rs. 38J3,86,255anil R&,4,78,33,522expendedrespcctively during thr. previous year. The total direct expenditure on senior basic schools that was included in total chect expenditure on middle schools wa& Rs. 13,53,27, 760 (Rs. 12,04, 73,598 on schools for boys and R<>. 1,48,54,162 on scho:>ls for girls). Further details of expenditure on senior ba.oie scho()ls are given in Chapter IV.
'l'he sonrcewise distribution of total direct expenditure on middle schools is given in table LUI below :
Table LIII-Direct Expenditure on Middle Schools by Sources
Source
Government Funds District Board Funds Municipal Board Funds Fees Endowments Other Sources
Total
1960-61
Amount Percentage
Rs. 31,80,76,587 74·1
2,21,15,310 5·1 3,20,35,955 7·5 3,16, 76,684 7·4
71,39,521 1·7 1,81,75,720 4·2
42,92,19, 777 100·0
1961-62
Amount Percentage
Rs. 36,50,83,126 74·7
2,43,95,660 5•0 3,70,84,014 7·6-3,59,04,761 7·4
80,25,701 1·6 1, 79,24,926 3·7
48,8!,18,188 100·Q
It will be seen th'l.t (a) major portion of the expenditure was met by government (b) expenrliture met from government funds, district boards funds, municipal boar<h fund'!, fees and endowments increased by 14·8 per cent 10·:{ per cent, 15·8 per cent, 13·3 per cent and 12·4 per cent respectively while that from otlter sources decreased by 1·4 per cent.
The distribution of total direct expenditure on middle schools aecc>rding to managements is given in table IV below :
Table LtV-Diraat Expenditure on Middle Sahoals by Management
1960-61 1961-62 Management
Amount Percentage Amount· Percentage
Rs. Re. Government 10,39,98,076 24·2 12,64,62,424 26·0 District Boards • 15,77,05,228 36·7 18,04,48,002 36·9 Municipal Boards 5,77,06,185 13·5 5,77,93,513 11·8
Private Bo<lies-Ahled 9,62,53,248 22·4 10,89,80,062 22·3 Unaided 1,35,67,040 3·2 1,47,34,187 3·0
Total 42,92,19,777 100·0 48,84,18,188 100·0
The rise in expenditure was shared by schools under th<l control of all the agencies, though the increase wa.s. no~ evenly distributed.. · · · .[ ..1 ( l )5!1\Io£Edueation-12(a)


129
on Middle Schools by States ---~-- .....
Total Increase(+) Percen-Decrease(-) tago of
r----.....J-.. ----. ex pen-Amow1t Perccn .. dituro on StatefTerritory
1n60-61 1n61-62 tago Middle Schools to
total direct expdin 1961-62
6 7 8 9 10 1
Rs. R.,, 1,66,27,356 1,74,32,280 + 8,04,924 4·8 8•1 Andhra Pradesh
9n,40,532 1,19,62,518 + 20,21,986 20•3 15•3 Assam
.2,63,68,662 2,87,77,565 + 24,08,903 9·1 17·4 Bihar
4,55,83,213 5,01,60,112 + 4!,76,899 9·8 31·3 Gnjatat
31,54,239 38,27,933 + 6,73,694 21•4 16·4 Jammu & K11shmir
3,40,:!5, 7 53 . 3,70,33,085 + 30,07,132 8•8 21·5 Kcrala
2,56,83,224 3,34,no,ao1 + 78,07,077 30·4 16·6 Madhya Prade•h
4,17,15,942 5,09,12,6!)4 + 91,96,752 22·0 10·7 Madras
n,37,37,212 10,15,10,397 + 77,73,185 8·3 25·7 Muharashtra
3, 7s,zo,oz.; 4,35,44,100 + 57,24,074 15·1 28·1 Mysoro
62,Sii,603 81,77,868 + 18,92,2G5 30·0 14·6 Orissa
I, 71,24,070 1,90,02,601 + 1R,78,531 11·0 12·3 l'unjab
1,77,n~.S25 2,21,56,229 + 43,56,404 24·5 18·3 Rajasthan
2,73;~7,751 2,9J,OS, 706 + 23,80,952 9·4 8·6 Uttar Pradesh
1,51,31{,515 1 ,G7 ,65,890 + 16,27,375 10·7 6·1 West llcnga~
41,544 03,582 + :?2,n:1s 53·G 12·0 A. & N. Islands
Dadra & N1gar Havoli
4!1,311,964 G7,5U, 753 + IS,25,7S9 37•0 8·8 Delhi
J.!,94,-lOO 18,91,616 + 3,97,216 26·6 16·7 Himachal Pradesh
71.~33 1,4·l,lo'J5 + 72,922 102·4 48·0 L. M. & A. Islands
1-!,37,298 15,44,112 + 1,06,814 7·4 16·9 Manipur
8,30,879 11,52,535 + 3,21,656 38·7 22·9 Nagaland :!,lll,4S:! :?,ti0,470 + 49,988 23·7 l!l·4 N.E.F.A. 7,;H,SIO !l,o~.7U7 + 1,47,957 19·6 18·7 Pondicherry
11,lti,~41 1!.3!!,91!} + 23,678 2·1 ll·5 Tripura 4:!,!l:?,lfl,777 48,81, IS,lSS +5,9 1 .u~.·lll 13·8 16·7 bou.

180
Table LV-Direct Expenditure on Middle Schools by State~ontd.
Percentage of Expenditure met from Average cost
lltatefTerritory (1961-62) per pupil
Govt. Distt. Munici. Fees Endow- Other 1960-61 1961-62 Funds Board bal menta sources
Funds oard Funds·
11 12 13 14 15 16 17 18
Rs. Rs.
Andhra Pradesh '72·4 9·5 4·4 11·0 2·6 0·1 47·2 46·1
Assam '76·0 0·0 0·3 17·3 5·3 1·1 49·2 55·2
Bihar 66·2 4·2 1·4 19·1 1·4 7·7 32·5 31·9
Gujarat 81·5 '7·1 7·5 1·5 0·5 1·9 29·7 28;8
Jammu & Kashmir • 97·8 0·7 0·1 . 1·4 48·3 40·5
Kerala 98·3. 0·0 0·4 0·1 1·2 44·1 44·0
Madhya Pradesh 89·2 4·2 0·8 3·3 0·6 1·9 52·6 59·7
Madras '73·'7 10·5 10·1 1·4 4·0 ·0·3 37·7 36·4
:Maharashtra . 68·6 3·0 18·1 3·1 0·2 7·0 38·5 38·4
My sore 91·1 3·1 2·3 0·3 0·1 3·1 32·3 31·2
OriBBa 59·2 0·8 18·4 9·7 11·9 57·9 66·0
Punjab 91·1 0·1 0·1 4·3 2·5 1·9 54·1 43·7
Raiasthan 90·2 0·0 0·1 4·1 4·2 1·4 56·3 60·0
Uttar Pradesh 47·6 11·5 3·7 29·5 1•5 6·2 49·7 49·7
West Bengal 40·9 0·6 0·2 47•2 5·6 5·5 67·1 67·1
A. & N. Islands 100·0 144·3 70·7
Dadr!' & Ngr. Haveli
Delhi 1·6 89·9 5·0 0·6 2•9 76·1 80·2
Himachal Pradesh 96·0 1·4 0·4 2·2 67·6 79·9
L. M. & A. Islands 100·0 54·3 62·4
Manipur 92·3 0·1 0·5 7·1 56•1 63·5
Nagaland 97·7 2·3 79·7 99·1
N.E.F.A. 100·0 144·4 154·1
Pondicherry 92·5 3·1 4·4 50·3 49·0
Tripura 97·8 0·9 1·1 0·2 103·4 88·9
TOTAL 74·7 5·0 7·6 7·4 1·6 3·7 40·5 40·2
····----·--·

131
The Statewise details of expenditure on middle schools during the years 1960-61 and 1961-62 are given in table LV. The expenditure on these schools increm;ed in all the States and Union Territories. Among the Statlols, the highest increMe wM report!'d by Madras (Rs. 91,96,752) and the lowest by Jammu and Kashmir (Rs. 6,73,694.). Among the Union Territories, Delhi; as usual reported the highest increase of Rs. 18,25,789 and L.M. & A. Islands reported the lowest incr'ease of Rs. 49,988. On percentage basiF, among the States, Madhya Pradesh topped the list with highest increa~e of 30 · 4 percent while Andhra Pradesh reported the lowest increase of 4·8. In Union Terr:torio~, the high·~~t and the lowest increase was reported by L.M. & A. Islands (102 · 4 percent) and Tripura (2 ·1 percent) m~pectively. The significant inctcaee of 102·4 percent in L.M. & A. islands was due to upgrading of 4 lower primary schools as upper primary schools in L. l\1. & A. Islands.
The total direct expenditure on middle_schools constituted 12·3 percent of the total direct expenditure on education. The Statewise position is given in col. (10) of table LV.
The extent to which the total direct expenditure on middle schools wasmet from different sources in various states and Union Territories is indicated in cols. (11) to (16) of table LV. Government was the largest contributing agency in all the States and Union Territories except in Uttar Pradesh, Delhi, Himachal Pradesh and Manipur. In the State, its contribution was the highest in Kcrala (98·3 per cent) and the least in West Bengal (40·9 per cent) whiln in the Union Territories, it met cent percent expenditure in A. & N. Islands, L.M. & A. Islands and NEFA and contributed the least in Delhi (1·6 per cent). The share of the local boards predominated in Delhi (89·9 percent), Himachal Pradesh (97·4 per cent) and Manipur (92·4 percent). The greatest contribution of fees was to the extent of 47·2 per cent (in West Bengal) while that of endowments and other sources was 9·7 percent (in Orissa) and 11·9percent (in Orissa) respectively.
The average annual cost of educating a pupil decreased from_Rs. 40·5 to Hs. '10 · 2 . Its distribution according to various sources of income was : Government funds Rs. 30 ·1, district board funds Rs. 2 ·0, Municipal board funds Rs. 3·0, fees Rs.3·0,enrlowments Rs.0·6andothersourcesRs.1·5. Cols. (17) and (18) of table LV show the average annual cost per pupil in the different Stutes during the years 1960-61 and 1961-62.
High and Higher Secondaty Schools
During t~e year under report, the total number of high and higher secondary . school~ mcreased. by 2,049, to 19,306 (16,522 for boys and 2,784 for girls); the rate of mcrease bemg 11·9 percent as against 18·5 percent in the previous year: Of the total 5,577 were hig~er secondary schools as against 4,654 in the previous y~ar, and .13, 729 were high ~C'hools as against 12,603 in the previous year. The mcrcase 111 the numbl'r of higher secondary schools and high schools ~hus ~nul 22·0 percent and 8·9 percl'nt reRpectively as against the correspondmg ligures of 23.·7 percent and 5·6 percent in 1960-61. The number of post

132
Lasio schools included in high schools was 31 (27 for boys and 4 for girls). Fuxt~er details of post basic schools are given in chapter IV.
,The number of high and higher secondary schools according to various managements is given in table LVI below :
Table LVI-Number of High & Higher Secondary Schools by Management·
High Schools Higher Secondary Total number of High and Higher Sohools Secondary Schools
Management ,.----~......_______,
~ 1960-61 1961-62 1960-61 1961-62 1960-61 1961-62
~ ~ No. Percent- No. Percent-
age age
1 2 3 4 5 6 7 8 9
Government 2,021 . 2,203 1,218 1,504 3,239 18·8 3,707 19·2
Dist. Boards 1,498 1,836 107 187 1,605 9·3 2,023 10·5 Munic:pal Boards 321 312 140 ISO 461 2·7 492 2·5
Private Bodies-
Aided 7,324 7,925 2,774 3,307 10,098 58•5 II,232 58·2 Unaided 1,439 1,453 415 399 1,854 10·7 1,852 9·6
•rota! 12,603 13,729 4,654 5,577 17,257 100•0 19,306 100·0
There is no appreciable divergence in these percentages ofhighandhigher secondary schools in 1961-62 as compared to the corresponding figures of 1960-61. Private bodies continued to manage a large majority (about three fifth) of the schools. The managementwise distribution of high schools and higher secondary schools separately during the years 1960-61 and 1961-62 is given in cols. (2) to (5) of table LVI above.
The nuinber of high and higher secondary schools in rural areas increased from 8,965 (8,648 for boys and 317 for girls) to 10,525 (10,141 for boys and 384 for girls). This constituted 54·3 percent (62·7 percent for boys and 13·7% for girls) of the total number of high and higher secondary schools as against 51· 9 percent (50 ·1 percent for boys and 1· 8 percent for girls).
'l'he Statewise distribution of high and higher secondary schools is given in ·table LVII. The number of high and higher secondary schools increased in all the States and Union Territories excepting A. & N. Islands, L.M. & A. Islands and NEFA where the number remained stationary. The highest increase reported by Maharashtra (405) among the States and by Manipur (28) among the Union Territories and the lowest increase by Assam (71) among the States and in Nagaland and Tripura (1 each) among the Union Territories. On percentage basis, the highest and the lowest percentage increase was reported by Rajasthan (21·0 percent) and Punjab (1·2 percent) respectively among the states and by 1\Ianipur (49·1 percent) and Tripura (2·9 percent) respectively among the Union Territories.

Statc}Tcrritory
Table LVII-Number of High and Higher Secondary Schools by States
Total No. Number of High Schools Number of Higher Secondary Sehools of High & Higher lntrea.se( +)
Seo. Scb.ools Decrease(-) ,--------A----------. r----"------, Number
1960-61 I961-62 I960-6I 1961-62 ,-----'----,
For Boys For Girls For Boys ,For Girls For Boys For Girls For Boys For Girls
I960-61 I961-62 Per-centage Inc_rease
---------------------------------------------------------------------------------Anuhra Prauesh .AHsnm Billar Gujurat . . Jammu & Kashmir Kerula . . Maulwa Prauesh Jlladr~s Jllaharashtra M_ysorc Orif'sa Punjab Rajastl1an Uttar Pradesh West Bengal A. & N. Islands Dnclra & Ngr. Haveli Delhi • . Himachal Pradesh I •. M. & A. Islands Mnnipur. Nagalnnd N.E.F.A. Pondichorry Tripara
INDIA
2
975 4G4
1,2H7 99H 181 749 63
1,040 1,900
567 413 994 190
920
67 I
52 12 5
22 20
10,920
3
109 64 69
101 45
133 6
217 204 81 34
287 43
268
2
5
9 6
1,683
4
1,095 521
1,334 1,103
240 779
4 1,270 2,269
579 476 935 286
848
2
66 I
76 13 5
24 21
11,947
5
I24 69 74
107 56
147
243 224 78 40
276 4:;
273
2
9
9 6
1,7R2
6
116 28
168
23
581
so 97 4
141 27S
1,4S9 6!4
2
179 9
7
3,816
7
24 4
17
124
14 33
1 51 26
282 155
l
9\l 5
1
838
s
184 35
234
31 3
754 3
92 I69
10 205 288
1,583 758
2
198 19
7
4,575
9 IO 11 I2 13
32 6
20
2
159 1
18 49
I 75 31
310 185
I
106 5
1
1,002
I,224 560
1,541 I,099
250 882 774
I,257 2,198
778 452
I,473 537
1,771 I,957
3
27S S3 I
57 12
5 31 34
17,257
1,435 631
1,662 1,210
329 921! 917
1,517 2,603
875 527
1,491 650
1,893 2,064
3 2
304 92 1
S5 13 5
33 35
19,306
+ 211 + 71 + I21 + Ill + 79 + 47 + 143 + 260 + 405 + 97 + 75 + IS + ll3 + 122 + 107
+ 2 + 26 + 9
+ 28 + 1
+ 2 + 1
+17'2 +12•7 + 7•9 +IO·J +3I·fl + 5·3 +18·5 +20'7 +18·4 +12"5 +16•6 + 1'2 +21.0 + 6•!)
+ 5·5
+ 9·4 +10·8
+49·1 + 8·3
+ 6·5 +. 2·9
+2,049 +11·9

134
Table LVIU-Percentage of High & Higher
Percentage of High Schools :Managed by Percentage of
State/Territory Higher Secondary
Govern- District :Municipal Private Bodies Govern-District Munici-ment Boards Boards ,------J'----. ment Boards pal
Aided Un-aided :aoards
1 2 3 4 /; 6 7 8 9
Andhra Pradesh 7·7 73·8 3·7 14·5 0·3 19·5 38·4 7·4
Assam 2·0 80·7 17·3 41·5
Bihar 0·6 56·0 43·4 21·3
Gujarat 9·5 2·2 6·2 80·0 2·1
Jammu & Kashmir . 91·6 8·1 0·3 97·0
Kerala 29·7 0·3 68·5 1·5 '
:Madhya Pradesh 75·0 25·0 56·2 8·3 4·3
:Madras 4·9 48·8 5·0 40·2 1·1
:Maharashtra 6·4 1·2 1·4 87·6 3·4 28·2 6·4
:Mysore 13·1 11·.3 7·3 58·3 10·0 31·6 4·6 19·3
Orissa 16·5 1·2 49·8 32·5 54·5
Punjab 58·4 0·2 26·8 14-6 36·6
Raj~.tsthan 78·5 20·8 0·7 82·1
Ottar Pradesh 8·1 0·2 2·4
West Bengal 0·6 0·1 84·1 15·2 3·8 0·6
A. & N. Islands 100·0
Dadra &,Ngr. Haveli 100·0
Delhi 59·2 3·6
Himachal Pradesh 85·3 10·3 4·4 58·3 41·7
L. :M. & A. Islands 100·0
Manipur 9·4 4·7 74·1 11·8
Nagaland 84·6 15·4 .. N.E.F.A. 100·0
Pondicherry 72·7 27·3
Tripura. 48·1 51·9 62·5
INDIA 16·0 13·4 2·3 57·7 10·6 27·0 3·4 3·2

135
Stl{londary .Schools by Management
Schools Managed by Fercentage of High & Hgr. Sec. Schools Managed by
Private Bodies Govern- District Municipal Private Bodies State/Territory
ment Boards Boards ...------'~ Aided· Unaided Aided Un-aided
10 11 12 13 14 15 16
34·7 9·5 68·4 4·2 17·6 0·3 Andhra Pradesh
58·5 4·6 79·2 16·2 Assam
75·6 3·1 3·9 58·9 37·2 Bihar
9·6 2·2 6·1 80·0 2·1 Gujarat
3·0 92·1 7·6 0·3 Jammu & Kashmir
100·0 29·6 0·3 68·6 1·5 Kerala
27·3 3·9 56·3 8·3 4·3 27·1 4·0 Madhya Pradesh
100·0 5·0 48·6 5·0 40·3 1·1 Madras
61·8 3·6 7·4 1·1 1·6 86·5 3·4 Maharashtra
44·0 0·5 17·7 9·6 10·3 54·7 7·7 Mysore
36·4 9·1 17·3 1·1 49·5 32·1 Orissa
58·0 5·4 54·5 0·2 32·5 12•8 Pw1jab
16·0 1·9 80·3 18·5 1·2 Rajasthan
76·5 12·7 8·1 0·2 2·4 76·6 12·7 Uttar Pradesh
88·1 7·5 2·1 0•3 85•9 11•7 West Bengal
100·0 A. & N. Islands
100·0 Dadra & Ngr. Ha.veli
31·9 5·3 59·2 3·6 31·9 5•3 Delhi
78·3 18·5 3·2 Himachal Pradesh
100·0 L. M. & A. Islands
9·4 4·7 74·1 ll·8 Manipnr
8!·6 15•4 Nagaland
100·0 N.E.F.A.
72·7 27·3 Pondichcrry 37·5 51·4 48·6 Tripura.
59·:1 7·1 19·2 IO·;i 2·5 58·2 9·6: INDIA
136
'Jf Taking high schools and higher secondary schools, it will be seen that the number of higher secondary schools increased in all the States and Union Territories except A. & N. Islands and Tripura where the number remained
·stationary. The number of high schools, however, decreased in Madhya Pradesh Punjab, Rajasthan, West Bengal and Himachal Pradesh due to conversion of high schools into higher secondary schools. There was no change in the number of high schools in L. M. & A. Islands and N.E.F.A.
· The proportion of high and higher secondary· schools under different management in various States iS shown in table LVIII. So far as high schools are concerned, Government managed cent percent schools in Dadra Nagar Haveli, L. M. & A. Island land N.E.F.A. Apart from this the State of Jammu and Kashmir, Madhya Pradesh, Punjab, Rajasthan and Union Territories of Nagaland and Pondicherry reported majority of schools under government, local bodies schools predominated in Andhra Pradesh, Madras and Himachal Pradesh only. In the relllaining States of Assam, Bihar, Gujarat, Kerala, Maharashtra,Mysore, Orissa.and West Bengal and the Union Territories of Manipur and Tripura, majority of them were managed by private bodies. As far as the higher secondary schools were concerned, Government managed cent per cent schools in A. & N. Islands and a mg,jority of the~ in Jammu and Kashmir, Madhya Pradesh, Orissa Rajasthan and Delhi. Local bodies higher secondary schools predominated only in Himachal Pradesh and Tripura. In the rest of the States and Union Territories, private schools were in a majority.
PUpils
The number of pupils enrolled in high and higher secondary schools increased from 75, 11,514. (56,85,34.3 boys and 18,26,171 girls) to 84,29, 721 (63,4.0,682 boys and 20,89,039 girls) or by 12·2 percent during the year as compared to 11·1 percent in the previous year. Of the total, 53,67,7:29 (39,22,4.51 boys and 14,4.5,278 girls) were in high schools and 30,61,992 (24.,18,231 boys and 6,43,761 girls) were in higher secondary schools. The corresponding figures for the previous year were 50,15,178 (34,98,100 boys and 13,17,078 girls) and 24,96,336 and (19,87,243 boys and 50,90,093 girls). These gave percentage increase of 6·8 percent and 23·9 percent respectively as against 5 · 3 percent and 24. · 8 percent in the previous year. The tota~ enrolme1_1t for high and higher secondary schools referred to above also moludes (m that of high schools) an enrolment of 4,712 (3,3U boys and 1,368 girls) studying in post-basic schools. Further details of enrolment in post basic schools are given in Chapter IV.
The break-up of total enrolment in high and higher secondary schools managJd by differe1.t agencie~> is shown in table LIX below:-

Table LIX-Number of Pupils in High/Higher Secondary Schools by Management
Number of pupils in Number of Pupils in Total Number of Pupils in High and Higher Percentage High Schools Higher Secondary Schools Secondary Schools Increase(+)
or Decrease Management 1960-61 1961-62 (-)
1960-61 1961-62 1960-61 1961-62 Number Percentage Number Percentage
2 3 4 5 6 7 8 9 10
Government . 9,91,769 10,69,619 5,89,527 7,28,408 15,81,296 21·1 17,98,027 21·3 +13·8
District Board 5,02,885 5,77,763 57,803 80,903 5,50,688 7·3 6,58,666 7·8 +19·6
Municipal Board 1,78,498 1,71,014 98,704 1,25,079 2,77,652 3·7 2,96,093 3·5 + 6·6
Private Bodies-
Aided 29,61,972 31,99,144 16,05,511 19,75,318 45,67,483 60·8 51,74,462 61·4 +13·7 I-'
Unaided 3,79,604 3,50,189 1,54,791 1,52,284 5,34,395 7·1 _5,02,473 6·0 - 6·1 ~ -:J
Total 50,15,178 53,67,729 24,96,336 30,61,992 75,11,514 100·0 84,29,721 100·0 +12·5

The increase in enrolment was shared by institutions 1mder all manaD"ements except private unaided bodies. The enroh;nent increased by I· 38 pe~cent in . government schools, by I9 · 6 percent in district board schools, by 6 · 6 percent in municipal board schools and by I3·7 percent in private aided schools as compared to the corresponding figures of I3·6 percent, 14·8 percent, 8·5 percent and II· 6 percent in the previous year. The decrease in the enrolment of school managed by private unaided bodies was only 6 ·1 percent.
The number of pupils coming from rnral areas and studying in high and higher secondary schools increased from 34,26,662 (29,I5, 764 boys and 5,10,898 girls) to 39,50,796 (33,28,763 boys and 6,22,033 girls). This constituted 46·8 percent of the total number of pupils studying in all the high and higher secondary schools as compared to 45·6 percent for the previous year.
Table LX gives the number of pupils in high and higher secondary schools (high and higher secondary separately) in various States for the year I960-6I and I96I-62. Increase in. enrolment was reported by all the States and Union Territories. The highest increase in enrolment was reported among the States by Maharashtra (I,I6,9I6) followed by Uttar Pradesh (I,09,4I2), Audhra Pradesh (89,6I7), Kerala (86,268), Punjab (78,077) West Bengal (76,6IO) and Madras (70,350). In other States, the increase was less than 50,000, the least being of 8,980 in Jammu and Kashmir. Among the Union Territories, the highest and lowest increase was reported by Delhi (2I,284) and L.M. & A. Islands (17) respectively. On percentage basis, Punjab topped the list among the States with an increase of 22 ·I percent while Bihar was at the bottom with an increase of 9 · 5 percent. In Union Territories, the highest and lowest percentage increase was reported by A & N Islands (32· 3 percent) and L.M. & A. Islands (3 · 5 percent).
To have a correct appraisal of enrolment at high and higher secondary stages, it is necessary to eliminate pupils of primary and middle stages studying in high and higher secondary schools and include these reading in high and higher secondary classes attached to some of the colleges. Accordingly, table LIX gives the enrolment at high and higher secondary stage in different States dnring I960-6I and I96I-62. For inter-State comparison, the number of classes comprising the high and higher secondary stage, as given in the table XL should be kept in view. The number of pupils at high and higher secondary stage increased from 34,62,709 (27,76,3I4 boys and 6,86,395 girls) to 40,76,164 (32,24, 186 boys and 8,51,978 girls) yielding an increase of 17 · 7 as compared t.o 15·2 percent in the previous year. The enrolmel!t ip.creased in all the States and Union Territories except the Union territory of N. E. F. A. where the decrease was insignificant. The highest increase was reported by Maharashtra (1,29,473) and the lowest by Jammu and Kashmir (4,200) among the States while among the Union Territories, the highest and the lowest increase was reported by Delhi (14,228) and L.M. & A. Islands (14). On percentage basis the highest and lowest position was occupied by Mysore (43·0 percent) and Uttar Pradesh (4,o5 percent) in States. In Union Territories, excepting Dadra Nagar Haveli, which reported statistics for the first time, the highest increase was reported by Tripnra (58·0 percent) and the lowest by Pondicherry (11·1 percent).

Table LX-Number of Pupils in High and Higher Secondary Schools by States
In High Schooffi · In· Higher Secondary Schools Increase ( +) Total Decrease(-)
For Boys For Girffi For Boys For Girls ,.------A----. StatoJTcrritory Number Percent-
1960-61 1961-62 1960-61 1961-62 1960-61 1961-62 1960•61 1961-62 1960-61 1961-62 age
2 3 4 5 6 7 8 9 10 11 12 13
Andhra Pradesh 3, 71,135 3,99,403 55,256 57,063 1,07,276 1,59,291 19,514 27,041 5,53,181 6,42,798 + 89,617 16·2 AI! sam 1,81,143 1,96,069 25,367 26,795 18,805 23,942 3,200 4,359 2,28,515 2,51,166 + 22,651 9·9 Bihar 3,84,922 3,94,798 20,241 21,244 1,09,391 1,47,559 9,067 9,982 5,23,621 5,73,583 + 49,962 9·5 Gujarat 3,20,495 3,59,208 44,358 50,346 3,64,853 4,09,554 + 44,701 12·3 Jammu & Kashmir • 61,201 62,203 19,163 23,816 9,863 12,890 1,010 1,308 91,237 1,00,217 + 8,980 9·8 Kerala 5,93,597 6,66,131 96,855 1,10,333 256 6,90,452 7,76,720 + 86,268 12·5 Madhya Prade;h 14,814 688 679 2,08,285 2,61,614 54,308 64,367 2,78,086 3,26,669 + 48,583 17·5 ..... Madras 5,71,373 6,31,688 1,17,799 1,27,572 170 92 6,89,172 7,59,522 + 70,350 10·2 c..:> Maharashtra 6,46,613 7,39,304 99,592 1,09,711 62,537 74,024 9.442 12,061 8,18,184 9,35,100 +1,16,916 14·3
cg
Mysore 1,50,865 1,26,609 27,672 22,503 60,254 1,06,887 15,465 23,111 2,54,256 2,79,ll0 + 24,854 9·8 Orissa 91,800 1,02,178 6,128 7,057 2,572 4,413 575 521 1,01,075 1,14,169 + 13,094 13·0 Punjab 4,29,871 4,24,356 1,30,506 1,31,352 1,44,810 2,04,155 36,132 59,533 7,41,319 8,19,396 + 713,077 1(1·5 Rajasthan 84,402 1,15,969 11,770 13,244 93,961 1,02,148 8,798 11,1>27 1,98,931 2,42,888 + 43,957 22·1 Uttar Pradesh 7,64,203 8,51,404 1,47,874 1,70,085 9,12,077 10,21,489 +1,09,412 12·0 West Bengal , 2,91,354 2,70,086 90,889 93,615 3,19,601 3,95,644 76,831 95,940 7,78,675 8,55,285 + 76,610 9·8 A. & N. Islands 551 639 164 307 715 946 + 231 32·3 Dadra & Ngr. Haveli 200
1,29,o62 200 + 200
Delhi • . . 1,45,327 68,829 73,848 1,97,891 2,19,175 + 21,284 10·8 Himachal Pradesh 25,762 25,629 458 518 5,300 8,702 3,693 3,196 35,213 38,045 + 2,832 8·0 L. M. & A. Islands 486 503 486 503 + 17 3·5 Mo.nipur. 19,957 . 23,319 2,570 3,574. 22,527 26,893 + 4,366 19·4 Nagaland 4,136 5,455 4,136 5,455 + 1,319 31·9 N.E.F.A. 996 1,125 996 1,125 + 129 13·0 Pondioherry 6,902 . 8,299 3,915 4,252 10,816 12,551 + 1,735 16·0 Tripura . 7,866 8,983 2,271 2,530 4,227 4,540 736 1,109 15,100 17,162 + 2,062 13·7
INDIA 42,59,690 45,62,203 7,55,488 8,05,526 20,40,698 25,03,605 4,55,638 5,58,387 75,11,514 84,29,721 +9,18,207 11·2

Table LXI-Number of Pupils at High and Higher Secondary Stage
Boys Girls Total Increase ( +) Decrease(-)
State/Territory · 1960-61 1961-62 1960-61 1961-62 1960-61 1961-62 Number Percentage
1 2 3 4 5 6 7 8 9
Andhra Pradesh 1,64,793 1,81,929 31,391 35,888 1,96,184 2,17,817 + 21,633 +11·0 Assam 99,629 1,12,334 26,555 32,823 1,26,184 1,45,157 + 18,973 +15·0 Bihar 4,40,389 4,85,040 32,366 33,154 4,72,755 5,18,194 + 45,439 + 9·6 Gujarat 2,03,149 2,29,655 63,539 . 75,356 2,66,688 3,05,011 + 38,323 +14·4 Jammu & Kashmir 16,862 20,159 5,583 6,486 22,445 26,645 + 4,200 +18·7 Kerala 1,97,714 2,49,597 1,34,276 1,79,153 3,31,990 4,28,750 + 96,760 +29·1 Madhya Pradesh 1,06,625 1,22,050 17,855 21,582 1,24,480 1,43,632 + 19,152 +15·4 Madras 2,00,944 2,15,417 67,028 77,384 2,67,972 2,92,801 + 24,829 + 9·3 Maharashtra 3,62,425 4,63,705 1,13,557 1,41,750 4,75,982 6,05,455 +1,29,473 +27·2 ...... Mysore ... 1,59,508 2,23,453 45,855 70,267 2,05,363 2,93,720 + 88,357 +43·0 ~ Orissa 61,801 73,074 6,107 7,783 67,908 80,857 . + 12,949 +19·1 o· Punjab 1,40,"99 1,58,042 29,780 35,628 1,70,379 1,93,670 + 23,291 +13·7 Rajasthan 69,882 86,622 7,022 8,786 76,904 95,408 + 18,504 +24·1 Uttar Pradesh 3,19,475 3,44,583 37,983 42,568 3,57,458 3,87,151 + 29,693 + 4·5 West Bef.f:! • 1,72,651 1,84,145 45,553 52,682 2,18,204 2,36,827 + 18,623 + 8·5 A. & N. ds 168 209 63 119 231 328 + 97 +42·0 Dadra & Ngr. Haveli 160 40 .. 200 + 200 Delhi • • 35,790 43,350 16,150 22,818 51,940 66,168 + 14,228 +27·4 Himachal Pradesh 4,663 5,771 729 1,145 5,392 6,916 + 1,524 +28·3 L. lit & A. Islands 35 49 2 2 37 51 + 14 +37·8. ManiJ.ur • 11,416 13,873 2,562 3,544. 13,978 17,417 + 3,439 +24·6 Nag and 1,635 1,926 506 568 2,041 2,494 + 453 +22·2 N.E.F.A •• 228 238 32 21 260 259 1 -0·4 Pondioherry 2,112 2,339 659 739 2,771 3,078 + 307 +11·1 Tripura • 3,921 6,466 1,242 1,692 5,163 8,15!J + 2,995 +58·0
INDIA 27,76,314 32,24,186 6,86,395 8,51,978 34,62,709 40,76,164 +6,12,455 +17·7

PERCENTAGE OF TRAINED TEACHERS IN
HIGH./ HIGHER SECONDARY SCHOOLS 1961-62
NAGALAND
ASSAM
WEST BENGAL.
BIHAR
RAJASTHAN
ORISSA
MADHYA PRADESH
GUJARAT
MYSORE
MAHARASHTRI\
JAMMU & KASHMIR
UTTAR PRADESH
KERALA
ANDHRA PRADESH
PUNJAB
MADRAS
MANIPUR
TRIPURA.
DAORA & NAGAR HAVEU
N.E.F.A.
PONOICHERRY
HIMACHAL PRAOES11
L. M. & A. ISI..ANOS
A. & N. ISLANDS
OELHJ. ,, .•.
1\lJB( 1. )64Momdncation-13
100

141
Table LXII gives the proportion of the pupils in classes IX-X/XI to the population of the corresponding school-going age. It will be seen that 12·5 per cent of the entire population in the age group 14-17 were receiving instmction in the country as a whole. This average, however, varied from State to State and was exceeded in 8 States and 3 Union Territories. This percentage was the highest in Delhi {40·5 per cent) and the lowest in L.M. & A. Islands (2·6 per cent).
Co-education
Of the total number of 20,89,039 girls in high and higher secondary schools, 7,75,429 or 37·1 per cent were reading in schools for boys as against 36•4 per cent in 1960-61. Table LXffi shows the details of girls studying in boys' schools and girls' schools in various States. Except in Dadra, Nagar Haveli, L. M. & A. Island , Nagaland and N.E.F.A. where there "'ere no separate schools for girls, the highest percentage of girls under instruction in boys' schools was reported by Kerala {67·7 per cent). Next in order were Maharashtra {53·3percent), Gujarat {53·0 per cent), Himachal Pradesh(51·8percent), Assam {50· 8 per cent). In other States and Union Territorie.~, substantial pro- _ portion of girl students were under instruction in schools meant exclusively for them.
Teachers
The number of teachers in high and higher secondary schools rosr>, duringthe year under report, from 2,96,305 {2,33,958 men and 62,347 women) to 3,30,570 {2,59,289 men and 71,281 women). This gives a rise of 11· 6 per cent (10·7 for men and 12·7 for women teachers) as compared to 10·7 percent {10·2 percent for men teachers and 12·7 per cent women teachers) in the previous year. Trained teachers also increased from 1,84,962 to 2,12,597 or by 14·9 percent and constituted 64·3 percent of the total teaching staff. The corresponding proportion for the previous year was 64 ·1 per cent. The proportion of women teachers in the total number of teachers increased from 21· 0 per cent to 21· 6 per cent while that of trained "'omen teachers to total number of women teachers decreased slightly from 73 · 9 per cent to 73 · 2.
The number of teachers in post-basic schools included in high/higher ~econdary schools was 265. Further details are given in Chapter IV. .
Tab_le LXIV give the mm1ber of teachers in high and higher secondary schools m various States and Union Territories during 1960-61 and 1961-62. Increase in the number of teachers v.as shared by all the St-ates and Union Territories. Number of trained teachers also increased in all the States and Union Territories. Figures in Col. (12) show that efforts to train teachers could not keE)p pace with the increase in the number of teachers in the State of Assam, Bil~ar, Jammu & Kashmir, Kerala, Madras, Mysore, Orissa, Punjab, and the ~mo~ Territories of Dellii, Himachal Pradesh, Manipur and NEFA, excepting m Himachal Pradesh where the proportion of trained teachers to the total number of teachers decreased from 81· 3 per cent to 75 · 6 per cent. The fall in the percentage of trained teachers in these States and Union Territories was slight 11! 'B( )MMofi:duoatio~t-13(a)

142
, Table LXII_,_Educational Facilities for the Children for the Age-group 14-17
Enrolment in Classes IX and Percentage of enrolment in onwards classes IX and onwards to the
StatefTerritory population of the age group
14-17
Boys Girls Total Boys Girls Total
I 2 3 4 5 6 7
Andhra -Pradesh' 1,81;929 35,888 2,17,817 16·8· 23·4 10·1 r-:
Assam 1,12,334 32,823 1,45,157 32·9 10·2 21·9
Bihar- ... 3,40,749 21,356. 3,62,105 26·4 1·6 14·0
Gujarat .. 1,49,639 47,671 1,97,310 23·4 8·0 15·8
Jammu & K~~ir. , " 21,159. 6,486 27,645 19·1 6·2 12·5
Kerala· • 1,16,914 79,631 1,96,545 22·6 14·8 18·6
Madhya Pradesh 1,22,050 21;582 1,43,632 12·8 2·4 7·8
Madras. 2,15,417 77,384 2,92,801 21·2 7·6 14·4
Maharashtra • 3,00,975 90,647 3,91,622 24·4 7·8 16·4
Mysore • 1,47,586 42,915 1,90,501 20·1 6·0 13·2
Orissa 47,991 4,683 52,674 9·9 1·0 5·4
Punjab. 1,58,042 35,628 1,93,670 24·5 6·1 15·7
Rajasthan' 86,622 8,786 95,408 13·9 1·6 9·0
Uttar Pradesh 3,44,583 42,568 3,87,151 15'3 2·1 9·0
West Bengal • 1,84,152 52,682 2,36,834 15·4 5·0 10·9
A; & N.lslands 209 119 328 10·5 11·9 10·9
Dadra & Nagar Haveli 89 19 108 4·5 1·9 3·6
Delhi, 43,350 22,818 66,168 50·0 29·5 40·5
Himachal Pradesh- • 5,771 1,145 6,916 15·6 3·4 9·7
L.M. & A. Islands 49 2 51 4·9 0·2 2·6
Manipur 13,873 3,544 17,417 63·1 15·4 38·7
Nagaland· 1,926 568 2,494 17·5 5·7 Il·9
N.E.F.A. N.A N.A. N.A.
P6ndicherry 2,339 739 3,078 19·5 6·2 12·8
Tripura 4,644 1,692 6,336 14·5. 5·0 9·6
hrou. 26,02,392 6,31,376 32,33,768 19·6 5·0 12·5

143
Table LXIll-Girls in High/Higher Secondary Schools
Number of No. of Girls Total No. of Percentage of Girls in State/Territory Girls in in Girls' Girls Boys' Schools to
Boys' Schools Schools 'l'otal Number of Girls ,....
1960-61 1961-62
2 3 4 5 6
Andhra Pradesh 66,789 78,554 1,45,343 44·1 46·0
Assam 31,639 30,673 62,312 49·3 50·8
Bihar 11,621 30,975 42,596 25·1 21·3
Gujarat 56,524 50,050 1,06,574 52·2 53·0
Jammu & Kashmir 824 24,641 25,465 2·6 3•2
Kerula 2,25,175 1,07,235 3,32,410 69·4 67·7
Madhya Ptadcsh 12,434 61,501 73,935 14·5 16·8
l\ladrus • 96,917 1,23,595 2;20,51:1 42·7 44·0
~ltdmrashtra 1,34,779 1,18,263 2;;_)3,04:! 51·!) 53·3
My:;uro. 27,660 42,973 70,633 36·9 39·2
Ori~~u. 5,063 7,530 13,493 46·7 44·2
Punjab. 20,860 1,74,13! 2,03,994 13·5 14·6
Rajasthan 5,271 24,037 29,308 18·5 18·0
Uttar Pradesh 14,682 1,63,582 1,78,264 8·3 8·2
West llcngal . 32,387 1,88,385 2,20,772 13·0 14·7
A. & N. hlanW. 16 307 323 12·3 5·0
Dadra & Ngr. Havcli 40 40 100·0
llulhi 12,016 72,968 84,084 13·3. 14·1
llimndml Pradesh 3,980 3,703 7,683 47·6 51·8
L.M. & A. blamls 10 19 100·0 100·0
:\lanipur 2,510 3,~74: 6,084 42·1 41·3
Xagnlnnd 1,513 1,513 100·0 100·0
N.E.i•'.A. 227 227 100·0 100·0
l'uudichcrry 1,005 3,2Ul 4,296 19·4 23 4
Tripuru. 1,578 3,639 5,217 29·5 30·2
INDIA 7,75,4:::!!.) 13,13,61U 20,89,039 36·4 37·1

Table LXIV -Number of Teachers in High/Higher Secondary Schools
Percentage of Average num·
Men Women Total Increase Trained Teachers ber of
State}Territory (+) Number of Trained to Total Num- Students Decrease Teachers ber of Teachers per Teacher·
r- A...-----, (-) ~-1060-61 1961-62 1960-61 1961-62 1960-61 1961-62 1960-61 1961-6.2 1960-61 1961-62 1960 1961-
61 62 .
1 2 3 4 5 6 7 8 9 10 11 12 13 14
Andhra Pradesh 20,798 23,552 4,139 4,744 24,937 28,296 + 3,359 ,20,078 22,856 80·5 80·8 22 23
Assam 7.983 8,872 1,185 1,252 9,!68 10,124 + 956 1,437 1,607 15·7 15·9 25 25
Bihar . 16,607 17,763 1,0U 1,181 17,6!8 18.94! + 1,296 6,995 7,217 39·6 39·0 30 3o Gujarat 11,969 13,185 2,239 2,562 14,203 15,747 + 1,539 8,416 9,410 59·2 59·8 26 26
Jammu & Kashmir 2,76lJ 3.399 7;34 888 3,514, 4,287 + 773 2,369 2,86! 67·4 66·8 26 21
Kerala 16,581 18,714 10,273 11,679 26,854 30,393 + 3,539 20,188 22,272 75·2 73·3 26 23
Madhya Pradesh l'l,9il 12,757 2,759 3.244 13,730 16.001 + 2,271 6,529 8,065 47·6 50·4 ·20 20
Madras 22,053 N,739 7,064 8,110 29.117 32,849 + 3,732 26,787 30,107 92·0 91·7 24 23 -Mahard.sbtra. 24.969 28,436 8,131 9.278 33,100 37,714 + 4,614 20,886 2!,110 63·1 63·9 25 27 ~ ~
1\Iysore 8,544 9,395 2,090 2,290 10,634 11,685 + 1,051 6,373 7,272 6!·6 62•2 24 N Orissa. . 4,448 4,996 379 426 4,827 5,422 + 4,595 2,506 2,721 51·9 50·2 21 21 Punjab 16,701 17,096. 5,324 6,272 22,025 23,368 + 1.343 18,219 19,272 82·7 82·5 34 35 Rajasthan 8,266 9,915 1,156 1,2\JO 9,522 11,205 + 1,683 4,161 5,260 43·7 46·9 21 22 Uttar Pradesh 30,222 32,5.55 5,854 6,638 36.076 3},193 + 3,117 24,851 27,541 68·9 70"3 25 26 West Bengal 23,441 25,035 5,950 6,727 29,391 31,762 + 2,371 10,397 11,398 35·4 35·9 26 27 A. & N. Islands 37 50 9 9 46 59 + 13 39 55 84·4 93·2 16 11 Dadra. & Ngr.
Haveli N.A. 12 N.A. N.A. N.A. 12 + 12 N.A. 6 N.A. 50·0 N.A. 17 Delhi 0 4,487 5,061 3.343 3,916 7,830 8,977 + 1,147 7,386 8.382 .94·3 93·4 25 24 Himachal Pradesh 1,207 1,527 292 332 1,499 1,859 + 360 1,219 1,405 81·3 75·6 23 20 L.lii. & A. Islands 17 20 2 19 20 + 1 16 18 84·2 90·9 26 25 Manipur 757 987 49 62 806 1 ,0!9 + 243 ll6 125 14·4 ll·9 28 26 Nagala.nd 127 161 14 2ft 141 192 + 51 5 10 3·5 5·5 29 30 N.E.F.A. 64 70 14 14 78 84 + 6 47 49 60·3 58·3 13 13 Pondicherry 287 337 160 192 447 529 + 82 275 336 61·5 63·5 24 24 Tripura 562 653 126 146 688 799 + Ill 167 239 24·3 . 29·9 22 21
INDIA 2,33,958 2,59,289 62,347 71,281 2,96,305 3,30,570 +34,215 1,89,862 2,12,597 6i·l 6!·3 25 26

Expenditure
The total direct expenditure on· high and higher secondary schools increased from Rs. 68,9I,I7,389 to Rs. 79,11,85,207 or by I6·4 per cent all against 22 ·I per cent in the previous year. Of this total direct experditHie, Rs. 45,75, 71,335 were spent on high schools and Rs. 33,36,I3,f.7Z on higher secondary Bchools. The corresponding figures for the previoils year were Rs. 42,02,92,293 and Rs. 26,88,25,I06 r.espectively. The total direct expenditure ou high schools also includes au amoutlt of Rs. 5,I2,346 that was expended on post basic schools where detailed account has been given separately in Chapter IV. The percentage of total direct expenditure on higher secondary schools and post basic schools to the total direct expenditure on all the high and higher secondary schools was 42 · 4 per cent and 0 · I per cent respectively. The remaining 57 ·5 per cent was expended on high schools.
The distribution of direct expenditure on bigh and higher secondary schools (including post baRic schools) met from different sources of income is shown in_ table LXV. It will be seen that (a) numerically all sources except district board reported an increase in expenditure (b) government ftmds and fees accounted for more than fom fifth of the total expenditure; (c) the expenditure from govermuent ftmds increased by 22 ·2 percent, from municipal board funds by I2 · !) per cent, from fees by 8 · 9 per cent, from endowments by 6 ·I per cent and fromother sources by 9·3 percent while it decreased by 5·4 percent in case of district board funds.
The distribution of total direct expenditure on high and higher second~ry schools under different management : is given in table LXVI. Private schools whieh formed 68 per cent of the total number of high and higher secondary schools accounted for 6J · 7 per cent of the total direct expenditure on these schools. The share of the government and loJal bodies was only 24 · 0 per cent and 11· 3 per cent respectively.
Table LXVII compares the direct expenditure on high and higher secondary schools in different States and Union Territories during the years I960-61 and 1961-62. It "'ill be observed that the increase in expenditure was shared by all the Sh1tes and Union TelTitories. Among the States, the percentage increase was highest in Madhya Pradesh (34· 8) per cent, and the least in Pur jab (7 · 2 pcHcnt). While numerically, lHaharashtra reported the highest increase of (Hs. 1,-14,42,270) and Jammu & Kashmir the lowest increase of (Rs. 18,70,088). In the Union Territories, excepting Dadra Nagar Haveli which reported high and higher secondary schools for the first time, A. & N. Islands topped the list with •i percentage increase of 41·8 while Nagalauu was on the other end with a percmtagc increase of 11· 2. Numerically, DellLi reporteu the highest increase of Hs. 67,3 7,209 and L. M. & A. Islanus the lowest increa~e of Rs. 16,030.
ThP proportion of direct expewliture incun-ed ou high and higher secondarv H·hools to the tntnl direct expenditure on education as a whole is indicated i~ col. (11) of tahle L..\:.VII and reveals wide Y:!riations.

Table LXV-Direct Expenditure on High and Hlgher Secondary Schools by· Sources --··---
On High Schools · On Higher Secondary Schools On High and Higher Secondary Schools Sources ,..- .----..
1960-61 1961-62 ( "---. --"":""\ ,-----:-----"'-------.
Amount Percentage Amount Percentage Amount Percentage Amount Percentage
2 3 4 5 6 7 8 9
Government Funds 23,12,86,620 50·5 17,32,12,180 51-9 33,10,31,_894 48·0 40,44,98,800 G1·l District Board Funds 1,90,94,407 4"2 17,94,153 O·fl 2,20,74,336 3·2 2,08,88,560 . 2·7
Municipal Board Funds 59,63,018 1·3 53,61,606 1·6 1,00,31,805 1·5 1,13,24,624. 1·4 Fees 16,41,25,854 3,;.g 13,02,"!0,4'!3 39·0 27,03,94,333 39·2 29,43,56,347 37·2 Endowments 1,46, 74,530 3·2 63,75,953 1·9 1,98,46,084 2·9 2,10,50,483 2·7 Other Sources 2,24,26,906 4·9 1,66,19,-187 5·0 3,57,38,937 5·2 3,90,66,393 4·9 -Total 45,75,71,335 100·0 33,36,13,872 100·0 68,91,17,389 100·0 79,11,85,207 100·0
~ 10)··

Table LXVI-Direct Expenditure on High and Higher Secondary Schools by Management
On High Schools On Higher Secondary Schools
On High and Higher Secondary Schools
:Management 1960-61 1961-62
r------.A-1960-61 1961-62 1960-61 1961-62 Amount. Pf"rl-entage Amount Percentage
2 3 4 5 6 7 8 9
Government 7 ,6fi,!Hl, 7:12 8,37,77,147 8,25,04, 770 10,(i0,62,142 15,92,01,502 23·1 18,98,3!1,289 24·0
District Board.-.~ . 4,50,7!),232 5,32,67,290 45,22,406 77,77,158 5,05,01,638 7·3 6,10,44,448 7·7
JIInnicipnl Boards 1,on,:i3,869 1,M,80,736 92,2.3,42:? 1,24,53,617 2,51, 79,291 3·7 2,81,34,353 3·6
Private Bodies Aided 25,12,98,980 27,64,~3.1->3 15,58,60, 7118 18,78,24,702 40,71,59,778 59-I 46,42,67,855 58·7
Unaided 3,03,63,4 70 2,84,03,009 1,67,ll,7l0 1,94,96,253 4, 70,75,180 -6-8 4,78,99,262 6·0 ~ ~
Total 42,02,92,293 45,75,71,3~:) 26, 88, 25,106 33,36,13,872 68,91,17,389 100-0 79,ll,85,207 100·0

148
Table LXVII-Direct Expenditure on High
On High Schools .---- ---·-------"------ .......
St&tejTerritory For Boys For Girls
1960-61 1961-62 1960-61 1961-62
1 2 3 4 '5
Andhra Pr&desh 3,53,02,915 3,51, 75,026 49,35,635 50,85,225
Assam 1,41,48,496 1,68,91,029 22,76,686 25,48,757
:Bihar 2,16,07,921 2,15,16,624 14,81,340 17,90,336
Gujarat 3,06,24,489 3,50,08,051 46,90,125 57,86,539
Jammu & Kashmir 37,61,810 48,98,351 12,35,787 15,73,963
Kerala 3,71,03,132 4,19,26,773 59,83,6-U 73,79,581
Madhya Pr&desh 18,93,505 7,39,012 1,10,368
Madras 5,13,16,594 5,82,51,783 1,07,77,232 1,26,51,097
Maharashtra 7,43,25,046 8,59,33,344 1,36,53,838 1,48,29,356
Mysore . 1,46,18,054 1,33,11,665 23,06,897 21,70,808
Orissa 77,26,171 89,92,302 7,08,891 9,51,504
Punjab 2,69,21,944 2,49,88,583 71,29,648 71,63,829
Rajasthan 80,94,043 1,01,46,696 13,74,690 15,79,193
Uttar Pr&desh
West Bengal 2,36,20,9_62 2,13,84,611 66,22,639 73,34,494
A. & N. Islands
D&dr& & Nagar 13,454 II&ve,li
Delhi
Himachal Pradesh 21,60,735 23,96,162 52,297 62,656
L.M. & A. Islands 54,134 70,164
Manipur. 11,69,532 16,72,067 1,54,683 1,98,53-l
Nagaland 6,35,764 7,07,036
N.E.F.A. 1,82,069 2,50,210
Pondicherry 5,94,269 7,46,251 2,58,239 3,50,584
Tripur& 5,01,090 7,99,295 1,76,966 2,96,330
lliDU 35,63,62,681 38,58,18,549 6,39,29,602 7,17,.52, 786
·····--·-··---·--- ~-

149
and Higher Secondary Schools by States On Higher Secondary Sehools
,-For Boys
-------... For Girla
1960-61 1961-62 1960-61 1961-62 StatejTerritory
II 7 8 9
1,14,47,992 1,64,31,743 20,29,554 28,25,a;;;; Andhra Pradesh
22,58,750 30,03,050 3,45,850 5,22,031 Assam
75,58,434 1,05,16,669 10,63,816 11,72,129 Bihar
Gujarat
12,74,836 15,96,735 80,127 1,53,599 Jammu & Kashmir
54,115 Kerala
2,27,03,922 3,27,63,634 59,45,003 78,21,954 Madhya Pradesh
73,144 20,749 1\Iadras
72,46,851 85,48,227 10,70,403 14,27,481 1\faharashtra
54,43,939 99,67,174 14,59,265 22,73,946 lllysore
2,84,252 6,33,056 70,030 87,119 Orissa
82,40,967 1,18,01,736 29,17,204 45,09,395 Punjab
1,36,98,768 1,60,5.=J,056 15,36,994 20,19,889 Rajasthan
7,92,84,527 8,57,46,510 1,54,39,644 1, 75,71,990 Uttar Pradesh
3,58,01,936 4,40,89,318 96,80,478 1,10,96,627 West Bengal
1,31,947 1,81,066 57,977 88,174 A. & N. Islands
Dadra & Nagar Haveli
2,03,98,065 2,49,86,871 98,44,154 1,19,92,557 Delhi
4,97,336 9,67,446 2,39,144 3,13,320 Himachal Pradesh
L.JII. & A. Islands
1\fanipur
Nagaland
N.E.F.A.
Pondicherry
5,73,464 6,56,801 1,39,471 1,45,200 Tripura
21,68,4;;,992 2fi,S9,7~,~.ll 5,19,79,114 6,46,41,521 INDIA

150
'l'able LXVU-Direct Expeu.diture on High ~t .• 1.4-~-------~----
StatejTertitory On High and Higher Secondary ~chools
r--- --------A----.---. 1960-61 1961-62
10 11 ·----- --------
Andhra Pradesh 5,37,16,096 5,95,17,349 Assam 1,90,29, 782 2,29,64,867 Bihar 3,17,11,511 3,49,95,758 Gujarat • 3,53,14,614 4,07,94,590
Jammu & Kashmir 63,52,560 82,22,648 Kerala 4,30,86, 773 4,93,60,469
Madhya Pradesh 3,06,52, 798 4,13,24,660 Madras 6,20,93,826 7 ,09,!!6, 773 Maharashtra 9,62,96,144 11,07,38,414 Mysore .• 2,38,28,155 2, 77,23,593 Orissa 87,89,350 1,06,63,981 Punjab . 4,52,09, 763 4,84,63,543 Rajasthan 2,47,04,495 3,07,00,834
Uttar Pradesh 9,47,84,171 10,33,18,500 West Bengal . 7,57,26,015 8,45,05,050
A. & N. Islimds 1,89,924 2,69,240 Dadra & Nagar
Haveli 13,454 Delhi 3,02,42,219 3,69, 79,428
Himachal Pradesh 29,49,512 37,39,584
L.M. & A. Islands 54,134 70,164 Manipur, 13,24,215 18,70,601 Nagaland. 6,35,764 7,07,036 N.E.F.A. 1,82,069 2,50,210 Pondicherry 8,52,508 10,96,835 Tripura 13,90,991 18,97,626
~ " .
INDIA 68,91,17,389 79,11,85,207
lnl'rea"e (+) Decrease (-)
r . ..;.......;.:.----A.------, ·Amount Percent~>ge
12 13 ·---------- --
+ 58,01,253 +10·8 + 39,35,085 +20·7 + 32,84,247. +10·4 + 54,79,976 +15·5
+ 18,70,088 +29·4 + 62,73,696 ·+14·6
+ 1,06, 71,862. +34·8 + 89,02,947 +14·3 + 1,44,42,270 +15·0 + 38,95,438 +16·3 + 18,74,631 +21·3 + 32,53,780 + 7·2 + 59,96,339 +24·3
+ 85,34,329 + 9·0 + 87,79,035 +ll·6
+ 79,316 +41·8
+ 13,454 N.A. + 67,37,209 +22·3
+ 7,90,072 +26·8
+ 16,030 +29·6 + 5,46,386 +41·3 + 71,272 +•1·2 + 68,141 +37-4 + 2,44,327 +28·7 + 5,06,635 +36·4
+ 10,20,67,818 +14·8
----·

151
and Higher Secondary Schools By States-contd.
Percentage of Expenrlit•Jre (lnrll-62) on Righ nnd Average annul\) Higher Sc:-ondary SC"hoooh mel. from cost per pupil in
Perc en. High & Higher tage Ho"ondary of Sclnol~
Expendi- ,..----A-------, State/ ture Govt. District Munici- Fees Endow- Other 1960-61 1961-62 Territory on F.1ruls Roar<l pal ment' SOllf<'CS
Secon- Funrls Board dary Funds
Schools to total
Direct Expendi-
ture on 'Educa-
tion in
1961-62
14 15 16 17 18 19 20 21 22
Andhra Prac -27·7 53·3 5·5 2·6 35·2 3·2 0·2 97·1 92·6 desh 29·3 60·4 o·-o 0·1 35·3 3·4 0·8 83·3 91·4 Assam 21·2 29·2 60·7 2·1 8·0 60·6 61·0 Bihar· 24·0 50·1 0·4 0·6 38·7 2·4 7·8 96·8 99· 6 Gujarat
Jammu& 35·2 91·1 4·8 0·2 3·9 69·6 82·0 Kashmir 28·6 81·3 0·0 16·5 0·1 2·1 62·4 63·5 Kerala
20·4 72·2 1·1 1·9 14·7 1·8 8·3 110·2 126·5 MadhyaPra-
desh 27·5 51·6 17·1 4·4 18·8 6·9 1·2 90·1 93·5 Madras 28·1 M·O 0·2 0·3 54·6 1·1 8·8 117·7 118 · 4 Maharashtra 17·9 62·9 2·9 3·6 19·6 1·1 9·9 93·7 99·3 Mysore 19·0 53·3 0'6 31·2 7·4 7'5 87·0 93·4 Orissa 31·5 59·3 0·0 0·2 32·2 5·4 2·9 61·0 59·1 Punjab 26·4 80·5 0·0 12·5 5·5 1·5 124·2 126·4 Rajasthan
Uttar Pra-29·3 42·1 0·0 0·8 49·9 1·0 6·2 103·9 101·1 desh' 30·6 34·1 0·0 0·0 58·2 2·7 5·0 97·2 98 · 8 West Bengal
A. & N. 3-1·6 100·0 265·6 421·3 Islands.
31·1 100·0 Dadra &·Ngr.,
137·4 Haveli 38·3 61·6 5·9 26·9 1· 7 3·9 132·8 168· 7 Delhi
33·0 6-1·9 29•3. 4·8 0·6 Himachal
0·4 80·8 98·3 Pradesh. L.M. & A.
23·4 100·0 111·4 139·5 Islands 20·5 2·3 75·1 0·2 14·7 7·7 0·0 58·8 69 · 6 !Irani pur 18·4 90·7 3·2 3·5 2'6 158·7 129· 6 Nagah!nd 18·6 100·0 182·8 222·4 N.E.F.A. 22·7 67·9 27·6 4·5 78·8 87 · 4 Pondicherry 19·1 88·8 8·8 2 '1 0·3 92·1 l!O· 6 Tripura
27·0 51·1 2·7 1·4 37·2 2·7 4·9 91·7 93·6 INDIA

152
Table LXVIll-Results of Matriculation/Higher
Number appeared in
Matriculation and Higher Secondary and Stat~/Terri. Equivalent Examination Equivalent Examination ·
tory
Boys Girls Total Boys Girls Total
1 2 3 4 5 6 7
Andbra Pra-desh 52,555 8,568 61,123 36,198 5,868 42,066
Aasam 21,049 5,921 26,970
Bihar 1,03,122 6,204 1,09,326 8,832 608 9,440
Gujarat 80,941 21,320 1,02,261
Jammu & Kashmir 7,657 2,281 9,938 849 56 905
Kero.la • 92,525 65,997 1,48,522 42 14 56
Madhya Pra· desh • 21,7ll 3,073 24,784 33,582 5,087 38,669
Madras. 79,865 21,765 1,01,630
Maharashtra , 1,87,683 47,641 2,35,324 11,089 1,324 12,413
Mysore • 78,783 20,303 99,086 2,026 56 2,082
Orissa 18,656 1,494 20,150 303 62 365
Punjab. 93,732 26,342 1,20,074 15,318 2,981 18,299
Rajasthan 38,728 4,683 43,411 8,727 744 9,471
Uttar Pradesh 2,17,444 24,615 2,42,059
West Bengal', 85,712 27,199 1,12,911 23,278 5,189 28,467
A. & N. Islands 15 15 40. 14 54
Dadra & Ngr., Haveli 15 2 17
Delhi ·• 450 180 630 9,253 3,904 13,157
Himachal Pra· desh • 1,659 117 1,776 242 191 433
Manipur 3,ll2 527 3,639
Nagaland 293 43 336
N.E.F.A. 46 3 49
Pondioherry . 844 283 1,127
Tripur& 2,232 734 2,966 455 158 613
INDIA 11,88,829 2,79,295 14,68,124 1,50,234 26,256 1,76,490

153
Secondary and Equivalent Examinations
Number Passed in Pass Percentage -A. ·-~r--
Matriculation and Equivalent Higher Secondary and . Matricu]a. Hr. Sec. Examination · Equivalent Examination tion & Examina- State{
Equivalent tion Territory ,..--___,________, Exam.
Boys Girls Total Boys Girls Total
8 9 10 11 12 13 14 15
Andhra Pra-
22,390 3,606 25,996 10,949 2,276 13,225 42·5 31·4 desh
8,726 2,235 10,961 40·6 As;am
44,870 3,728 48,598 3,802 343 4,145 44·5 43·9 Bihar
31,271 8,880 40,151 39·3 Gujarat
Jammu & 3,680 1,204 4,884 380 24 404 49·1 44·6 Kashmir
37,713 20,132 57,845 5 6 38·9 10·7 Kerala
Madhya Pra-5,529 991 6,520 24,647 4,030 28,677 26·3 74·1 desh
29,875 9,382 3 ,257 38·6 Madras
1,09,986 29,726 1,39,712 4,776 777 5,553 59·4 44·7 Maharashtra
31,490 8,287 39,777 455 14 469 40·1 22·5 Mysore
9,450 904 10,363 180 41 221 51·4 60·5 Orissa
47,889 14,008 61,897 8,661 1,858 10,519 51·5 57·5 Punjab
18,307 2,305 20,612 3,363 378 3,741 47·5 39·5 Rajasthan
92,518 15,708 1,08,226 44·7 Uttar Pradesh
2~.538 8,702 37,240 13,129 3,469 16,598 33·0 58·3 West Bengal
15 11 26 6·7 48·1 A. & N. Islands
4 5 29·4 Dadra & Ngr.,
Haveli
275 119 394 6,197 2,695 8,892 62·5 67·6 Delhi
Himachal 1,000 68 1,158 162 105 267 65·2 61·7 Pradesh
777 108 885 24·3 Mauipur
13(\ 21 157 46·7 Nngnland
!!0 2 22 «·9 N.E.F.A.
255 100 355 31·5 Pondicherry
627 297 924 241 90 331 31·2 52·8 Tripura
5,25,426 1,30,514 6,55,940 76,962 16,112 93,074 44·7 52·7 lBDIA

154
The percentage of expenditure met from different sources of income are given in cols. (15) to (20) of table LXVII. Government met cent pet cent expenditure in A. & N. Islands, Dadra, Nagar Haveli, L. M. & A. Islands and N.E.F.A. The contribution from government-funds was more than one-half ill descending order in .Jammu & Kashmir (91•1 percent),Nagaland (90·7 percent),Tripura (88·8 percent),. Kerala !81·3 percent), Rajasthan (80·5 percent). Madhya Pradesh (72·2 per cent), Pondicherry (67·9 percent), Mysore(62·9 percent), Delhi (61·6 percent), Assam (60·4percent), Punjab(59·3percent), Andhra Pradesh and Orissa (53·3 pE>rcent each); Madras (51·6 percent) andGujarat (50 •1 per cent). The contribution of local bodies was significant only in Himachal Pradesh (94•2 percent) and Manipur (75·3 percent). Foos accOlmted for more than 50 percent in Bihar (60·7 per cent). West Bengal (58,2 percent) andMaharashtra (54·6 ·percent) only. The sharo.~, of endowment and other sources varied from 1·0 percent in Himachal Pradesh to 14·9 per cent in Orissa.
The average. annual cost per pupil under instruction in high and higher secondary schools increased from Rs. 91· 7 to Rs. 93 · 6. Its distribution over different· sources of income was· government funds Rs. 4 7 · 9, district board funds Rs. 2 · 5,. Municipal board funds Rs. 1· 3, fees Rs, 34 · 8, endowments Rs. 2 · 5; and other sources Rs. 4 · 6. Cols. (21) and (22) of table LXVII indicate the. Statewise: details of the average annual cost per pupil during 1960-61 and 1961-62. The all-India average for 1961-6':!, was exceeded in 7 States and 8 Union Territories.
Examination Results
During th'e year 14,68,124 pupils (11,88,829 boys and 2,79,295 girls) appeared at the Matriculation and.equivalent examinations, of which 6,55,940 pupils (5,25,426 boys and 1,30,514 girls) qualified. This gives a pass percentage of 44 · 7 as against 43' 8 per cent in the previous year. The figures given above include private candidates-also. The number of students who appeared at the higher secondary and equivalent examinations was 1,76,490 (1,50,234 boys and 26,2M:girls); of which 93,074 (76,962 boys and 16,112 girls)• qualified yielaiug a pass percentage of 52· 7 per cent; Table LXVIII gives the details of the examination results in different states and Union Territories.
Free Studentship, Scholarships and Stipends
Out of'84,29,721 pupils (63,4.0,682 boys and20,89,039 girls), in high and higher secondary schools as many as 12,95,69T pupils (10,09,661 boys and 2,86,036 girls) were receiving free education and the amount foregone on their account came to Rs. 5,66,97,823,· In addition to this 4,49,869 pupils (3, 76,304 boys and 73,565 girls) received scholarships and stipends of the total value of Rs. 3,25,92,538 and 11,36,680 pupils (8,84,062 boys and 2,52,618 girls) received financial concession 'lf the value of Rs. 5,07,94,582.

CHAPTER VI
UNIVERSITY EDUCATION
Main Developments at the Centre
In the field of higher education, the Government of India is responsible for the maintenance of the Central Universities-Aligarh, Banaras, Delhi and Visva-Bharati. It is also responsible for the co-ordination and maintenance of standards in higher education and it is for this purpose that the University Grants Commission was constituted in 1953. In addition to these constitutional obligations, the Government ofindia gives grants-in-aids to State Governments and voluntary organisations for the development of higher education and ope• rates several programmes of international co-operation for the development of higher education in India. It also conducts significant pilot. projects in higher education of which the most important is that of Rural Institutes.
A. CEN'lRAL UNIVERSITIES
2. University of Dalhi-The following are the principal developments during the year under report:
(a) Introduction of Cqrrespondence Courses-With a view to enabling the University of Delhi to conduct correspondence courses and to confer degrees or diplomas on persons who pursued a course of study by correspondence, a bill to amend the Delhi University Act, 1922, was introduced in the Lok Sabha and was passed by both Houses of Parliament. It was brought into force with effect from 1st February, 1962.
(b) Opening of New Colleges-Two new colleges, namely the Sri Venkateswara College and the W.A.F. Memorial Shivaji College were opened in July 1961 to meet the increasing demand for admissions
(o) The Delhi School of Soaial Work-This has been taken over by the Delhi University and is being run as a. university-maintained institution with eff<~ct from April, 1961.
(d) New Departnumt of Modern India11 Languages-A new Department of Mod~rn Indi~~ _Languages has been created in the University. It p~ov1des facihttes for the teaching of Bengali, Punjabi, Sindhi, Tamil, Telugu, Kanada, Malayalam, Gujarati and Marathi.
(e) New Courses-The new c?urses instituted in the University during the yea~ are: _(1) ~ Certificate Course in Spanish, (2) A Certificate Coru;se Ill GuJarat~, (3) A Certificate Course in 1\Iarathi, and (4) A Certificate Course m Translation (English-Hindi).
155

156 ,.., S. Aligarh Muslim University-The following are the main developments
during the year under report!
(a) Aligarh Illuslim University Enquiry Committee-The Aligarh Muslim University Enquiry Committee submitted its Report to the University in December, 1960. All the recommendations of the Enquiry Committee have since beeo accepted by the E:..:ecutive Council of the University which has set up an Implementation Committee to ensure that quick effect is given to them.
(b) Medical College-The University scheme for the establishment of a. medical college has been approved by the authorities concerned and ordinances for the purpose have also been framed. The posts required for the college have been. sanctioned.
(c) Education Department-In addition. to its regular in-service activities the Department organised an intensive project on the teaching of English in order to work out, with the help of classroom teachers, the best and most ·effective methods of teaching English to the VI, VII and VIII classes, without uhanging the prescribed textbooks.
4:. Banaras Hindu University-The following are the main developments during the year under report!
(a) Long-Term Legislation for Banaras Hindu University-A bill further to amend the Banaras Hindu University Act, 1915, was introduced in the Lok Sabha in May, 1961. However, due to other important items of business and for certain other reasons, the Bill could not be taken up for consideration.
(b) New Departments-The President, in his capacity as the visitor of the University, has approved the University's proposals for the creation of the following three additional departmentsl-
1. Department of Indian. Languages. 2. Department of Foreign Languages. S. Department of Geophysics.
(c) Institute of Nuckar Sciences-Proposals to start an Institute of Nuclear Sciences are under consideration. A committee of the Atomic Energy Commission has already visited the University in this con· nection.
5. Visva Bharati-The following are the main developments during the year:
(a) Amendment of the Visva-Bharati Act,l951-With a view to removing certain lacunae in the Visva-Bharati Act, 1951, a Bill to amend the Act has been passed by both Houses of Parliament and has received the President's assent.
(b) Creatiqn o.f New Departments/Courses-On the recommendation _of the Siksha Samiti (Academic Council) three new courses of studies

157
have been introduced from the 1961-62 academic session; (i) B.Sc. Honours in mathematics with physics and chemistry as subsidiary subjects; (ii) B.A. Honours in ancient Indian history and cult~e; and (iii) M.A. in history. A one-year preparatory course of s~dies in arts subjects, intended for those who passed the school certificate or its equivalent examination after completion of the ten-year school course, was also introduced at the Siksha Bhavan, for two years only with effect from July, 1960.
(c) Reorganisation of Studies-A four-year diploma course in music and dance was introduced at the Sangeet Bharana in place of the threeyear intermediate course followed by a two-year degree course in music and dance. The courses of study at the Kala Bhavana leading to the four-year diploma and two year certificate in fine arts and artistic handicrafts were also r.eorgan ised.
(d) Projects Undertaken and Executerl-Satisfactory progress was maintained throughout the year in the implementation of the Watet:_ Supply Scheme sanctiored by the University Grants Commission at an estimated cost ofRs. 18lakh.
The Ministry of Food and Agriculture, Government ofindia, presented to the University the deep tube-well which the Exploratory Tubewells Organisation had sunk at Santiniketan. This enabled the Water works to function from May, 1961.
Construction of the Rabindara Art Gallery w hicb was undertaken in the beginning of 1960 progressed satisfactorily. The building was ready for occupation during the Poet's Birthday Centenary Celebrations in May, 1961. A hobby workshop building was constructed and the extension of the Pearson Memorial Hospital was completed.
B. INSriTUTIONS OF ALL-WDIA IMPORTAN·JE W EDUCATION
6. Jamia Millia Islamia-The Jamia Millia Islamia, New Dellii, is one of the national educational institutions in receipt of grants from the Central Government on a 'cover-the ddicit' basis. It pro~ ides education from the nursery to the graduate level in additon to maintaining a Teacbets' College and a Rum! Institute.
Recently the University Grants Commission agreed to recognise for a period of three years in the first instance, the B.A. and B.Ed. degrees <~f the Jamia, subject to satisfactory arrangements beina made for the administrative and ~ademic set-up.
0
7. Assistance to All-India Institutions of Higher Iducation-In the Central sector, the Ministry of Education has included a scheme under the third Five year Plan for assistance to all-Iwlia institutions of hiaher education. This is l\ continuing scheme from the Second Plan and grants ~der it are paid to nonaftiliatetl institutions of higher education that are recommended for assistance by the Advisory Committee headed by Shrimati Kamaladevi Chattopadhyay. ~!fB( Jl)5i1!ofl'dn-I4a

The Advisory Committee has recommended the follo"l\'inO' inRtitutions for assistance under the scheme:
0
(1) .Vidya Bhawan Society, Udaipur, (Rajasthan). (2) Lok Bharat, Sanosara (Gujarat). (3) Kaivalyadham Shreeman Madhava Yoga Mandira SJ.miti, Lona.vala,
Poona (Maharashtra). (4) Gujarat Vidyapeetb, Ahmedabad, MJ.harashtrl.. (5) Kashi Vidyapeeth, Varanasi (U. P.). (6) Gurukul Kangri, Hardwar (U. P.). (7) Kanya Gurukul Mahavidyalaya, Debra Dun. (U. P.). (8) Gurukul Vishwavidyalaya, Vrindaban (U. P.). (9) Institute of Oriental Philosophy, Vrindaban (U. P.).
(10) Sri Aurobindo International Centre of Education, Pondicherry.
Of these, the Kanya Gurukul, Dehra Dun and the Kashi Vidyapeeth, Varanasi were given grants amounting toRs. 53,000 and Rs. 80,000 respectively d_uring the year 1961·62. In addition, the Ministry has agreed in principle to g1ve a non-recurring gram; of Rs. 1,00,000 to the Kashi Vidyapeeth for the construction of additional clas~rooms.
8. Imlian Sch()-·1 of International Studies-On the advice of the University Grants Commission, the Ministry has declared that the Inrlian School of International Studies, New Delhi, which is an institution for higher education, shall be deemed to be a university for purposes of the University Grants Commission Act.
9. Gu7tlkul Kangri VishWl •idy-lhya-The adviceofthe University Grants Commission that the Gurukula Kangri Vishwavidalaya may be deemed to be a UD.i.versity in terms of the University Grants Cvmmission Act, is under the consideration of the Ministry.
10. Kas"1i Vidywzet:1.-A visiting committee under the chairmanship of Shri Jayaprakash Narayan was appointed to study the working of the Kashi Vidyapeeth, Varanasi, and to report to the G)vernment the desirability or otherwise of declaring it as an institution of national importance. The com nittee has since submitted its report which is under the consideration of the University Grants Commission.
11. Gujl.1.'at Vidylp~Jth, Ahm 1da.bad-The Government of India has appointed a visiting committee for this institution under the chairmanship of Dr. M. S. Mehta, Vice-Chancellor, Rajasthan University. The terms of reference for the Committee are the same as for the committee on Kashi Vidyapeeth. The committee has since submitted its report which is under consideration.
12. Gil ukul K:mgl'i, Hlrdw.u-The GJvern'Ilant of India have fixed the maintenance grant to the Gurukttl Kangri, Hardwar, at R3. 1,11,200 per annum for 1961-62 and 1952-63 or till the institution acq11ires a university status under the U.G.C. Act . .
15\)
13. Committ~e on 2~cognition of D:plom,,s of Sri An ·o':Jindo Intsrnational Centre of l ducation-A committee was appoint<:>d to examine the question of recognition of diplomas of Sri Aurobindo International Centre of Education, Pondicherry. On the basis of the report submitted by the committee the Ministry of Home Affairs is considering, in consultation with the UP.S.C., the question of recognition of the 'Higher Course' of the Centre as equivalent to the B.A., B.Sc. degrees of Indian tmiversities for purposes of employment in posts tmder the Central Government
C. UNIVERSITY GRfu."fr3 COl'IL."'IISSION .
14. Programme:·--Duringtheyear linder review a series of meetings were arrangecl between the University Grants Commission and the representatives ofthe State Governments and the State universities to find out how development schemes of a reasonable size could best be implemented.
The following schemes were proc ssed-
(a) Library buildings at the Universities of Vikra.m Mys0re, Utkal 1\Iarathwada and Jabalpur and the Indian Institute of Science, Bangalore, were approved at a total cost of Rs. 55 lakh;
(b) The Universities of Aligarh, Baroda, Calcutta, Gujarat, Kerala, l\Iysore, Osmania, Panjab, Poona and Sanskrit University Varanasi,were selected for assistance in the matter of collecting, preserving and utilising manusnipts;
(c) Allocations were made to alltmiversities for the purchase of library books and journah and building up of textbook libraries to meet the gener>tl needs of teaching and research, both in the humanities and sciences;
(d) Allocations were made to ali universities for scientific equipment to meet their general needs of teaching ancl research;
(e) Approval was given to the estahlishment and improvement of printing, presses at the Uuiversitif's of Calcutta,, Sri Venkatesw~Lra, Jammu and Kashmir, and Bmd'Wan at a cost of Rs. 6,60,000;
(f) GnE'st houses and staff:' clubs for the Visvahharti, Delhi and Raja8than Universities were approved at a cost of Rs. 6,GO,OOO;
(g) Tagore Chairs were established at the Uaiversities ofBombav, Baroda, Calcutta, D<•lhi, Kerala, :t.bdra.s, Nagpur, Panjab and Rajasthan; and Tagcre Lccturerships were imtituted at the Universities of Allahabad, Annamalai, l\Iarathawada, Mysore and Poona;
(h) University ho~tels for women at the Universities of Patna, Osmania, Kcrr.la, Bihar, Nagpur, Gujarat anrl Burdwan, and those for men at Saugar, \Valtair, Bihar ancl Burdwan were approved at a total <'OSt of Rs. 45 lakh:
(i) Staff quarters at Gorakhpnr. Burtlwan, Baroda. Visva-Bharti, Sri VenkatE'swam and Amlhra UniYcr:>itic·s were san tioncd at a total cost of Rs. 3·1 lakhs:

HiiJ
(j) Gandhi Bhavans are coming up at Allahabad, Delhi, Nagpur, Panjab and Rajwthan Universities and proposals for their establishment in Universities of Kerala, Karnatak, Mysore, Andhara, Aligarh and Jammu and Kashmir have been accepted.
(k) The centenary buildings at Calcutta, Bombay and Madras Universities are progressing satisfactorily and some of them are nearing completion ;
(l) A medical college for the M.B.B.S. degree has started functioning at the Banaras Hindu University;
(m) Assistance to the Gauhati University under the three-year degree course is being given;
(n) .A scheme to utilise, at university centres, services of scientists and teachers of established repute (who are active even after superannuation) both for research and teaching work (normally up to 65 years) has been accepted;
(o) A scheme for holding research seminars and summer schools and institutes under the Commission's auspices on a larger scale than hith4>rto has been drawn up.
For the development of science, apart from schemes begun or sanctioned in the Second Plan period, certain specific schemes mentioned below have been approved 1
(a) Establishment of new departments of postgraduate studies in geography and statistics at the University of Mysore;
(b) Development of various science departments at Burdwan University;
(c) Creation of a. Chair after the name of Dr. Sir M. Visvesvaraya ab Mysore University ;
(d) Assistance to the Universities of Gujarat, Delhi, Kerala. and Utkal for holding workshops and summer schools in specialised topics and · for convening annual sessions of learned societies;
(e) Assistance to postgraduate affiliated colleges for the development of postgraduate studies in basic science subjects (Schemes already sanrytioned include the development of the Department of Zoology at B. R. College, Agra, and the Department of Chemistry at Madurai College, Madurai);
(f) Development and maintenance of Ionospheric Field Station at Haringhatta in the Calcutta University;
(g) Sanction of grants for the introduction of the five-year integrated course in engineering colleges;
(h) Further development of the Department of Engineering at the Annamalai University ;
(i) Grants for the improvement of the standards of instruction at the College of :Mining and Metallurgy at Banaras Hindu Universi~y;

161
(f) Development of instructional fac~tie~ ~ industri~l management. and · business management at the Umvers1t1es of Delhi, Bombay, GuJarat
and Madras; (k) Opening of full-time and part-time c_our~s in business management
at the Universities of Bombay, Delhi, GuJarat and Madras; (l) Development of additional facilities at the School of Architecture at
Madras University for conducting a five-year integrated course; (m) Development of the Departmerot ~f Applied Geology at ~he Univer
sity of Saugar in accordance With the recommendatwns of the Joint Committee of the University Grants Commi~sion and the AllIndia Council for Technical Education for the development of facilities in geology and applied geology;
(n) Establishment of a polytechnic at the Annamalai University; and (o) Establishment of some advanced centres of study in the universities
of Bombay Calcutta, Delhi, Jadavpur, Madras, Poona and Saugar. The Commission has formulated a policy for the payment of grants to
wards the development of post graduate education in science subjects in affiliated colleges and necessary grants have been sanctioned to a number of · colleges.
15. Scales of Pay_:_ With effact from 1st April 1961, the scales of pay of teachers in the Central universities have been revised as follows:-
Professors Rs. 1000-50-1500 Readers Rs. 700--40-1,100 Lecturers Rs. 400-40-640-E.B.
--40--800 These scales have been communicated to the State universities for their
guidance and if they decide to effect a similar reform, assistance up to 80 per cent of the increased expenditure would be given b} the Commission. A number of universities have sent in proposals on this subject which are now being examined.
Assistance towards upgrading the salaries of college teachers, in accordance with the scales of pay approved during the Second Plan,· has been promised to those colleges which could not adopt the reform earlier but would like to introduce it now. The assistance, however, will be limited to the period of the Third Plan only.
The scales of pay and allowances of the non-acade1nic staff of universities h~v~ been revised on the lines of the recommendations made by the Pay CommiSSIOn for the employees of the Central Government.
D. DEVELOPMENT PROJECTS UNDERTAKEN WlrH EXrERNAL ASSISTANCE
. 16. In the field of higher education, a number of important development p~oJects have ?een taken up with external assistance. These include: (a) Home sCience educatiOn and research; (b) Public Administration Centre at Luck:now U~iver~i~y; (c) introduction of a general education programme in selected Indian nmvers1tws; (d) Australian gift of reference books under the Colomho Plan· (e) Indo-United States Agreement for financincr an educational exchancre pro: gramme; (j) lowpriced re-publication of standa~d educational works and books of reference; and (g) India-Wheat Loan Educational Exchange Programme.

162
17. Home Science Education and Research-The project for assistance to home science education and research under the Indo-U.S. Technical Cooperation Programme continued to progress during 1961-62. Of the last batch of nine American technicians who had come to assist the institutions selected as regional demonstration centres under the Project, eight have completed their
__ .~si~ent and have returned to the U.S.A.
As regards training facilities provided under the Programme, the four home science teachers who had gone to the U. S. A. for higher studies/training for 12 months have returned to their rr,spective institutions. ·
A Home Science Administrators' Conference was held at New Delhi in January, 1961 for the exchange of ideas and experiences among the home science administrators who had an opportunity of visiting the U. S. A. under the programme and of obsen-ing the American institutions at work. A home science workshop was held in Febmary, 1961 to discuss, among other items, the postgraduate courses in various areas of home science in India and other related topics.
The regional demonstration centres conducted workshops on various aspects of home science to assist the teachers of home science institutions and high/higher secondary schools in·the respective regions in various professional areas as well as in teaching methods and instructional aids.
A postgraduate course in various fields of home science has been instituted at five institutions in India and five others are making preparations to institute the course.
18. Introduction of Central Education Programme in selected Indian Universities through Ford Foundation Grant-This programme, which was drawn up in 1959-60 with a grant from the Ford Foundation, continued to make progress during 1961-62. The six beneficiary universities under the project have oeen conducting seminars and workshops on general education teaching by inviting top-ranking professors and educationists who have made a special study of the subject. Books on general education have also been purchased and distributed by the universities. A provision of Rs. 79,000 was made in the budget for 1961-62 in this behalf.
19. Colombo Plan-GIFT of Australian Reference Books to Indian UniversitiesfLibrariesjinstitutions.-The Government of Australia, through their High Commission in India, made a gift of reference books on Australia to 38 Indian 1miversitiesjlibrariesjinstitutions.
20. Indo-U.S. Agreem£nt for Financing Education Exchange ProgrammeUnder the U.S.E.F.I. Programme for 1961-62 administered by the U.S. Educational Foundation in India, the following exchange has been carried out:
From India to U.S.A. 165 Grantees
From U.S.A. to India 91 Grantees

163
Under the terms of the Agreement, the Government of India reimburses to the U. S. Educational Foundatior in India, the taxes and duties paid by the Foundation aad ita American grantees in India, as they are exempted from payment of such taxes.
21. Low-P.cicad Republication of Standard Educational Works and Books oi Reference-There are two main schemes for this purpose.
(a) The U. S. A. Scheme-During the period under review, consultations have been held with the concerned Ministries of the Government of India, and broad guiding principles have been framed within which the programme oflow-priced publication of American textbooks, with the help ofP.L. 480 funds, may be undertaken by the American Embassy or a representative designated by the Embassy for this purpose.
The work of publication has started.
So far, the following books have been published under the scheme-
1. College Chemistry by Linus Pauling. 2. Statistical Methods Applied to Experiments in Agriculture and Biology
by Sned~cor, G.W. 3. International Law by Charles G. Fenwick. 4. A Descriptive Petrography oflgueous Rocks Vol. 1 by Johannsen.
To evaluate the new books proposed under the scheme, the Ministry has drawn up a panel of expert evaluators in various subject-fields.
It has been found necessary to review the entire scheme to ensure that it i~ administrated in such a manner that it does not cause any hardship to Indian authors and publishers. For this purpose, an L1do-American Board has been set up. It consists of 14 members-seven representing the Government of India and seven, the Government of U. S. A. The Board goes into problems connected with the working of the scheme, with a view to safeguarding the interests of Indian authors.
(b) The U.K. Scheme-The Government of the U. K. has also initiated a scheme for the production of low-priced books of reference and standard works for use in India and has given a measure of priority to university textbooks. The first set of about 30 books on scientific, engineering, technological and other subjects has been published. The price-range of these books avera~es one-third of the original and is, in some cases, even less. These books will be followed by a further group of university textbooks. The titles were selected in consultation with the University Grants Commission.
22. India-wh9at Loan Educational Exchange Programme-The India-Wheat Loan Educational Exchange Programme has reached a stage of successful completion with the allocation of the fifth and final year funds during the year 1960-61. As the allocation during the year 1960-61 was final, it was utilised for ~he fur.therance and successful completion of the importaDt projects initiated Ill earher years, rather than for taking up new projects for which additional resources may not have been found. Sums of £175,000 and£ 148,000 were distributed for the purchase of equipment and books during 1960-61 and 1961-62.

164
The personnel-exchange component of the programme during the year was of special significance. In addition to provjding opportunities to several Indian scientists and librarians to visit the U. S. A., it opened up a new phase of exchange for curriculum scientists between the two countries
E. RURAL IDGHEB EDUCATION
23. Rural Institutes-In addition to the 11 Rural Institutes started during the second Five-Year Plan, two more Rural Institutes, viz., Rural Iu&titute, Wardha and Rural Institute, Hanumanamatti (Mysore State) started functioning from the current academic year with the diploma course in rural services and the certificate course in agricultural science. The post-diploma course in cooperation has been 13tarted at Sri Ramakrishna Mission Vidyalaya, Coimbatore.
24. Grants-The total amount of grants sanctioned to the Rural Institutes during the year was Rs. 22,63,634 and that of stipends sanctioned was Rs. 4,66,344.
25. Academic Events-The National Council for Rural Higher Education met twice during 1961, once in January, 1961 at Udaipur and again in New Delhi in November, 1961. At the second meeting, the Council considered pressing problems of the Rural Institutes, their finances and academic acvitities.
The Ministry organised orientation courses for the teachers of Rural Instit.utes at the Institutes at Bichpuri and Amravati. A seminar for the twenty teachers who were sent to the· U.S.A. in 1959 under a T.C.M. programme was held at Udaipur in September, 1961. Thref more seminars on the teaching of economics,· agriculture and engineering were held respectively at Rajpura, Sanosara and Coimbatore in November and December, 1961 and January, 1962.
A journal on "Rttral Higher Education" was brought out in November, 1961, as a supplement to 'Youth'. It is proposed to continue this journal as a Quarterly.
26. General-Under the Programme for 1961, equipment worth of £25,000 is being, supplied to the Rural Institutes by the Technical Co-operation Mission. The equipment has started arriving at the IUBtitutes.
The Ministry of Home Affairs, in coUBultation with the U.P.S.C., have recognised the diploma in rural services under them. The diploma has also been recogniried by almost all State Governments. The Inter-University Board and the Universities of Agra, Annamalai, Baroda, Delhi, Gujarat, Jadavpur, Karnatak, Madras, Marathwada, Nagpur, Patna, Pa.njab, Rajasthan, S.N.D.T. (Bombay), S. V. Vidyapeeth and Visva-Bharti have recognised the diploma for purposes of admission t<> post-graduate courses.
All State Governments except Andhra Pradesh, Gujarat, Punjab and West Bengal, have recognised the diploma in civil and rural engineering for purposes of employment to subordinate posts.
The Governments of Andhra Pradesh, Bihar, Gujarat Madhya Pradesh, · Maharashtra, Mysore and Orissa have recognised the sanitary certificate course.

165
F. GENERAL
27. Model Aot for Universities in India-In or<ler to consider broadly the organisational structure of universities in India and to prepare tho ontlino of a 'Mod~! Act' he~t suited t? their present role .and fun~tions, a sPven-membcr comm1ttee has been appomted under the charrmanship of Dr. D. S. Kothari. The proposaL~ in this behalf were examined by a group comprising the Chairman, University Grants Commission, the &cretary, :Ministry of Edtwation, and the Vice-Chancellor, Delhi University. The Committee is expected to submit an interim report in the near future.
28. Vice-chancellors' Conference-A conference of the vice-chancellors o( all the Indian universities wa.s held at New Dolhi in October, 1961 in collaboration with the Univer~ity Grants Commission. The Conference was inaugurated by the Union Edncation MinistAJr and was presided over by the Chairman, University Grants Commission. The Union Health Minister, the Minister of Community' D~velopment and Cooperation and Member (Educat.ion) cf Planning Commission addressed the Conference. The Prime Minister also nddressAd the vic~-chancel1ors. The ConferenCP deliberated on important; problnms of university educ>ttion. The conclusions and recommendations of the Conference have since been circulated to all universities and other participants for necessary action.
29. Sponsored Colleges in West Bengal-Consequent upon the decision of the Government to wind up the Ministry of Rehabilitation according to a phased programme, that Ministry ha3 transferred the work relating to the 'sponsor<'rl colleges' in West Bengal to the Ministry of Education. In aPcor<lance with the arrangements made in consultation with the Government of We~t Bengal, the Ministry of R"habilitation sanctioned the estahlislm11mt of 1:? degree colleges in W eQt Bengn.! during 1956-60 in order to meet the requirement" of a large number of displaced students from East Pakist~n for whom a.<leq~mtP. educational facilities were not available iu the existing colleges.
The Ministry of Reh>'ILilitalion has 81\uctioned, as grant-in-aid to the Go~crnment of West Benga.l, the capital expenditure for the buildings and ecpnpment of all thes~ college~, and in most crrscs, has 0ither sa,lct.ionerl the cost of acrpuring the site or has l'rovidcd land for the site in the colonies sd up at nw cost ofth<' Centra.! GovernmeP~.
A~ rt~g>uds recurring expen•liture, the entir·~ deficit (after deducting tl•e a1~oun~ received_ from fees and oth<Jr receipts) ha8 to be met by the Government ot Irvha acl'Ordmg to a progressivdv sliding SPale so thn.t the rc~ponsibiljty of the C.•ntml Governme•lt· <'e>l'eS at th,, nn<l of a fixed period. During 1961-62, propo;al~ for a grant-in a.id of Rd. 3,63,000 were received rmd the amount R>'lt\l"tioned.
. 3•1. De'hbandhu College, Kalkaji, New Delhi-A grant-in-aid of Rs. 11,000 has bPen sa•tdinned to the coll.,gn rlnrirliZ the emTent v<>a.r. AnothPT Rum of R~. 3,000 lmR h""n giwn to the col!P!!e a; non-r<>cuni~!! (!l'ant. for the purchase of library books. ~ - '

166
31. Inter-University Board of India-The Inter-Universitv Board of India is a voluntary organisation constituted by .the universities in India for the purpose, mainly, of serving as an authorised channel of communiration between universities that are its constituent members. It also facilitates coordination of university work. The Board receives a maintenance grant up to Rs. 32,000 annually from the Central Governme:~t. The actual grant given this year is Rs. 25,000. In view of the large number of new universities that are being established every year and the consequential increase in the activities of the Board, it is proposed to allocate additional development gra.nts to the Board upto Rs. 1,00,000 during the Third Five Year Plan.
32. Promotion of Publications in Science and Technology-A scheme is being worked out to promote publications in science, technology and the humanities at university level by Indian authors. .
33. Scheme of Correspondence Courses and Evening Colleges-The Government of India have included in the Third Five Year Plan a scheme for assisting universities to impart instruction through evening rolleges and correspondence courses. On the recommendation of the Central Advisory Board of Education, an expert rommittee bas been set up under the chairmanship of the chairman of the UDiversity Grants Commission to work out the details of the scheme. The report of the Expert Committee is awaited. As stated earlier, pending receipt of the report, the Gove,nment of India. has on the recommendation of the Committee, amended the Delhi University Act to enable the University of Delhi to start correspondence courses from 1962. A provision of Rs. 1,00,000 was included for this purpose in the revised estimates for 1961-62. For 1962-63, a. provision of Rs. 10 lakb has been induded in the budget for the same purpose.
Main Davelopment in the States A brief acrount of the development in the field of University education in
different States is given below :-
Andhra Pradesh
Andhra University A diploma course in Rural studies was introduced. M.A. in Anthropology
and full-Hedged M.A. Degree course of one year's duration for honours graduates and two years duration for pass graduates in English, Sanskrit, Telegu,
· Philosophy, Hiatory, Politics, Economics and Mathematics were started in the University Ccllege, Waltair.
Two departments, viz., those of Anthropology and Theatre Arts (Acting) were established in the University Colleges. The Department of Geophysics was bifurcated into two departments, namely (i) Geophysics and (ii) Meteorology and Oceanography.
Osmania University Senior Diploma in French and German in the Faculty of Arts, B.So.
(Home Science) in the Faculty of Science, M.E. in Hydraulics in the Faculty of Engineerin~ and M.Sc. (Bio-chemistry), D.P.H., D.M.R., D.H.M., and M.S. (ENT) in the Faculty of Medicine were introduced.

16"1
Assam
Gauhati University
Pre-University in Arts, Science and Commerce were introduced.
Bihar
Bltagalpur University
Post-graduate teaching in Science subjects was sanctioned during the year.
Bihar University
Post-graduate teaching in four arts subjects wa.s sanctioned a.t C.M. College, Da.rbha.nga., under Bihar University.
Patna University
No new course subject was started.
Ranchi University
M.A. in Economics and M.Sc. in Agriculture were started.
Gujarat
Baroda University
Some new courses/subjects, viz., Ph. D. in Geology, M.E. in Soil Mechanics, M.Sc. (Home) in Clothing and Textile, M.Sc.(Home) in Home Science Education and Extension, LLB., Diploma. in Early Childhood Education and Certificate in German Language were introduced.
Gujarat University
Diploma. in Fine Arts and Diploma in Journalism were newly started.
S. V. Vidyapeeth
Ph.D. (Education), Teachers' Diploma. and Diploma in Dairy Science were started.
A donation of Rs. 5,000 offered by the Gujara.t State Centenary Committee, was accepted a.nd a. gold medal to be oa.lled Kaviraj Ravindra Nath 'fa.gore Cent~mary Gold Medal wa~ i11stituted.
Jammu & Kashmir
Jammu &: Kashmir University
Pre-University and Three years' Degree course in Arts, Science and Commerce were introduced. B.Sc.(AgrJ. and B.E. (in 'Civil, Electrical and Mechanical) along with 1\I.Sc. in Zoology and Botany were also started.

·. lti8
Kerala
Kerala, University
Post-graduate courses in Commerce were started in l'ifar Ivanios College, Sacred Heart College, N. S. S. Hindu College, Fatima Mata National College a.nd Christ Colleg~•. Po~t-graduate course itt Social Welfare (M.S.W.) was started in Sacred Heart CollegP. Another postgraduate courst' in Agriculture (M.Sc. Agri.) was started in thf: Agricultur~l College. M.Sc. in Zoology was star-ted in Christ College. ·
Diploma course in German was started itt thtJ Uaiv.Jrsity D-:p.Htm }\lt of Gorman. Instmctions for Bachelor Degree in Library Science (B.Lib.Sc.) was start(ld in the Univer!:lity Library. A Post-gradu:1.b course in Tamil was started 'iu the University Department of Tamil. . .
One new Department viz. Department of Tamil was also established.
Madhya Pradesh
Indira Kaks Sangeet Vishwavidyalaya
A new course in Vid-Honours was started during the year.
Jabalpur University
The first Dapa,·tment ()f post-gradtl>l.te studies and research in sci'm<'e, viz. the Department of Post-graduate Studies and Research in Chemistry was established. An ordinance along the lines of the corresponding ordinance relating to the University Departments of post-graduate Studies and Research in Arts had also been made to regulate the arrangements for instruction for the M.Sc. course in the University Dapartmcn.ts of Post-graduate Studies and Research in Science. ·
Regular classes for the LL.M.(Part I) Examination were heltl for the first time in this academic year.
Saugar University
The University introduced post-graduate course in law leading to LL.M. Degree, 4 year's integrated course in Agricultur~ leading to B.Sc.(Agri) degree and 5 year's integrated course leading to B.E. degree. The University also formulated a scheme for post-graduate study in M.Sc. iu Applied Geography. The University decided to merge the Department of Pure Geology with that of Applied Geology.. The University also introduced three years degree course in classics leading to B.A. (Classics) degree.
Vikram University
M.A. in Ancient Indian History and Culture, M.A. in Social Work, Bachelor, in Dental Surgery and Master in VBterinary Science were instituted.
Madras
Annamalai Uuiversity
M.A. in Psycbqlogy and certificate course in Tamil wore introduced.
169
Madras University
The regulations for M.A. in Social work, .M.A. i': French, Bachelo11 .of Indian Medicine, Maste-r of Technology and D1ploma 1n Management St.udies were introduced. On the recommendation of the Board of Studies, revised reguhttions for B.T. degree courRe and diploma in Statistics had been adopted.
Maharashtra
BomlHty University
A Diploma course in lndu.'liria.l Engineering (D.I.E.) was instituted. An endowm'lnt of Rs. 4 lakh'l had been c,reated in the University for the esta.blishnwnt of a Tagore chair. The University Grants Commission also gave a. grant of Rs. 3 lakhs to the University for this purpose.
Ma.mthwarla University
Post-graduate teaching in Hindi was started with the assistance of co!ltributed teachers from the afliliated colleges. Bachelor Degree in Oriental -Learning and Diploma irl Oriental Learning were also in~t.ituted.
N agpur University
Degree course in Architecture, M.S. (Oph.), M.D. (Pu.th.), M.Ch. (PlastiGSurgery) were started. Poultry Science Waf'\ added a.s a subject for B.V.So. examination.
S.N.D.T. Women's University
Diploma. in Library Science wM instituted.
Mysore
l(arnatak University
The university started a. Diploma. course in Public Administration, under the auspiws of t.he political science Department of the University.
Mysore Univel'sity
M.Sc. (Anatomy), M.Sc. (Ph!\rmocology) M.D., M.S., M.Sc. (Home Science) ~ost-gr~dua.te Diploma in D.O.M.S. were introduced. A post-graduate cours; Ill Arch1terture and Town Planning was approved.
Orissa
Utkal T!n1:11Pr.<ity
New cour""~, in :.\LD. (Social nnd Preventive Medicine), Ph.D. (Anatomy) Pn.thology, Bioch-:mi~try n.nd Pharnuwhology) and D.A. (Ana.esthesiology) W•lre sfarted. ·

170
Punjab
E urukshetra University
Pre-University, Pre-Medical, B.A.fB.Sc. (Pa.ss), B.A.(Hons). in English, Mathematics, Economic3, Political Sciem:e, Hindi, History and Sa.nskrit, and B.Sc. (Hons.) in Physics and Chemistry were started. M.A. in English, History, Political Science, Hindi, Economics, Mathem'l.tics, Philo3ophy, Indian Philosophy & Religion & M.S.::. in Chemistry were also introduced.
Panjab University
Pre-Agriculture, Pre-Commerce, Pre-Medical, Pre-Engineering and B.A. and B.Sc. (3 years) courses were started. M.A. in Ancient Indian History & Culture and Public Administrat.ion were also introduced.
Rajasthan
Rajastlian Univmity
Ci!rt.i.ficate cour.>e in Russian and Diploma. in French antl German L'l.nguages were started along with the DiplomJ. course in Library Science.
Uttar Pradesh
Agra U niversit:y
New courses in DiplomJ. of Higher Proficiency in Hindi Phonetics and Graduate of Homo~opathic Medical Science were introduced. ·
A l?'garh 1Jniversity
Th.e Fa.-.:ulties of Arts and Sjeuce successfully completed the changeover from old p:J.ttern of the Intermediate imd Two years' Degree courses to the Pre-University and Three years' Degree courses.
Allahabad University
Ba'.lh'llor of E~giu~ering, M.B., B.S. ani M.A. in Psychology ware introduced.
l.II.Wknow University
Anaost.hesiology had been separated from the Department of Surgery and a new Department of Anaesthesiology was created.
Roorkee Uniwrsity
A new po.st-graclu!!ote course in Machin<:l D3sign wa.s st,uted in the l\I~cha~cal Engineering Department.
U.P. AgriouUural Unit>ersity
B.Sc. (Hons.) Agri. & A.H. and B.V.Sc. were started.

171
West:Bengal
Burdwan~ University M.Sc. in Physir.s and Chemistry were started.
Calcutta. University R~rrulations for tha Pre-University Examination were split up into two
sopara~ sets of regulations i.e. for Pre-University Examination in Arts and for Pre-University Examination in Science. An integrated Degree course in B.E. (Intermediat-e) was also started.
J adavpur D niversity . The University instituted a two years' post-graduate course in Bio
Chemical Engineering !earling to the Degree of Master of Technology. The syllabi and courses of study for the 5 years' integrated courses in Engineering were adopted. The University also instituted a two years' certificate course in Sanskrit. Besides tho above, the syllabi of studies of post-graduate courses in Physics, English, Bengali and International Relations and of under-graduat,e courses in English and Bengali were revised and adopted.
Kalycmi University Th1 University started B.S(l. (Agri.) 4 yaars' course, MG. (Hon:'l.) in
Chomistry, M.Sc. in Ch;Jmistry, B::>tany and Zvology, M.Sc. (Agri.) Plant Pathology and M.A. E~::>n'lmics for tha first time during the year.
Visva-Bharati University
B.Sc. (Hons.) in M1them1.tics with Physics and Chemistry as subsidiary subjects aud B.A. (Hon.s.) in Ancient Indian History and Culture were introduced.
Delhi
Delhi um:versity
One year eertific3.te course in Spanish was in.~t.ituted in the Department of Moclorn European Languages. One year diploma courses in German and Italian (after tho certificate course) were also instituted in the department. Diploma courses in Radiation Medicine and Ophthalmology were instituted in the Faculty of Medical Sciences.
Institutions
(a) Universities
DuriJJ.g tho yer.r, the number of universities in th~ country rose by one to 46. Tho newly e~tah~8~ed University w_as K.S. s,lnsln-it University, DHrbhanga. Of these 9 umwrsltles were locf\ted m Uttar Pradesh, 5 each in 1\Iaharashtra West Bongal r.nd Bihar, 4 in Mailllya Pradesh, 3 each in Andhra Pradesh and Gujarat, 2 <'ach in l\bdras, Mysore and Punjab and 1 each in Assam Jammu mul Kr1slunir, Kernb, Orif&l, Rajasthan and Delhi. The romainiJ;" Union Territories had no uniYersity of their own. "' lll;'B( 11)5-f\hfl-:uu-15

172
. .Table LXIX gives the year o~ foundatio~frecon~titution, .ter~itorial jurisdiction, type, faculty and medium of mstrnctronfexannnahon of each university. ·
Of these 46 universities, one was purely af!illating, 12 residential an:d teaching, 2 teaching and federal and the remaining 31 teaching and affiliating.
Apart from these 46 universities, there were three institutions as a«ainst two in the previous year which W<)re deemed to be. universities under Section 3 of tho University Grants Commission Act of 1956. These were Indian Agricultuial Research Institute, New Delhi; Indian Institute of Science, Bangalore and Indian School of International Studies, New Delhi. Moreover, under Acts of the Parliament, the All India Institute of Medical Sciences, New Delhi, the Indian Institute ·of Technology, Kharagpur, Indian Stat.istical Institute, Calcutta were declared as Institutions of National Importance.
Boards
There was no change in the number of Boards which, intet nlirt, conducted Intermediate Examinations. The names of the existing Board~ are given below-
1. Board of High School and Intermediate Education, Uttar Pradesh Allahabad.
2. Bo:J.rd ·of &1condary Education, Madhya Pradesh, Bhopal
3. Board of Secondary Education, Rajasthan, Jaipur.
4. Central Board of Secondary Education, Delhi.
Colleges The total number of colleges affiliated to univer~ities and boards or recog
niaed by State Governments increased by 225 to 2,365. This gives an increase of 10· 5 per cent. Of these, 1,182 were arts and science colleges (including 44 research institutions), 961 colleges for professional education and 222 colleges for special education. The corresponding total number of these colleges during the previous year was 2,140. Of these, arta and science colleges were 1,080 (including 41 research institutions), colleges for professional education 852 and colleges for special education 208. Thus arts and science colleges registered an increase of 9 · 3 per cent while the professional colleges and special education colleges increased by 12·8 per cent and 6·7 per cent respectively.
The colleges for women numbered 313. Of these, 181 were arts and science C;)lleges, 106 professional education colleges and 26 special education colleges. The corresponding number for the previous year was 165,97 and 21 respectively. The percentage of women's colleges to the total number of colleges comes to be the t~ame as in the previous -year.
Colleges (inrluding 3 research institutions) in rural areas numbered 273 (258 for men and 15 for wome~). or. these, 106 (including 5 f~r women) w_ere arts and science colleges, 164 (mcluding 10 for women) professiOnal educahon colleges and special education colleges. These colleges in rural areas constituted 10·9 per cent of the total number of colleges in the country.

Table LXIX-Universities in India-Jurisdiction, Tn!e and Faculties
Xamo and Addn:s9
A:iDIIHA.
A.ndhra. Univon;ity,'\Vultu.ir.
O:ima.nia. Univer:iity, Hy<l<orabad.
Yeur of Foundation/ Reconsti
tution
2
1926
1918(1947/ 1U5()jl\1;39
Territorial Jurisdiction
3
Srikakula.m, \"isa.khapJ.tnam, East Godavari, \Vest Godn .. vari, Krishna and Guntur District~.
Districts of Adiln bad, Hydembad, Kn.rimnagnr, Khama.m, :l\Iahbubnogar, Medak, Nalgonda, Nizamabad and Worangal in
Andhra Prau,.h.
Sri Von katesw~rn 195! Five distrirts of Andhra viz. An1.ntpur, Chit.tor, Cuddapah, Kurnoul and Nellore.
University, Tirupati.
AssAM GRnhati University,
Guuhati. BmAR
Bhngnlpur University, Bhagalpur.
Bihar University, Muzznffarpu.r.
Magadh University, llo<lli Gay a.
Mjll(D)5lMollidu 15(a)
1M8
1900
1962
State of AAsam and Union Territory of 1\Ianipur.
Districts of Bhagalpur, Jllonghyr, Pnmea, Saharsa and Santhal Pargana.s in Bihar State.
Tirhui Division of Biha.r State.
Whole of tho Patna. Division, except the !<.>cal area of Patna University.
Type
4
Teaching and Affiliating.
Teaching and Affiliating.
Teaching and Affiliating.
Teaching and Affiliating.
Teaching and Affiliating.
:l!edium of Instruction/ ExamiiHLtion
Faculties
5
Art;; Sc.; Agri; Com; Engg; English. !fine Arts; Law; :Medicine; Oriental Learning; Teaohing.
6
Arts.; Sc;.Agri.; Com.; Edu.; English cr Hindustani Engg; Tech.; Law.; Med. (Per;ian and Devnagri and Vet. Science. script). English f<•r
professional courses.
Arts; Sc.; Agri; Com; Engg; English. l'ine Arts; llled; Orientnl learning; Edu. & Vet. Science.
Art.s; Sc.; Com.; Engg.; 1\Ied. and Law.
Arts; Agri; Com.; Engg; Fine Arts & Crafts and Law.
English
Teaching and Arts; Sc.; Agri; Com.; Engg; Affiliating. Law & Med, Sciences.
Hindi for all exams. upto B.A.; . English, Urdu and Bengali also allowed with special permission.
Hindi, Urdu, English or Bengali in Pre·Uni•. and degree courses (Arts; Se.; Com.); English in others.
Teaching Affiliating.
and Arts; Sc.; Com; Vet. Science.
Law & Hindi, English, Urdu & Bengali.

Table LXIX-Universities in India-Jurisdiction, 'fype and Faculties-contd.
2
Patna. P>ttna.
University, ID17jl952j 1960jl962
Ranehi R1t~chi.
University, 1960
GuJAR-<T
Ba!"oda Baroda.
University, 1949
Gujnr~t Uuiversity, I 949 Ah·nedabnd.
Sardt'.r V•lllabhbhsi Vidya. 1955 pcoth, Vallabh Vidynnagar.
JAmtu & KAsnma
Jammu & Ka:;hmir Uni- 1948 ,.W'.ii~.~·, Hrinagar.
KERAT.A
Kcrai!L University ID37fl957 Trivnndrum. '
3
Patna Division
4
Teaching and Ro;idential.
Dis~ts. <:£ Dhanbad,Hazaribagh, Teaching and Palam~u. Ranchi & Singhbhum Affiliating. in Chota Nagpur Division of Bihar State.
Within tho radius of 10 miles from the University Office.
Teaching· and Residential.
State of Guj •rat (excluding areas Te~ching and of nu,,,h Uni••ersity and SarJ.ar Affiliating. Vallabhbhai Vidynpeeth).
Within the radius of 5 miles from the University Office.
Jammu & K:tshmir,St.ato
Koral" State
To:Lching and Affiliating.
Te,.ching and Affiliating. ·
Teaching and Federal.
5 6
Arts; Sc.; Com.; Edu.; Engg.; Hindi in Inter. a.~d Degr~e Law and 1\Iocl. classes, English lfi
others.
Arts; Sc.; Agri; Com; Law and ::llineral Tech·.
Hindi in Inter. and Degree courses. English ia othets.
A"ts; So.; Com; Edu; English. Psych; Fine Arts; Home Sc.; ilied; Engg. nnd Tech. and Social Work.
Arts (including Edu.); Sc.; Agri; Ayurveclic Med; Cmr..; Lnw; 1\led. and Tech. (including Engg.).
Arts; Sc; Agri; Com.; Engg. & Edu.
Gujarati & Hindi in Inter.; B.A.; B.Sc.; B. Com.; B.~Ed; M. Erl., B. Pharmacy; Law; PreUniver•ity; First LL.B., 1'.D.B.'E.nndfirst 1\f.B.B.S., Eng. in others.
Guajarati, English and Hindi.
Arts; Sc; Edu; Com; Social English. Sc.; Mel. and Oriental
Languages.
Arts; Sc: Agri; Ayur'redic; English. Com; Edu; Engg; Law; Mod; Oriente 1 Studies: Fine Art• & Vet. Sc.

::a.tADUYA l'H . .-IJESH
Inclira. I(;da. Sa:l;_t•~<Jt, l!)jG Vi .... hwn.vidyabya,·Kh:.dra.gnrh.
Ja.balpur UnivcrJity, 19j7 Jahalpur.
Suaga.r Sagar.
Unin:rdity, 1946
Viknun Ujjnin.
University,
MAD BAS
1950/1957
A.nna.JHnlai Uni verdity, 1929 Annamala.inagar.
Madras Madras.
University, 1857 Jl 904J 1923;1929
MAHARASHTIU
Bumbay University, Burn bay.
~hh~trathwada Unive~sity, Aurangabad.
1857,1904{ 192811953 1958
Within t:,o:Scate of ~Iadhya Pm· d.esh but it ca.n affiliate institutions ouLide the l)roYince a-8 \Yell.
District of Jabalpur
Revenue distts. of B:tlagha.t, Bastar, Betul, Bi!aspur, Chat tar· pur, Chhind,ntr.l, Dati a, Durg, Damoh, Hoshangabad, ~Iandla., Kar.:>inghpur, Nimar, Panna, ltaigarh, Raipur, Rewa, Sagar, Sa.rgiya, Satna., Seoni, Shahdol, Sidili, Tikamgarh in i\laclhya Pradesh.
18 revenue uistts. of :\I.P. viz., Bhinrl, Dewas, Dhar, Guna., Gwalior, Indore, Jhabua, ~IandFaur, 1\Iorena., \Vest Nimar (Kharg-me}, Haisen, Rajgarb, Ratlam, Sehnre, Sha.japur, Shivapuri, Ujjain and Vid.ioha.
Te.:1.ching and Affiliuti11g.
Tea.ehing nnd Affiliating.
Teaching and Afllliatiug.
Teaching and Afllliating.
Within the r~diue of 10 miles Residential and from the con vocation hall. Teaching.
State of ;\hdras (excluding the Teaching and area. of Annama.lni Uaiversity). Affiliating.
Greater BJrnbay Teaching and Federal.
Five districts in l\la.hara.shtra, Teaching and viz., Aurangabad, Parbhani, .Affiliating. Nanded, Bhir & 0fma.nabad.
Music & Da.nce
Arts; Sc.; Com.; Law; Edu.; Agri.; ;\Ietl.; Vet. :Sc.; Home Sc. and Engg.
Arts; Sc.; Law; Edua & Engg.
Arts; Sc.; Agri; Com: Edu; Engg; Law; 1\Ied; Ph~·sical Edu; Vet. Sc. & .Animal Husbandry.
Hindi, Eng. and ~Iurathi.
Eng. and Hindi in PreUniversity & Degree Courses, Eng. f,,r othe:rda
English and Hindi in Arts & Com. English in Sc. Classes.
Eng. in Professional Courses (exclw.ling Commerce where Hindi is the Medium). English and Hindi in others.
.Art•; So.; Edu; Engg. & Engli•h. Tech.; Fine .Arts & Oriental Studies.
Arts; Sc.; Agri.; Com.; Engg; English and Tamil. Fine Arts; Law; :Med; Oriental Learning; Edu; Tech; and Vet. Sc.
Arts; Sc.; Com.; Dentistry; Law; ;\Ied and Tech.
Arts· Sc · Agri · Com· Edu; Enig; La.w ~nd ~red.
.Engli~h.
English, 1\Iara.thi or Hindu. staui (Devnagri script) in faculties of Arts; Sc.; Agri; & l:om. English in othflrs.
-------------------------------------~----~------------~~~~~~-

Table LXIx-Universities In India-J'urisdiction, Type and Faculties-eontd.
1 2
Na!(pur Nagpur.
University, 1923
Poona Poona.
University, 1949
S.N.D.T. Women's Uni- 1951 • versity, Bombay.
MYSORD
Kamatak University, Dharwar.
1949fl950
Mvi!Ore 'My•ore.
University, 1916/1956/ 1957
OrusSA Utkal University, 1943
Bhuhaneswnr,
PUNJAB
Kurukshotra University, 1956 Kurukshetra.
3
Districts of Akola, Amravati, Bhandara, Buldhana, Chanda, Nagpur, Wardha and' Yeotmal in Maharashtra State.
Districts of Poona1, Satara, Ahmed
naga.r, Sholapur, Nasik, Ratnagiri, Colaba, J algaon; Dhulia, Sa.ngli and Kolhapur.
ll'ot defined
Districts ofBelgaum, Bidar, Bija- I
pur, Dharwar, Gulbarga, North Kanara, Raichur and some colleges in South Kanara district of Mysore State,
Twelve districts of ll!ysore, viz. llfysore, Bangalore, Bellary, Chikmagalur, Chitradurga, Coorg, Hasan, Kolar, Mandya, Shimoga, Tumkur & South Kanara,
The State of Orissa
4
Teaching and Affiliating.
Teaching anc1 Affiijating.
Teaching and Affiliating.
Teaching and Affiliating.
Teaching and Affiliating.
Teaching and Affiliating.
Within the radius of I 0 miles from Residentia.l and the University Office. Teaching.
5 6
Arts; Sc.; Agri; Com; Edu; English, Hindi andl'<!arathi Engg. & Tech; Law and· in Pre-University & · Med. Degree Courses, M.A.
I Art•) & M. Com. English for others.
Arts; So; Agri; Ayurvedio Med., Engg; Law; Med, and Mental, Moral and
· Social Sciences.
Arts; Medicine and Education.
English and Marathi in 'Pre-University and degree classes. English in others.
English in B. So. (Nursing) English and Hindi in others,
Arts; So; Agri; Law; Med; Hindi, Regional Lang~sge Public Adm.andSocial Sc. & English in Pre-Umver
eity. English for others.
Arts; So; Agri; Law; Com; English & Kannada in Pre-Edu; Med; Engg. & Tech. University and Degree
Arts; So; Agri; Com; Edu; Engg; Law; Med; Vet. So. & Animal Husbandry.
Arts; So.; Social Sc. . and Edu.
Courses, English fo• others.
English.
F'nglish, Hindi & Panjahi fur I.A. and Graduate courses. English for post-Graduate Courses.

r.mjnb rni\·cr.;ity, CL.andi;...: .. r:t.
J{.AJASTJIAN
R1LjrLsfhan Juipur.
l:TT.\R PnADESli
1947
1947
Arrra. L".•i,·ordty, IU27jl953 Awa.
A/ignrh :\Iu.·dinl Uni\'cr.sity, 1U21 Aligarh.
Alhhaba•l University, 1Sd7 Al!:dmhad.
Eannras Hindu UniverNity, 1~16 Varo.nn~:~i.
Gurakhpnr Uni~ersity, 1D57 U.<rakhpur.
Luc knnw University, LuekntlW.
Ronrkee University, Rourk eo.
HJ2ljln58 ·
1947;1949
l'unjub and lli.nacha.l Pradesh exeept. ti1e urea uf 1\.uruksht•tra. Univl'rsity.
Rn.ja.sthan State
State ofUt tar Pradesh (exeluding areas of A.li~arh, Allahabad, Ba.naras, G Jrakhpur, Lucknow and RoorkC'e Univer.::.it.iel:l).
"·'ithin a. radius of 15 miles from the University :Mu8que.
Teaching and Afiiliut,I<g.
Teaf'hing and Affiliatiug.
Affiliating.
Residential and Teaching.
Within the mdius of 10 miles from Residential and the Univer::Jity Office. Teaching.
Within the radius of 15 miles from Teaching and the University Temple. Residential.
Fourteen districts of U.P. viz .• G.Jrakhpur, Deoria, Azamgarh, Bn.lia, Vara.nasi, Jaunpur, Ghazipur, Basti, Gonda, Bahraich, FaizabaJ, Mirzapur, Su!tanpur and Pmtapgarh.
Teaching and Afliliating.
Teaching and Hesid~ntial.
Arts; 8:.-., Agri; Dair_vj;,g; Cum; :Edu; EI.gg. at.d 'l Cl'l.; Law; :l.f~d; Oriental L£•arning and Vet. ::ic.
Arts; Se; Com; Etlu; Engg; Law; l\Iod; Pharmaet;Utit's and Vot. ~~.:.
Art::;; Sc; Agri; Con1; Engg; Homoeopathy; Law; :ued; Tech. and Vet. Sc.
Arts; Sc; Com; Engg. & Tech; Law; illed. and Theology.
Arts; Sc; Com; J,aw; Engg. and llred.
Arts; Sc. Law; ~Ied. & i:iurgery (Ayurveda); Music and Fine Arts; Oriental Learning; Tech. and Theology.
.Arts; Sc. Com. & Law
English, llindi, r.n.tu t.r runjabi ia1 l.A., B.A.,
& ll. Cum. Englibb. for oth<.'rs.
Hindi in Pre-University/ l.A., Engli>h und Hindi in degree classes. English in o:;hers.
Englbh and Hindi in B.A., B.T .. ll. Com., liLA. & :11. Com. English in others.
English, Hindi and Urdu in Pre-Uni"Versity, Urdu in B.U.Tll.S. English in others.
English and Hindi in GraduDte as well as postGraduate classes.. English for professional courses.
English and hindi in I.A.; I. Sc.: I. Com; B.A.; l\1. A.; B. Com. and Ayurveda, Hindi in Music and }'ine .Arts. Eng!ioh in others.
English and Hindi.
.Arts, Sc; Com; Law & Tlled. Hindi in Graduate Courses. \Vithin ti1e radius of 10 miles from the Univer~ity convocation hall. Not defined Hesidential and Engg., Science and
Er.glish for others. Archi- English.
Teaching. tecture.
*E;tab!isheJ in l U 16 but started functioning as a statutory university in l U5l 1under an act pl¥!sed by Bombay Government.

Table LXIX-Universities in India-Jurisdiction, Type and Faculties-concld.
1 2
U.P . .Agriculture Univer- 1960 sity, Pant Nagar (Naini-tal).
Varanaseya Sanskrit 1958 Vishwavidyalaya, Vara-naai.
WEST BENGAL
B1udwan· Burdwan.
University, 1960
Calcutta Calcutta.
University, 1857{1951/ 1954
Jadavpur University, 1955 Jadavpur.
Vishva.Bharati University 1951 Santiniketan. '
Kalyani University, 1960 Kalyani.
DELHI Delhi University, Delhi 1922{1943/
1952
3
Not defined
4
Residential and Teaching.
5
Agri. and Vet. Sc.
The entire country Teaching and Sanskrit
Districts of Bankura, Birbhum, Burdwan, Hooghly and Purulia in West Bengal.
State of West Bengal (excluding areas of Burdwan, Jadavpur,
Kalyani & Visva-Bharati Universities) and Tripura.
Within the area of 2 miles from the Uhi versi ty Office. .Area of Santiniketan in the distt.
of Birbhum in West Bengal.
Police Stations Chakdah & Haringhata in the district of Nadia and Police station Bijpur in the district of 24-Parganll.ll.
Union Territory of Delhi
.Affiliating.
Teaching and .Affiliating:
Teaching, .Affiliating and Examining.
Teaching
Arts.; Sc; Agri; Com; Edu; Engg; Fine .Arts & Music; Journalism, Law; Med; Tech. and Vet. Science. Arts; So; Engg. and Tech.
University Teach- Arts only ing and Resi-dential.
Residential Teaching.
and Arts; Sc.; .Agri. and Teachers Training.
Teaching, .Affiliating and Federal.
.Arts; Sc.; .Agri; Forestry; Lew: Medical Sc.; :vrusic and Fine .Arts; Social Sc. and Tech.
6
English.
Sanskrit in all subjects except in Languages and modern subjects where Hindi and English are the media.
English and Bengali in Pre-University, I . .A., B.A. & B.T. English in others English.
English.
English, Hindi, Bengali and Oriya in Pre.Univer.ity. English and Bengali in others. Engliah.
Hindi and Rnglish in PreUniversity and Degree ('.ourses. English for others.
......
.;)
00

179
Professional colleges wNe of various types. The ~a;gest number among them (550 or 57· 3 P"r cent) belonged to the tea?her ~·ra1~1ng t:rye, follo:ved by those for medicine (14~ or 14·9 per cent), engme{1rmg mcluding architecture ('Ttl or 8·1 per cent), comm~rce (52 or 5· 4 per.cent), la.w (44 or 4· 6 per cent~, agriculture (38 or 3·9percent), physical education (20 or 2·1 per cent), vetenMrv science (18 or 1· 9 per cent), technology (11 or 1·1 per cent), f~restry (3 or 0·3· per cent) and oth'lrs (unspecified --4 or 0·4. percent). Profess:onal education colle!!eg increased bv 109 (11·3 percent) durmg the year. The mcrease was shared as follnws: te'lch~rs' training colleges 73, commerce ancl medical colleges 10 each, engineering including architecture colleges 9, law colleges 6 and agriculture colleg(l~ 2. But this increase was ofl's?.t by the decrease of one technological colleg'l. Physical edu;ation colleges, v_•'tcrina.ry ~rience colleges and other (unspecified) colleges remamed the same as m the previOus year.
The 222 colleges for special educa~ion comp~ised of 54 c?lleges for. music, dancina and other fine art8, 117 for onental studies, 8 for socml educatwn and 43 for
0
0ther subjects. Table LXX gives the distribution of colleges by management.
Table LXX-Number of Colleges by Management
Toto.! Arts & Science Colleges for Cb!legeo for --Colleges and Re· Professional Sperial Educa. 1960-61 1961-62 Management
se'lrch Institutions Education tion ~ r----A--. ~~ ~ No. Percen. No. Percen. 1900-61 1961-62 1960-61 1961-62 1960-61 1961-62 tage tage
2 3 4 5 6 7 8 9 10 II
Government 232 250 4Z4 457 49 55 705 32·9 762 32"2
Loeo.l Boards 2 2 3 4 3 3 8 0·4 II 0·5
Private 1
Aided 681 750 350 381 137 142 1,168 54.6 1,273 63•7
Un-aided 105 180 75 119 19 22 258 12·1 321 13·6
India 1,080 1,182 862 961 206 222 2,140 too· o 2,865 too·o
The position during 1961-62 waR more or less the same as in 1960-61. Nearly two-thirds of the colleges were managed by private organisations. Government controlled most of the remaining one-third of the colleges. The control of the boards was very insignificant (0 · 5 per cent only). Taking each type of colleges separately, nearly three-fourths of the arts and science colleges and special education colleges were managed by private bodies and one-fourth by Government. About 52 per cent of the colleges for professional education wt>re managed by private bodies. Government managed most of the remaining 48 per cent of the colleges for professional education.
Table LXXI shows the distribution of colleges in different States during the year 1960-61 and 1961-62. There was no college in A. & N. Islands, Dadra & Nagar Haveli, L.M. & A. Islands and 1-.TEFA. The number of colk;:;es inereascd in all the States and Union Territories except Himachal Pradesh and Tripura where the number of colleges remained the Fame as in the previous yenr. Tl1e numbt>r of arts e.nd scirnce colleges increa~cd by 24 in :Maharashtra, 14 in Uttar Pradesh, 11 in West Bengal, 10 in Gujarat, 7 in Madhya Pradesh, 5 each in Bihar and hlyfore, 4 each in Jammu & Kashmir, Orissa, Punjab
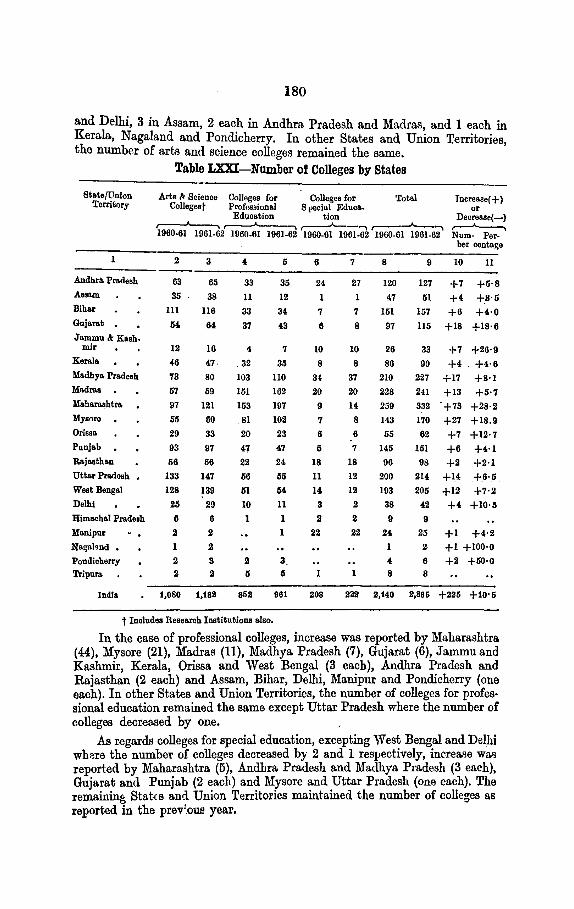
180
and Delhi, 3 in Assam, 2 each in Andhra Pradesh and Madras, and 1 each in Kerala, Nagaland and Pondicherry. In other States and Union Territories, the number of arts and science colleges remained the same.
State {Union Territory
Andbra Pradesh
Assam
Bihar
Gujarat
Jammu k Kash· mir
Kerala
Madhya Pradesh
Madras
Maharashtra
Mysnre
Orissa
Punjab
Rajasthan
Uttar Pradesh
WestBangal
Delhi
Himaohal Pradeoh
Han! pur
Na~al•nd •
Pondicherry Tripura
India
Table LXXI-Number of Colleges by States
Arts •" Science Colleges for Colleges for Total Collegest Prof,.sional S l"'oial Educa.
Increase(+) or
Decrease(-) ~
Education tion ,.--A....-~~~--,~ 1960-61 1961-62 1980.81 1961-62 1960-61 1961-62 1960-61 1961-62 Num- Per
her centage
2
63
35
ll1
M
I2
46
73
57
97
55
29
93
56
133
I28
25 6
2
2
2
3
65
38
ll6
64
33
ll
33
37
I6 4
47- . 32
80 I03
59 I51
I21 I53
60 81
33 20
97 47
56 22
147 66
I39 6I
29 IO
6 1 2
2
3 2
2
6
1,080 1,182
5
35
I2
34.
43
7
311
llO
I62
I97
102
23
47
24.
55
M
ll
3 G
961
6
24
I
7
6
10
8
3!
20
9
7
6
5
I8
11
a 3
2
22
208
7
27
1
7
8
10
8
37
20
14
8
6
7
IS
12
12
2
2
22
8
I20
47
I 51
97
26
86
210
228
259
143
55
I45
96
200
I93
38
9
24
4
8
9 10 ll
127 +7 +5·8
51 +4 +B·5
157 +6 +4·0
115 +IS +18· 6
33 +7 +26·9
90 +4 . +4·6
227 +17 +B·l
241 +13 +5·7
332 . +73 +28·2
I70 +27 +18.9
62 +7 +I2·7
I51 +6 +4·I
98 +2 +2·I
214 +14 +_6·_5.
205 +I2 +7·2
42 +4 +IO·II
9
25 +I +4·2
2 +I +100·0
6 +2 +50·0 8
222 a,t4o 2,865 +225 +1o·5
t Inoludes Researoh Institutions also.
In the case of professional colleges, increase was reported by Maharashtra. (44), Mysore (21), Madras (11), Madhya Pradesh (7), Gujarat (6), Jammu and Kashmir, Kerala, Orissa and West Bengal (3 each), Andhra Pradesh and Rajasthan (2 each) and Assam, Bihar, Delhi, Manipur and Pondicherry (one each). In other States and Union Territories, the number of colleges for profes· sional education remained the same except Uttar Pradesh where the number of colleges decreased by one.
As regards colleges for special education, excepting West Bengal and Delhi wh~re the number of colleges decreased by 2 and 1 res}Jectively, increase WM
reported by Maharashtra (5), Andhra. Pradesh and Madhya Pradesh (3 each), Gujarat and Punjab (2 each) and Mysore and Uttar Pradesh (one each). The remaining Stat{ a and Union Territories maintained the number of colleges as reported in the prev'.oUI! year.

181
Pupils
The enrolment in university teaching departments, colleges and other institutions increased from 9,87,553 (8,10,134 boys and 1,77,419 girls) in 1960-61 to 10,58,020 (8,60,313 boys and 1,97,707 girls) in 1961-62. This gives an increase of 7 ·1 per cent a.s against an increase of 4· (J per cent during the previous year. The numb~r of girls constituted 18· 7 per cent of the-total enrolment as against 18· 6 per cent in the previous year. With the exception of Jammu and Kashmir, Punjab, Rajasthan and Him:1chal Pradesh, all the other States and Union Territories shared this increase. On percentage basi~, the high?st increase among the States was reiJortcd by Orissa (19·8 percent) followed by Assam (16·2 }er cent) and Bihar ( 13 · 7 per cent.) and the lowest position was held by West Bengal (1· 2 rcr cent). Among UJJ.ion Territories, the highest increase was reported by Nagaland (128·8 peHcnt) and lowest was reported by 'l'ripura (3·3 per cent). Further details arc given in table LXXII.
Table LXXll-Number of Pupils in Universities and Colleges
Increase ( +) or State/ For Boys For Girls Total Decrense (-)
Tcrrrit-ory --, ,----A----, ,----A----. ~ 10GQ.61 1961.62 1960.61 1961·62 1960.61 1961.62 Number Percentage
2 3 4 5 6 7 8 9
Andhra Pradrsh 51,7J4 57.Q46 3,447 3,799 58,221 60,845 +2,62( +4·5 Assam 26,401 30,595 1,410 1,711 27,811 32,306 +4;495 +16·2 Bihar 86.~53 98,298 3,801 4,302 90,214 - 1,02,600 +12,386 +13·1 Gujarat 47,686 53,18-1 2,667 2,754 50,353 55,038 +5,585 +11·1 Jammu &. Knsh
n:ir 7,441 7,994 3,229 2,385 10,670 10,379 -291 -2·7 Kerala 3~,762 43,400 n,298 7.212 45,060 50,621 +5.561 +12·3 Madhya Pradoeh 60,938 56,359 3,135 3,479 54,073 59,838 +5,765 +10·7 MadrBB 64,243 68,766 14,032 16,221 78,275 84,9~7 +6,712 +8·6 Mahorashtra 1.11,538 1,26,6(}2 4,422 4,967 1,15,960 1,31,629 +15,669 +13·5 Mysore 48,884 54,797 4,892 5,130 53,776 59,927 +6,151 +11·4 Orissa. 14,209 17,033 510 596 14,719 17,629 +2,910 +19·8 Punjab 57,910 53,831 8,078 7,794 65,988 61,625 -4,363 -6·6 Rajasthan 34,187 31,946 3,660 3,598 37,817 35,544 -2,103 -6·1 Ut.tar Pradesh 1,07,135 1,10,389 5,410 5,98U 1,12,545 1,16,375 +3,830 +3·4 \Vest Bengal 1,25,228 1,23,308 17,344 20,960 1,42,572 1,44,258 +1,686 +1·2 Dolbi 18,600 21,804 4,665 4,871 23,165 26,675 +3,510 +15·2 Himachal Pro.. d~.ah 1,029 1,013 1,029 1,013 -16 -1·5 Ma.nipur • 2,354 2,656 2,354 2,656 +302 +12·8 Naga.la.nd. 52 110 52 l!O +67 +128·8 Pondichcrry ·1,243 1,376 1,243 1,376 +133 +10·7 Tripuro 1,605 1,645 21 35 1,626 1,680 +54 +3·3
India 9,00,472 9,62,230 87,081 95,790 9,87,558 10,58,020 +70,467 +7•1
Of the total number of Hl,58,020 students in the Universities and colleges, 77,9ti9 were studying in university teaching departments, 3,278 in research iustit~tions, 7,24,861 in mts and science college~, 2,2fi,574 in professional and tccluucal collcgps and 2€.~48 in Efccial education colleges. The distribution of enrolment in institutiom ma!'aged by different agencies was: Government 259,282 124·5 pn c<mt), local bcarcF 1,754 (0·2 per cent) and private bodies 7,96,984 (75·3 per Ct'nt).

182
The enrolment. given above relat.:ls to univereities and colleges that i.q it also includes the sch?ol classes wherever they are attached to coll~ges. Table L)O~III, however, g~v~s the enrolment of courses of higher education only. · It will b.e seen from this table that the enrolment at the university stage increased from 10,94,991 to 11,86,097 or at the rate of 8·3 percent. Tnis constitutes 7 · 9 per cent of the total enrolment at all stages of education.
Of the total number of 11,86,097 students at the university stage 8,65,528 (6,96,219 boys and 1,69,309 girls) or 73·0 per cent took up arts and science courses, 2,96,584 (2,66,695 boys and 29,889 girh) or 25·0 per cent prQf'lssional courses and 23,985 (15,572 boys and 8,413 girls) or 2 · 0 per cent special education courses. Tile corresponding figures for the previous year were: general education courses 8,08,025 (6,58,134 boys and 1,49,891 girls) or 73 per cent, professional education.courses 2,65,111 (2,38,987 boys and 26,124 girls) or 24·2 per cent and special education 21,855 (14,500 boys and 7,355 girls) or2·0 percent. The percentage increase of enrolment for general education and professional education was 7 ·I per cent and 11· 9 pcn<ent respect.ivel y and the enrolment for special education increased by 9·7 per cent. The enrolment at university stage increased in all the States ·and Union Territories except Himachal Pradesh where the decrease was to the extent of 4·7 per cent.
The details of enrolment according to varioJLq stages and courses of studies are given in table LXXIV. It will be seen that in the case of general education, enrolment decreased at the intermediate stage, which was due to tha introduction of three years' degree courses in some of the States. Among the various professional and technical courses, commerce attracted the highest number of students (88,473) followed by engineering and technology (54,420), teachers' training (52,561), medicine (44,952), law (28,220), agriculture (18,927), veterinary science (5,638), physical education (1,016) and forestry (718). Other courses of tho professional and technical education enrolled (1,659) students in all. On percentage basis (aB compared to the enrolment of the pr~vious year) the highest increase was reported by agriculture (19·4percent) followed by engineering and technology (13·8 percent), commerce (13·0 per cent), physical education (12 · 4 pt>r cent) andteachers' training (12 · 3 per cent). In other cases, tha increase ranged from 11· 3 in medicine to 1 · 7 in veterinary science. In special education, the highest number of students was enrolled in oriental ~tudies (10,294) followed by music, dancing and other fine arts (7,070) and other subjects (6,621).
Co-education Out of the total number of 1,97,707 girls studying in institutions for
higher education, 1,02,246 or 51· 7 per cent were enrolled in co-educational institutions. In arts and science colleges (including university teaching departments and research institutions), out of the total number of 1,54,631 girls, as many as 77,894 or 50~ 4 per cent wrre studying in institutions for boys. The corresponding number in professional and special education colleges was 24,352 Qr 56·5 percent. Table LXXV gives the Stahlwise picture in this connection. In Himachal Pradesh, Manipur, Nagaland, Pondicherry and Tripura, there were no separate arts and science colleges for girls. Among the Union 'l!erritorie8 only Tripura had profe&>ional and special education college. Besides, among the States, Assam was the only exception which did not have any separate college for girls for professional and special education.

Table LXXIII-Number of Pupils Receiving General, Professional and Special Education at the University Stage
ttcnC>ral Education Professional Education ,-----------------..A..-.----------~----. ,------------ """'---------------.
State Boya Girt. Total Boys Girls Total ,--- .A.----. ,-----..A.---""\ ,----.A-----~,------'----, ,-----..A.----. I -------..A.---,
1%0-61 i961-62 1960-61 1961-62 1960-61 1961-62 1960-61 1961-62 1960-61 1961-62 1960-61 1961-62
2 3 4 5 6 7 8 9 10 11 12 13 -----
Andhm Pradesh 33,469 34,2 >2 5,838 6,409 39,487 40,611 15,583 16,813 1,452 1,689 17,035 18,502
Assam 19,793 23,040 3,-524 4,187 23,317 27,227 4,354 4,91~ 122 148 4,476 5,0f.l
Bihar . 67,971 77,64;) 5,961 6,542 73,932 84,187 15,107 17,153 476 567 15, '83 17,720 Gujarat 24,162 28,049 7,291 8,475 31,453 30,524: 15,357 1il,l07 1,006 1,126 16,363 17.2~:1
Jammu & Kashmir 6,423 11,137 1,741 2,033 8,16! 8,170 423 1,1;")0 155 220 578 1,37•) Kcralu 23,119 2.5,919 11,481 13,353 34,600 39,272 8,068 8,849 1,438 1,611 9,506 10,460 M11tlhyo. Pradesh 19, 70! 23,489 3,33:l 4,607 23,037 28,096 20,778 22,519 1,788 1,956 22.566 24,475 Madras 31,069 33,720 8,020 8,953 39,089 42,673 22,36! 22,952 5,562 5,891 27,926 28,843 >-• Muhamshtm 56,970 61,287 18,6[1; 21,082 75,586 82,369 30,846 37,770 4,898 5,985 35,744 43,75ii rFJ
:,~ :Mytwre 25,407 27,402 6,724 6,887 32,131 3!,289 17,323 19,618 1,696 1,979 19,019 21,597 Ori~su.. 9,411 11,121 1,232 1,560 10,6!3 12.681 3,118 3,987 273 338 3,391 4,325 Punjab 42,095 36,079 9,795 10,667 51.890 46,7!6 8,25S 9,282 2,007 2,511 10.26~ 11,793 Rn.jtL':Ithan 15,988 16,353 3,698 4,050 19,686 20,403 11,770 11,62~ 288 3)) 12,058 11,988 Uttar Pradesh 1,88,900 2,04,437 28,347 32,983 2,17,2!7 2,37,422 31,949 33,00:> 2,012 2,303 33.961 35,308 West. Bengal 80,167 71,737 28,238 30,498 1,08,40.) 1,02,23,} 28,140 3,3,162 1,912 2,054 30,052 37,226 Delhi 9,987 11,834 5,332 6,250 15,319 18,084 4,710 4,870 89i 935 5,604 5,805 Him~tclml Pro.do•h 652 639 222 198 874 837 52 71 17 29 69 100 Munipur 1,493 1,859 231 275 1,724 2,134 278 152 12 12 290 164 Nagalund 44 111 8 8 52 119 Pondicherry 75 209 28 40 103 2!9 230 303 76 111 306 414 Tripuro. ,055 950 231 250 1,286 1,200 279 391 40 5! 319 445
India 6,58,134 6,96,219 1,49,891 1,S9,309 8,l'8,025 8,65,528 2,38,987 2,66,695 26,124 29,889 2,65,111 2,96,584

Table LXXIII-Number of Pupils Receiving General, Professional and Special Education at the University Stage--contd.
Sp?cial Education Grand Total
Boys Girls Total Boys Girls Total State ,.... ----.. ~ -----,
1960-61 1961-62 1960-61 1961-62 1960-61 1961-62 1960-61 1961-62 1960-61 1961-62 1960-61 1961-62
14 15 16 17 18 19 20 21 22 23 24 25
Andhra Pradesh 947 963 184 248 1,131 1,211 50,179 51,978 7,474 8,346 57,653 60,324 Assam 18 18 18 18 24,165 27,971 3,646 4,335 27,811 32,306 Bihar 2,755 3,964 53 62 2,808 4,026 85,833 98,762 6,490 7,171 92,323 1,05,933 Gujarat 550 681 550 750 1,100 1,431 40,069 ~.837 8,847 10,351 48,916 55,188 Jammu & Kashmir 140 129 184 366 324 495 6,986 7,416 2,080 2,619 9,066 10,035 Kerala 388 449 144 193 532 642 31,575 35,217 13,063 15,157 44,638 50,374 Madhya Pradesh 1,385 971 1,558 1,037 2,943 2,008 41,867 46,979 6,679 7,600 48,546 54,579 Madras 1,851 1,741 805 888 2,656 2,629 55,284 58,413 14,387 15,732 69,671 74,145
1-' Maharashtra 682 1,214 692 954 1,374 2,168 88,498 1,00,271 24,206 28,021 1,12,704 1,28,292 oc Mysore 236 250 51 555 287 805_ 42,966 47,270 8,471 9,421 51,437 56,691 II>-
Orissa . 382 324 106 103 488 427 12,911 15,432 1,611 2,001 14,522 17,433 Punjab 311 281 73 159 384 440 50,664 45,642 11,875 13,337 62,539 58,979 Rajasthan 362 403 19 23 381 426 28,120 28,384 4,005 4,433 32,125 32,817 Uttar Pradesh 2,596 2,105 555 -607 3,151 2,712 2,23,445 2,39,547 30,914 35,895 2,54,359 2,75,442 West Bengal 1,215 1,259 1,741 1,806 2,956 3,065 1,09,522 1,08,158 31,891 34,368 1,41,413 1,42,526 Delhi . 551 702 590 627 1,141 1,329 15,248 17,406 6,816 7,812 22,064 25,218 Himachal Pradesh 64 39 22 5 86 44 768 749 261 232 1,029 981 Ma.nipur 60 66 14 8 74 74 1,831 2,077 257 295 2,088 2,372 Nagaland 44 Ill 8 8 52 119 Pondicherry 305 512 3: 104 151 409 663 Tripura. 7 13 14 22 21 35 1,341 1,354 285 326 1,626 1,680
India 14,500 15,572 7,355 8,413 21,855 23,985 9,11,621 9,78,486 1,83,370 2,07,611 10,94,991 11,86,097 -

Table LXX!V-Distrlbution of Pupils at University Stage Increase ( +) or
Boys Girls Total Decrease (-)
Stage ,------..A---~ ,----A------. ,------"-----~ ,- ...... 1960-61 1961-62 1960-61 1961-62 1960-61 1961-62 Number Percentage
2 3 4 5 6 7 8 9
GenCral J~ducation:
Intcrmcdiatc/Pre-Univer· 3,81,384 3,fi8,824 76,.517 77,021 4,57,901 4,~5.845 -12,0,)6 -2·6
oity B.A./B. He. 2,~~5,fi~J~ 2,81,050 6:l,379 80,715 2,99,012 3,62,665 +63,H5:l +21-~
M.A./.\!.Sc. 3H,87:l -i0,94i> 9,215 10,763 46,088 51,708 +5,fi20 +12-~
H.e~carch 3,87!1 4,178 768 779 4,647 4,957 -~-~]() +6·7
Post Graduate Diploma 365 3·)·Jo 12 31 377 35a -24\l -6·4
Total 6,58,134 6,90,21? 1,49,891 1,69,309 8,08,025 8,65,528 +57,503 +7·1
Profcs~ional Education: Agriculture 15,699 18,743 149 184 15,848 18,927 +3,07n +19·4 '""' Commerce 77,~8 87,4'>8 864 1,015 78,312 88,473 + 10,llil +1:1-0 00
Co
Engineering/Technology 47,464 53,089 374 431 47,838 54,420 +6,582 +13·S'
Forestry 683 718 683 718 +:l5 +5·1
Law 26,336 27,4li) 805 805 27,141 28,220 +1,07[) +4·0
Medicine 32,164 35,513 8,238 9,439 40,402 44,9;")~ -\--1,550 -\-11·3
Pbysicnl Education. 745 819 159 197 904 1,016 +112 12·4
'fcu.chertl Tr1Lining 31,606 3,),112 15,202 17.~9 46,808 52,5fil +5,75:1 +12·3 Veterinary Science . . 5,498 5,591 47 47 5,545 5,638 +93 +1·7 Others 1.3~ 1,:J37 286 322 1,630 1,65!) +29 +1·8
Total 2,-18,987 2,66,695 26,124 29,889 2,65,111 2,96,584 -\--31,473 +11·9
SpeciE,! Education: Music, Dancing & Other Fine Arts 2,819 3,142 3,499 3,928 6,318 7,070 +752 +11·9 Oriental Studies 8,427. 9,087 959 1,201 9,386 10,294 +!lOS +9·7 Other ::>ubjects 3,254 3,343 2,897 3,278 6,151 6,G~l +470 +7·6
TOial 14,500 15,572 7,.155 8,41.3 21,855 23,'185 -\-2,130 +9·7
Grand Total 9,11,621 9,78,486 1,83,370· 2,07,611 10,94,S91 11,!>6,097 +91,106 +8·3

Table LXXV-Number of Girls Studying for Higher Education
In Arts and Science Colleges* In Colleges for Professional and Specia.I Education State/Territory
Number of Tota.I %age of Number of No. of Tota.I No. Percentage No. of girls in girls in number of girls in girls in girls in of girls of girls in
boys' girls' girls boys' boys' girls' boys' colleges colleges I colleges colleges colleges colleges
to tota.I No. to tota.I No. of girls of girls
1 2 3 4 5 6 7 8 9
Andhra Pradesh 2,957 3,652 6,609 44·7. 1,613 147 1,760 91·6 Assam 2,509 1,711 4,220 59·5 115 115 100·0 Bihar 2,399 4,201 6,600 36·3 450 101 551 81·7 Gujarat 6,362 2,223 8,585 74·1 1,309 501 1,810 72·3 Jammu and Kashmir 278 1,776 2,054 13·5 199 609 808 24·6. Kerala 6,490 7,016 13,506 48·0 1,520 196 1,716 88·6 Madhya Pradesh 2,361 2,082 4,443 53·1 2,964 1,397 4,361 68·0 ....
00 Madras 1,554 8,119 9,673 16·1 1,676 8,102 9,778 17·1 0) Maharashtra 17,748 4,055 21,803 81·4 5,541 910 6,451 85·9 Mysore 3,314 3,632 6,946 47·7 1,484 1,498 2,982 49·8 Orissa 1,023 537 1,560 65·6 544 59 603 90·2 Punjab 4,092 6,595 10,687 38·3 3,280 1,199 4,479 73·2 Rajasthan 1,118 3,484 4,602 24·3 437 29 466 93·8 Uttar Pradesh 8,786 5,251 14,037 62·6 1,260 711 1,971 63·9 West Bengal 13,323 18,592 31,915 41·7 1,312 2,192 3,50~ 37·4 Delhi 2,748 3,811 6,559 41·9 339 1,051 1,390 24·4 Himachal Pradeah 198 198 100·0 42 42 100·0 lllanipur 282 282 100·0 103 103 100·0 Nagaland 8 8 100·0 Pondicherry 93 93 100·0 Ill 111 100 rripura 251 251 100·0 53 22 75 60·2
India ' 77,894 76,737 1,54,631 50·4 24,352 18,724 43,076 56·5
*Includes enrolment in University Teaching departments and Research Institutions.
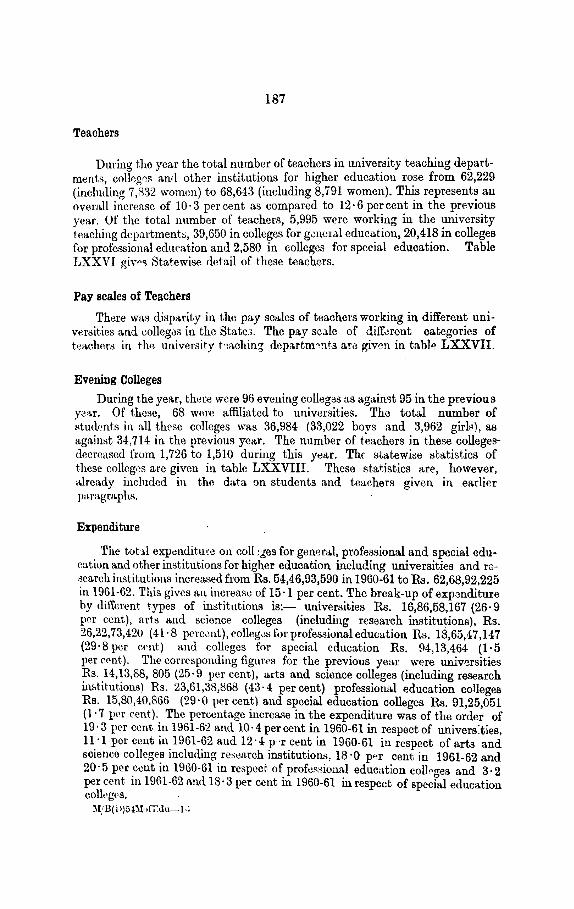
187
Teachers
Dming the year the total number of teachers in university teaching departments, colleg0~ A.nrl other institutions for higher education rose from 62,229 (including 7,832 women) to 68,643 (including 8,791 women). T~s represent~ au overall increase of 10·3 percent as compared to 12·6 percent m the previOus yeA.r. Of the total number of teA.chers, 5,995 were working in the university teaching dcpartmenb, 39,650 in colleges for g~n(Hal education, 20,418 in colleges for professionA.l education and 2,580 in colleges for special education. Table LXXVI giws Statewise detail of these teachers.
Pay scales of Teachers
There was disparity in the pay scales of teachers working in different universities and eollegas in the State:;. The pay sc.1le of dilf0rent categories of teach()rS in the university h\chin~ departm•nts ara giv0n in tab!~ LXXVII.
Evening Colleges
During the year, there were 96 evening collegas as against 95 in the previous J<!'l.r. Of these, 68 were affiliated to universities. The total number of Htudents in all these colleges was 36,984 (33,022 boys and 3,962 girl~), as against 3-1,714 in the previous year. The number of teachers in these collegesdecreased from 1,726 to 1,510 during this y<Jar. Thf statewi;e ~tatistics of these colleg.•s are given in table LXXVIII. These stat,istics are, however, alret\dy included in the data on students and teu.chers given in earlier pamgmphs.
Expenditure
The tot~! expenditu~e on coil ~;5es for gen~ral, professional and special education and other institutions for higher education including universities and rGscarch institutions increased from Rs. 54,46,93,590 in 1960-61 toRs. 62,68,92,225 in 1961-62. This gives an increase of 15·1 per cent. The break-up of exp<mditure by different types of institutions is:- universities Rs. 16,86,58,167 (26· 9 per cent), arts and science colleges (including research institutions), Rs. 26,22,73,420 (41· 8 pcrc0nt), colleg0s for professional education Rs. 18,65,47,147 (29·8 per c.mt) and colleges for special education Rs. 94,13,464 (1·5 per C<'nt). The correspomling figur<'s for the previous yel>r were univ0rsities Rs. 14,13,88, 805 (25·9 per cent), arts and science colleges (including research in&titutions) Rs. 23,61,38,868 (·!3 · 4 per cent) professional education colleges Rs. 15,80,40,866 (29·0 per cent) and special education colleges Rs. 91,25,051 (1·7 per cent). The percentage increase in the expenditure was of the order of 19 · 3 per cent in 1961-6:2 and 10· 4 per cent in 1960-61 in respect of univers:ties, 11·1 per cent iu 1961-62 and 12·4 p·r cent in 1960·61 in respect of arts and soienco colleges including resea.rch institutions, 18 ·O per cent in 1961-62 a.nd 20·5 per cent in 1960-61 in respect of profe~sional education coll""es and 3·2 per cent in 1961·62 and 18 · 3 per cent in 1960-61 in respect of special education coll,•g,•s.
~!,'B( I l)541!.,lT.<lu-J.;

188
Table LXXVI-Number of Teachers in
In University In Colleges for In Colleges for Teaching General Professional Departments Education Education
State/Territory ~ ,----..A---,
Men Women Men Women Men Women
1 2 3 4 5 6 7
Andhra Pradesh 444 I9 2,774 482 I,23I I 56
Assam 116 4 853 82 3I8 I3
Bihar 253 8 2,983 282 860 20
Gujarat 52 5 I,638 256 I,I20 46
Jammu and Kashmir 30 I 35I 90 I84 10
Kerala. 33 6 I,754 582 6I2 114
Madhya. Pradesh 196 6 2,040 218 I,697 I 54
Madras 3.59 9 2,312 775 2,I32 581
Maharashtra 297 29 3,464 808 2,996 288
Mysore 132 I 1,982 312 I,698 I70
Orissa. 37 3 664 73 380 36
Punjab 190 11 . 2,I83 417 I,024 160
Rajasthan 79 6 1,456 199 600 29
Uttar Pradesh 2,089 174 3,385 384 857 112
West ~enga.l I,I32 32 4,608 904 2,054 ll3
Delhi 220 22 724 249 489
Himachal Pr&desh . l09 12 12 2
Manipur 78 5 2
Nagala.nd 9 2
Pondicherry 47 14 81 10
Tripura 83 8 54 3
India 5,€59 886 33,496 6,154 18,401 2,017
*Includes re•earch Institutions.

189
Universities and Colleges by States
In Colleges for Total Special Education
,--- State/Territory
Men Women l\Ien Women All PeniCJns
8 9 10 II 12
217 20 4,666 677 5,343 Andhra Pradesh
4 1,291 99 1,390 Assam
81 2 4,177 312 4,489 Bihar
130 30 2,940 337 3,277 Gujarat
63 lG 628 Il7 745 Jammu and Kashmir
51 9 2,450 7Il 3,161 Kerala
~89 56 4,222 434. 4,1156 Madhya Pradesh
177 26 4,980 1,391 6,371 Ilfadras
liU 25 6,\136 1,150 8,086 Ilfaharashtra
1~2 3,934 484 4,418 Ilfysore
7f) 1,156 II3 1,269 Orissa
4!1 27 3,446 615 4,061 Punjab
227 2 2,361 236 2,597 Rajasthan
167 4 6,498 674 7,172 Uttar Pradesh
329 61 8,123 1,110 9,233 West Bengal
9 1,442 271 1,713 Delhi
H 13;") H 149 Himachal Pradesh
10-l 2 1d4 7 191 l\Ianipur
9 2 11 Nngaland
128 24 152 Pondicherry
9 2 146 13 159 Tripura
2,2ol6 234 5J,852 8,791 es,643 India

190
Table LXXVll-Pay Scales of Teachers in University Teaching Departments-contd.
University Lecturer Reader Professor
Rs. Rs. R~.
Agra 400-30-640----EB- 700-40-1,100 1,000 -50-1,500 40-800
Aligarh 400-30-640----EB-. 700-40----1,100 1,000-50-1,500 40-800
All&habad 300-20-500-EB- 800-50-1,250 25-800
Andhr& 400-30-640----EB- 700-40-1,100 1,000-50-1,500 40-800
Annarnalai 250-20-490-10- 500-25-800 800-50-1,250 500
Ban&r&a 400-30-640-40-800 700-40----1,100 1,000-50-1,500
Baroda 250-25-500 500-25-800 800-50-1,250
Bhagalpur 200-20-220-25-- 350-25--650-EB- 850-50-1,250 320-E:s-.:.25--670- 35--1,000 EB-20-750
Bihar 200-20-220-25-- 350-25--650-35-670-20-750 . 1,000
Bombay 300-25--600 500-25-800 800-25--1,250
Burdwan (i) 250-25-500 (ii) 300-25--750
500-25-800 800-50-1,250
Calcutta 400-30-640----EB- 700-40----1,100 1,000-50-1,500 40-800
Delhi 400-30-640-EB- 700-40-1,100 1,000-50-1,500 40-800
Gauhati ~30-640-EB- 700-40----1,100 1,000-50....:1,600 40-800
Gorakhpur 300-20-500-EB-25-800
800-50-1,250
Gujarat 250-25-500 500-25-800 850-50-1,250
Indira Kala 225--225--250-20- 400-25-560-EB- 800--40--1,000 Sangeet 350-EB-20-470-
485-500 35-800
Jaba1pur 250-25-500 500-30-800 800-50-1,250
Jadavpur 400-30-640----EB- 700-40-1,100 1,000-50-1,500 40-800
Jammu and 250-25--600 500-40-800 800-50-1,250 Kashmir
Kalyani 400-30-640-EB- 700--40--1,100 1,000-50-1,l!UO 40-800
Karnat&k 400-30-640----EB- 700-40----1,100 1,000-50-1,500 40-800
Kerala 400-30-640-EB- 700-40-1,100 1,000-50-1,500 40-800
Kurukshetra 400-30-640-40- 700--40--1,100 1,000-50-1,500 800
Lucknow 300-20-500-25-- 800-50-1,250 800
Madras . 250-20-470-30- 500-25--800 800-50-1,250 500
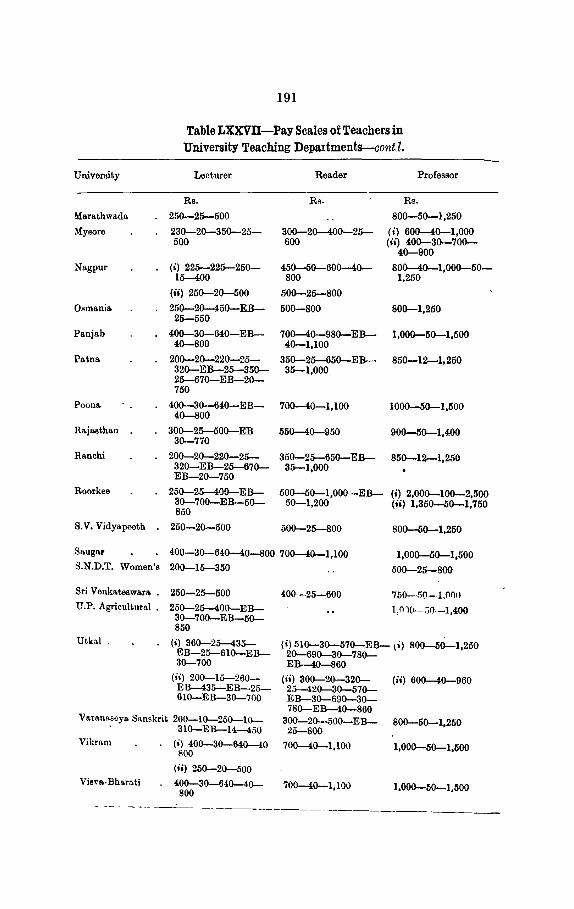
University
Marathwada
~{ysore
Nagpur
Osma.nia.
Panjab
Pa\na
Poona.
Rajasthan
Ranohi
Roorkee
S. V. Vidyapeeth
Saugar
S.N.D.T. Women's
Sri Venkateswara .
U.P. Agricultural .
Utl<nl .
191
Table LXXVU-Pay Scales of Teachers in University Teaching Departments-cont:l.
Lecturer Reader Professor
Rs. R•· Rs.
250-25-500 800-50-1,250
230-20-350-25- 300-2~0-25- (i) 600-40-1,000 500 600 (ii) 400-30-700-
40-900
(i) 225-225-250- 450-50-600-40- 800-40-1,000-50-15-400 800 1,250
(ii) 250-20-500 500-25-800
250-20-450-EB- 500-800 800-1,250 25-550
400-30-640-EB- 700-40-980-EB- 1,000-50-1,500 40-800 40-1,100
200-20-220-25- 350-25-650-EB- 850-12-1,250 320-EB-25-350- 35-1,000 25-670-EB-20-750
400-30-640-EB- 700-40-1,100 1000-.50-1,1500 40-800
300-25-500-EB 550-40-950 900-50-1,400 30-770
200-20-220-25- 350-25-650-EB- 850-12-1,250 320-EB-25-670- 35-1,000 EB-20-750
250-25-400-EB- 500-50-1,000-EB- (i) 2,000-100-2,500 30-700-EB-50- 50-1,200 (ii) 1,350-50-1,750 850
250-20-500 500-25-800 800-50-1,250
400-30-640-40--800 700-40-1,100 1,000-50-1,500 200-15-350 500-25-800
250--25-500 4.00 -25--600 760--m--l.notJ 250-25-400-EB- 1,010-~0--1,400 30-700-EB-50-850
(i) 360-25-435- (i) 510-30-570-EB- (i) 800-50-1,250 EB-25-610-EB- 20-690-30-780-30-700 EB-40-860
(ii) 200-15-260- (ii) 300-20-320- (ii) 600-40-960 EB-435--EB-25-- 25-420-30-570-610-EB-30--700 EB-30-690-30-
780-EB-40-860 VManasoya Sanskrit 200-10-260-10- 300-20-500-EB-- 800--50-1,250
310-EB-1~0 2<>--SOO Vikram {i) 400-30-640-40 700-40--1,100 1,000-50--1,500
800
{ii) 250--20-500 Vi~\"R·Bharati 4.00-30--640-40- 700-40--1,100 1,000--50--1,500
800
----·--·--------·-------------

192
Table LXXVID-Statistics of Evening Colleges*
State/Territory Number Number of Pupils on Rolls of
Number of Teachers
Colleges Boys Girls Total Hen Women Total (1) (2) (3) (4) (5) (6) (7) (8)
Andhra Pradesh 5 2,302 51 2,353 65 7 72
Assam 13 4,812 66 4,878 219 7 226
Bihar 12 1,879 203 2,082 76 11 87
Gnjarat 2 494 196 690 45 4 49
Keralat 4 496 40 536 1 2
Madhya Pradesh 6 1,6<!2 53 1,695 35 6 41
Madras 1 249 59 308 27 6 33
Maharashtra 3 2,025 58 2,083 40 1 41
Orissa 2 123 262 385 25 25
Punjab 267 267 12 12
Rajasthan 1 333 1 334 14 14
Uttar Pradesh 12 1,597 736 2,333 112 5 117
West Bengal 26 12,475 2,180 14,655 643 30 673 •
Deihl 6 3,757 52 3,809 115 3 118
Manipur 2 071 5 576 :j: :j: :j:
India 96 33,022 8,962 86,984 1,429 81 1,510
*Excludes seven affiliated Colleges, three in Assam and one each in Madhya Pradesh. Ori88a, Punjab and West Bengal and three non-affiliated colleges in Manipnr for non-availability of statistics.
tlnformation in respect of teachers of three non-affiliated colleges is not available.
:j:Not available.
The distribution of the total direct expenditure among the various sourcfs of income is given in table LXXIX below:- -
Table LXXIX-Direct Expenditure on Universities and Colleges by Sources
1960-61 1961-62 Source
Amount Percentage Amount Percentage
Government Funds 28,94,6!,621 53·1 33,8<!,5!,514 54·0 Local Board Funds 20,96,108 0·4 21,38,975 0·8 Fees 18,02,47,492 34·7 20,82,97,324 33·2 Budowmonts 2,12,03,930 3·9 1,72,35,049 2·8
Otho1' sources 4,20,81,439 7·9 6,07,66,363 9·7
Total 54,46,93,590 100·0 62,68,92,225 100·0

Hl3
The govemmeut fumL~ and fees account€d for 54·0 per cent ancl 33·2 per cent respectively of the expenditure. Contribution of local boards was negligible (0 · 3 per cent). The remaining expenditure was met from endowments (2·8 per cent) and other sources (9·7 per cent).
Of the total expenditure, Rs. 20,37,96,787 (32· 5 per cent) were spent on government institutions, Rs. 22,70,313 (0·4 per cent) on local bodies colleges and Rs. 4:2,08,25,125 (67 ·1 per cent) on institutions managed by private bodies. The corresponding percentages for the previous year were 32 · 8 per cent, 0 · 4 per cent and 66 · 8 per cent respectively.
The tobl direct expenditure on universities and colleges (separately for general, professional and special education) in different States is shown in Table LXXX. H will be observed that the direct expenditure increased in all the States and Union Territories.
On percentage basis, the highest increase in expe~cliture on higher education was reported by Jammu and Kashmir (58· 2 per cent) followed by Orissa (27 ·9 per cent) and Mysore (23· 7 per cent) while the lowest increase was reported by West Bengal (9· 6 por cent). Among the Union Territories the percentage ranged from 8·9 per cent in Himachal Pradeflh to 5·72 per cent in Nagaland.
Figures in col. (15) of Table LXXX give percentage of expenditure incurred on the uuivcrsities and colleges to the total direct expenditure during the year. It varied from 13· 5 per cent in Kerala to 27 · 2 per cent in Uttar Pradesh among the States and from 1· 9 per cent in Nagaland to 42 · 9 per cent in Pondicherry amot1g the Union Territories. .
The percentage of direct ex]_Jenditure on universities and colleges met from various somces is given in cols. (16) to (20) of Tabl~ LXXX. Government contributed ru;tjor share of expenditure in 10 States varying from 51· 5 per cent in :Uadms to 78·9 pH cent in Jammu & Kashmir. Punjab reported the lowes~ contribution from Government funds in the field (32·1 per cent). The shares of [ot'al boards were insignificant in all the States.
Fees nwt between 17 · 6 per cent of the expenditru:e in Jammu and Kashmir to 5li · 2 per cent in Punj<lb. Significant contribution' from endowments and other '<>UW.'S ranged from 3· 3 per cent in Assam to 2·1· 6 per cent in Utbr Prwr'esh. Among the Union Territories, the major share of expenclitu~.? IV'.~! 1,0''"'' by the Gowrnment (('xcept in Nagaland) the largest beinO' the Himachal Pradesh ( '~ " l 0 . t!<J • <J pPr eent) and t te samlkst in Manipur (52· 0 per cent) .
. The average :\nnunl cost per stutlent in arts and science colleges, pro[,.,slotml and t.f1chnieal collcges and special education colleges may be seen in eols. (21) to (23) of Tahle LXXX. As usual wide variations were noticeable «mong. the .tli!It•rent stak~. . On an average the annual cost per pupil was Hs. 361· 8 man ••rts anrl sctcnce college, Rs. 827 ·0 in a college for professional <'.Jucunon and Rs. 337 · 3 in ,, speciaJ education coll••.£p. Scholarships and Stipends
1. A smn of R.". 5,31,589 ""''' distributed to various institutions in the ~:ountr~· fnr the development. of drmcP, drama an•l music.
:2. At. prc':«•nt there are :280 sc.holars under O'oiu" studies tmdcr the sch'lme of Sl'h•>hrshtps f•Jr the study ofHin<li for stnd<Jnts from
0
Non-Hindi-speaking States,

Table LXXX-Direct EXPenditure on
Universities Arts & Soiencet colleges Colleges for Edu
S$ate/Terrltory ,---"-
1960-61 1961-62 1960-61 1961-62 1960-61
1 2 3 4 5 6
Andhra Pradesh 1,29,19,326 1,42, 70,390 1,57,48,843 1,77,26,847 1,02,35,474
Assam 29,81,475 38,62,358 46,10,736 54,67,740 32,21,944
Bihar 45,42,899 62,33,4~6 1,52,28,061 1, 74,94,269 80,75,701
Gujarat 1,09,97,477 1,06,37,153 1,15,53,570 1,47,24,121 85,88,532
Jammu & KashmiJo 8,63,341 11,31,682 16,37,934 24,26,297 7,58,577
Kerala 46,37,492 50,98,451 1,16,42,271 1,23,96,031 44,82,240
Madhya Pradesh 66,60,722 54,86,223 1,29,29,981 1,54,05,556 1,33,17,983
Ma.draa 93,79,490 94,11,144 1,54,67,535 1,69,26,157 1,54,89,912
Ma.harashtra 1,34,03! 734 1,61,94,080 2, 73,92,209 3,14,05,224 2,45,64,108
Mysore 33,95,603 49,32,989 1,34,90,350 1,44,47,686 89,77,394
Orissa 10,80,761 16,14,963 37,77,921 49,35,178 25,59,390
Punjab 98,25,238 1,16,44,096 1,49,96,165 1,61,07,818 94,80,537
Rajasthan 19,94,278 24,98,695 1,06,96,884 1,18,17,872 59,02,325
Uttar Pradesh 4,03, 75,085 5,24, 70,795 3,02,38,275 3,29,58,462 89,44,404
West Bengal 1,43,83,143 1,81,67,103 3,12, 75,737 3,11,93,525 1,96,56,720
Delhi 39,48,741 50,04,589 1,28,23,529 1,40,51,101 1,26,90,169
Himachal Pradesh • 8,10,629 8,51,688 97,088
Manipur 4,36,797 4,63,473
Nagaland 61,200 93,470
Pondioherry 7,90,067 7,97,642 8,32,874
Tripnra 5,21,174 5,83,263 1,65,494
India 14,18,88,805 16,86,58,167 23,61,88,868 26,22,73,420 15,80,40,866
tinoludea research lnewtutions also.

195
Universities and Colleges by States . Professional Colleges for Speoi"l Total ostion Education
St,.te/Territor.v
1961-62 1960-61 1961-62 1960-61 1961-62
7 8 9 10 II
1,08,39,757 5,82,116 6,61,155 3,94,85, 759 4,34, 98,149 Andhra Pradesh
34,12,055 24,271 11,223 1,08,38,426 1,27,53,376 Assam
96,69,627 3,39,640 3,30,182 2,81,86,301 3,37,27,534 Bihar
94,90,221 9,66,061 9,32,768 3,21,05,640 3,57,84,263 Gujarat
17,94,444 2,56,247 2,10,274 35,16,099 55,62,697 Jammu and K&shmir
56,49,918 1,77,725 1,65,845 2,09,39, 728 2,33,10,245 Kerala
1,69,36,190 10,81,876 12,18,855 3,39,90,562 3,90,46,824 Madhya Pradesh
1,84,75,266 6,71,015 8,06,092 4,10,07,952 4,56,18,659 Madras
2,77,05,007 11,03,158 9,46,017 6,64,63,209 7,62,50,328 Maharashtra
1,26,29,748 2,88,170 3,36,647 2,61,51,517 3,23,47,070 Mysore
29,55,330 2,20,304 2,63,420 76,38,376 97,68,891 Orissa
1,02,48,424 1,04,052 2,02,286 3,44,05,992 3,82,02,624 Punjab
73,00,354 6,67,420 7,19,310 1,92,60,907 2,23,86,231 Rajasthan
95,67,148 8,11,180 8,76,368 8,03,68,944 9,58, 72,773 Uttar Pradesh
2,24,01,690 10,27,163 9,72,723 6,63,42, 763 7,27,35,041 West Bengal
1,67,60,742 7,03,402 6,35,385 3,01,65,841 3,54,51,817 Delhi.
1,32,193 55,770 65,650 9,63,487 10,49,531 Himachal Prade•h
5,0U 33,325 48,927 4,70,122 5,17,474 Manipur
61,200 93,470 Nagaland
12,70,235 16,31,941 20,67,878 Pondicherry
2,il3,700 12,168 10,337 6,98,824 8,47,350 '.rripura
18,65,47,174 91,25,051 94,18,464 54,46,93,590 62,68,99,295 India

li:JB
Table LXXX-Direct Expendit!Ue on the
Increase(+) or Decrease(-) Percentage of Percentage of Total Direct me'
Expenditure on Education
State/Territory ,---'-----, ,--------
Amount Percent- 1960-61 1961-62 Govern- Local" age ment Board
Funds Funds
12 13 14 15 16 17
Andhra Pradesh + 40,12,390 +10·2 20·0 20·2 52·6 0·1
Assam + 19,14,950 +17·7 16·4 16·3 53·7 0·1
Bihar + 55,41,233 +19·7 19·0 20·4 ;(9·3 0·0
Gujarat + 36,78,623 +ll·5 21·2 22·4 47·3 0·8
Jammu and Kashmir + 20,46,598 +58·2 20·1 23·8 78·9
Kerala + 23,70,517 +ll·3 13·3 13·5 43·9
Madhya Pradesh + 50,56,262 +14·9 20·8 19·3 74·8 0·0
Madras + 46,10,707 +ll·2 18·0 17·7 51·5 0·1
Maharashtra + 97,87,ll9 +14·7 18·6 19·3 40·2 2,1
Mysore + 61,95,553 +23·7 19·3 20·8 55·9 0·1
Orissa + 21,30,515 +27·9 15·9 17·4 66·0 0·0
Punjab + 37,96,632 +ll·O 24·6 24·8 32·1 0·3
Rajasthan + 31,25,324 +16·2 19·4 18·5 69·1 0·0
Uttar Pradesh + 1,55,03,829 +19·3 26·2 27·2 54·4 0·0
West Bengal + 63,92,278 + 9·6 27·0 26·3 57·9 0·0
Delhi + 52,85,976 +17·5 38·1 36·7 77·5 0·0
Himachal Pradesh • + 86,044 + 8·9 10·6 9·3 85·5
Manipur + 47,352 +10·1 6·4 5·7 52·0 1·9
Nagaland + 32,270 +52·7 1·9 1·9
Pondioherry + 4,35,937 +26·7 40·9 42·9 63·3
Tripura + 1,48,526 +21·2 8·0 8·5 80·2
India + 8,:?1,98,685 +15·1 21·2 21·5 54·0 0·3

!Vi
Universities and Colleges by States-eontd.
Expenditure (1961-62) from
Average Annual Cost per pupil (I961-62)
,-·----------A---------~ Sta tejTerritory
Fee• Endow- Other In Arts In Colleges In Colleges ments Sources & Science for Prof. for Spl.
Colleges Education Education
18 19 20 21 22 23
27·6 3·1 16·6 405·2 868·4 619·6 Andhra l'radesh
~2·9 1·1 2·2 I97·0 I,I27·6 623·5 Assam
39·0 1·6 10· I 2I1·2 697·2 568·3 Bihar
38·0 0·4 I3·5 430·3 558·0 583·3 Gujarat
17·6 0·2 3·3 30!·I I,380·3 250·6 Jammu & Kashmir
47·0 O·I 9·0 297·0 710·5 234·9 Kerala
20·0 0·7 4·5 446·3 938·3 273·I ;\Iadhya. Pradesh
33·2 I3·4 I· 8 382·3 528·8 452·3 ::\Iadras
~~·6 1·4 9·7 360·0 708·5 450·9 Maharashtra
36'7 0·9 6·4 408·1 621·1 I36·6 Mysore
!M·2 4· I 3·7 383·6 767·0 445·7 Orissa
56·2 7·8 3·6 348·7 824·1 155·7 Punjab
~1·7 6·9 2·3 457·5 I,l48·0 315·5 Rajasthan
21·0 1·6 23·0 454·5 1,098·3 432·6 Uttar Pradesh
35·8 0·8 5·5 293·3 1,105·8 281·1 West Bengal
I7·2 0·5 4·8 735·2 3,259·0 1,050·2 Delhi
11·4 0·3 2·8 992·6 1,673·3 863·8 Himachal Pradosh
42·9 3·2 20!·8 145·0 136·7 ~Ianipur
I9·7 36·1 44·2 785·5 Nagaland
4·5 32·2 8~9·1 3,068·2 Pondh·herry
18·5 I ·3 434·6 837·5 295·3 Tripur:.
33·2 2·8 9·7 361·8 827·0 357·3 Injia

198
3. A sum of Rs, 2· 22 crore was placed at the disposal of the State Governments and Union Administrations for implementation of the scheme for award of scholarships to students belonging to scheduled castes, scheduled tribes and other backward classes for post-matriculation studies in India. In addition the State governments utilized funds from their own resources. Under this scheme 49,015 8,548 and 18,114 scholarships were awarded to students belonging to ocheduled castes, scheduled tribes and other backward classes respectively involving an expenditure of Rs. 2,13,89,315, Rs. 36,77,669 and Rs. 1,01,96,381 respectively.
4. During this year, the following government of India overseas scholarships schemes were in operation:- ·
(a.) Under Agatha Harrison fellowship scheme, which is of five years duration, the scholar who was sent in 1956-57 continued his work during this year.
(b) Under the central oversaa.s scholarships scheme, no fresh awards were made. Of the six scholars already studying under the scheme, five returned after completing their studies abroad.
(c) No new scholarship was awarded under foreign languages scholarships scheme and fully paid overseas scholarship scheme. Scholars of earlier bat{lhes continued their studies.
{d) Under the programme for exchange of scholars between India and U.S.S.R. instituted during this year, the names of ten candidates were recommended to U.S.S.R. government for award of scholarships.
(e) Under the programme for the exchange of schoillrs between India and Rumania two Indian scholars of 1960-61 who had been awarded scholarships were prosecuting their studies.
(f) Programme for exchange of scholars between India and U.A.R. was also instituted and t-hree Indian scholars already studying in U.A.R. were given the scholarships.
(g) 14 scholarships were awarded to studunts belonging to scheduled castes (5), scheduled tribes (5), and other backard classes (4) under the overseas scholarships for scheduled castes, scheduled tribes and other backward classes.
(h) No award for Humanities was given during this year under the Union Territories overseas scholarships. Scholars of preceding years continued their studies abroad during this year.
(i) Besides, there were also other scholarships/fellowships awarded under United Nations UNESCO and Commonwealth Education Cooperation Plane.
5, The post-Matrio Merit scholarships scheme had been replaced by the newly instituted "National Scholarship~ SohemJ". Under this scheme 806 scholars continued their studies during this year. .
6. National scholarships scheme for post-Matric education was introduced during this year. Under this scheme 2,119 candidates for scholarships out of the total of 2,400 for 1961-62 had been selected and they were prosecuting their studies. Selections for the remaining 281 awards would be made shortly.

OUTPUT OF GRADUATES IN THOUSANDS 72
1961-62
PH EDUCAT
AGRICULTURE OT & FORESTRY
LAW ·VETERINARY SCIENCE

199
7. Another scheme introduced during this year was the merit scholarships fur the children of primary and secondary school teachers- for post-matric studirs. A total of 2,500 scholarships (500 every year) would be awarded during the Third Plan. Candidates for 477 scholarships for 1961-62 had be~n selected. ·
8. A scheme for post-graduate scholarships in humanities was tak(m over 1r1,m U.G.C. with effect from 1961-62. Seventy scholars of 1960-61 n.nd eighty schnlrlrs awrmled scholarships during this year were prosecuting their studi0s.
9. Post-graduate. scholarships-in-science scheme was alsotakenoverfrom U.G.C. 150 students had been awarded scholarships during this year.
10. A number of fellowships are at present available to students in the uniYersities. Some of them are provided by the Co1mcil of Scientific and Industrial Research, the AICTE etc. The value of junior and senior fpl!owships has been fi.xed at Rs. 300 and Rs. 500 per month res1,ectivcly. Twenty-five junior fellowships in humanities and 86 junior fellowships in science were awarded dnring the yer1r and gri1nts ammmting to Rs. 1· 5lakhs were paid.
Twenty-seven senior fellowships in engineering and technology were awarded during the year and a sum of Rs. 92,000 was paid on this account. Senior fellowships of the value of Rs. 500/- were awarded to 12 candidates in humanities itnd to 31 candidates in science. A sum of Rs. 1· 49 lakhs was paid towards the senior fellowships in science and humanities.
Examination Results
The following table gives the results of pre-university, intermediate, de&rce ttnd post-gracluat~ examinations held during 1960-61 and 1961-62.
Table LXXXI-Examination Results
Examination Number Number Pass Appeared Passed Percentage r--~ .-------"-------. 1960-61 1961-62 1960-61 1961-62 1960-61' 1961-62
.2 3 4 5 6 7
Pre-University (Arts & Science) 2,14,997 2,91,347 92,288 1,29,763 42·9 4A·l
I.A.* 2,01,3-10 1,58,5!9 80,754 65,19:) 40-1 ·H·I l$c, 84,370 136,389 34,977 29,477 40·0 4!',! B.A. (Pass & Hons.) 1,42,273 l,fi1,980 65,138 70,~01 ·45·8 4u·2 B.So. (Pass & Hons.) 61,666 66,220 27,814 29,078 45·1 43·9 M.A. 23,276 2-!,95-1. 18,948 20,8:17 81·4 83·5 M.Sc. 6,304 6,608 4,737 5,IIO 75·1 77·3 Pre-Professional 7,475 3,576 4,670 2,130 62·5 59·6 Professional Subjcctst 93,417 1,00,961 60,163 64,925 64·-1. 64·3
•11\ .\ndhm Pradc::~h 3.Tht ~[atlras, I. A. includes I.Sc.also. tTho fi~un--s rolato to d.ogrco and equivalent diploma examinations ou..ly.
The Statewisc distribution of passes in LA., I.Sc., B.A., B.Sc., M.A., l\I.Sc. and professional degree courses is shown in table LXXXII.

200
Table Lxxm-University Examination
State/Territory Pre-University Arts & Science Intermediate Arts
-,
Number Number Passed Number Number PaBSed Appeared Appeared
Boys Girls Tot~>! Boys Girls Total
1 2 3 4. 5 6 7 8 9
Andbra Pradesh 27,099 9,579 1,826 11,405 2,758 1,107 107 1,214
Ass~>m 9,970 5,290 924 6,214 9,M6 2,!l49 706 8,655
Bihar 44,159 16,785 1,885 18,670 4.62 136 8 144
Gujarat 9,245 3,617 1,571 5,188
Jammu & Kashmir 2,121 364 79 443 1,952 393 237 630
Kerala 80,918 9,394 4,105 13,499 --Madhya Pradesh 22,840 8,499 1,062 9,561
Madras 35,717 12,28! 2,901 15,188 3,99St 1,19!f 25!t l,145f
Maharashtra 26,426 8,570 4,624 13,194 8,908 1,805 1,541 3,346
Myeore 34,934 8,525 2,148 10,673
Orissa 6,218 3,554 495 4,0!9 ',0{5 381 28 4(9
Punjab 21,622 6,903 2,873 9,776 10,625 1,826 1,029 2,855
Rajasthan 8,079 2,356 761 3,117 8,710 2,923 520 3,443
Uttar Pradesh 1,019 327 154 481 55,351 18,254 6,376 24,639
West Bengal 41,689 15,421 5,610 21,031 21,414 5,765 2,441 8,206
Delhi 3,014 771 517 1,288
Himachal Pradesh 361 153 34 187
llanipur 839 411 39 450 974. 266 20 286
Nagaland 20 10 10 19 a 2 16
Pondicherry 142 75 13 88
Tripur& 581 132 35 167
India • 2,94,347 1,00,772 28,991 1,29,768 1,58,549 49,261 15,984 65,195
t Includes Intermediate Science also.

201
Results by States ·
Intermediate Science B.A. (Pass & Hons.) ---,
Number Number Pa.ssed Number Number Pa.ssed Appeared ,.-----J'--- ---. Appeared "---. State/Territory
Boys Girls Total Boys Girls Total
10 11 12 13 14 15 16 17
8,483 2,238 478 2,716 Andhra Pradesh
2,676 1,373 85 1,458 4,290 1,230 342 1,572 Assam
26 8 6 14 18,924 5,950 864 6,814 Bihar
4,330 2,548 289 2,887 5,128 2,556 1,352 3,908 Gujarat
2,221 652 86 738 939 366 177 543 Jammu & Kashmir
3,772 751 437 1,188 Kerah•
821 223 20 243 6,539 3,483 1,030 4,513 Madhya Pradesh
6,849 1,516 518 2,034 Madras
9,543 3,595 1,129 4,724 13,163 4,395 3,070 7,465 Maharashtra
2,777 706 449 1,155 Mysore
14/i 57 'I 64 2,204 993 160 1,153 Orissa
4,868 1,379 ' 1,383 21,349 5,937 1,981 7,905 Punjab
1,516 569 61 630 7,094 2,508 665 3,173 Rajasthan
33,353 13,664 831 14,496 24,076 9,295 3,664 12,959 Uttar Pr~desh
6,673 2,587 lllil 2,745 21,615 6,311 4,130 10,441 West Bengal
3,913 1,339 1,013 2,352 Delhi
81 27 13 40 Himachal Pradesh
146 100 13 113 338 64 11 75 Manipur
Nagaland
16 6 2 8 Pondicherry
71 29 l 32 430 140 47 187 Tripura
66,389 26,784 2,~93 2~,477 1,51,980 49,811 20,403 70,201 India
M, B(l')SU!oiTdn-17

202
Table LXXXII-Examination
B.So. (Pass & Hons.) M.A. .....,
StateJTerritory Number Number P&88ed Number Number Passed Appeared Appeared,-
Boys Girla Tot&! Boys Girls Tot&!
18 19 20 21 22 23 24 25
Andbra Pradesh 5,994 i,577 412 1,989 451 322 71 303
Aas&m 665 348 21 369 315 197 33 230
Bihar 3,511 i,350 38 1,388 2,524 1,932 189 2,121
Gujarat 1,634 1,024 129 1,153 732 4!5 151 596
Jammu & Kashmir • 477 199 16 215 136 77 24 101
Kemla 9,802 2,038 1,176 3,214 287 170 97 267
Madhya Pradesh 1,725 917 134 1,051 i;798 (218 • 297 1;523
M&dr&s 11,189 2,583 738 3,321 594 377 95 472
Maharashtra 7,775 3,929 920 4-,849 1,930 1,011 .. 458 1,469
Mysore 4,422 sao 285 1,115 395 257 67 324
Orissa 700 377 29 406 231 160 32 192
Punjab 2,887 1,303 57 1,360 2,032 1,211 419 1,630
Rajasthan 662 296 40 336 1,3R3 928 276 1,204
Uttar Pradesh 6,389 3,479 274 3,753 8,318 5,646 1,883 7,529
West Be~gal 7,676 3,647 401 4,04-8 2,69~ 1,295 612 1,907
Delhi 584, 380 73 4-53 1,134 618 269 887
Himachal Pradesh 8 3 3
Manipur 49 22 22
Pondioherry 16 8 8
Tripur& 65 23 2 25
In:lla , 66,220 24,333 4,745 21,078 24,954 15,864 4,973 20,8S7

C,GOS 4,457 653 5,110 530 410 50 460 India
)113( ')51)IofEdu-17a

204
Table LXXXII-Examination Results by States-concld.
Prof Degrees and Equivalent Diplomas
Pre-Professional
r--- ,---·
StatejTerrito!'Y Number P6886d Number Passed·
Number Boys Girls Total Numbe•· Boys Girls Total Appeared Appeared
3' 35 36 37 38 39 40 41
Andhra Pradesh 6,517 3,523 446 3,969 1,419 797 122 919
A886m 1,072 570 31 601
Bihar 6,102 4,248 211 4,459
Gujarat 4,417 2,703 284 2,987
Jammu & Kashmir 386 196 88 284 .. Kera!a 4,075 2,380 958 3,338 552 343 52 395
Madhya Pradesh 5,229 3,708 327 4,035 11 9 9
Madras 8,359 3,911 624 4,535 90 37 23 60
Maharashtra 12,418 6,696 1,051 ~.747 765 ~5 352
My sore 5,985 3,070 240 3,310
Orissa 1,004 714 46 760
Punjab 6,990 2,856 1,60C 4,456
Rajasthan 2,598 2,026 107 2,133 630 324 S24
Uttar Pradesh 19,509 10,888 1,324 12,212
West Bengal 14,640 8,076 601 8,677
Delhi 1,885 i,047 221 1,268 50 19 22 41
llimaohal Pradesh 78 46 23 69 59 30 30
Manipnr 43 27 2 29
Pondioherry 19 10 3 13
Tripnra 135 41 2 43
India • 1,00,961 56,736 8,189 64,925 3,576 1,910 220 2,130

CHAPTER VII
TRAINING OF TEACHER')
Training of teachers is a vital part of ~ur educational system. in as much as the improvement in the standard of educatiOn depends largely on 1t. The Central Government as also the State Governments undertook various activities in this direction during the year under report. A brief sketch is given below:
Main Developments at the Centre
A programme for the orientation of primary school teachers in community development was taken up during the year. The main object of this scheme is to train the primary school teachers so that they may be enabled to play an effective role in the commun'.ty development programmes and make the primary school a centre of the community. The programme proposes to make this orientation an integral part of the training of primary teachers. For this purpose, seminars of principals of training institutions for primary teachers were or-ganised at the social education organisers' train~n~ ce?-tre.s ~d it. was prop~ed to train two members of staff of every teacher trammg mstitutwn m communtty development. During the year under review, nearly 800 members of the staff of these training institutions were given orientation in community developmen~ anll about 500 principalR of training institutions attended the special seminars organised for them.
The report of the first National Seminar on the Training of Primary Teachers was published during the year and the recommendations made by the Seminar were being implemented.
The Central Institute of English, Hyderabad, established in November, 191>8 in cooperation with the Ford Foundation and the British Council to stem the falling standard of English in India, undertook various activities during the year. Two seminars were organised by the Institute in Srinagar in May and Juno 1961. The first was intended for the Directors of Education and the Chairmen of the Boards of Secondary Education. It was organised with a view to apprising the educational administrators and training college professors of the current position of English teaching in our high schools and the consequent need for effecting reforms in the light of the latest thinking and research in the field. The second seminar was attended to by the university professors of English and the Chairmen of the Boards of Studies in English. The Institute also organised a short training course for the secondary school teachers of Jammu & Kashmir State. The course was conducted by the Education Department of the State who utilised the expert services of the staff of the Institute for the pu.rpo3e. Teachers were given daily practice in useful skills like the construction of substitution tables, the ability to speak within a restricted voc<\balary and production of English sounds. They were also trained in the teach ina of textbook analysis. The Institute conducted its sixth regular four-mouth tn~inin" course which was attended by 52 tra.inees drawn from training cuilerro le.:tur~rs arts and science college lecturers and higher seconduy schoJi t<)achors. '
200

206
A four-day course was run by the Institute's staff in Bomb:~.y and Auran• gabad for the benefit of pre-university teachers of English- at the request of the B.N.D.T. University for Women and the Marathwada University.
In February, 1961, a committee was set up by the Central Ministry of Education to review the work and progress of the Institute. One of the main recommendations of this committee related to the starting of a nine-month course for the training of key personnel so that they would ·be thoroughly equipped for·conducting training courses for the teaching of English in. their own States. ·
The scheme of opening Hindi teachers' training colleges, for whose. establishment and running, the Government of India bears 100 per cent expenditure, was continued. During the year u.ri.der review, training colleges for Hindi teachers were set up in Kerala and Mysore where 200 teachers were undergoing training, and grants of Rs. 2, 75,000 and Rs. 84,370 respectively were given to enaole them to meet the entire expenditure on the setting up and running of these training colleges. Besides, the training facilities in the Mah·uashtra State were e:q>anded ·by starting four additional short-term Hindi teachers' training courses.
The Central Institute of Education, Delhi, recorded all-round progress during the period under review. 100 students passed the B.Ed. examination and 14 the M.Ed. examination held during 1960-61. During the current session, 105 students were admitted to the B. Ed. and 16 to the M.Ed. classes. In addition, there were 26 Ph.D. students pursuing research in different areas of eduoationaltheory and practice .. Five research supervision committees for different subject-areas were organised with th-ree or four members of the staff on each committee to assist the M.Ed. students in the preparation of their research subjects, The areas covered are (i) educational philosophy, educational sociology and teacher education, (ii) educational psychology including guidance and counselling, (iii) curriculum construction, textbooks and the methodology of teaching, (iv) educational administration and (v) experimental education. Additional opportunities were provided for small group discussions on every alternative Saturday in the form of seminars guided by the members of the staff. A four-month short-term course was conducted by the Institute for teachers of the fine arts stream of multipurpose schools on the methodology of teaching fine arts in schools. Nineteen members from different universities participated in a seminar on educational administration which discussed ways and means of improving the teaching of the subject offered at the M.Ed. level and also considered how research work in the subject could be made more effective. Further, during the year the Institute brought out sixteen publications on various aspects of education.
. The Department of Extension Service, under the Central Institute of Education., undertook, among other things, a tbree-weck refresher course Oil the teaching of English th-rough the structural approach, a social studies project aimed at giving the teachers a thorough understanding and orientation in the subject, a project on 'School as a Teacher Education Agency' in schools where practice teaching is done, and intensive work with an on-the-spot guidance to about twenty rural higher secondary schools to assess the difficulties and problems placed by teachers and to help them to find solutions through special projects and experiments.

207
MAIN DEVELOPMEN.rS IN THE STATES
Andhra Pradesh
· Hindi Pandits' training course was conducted at the Government Training· College, Hyderabad, to prepare trained teachers in Hindi. 27 candidates were admitted to the course and at the end of the course they appeared for the examination conducted by the Commissioner for Government Examinations.
Three private institutions were given grants-in-aid during 1961-62; 80 students were trl).ined in these institutions.
A short-term training course in Hindi for teachers' training certificate holders was conducted at the Government Training College, Hydera.bad, for 13 students;
Assam A scheme for raising the annual intake of the existing teachers' training
institutions and for establishing more new ones was taken up. To bridge the gap between the systems in the traditional elementary schools and basic pattern· of schools, an orientation programme. was taken up with proper syllabus and reading materials for a short training course to the untrained teachers. ID addition a programme of extension inservice training was initiated by organisi.Pg monthly gathering of teachers.
To overcome the general shortage of qualified teachers for secondary schools, a number of teachers were given inservice training in science subjects and some teachers were deputed for postgraduate studies. The Gauhati University also instituted a post-graduate vacation course in science subjects for the teachers of secondary schools.
During the year the construction works of buildings of the basic trainina centres which were to _be opened in 1962-63 were completed.
0
Bihar
To provide inservice training facilities for secondary school teachers, the All India Council for Secondary Education provided Extension _Services Departments in four training colleges.
Gujarat
Under the training programme for primary teachers, two. additional divisions were opened in each of the nine training colleges set up durina 1960-cl under the Government of India scheme.
0
An amount of Rs. 9,035 was spent for payment of stipends to forty women teacher trainees during the year. /
A seminar of science teachers was organised in which twentyfive teachers par~icipated. . _ · .
;Jammu & Kashmir
With a view to meeting the growing need for trained teachers required for ~he schools ':hie~ were opened, and. U_Pgraded in much larger numbers, the mtake capac1ty Ill the teachers trallllllg schools was increased from 600 in 1960-61 to 65! in 1961-62.

208
Kerala
. Tv.o courses, viz. a diploma course for high school teachers and a certificate course for upper primary school teachers were introduced in the Training College for Hindi Teachers set up at Ra.mavarmapuram, Trichur, in 1961. The trainees of the college participated in practice teaching as also in general competitive functions conducted inside and outside the college especially in connection with the Tagore Centenary Celebration of 1961 and secured prizes.
Madras . . . . "
During the year under report, one aided training school for women was set up at Tiruchirapalli, and one training college for women was opened at ]radras. ·
· Pandits' training classes for .the training of language teachers (Tamil) were conducted during the year in the Teachers' College, Saidapet. Similar courses were also conducted during the year in the Government Training College, Komarapalayam. Primary English teaching courses were conducted in four traini,ng centres at Pallavaram, Coimbatore, Virudhunagar and Tiruchirapalli. Two B.T. courses of three months' duration each for graduate secondary grade trained teachers were held in the Teachers' College, Saidapet. 'Further, M.El. course was newly started in Sri Ramakrishna Mission Vidyalaya Teachers' College, Perianaickenpalayam, Coimbatore District.
Maharashtra
· . During the year three teachers' training college for degree courses, one each at Sangli, Dhulia and Am.ravati, were newly started. The number of prima.ry training colleges for women increased by 4.
Mysore;
Four new teachers' training institutions were opened under the Government of India scheme, each with an intake capacity of 100. A short orientation training in basic education methods for a period of three months was given to 150 teachers at the Dodballapur Post-Graduate Basic Training College. Two morJ orientation training centres were also started at Jamkhandi and Gurigunta.
- '
Orissa
A site was selected by the D.P.I. in consultation with the Revenue authorities ·for construction of the buildings of a new teachers' training college to be started with effect from July, 1962. at Sambalpur. Steps were also taken for
· construction of the buildings.
Two new eecondary training schools were started during the year, one at Bhawanipatna. and the other at Baripada, with an admission capacity of 40 each.

A short-term training course for imparting training to 400 'school mothers' was organised in some centres. :ren co~d~nsed oo~se training centres were started in selected high schools w1th adiD!SSlOn capa01ty of 40 each. A refresher course training for a batch of 23 trained and untrained undergraduate women teachers was organised in the Ravenshaw Girls' School, Cuttack.
The Government sanctioned a sum of Rs. 10,000 for improvement of existing old elementary training schools in the State. A sum of Rs. 6,000 was placed at the disposa~ of the O:ganiser, Ba~io Ed~oatio~,. Orissa, for purchase of library books and s01ence eqmpment for s1:X: basw trammg schools.
Punjab
244 units for the training of J.B.T. teaahers were started in variou~ high and higher secondary schools. In order to m'3~t the ever-increa~ing dema.nd for teachers and spacialists in Hom<:J Science, a Homo Scienc3 College was established at Chandigarh.
Three divisiou:1l n.nd sev.:Jatccll di;trict scmitl::Hd for in3p !ction staff andten.ching stn.ff of training colleg0s and training scho::>h w<lre organised under the scheme of orientation of teachers.
An Extension Serv:ces Project was started at the Government Basic Training School, J agraon, as a plan scheme with cent per cent assistance from the centre;
Rajasthan
A new teachers' training collcg!, viz. M-~.hesh Te1ched Training College, was started at Jodhpur.
Uttar Pradesh
Under a scheme of Third Five YeJ.r Plan, five Gwcrnm)nt Normal Sohools, three for men and two for womom, were opened.
Under a scheme jointly spon~ored by theMini>~ri-)sofEdueationandCommunity Development and Panchayati Raj, Govt. of India, a State-level seminn.r for the orientation of prim:uy school teaehera to community development was organised at Lucknow in November, 1961. This was followed by district level seminars for junior inspecting personnel and selected teachers of training institutions. A beginning in in-service training of nursery school teachers was mn.de by orgn.nising a three month course at the Goverlllllent Nursery Training College, Allahabad, which was attended by eight teachers. At th<: secondary lev~l, a number of in-service training courses were organised.
West Bengal
The intake capJ.city of the tc1ch·Jra' training it1-;titutions in t.h<' State was increased by 60. A condensed course of basic training for two months for 30 Bhutanese teachers was sanct.io:1ed. Several seminars were organised by the

210
State Education· Directorate as well ·as by the extension services units attached to the four teachers' training colleges. Besides, Career Masters' Courses were introduced at the David Hare Training College, Calcutta, to train the teachers of class XI schools to give educational and vocational guidance. An English Language Institute was set up in Calcutta for training teachers of secondary schools and training colleges in the modern method of teaching English.
A. &N. Islimds
Under 8. scheme of Third Five Year Plan, provision was made for there·· organisation of the Junior Basic Teachers' Training School and accordingly, additional staff and equipment were provided to the training school. A sum of Rs. 13,700 was spent for the maintenance of this school durw.g the year.
Dadra & Nagar Haveli
The Administration, Nagar Haveli, organised short-term: teacher~' training camps in which 52 teachers participated. Four teachers joined, a.t th.eir own cost, a primary training college in the neighbouring district. Fourteen teachers were deputed with financial help from the Government for primary teachers' certificate training at the colleges of the neighbouring States.
Delhi
With a view to providing more facilities for the training of teachers and increasing their professional efficiency, a proposal to attach an extension wing with tho Government Teachers' Training Institute, Daryaganj, was considered.
Himachal Pradesh
During the year one basic training school was opened. The intake capacity of the Basic Training College, Solan, was raised from 60 to 100. Thirtysix teachers we~" deputed for training outside the Territory under the pls.n scheme. 250 teachers were given orientation training organised by the Government.
Manipur
One basic training college was opened for training post-matrie teachers ofM.E .. and high schools. Geograr,hy was introduced as a subject in tho B.'I. class.
Pondicherry
In view of the great demand for trained bands anticipat..ed during the course of the Third Plan, the capacity of the existing (non-basic) teachers' t.raining instil ution was doubled to 80. and a new basic type institution with an intake of 40 was started.

211
Tr1pura
During the year under report tho Craft Teachers' Train~g In_stitute w~~ expanded and 49 teachers were trained in crafts and wero provided m the basiC schools.
The annual intako capac.ity of the basic training collcgf\S was raised from 300 in 1960-61 to 360 during the year. Necessary equipment and teaching appliances were purchased and supplied to the colleges, for which an amount of Rs. 60,661 was spent.
The work of construction of a B.T. college wa11 in progress during the year.
Main Statistics
Training Schools
Institutions
During the year under report the total-number of teachers' tra.inmg schools was 1,133 as against 1,138 in 1960-61 which showed a decrease of. 5 (or0·4 per cent) only. This was mainly because of appreciable decrease inMysor~, Madras and Rajasthan. Of the total, 759 (67 · 0 per .cent) were managed by Government, 16.(1·4 per cent) by local homes, 312 (27·5 per cent) by p:ivate aided bodies and 46 (4·1 per cent) by private unaided bodies. This number, however, excludes some training colleges and secondary schools providing training of the school standard. A statement showing the Statewise distribntion of training schools is given in tablt> LXXXIII. It shows that there were no training schools in Dadra & Nagar Havcli, L.M. & A. Islands. Pondicherry ancl Tripura. Six States/Union Territories showed an increase in the number of training~ schools, of which Utt..'lr Pradesh showed the highest, whereas seven showed decrease with Mysore topping tho list.
The management-wise distribution ·of these schools is given in coLq. (9)(12) of the .same table. It shows that Govt. managed all the schools in Jammu and Kashmir, A. & N. Islands, Delhi, Himachal Pradesh, Manipur, Nagaland and NEFA; it had the larg~st individual share in [l,ll other States/Union Territories excopt in Guj[l,rat (where it sh:ucd equally with private aided bodies) and Kcrala, Madras and Maharashtra (where private aided bodic!! predominated).
Pupils
The total number of pupils in training schools and other training .::lasses of school standard attached to other imtitutions rose from 1,22,682 in 1960-61 t? 1,39,920 during 1961-62, showing an increase of 17, 38 or 14·1 per cent as against an increase of 22 · 5 per cent in the previous year. The state-wise distribution is shown in table LXXXIV. A decrease in number was sho.vn in Assam, Mysore and Rajt\sthan among St'\tes and .A.&. N. lolands, Manipur and Nag!\laud among Union Tenitories. The others showed increase the highest being in runjab (5,021), follow- 1 hy Bihar (2,571) and Uttar Pr~desh (2,10-!).

212
Table I. XX x Ill Number of
For Men For Women Total
StatejTerritory 1960-61 1961-62 r--__._____, 1960-61 1961-62 1960-61 1961-62
1 2 3 4 5 6 7
Andhra Pradesh 95 93 42 42 137 135
Assam. 30 28 6 6 36 34 .
Bihar 96 96 26 25 122 121
Gnjarat 55 53 23 25 78 78
Jammu & Kashmir 8 8 2 2 10 10
Kerala . 63 64 17 18 80 82
Madhya Pradesh 41 41 7 7 48 48
Madras. 9 5 23 18 32 23
Jllaharashtra • 128 133 47 5,!) 175 183
Mysore 20 10 4 1 24 11
Orissa 76 76 6 5 82 81
Punjab 14 15 12 14 26 29
Rajasthan 51 45 4 5 55 50
Uttar Pradesh 128 138 27. 30 155 168
West Bengal 55 55 11 12 66 67
A. & N. Islands 1 1 1 1
Dadra & Ngr. Haveli
Delhi ·• 1 1 1 1
Himachal Pradesh • 3 4 a ' L. M. & A. Islands
Manipur 5 5 5 6
Nagaland 1 1 1 1
N.E.F.A. 1 1 1 1
Pondioherry ,
Tripura
INDIA 881 873 257 260 1,138 1,133
---·------

213
Teachers' Training Schools
Increase(+) Number of Schools in 1961-62 managed by .-------------~ -.
or Govt. Local Board Private Bodies State/Territory
Decrease (-) Aided Un-Aided
8 9 10 11 12 1
-2 103 31 1 Andhra Pradesh
-2 15 12 4 3 Assam
-1 101 19 1 Bihar
39 39 Gujarat
10 Jammu & Kashmir
+2 33 49 Kerala
46 2 Madhya Pradesh
-9 9 14 Madras
+8 62 2 119 Maharashtra
-13 9 2 •• Mysore
-1 79 2 Orissa
+3 17 2 10 :Punjab
-5 48 2 Rajasthan
+13 127 I 9 31 Uttar Pradesh
+1 48 1 18 West Bengal
A. & N. Islands
Dadra & Ngr. Haveli
1 Delhi
. +I 4 Himachal :Pradesh
L. M. & A. Islands
5 Manipur
1 Nagaland
N.E.F.A.
:Pondioherry
Tripura
759 16 312 46 INDIA
Table LXXXIV-Number of Pupils in Teachers' Training Schools*
Increase(+) State/Territory Men· Women Total or ,.--:_--..J\---_____
r--- ___:;..o.__,___......, Decrease(-) 1960-61 1961-62 1960-61 1961-62 1960-61 ~961-,62
1 2 3 4 5 6 7 8
Andhra Pradesh 10,685 12,001 4,049 4,602 14,734 16,603• +1,869 .Aeaam 2,108 1,852 385 305 2,493 2,157 ,..... 336 Bihar· 13,985 16,250 2,875 3,181 16,860 19,431 +2,571 Gujarat • 6,129 6,692 2,557 2,890 8,686 9,582 + 896 Jammu & Kashmir • 444 439 194 214 638 653 +15 Kerala 3,681 4,426 2,718 3,760 6,399 8,186 +1,787 Madhya Pradesh 4,461 4,504 879 940 5,340 5,444 + 10! Madras 5,942 6,809 4,995 5,734 10,937 12,543 .+1,606 Mabarashtra 13,250 14,662 5,415 5,564 18,665 20,226 .+1,561 ~ Mysore 2,299 1,698 731 373 3,030 2,071 -959 .....
ll>o Orissa 4,601 5,743 140 174 4,741 5,917 +1,176 Punjab 2,711 4,379 3,424 6,777 6,135 11,156 +5,021 Rajasthan 6,031 5,392 547 644 6,578 6,036 -542 Uttar Pradesh 11,869 13,564 1,722 2,131 . 13,591 : 15,695 +2,104 West Bengal 2,155 2,386 693 733 2,848 3,ll9 + 271 A. & N. Islands 20 13 4 10 24 23 -I Dadra & Ngr. Havell
142 Delhi . . . 169 145 140 287 309 + 22 Himachal Pradesh 218 242 49 85 267 327 + . 60 L. M. & A. Islands Manipur. 344 327 30 38 374 365 9 Nagaland 37 34 37 34 3 N.E.F.A. 18 43 18 43 + 25 Pondicherry Tripura •
INDIA 91,130 1,01,625. 31,552 38,295 1,22,682 1,39,920 +17,238
*Includes enrolment in attached classes.

215
Expenditure
The total direct expenditure on teachers' training schools (excluding that on attached training classes of school standard) rose from Rs. 3,48,11,129 in 1960-61 to Rs. 3,92,75,302, giving an increase Gf Rs. 44,64,173 or 12·8 per cent as against 25·6 per cent in 1960-61. The source-wise distribution is shown in table LXXXV. The important point that .emerges from here is that Government bore 90·2 per cent of expenditure in 1961-62 as compared to 90·4 percent in 1960-61.
Table LXXXV-Direct Expenditure on Teachers' Training Schools by Sources
1960-61 1961-62 Sources
Amount Percen- Amount Percen-tage tage
Ra. Rs.
Government Funds 3,14,70,007 90·4 3,54,27,369 90·2
Local Board Funds . 1,10,395 0·3 2,03,875 0·5.
Fees 18,56,188 5·3 21,22,845 5·4
Endowments 3,51,820 1·0 4,32,4!0 1·1
Other Sources • 10,22,719 3·0 10,88,773 2·8
TOTAL 3,48,11,129 100·0 3,92,75,302 100·0
-
The Statewise details of direct exrenditnre on tr~ining schools is g:vcn in table LXXXVI. An increase was reported by all States and Union Territories • exe<lpt Madras, Mysore, Rajasthan and Delhi. Government met cent per cent expenditure in five cases, over 90 per cent in eleven other cases, betwe(n 75 and 90 per ceut in three cases and between 60 and 75 per cent in two cases, the lowest being in Madras (60·2 percent) where a considerable percentage (30·9) was met from endowments. Column (10) of this table shows an avemge annual oost pet pupil. The all India figure comes toRs. 322·5 (Rs. 332·8 in schools for men and Rs. 282·6 in schools for women) as against Rs. 315·0 (Rs. 317·8 in schools for men and Rs. 303·2 in schools for women) in 1960-61. This average cost. was distributed among the various sources of income as follows: Government ftmds Rs. 290·9, local bodies funds Rs. 1·6, fees Rs. 17·5, endowments Rs. 3·5 and oth€r sources Rs. 9·0.

216
Table LXXXVI-Direct Expenditure on
On Schools for On Schools for Men Women
State/Territory ,...-----A------, -. 1960-61 1961-62 1960-61 1961-6%
1 2 3 4 5
Rs. Rs. Rs. Rs.
Andhra Pradesh · 23,20,569 29,00,586 6,14,071 6,39,7,47
Assam 7,22,632 7,61,973 66,566 68,712
Bihar 45,22,289 52,68,318 8,13,691 9,72,313
Gujarat 15,45,135 19,55,917 5,39,120 7,24,449
Jammu & Kashmir 5,58,389 6,31,613" 1,30,232 1,53,222
Kerala 7,78,721 8,25,314 1,63,179 1,99,439
Madhya Pradesh 30,44,971 42,72,432 4,17,883 5,01,693
Madras 99,728 85,639 2,53,665 2,37,126
lllaharashtra 38,98,495 41,90,591 14,55,863 15,19,595
Mysore 15,03,489 9,93,706 1,65,054 49,962
Orissa 6,06,279 7,89,199 43,104 43,175
Punjab 4,46,017 4,63,917 2,80,695 3,19,954
Rajasthan 30,09,653 29,17,218 2,25,930 2,70,099
Uttar Pradesh 43,46,350 50,10,353 10,59,496 11,29,995
West Bengal 5,67,491 6,86,937 1,73,247 2,00,850
J,.. & N. Islands 17,368 28,903
Delhi 1,00,311 90,416
Himachal Pradesh 1,30,863 1,42,742
lllanipur 92,369 94,127
Nagaland 19,363 22,430 .. N.E.F.A. 78,851 1,12,640
INDIA 2,84,09,333 3,22,44,971 64,01,796 70,30,331

217
Teachers' Training Schools)y States
Increase ( +) or Total Decrease(-)
,-----A-----.. StatejTerritory 1960-61 1961-62 Amount Percentage
6 7 8 9 1
Rs. Rs. Rs. Rs.
29,3!,640 35,40,333 +6,05,693 +20·6 Andhra Pradesh
7,89,198 8,30,685 +41,487 +5·3 Assam
63,35,980 62,40,631 +9,04,651 +17·0 Bihar
20,8!,255 26,80,366 +5.96,11l +28·6 Gujarat
6,88,621 7,84,835 +96,214 +14·0 Jammu & Kashmir
9,41,900 10,24,753 +82,853 +8·8 Kerala
34,62,854 47,74,125 +13,11,271 +37·9 Madhya Pradesh
3,53,393 3,22,765 -30,628 -8·7 Madras
53,54,358 57,10,186 +3,55,828 +6·6 Maharashtra
16,68,543 10,43,668 -6,24,875 -37·4 Mysore
6,49,383 8,32,374 +1,82,991 +28·2 Orissa
7,26,712 7,83,871 +57,159 +7·9 Punjab
32,35,583 31,87,317 -48,266 -1·5 Rajasthan
54,05,8!6 61,40,348 +7,34,502 +13•6 Uttar Pradesh
7,40,738 8,87,787 +1,47,049 +19·9 West Bengal
17,368 28,903 +11,535 +66·4 A. & N. Islands
1,00,3ll 90,416 -9,895 -9·9 Delhi
1,30,863 1,42,742 +11,879 +9·1 Himachal Pradesh
92,369 94,127 +1,758 +1·9 Manipur
19,363 22,4:10 +3,067 +15·8 Nagaland
78,851 1,12,6!0 +33,789 +42·8 N.E.F.A.
3,4S,ll,129 3,!12,75,302 + <4,C4,1i3 +12·8 Ixoa

218
Table LXXXVI-Direct Expenditure on T. T. Schools by States (contd.)
Average Percentage of Expenditure (1961-62) Annual met from
Cost State/ Per Govt. Local Fees Endow- Other
Territory· Pnpil Fnnds Board menta Sources Fnnds
1 10 11 12 13 14 15
R<~.
Andhra Pradesh 210·3 91·3 2·8 5·5 0·4
Assam ,385· ~ 91·9 5·1 0·6 1·8 0·6
Bihar 321·2 98·8 0·0 0·1 1·1
Gujarat 279·7 78·3 3·4 10·2 1·6 6·5
Jammu & Kashmir 1,280·3 98·0 2·0
Kerala • 1,366·9 75·1 22·1 2·7 0·1
Madhya Pradesh 877·4 98·6 0·8 0·6
Madras • 124·5 60·2 4•5 30·9 4•4
lllaharashtra • 286·1 73·4 0·4 15·1 0·9 10·2
Mysore . 1,103·2 97·8 0·6 1·6
Orissa 140·7 98·5 0·3 1·2
Punjab. 163·3 77·1 18·8 0·5 3·6
Rajasthan 539·6 94·1 5·1 0·2 0·6
Uttar Pradesh 392·3 94·4 0·2 4·0 0·1 1•3
West Bengal . 290·2 90·2 3·8 2·4 0·7 2•9
A. & N. Islands 1,256·6 100·0
Delhi 456·6 100·0
Himachal Pradesh . 436·5 100·0
l\Ianipur 257·9 99·7 0·3
Nagaland 659·7 100·0
N.E.F.A. 2,619·5 100·0
INDIA 322·5 90·2 0·5 5·4 1·1 2•8

219
Training Colleges
Institutions
The total number of post-gradu1.te and undergraduate teachers' training colleges increa~ed from 478 in 1960-61 to 550 during the year under raview which!m('"'tns an increase of 15·1 per cent as compared to 19· 2 per cent in 1960-61. l)f the total, Government managed 4 7 · 8 per cent, private aided bodies managcJ 40· 9 per ceut and the rest of the coll.::g."s wera manag,:d by private unaided bocliPs. Out of these 550 colleges, 152 were degree and post-graduate colleges and the rest were undergraduate colleges. The Statewise distributions of these colll)gcs arc given in tables LXXXVII and LXXXVIII. It will be seen that there are no training colleges in A. & N. Islands, Dadra & Nagar Havcli, L. M. & A. Islands, Nagaland and NEFA. A decrease of two and one post graduate colleges was shown in w~st Bengal and Ptmjab respectively and of one w1dergraduate college was shown in Utta,r Pradesh while in all other cases the positio~. was either stationary or an iacrease was reported. The highest increase iri post-gradU'1te as also undergraduate colleges was shown in Maharashtra (3 and 37 respectively).
Pupils
The total number of pupils enrolled in various teJ.chers' trainirig colleges, university tc:>ching departments and attached tra.iriirig cbsses of collegiate standard increased to 52,561 as compared to 46,808 in the previou..~ year. This gives an increase of 12·3 per cent as against 19·6 in 1960-61. The Sta.tewise distribution is given in table LXXXIX. It will be seen tha.t an increase was registered everywhere. Among the States, by far the bigg<>st increase was _in l\Iahamshtra (2,051) followed a long way behind by l\Iysore (854), Punpb (783) and Madra~ (736). Among the Union Territories, Tripura. l79) led the field followed by Pondicherry (60).
Expenditure
The total direct expenditure on teachers' tra.inincr collerres rose from n~. 2,15,14,3:l8 in1960-61 to RR. 2,57,61,967 in 1961-62. This gi~es au increase of 19·8 per c~nt as compared to 18·8 p~r cent during 1960-61. Of the total, Rs. 1,~8,23,914 was spent. on the post-graduate training colleges and Rs. 1,19,•11 ,0_53 on the w1dergraduate training colleges. The corresponding figures for ihe preVIous ye:1r were Rs. 1,29,22,658 and Rs. 85,91,670. The sourcewise details of direct expenditure on all the training colleges are given in table XC. It shows that Government ftmds met more than thren.-fourths of the total expc•nditme, ft>es nwt about one-eighth and the rest W3re m~t from endowments and other sotuces, !oct>! bodies' share being insignificant.
){1 B(D);) 1)!-JfE,\u,•atiou-lS(a)

StatejTerritory
1
Andbra Pradesh Assam Bihar Gujarat . • Jammu & Kashmir Kerala • Madhya Pradesh l>ladras . l>laharashtra Mysore Orissa Punjab Rajasthan . U ttnr Pradesh West Bengal A. & N. Islands • Dadra & Ngr. Haveli Delhi , . Himachal Pradesh ·L.M. & A. Islands. Manipur Nagaland N.E.F.A. Pondicherry Tripura.
Table LXXXVll-Number of Post-Graduate Teachers' Training Colleges
INDIA
For Men For Women
1960-61 1961-62 1960-61 1961-62
2
7 2 4 6 2
16 9
12 15 9 2
19 4 7
11
1 1
1
128
3
7 2 4 6 2
17 10 12 18 9 2
18 5 7
10
1 1
1
132
4
1
1
2
4 1 1
•4
3 2
19
5
1
1
2
5 1 1
4
4 1
20
Number of Colleges in (1961-62) Increase(+) Managed by
Total or r-----"---.......,.. Decrease
1960-61
6
8 2 5 6 2
18 9
16 16 10 2
23 4
10 13
1 1
1
147
1961-62
7
8 2 5 6 2
19 10 17 19 10 2
22 5
11 11
1 1
1
152
(-)
8
+I +1 +1 +3
-1 +1 +1 -2
Private Bodies Govt. ,-----A.--..,
Aided Un-Aided
9
6 2 3 6 2 4
10 7 6 5 2 6 2 4 4
1 1
1
. 72
10
2
2
15
' 10 13 4
16 3 5 7
77
11
1
2
3

Table txxxvm-Number of Under-Graduate Teachers' Training Colleges
Number uf Cnlloges in (1UIH-62) Increase(+) Managed by
For Men For Women Total or Private Bodi-;;;;-'
State fTerritory Decrease(-) Govt.
1960-61 1961-62 1960-61 196I-62 1960-61 1961-62 ~ Aided Un-Aided
I 2 3 4 5 6 7 8 9 10 11
Andbra Pradesh A.RRam Bihar 1 Gujarat • • 1 1 2 2 2
Jnmmu & Kashmir Kcrala 54 Madhya Pradesh 54 5 5 59 59 59
Madras 73 76 42 48 115 124 +9 70 53 1
Maharashtra 73 110 3 3 76 113 +37 2 62 49
Mysore 30 45 I2 14 42 59 +17 31 19 9 ~ Orissa. IO 12 1 1 11 13 +2 I3 .... Punjab 2 2 1 1 3 3 2 1
Rajasthan . 5 5 Uttar Pradesh 5 4 10 9 -I 6 3
West Bengal 5 5 3 4 8 9 +I 1 8 A. & N. lolands Dadra & Ngr. Haveli Delhi Himachal Pradesh L. M. & A. Islands 1\Ian.ipur 1 1 +I Nngaland N.E.F.A. Pondicherry 1 2 1 2 +I 2 Tripura ·- 4. 4 4 4 4
INDIA. 258 317 73 81 331 398 +67 19I I48 59

· StatejTerritory
Andhra Pradesh Assam Bihar Gujarat . Jammu & Kashmir Kerala Madhya Pradesh Madras Maharashtra Mysore Orissa Punjab Rajasthan • Uttar Pradesh . West Bengal A. & N. Islands Dadra & Ngr. Haveli Delhi . . Himachal Pradesh L. M. & A. Islands
• Manipur. Naga!and N.E.F.A.. Pondicherry Tripura •
1
Table r.xxxrx Number of Pupils in Teachers' Training Colleges**
INDIA
Men
1960-61
2
850 165 551 644 135
1,309 5,836 7,554 2,807 3,297
770 1,555
441 3,874 1,390
100 40
40
64 184
31,606
1961-62
3
825 195 574 683 197
1,322 5,931 8,025 4,077 4,053
967 1,883
531 3,824 1,485
83 50
55
102 250
35,112
Women
1960-61
4
284 26
126 331 104 726
1,317 4,447 2,558 1,187
93 1,525
62 1,299
866
155 17
' 8
31 40
15,202
1961-62
5
320 37
158 337 119 800
1,374 4,712 3,339 1,285
101 1,980
95 1,539
931
177 29
10
53 53
17,449
Increase ( +) or
,.----A-------. Decrease(-) Total
1960-61
6
1,134 191 677 975 239
2,035 7,153
12,001 5,365 4,484
863 3,080
503 5,173 2,256
255 57
48
95 224
46,808
1961-62
7
1,145 232 732
1,020 316
2,122 7,305
12,737 7,416 5,338 1,068 3,863
626 5,363 2,416
260 79
65
155 303
52,561
·8
+11 +41 +55 +45 +77 +87
+152 +736
+2,051 +854 +205 +783 +123 +190 +160
+5 +22
+17
+5,753
••Includes enrolment in University Teaching Departments and training classes attached to Arts and Science colleges and excludes pupils in training classes of school standard in Training colleges.

223
Table XC-Direct Expenditure on Teachers' Training Colleges by Sources
1960-61 1961-62 ----. -----..
Sources Amount Pcrcen- Amount Percen-tage tage
2 3 4 5
Government Funds 1,67,59,745 77·9 2,01,22,695 78·1 Local Board Funds 7,077 0·0 Fees 27,61,482 12·8 34,22,475 13·3 Endowments 10,65,642 5·0 10,92,579 4·2 Other Sources 9,27,459 4·3 11,20,141 4·4
TOTAL 2,15,14,328 100·0 2,57,61,967 100·0
The brcak-np of th~ total direct expenditur3 into that on J:lOSt-gradnate and und~rgradnate colleges is given in table XCI and XCII. In a broad sense the pattern remained the same in these two cas~s also.
Table XCI-Direct Expenditure on Post-Graduate Teachers' Training Colleges by Sources
1960-61 1961-62 ,--A---------,
Sour~es Amount Percen- Amount Percen-tage tage
2 3 4 5
Government Funds 95,87,215 74·2 1,01,78,132 73·6 Local Board Funds 7,001 0·1 Fees 22,13,625 17·1 24,71,748 17·9 Endowments 5,25,398 4·1 4,51,214 3·2 Other Sources 5,96,420 4·6 7,15,819 5·2
TOT AT. 1,29,22,658 100·0 1,38,23,914 100·0
Table XCII-Direct Expenditure on Under-Graduate Teachers' Training Colleges by Sources
Sources 1960-61 1961-62
Amount Percentage Amount Percentage
2 3 4 5
Government Funds 71,72,530 83·5 99,4!,563 83·3 Lac<>! Board Funds 76 o-o Fees 5,!7,857 6·4 9,50,727 7·9 Endowments 5,40,24-4 6·3 6,41,365 5·4 Other Sources 3,31,039 3·8 4,04,322 3·4
TOTAL 85,91,670 100·0 I,J9, I 1,053 100·0

The Statewiso details of direct expenditure on pest-graduate and t.ndergraduate teachers' training colleges are shown in tables XCIII and XCIV. The expenditure on post-graduate colleges increased in all the concerned cases exce:{Jt Bihar, West Bengal, Delhi and Tripura where it decreased. The highest iJ+crease was reported by Madhya Pradesh (Rs. 3,17,478), followed by Jammu and Kashmir (Rs. 1,09,508) and Punjao (Rs. 1,05,540). In terms of percentage, however, the prid.) of place went to Jammu & Kashmir (45·5), followed by Himachal Pradesh (36·2), Assam (32·2) and Madhya Pradesh (17·8). In the case of undergraduate colleges there was an increase iu every concerned case eJ:rcept Uttar Pradesh where a decrease was observed. The highest increase was iu Mysore (Rs. 11,31,194), closely followed by Madhya Pradesh (Rs. 11,14,178). In terms of percentage Gujarat (192· 4) registered an abnormal increase, followed by Tripura (99·8), Mysore (83·5), Maharashtra (58· 6) and Pondicherry (46·7).
The percentage of expenditure on post-graduate colleges met from various sources of income in the States and Union Territories is given in cols. (11) to (15) of table XCIII. Government met cent per cent expenditure in Assam, Himachal Pradesh and Tripura. Between 90 and 100 per cent in six .cases, between 75 and 90 per cen.t in four States, between 50 and 75 per cent in two States and below 50 per cent in Maharashtra, Punjab and Kerala. In Maharashtra and Punjab, however, Government had the largest single share, fees coming next, but in Kerala more than three-fifths of the. expenditure was met from fees only. The corresponding information for undergraduate colleges is given in cols. (11)-(14) of table XCIV. It shows that Government met total expenditure in Pondicherry, between 90 and 100 per cent in six cases, between 75 and 90 per cent in two cases and below 50 per cent in Punjab and Maharashtra. While in Punjab the Government had the largest single share followed by fees, in Maharashtra more than three-fourths of the expenditure was met from fees only .
.Another point of interest is the average annual cost per pupil which is given in col. (10) of each of the two tables under consideration. The all-India average cost per pupil of the degree and post-graduate standard came to Rs. 694·0 (Rs. 733·4 in men's colleges and Rs. 470·3 in women's colleges) as compared to Rs. 733·7 (Rs. 768·9 in men's colleges and Rs. 544·3 in women's colleges) in 1960-61. Out of this Rs. 511·0 was met from Government funds, Rs. 0· 4 from local bodies' funds, Rs. 124 ·1 from fees, Rs. 22 · 6 from endowments and Rs. 35·9 from other sotirces. Similarly, the average annual cost per pupil in the undergraduate colleges was Rs. 301·1 (Rs. 317 ·1 in men's colleges and Rs. 251·0 in women's colleges) as agaiwt Rs. 259·4 (Rs. 27 4 · 2 in men's colleges and Rs. 215·2 in women's colleges) in 1960-61. Of the total, Rs. 250·7 was met from Government funds, Rs. 24·0fromfees, Rs.16·2fromendowments and Rs. 10 · 2 from oth"lr sources. The combined picture for the post-graduate and undergraduate colleg('B shows the average all-India cost as R~. 432 · 4 (Rs. 467 · 3 in men's colleges and Rs. 302·8 in women's colleges) as against Rs. 424·1 (Rs. 459·9 in men's colleges and Rs. 294·8 in women's colleges) in 1960-61. Out of the total of Rs. 432 · 4, Rs. 337 · 7 was met from Government funds, Rs. 0·2 from local bodies' funds, Rs. 57·4 from fees, Rs. 18.3 from endowments and Rs. 18·8 from other sources.
Output in Teachers' Training During the year under report, a total of 1,25,915 pupil teachers (91,942 men
and 33,973 women) successfully compl.,ted the teach?rs' training courS('s of degree, diploma. and r.ertificate standard as compared to 1,07,001 (79,863 men
·- .

225
and 27,138 women) in the r,revious year. Out of the total, 92,854 (69,417 men and 23,437 women) qualified as primary school teachers and the remaining 33,061 (22,525 men and 10,536 women) as seco11dary school teachers. Of the latter, 532 teachers (397 men and 135 women) received post-graduate degr.~es in teachers' training, 19,515 teachers (13,311 men and 6,204 women) graduate degrees and equivalent diplomas and the remaining 13,014 teachers (8,817 men and 4,197 women) undergraduate diplomas and certificates. The Statewise details of output in teachers' training are given in table XCV. Per~ntage increase or decreas'3 is shown in col. (19) of this table. It will be seen that there was ::m increase in every case except Gujarat, Madhya Pradesh, Punjab, :Rajasthan, A. & N. Islands, Delhi, 1\fanipur, Nagaland, N. E.F.A. and Pondicherry. 'rbe highest percentage increase was registered by Maharashtra (75·8), followed by Mysore (66·1), Kerala (52·3), and Orissa (38·5).
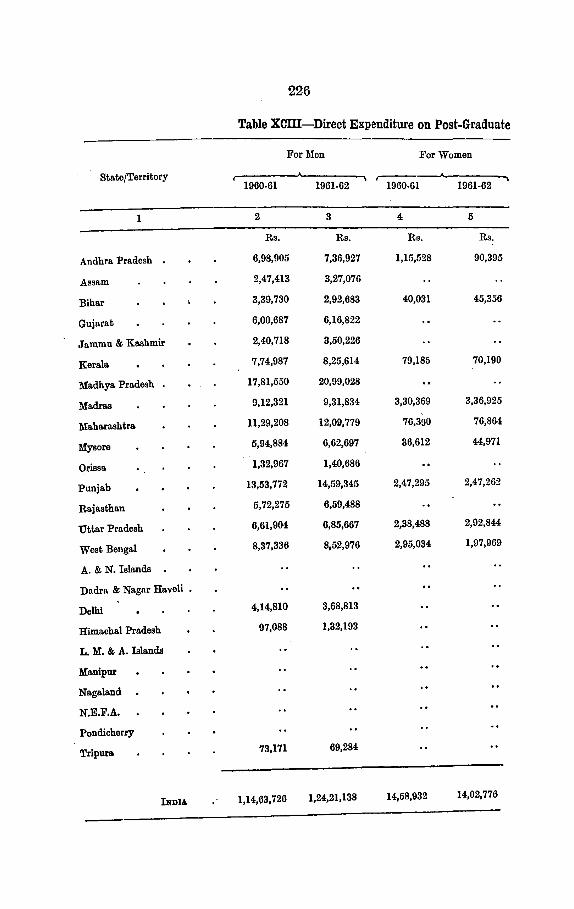
226
Table Xcni-Direct Expenditure on Post-Graduate
For Men For Women
State/Territory r---~ 1960-61 1961-62 1960-61 1961-62
1 2 3 4 5
Rs. Rs. Rs. Rs.
Andhra Pradesh 6,98,905 7,36,927 1,15,528 90,395
Assam 2,47,413 3,27,076
Bihar 3,39,730 2,92,683 40,031 45,356
Gujarat 6,00,687 6,16,822
Jammu & Kashmir 2,40,718 3,50,226
Kera.la. 7,74,987 8,25,614 79,185 70,190
Madhya Pradesh 17,81,550 20,99,028
Madras 9,12,321 9,31,834 3,30,369 3,36,925
Maha.rashtra 11,29,208 12,09,779 76,390 76,864
Mysore 5,94,884 6,62,697 36,612 44,971
Orissa. 1,32,967 1,40,686
Punjab 13,53,772 14,59,345 2,47,295 2,47,262
Rajasthan 5,72,275 6,59,488
Uttar Pradesh 6,61,904 6,85,667 2,38,488 2,92,844
West Bengal 8,37,336 8,52,976 2,95,034 1,97,969
A. & N. Islands
Dndra & Nagar Haveli •
Delhi 4,14,810 3,68,813
Himachal Pradesh 97,088 1,32,193
L. M. & A. Islands
Manipur
Nagaland
N.E.F.A.
Pondicherry
Tripura. 73,171 69,284
ll!DIA. 1,14,(13,726 1,24,21,138 14,58,932 14,02,776

227
Teachers' Training Colleges by States
Total Increase(+) or Decre'l.Se (-)
-, State/Territory 1960-61 1961-62 Amount Percentage
6 7 8 9 1
Rs. Rs. Rs.
8,14,433 8,27,322 +12,889 +1·6 Andhra Pradesh
2,47,413 3,27,076 + 79,663 +32·2 Assam
3,79,761 3,38,039 -41,722· -11·0 Bihar
6,00,687 6,16,822 +16,135 +2·7 Gujarat
2,40,718 3,50,226 +1,09,508 +45·5 Jammu & Kashmir
8,54,172 8,95,804 + 41,632 +4·9 Kerala
17,81,550 20,99,028 + 3,17,478 +17·8 Madhya Pradesh
12,42,690 12,68,759 +26,069 +2·1 Madras
12,05,598 12,86,643 +81,045 +6·7 Maharashtra
6,31,496 7,07,668 +76,172 +12·1 Myso!'l'
1,32,967 1,40,686 +7,719 +5·8 Orissa
16,01,067 17,06,607 + 1,05,540 +6·6 Punjab
5,72,275 6,59,488 +87,213 +15·2 Rajasthon
9,00,392 9,78,511 +78,119 +8·7 Uttar Pradesh
11,32,370 10,50,945 -81,425 -7·2 West_ Bengal
A. & N. Islands
Dadra & Nagar il:ava\i
4,14,810 3,68,813 -45,997 -11·1 Delhi
97,088 1,32,193 +35,105 +36·2 Himacha.l Pradesh
L. ~ & A. Islands
Ma.nipur
Naga!and.
N.E.F.A.
Pondicherry 73,171 69,284 -3,887 -5·3 Tripura
1,!!9,22,658 1,38,23,914 +9,01,256 +7·1 INDIA

228
Tlbh XCHt -DiNct E tP~nditn~-3 on P.:>st-Gra.dtnb Tea'Jh1rs' Training -Colleges by State3-- -contd.
Average Percentage of expenditure (1961-62) met from Annual
State/Territory Cost per ......, Pupil Govt. L.B. Fees Endow- Other
Funds Funds ments Sources
10 11 12 13 14 15
Andhra Pradesh 794·0 . 76·4 2·8 6·7 14·1
Assam 3,407·1 100·0
Bihar 485·7 95·2 4·1 0·7
Gujarat 803·2 68·5 20·1 11·4
Jammu & Kashmir 1,423·7 99·8 0·2
Kern.la 427·4 38·5 60·7 0·8
Madhya Pradesh 1,329·3 98·8 1·2
Madras 653·0 78·4 5·9 15·4 0·3
Maharasbtro. • • 666·7 39·6 0·.2 37·9 2·6 19·7
Mysore 898·1 68·1 9·5 22·4
Orissa 676;4 95·9 3·3 . 0·1 0·7
Punjab 329·0 46·3 0·3 45·4 6·3 1·7
Rajasthan 873·5 75·3 16·9 7·8 0·0
Uttar Pradesh 930·1 75·8 17·6 0·7 5·9
West Bengal 851·0 96·7 2·0 1·3
A. & N. Islands
Dadra & Nagar Haveli
Delhi · 2,615·7 92·2 7·8
Himachal Pradesh 1,673·3 100·0
L M. & A. leland& ,
Manipur
Nagaland . N.E.F.A.
Pondicherry'
Tripura 877·0 100·0
1m> a 694·0 73·6 0·1 17·9 3·2 5·2
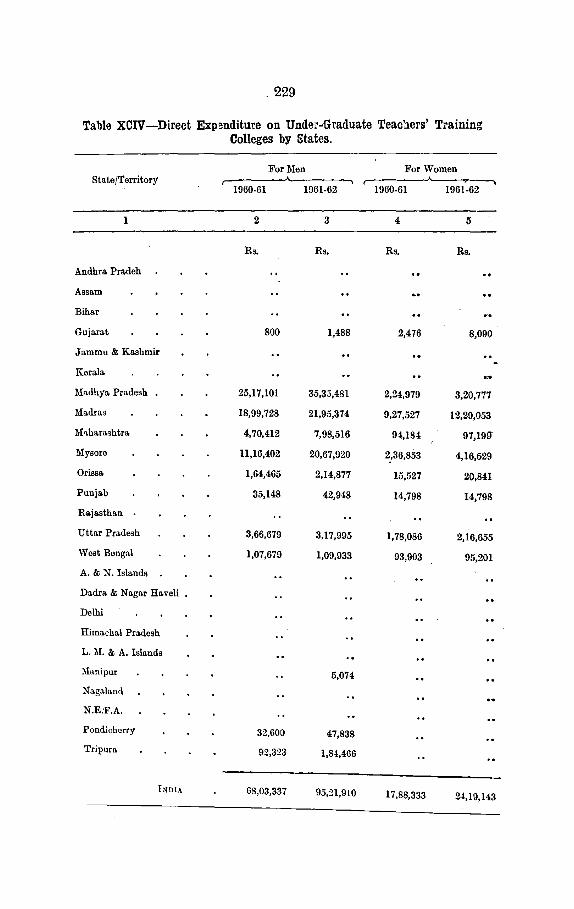
229
Table XCIV-Direct Expenditure on Unde:-Graduate TeacJ.ers' Training Colleges by States.
For Men For Women State/Territory .A..
1960-61 1961-62 1960-61 1961-62
I 2 3 4 5
Rs. Rs. Rs. Rs.
Andhra. Prn.deh
Assam
Bihar
Gujarat 800 1,488 2,476 8,090
Jo.mmu & Kashmir
Kerala
Mo.dhya Pro.desh 25,17,101 35,3;;,481 2,24,979 3,20,777
Madras 18,99,728 21,95,374 9,27,527 12,29,053
1\hharashtra. 4,70,412 7,98,516 94,184 97,199"
Mysore 11,16,402 20,67,920 ~,36,853 4,16,529
Orissa. 1,64,465 2,14,877 15,527 20,841
Punjab 35,148 42,948 14,798 14,798
Rajasthan
Uttar Pradesh 3,66,679 3,17,995 1,78,086 2,16,655
West Bengal 1,07,679 1,09,933 93,903 95,201
A. & N. Islands
Dadra & Nagar Ha veli
Delhi
Himachal Pradesh
L. M. & A. Islands
Manipur 5,074
Nagaland
N.E:F.A.
Pondichorry 32,600 47,838
Tripuri\ 92,323 1,84,466
bou 68,03,337 95,21,910 17,88,333 24,19,143
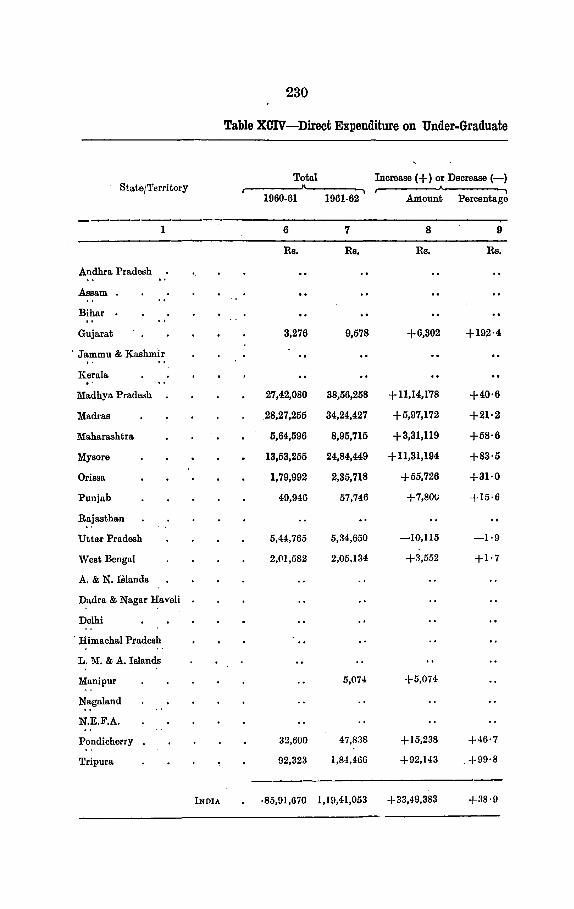
230
Table XCIV-Direct Expenditure on Under-Graduate
Total Increase ( +) or Decrease (-) StatejTerritory
1960-61 1961-62 Amount Percentage
1 6 7 8 9
Rs. Rs. Rs. Rs.
Andhra Pradesh
Assam
Bihar
Gujarat 3,276 9,578 +6,302 +192·4
· Jammu & Kashmir
Kerala
Madhya Pradesh 27,42,080 38,56,258 + 11,14,1'78 +40·6
Madras 28,27,255 34,24,427 +5,97,172 +21·2
Mnharash tra 5,64,596 8,95,715 +3,31,119 +58·6
My sore 13,53,255 24,84,449 +11,31,194 +83·5
Orissa 1,79,992 2,35,718 +55,726 +31·0
Punjab 49,946 57,746 +7,800 +15·6
Rajasthan
Uttar Pradesh 5,44,765 5,34,650 -10,II5 -1·9
West Bengal 2,(11,582 2,05,134 +3,552 +1·7
A. & N. Islands
Dadra & Nagar Haveli
Delhi
· Himachal Pradesh
L. M. & A. Islands
Manipur 5,(174 -j-5,074
Nagaland
N.E.F.A.
Pondicherry 32,600 47,838 +15,238 +46·7
Tripura 92,323 1,84,466 +92,143 .+99·8
INDIA ·85,91,670 1,19,41,053 +33,49,383 +38·9

231
Teachers' Training Colleges by States-contd.
Avera):!e Annual Percentage of expenditure 119 ·1-62)
Cost per met. r'rom Pupil ,--------.A.---------~ State/Territory
G wt. Fees Endow. Other Fu:'<b IJlents s::~urc:es
10 ll 1~ 13 . ' b 1
Rs.
Andhra Pradesh
Assam
Bihar
91·2 95·0 5·(· Gujarat
Jammu & Kashmir
Kerala.
690·2 98·1 1·7 0·2 1\Iadhya Pradesh
166·2 76·5 I·4 I8·6 3·5 1\Iadras
I75·3 18·4 76·6 0·4 4·6 l\Iaharashtra
4(13·5 88·6 4·0 7·4 l\Iysore
27 1·1 98·3 1·7 Orissa
317·3 49·2 45·2 5·e Ptmjab
Rajasthan
724·5 91·5 2·4 6· I l'ttar Pradesh
483·8 91·7 2·9 2·4 "~ettt Bengal
A. & N. }.:;lands
Dadra & Nagar Haveli
Delhi
Himachal Pradesh
L. ~I. & A. Islands
150·0 97·2 2·8 l\Ianipur
Nagnland
N.E.I<.A.
:}OS·C IUO·O Pondichou-y
8:!:{·5 \H·l [·9 Tripnra
30I ·I 8"!·3 7·9 5·4 3·4 IXDI.\

232
Table XCV-output in
Post-Graduate Standard Graduate Standard StatejTerritory r- ----. 1\Ien Vi" omen Total 1\len Women Total
1 2 . 3 4 5 6 7
Andhra Pradesh 12 2 14 65U 297 947
Assam 5 3 8 96 22 us Bihar 24 4 28 1,117 149 1,266
Gujar11t 22 4 26 510 224 734
Jammu & Kashmir 170 88 258
Kerala 1,316 779 2,095
1\ladhya Pradesh 73 13 86 871 -231 1,102
Madras 12 7 19 996 439 1,435
1\laharashtra 45 36 81 882 454 1,336
Mysore 42 :1 15 437 169 606
Orissa 9 10 202 31 233
Punjab 16 3 19 1,280 1,511 2,791
Rajasthan 20 20 493 92 585
Uttar Pradesh 78 33 Ill 3,182 1,153 4,335
West Bengal 16 20 36 987 - 410 1,427
A. & N. lslanda
Dadra & Nagar Havell
Delhi 11 4 15 63 100 163
Himachl\l Pradesh • ;, 46 23 69
L. M. & A. Islanda •
Manipur 13 2 15
Nagaland
N.E.F.A.
Pondicherry
Tripura 12 2 14
INDIA 397 135 532 13,311 6,204 19,515

Zit)
Teachers' Training
Under-<lrauuate Standaru School Stanuard .-------"------... .-------"----------. State;Territory
Men Women Total Men Women Total
8 9 10 11 12 13
7,013 1,931 8,944 Anuhra Pradesh
25 25 970 211 1,181 Assam
6,895 1,187 8,082 Bihar
3,777 1,519 5,296 Gujarat
43:J 207 640 Jammu & Kashmir
2,fJ55 2,308 5,263 Kerala
4,689 1,065 6,754 4,014 S36 4,860 11fadhya Pradesh
19 7 26 7,055 4,268 11,313 Madras
2,968 2,739 5,707 11,619 5,265 16,b84. Maharashtra
7 9 16 6,S68 2,038 8,906 Mysore
347 55 402 2,857 83 2,910 Orissa
76 71 147 1,048 1,613 2,661 Punjab
4,862 519 ;),381 Rajasthan
140 91 231 6,182 l.i'l5 li,817 Uttar Pradesh
331 126 457 2,325 668 2,993 West Bengal
13 8 21 A. & N. Islands
Dadra & Nagar Haveli
]4, 71 85 Dcl'-'i
231 78 309 Hima<:hal Pradesh
L. M. & A. Islands
26ll :l2 292 :uanipur
15 15 Nagalaml
II II N.E.F.A.
~5 16 41 Pondicherry
190 IS 208 Tripura
8,817 4,Hl7 13,014 69,417 23,437 92,854 l.SDIA
~l;B( •)G4Mol<ducation-1

234
Table XCV -Output in Teachers' Training-contd.
InrreaBe'c Pcr<·enf-(+) Cl$!f'
Out rut. or Incrrast-State/Territory Total Out.put 1961-62 during Docreafe (+)or
1960-61 (-) DeerenFt' (-),
Men Women --,
Total
14 15 16 17 18 19
Andhra Pradesh 7,675 2,230 9,905 R,727 + I.l78 -+ 13 ·5
A8811m 1,096 23C 1,:>32 1,325 +7 +O·;j
Bihar 8,036 1,340 9,376 8,5H4 +782 +!1·1
Gujarat 4,309 1,747 6,056 7,052 -996 -14·1
Jruumu & Kashmir C03 295 b!IS 832 +66 +7·9
Kern II• 4,271 !1,087 7,~5~ •• 822 +2,536 +.12·0
Madhya Pradesh 9,6!7 2.145 ll,792 12,457 -665 -5·3
Madras 8,f'82 ·1,711 12,79!1 ·I 1,650 +1,14!1 +9·8
lllabara>htra 15,514 8,494 24,008 13,658 +10,350 +75·8
Mya<•re 7,354 2.2111 9,573 5,76:1 +3,810 +0~·1
Orissa 3,415 140 3,355 2,566 +989 +~8-5
Punjab 2,420 3,198 5,618 6,1181 -1,369 -19·6
Raj nathan 5,375 611 6,986 6,710 -724 -10·8
Utlar Pradesh 9,582 1,912 11,494 10,217 +1,277 +'2·5
Weat Bengal 3,659 1,254 4,913 .,320 +584 +13·5
A. & N. Islands 13 8 21 24 -3 I -12·.-J
D&dra & Nagar Haveli
Delhi 88 17!1 263 398 -135 -:>3·11
Himachal Pradaah 277 101 !178 2117 +81 +27·:1
L. M. & A. Ialands
1\lanipur 273 34 :lll7 3:!(; -29 -8·ti
Nagalard 15 15 19 -i -21·1
N.l!'.F.A. II II 18 -7 -!IR·9
! ondi r herry 25 16 "' ~2 -I -2·4
Tripu a 202 20 222 178 +44 ~21·7
·-------------·- -----
h!nu 91,1142 :l3,9TI 1,2o,ijlo 1,07,01>1 418,\JH + 17·7

CHAPTER VIII
PROFESSIONAL AND TECHNICAL EDUCATION
This Chapter deals with professiona_l and tec_hnical ~du?ation exclud!ng teachers' training which has been discussed m details m the preceding c}Ja.pter (chapter VII).
The expausion of technical education in the country continued with steady progress. New technical institutions were op_ened, the intake of m~ny existing ones was enlarged, facilities f~r research m the fie!~ of technical education were increased and laboratorres were strengthened w1th necessary equipment.
Main Developments at the Centre Some of the important activities of the Central Government in the field JO
professional and technical education are given in the following paragraphs.
l~ugineering and Technological Education, Indian Institute of Technol06Y
1. College of Engineering & Technology, Delhi Thls college was started in August, 1961 when the first batch of 141
students was admitted to degree courses in Civil, Mechanical, Electrical- and Cherniclll Engineering and Textile Technology. The college was being assisted by the Federation of British Industries and U.K. Government and would admit 2110 students each year, when fully developed, for the first degree courses in Engineering and Technology. It would also offer facilities for post-graduate studies and research in due course.
A technological block and one workshop block were constructed as part of the first phase of building of the college. Equipment worth Rs. 500,000 was received from the U.K. and five British experts were working at the college. The total assistance promised by the U.K. consisted of equipment worth £ 2,50,())0 and services of ten professors and two workshop exp<'rts for a period up to five years.
2. Higher Technological Institutes
A combined admission test for all the four Higher Technological Institutes at Kharagpur, Bombay, Madras and Kanpur was held in May, 1961 at about fifty •:entres and about 11,360 candidates sat for the test. Out of these 963 were allmitted in the first and second years of the 5 year integrated deQTee courses in various branches of Engineering and Techonology. The Kharagpur and B~mbay . insti~utes also conducted 31 and 16 post-graduate courses respc•~t1vely m different branches of Engineering and Technology. The tot~> I student enrolment in the post-graduate courses in these institutes was 327,.
The I.I.T., Bombay, which is being assisted by the UNESCO and the U.S:S.R.,_ received equipment worth ~s. _12· 658 millions up to the end of March, 1962. Fifteen professors, three sc~ent1fic translators and three technicians whos\3 services had been made available under the -~'!stance Programme, wf'.re'
MJB(D)5Utuf1'<lu-10a 235

236
serving at the Institute during the year. Four Indian teachers were also sent to the U.S.S.R. for training.
The I.I.T., Madras, which is being assisted by the West German Government, received equipment worth Rs. 3 • 657 millions up to the end of March 1962. Four German Professors, a German language teacher and three foremen were working at the Institute during the year. Four Indian teachers who were sent to West Germany returned to the Institute after training. Eleven other Indian teachers were currently undergoing training in West Germany.
A consortium of nine American universities and institutions had been formed by the U.S. Government to assist in the establishment and development of the I.I.T., Kanpur. A seven-man American team visited India in November, 1961 on behalf ofthe consortium to discuss the programme of the .~merican aid and other details. Following these discussions, Prof. Norman C. Dahl, of the Massachussetts Institute of Technology, arrived here to work as Programme Director of the American Aid and also as visiting Professor at the Institute. Twelve more American professors were expected to join the Institute by June, 1962. The U.S. Govt. obligated so far $ 33,19,065 for assistance to the Inst:tute in the form of equipment, services of American professors and training facilities for Indian staff in the States. In addition, an amount of Rs. (i • 548 millions was granted under PL 480 for rupee expenditure on buildings, local costs of the American professors, etc.
A comprehell8ive bill called the Institutes of Technology Act, 1961, incorporating all the four Higher Technological Institutes as Institutions of National Importance, was passed by ·the Parliament in December, 1961. The Act came into 1'orce from the 1st April, 1962. It also provided for the regulations of the administration and management of the affairs and finances of the lMtitutes. · For purposes of laying down general policy and overall co-ordination, the Act provided for the setting up of a Council. Each lMtitute would, however, have a large measure of autonomy and would be administered by its own Board of Governors.
B. Indian School o! M.ines, Dhanbad 'fhe name of the School was changed from Indian School of Mines & Applied
Geol.ogy to Indian School of Mines. The first batoh of students admitted in Petroleum Technology and Applied Geophysics passed out in 1961. A draft plan was prepared for the development of the School that envisaged coll8olidation of the existing courses and introduction of specialised training in mineral dressing, shaft sinking and tunnelling, open cast mining, mechanisation, mining geology, drilling and exploration of oil fields, etc. The details of the plan were beit1g worked out by the Governing Council of the Schod.
f. Regional Engineering Colleges 'rhe eighth Regional Engineering College started in August, 1961 at Alla
haba.•l, when tha first admissions were made for degree courses in Civil, Mechanical and Electrical Engineering. Under the Third Five Year "Plan, the Central Go·rernment sanctioned seven more Regional Colleges to be established in a phased mauner in Kerala, Gujarat, Punjab, Rajasthan, Madras, Assam and Orissa. Th > colleges for Kerala and Gujarat started during 1961-62 at Kozhikode and Surat respectively.

:!:n
5. Technical Institutions in the State Sector
During the year under report, the State governments started two Engineering colleges, one at Jalpaiguri, West Bengal and the other at Kothamangalam, Kerala and fifteen polytechnics. The Government of Orissa also started an engineering college at Romkela. Provision was made in the States-plans for establishment of 23 girls polytechnics during the Third Plan period. Four of these started functioning in 1961-62 at Hyderabad, Kakinada, Bangalore and Trivandrum. The revised Thrid Five Year Plan in the States' sector also provided for the establishment of 107 Junior Teclmical Schools. Seventeen of these schools- Eight in Madhya Pradesh, four in Kerala, three in Madras and two in And.hra Pradesh--started functioning during the year.
6. Post-Graduate Engineering Education and Research
The Committee appointed by the Central Government in November, l9fl9 under the Chairmanship of Prof. M.S. Thacker, submitted its report in August, 1961, on the present state of post-gradute Engineering Education and ReHearch and the lines along which further development in this field should beundertaken during the Third Plan period. The main recommendation of the Committee was that post-graduate courses should be reorganised in order to serve two distinct objectives viz. imm,diate and long rangfl. The immediate objective was to train engineer specialists in narrow fields who could easily apply their advanced knowledge of the field to industrial operation relating to design, construction, manufacturing processes, etc., in a scientific way and also to develop the results of research in their application to industry. The longrange objective was to train engineers with a deeper understanding of scientific principles who could undertake research and make fundamental contribution to the advancement of technology. In order to secure these objectives, the structure of post-graduate courses should provide for two distinct courses-one to be designated as post-graduate, diploma course of one year's duration and the other as 1\laster's degree cCiurse of two years' duration.
The report was considered by the All India Council for Technical Educ,ation at its 15th meeting held Gil 7th December, 1961. The Council generally agreed with the approach made by the Committee and endorsed the various recommendations c.ontained in the report.
The recommendations of the Committee were thereafter considered in the Ministry of Scientific Research and Cultural Affairs and within the limitations of the funds available in the Third Five-Year Plan, effect was being gtven to them as far as possible during the year.
Commerce Education
The All India Council for Technical Education appointed a Special Committee iu 1958 under the Chairmanship of Dr. V.K.R.V.Rao, to survey the whole field of Commerce Education and to recommend the lines along which Commerre Education should be reorganised and developed in relation to the needs of

238
industry and commerce. The Committee submitted its report in July, 1961 The main recommendations of the Committee were as follows :-
( i) In order to provide for efficient personnel in the lower wings in business and commerce as also to reduce the pre~ent rush to colleges, the Committee recommended instituting a National Diploma. Course in Commercial Practice (D.C.P.). The course should be of two years' duration with matriculation or its equivalent as the admission qualification. The course should be strict.ly vocational in content and training and should be offered by junior commercial schools or· polytechnics or other schools which were prepared to have a special section for commerce teaching. All institutions imparting instruction for the D.C.P. course should be registered and should satisfy certain minimum conditions regarding library, equipment and teaching staff. The institutions should also be eligible for government grants. Further, all other diplomas and certificates in commerce should be abolished.
(ii) The commerce subject should be taught only from the 11th class and Eot from the 9th class as suggested by the Secondary Education Commission.
(iii) The present B.Com. courses should be revised in such a manner as to give the students more liberal education. Specialisation in commerce should begin at the post-graduate stage. No practical training should be prescribed for B. Com. courses.
(iv) M. Com., courses should be so designed as to train specialists in commerce for employment in business and industry at executive level on the one band and the acadE>mic profession on the other. The duration oft.he course should be two years full-time or three years part-time. The part-time course should be open to commerce graduates who are employed and had at least three yeare' experience.
(v) Practical training should be prescribed only in case of M. Com. and that too at the completion of academic instruction. There should also be a well organised scheme of practical training for commerce teachers.
(vi) The teaching methods should be c..hanged Sl) as to include more use of tutorial methods, case study and use of library ; viva voce should be made an integral part of the examinations at the post-graduate stage.
(~ii) An All India Council for Commerce Education should be set up to deal with Commerce and Management Education. The Council should have Boards of Studies and Regional Committees and should function on the same lines as the All India Council for Technical Education.
(viii) Sufficient funds should be provided in the Third Five-Year Plan by the Central and State Governments for C01mnerce Education in the country.
The report was considered by the All India Council of Technical Education at its 15th meeting held on 7th December, 1961. The Council agreed with th(O aims and objectives of B.Com. course as defined by the Special Committee subject, however, to the modification that while no stress should be laid on llpecialisation, provision should be made in the scheme of studies for an optional iUbject to be ofl'ered by candidates wherever possible. Since, according to the committee, B.Com. courses should be regarded as liberal education, the Council recommended that the question cf development at tLis level might be

considered by the University Grants Commission as an integral part of the development of degree courses in the Humanities and Liberal Arts in Universities.
As regards ll'I.Com. courses and D.C.P. courses, the Council decided that these should be treated as particular fields of Technical Education. As Such, reorganisation and development of the courses along the lines suggested by the Conunittee ehould be brought within the purview of the Council itself for purpose!' of co-ordination and maintenance of standards. In order to- secure these objectives, the following measures Bhould be adopted :-
(a) The Board of Studies in Commerce should be reconstituted in order to make this body fully representative of all interests concerned and also to closely a~sociate with its professional institutions, as for instance, the Institute of Chartered Acco1mtants, the Institute of Costs and Works Accountants, the Institute of Banking etc. The reconstituted Board should formulate detailed proposals for the development of facilities for D.C. P. courses in the States as also fort he development of M.Com. courses at selected centres in accordance with tho recommendations of the Special Committee.
(b) Close liai~on ~hould be established between the Board of Management ~tudios and the Board of Commerce studies in order to secure co-ordination between commerce education and management studies. For this purpose, a Joint Committee of_ the two Boards should be set up to deal with problems of common interest.
As regards Commerce Education at the secondary stage, the Council decided that the recommendations of the Special Committee might be forwarded to the Ministry of Education for the consideration of the All India Council for Secondary Education.
The report of the Special Conunittee together with the recommendations of the Council were under the consideration of the Central Government.
Miscellaneous
1. Establishment of Technical Institutions
On the recommendations of the National Productivity Council, the Central Government approved the establishment of a. National Institute for Training in Indru!trial Engineering at Bombay durine; the Third Plan period. Detailed plans and estimates were drawn up by an expert Committee and these were approved.
Tlie Central Government decided to establish two All India Institutes of M.11nagemeut, one at Calcutta and the other at Ahmedabad, in association With the State Governments concerned and the Ford Foundation for Dostgraduate training and rosearch in Management. The Director of the Cal~utta Institute was appointed and the Ford Foundation arranged for the collaboration.of the Massachussetts Institute of Technology in the Development of this Ingt1tute.

240
The All India Council for Technical Education approved a scheme formulated by an Expert Committee for the establishment of a National Institute for Foundry and Forge Technology at Ranchi during the Third Plan period. The Council also approved a scheme formulated by another Expert Committee for the establishment of a Central Institute of Printing Technology during the Third Plan period. The question of location of this Institute was currently under consideration of the Government. 'fhe Council further approved the recommendations of its Applied Art Board that four Regional Centres for Industrial Design should be started at Bombay, Calcutta, Delhi and Madras .
. 2. All India Council for Technical Education
During the year under report, the Council held two meetings when it considered the proposals formulated by its Regional Committees and other Expert Committees for the expansion and development of technical education under the Third Plan. The Council also considered the reports on Post-graduate Engineering Education and Research and on Commerce Education.
In order to meet the increasing demand for chemical engineers, the Council approved doubling the admissions in existing centres and opening new centres in the States of Madhya Pradesh, Gujarat, Assam, Kerala, etc.
In order to maintain uniform standard of admissions in each State, as also to co-ordinate admissions to institutions, the Council recommended that the seats of all technical institutions in each State should be pooled together and admissions made by a single agency set up for the purpose. Some of the States accepted the recommendation and proceeded to make admissions to institutions in their respective areas through a State Selection Board. The other States were considering the matter.
3. Training of Technical Teachers Under the Technical Teachers' Training Programme, a further batch of
105 candidates was selected of whom 67 joined. Teacher-tr&inees numbering 234 were under training during the year. 23 teacher-trainees selected in previous years completed their training and were posted to different institutions ,to regular teaching positions.
A Working Group was set up under the auspices of the .All India Council for Technical Education to formulate a detailed programme for the training of teachers for polytechnics.
4. Practical Training
In order to organise and co-ordinate practical training of mining students on an all India basis, the Central Government set up a Dire~torate of Practical Training in Mining in December, 1961 at Dhanba.d.. The D~rector~te was under the charge of a Director and the necessary techrucal and mspectmg staff was aanctioned.
5. Part-time Courses and Sandwich Courses With the approval of the Ministry of Soie~t~fic Research an~ .C:Wtural
Affnirs and the Planning Commission, the Ministry of Defe~ce JmtJat~ a scheme of part-time courses for the A.M.I.E. and other profess1onal examma-
241
tiona for persons working in Defence Establishments, Government departments, Industries, etc. The part-time courses were organised at 19 centres and catered for about 3,100 students.
A centre for conducting Sandwich Course in Mechanical Engineering was also sanctioned for Coimbatore.
6. Scholarships, Fellowships and Grant-in-aid
Under the Research Training Scholarships Scheme, 800 scholarships had been sanctioned during the Second Plan period and it was proposed to raise the number to 1,000 by the end of the Third Plan period. For the National Research Fellowships 32 candidates were selected of whom 11 joined.
1,700 scholarships under the merit-cum-means scholarship scheme were sanctioned during the year for fresh entrants to degree and diploma courses. These new scholarships were distributed to all technical institutions in the country in proportion to actual admissions. In addition, 1,970 scholarships sanctioned in previous years were continued for students studying in higher classe8.
Grants amounting to Rs. 61· 6 millions and loans amounting to Rs. 16 ·55 millions were sanctioned to State Governments, private agencies, Regional Colleges, etc., for various schemes of Technical Edueation up to the end of the year 1961-62. ·
Main Developments in the States
A brief account of the main developments in the field of profesaional and technical education (excluding teachers' training which has been discusaed in detail in the preceding chapter) in the States and Union Territories is recorded below.
Andhra Pradesh
Grants were ~auctioned to the students of final year classes of the Polytechnics under the scheme of educational concessions (cash grants) to poor and meritorious students. A Government Polytechnic was started at Srikakulam .
.A6sam
A Commerce College was established during the year under report and &
l'olyt:echnic was started at Nowgong.
Bihar
The reconetruction uf the two big lecture theatres of the Bihar Veterinary College, Patna, in order to accommodate more students was completed during the year, .and an Engineering college at Bhagalpur was also started.

Gujarat
A Polytechnic at Broach with diploma course~ in Civil Engineering waR started.
Jammu and Kashmir
. · In order to give a great impetUB to technical education, a Board of Technical Education to advise the Government on the progress of technical edu- · cation was set up.
Kerala
A new Departmei:tt of Law was started at Ernakulam under the University of Kerala. The Thirumala Devaswon Medical College was newly established at Alleppey. A Government Polytechnic was started at Perithelmani.~ (District Palgbat).
Madras
The University of Madras instituted the degree of .Master of Library Science. A Government Polytechnic was started at Pondicherry.
Maharashtra
A two-year tra.ining course was provided at the nine agricultural training centres to train the Gram Sevaks in ba~ir. knowledge of certain important subjects related to rural development work. A p0ultry school was newly Rtarted at Nagpur. Two new 'Technical Centres' were started at Khamgaon and Parbha.ni, where secondary school students opting for technical education were given training in workshop processes and were imparted lessons in engineering.
One Commerce college, namely, the Bandra College, was started m l!ombay.
My sore
Two Government Polytechnics, one each at R.aichur and Erazerpet were started.
Orissa
Grant-in-aid from Government was given to a private technical school a\ Balasore. Some new courses of study were provided in different Industrial Training lllBtitutes. An Engineering college was started at Rourkela which later on was converted into a Regional Engineering college.

243
Punjab
_ Three new Industrial Training Institutes for girls were set up_ at Simla. Three Government Junior Technical Schools were transferred to the Director, Technical Education, Punjab. Evening classes were started at the Government Industrial School, Roshiarpur. Four Vocational Training Centres were converted into Industrial Training Institutes and eight merged with the respective LT. Institutes. Eleven new I.T. Institutes for boys (OUt of which three were managed by private bodies) were set up. Three Industrial Schools for girls were started in rural areas and one Diploma School was established at Simla. Three new private Industrial Schools for girls were granted provisional recognition and twelve provisionally recognised certi£cate schools were pE>rmanently recognised. A sum of Rs. 19,307 was disbursed as grant-in-aid among permanently recognised schools and a sum of Rs. 10,000 wa~ sanctioned as ad-hoc grant to some of the provisionally recognised schools. Four private technical institutions were paid grant-in-aid to the tune of Rs. 4,61,665. An amount ofRs. 52,541 was spent as stipends under the Economic Uplift Scheme to the Scheduled. Castes/Other Backward class students of the thirteen Economi<; Uplift Industrial Training Centres. A sum of&. 14·35 lakhs was distributed to poor and deserving technical students as interest-free loan. Loans were also given to students pursuing studies in Chemical Engineering at Panjab University and to some Punjabi engineering students outside the State. Displaced students from West Pakistan studying in various technical institutions throughout India were also granted financial assistance in the . form of stipends under the rehabilitation scheme.
A seheme for the establishment of the Institute _ for Post-graduate Training and Medical Research at Chandigarh was conceived and included in the Second Plan. Subsequently, it was extended to the Third Plan ali!Oduring the year under report, the Institute's building was nearing completion.
The scheme for starting a new agricultural college at Hissar was approved by the Government. Grants-in-aid amounting to Rs. 13,800 were given to Khalsa C<'llege, Amritsar, for agricultural education purposes. . '
A Government Polytechnic was started at Thajjor (District Rohtak).
Rajasthan
One I)11W Medical College was opened at Ud"J.ipur in the year under review._
Uttar Pradesh
. The Government S~hool of Art and Crafts, Lucknow, prepared students lll Arehttectural Des1grung and Draughts-manship for the first time during the J€ar under report. ·

244
West Bengal
Five Colleges of Commerce were established in the year, four in Calcutta and one at Midnapore and an Engineering College at Jalpaiguri was also started.
Delhi
The College of Technology, Banaras, was given a grant of Rs. 480 and four students of the Indian School of Mines, Dhanbad, were awarded a total amount of Rs. 2,400 by the Directorate of Education, Delhi. A Polytechnic was started at Okhla.
Himachal Pradesh ·
A provi~ion of Rs. 10,000 was made for the award of five scholarships for degree courses and fifteen Rcholarships for diploma courses in Engineering to deserving student.s.
L. M. & A. Islands
There were no facilities for professional and technical education in the islands. .During the year eight ~tudents were sent to ~he mainland for studying various professional and technical courses. They were given scholarships as well as annual lump .sum grants for purchase ·of books and their feee to the institutions where they were studying were pll.id by the Administration.
A· new Industrial School was established during the year. Tools and implements were purchaeed and distributed to schools on a large scale.
PoncUchem
A Polytechnic institution named as Motilal Nehru Polytechnic was ~tartPd i11 June,l961, with Civil Engineering courses only. Liberal sanction was given to this institution for the purchase of equipment for laboratories and workshops and scholarships worth Rs. 14,170 were awarded to 32 students.
The Pondicherry Medical College showed much progress during the year. The Departments of Radiology and Psychiatry were organised and those of Paediatrics and E.N.T. were further developed. New methods of teaching were introduced by organising periodical sympo3ia and seminars.
~pura
During the year under report the Industrial Institutes existing in Tripura were expanded and strengthened by appointment of more teachers and by purchasing equipment and scientific apparatus.

245
The Basic Aoricultural school opened new courses for training farmer~' and tribal farmer~' sons. The intake capacity of the Polytechnic Institute was increased to 120. The Nursing Training Centre attached to the V.M. Hospital, Agartala, started three new courses, viz. Senior Nmsing Course, Pharmacy Training Course and Health Vi•itors' Course.
Vocational and Technical Schools
Institutions
The salient statistics of vocational and technical schools are given in table XCVI. The number of such schools decreased by 394 to 3,751 or by 9 · 5 per cent dming the year under report. The decrease was mainly due to a decrease in Commerce schools. Of the total, 1,687 schools (45·0 percent} w'lre managed by the Government., 34 schools (0 · 9 per cent) by local boards, 1,089 (29·0 percent) byprivate aided and 941 (25·1percent) by private un- _ aided organisations.
The distribution of these schools according to type of education was: technical, industrial, arts and crafts schools 1,196 (31·9 per cent), teachers' training Rchools 1,133 (30·2 per cent.), Commerce schools 770 (20·5 per cent),engineering ~chools and polytechnic schools 297 (7 · 9 per cent,), medical schools 174 (4·6 percent.), agricultmal schools 106 (2·8 percent), Physical education schools 43 (1·1 per cent), schools for veterinary science 9 (0·2 percent), marine training schools 5 (0·1 per r.ent), forestry schools 4 (0·1 per cent) and other (unspecified) schools 14 (0· 4 pl'r cent}. Some of the Technical and Industrial schools provided instruction in engineering subjects also. Besides, some of the schools for geMral education had attached classes in teachers' training, engineeiing and other technical and vocational subjects. An increase was reported in each of agriculture, engineering and medicine and whereas a decrease ws.s observed in each of Commerce, teachers' training, veterinary science, technical, industrial and arts and crafts schools and other (unspecified} schools. The number of foreRt.ry and marine training schools remained the same as in the previous year, The rather unusual decrease of 419 in commerl!e schools was due to discontinuation of typing schools in Andhra Pradesh and Maharashtra, while teachers' training schoola decreased by 5, veterinary science schools by 3 Technical, Industrial, Arts & Crafts Schools by 2, and other schools by 1 only .
. 'l'ho. highest increase w~~ reported by medicai schools (16), followed by engnwermg schools (14), agnculture schools (4) and physical education schools (2). 0
Enrolment
The total number of pupils under instruction in various vocational and t er hnieal schools and attached ela!<ses to' general and professional schools and
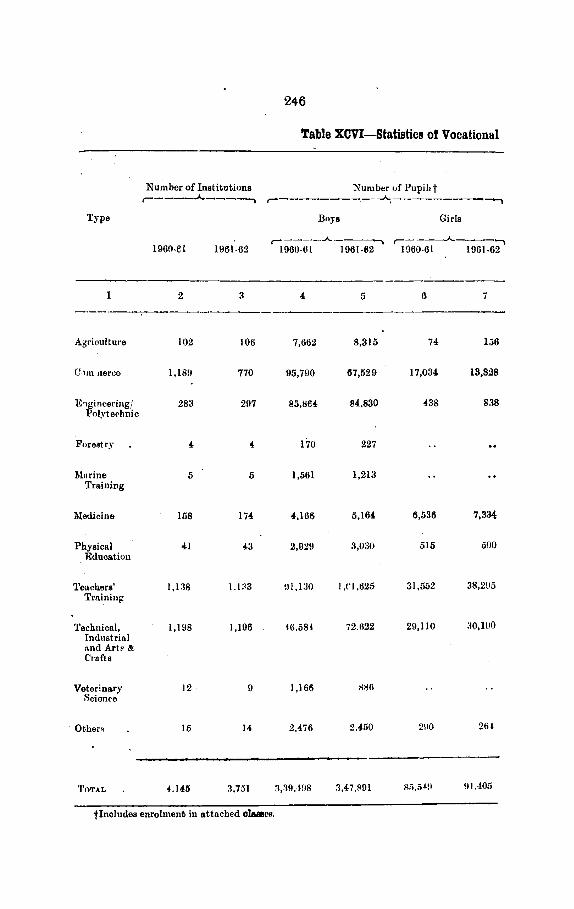
246
Table XCVI-Statistics of Vocational
Number of Institutions X umber of Pupil>t r-----.A.------. ,.----------.--~,---------~
Type Boys Girls
r------..A..----, r-----..A..-----. 196o-eL 1961-62 1960-!il 1961-82 1960-61 1961-62
2 3 4 5 6 7
Agt·ioulture 102 106 7,662 8,315 74 1J6
U)JU nerco 1,18!1 770 95,790 67,529 17,034 IS,SilS
E'lgineeringj Polytechnic
283 297 85,86.l 84,830 438 838
Forestry 4 "'
I7o 227
Mnrine 5 5 1,561 1,213 Training
l\ledioine \liS 174 4,16fS 5,164 (1,536 7,334
Physical 41 4:1 2,92!1 3,0:10 515 500 Rduoation
11eachers' 1,138 1.1 :>3 !JI,l:JO 1,1'1,625 31,5,;2 38,2U5 Train in!(
Technical, 1,1118 1,106 16,581 72.622 29,ll0 :JO,l!IO Industrial 1\nd Art• & Crafts
Veterinary Scien<·e
12 9 1,166 >!86
Other. 16 ).1, 2,476 2.450 2!10 261
ToTAL 4.146 3,751 3,39,-198 91.-105
tincludea enrolment in attached oues.

247
and Technical Schools by Type
Expenditure Percentage of Expenditure Average T~p (1961-62) met from annual ccst
per pupil _--A.--·-----.. r-__ ___.J\,._ _____ --.
r------"-----.,
1960-61 Hl~l-62 Govt. Local Fees En- Other 1!lfl0- 1961-Funds Boards dow- Sour- 61 62
·Funds mente ces
----8 9 lO 11 12 13 14 Hi 16
4fl,5l,O:J!l 41!,15,453 92·5 1·3 0·0 6·2 601·6 5S:~·2 Agriculture
45,11,580 33,95,793 5·2 0·0 90·2 1·5 3 ·1 40·1 41·8 C(mlmen·e
4.,03,Aii,444 4,60,92,778 78·4 0·0 16·8 2·2 2·6 508·1 523·3 Engineering Polytechnic
94,882 1,02,418 100·0 558·1 4iH -2· F,,restry
15,78,078 a,s1,527 94·6. 4·6 0·!1 1,010·9 1,221·-t 'Marine Training
35,~12,519 45,!17,810 U·1 2·8 12·0 0·7 10·4 389·9 408·4 ].[pdil'ine
.~.72,230 f\,16,753 34·6 2·9 46·9 1·2 14·4 199·9 2ll·O Physic-al Edncatint1
~~.4~.1l.l2:l 3,92,75,302 ll0·3 0·4 5·4 1·1 2·8 :Ill·{ 322·5 TeacherB' Training
2,25,07,372 2,63,24,010 81·1 0·8 6·6 4·2 7·3 303·4 290·6 Tet·huit·al, . Industrial and Arts & ('rafts
4,4.6,636 4,68,017 98·3· 1•7 444·9 602·1 Veterinary Scienc-e
_,. 9,0i,6U 7,80,7f6· 97·8 2·2 .. 461·:7 398-s Other~
ll,40,91,613 12,80,46,627 .81·2 0·4 12·2 ~-1 ·i-1 284·3 313·5. ToTAL

248
colleges rose from 4,25,047 (3,39,498 boys and 85,549 girls) to 4,39,296 (3,47,891 boys and 91,405 girls) during the year. This gives an increase of 3 · 4 per cent as compared to an increase of 11· 6 per cent during the previous year. The distribution of students according to the type of vocation is as follows:-
Table XCVU-Number of Pupils by Type of Vocation of School Standard
1960-61 1961-62 Type of EduoBtion
Number of Percentage of Number of Percentage of students total enrol· students total enrol
ment ment
Agriculture • 7,736 1·8 8,471 1·9
Commerce 1,12,824 26·5 81,357 18.5
Engg./Technology 86,302 20·3 85,668 19·5
Forestry 170 0·0 227 0·1
Marine Training . 1,561 0·4 1,213 0·3
Hedloihe 10,702 2·li 12,498 2•7
Physical Education 3,444 0·8 3,1130 0·8
Teaohera' Training 1,22,682 28·9 1,39,920 31·9
Teohnioal, IndustrialandArts 75,694 17·8 1,02,812 23·4 & Crafts.
Voterin&ry Science 1,166 0·3 886 0·2
Othera 2,766 0·7 2,714 O•R
Total 4,25,047 100·0 4,39,296 100·0
An increase in the number of pupils was reported by all types of vocation except commerce, marine training, veterinary science and 'Other' subjects during 1961-62. The largest decrease was observed in commerce which was due to a fall in the number of such institutions. Teachers' Training attracted the largest number of students, followed by technical, industrial and arts and crafts and engineering technology. The only other vocation which attracted a sizable number of students was commerce. These four types of vocations together accounted for over 93·6 per cent of the total enrolment in vocational schools leaving a small margin of about 6 · 4 per cent for all the other_ types of vocations.
E:rpenditure
The. total direct expenditure on vocational a.nd U>chnical schools (excluding attached ola.saes) increased from Rs. 11,40,91,613 toRs. 12,80,45,627 or at the rate of 12 · 2 per cent during the year under report as against 22 · 8 per cent during 1960-61. This expenditure constitutes 3 · 2 per cent of the total expenditure on all tn>es of institutions.
The percentage distribution of the expenditure according to different sources of income was: Government funds 81 ·2 per cent, local boards funds 0·4per cent, fees 12·2per cent, endowments etc. 2·1 per cent and other sources 4·1 per cent. The corresponding percentages for the previous year were 77·1, 0·7, 14·2, 2·4 and 5·6 respectively.

249
Of the total direct expenditure on vocational and technicJ.l 9chools, the schools for engineering and technology alone accounted for . 36 · o. perce~t, followed by teachers' training schools 30·7 percent and techmcal, mdustnal and arts and crafts schools 20 · 6 percent. The proportion of expenditure on the remaining schools ranged from 0 · .1 percent on forestry schools to 3 · 8 percentlon those for agriculture.
Taking all types of vocational school!~ together,the averag<~ ~nnual cost of education per pupil in these schools increased from Rs. 284·3 m 1960-61 to 313 · 5 during the year under report. As in the previous year, the highest average annual cost per pupil was reported by marine training schools (Rs. 1,221· 4) and the lowest by Commerce schools (Rs. 41· 8).
The combined statistics of all the. vocational and technical schools by States are given in table XCVIII.
A brief account of each type of vocation except teachers' training (which has already been discussed in the previous chapter) and other (unspecified ones) is given below:-
Agricultural Schools The number of agricultural schools increased by 4 to 106. Guja.ra.t, Maha·
rashtra and Mysore reported an increase of 5, 2 and 1 respectively while Madhya. Pradesh showed a decrease of 4 schools. Of the total number of agricultural schools, 91 (85·9 percent) were managed by the government, 10 (9·4 percent) by private aided bodies and 5 (4·7 percent) by private unaidec} bodies. Th~ number of pupils together with those in attached classes receiving agricultural education of the school standard increased from 7, 736 (7 ,662 boys and 7 4 girls) in 1960-61 to 8,471 (8,315 boys and 156 girls) in 1961-62.
The total direct expenditure on these schools also increased from Rs. 46,54,099 to Rs. 49, 15,453. Its distribution according to various sources of i.vcome was:-government funds 92 · 5 percent, fees 1 · 3 percent and other sources 6 · 2 percent. The average annual cost of educating a pupil in these schools amounted to Rs. 583· 2 as compared to Rs. 601· 6 in 1960-61. Table XCIX gives statistics of these schools in the various States. .
Commerce Schools The number of Commerce schools deoreased from 1,189 in 1960-61 to
770 during 1961-62. The largest decrease was in Maharashtra (197), followed by Andhra Pradesh (184). The decrease in these States was due to the fact that the institutions which had no educational content (e.g. typing schools) were dropped from the list in 1961-62.
Au increase in the number of commerce schools WM reported among States by Ma~as (17)~ followed by Mysore (9), Bihar (3) and West :&ngal (1). AB for Umon Terntories one Commerce school was started in Delhi during 1961-~2. The distribution of these schools by management was: 17 (2·2 percent) by governm~nt, 61 (7 · 9 percent) by private aided bodies and 692 (89 · 9 per cent) by p~1vate un!l.~ded bodies. The number of pupils in Commerce ~chools to get her w1th those 1n attached classes in other institutions decreased from 1,12,82-l students (95,790 boys and 17,034 girls) in 1960-61 to 81,357 students (67,529 boys and 13,828 girls) during 1961-62. ~[jB(D)54::1IofEducatinn-20

250
Table XCVIn~tatistics of Vocational
Number of Institu- Number of Pupilst tiona r- .A.-------....,
StaleJTerritorif Boys Girls
~ ,-------. ,-----"----. 1960-61 1961-62 1960-61 1961-62 1960-61 1961-62
2 3 4 5 6 l
Andhra Pradesh 387 205 30,641 24,256 5,470 5.560
Assam 97 94 7,129 7,866 1,071 I ,()25
Bihar 230 232 28,661 31,106 3,091 4,189
Gujarat 328 288 27,758 28,994 7,550 7,121
Jammu & Kashmir 10 12 4-14 903 194 214
Kerala 190 198 12,036 13,792 4,988 5,882
Madhya Pradesh u' 143 9,089 9,436' 1,683 2,034
M~drss M2 551 42,057 45,099 12,0:JJ 13,454
Mahara.shtra !)87 667 54,141 48,157 19,931 17,803
My sore 270 274 29,592 31,691 4,696 5,754
Orissa 138 136 8,558 9,('59 519 568
Punjab 160 170 12,659 15,861 6,640 10,431
Rajasthan 68 6ol 8,419 7,968 668 605
Uttar Pradesh 285 311 27,373 30,184 5,394 5,742
West Bengal 337 33& 35,810 38,029 9,509 9,772
A. & N. Islands 2 20 IS 4 10
-Delhi 10 15 3,224 ·3,529 640 668
Himachal Pradesh 4 5 330 413 49 85
Manipur 31 31 890 911 228 232
Nagaland. 2 2 '60 59 t6
N.E.'F.A. 18 43
Pondicherr::r 2 3 lOS 152 18 37
Tripura 20 i 586 470 375 1:!0
INDIA 4,145 . 3,751 3,39,498 3,47,891 85,540 91,40G
t Inrludes enrolment. in attached olaoses.

251
and Technical Schools by States
F.xpenclituro Perc~ntage of Expenui t ure (1961-62) met from
,- --. _..,~.,. __ -~ ,--------A State/Territory JOe0-61 IUtil-62 GoYt. Local Fees Rnd~w- Other
Fnnds Board.! ment.s Rourr,es Funds
-------------g ~ 10 11 12 13 14
---------------------
8~.81,86~ n6,26,421 M!·S 0·4 5·7 8·4 0·9 Audhra Pradesh
~~.76,6~0 30,70,1~2 88·7 IHI 8•1 1·6 1·6 Assam
I ,07,41,360 1,12,,1,070 97·6 0·1 1·0 0·5 0·8 Bihar
tlri,71,5H2 99,93,982 81·4 1·4 10·8 0·8 4·6 Gujarat
~.8R.621 15.27.044 99·0 1·0 Jammu & Kashmir
:nR1 .. >11 :16,15,986 72·6 21·0 0·6 5·8 Kerala
71,05,803 97,90,436 96·9 0·0 2·2 0·0 0·9 Madhya PradeNa
ll5,87,46::; H,56,8S8 50·0 31.··5 13·9 5·6 Madra a
2,l::;,H,147 2,01l,I0.969 72·3 0·7 17·1 0·7 9·2 Maharashtra
ll6,11H,9U 75,78.870 7!!·0 0·0 15·7 0·0 4·4 ~lysore
28.1'1.~17 25,~--.322 86·6 0·0 0·7 1·5 2·2 Oriasa
(13,86,022 68.61,129 72•1 0·0 19·6 2·7 5·6 Punjab
4q,96,\l26 !i-!.77,958 93·6 5·7 0·2 0·5 Rajasthan
1,21 ,4-1,4»» 1.41.93,652 87·1 0·7 8·1 0·3 3·8 Uttar Pradesh
Y;j,5l,U2 1,(18,85,065 70·0 0·6 23·6 1·a 4·4 West Bengal
2'.713 2~.00:{ 100·0 A. & N.lslande
\;3,116,5~7 17,R2,47n 96·:1 2·5 0·8 0·~ Delhi
3,0,,8811 3,79,157 RiH, ~-6 Himachal Pradeoh
3,70,133 4,32,701 97'' !•8 o·& 1•1 O·S Manipur
!i2,05!'\ 55,067 100•1) Nagaland
7~,851 1,12,640 100·0 N.E.F.A.
M.42S 1,1 R.~90 0-'1·4 ~-6 Pondich•rry
JM,7ti~ :\,62,217 91·3 6·11 I·R Tripura
-----11.40,01,61:1 12,80,45,62i ll1·2 11·4 12·2 2·1 4·1 iNDIA

252·
Table XCIX-Statistics of Agricultural Schools
Number Number of Pupils* Expendi- Average _i:ltatetTerrit~ry of ·r- -. ture Annual
Insti· Boys Girls Total cost per tutions pupil
2 3 4 5 6 7
Rs. Rs.
Assam 97 97 84,537 871·6
Bihar 20 1,744 47 1,791 8,74,672 488·4
Gujarat 15 993 33 1,026 7,37,921 719·2
Madhya Pradesh 8 288 289 26,409 91·4
Maharasbtra 37 3,044 4 3,0!8 19,84,540 660·4
Mysore 11 671 71 742 6,70,622 903·8
Uttar Pradesh 10 1,238 1,238 3,6fl,755 297·9
West Bengal 2 113 113 93,718 829·4
Manipur 22 22 39,470 1,794·1
Tri:rura 105 105 34,809 331·5
INDIA. 106 8,315 156 8,471 49,15,453 583·2
*Includ~s enrolment in attached classes.
The total expenditure incurred on these institutions was Rs. 33,95, 793 as against Rs. 45,11,580 during the previous year. The decrease in enrolment and expenditure was ·due as stated earlier to a fall in the number of institutions in .Andhra Pradesh and Maharashtra. Of the total expenditure of Rs. 33,95, 793, 5 · 2 percent was met from government funds, 90 · 2 percent from fees, 1 · 5 percent from endo~ents and 3 ·I percent from other sources. The average annual cost per pupil in a commercial school during 1961-62 was Rs. 41·8 as against Rs. 40·1 during the previous year.· The State-wise statistics of Commerce schools are given in table C.

253
Table C-Statistics of Commerce Schools
No. of No. of Pupil&• Expendi· Average State Territory Insti. ,---..A------~ ture Annual
tutions Boys Girls . Total cost per pupil
----------2 3 .. 5 () 7
Rs. Rs.
Andhra Pradesh 5 .. 214 57 271 !!0,235 3~3:0
Asaf\m 23 3,151 370 3,521 1,60,403 45·6
Bihar 27 2,843 56 2,899 1,19,872 18·7
Madhya Pradesh 29 29 2,412 83·2 )Jadras 432 23,106 . 6,156 29,262 10,36,688 35·4 Maharasht ra 43 6,095 1,440 7,535 5,35,119 72·8 !>Iysore 162 16,402 3,888 20,290 5,26,774 26·0 Orissa. 2 32 I 33 6,878 208·4 Punjab 19 19 Raj~U~than 84 84 West Bengal 74 15,460 1,844 17,304 9,03,087 51·7 Delhi 94 1!' 110 14,325 130·2
--------------I surA 770 67,52!1 13,828 81,357 33,95,793 41·8
~ Include! enrolment in attached classes.
Engineering schools/Polytechnics
Under this category of institutions, only those have been included which have one or more courses in engineering and technology of the post-matriculation standard. The number of these institutions rose from 283 in 1960-61 to 297 during the year under report. The increase in the number of such institutions was reported by Andhra Pradesh (4), Assam (1), Gujarat (1), Kerala (2), Madhya Pradesh (2) :Maharashtra (6), Mysore (5), West. Bengal (2) and Delhi (1), while a decrease was shown by Bihar (1), Punjab (11) and Uttar Pradesh {1). During 1961-62, 2 institutions in Jammu & Kashmir and 1 in Pondicherry were also newly started. In other States and Union Territories the number of such institutions remained the same as in the previous year. Of the total number of enginering schools and polytechnics, 211 (71-0 percent) were managed by government, 75 (25·3 percent) by private aided bodies and 11 (3-7 percent) by private unaided bodies. Apart from these engineering schools, some technical schools and engineering colleges also had provision for engineering education of the F<"hool standard. . . · -~. ·
T~w number of pupils in engineering schools and polytechnics togetherwith t hosq Ill attached classes in engineering colleges and technical, industrial and arts and crafts schools decreased from 86,302 (85,864 boys an<l 438 girls} in 1960-61 to 8fi,668 (84,830 boys and 838 girls) in 1961-62. The total expenditure incurred on t~1ese institutions was Rs. 4,60,92,778 during 1961-62 as against Rs. 4,03,85,444 dunng the previous year. Of this, government met 78·4 percent, fees 16·8 porc<:~nt, endowments 2·2 percent and the rest of 2-6 percent was met from other sonrc<.'s. The average annual cost per pupil was Rs. 523-3 during the year as compared t<1 Rs. 508-1 in 1960-61. · · ·: '

The Sta.te-wise statistics of engineering schools and polytechnics are given in table CI. . ·
Table CI--Btatisti~ of Engineering Schools and Polytechnics
No. of No. of_pupila* Expendi. A,·erage StstoJTerrit >r:r Institn. r---~ --------. t.nre .\nnunl
tiona Boys Girls 'rot.al ('OAt pt-r pupil
2 3 5 6 7
Ro. Ro.
An•lhrs Prad01h 32 9,39ii u2 9,tl37 4-4,4(1,751 460·8
AI!I!Sm II 1,243 1,243 10,59,962 ~52·7
Bihar ,. 22 5,002 5,002 30,15,04~ 4~9·7
G~tj,.rr.t • 12 5,249 8 5,257 24,90,081 .535·8
Jammu & Kashmir 2 464 464 7,42,209 1,509·6
Kerala 24 4,832 287 1),119 2f·,31,540 2tl9·9
Madhya Pra.deah 15 2,922 2,922 36,37,4I:i 1,2<!4·R
Madras 23 7,937 7,997 37,69,5P.5 488·1J
M•haraahtra 24 7,996 90 8,086 36,41,755 . 744·7
M.YRore 25 !1,435 175 8,610 36,24,732 444•0
OrlN& 12 2,320 2,320 11,28,473 505·8
Punj&b a a 9,159 9,1611 44,03,534 455·8
Raj&sthan 5 1,184 1,184 15.70,4()!) 1,!126·4
Uttar Pradesh . 27 8,475 6,475 .11,90,270 646·7
West Bengal 26 9,644 4 9,648 58,13,67~ ·~8·0
Delhi 4 1,889 so 1,919 9,72,939 472·3
Him!'chal Pradeoh 1 171 171 2,36,415 1,382·5
Manipur 2 236 2 238 1,38,129 567·8
Pondich61Ty 53 53 33,616 632·4
Tripura 224 224 1,55,338 693·5
bnu. 297 84,830 838 85,668 4,60,92,778 523·3
• Includes enrolment in attached classes.
Forestry Schools
The number of forestry schools during 1961-62 remained the same as in the previollil year. 2 such schools exist in GujiU'&t and the other 2 in Mahar&Bhtra. These schools were being managed by government. The number of pupils in these schools rose from 170 (all boys) in 1960-61 to 227 (all boys) in 1961-62. The total direct expenditure in these schools incr6686d from Rs. 94,882 in 1960-61 to ltb. 1,02,418 during 1961-62. The average annual cost of educating a pupil in a forestry school was Rs. 451·2 as against Rs. fl58·1 during the previous year.

255
'Phe State-wise statistics of these schools are given in table CII.
~tatf!l Turri tory
(; 1tjarat Mah1.r:1~1 l. ~;n
Table CU-Statistics of Forestry Schools
No. of No. of Pupils L1a~itu- ,----___.t...------. tiona Boys Girls Total
2 3 4 5
2 68 68 2 169 159
Expsndi· ture
6
Rs.
G8,8It~ 3:1,602
-- --------------· {~JHA ..; 227 227 1,02,418
Marine Training Schools
Average Annual cost per
pupil ·----
7
Rs.
1,012·0 211·3
451·2
Thor~ were 5 marine training schools in th~ country, the same as in 1960-61, out of which 2 were in Andhra. Pradesh and 1 each was in Guja.ra.t, Ma.ha.ra.shtrii. and West Bengal. Of these, 4 (80·0 percent) were managed by gov~rnment and 1 (20·0 percent) by a. private aided organisation. The num.oor of pupils receiving education in these schools decreased from 1,561 (all boys) in 1960-61 to 1,213 (all boys) during the year under report. Decrease was reported by all the States. The total direct expenditure decreased from Rs. 15,78,078 to Rs. 14,81,527. The percentage distribution of the total direct expenditure shows that 94 · 6 percent waR inet from government funds, 4·6 percent from fees and the remaining 0 · 8 percent from other sources. The average annual cost per pupil was Rs. 1,221·4 as against Rs. 1,010·9 in the previous year.
The State-wis" statistical details are given in table CIII.
Table em-Statistics of Marine Training Schools
State/Territory No. of No. of pupils
Institu- Expendi-tiono 1loye Giril Total ture
2 3 4 6 6
Rs. Andhra Ptadosh 2 497 497 4,51,008 Gujarst . I 260 260 1,92,168 Maharasbtra I I 56 156 5,97,674 West Bengal : I 300 800 2,40,677
INDU. 5 I,2I3 I,2I3 14,81,527
Schools of Medicine
Average AnnuaJ
cost ·r· pup•
7
· Rs. 907·11 739·1
3,831·2 802·2
1,221·4
Medical schools existed in Gujarat, Kerala, Madhya. Pradesh, Maharashtra )I~or~, Pull:jab, U~tar Pradesh, West Bengal, Delhi, Manipur, Pondicherry and Tnpura. B<'Bides this some of the medical colleges in Andhra Pradesh, Madras and RaJasthan had school classes attached t<> them. The total number of schools

256
for medicine increased by 19 to 174. An inc:.;ease was reporred by the States of Gujarat (4), Maharashtra (5), Punjab (8) and Uttar Pradesh (3). The decrease of 3 medical schools in Mysore Stare was due to the amalgamation of some training centres of uneconomical nature and of 1 such school in Manipur due to non-availability of buildings and equipment. Of the total number of medic;tl schools, 100 (57·5 percent) were managed by government, 3 (1·7 percent) by local boards, 46 (26·4 percent) by private aided bodies and the remaining 25 (14·4 percent) by private unaided bodies.
The total number of students receiving education in these schools together with those of attached claBBeS in some of the colleges was 12,498 (5,164 boys and 7,334 girls) during the year under report. as against 10,702 (4,166 boys and 6,536 girls) during the pr~vious year. This gives an increase of 16·8 percent. The total direct expenditure on these schoole increased from Rs. 35,32,519 to Rs. 45,97,810 or by 30·2 percent. Its source-wise percentage distribution was: government funds 7 4 ·1 percent, local bodies funds 2 · 8 perc.ent, fees 12 · 0 per cent, endowments 0·7 percent and other sources 10·4 percent. The average at;~nual cost per pupil in these schools increased from Rs. 389·9 in 1960-61 toRs. 408·4 in 1961-62.
·The detailed statistics of these schools in Stares and Union Territories are given in table CIV. ·
Table CIV~tatistics of Schools for Medicine
No. of No. of Pupils StatejTerritory Institu- Average
tiona Boys Girls Total Expendi- Annual ture coat
per pupil
1 2 3 6 6 7
Rs. Rs.
Andhra Pradesh 372 373 Gujarat 26 149 1,166 1,314 5,41,451 417·8 Kerala . 63----- 12 . 75
Madhya Pradesh 6 so 170 200 1,15,720 578•6 Madraa. 206 12 218 Maharashtra . 88 2,279 3,747 6,026 24,60,328 409·2 Mysore . 16 405 587 992 4,19,889 423·3 Pnujab. 24 20! 924 1,126 2,99,720 276·0 Rajasthan .. 80 13 93 Uttar Pradesh 5 293 99 392 1,08,441 634·2
West Bengal • 10 766 314 1,080 4,62,172 428·8
Delhi . 1 319 117 436 1,47,423 1,260·0
Marl! pur 2 49 49 20,067 409·6
I'ondicherry . 1 37 37 19,749 533·8
Tripura 1 87 87 2,850 32·8
INDIA 174 5,164 7,334 12,4g9 45,97,810 408·4

257
Schools for Physical Education
Schools for Physical education existed in the States of Biha.r, Gujarat, Madhya Pradesh, Madra~, Maharashtra, Mysore and Orissa.. The total number of these schools during the year under report was 43 as against 41 during 1960-61. The increa,se of 2 schools was reported by l\'faharashtra while in other cases the number remained the same as in the previous year. Of the total number, as many as 41 (95 · 5 percent) were managed by private aided organisations and 1 each (2· 3 percent each) by government and a local body.
The total number of pupils receiving physical education in schools together with those of attached classes increased from 3,444 (2,929 bO)B and 515 girls) in 1960-61 to 3,530 (3,030 boys and 500 girls) in 1961-62:
The total direct expenditure on these schools rose from Rs. 5,72,230 to Rs. 6,16,753 or by 7 · 8 percent. Its percentage distribution according to various sources of income was: 34 · 6 per cent from government funds, 2 · 9 percent from local bodies funds, 46· 9 percent from fees, 1·2 percent from endowments and the remaining 14·4 percent from other sources. The averag~ annual cost of educating a pupil came toRs. 211·0 as compared toRs. 199·9 in the previous year. Table CV gives the statistics of Hchools for physical education in the various States.
Table CV -Statistics of Schools for Physical Education
No. of No. of pupils Expendi· Average State/Territory lnstitu. ...-., ture Annual
tiona Boys Girls Total cost per
pupil
2 3 4 5 6 7
Rs. Ra. Andhra Pradesh 32 5 37 Bihar 75 ll 86 3,250 92·9 Gujarat 3 172 44 216 70,191 325·0 Madhya Pradesh ll7 36 153 6,915 45·2 ~[adras . 385 97 482 30,492 358·7 )fnharashtra 19 718 209 927 3,88,369 419·0 Mysore . 17 1,395 78 1,473 1,00,654 68·3 Orisoa 34 34 16,882 496·5 Rajasthan 69 20 89 Uttar Pradesh 33 33
lliDIA 43 3,030 500 3,530 6,16,753 2ll·O
Technical, Industrial and Arts & Crafts Schools
_\11 I.T.I's. having courses below matriculation standard were shown wuler this category of institutions. The number of technical, industrial and a~ts & crafts schools decrc>ased from 1,198 to 1,196 or by 0· 2 percent. The h1gh~st mcrease ''~"'\S reported by Gujarat (19) followed by Uttar Pradesh (11), Pun]lb (10) Mysore (5), Kerala and Madras (4 each), Delhi (3), Madhya

258
Pradesh (2) and Bihar, Rajasthan and Ma.nipur (1) each, while the largest decrease was in Maha.rashtra (43) followed by Tripura (13), West Bengal (3), Assam (2), Orissa (1) and A. & N. Islands (1). The unusual decrease in Maharashtra and Tripura was due to the fact that the institutions which had no educational content were dropped from the list in 1961-62. Moreover, in the case of Tripura, some of the arts and crafts centres under the Industry Department and some private managements were not taken into account. The increase in Gujarat, Uttar Pradesh and Punjab was due mainly to the reclassification of some of the vocational and technical schools. Andhra Pradesh, Nagaland and Pondicherry had the same number as in the previous year. There was only one such school in A. & N. Islands in 1960-61 which was closed during 1961-62. Of the total number of these schools. 485 ( 40 · 6 percent) were managed by government, 13 (1·1 percent) by local boards, 536 (44· 8 percent) by private aided bodies and 162 (13.· 5 percent) by private unaided bodies.
The number of pupils studying in these schools as well as in classes attached to other institutions increased from 75,694 (46,584 boys and 29,110 girls) in 1960-61 to 1,02,812 (72,622 boys and 30,190girls) in 1961-62. Thetotal direct expenditure on these schools also rose from Rs. 2,25,97,372 toRs. 2,63,24,010 during the year under report. Of this, 81· 1 percent was met by government, 0 · 8 percent by local bodies 6 · 6 percent by fees, 4 · 2 percent by endowments and 7 · 3 percent by other sources. The average annual cost par pupil was Rs. 290·6 as compared toRs. 303·4 in the previous year~ Th~ detailed statistics of these schools are given in table CVI.
Table CVI-Statistics of Technical, Industrial and Arts & Crafts Schools
State/Territory
1
Andhra Pradesh AsBIIJI\ • Bihar Gujarat Kerala . • Madhya Pradesh Madras. . Maharashtra . Mysore. Orissa . Punjab. Rajasthan . Uttar Pradesh West Bengal Delhi . Mauipur Nagaland Pondicherry Tripura
INDIA
No. of Institu-
tiona
2
29 30 39
144 92 63 75
267 32 40 84
9 101 158
8 19
1 1 4
1,1Dil
No. of l'upils
Boys Girls
3 4
1,556 662 1,523 350" 4,883 894
14,687 2,979 4,471 1,823 1,401 873 6,656 1,455
11,787 6,728 2,585 582
930 393 2,008 2,730 1,159 18 8,179 3,290 9,337 6,877 1,058 365
137 138 25 99
141 38
72,622 30,190
Average Expendi- Annual
ture Cost Total per
Pupil
5 6 7
Rs, R3.
2,218 8,88,690 416·/l 1,873 9,34,545 499·0 5,777 8,26,531 212·1
17,666 29,81,360 168·8 6,294 6,59,683 144·0 2,274 11,17,229 491·3 8,111 22,97,308 316·7
18,515 51,02,771 295·9 3,167 11,92,531 376·5 1,323 5,59,715 423·1 4,738 13,74,004 316·2 1,177 7,20,232 611·9
11,469 43,85,838 402·4 16,214 24,37,268 206·6 1,423 5,57,376 1112·8
275 1,21,747 442·7 25 32,637 1,305· 5 99 65,325 659·8
174 1,69,220 972·6
1,02,812 2,63,24,010 290·6
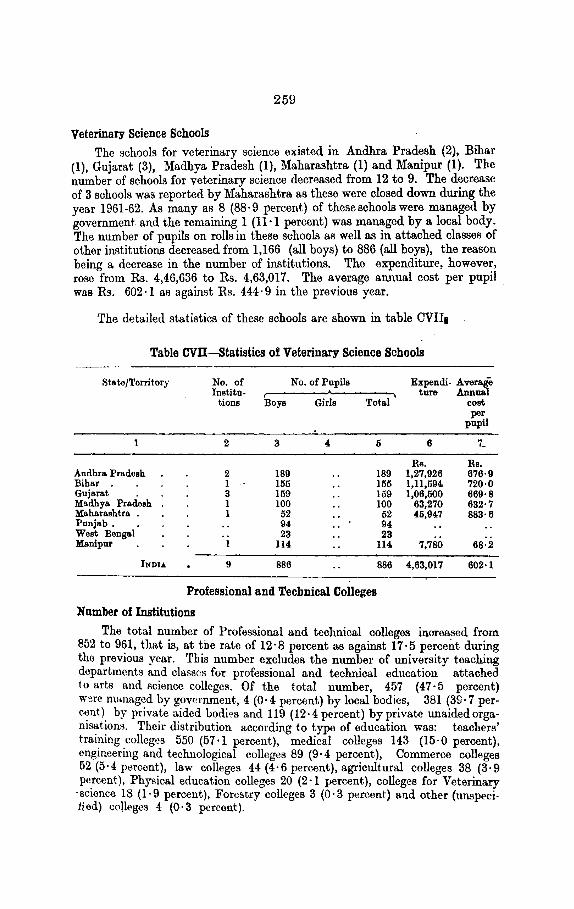
259
Veterinary Science Schools
The schools for veterinary science existed in Andhra Pradesh (2), Bihar (1), Gujarat (3), Madhya Pradesh (1), Maharashtra (1) and Manipur (1). The number of schools for veterinary science decreased from 12 to 9. The decrease of 3 schools was reported by Maharashtra as these were closed down during the year 1961-62. As many as 8 (88·9 percent) of theseschoolswere managed by government and the remaining 1 (11·1 percent) was managed by a local body. The number of pupils on rolls in these schools as well as in attached classes of other institutions decreased from 1,166 (all boys) to 886 (a.ll boys), the reason being a decrease in the number of institutions. The expenditure, however, rose from Rs. 4,46,636 to Rs. 4,63,017. The average annual cost per pupil was Rs. 602·1 as against Rs. 444·9 in the previous year.
The detailed statistics of these schools are shown in table CVIIt
Table cvn~tatistics of Veterinary Science Schools
State/Territory No. of No. of Pupils Expendi. Average Instito-
t.ione Boys Girls Total
2 3 4 5
Andhra Pradeoh 2 189 189 Bihar I 155 155 Gujarat 3 159 159 Madhya Pradeoh 1 100 100 Maharashtra . 1 52 52 Punjab . 94 94 Weet Bengal 23 23 Manipur 1 114 114.
INDIA 9 886 886
Professional and Technical Colleges
Number of Institutions
tore Annual cost per
pupil
6 7_
Rs. Re. 1,27,926 676·9 1,11,594. 720·0 1,06,500 669·8
63,270 632·7 45,947 883·6
7,780 68·2
4,63,017 602·1
The total number of Professional and technical colleges increased from 852 to 961, that is, at the rate of 12 · 8 percent as against 17 · 5 percent during the previous year. This number excludes the number of university teaching departments and classes for professional and technical education attached to arts and science colleges. Of the total number, 457 (47·5 percent) were m>ulagcd by government, 4 (0·4 percent) by local bodies, 381 {39·7 perc~nt). by private aided bodic>s and 119 (12·4percent) byprivate unaidedorgamsatwns. Their distribution according to type of education was: teachers' training colleges 550 {57 ·1 percent), medical colleges 143 (15·0 percent), engineering and technological colleges 89 {9 · 4 percent), Commerce colleges 52 (5·4 percent), law colleges 44 {4·6 percent), agricultural colleges 38 {3·9 pe.rcent), Physical education colleges 20 (2·1 percent), colleges for Veterinary
-scwnce 18 (l· 9 percent), Forestry colleges 3 (0· 3 pereent) and other {unspecified) colleges 4 (0·3 percent).

260
Table CVIU-Statistics of Professional and Technical Colleges by TYlle
Number of Number of Pupils*
Type Institutions r-' .......
Boys Girls
1960-61 1961-62 1960-61 196i-62 ,-------"-----, 1960 61 1961-62
1 2 3 4 5 6 7
Agriculture 36 38 15,699 18,743 149 186 Commerce 42 52 77,448 87,458 864 1,015 Engineering 69 78 42,830 48,828 333 381 Forestry 3 3 683 718
Law 38 44 26,333 27,415 805 805 Medicine 133 143 32,164 35,513 8,238 9,439 Physical Education 20 20 745 819 159 197 Teachers' Training . 478 550 31,606 35,112 15,202 17,449 Technology . ·12 11 4,634 5,161 41 50 Veterinary Science 18 18 5,498 5,591 47 47
Others . 3 4 1,344 1,337 286 322
Total 852 961 2,38,987 2,66,695 26,124 29,889
Expenditure Percentage of Expenditure
(1961-62) met from Type ---,
1960-61 1961-62 Govt. Local Endow- Other funds Boards Fees menta souroe1
funds
8 9 10 11 12 13 14
Re. Rs. Agriculture 1,30,44,613 1,41,65,890 82·0 11·6 1·9 4·5 Commerce 59,67,798 76,69,201 19·2 0·0 71·3 1·8 7·7 Engineering 4,00,69,569 4,76,66,710 68·7 24·7 2·6 4·0 Forestry 11,33,048 11,43,788 21·2 78·8 Law 26,70,701 28,75,337 4·6 87·0 0·4 8·0 Medicine 5,90,11,097 6,87,68,903 77·3 2·0 14·4 2·3 4·0 Physical Education 14,08,279 13,96,315 84·7 11·3 1·0 3·0 Teachers' Training . 2,15,14,328 2,57,64,967 78·1 0·0 13·3 4·2 4·4 Technology 63,42,778 88,82,733 91·7 0·0 2·7 1·2 4·4 Veterinary Science • 65,11,486 76,89,920 87·7 8·9 3·4 Others 3,87,169 6,33,410 84·7 7·8 7·5
Total 15,80,40,866 18,65,47,174 72·9 0·8 19·7 2·4 4·2
*Includes enrolment in University Teaching Departments and attached classes in Profes• sional and Technical subjects.

DISTRIBUTION OF PUPILS RECEIVING PROFESSIONAL EDUCATION
ISO-~- SCHOOL STANDARD STUDENTS
125 _______ __c_I:..:N_:_T:.:.H=::::...:.:Nc:.:D:..:S::__ __ _
100 -----------------
~0----
25----
SCIENCE
90--=COLLEGE STANDARD----sTuDENTs
7.5---IN THOUSANDS
t50 --
4-5 --~~
15
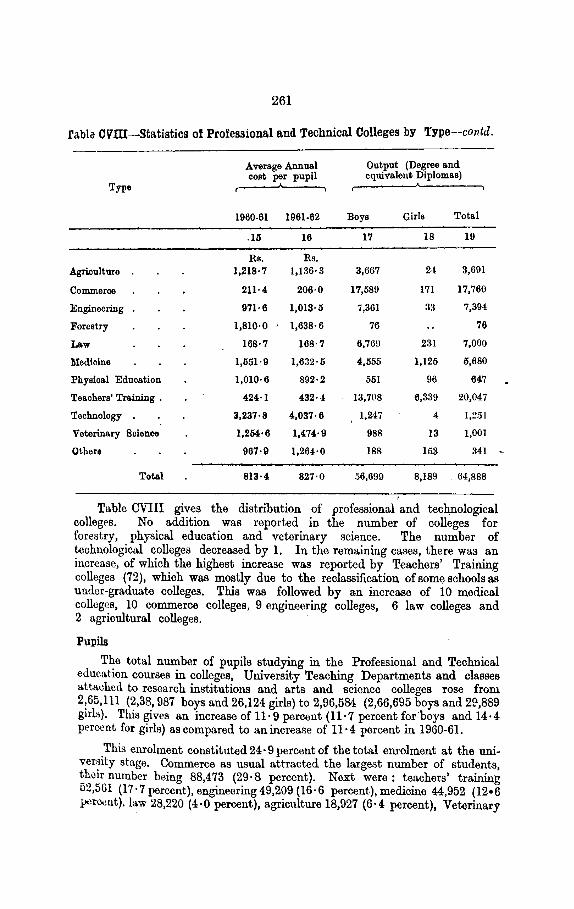
261
ra.bla CV'ill-Statistics of Professional and Technical Colleges by 'fype--contd.
Average Annual cost per pupil
Output (Degree and equivalent Diplomas)
Type
1960-61 1961-62 Boys Girls Total
.15 16 17 18 19
Rs. Rs. Agriculture 1,218·7 1,136· 3 3,667 24 3,691
Commerce 211·4 206·0 17,589 171 17,760
Engineering 971·6 1,013·5 7,361 33 7,394
Forestry 1,810·0 1,638·6 76 76
Law 168·7 168·7 6,769 231 7,000
Medicine 1,651·9 1,632·6 4,555 1,126 5,680
Physical Education 1,010· 6 892·2 561 96 647
Teachers' Training . 424·1 432·4 13,708 6,339 20,047
Technology 3,237·8 4,037·6 1,247 4 1,~;)1
Veterinary Science 1,264·6 1,474·9 988 13 1,001
Others 967·9 1,26~·0 188 153 341
Total 813·4 827·0 56,699 8,189 . 64,888
Table CVIII gives the distribution of professional and tech,nological collegPs. No addition was reported in the number of colleges for forestry, physical education and veterinary science. The number of technological colleges decreased by 1. In the remaining cases, there was an increase, of which the highest increase was reported by Teachers' Training colleges (72}, which was mostly due to the reclassification of some schools as under-graduate colleges. This was followed by an increase of 10 medical colleges, 10 commerce eolleges, 9 engineering colleges, 6 law colleges and 2 agricultural colleges.
Pupils
-
The total number of pupils studying in the Professional and Technical education courses in colleges, University Teaching Department<~ and classes atta<Jhed to research institutions and arts and science colleges rose from 2,65,111 (2,38, 987 boys and 26,124 girls) to 2,96,584 (2,66,695 boys and 2~,889 girlli). This gives an increase of 11· 9 percent (11·7 percent for boys and 14· 4 per~nt for girls) as compared to an increase of 11· 4 percent in 1960-61.
_This enrolment constituted 24· 9 percent of the total enrolment at the university stage. Commerce as usual attracted the largest number of students, th<Jir number being 88,473 (29·8 percent). Next were: teachers' training 52,561 (17 · 7 percent), engineering 49,209 (16· 6 percent), medicine 44,952 (12•6 poroeut). h\w 28,220 (4·0 percent), agriculture 18,927 (6·4 percent}, Veterinary

262
Science 5,638 (1· 9 percent), Technology 5,211 (1· 9 percent}, Physic~! education 1,016 (0·3 percent), Forestry 718 (0·2 percent) and other subjects 1,659 (0·6 percent.)
Expenditure
The total direct expenditure on professional and Technical colleges increased from Rs. 15,80,40,866 toRs. 18,65,47,174, that is, by 18· 0 p·.-rcent, as against an increase of 20 · 5 percent in the previous year. This constituterl 30 · 0 percent of the total direct expenditure on universities and colleges and 4·7 percent of the total direct expenditure on all types of institutions. This expenditure was distributed among the various sources of income as: government funds 72·9 percent, local bodies funds 0· 8 percent, fees 19·7 percent, endowments 2 · 4 percent and other sources 4 · 2 percent.
According to types of education, medical colleges accounted for the highest proportion (36 · 9 percent) of the total direct expenditure on professional and technical colleges followed by engineering colleges (25·5 percent), teachers' training college (13·8 percent), agriculture colleges (7·6 percent), technological colleges (4·8 percent), Commerce and Veterinary Science colleges (4·2 percent each), law colleges (1·5 percent), Physical education colleges t0·7 percent} Forestry colleges (0 · 6 percent) and other (unspecified) colleges (0 · 3 percent).
Columns (10) to (14) of table CVIII show the source-wise distribution of expenditure on each type of institutions. More than two thirds of the expenditure was financed by government in colleges for technology, veterinary science, Physical education, agriculture, teachers' training, medicine and engineering. Education in the remaining types of colleges, viz. law, forestry and commerce was largely financed by fees.
The average aunual cost per pupil in all types of Professional and technical colleges increased from Rs. 813· 4 toRs. 827 · 0. The highest cost per pupil was reported in colleges for technology (Rs. 4,037·6) and the lowest in law colleges (Rs. 168·7). In other types of colleges it ranged from Rs. 1,632·5 in medicine to Rs. 206 in Commerce, ·
Output During the year, 64,888 students (56,699 boys and 8,189 girls} were awarded
professional degrees and equivalent diplomas as against 60,224 (53,045 boys and 7,179 girls) during the previous year. The degrees were awarded as follow~: Teachers' training (20,047) followed by Commerce (17,760), law (7,000), engineering (7,394) medicine. (5,680), agriculture (3,691}, Tech. (1,251}, Veteri_nary science (1,001) Physical education (647), forestry 76, and others (unspecified) 341,
The combined statistics of all the professional and technical colleges according to States are given in Table CIX.
A brief account of each type of professional and technical education, except teachers' training which has already been discussed elaborately in Chapter VII, is given below :

263
Agriculture Colleges
The total number of agricultural colleges increased, during the year from 36 to 38. B~eidcs these colleges, facilities for teaching of agriculture also existed in the «-.aching departments of some of the universities and in classes attached to some of the arts and science colleges. This increase was due to the opening of 2 colleges in Jammu and Kashmir and 1 college in Madhya Pradesh while 1 existing college in West Bengal was included under university t~aching departments. No agricultural college existed in any of the Union Territories, but facilities for teaching agriculture existed in Delhi and Himachal Pradesh.
Of the total number of colleges, 28 (73· 7 percent) were managed by government, 7 (18· 4 percent) by private unaided bodies and 3 (7 ·9 percent) by private aided bodies.
Tho total number of pupils in these colleges as well as in classes attached to other in~titutions rose from 15,848 (15,699 boys and 149 girL•) in 1960-61 to 18,927 (18,743 boys and 184 girls) in 1961-62, that is, at the rate of 19·4 percent. The enrolment increased in all the States except Kerala. The decrease in Kerala was insigniiicant.
The total direct expenditure on agricultural colleges increased from Rs. 1,06,90,277 to Rs. 1,41,65,890, that is, at the rate of 32· 5 percent, as compared to 22 · 0 percent in the previous year. The source-wise distribution of this expenditure was I government ftmds 82 · 0 percent, fees 11· 6 percent, endowments 1·9 percent and other sources 4·5 percent. The average annual cost of educating a pupil in these colle.gee was Rs.l,l36·3 as compared toRs. 1,218·7 in the previous year. As many as 3,006 candidates (2,991 boys and 15 girh>), qualified for the Bachelor's degree and 685 candidates (676 boys and 9 girls) for Master's degree in agriculture, the corresponding figures for the previous year being 2,649 (2,629 boys and 20 girls) and 569 (568 boys and 1 girl) respectively.
The Stetewise stati:;tics of these colleges are given in table CX •.
Commerce Colleges
The number of Commerce colleges increased during the year by 10 to 52. Of these, 41 (78·9 percent) were managed by private aided bodies, 6 (11·5 percent) by private unaided bodies. Besides, there were teaching departments. of Commerce in some of the universities and also commerce classes attached to some of the arts and science colleges. There were no Commerce colleges in Madras, Orissa and Uttar Pradesh among the States and in the Union Territories exce)!t Delhi. Facilities for commercG teachin", however existed in :MadrrLS, Oris:;a, U.P., Manipur and Tripura. Aniucrea; in the n~ber of Commeroo colleges was reported by Ass,>m, Gujarat and Maharashtra (1 each), Mysore (2) and West Bengal (5). ·w !l(l >):;!)Iuf.:uucatiou-21
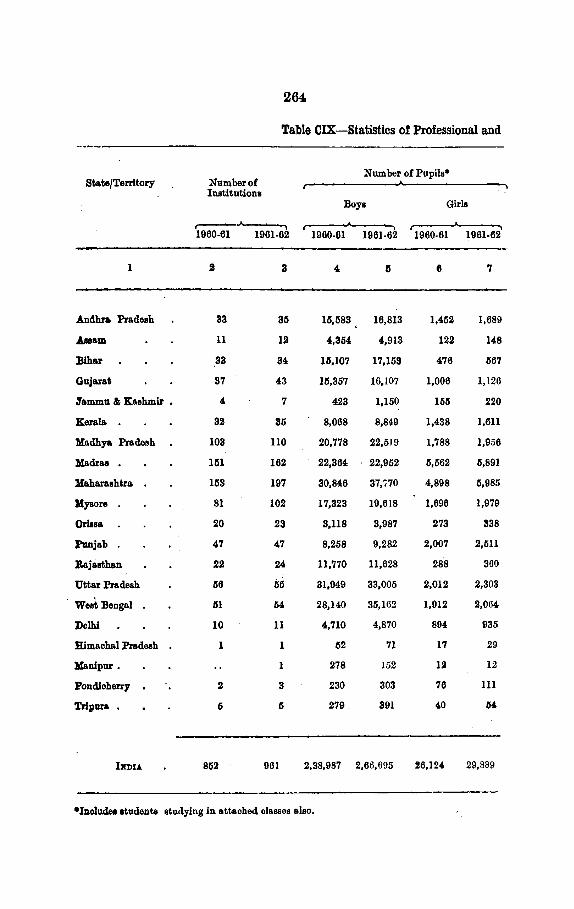
StatejTerrltory
I
Andhra Pradesh
Auam
Bihar
Gujarat
.Jammu & Kashmir •
Kerala
llladhya Pradesh
llladraa
lllaharaahtra
J!ysore
Orlua
Punjab
Rajasthan
Uttar Pradesh
Weat Bengal
Delhi
Himachal Pradeah
J!anipur.
Pondlcherry
Tripun •
Number of Institutions
264
Table CIX-Statistics of Professional and
Number of Pupils*
Boys Girls
,--·.A----. 1960-61 1961-62 1960-61 1961-62 1960-6I I96I-62
2 3 4 II 6 7
33 311 I5,583 I6,8I3 I,452 I,689
11 I2 4,354 4,9I3 122 I48
33 34 111,107 17,I53 476 IS67
37 43 15,357 I6,107 I,006 I,I26
4 7 423 I,150 I 55 220
32 35 8,068 8,849 1,438 1,611
103 110 20,778 22,519 1,788 1,956
151 162 22,364 22,952 5,562 5,89I
153 I97 30,846 37,770 4,898 5,985
81 102 17,323 19,618 1,696 I,979
20 23 3,118 3,987 273 338
47 4.7 8,258 9,282 2,007 2,511
22 24 11,770 11,628 288 360
56 55 31,949 33,005 2,012 2,303
Ill 54 28,140 35,162 1,9I2 2,064.
10 11 4,710 4,870 894 935
1 52 71 I7 29
278 152 Ill I2
2 3 230 303 76 ll1
5 IS 279' 391 40 04.
852 961 2,38,987 2,66,605 26,I24 29,889
•Includea atudente studying in attached classes also.

265
Technical Colleges by States
Expenditure l'eroentage of Expenditure (1961-62) met from
State/Territory
1960-61 1961-62 Govem- Local Fees Endow- Other ment Board menta Source• fun do fun do
8 9 10 11 12 13 14.
Rs. Ra.
1,02,35,427 1,08,39,757 68·8 0·0 19·9 1·2 10·1 Andhra J>radesh
32,21,944. 34,12,055 88·7 8·0 0·3 3·0 Assam
80,75,701 96,69,627 71·2 0·0 23·6 4·0 1·2 Bihar
85,88,632 94,90,221 66·3 36·2 0·2 7·3 Gujarat
7,58,577 17,94,444 94·6 5·4 Jammu & Kaohmir
44,82,240 IS6,49,918 62·6 35·5 0·1 1·8 Kerals
1,33,17,983 1,69,36,190 87-11 0·0 10·4 0·2 l·6 Madhya Fr'adeoh
1,54,89,912 1,84,76,266 72·4· 16·7 9·9 1·0 Madras
2,45,64,108 2,77,05,007 62·9 5·0 26·3 0·4 l!-4 Maharashtra
89,77,394 1,26,29,748 62·2 32·8 11·0 Mysore
25,59,390 29,55,330 88·6 0·0 10·7 0·0 0·7 Orissa
94,80,537 1,02,48,424 69·9 0·2 23·9 10·6 6·4 l'unjab
59,02,325 73,60,354 75·4 16·8 8·2 1•6 Rajasthan ·
89,44,404. 95,67,148 69·8 0·0 19·6 3·2 7·4 Uttar l'rad~oh
1,96,o6,720 2,24,01,690 81·4 0·0 13·3 0·0 6·3 West Bengal
1,26,90,169 1,57,60,742 87·9 0·0 7·4 O·G 4·1 Delhi
97,088 1,32,193 100·0 !Uxnaohall'radesh
5,074 97·2 2·8 ;Man\pur
8,32,874 12,70,236 05·8 4·7 l'ondioherry
1,6M9-lo 2,53,760 95·7 4·3 Tripura
15,80,40,866 18,65,47,174 0·8 19·7 4·2 bma
~{Ill( •)5-nt·•f duocation-2la

266
Table CX-Statistics of
Number Number of Pupila* E:rpendi. AYerage of ture annna.I
StatejTerritory Inetitutio111 :Boys Girls Total coat
::;n
1 3 6 6 7
Rs. Rs.
Andhra Pradesh 2 976 31 1,006 9,63,735 1,441·6
Assam 1 340 340 6,11,102 1,587·3
Jllha.r 3 817 1 818 11,14,094 1,862·0
Gnja.rat 2 1,137 19 1,166 7,47,366 825·8
Ja.mmn & IUshmir 2 137 137 8,19,321 2,330·8
Kera.la • 1 258 29 287 4,55,393 2,098· 6
Madhya Pradesh 6 1,475 1,"5 20,24,894 1,375·6
Ma.drae. 1 9M 22 1,006 5,55,858 721·9
Ma.harashtra • 5 2,412 9 2,421 21,89,872 1,070·1
My110re • 2 864 864 9,69,631 1,277·5
OriNa • 1 609 609 5,02,242 824·7
l'lm:l•b. 1 1,816 1,316 8,72,910 1,116·2
Bajalthan 2 1,076 2 1,078 11,90,587 1,352·9
Uttar Pradesh 9 5,615 61 5,676 17,44,405 839·11
West :Bengal 3U 1 325
Delhi . 383 9 392
Himachal Pradesh • 21 21
Ilmu. 38 18,743 184 18,927 1,41,65,890 1,136·3
•Inclndes enrolment in attached olaesellal•o.
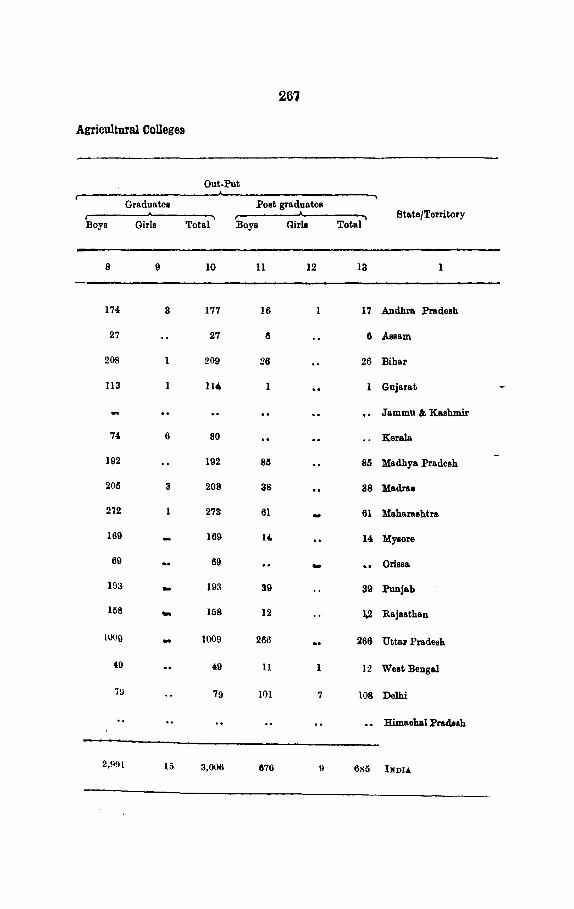
261
Agricultural Colleges
Out-Put
Graduates Post graduates State/Territory
Boys Girls Total Boys Girls Total
8 9 10 11 12 13 1
174 3 177 16 17 Andhra :Pradesh
27 27 6 6 Assam
208 209 26 26 Bihar
113 114 1 1 Gujarat
Jammu & Kashmir
74 6 80 Kerala
192 192 811 811 Madhya :Pradesh
205 3 208 38 38 Madra a
272 273 61 61 Maharaahtra
169 169 14. 14 Mysore
69 69 - Orise&
193 - 193 39 39 Punjab
168 ... 158 12 1,2 Rajasthan
1009 1009 266 266 Uttar Pradesh
40 49 11 1 12 Weat Bengal
7U 79 101 7 108 Delhi
Himachal Prad11h
2,\\9! 15 3,006 876 9 685 l!IDU

288
The total enrolment in t.hese colleges in~>lnding that in the University Teaching Departments and clas.~es attached to other institutions rose from 78,312 (77,448 boys and 864 girls) to 88,473 (87,458 boys and 1,015 girls). This gives an increase of 13 · 0 pernent (12 · 9 percent for boys and 17 · 5 percent for girls). The increase was shared by all the States and Union Territori6s except Gujarat, Jammu and Ka.Shmir, Mysore, Oris.<>a, Uttar Pradesh, Delhi and Manipur.
The total direct expenditure on commerce colleges· amounted to Rs. 76,69,201 as against Rs.:59,57,798 in the previous year. The rate of increase comes to 28·7 percent as against 28·.0 percent in 1960-61. Of the total direct expenditure on commerce colleges, Fees attracted the major position i.e. 71· 3 percent while the shares of government, other sources and endowments were 19·2, 7·7 and 1·8 percent respective!). The share of the local bodies wat< practically nil. The average annual cost per pupil in these colleges was Rs. 206•0 as comp9.red toRs. 211·4 in the previous year. During 1961-62, as many as 15,529 students (15,368 boys and 161 girls) were awarded Bachelor degree and 2,231 students (~,221 boys and 10 girls) qualified for the award of Master's degree in commerce.· ·
The detailed statistics of co~erce c~lleges in. ~arioUB States and Union Territories are given in table CXI.
Engineering (including Architecture) Collegell
During the year, there were· 78 engineering colleges (including 5 forarchitecture' in the country as agains~. 69 (including 3 for architecture) during the previous year. This gives an overall increase of 13·0 percent. Of the tot11l 37 (47·4 percent) were managed. by private aided bodies, 37 (47·4 percent) by government. and 4 (5·2 percent) by private unaided bodies. Besides, facilities for engineering.educatillll were also provided in the teaching departments of Aligarh, Annamalai, Banaras, Madras, Roorkee and Utkal universities, the Indian Institute of Science, Bangalore and some of the technological colleges. The engineering colleges existed in all the States and in Delhi among the Union Territories. 'l'he highest increase was reportea by Korala. (2) and next to follow were Gujarat, Jammu and Kashmir, l'lfaharashtra, Orissa, Punjab, WeJt Bengal and Delhi (Teach). "
The number of pupils in all the engineering colleges and classes attached to 1miversities and ot.her institutions rose from 43,163 (42,830 boys and 333 girls) to 49,209 (48,828 boys and 381 girls), that is at the rated 14·0 percent as compared to. an incr~~e of 19 ·.2 percel!-~ in the previous year. An.increase in enrolment was reported by all the States while Delhi showed a dt>crea.se.
The total direct expendit.ure on engineering (inclUding architecture) colleges increased from Rs. 4,00,59,569 in 1960-61 toRs. 4,76,56,710 in 1961-62, This giYes an increase of 19·0 percent as against 21•1 percent reported during the I'revious year, Its distribution according to various sources of income
269
was : govrrnment funcls 68· 7 percent, fees 24· 7 percent, endowments 2 · 6 percent and other soun:e< 4·0 JWn:cnt. The average mmua.l <"0:o>t per pupil mRe from Rs. 971·6 ton~. 1,013·5. The out-put. of gra.duntes and post-graduates during the year was 7,207 (7,174 boy;; and 33 g:rl') ~n<l 187 (,•,11 boys) resprctively as compared to 6,715 (6,700 boys and 15 girls) and 356 (all boys) during the previouR yrar.
Tl1c State-wise details of engineering colleges are given in table CXII.
Forestry Colleges
There were only 3 colleges for forestry in the country, 2 in Uttar Pradesh and 1 in 1\Iadras- 1he same as in the previous year. All the three colleges were managed by the government. During the year, 718 students (all boys) were on rolls of these colkges as 8.gainst 683 (all boys) in the previous year.' The total direct expenditure incurn~d on these r.olleges was Rs. 11,43,788 as against R;·. ll,33,048 in the previous year. Thif gives an increase of 0·9 percent. The major part of the expenditure (78·8 percent) WfiM met from fei'B while the remaining (21·2 {Jercent) came from govemment funds. The averagtr 1mnual co:,t oiedueal.ing a pupil in these collf•gts was Rs. 1,638·6 as against R~. 1,R10·0 dur!ng lhe previous Y€81'. During the currer,t year 193 students (all boys) qualified for the :~ward of Rangers certificate as against 61 (all boy<~) in the previous year. 76 boys qnalifiPd for SupervisoriForeRt Officer. Table CXIII gives the nece~sary d<'ta.il~.
Law Colleges
The number of law colleges increased ouriLg the year by 6 to 41. This gives an increase of 15·8 percent. Of the total, 30 colleges (68·2 percent) were managed by private unajded agencieH, 8 (18 · 2 percent) by private aided bodies anrl the remaiuing 6 (13·6 pereent) by the government. There were no law colleges in Jammu and Kashmir and Rapsthan and the Union Territorie~ ah liough facilitie~ for teaehing law exioteJ iu n~jasthan and Delhi. Besides the colleges, tcac!JiiJg of law wa~ proviclcd iJJ the teaching departments of Aligarh, AllaLabnd, Bamua3, Bombay, Delhi, Gon.k.hpur, Lneknow, Madras, Raja~tban, Saugar and Utkal universil.ies and also in bnme arts and Science rolleges.
The enrolment in these 0olleges including that in the utti.ver.,ity teaching departments and clas"es attad10d to other iillititutioH.s rose from 27,141 (26,336 boys and 805 girls) in 19u0-61 to 28,220 (27,415 boys and 805 gi:ds) in 1961-62. The cmolment inereabed in all tbe State,, except Andhra PndeFh, As.-;a~11, Kei'>da, Madras, Punjab, West Bengal and Delhi.
TLe total U!l'ect expellu;lllre unlaw colleges increa~cd from Rs. 26,70,701 to R;. 28.75,337, that. is al tlte rate of 7 ·6 percent. Fees contributed the li01.'s ;lumJ o! !)7 ·0 percent while the Hhares of govenillw.nt., endowments and other sources were 4 · 6, 0 · 4 anrl8 ·0 percent respectively. ThMwerageannual cost pt•r pupil1emained the same a~ in the previou> year i.e., Rs. 168·7. Durin 1 the

270
Table CXI-Statistics ol
Number Number of Pupils• Expendi- Average BtatejTerritory of ture annual
Instl tutions Boys Girls Total ooet per pupil
1 2 3 I) 6 7
Rs. Re .
.Andhra l'radesh 1 3,930 29 3,959 52,452 143·3
.Assam 1 2,1511 1 2,156 47,293 172·0
Bihar 2 6,336 3 6,339 4,03,621 134•6
Gujarat 9 6,585 98 6,683 12,211,862 223•2
Jammu & ~shmir 1 141 141 41,104 291-15
Kerala 2,299 65 2,354 40,931 130·4
Madhya l'radesh 3 6,367 14 6,381 3,09,902 180•9
lladras. .. 2,636 4. 2,639
Ha.harashtra • 16 16,768 617 17,386 28,52,4.88 244·7
llyaore • 6 4,426 69 4,495 6,67,961 197·0
Orieaa 472 472
Punjab. 2 64.8 648 1,52,915 377-ll
Rajasthan 3 6,846 4. 6,849 3,77,380 327·S
Uttar l'radesb 8,089 6 8,094
West Bengal • 7 19,216 108 19,324 12,22,462 138•6
Delhi 1 1,312 6 1,317 3,81,830 4.90•8
ltanipur 93 2 96
Tripura 141 1 142
INDIA. 52 87,458 1,01!5 88,473 76,69,201 206·0
• I noludes enrolment in attached olaBBea also.

271
Commerce Colleges
Out-Put
Graduatee Post-graduates State [Territory
lloya Girla Total Boys Glrla Total
8 9 10 11 12 13 1
1,072 a 1,075 38 2 40 Andhra Pradesh
190 1 191 32 32 Assam
1,006 1,008 113 113 Bihar
892 25 917 73 1 74. Gujarat
28 28 Jammu & Kaahmlr
505 17 522 Kerala
1,101 1,102 285 l 286 Madhya Pradesh
615 615 43 43 Madrae
1,836 83 1,919 210 4 214 Maharaehtra
858 0 864 88 2 40 Myaore
160 160 Oriua
70 70 Punjab
MS 643 2U 212 Rajaetha~
2,013 2,014 721 721 Uttar Pradelh
4,191 24 4,156 430 430 West Bengal
818 818 26 26 Delhi
13 IS Man! pur
29 29 Tripura
15,368 161 15,02Q 2,221 10 2,231 llmU

,l::72
• Table em-statistics of .
Number . Number of Pupils* Expend!ture Average StatejTerritory . or· .. · ·· annual
lnstitu- Boys·· ·Girls Total oost per tioll.B ·pupil
1 . 2 a· --4··-··- 5 - .. 6 7
Rs~ Rs.
And bra Pradesh 5 4,051 10 4,061 22,96,928 783·1 'j ..
Alaam 2 549 549 6,86,073 1,249· 7
Bihar 7 4,673 4 4,677 48,67,759 1,068·7
Gujarat 5 3,731 . 32 3,763 29,99,736 692·5
Jammu & Kashmir 1· 362 362 4,61,283 1,246· 6
Kerala 6 2,669 96 2,76.3 14,73,668 533·0
llladhya Pradesh 6 3,558. 14 3,572 26,06,043 732·4
Madras '•· .• 8 5,~28 ·7 5,335 59,12.505 1,269·6
lllaharashtra • 10 3,741 136 S,877 48,58,438 731·5
lllysore 9 5,666 "13 5,579 28,44,260 1514·1
OriiiM 2 668 668 4,12,629 617·7
Punjab 4 1,966 5 1,971 22,79,174 1,228·7
Rajasthan 2 1,~64 1,664 20,90,683 1,301·8
Uttar Pradesh 2 3,514 19 3,533 7,76,419 1,~9·4.
West Bengal , 6 5,877 35 5,9.12 1,01,88,272 2,354·0
Delhi 3 911 10 921 29,12,842 1,3.57·3
INDIA 78 48,828 381 49,209 4, 76,56, 710 1,013·6
•Includes enrolment in attached olaases also.

273
Engineering Colleges
Out-Put
Graduates Post-gradua.tes State/Territory
Boys Girls Tota.l Boy a Girla Tota.l
8 9 10 11 12 13 1
491 401 Andhra Pradesh
63 63 Asaa.m
757 757 Bihar
788 1 739 Gujarat
Jammu & Kashmir
139 20 350 26 26 Kera.la.
213 213 Madhya. Pradesh
931 931 Madraa
670 5 675 32 32 Maharaahtra
805 805 6 6 Mysore
104 104 Oriaaa.
421 421' 1~ 12 Punjab
242 242 8 8 Rajasthan
610 5 615 81 81 Uttar Prs.deah
705 2 707 22 22 WPot Bengal
85 85 Delhi
7,174 33 7,207 187 187 llmll

Table CXID-Statistics of Forestry Colleges
Number Number of Pupils Average . Out-Pat State/ of annual
Territory Institu. Boys Girls Total Expenditure cost per Supervi•or/ tiona. pupil Rangers Forest Officer
Rs. Rs. Boys Girls Total Boys Girls Total
1 2 3 5 6 7 8 9 10 11 12 13
Madras 1 202 202 3,54,190 1,753·4 98 98
Uttar l'rsdesh 2 516 516 7,89,598 1,591·9 95 95 76 76
INDIA 3 718 718 11,43, 788 1,638· 6 193 193 76 76

year 6,912 students (6,685 boys and 227 gir~g) qualified for the award of Bachelor's degre~ and 88 stndents (84 boys and 4 girls) for Ma.'lter's degree in law as compared to 7,083 (6,903 boys and 180 girls) and 79 (74: boys and 5 girls) respectively in the previous year. Table CXIV gives the State-wise detailed ~tatistics of Jaw colleges in the country.
Medical Colleges The number of meuical colleges during the year was 143at~ against 133 in
the previous year. This gives an increase of 7 · 5 per cent. An increase was reportell among States by Bihar, Gujarat, Madhya Pradesh, Madras and Rajasthan (1 each), Andhra Pradesh, Maharasbtra and Mysore, (2 each) wl1ile Uttar Pracll'sh >.howed a derrease of 1 and there was no change in Assam, Jammu aud Kashmir, Kerala, Orissa, Punjab and West Bengal. Among the Union Territories, Delhi and Pondieheuy had medical colleges. The medical colleges included collAges for allopathy, ayurveda, dentistry, medicine, nursing public health, Pharmacy, Unani Tibbia, Burgery, etc. Besides these <'olleges0 facilities for teaching med.ical science were also available in some of the research institutions and teaching departments of Aligarh, Banaras, Lucknow and l'atna universities and for the teaching of Pharmacy in the teaching departments of Bombay, NagpPr, Punjab, Patna and Saugar univerHitics. Gf the total number of colleges 79 (55·2 percent) were managed by the Go\'Cl'llment, 51 (35·7 percent) by private aided bodies, 9 (6·3 percent) by private unaided agencif)s and 4 (2·8 per cent) hy local bodies.
The total enrolment in medicn.l collegc•s including that in university teaching departments, research inst itlttions and classes attached to other inRtitutions rose from 40,402 pupils (32,164 boys and 8,238 girls) to 44,952 ]•Upib (35,513 boys ancl 9,439 girls), which gi>es an increase of 11·3 per cent. An increa.,e in enrolment was reported everywhere except 1Vest Bengal where the decrease wa . ., insignificant.
The total direct expenditure incurred on th!'se colleges (excluding university teaching departments :tnd research institutions) was Rs. 6,87,68,9()~ wl1ich shows an imTrase of 16·5 pere<'nt over the previous yea.rs' expenditure of TI.s. 5,90,11,497. Government contributed 77 · 3 percent. oft.he tot~>. I direct exjlfmditme on mcuical colleges while local bodies, fees, endowments and other sources contributed 2·0, 14·4, 2·3 and 4·0 percent respectively. The average annual cost per pupil in medical colleges rose from Rs. 1,551·9 to Rs. 1,632·5. A total of 4,982 students (3,692 boyR and 1,018 girls) graduated in medicine, while 698 students l591 boys and 107 girls) qualified for the award of post.p:rarlnate medical del!reeR. The corr!'.sponding figure~ for the previous year ":nre 4,725 (3,793 boys and 932 girls) and 544 ('!94 boys and 50 girls) respectively. The State"wise detailed stat.i~tics of medica.! colleges are given in table CXV. , .
Colleges for Physical Education . · The number of I' hysical <'dnca1 iou ('ulleges remained stationary at 20 as 111 the previous year. All tl e St...t es !'}..Cept As.«am, Jammu l;.nd Kaslunir and Orissa. had Physi,..al education f'Ol!!'ge~ whilP none of the Union Territories had. any. 12 of these colleges wen• managed by the Government and the other 8 by private aided bodies.

Table CXIV-Statistics of Law Colleges
Number Number of Pupils* Average Out-Put State/ of auuual Territory Institu- Boys Girls Total Expenditure cost per Graduate Post-graduate
tiona pupil Rll. Rs. Boys Girls Total Boys Girls Total
1 2 3 4 5 6 7 8 9 10 11 12 13
Andhra Pradesh 2 1,611 28 1,639 1,58,911 111·0 «0 13 453 17 AsR&m 1 496 5 501 63,739 127·2 49 49 Bihar . 4 1,913 4 1,917 2,49,795 138·3 418 418 3 3 Gujarat 7 1,779 34 1,813 4,08,981 166·2 202 e 208 4 4 Kerala 2 373 36 409 1,34,138 328·0 142 9 151 3 3 :Ha.dhya Pradesh 9 2,147 25 2,172 99,580 121·9 440 8 448 Hadras 1 1,139 32 1,171 1,70,848 145·9 445 13 458 1 1 Maharsahtra 8 4,664 270 4,934 9,90,762 212•7 1,188 103 1,291 32 2 34 Hysore 6 1,427 46 1,473 2,50,999 170•4 356 16 371 9 9 ~-Q OriBBa 1 363 5 368 38,527 104•7 80 80 ....s Punjab 1 858 15 ~73 1,62,876 186·6 889 7 396 CD Rajasthan 737 18 755 181 3 184 1 1 Uttar Pradesh 1 5,757 68 6,825 82,948 186·0 1,672 27 1,699 14 2 16 West Bengal 1 8,485 195 8,680 68,234 100·4 408 9 417 Delhi. • 666 24 690 276 14 289
bmu. 44 27,415 805 28,220 28,76,887 168•7 6,685 2!7 8,912 84, 4 88
-xncludea enrolment In attaohed ola- also.

Table CXV--Statistics o! Medical Colleges
Number Number of Pupils* Average Out-Put State/ of annual
Territory Tnstitu- Boys Girls Total El<penditure cost per Graduate Post-graduate tions pupil
Rs. Rs. Boys Girls Total Boys Girls Total
2 3 4 5 6 7 8 9 10 II 12 13
Andbra Pradesh 14 4,Ill 1,244 5,355 58,55,845 1,085·0 316 97 413 60 23 83 A.'-18S.tn 3 825 76 !101 14,35,490 1,593·2 101 5 106 Bihar 10 2,189 397 2,586 21,80,876 953·2 232 43 275 102 7 109 Gujarn.t lO 2,ll9 540 2,659 33,67,327 1,346· 9 911 21 Ill 12 12 Jammu & Ka•hmir I 313 101 414 6,32,530 1,527·9 Kornl& 3 1,375 475 1,850 22,93,586 1,374·2 111 48 159 Madhya Pradesh . 13 2,260 514 2,774 44,47,543 1,672· 6 27H 65 344 26 6 3:l M"<ir"" 7 3,466 1,098 4,564 56,42,847 1,261· 3 34!i 143 488 37 14 51 Maharashtra 17 3,981 . 1,545 5,526 71,67,622 1,324·1 768 252 '1,020 liS 21 139 Mysore 7 2,791 551 3,342 41,62,540 1,245·5 276 34 310 ~
Orissa 3 655 232 887 12,30,095 1,386· 8 26 13 39 ..;J
Punjab 10 1,964 482 2,446 43,52,276 1,787·4 254 62 316 19 •4 23 ..;J
Rajasthan 10 1,461 222 1,683 23,59,433 1,436·9 87 ll 98 Utt.ar Pratlesh 14 3,262 506 3,768 24,60,809 1,087 '9 561 56 617 122 12 t34 West Bengal 14 3,423 702 4,125 78,60,429 2,062·0 45:) 84 539 77 5 82 DeJh.i . 6 I,ll7 696 1,813 1,20,97,257 6,830·7 53 81 1<;4 IS 15 33 Pondicherry 1 201 58 259 12,22,398 4,719·7 10 3 13
lNou 143 35,513 9,439 44,952 6,87,68,903 1,632·5 3,964 1,018 4,982 591 107 698
.*Includes emolment in attached classes also.

Table CXVI-Btatistias of Physical Education Colleges
Number Number of l'apile* Average State/Territory of annual Ont-l'at
Inatitu- :uo,. Girls Totel Expenditure cost per tion.l pupil Bo111 Girls To tel
Rs. Rs.
Andhm Pradesh 1 28 4 32 49,075 711•2 28 ' 32 Bihar 1 89 89 61,341 438•2 83 83 Gnjarat 1 14 1 15 24,911 1,660•7 Keral& 2 104 80 134 65,301 354•9 7 12 10 )tadhya Pradesh 2 194 10 204 5,7'7,030 11,828•6 40 40 Hadraa . 2 42 0 51 1,01,327 226•2 38 38 Haharub~ 4 62 10 '72 1,45,385 2,019•2 106 19 125 M:ysore 1 36 11 47 tH,333 1,943•3 l'onjab 1 '71 l9 90 58,639 651•5 53 13 fl6 Rajasthan 1 26 7 33 52,590 431•1 20 29 Uttar Pradesh 8 118 27 145 1,24,924 1,041•0 147 as 180
to West Bengal • 1 ll!i 19 64 44,459 823·3 20 16 35 ~
IJmq. 20 8111 19'7 l 10J6 13,91!,315 892·2 551 96 647 00
•Inolu~ enrolment in attaob.ed ol&aa..

279
The number of pupils in these C( lieges as well as classes attached to other institutions rose from 904 (745 boys and 159 girls) to 1,016 (819 boy3 and 197 girls) or by 12·4 percent. The enrolment increased in all the States except Gujarat, Madras, 1\Iaharashtra and Uttar Pradesh. The decrease in these States was small except in Madras.
The total d ir.~ct expenditure on these colleges decreased from Rs. 14,08,279 to Rs. 13,96,315 or by 0 ·9 percent. The decrease was due to a decrease in expenditure in Madras, Mysore and Uttar Pradesh. Its distribution according to various sources of incvme was : Govern...'llent 84 · 7 percent, Fees 11· 3 percen!;, Endowments 1·0 percent and other sources 3 ·0 per~;en~. The ave~age aruma! co·>t per pupil was Re. 892·2 as compared tv Rs. 1,001·6 m the preVIous year. During the current snsRion 647 etudents (551 boys and 96 girls) qualified for the award of Bachelor's degree or equivalent diploma in Physical education.
The detailed statistics of these collllges in the various States are given in table C XVI.
Colleges for Technology
With the inclusion of Silpa Sadana, formerly a constituent college of the Visva-Bharai.i, Santiniketan, as a university teaching department, the number of colleges for technology in the country decreased from 12 to 11. These colleges existed in AssH.m, Maharashtra., Mysore, Punjab, Uttar Pradesh and West Bengal only. But facilities for technological education of the colleg~ standard were abo provided by some teaching departments of universities, rese.c1.reh institutions anJ classes attached to engineering colleges and polytechnic3 7 cf these technological colleges were managed by Government ancl 2 each by private aidel and unaided bodies.
The total enrolment in these collcg~>s as well a.s university teaching departments and classes attached to other institutions went up from 4,675 ( 4,634 boys anrl41 girb) to 5,211 students (fi,l61 boys and 50 girL~). This gives an increa~e of 11· 5 percent. The enrolment increased in all the States except _Madras and Punjub.
The total direct expenditure on colleges for technology increased from Rs. 63,42,778 toRs. 88,82,733 or by 40·0 percent. Its distribution according to v:uious sources of income was: Government funds 91· 7 percent, Fees 2 · 7 perc~nt endowments I· 2 percent and other sources4·4 percent. The share of local hoLlies funds was practically nil. The average annual cost per pupil in these colkgcs was Rs. 4,037 · 6 as against Rs. 3,237 · 8 during the pr.::vious year. The number of students who qualified for the award of Bachelor's degree was 936 (932 boys and 4. girl"). Further, 315 (all boys) qualified for ?.faster's de!!I'ees. Thc.prcvions y<'ar's figures were 7!2 (73'9 boys and 3 girls) and 187 (186 boYs and 1 girl) r<'spectivcly.
The detailed statistics of colleges for technology in the various States arc given in table CXVII. )I, B(l•)5 \':II ,f U.u-~2

Table CXVU-Statistics of Technological Colleges
-Number Number of Pupils* Average Out-Put State/ of annual
Territory Institu- Boys Girls Total Expenditure cost per Graduate Post graduate tiona pupil
Rs. Rs. Boys Girls . Total Boys Girls Total
1 2 3 4 5 6 7 8 9 10 11 12 13
Andhra Pradesh 398 398 54 54 61 61 Assam 1 34 29 63 90,882 1,442·6 Madhya Pra-desh : 51 51 ·- 18 18 Madras • • 465 465 82 82 Maharashtra, 2 1,323 8 1,331 62,24,359 6,736·3 196 3 19fl 6 6 Mysore 1 158 158 2,23,716 1,381·0 13 13 Punjab 1 143 143 1,51,329 1,058-2 28 28 Uttar Prade~h 2 1,309 2 1,311 12,40,801 2,579·6 38 . 38 18 18 West Bengal • 4 992 11 1,003 9,51,646 2,228·7 503 I 504 212 212 Delhi • • 288 288 18 18 1¢
00
INDIA 11 5,161 50 5,211 88,82,733 4,037· 6 932 4 936 315 315 0
*Includes enrolment in attached classes also.

281
College for Veterinary Science
During 1961-62, there were 18 c~lleges for Veterinary Srience, the same as in the previous year. These colleges existed in all the Stat:Ds except Gujarat and Jammu & Kashmir. Union Territories did not possess any veterinary science college. 17 of the colleges were managed by Government and 1 by a private aided body.
The total number of pupils in these colleges as well as in university teaching dBpartments and attacl1ed classes rose from 5,545 (5,498 boys and 47 girls) to 5,638 (5,591 boys and 47 girls), that is, by 1·7 per cent. The enrolment increased in all the States except Andhra Praclesh, Kerala, Madhya Pradesh, Punjab, Rajasthan and West Beng(!.l. The decrease in these States was, however, small.
The total direct expenditure on these colleges increased from Rs. 65,11,486 in 1960-61 toRs. 76,89,920 or by 18·1 percent during the year under review. Its distribution according to various sources of income was: Government funds 87 ·7 per cent, Fe£s 8· 9 per cent and other sources 3·4 percent. An increase in the expenditure was reported by all the States except Uttar Pradesh. The average _ annual cost of educating a. pupil in these colleges went up from Rs. 1,254 · 6 to Rs. 1,474·9. During the current session, 885 candida.t~s (873 boys and 12 girls) qualified for the award of Bachelor's degree and 116 candidates (115 boys and 1 girl) forth~ award of Master's degree in vcterinfl.ry sci~nce. The corresponding figures for the previous year were 813 (810 boys and 3 girls) and 104 (all boys)_ respectively.
The State-wiqe detailed statistics are shown in table CXVIII.
1\IjB(D)G!..'\IofEdu-22,,

Table CXVm-Statistics of Veterinary Science Colleges
,{umber Number of Pupils* Average Out-Put Stat<>/ of annual
Territorv Institu- Boys Girls Total Expenditure cost per Graduate Post-graduate tions pupil
Rs. Rs. Boys Girls Total Boys Girls Total
Andhra Pradesh 2 69S 3 701 6,30,4S9 1,102· 3 9S 1 99 Assam 1 319 319 2,50,400 7S5·0 3 3 Bihar . 2 562 562 4,54,102 80S·O 92 92 s 8 Kerala 1 ·337 17 354 2,91,097 976·8 66 4 70 Madhya Pradesh • 2 50S 3 511 9,15,912 . 1,792·4 106 2 10S Madras 1 666 7 673 10,44,505 1,552·0 94 4 9S 29 1 30 Maharashtra. 2 364 3 367 S,21,324 2,237· 9 95 1 96 25 25 Mysore 1 297 4 301 3,37,191 1,120·2 24 24 Otissa ·. 1 253 253 3,95,433 1,563·0 52 52 Pw1jab 1 316 316 2,80,0S2 6S3·1 72 72 10 10 Rajasthan 1 245 245 6,20,193 2,531·4 41 41 t-:) Uttar Pradesh 2 8G7 5 S62 8,34,0S3 1,64S·3 so so 43 43 00 West Bengal 169 5 174 S,15,109 4,137·6 50 50 t-:)
INDIA 1S 5,591 47 l5,63S 76,S9,920 1,474·9 873 12 SS5 115 1 llH
*Includes enrolment in attached classes also.

CHAPTER IX
SOCIAL EDUCATION
Social education aims at providing education for the betterment of life for the adult population. Within the limited resources available during the year, the programme of social education .had to rn: rest~icted a:nd c~nfined to a ~ew more important activit~:s su~h. as(~) conducti?-g J_nlot pro]e~ts m.~~e educa.t~on of industrial workers; (~~) tra.mmg of workers m library serVIce; (~n) developmg a lihrary Bervice in Delhi as a pilot project; (iv) cooperating with international agencies; ( v) assisting ~olunta.ry organisatio~ and ID:stitutions; and (vi) supporting certain ancillary serv1ces such as production of literature for neo htera.t<Js and for the new reading public.
Main Developments at the Centre
A brief account of the activities of the Central Government in the fielu of social education during the year under report is given below.
1. Workers' Institute, 'Indore-This institute was e~tablished as a pilot central scheme in Novemb<>r, 1963. Its main objectives are (i) to stimulate a. desire for knowledge among the working class; (ii) to arouse a sense of social and civic responsibility in them; (iii) to provide facilities for general education and for enlarging the range of their interest; and {iv) to provide wholesome recreation. The year under review being the first year of existence of this institute, it lrndcrtook a number of acti.vitics, namely, (i) it provided facilities to workt>rs to learn music, drawing and Hindi and English (ii) it organised handicraft. classes and literacy clu.sses for women workers (iii) cultural activities like vari•!ty entertainments, symposia and elocution competitions were organised; (iv) regular weekly discussion groups, based on the teaching of Ramayana, were held in the principal industrial residential localities; (v) after a.series of lectures on good housekeeping, three 'clean-house competitionR' were organised in which 52 fmnili~s, consisting of 312 members, took part; (vi) the membership of the institute library rose from 49 to about 45() and the average daily circulation of books rose fro.m111 to 739. .
2. Inst!:tute of Library Science, Delhi-Started in March, 1959, this institute conducted during the year under report the third one-year diploma course and the Master's degree course in library science. About 50 and 9 students were admitted to the diploma and Master's courses respectively. A special cour~e of six months' duration in advance librarianship was organised for four Iraqi librarians sent by UNESCO.
3. Delhi Public Library-The children's section and the social education section of the library arranged during the year a number of a.ctivitil'.s like group <liscussioP.s, film shows and musical concerts.
283

284
4. Mysore State Vidyapeeth Programnie-ln cooperation with the Ford Foundation of U.S.A., the Ministry of Education assisted the Mysore State Adult Education Council to establish one more Vidyapeeth in the State, bringing the total number to five. These V idyapeeth aim primarily to train village youth to rural leadership.
6. Assistance to Voluntary Organisations-During the year under review, 14 voluntary organisations and institutions in the ficld of social education were assisted to the tune of Rs. 1· 56 la.khs for the development of various activities relating to social education and libraries. . .
6. Literatute for Social Education-The eighth prize competition for books . for neo-literates was held during the year for which 323 entries in various Indian languages were received and 36 of these were awarded prizes of Rs. 500 each. The best five books of the seventh competition were awarded additional prizes of Rs. 500 each and steps were taken to expedite translation of these in various modern Indian languages. 1500 copies each of the 22 prize winning books of the fifth and sixth competitions were purchased for free distribution to community development blocks, social education centres and school libraries.
The second UNESCO prize competition for new-reading public for ihe award of prizes to Indian authors of best books on the subject in Hindi, Urdu, Bengali and Tamil published between January, 1959 and December, 1960 was held during the year under review. Out of the seventeen books received, seven books, four in Hindi and three in Tamil, were awarded prizes of 400 dollars each. 1500 copies each of three out of the six prize winning liooks of the first competition were purchased by the Ministry of Education for free distribution.
7. National Book Trust-The National Book Trust, established in 1957, brought out 20 books, during the year under review, in English, Hindi and various regional languages, bringing the total number of books brought out so far to 52. 34 books were under production, about 50 manuscripts were awaiting selection of presses and 187 manuscripts were under different stages of translation.
8. National .Institute of Audio-Visual Education-The institute continued its activities in research in-service training, production of non-projected visual aids, projected aids, aural aids and other things.
During the year one short-term course in audio-visual education was conducted for 33 trainees from different States/Central Ministries. A two-week training course in the operation and maintenance of projection equipment was organised for the trainees from rural institutes. A number of local short-term courses lasting from a. couple of days to a week were arranged.
In cooperation with UNESCO, a. regional workshop on the production of low-cost visual aids was organised at New Delhi, from 15th December, 1961 to 31st January, 1962. UNESCO fellowship-holders from South-East Asian eountries participated.
As part of the over-all programme to produoe standard non-proje~ted material for secondary schools in the country the institut,o produced variOus educational charts, posters, study kit, eto.

2t:5
One 16 mm. film of 800 ft. on the 'Operation of Diseased Lun~s' was prod11ced in colour. Five sponsored films were completed and about stxteen films were under produetion.
D11ring the y<)ar, 5!9 film> and 265 fil~-;trips w:ere added to the Central Film Library, and lO,OH film> and 210 film>tnps were Issued to 1;512 m1mber~.
The m'>bile cinem 1 unit screenoo 738 film> and 132 ll"lW m'3mb~rs were enrolled, bringing the total number of members to 1,588.
The following survey projects were planned and undertaken during tlte year 1
(i) use of audio-visual aids in Community Development Block~; (ii) teaching aids in science-a survey;
(iii) evaluation of effectiveness of film~ and other aids in teaching.
Thirtyaeven visits were conducted during the year undar report. The ,.; >ltors in~ludecl leadera in the educational field, UNESCO fellows, officers of the U~ESCO Secretariat, student groups from tefl.aher training colleg.}q and trainees from various Central Ministries.
Main Developments in the States
A brief account of the activities in the field of social education in the States and Union Territories is given below-
Andhra Pradesh
Sixtyfour schools in the State were paid grants at the rate of Rs. 250 each for purchase of radio sets. Five schools in Telangana area were paid Rs. 1,500 each and twentyfour schools in Andhra area were paid Rs. 1,000 each as grants towards tha purchase of 16 mm. film.
An amount of Rs. 6,500 was sanctioned towards the scheme for training teachers in the preparation of simple visual aids like charts, modeh, film-strips etc. Sixtyfive teachers wero trained under this scheme.
An amount of Rs. 5,009 was also sanctioned for the film library in-the State Dinr.tora.te. A 16 mm. film projector and accessories were purchased with this amount.
Assam
Mttch progress Wc\S mado in the State during the year in the fHd of social eLlucatiou. Som'l of the activities in this field are as follows :
49 Community Centres including 4 in VI-Schedule (Part A). areas were functio~ting dur_ing the year. E-:~ch of these centres organised five 'literacy ccntrus around 1t and the total amount spent was Rs. 51,600. Books for ueoliterates were supplied to the neo-litl}rates and also to the libraries where literacy een· tres were ?r_g:>nised, and the total amount spent for the purpose wa~ Rs. 9, 115. ~oak exlnbJtlOnS were arrang('d during th9 national days such ·as Social Education Day, Republic D.>y etc. 15 'sh:>dow:centres'\werc org:>ni~od'with ffi')!C O! l!!~S the samo programmes as those of tho community centres. '

266
Seven social education worhrs' training camps were held in which 225 workers participated. These camps were rtm under the direct supervision of th~ District Social Education Officers and these camps continued for 5 days. Some of the subjects of training were (i) how to establish community centres and libraries
· as effective agencies for carrying out the social education and development programmes in their respective areas, tii) how to organise different groups such as youth groups, occupational groups, women and children's groups, cultural groups etc. around the community centres anci libraries, (ii~) practical demonstrat.ion of group reading group di.~cussion, radio listening group, cultural and ·recreational groups, etc. and (iv) demonatration of work projects such as adult literacy, conf!trudion and repair of roads, repair of public hotts('s; sanitation programmes etc. The total expenditure incurred for thes"l training camps was Rs. 3,500.
A State level seminar on social education was organised where 103 officers participated.
Lump grants worth Rs. 1,00,737 were given to 1,110 libraries including 21 in VI Schedule (Part-A) Areas to enable to enrich their stock of books during the year. A monthly journal Deepalc was subscribed for 400 libraries selected from amongst the above libraries. These exclude the libraries aided by the Development Blocks.
A few non-student youth clubs were given a total grant of Rs. 5,000 for performance of various social educational activities.
One social education-cum-exhibition was held at Kherajkha.t in North Lakshipur Sub-division.· The duration of the rally was three days. Besides this, the district social education officers participated in 169 exhibitions and me~ organised by the Development Blocks.
Bihar The social education programma in the State includes sevan important
items, namely (i) adult literacy and education to children deprived of normal education in schools; (ii) individual and community cleanliness; (iii) health sanitation and medical aid; (iv) recreation and culture; (v) campaign against
·social evils; (vi) economic improvement; and (vii) publication and publicity. Vigorous and all round efforts were made to make the seven point comprehensive programme a complete success. Impetus was given to a large number of school'!, panchayats libraries and other organisations to take up this work for the general good of the society. Whole-time social education instructors were appointed under the scheme of 'relieving educated unemployed' launched by the Government of India to well-established high schools. The State AudioVisual Board purchased a number of radio sets and distributed these among Institutions engaged in social education work.
Gujarat Dnring the year under review, grants amounting to Rs. 50,000 were
sanctioned to the Regional Social Education Committee for Gujarat, to help it to pnblish literaturo for the neo-literates.

257
The scheme for training village school teachers for social education work in villages was continued. Th3 t<>achers w1der the scheme were trained by a team of special officers spl'cially appointed for the purpose. The ·courses were run in distrir:ts by camps of 30 days duration.
A number of courses, shihirs and camps were organised for the social educatiun worhrs in the Community Development Projf'cta and National ExtRusion Service Blocks.
Kerala
The State had four mobile Audio-Visual units which went round to the schools to exhibit edncr~tional films. Many of the secondary schools were equipped with radio receiv:ng sets and ptojectors.
An amount of Rs. 4,36,453 was disbursed to 2,304libraries as grants. Books and furniture worth Rs. 9,000 and Rs. 3,000 respectiv~ly w-,re purchased for each of the eight 'distributing libraries' existing in the State. Books and furniture worth R;. 35,0CO w-ere pnrchas•'d for the State Central Library. _
In addition to the existing 200 units, 100 more units were establ:shed at various places for medical inspection of the children in the first four standards in primary schools. All the L.P. schools within a radius of five miles from a unit were brought under ita capacity. The total expenditure for the scheme during the year was Rs. 36,569.
Madras
Two Adult Education Mobile Units continued to function during the year. Propaganda lectures and educational film shows were given for the benefit of rural folk. Songs and speeches on adult education and the midday meals scheme were tape-recorded and relayed to the audience.
The Government Training Schools for Adult School Teachers gave training to 160 teachers in six batches. The direot expenditurE: incurred on these institutions amounted to Rs. 16,574 in the year.
Under the scheme of youth Camps and Labour Service by colleae students the all-India Catholic University Federation of Loyola College, Mad~as and th~ Madras Students' Social Service League availed themselves of grants ~nctioned by the Government of India.
Maharashtra
The work of literacy which was formerly being undertaken by the Social Education Classes was entirely taken up under the scheme of Gram Shikshan Mohim (aiming at cent per cent literacy in the villages) throucrhout the State ex0ept Greater Bombay where the old practice was continued."

288
A list of books and pamphlet.s in Marathi, useful for neo-literates and for vill~ge librari~s 'l'tas pr~ted and supplied to all concern~d by the Regional Social Educatton Committee for Mah:uashtra. A number of periodicals were continued to be published and circulated.
Fo~r private .organisations were paid subsidies worth R~. 2,100 by the Educatton and Social Welfare Department for the work done by them in furtherance of the cause of social education.
The 13th Social Education Week 'l'tas celebrated in Bombay fr6m 16th December, 1961 and the total colle.::tion made W!ls Rs. 76,952. _ ·
My sore
A sum of Rs. 30,000 was provided for the purchase of library books to high schools. In addition to this, a sum of Rs. 18,000 was made for conducting short term courses in liorary service. Grants amount:ng toRs. 1,10,000 for regional and district libraries were sancti?ned with a view to enabling these libraries to purchase more books and eqmpment.
Under the scheme of expansion of audio-visual education in the State, a provision of one lakh of rupees was made under the plan for purchase of filmstrips and projectors.
Orissa The State Education lJepartment produced five books for neo-literates
and four for illiterates for distribution among the adult education centres. Grant-in-aid was paid to the extent of Rs. 1,35,000 to 3, 783 village libraries. An amount of Rs. 4,996 was spent for integrated library services at Angul. Two mobile libraries situated at Itamati in Purl District and Khunta in Mayurbhanja District issued library books to villagers on loan basis and the expenditure .incurred on this account was Rs. 4,568.
The Children's Literature Committee constituted by Government in 1957-58 awarded eight prizes amounting to Rs. 1,500 to authors of prize-winning books in the 5th prize competition on children's literature sponsored by th.; Committee. AsumofRs. 7,800wasalsoapentforpurchaseof books on children's literature for distribution to -public libraries and also for the Committee's library. An amount of Rs. 1,350 was given to some authors as subsidy for publishing their manuscripts.
The Community Development Blocks and compact areas organised a number of social education dramas, playlets, filmshows, etc. Three A.V. aidsposters were printed in sufficient numbers for distribution in :the primary B<ihools free of cost. A filmstrip on 'evils of intoxication and gambling' was produced by the Education Department for free distribution to social education centres. Two solo songs on 'primary education as against child labour' were recorded and given for distribution among the· social education centres.
Punjab In order to intensify the programme of eradicating illiteracy, the Education
Department chalked out a programme for starting a package programme of

289
adult literacy in selected villages by appoll:tt~ng part-tin:e teachers, retired teachers and available matriculates and by g1vmg them smtable allowances.
A total of 100 trainees completed the course in village leadership in the Government Janta Colleges at Dujana and Sheikhupura. The total expenditure incurred on these colleges during the yeB.r was Rs. 30,686.
During the year a sum of Rs. 2,000 was given as grant-in-aid to private organisations engaged in social education programmes.
Three mobile cinema vans fully equipped with projectors and films on health, civic education and cultural activities were provided to the social education centres at Jull1mdur, Ambala and Bhatind"l..
Rajasthan During the year under review all round progress was noticed in the field
of social education. Increase was registered in the number of adult education centres, number of adults made literate, total expenditure incurred and number of honorary teachers.
uttar Pradesh
The State Planning Department which is mainly responsible for social -education including adult literacy published six books for neo-literates during the year. The Mobile Library Unit held library camps of ten day's duration in rural areas, where visitors were educated on important topics through pictures, discussions and film exhibition of posters, playcards, books magazines etc.
Film shows in rural areas were given by five publicity vans and four vans of the Mol1ile Squads of the Education Expansion Department. The total number of such film shows came to 310. These Mooile Squads which include one Mobile Literacy Squad, one Mobile Library Squad, one Mobile Exhibition Squad and one Mobile Gosthi Squad did much for the cause of social education in the State by organising camps, talks, discussions, film shows etc., by publishing and circulating useful maga;,ines and by teaching through the media of pictures, maps, charts and other audio-visual aids.
West Bengal
Ex~ension of library services, taken up as a programme during the Second Plan, was further extended during 1961-62.
For conducting various educative, cooperative and recreative a..;tivities, 12 m<>?-el co~mmity centre~ and 59 school-cum-Community Centres were organised m the mtt'rest of the village people. Government grants were sanctioned to four. ~raining Centres for imparting specialised training to folk artists and IDUSICiaUS.
During the year the two Janata collegns at Bani pur an:l Kalimpon" oi"fered ~onrses in village work and constructive leadorship to 150 traine;s. The Ideal~ aud obje~tives of s?cial ~ducation were explained to the people on the occasiOn of Umversal Children s Day (on November 14) and on the· All-India Social Eduration Day (on December 1).
,A cou_rs? on Audio· visual Education was introduced in eight secondary teacher s trammg colleges and grants were sanctioned for setting up of full-fledged

:.:vo
audi~-vi~ual units. .A staff for imparting instruction on theory and practire of Audio-VIsual educatiOn was also sanctioned for each of these training colleges.
A. & N. Islands
During the year under review eleven social education centres were established and literacy classes were conducted. The total expenditure incurred was Rs. 1,200.
Dadra. & Nagar Haveli . The adult classes (conducted by the primacy teachers) were so long under
the direct control and supervision of the Education Department but with effect from the let April, 1il61, thesP- activities wei e taken over by the. Block Development Officer, Dadra and Nagar Haveli, who. after registerina the adult classes, arranged the supply of necessary materials and held ex:minations through his staff.
Delhi Televisiou was introduced in schools in DeThi and 152 schools were equip
ped with television sets. Special seminars and training courses for the teachera of the viewing schools were conducted in collaboration with the All India Radio and Ford Foundation in order to train them in imparting lessons through television. Further, 58 Tele clubs were established wherein the members vieVted the special social education programme televised by the All India Radio every Friday.
The Social Education Day was celebrated on the 1st DedemiJer, 1961 at the Delhi Public Library. This was organised in cooperation and coordination with all tho agencies working in the field of social education in Delhi. This was followed by a cultural programme consisting of community songs, folk dances and a drama.
The courses of the Janta College were completed on November 30, 1961 and 40 men and 45 women were awarded certificates. A literacy test was held in the Centml Jail wherein 200 prisoners participated. The tests of the adult schools run by the Jamia Milia at six places were also held during December, 1961:
A conference of Village Youth Clubs and Mahila Samitis was organised on the 13th and 14th January, 1962, and 250 delegates attended this conference.
Himachal Pradesh A literacy campaign for illiterate adults wa~ launched in Kinnaur District
where the aim was to make about 10,000 adults literate.
Mobile library services were started during the year. Audio-visual education equipment and apparatus were supplied to the Audio-Visual Unit of the Education Directorate under the schewe of organisation of audio-visual education.
· L. M. & A. Islands A labour and social service camp for junior boys was conducted at Androth
in March, 1962. A sum of Rs. 1,236 was spent _for the purpose.

291
Library books were purchased. and supplied .to the Ce?~ral Library a.nd reading room-cum libraries in nine Islands. Wel'khes and dmhes were supphed to all the reading rooms.
Three Women WelfDre Centres were opened at Kalpeni, Ameni and Agathy. Three teach€'rs in-charcre of these centres were given training from Calicut in tailoring and embroid~ry work. Ten islanders 'l'<ere taken on a study tour in the project area of Kerala
Manipur One competition for books for adult nco-literates was held. The best books
'~'<ere purch&sed and distributed to the community centres or youth clubs for the adult readers. Film shows were organised extensively. Educational charts and posters were exhibited in the schools. To develop outlook cf the school children audio-visual aids were distributed to primary schools and excursiom were organised. Seminars on the reorientation programmes, social service camps, Yillage leader camps, citizenship training camps etc. were also organised.
Bulletins of educational facts about man and the 'I'<Orld and lingua phones of English course "'ere prepared and distril:uted to M.Fi. and high schools. Radios ... maps, ch~rts etc. were also distributerl in these schools,
The children's library-cum-museum was improved and 5,562 child readers visited it during the year.
N.E.F.A. The Education DirectoNte arranged v~riety shows and exhibitions and
produced text hooks in tribal languages for distribution among the schools
Pondicherry
The Education Department conducted an adult education centre mainlv intended for the we>rking class population and also an adult. litPracy class in rural area. Post-literacy classes in English only were alsoconducted bv the D~partmeJlt for the benefit of those who ~spire for higher studies of matricu- · lat10n standard.
ID the field audio-visual education the expenditure during the year was Rs. 16,3-!7 · 3~ films, 25 films strips alold 10 sets of art slides were purchased, a film mechamc and cleaner was appomted and a riumber of film shows were arranged for pupils in different schools.
TrilJUIII
J?uring the year .und r report. ac~ivities ofthree projec·ts of original pattern of Tl'lpnr~\ St~te ~o~ml Welfare Advtso:·y Board were ~ransferred to vohmtary orgamsahons rn vww of the accepted pohcy of demoorattc rlecentralisation of the '1\>elfare institutions.
Fonr new schem0s \\ere introduced durin'! the year for develop-11\('llt of social C'due:~tion. Nine adult literacy centtes ~ere started. An amo.unt of Rs. 31,300 ~'>as spent for developnient of libraries. A children's s.cehon wa~ started at the Central Library. For efficient manacrement of library service, three librarians were seut for practical training at the National

292
Library, Calcutta, and two graduate librarians were sent to Calcutta University for diploma course in library service. The Central Film Library was further equipped by adding stocks of films. 11 films were purchased and added to the Central Film Unit. The facilities of the mobile library was extended to three more sub-divisions.
Two books for the neo-littrates were produced by the Education Department and an amount of Rs. 8,800 was incurred for the purpose.
A sum of Rs. 8,000 was spent by thP. Audio-Visual Section tomeetthepay · of staff and for purchasing films and other things. A workshop for repair of proje~tors, radios, etc., was set up. 290 cinema shows including documentary films were arranged and the shows were attended by more than 2lakhs of people.
Main Statistics
The total number of social education schools and classes increased from 62,815 in 1960-61 to 2,46,211 dlll'ing the year showing an over-all increase of 1,83,396 which is more than 292 percent. This is mainly due to a large increase in Maharashtra. Of the total, 8,306 were managed by Government, 11,530 by local bodies and 2,26,375 by private bodies.
The total number of adults on rolls increased from 14,94,706 (11,93,629 men and 3,01,077 women) in 1960-61 to21,19,548 (16,38,594men and 7,80,954 women) during 1961·62. Of this total 12,22,176 p2rsous (8,99,718 men and 3,22,458 women) were awarded literacy certificates.
The total e:x.penditlire on social education came to Rs. 1,01,90,016 01.s against Rs. 1,07,91,394 in the previous year. The decrease is mainly due to a big decrease in the state of W eat Bengal. Of the total expenditure, the Government's share was 85 · 9 percent. Local Bodies shared only 5 ·l percent and the rest was met from Other Sources.
TILe main statisties of social education in different States/Territories for the years 1960-61 and 1961-62 are given in Table max.

SOCIAL EDUCATION 1961-62
NUMBER OF
ADULTS ON ROLLS
MALE
MALE
FEMALE
t 1&.38.$94
1 7.80.95.
NUMBER OF
ADULTS MADE LITERATE
8.99.718 1 3.22.458 1 FEMALE
EXPENDITURE

Table CXIX-Statistics of Social Education
Numb9r of Adults on Rolls Jncrpaee( +) No. of Schools/Cla.ne•/Centrcs r-- or
Men Women All Pereons Decrease(-} State/Territory r----"------,
1960-61 1961-62 Increase(+) 1960-61 1961-62 1960-61 1961-62 1960-61 1961-62 Decrett.Re(-)
2 3 4 ~ 6 7 8 9 10 II
Andbra Pradesh 1,358 1,510 + 157 35,389 39,111 2,675 3,268 38,064 42,379 + 4.,310 Assam 676 828 + 152 19,438 20,880 5,367 5,210 24,805 26,090 + 1,285 Bihar 7,711 7,888 + 177 2,65,732 2,49,052 37,531 37,064 3,03,263 2,86,116 17,147 Gajt~.rn.t. 7,211 7,430 + 219 l,Ht,028 1,44,317 26,025 35,341 1,45,953 1,79,658 + 33,705 Jammu and Kashmir Koral a Madhya Pradroh 1,872 1,876 + 4 37,846 31,878 3,808 2,640 4,1,654 34,518 7,136 Madras 949 632 317 21,160 13,986 4.,272 2,680 ~~.432 16,666 8,766 Maha.rashtra 23,658 1,99,998 +1,76,340 2,61,107 6,60,726 1,31,167 6,03,398 3,92,274 12,64,124 + 8,71,8~0 t-0 J4ysore 5,001 5,37~ + 374 74,602 61,995 6,186 5,019 80,788 67,014 13,7" co
~ Orissa 3,292 4,212 + 920 69,922 81,590 15,825 15,957 85,747 97,647 + 11,800 Punjab 1,098 981 117 5,676 4,051 17,184 14,990 22,860 19,041 3,819 Rajasthan 3,936 9,416 + 5,480 64,685 1,26,000 6,053 7,800 70,738 1,33,800 + 63,062 Uttar Pradesh 498 486 i2 12,1a 12,730 1,352 1,729 13,<l66 14,459 + 993 West Bengal ,,623 4,501 22 1,85,827 1,71,587 33,121 84,182 9,18,948 2,05,769 13,179 A. & N. Island• II 22 + ll 300 430 25 10 325 440 + ll5 Dadra Nagar Havel! Delhi 187 192 + 5 3,193 3,257 5,551 5,318 8,744 8,575 169 Himoohal Prad••h 253 186 67 2,600 2,507 1,054 580 3,654 3,087 567 L.M. & A. !Blando 13 14 + 1 349 349 41 94 390 443 + 53 Man! pur 88 169 + 81 1,761 2,805 372 1,~66 2,133 '.371 + 2,238 Nagaland 4 3 40 169 16 85 66 254 + 198 N.E.F.A. Pondicherry 61 64 + 3 1,809 2,149 241 195 2,050 2,344 + 294 Tripara 415 423 + 8 10,151 9,025 3,211 3,828 13,362 12,853 509
I"DIA 62,815 2,46,211 +1,83,396 11,93,629 16,38,594 3,01,077 7,80,954 14,94,706 24,19,548 + 9,24,842
M{B(D)54MofE<iu-23

Table CXIX~Statistics of Social Education-(Contd.J Number of Adults made Percentage
Amount of Expenditure met from State/Territory literate Total Expendit.ure on Social Education ofExp. on
~---. Social llfen Women All No. of 1960-61 1961-62 r ncreaae( +) Edu. to Govt. D.B. M.B. Other
Persona Teachere Decrea.se(-) Total funds Funds Funds Sources ,.-..---'----. Exp. nn Amount Percentage Edu.
12 13 14 15 16 17 18 19 20 21 22 23 24
Andhra Pradosh 32,020 2,587 34,607 1,602 2,01,111 1,98,377 2,734 1·3 0·1 1,63,128 30,062 . 5,032 155 Assam 14,382 3,732 18,114 828 1,14,781 97,70~ 17,077 14·9 0·1 95,904 1,800 llihar 1,87,659 27,571 2,15,230 7,919 15,76,664 14,68,506 - 1,08,158 6·9 0·9 14,56,~30 11,676 Gujarat 86,140 9,044 95,184 6,909 3,85,607 5,22;906 + 1,37,299 + 35·6 0.3 3,71,799 1,07,144 12,820 31,143 Jammu & Kas~mir : Kerala Madhya Pradesh 2,2,524 1,866 24,390 1,876 5,91,462 5,16,598 74,864 12·6 0·3 5,09,385 56 7,157 Madraa 1,901 337 2,238 718 2,95,775 2,00,146 95,629 6·5 0·1 1,93,080 7,066 t-::1 Maharashtra 2,79,274 2,30,042 5,09,316 1,99,160 7,74,357 6,27,152 - 1,47,205 19·0 0·2 2,38,139 82,706 3,06,307 <:O·
If>.. Myaore 20,«5 1,741 22,186 5,381 4,92,291 6,74,876 + 1,82,585 + 37·0 0•4 5,55,215 42,679 76,982 Oris.n. 41,882 9,144 51,026 3,152 7,41,969 10,01,483 + 2,59,514 + 35·0 1·8 9,85,143 16,340 Punjab 2,574 8,f95 10,669 597 3,98,871 5,99,492 + 2,00,621 + 50•3 0•4 5,24,451 1,431 73,610 Rajasthan 1,26,ooo 7,800 1,33,800 9,416 5,77,652 6,78,000 + 1,00,348 + 17·4 0•6 6,78,000 Uttar Prndosh 1!J,209 1,506 11,715 686 95,019 1,04,451 + 9,432 + 9·9 o·o 98,553 3,158 2,740 West Bengal 59,105 10,432 69,537 5,454 31,63,322 19,67,158 -11,96,164 37·8 0•7 15,27,838 5,088 .55,402 3,78,830 A. & N. Islands 430 10 440 22 23,422 22,462 969 4•1 2•9 22,462 Dadra Na~ar Havell Delhi 1,030 3,449 5,379 192 3,57,388 3,96,450 + 39,062 + 10·9 0•4 2,26,948 1,69,502 Himachal Pradesh 1,718 345 2,063 1 151 39,833 37,071 . 2,762 6·9 0•3 36,951 120 L.M. & A. Tolond• 85 10 95 28 2,280 6,756 + 4,476 + 106·3 2·2 6,756 M.anipur 2,178 1,203 3,381 169 15,645 18,706 + 3,061 + 19·5 O·O 18,706 N•••l•nd 10 5 15 10 500 500 500 N.E.F.A. Pondicherry 1,282 99 1,381 65 12,122. 20,719 + 8,597 + 7·1 o·o 20,719 Ttipura 7,970 3,«0 11,410 474 9,31,323 10,30,503 + 99,180 + 10·6 10·4 10,26,219 4,284
hmu. 8,99,718 3,22,458 12,22,176 2,44,809 1,07,91,394 1,01,90,016 - 6,01,378 5·6 0•3 87,56,726 2,25,000 2,90,080 9,18,210

CHAPTER X
MISCELLANEOUS
1. Pre-Primary Education
Pre-Primary education is generally imparted to children belonging to' the age-group 3 to 5 or 6 yea.~s and pr~ced~s t~e formal ed~cation that com~enees at the primary-stage. This educatwn IS gtven under different systems like the Nursery system, Montessori system, Kindergarten system, etc. Pre-primary education is provided in pre-primary ·schools and pre-basic schools as well as such classes attached to some of the prinlaryjjunior basic and secondary schools.
During the year under report, the number of pre-primary schools was 2,240 as against 1,909 iu the previous year. This excludes the number of pre-primary classes attached to other institutions as the number of such classes is not availa- -ble. Of the total number of pre-primary schools, 1,595 or 71·2 per cent were managed by private bodies (59· 3 per cent by private aided bodies and 11· 9 percent by private un-aided bodies) 370 or 16·5 per cent by government and the remaining 275 or 12·3 per cent by local boards.
These pre-primary schools as well as the pre-primary classes attached to other institutions together enrolled 2,16,317 pupils (1,22,686 boys and 93,631 girls) as against 1,78,642 pupils (96,520 boys and 82,122 girls) in the previous year. This shows an increase of 21·1 per cent (27 ·1 per cent in boys and 14· 0 per cent in girls) as compared to an increa.se of 18· 3 percent (19· 9 per cent in boys and 16·5 per cent in girls) in 1960-61.
The total direct expenditure on pre-primary schools (excluding that on attached classes) increased from Rs. 58,73,417 toRs. 7 4,90,901. This -expenditure was distributed among the various sources of income as under : Government funds 28·1 percent; local board funds9·9 per cent, fees 35·8 percent and other sources 26 · 2 per cent.
Detailed statilltics of pre-primary schools according to States are given in Table CXX.
Facilities for the training of teachers for pre-primary schools were provided in the States of Audhra Pradesh, Gujarat, Kerala, Madhya Pradesh, Ma.dras, !ll<>ha.ra,htra. and Uttar Pradesh. The total number of training schools in these Slates was~~ as against 30 in the previous year. The decrea~ of one pre-primary tmw.her tnunmg school was due to the closure of the school m Delhi. The highest number (f schools was reported by Maharashtra (12), followed by Gujarat (7), l\Ia<lras (4), Kcrab and Madhya Pradesh (2 each) and Andhra Pradesh and Uttar Pradesh (1 each). ~Ijll(D)5Hioffidu-23a 295

'fable CXX-Statistics of Pre-Primary Schools
Numbt• of Pupils Expenditure StatejTerritory Number of schools r- """" Boys Girls Total
r-----A- r-----'----. r-----A.~ r-~------ r----"--,. 1960-61 1961-62 1960-61 1961-62 1960-61 1961-62 1960-61 1961-62 1960-61 1961-62
1 2 3 4 5 6 7 8 9 10 ll
Audhra Fra<leoh 4.7 71 3,774 4,686 2,855 3,828 6,629 8,514 1,43,035 2,07,783 Assam 43 47 3,821 1,285 3,726 1,437 7,547 2,722 71,159 83,859 Bihar 18 27 65~ 904 579 668 1,243 1,572 83,896 1,14,542 Guja.rat 358 415 30,075 35,551 19,341 21,891 49,416 57,442 11,46,527 13,49,101 Ja.mmu aud Kashmir 4,783 12,98a 9,268 8,974 14,051 21,957 Kerala. 2:l 46 693 1,318 676 1,329 1,369 2,647 42,678 97,861 Madhya Pradeoh 169 2()4 5,765 7,056 5,981 6,764 ll,746 1:1,820 6,46,946 8,01,005 Madras 28 34 1,704 2,411 1,670 2,176 3,374 4,587 2,09,363 2,45,269 Ma.hara.ahtra 527 527 18,895 20,0ll 15,545 16,961 34,440 36,972 16,94,955 18,81,768 Mys~ro 201 239 7,172 9,799 11,396 8,209 13,5~ 18,008 4,23,719 6,36,401 1;0 OriBSa 89 95 67 72 156 167 co Punjab 5 8 691 523 753 318 1,444 841 18,641 31,131
0')
Rajasthan 16 32 2,()46 2,185 1,301 754 3,34.7 2,939 1,39,238 3,05,209 Utto.r Pradeeh 73 108 4,871 6,C33 3,654 5,167 8,525 11,800 7,31,518 9,:,3,173 W66t Bongal 78 liS 3,922 6,94.0 3,371 5,405 7,293 12,345 3.~2.792 5,55,631 A. & N. Islanda 437 395 242 240 679 635 Dndra. Xa;ar Hav~li 2 23 32 53 .. Delhi • 24 30 733 2,'58 562 1,777 1,295 4,235 65,735 1,56,689 Himachal Pradesh 2 5 40 107 35 70 75 177 5,140 15,007 L. M. & A. lolauda Manipur 1 7 17 4 4 1~ 21 4,080 2,931 N.E. F. A. 2 40 20 60 6,240 Pondicherry 30 so 1,1~9 1,101 962 1,198 2,101 2,299 30,618 36,198 Tri;:uro. 208 294 5,199 6,165 5,134 6,337 10,333 12,502 23,477 31,103
!IlDIA. 1,909 2,24.0 96,520 1,22,686 82,122 93,631 1,78,642 2,16,317 58,73,417 74,90,901
• Figures not available.

297
The States of :Mysore and Punjab did not report any pre-primary training school but facilities for such training existed in some of the primary and secondary training schools in these States. Of the total number of pre-primary training schoolB 23 or 79· 3 per cent were managed by private aided bodies, and the remaining 6 or 20·7 per cent school by government.
These pre-primary training schools together with the training classes attached to other institutions enrolled 1,943 (131 men and 1,812 women) pupilteachers as against 1,849 (179 men and 1,670 women) in the previous year, the fall being due to decrease in the number of institutions. The total direct expenditure incurred on pre-primary training schools (excluding attached clas~s), however, increased from Rs. 4,90,088 to Rs. 5,09,618 at the rate of 4 ·0 per cent. It was distributed among the various sources of income as under : Government funds 59·2 percent, Local bodies funds 0·9 percent, fees 23·8 per cent, endowments 7 · 6 per cent and other sources 8 · 5 per cent. The average annual cost of educating a teacher trainee in such schools was Rs. 295 · 6 as against Rs. 284·8 in 1960-61.
Table CXXI~tatistics of Pre-Primary Teachers' Training Schools
Number Number of Pupilst of Insti-State/Territory
Andhra Pradesh
Guja.ra\
Kerah•
Madhya. Pradesh
Ma.dra.s
Maha.ra.shtra.
Mysore
Punjab
U t\ar Pradesh
INDIA.
tutions Boys
2 3
1
7 131
2
2
4
12
1
29 131
tincludea enrolment in attached classes.
Girls Total
4 5
100 100
369 500
79 79
98 98
324 324
606 606
60 60
99 99
77 77
1,812 1,943
Tote.! Direct
Expenditure
6
21,671
89,482
7,938
60,961
48,046
2,25,664
.. 55,856
5,09,618
Average Annual
Cost per Pupil
7
216·7
179·0
100·5
622·1
148·3
372·4
725·4
295.6
The detailed statistics of pre-primary training schools in various States are given in table CXXI.
2. Aesthetic Education
The year 1961-62, witnessed slow but steady expansion in the activities of the Central and State Governments in the field of Aesthetio Education which mainly in?lnded the study of music, dancing, crafts and other fine arts, including ~he teaching of drawing. The facilities for the aesthetic education were provid<'d Ill some of the secondary schoob for ~irla and in a few colleges and universities.

29S
Extra curricular activities conducted by literary and dramatic clubs and students' union in colleges also helped in the promotion of aesthetic education. Besides, voluntary organisation working in the field also contributed towards its development.
The three Academies, nam~ly Sahitya Akade:rn,i, the Sangoot Natak Akademi and Lalit Kala Akademi continued their activities for the promotion of Art and Culture in their respective fields. The Government of Indid. paid the following grahts to each of the Akademies as under-
. Sahitya Akademi-Ra. 6,00,000. Sangeet Natak Akademi -Rs. 12,00,000. Lalit Kala Akademi-Rs. 7,00,000.
A brief account of the activities of the three Akademias is given below-
Sahitya Akademi Some of the important projects that wt>re in hand or completed during
the year are as under-
(i) A Bibliography of Indian literature from the beginning of the present century to the end of 1963.
(ii) A Who's Who of Indian Writers. (iii) Critical Education of Kalidasa's Works. ( iv) .Anthology of Saniildit Literature. (v) Anthology of Indiim Poetry.
(vi) Anthology of Folk Poetry. tvii) Anthology of Devotional Poetry. (vii~) Bhatatiya Kavita.
tix) Contemporary Indian Short Stories. (x) 1Iistories cif Literature.
(xi) Contemporary Indian Literature. (xii) Contemporary Hindi Literature. (~iii) Collected Works of Sardar Pooran Singh. (xiv) CollMted Wo1'ks of Late Maulana Abu! Ka;lam Azad. (xv) Tagore Bibliography.
(xvi) Dictionaries.
A Bengali to Bengali Dictionary 'Bangiya Shabdakosh' was also compiled and edited. Besides, the Akademi brought out two-six-monthly journals, one in English entitled 'Indian Literature' and the other in Sanskrit entitled 'Sanskrita Pratibha'.
Translation of Foreign classics
The activity of translating well known foreign classics into major Indian languages, under the programme 'Unesco's l\fajor Projects of l\futual appreciation of Eastern and West{)rn Cultural values' whereby a gift of 5,000 dollars worth of printing paper was made available to the Akademi, was contiliucd.
299
Language translations of the Ant~ology of Yugoslav ~hort Stories an~ the antholo"V of Rumanian Short Stones were prepared. Besides, the Akadenu also m<~inta.i~~d conta.o:Jt wi~h several literary and cultural imtitutions to encourage betwr a.pprcciatio:J. of Indian literature abroad.
Tagore Centenary
In connection with RJ.bindranath Ta.gore's birth centenary celebrated in 1961, Selected Short Storirs of Tagore, in Nepali, entitled 'Ra.bindr<\nath Ka Katha.' and selected poems of Tagore, in Tib3ta.n, entitled 'Snyan-ngag Dsdus-ta.' were published. In addition to these the Akademi also brought out a short biography specially written for young readers and a Tagore Centenary Volume in English containing articles by distinguished writers on various 11spects of Tagore's life and works. A Tagore chronicle, a short biography of his works and a 'Tagore homage volume under the title 'Ravindropaharam' were also published in Malayalam. The Akademi also helped some State Cel\tenary Committees in the preparation of similar volumes in some other Indian languages.
A Tagore Award of Rs. 10,000 to be distributed equally was awarded by the Akademi to four living writ~rs whose studies, writinga or editing have helped most in the understanding ofTangore's life and ideas. To commem)rate the birth centenary of Rabindranath Tagore, the newly constructed building of the Sahitya Akademi was named 'Rab~dra Bhavan'.
International Literary Seminar
A three day International Literary Seminar was organisod by the Sahitya Akadcmi from 11th to 14th November, 1961 in collaboration with the Indian Council for Cultural Relations and with the assistance of UNESCO, as part o{ the Tagore Centenary celebrations in India.. The Seminar which was attended by
·distinguished delegates from abroad discus~ed three main items viz.-
(i) Rabindranath Tagore and Modern Indian Literature (ii) Rabindra.nath Tagore and tho World, and
(iii) Literature and Modern Life.
Awards and Financial Assistance
The S.1hitya Akademi gave annual award~ to 76 writers of R3. 5,000 each for the most outstanding book of literary quality in each of the major Indian languages upto the year 1962.
Lalit Kala Akademi
The L:ilit Kala. Akad·~mi mwel to its new headquarters in Rabindra Bha.ra.ti anl th.) Aka.d•3mi during the yea.r under revi~w took up new programmes and played its role m'lr\3 effectively as under-
National Exhibition of Art, 1962
Th~ L:Jit K..a.h Akademi org,lnised the National Exhibition of Art from 21st Janutwy, 1962 to 12th Februar.;, 1962 in New D~llii which was inaugurated by Dr. S. Radhakrishnan, Vice President of India. It was sub~equently shown at Cn.Jc,Itt:\, Bhubaneswa.r, Shillong and Pa.tna. a.1 travelling exhibition. The Akad,~llli purchased, for its own collection, 27 exhibits (24 paintings and 3 graphied) of the V<llue of Hs. 14,850. · .

300
Indian Exhibitions Abroad
The Akadem.i parttC'ipated in the VI Biennale de Sao Paulo of the Museum of Modern Art by sending 40 paintings, 3 sculptures by 10 artists and 4 copies of Ajanta Frescoes and 8 photographs giving views of Ajanta Caves in which Shri K. G. Subramanyan of Baroda was awarded 'Honourable Mention'. Besides, the Akadem.i participated in the exhibition II Biennale de Paris, by sending 9 paintings and 1 sculpture.
Delegations Sent Abroad
The Akadem.i participated in the Intermtional Symposium of Sculptures 'Forma Viva' at Kostenjevica na Kuki (Yugoslavia) from June 6 to September 12, 1961 by sending a one man delegation Prof. Sankho Chaudhuri. Earlier, the Akadem.i had participated at the International Congress of Plastic Arts at Vie!pla in September, 1960 by sending a five man delegation. One of the delegates, Shri P. Das Gupta, was unanimously elected President of the newly constituted Bureau and also a member of the new Executive Body of I.A.P.A.
Publications, Recognitions and Grants The Akademi published 3 books and journals namely 'Drawings and Paint
ings of Rabindranath Tagore' by P. Neogy; 'Paintings of the Sultans and Emperors of India in Amarican collections' by Dr. Richard Hinghansen and Lalit Kala No.8. The Recognition Sub-committee ofthe Akadem.i accorded recognition to International Cultural Centre (New Delhi). Nasik Kala Niketan (Nasik) and Society of Contemporary Artists (Calcutta). Besides, a total sanction of Rs. 1,03,000 was made during the year to 22 recognised organisations and institutions including a grant of Rs. 4,000 each to the 8 State Akademies of Andhra Pradesh, Assam, Gujarat, Madhya Pradesh, Madras, Mysore, Orissa and Uttar Pradesh.
Library An addition of 255 titl68 including some rare books was made by the
. Akadem.i to the library books, bringing the total number of volumes in the library to 1, 725.
Other Programmes A three-day Seminar on Indian Art History was organised on March,
11, 1962 at the Bharat Kala Bhavan, Banaras Hindu University. Also, the Annual Artists' Conference was organised at Calcutta in collaboration with the Central Art Society for three days from March 17, 1962. Besides, the local artists, delegates from varioua State Akadem.ies and regional art organisations participated in it.
Survey and Copying In pursuance of the Akadem.i's regular programme of copying, work at the
Bagh Caves started during the year. More than half of the work was completed.
Sangeet Natak Akademi · Sangeet Natak Akademi was dissolved by the Government of India and
the new Akadem.i was registerd as a Society under the Societies Registration Act,

:JOI
1S60 whose Chairman and Vice-Chairman were both appointed by the Presidc!:.t,of India for a period of 5 years. The new Akadcrni continued the activities on ,,ne iines laid down by its predecessor.
Fellowships and Awards
The Akademi elected Sarvashri Gopeswar Bandopadhyay, Papanasam R. Sivan, D. Annaswami Bhagavathar and Uday Shankar as Fellows of the Akademi. The Akademi also selected 9 artists for the Akademi a warda in Music Dance and Drama. 'Maru Vazhvu' of Shri T. N. Viswanathan was selected aa the best play in Tamil for award of a cash prize.
Tagore Centenary
In connection with Poet Rabindranath Tagore's birth centenary celebrated in November-December 1961, Tagore's dramas and dance dramas, namely, Chitrangada' 'Visarjan', 'Mayar Khela' 'Ghare Balire', 'Kshudhito Pashan, •Shyama,' 'TasherDesh' 'Bhanusingher Padvali' and 'Dalia.' were presented by well-known cultural organisations in the country. The Aka.demi gave special grants to the institutions concerned for producing these plays and dance dramas.
Publications
The Akademi published the first volume of an Anthology of Songs of Ra.bindra Nath Ta.gore in staff notation, (containing 50 song~) and the Sangeet Nata.k Akademi Bulletin-Rabindranath Ta.gore Centenary number.
The Akademi disbursed a sum of Rs. 5,54,589 as financial assistance to a number of institutions working in the field of Music, Dance a.nd Drama. Resides, the Akademi spent Rs. 2,37,358 on the National School of Drama and ARian Theatr'~ Institute (New Delhi) and Rs. 25,000 on the Manipur Dance College, Imphal and the two institutions run by it.
National School of Drama and Ailian Theatre Institute, New Delhi, and !4anipur Dance College, Imphal
The National School of Drama and A~ia.n Theatre Institute continued to train students in the basic principl<>s of the various aspects of theatrecraft. The Mr1inpur Dance College, Imphal, had attempted to break fresh ground by producing ballets in Ma.nipuri Style-'Khama and Thoila.' and Tagore's 'Chitrangad:l'. Un~e~ the schez_ne ~f Int{)r-State Exchange of Cultural Troups sponsored by the !'IIIIDstr,r of s~wutific Research and Cultural Affairs, a college troup toured Assam, Onssa, Kerala and Andhra Pradesh.
Statistics
The statistics of institutions of music and dll.ncing and other fine arta are given in table CXXII and table CXXIII. A brief account of institutions llUder
:each type ia giV<'n below-

~02
Table CXXJI--Statistics of Schools for Music, Dancing and Other Fine Arts
State/Territory
1
.Andhra Pradesh
Assam
Bihar
Gujarat
Kerala
Madhya Pradesh
Madras
Maharashtra
Mysore
Orissa
Punjab
Rajasthan
Uttar Pradesh
West Bengal
Delhi
Manipur
Tripura
INDIA
Schools for Music and Dancing Schools for Other Fine Arts
No. of No. of Insti- Number of Pupilst Insti- Number of Pupilst
tutions ,-----A----- tutions ,.-----''------.. Boys Girls Total Boys Girls Total
2
13 13 1
11
6
3
1
26
24
21
4 "10
29
1
2
3 4
303 949 34 58
50 50
627 466
159 488
824 885
3 65
780 1,167
599 1,277
349 836
i24 237
213 830 550 2,4!:13
8 101
. 25
7
53
17
5
1,252
92
100 1,093
647
1,709
68
1,947 1,876
1,185
361
1,043
3,033
109 78 2-!
165 4,655 9,962 14,617
6
2
1
8
5
3 21
4
2
1
1
1
1
1
7
35
85
255
117
382 428
419
71
128 42
444
11
50
51 2,467
8
3
5 169
56
29
229
60
69
4
17
46
36
9
38
90
424
173
411
657
479
140 132
59
490
47
50
723 3,190
t Includes enrolment in school classes attached to colleges.
Schools for Music and Dancing
The number of schools for music· and dancing decreaB{)d from 189 to 165. The decrease was due to the fact that some institutions from Maharashtra which had no educational content and were included in 1960-61 have been dropped from 1961-62.
Beside these schools, facilities for music and dancing courses of school -standard also existed in some of the colleges for music and dancing. The number of students in the schools for music and dancing as well as such classes attached to other iustitutions was 14,617 (4,655 boys and 9,962 girls), as against 13,938 students (4,357 boys and 9,581 girls) in the previous year.
The total direct expenditure incurred on the schools for music and dancing amounted toRs. 13,36,738 as ag<1inst Rs. 14,37,928 in the previous year. Its sourct:wise distribution was: governm'lnt funds 41· 7 per cent, local bodies funds 2·0 per cent, fees 28· 6 per cent, endowments 7 · 0 per cent and other sources 20· 7per cent. The average annual cost of educating a pupil in these schools was Rs. 116·0,

303
Schools for Other Fine Arts Th~ number of schools for other fine arts increased fro!ll 49 to 5l. Btl·
Rides, some colleges provided facilities for other fine arts of school stu.uclard. The number of pu]:-ils in thes? schools as well as in attached class0s inereased from 4/134 (3,281 boys and 753 girls) to 3,190 (2,467 boys and 723 girls).
The total direct expenditure on schools for other fine arts was Rs. 9,90,865 as against Rs. 8,46,686 in the previous year. Of this, 59· 8 per cent was met from Government funds, 0 · 5 per cent from local bodies funds, 27 · 4 per cent from fers, 2 · 9 per cent from endowments and 9 · 4 per cent from other sources. The average annual cost of educating a pupils was Rs. 217 · 0.
Colleges for Music and Dancing The number of colleges for Music and dancing stood at 46 during the
year as against 45 in the previous year.
Apart from these colleges, facilities for the teaching of music and dancing existed in t.he te<J.ching departments of the University of Annalllala.i Delhi, Indira Kala Sangect Vishwavidyalaya, Madras, Patna, VaranaS()ya' Sanskrit Vishwavidyalaya and Vishwa Sangect Bhavan of Calcutta. .
The total number of pupils on rolls in music and dancing colleges as weir as in University teaching departments rose from 5,153 (1,979 boys and 3 174 girls) to 5,371 (1,941 boys and 3,430 girls). This figttre excludes the nm~ber of students receiving instruction in courses of schools standard in these institutions.
Table CXXIII-Statistics of Colleges for Music, Dancing and Other Fine Arts -
StatejTerritory
Andhra Pradesh Bihar Gujarat Madhya Pradesh Madras Mahar<l.Shtra. Orissa Rajasthan Uttar Pradesh West Bengal Delhi Manipur Tripura
INDIA
Colleges for Music of Dancing Colleges for Other Fine Arts
' No. of Insti
tutions
2
1 2
21 2
2 I 6 8
1
46
~·---------A--------------No. of Pupilst No. of No. of Pupilst
Insti-Boys Girls Total tutions Boys Girls Total
3 4 5 6 7 8 9
2 26 28 187 44 231 25 21 4G
302 2~5 507 83 21 104 637 714 1,351 4 71 41 112
75 225 300 6 4 10 625 274 899
4G 103 149 14 17 31
279 402 681 293 1,fJ30 1,923 229 1!4 313 250 ().! 314
[i 6 13 22 35
1,941 3,430 5,371 8 1,201 498 1,699
tExcludos enrolment in attached school classes but includes thereof collegiate standard cl•uscs attached to other institutions.

304
The total direct expenditure on colleges for music and dancing increased from Rs. 15,24,781 to Rs. 16,13,062 during the year of which 47·8 per cent was met by Government, 0 · 2 per cent by local bodies, 23 · 3 per cent fro no fees, and 28·7 per cent from other sources. The average annual cost of educating a pupil amounted to Rs. 215·1.
Colleges for Fine Arts The number of colleges for fine arts in the country decreased from 9 to 8.
Besides facilities for the teaching of fine arts existed in the teaching departments of the universities of Baroda, Gorakhpur, Madras and Visvabharati_.
The number of pupils in colleges for fine arts as well as in the univ~rsity teaching deptts. rose from 1,165 (84J boys and 325 girls) to 1,699 (1,201 boys and 498 girls). This number, however, excludes the number of students reading in fine arts classes of schools standard attached to the colleges for fine arts.
The total direct expenditure on colleges for fine arts decreased from Rs. 9,515,816 to Rs. 8,96,242. Its distribution among the various sources of income was t government funds 87 • 2 per cent, fees 11· 5 per cent and other sources 1· 3 per cent. The average annual cost of educating a pupil was Rs. 631· 2.
A brief account of the developments in the field of Aesthetic Education in the different States and Union Territories is given below.
Bihar A State Board of Cultural Education was constituted to provide tech
nical guidance, supervi'lion and to recommend financial assistance for the improvement of dance, drama and music to th3 institutions affiliated to the Bihar Academy of Music, Dance and Drama..
The State Government had included a scheme of construction of a Sta.te Th~atre Hall at Pa.tna in the Second Five Year Plan. The Govt. of India also extended assistance to this scheme during the year for the Second Five Year Plan.
The State Government has decided to start a college of Music at Patm on the pattern of Moris college of Music at Lucknow and Bhatkhande school of Music at Poona. The Government was also considering a proposal to take over the management of Bh~ratiya Nritya Kala Mandir, an aided institution devoted to dance and drama.
Gujarat The Gujarat Sangeet Nritya Natya Akademi was established in July,
1961. The State Government arranged festivals like Tagore Natya Mahotsava
Music, Dance festival and Bhavai festival. It also awarded prizes to the best written dramas in Gujarati language for both adults and children. Finan· cial assistance was also given to needy artists. Under the Government of Indll~'s scheme of Inter State Exchange of Cultural Troups, an amount of Rs. 60,000 was spent on thew activities. Grants were also distributed to 16 dramatic and cultural institutions to the tune of Rs. 12,500.
305
The Second State Art Exhibition was organised at Surat. Out of 1,033 exhibits received 635 were selected for the exhibition and prizes worth Ra. 21,000 were sanctioned. Orissa
Under the Government of India's scheme of Inter-State Exchange of Cultural Troupes, the troups of Ma.nipur and Madras were invited to the State during the period from 22nd to the 30th D3c. 1961 and 6th to 14th Jan., 196~ respectively. An amount of Rs. 10,000 was sanctioned for theso troupes. Besides, the troupes from Orissa visited the States of K~rala and Andhra under the above scheme for which an amount of Rs. 5,000 was sanctioned.
Performances of instrumental and vocal music and dance and dramas were arranged at Sahed Bhava.n, Cuttack und9r the scheme of Cultural Exchangll of Visits of Outstanding Artists and Ustad Villayat Khan of Bombay participated in the J:Erformances. An pmount of Rs. 3,000 was sanctioned by the Govt. for the purpose.
The Orissa Sangit Natak Akademi, Bhubaneswar, organised various cultural programm~s, not:J.bly a daw~e drama. 'Krishna Ga.tha', on the 21st July, 1961 and a dance drama 'Buuha.' on 21st August, 1961 at Bhuba.nesw."1f. Rajasthan
The Lalit Kala. Akademi of Rajasthan presented 'Gadia Luhar Jhanki' on the Republic Day and was awarued second prize for the first time. The Akadcmi conducted 13 exhibitions at different places. The Sahitya Akademi got translated 4 books of Rabindranath Tagore, three in Rajasthani and one in Hindi. The Akademi awarded prizes amounting to Rs. 6,000 for five book!!_ and Rs. 800 as financial assiftance to five magazines. The Sau~'et Natak Akademi gave grants-in-aid amounting to Rs. 8,000 to different institutious. Under the scheme of Inter-State Exchange Cultural Troupes, the lVlysore State Cultural Troupe's progra=es were arranged at Bikaner, Jodhpur and Udaipur. West Bengal
A progra=e for improving and developing a large number of institutions of music on proper lines was taken up by providing financial assistance to 10 institutions according to grant-in-aid rules. Tot '1 expenditure under the scheme was Rs. 1. 11 lakhs. · Himachal Pradesh . Tagore Centenary was celebrated at Solan early in May, 1961. The pain
tings, photographs and books of the poet were shown in the exhibition. An clab?rate cultural programme comprising of exhibition of works of Tagore, Kav1 Sa.=,.hns, drama and public speeches etc. was also organised on the ?ccas!on. Moti~al Nehru Centenary was also celebrated on 6th May, 1961 and m th1s connt>ctJon practical symposiums and cultural progra.mmes were also t~rmnged.
L. M. & A. Islands An Art club at Ameni similar to the one at Minicoy was started.
Manipur In 8()JU0 _of th~ l~igh _sch?oh llliHic_ WcH introtltwcu as a subject of study.
In eac~ Ba:Hc T~-.~~~lmg mst1tute, mus1c and art teachers were appointed for ell:panswn r.f fae~htJes for music and art in the Primary schools.

306
3. Education of the Handicapped
Education of the handicapped is imparted through two types of instituc· tiona viz (a) institutions for the mentally handicapped children and (b) institutions for the physically handicapped children. A brief account of these schools is given below.
Schools for the Mentally Handicapped Children
During the year, 7 schoo~ catered to the needs of mentally handicapped children of the country. These schools were in the State of Gujarat (I) Maharashtra (3) West Bengal (I) and Delhi (2). Besides these, the separate section in the school for the Deaf at Luch.-now, continued to provide education to the menta.lly retarded children. These schools reported an enrolment of 511 (375 boys and 136 girls) as compa.red to 4IO (270 boys and I40 girls) during the previous year. The number of teachers employed therein increased from 52 to 64, and the expenditure incurred thereon increased from Rs. I,93,725 to Rs. 4,53,245 in I96I-62. This expenditure was diftributed among the various sources of income as under: Government funds 50· 0 per C{)nt, local bodies funds 2 · 0 per cent, fees 37 ·I and other sources IO · 9 per cent. The corresponding percentage for th'3 previous year were 63· 4, I·l, 34·0'and 1· 5 respectively. These institutions watched the mental development of children with care and sympathy and provided them with psychological and psychoanalytical treatment for readjusting themselves in the society to possible extent.
Schools for the Physically Handicapped Children
The number of schools for the physically handicapped rose from 139 in 1960-61 to 155 in 1961-62. The di~tribution of schools for the physically handicapped according to management was Government 43 or 27 · 7 per cent, local boards 2 or 1·3 per cent, private aided bodies 106 or 68·4 per cent, and private un-aided bocli?s 4 or 2·6 per cent of the total. Of these, 85 schools were fer the blind, 50 schools for the deaf-mute and 20 schools for the crippled. The schools for the physically handicapped were reported by all the States and the Union Territory of Delhi. Increase in the number of schools was reported by the State of Bihar (3), Gujamt (2), Jammu & Kashmir (1), Madhya Pradesh (1), Madras (3), Maharashtra (3), Delhi (4}. Thetotalenrolmentin the schools for the physically handicapped increased from 7,984 (6,081 boys and 1,903 . girls) children to 10,576 (8,479 boys and 2,097 girls) at the rate of 29·8 percent. Tha corresponding percentage increase in the previous year wa~ 9·2J;er cent. The distribt:.tion of the enrolment in different types of schools was : for the blind 6,163, for the deaf-mute 3,592 and for the crippled 821. The enrolment in each of these types of schools increased by 2,298, 234 and 60 respectively over the previous year's figures. The tohl expenditure (Direct and Indirect) increased from Rs. 42,88,532 toRs. 63,26,106 giving an increase of 47·5 percent. The Government met 68·5 per cent of this expenditure, local boards 2 · 2 per cent, fees 5 · 0 per<·ent and the remaining 24 · 3 per cent was met from endowments and other sources.

ION PPED __ 90
INSTITUTIONS
L__-._0 ===---------IN THOUSANDS·6
ENROLMENT
r-----------------~2
L_.ILo ------------------------800
----------------------------soo TEACHERS
EXPENDITURE

Table CXXIV-Stati.stics of Schools for the Handicapped
NurLbcr (Jf ~cbools Number of Pupils
• .A.--------.. • Statc/Territr,ry For the Physically Handicapped F >r the Total J<',>r the Physically Handicapped For the Total Total Number Mentally Mentally Expendi- of
lllind Deaf-Mute Crippled Handi- Blind Deaf-1\Iute Crippled Handi- ture Teachers capped capped
2 3 4 5 6 7 8 9 10 II 12 13
Andhra Pradesh 4 2 3 9 168 199 100 467 1,07,476 57 Asaa.m 1 1 2 40 :l9 79 4:l,054 22 Bihar 8 3 ll 278 128 406 1, 7~,5\)4 53· Gujarat 12 5 19 421 328 22 41 812 8,00.231 102 Jammu & Kashmir 2 2 31 31 28,276 8 Kerala *4 3 7 *I:lO us 378 1 ,51,.) 18 52 Madhya Pradesh 4 1 5 142 55 197 I,O<J,l21) :ll JII,ulras 6 7 4 17 461 926 328 1,715 fJ.01,2ti4 183 Maharashtra 1 :J 10 8 3 34 2,597 471 320 3ll 3,699 16,59,037 274 My sore 3 3 249 .. 2!9 l,2U,1:;8 :n ~
0 Orissa 1 3~ 3-! IG,08!J 4 '"-l Punjab 5 7 203 29 51 283 3,::.t-,!J7-1 41 Rajasthan 2 2 148 148 1,07,!113 13 Uttar Pradesh 13 10 23 519 459 1,008 7,55.:ws 140 West Bengal 4 5 10 246 389 73 708 5,94,4~3 115 A. & N. Islands
.·, Dadra N:agar
Havcli .. Delhi· 4 1 3 2 10 Himachal Pradesh
500 287 86 873 8,12,535 Ill L.M. & A. Islands Manipur Nagaland N.E.F.A. Pondi< !terry Tripm·a
INDIA/TOTAL 85 50 20 7 162 6,163 3,592 821 511 ll,OS7 63 26,:06 1,243
*Includes deaf and dwnb. MfB{J.J)MMof dn-24

308
The total number of teachers in the schools for physically handicapped was 1,179 as against 1,034 in the previous year. Of thest>, 655 were in the schools for the blind, 426 in those for the defl.f-mute and 98 in those for the crippled. T~aining facilitie.~ for the teachers for the deaf continued to be provided by
. the training sections of the Deaf and Dumb schools located in Lucknow and Calcutta.
Table CXXIV gives the Statewise statistics of schools for the handicapped.
The schools for the blind generally imparted elementary education coupled with vocational training in <'rafts like weaving, chaircanning, candle making, toy making, etc., to enable the students to earn their living. Music, vocal as well instrumental, was taught almost in every · school for the blind. The elementary education was provided free and by means of a Braille Code adopted to regional languages. Lip reading and articulation formed the main feature of _instructions in institutions for the deaf-blind. During the year 1961-62, the Ministry of Education continued its efforts to promote the education, welfare aud rehabilitation of the handicapped. Special efforts were made t<> reappraise the existing schemes and orient policies to be adopted during the Third Five Year Plan.
, National Centre for the Blind, Dehra Dun
. One of the major projects undertaken by the Government of India. in the field of education and training of the blind was aimed at providing an integrated service for the blind commencing from education in childhood and ending with the training of the adult and included the production and manufacture of Braille literature and ap}'liances for the blind. The Centre comprised a. number of institutions one of which was established during the year under report and others were developed and strengthened.
Training Centre for the Adult Blind, Dehra Dun
It. was established in 1950 for imparting two years' training to ad.llt blind men and women chiefly in crafts, with a view to help them towards economic independance. The rules of admission to the Centre were liberlised during the year under review by raising the maximum age of admission from 30 to 40 years and by giving priority to blind ex-servicemen and to candidates sponsored by State Governments and approved institutions for the blind. In the case of blind ex-servicemen a further concession was given by raising the maximum age at 50. Since the blind persons trained in cottage industries were finding it difficult t<> secure remunerative employment, the process of shifting the emphasis gradually to light engineering trades was started db.ring the year and new trades like cycle repairing and cycle assembling were introduced. The scop'l of the training programme was also widened by introducing do!llestic science and doll-making for blind women and coir making for blind men. The
· pt>riod of training in the various trades which was hithert<> being followed . uniformally was also rationalised and durations varying from 6 months to 2 years depending on the particular trade were fixed. The Centre had a strength ·of 150 blind men and 35 blind women on its rolls and they were provided
·hostel facilities. Sixty-nine blind men and four blind women passed out of the . _Centre during the year under report.

309
The Model School for the Blind children, Dehra Dun
One of the important units of the National Centre for the Blind, continued to function in accordance with a phased program'llil. The 6th class was adden during the year and the number of children on roll~ increased from 31 to 50.
Sheltered Workshop, Dehra Dun is attached to the Traini11.g Centre for the blind, Dehra Dun. Nine blind workers were provided employment, 4 on weaving and 5 on chair cauning. The workers were provided free furnished accommodation, the services of a cook and free medical aid in addition to their wages.
The Central Braille Press, Dehra Dun, whose main object is to produce Braille leterature in Indian languages, printe_d 32 new titles in Braille in different languages and suitable for various age groups of the blind as agaiust 70 titles brought out since 1957. The press also continued to publish the quarterly journal in Braille, entitled "Alok". Plans for improving the capacity and outturn of this press were in the process of implementation. An agreement was entered into with the UNICEF for the supply of additional machinPry, equipment and Braille paper.
Work;lwp for the Manufacture of Braille Applianr,es, continued to manu{acture and supply at subsidised prioos basic applianoos like Braille slates arithmetic frames, chess boards, etc., needed for the education and welfare of the blind. In implementation of the recommendations made by a United Nations expert in 1961 for the expansion and improvement of the Press, an agreement was entered with the UNICEF for the supply of necessary mnchinery and equipments for the workshop, so ll$ to double the production during the coming years.
The National Braille Library-the only one in the coun~ry was established during the year for lending free of charge the Braille literature with a stock of books published by the Central Braille Press and the valuable collection of books chiefly in English built up by the Training Centre for the Blind !luring the past few years. A substantial number of additional Braille volume~ were donated by the National Braille Library, London. The State Government were also requested to establish a Braille Section in all State Central Libraries, so as to serve effectively the entire Braille reading population of the country.
The training centres for the training of teachers were strength~ned with the addition of three more training centres during the year, t.hus raising the total number of such cent.es to 5.
A School of Photography for the Deaj-wJ.s establiohed in Delhi, dilring the yc_a~, by the All India Federation of the Deaf with the assistanoo given by the Ministry of Education. This was tne first institution of it.q kind in the country.
In view of the inadequacy of existing educational and training facilities fo! mentally deficient children, the Ministry of Education appointed a committee to survey the ex.iRting situation and suggested measure for the developm~nt of existing ~ervice and the establishment of new ones. In pursuaMe of thiB recommendatwn, ,r was decided to undertake a survey cf a few selected sch?ols for boys and girls in Delhi and Bombay in ordor to gnage the incid~nce of 1r.herent mental retardation among school going children. MjB(D)5±MofEdn-14a

310
Under the scheme to establish a network of employmE~nt offices for the phrically handicapped as part of National Employment Service, a special Employment Exchange was started at DE~lhi, the othflr two established previously being at Madras and Bombay. The Madras Employment Office placed 10 blind pllrsous during the year bringing the total to 147 since its inception in 1954 while that of Bombay placed 60 physically hanl].icapped persons bringing to total placements since its inception in March, 1959 to 187. The Special Emplo)ment Exchange at Delhi made 55 placements of physically handicapped persons.
A First National Seminar on the Training and Employment of the Physically Handicapped was convened at Bangalore from 16th to 22nd December, 1961 by the Ministry of Education to suggest a feasible programme for the training and plaooment of the physically handicapped during the Third Five Year Plan. The Seminar was att.ended by 89 deleg'ltes and 9 observers repre-
. senting Central and State Governments, Employee's Organisations, trade unions and distingnished non-officials in the field. The seminar made a number of valuable recommenrlation.q, On the occa11ion of this Seminar, tbe Ministry of Education organised the First National Exhibition on the training and . employment of the physically handicapped.
Under the scheme of assistance to voluntary organisation in the field of the hanrlicapped, grants amounting to Rs. 3·18 lakhs were given. The grants were made for developmental act.ivities through the State Governments. The rules governing these grants to voluntary organisation were liberalised during the year.
The scheme of awarding scholarships to blind, deaf and orthopaedically handicapped students was continued. During the year, 339 fresh awards were made comprising 87 blind, 83 deaf and 169 orthopaedically handicapped students raising the total number of scholarships holders to 998. The total expenditure incurred on scholarships for the physically hanl].icapped during 1961-62 amounted toRs. 3·85lakhs as against Rs. 1·86lakhs in the previous year.
A standing int~r-departmentru committee was appointed with representative from the Ministries of Home Affairs, Health, Labour and Employment, Community Development and Cooperation, and Planning Commission. The main function of the Committee was to evolve, implement and review from t,imE~·to time the progress made in implementation of a coordinated programme for the education and welfare of the handicapped. The Committee at its first mooting hrld on September 15, 1961 made the following recommendations:-
(a) Highest priority should be given to providing an effective information guidance service.
(b) Ministry of H<'alth should provide funds for medical and paramedical services which are essential for certain typa of institutions for the handicapped.
(c) Development of an effective rural service in rural areas for the handicapped PEirBOUS residing in the villages to the facilities availa.1.lr. in the district by the workers such as social education organiP.ers, Mukhya Sevikaa, ero.

3ll
4. Education of the Scheduled Castes, Scheduled Tribes and other Backwar Classes
During the year, the students belonging to scheduled casteg, scheduled tribes and oth~r backward communities continu~d to receive benefi.ts and concessions under various schemes of the Central and State Governments for the promotion of educ:1.tion among these classes. These benefits and the conce>~ions included the award of scholarships and financial concessions, exemption from the payment or re-imbursement of tuition fees, examiu:1.tion aurl other fees, reservation of seats for them in schools, colleges and hostels, op"ning and maintenance of institutions primarily for these classes, providing free lodging, mid-day meals, c.lothing, books, stationeries, etc. Besides, rules regarding admission to crrtain examinations relaxed in their favour were also continued. Some States had separate departments for the welfare of these communities, while in other States special officers we~e appointed for this purpose.
The scheme for the award of scholarships to scheduled castes, scheduled tribes and other backward classes students for post-m1.triculation studies in India was continued to be administered by the State Governments and Union Administratio11s. From 1961-62, a meal1S test as applicable for the 'other back· ward classes' students was introduced for the Scheduled Castes students also. The underlying idea was to get those students accustomed to the economic -criterion of backwardness which is to be eventually adopterl as the basis for the award of scholarships. A sum of Rs. 2·22 crores was placed by the Central Government at the disposal of the State Governments/Union Administrations for the implementation of this scheme. In addition, the State governments utilised funds from their own resources and funds given by the Miniatry .of Home Affairs.
The number of schobrshipo awarded under thi.s scheme to the scheduled oastes, scheduled trib.~s anrl other backward classes students and the exprmditure incurred on each of the three classes during the year is given below.
Number of Expenditure Scholarships incurred
Scheduled Castes • Scheduled Tr.bee . • Other Backward Classes •
Total
Awarded
49.015 8,548
18,114
75,677
Rs. 2,13,89,351
36,77,669 1,01,96,381
.3,52,63,401
The number of scholarships awarded to the students of all the three cla~ses aud the.exp~nditure thereon in the previous year was 63,369 anrl Rs. 2,86,75,716 respectively. These scholarships covered tuition fees and other non-refundable compulsory maintenance charges.
Under tl~e Scheme for Overseas Scholarships for Scheduled Castes Sch~duled Tnbes a~d Other Backward Classes, 14 scholarships wore awarded durmg the year. Nme scholars of earlier batches went abroad durin" 1961-62
"' and 8 returned after completing their studies abroad.

Under the Scheme for Passage Grants for Scheduled Castes, Scheduled Tribes and Other Backward Classes, four students belonging to other backward clas.qes who were in receipt of foreign scholarships without provision for passage, were awarded passage grants. Return passage grants were also given to the three other backward clasf.es students. The total expenditure incurred on both theqe schemes during the year 1961-62 amounted toRs. 1,75,966.
During the year, there were 7,605 educational institutions predominantly meant for scheduled castes, scheduled tribes and oth<>.r backward classes as against 8,112 during the previous year. Besides, students bP.longing to scheduled castes, scheduled tribes and other backward clas.'!CS were also admitted in other institutions. The total enrolment of students belonging to these classes in all institutions was 1,93,66,290 (1,41,77,027 boys and 51,89,263 girls) as against 1,57,53,588 (1,17,34,975 boys and 40,18,613 girls) in the previous year. The total expenditure incurred on institutions meant for these classes amounted to Rs. 2,55,77,281 showing an increase of Rs. 23·2lakhs over the previous years' figure. Of the total number of scheduled castes, scheduled tribes and other backward classes students, 23,49,101 (18,29,875 boys and 5,19,226 girls) received scholarships, stipends and other financial concessions of the total value of Rs. 12,12,54,724. The corresponding figures for the previous year were 12,19,603 and Rs. 7,78,18,494. Besides, a great majority of these students also rer.eived full or partial free studentships.
The State-wise details of statistics of tlduoation of students belonging to these classes are given in table CXXV.
6. Education of Girls
Recognising the difficulties in bringing girls to schools in sufficient numbers and the need for removing or at least reducing substantially the disparity b, tween the enrolment of boys and girls, a programme was finalised on the lines of special programme recommended by the National Council for Women's Educat.ion. It provided for schemes to serve as incentives for expanding enrolment of girls and increasing the supply of women teachers in addition to the normal programme for expansion and improvement of education. These incentive programmes consisted of special inducement such as attendance schola.r~hips, stipends, subsidised transport for girls, clothing, etc. Other measures &rtopted in order to attract a larger number of women teachers provided for village allowanr.e or quarters for women teachers, condensed educational courses for adult women, scholarships and stipends for teacher training etc. A sum of Rs. 12 crores was set apart for implementing the special incentive programme.
The National Council for Women's Education was reconstituted during the year. Two meetings (the Third and the Fourth meetings) of the Coun~.il were held during the year.
At the Third meeting, the Chairmen of the State Councils and officers dealing with Girls' Education programmes in the States were also invited. Some of the major recommendations related to (i) Continuing the speoial programme for the education of girls as a Centrally sponsored scheme in the Third Plan ; (ii) fixing the targets for boys and girlB in respect of each scheme in the

Table CXXV-Statistics of Education of the Scheduled Castes, Scheduled Tribes and Other Backward Classes
Number of Total Ex- Total Ex. Insti t ut!on1 Total Number of Pupils_ Number of Pupils getting Scholarships penditnre penditnre
StatejTenitory Specially etc. on Scholar- on insti-meant for ships, Stipends tutions
Scheduled Boys Girls Total Boys Girls Total and other specially Castes eto. Financial meant for
Concessions pupils belonging
to Scheduled Casteaeto.
1 2 3 ' IS 6 7 8 9 10
Andhra Pradesh 14,97,674 7,95,946 22,93,620 1,38,925 37,8ll 1,76,736 1,07,52,933 Assam 6,21,422 3,35,034 9,56,456 51,396 15,870 67,266 42,43,588 Bihar 2,094 22,94,042 4,49,505 27,43,547 96,821 13,057 1,09,878 1,24,95,581 24,03,958 Gujarat 5,47,629 2,29,145 7,76,774 39,901 8,054 47,955 38,41,094 Jammu and Kashmir 25,39\l 3,698 29,097 1,752 264 2,016 1,58,343 Kerala 8,39,598 6,45,540 14,85,138 1,71,332 1,;19,870 3,ll,202 68,16,012 c.:> Madhya Pradesh 1,534 6,61,187 1,15,340 7,76,527 1,72,026 30,471 2,02,497 61,23,341 64,21,592 ...... Madras 1,155 19,01,331 10,37,054 29,38,385 91,313 26,163 1,17,476 1,20,30,100 47,57,737 c.:> Muharashtra 12,91,327 5,30,638 18,21,965 4,19,0ll 90,635 5,09,646 3,4 7,13,397 Mysore 19 1,74,942 82,475 2,57,417 17,908 7,158 25,066 15,49,946 2,35,854 Orissa 7,38,461 2,60,885 9,99,346 3,59,803 1,17,739 4,77,542 57,29,699 Punjab 13 4,66,8:)3 1,44,524 6,l1,417 46,593 2,658 49,251 48,96,451 81,028 Rajasthan 3,09,283 23,208 3,32,491 34,148 1,541 35,689 9,59,336 Uttar Pradesh . 603 18,56,043 2,21,101 20,77,144 1,08,580 9,431 1,18,0ll 94,74,832 11,09,516 West Bengal 7,35,938 2,24,876 9,60,814 35,375 7,398 42,773 49,II,290 A. & N. Islands 130 4,922 2,745 7,667 8,45,519 Delhi 71,592 28,629 1,00,221 26,756 6,668 33,424 15,41,223 Himachal Pradesh 18,II8 3,506 21,624 2,248 294 2,542 97,307 L.M. & A. Islands 35 3,019 1,676 4,695 22 6 28 4,184 3,00,403 Manipnr 1,300 36,902 18,129 55,031 5,904 2,428 8,332 3,06,666 32,98,969 Nagaland 556 N.A. N.A. N.A. N.A. N.A. N.A. N.A. 47,15,849 N.E.F.A. 165 6,830 1,065 7,895 6,370 811 7,181 3,87,184 13,41,804 Pondicheny 26,644 12,780 39,424 Tripura 47,831 21,764 69,595 3,691 899 4,590 2,22,217 65,052
India/Total 7,605 1,41,77,027 111,89,263 1,93,66,290 18,29,875 5,19,226 23,49,101 12,12,54, 724 2,55, 77,281

314
General Development programme; (iii) providing adequate and proportionate funds in the Third Plan for the special programmes for girls' education; (iv) revising the Plan provisions and taking suit.able action froll! the second year of the Plan to expand specially those facilities which aim at enlarging the supply of women teachers and encouraging them to accept service in rural areas.
The Fourth meeting of the National Council for Women's Education (January, 1962) further reviewed the programmes and financial provision made for girl~' education. The main items discussed were: fixation of separate target for girls and boys for each year; provision of facilities for continuation classes and part-time instruction for girls; measures for increasing the supply of women teachers; provision for Centra.lly sponsored scheme for hostels for girls at the middle and ~condary stages; and the scheme of assistance to voluntary organisations in the field of girls' education. The Council recommended the measures for increasing the enrolment in middle schools, pre-selection of girls at the secondary stage, for future training as teachers, provision of scholarships, condensed courses and teachers' quarters. A programme of action for State Councils was approved.
On a suggestion made by the Council, seminars of women social workers were being organised in all parts of the country with a view to launching a drive for increasing the e1).l'olment of girls. Seventeen seminars were proposed for the country as a whole; of these 13 were organised during the year.
The f'..entrally sponsored scheme for the expansion of girls' education and training of women teachers at the elementary stag9, initiated in 1957, was located in the State sector in pursuance of the general principle to put in the State sector the schemes that are to be executed by the States. The special programmes included were treated as Centrally assisted with 100 per cent assist.ance. The State Governments were request.ed to review the position and to make adequate pro-ruion both in the general and in the special programmes from the year 1962-63 onwards.
During the year under review, the total number of girls under instruction in girls' a~ well as boys' institutions (including co-educational institutions) increased from 1,42,59,505 to 1,68,26,276 i.e., at the rate of 18·0 per cent. The number of boys on rolls in these institutions increased from 3,37,04,897 to 3,74,55,166 ('i.e., by 11·1 per cent). However, there were only 45 girls in educational institutions to every 100 boys enrolled. The corresponding proportion in the previous year was 42 to 100. There was thus a slight improvement in the enrolment of girl<! over the previous year's figure. Although the over-all expansion was greater than the original targets, tho increase in the enrolment of girls did not keep pace with the general increase, thus under-lying the need for further and more intensive efforts.
Of the total number of girls more than two-thirds (68·9 per cent) were studying in institutions for boys, while the rest were in institutions exclusively meant for girls. By type of education, details regarding girls' enrolment were : general education 94·4 per cent, special education 4· 9 per cent, and professional an:d technicaleducation 0·7 per cent. The corresponding figuresforboys were: general education 93 · 5 per cent, special education 4 · 9 per cent, and professional and technical education 1· 6 per cent. The detailed break-up of total onrolment1 according to stages and types of education is given in table CXXVI.

Table CXXVI-Distribution of Girls and Boys in Recognised Institutions
Subject Number of Girls on rolls Inoresse ( +) Percentage Number of Boys on rolls Increase ( +) Percentage or Increase ( +) or Increase ( +)
1960-61 1961-62 Decrease(-) or 1960-61 1961-62 Decrease (-) or Decrease(-) Decrease(-)
2 3 4 6 6 7 8 9
A. General Education : Pre-Primary 82,122 93,631 + 11,509 + 14·0 96,520 1,22,686 + 26,166 +27·1 Primary 1,09,44,051 1,26,10,907 +16,66,856 + 15·2 2,26,87,340 2,49,67,222 +22,79,88:! +10·0 Secondary 26,27,573 30,02,317 +3,74,744 + 14·5 83,14,720 92,33,349 + 9,18,629 +11·0 Intermediate 76,517 77,021 + 504 + 0·7 3,81,384 3,68,824 12,560 - 3·3 B.A./B.Sc. 63,379 80,715 + 17,336 + 27·4 2,35,633 2,81,950 + 46,317 +19·7 M.A./M.Sc. 9,215 10,763 + 1,548 + 16·8 36,873 40,945 + 4,072 +11·0 Research 768 779 + 11 + 1·4 3,879 4,178 + 299 + 7·7 Post Graduate Diploma 12 31 + 19 +158·3 365 322 43 -11·8
Total 1,38,03,637 1,58,76,164 +20,72,527 + 15·0 3,17,56,714 3,50,19,476 +32,62,762· +10·3 <:.>:> .... B. Professional Education: (Collegiate) 01
Agriculture & Forestry 149 184 + 35 + 23·5 16,575 19,461 + 2,886 +17·4 Commerce . . . 864 1,015 + 151 + 17·5 77,448 87,458 + 10,010 +12·9 Engineering & Technology 374 431 + 57 + 15·2 47,464 53,989 + 6,525 +13·7 Law . • • 805 805 26,336 27,415 + 1,079 + 4·1 Medicine and Veterinary Scie~ce 8,285 9,48~ + 1,201 + 14·6 37,662 41,104 + 3,442 + 9·1 Physical Education 159 197 + 38 + 23·9 745 819 + 74 + 9·9 Teachers' Training 15,202 17,449 +2,247 + 14·8 31,606 35,112 + 3,506 +ll·1 Others • • 286 322 + 36 + 12·6 1,151 1,337 + 186 +16·2
Total 26,124 29,889 +3,765 + 14·4 2,38,987 2,66,695 + 27,708 +ll·6
C. Special Education (Colleg;ate) : Home Science and Needlework 2,422 2,166 256 - 10·6 Music, Dancing and Other Fine ~ta 3,499 3,928 + 429 + 12·3 2,819 3,142 + 233 +11·5 Oriental Studies 959 1,207 + 248 + 25·9 8,427 9,087 + 660 + 7·8 Sociology 208 276 + 68 + 32·7 762 998 + 326 +31·0 Others 267 836 + 569 +213·1 2,492 2,345 147 - 5·9
Total 7,355 8,413 + 1,058 + 14·4 14,500 15,572 + 1,072 + 7·4

Table CXXIV-Dist~ibution of Girls and Boy~ in Recognised Institutions-(Contd.)
Subject Nmnber of Girls on rolla Increase (+) Percentage Nmnber of Boys on rolla Increase ( +) Percentage ' or Increase ( +) · or . Increase ( +)
1960-61 1961-62 Decrease {-) or 1960-61 1961-62 Decrease{-) or Decrease(-) Decrease(~)
1 ll 3 4 5 6 7 8 9
D. Professional and Technical Education (Schools):
+ 9·1 Agriculture and Forestry 74 156 + 82 +110·8 7,832 8,642 + 710 Commerce • • .- 17,034 13,828 3,206 - 18·8 95,790 67,529 28,261 -29·5 Engineering, Technology and Arts & Crafts • .· 29,548 31,028 + 1,480 + 5·0 1,32,448 1,57,452 + 25,004 +18·9 Medicine and Vety. Science 6,536 7,334 + 798 + 12·2 5,300 6,050 + 750 +14·2 Physical Education 515 500 15 - 2·9 2,929 3,030 + 101 + 3·4 Teacher's Training 31,552 38,295 + 6,743 + .21·4 91,130 1,01,626 + 10,495 +11·5 Others 290 264 26 - 9·0 4,069 3,663 406 -10·0 e.:
Total 85,549 91,405 + 5,856 + 6·8 .....
3,39,498 3,47,891 + 8,393 + 2·5 ~
E. Special Education (Schools) : Music, Dancing and Other Fine Arts 10,334 10,685 + 351 + 3·4 7,638 7,122 516 - 6·8 For the Handicapped , 1,829 2,007 + 178 ·+ 9·7 5,728 8,274 + 2,546 . +44·4 Oriental Studies 16,107 18,967 + 2,860 + 17·8 1,32,627 1,36,288 + 3,661 + 2·8 For Social Workers 638 459 179 - 28·1 3,439 2,783 656 -19·1 Social (Adult) Education 3,01,077 7,80,554 +4,79,477 +159·3 11,93,629 16,38,594 +4,44,965 +37·3 Reformatory . . . 1,572 1,895 + 323 + !l0·5 6,790 6,294 496 -7·3 Others (Including Home Science) 5,283 5,838 + 555 + 10·5 5,347 6,177 + 830 +15·5
Total 3,36,840 8,20,405 +4,83,565 +143·6 13,55,198 18,05,532 +4,50,334 +33·2
Grand Total 1,42,59,505 1,68,26,276 +55,66,771 + 18·0 3,37,04,897 3, 7 4,55,166 +37,50,269 +11·1

During the vear, the number of recognised in'>titutions for girls increased from 41,674 to 1,16,150. Their distribution among different ~ypes. of institutions was as follows :-(figures in brackets relate to 1960-61) UruversJt.y 1(1), arts and s0ience colleges 181 (165), professional coll~ges 1?6 (97), spec!al education colleges 26 (21), high and higher secondary (mcluding post-basw) schools 2,784 (2,521), middle (including senior basic) schools ~,150 (4,666), primary (including junior basic) schooL<> 22,057 (19,829), pre-pmn:ary schools 296 (230), vocational and technical schools 897 (858), adult educatiOn . centres 84,505 ( 13,143) and special education schools 14 7 (143). The total expenditure. on these institutions for girls amounted to Rs. 39,10,83,119 as agalllRt Rs. 33,61,01,772 in the previous year, an increase of 16·3 per cent.
The number of girls passing the matriculation and equivalent exami.rw.tiomi during 1962 increased from 1,13,966 to 1,30,514 and that of passing the hig?er secondary school examination increased from 10,290 to 16,112. T~e o~tpt:t of grrls in pre-university, intermediate, degree and post-graduate exammatwns IS shown below:
Examination
Pre-University (Arts and Science) Intermediate (Arts & Science) B.A. & B.Sc. M.A. & M.Sc. Professional Subjects (leading to degrees and equi
valent diploma~)
6. Physical Education and Sports
1960-61
19,180 22,893 22,295
5,115
6,400
1961-62
28,991 18,627 25,148 5,626
8,189-
Phy$ical educJ.tion which is accepted as an essential and integral part of education continued to receive due attention in educational institution<>. Physical education and sports were included as a part of school curriculum from the primary to the secondary stage. In several universities also it was compulsory in the first two classes for those who were not in N. C. C. In moat of the institutions, there were physical training instructors on the staff for such activities. Physical education covered mass drill, games and sports, gymnastics and atheletics. Arrangements for games like hockey, cricket, volleyball, etc., existed almost in all secombry schools and colleges. Annual inter-school and inter-collegiate tournaments were conduct<'d in all the States. Besides, various sports organisations did useful work for the promotion of physical educat.iou among young boys and girls. Shortage of staff and paucity of playgrounds, however, continued to be the main handicap in the way of an efft•ctive programme of physical education.
Training-During the year 20 colleges and 43 schools (excluding gymnasia) provided facilities for the training of physical imtructors in the country. Detaill'd sbtisties of thP-se institutions have been given in Chapter VIII.
• During the year under review, which was the first year of the Third Five 1ear Pla.n, steady progress of the Central Schemes in the fiEld of physical education was maintained as indicated below. The main object of the schemes in thi~
318
:field being to consolidate and extend the programme initiated in the Second Five Year Plan, most of the schemes included in the previous lJlan continued.
(i) Lakshmibai College of Physical Education, Gwalior-With the expansion in its construction programme, the Lakshm.ibai College of Physical Education, Gwalior, which was set up by the Government of India in 1957 to provide training facilities for a 3 year Degree Course in physical education, improved upon its facilities. The college opened admission to girl students for the first time since it started functioning. ·
(ii) Grant-in-aid to Private Physical Education Training InstitutionsUnder the scheme of strengthening of physical education training institutions which aimed at assisting these institutions by payment of non-recurring grants upto 75 per cent for the improvement andfor development of their facilities, i.e., development of play grounds, construction of gymnasia, hostels, etc. etc. Rs.· 1,17,500 lakbs were sanctioned to 8 institutions during 1961-62.
(iii) National Physical E.J!Wiency Drive-The pattern of implementing the Scheme of National Physical Efficiency Drive which was first launcned by Government of India in 1960 to make the country :fi.tnes~ conscious, was reviewed in consultation with the representatives of the State Government and others. To ensure uniformity and to build up a nucleus of better trained personnel to man the testing centres, three day orientation courses were organised by the State Governments with the assistance from Government of India. During 1961-62, tests under the Drive were conducted at over 1,000 Testing Centres involving about 1,60,000 participants and 80,000 winners. This registered considerable improvement over the previous Drives.
In view of the national importance of the Scheme, the Government of India instituted 'National Awards' in Physical Efficiency through an All India Competition to be held annually for those persons who reveal proficiency of a very high order in their physical ability. Seven persons including 2 women won the National Awards for 1961 Drive.
Scholarships for Higher Studies in Physical Education Under this scheme, three scholarships at the rate of Rs. 200 per mensem
each for a period of one year (1961-62), were awarded for specia.lisa.tion in Yoga, Wrestling and Folk Dance.
Promotion of Yoga The Committee of medical experts which had been set up by the Govern
ment of India to evaluat~ the therapeutical claims of Yoga and recommend measures for the scientific development of the institutions engaged in these activities submitted its report. The implementation of the Committee's recommendation was taken up with the Ministry of Health.
Grants amounting Rs. 81,250 were paid to two Organisations K. S.M. Y. M. Samati, Lanavala and Vishwayatan Yoga Ashram Vashnav Devi-for the promotion of Yoga.
(iv) Central Advisory Board of Physical Education and Recreation-The Board was reconstituted to make it more broad-based by providing representation inter-alia to all State Governments. The first meeting of the reconstituted Board was held in December, 1961. The Board set up several sub-committees

319
to examine in detail important subjects like the place of physical education in the school curriculum, ways and means of improving the _quality ?f training ?oll:ges in this field the oruanisation of research, the promotion of smtable publicat10ns and the or~anisat~n of departments of recreation in selected institutions.
Sports (i) National Institute of Sports-The National Institute of Sports set ul? by
the Government of India with the main object of training coaches in vanous branches of sports and games that started functioning on 20th March 1961, continued its trainina. The institute requisitioned for its staff, the services of seven competent for;ign coaches in seven selected games while hockey was manned by a well-known Indian Coach. The first ad-hoc trainin~ course, of 6 months' duration, started on 20th March, 1961 was completed in October, 1961 and imparted training to 132 coaches already working in tbe }'rofession, in Hockey, Wrestling, Volley-ball, Gymnastics, Crickets, Atheletics and Football. At the second adhoc course which commenced on 3rd November, 1961 and admitted 146 trainee&, Badminton was an additional item. Besides, practical and theoretical lessons in the gamesfsports concerned, training was also given in scientific principles of coaching, psychology of coaching, health and hygiene, physiology, anatomy, physio-therapy and first aid ;
National Coaching Schemes
The Raj Knmari Sports Coaching Scheme was merged into the National Institute of Sports with effect from 1st October, 1961. With the merger of this scheme, the National Coaching Scheme has come into existence. All the staff trained at the first ad hoc Course of National Institute of Sports was taken over as coaches on the Institute's pay roll. During the year 1961-62, a sum of Rs. 8,57,250 was placed at the disposal of the institute for this scheme.
Assistance to National Sports Federation/Associations
Grants amounting toRs. 2,88,000 were paid to various National Sport Federations/Organisations for holding national championships, tournaments, organising training camps, participation of Indian teams in international meet, the deputatio~ of Indian teams abroad, visit of foreign teams to India, purchase of sports eqllipment, etc. .
Construction of Stadia
Grants amounting to R~. 2,11,230 were paid to the State Governments of Andhra Pradesh, Bihar, Kerala, Madras and West Banual towards the share of Central Assistance for the construction of a stadia a,;d shooting· ranges. All India Sports Council
On the advice of the AU India Council for Sports, the first All India Sports Congress was convened by the Government of India from 12th to 14th March 1962 at which various questions pertaining to the administration of sports ~ the cou?-try wer~ discussed. The congress was attended by the members of the AU India Counml of Sports Board of Governors of the National Institute of Sports, the presidents and secretaries of the national sports federation and the State Sports Councils, prominent sports writers and noted sportsmen. The rerort of the Congress was being examined by the AU India Council of Sports.

320
Arjuna Awards to Selected Sportsmen o! the Year
On the advice of the All-India Council of Sports, the Government of India approved a srheme for honouring selected sportsmen of the year in each major game by the grant of special award called the "Arjuna Award". Twenty Arjuna Awards for the "Sportsmen of the Year 1961" were conferred on selected sportsmen by the Vice President on 14th March, 1962. The occasion synchronised with the All India Sports Congress.
National Discipline Scheme The National Discipline Scheme aimed at making the youngilr generation
healthy in mind and body and instilling in them a sense of patriotism, self-reliance, tolerance and self-sacrifice and inculcate among th~ students a spirit of nationalism, a sense of India's unity, consciousness of good citizenship, and desire to serve the cOlmtry disinterestedly, through a programme of physical training, mental training, training of cult.ural development, etc. The scheme was operating in the States of Jammu and Kashmir, Gujarat, Kerala, Madhya Pradesh, Maharashtra, Mysore, Punjab, Rajasthan, Uttar Pradesh, West Bengal, A. & N. Islands, Delhi and Himachal Pradesh. The number of institutions covered and the children receiving training under the scheme WM
2,100 and 12,00,000 respectively. The corresponding figures for the previous year were 2,100 and 13,01,612 respectively. During 1961-62, a sum of Rs. 45,69,000 was spent on the scheme.
· The Central Training Institute established in October, 1960 at Alwar, with a view to imparting a uniform and systematic intensive training toN. D. S. instructor-trainee, trained 12,000 instructor-trainees during the year under report.
'1. Youth Welfare
The various programmes of Youth Welfare which aimed at inculcating the spirit of nationhood in the youth and promoting inter-State understanding among them and providing welfare services to those youth who were not attending educational institutions, continued to make steady progress during the year. A total provision ofRs. 14· 30 lakhs was made during 1961-62 for carrying out the activities,. a brief account of which is given below:
Youth Festivals After the break of one year in the series, the Government of India held the
Seventh Inter-University Youth Festival in New Delhi from October, 25 to 31, 1961 in which 36 Universities participated. The objectives as well M the pattern of the Festival were considerably revised with greater emphasis laid on intellectual debates than on artistic performances. The total number of participants at the Festival was 796 and an amount of Rs. 1,72,126 w~ srx;nt at this FestivaJ. To select candidates for participation in the Inter-Uruvers1ty Youth Festival a number of Inter-collegiate youth festivals were organised by the individual universities. During the year 1961-62, grant amounting of ~. 16,402 was given to various universities for conducting these festivals.

321
Youth Leadership and Dramatio Training Campa
One Youth Leadership Training Camp was organised at Peermede during March 1962 involvinu an expenditure of Rs. 10,000. This amply-fulfilled the purpo;e of giving a sh~rt-term training to teachers o~ ~ive~sities and. colle~es i~ the techniques of cond~t~ting Youth Welfare Act~vttJes .~ educatron~l mst~tutions. Some univorsrtres held Youth Leadershrp Trammg Camps m therr own universities for which a sum of Rs. 37,802 at the rate of 75 per cent of the Central Assistance was given by the Government of India. An amount of Rs. 35,000 was spent towards short term training camps for the benefit of University teachers.
Students' Tours During the year, the application of the scheme of providing educational
Msistanoe to batches of the students in ,:various educational institutions through the State Government for visiting places of historical interest, science beauty and architectural grandeur was limited to the students studying in the Union Territories. The Government of India gave grants to meet. full third class rail and/or bus fare in such oases. Grants amounting to Rs. 66,305 were sanctioned to 35 institutioM. 1,027 students and 87 teachers were benefited by these . grants.
Youth HostelJ
This Scheme aimed at encouraging hiking by providing cheap accommodation to young people. Grants amounting to Rs. 80,000 were sanctioned to State Gowrnments of Andhra Pradesh, Orissa and West Bengal to set up one Youth Hostel in each State. Jk>Rides, a grant of Rs. 15,000 was given to the Youth Hostel Association of India to meet 50 per cent of their administrative expenditme for the current year.
Youth Welfare Boards and Committees
Substantial progress was made in this scheme which aiJll-3 at helping the universities by way of 50 per cent financial contribution towards the administrative expenditure to Eet up a separate committee on Youth Welfare. During the year, Rs. 22,018 was sanctioned out of a provision of Rs. 40,000 to the 8 Universities for setting up such Committees in their respective universities.
Non-Students' Youth Clubs and Centres
Under this scheme, registered youth clubs and organisations, devoted to the welfare of non -students were offered assistance for the purchase of equipment, etc., to meet 50 per cent of the approved expenditure, subject to a ma:rimum of Rs. 6,000. This scheme, however, did not receive much response from the public and only one institution, Friends's Union Club, Imphal, was found eligible to receive financial assistance and was sanctioned a. sum of Rs. 1,155 out of the budget provision of Rs. 95,000. The scheme has since been abandoned due to poor respo!llle in 1962.
National Project for Child Welfare-Bat Bhavan and Children's Museum
The Bal Bhavan was set up by way of providing adequate facilities for the welfare of the children. A suitable building for the purpose was constructed .

322
A grant of Rs. 3,06, 764 was ·sanctioned to Bal Bhavan Board during the year which also included Rs. 2,00,000 towards the construction of the building only.
The National Children Museum, which is a supplement to Bal Bhavan for the welfareofthe children, received during the year, as a gift from the Polish Embassy, the structural material and some furniture which were in the Polish Pavilion at the Industries Fair. A sum of Rs. 71,000 was sanctioned towards dismantling this pavilion and to meet expenditure on day to day administration of the Museum during the year. The National Children's Museum agreed to "play host" to the Children's Ca.rnival spousored by the Museum of Modern Art, New York which was presented to Indian Children by Mrs. Kennedy during the recent visit to the Capital. .
Labour and Social Service Scheme The Labour and Social Service Scheme which was operated in the first two
plaus was continued during the year, the first year of the Third Five Year Plan. The scheme was implemented in two parts (a) Labour and Social Service Camps and (b) Campus Works Projects. The Labour and Social Service Camps aimed at inculcating a sense of dignity of manual labour among the students and other youths and giving them an opportunity to get into contact with village life and conditions and offer 'Shramdan' for the improvement of existing amenities in the rural areas. A number of camps of 10 to 30 days' duration were conducted in villages at which the campers offered 'Shramdan' on small works e.g. repair and construction of approach and link roads, village tankR, levelling of play-grounds, repair and construction of village school buildings and Panchayat Gkars, digging of soak pits, manure pits and wells, etc. The girl campers rendered environmental services e.g. personal hygiene, home nursing, child care, care of sick, sewing and tailoring, planning and repair of kitchens and kitchen gardens, etc. A sum of Rs. 12 · 77 lakhs was sanctioned to various agencies, that is, Bharat Sevak Samaj, Bharat Scouts and Guides, the N.C.C. Directorate (for A.C.C. Campers), State Governments and Universities for conducting 1,486 camps in which 1· 24 lakhs campers participated.
The Campus Works Projects provided the much r>eeded physical and recreational amenities in educational institutions. Under this scheme, at least 5 per cent voluntary labour (Shramdan) to be rendered on the project by the students themselves was compulsory. The Government grant was limited to 75 per cent of the oost of the project subject to certain ceilings for each project which included recreation hall-cum-auditorium, gymnasia, small-stadia for SlJectators round the sports arena, open air theatres, pavilion and 400 metre oval cinder tracks for track events. The grants were paid in instalments, depending on the progress of construction. During the year, a sum of Rs. 19,53,999 was sanctioned. The amount covered first instalment of grant for 44 new projects approved during the year and 2nd, 3rdand4th (orfinal)instalmentsoftheprojectsa.pyroved during the years 1954-55 and 1957-58 to 196D--61 but still under construction.
8. Scouting and Guiding
Bharat Scouts and Guides a voluntary organisation that is recognised by the Government for the promotion of Scouting and Guiding, continued to reoeive grants for its various activities from the Central Government. Financial

a9sistance to the extent of Rs. 4,75,000 was given to it during the year for holding of tra,ining camps, National Jam?oorees, purchase o~ .ca.~pit1~ equipment, deputation of Indian Scouts and Gmdes abroad for partrctpatwu m the Internation >l meets and invitinrt forei.,.n Scouts and Guides, establishment of the National Training Centre ~t Pachmarhi, construction of the National Headquarters building3 at New Delhi, establishment of the Asian Centre (Guides). at Poona, etc. ·
That the Scouting and Guiding movement made rapid strides d~ring the year will be evident from the fact that the number of Scouts and Gurdes was 6,49,860 in 1961-62 as against 1,72,615 in 1960-61.
The Bhara.t Scouts and Guides which aim at promoting discipline and a spirit of selfless service continued its various activities, a brief account of which is given below :-
Training
The All-India Training Centre at Pachmarhi and the various State Training Centres all over the count.ry continued to provide training to the leaders of both Scouts and Guides. Over 416 ScoutsjGuides attended the Himalayan Wood Badge Cour~es. The Guide Section arranged to break up new grounds by running Mom1taineering Training courses at Pachmarlti with the support of the Mountaineering Institute of Darjeeling. A Handicraft Training Course, the first ever for Guides, was also run at Pachmarhi.
International Events
With the cooperation of the Far East Boys Scouts Regional Office, a Fifth Far East Trainit~ Team Course, the first such course in this country, was held at the National Trainmg Centre, Pachmarhi, from 11th to 16th November, 1961. The cour~e was attended by 45 Deputy Camp Chiefs and Assistant Deputy Camp Chirfs from different parts of India.
Conferences
The National Executive Committce met twice on 26th April, 1961 at the National Headquarters and later in Calcutta on 27th October, 1961. The National Council also met at Calcutta. on the 28th and 29th October, 1961.
Third All India Guide Training Team Conference
The Conference was held at Pachmarhi. Eight States were represented at this conference with fifteen attending. Among the subjects discussed at this conference were the syllabus for President's Guides, Handicraft in training Flock Leaders, Air Rangers and Sea. Rangers, Revised Second Cla.s~; test fot Guides, Mountameering Course and Publication of Ranger Handbook and Ranger Journal.
President's Scouts' and President's Guides' Rally
At a. Rally of the Bharat Scouts and Guides held on 28th November, 1961 certificates were diFtributed by the President Dr. Ra.dhakrishnan, who is the P~tron of Bharat Scouts and Guides, to Scouts and Guides who after getting Ftrst C.lass Badge also won badges for service and promised to render service where 1t was demanded or necessary ... The President dill a great honour to 1 B( 1 l)5l:UufE<lucatian-25

324
Bhara.t Scouts a.nd Guides by giving his consent to call the Scouts and Guides of highest rank a.nd calibre as "President's Scouts" and "President's Guides" and also the Ashoka. Crest for the President's Scouts/Guide Badge. A camp fire programine was also arranged ·at the end ·of the day .
. Sea Scouts
The number of the Sea Scout Groups a.t Andhra Pradesh, Kerala, Madras, Rajasthan and West Bengal reported an increase. . The total number of Sea Scouts during the year was 222.
Am Scouts
Lack of opportunities and necessary facilities continued to hamper the development of Air Scouting. There was, however, a. slight increase in the number of Air Scout Groups. The appointment of Headquarters Commissioner for air Scouts in some States led to some interesting and encouraging developments. The total number of Air Scouts was 75. '
Handicapped Scouts and Guides Owing to-the appointment of Headquarters Commissioner in some States,
the enthusiasm•of the boys/girls either sightless, deaf, dumb, leper or handicapped for scouting and guiding continued unabated as it helped them feel wanted, to have an incentive to do things for themselves to remove them from a feeling of isolation and associate themselves with others as much as their conditions permitted. Continued good work was reported with ScoutfGuides groups in the leper asylum, Amraoti, Madhya Pradesh and at the leper school at Purulia, West Bengal.
Social Service In addition to the traditional• services at tho time of fairs, melas, showR,
etc., a band of more tha.n 550, Rover Scouts and 50 Guides coming from all parts of India. rendered the most outstanding service at Kumbha Mela at Hardwar. Their work included regulating the crowd, controlling traffic, tracing lost children and lost property, giving first aid and saving from drowning and fire. The relief work done at Kerala, Poona and Bihar among the flood victims had also been considerable a.nd fruitful.
Social Service a.nd Labour Camps were held in various States to achieve plan targets. A camp was held at Beelwari- (Rajasthan) and was attended by 99 Scouts. The scouts offered 'Shramdan' by constructing a road, cleaning surroundings and tops of wells, removing large amount of rubbish and uprooted trees, herbs and shrubs and cleaning the road leading to Beelwar from the main road. Various talks and discussions with villagers were held and utility of 'Shramdan', adult education, cooperative business, college industries and living a. neat and clean life were emphasised.
Awards A number of awards were given to members of the movement by the
National Commissioner in consultation with the National Executive Committee. In recognition of their services of the most exceptional character, the 'Silver Elephant' award was given to three persons, 'Silver Star' to five persons on recognition of speciality distinguished and continuous service for twenty years and a gilt medal to one person for gallantry.

325
Publications The "Bharat Scouts and Guides", the official journal of the Association,
continued to be published. The States continued to bring out their own magaaines and periodicals.
9. National and Auxiliary Cadet Corps
Under the N.C.C. scheme for imparting military training in B<'bools and colleges, there was a substantial incruse both in the strength and quality of all the wings of the National Cadets Corps and Auxiliary Cadet Corps. An account of these is given below :
Strength
The strength of NCC increased from 5,611 officers and 2,70,436 cadets to 6,107 officers and 2,98,397 cadets,.giving an increase of 9·0 per cent in the officer-cadre and 10·3 percent among the cadets. The NCO Rifles during the year consisted of 1,400 officers and 2,80,000 cadets while the Auxiliary Cadet Corps consisted of 30,214 officers and 12,12,840 cadets. .
Training of N.C.C. Otllcers (a) Army Wing : With a. view to imparting intensive training to NCG
officers and improving the standards in the NCO, an NCO Academy was ~tarted at the historic fort of Pura.ndhar near Poona where selEcted tC!Lchers of the Senior Division NCC who are commissioned after short pre-commisf:ion training at Kamptoo, are given training for a period of six months, and the fresh entrants are given training for nine months. At the fust pre-commission course of nine month~' duration that was started on 5th November, 1961, 52 cadet officers were undergoing training while 141 NCO and NCO Rifle officers joined this course for 6 months' training on 7th February, 1962. At the NCO officers' training school, Kamptee, 923 officer cadets (including 81lady officer cadets) completed pre-commission training while 810 NCO office;s (including 57 lady officers) attended refresher training courses.
(b) Naval Wing : 15 Senior Division and 43 Junior Division Officercadets completed their pre-commission training at INS Venduruthy, Cochin. In addition to this, at the same establishments, 5 Senior Division and 36 Junior Division officers attended refresher eourfes.
(c) Air Wing : 17 Senior Division and 53 Junior Divi8ion officer-cadets received pre-commission training at the IAF Station, Hyderabad. Besides, 17 Senior Division and 69 Junior Division officers attended refresher coursell at the same station.
Camps
Camps formed an essential part of cadet training. These camps were of various types and each type was designed to serve definite objectives. An account of these camps is given below :
(a) Annual Training Camps: At the 221 training camps held, over two lakb;; of officers and cadets (3,796 officers and 1,99,028 cadets) participated.
(~) Social Se-rvice Ca.rnps: During the year, 23 social service camps were orgamsed. 487 officers and 17,036 cadets participated in these camps. In MJB(JJ)U4Muffi<lucatinn-25(a)

326
addition, 30 lady officers and 878 girl cadets attended 7 social service camps. Male cadets worked mostly in community development areas and assisted in constructing rural roads, desilting tanks and improving irrigation channels. The girl CJ.I.dets helped village families in home nursing, child care and general education.
(c) All India Summer Camps : To allow cadets an opportunity of bringing, training and mixing with cadets of neighbouring states, 8 all India summer camps were organised-4 for boys and 4 for girls two each at Khadak Vasla, Guara Hills, Wellington (Nilgiris), Subathu and Paha.lgam. 40 officers and 2,095 cadets of the Senior Division (Boys) and 67 officers and 62 cadets of Girls' Division (Senior Wing) participated in them.
(d) Advance Leadership Camps: During the period under review, 8 advance leadership camps of 17 days' duration each were held for 16 officers and liB cadets. Thfse camps were held at Mahabaleshwar, Kodaikanal, Darjeeling, Chakrata, Dalhousi, Happy Valley, Shillong, Mount Abu and Pahalgam. In these camps emphasis was laid on trekking, long range patrolling and outdoor exercises. Training in basic military subjects was also imparted.
(e) Naml Wing Camps : 4 annual training camps of the Senior Division Naval Wing Units were held at Cochin, Visakhapatnam, Jamnagar and Digaru (Assam) in which 46 officers and 2,640 cadets, participated. 8 Camps of the Junior Division Naval Wing Units also were held at various places in which 113 officers and 4,867 cadets participated.
(j) Air Wing Camps: 2 combined Senior Division Air Wing Camps were held at Kanpur and Bangalore. Those units, which could not participate in these camps held separate camps. Annual camps for Junior Division Air Troops were held on circle basis except for Maharashtr&, Madhya Pradesh, Uttar Pradesh, Bihar and OrisSa, for whom two separate camps were heldone at Mirsi (near Nagpur) and the other at Ranchi.
(g) Public School Camps: Public School (including K. G. School) Troops, which were grouped into 4 zones had their camps at Jodhpur, Lucknow, Cochin and Delhi. In these camps 37 officers and 1,421 cadets participated .•
(h) Republic Day Camp: 35 officers and 1,160 cadets including 2 NCC Boys' 1 girls' Bands took part in the Republic Day in Delhi on 26th January, 19.62. Inter-circle competitions and annual NCC rally were organised on this. occasion·.
Courses at Himalayan Mountaineering Institute: 5 officers and 14 cadets re.ceived training in the three basic courses organised by the Himalayan M9un-
, tteineering Institute. Two of these courses were for boys and one for the first time only for girls. One officer also attended the advanced course at the Institute. All of:Iicers and cadets, achieved good proficiency in the techniques of rock climbing and in the snow craft.
Visit of NCC Cadets to Singapore At the invitation of the Malayan Government, two NCC Air Wing Senior
Division cadets visited Singapore and participated in the Annual camp of the Malayan Air Training Corps from 6th to 16th Augu&t, 1961. The cadets met the Head of the State and were shown around various establishments and places of interest. ·

327
Shooting Competitions
For improving the standard of shooting of selected cadets of NCC, various inter-circle shooting competitions were held. -
Auxiliary Cadet Corps
The year under report witnessed further improvement in training and administration of Auxiliary Caclet Corps. Most of the States imparted ACC training during normal whool hours and teachers displayed greater response in the attendance of refresher courses. 66 ACC Labour and Social Service camps were held in which 883 teachers and 22,771 cadets participated. The camps, inter alia aimed at inculcating in t.he ~dets a spirit of service and dignity of labour and also enabling them to participate in nation-building activities,
10. School Meals
The importance and desirability of the scheme of providing mid-day meals to t;hildren in primary schools from health point of view as well as incentives to poor children to come to schools in big numbers was well realised by the States. In mo~t of the States, meal was distributed free to studentB, but in certain cases a nominal fee was charged from them. The essential part of the scheme is the mobilisation of community participation to supplement t]le State resources. The response from the community was very encouraging and the cost of the scheme was shared between the State Government and the public. Local bodies and private organisations also contributed towards this expenditure. International organisations like UNICEF and voluntary organisations like CARE also rendered assistance by gifts of milk powder !!.nd cornmeals to school children as mid-day meal.
The scheme of mid-day meals for primary school children was in operation in scheduled areas in the States of Assam, Bihar, Gujarat, Kerala, Mysore, Madras, l\Iaharashtra, Orissa, Punjab and Uttar Pradesh and in the Union Territories of NEFA, Pondicherry and Tripura. Large scale programme of sehool meals at the primary school Etage was introduced during the year under review in Madras, Kerala and Punjab. The mlient features of this programme in some of the states are briefly given below :
In As~am, the supply of mid-day meal in Primary schools- within Matia Proj"!ct in Goalpara sub-division continued during the year. 1\Iid-day meal was also tried in certain schools on subscription from the students. Powdered milk was distributed to certain primary schools. In Bihar, many High, Basic, liiiddle and Primary Schools, specially tho~e Primary schools which were under the jurisdiction of the pilot project offrce and compulsory education, were i!npplied powder milk received from voluntary organisations abroad to be distributed ~o ~tudents free of charge. Also, free light refreshment was given to the pupils ~n some ~ilway managed schools. In Gujarat, the mid-day meal scheme mtroducccl Ill the Dangs District in 1951-52, was continuP.d during tl.e year nndor report. It was also proposed to extend this in Vehhal Nizar area also. The scheme of free dist.ribution of UNICEF SKIIII l\IILK Powder to chilt~ron in ~ublic primary schools was introduced in a large number of schools ~1tuated Ill t~e scheduled areas, community project areas, Community Development ProJects and the National Extension Service Blocks in the State. In Kerala, the Government approved of the introduction of a scheme of

'·'328
mid-day meals to poor pupils reading in primary schools in the State with grants provided by Government and donation.~ offered in cash or kind or in both by the local public. 8,252 schools with standards I to IV (17 ·76 lakhs children) benefited under the scheme during 1961-62. From December, 1961, CARE feeding programme was also started in the schools and food prepared out of milk powder, and C\)rnmea.l was supplied to the children. In Mysore, a. ,sum of Rs. 6·00 lakhs was provided for the wntinuation of the scheme of mid-day ~eals in the primary schools. In Madras; the schem~ made a tremendo\lll progress durip.g the year. Out of 28,392 primary schools in the State; the scheme was functioning in 27,260 schools and the number of children feel was 12·67 lakhs. The subsidised schemes for the free supply .of school meals .to poor children in elementary schools ak>o continued to make progress during t.he year. CARE feeding programme was started in the schools during the year. Under the Madras Mid-day Meal Scheme, milk powder, r:ce and ~ulgar wheat were supplied to the children.
In .Maharashtra, the certified under-not:rished children were eontinued to· be given six ozs. of toned pasteurised milk in a sealed bottle. In addition tG this free supply of milk to the pupils of standards I and II of Cola.ba group of .schools from Lion's Club of Bombay was also continued. The number of primary schools covered under the scheme of fre~ distribution of UNICEF milk powder was · 2, 752 and the number of children fed was 48,228. The corresponding figures for the previous· year are : schools covered 1,268 and children benefited 20,000. In Orissa, free mid-day meals and powdered milk were distributed to children of Primary and Seconda:r;y schools in the flood affected areas and in the . block areas where primary education was compulsory. In Punjab, the mid-day meal scheme that was introduced with effect from 15th February, 1961, under a phased programme by serving milk. to students under CARE school feeding programme, was continued during the year. The nup1ber of primary schwls covered under the scheme was 4,255 in 81 blocks and the number fed was 5 lakhs. In Uttar Pradesh a comprehensive scheme. for providing free mid-dr. y meal~ to the children of primary schools was launched on 19th November, 1961 with the help of the
·local community on a voluntary basis. The scheme covered 8,765 primary schools benefiting, 5, 72,950 children. For the implementation of the scll.eme, the.- public donated a sum of Rs. 27,916 in cash and also food grains WClrth Rs. 84,175. ·
In N.E.F.A., mid-day meals were arranged from the products <'f the agricultural gardens maintained in almost all the fchools. In Pondicherry, the supply of mid-day meals was further exteuJ.ed. The number of Government schools covered under the rcheme was 217 and the numher of children fed was 34,588. The corresponding figures for the previous year are : schools covered 147 and .children, benefited 19,622. Another scheme for the supply of mid-day meals to poor children in elementary ~chools was introduced during 1961-62 under which 12 private schocls were sanctioned subsidy for introducing
· the scheme in thei:r: s<;hools .. 886 pupils were benefited. The State Government incurred an expenditure of Rs. 5,97,314 on mid-day meals. In 1:'ripura, the school meal system was introduced in 50 primary, junior basic and middle schools for a period lasting as long as 3 months in ~orne of the schools. The number of students benefited was about 4,000.
329
11. Education of the Displaced Students
Financial Assistance
The Scheme of giving financial assistance to displaced students from Eas' and West Pakistan in the shape of free studentship up to school stage and stipends up to the college stage was continued during the year under repo;rt. As the scheme was originally to be wound up at the end of the Second Plan, therefore, in order that undue hardship may not be caused to those who '\\-ere in the midst of their courses, benefits under the scheme were given only to those students who were already in receipt of such assistance but who had not completed their courses during 1961-62. A financial provision ofRs. 23,22,000 was made for them during the year.
Recovery of Educational Loans
The work relating to the recovery and rem!Bswn of educational loans advanced to displaced students was also contin11ed during the year under reports and out ofa sumofRs. 7·26lakhs advanced to 1,401loanees through the Social Welfare and Rehabilitation Directorate, a sum of Rs. 4·44 lakbs was either recovered or remitted.
Relief and Rehabilitation Measures for Displaced persons
The Ministry of Education continued to discharge its responsibilities relating to 58 Homesj!nfirmaries situated throughout the country with a total populationof about 30,000 and also the cases of about 1,800 displaced destitute children residing in the 37 children's institutions in West Bengal. Besides, about 4,000 displaced persons were paid monthly cash doles outside these Homes.
The policy of rehabilitating able-bodied inmates through various s<Jhemes of vocational/technical training and education with a view to liquidating the problem, continued to be followed during the year. Besides, the Inspecting Officer of the Ministry of Education, in conjunction with the representative of the concerned State Governments/Union Administrations screened the cases of inmates of various Homes/Infirmaries with a view to weeding out the persons who might have, due to one reason or the other, became ineligible for relief. As a. result of the weeding of .the able-bodied persons and the merger of the smaller Homes with larger ones, the total number of Homes and Infirmaries was reduced from 58 to 53 and the number of inmates from about 30,000 to 25,000.
Educ'ltional Certificates and verifications of displaced persons
Under the Indo-Pakistan agreement on the issue of educational certificates to ~is placed .pers~ns, the Government of India disposed of almost all the applicatwns rece1ved Ill connection with the issue of educational certificates and ver.ifications of educational qualifications in respect of Pakistan nationals. while the Government of Pakistan had still to clear many cases on their side.

~30
12. Indian Students Abroad
Award of Scholarships
The National Schemes of providing facilities in the shape of financial 1¥1sistance, scholarships, travel grants etc., for the Indian Students who went to foreign countries for bigher studies and training in various branches of education were continued by the Central and State Governments. Besides such facilities were also provided by semi-public and private orgauisationsjinstitutions, foreign Governments, educational foundations and international organisations. Majority of these students, hov.ever, went on their own resources.
AD. account of these facilities is given below- .
1. Agatha Harrison Fellowship
This fellowship that was instituted in 1956-57 in the memory of late Miss Agatha Harrison envisages the study of Asian problems with special reference to India at the St. Anthony's College, Oxford, and is of 5 years' duration. The selected candidate sent in 1956-57 continued his work at the college during 1961-62. .
2. Central Overseas Scholarhip Scheme
No fresh award was made under this scheme after 195~-59. Of the 6 persons awarded scholarships in 1958-59 five returned after completing their studies abroad in 1961-62 while one continued his studies abroad during the year under report.
3. Fully Paid Overseas Scholarship Scheme
No fresh award was made under this scheme abo after 1958-59. One scholal' who was sent abroad during 1958-59, returned after completing her studies during the year.
4. Programme of Exchange of Scholars between India and Rumania
Two scholars who were av.arded the scholarships in 1960-61 under the programme continued their studies in Rumania during tbe year under report.. ·
5.. Programme of Exchange of Scholars between India and USSR
This programme was instituted with effect from 1961-62. The names of ten selected candidates were recommended to the U. S. S. R. Government for award of scholarships.
6. Programme of Exchange of Scholars between India and UAR
The programme was also instituted with effect from 1961-62. Three Ind~an scholars who were already studying in the U. A. R. were _given the sch,olarships. The name of one candidate was recommended from Ind1a for the aw'ard of the scholarship.

331
7. Union Territories Overseas Scholarships One scholarship is available every year for studies in humanities to a person
who by birth or domicile is a native of any of the Union Territories. No award for Humanities was given during 1961-62. The two candidates of 1959-60 and 1960-61 continued their studies abroad during the year.
8. .l!'oreign Language Scholarship Scheme The scheme of awardin<> scholarship for specialisation in various languages
was continued. Three more hnguages namely, Burmese, Indonesian and Pushto were included in the scheme from the year 1961-62. Selections for 1961-62 awards were not made during the year and 15 scholars for that year were carried over for 1962-63. Six scholars of earlier batches proceeded abroad during 1961-62 and five returned to India after completing their studies abroad.
9. Overseas Scholarships for Scheduled Castes, Scheduled Tribes and Other Backward Communities
For 1961-62, 14 Scholarships were awarded-5 to scheduled castes, 5 to scheduled tribes and 4 to other baclrnard class students. None of the selected candidates proceeded abroad during the year. Nine scholars of earlier batches went abroad during 1961-62 and 8 returned after completing their studies abroad. -
10. Passage Grants for Scheduled Castes, Scheduled Tribes and other Backward Classes
Four students from the other backward classes, who received foreign scholarships without passage costs, were awarded passage grants for studies abroad. Return passage grants were also given to three students of the other backward classes.
11. ScholarshipsjFellowships offered by Foreign Governments/International Organisations etc.
Foreign Governments, institutions and international organisations etc. also awarded scholarships/fellowships to Indian nationals for studies abroad during 1961-62. The details of the awards are given below-
Name of the awarding authority
1
1. United Nations (U.N.) Social Welfare Scholarships and Fellowship Programme
2. Ul\TE~O
3. Thai Government 4. U.K. Government
Number of scholarships/fellowships offered
2
One fellowship. Two fellowships for production of Reading material
Three scholarships. Seven Bursaries for teacher train· ing.

Name of the awarding authority
1
5. Australian Government
6. Danish Government
7. French Government
8. U.S.S.R. Government •
. 9. West Germany Government .
10. Polish Government
11.· Belgian Government
12. Hungarian Government .
13. Austrian Government .
14. Nornegian Government
15. British Council, London
332
Number of scholarships/fellowships offered
2
One visiting fellowship to an Indian teacher for study tour and discussions on educational subjects with Australian educationists.
Four scholarships for study of folk high school movement ..
(i) Five , scholarships for postgraduate study in humanities out of which three selected candidates are studying in France;
(ii) Ten scholarships for specialised training tenable during 1962-63: and
(iii) Two scholarships for young Indian Roman Catholic priests tenable during 1962·63.
Two scholarships for Indian teachers for t1e study of Russian language .
Ten scholarships for the study of physical education, German language, etc.
(i) Two scholarships for post-graduate study in the humanities, and
(ii) Four fellowships for study of economic planning tenable during 1962-63.
One scholarship for study of economic planning tenable during 1962-63.
• Six scholarships for study of humanities tenable during 1962-63.
Two scholarships for post-graduate study in the humanities.
One scholarship for studies in the humanities.
The scholarships for post graduate study/research in the U.K. tenable during 1962-63.

333
Name of the awarding authority Number of scholarships/fellowships offered
1
16. Walker's Travelling Association, U.K.
17. Imperial Relations Trust, London .
2
One Scholarship for study at the 8"1\ansea University. Two fellowships-each tenable at the London University Institute of Education, London during 1961-62 and 1962-63.
Is. Philippines Board of Scholarships for Six scholarships 'for South East South East Asia (University of Asian countries. Philippines).
19. People's Friendship (Patrice Lumumba) University, Moscow.
Five scholarships for study of humanities tenable during 1962-63.
Indian Students going abroad for Higher Studies during 1961-62
The available statistics of Indian students/trainees who· went to various foreign countries to pursue higher studies in various subjects are given in Table CXXVII below : . . -
Table CXXVfi-Number of Students/Trainees who went abroad during 1961-62 by Subjects
Subject Boys Girls Tots!
Arts 256 63 319 Science 323 29 352 Education 55 48 103 Engineering 1,865 3 1,868 Architecture & Design 50 I 51 Technology & Industry 1,814 12 1,826 Medicine & Vet. Science 1,101 149 1,250 Agriculture and Forestry 194 7 201 Law 34 3 37 Commerce 180 7 187 Journalism 5 2 7 Banking & Insurance 25 25 Fine Arts 21 8 2!1 Nursing 2 5 7 Library Soienoo • 1 2 3 Others 336 47 383
Total 6,262 386 6,648

334
It will be seen that as many as 6,648 students (6,262 men and 386 women) went abroad. The number of stipendiary students was 2,228 (2,091 men and 137 women). U. K. attracted the largest number of students (36·6 per cent) followed by U.S. A. (33·8 per cent) and West Germany (18·1 per cent). The details of these students according to the countries to which they went during 1961-62 may be seen in Table CXXVTII.
Table CXX:Vill-Number of Students/Trainees who went abroad during 1961-62 by Countries
Na.me of the Country
Australia Austria
Belgium Burma
Canada Ceylon
China O.eohoslovakia
Denmark East Germany
Finland France
Greece Holla.nd
Hongkong Hungary Ireland Israel Italy Ja.pa.n
Lebanon Ma.la.ya. N etherla.nds New Zea.la.nd
.Nigeria. Norway
Pa.kista.n Philippines
Pola.nd Rumania.
Sweden South Rhodesia
Sudan Switzerla.nd
U.K. u.s.A. U.S.S.R. West Germany
Yogoslavia • • Other Africa.n Countries Other Europea.n Countries
Tota.l
Boys
21 80 4 2
110 6
4 17
22 49
2 62
2 2 2 3 1 2
63 71
1 37 3 1 1
2 1
1 2
29 1
1 57
2,257 2,06i
75 1,192
7 2 4
6,262
Girls
11
1
3
1 2 1
1
176 182
7
1
386
Tota.l
21 80
4 2
121 6
4 18 22 ~49
2 66
! 2 2 3 1 2
63 72
2 2
37 3 1 1 2 1
1 2
29 1
1 68
2,433 2,246
75 1,199
. 7 2 6
6,648
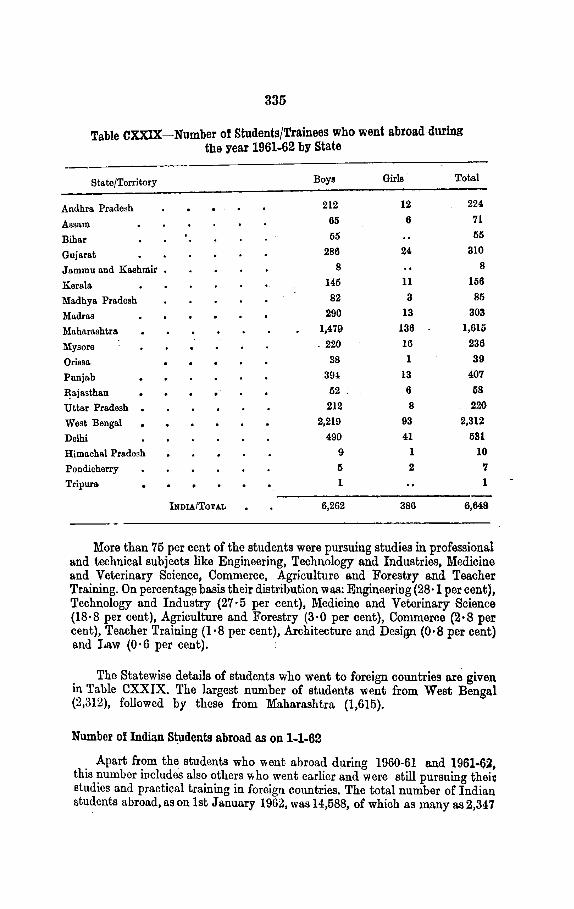
335
Table CXXIX-Number ot Students/Trainees who went abroad during the year 1961-62 by State
State/Territory Boys Girls Total
Andhra Pradesh 212 12 224
Assam 65 6 71
Bihar 55 55
Gujarat 286 24 310
Jammu and Kashmir • 8 8
Kerala I45 11 I 56
Madhya Pradesh 82 3 85
Madras 290 I3 303
Maharashtra I,479 136 1,615
Mysore . 220 16 236
Orissa 38 I 39
Punjab 39! 13 407
~n.jasthan 52 6 58
Uttar Pradesh 212 8 220
West Bengal 2,219 93 2,312
Delhi 490 41 581
Himachal Pradesh 9 1 IO
Pondicherry 5 2 'I
Tripura I 1
INnu./ToTAL 6,262 386 6,648
----More than 75 per cent of the students were pursuing studies in professional
and technical subjects like Engineering, Technology and Industria.<>, Medicine and Veterinary Science, Commerce, Agriculture and Forestry and Teacher Training. On percentag!J basis their distribution was: Engineering (28·1 per cent), Technology and Industry (27 ·5 per cent), Medicine and Veterinary Science (18·8 per cent), Agriculture and Forestry (3·0 per cent), Commeroe (2·8 per cent), Teacher Training (1·8 per cent), Architecture and DesiiJ!l (0·8 per cent) and Law (0·6 per cent).
The Statewise details of students who went to foreign countries are given in Table CXXIX. The largest number of students went from West Bengal (2,312), followed by these from Maharashtra (1,615).
Number of Indian Students abroad as on 1-1-62
. Apart fr?m the students who went abroad dtuing 1960-61 and 1961·6~, thts number wcludes also others who went earlier and were still pursuing theit studies and practical training in foreign countries. The total number of Indian students abroad, as on 1st January 1962, was 14,588, of which as many as 2,34 7
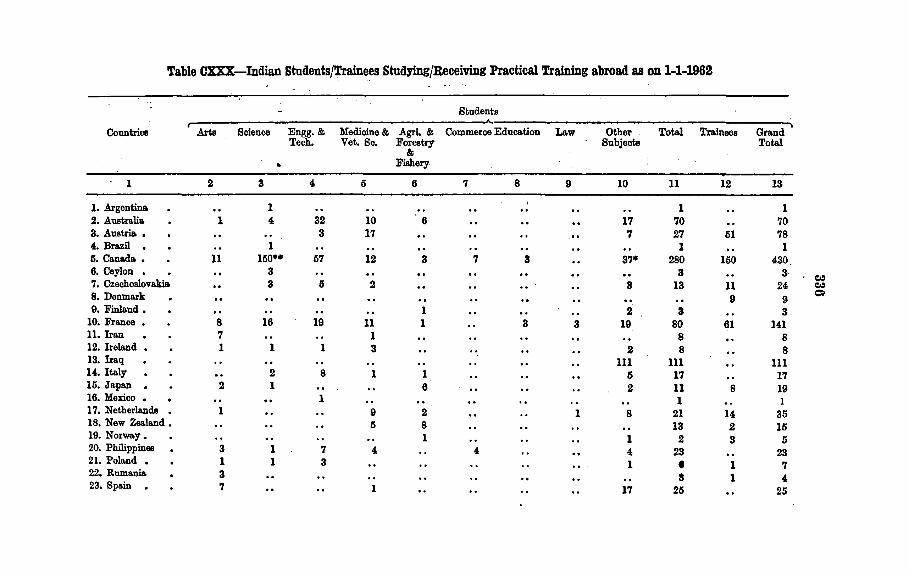
Table CXXX-Indian Students/Trainees StudyingjReceiving Practical Training abroad as on 1-1-1962
Students
Countries Arts Science Engg. & Medicine& Agri. & Commerce Education L&w Other Total Trainees Grand Tech. Vet. So. Forestry Subjects Total
& • Fishery
1 2 3 4 6 6 7 8 9 10 11 12 13
1. Argentina 1 1 1 2. Australia 1 4 32 10 6 17 70 70 3. Austria , 3 17 7 27 61 78 4. Brazil . 1 1 1 6. Canada • 11 150** 67 12 3 7 3 37* 280 150 430 6. Ceylon , 3 3 3- Cl:l 7. Czeohoalovskis 3 6 2 3 13 11 24 Cl:l 8. Denmark 9 9 = 9. Finla.nd • 1 2 8 3
10. France • 8 16 19 11 1 8 3 19 80 61 141 11. Iran 7 1 8 8 12. Ireland , 1 1 1 3 2 8 8 13. Iraq 111 111 111 14. Itsly 2 8 1 1 5 17 17 16. Japan . 2 1 6 2 11 8 19 16. Mexico 1 .. 1 1 17. Netherlands 1 9 2 1 8 21 14 36 18. New Ze.sland • 5 8 13 2 15 19. Norway. 1 1 2 3 6 20. Philippines 3 1 7 4 4 4 23 23 21. Poland • 1 1 3 1 • 1 7 22. Rumania 3 s 1 4 23. Sp&in . 7 1 17 25 25

24. Sweden • 3 1 2 2 3 2 13 6 19
25. Switzerland 21 2 10 3 1 1 15 62 115 7 122
26. Turkey • 1 1 1 27. U.A.R. 24 24 24 28. U.K. 423 218 960 1,302 15 8 48 23 49 3,046 3,046@ 29. U.S.A .• 1,044 956 2,250 656 343 494 215 25 393 6,376 144 6,520 30. U. 8. S. R. 3 24 59 6 7 6 105 105 31. West Germany 66 237 950 265 13 30 6 182 1,749 1,876 3,625 32. Yugoslavia 1 1 13 1 4 20 3 23 83. Pakistan 5 3 1 9 3 1 43 65 65***
Total 1,612 1,626 4,381 2,320 411 547 269 74 1,001 12,241 2,347 14,588
*This includes students, in whose case subject of study is not known. **This includes students, of Ph. D. where the subject, of research is not specified. ***Excludes students studying in High School olaeaea. NOTE- 1. Figure of U. A. R. is the same aa on 1·1-1961 and
~ 2. Figure of Finland is 2 more than on 1·1-1961. ~
-~ @Figures are provisional.

338
were receiving specialised training in various branches of technology and industry. Table C:XXX gives the statistics of these students according to courses of study and the country where they were pursuing their studies. U.,S. A. attracted the largest number of such students (6,520), followed by West Germany (3,625), U.K. (3,046), Canada (430), and France (141). In other countries the number of such students/trainees '\"\as less than 100. Of the total number of studenta, a great majority '\"\aB receiving instructions and practical training in Engineering and Technology (35 · 8 per cent), Medicine and Veterinary Science (18 · ~ per cent), Applied Science (13·3 per cent) and Arts subjects (13·2 per cent).

CHAPTER XI
STATISTICAL SURVEY
An attempt has been made in this chapter t? s_tudy the tren_ds in s~me important fields of education as revealed by stahsttcs for the qumquennmm ending 1961-62. This study being largely statistical does not aim at qualitative assessment of educational development during the period. Moreover, the trends have been studied on an all-India basis and the conclusions do not reflect inter State variations.
Elementary Education
The progress made in the field of elementary edu ... ation during the years from 1956-57 to 1961-62 is given in table CXXXI below:
Table CXXXI-Enrolment in classes I-VIII.1956-62
No. of Pupils in Classes Percentage Percentage of increase from -I-VIII of girls the previous year
Year (In lakhs) to total ,.--
Boys Girls Total Boys Girls Total
1956-57 220·95 93·54 314·49 29·7 5·4 10·0 6·&... 1957-58 232·40 98·58 330 98 29·8 5·2 5·4 5·2 1958-59 252·14 109·83 361·97 30·3 8·5 ll·4 9·4 195~-60 21l!l-17 ll9·55 388·72 30·S 6·8 8·9 7·4 1!!60-61 286·16 130·17 416·33 31·3 6·3 8·9 7·1 1961-62 315·91 149·81 465·72 32·2 10·4 15·1 ll·9
The above table shows that the enrolment in Class I-VII{ maintained its rising trend throughout the period under review. During this ·period over 150 lakhs of additional children came to be enrolled in the elementary classes. Thi~ gives an average increase of more than 30 lakhs of students per yearo'er 18 lakhs boys and 11 lakhs girls. In spite of the fact that the gap between the enrolment of girls and E oys continued to be wide, the percentage increase of enrolment of girls has been better than that of the boys. The expansion of educational facilities in this field of education on the whole has been fairly rapid.
Table CXXXTI-Educational Facilities for the Age-Group 6-14
Year
Percentage of pupils in classes I-VIII to the total popula
tion in the age-group 6-14
------------------------------------------B~oy~•----G-ir_Is ____ ~Total 19.)1\-57 1907-58 1~;)8-59
Htti9-60 1%0-61 1~61-62 ______ ____:
33~
55·9 60·2 61·1 63·8 66·3 71·2
. 24·9 26·9 28·3 29·9 32·0 35·8
40·9 43·9 45·2 47·1 49·7 li4·0

340
The peroentsge of educational facilities in Classes 1-VIII to the population of children in the age-group 6-14 increased from 40·9 to 54·0. This shows an average increase of 2·62 per cent per year. Whereas in 1961-62 against 100 boys over 71 boys were going to schools, in the case of girls over 35 wer~ going against 100. It is, therefore, obvious that the tempo of educational enrolment will have to be accelerated to achieve the goal of univer~al education for children up to the age of 14 years, This is particularly true of girls where the percentage of enrolment to the total population in the aae-gtoup 6-14- is still very low as compiued to the boys. -
0
Primary Education
. Primary education is imparted in primary schools as well as in primary departments of middle and high schools. Table CXXXIII shows an increase in the number of primary schools from 1956-57 to 1961-62. The statistics given in this table, however, do not i.il.clude the number of primary departments of middle and secondary schools.
Table CXXXIII-Namber of Primary Schools, 1956---62
Primary Schools Primary Schools Single· Teacher· Percen-for Girls Schools tage
Yeat-·--· ---. Number
..__,_., of single Number Increase Percen- Number Percen· teacher
fr-am the tage of tage of schools to previous Girls increase total No,
year Schools from the of to total previous Primary
No. of year . schools ·.· ·Schools
1956-57 . 2,87,2~8 9,163 16,065 5·6 1,16,272 . 4·5 40·5
i957-58 ~.98,247 10,949: 16,433 11·5 1,23,248 G·O 41·3
l958-59 3,01,564 . 3,317 16,735 6·5 1,29,193 4.·8 4.2·8
1959-'60 3,19,070' 17,506 18,800 11·9 1,38,993 7·6 4.3·6
196.0-61 . 3,30,399 11,329 19,829 6·0 1,45,191 4·5 43·9
1961-62 3,51,530 21,131 22,057 6·3 1,55,0!7 8·8 44·1
This table sho.vs that the number of primary schools increased from ovE>r .2·87lakhs in 1956-57 to 3·52 lakhs in 1961-62. This giv~s an increase of more than 64,000 i~ five years or an average of 12,800 new schools p<!r year. Of the 'total number of primary schools, over 6 per ·cent WE're meant for girls. On the wlwle the increase in the number of primary schools durin a the year under review is an _impressive record of effort made for
·the estsblishnient of a broad.based syt~tem of primary education in.t.he cotmtry. . . . .
The above table also shows that the number of single"teacLer primary schools has been progressively increasing !lOt oruy in numbers but also in )_)fO·
port-ion to the total number of I>rimary schools.

341
The distribution of primary schools according to management is given in tha following table :-
Table CXX:lOV-Number of Primary Schools by Management, 1956-62
1956-57
1957-58
1953-59
1953-60
l96a-61
1931-62
Tots! No. of Primary Schools
2,87,298
2,98,247
3,10,564
3,19,070
3,30,399
3,51,510
N umbar of Primary Schools Managed by
Govt. Local Private Boards Bodies
64,093 1,52,064 71,136
77,72! 1,48,275. 72,248
81,939 1,43,331 71,324
70,!533 1,77,855 70,632
72,330 1,8!,825 73,194
76,6 )9 1,93,56! 75,357
Percen- Percen- Percen-tage of tage of tage of Govt. Local Private
managed Bodies Schools Schools managed
Schools
22·3 52·9 24·8
26·1 49·7 24·2
27·2 49·1 23·7
22·1 55·7 22·2
21·9 55·9 22·2
21·8 56·8 21·4
It will be oh~rved from the a.bJve data that more than half the number of schools arJ manag<Jd by Local Bxlies and the remaining being equally divided be ween Govt. and priva.t'3 organi;;;ations. Taking Govt. and Local BoardP,.. tog3ther, schools under public ma.nagem0nt constituted more than 3/4 of t:..le total number of schools.
Enrolmant in Classes I-V during the five years under discus3ion is given in the following table :
Table CXK:X:V-Elucational Facilities for the Age Group 6-11, 1955-62
Year Enrolment in Classes I-V Percentage of enrolment of (in Lakhs) chi!Jren in the age-group
6-11
Boys Girls Total Boys Girls. Total
1956-57 184·51 82·62 267 ·13 73·7 34·5 64·5
1957-58 194·04 87·66 281·70 76·1 36·2 56·7
1958-59 210·15 97·42 307·57 76·0 37·5 &7·3
1%9-60 222·96 105·24 328·19 81·4 40·5 61·5
1960-61 234·68 113·47 3i8·15 80·9 42·0 62·0
1961-62 259·8! 131·18 391·02 87·4 47·0 67·8
:W:, ll\DJ5 •>l·JL :du-27

342
Tl:e above data shows that enrolment increa'led about 124 hkh.~ bv 1961-62 over that of 1956-57. This figure inrlutl~s 75·33 bkhs bovs anrl 48:56 lakhs girls. The average annual increase in enrolment works out to over 24 lakhs-15 lakhs boys·and 9·7llakhs girls. The gap between enrolment of boys and girls still remains wide.
The above table also gives the }ercentage of enrolment in Cla.sses 1-V to the population of children in the age-gr.mp 6-11. As e.gainst 2.bout 87% of boys only about 47% of girls in the ~aid age-group wer<> availing the school places. This gives an overall percentage of 67 · 8 only. The problem of girls' education, therefore, still remains to be tackled so far as this field of
·educat.ion is concerned. ·
It may incidentally be mentioned here that not all the students of clasRIJli 1-V who have been related to the popubtion of ag·)-group 6---;-11 actunlly belong to this. age group. A substantial portion of this enrolment bdongs to ages outside the age-group 6-11.
Table CXXXVI below indicates the extent to which the ehrolment of cl.4SS<)s I~V falls outsirle the af,~-gronp 6-11 :
Table CXXXVI-Pupils Outside the Age-Group 6-11, in Classes I-V 1956-62 .
Year Enrolment in Classes Pupils below 6 aml Percentage of pupils I-V (in Lakhs) above 11 in Classes below 6 & a hove 11
I-V (in Lakhs) in classes I-V
Boys Girls ·Total Boys Girls Total Boys Girls Total
1956-57 18!·51 82·62 267·13 44·27 17·79 62·06 24·0 21·5 23·2
1957-58 194·04 87·66 281·70 46·14 18·20 64·34 23·8 20·8 22·8
1958-59 210·15 97·42 307·57 48·68 19·47 68·14 23·2 20·0 22·2
1959-60 222·96 105·24 328·19 51·66 21·41 73·07 23·2 20·2 22·3
1960-61 234·68 113·47 348·115 54·00 23·05 77·05 23·0 20·3 22·1
1961-62 259·84 131·18 391·02 60·4.5 27·2! 87·69 23·3 20·8 22·4
, It is evident 1hat 22·4 per cent of the seats available in class~s 1-V were utilizerl by children of th~ v.Tong age. It is, however, a m~.>tter of satisfaction that this percentage is not increas:ng mu· h.
One of the draw-backs from which primary education suffers is wastage (including stagnation). By wastage is meant the loss on acC'ount of premature withdrawal of children from school and failure on the part,of some pupils to get promoted from one class to the next in the course of an academic year. Thus all children who join the schools are not of the age bf 6 and due to failures or even otherwise they continue to be in classes I-V even when they cross th6 age ofll. . . .
It will appt>ar from the above table that there is wastage and stagnation to the extent of 58% in respect of children who join Cbss I b.::fore reaching Class IV. The wastage is heavier among girls than among boys.

Year
1U;i0-iji
1957-;iS
195S-ii9
1%9-60
1960-61 .
19r,I-62
Table CXXXVll-Wastage and Stagn:ttion, 1956-62
Enrolment in Class I three years previou;ly (In lakin)
Boys Girls Total
54·67 26·20 80·87
61·89 29·23 91·12
66-60 32·98 99·58
67·71 35·12 102-83
72·42 36·66 109·08
78·84 41·15 ll9·99
Enrolment in Class IV during the year (in lakh<)
Boys Girls Total
25·10 9·57 34-67
26·57 10·29 36·86
28·69 ll-51 40·20
30·01 12·47 42·48
32·53 14·01 46·54
34·98 15·42 50·40
Numerical \V Jsta~e and Stu.gmtion (ln lakh<)
Wastage and tagna..tion in percentage
r-----------~·--------~ Boys Girls Total Boys Girls TottLI
29·57 16·63 46-20 54·1 63·4 57·1
35-32 18-9-! • 54·26 57·1 64·8 59·5
37·91 21·47 59·38 58·9 65·1 59·6
37·70 22·05 60·35 55·7 64·5 58·7
39·89 22·65 62·54 55·1 61·8 57·3
43·86 25·73 69·59 55·6 62·5 58·0
<:;j oflo. ~

344
Table CXXXVIH sh0ws the magnitude of wa~tag~ ani{ stagnatiO'l from Class I to II, from Class II to III and from Class III to IV. This tab!~ has been prepe.red by taking t.h<J emolm~nt of Cla..ss I as 100 and th·13 c.1lculatin" the indices of enrolment in the subsequent classes in the subsequent years.
0
Class
1
I II III IV
Class
I II III IV
Tlble CXXXVIll-Indices of Enrolment in Classes I-IV
195-!-58 Batch 1955-59 Batch 19.55-60 Batch
Boys Girls Total Boys Girls Total Boys Girls Total
2 3 4 5 6 7 8 9 10
100 100 100 10() 100 100 100 100 100 62 58 61 61 55 59 61 56 58 51 45 49 50 43 43 50 44 49 43 35 40 43 35 40 4! 36 41
1957-61 Batch 1958-62 B,tch
Boys Girls Total Boys Girls Total '
11 12 13 14 15 16
100 100 100 100 100 100 62 58 61 61·2 56·4 59·6 51 46 49 51·1 45·1 49·1 45 38 43 44·4 37·5 42·0
It is clear from the above t.abl~ that wastage and stagnation is the highest from Class I to Class II and gradually de'.lreages to Class IV. Of the 100 ch ldren wno join Class I only 42 reached Class IV.
The following table gives an idea of the growth of t.ea()hing staff of Primary schools together with thair position with regard to training :
Table CXXXIX-Teachers in Primary Schools, 1956-62
No. of Teachers in Prima.ry Increase Percen· No. of Percen· Schools (In Thous&nda) or tage of Trained tage of
decrease Women Teachers Trained Year from Teachers (in Teachers
Men Women Total previous thousands) year (in thous&nda)
Hl56•57 .. 58Q 121 710 -j-19 17·1 442 63·5
1957·58 602 127 729 +19 17·4 463 63·5
1958-59 . 577 us ~95 -3! 16·9 443 63·7
1959-60 606 125 731 +aa 17·1 467 63·8
1960-61 615 127 7!ll +11 17-1 475 6!·1
1961-62 656 139 795 +53 17·0 511 61·3

345
The strength of teaching staff in primary schools rose from 710 thou~and in 1956-57 to 795 thousand in 1961-62. This gives an average increase of 17,0:JO teachers per year. The number of trained teachers also steadily increased during the period under review.
The following table gives the distribution of direct expenditure on primary schools by sources :-
Table CXL-Expenditure on Primary Schools by Sources, 1956-62
Year
1956-57 1957-58 1958-59 1959-60 1960-61 1961-62
Expenditure met from (In crores of rupees)
Govt. Locar Fees Other Funds Board Sources
Funds
43·56 11·50 1·80 1·62 52·36 10·75 1·76 1·84 51·78 8·36 1·57 1·86 56·31 9·92 1·66 1·82 59·12 10·67 1·72 1·94 66·21 12·47 2·0i 1·95
Percen· tage of expendi· ture met from
Total Govern-ment
and Local Boards Funds
58·48 94·2 66·71 94·6 63·57 94·6 69·71 95·0 37·45 95·0 82·67 95·2
But for 4· 8% of the expenditure which is met from fees and other sources, the entire burden of providing primary education in India is being borne by public authorities, i.e., Government and Local Bodies. ·
Of the direct expenditure, salaries of teachers claimed the lion's share as is clear from the table given below :-
Table CXLI-Teachers' Salaries in Primary Schools, 1956-62
Total Teachers' Percentage Average Salary Year Direct Salaries of Teachers' salary per index with
Expenditure salaries to teacher per· 1956-57 (In crores total Direct annum as base of rupE'es) expenditure
1956-57 58·48 49·28 84·3 694·0 100·0 1957-58 66·71 56·92 85·3 780·6 112·5 1958-59 63·57 58·78 86·2 788·5 113·6 1959-60 69·71 61·29 87·9 838·4. 120·8 1960-61 73·45 64·72 88·1 872·8 125·8 1961-62 82·67 72·61 87·8 913·3 131·6 --·-MBfB(Il)MMof£du-2S
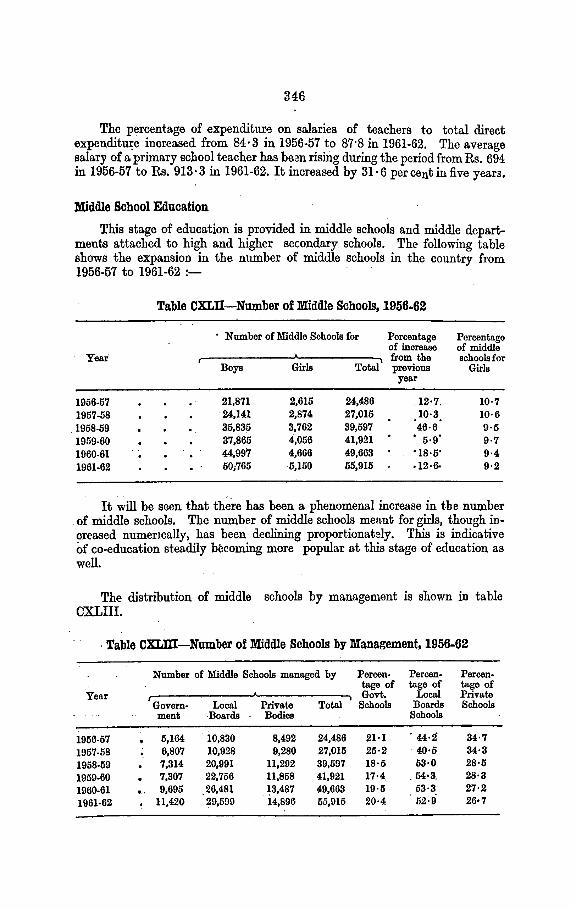
346
The percentage of expenditur'3 on salaries of teachers to total direct expenditure increased from 84·3 in 1956-57 to 87·8 in 1961-62. The average salary of a primary school teacher has been rising during the period from Rs. 694 in 1956-57 toRs. 913·3 in 1961-62. It increased by 31·6 percent in five year3.
Middle School Education
This stage of education is provided in middle schools and middle departments attached to high and higher secondary schools. The following table shows the expansion in the number of middle schools in the country from 1956-57 to 1961-62 :- ·
Table CXLU-Number of Middle Schools, 1956-62
· Number of Middle Schools for Percentage Percentage of increase of middle
Year from the schools for Boys Girls Total previous Girls
year
1956-57 21,871 2,615 24,486 .12·7. 10·7 1957-58 24,141 2,874 27,015 10·3 10·6 1958-59 35,835 3,762 39,597 46·6 9·5 1959-60 37,865 4,056 41,921 • 5·9' 9·7 1960-61 44,99'7 4,666 49,663 '18•5' 9·4 1961-62 50,765 5,150 55,915 ·12·6- 9·2
It will be seen that th~re has been a phenomenal increase in the number of middle schools. The number of middle schools meant for girls, though increased numerically, has been declining proportionately. This is indicative of co-education steadily becoming more popular at this stage of education as well.
The distribution of middle schools by management is shown in table CXLIII.
. Table CXLIII-Number of Middle Schools by Management, 1956-62
Number of Middle Schools managed by Percen- Percen- Percen· tage of tage of tage of
Year Govt. Loca.l Private Govern· Loca.l Private Total Schools Boards Schools ment Boards Bodies Schools
1956-57 5,164 10,830 8,492 24,486 21·1 . «·l! 34·7
1957-58 6,807 10,928 9,280 27,015 25·2 . 40·5 34·3
1958-59 7,314 20,991 11,292 39,597 18·5 53·0 28·5
1959-60 7,307 22,756 11,858 41,921 17·4. . 64·3. 28·3
1960-61 9,695 ,26,481 13,487 49,663 19·5 53·3 27·2
1961-62 11,420 29,599 i4,896 55,915 20·4 52·9 26•7

347
The above table shows that majority of the middle schools were managed by Local Boards and their number has been gradually increasing.
Trends in enrolment of Classes VI-VIII between 1956-57 and 1961-62 are revealed in the table below:-
Table CXLIV-Enrolment in Classes VI-VUI, 1956-62
Pupils in Classes VI-VTII Percen· Percentage of enrolment in (in Lakhs) tage of classes VI-VIII to children
girls to in the age-group 11-14 Year total ----,
Boys Girls Total Boys Girls Total
1956-57 36·44 9·92 46·36 21·4 26·4 7·7 17·3 1957-58 38·35 10·93 49;28 22·2 29·2 8·8 19·3 1958-59 42·00 12·41 64·41 22·8 30·9 9·7 20·7 1959-60 46·21 14·31 60·52 23·6 30·5 10·2 20·7 1960-61 51·48 16·70 68·18 24·5 36·4 12·4 24·7 1961-62 56·08 18·62 74·70 24·9 38·7 13·5 26·4
This table shows that during the period under revi11w, the t~tal strength of Classes VI-VIII increased by 28· 34lakhs of which boys v.ere 19· 64: lakhs and girls 8·70 lakhs. The position of girls in the total enrolment in these classes improved from 21·4% to 24·9%.
The above table also gives the percentage of enrolment in Classes VI-VIII to the population in the age-group 11-14 years. In 1961-62 facilities for middle school education were available only for 26·4% of the population of the corresponding age-group. The gap between the enrolment of boys and girls was still very large. These gaps will have to be bridged for achieving the goal of universal education at the middle stage.
Data about teachers in middle schools are given in table CXLV.
Table CXLV-Teachers in Middle Schools,1956-62
Number of Teachers Percen- Percen-tage of tage of
Yei'U' Women Trained Trained Men Women Total Teachers Teachers Teachers
to Total
1956-57 1,35,467 31,096 1,66,563 18·7 1,00,077 60·1 1957-58 1,48,054 37,019 1,85,073 30·0 1,16,021 62·7 1958-59 2,05,774 59,907 2,65,681 22·5 1,74,857 65·8 1959-60 2,22,108 70,024 2,92,132 24·0 1,93,879 66·4 1960-61 2,61,696 83,532 3,45,228 24·2 2,29,606 66·5 1961-62 2,87,795 94,251 3,82,046 24·7 2,60,103 68·1
The st~e~gth of teaching staff in middle schools increased by 2,15,483 in five years g1vmg an average increase of 43,097 teachers per year. The number of trained teachers increased gradually from 60·1% in 1956-57 to 68 ·1% in
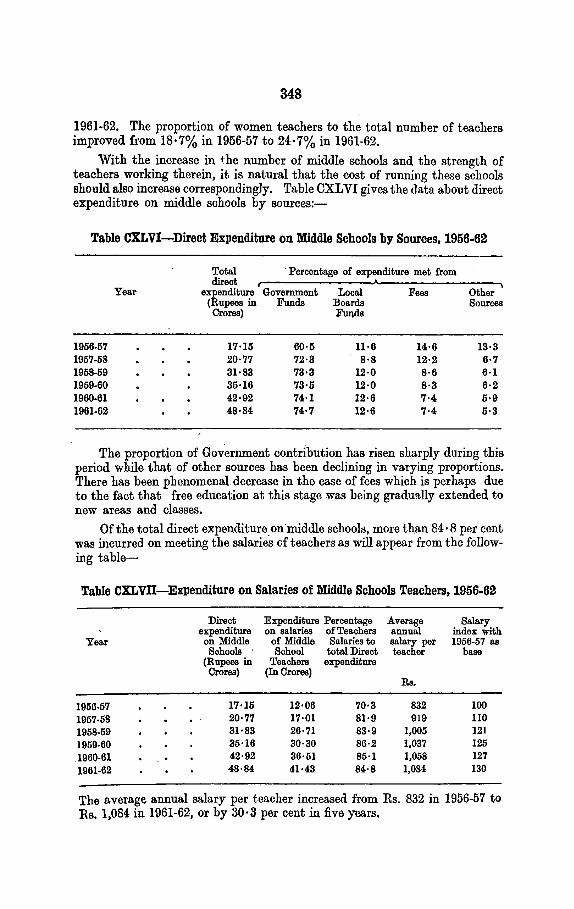
348
1961-62. The proportion of women teachers to the total number of teachers improved from 18·7% in 1956-57 to 24·7% in 1961-62.
With the increase in +he number of middle schools and the strength of teachers working therein, it is natural that the cost of running these schools should also increase correspondingly. Table CXLVI gives the data about direct expenditure on middle schools by sources:-
Table CXLVI-Direct Expenditure on Middle Schools by Sources,1956-62
Total ·Percentage of expenditure met from direct
Year expenditure Government Local Fees Other {Rupees in Funds Boards Sources Crores) FWlds
1956-57 17·15 60·5 11·6 14·6 13·3 1957-58 20·77 72·3 8·8 12·2 6·7 1958-59 31·83 73·3 12·0 8·6 6·1 1959-60 35·16 73·5 12·0 8·3 6·2 1960-61 42·92 74·1 12·6 7·4 5·9 1961-62 48·84 74·7 12·6 7·4 5·3
The proportion of Gov~rnment contribution has risen sharply during this period while that of other sources bas been declining in varying proportions. There has been phenomenal decrease in the case of fees which is perhaps due to the fact that free education at this stage was being gradually extended to new areas and classes.
Of the total direct expenditure_on·middle schools, more than 84·8 per cent was incurred on meeting the salaries c.f teachers as will appear from the following table-
Table CXLVll-Expenditure on Salaries of Middle Schools Teachers,l956-62
Direct Expenditure Percentage Average Salary expenditure on salaries of Teachers annual index with
Year on Middle of Middle Salaries to salary per 1956-57 e.s Schools School total Direct teacher be.se
(Rupees in Crores)
Teachers (In Crores)
expenditure
Rs.
1956-57 17·15 12·06 70·3 832 100 1957-58 20·77 17·01 81·9 919 110 1958-59 31·83 26·71 83·9 1,005 121 1959-60 35·16 30·30 86·2 1,037 125 1960-61 42·92 36·51 85·1 1,058 127 1961-62 48·84 41·43 84·8 1,08·1 130
The average annual salary per teacher increased from Rs. 832 in 1956-57 to Rs. 1,084 in 1961-62, or by 30·3 per cent in five years.

349
Basic Education
Basic education consists of an integrated course of 8 years duration~ junior basic of five years and senior basic of three years. B~t this p~ttern is not uniform in all the States. Table CXL VIII below shows the mcrease m the number of basic schools during the period under report:-
Table CXLVID-Number of Basic Schools, 1956-62
Junior Basic School Senior Basio Schools
Year Percentage of Schools Percentage of Schools Managed by Managed by
Number Number Govern- Local Private Govern· Local Private
ment Boarde Bodies ment Boarde Bodies
1956-57 46,881 11·7 77·6 10·7 6,897 13·1 79·4 7·5 1957-58 52,039 13-7 74-3 12·0 7,819 15·0 75·5 9·5 1958-59 57,069 13·8 74·3 11·9 12,739 11·7 71·6 16·7 1959-60 61,757 10·6 78·3 11·1 13,554 9·7 73·4 16·9 1960-61 65,9.!9 10'7 78·7 10·6 14,269 9'3 72·9 17·a. 1961-6} 73,982 10·6 8o·o 9'4 15,485 9'8 72•4 17•8
The number of Junior Basic Schools increased by about 27,000 and that of Senior Basic Schools by about 8,500. An overwhelming majority of Junior Basic Schools (80 per cent) are managed by Local Boards and the rest are almost equally distributed between Government and private manage!llents. In so far as Senior Basic Schools are concerned, the management pattern has been almost similar to that of Junior Basic School~.
Table CXLIX compares the number of Junior Basic Schools with the total number of primary schools (ba~ic as well as non-basic) and Seni_or Basic Schools with the total number of middle schools (basic as well as non-basic).
. . Table CXLIX-Proportion of Junior and Senior Basic Schools, 1956-62
Year
1956-57 1957-58 1958-59 1959-60 1960-61 1961-62
Junior Basio
Schools
46,881 52,039 57,069 61,757 65,9-19 73,982
Primary Schools (Basio &
Non-Basic)
2,87,298 2,98,247 3,01,564 3,19,070 3,30,399 3,51,530
Junior Basio
Schools as per-centage
of Primary Schools
16·3 17·4 18·9 19·4 20·0 21·0
Senior Middle Senior Basio Schools Basio Schools (Basic & School:!
Non- as per-Basic) centage
of l\Iiddle
Schools
6,897 24,486 28·1 7,819 27,015 28·9
12,739 39,597 32·2 13,554 41,921 32·3 14,269 49,663 28·7 15,485 55,915 27·7

350
The above table shows that in spite of substantial increase in the number of Junior and Senior Basic Schools, their proportion to primary and middle schools did not go beyond 21 per cent and 28 per cent respectively.
The enrolment. of junior and senior basic schools is given in table CL below:-
Year
1956-57 .
1957-68 •
1968-69 •
1969-60 •
1960-61 •
1961-62.
Table CL-Enrolment in Basic Schools, 1956-62
Enrolment in Junior Basio Schools
(In Lakhs)
Enrolment in Senior Percent- Percen· Basic Schools age tage (In Lakhs) of of .----....A----v---....... -----. enrol- enrol-
Total Girls Per.
41•28
48·13.
64•60
60•13
65•02
76•43
8·61
10~33
12•14
13•99
16•78
19•91
centage of girls
20·9
21•6
22·3
23•3
24·3
26•0
Total Girls Per- ment ment
17·31 4·88
19·77 6·86
27·55 7·66
29·91 8·39
32·20 9·01
35·90 10·30
cent- in in age Junior Senior
of girls Basic Basic Schools Schools to that of to that Primary of Schools Middle
Schools
28·2 17·26 39·51
29·6 19·42 39·07
27·4 22·36 33·72
28·1 23·23 33·66
28·0 24·40 30·35
28·8 26·0 29·6
The total enrolment in junior basic schools increased by 35 ·15 lakbs in the course of five years while that in the senior basic schools by 18·59lakhs. This compares favourably with the increase in the number of junior and senior basic schools.
The proportion of girls improved from 20·9 per cent in 1956-57 to 26·0 per cent in 1961-62 in junior basic schools and from 28·2 per cent in 1956-57 to 28·8 per cent in 1961-62 in the case of senior basic schools. 26 per cent of the pupils in primary schools were studying in junior basic schools and 29 · 6 per cent of the pupils in middle schools were in senior basic schools.

351
Table eLI-Expenditure on Basic Schools, 1956-62
Total Percentage of Expenditure met from Percent-expendi- age of
Year ture expendi· (In Crores ture on of Rupees) Govern- Local Fees Other Basio
ment Board Sources Schools Funds Funds to that on
Primary/ Middle Schools
Junior Basic Schools
1956-57 9:11 75·7 20·1 3·1 1·9 15·6
1957-58 10·85 78·9 18·4 0·8 1·9 16·3
1958-59 12·50 79·0· 18·7 0·3 2·0 19·7 1959-60 14·04 78·9 19·0 0·4 1·7 20·1 1960-61 16·14 79·1 18·5 0·6 1·8 22·0 1961-62 18·87 79·1 18·8 0·8 1·3 21·8
Senior Basic Schools
1956-57 5·09 83·5 11·4 2·1 3·0 29·7 1957-58 6·26 82·9 12·6 2·0 2·5 30·1 1958-59 10·27 75·4 11·7 8·7 4·2 32·3 1959-60 10·99 75·6 20·3 1·0 3·1 31·3 1960-61 12·36 77·1 11·4 7·2 4·3 28·8 1961-62 13·53 77·5 11·3 7·3 3·9 27·7 -
During the period under review, the total expenditure on Junior Basic Schools have almost doubled whereas the expenditure on Senior Basic Schools increased to nearly three times. A high percentage of the expenditure in both types of schools iP met frvm the Govt. funds. During these years there is.a tendency for the pcrecntage of expenditure met from Govt. funds on Junior Ba~ic Schools to increase whereas the eX}Jcnditure met from Govt. on Senior Basic Schools shows a. decreaf,ing tendency. · · : :
Table CLll-Teachers in Basic Schools, 1956-62
Teachers in Junior Basio Teachers in Senior Basic
Year
1956-57 1957-58 1958-59 1959-60 1~60-61
19G1-02
Total
1,19,366 1,34,927 1,48,361 1,59,751 1,75,606 1,96,429
Schools
Trained
93,400 1,05,704 1,15,181 1,21,704 1,31,638 1,41,828
Percent-age of
Trained teachers to Total
78·2 78·3 77·6 76·2 75·0 72·2
Schools
Total Trained Percent-age of
Trained teachers to total
52,552 38,684 73·6 57,846 43,869 75·8 87,437 66,087 75·6 95,539 72,461 75·8
1,02,083 76,890 75·3 1,11,810 84,602 75·7

352
'rhe above table gives the teachers in Basic Schools during the period 1956-62. The number of teachers in the Junior Basic Schools has increased from 1·2 lakhs in 1956-57 to 2·0 lakhs in 1961-62. But it is seen that the training arrangement~ are not keeping pace with the total number of teachers employed. The percentage of trained teachers in Junior Basic Schools has decreased from 78 per cent in 1956-57 to 72 per cent in 1961-62.
The total number of teachers in Senior Basic Schools has more than doubled during this period. The percentage of trained teachers has also increased from 74 per cent to 76 per cent.
High and Higher Secondary Education
Education at this stage is usually provided in High and Higher Secondary Schools. In some cases colleges also have classes in this stage attached to them but the number of such attached classes of High and Higher Secondary Schools is not available. The table below gives the number of High/Higher Secondary Schools in th( country:-
Year
1956-57
1957-58
1958·59
1959-60
1960-61
1961-62
Table CLIII-Number of High/Higher Secondary Schools, 1956-62
Number of IDgh Percent- Percentage of Schools managed and IDgher Secondary age of by
Schools Girls ,... Schools
Total For Govern- Local Private Girls ment Boards Bodies
11,805 1,758 14·9 15·3 13·0 71·7
12,639 1,889 15·0 19·0 10·1 70·9
14,326 2,103 14·7 19·5 10·0 70·5
15,703 2,281 14·5 18·1 11·6 70·3
17,257 2,521 14·6 18·8 12·0 69·2
19,306 2,784 14·4 19·2 13·0 67·8
Ji'ollowing are the main points which emerge from the table above:
(1) The total number of High/Higher Secondary Schools have increased by about 7,500 dming this period, i.e. nearly 64 per cent in five years.
(2) The increase in the number of girls schools is also of the same order. However, there is no increase in the percentage of schools for girls during the period under review.
(3) A substantial percentage ofthe~e schools (68 per cent) are in private hands. However, lately the percentage of schools managed by private bodies shows a decreasing trend whereas the percentage of schools managed by Govt. and Local Bodies is increasing.

353
Table CLIV-Enrolment in Classes IX-X/XI. 1956-62
Enrolment in Classes IX-X/ Percentage of Enrolment to
Year XI (In Lakhs) Population in the age-gr'>Dp 14-1/l/17
Boys Girls Total Boys Girls Total
1956-57 16-63 3-44 20-07 14·6 3·0 9·1
1957-58 17·93 3·90 21·83 14·7 3·4 9·2
1958-59 19·36 4·23 23·59 15·7 3·5 9·7
1959-60 20·70 4·52 25·22 14·7 3·5 9·3
1960-61 23·31 5·41 28·72 18·0 4·4 11·4
1961-62 26·03 6·31 32·34 19·6 5·0 12·5
The table above gives the enrolment in Classos IX-X/XI during the years 1956-62. The total enrolment has increased by 12lakhs during this period. Of this increase only 3 lakhs is for girls.
The enrolment in Classes IX-X/XI in terms of the total population in the age-group 14-16/17 has incre!J.Sed from 9 per cent in 1956-57 to 12 · 5 pt>r cent in 1961-62. The percentage enrolment of girls to the female population was 3 in 1956-57. It bas increaEed to 5% by 1961-62.
Table CLV-Teachers in High/Higher Secondary Schools, 1956-62
Total Number Percentage Number Percentage Year Number of Women of women of trained of Trained
of Teachers Teachers teachers teachers teachers
1956-57 2,05,617 39,146 19·0 1,25,845 61·2
1957-58 2,21,695 43,203 19·5 1,39,175 62·8
1958-59 2,45,555 49,277 20·1 1,55,288 63·2
1959-60 2,67,637 5,5,312 20·7 1,70,670 63·8
1960-61 2,96,305 62,347 21·0 1,89,962 64·1
1961-62 3,30,570 71,281 21·6 2,12,597 64·3
. The total number of teacher~ in High/Higher Secondary Schools have mcreased by 1·25lakhs during this period whereas the total number of women teachers have almost doubled during the same period. Also the percentage of wo~en teachers ~o total number of teachers is increasing. The percentage cf tra1:ned teachers mcreased from 61 per cent to 64 per cent during the same penod.

354
Table CLVI-Expenditure on High/Higher Secondary Schools by Sources 1956-62
Year
1956-57 1957-58 1958-59 1959-60 1960-61 1961-62
Total Expendit~ (Rupees in
Crores)
41·59 46·47 52·51 59·90 68·91 79·12
Percentage of Expenditure met from
Government Local Fees Other Funds Board Sources
Funds
42·0 4·1 44·1 9·8 44·4 4·5 41·5 9·6 45·9 3·8 41·1 9·2 48·1 4·5 39·4 8·0 48·0 4·7 39·2 8·1 51·1 4·1 37·2 7·6
The total expenditure on High/Higher Secondary Schools is given above. The total expenditure has almost doubled during the period 1956-62. In 1956-57 income from fees formed a major source for meeting the total expenditure. In later years a major part of the expenditure is met from Govt. funds. Also the percentag~ income from fees is decreasing year by year whereas the expenditure met from Govt. fund~ is increasing.
A major part of the total expenditure on High/Higher Secondary Schools was expended on teachers' salaries. This is brought out in the table below:-
Table CLVU--Salaries of Teachers in High/Higher Secondary Schools,1956-62
Total Expenditure Percentage Average Salary expenditure on of annual Index
Year on High/ Teachers' expenditure salary per with Higher Salaries on teacher 1956-57 as
Secondary (Rupees in Salaries base Schools Crores)
(Rupees in Crores)
1956-57 41·59 29·01 71·4 1,411 100·0
1957-58 46·47 33·31 71·7 1,503 106·5
1958-59 52·51 37·93 72·2 1,545 109·5
1959-60 59·90 46·05 76·9 1,721 121·9
1960-61 68·91 49·81 72·3 1,681 ll2·0
1961-62 79·12 56·98 72·0 1,724 122·2
The percentage of expenditure on teachers' salarie~ has Iemained more or less constant around 72 per cent during this period excepting 1959-60 in which year about 77 per cent of the expenditure was on teachers' salaries.
]t is also seen from the table that the average annual salary per teacher has increased from about RP. 1,411 in 1956-57 toRs. 1,724 in 1961-62, or by 22·2 per (:ent in five years.

355
Table CLVffi-Results of Matriculation and Equivalent Examinations, 1956-62
Number Number Pass Number of Percentage appeared passed percentage Girls of girls
Year included among in Col. (3) number
passed
1956-57 10,12,309 4,66,764 46-1 83,046 17-8
1957-58 10,79,966 5,21,552 48-3 91,179 17-5
1958-59 11,75,706 5,30,136 45-1 92,818 17-5
1959-60 13,49,465 5,72,198 42-4 1,13,123 19-8
'960-61 14,48,440 6,61,501 45-7 1,34,498 20-3
1961-62 16,44,614 7,49,014 45-5 1,46,626 - 19-6 '
The out-turn of matriculates and equivalents during the pEriod 1956--62 is given above. The numb3r of pupils appearing for matriculation and equivalent examinations had been increasing steadily from year to year.
Higher Education
Institution~. of higher education include universities and the colleges attached to them as well as the institutions of higher education which are not affiliated to these universities. The following table gives the number of ins~itutions of higher education:-
Table CLIX-Number of Institutions for Higher Education, 1956-62
Universities Research Colleges and Institutions
Year Institutions General Professional Special Education Education Education
1956-57 33 41 773 399 128 1957-58 38 43 817 489 148 1959-59 40 42 878 542 168 1959-60 40 42 946 725 180 1960-61 45 41 1,039 852 208 1961-62 46 44 1,138 961 222
During the five-year period 1956-62, the number of universities increased by 13. The number of research institutions having teaching functions increased by 3. The num her of colleges for general education increa<;ed by 365. Co!leaes and institutions of professional education increased by 562 and for special ed~cation by 94.

356
The enrolment at the university stage is given in the following table:-
Table CLX-Enrolment at the University Stage, 1956-62
General Educa. Professional and Special Educe.. A.ll Higher Per. tion Technical Education tion Education centage
Year ,..-----'-----, ~ r---'------, r---"-----. of Total Girls. Total Girls Total Girls. Total Girls girls
(Figures in Lakhs)
1956-57 6·25 0·96 1·62 O·ll 0·14 0·04 8·01 1·ll 13·9 1957-58 6·62 1·07 1·82 0·14 0•18 0·04 8·62 1·25 14·5
1958-59 7·35 1·25 2·02 0·16 0·21 0·06 9·58 1·47 i5·3
1959-60 - 7·85 1·37 2·38 0-22 0·21 0·06 10·44 1·65 15·8
1960-61 8·07 1·50 2·64 0·26 0·21 0·07 10·92 1·83 16·8
1961-62 8·65 1·69 2·97 0·30 0-24 0·09 11·86 2·08 17·5
The total enrolment at the university stage increased by It times during the period 1956-62. The percentage of girls enrolled increased by 4.
The table below gives the distribution of the enrolment in colleges for general education by stages of education:--
Table CLXI-Enrolment in Colleges for General Education of Stages, 1956-62
Intermediate Degree Post Graduate and Total Research
Year (In lakhs) r----' l Number Percen- Number Percent- Number Percent-(Inlakhs) tage (In lakhs) age (In lakhs) age
1956-57 6·25 4·26 68·1 1·68 26·9 0·31 5·0
1957-58 6·62 4·39 66·3 1·89 28·6 0·34 5·1
1958-59 7·35 4·87 66·3 2·08 28·3 0·40 5·4
1959-60 7·85 4·93 62·8 2·49 31·7 0·43 5·5
1960-61 8·07 4·58 56·8 2·99 37·0 0·50 6·2
1961-62 8·65 4·46 51·6 3·62 41·8 0·57 6·6
Even though there is a slight increase in the number of students enrolled for intermediate, percentage number of students at this stage shews a decreasing tendency. The percmtage n~mber of studmts enrolle~ at the degr~e .stage has increased from 27 per cent. m 1956-57 to 42 per cent m 1961-62. Sm1tlarly the number of students at the post-graduate stage has increased from 5 per cent to 6 · 6 per cent.

357
The subject-wise enrolment in colleges for professional education is given in the following table:-
Table CLXll-Enrolment in Professional Subjects, Collegiate Stage, 1956-62
Agricul- Com- Educa- Engi- Law Medicine Others Total Year ture merce tion nearing
and Techno-logy
1956-57 7,051 61,303 17,261 21,905 20,817 27,289 5,838 1,61,464
1957-58 9,304 63,206 22,051 28,391 22,598 30,317 6,286 1,82,153
1958-59 10,871 66,582 24,422 35,255 24,055 32,950 7,554 2,01,689
1959-00 13,295 74,486 39,135 40,242 25,925 36,615 8,385 2,38,083
1960-01 15,848 78,312 46,878 47,838 27,141 40,402 8,079 2,64,498
1961-62 18,927 88,473 52,561 54,420 28,220 44,952 9,031 2,96,584
The following points emerge from the above table--
( i) There is substantial increase in the enrolment during the period in all the subjects.
(ii) The largest increase is observed in teachers' training, followe<iby engineering and technology, commerce and medicine.
Table CLXIII-Expenditure on Institutions for Higher Education, 1956-62
Universi- Boards Research Colleges Colleges Colleges Total Year ties of Institutions for for for Education General Profes- Special
Education sional Education Education
(In crores of Rupees)
1956-57 9·20 1·50 1·75 12-82 7·79 0·49 33·55 1g57-58 9·80 1·76 2·94 14·12 8·84 (j-62 38·08 1958-59 11·56 2·05 2·53 15-84 11·19 0·70 43·87 1959-60 12·81 2·37 2·84 18·16 13·12 0·77 50-07 1900-61 14·14 2·41 2·70 20·92 15·80 0·91 56·88 1901-02 16-87 2·99 2•85 23-38 18·65 0-94 65·68
_The ~xpen?-iture ?n_ iustituti_ons of Higher Education has nearly double-d durmg tlns penod. This mcrease IS shared by all types of institutions.

358
The expenditure on institutions of higher education other than on Boards of Education by sources is given below:-
Table CLXIV-Expenditure on Universities and Colleges by Sources, 1956-62
Total Percentage of Expenditure met from
Year
1956.57.
1957-58
1958-59
1959-60
1960.61
1961-62
expenditure (Rupees in
Crores)
32·05
36·32
41·82
47·70
54·47
62·69
Govern-ment
Funds
48·7
51·0
51·6
51·4
53·1
54·0
Local Fees Other Boards Sources funds
0·3 38·4 12·6 0·3 38·1 10·6 0·3 35·9 12·2
0·6 34·9 13·1 0·4 34·8 ll·7 0·3 33·2 12·5
Government funds and fees are the major sources of income of institutions of higher education. During the period 1956-62, the percentage of expenditure met from Govt. funds is steadily increasing whereas the income from fees shows a decreasing tendency. The expenditure met from local board funds and other sources continues to be same.
The output of graduates in arts, scienc·e and professional subjects during the period 1956-62 is given below:-
Year
'1956-57
1957-58
1958·69
1959-60
1960-61
1961-62
Table CLXV-Exam.ination Results, 1956-62
Professional subjects (First Degree only)
B.A.fB.Sc. Agrioul- Com- Educa- Engg. & Law ture merce tion Teohnolo·
gy
64,517 1,176 10,316 12,592 4,484 5,666
73,179 1,798 11,878 14,363 4,854 5,856
75,662 1,900 12,751 15,208 4,860 6,458
80,849 2,172 12,923 15,758 6,345 6,602
90,919 1,826 13,083 12,839 6,459 6,242
99,292 3,006 15,529 19,&15 8,179 6,912
Medicine
3,570
4,014.
3,666
4,42/S
3,711
4,982
The output of graduates in agriculture has more than doubled during this period whereas that of engineering and technology has nearly doubled.

35!:1
Vocational and Special School Education
The number of vocational and special schools is given in the tv ble below:-
Table CLXVI-Number of Vocational and Special Schools, 1956-62
Agricul- Com- Engg. & Medicine Teachers' Adult Others Year ture merce Tech. Training Schools
and Industry
1956-57 94 829 179 109 916 44,058 5,908
1957-58 105 877 226 115 901 45,961 6,197
1958-59 102 966 951 124 974 47,586 4,560
1959-60 100 1,095 1,385 150 1,034 51,736 4,223
1960-61 102 1,189 1,481 158 1,138 62,811 4,350
1961-62 106 770 1,493 174 1,133 2,46,208 4,302
Among the different categories of vocational.and .special schools, adult schools form the largest single group of institutions. Teachers' Training Schools, commerce schools and engineering, technical and industrial schools were the other types of schools having significant numbers.
The enrolment in vocational and special schools is given in tll ble CLXVII below:-
Table CLXVll-Enrolment in Vocational and Special Schools, 1956-62 -
Year Agri- Commerce Engg. & Medicine Teachers, Adult Others culture Technolog"y · Training Education
1956-57 6,116 79,889 41,938. 6,569 83,218 12,04,985 2,77,318 1957-58 8,184 84,666 51,405. 7,457 77,342 12,06,630 2,90,314 1958-59 7,411 98,754 1,11,921 10,688 89,514 12,57,760 2,04,777 1959-60 7,639 1,15,057 1,41,635 10,471 99,991 13,69,811 1,94,358 1960-61 7,736 1,12,824 1,65,930 10,670 1,22,612 14,84,479 2,02,416 1961-62 8,471 81,357 1,88,480 12,498 1,39,920 24,19,158 2,15,347
Ex:cpting :ommercial sch_ools and 'others' schools, the enrolment during the penod contmued to grow m all other types cf vocational and speci~>l st-hools. The ~aximum increase in enrolment was in schools of engineering, technology and mdustry.
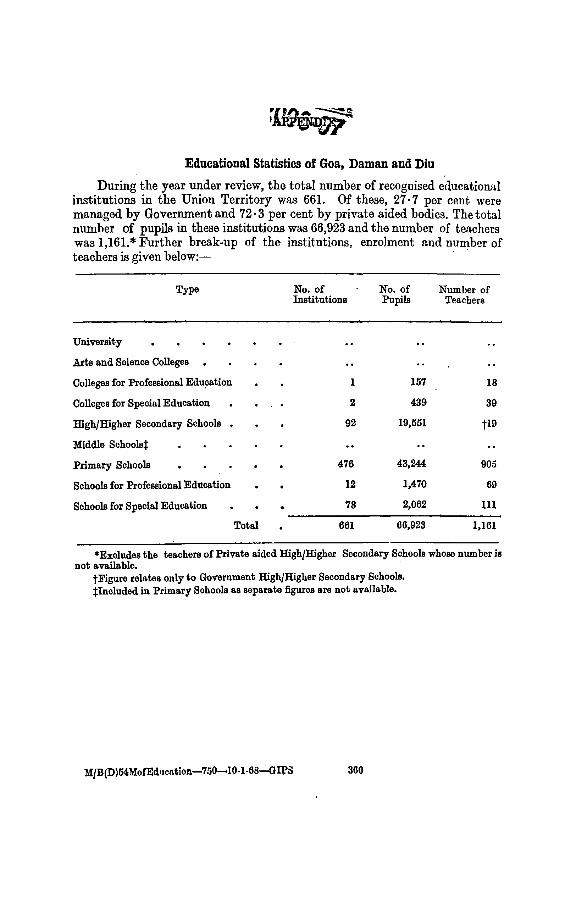
Educational Statistics of Goa, Daman and Diu
During the year under review, the total number of recognised educational institutions in the Union Territory was 661. Of these, 27 · 7 per cent were managed by Government and 72 · 3 per cent by private aided bodies. The total number of pupils in these institutions was 66,923 and the number of teachers was 1,161.* Further break-up of the institutions, enrolment and number of te~chers is given below:- ·
Type
University
Arts and Science Colleges
Colleges for Professional Education
Colleges for Special Education
High/Higher Secondary Schools
:Middle Schoolst
l'rimary Schools
Schools for Professional Education
Schools for Special Education
Total
No. of Institutions
1
2
92
476
12
78
661
No. of Pupils
157
439
19,551
43,244
1,470
2,062
66,923
Number of Teachers
18
39
ti9
905
69
111
1,161
*Excludes the teachers of Private aided HighJHigher Secondary Schools whose number is not available.
tFigure relates only to Government High/Higher Secondary Schools. tincluded in Primary Schools as separate figures are not available.
:MJB(D)M'MofEd•tcation-750-10-1·68-Gil'il 360

PUBLICATION No. 793
ED. 1. 62, 1 750
Price: Inland Rs. 26.00-Foreign 60sh.·Bd.;or-9 $ 36-cents.
1968 PRINTED BY THE MANAGER, GOVERNMENT OF INDIA PRESS, SIMLA
FOR THE MANAGER.OF PUBLICATIC>NS, CIVIL LINES DELHI