Seismic Microzonation: Principles, Practices and Experiments
61
Seismic Microzonation: Principles, Practices and Experiments T. G. Sitharam Professor, Department of Civil Engineering ,Indian Institute of Science, Bangalore, India-560012 [email protected] P. Anbazhagan Lecturer, Department of Civil Engineering ,Indian Institute of Science, Bangalore, India-560012 [email protected] ABSTRACT This paper presents an overview of the seismic microzonation and the grade/level based study along with methods used for estimating hazard. The principles of seismic microzonation along with some current practices are discussed. Summary of seismic microzonation experiments carried out in India is presented. A detailed work of seismic microzonation of Bangalore has been presented as a case study. In this case study, a seismotectonic map for microzonation area has been developed covering 350 km radius around Bangalore, India using seismicity and seismotectonic parameters of the region. For seismic microzonation Bangalore Mahanagar Palike (BMP) area of 220 km 2 has been selected as the study area. Seismic hazard analysis has been carried out using deterministic as well as probabilistic approaches. Synthetic ground motion at 653 locations, recurrence relation and peak ground acceleration maps at rock level have been generated. A detailed site characterization has been carried out using borehole with standard penetration test (SPT) ―N‖ value s and geophysical data. The base map and 3-dimensional sub surface borehole model has been generated for study area using geographical information system (GIS). Multichannel analysis of surface wave (MASW) method has been used to generate one-dimensional shear wave velocity profile at 58 locations and two-dimensional profile at 20 locations. These shear wave velocities are used to estimate equivalent shear wave velocity in the study area at every 5m intervals up to a depth of 30m. Because of wider variation in the rock depth, equivalent shear for the soil overburden thickness alone has been estimated and mapped using ArcGIS 9.2. Based on equivalent shear wave velocity of soil overburden thickness, the study area is classified as ―site class D‖. Site response study has been carried out using geotechnical properties and synthetic ground motions with program SHAKE2000. The soil in the study area is classified as soil with moderate amplification potential. Site response results obtained using standard penetration test (SPT) ―N‖ values and shear wave velocity are compared, it is found that the results based on shear wave velocity is lower than the results based on SPT ―N‖ values. Further, predominant frequency of soil column has been estimated based on ambient noise survey measurements using instruments of L4-3D short period sensors equipped with Reftek 24 bit digital acquisition systems. Predominant frequency obtained from site response study is compared with ambient noise survey. In general, predominant frequencies in the study area vary from 3Hz to 12Hz. Due to flat terrain in the study area, the induced effect of land slide possibility is considered to be remote. However, induced effect of liquefaction hazard has been estimated and mapped. Finally, by integrating the above hazard parameters two hazard index maps have been
Transcript of Seismic Microzonation: Principles, Practices and Experiments
Seismic Microzonation: Principles,
Practices and Experiments
T. G. Sitharam
Professor, Department of Civil Engineering ,Indian Institute of Science,
Bangalore, India-560012
P. Anbazhagan
Lecturer, Department of Civil Engineering ,Indian Institute of Science,
Bangalore, India-560012
ABSTRACT This paper presents an overview of the seismic microzonation and the grade/level based study along
with methods used for estimating hazard. The principles of seismic microzonation along with some
current practices are discussed. Summary of seismic microzonation experiments carried out in India
is presented. A detailed work of seismic microzonation of Bangalore has been presented as a case
study. In this case study, a seismotectonic map for microzonation area has been developed covering
350 km radius around Bangalore, India using seismicity and seismotectonic parameters of the
region. For seismic microzonation Bangalore Mahanagar Palike (BMP) area of 220 km2
has been
selected as the study area. Seismic hazard analysis has been carried out using deterministic as well
as probabilistic approaches. Synthetic ground motion at 653 locations, recurrence relation and peak
ground acceleration maps at rock level have been generated. A detailed site characterization has
been carried out using borehole with standard penetration test (SPT) ―N‖ values and geophysical
data. The base map and 3-dimensional sub surface borehole model has been generated for study
area using geographical information system (GIS). Multichannel analysis of surface wave (MASW)
method has been used to generate one-dimensional shear wave velocity profile at 58 locations and
two-dimensional profile at 20 locations. These shear wave velocities are used to estimate equivalent
shear wave velocity in the study area at every 5m intervals up to a depth of 30m. Because of wider
variation in the rock depth, equivalent shear for the soil overburden thickness alone has been
estimated and mapped using ArcGIS 9.2. Based on equivalent shear wave velocity of soil
overburden thickness, the study area is classified as ―site class D‖. Site response study has been
carried out using geotechnical properties and synthetic ground motions with program SHAKE2000.
The soil in the study area is classified as soil with moderate amplification potential. Site response
results obtained using standard penetration test (SPT) ―N‖ values and shear wave velocity are
compared, it is found that the results based on shear wave velocity is lower than the results based on
SPT ―N‖ values. Further, predominant frequency of soil column has been estimated based on
ambient noise survey measurements using instruments of L4-3D short period sensors equipped with
Reftek 24 bit digital acquisition systems. Predominant frequency obtained from site response study
is compared with ambient noise survey. In general, predominant frequencies in the study area vary
from 3Hz to 12Hz. Due to flat terrain in the study area, the induced effect of land slide possibility is
considered to be remote. However, induced effect of liquefaction hazard has been estimated and
mapped. Finally, by integrating the above hazard parameters two hazard index maps have been
Bouquet 08 2
developed using Analytic Hierarchy Process (AHP) on GIS platform. One map is based on
deterministic hazard analysis and other map is based on probabilistic hazard analysis. Finally, a
general guideline is proposed by bringing out the advantages and disadvantages of different
approaches.
KEYWORDS: Seismic microzonation, hazard, site characterization, site response
INTRODUCTION
Many earthquakes in the past have left many lessons to be learned which are very essential to plan
infrastructure and even to mitigate such calamities in future. The hazards associated with earthquakes are
referred to as seismic hazards. The practice of earthquake engineering involves the identification and
mitigation of seismic hazards. Microzonation has generally been recognized as the most accepted tool in
seismic hazard assessment and risk evaluation and it is defined as the zonation with respect to ground
motion characteristics taking into account source and site conditions [TC4-ISSMGE, 1999]. Making
improvements on the conventional macrozonation maps and regional hazard maps, microzonation of a
region generates detailed maps that predict the hazard at much smaller scales. Seismic microzonation is
the generic name for subdividing a region into individual areas having different potentials hazardous
earthquake effects, defining their specific seismic behavior for engineering design and land-use planning.
The role of geological and geotechnical data is becoming very important in the microzonation in
particular the planning of city urban infrastructure, which can recognize, control and prevent geological
hazards (Bell et al., 1987; Legget, 1987; Hake, 1987; Rau, 1994; Dai et al., 1994, 2001; Van Rooy and
Stiff, 2001). The basis of microzonation is to model the rupture mechanism at the source of an
earthquake, evaluate the propagation of waves through the earth to the top of bed rock, determine the
effect of local soil profile and thus develop a hazard map indicating the vulnerability of the area to
potential seismic hazard. Seismic microzonation will also help in designing buried lifelines such as
tunnels, water and sewage lines, gas and oil lines, and power and communication lines.
In the last three decades, large earthquakes have caused massive loss of lives and extensive physical
destruction throughout the world (Armenia, 1988; Iran, 1990; US, 1994; Japan, 1995; Turkey, 1999;
Taiwan, 1999, India 2001, Sumatra 2004, Pakistan, 2005). India has been facing threat from earthquakes
since ancient times. In India, the recent destructive earthquakes are Killari (1993) Jabalpur (1997) Bhuj
(2001) Sumatra (2004) and Indo-Pakistan (2005). Seismic activity of India is evident from these recent
earthquakes within the intra plate and along the boundaries of Indo-Australian Plate and Eurasian Plate.
Many researchers address the intra plate earthquakes and seismicity of South India (Purnachandra Rao,
1999; Ramalingeswara Rao, 2000; Iyengar and Raghukanth, 2004).
Very preliminary process of reducing the effects of earthquake is by assessing the hazard itself. As
part of the national level microzonation programme, Department of Science and Technology, Govt. of
India has initiated microzonation of 63 cities in India (Bansal and Vandana, 2007). Some of them are
finished and some of them are ongoing. As an initial experiment, seismic hazard analysis and
microzonation was taken up for Jabalpur city in Madhaya Pradesh. Further, for many other cities such as
Sikkim, Mumbai, Delhi, North East India, Gauwhati, Ahmedabad, Bhuj, Dehradun and Chennai an
attempt has been made to carryout microzonation considering geomorphological features and detailed
geotechnical studies. Among the above Jabalpur, Sikkim, Gauwhati and Bangalore microzonation works
have been completed. However, for Sikkim and Gauwhati, microzonation reports are already available
and the report on microzonation of Bangalore is in the final stages which will be released within few
months.
Bouquet 08 3
This paper presents the state-of-art practices of microzonation along with brief summary of the
Indian experiments. Further, a detailed case study of seismic microzonation of Bangalore has been
presented. Seismic microzonation of Bangalore is addressed in four parts: In the first part, estimation of
seismic hazard using seismotectonic and geological information. Second part deals about the site
characterization using geotechnical and shallow geophysical techniques. In the third part, local site effects
are assessed by carrying out one-dimensional (1-D) ground response analysis (using the program SHAKE
2000) using both borehole SPT data and shear wave velocity survey data within an area of 220 km2.
Further, field experiments using microtremor studies have also been carried out (jointly with NGRI) for
evaluation of predominant frequency of the soil columns. The same has been assessed using 1-D ground
response analysis and compared with microtremor results. Further, Seed and Idriss simplified approach
has been adopted to evaluate the liquefaction susceptibility and liquefaction resistance assessment. As the
study area is fairly flat in most of the region except in north and northwestern, landslide possibility is
considered as remote. Fourth part discuss about the integration of all the hazard parameters and
developing a final hazard index map for BMP area using Analytic Hierarchy Process (AHP) on GIS
(Geographical Information System) platform.
PRINCIPLES OF SEISMIC MICROZONATION
The earthquake damage basically depends on three groups of factors: earthquake source and path
characteristics, local geological and geotechnical site conditions, structural design and construction
features. Seismic microzonation should address the assessment of the first two groups of factors. In
general terms, seismic microzonation is the process of estimating the response of soil layers for
earthquake excitations and thus the variation of earthquake characteristics is represented on the ground
surface. Seismic microzonation is the initial phase of earthquake risk mitigation and requires
multidisciplinary approach with major contributions from geology, seismology and geotechnical
engineering.
Seismic Microzonation falls into the category of ―applied research‖. That is why it needs to be
upgraded and revised based on the latest information. The microzonation is defined as subdivision of a
region into zones that have relatively similar exposure to various earthquake related effects. This exercise
is similar to the macro level hazard evaluation but requires more rigorous input about the site specific
geological conditions, geotechnical characteristics of site, ground responses of soil column to earthquake
motions and their effects, ground conditions which would enhance the earthquake effects like the
liquefaction of soil, the ground water conditions and the static and dynamic characteristics of foundations
or of stability of slopes in the hilly terrain.
The microzonation shall be graded based on the scale of the investigation and details of the studies
carried out. The technical committee on earthquake geotechnical engineering (TC4) of the International
society of soil mechanics and foundation engineering (TC4-ISSMGE 1993) states that the first grade
(Level I) map can be prepared with scale of 1:1,000,000 – 1:50,000 and the ground motion was assessed
based on the historical earthquakes and existing information of geological and geomorphological maps. If
the scale of the mapping is 1:100,000-1:10,000 and ground motion is assessed based on the microtremor
and simplified geotechnical studies then it is called second grade (Level II) map. In the third grade (Level
III) map ground motion has been assessed based on the complete geotechnical investigations and ground
response analysis with a scale of 1:25,000-1:5,000.
For the estimation of site effects (local soil and topographical effects) and induced effects (land
instability and liquefaction) the knowledge of bed rock where ground motion being applied is required.
Bouquet 08 4
Bed rock can be divided as two types, one seismic bed rock and other one engineering bed rock. Seismic
bed rock is the rock having the shear wave velocity of more than 3000 m/s used for earthquake simulation
and modeling. Seismic bed rock characteristics are included in the source and path effects of ground
motions. Engineering bed rock is the rock having shear wave velocity of 700 m/s and above, where
usually engineers rest their deep foundation.
SEISMIC HAZARD AND MICROZONATION STUDIES
Literature shows that in the area of seismic hazard and microzonation lot of work has been carried
out from Nineties in many countries. There are guidelines for seismic microzonation studies, French
Association for Earthquake Engineering Titled ―Guidelines for Seismic Microzonation Studies; 1995‖
(Bard et. al., 1995). The recent guideline from General Directorate of Disaster Affairs, Republic of
Turkey Ministry of Public Works and Settlement titled as Seismic Microzonation for Municipalities
Manual, February 2004 (DRM, 2004). A typical case study using updated information is also presented
for Microzonation of Pilot Areas of Adapazari, Gölcük, İhsaniye and Değirmendere (DRM, 2004; Ansal
et al, 2004). This study presents site classification map, site amplification/ground motion map,
liquefaction susceptibility map and landslide hazard map separately using GIS. Even though detailed
studies have been carried out and maps are generated for different components of seismic microzonation
for the above area, no integrations of hazard parameters has been presented.
Experiments in India
This section presents the summary of seismic hazard analysis and microzonation works carried out
in Indian urban centers.
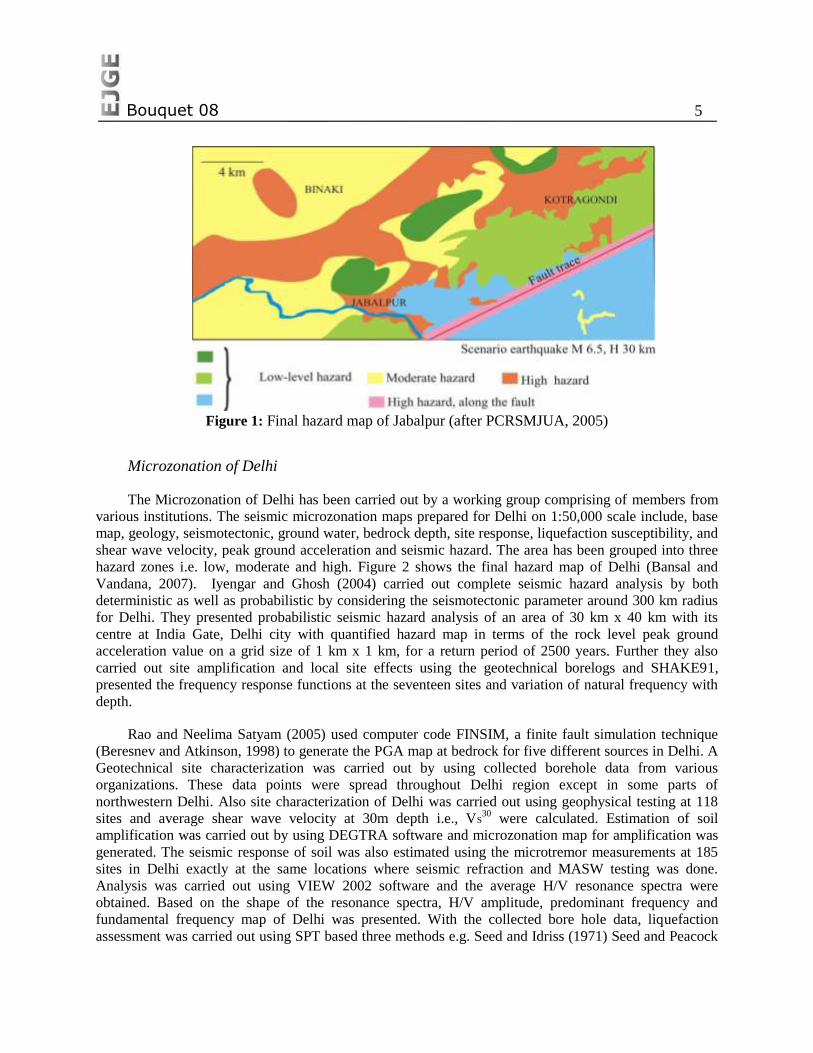
Seismic Microzonation of Jabalpur Urban Area
Very first work in India towards microzonation of Indian cities, was initiated as an experiment and
example by the Department of Science & Technology, New Delhi (PCRSMJUA, 2005). This work was
carried out by the nodal national agencies viz. Geological survey of India, Central Region Nagpur, Indian
Metrology Department New Delhi, National Geophysical Research Institute (NGRI) Hyderabad, Central
Building Research Institute(CBRI) Roorkee and Government Engineering College, Jabalpur. Seismic
hazard analysis was carried out deterministically and deterministic peak ground acceleration map
published based on the attenuation relation developed by Joyner and Boore (1981). The extensive work
on ground characterization was presented based on the experimental study of geology, geotechnical and
geophysical investigations. Based on this information, the first level microzonation map was published.
The liquefaction hazard assessment was carried out using geotechnical data and simplified approach of
Seed and Idriss (1971). Shear wave velocities from geophysical method of multichannel analysis of
surface wave were measured and used for classification of sites in Jabalpur based on 30m equivalent
shear wave velocity. Site response studies were carried out by conducting the experimental test of
Nakamura type studies and receiver function type studies. The predominant frequency and peak
amplification maps were developed and presented. The vulnerability and risk analyses have been carried
out and second level microzonation map and preliminary seismic risk maps were produced. Figure 1
shows the final hazard map prepared for Jabalpur.
Bouquet 08 5
Figure 1: Final hazard map of Jabalpur (after PCRSMJUA, 2005)
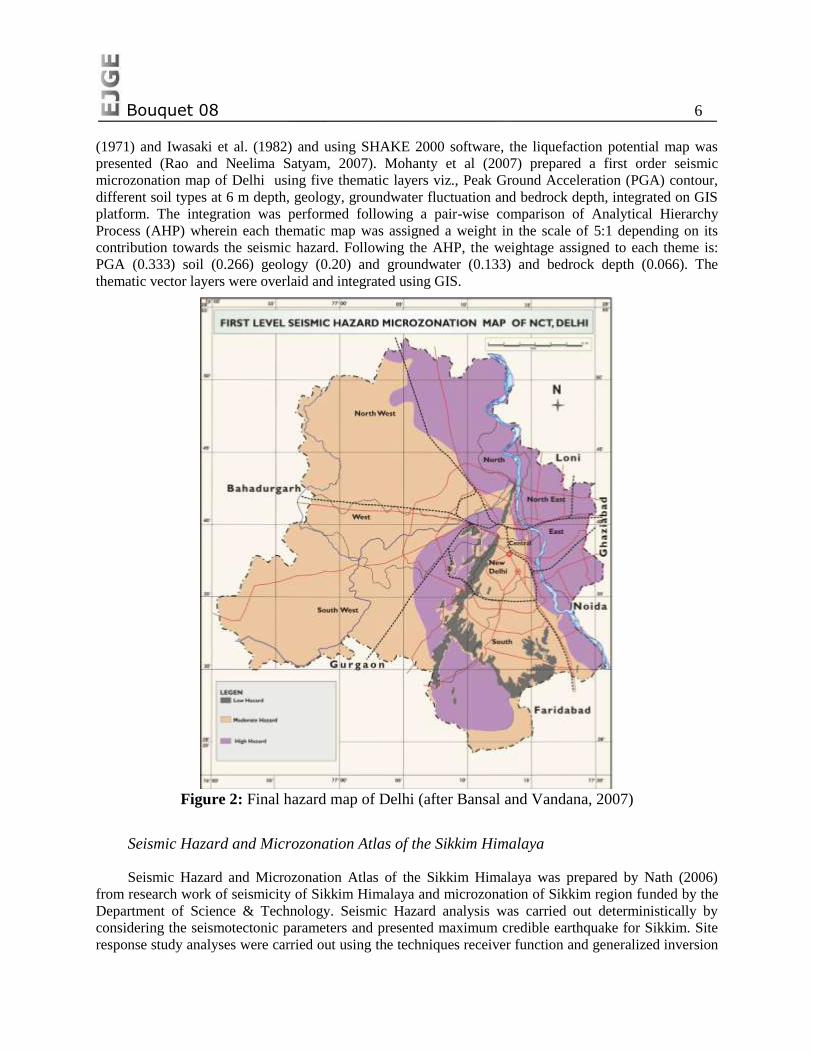
Microzonation of Delhi
The Microzonation of Delhi has been carried out by a working group comprising of members from
various institutions. The seismic microzonation maps prepared for Delhi on 1:50,000 scale include, base
map, geology, seismotectonic, ground water, bedrock depth, site response, liquefaction susceptibility, and
shear wave velocity, peak ground acceleration and seismic hazard. The area has been grouped into three
hazard zones i.e. low, moderate and high. Figure 2 shows the final hazard map of Delhi (Bansal and
Vandana, 2007). Iyengar and Ghosh (2004) carried out complete seismic hazard analysis by both
deterministic as well as probabilistic by considering the seismotectonic parameter around 300 km radius
for Delhi. They presented probabilistic seismic hazard analysis of an area of 30 km x 40 km with its
centre at India Gate, Delhi city with quantified hazard map in terms of the rock level peak ground
acceleration value on a grid size of 1 km x 1 km, for a return period of 2500 years. Further they also
carried out site amplification and local site effects using the geotechnical borelogs and SHAKE91,
presented the frequency response functions at the seventeen sites and variation of natural frequency with
depth.
Rao and Neelima Satyam (2005) used computer code FINSIM, a finite fault simulation technique
(Beresnev and Atkinson, 1998) to generate the PGA map at bedrock for five different sources in Delhi. A
Geotechnical site characterization was carried out by using collected borehole data from various
organizations. These data points were spread throughout Delhi region except in some parts of
northwestern Delhi. Also site characterization of Delhi was carried out using geophysical testing at 118
sites and average shear wave velocity at 30m depth i.e., VS30
were calculated. Estimation of soil
amplification was carried out by using DEGTRA software and microzonation map for amplification was
generated. The seismic response of soil was also estimated using the microtremor measurements at 185
sites in Delhi exactly at the same locations where seismic refraction and MASW testing was done.
Analysis was carried out using VIEW 2002 software and the average H/V resonance spectra were
obtained. Based on the shape of the resonance spectra, H/V amplitude, predominant frequency and
fundamental frequency map of Delhi was presented. With the collected bore hole data, liquefaction
assessment was carried out using SPT based three methods e.g. Seed and Idriss (1971) Seed and Peacock
Bouquet 08 6
(1971) and Iwasaki et al. (1982) and using SHAKE 2000 software, the liquefaction potential map was
presented (Rao and Neelima Satyam, 2007). Mohanty et al (2007) prepared a first order seismic
microzonation map of Delhi using five thematic layers viz., Peak Ground Acceleration (PGA) contour,
different soil types at 6 m depth, geology, groundwater fluctuation and bedrock depth, integrated on GIS
platform. The integration was performed following a pair-wise comparison of Analytical Hierarchy
Process (AHP) wherein each thematic map was assigned a weight in the scale of 5:1 depending on its
contribution towards the seismic hazard. Following the AHP, the weightage assigned to each theme is:
PGA (0.333) soil (0.266) geology (0.20) and groundwater (0.133) and bedrock depth (0.066). The
thematic vector layers were overlaid and integrated using GIS.
Figure 2: Final hazard map of Delhi (after Bansal and Vandana, 2007)
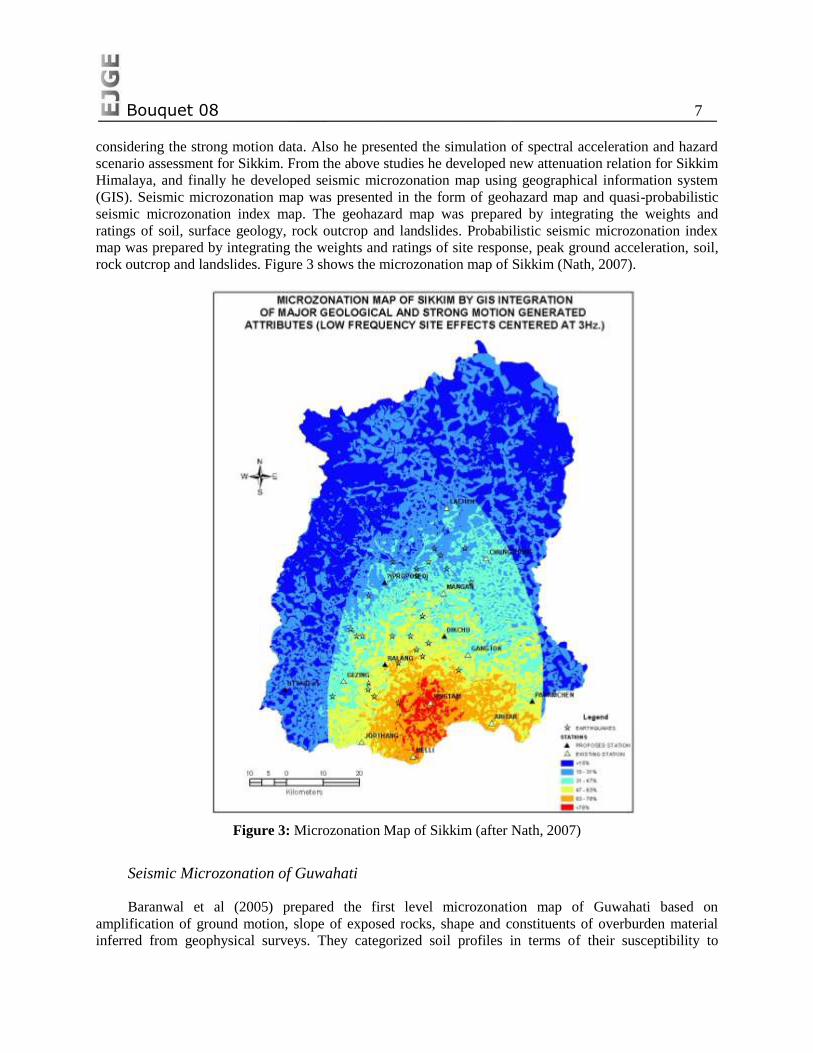
Seismic Hazard and Microzonation Atlas of the Sikkim Himalaya
Seismic Hazard and Microzonation Atlas of the Sikkim Himalaya was prepared by Nath (2006)
from research work of seismicity of Sikkim Himalaya and microzonation of Sikkim region funded by the
Department of Science & Technology. Seismic Hazard analysis was carried out deterministically by
considering the seismotectonic parameters and presented maximum credible earthquake for Sikkim. Site
response study analyses were carried out using the techniques receiver function and generalized inversion
Bouquet 08 7
considering the strong motion data. Also he presented the simulation of spectral acceleration and hazard
scenario assessment for Sikkim. From the above studies he developed new attenuation relation for Sikkim
Himalaya, and finally he developed seismic microzonation map using geographical information system
(GIS). Seismic microzonation map was presented in the form of geohazard map and quasi-probabilistic
seismic microzonation index map. The geohazard map was prepared by integrating the weights and
ratings of soil, surface geology, rock outcrop and landslides. Probabilistic seismic microzonation index
map was prepared by integrating the weights and ratings of site response, peak ground acceleration, soil,
rock outcrop and landslides. Figure 3 shows the microzonation map of Sikkim (Nath, 2007).
Figure 3: Microzonation Map of Sikkim (after Nath, 2007)
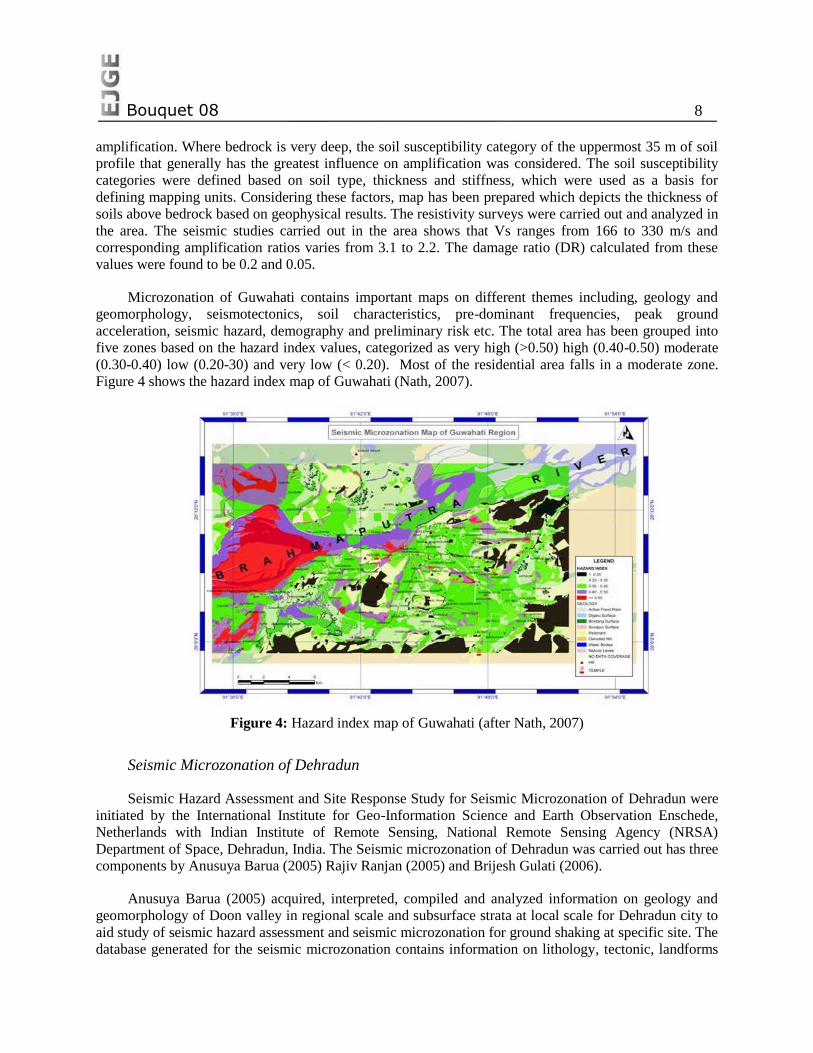
Seismic Microzonation of Guwahati
Baranwal et al (2005) prepared the first level microzonation map of Guwahati based on
amplification of ground motion, slope of exposed rocks, shape and constituents of overburden material
inferred from geophysical surveys. They categorized soil profiles in terms of their susceptibility to
Bouquet 08 8
amplification. Where bedrock is very deep, the soil susceptibility category of the uppermost 35 m of soil
profile that generally has the greatest influence on amplification was considered. The soil susceptibility
categories were defined based on soil type, thickness and stiffness, which were used as a basis for
defining mapping units. Considering these factors, map has been prepared which depicts the thickness of
soils above bedrock based on geophysical results. The resistivity surveys were carried out and analyzed in
the area. The seismic studies carried out in the area shows that Vs ranges from 166 to 330 m/s and
corresponding amplification ratios varies from 3.1 to 2.2. The damage ratio (DR) calculated from these
values were found to be 0.2 and 0.05.
Microzonation of Guwahati contains important maps on different themes including, geology and
geomorphology, seismotectonics, soil characteristics, pre-dominant frequencies, peak ground
acceleration, seismic hazard, demography and preliminary risk etc. The total area has been grouped into
five zones based on the hazard index values, categorized as very high (>0.50) high (0.40-0.50) moderate
(0.30-0.40) low (0.20-30) and very low (< 0.20). Most of the residential area falls in a moderate zone.
Figure 4 shows the hazard index map of Guwahati (Nath, 2007).
Figure 4: Hazard index map of Guwahati (after Nath, 2007)
Seismic Microzonation of Dehradun
Seismic Hazard Assessment and Site Response Study for Seismic Microzonation of Dehradun were
initiated by the International Institute for Geo-Information Science and Earth Observation Enschede,
Netherlands with Indian Institute of Remote Sensing, National Remote Sensing Agency (NRSA)
Department of Space, Dehradun, India. The Seismic microzonation of Dehradun was carried out has three
components by Anusuya Barua (2005) Rajiv Ranjan (2005) and Brijesh Gulati (2006).
Anusuya Barua (2005) acquired, interpreted, compiled and analyzed information on geology and
geomorphology of Doon valley in regional scale and subsurface strata at local scale for Dehradun city to
aid study of seismic hazard assessment and seismic microzonation for ground shaking at specific site. The
database generated for the seismic microzonation contains information on lithology, tectonic, landforms
Bouquet 08 9
and associated neotectonics activity in regional scale as well as subsurface information in city part. These
data of geological and geomorphological information has been used for study of seismic hazard
assessment, liquefaction hazard modelling and seismic microzonation.
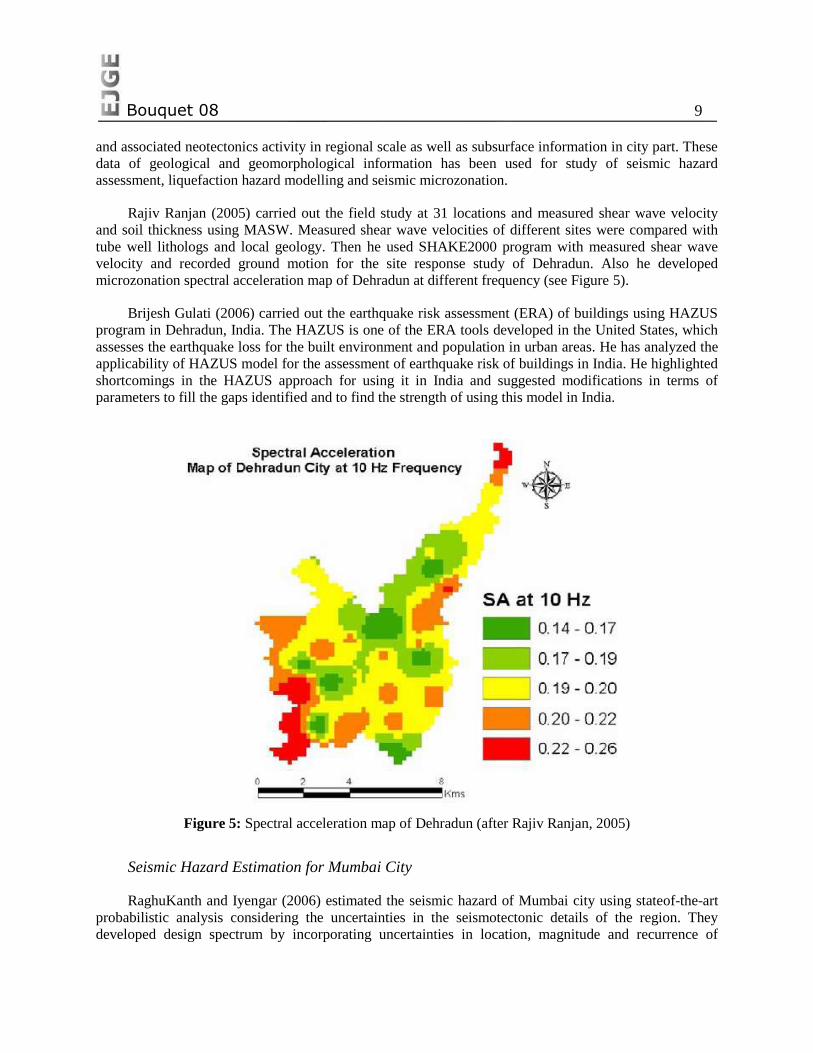
Rajiv Ranjan (2005) carried out the field study at 31 locations and measured shear wave velocity
and soil thickness using MASW. Measured shear wave velocities of different sites were compared with
tube well lithologs and local geology. Then he used SHAKE2000 program with measured shear wave
velocity and recorded ground motion for the site response study of Dehradun. Also he developed
microzonation spectral acceleration map of Dehradun at different frequency (see Figure 5).
Brijesh Gulati (2006) carried out the earthquake risk assessment (ERA) of buildings using HAZUS
program in Dehradun, India. The HAZUS is one of the ERA tools developed in the United States, which
assesses the earthquake loss for the built environment and population in urban areas. He has analyzed the
applicability of HAZUS model for the assessment of earthquake risk of buildings in India. He highlighted
shortcomings in the HAZUS approach for using it in India and suggested modifications in terms of
parameters to fill the gaps identified and to find the strength of using this model in India.
Figure 5: Spectral acceleration map of Dehradun (after Rajiv Ranjan, 2005)
Seismic Hazard Estimation for Mumbai City
RaghuKanth and Iyengar (2006) estimated the seismic hazard of Mumbai city using stateof-the-art
probabilistic analysis considering the uncertainties in the seismotectonic details of the region. They
developed design spectrum by incorporating uncertainties in location, magnitude and recurrence of
Bouquet 08 10
earthquakes. Influence of local site condition was accounted by providing design spectra for A, B,7 C and
D-type sites separately. They highlighted that the results presented can be directly used to create a
microzonation map for Mumbai.
Ongoing Seismic Microzonation Studies of Other Cities in India
The Department of Science & Technology, New Delhi initiated the seismic microzonation of Bhuj,
Kachchh, Ahmedabad, Chennai and Kochi. These projects are ongoing, which are briefly presented
below.
As a part of the microzonation studies in Bhuj, after 2001 earthquake many studies are undertaken to
understand the seismotectonic of regions, installation of arrays of strong motion and broad band
seismographs, site response studies, liquefaction studies, etc. In particular, Mandal et al (2005) Parvez
and Madhukar (2006) Trivedi et al (2006) and Mohanty (2006) are working towards microzonation of
Bhuj, Kachchh and Ahmedabad based on microtremor survey. Mandal et al (2005) estimated the site
response in Kuchchh region using H/V ratio of the aftershocks. Parvez and Madhukar (2006) presented
the preliminary results on site-effects and shear wave velocity structures of sub-surface soil using
microtremor arrays at twenty different sites in Ahmedabad. They highlighted that most of sites are
having the fundamental resonance frequency of 0.6Hz and rest of them is having frequency of 2 to 6Hz
using H/V spectral ratio. 1-D shear wave velocity obtained from microtremor array shows that, upper
most layer having the shear wave velocity of 150-200m/s and below this 400-800m/s up to 60m depth.
Trivedi et al (2006) carried out at 120 different stations and measurements were taken using velocity
sensors for a period of 30 minutes at each station point by using microtremor of MR2002-CE vibration
monitoring system. These tests were carried out exactly at the same locations where seismic refraction
and MASW testing were conducted to study the detailed site response. Horizontal versus vertical (H/V)
spectra using Nakamura method was estimated using VIEW 2002 software and compared with seismic
refraction and MASW testing results. Mohanty (2006) carried out extensive study on identification and
classification of seismic sources in the Kachchh and geological/ geophysical database was prepared using
remote sensing and other conventional data sets (IRS WiFS, LISS-III & PAN images). Analyses and
studies of the geological map of the region was used to establish empirical seismic attenuation model for
Kachchh. Further, the authors computed probabilistic peak ground acceleration (PGA) values of the
region. These PGA values computed for individual faults were superimposed to prepare a combined
hazard zonation map of the area. They also planned to prepare a detailed seismic microzonation maps
taking into account liquefaction.
Suganthi and Boominathan (2006) studied the site response behavior of Chennai soils as part of
seismic hazard and microzonation of Chennai. They carried out the seismic hazard and site response study
using SHAKE 91 and borelog information collected. They highlighted that the ground response analysis
indicates that the occurrence of amplification is only in the low range of frequencies below 0.8Hz based
on analysis at few regions in the study area.
Center for Earth Science Studies planned seismic Microzonation of Kochi city, in GIS environment.
It is planned to use site response by measuring ambient noise (microtremor) with the help of a City Shark
seismic recorder and triaxial 3- component 1s geophones and to relate the responses (ground
amplification) with the available information on geology, geomorphology, lineament patterns, soil type/
lithology, structural features, earthquakes etc. in the region.
Bouquet 08 11
SEISMIC MICROZONATION ISSUES
RELATED TO INDIA
Seismic microzonation in India was initiated in 2001. Even after seven years Indian seismic
microzonation works has many problems, which needs to be properly addressed. These issues can be
broadly classified into three major groups: seismology related, Grade and geology related and
geotechnical related issues.
Issues related to seismology
Issues related seismology are the preparation of regional seismotectonic map and estimation
of seismic hazards:
Preparation of seismotectonic map for the study area
Most of the microzonation works in India does not have a complete seismotectonic map. It is very
much essential that before starting the microzonation work a detailed seismotectonic map for the study
area need to be prepared. A seismotectonic map has to be prepared by considering up to date seismicity,
geological and seismotectonic details for a circular area of radius 300km (approximately 200miles)
around the study area as per Regulatory Guide 1.165(1997). This map can be used for the detailed hazard
estimation.
Seismic hazard estimation
So far most of seismic microzonation maps published in India is based on the deterministic seismic
hazard analysis by considering scenario earthquake. But seismic microzonation hazard estimation need to
consider uncertainties involved in the earthquake and produce the hazard map with required probability
and return periods. Hence, special attention may be given to the probabilistic seismic hazard estimation,
where the uncertainty is quantified and hazards are represented with required probability exceeded in
particular years.
Grade and Geology
The grade/level of the seismic microzonation maps is desired based on scale of the study and
method of estimating hazard parameters as suggested by the TC4 committee of ISSMGE (1993). Geology
is considered for initial stage of the seismic microzonation mapping. Most of the seismic microzonation
maps produced in India, has given more importance to the geology. But recently, it is proved that
considering the geological units as the only criteria in seismic microzonation is not appropriate (Ansal et
al., 2004). It is also highlighted that geology map may be regarded as the basic information to plan
detailed site investigations and to control the reliability of the results obtained by site characterizations
and site response analyses.
Geotechnical Issues
Like hazard estimations, another key issue in the seismic microzonation is the estimation of effects
of earthquake. Basically earthquake effect can be grouped as two major groups, site effects and induced
effects. These effects are based on geotechnical properties and behavior during the earthquake of the
subsurface materials. Hence, more importance needs to be given to the geotechnical properties rather than
Bouquet 08 12
geology. Case studies summarized above shows that, geotechnical properties are not handled properly in
India for assessing the site and induced effects. Site effects are combination of soil and topographical
effects, which can modify the characteristics (amplitude, frequency content and duration) of the incoming
wave field. Most of the Indian seismic microzonation studies show that the modification of waves is
estimated using average 30m shear wave velocity (Vs30
) irrespective of locations. This practice needs to
be completely revised, because Vs30
is not a standard parameter to reflect the site effects. Pitilakis (2004)
shows inability of the Vs30
for estimation of site amplification of soil layers. Particularly large
amplifications of the deep incident wave field are practically absent when amplifications are computed
using the transfer ratio for shallower depths. The authors have also proved that use of Vs30
as a basis for
site amplification is misleading in many cases. Hence it is necessary to use actual engineering rock depth
(shear wave velocity over 760 m/s) rather than Vs30
for amplification study. Another major issue is the
estimation of induced effects such as liquefaction hazard and land slide hazard. Most of case studies
summarized above shows that liquefaction hazard was estimated using the simple, outdated correlations
and attenuation relation without much of local geotechnical knowledge. It is always recommended the
liquefaction hazard has to be estimated based on recent knowledge in earthquake geotechnical
engineering. Most of the land slide hazards in seismic microzonation studies in India were estimated
based on geological knowledge, but it requires detailed geotechnical inputs for precise mapping of
landslide possible area during earthquake.
In this paper an attempt has been made to handle the above issues properly in the case study of
seismic microzonation of Bangalore and to generate the final hazard index maps based on both
deterministic as well as probabilistic approaches. A detailed microzonation study of Bangalore is
summarized in the following sections.
SEISMIC MICROZONATION OF BANGALORE: A CASE STUDY
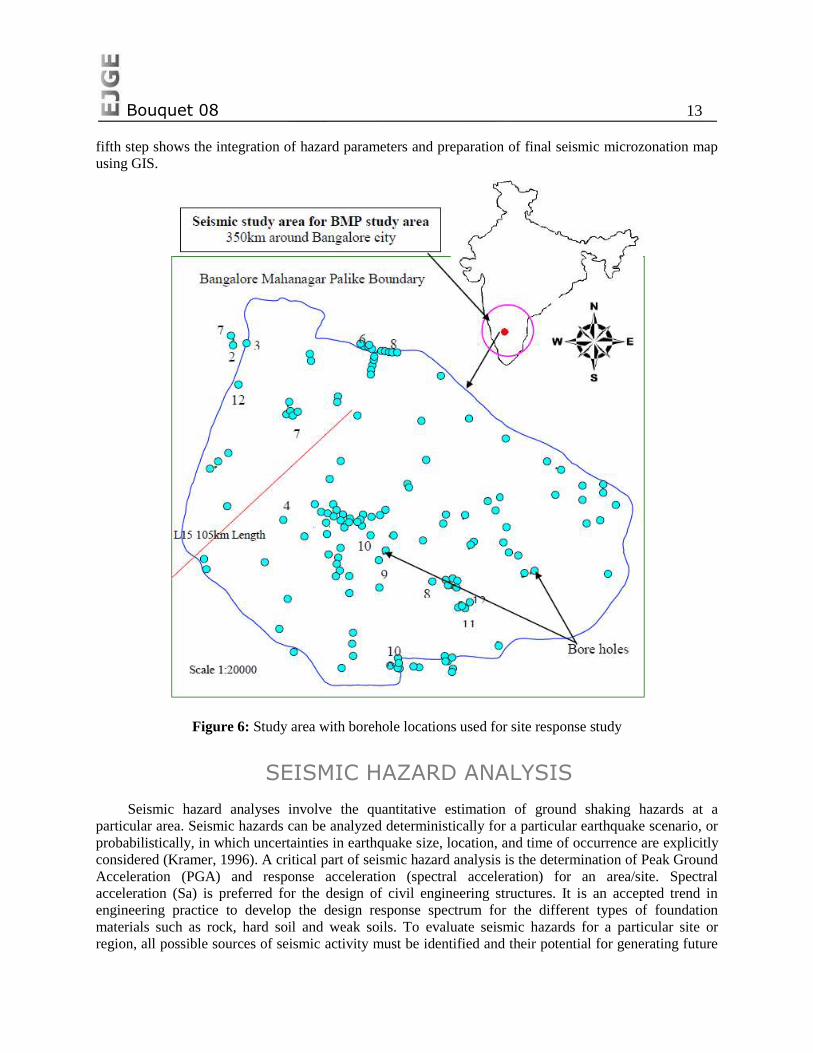
The area of study is limited to Bangalore Metropolis area (Bangalore Mahanagar Palike) of about
220 km2. Bangalore is situated on a latitude of 12o 58' North and longitude of 77o 36' East and is at an
average altitude of around 910m above mean sea level (MSL). For the seismic microzonation study, the
base map is prepared using geographical information system (GIS) with several layers of information in
ArcGIS 9.2. Some of the important layers considered are the boundaries (Outer and Administrative)
Highways, Major roads, Minor roads, Streets, Rail roads, Water bodies, Drains, Landmarks and Bore
locations. Study area with selected geotechnical boreholes for ground response analysis along with
location of Bangalore in India map is shown in Figure 6.
The present investigation was carried out with a scale of 1:20,000 and ground motions are arrived
based on the detailed geotechnical/geophysical investigations and ground response analysis. Hence, this
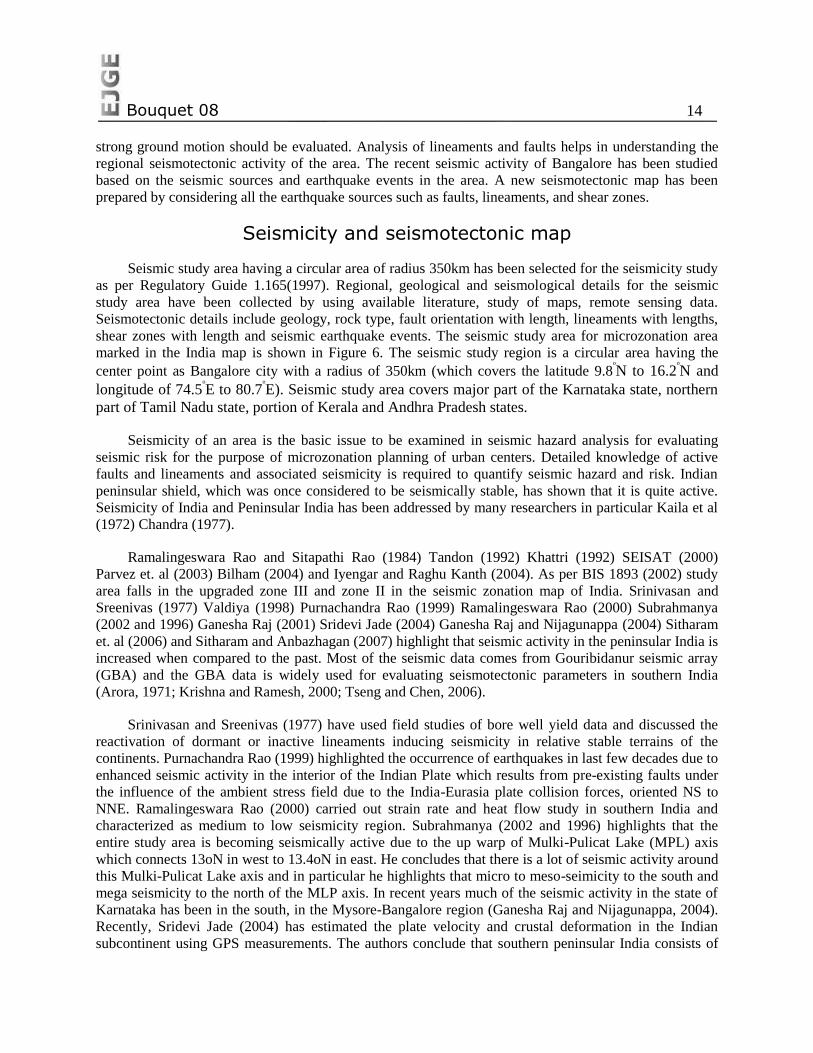
study can be graded as grade III (Level III) seismic microzonation. A generalized methodology has been
formulated by considering essential five steps for seismic microzonation suitable for flat terrain, where
landslide, tsunami possibilities are remote. The steps followed in seismic hazard and microzonation of
Bangalore in the present investigation is illustrated in the form of a flow chart in Figure 7. The first step
illustrates the assessment the expected ground motion using the deterministic and probabilistic seismic
hazard analysis. The site characterization for the study area is done at local scale of 1:20,000 using
geotechnical and shallow subsurface geophysical data and is discussed in the next step. Third step is the
study of local site effects using first and second part output data and producing the ground level hazard
parameters maps. Fourth step is the assessment of induced site effects such as liquefaction, land
instability and Tsunami. Due to remote possibilities of land slides and Tsunami, figure 7 shows only the
assessment of liquefaction potential in terms of factor of safety against liquefaction for fourth step. The
Bouquet 08 13
fifth step shows the integration of hazard parameters and preparation of final seismic microzonation map
using GIS.
Figure 6: Study area with borehole locations used for site response study
SEISMIC HAZARD ANALYSIS
Seismic hazard analyses involve the quantitative estimation of ground shaking hazards at a
particular area. Seismic hazards can be analyzed deterministically for a particular earthquake scenario, or
probabilistically, in which uncertainties in earthquake size, location, and time of occurrence are explicitly
considered (Kramer, 1996). A critical part of seismic hazard analysis is the determination of Peak Ground
Acceleration (PGA) and response acceleration (spectral acceleration) for an area/site. Spectral
acceleration (Sa) is preferred for the design of civil engineering structures. It is an accepted trend in
engineering practice to develop the design response spectrum for the different types of foundation
materials such as rock, hard soil and weak soils. To evaluate seismic hazards for a particular site or
region, all possible sources of seismic activity must be identified and their potential for generating future
Bouquet 08 14
strong ground motion should be evaluated. Analysis of lineaments and faults helps in understanding the
regional seismotectonic activity of the area. The recent seismic activity of Bangalore has been studied
based on the seismic sources and earthquake events in the area. A new seismotectonic map has been
prepared by considering all the earthquake sources such as faults, lineaments, and shear zones.
Seismicity and seismotectonic map
Seismic study area having a circular area of radius 350km has been selected for the seismicity study
as per Regulatory Guide 1.165(1997). Regional, geological and seismological details for the seismic
study area have been collected by using available literature, study of maps, remote sensing data.
Seismotectonic details include geology, rock type, fault orientation with length, lineaments with lengths,
shear zones with length and seismic earthquake events. The seismic study area for microzonation area
marked in the India map is shown in Figure 6. The seismic study region is a circular area having the
center point as Bangalore city with a radius of 350km (which covers the latitude 9.8o
N to 16.2o
N and
longitude of 74.5o
E to 80.7o
E). Seismic study area covers major part of the Karnataka state, northern
part of Tamil Nadu state, portion of Kerala and Andhra Pradesh states.
Seismicity of an area is the basic issue to be examined in seismic hazard analysis for evaluating
seismic risk for the purpose of microzonation planning of urban centers. Detailed knowledge of active
faults and lineaments and associated seismicity is required to quantify seismic hazard and risk. Indian
peninsular shield, which was once considered to be seismically stable, has shown that it is quite active.
Seismicity of India and Peninsular India has been addressed by many researchers in particular Kaila et al
(1972) Chandra (1977).
Ramalingeswara Rao and Sitapathi Rao (1984) Tandon (1992) Khattri (1992) SEISAT (2000)
Parvez et. al (2003) Bilham (2004) and Iyengar and Raghu Kanth (2004). As per BIS 1893 (2002) study
area falls in the upgraded zone III and zone II in the seismic zonation map of India. Srinivasan and
Sreenivas (1977) Valdiya (1998) Purnachandra Rao (1999) Ramalingeswara Rao (2000) Subrahmanya
(2002 and 1996) Ganesha Raj (2001) Sridevi Jade (2004) Ganesha Raj and Nijagunappa (2004) Sitharam
et. al (2006) and Sitharam and Anbazhagan (2007) highlight that seismic activity in the peninsular India is
increased when compared to the past. Most of the seismic data comes from Gouribidanur seismic array
(GBA) and the GBA data is widely used for evaluating seismotectonic parameters in southern India
(Arora, 1971; Krishna and Ramesh, 2000; Tseng and Chen, 2006).
Srinivasan and Sreenivas (1977) have used field studies of bore well yield data and discussed the
reactivation of dormant or inactive lineaments inducing seismicity in relative stable terrains of the
continents. Purnachandra Rao (1999) highlighted the occurrence of earthquakes in last few decades due to
enhanced seismic activity in the interior of the Indian Plate which results from pre-existing faults under
the influence of the ambient stress field due to the India-Eurasia plate collision forces, oriented NS to
NNE. Ramalingeswara Rao (2000) carried out strain rate and heat flow study in southern India and
characterized as medium to low seismicity region. Subrahmanya (2002 and 1996) highlights that the
entire study area is becoming seismically active due to the up warp of Mulki-Pulicat Lake (MPL) axis
which connects 13oN in west to 13.4oN in east. He concludes that there is a lot of seismic activity around
this Mulki-Pulicat Lake axis and in particular he highlights that micro to meso-seimicity to the south and
mega seismicity to the north of the MLP axis. In recent years much of the seismic activity in the state of
Karnataka has been in the south, in the Mysore-Bangalore region (Ganesha Raj and Nijagunappa, 2004).
Recently, Sridevi Jade (2004) has estimated the plate velocity and crustal deformation in the Indian
subcontinent using GPS measurements. The authors conclude that southern peninsular India consists of
Bouquet 08 15
large zones of complex folding, major and minor faults and granulite exposures, and this region cannot be
classified as an area of low seismic activity. All these authors highlight that the seismic activity of the
south India has shown an increasing trend.
Figure 7: Flow chart for seismic microzonation

Bouquet 08 16
Seismic data collected from various agencies [United State Geological Survey (USGS) Indian
Metrological Department (IMD) New Delhi; Geological Survey of India (GSI) and Amateur Seismic
Centre (ASC) National Geophysical Research Institute (NGRI),Hyderabad; Centre for Earth Science
Studies (CESS) Akkulam, Kerala and Gauribindanur (GB) Seismic station] contain information about the
earthquake size in different scales such as intensity, local magnitude or Richter magnitude and body wave
magnitudes. These magnitudes are converted to moment magnitudes (Mw) to achieve the status of the
uniform magnitude by using magnitude relations given by Heaton et al. (1986). The earthquake events
collated are about 1421 with minimum moment magnitude of 1.0 and a maximum of 6.2. About 1421
earthquakes have been collated and their magnitudes were converted to moment magnitude scale. The
data set contains 394 events which are less than moment magnitude 3, 790 events from 3 to 3.9, 212
events from 4 to 4.9, 22 events from 5 to 5.9 and 3 events which are more than moment magnitude 6.
Maximum earthquake magnitude out of about 1421 events reported in the study area is 6.2. Out of 1421
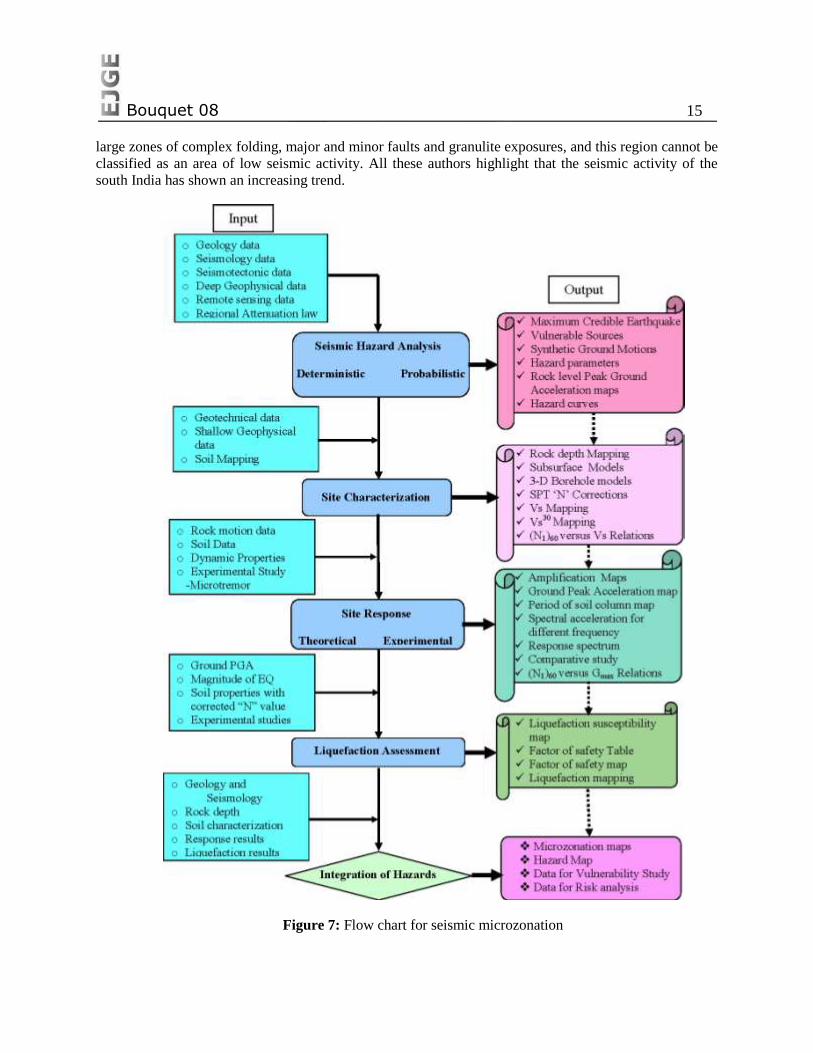
seismic data, about 1340 data was collected from the record of Gauribidanur seismic array (GBA) which
is in operation for long time, having geographic coordinates of the array center point, 13o36‘15‘‘N,
77o26‘10‖E. GBA seismic station is about 85km away from the center of the study area. The GBA has an
L-shaped configuration with dimensions of about 22 x 22 km2 and a tight station interval of about 2.5 km
(see Figure 8). Data set is unique; it is the only array data available in the public domain to study seismic
properties of the south India. GBA data is widely used for evaluating seismotectonic parameters in south
India in particular by Arora(1971) for earth‘s crust study, Krishna and Ramesh (2000) for the study of
propagation of crustal wave guide characteristics, Tseng and Chen (2006) for profiling P-Wave receiver-
function for south India. Seismic data collected from 1977 to 1995 from GBA is used for this study. Other
agencies have been established seismic stations recently and data for the last 10 years are also collected
and used in this study. On January 29th of 2001, earthquake of magnitude 4.3 in Richter scale hit the
Mandya area, its epicenter was about 65 km southwest of Bangalore. More than 50 buildings are reported
to be damaged at Harohalli/ Kanakapura. It caused widespread panic in Bangalore and schools were
closed. Minor damages are reported at Austin town and airport road in Bangalore. Even the Killari
earthquake of 30th September 1993 and Bhuj earthquake 2001 were felt in Bangalore. Sumatra
earthquake of 2004 had triggered tremors of intensity IV in Bangalore.
The well defined and documented seismic sources are published in the Seismotectonic Atlas-2000
published by Geological Survey of India. Geological survey of India has compiled all the available
geological, geophysical and seismological data for entire India and has published a seismotectonic map in
2000. Seismotectonic atlas (SEISAT, 2000) contains 43 maps in 42 sheets of 3ox4o sizes with scale of
1:1 million, which also describes the tectonic frame work and seismicity. SEISAT is prepared with
intention that it can be used for the seismic hazard analysis of Indian cities. In this analysis about 6
SEISAT maps are merged, seismic sources are digitalized within the seismic study area to prepare
seismotectonic map. Seismicity and activity of the plate tectonic will always change based on neotectonic
activity of the region. Thus it is necessary that any seismic hazard should include recent seismicity. An
extensive literature has been carried out to collect seismic sources from recent publications. Ganesha Raj
and Nijagunappa (2004) have mapped major lineaments of Karnataka State with length more than 100 km
using satellite remote sensing data and correlated with the earthquake occurrences. They have highlighted
that there are 43 major lineaments and 33 earthquake occurrences with magnitude above 3 (since 1828) in
the State. About 23 of these earthquakes were associated with 8 major lineaments, which they have
named as active lineaments. The Mandya-Channapatna-Bangalore lineament, Lakshman ThirthaKRS-
Bangalore lineament, and Chelur-Kolar-Battipalle lineament are some of the seismically active
lineaments identified by the authors. They have also stated that earthquakes are confined to the southern
part of the state indicating that south Karnataka is seismically more active. The authors have also
recommended the need to upgrade the seismic zonation map of Karnataka especially for areas
Bouquet 08 17
surrounding Mandya, Bangalore, and Kolar. Karnataka lineaments published by Ganesha Raj and
Nijagunappa (2004) using remote sensing data are also considered in the present study.
Figure 8: Pattern of the location of receivers in Gauribindanur Array.
The sources identified from SEISAT (2000) and remote sensing studies are compiled and a
seismotectonic map has been prepared using Adobe Illustrator version 9.0. The seismotectonic map
contains 65 numbers of faults with length varying from 9.73 km to 323.5km, 34 lineaments and 14 shear
zones. The converted earthquake events have been super imposed on source map with available latitudes
and longitudes. The earthquake events collated are about 1421 with minimum moment magnitude of 1.0
and a maximum of 6.2 and earthquake magnitudes are shown as symbols with different shape and
colours. Seismotectonic map showing the geology, geomorphology, water features, faults, lineaments,
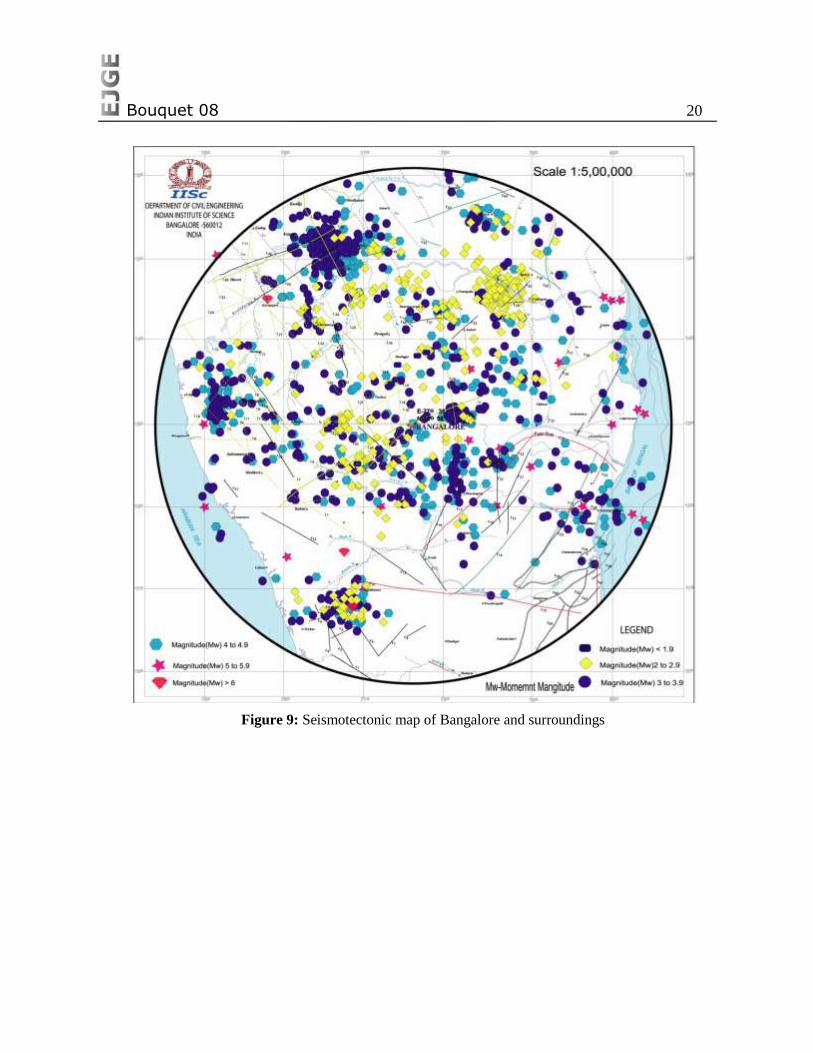
shear zone and past earthquake events has been prepared for Bangalore which is as shown in Figure 9.
From the Figure 9, there are cluster of earthquakes having a moment magnitude (Mw) of 2 to 2.9 found at
intersection of 10.8o N and 76.9o E, 12.5o N and 76.5o E, 13.0o N and 76.5o E, 14.3o N and 78.0o E and
14.5o N and 78.6o E. Mw of 3.to 3.9 at more frequently occurred at intersection of 15.1o N and 76.8o E,
Mw of 4-4.9 distributed throughout the study area and clustered at two locations (13.2o N and 75.1o E
and 15.1o N and 76.6o E). The range of 5 to 5.9 randomly distributed in the study area and reported close
to the study area. Magnitude 6 and above (3 events) are reported around Coimbatore and Bellary within
the study area.
Bouquet 08 18
Deterministic seismic hazard analysis
Deterministic Seismic Hazard Analysis (DSHA) for Bangalore has been carried out by considering
the past earthquakes, assumed subsurface fault rupture lengths and point source synthetic ground motion
model. Source magnitude for each source is chosen from the maximum reported past earthquake close to
that source and shortest distance from each source to Bangalore is arrived from the newly prepared
seismotectonic map. Using these details and regional attenuation relation developed for southern India by
Iyengar and Raghukanth (2004) the peak ground acceleration (PGA) has been estimated. The analysis
shows that the minimum PGA value is 0.001g and maximum PGA value is 0.146g (caused from Mandya-
Channapatna-Bangalore lineament, see L15 in Figure 9). Totally 10 sources have generated higher PGA
values close to Bangalore. Among the 10 sources, the active lineament of Mandya-Channapatna-
Bangalore lineament having a length of about 105km (which is 5.2km away from the Bangalore city
center) causing a PGA value of 0.146g due to an earthquake event (Mw of 5.1 occurred on 16th May
1972; corresponds to a latitude of 12.4°N and longitude of 77.0°E). This is a measured earthquake event
having a surface wave magnitude (ms) of 4.6. To estimate the expected magnitude for seismic source, a
parametric study has been carried out to find subsurface rupture length of the fault using past earthquake
data and Wells and Coppersmith (1994) relation between the subsurface lengths versus earthquake
magnitudes. About more than 60% of earthquake magnitude matches with the subsurface length
corresponding to 3.8% of the total length of fault. The expected maximum magnitude for each source has
been evaluated by assuming that the seismic source can be ruptured at subsurface level for a length of
3.8% of the total length of source. The expected magnitude calculated matches well with occurred
earthquake for many sources. Expected magnitude are lower (in the range of 0.5 to 1.5) than occurred
magnitude for 12% of the total sources and higher than (in the range of 0.5 to 1.5) occurred magnitude for
25% of the total sources. In general, estimated magnitudes are lower for the larger occurred magnitudes
(>5.7) and higher for the smaller occurred magnitudes (<4.6). The PGA for Bangalore has been estimated
using expected magnitudes and regional attenuation relation. The estimated PGA using expected
magnitude varies in between 0.001g to 0.153g. In total, 9 sources have generated PGA values of more
than 0.045g at rock level for Bangalore region. Among the nine sources, 3 sources have generated
considerably higher PGA values for Bangalore (i) the Arkavati fault (F47 in Figure 9) which is 51.24km
away from Bangalore and having a length of about 125km gives PGA of 0.047g (0.025g for occurred
earthquake). (ii) Chelur-Kolar-Battipalle Lineament (L20 in Figure 9) having a length of about 111 km,
which is 57.6km away from Bangalore causing a PGA value of 0.038g (0.037g for occurred earthquake).
(iii) Mandya-Channapatna-Bangalore lineament having a length of about 105km which is 5.2km away
from Bangalore causing a PGA value of 0.153g (0.146g for occurred earthquake). This study shows that
expected magnitude of Mw 5.1 is close to L15 causing maximum PGA to Bangalore and hence this
magnitude is considered as maximum credible earthquake for Bangalore. Microzonation requires the
estimation of site effects for a maximum earthquake estimated arrived from hazard analysis. To study the
effects of earthquake in the local scale level, the particular earthquake record/ground motion in the form
of time series is required. For the area having poor seismic record, synthetic ground motion models is the
alternative. In this study, seismological model developed by Boore (1983, 2003) SMSIM program, has
been used to generate synthetic ground motions considering regional seismotectonic parameters, more
details found in Sitharam and Anbazhagan (2007). Considering seismogenic source L15 and MCE of 5.1,
the synthetic ground motions are developed corresponding geotechnical and geophysical test locations.
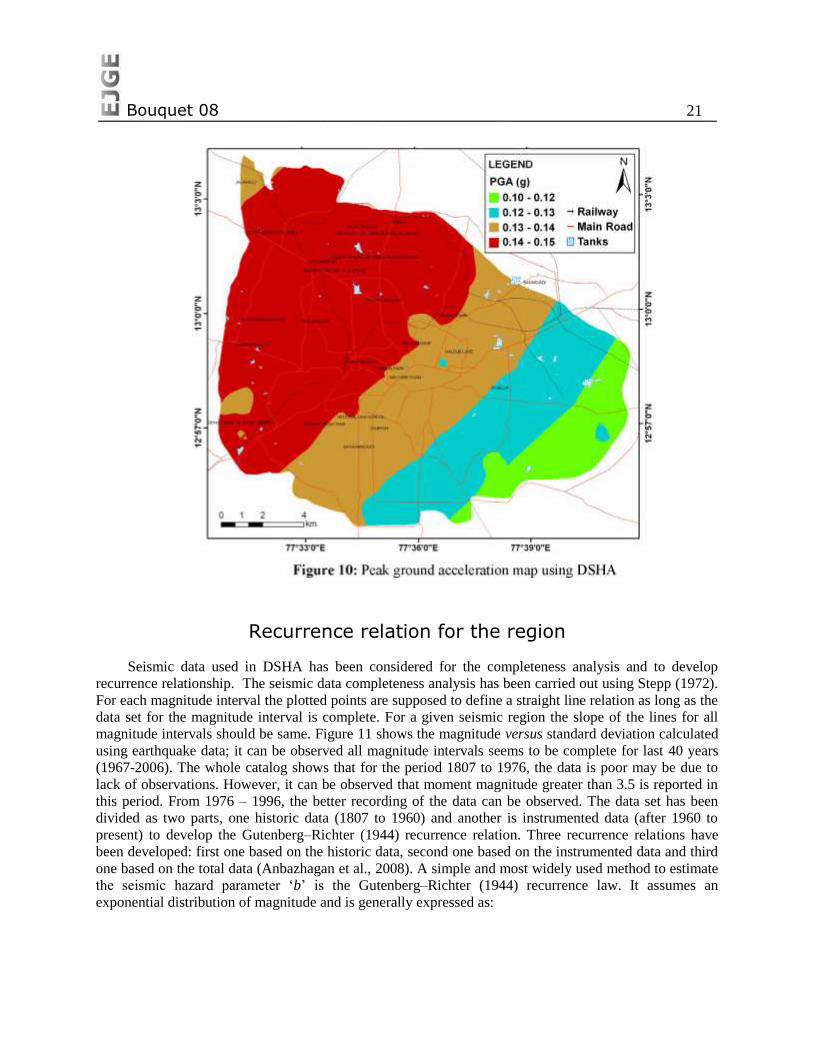
The rock level PGA has been arrived from the synthetic ground motions developed at 653 locations in the
BMP area. Using these PGA values at rock level PGA map has been prepared, which is as shown in
Figure 10. The rock level PGA values determined from model matches well with the regional attenuation
relation and shape of the synthetic spectral acceleration matches with the shape of uniform hazard
spectrum.
Bouquet 08 19
Probabilistic seismic hazard analysis
Even though DSHA gives the higher PGA based on the seismogenic source and MCE, it does not
consider the uncertainty involved in distance, size of magnitude and attenuation relation and also it is not
developed for a specific return period. Hence this section presents estimation of PGA using the
probabilistic approach, which includes effects of all the earthquakes expected to occur at different
locations during a specified life period which are considered along with associated uncertainties and
randomness of earthquake occurrences and attenuation of seismic waves with distance. The probabilistic
seismic hazard analysis evaluates the hazard in terms of composite probability distribution functions for a
selected strong ground motion at a site of interest due to all the earthquakes expected to occur during a
specified exposure period in the area around the site. PSHA is the most commonly used approach to
evaluate the seismic design load for the important engineering projects. PSHA method was initially
developed by Cornell (1968) and its computer form was developed by McGuire (1976 and 1978) and
Algermissen and Perkins (1976). McGuire developed EqRisk in the year 1976 and FRISK in the year
1978. Algermissen and Perkins (1976) developed RISK4a, presently called as SeisRisk III. Site ground
motions are estimated for selected values of the probability of ground motion exceedance in a design
period of the structures or for selected values of annual frequency or return period for ground motion
exceedance. The probabilistic approach offers a rational framework for risk management by taking
account of the frequency or probability of exceedance of the ground motion against which a structure or
facility is designed. The occurrence of earthquakes in a seismic source is assumed as the Poisson
distribution. The probability distribution is defined in terms of the annual rate of exceeding the ground
motion level z at the site under consideration (ν (z) ) due to all possible pairs (M, R) of the magnitude and
epicentral distance of the earthquake event expected around the site, considering its random nature. The
probability of ground motion parameter at a given site, Z, will exceed a specified level, z, during a
specified time, T and it is represented by the expression:
P(Z > z) = 1− e−ν (z)T ≤ ν (z) T (1)
Where ν(z) is (mean annual rate of exceedance) the average frequency during time period T at
which the level of ground motion parameters, Z, exceed level z at a given site. The function ν(z)
incorporates the uncertainty in time, size and location of future earthquakes and uncertainty in the level of
ground motion they produce at the site. It is given by:
(2)
Where Nn (m0) is the frequency of earthquakes on seismic source n above a minimum magnitude m0
that is taken as 4.0 in this work (magnitude less than 4 is considered to be insignificant). fn(m) is the
probability density function for minimum magnitude of m0 and maximum magnitude of m
u; fn(r|m) is the
conditional probability density function for distance to earthquake rupture; P(Z>z|m, r) is the probability
that given a magnitude ‗m‘ earthquake at a distance ‗r’ from the site, the ground motion exceeds level z.
Bouquet 08 20
Figure 9: Seismotectonic map of Bangalore and surroundings
Bouquet 08 21
Recurrence relation for the region
Seismic data used in DSHA has been considered for the completeness analysis and to develop
recurrence relationship. The seismic data completeness analysis has been carried out using Stepp (1972).
For each magnitude interval the plotted points are supposed to define a straight line relation as long as the
data set for the magnitude interval is complete. For a given seismic region the slope of the lines for all
magnitude intervals should be same. Figure 11 shows the magnitude versus standard deviation calculated
using earthquake data; it can be observed all magnitude intervals seems to be complete for last 40 years
(1967-2006). The whole catalog shows that for the period 1807 to 1976, the data is poor may be due to
lack of observations. However, it can be observed that moment magnitude greater than 3.5 is reported in
this period. From 1976 – 1996, the better recording of the data can be observed. The data set has been
divided as two parts, one historic data (1807 to 1960) and another is instrumented data (after 1960 to
present) to develop the Gutenberg–Richter (1944) recurrence relation. Three recurrence relations have
been developed: first one based on the historic data, second one based on the instrumented data and third
one based on the total data (Anbazhagan et al., 2008). A simple and most widely used method to estimate
the seismic hazard parameter ‗b‘ is the Gutenberg–Richter (1944) recurrence law. It assumes an
exponential distribution of magnitude and is generally expressed as:

Bouquet 08 22
LogN = a − bM (3)
For a certain range and time interval, Eq. (3) will provide the number of earthquakes (N) with
magnitude M and larger. Where ‗a‘ and ‗b‘ are positive, real constants. ‗a‘ describes the seismic activity
(log number of events with M>=0) and ‗b‘ which is typically close to 1 is a tectonics parameter
describing the relative abundance of large to smaller shocks. The number of earthquakes per decade was
divided in to five magnitude ranges such as 2 = M < 3; 3 = M < 4; 4 = M < 5; M ≥ 5. The time history of
historic data with the logarithm of the cumulative earthquake per year for M, where M is the magnitude in
particular interval is developed for three cases by Anbazhagan et al. (2008). An interval of 0.5 is taken for
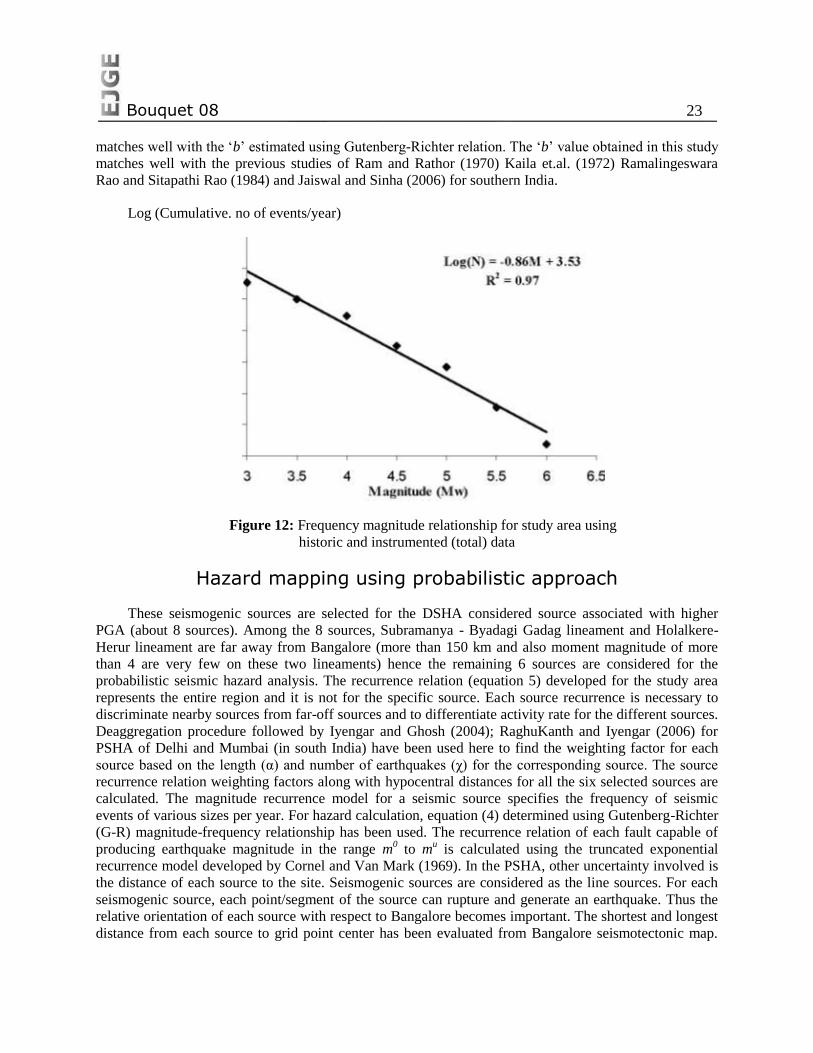
grouping the data while computing the ‗b‘ value. Figure 12 presents the time history of historic and
instrumented (total) data with corresponding frequency magnitude distribution plot which is as follows:
log(N) =3.52 − 0.86M (4)
From the above three approaches, seismic parameter ‗b‘ value of the region varies from 0.62 to 0.98.
Further seismic hazard parameters were also evaluated using all the earthquake data set, which is also
termed as mixed data set. Kijko and Sellevoll (1989, 1992) have presented a versatile statistical method
based on the maximum likelihood estimation of earthquake hazard parameters for the mixed data set.
Analysis was carried out using the computer program of Kijko and Sellevoll (HN2, Release 2.10, 2005).
A threshold magnitude value of 3.0 and standard deviation value of 0.2 were used in the analysis. From
the maximum likelihood solution, Mmax = 6 ± 0.5 and ‗b‘ value 0.87 ± 0.03 were obtained. From the
analysis it was observed that, seismic parameter for the region with a ‗b‘ value if 0.87 ± 0.03, which
Bouquet 08 23
matches well with the ‗b‘ estimated using Gutenberg-Richter relation. The ‗b‘ value obtained in this study
matches well with the previous studies of Ram and Rathor (1970) Kaila et.al. (1972) Ramalingeswara
Rao and Sitapathi Rao (1984) and Jaiswal and Sinha (2006) for southern India.
Log (Cumulative. no of events/year)
Figure 12: Frequency magnitude relationship for study area using
historic and instrumented (total) data
Hazard mapping using probabilistic approach
These seismogenic sources are selected for the DSHA considered source associated with higher
PGA (about 8 sources). Among the 8 sources, Subramanya - Byadagi Gadag lineament and Holalkere-
Herur lineament are far away from Bangalore (more than 150 km and also moment magnitude of more
than 4 are very few on these two lineaments) hence the remaining 6 sources are considered for the
probabilistic seismic hazard analysis. The recurrence relation (equation 5) developed for the study area
represents the entire region and it is not for the specific source. Each source recurrence is necessary to
discriminate nearby sources from far-off sources and to differentiate activity rate for the different sources.
Deaggregation procedure followed by Iyengar and Ghosh (2004); RaghuKanth and Iyengar (2006) for
PSHA of Delhi and Mumbai (in south India) have been used here to find the weighting factor for each
source based on the length (α) and number of earthquakes (χ) for the corresponding source. The source
recurrence relation weighting factors along with hypocentral distances for all the six selected sources are
calculated. The magnitude recurrence model for a seismic source specifies the frequency of seismic
events of various sizes per year. For hazard calculation, equation (4) determined using Gutenberg-Richter
(G-R) magnitude-frequency relationship has been used. The recurrence relation of each fault capable of
producing earthquake magnitude in the range m0 to m
u is calculated using the truncated exponential
recurrence model developed by Cornel and Van Mark (1969). In the PSHA, other uncertainty involved is
the distance of each source to the site. Seismogenic sources are considered as the line sources. For each
seismogenic source, each point/segment of the source can rupture and generate an earthquake. Thus the
relative orientation of each source with respect to Bangalore becomes important. The shortest and longest
distance from each source to grid point center has been evaluated from Bangalore seismotectonic map.
Bouquet 08 24
The probability distribution for the hypocenter distances, from any site to the earthquake rupture on the
source, is computed conditionally for the earthquake magnitude. Generally, the rupture length is a
function of the magnitude. The conditional probability distribution function of the hypocentral distance R,
for an earthquake magnitude M=m for a ruptured segment, is assumed to be uniformly distributed along a
fault and is given by Kiureghian and Ang (1977). In hazard analysis the ground motion parameters are
estimated from the predictive ground motion relation in terms of PGA and spectral acceleration. These
attenuation relations are obtained from regression, which is associated with the randomness of predictive
equations. Uncertainty involved in these equations can be accounted by calculating the probability of
exceedance of a particular value by the attenuation equation. The normal cumulative distribution function
has a value which is most efficiently expressed in terms of the standard normal variables (z) which can be
computed for any random variables using transformation as given by Kramer (1996).
The summation of all the probabilities is termed as hazard curve, which is plotted as mean annual
rate of exceedance (and its reciprocal is defined as the return period) versus the corresponding ground
motion. The mean annual rate of exceedance has been calculated for six seismogenic sources separately
and summation of these representing the cumulative hazard curve. Analyses have been carried out using
a MATLAB program which has been developed for this purpose. The hazard curves and UHRS 10%
probability exceedance in 50 years are calculated for about 1400 grid points. The mean annual rate of
exceedance versus peak ground acceleration for all the sources at rock level for all the grid point. This
clearly highlights that the sources close to Bangalore produce more hazard when compared to the sources
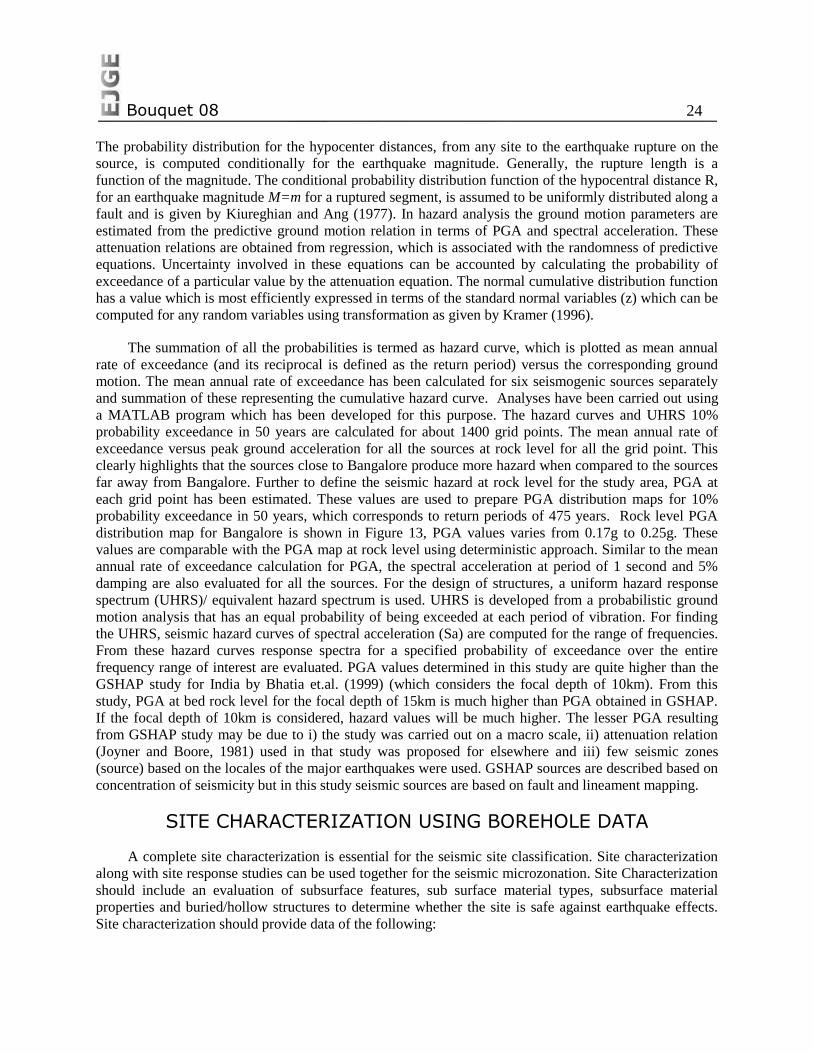
far away from Bangalore. Further to define the seismic hazard at rock level for the study area, PGA at
each grid point has been estimated. These values are used to prepare PGA distribution maps for 10%
probability exceedance in 50 years, which corresponds to return periods of 475 years. Rock level PGA
distribution map for Bangalore is shown in Figure 13, PGA values varies from 0.17g to 0.25g. These
values are comparable with the PGA map at rock level using deterministic approach. Similar to the mean
annual rate of exceedance calculation for PGA, the spectral acceleration at period of 1 second and 5%
damping are also evaluated for all the sources. For the design of structures, a uniform hazard response
spectrum (UHRS)/ equivalent hazard spectrum is used. UHRS is developed from a probabilistic ground
motion analysis that has an equal probability of being exceeded at each period of vibration. For finding
the UHRS, seismic hazard curves of spectral acceleration (Sa) are computed for the range of frequencies.
From these hazard curves response spectra for a specified probability of exceedance over the entire
frequency range of interest are evaluated. PGA values determined in this study are quite higher than the
GSHAP study for India by Bhatia et.al. (1999) (which considers the focal depth of 10km). From this
study, PGA at bed rock level for the focal depth of 15km is much higher than PGA obtained in GSHAP.
If the focal depth of 10km is considered, hazard values will be much higher. The lesser PGA resulting
from GSHAP study may be due to i) the study was carried out on a macro scale, ii) attenuation relation
(Joyner and Boore, 1981) used in that study was proposed for elsewhere and iii) few seismic zones
(source) based on the locales of the major earthquakes were used. GSHAP sources are described based on
concentration of seismicity but in this study seismic sources are based on fault and lineament mapping.
SITE CHARACTERIZATION USING BOREHOLE DATA
A complete site characterization is essential for the seismic site classification. Site characterization
along with site response studies can be used together for the seismic microzonation. Site Characterization
should include an evaluation of subsurface features, sub surface material types, subsurface material
properties and buried/hollow structures to determine whether the site is safe against earthquake effects.
Site characterization should provide data of the following:
Bouquet 08 25
Site description and location
Geotechnical data
Soil conditions
Geological data
Hydrogeology/ ground water data
Aquifer or permeable characteristics
Assessment of available data should include an analysis of the sufficiency and validity of the data in
relation to the proposed application/ study.
As part of the site characterization, experimental data should be collected, interpolated and
represented in the form of maps. The representation maps can be further used for the site classification
and seismic studies. Here, an attempt has been made to characterize Bangalore site using geotechnical
and geophysical experimental data. About 850 collected geotechnical borehole information with standard
penetration ―N‖ values and 58 geophysical test data using multichannel analysis of surface wave are used
for Bangalore site characterization.
The geotechnical data was collected from Archives of Torsteel Research Foundation, Bangalore and
Indian Institute of Science, Bangalore. GIS based model helps in data management, to develop
geostatistical functions, 3-dimensional (3-D) visualization of subsurface with geo-processing capability
and future scope for web based subsurface mapping tool. This is envisaged not only in economizing
geotechnical investigations and to aid in detailed site investigations for major projects. For the
geotechnical site characterization three major tasks has been carried out are as presented below.
(1) Development of digitized map of Bangalore city with several layers of information.
(2) Development of GIS database for collating and synthesizing geotechnical data available with
different sources.
(3) Development of 3-dimensional view of subsoil stratums presenting various geotechnical
properties such as location details, physical properties, grain size distribution, Atterberg limits, SPT ‗N‘
values and strength properties for soil and rock along with depth in appropriate format.
Bouquet 08 26
GIS has been used in geosciences for data collection, organization and distribution of geological
data and maps. Visualization is another GIS activity, which is very useful for the purpose of
microzonation. ArcGIS 9.2 has been used here with 3-D analyst extension. The 3-D subsurface model
with geotechnical data has been generated with development of base map of study area (220 km2) with
several layers of information (such as Outer and Administrative boundaries, Contours, Highways, Major
roads, Minor roads, Streets, Rail roads, Water bodies, Drains, Landmarks and Borehole locations). GIS
database for collating and synthesizing geotechnical data available with different sources and 3-
dimensional view of soil stratum presenting various geotechnical parameters with depth in appropriate
format has been developed. The boreholes are represented as 3-dimensional objects projecting below the
map layer in 0.5m intervals. Also image files of bore logs and properties table has been attached to
location in plan. These 3-D boreholes are generated with several layers with a bore location in each layer
overlapping one below the other and each layer representing 0.5 m interval of the subsurface. It consists
of several donut elements in different layers placed coinciding one below the other. Topmost donut
represents the 0.5m depth of surface strata and thereon each donut cumulates to 0.5m below ground level.
Each borehole in this model is attached with geotechnical data along the depth. The data consists of visual
soil classification, standard penetration test results, ground water level, time during which test has been
carried out, other physical and engineering properties of soil. The model provides two options to view the
data at each borehole in order to cater for various groups. In 2-D, clicking on a borehole will display the
Bouquet 08 27
standard bore log information and the respective properties table consisting of index properties and shear
strength parameters. Apart from this each donut of any borehole is attached with soil/rock properties at
that particular depth. As such when this model is viewed in 3-D, geotechnical information on any
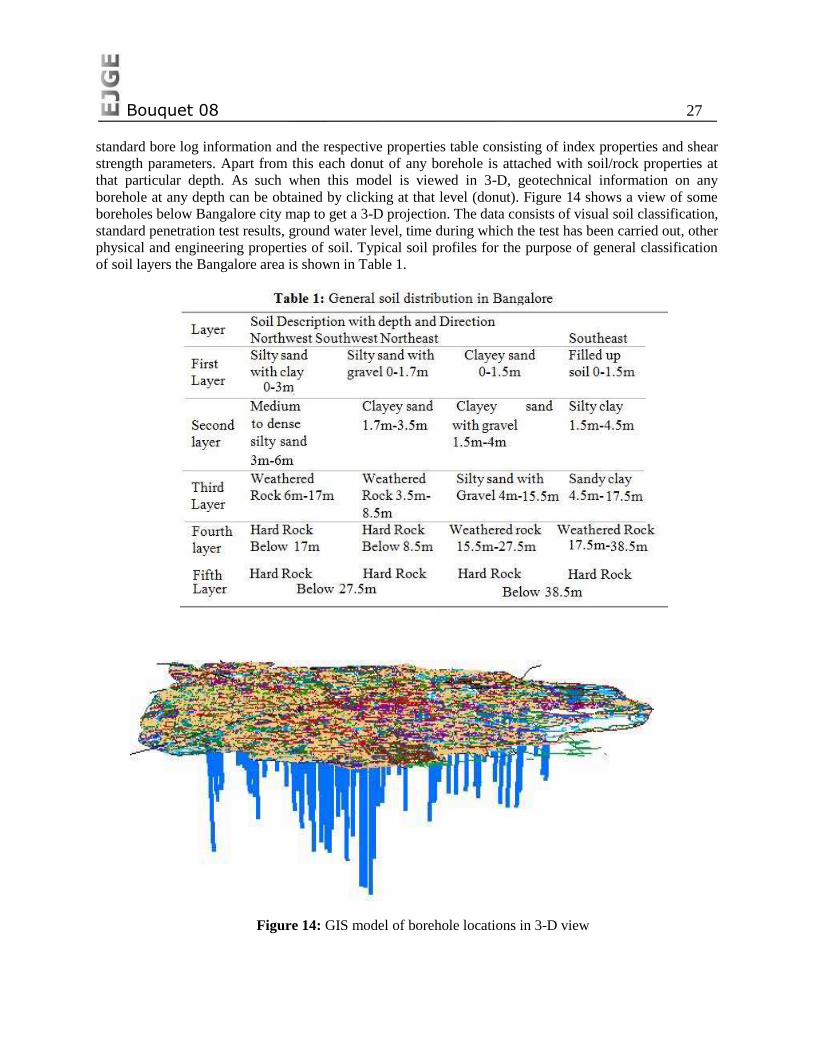
borehole at any depth can be obtained by clicking at that level (donut). Figure 14 shows a view of some
boreholes below Bangalore city map to get a 3-D projection. The data consists of visual soil classification,
standard penetration test results, ground water level, time during which the test has been carried out, other
physical and engineering properties of soil. Typical soil profiles for the purpose of general classification
of soil layers the Bangalore area is shown in Table 1.
Figure 14: GIS model of borehole locations in 3-D view
Bouquet 08 28
The ‗N‘ values measured in the field using Standard penetration test procedure have been corrected
for various corrections, such as:
(a) Overburden Pressure (CN)
(b) Hammer energy (CE)
(c) Bore hole diameter (CB)
(d) Presence or absence of liner (CS)
(e) Rod length (CR) and
(f) Fines content (Cfines)
(Seed et al., 1983; Skempton, 1986; Youd et al., 2001 and Cetin et al., 2004). Corrected ‗N‘ value
i.e. (N1)60 are obtained using the following equation:
(N1)60 = N × (CN × CE × CB × CS × CR ) (5)
The corrected ―N‖ Value (N1)60 is further corrected for fines content based on the revised boundary
curves presented by Idriss and Boulanger (2004) for cohesionless soils as described below:
(N1)60 =(N1)60 +Δ(N1)60 (6)
(7)
FC = percent fines content (percent dry weight finer than 0.074mm). The detailed procedures and
constants considered are presented in Sitharam et al. (2007).
SITE CHARACTERIZATION USING GEOPHYSICAL DATA
Multichannel Analysis of Surface Wave (MASW) is a non-intrusive and geophysical method, can be
used for geotechnical characterization of near surface materials. MASW identifies each type of seismic
waves on a multichannel record based on the normal pattern recognition technique that has been used in
oil exploration for several decades. MASW generates a shear-wave velocity (Vs) profile (i.e., Vs versus
depth) by analyzing Raleigh-type surface waves on a multichannel record. MASW is also used to
generate a 2-D shear wave velocity profile. The MASW has been found to be a more efficient method for
unraveling the shallow subsurface material properties. MASW system consisting of 24 channels Geode
seismograph with 24 geophones capacity have been used in this investigation. The seismic waves are
created by impulsive source of 15 pound (sledge hammer) with 300 mm 300 mm size hammer plate
with ten shots. These waves are captured by 24 vertical geophones of 4.5Hz capacity.
The MASW test locations are selected based on the space required for the testing and close to
important building such as hospitals, temples, government buildings and schools. About 58 one-
dimensional (1-D) MASW surveys and 20 two-dimensional (2-D) MASW surveys has been carried out.
The test locations are selected such a way that these represent the entire city subsurface information. In
total 58 one-dimensional (1-D) surveys and 20 two-dimensional (2-D) surveys have been carried out.
Most of the survey locations are selected in flat ground and also in important places like parks, hospitals,
Bouquet 08 29
schools and temple yards, etc. In about 38 locations MASW survey points are very close to the available
SPT borehole locations and these are used to generate correlation between shear wave velocity and
corrected SPT ‗N‘ values.
In order to figure out the average shear wave velocity distribution in Bangalore, the average velocity
has been calculated using the equation given below.
(8)
Where H = ∑di = cumulative depth in m, di and vi denote the thickness (in meters) and shear-wave
velocity (at a shear strain level of 10−5
or less, m/s) of the ith
formation or layer respectively, in a total of n
layers within the depth of H. The Vs average has been calculated for every 5 m depth interval up to a
depth of 30 m and also average Vs for the soil overburden has been calculated based on the rock depth
information. Even though the average shear wave velocity is calculated for every 5m depth intervals and
up to a maximum depth of 30m, these maps does not show the average shear wave velocity of soil
because of the wide variation in the soil overburden/ rock level. Site characterization using SPT data
shows that, the soil overburden thickness in Bangalore varies from 1m to about 40m. Hence, the average
shear wave velocity of soil has been calculated based on the overburden thickness obtained from bore
holes close to the MASW testing locations. The average shear wave velocity for soil overburden in the
study area is shown in Figure 15. Figure shows that whole study area has medium to dense soil with a
velocity range of 180m/s to 360m/s falling in to ―site class D‖ as per site classification as per NEHRP
classification and also UBC classification (Uniform Building Code, 1997) [Dobry et al. (2000); Kanli et
al, (2006)]. More details can be obtained from Anbazhagan and Sitharam (2008).
LOCAL SITE EFFECTS AND SITE RESPONSE
Site amplification of seismic energy due to soil conditions and damage to built environment was
amply demonstrated by many earthquakes during the last century. The wide spread destruction caused by
Guerrero earthquake (1985) in Mexico city, Spitak earthquake (1988) in Leninakan, Loma Prieta
earthquake (1989) in San Francisco Bay area, Kobe earthquake (1995), Kocaeli earthquake (1999) in
Adapazari are important examples of site specific amplification of ground motion, even at location far
away (100-300km) from the epicenter (Ansal, 2004). The recent 2001 Gujarat-Bhuj earthquake in India is
another example, with notable damage at a distance of 250km from the epicenter (Sitharam et. al 2001,
and Govinda Raju et. al 2004). These failures resulted from the effect of soil condition on the ground
motion that translates to higher amplitude; it also modifies the spectral content and duration of ground
motion. As seismic waves travel from bedrock to the surface, the soil deposits that they pass through
change certain characteristics of the waves, such as amplitude and frequency content. This process can
transfer large accelerations to structures causing large destruction, particularly when the resulting seismic
wave frequency matches with the resonant frequencies of the structures. Site specific ground response
analysis aims at determining this effect of local soil conditions on amplification of seismic waves and
hence estimating the ground response spectra for future design purposes. The response of a soil deposit is
dependent upon the frequency of the base motion and the geometry and material properties of the soil
layer above the bedrock.
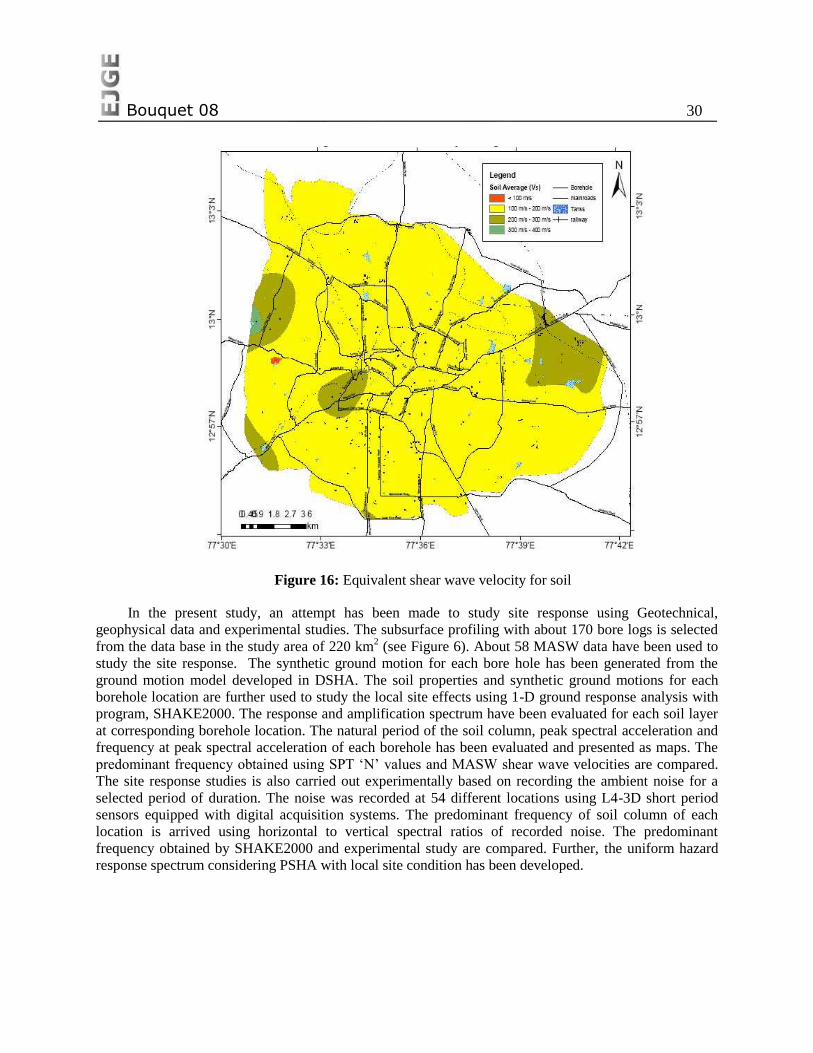
Bouquet 08 30
Figure 16: Equivalent shear wave velocity for soil
In the present study, an attempt has been made to study site response using Geotechnical,
geophysical data and experimental studies. The subsurface profiling with about 170 bore logs is selected
from the data base in the study area of 220 km2 (see Figure 6). About 58 MASW data have been used to
study the site response. The synthetic ground motion for each bore hole has been generated from the
ground motion model developed in DSHA. The soil properties and synthetic ground motions for each
borehole location are further used to study the local site effects using 1-D ground response analysis with
program, SHAKE2000. The response and amplification spectrum have been evaluated for each soil layer
at corresponding borehole location. The natural period of the soil column, peak spectral acceleration and
frequency at peak spectral acceleration of each borehole has been evaluated and presented as maps. The
predominant frequency obtained using SPT ‗N‘ values and MASW shear wave velocities are compared.
The site response studies is also carried out experimentally based on recording the ambient noise for a
selected period of duration. The noise was recorded at 54 different locations using L4-3D short period
sensors equipped with digital acquisition systems. The predominant frequency of soil column of each
location is arrived using horizontal to vertical spectral ratios of recorded noise. The predominant
frequency obtained by SHAKE2000 and experimental study are compared. Further, the uniform hazard
response spectrum considering PSHA with local site condition has been developed.
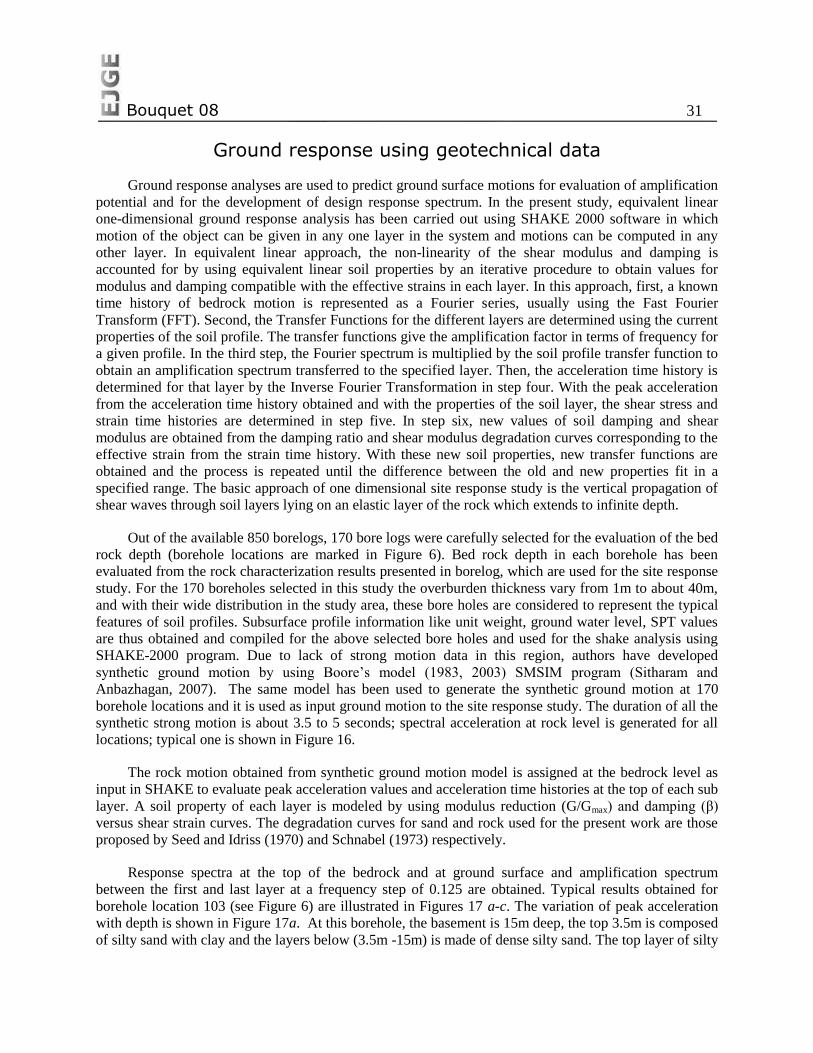
Bouquet 08 31
Ground response using geotechnical data
Ground response analyses are used to predict ground surface motions for evaluation of amplification
potential and for the development of design response spectrum. In the present study, equivalent linear
one-dimensional ground response analysis has been carried out using SHAKE 2000 software in which
motion of the object can be given in any one layer in the system and motions can be computed in any
other layer. In equivalent linear approach, the non-linearity of the shear modulus and damping is
accounted for by using equivalent linear soil properties by an iterative procedure to obtain values for
modulus and damping compatible with the effective strains in each layer. In this approach, first, a known
time history of bedrock motion is represented as a Fourier series, usually using the Fast Fourier
Transform (FFT). Second, the Transfer Functions for the different layers are determined using the current
properties of the soil profile. The transfer functions give the amplification factor in terms of frequency for
a given profile. In the third step, the Fourier spectrum is multiplied by the soil profile transfer function to
obtain an amplification spectrum transferred to the specified layer. Then, the acceleration time history is
determined for that layer by the Inverse Fourier Transformation in step four. With the peak acceleration
from the acceleration time history obtained and with the properties of the soil layer, the shear stress and
strain time histories are determined in step five. In step six, new values of soil damping and shear
modulus are obtained from the damping ratio and shear modulus degradation curves corresponding to the
effective strain from the strain time history. With these new soil properties, new transfer functions are
obtained and the process is repeated until the difference between the old and new properties fit in a
specified range. The basic approach of one dimensional site response study is the vertical propagation of
shear waves through soil layers lying on an elastic layer of the rock which extends to infinite depth.
Out of the available 850 borelogs, 170 bore logs were carefully selected for the evaluation of the bed
rock depth (borehole locations are marked in Figure 6). Bed rock depth in each borehole has been
evaluated from the rock characterization results presented in borelog, which are used for the site response
study. For the 170 boreholes selected in this study the overburden thickness vary from 1m to about 40m,
and with their wide distribution in the study area, these bore holes are considered to represent the typical
features of soil profiles. Subsurface profile information like unit weight, ground water level, SPT values
are thus obtained and compiled for the above selected bore holes and used for the shake analysis using
SHAKE-2000 program. Due to lack of strong motion data in this region, authors have developed
synthetic ground motion by using Boore‘s model (1983, 2003) SMSIM program (Sitharam and
Anbazhagan, 2007). The same model has been used to generate the synthetic ground motion at 170
borehole locations and it is used as input ground motion to the site response study. The duration of all the
synthetic strong motion is about 3.5 to 5 seconds; spectral acceleration at rock level is generated for all
locations; typical one is shown in Figure 16.
The rock motion obtained from synthetic ground motion model is assigned at the bedrock level as
input in SHAKE to evaluate peak acceleration values and acceleration time histories at the top of each sub
layer. A soil property of each layer is modeled by using modulus reduction (G/Gmax) and damping (β)
versus shear strain curves. The degradation curves for sand and rock used for the present work are those
proposed by Seed and Idriss (1970) and Schnabel (1973) respectively.
Response spectra at the top of the bedrock and at ground surface and amplification spectrum
between the first and last layer at a frequency step of 0.125 are obtained. Typical results obtained for
borehole location 103 (see Figure 6) are illustrated in Figures 17 a-c. The variation of peak acceleration
with depth is shown in Figure 17a. At this borehole, the basement is 15m deep, the top 3.5m is composed
of silty sand with clay and the layers below (3.5m -15m) is made of dense silty sand. The top layer of silty
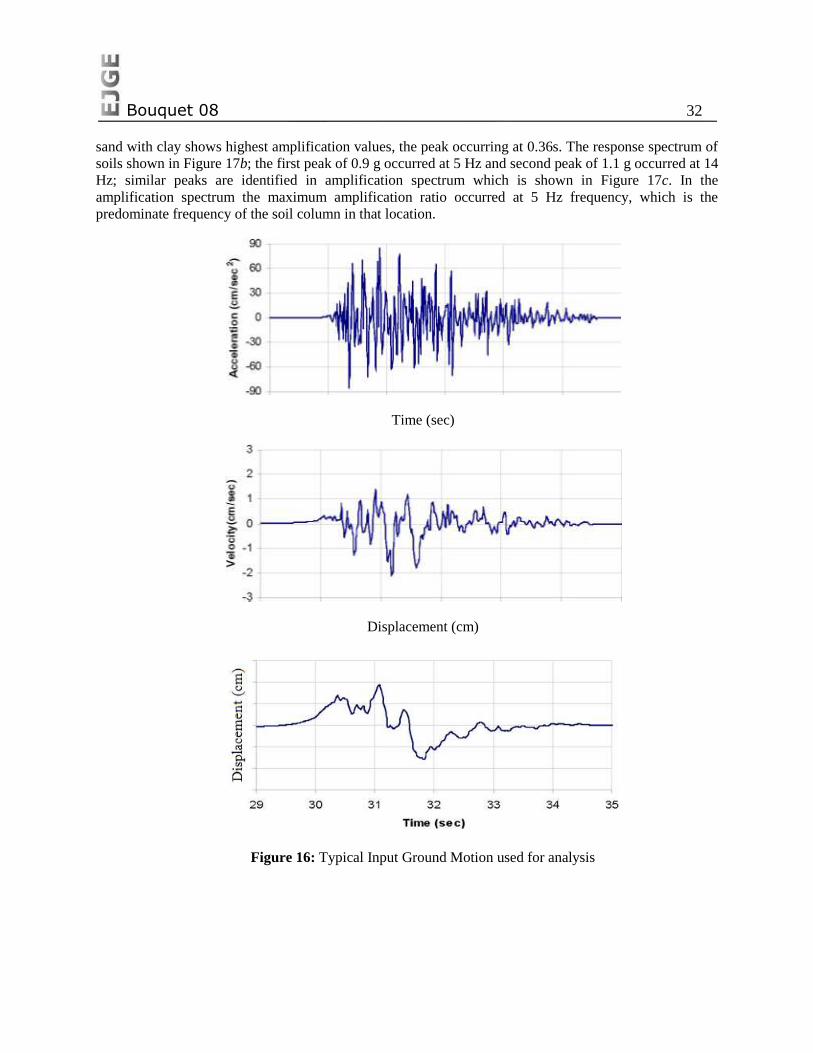
Bouquet 08 32
sand with clay shows highest amplification values, the peak occurring at 0.36s. The response spectrum of
soils shown in Figure 17b; the first peak of 0.9 g occurred at 5 Hz and second peak of 1.1 g occurred at 14
Hz; similar peaks are identified in amplification spectrum which is shown in Figure 17c. In the
amplification spectrum the maximum amplification ratio occurred at 5 Hz frequency, which is the
predominate frequency of the soil column in that location.
Time (sec)
Displacement (cm)
Figure 16: Typical Input Ground Motion used for analysis
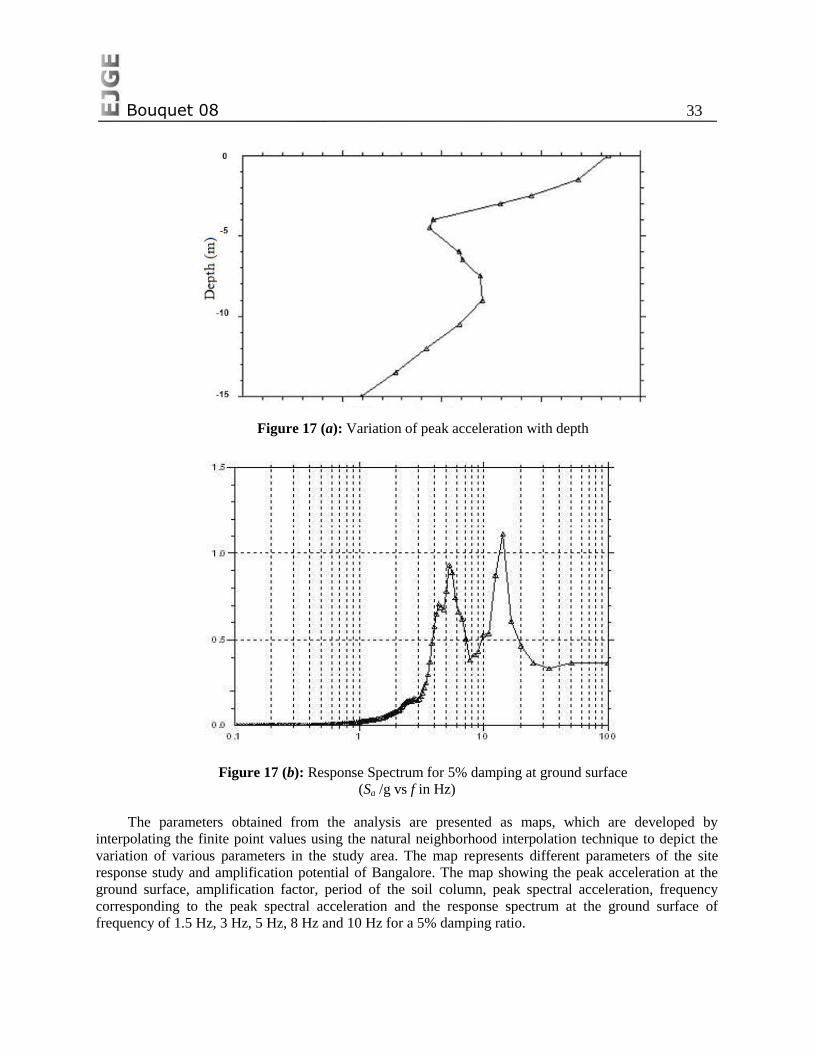
Bouquet 08 33
Figure 17 (a): Variation of peak acceleration with depth
Figure 17 (b): Response Spectrum for 5% damping at ground surface
(Sa /g vs f in Hz)
The parameters obtained from the analysis are presented as maps, which are developed by
interpolating the finite point values using the natural neighborhood interpolation technique to depict the
variation of various parameters in the study area. The map represents different parameters of the site
response study and amplification potential of Bangalore. The map showing the peak acceleration at the
ground surface, amplification factor, period of the soil column, peak spectral acceleration, frequency
corresponding to the peak spectral acceleration and the response spectrum at the ground surface of
frequency of 1.5 Hz, 3 Hz, 5 Hz, 8 Hz and 10 Hz for a 5% damping ratio.

Bouquet 08 34
Ground motions with high peak accelerations are usually more destructive than motions with lower
peak accelerations thus indicating that regions in this zone having PGA greater than 0.4g and are
seismically more unstable than the other regions. However, very high PHA values that last only for a very
short period of time and have very high frequencies may cause little damage to many types of structures.
Hence a better estimate of the regions of high seismic vulnerability can be made by identifying regions
susceptible to higher amplification of the bedrock motion. The term ―Amplification Factor‖ is hence used
here to refer to the ratio of the peak horizontal acceleration at the ground surface to the peak horizontal
acceleration at the bedrock. This factor is evaluated for all the borehole locations using the PHA at
bedrock obtained from the synthetic acceleration time history for each borehole and the peak ground
acceleration obtained as a result of ground response analysis using SHAKE 2000. The amplification
factor thus calculated ranged from 1 to 4.8. These results were interpolated as described earlier to prepare
the amplification map. Bangalore city can be divided into four zones based on the range of amplification
factors assigned to each zone. The amplification factor map for Bangalore City is shown in Figure 18.
Lower amplification values indicate lesser amplification potential and hence lesser seismic hazard. It can
be observed that the amplification factor for most of Bangalore region is in the range of 2 to 3. From this
it can be concluded that most of study area has a moderate amplification potential.
With the development of geophysical methods, particularly SASW (spectral analysis of surface
wave) and MASW are being increasingly used for the site response study and microzonation of cities
worldwide. Shear wave velocities (Vs) measured using geophysical method are widely used to get better
results of site response studies than SPT data. Because, wave propagation theory shows that ground
motion amplitude depends on the density and shear wave velocity of subsurface material (Bullen, 1965;
Aki and Richards, 1980). Usually density has relatively little variation with depth but shear wave velocity
is the logical choice for representing site conditions. In this study an attempt has been made to study the
site response of study area using measured shear wave velocity obtained from MASW presented earlier.
Site response study using SHAKE2000 and MASW data has been presented here for Bangalore. Similar
to site response study using geotechnical data, site response study using SHAKE2000 and MASW data
has been carried out. Here instead of calculating shear modulus using empirical correlations (inbuilt in
SHAKE2000) based on SPT corrected ―N‖ value, it has been calculated directly using shear wave
velocity and density. Other steps and inputs (ground motions and modulus curves) are similar to site
response using geotechnical data.
Figure 17 (c): Amplification Spectrum between the bedrock and ground surface
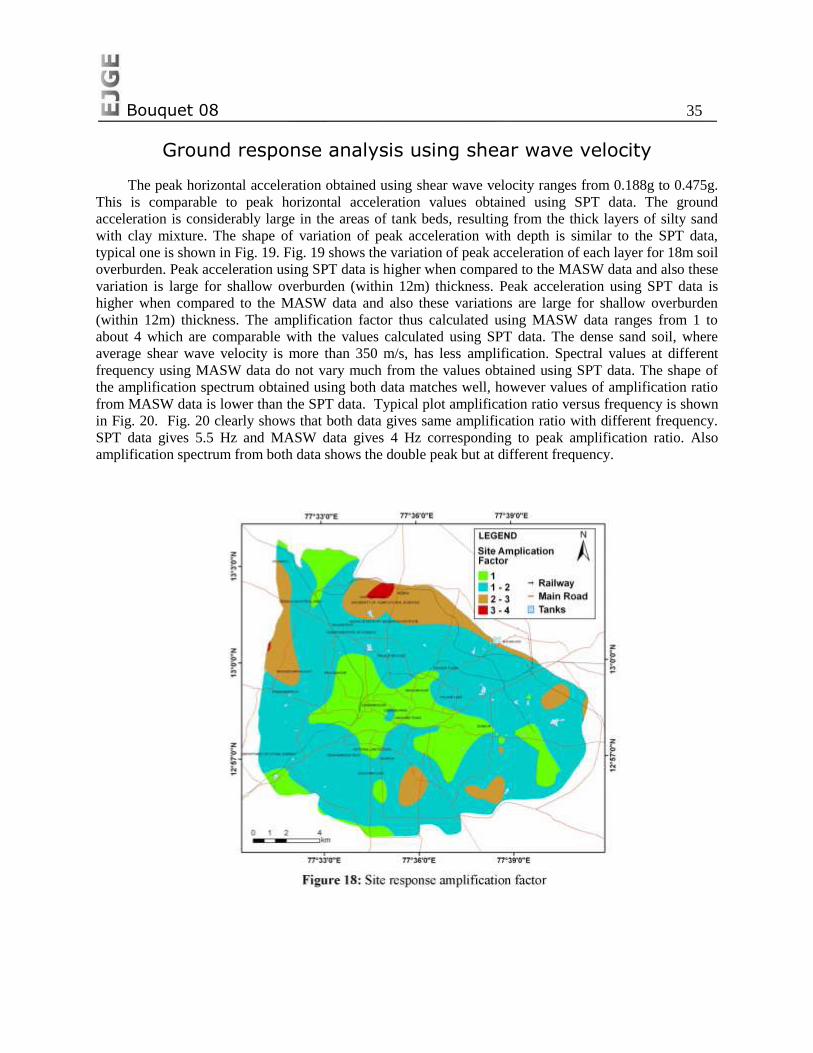
Bouquet 08 35
Ground response analysis using shear wave velocity
The peak horizontal acceleration obtained using shear wave velocity ranges from 0.188g to 0.475g.
This is comparable to peak horizontal acceleration values obtained using SPT data. The ground
acceleration is considerably large in the areas of tank beds, resulting from the thick layers of silty sand
with clay mixture. The shape of variation of peak acceleration with depth is similar to the SPT data,
typical one is shown in Fig. 19. Fig. 19 shows the variation of peak acceleration of each layer for 18m soil
overburden. Peak acceleration using SPT data is higher when compared to the MASW data and also these
variation is large for shallow overburden (within 12m) thickness. Peak acceleration using SPT data is
higher when compared to the MASW data and also these variations are large for shallow overburden
(within 12m) thickness. The amplification factor thus calculated using MASW data ranges from 1 to
about 4 which are comparable with the values calculated using SPT data. The dense sand soil, where
average shear wave velocity is more than 350 m/s, has less amplification. Spectral values at different
frequency using MASW data do not vary much from the values obtained using SPT data. The shape of
the amplification spectrum obtained using both data matches well, however values of amplification ratio
from MASW data is lower than the SPT data. Typical plot amplification ratio versus frequency is shown
in Fig. 20. Fig. 20 clearly shows that both data gives same amplification ratio with different frequency.
SPT data gives 5.5 Hz and MASW data gives 4 Hz corresponding to peak amplification ratio. Also
amplification spectrum from both data shows the double peak but at different frequency.
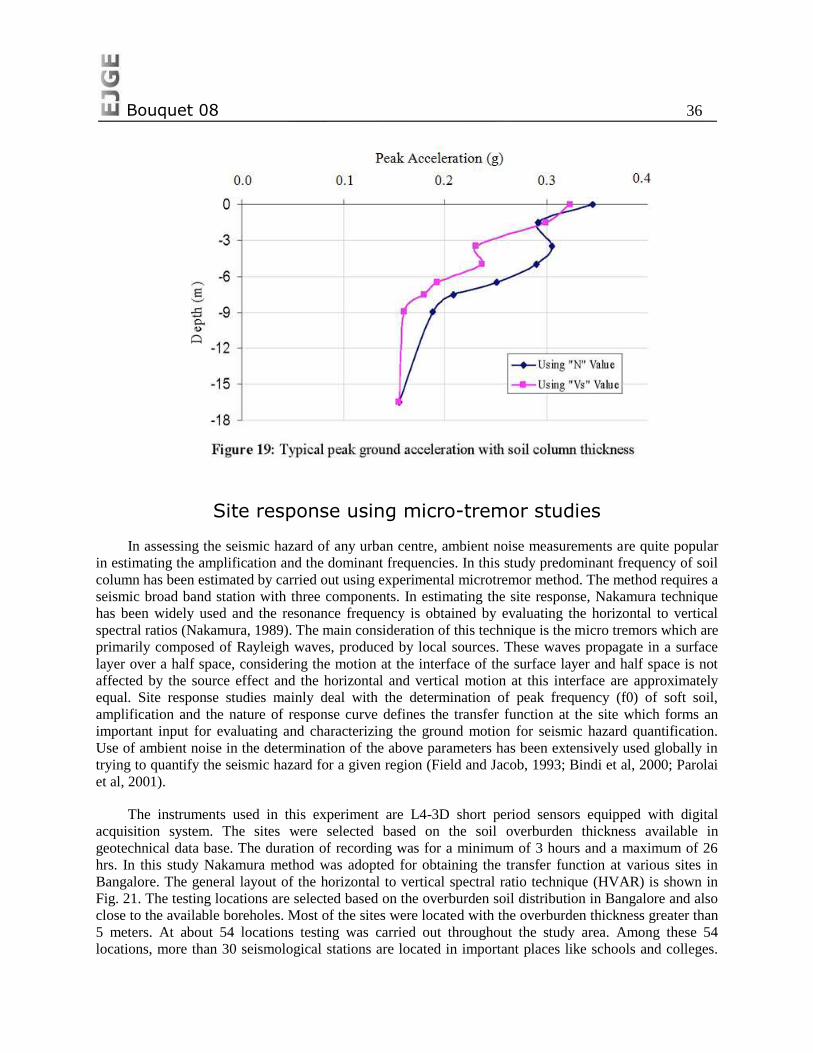
Bouquet 08 36
Site response using micro-tremor studies
In assessing the seismic hazard of any urban centre, ambient noise measurements are quite popular
in estimating the amplification and the dominant frequencies. In this study predominant frequency of soil
column has been estimated by carried out using experimental microtremor method. The method requires a
seismic broad band station with three components. In estimating the site response, Nakamura technique
has been widely used and the resonance frequency is obtained by evaluating the horizontal to vertical
spectral ratios (Nakamura, 1989). The main consideration of this technique is the micro tremors which are
primarily composed of Rayleigh waves, produced by local sources. These waves propagate in a surface
layer over a half space, considering the motion at the interface of the surface layer and half space is not
affected by the source effect and the horizontal and vertical motion at this interface are approximately
equal. Site response studies mainly deal with the determination of peak frequency (f0) of soft soil,
amplification and the nature of response curve defines the transfer function at the site which forms an
important input for evaluating and characterizing the ground motion for seismic hazard quantification.
Use of ambient noise in the determination of the above parameters has been extensively used globally in
trying to quantify the seismic hazard for a given region (Field and Jacob, 1993; Bindi et al, 2000; Parolai
et al, 2001).
The instruments used in this experiment are L4-3D short period sensors equipped with digital
acquisition system. The sites were selected based on the soil overburden thickness available in
geotechnical data base. The duration of recording was for a minimum of 3 hours and a maximum of 26
hrs. In this study Nakamura method was adopted for obtaining the transfer function at various sites in
Bangalore. The general layout of the horizontal to vertical spectral ratio technique (HVAR) is shown in
Fig. 21. The testing locations are selected based on the overburden soil distribution in Bangalore and also
close to the available boreholes. Most of the sites were located with the overburden thickness greater than
5 meters. At about 54 locations testing was carried out throughout the study area. Among these 54
locations, more than 30 seismological stations are located in important places like schools and colleges.
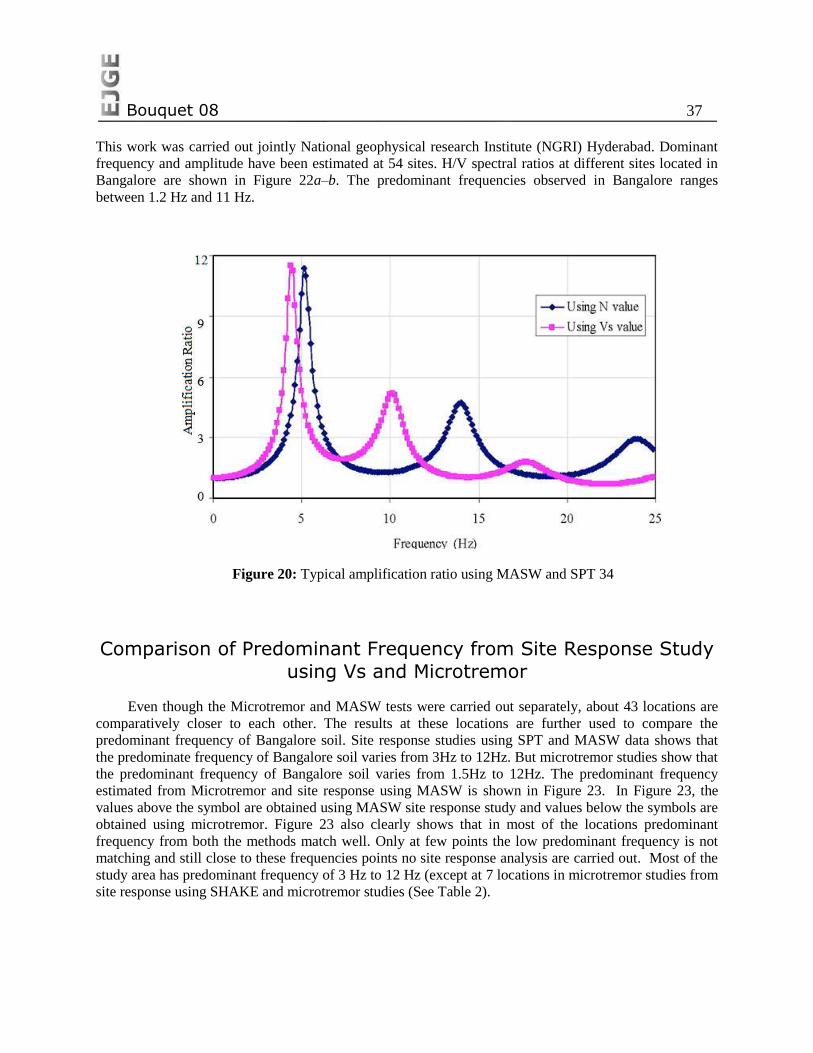
Bouquet 08 37
This work was carried out jointly National geophysical research Institute (NGRI) Hyderabad. Dominant
frequency and amplitude have been estimated at 54 sites. H/V spectral ratios at different sites located in
Bangalore are shown in Figure 22a–b. The predominant frequencies observed in Bangalore ranges
between 1.2 Hz and 11 Hz.
Figure 20: Typical amplification ratio using MASW and SPT 34
Comparison of Predominant Frequency from Site Response Study
using Vs and Microtremor
Even though the Microtremor and MASW tests were carried out separately, about 43 locations are
comparatively closer to each other. The results at these locations are further used to compare the
predominant frequency of Bangalore soil. Site response studies using SPT and MASW data shows that
the predominate frequency of Bangalore soil varies from 3Hz to 12Hz. But microtremor studies show that
the predominant frequency of Bangalore soil varies from 1.5Hz to 12Hz. The predominant frequency
estimated from Microtremor and site response using MASW is shown in Figure 23. In Figure 23, the
values above the symbol are obtained using MASW site response study and values below the symbols are
obtained using microtremor. Figure 23 also clearly shows that in most of the locations predominant
frequency from both the methods match well. Only at few points the low predominant frequency is not
matching and still close to these frequencies points no site response analysis are carried out. Most of the
study area has predominant frequency of 3 Hz to 12 Hz (except at 7 locations in microtremor studies from
site response using SHAKE and microtremor studies (See Table 2).
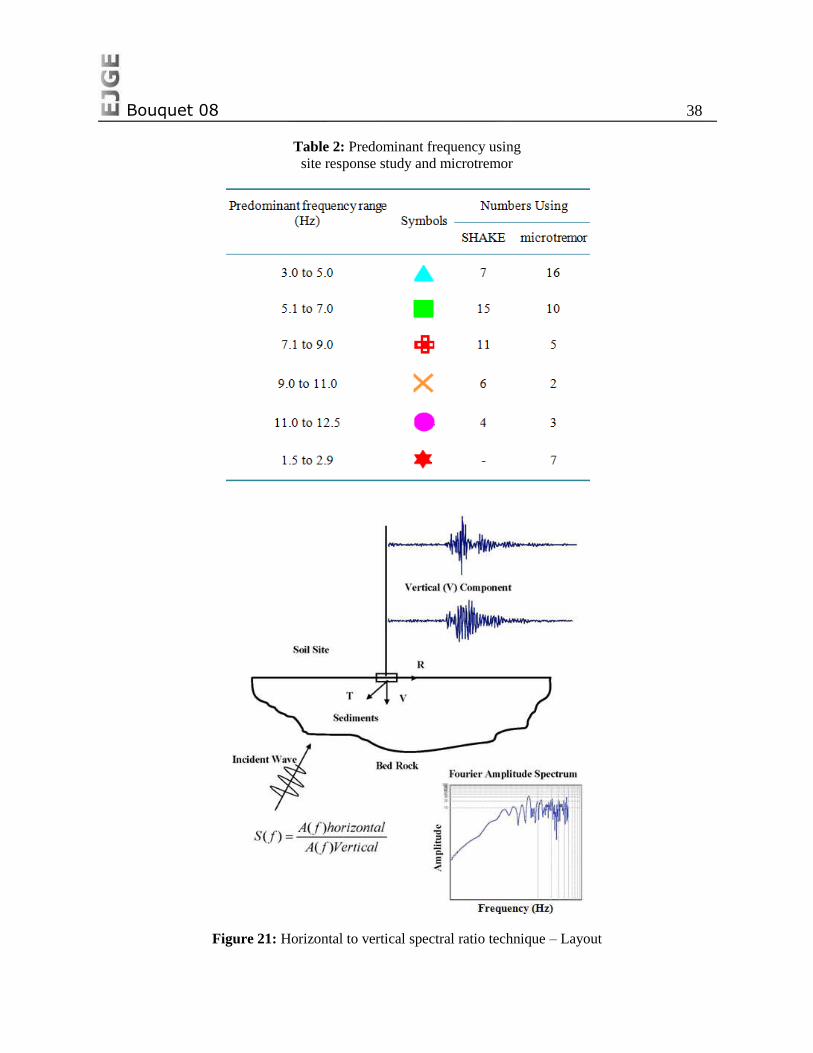
Bouquet 08 38
Table 2: Predominant frequency using
site response study and microtremor
Figure 21: Horizontal to vertical spectral ratio technique – Layout
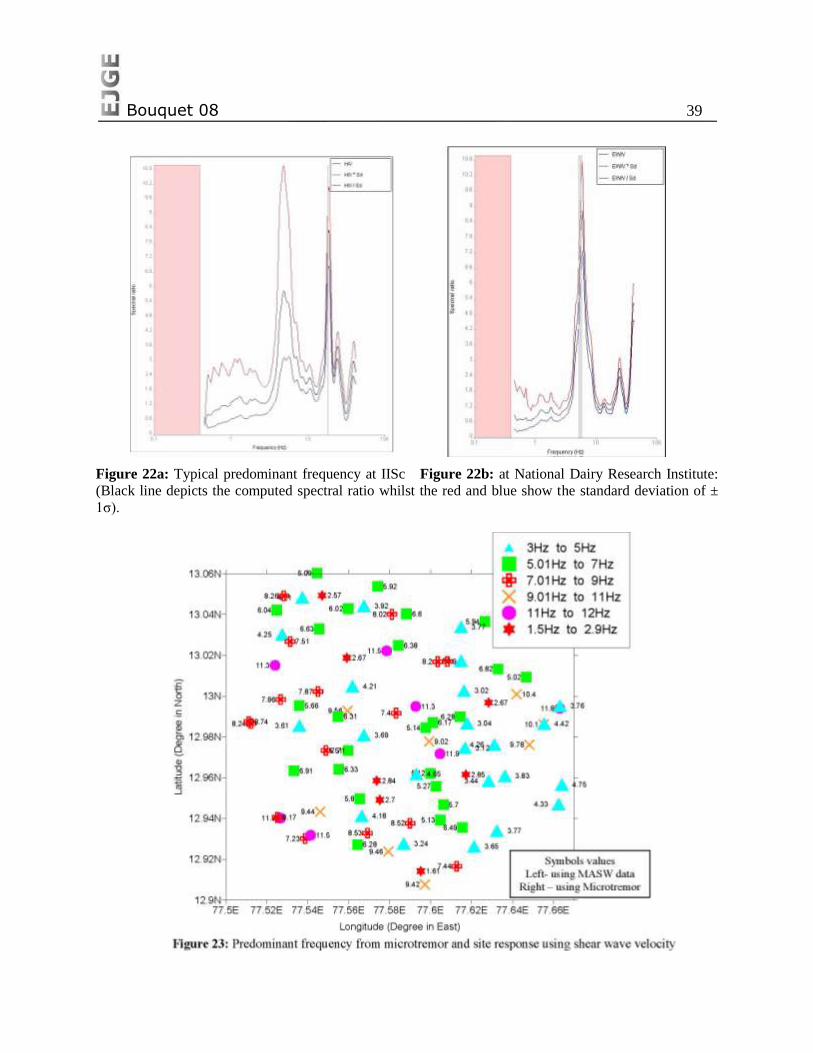
Bouquet 08 39
Figure 22a: Typical predominant frequency at IISc Figure 22b: at National Dairy Research Institute:
(Black line depicts the computed spectral ratio whilst the red and blue show the standard deviation of ±
1σ).

Bouquet 08 40
Figure 24: Spectral acceleration at bed rock and site D corresponding to period
of 1s and 5% damping for Bangalore.
Figure 25: Uniform hazard response spectrum for bed rock and site class D with 10% probability of
exceedance in 50 years (5% damping) for Bangalore.
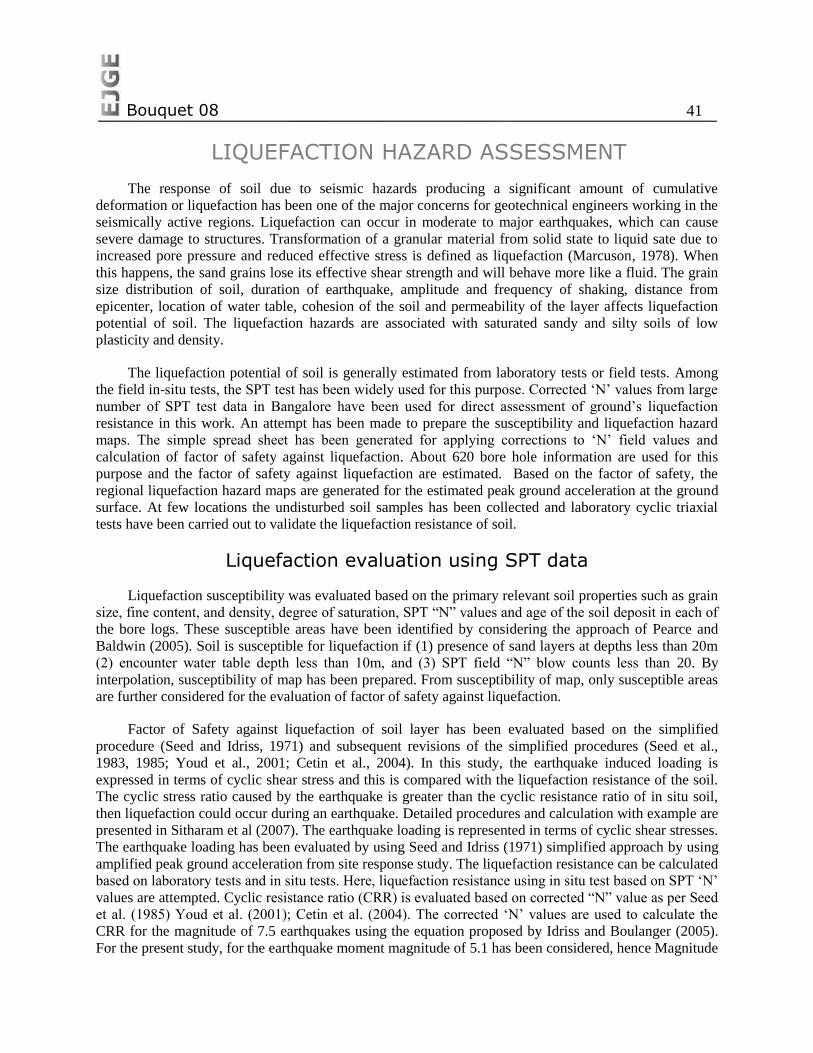
Bouquet 08 41
LIQUEFACTION HAZARD ASSESSMENT
The response of soil due to seismic hazards producing a significant amount of cumulative
deformation or liquefaction has been one of the major concerns for geotechnical engineers working in the
seismically active regions. Liquefaction can occur in moderate to major earthquakes, which can cause
severe damage to structures. Transformation of a granular material from solid state to liquid sate due to
increased pore pressure and reduced effective stress is defined as liquefaction (Marcuson, 1978). When
this happens, the sand grains lose its effective shear strength and will behave more like a fluid. The grain
size distribution of soil, duration of earthquake, amplitude and frequency of shaking, distance from
epicenter, location of water table, cohesion of the soil and permeability of the layer affects liquefaction
potential of soil. The liquefaction hazards are associated with saturated sandy and silty soils of low
plasticity and density.
The liquefaction potential of soil is generally estimated from laboratory tests or field tests. Among
the field in-situ tests, the SPT test has been widely used for this purpose. Corrected ‗N‘ values from large
number of SPT test data in Bangalore have been used for direct assessment of ground‘s liquefaction
resistance in this work. An attempt has been made to prepare the susceptibility and liquefaction hazard
maps. The simple spread sheet has been generated for applying corrections to ‗N‘ field values and
calculation of factor of safety against liquefaction. About 620 bore hole information are used for this
purpose and the factor of safety against liquefaction are estimated. Based on the factor of safety, the
regional liquefaction hazard maps are generated for the estimated peak ground acceleration at the ground
surface. At few locations the undisturbed soil samples has been collected and laboratory cyclic triaxial
tests have been carried out to validate the liquefaction resistance of soil.
Liquefaction evaluation using SPT data
Liquefaction susceptibility was evaluated based on the primary relevant soil properties such as grain
size, fine content, and density, degree of saturation, SPT ―N‖ values and age of the soil deposit in each of
the bore logs. These susceptible areas have been identified by considering the approach of Pearce and
Baldwin (2005). Soil is susceptible for liquefaction if (1) presence of sand layers at depths less than 20m
(2) encounter water table depth less than 10m, and (3) SPT field ―N‖ blow counts less than 20. By
interpolation, susceptibility of map has been prepared. From susceptibility of map, only susceptible areas
are further considered for the evaluation of factor of safety against liquefaction.
Factor of Safety against liquefaction of soil layer has been evaluated based on the simplified
procedure (Seed and Idriss, 1971) and subsequent revisions of the simplified procedures (Seed et al.,
1983, 1985; Youd et al., 2001; Cetin et al., 2004). In this study, the earthquake induced loading is
expressed in terms of cyclic shear stress and this is compared with the liquefaction resistance of the soil.
The cyclic stress ratio caused by the earthquake is greater than the cyclic resistance ratio of in situ soil,
then liquefaction could occur during an earthquake. Detailed procedures and calculation with example are
presented in Sitharam et al (2007). The earthquake loading is represented in terms of cyclic shear stresses.
The earthquake loading has been evaluated by using Seed and Idriss (1971) simplified approach by using
amplified peak ground acceleration from site response study. The liquefaction resistance can be calculated
based on laboratory tests and in situ tests. Here, liquefaction resistance using in situ test based on SPT ‗N‘
values are attempted. Cyclic resistance ratio (CRR) is evaluated based on corrected ―N‖ value as per Seed
et al. (1985) Youd et al. (2001); Cetin et al. (2004). The corrected ‗N‘ values are used to calculate the
CRR for the magnitude of 7.5 earthquakes using the equation proposed by Idriss and Boulanger (2005).
For the present study, for the earthquake moment magnitude of 5.1 has been considered, hence Magnitude
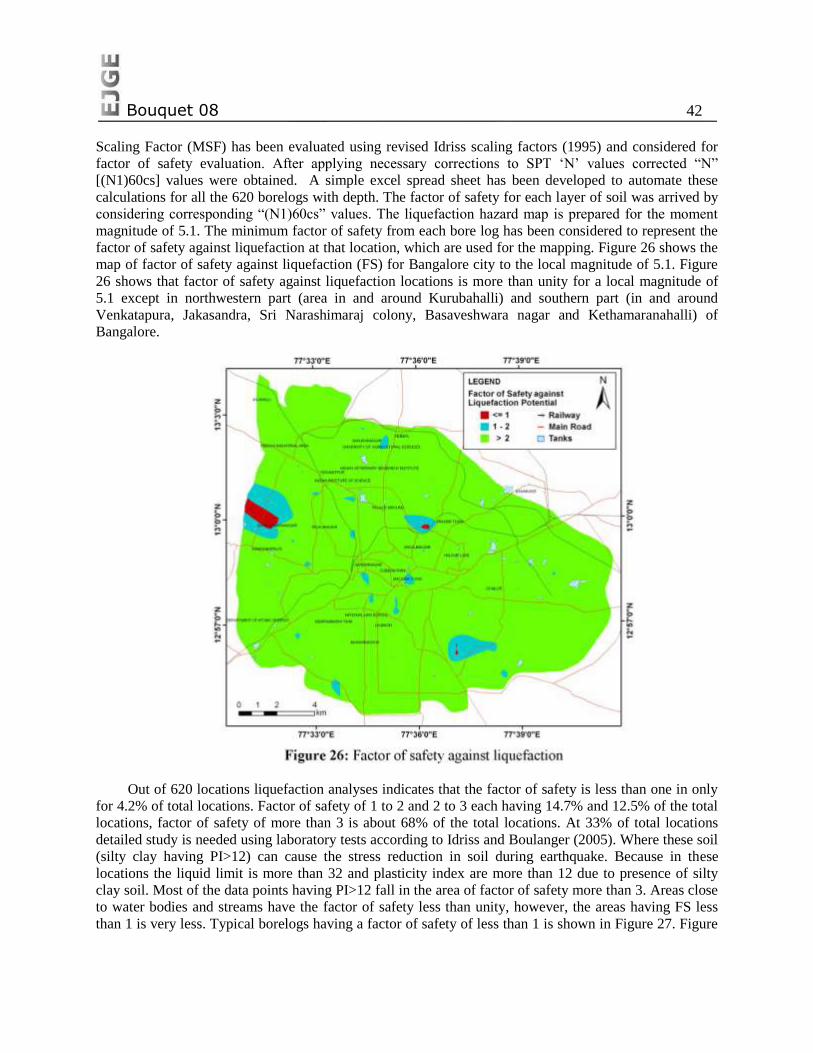
Bouquet 08 42
Scaling Factor (MSF) has been evaluated using revised Idriss scaling factors (1995) and considered for
factor of safety evaluation. After applying necessary corrections to SPT ‗N‘ values corrected ―N‖
[(N1)60cs] values were obtained. A simple excel spread sheet has been developed to automate these
calculations for all the 620 borelogs with depth. The factor of safety for each layer of soil was arrived by
considering corresponding ―(N1)60cs‖ values. The liquefaction hazard map is prepared for the moment
magnitude of 5.1. The minimum factor of safety from each bore log has been considered to represent the
factor of safety against liquefaction at that location, which are used for the mapping. Figure 26 shows the
map of factor of safety against liquefaction (FS) for Bangalore city to the local magnitude of 5.1. Figure
26 shows that factor of safety against liquefaction locations is more than unity for a local magnitude of
5.1 except in northwestern part (area in and around Kurubahalli) and southern part (in and around
Venkatapura, Jakasandra, Sri Narashimaraj colony, Basaveshwara nagar and Kethamaranahalli) of
Bangalore.
Out of 620 locations liquefaction analyses indicates that the factor of safety is less than one in only
for 4.2% of total locations. Factor of safety of 1 to 2 and 2 to 3 each having 14.7% and 12.5% of the total
locations, factor of safety of more than 3 is about 68% of the total locations. At 33% of total locations
detailed study is needed using laboratory tests according to Idriss and Boulanger (2005). Where these soil
(silty clay having PI>12) can cause the stress reduction in soil during earthquake. Because in these
locations the liquid limit is more than 32 and plasticity index are more than 12 due to presence of silty
clay soil. Most of the data points having PI>12 fall in the area of factor of safety more than 3. Areas close
to water bodies and streams have the factor of safety less than unity, however, the areas having FS less
than 1 is very less. Typical borelogs having a factor of safety of less than 1 is shown in Figure 27. Figure
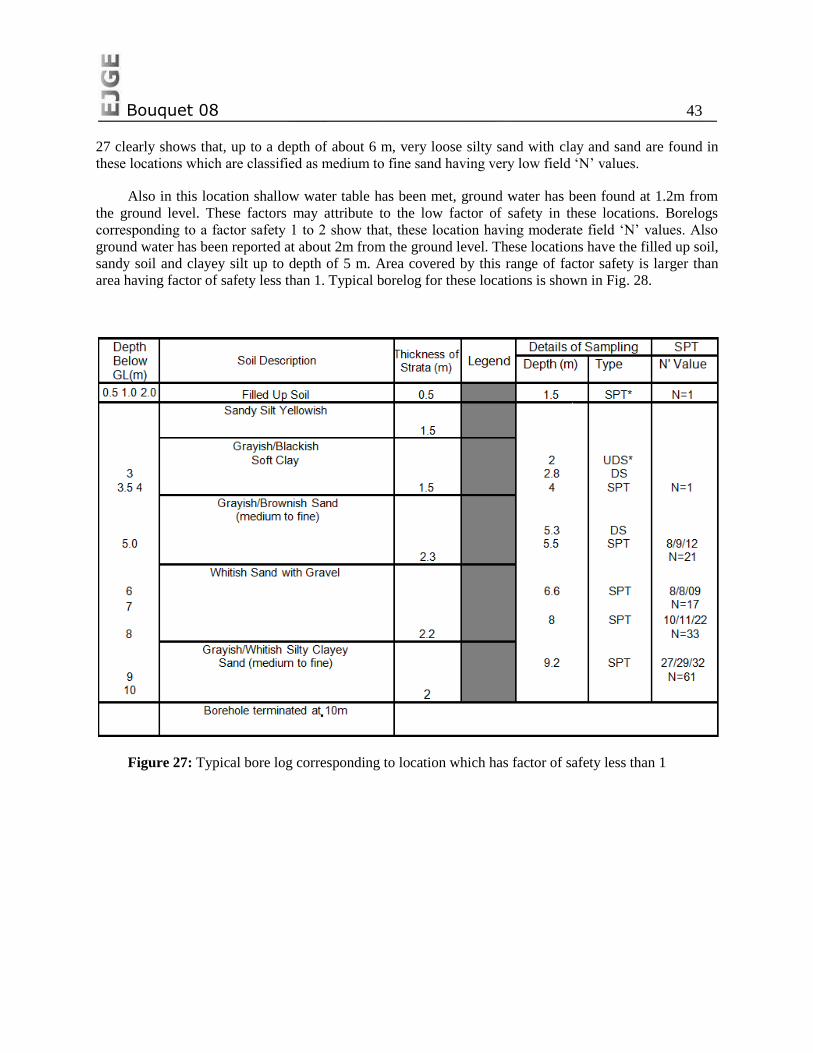
Bouquet 08 43
27 clearly shows that, up to a depth of about 6 m, very loose silty sand with clay and sand are found in
these locations which are classified as medium to fine sand having very low field ‗N‘ values.
Also in this location shallow water table has been met, ground water has been found at 1.2m from
the ground level. These factors may attribute to the low factor of safety in these locations. Borelogs
corresponding to a factor safety 1 to 2 show that, these location having moderate field ‗N‘ values. Also
ground water has been reported at about 2m from the ground level. These locations have the filled up soil,
sandy soil and clayey silt up to depth of 5 m. Area covered by this range of factor safety is larger than
area having factor of safety less than 1. Typical borelog for these locations is shown in Fig. 28.
Figure 27: Typical bore log corresponding to location which has factor of safety less than 1
Bouquet 08 44
Cyclic Triaxial experiments on undisturbed soil samples
Undisturbed samples were collected from few locations in (south east region) Bangalore city to
verify the liquefaction potential of the soil. Cyclic triaxial tests have been carried out in the laboratory on
the undisturbed soil samples collected from Boreholes. The tests have been carried out as per ASTM: D
3999 (1991) in strain controlled mode. Cyclic triaxial tests are carried out with double amplitude axial
strains of 0.5%, 1% and 2% with a frequency of 1Hz. Figure 29 shows the pore pressure ratio versus
number of cycles. From these plots it is clear that even after 120 cycles, the average pore pressure ratio is
about 0.94 and deviatoric stresses vs. strain plots have not become flat, indicating no liquefaction. The
resistance to liquefaction of these soils is very high. The calculated factor of safety against liquefaction
results for this borehole is also very high indicating no liquefaction and results matches well with the lab
test results. This study shows that Bangalore is safe against liquefaction except at few locations where the
overburden is sandy silt with shallow water table. Strain controlled cyclic triaxial tests on undisturbed soil
samples collected from south west region of Bangalore city indicates that soils are non liquefiable.
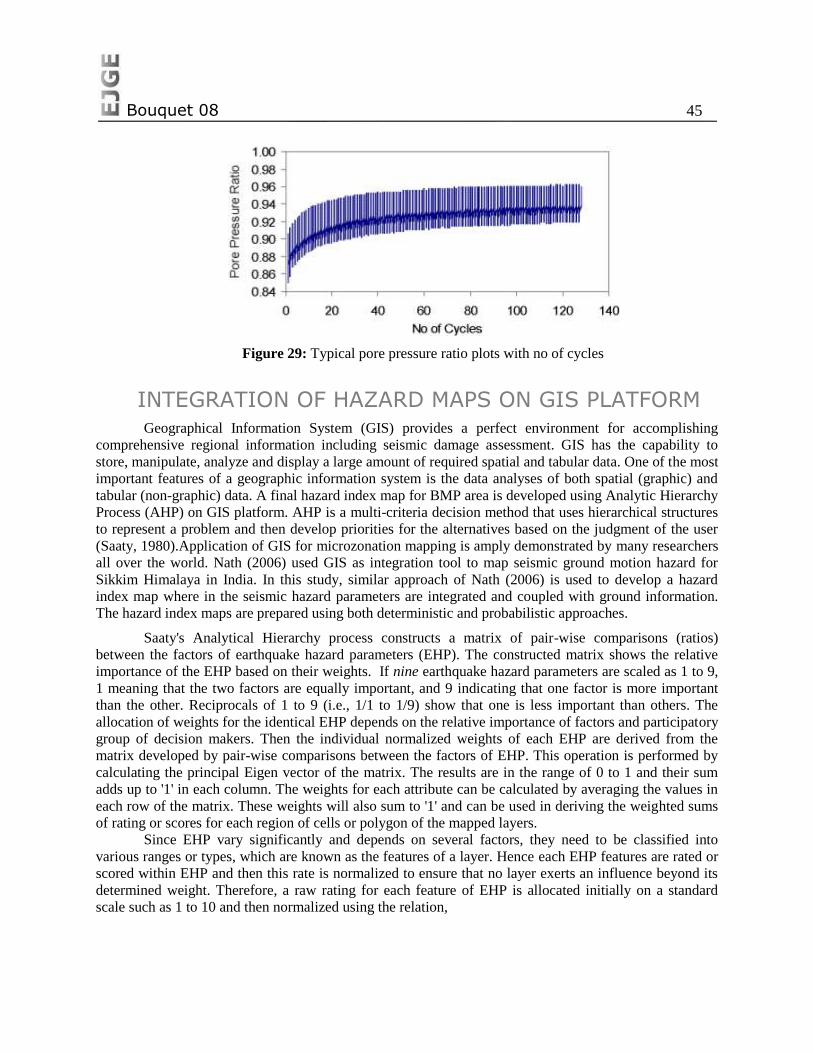
Bouquet 08 45
Figure 29: Typical pore pressure ratio plots with no of cycles
INTEGRATION OF HAZARD MAPS ON GIS PLATFORM Geographical Information System (GIS) provides a perfect environment for accomplishing
comprehensive regional information including seismic damage assessment. GIS has the capability to
store, manipulate, analyze and display a large amount of required spatial and tabular data. One of the most
important features of a geographic information system is the data analyses of both spatial (graphic) and
tabular (non-graphic) data. A final hazard index map for BMP area is developed using Analytic Hierarchy
Process (AHP) on GIS platform. AHP is a multi-criteria decision method that uses hierarchical structures
to represent a problem and then develop priorities for the alternatives based on the judgment of the user
(Saaty, 1980).Application of GIS for microzonation mapping is amply demonstrated by many researchers
all over the world. Nath (2006) used GIS as integration tool to map seismic ground motion hazard for
Sikkim Himalaya in India. In this study, similar approach of Nath (2006) is used to develop a hazard
index map where in the seismic hazard parameters are integrated and coupled with ground information.
The hazard index maps are prepared using both deterministic and probabilistic approaches.
Saaty's Analytical Hierarchy process constructs a matrix of pair-wise comparisons (ratios)
between the factors of earthquake hazard parameters (EHP). The constructed matrix shows the relative
importance of the EHP based on their weights. If nine earthquake hazard parameters are scaled as 1 to 9,
1 meaning that the two factors are equally important, and 9 indicating that one factor is more important
than the other. Reciprocals of 1 to 9 (i.e., 1/1 to 1/9) show that one is less important than others. The
allocation of weights for the identical EHP depends on the relative importance of factors and participatory
group of decision makers. Then the individual normalized weights of each EHP are derived from the
matrix developed by pair-wise comparisons between the factors of EHP. This operation is performed by
calculating the principal Eigen vector of the matrix. The results are in the range of 0 to 1 and their sum
adds up to '1' in each column. The weights for each attribute can be calculated by averaging the values in
each row of the matrix. These weights will also sum to '1' and can be used in deriving the weighted sums
of rating or scores for each region of cells or polygon of the mapped layers.
Since EHP vary significantly and depends on several factors, they need to be classified into
various ranges or types, which are known as the features of a layer. Hence each EHP features are rated or
scored within EHP and then this rate is normalized to ensure that no layer exerts an influence beyond its
determined weight. Therefore, a raw rating for each feature of EHP is allocated initially on a standard
scale such as 1 to 10 and then normalized using the relation,
Bouquet 08 46
(9)
Where, Ri is the rating assigned for features with single EHP, Rmin and Rmax are minimum and
maximum rate of particular EHP.
Earthquake hazard parameters
Seismic microzonation is subdividing a region into smaller areas having different potential for
hazardous earthquake effects. The earthquake effects depend on ground geomorphologic attributes
consisting of geological, geomorphology and geotechnical information. The parameters of geology and
geomorphology, soil coverage/thickness, and rock outcrop/depth are some of the important
geomorphologic attributes. Other attributes are the earthquake parameters, which are estimated by hazard
analysis and effects of local soil for a hazard. The Peak Ground Acceleration (PGA) [from deterministic
or probabilistic approach], amplification/ site response, predominant frequency, liquefaction and land
slide due to earthquakes are some of the important seismological attributes. Weight of the attributes
depends on the region and decision maker, for example flat terrain has weight of ―0‖ value for land slide
and deep soil terrain has highest weight for site response or liquefaction. Different attributes considered
for Bangalore microzonation are presented below;
Geomorphologic Attributes
The geomorphologic attributes (here after called as themes) considered in this study are the geology
and geomorphology (GG), rock depth/ soil thickness (RD/ST), soil type and strength (represented in
terms of average shear wave velocity) (SS), drainage pattern (DP) and elevation level (EL). In the
previous sections important attributes of rock depth/ (RD), and soil type and strength (represented in
terms of average shear wave velocity) (SS) are discussed, in this section discusses the other
geomorphologic attributes.
Geology and Geomorphology (GG)
As the study area is densely covered by buildings, it is very difficult to obtain the detailed
geological/geomorphologic maps. A simple geological and geomorphology map of Bangalore is prepared
based on the available literature and presented in Figure 30 for the study area. Bangalore lies on top of the
south Karnataka Plateau (Mysore Plateau) and its topology is almost flat with the highest point being at
Doddabettahalli (954 m above Mean Sea Level) in the direction of a NNE-SSW trending ridge lies east of
the Vrishabhavathi river. The study area falls under the expanse of the Peninsular Gneissic Complex. The
main rock types in the regions are Gneissic country rock and as well as intrusions of Granites and
Migmatites. Bangalore city lies over a hard and moderately dense Gneissic basement dated back to the
Archean era (2500-3500mya). A large granitic intrusion in the south-central part of the city extends from
the Golf Course in the north central to Vasantpur VV Nagar in the south of the city (almost 13 km in
length) and on an average 4 km from east to west along the way. A magmatite intrusion formed within the
granitic one extends for approximately 7.3 kms running parallel with Krishna Rajendra Road/ Kanakpura
Road from Puttanna Chetty Road in Chamrajpet till Bikaspura Road in the south. A 2.25km Quatrzite
formation is found in Jalahalli East (see Figure 30).
Dike swarms are seen around the western outskirts of the city (west of the Outer Ring Road)
majority striking approximately oriented on N15o
E. However random east west trending ones are also
seen. They appear to strike parallel to the strike of the vertical foliation of the country rock. These
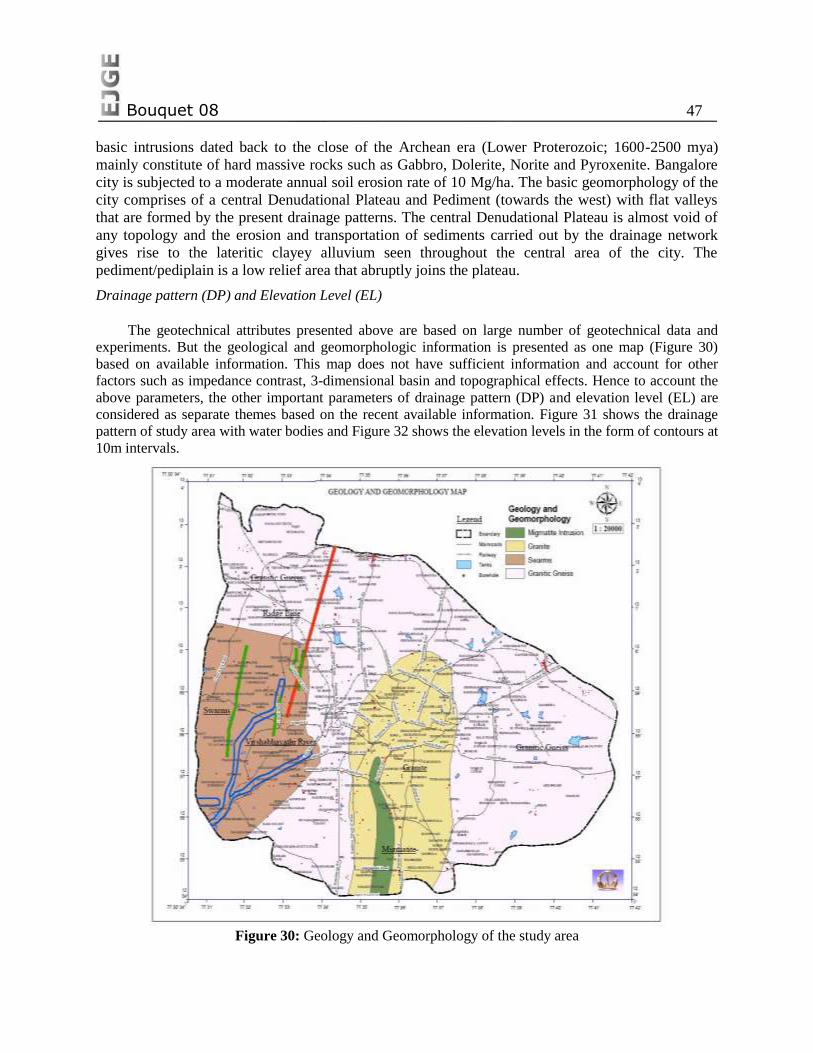
Bouquet 08 47
basic intrusions dated back to the close of the Archean era (Lower Proterozoic; 1600-2500 mya)
mainly constitute of hard massive rocks such as Gabbro, Dolerite, Norite and Pyroxenite. Bangalore
city is subjected to a moderate annual soil erosion rate of 10 Mg/ha. The basic geomorphology of the
city comprises of a central Denudational Plateau and Pediment (towards the west) with flat valleys
that are formed by the present drainage patterns. The central Denudational Plateau is almost void of
any topology and the erosion and transportation of sediments carried out by the drainage network
gives rise to the lateritic clayey alluvium seen throughout the central area of the city. The
pediment/pediplain is a low relief area that abruptly joins the plateau.
Drainage pattern (DP) and Elevation Level (EL)
The geotechnical attributes presented above are based on large number of geotechnical data and
experiments. But the geological and geomorphologic information is presented as one map (Figure 30)
based on available information. This map does not have sufficient information and account for other
factors such as impedance contrast, 3-dimensional basin and topographical effects. Hence to account the
above parameters, the other important parameters of drainage pattern (DP) and elevation level (EL) are
considered as separate themes based on the recent available information. Figure 31 shows the drainage
pattern of study area with water bodies and Figure 32 shows the elevation levels in the form of contours at
10m intervals.
Figure 30: Geology and Geomorphology of the study area
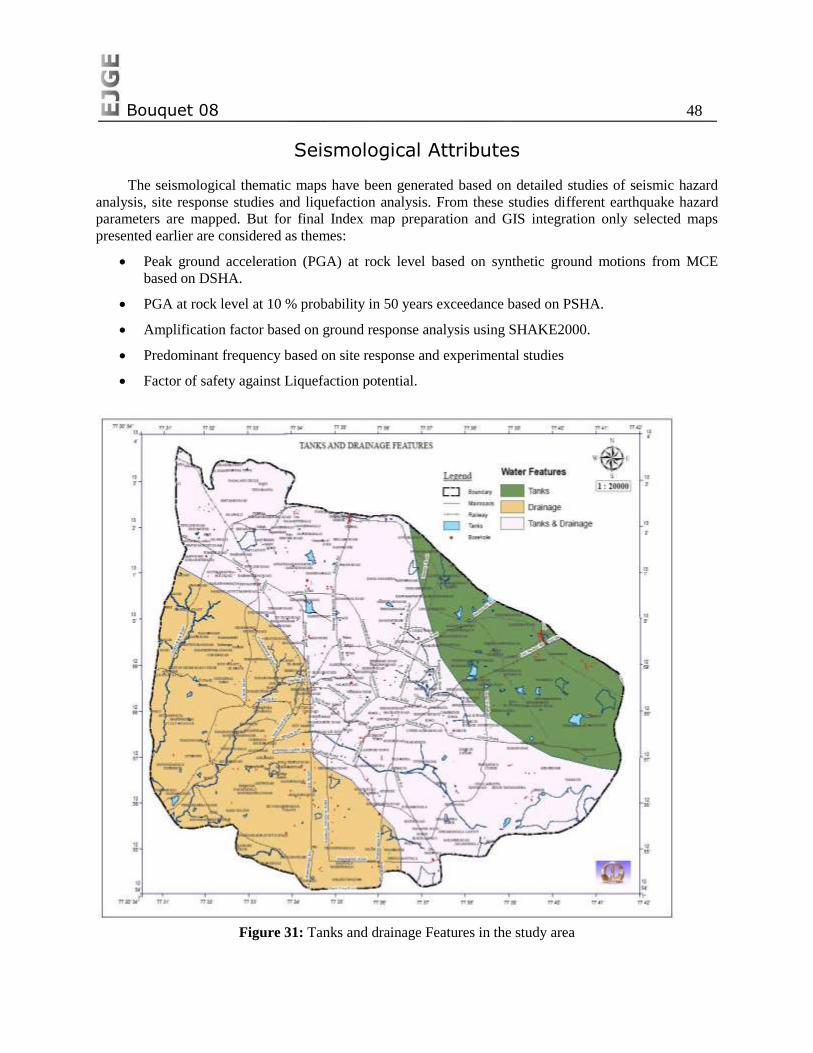
Bouquet 08 48
Seismological Attributes
The seismological thematic maps have been generated based on detailed studies of seismic hazard
analysis, site response studies and liquefaction analysis. From these studies different earthquake hazard
parameters are mapped. But for final Index map preparation and GIS integration only selected maps
presented earlier are considered as themes:
Peak ground acceleration (PGA) at rock level based on synthetic ground motions from MCE
based on DSHA.
PGA at rock level at 10 % probability in 50 years exceedance based on PSHA.
Amplification factor based on ground response analysis using SHAKE2000.
Predominant frequency based on site response and experimental studies
Factor of safety against Liquefaction potential.
Figure 31: Tanks and drainage Features in the study area
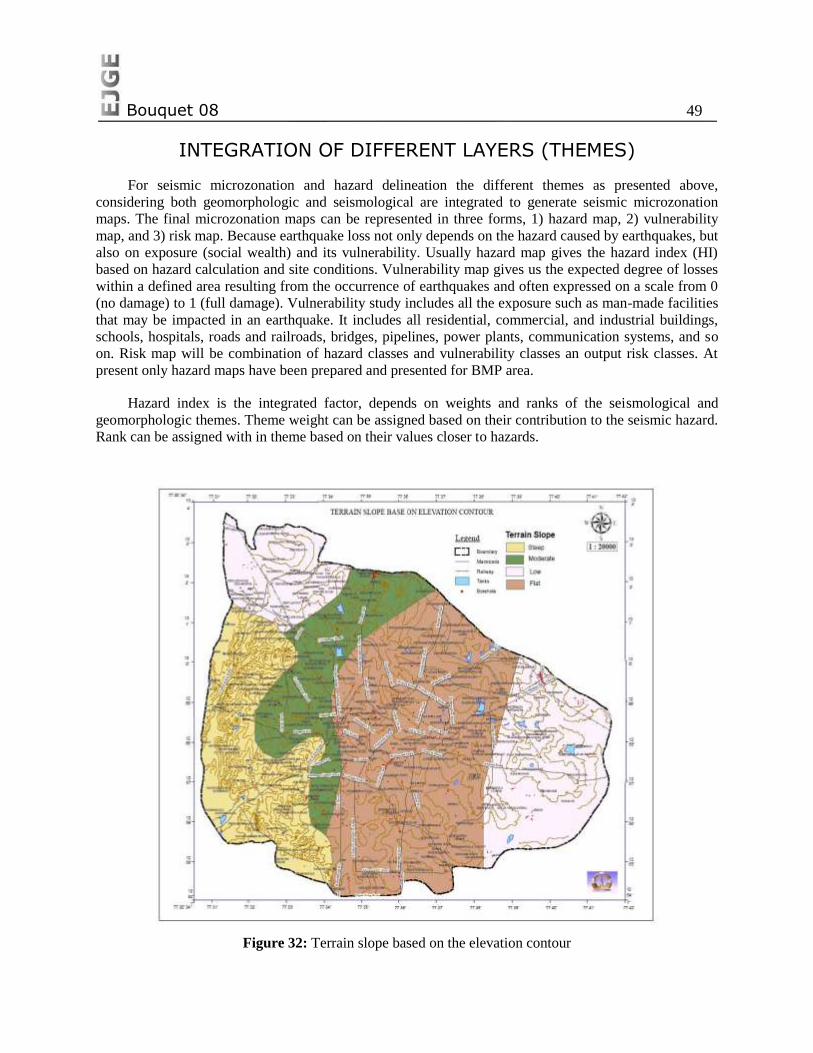
Bouquet 08 49
INTEGRATION OF DIFFERENT LAYERS (THEMES)
For seismic microzonation and hazard delineation the different themes as presented above,
considering both geomorphologic and seismological are integrated to generate seismic microzonation
maps. The final microzonation maps can be represented in three forms, 1) hazard map, 2) vulnerability
map, and 3) risk map. Because earthquake loss not only depends on the hazard caused by earthquakes, but
also on exposure (social wealth) and its vulnerability. Usually hazard map gives the hazard index (HI)
based on hazard calculation and site conditions. Vulnerability map gives us the expected degree of losses
within a defined area resulting from the occurrence of earthquakes and often expressed on a scale from 0
(no damage) to 1 (full damage). Vulnerability study includes all the exposure such as man-made facilities
that may be impacted in an earthquake. It includes all residential, commercial, and industrial buildings,
schools, hospitals, roads and railroads, bridges, pipelines, power plants, communication systems, and so
on. Risk map will be combination of hazard classes and vulnerability classes an output risk classes. At
present only hazard maps have been prepared and presented for BMP area.
Hazard index is the integrated factor, depends on weights and ranks of the seismological and
geomorphologic themes. Theme weight can be assigned based on their contribution to the seismic hazard.
Rank can be assigned with in theme based on their values closer to hazards.
Figure 32: Terrain slope based on the elevation contour
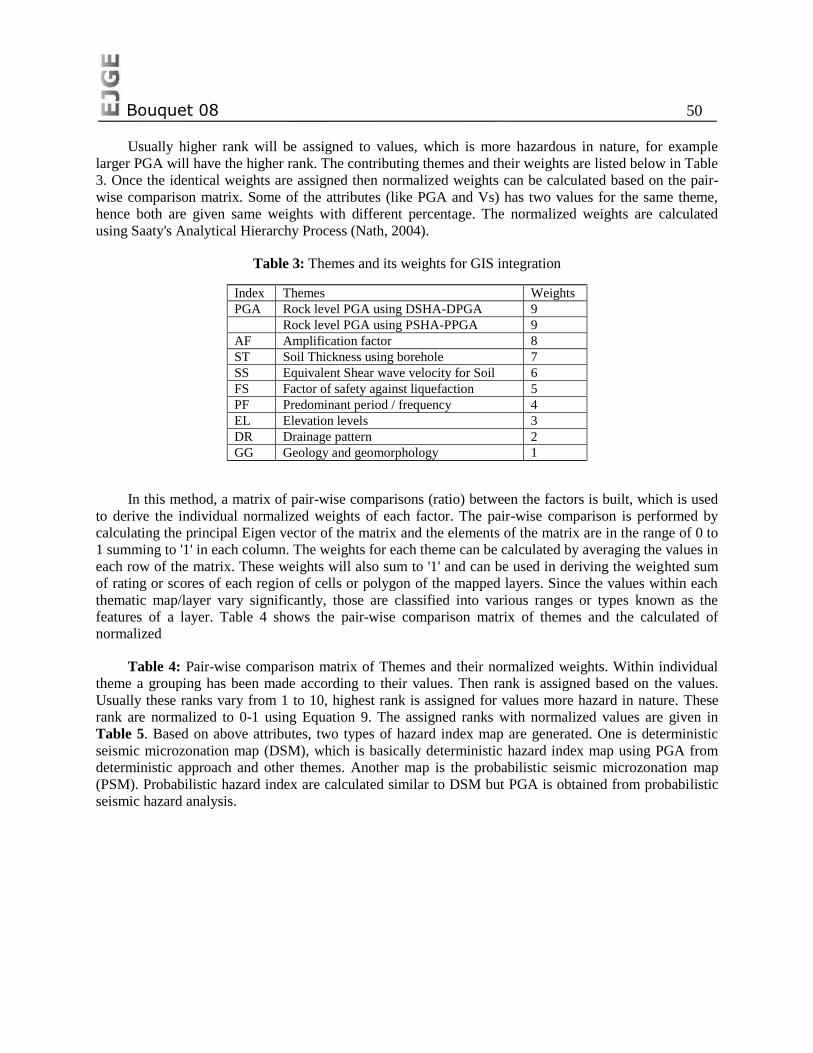
Bouquet 08 50
Usually higher rank will be assigned to values, which is more hazardous in nature, for example
larger PGA will have the higher rank. The contributing themes and their weights are listed below in Table
3. Once the identical weights are assigned then normalized weights can be calculated based on the pair-
wise comparison matrix. Some of the attributes (like PGA and Vs) has two values for the same theme,
hence both are given same weights with different percentage. The normalized weights are calculated
using Saaty's Analytical Hierarchy Process (Nath, 2004).
Table 3: Themes and its weights for GIS integration
In this method, a matrix of pair-wise comparisons (ratio) between the factors is built, which is used
to derive the individual normalized weights of each factor. The pair-wise comparison is performed by
calculating the principal Eigen vector of the matrix and the elements of the matrix are in the range of 0 to
1 summing to '1' in each column. The weights for each theme can be calculated by averaging the values in
each row of the matrix. These weights will also sum to '1' and can be used in deriving the weighted sum
of rating or scores of each region of cells or polygon of the mapped layers. Since the values within each
thematic map/layer vary significantly, those are classified into various ranges or types known as the
features of a layer. Table 4 shows the pair-wise comparison matrix of themes and the calculated of
normalized
Table 4: Pair-wise comparison matrix of Themes and their normalized weights. Within individual
theme a grouping has been made according to their values. Then rank is assigned based on the values.
Usually these ranks vary from 1 to 10, highest rank is assigned for values more hazard in nature. These
rank are normalized to 0-1 using Equation 9. The assigned ranks with normalized values are given in
Table 5. Based on above attributes, two types of hazard index map are generated. One is deterministic
seismic microzonation map (DSM), which is basically deterministic hazard index map using PGA from
deterministic approach and other themes. Another map is the probabilistic seismic microzonation map
(PSM). Probabilistic hazard index are calculated similar to DSM but PGA is obtained from probabilistic
seismic hazard analysis.
Index Themes Weights
PGA Rock level PGA using DSHA-DPGA 9
Rock level PGA using PSHA-PPGA 9
AF Amplification factor 8
ST Soil Thickness using borehole 7
SS Equivalent Shear wave velocity for Soil 6
FS Factor of safety against liquefaction 5
PF Predominant period / frequency 4
EL Elevation levels 3
DR Drainage pattern 2
GG Geology and geomorphology 1
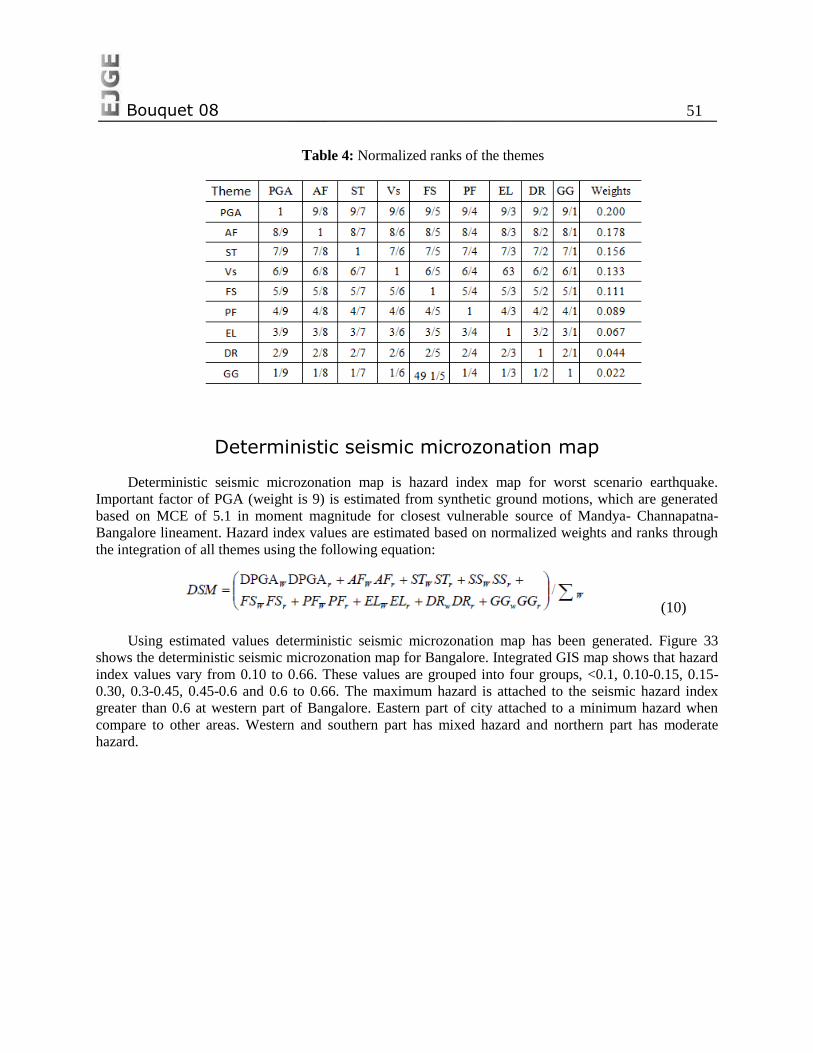
Bouquet 08 51
Table 4: Normalized ranks of the themes
Deterministic seismic microzonation map
Deterministic seismic microzonation map is hazard index map for worst scenario earthquake.
Important factor of PGA (weight is 9) is estimated from synthetic ground motions, which are generated
based on MCE of 5.1 in moment magnitude for closest vulnerable source of Mandya- Channapatna-
Bangalore lineament. Hazard index values are estimated based on normalized weights and ranks through
the integration of all themes using the following equation:
(10)
Using estimated values deterministic seismic microzonation map has been generated. Figure 33
shows the deterministic seismic microzonation map for Bangalore. Integrated GIS map shows that hazard
index values vary from 0.10 to 0.66. These values are grouped into four groups, <0.1, 0.10-0.15, 0.15-
0.30, 0.3-0.45, 0.45-0.6 and 0.6 to 0.66. The maximum hazard is attached to the seismic hazard index
greater than 0.6 at western part of Bangalore. Eastern part of city attached to a minimum hazard when
compare to other areas. Western and southern part has mixed hazard and northern part has moderate
hazard.
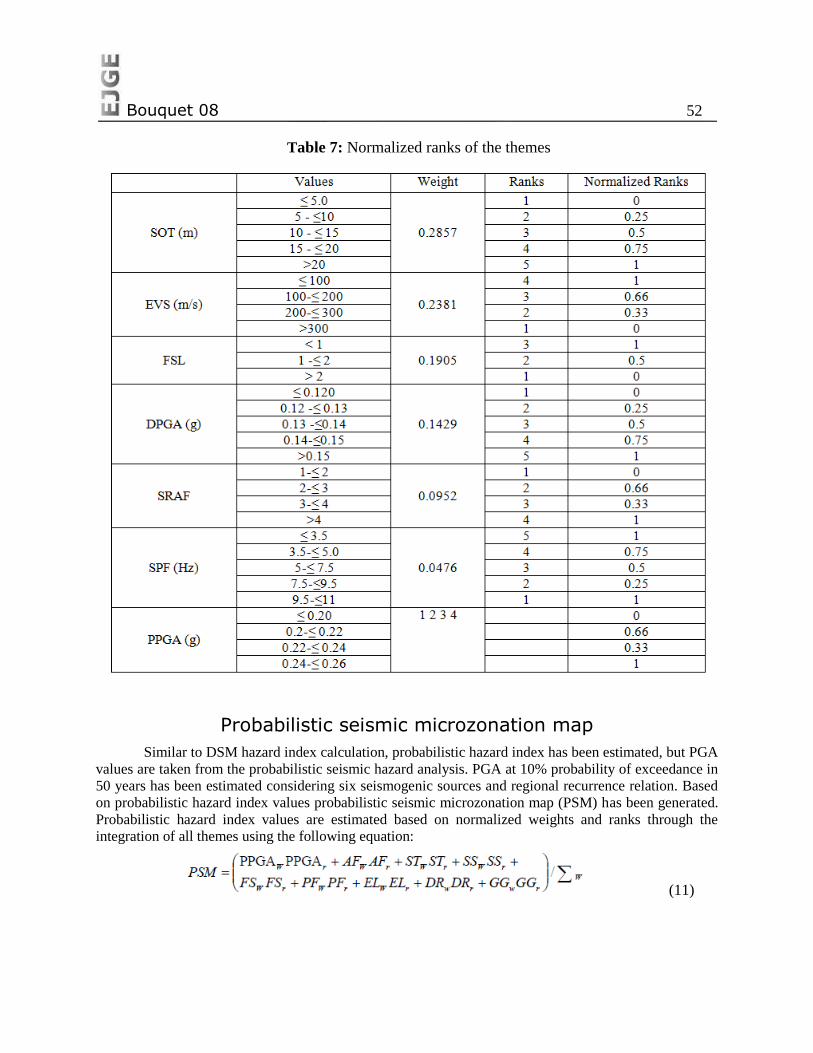
Bouquet 08 52
Table 7: Normalized ranks of the themes
Probabilistic seismic microzonation map
Similar to DSM hazard index calculation, probabilistic hazard index has been estimated, but PGA
values are taken from the probabilistic seismic hazard analysis. PGA at 10% probability of exceedance in
50 years has been estimated considering six seismogenic sources and regional recurrence relation. Based
on probabilistic hazard index values probabilistic seismic microzonation map (PSM) has been generated.
Probabilistic hazard index values are estimated based on normalized weights and ranks through the
integration of all themes using the following equation:
(11)
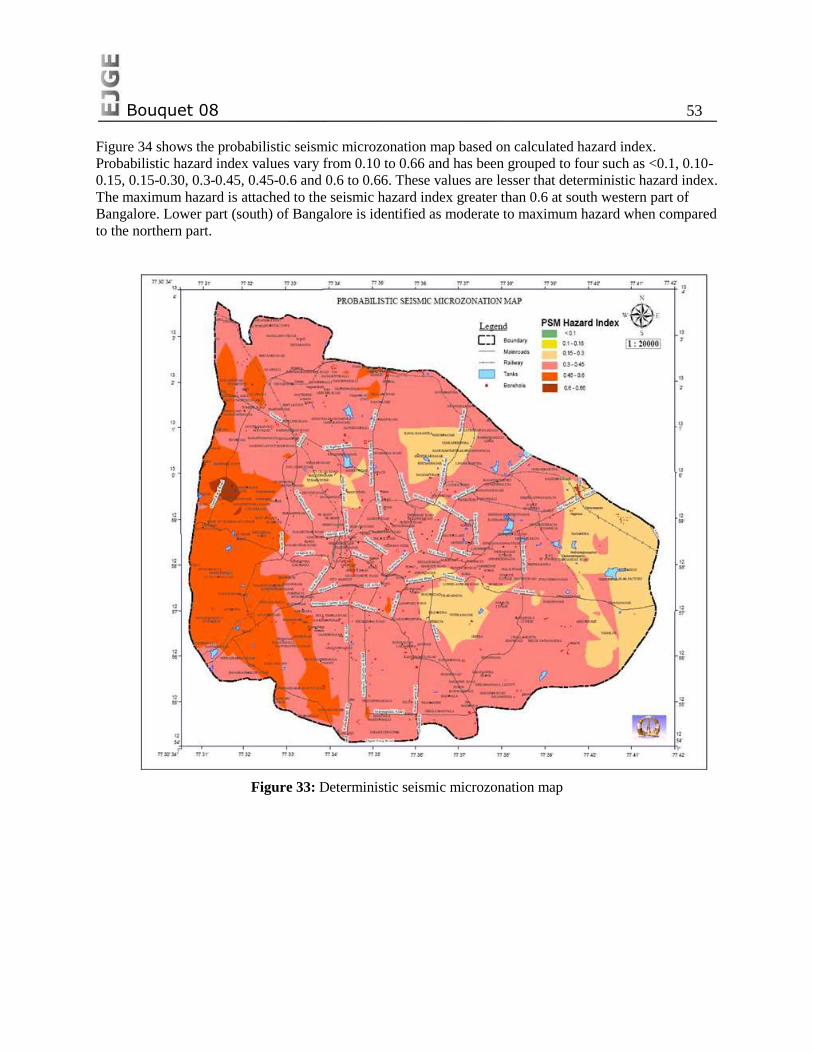
Bouquet 08 53
Figure 34 shows the probabilistic seismic microzonation map based on calculated hazard index.
Probabilistic hazard index values vary from 0.10 to 0.66 and has been grouped to four such as <0.1, 0.10-
0.15, 0.15-0.30, 0.3-0.45, 0.45-0.6 and 0.6 to 0.66. These values are lesser that deterministic hazard index.
The maximum hazard is attached to the seismic hazard index greater than 0.6 at south western part of
Bangalore. Lower part (south) of Bangalore is identified as moderate to maximum hazard when compared
to the northern part.
Figure 33: Deterministic seismic microzonation map
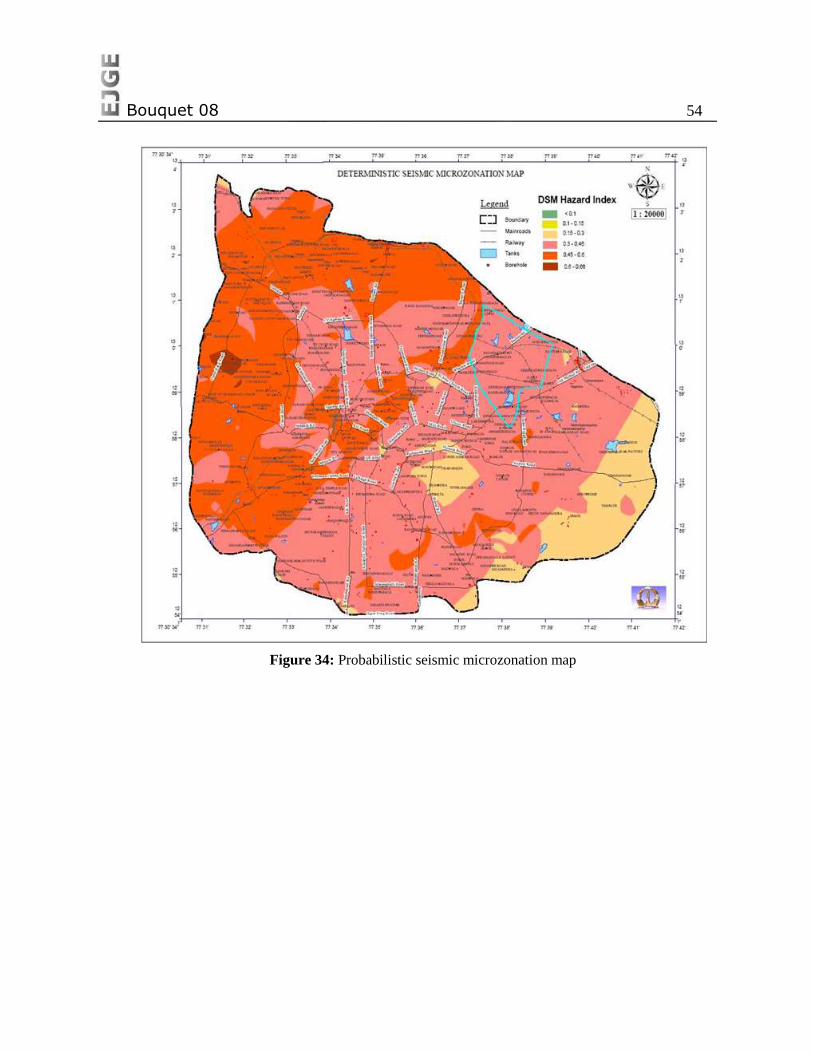
Bouquet 08 54
Figure 34: Probabilistic seismic microzonation map
Bouquet 08 55
CONCLUSIONS AND RECOMMENDATIONS
Case studies of seismic microzonation of Indian cities have been presented with brief introduction to
seismic microzonation and their grade/level. Important issues related to seismic microzonation of Indian
cities with reference to seismology, Grade and geological details, and geotechnical details are highlighted.
For shallow overburden regions (region having engineering rock within 30m) application of 30m average
site class may not be appropriate. Such regions it is recommended to take average shear wave velocity of
overburden thickness (up to the engineering rock depth). A summary of seismic microzonation of
Bangalore with simple methodology is presented in this paper. Hazard maps are generated using both
deterministic as well as probabilistic approaches. Probabilistic study generates the spectral acceleration
map, which is essential component for building designs. It is recommended to generate surface level
spectral acceleration maps using probabilistic approach. Probabilistic hazard map for particular return
period will be more useful for vulnerability and risk analysis. Even though different hazard index maps
are generated for Indian cities, these maps are developed considering different number of themes with
weights and ranks. There is no global match in hazard index values. Hence, specification about number of
themes, weights and ranks need to be recommended in near future. As a first level, several themes have
been considered to generate hazard maps.
REFERENCES 1. Aki, K., and Richards, P.G. (1980) ―Quantitative Seismology‖, Freeman and Co., New York.
2. Algermissen, S. T. and Perkins, D. M. (1976) A probabilistic estimate of maximum acceleration
in rock in the contiguous United States, USGS Open File Report 76-416, p-45.
3. Anbazhagan P., Vinod, J. S. and Sitharam, T. G. (2008) Probabilistic seismic hazard Analysis for
Bangalore, Journal of Natural Hazards (online, 10.1007/s11069-008-9253-3).
4. Anbazhagan, P., and Sitharam, T. G. (2008) Mapping of Average Shear Wave Velocity for
Bangalore Region: A Case Study, Journal of Environmental & Engineering Geophysics Vol. 13
(2) pp. 69-84.
5. Ansa1, A., Biro, Y., Erken, A., Gülerce., U. (2004) ―Seismic Microzonation: A Case Study-
Chapter 8 in Recent Advances in Earthquake Geotechnical Engineering and Microzonation‖
edited by Ansal, A, Kluwer Academic Publishers. Printed in the Netherlands, pp 253–266.
6. Ansal, A (ed) (2004) ―Recent Advances in Earthquake Geotechnical Engineering and
Microzonation,‖ Kluwer Academic Publishers. Printed in the Netherlands.
7. Anusuya Barua (2005) ―Generation of Geological Database for Seismic Microzonation of
Dehradun‖ M.Sc Thesis, International Institute for Geo-Information Science and Earth
Observations -Enschede, Netherlands, P-102.
8. Arora, S. K. (1971),‖ A study of the Earth's crust near Gauribidanur in southern India‖, Bull.
Seism. Soc. Am., Vol. 61, pp 671 –683.
9. Bansal, B.K and Vandana, C. (2007) ―Microzonation Studies in India: DST initiatives,‖
Proceedings of Workshop on Microzonation, Indian Institute of Science Bangalore, pp 1-6.
10. Baranwal, M., Pathak, B. and Syiem, S.M. (2005) ―Preliminary First Level Seismic
Microzonation of Guwahati‖, Journal of Geophysics, Vol. XXVI No.1, PP 32-40.
Bouquet 08 56
11. Bard, P. Y., Czitrom, C., Durville, J. L., Godefroy, P., Meneroud, J. P., Mouroux, P., and Pecker,
A. (1995) ―Guidelines for Seismic Microzonation Studies‖ Published by Delegation of Major
Risks of the French Ministry of the Environment-Direction for prevention, Pollution and Risks, p-
50.
12. Bell, F.G., Cripps, J.C., Culshaw, M.G., O‘Hara, M. (1987) ―Aspects of geology in planning. In:
Culshaw, M.G., Bell, F.G., Cripps, J.C., O‘Hara, M. (Eds.) Planning and Engineering Geology‖,
Geological Society Engineering Geology Special Publication, no. 4, pp. 1– 38.
13. Beresnev, I. and Atkinson, G. (1998) ―FINSIM - a FORTRAN Program for Simulating Stochastic
Acceleration Time Histories from Finite Faults,‖ Seism. Res. L. 69, 27-32.
14. Bhatia, S. C., Ravi Kumar, M and Gupta, H.K. (1999) ―A Probabilistic Seismic Hazard Map of
India and Adjoining Regions‖,http://www.seismo.ethz.ch/gshap/ict/ india.html. 1-12.
15. Bilham, R. (2004) ―Earthquakes in India and the Himalaya: tectonics, geodesy and history‖,
Annals of Geophysics, 47(2) 839-858.
16. Bindi, D., Parolai,S., Spallarossa,D. and Cattaneo,M. (2000) ―Site effects by H/V ratio:
comparison of two different procedures‖, J. Earth. Eng., Vol. 4, pp 97-113.
17. BIS: (2002) IS 1893-2002, Indian Standard Criteria for Earthquake Resistant Design of
Structures, Part 1 - General Provisions and Buildings. Bureau of Indian Standards, New Delhi.
18. Boore, D. M. (1983) ―Stochastic simulation of high-frequency ground motions based on
seismological models of the radiated spectra‖, Bull. Seism. Soc. Am., 73, pp 1865-1894.
19. Boore, D. M. (2003) ―Simulation of ground motion using the stochastic method‖, Pure and
Applied Geophysics, 160, pp 635-675.
20. Brijesh Gulati (2006) ―Earthquake Risk Assessment of Buildings: Applicability of HAZUS in
Dehradun, India‖ M.Sc Thesis, International Institute for Geo-Information Science and Earth
Observations -Enschede, Netherlands, P-109.
21. Bullen, K.E. (1965) ―An introduction to the theory of seismology‖, Cambridge Univ. Press,
Cambridge, U.K.
22. Cetin, K.O, Seed, R.B., Kiureghian, A.D., Tokimatsu, K., Harder, L.F. Jr., Kayen, R.E., and
Moss, R.E.S. (2004) ―Standard penetration test-based probabilistic and deterministic assessment
of seismic soil liquefaction potential‖, Journal of Geotechnical and Geoenvironmental
Engineering, 12, pp 1314-1340.
23. Chandra U. (1977) ―Earthquakes of Peninsular India: a seismotectonic study‖, Bull. Seism. Soc.
Am. 65, 1387-1413.
24. Cornell, C. A., and Van Marke, E. H. (1969) ―The Major Influences on Seismic Risk,‖
Proceedings of the Third World Conference on Earthquake Engineering, Santiago, Chile, A(1)
69-93.
25. Cornell, C. A. (19680, ―Engineering seismic risk analysis‖, Bull. Seismol. Soc. Am. 58, 1583–
1606.
26. Dai, F.C., Lee, C.F., Zhang, X.H. (2001) ―GIS-based geo-environmental evaluation for urban
land-use planning: a case study‖, Engineering Geology 61, 257–271.
27. Dai, F.C., Liu, Y., Wang, S. (1994) ―Urban geology: a case study of Tongchuan City‖, Shaanxi
Province, China. Engineering Geology 38, 165–175.
Bouquet 08 57
28. Dobry, R., R. D., Borcherdt, C. B., Crouse, I. M., Idriss, W. B., Joyner, G. R. Martin, M. S.,
Power, E. E., Rinne and R. B. Seed (2000) ―New site coefficients and site classification system
used in recent building seismic code provisions‖, Earthquake Spectra, 16, pp 41–67.
29. 29.DRM (2004) ―Seismic Microzonation for Municipalities Manual‖ by World institute for
Disaster Risk Management, Published in online www.DRMonline.net last down loaded on 5
August 2008.
30. 30.Field E.H. and Jacob, K.H. (1993) ―The Theoretical Response of Sedimentary Layers to
Ambient Seismic Noise‖, Geophys. Res. Lett. 20, pp 2925-2928.
31. Ganesha Raj, K. (2001) ―Major Lineaments of Karnataka and their significance with respect to
Seismicity – Remote sensing based analysis‖, Ph.D. Thesis, Gulbarga University, Karnataka,
India.
32. Ganesha Raj. K., and Nijagunappa, R. (2004),‖ Major Lineaments of Karnataka State and their
Relation to Seismicity‖ Remote Sensing Based Analysis, Jr.Geol.Soc.India, 63, pp.430-439.
33. GovindaRaju, L., Ramana, G.V., HanumanthaRao, C., and Sitharam, T.G. (2004),‖Site specific
ground response analysis, Special section‖, Geotechnics and Earthquake Hazards, Current
Science, 87(10) pp 1354-1362.
34. Gutenberg B. and Richter C. F. (1944) ―Frequency of earthquakes in California‖, Bull. Seism.
Soc. Am. 34 185-188.
35. Hake, S.S. (1987) ―A review of engineering geological and geotechnical aspects of town and
country planning with particular reference to minerals and the extractive processes. In: Culshaw,
M.G., Bell, F.G., Cripps, J.C., O‘Hara, M. (Eds.) Planning and Engineering Geology‖, Geological
Society Engineering Geology Special Publication, no. 4, pp. 69–74.
36. Heaton, Tajima, T. F., and Mori, A.W. (1986) ―Estimating Ground motions using recorded
Accelerograms‖, Surveys in Geophysics, 8, pp 25-83.
37. Idriss, I. M., and Boulanger, R. W. (2004) "Semi-empirical procedures for evaluating liquefaction
potential during earthquakes." Proc., 11th International Conference on Soil Dynamics and
Earthquake Engineering, and 3rd International Conference on Earthquake Geotechnical
Engineering, D. Doolin et.al.,., eds., Stallion Press, 1, pp 32-56.
38. Iwasaki, T., Tokida, K., Tatsuoka, F., Watanabe, S., Yasuda, S. and Sato, H.(1982)
―Microzonation for soil liquefaction potential using simplified methods,‖ In Proceedings of Third
International Conference on Microzonation, Seattle, vol. 3, pp 1310–1330.
39. Iyengar, R. N. and Ghosh, S. (2004) ―Microzonation of earthquake hazard in greater Delhi area‖,
Curr. Sci., Vol. 87, pp 1193–1202.
40. Iyengar, R.N. and Raghukanth, S. T. G. (2004) ―Attenuation of Strong Ground Motion in
Peninsular India‖, Seismological Research Letters, Vol. 75, No. 4, pp 530-540.
41. Jaiswal, K. and Sinha, R.,(2006) ―Probabilistic Modeling of Earthquake Hazard in Stable
Continental Shield of the Indian Peninsula‖, ISET Journal of Earthquake Technology. 43(3). 49-
64
42. Joyner, W. B. and Boore, D. M. (1981) ―Peak horizontal accelerations and velocity from strong-
motion records including records from the 1979 Imperial Valley‖, California, earthquake, Vol.71,
pp 2011-2038.
Bouquet 08 58
43. Kaila., K. L., Gaur V. K. and Hari Narain. (1972) ―Quantitative seismicity maps of India‖, Bull.
Seism. Soc. Am. 62, 1119-1131.
44. Kanli, A.I., Tildy, P., Pronay, Z., Pinar, A. and Hemann, L. (2006) ―Vs30 mapping and soil
classification for seismic site effect evaluation in Dinar region , SW Turkey‖, Geophysics J. Int,
165, pp 223-235.
45. Khattri, K.N. (1992) ―Seismic Hazard in Indian region‖, Current science, 62 (1&2) 109-116.
46. Kijko, A. and Sellevoll, M. A. (1989) ―Estimation of earthquake hazard parameters from
incomplete data files Part I Utilization of Extreme and Complete catalogs with different threshold
Magnitudes‖, Bull. Seismol. Soc. Am., 79, 645–654.
47. Kijko, A. and Sellevoll, M. A. (1992) ―Estimation of earthquake hazard parameters from
incomplete data files. Part II. Incorporating Magnitude Heterogeneity‖, Bull. Seismol. Soc. Am.,
82, 120–134.
48. Kiureghian, D, A., and A. H.-S. Ang. (1977) ―A fault-rupture model for seismic risk analysis‖,
Bull. Seism. Soc. Am., 67(4): 1173-1194.
49. Kramer, S. L. (1996) ―Geotechnical Earthquake Engineering ―, Published by Pearson Education
Ptd. Ltd,Reprinted 2003, Delhi, India.
50. Krishna, V. G., and Ramesh, D. S. (2000) ―Propagation of crustal waveguide trapped Pg and
seismic velocity structure in the south Indian shield,‖ Bull. Seismol. Soc. Am., 90, pp 1281–1296.
51. Legget, R.F. (1987) ―The value of geology in planning. In: Culshaw, M.G., Bell, F.G., Cripps,
J.C., O‘Hara, M. (Eds.) Planning and Engineering Geology‖, Geological Society Engineering
Geology Special Publication, no. 4, pp. 53– 58.
52. Mandal,P, Chadha, R. K., Satyamurty, C. , Raju, I. P. And Kumar, N. (2005) ―Estimation of
Site Response in Kachchh, Gujarat, India, Region Using H/V Spectral Ratios of Aftershocks of
the 2001 Mw 7.7 Bhuj Earthquake‖ Pure and Applied Geophysics, 162, 2479–2504.
53. Marcuson, W. F. (1978) ‗‗Definition of terms related to liquefaction.‘‘ J. Geotech. Engrg. Div.,
ASCE,Vol.104(9),pp 1197–1200.
54. McGuire, R. K. (1976) ―FORTRAN computer program for seismic risk analysis‖, U.S. Geol.
Surv., Open File Rep. No. 76-67.
55. McGuire, R.K. (1978) ―FRISK — A Computer Program for Seismic Risk Analysis‖, U.S.
Department of Interior, Geological Survey: Open-File Report 78-1007.
56. Mohanty M (2006) India bolsters GPS network for earthquake hazard assessment. EOS Trans.
AGU 87(37): 375-375.
57. Mohanty, W.K., Walling, M.Y., Nath, S.K. and Pal, I. (2007) ―First Order Seismic Microzonation
of Delhi, India Using Geographic Information System (GIS)‖ Natural Hazards, Vol. 40, No. 2.
pp. 245-260.
58. Nakamura, Y. (1989) "Earthquake Alarm System for Japan Railways," Japanese Railway
Engineering , 28(4) pp 3-7.
59. Nath, S. K. (2006) ―Seismic Hazard and Microzonation Atlas of the Sikkim Himalaya‖, published
by Department of Science and Technology, Government of India, India.
Bouquet 08 59
60. Nath, S.K. (2007) ―Seismic Microzonation Framework – Principles & Applications,‖ Proceedings
of Workshop on Microzonation, Indian Institute of Science, Bangalore, pp 9-35.
61. Parolai, S., Bormann, P and Milkert, C. (2001) ―Assessment of the natural frequency of the
sedimentary cover in the Cologne area (Germany) using noise measurements,‖ Journal of
Earthquake Engineering , Vol. 5, pp 541–564.
62. Parvez, A.I, Franco Vaccari and PanzaOctober, G. F. (2003) ―A deterministic seismic hazard map
of India and adjacent areas‖, Geophysical Journal International. 155, 489–508.
63. Parvez, I. A. and Madhukar, K. (2006) ―Site Response in Ahmedabad City using Microtremor
Array Observation,‖ A Preliminary Report, PD CM 0602,
http://www.cmmacs.ernet.in/cmmacs/Publications/proj_docs/proj_docs1.html.
64. PCRSMJUA (2005) ―Project Completion Report of Seismic Microzonation of Jabalpur Urban
Area,‖ published by Department of Science and Technology, Government of India, India.2
volumes.
65. Pearce, J.T. and Baldwin, J.N. (2005) ― Liquefaction Susceptibility Mapping ST. Louis, Missouri
and Illinois-Final Technical Report‖, published in web.er.usgs.gov/reports/
abstract/2003/cu/03HQGR0029.pdf.
66. Pitilakis, K. (2004) ―Site effects, Chapter 5, Recent Advances in Earthquake Geotechnical
Engineering and Microzonation.‖ edited by Ansal, A, Kluwer Academic Publishers. Printed in the
Netherlands. pp 139-197.
67. Purnachandra Rao, N. (1999) ―Single station moment tensor inversion for focal mechanisms of
Indian intra-plate earthquakes‖, Current Science, Vol. 77, pp 1184-1189.
68. RaghuKanth, S. T. G. and Iyengar, R.N. (2006),‖Seismic hazard estimation for Mumbai city‖,
Current Science, Vol. 91, No. 11, pp 1486-1494.
69. RaghuKanth, S. T. G. and Iyengar, R.N. (2007) ―Estimation of seismic spectral acceleration in
Peninsular India,‖ J. Earth Syst. Sci. 116, No. 3, pp. 199–214.
70. Rajiv Ranjan. (2005) ―Seismic Response Analysis of Dehradun city, India,‖ M.Sc Thesis,
International Institute for Geo-Information Science and Earth Observations -Enschede,
Netherlands, P-86.
71. Ram, A. and H. S. Rathor. (1970) ―On frequency magnitude and energy of significant Indian
earthquakes‖, Pure Appl. Geophys. 79, 26-32.
72. Ramalingeswara Rao, B. (2000) ―Historical Seismicity and deformation rates in the Indian
Peninsular Shield―, Journal of Seismology, Vol. 4, pp 247-258.
73. Ramalingeswara Rao. B. and Sitapathi Rao, P. (1984) ―Historical seismicity of Peninsular India‖,
Bulletin of the Seismological Society of America, 74, 2519 – 2533.
74. Rao, K.S and Neelima Satyam D (2005) ―Seismic Microzonation Studies for Delhi Region,‖
Symposium on Seismic Hazard Analysis and Microzonation, September 23-24, Roorkee, pp 213-
234.
75. Rao. K. S. and Neelima Satyam. D. (2007) ―Liquefaction studies for seismic microzonation of
Delhi region‖, Current Science, Vol. 92, No. 5, pp 646-654.
76. Rau, J.L. (1994) ―Urban and environmental issues in East and Southeast Asian coastal lowlands‖,
Engineering Geology 37, 25–29.
Bouquet 08 60
77. Regulatory Guide 1.165 (1997) ―Identification and characterization of seismic sources and
determination of safe shutdown earthquake ground motion‖, Published by U.S. Nuclear
Regulatory Commission USNRC, March 1997.
78. Saaty, T. L. (1980). The Analytic Hierarchy Process (McGraw-Hill, New York, NY).
79. Schnabel, P. B. (1973) ―Effects of Local Geology and Distance from Source on Earthquake
Ground Motion,‖ Ph.D. Thesis, University of California, Berkeley, California.
80. Seed, H. B. and Peacock, W. H. (1971) ―Test Procedures for Measuring Soil Liquefaction
Characteristics,‖ Journal of the Soil Mechanics and Foundations Division, ASCE, 97(SM8) pp
1099-1119.
81. Seed, H. B., and I. M. Idriss (1971) ―Simplified procedure for evaluating soil liquefaction
potential,‖ Journal of the Soil Mechanics and Foundation Division, ASCE, 97(9) pp 1249-1274.
82. Seed, H. B., and Idriss, I. M. (1970) ―Soil Moduli and Damping Factors for Dynamic Response
Analyses,‖ Earthquake Engineering Research Center, University of California, Berkeley,
California, Rep. No. EERC-70/10.
83. Seed, H. B., Idriss, I. M., and Arango, I. (1983) ―Evaluation of Liquefaction potential Using Field
Performance Data,‖ Journal of Geotechnical Engineering, 9(3) pp 458-482.
84. Seed, H. B., Tokimatsu, K., Harder, L. F., and Chung, R. M. (1985) ‗‗The influence of SPT
procedures in soil liquefaction resistance evaluations,‖ J. Geotech. Engrg., ASCE, 111(12) pp
1425–1445.
85. SEISAT (2000) ―Seismotectonic Atlas of India,‖ published by Geological Survey of India.
86. Sitharam, T. G. and Anbazhagan, P. (2007) ―Seismic Hazard Analysis for the Bangalore Region‖,
Natural Hazards, 40, pp 261–278.
87. Sitharam, T. G., Anbazhagan, P. and Ganesha Raj, K. (2006) ―Use of remote sensing and
seismotectonic parameters for seismic hazard analysis of Bangalore‖, Natural Hazards Earth
System Sci., 6, pp 927–939.
88. Sitharam, T. G., Anbazhagan. P and Mahesh. G. U. (2007) 3-D Subsurface Modelling and
Preliminary Liquefaction Hazard Mapping of Bangalore City Using SPT Data and GIS, Indian
Geotechnical Journal, 37(3): 210-226
89. Sitharam, T.G., Srinivasa Murthy, B.R., and Aravind Kolge (2001) ‘‘A Post- Mortem of the
Collapse of Structures in Ahmedabad during the Bhuj Earthquake―, Proceedings, Indian
Geotechnical Conference, I, pp 344-347.
90. 90.Skempton, A. W. (1986) ―Standard Penetration Test Procedures.‖ Geotechnique, Vol.36,
No.3, pp 425-447.
91. Sridevi Jade. (2004) ―Estimation of plate velocity and crustal deformation in the Indian
subcontinent using GPS geodesy‖, Current Science, 86, 1443-1448.
92. 92.Srinivasan, R. and Sreenivas, B.L. (1977) ―Some new geological features from the Landsat
imagery of Karnataka‖, Jour. Geol. Soc. India, 18, 589-597.
93. Stepp, J. C. (1972) ―Analysis of the completeness of the earthquake sample in the Puget Sound
area and its effects on statistical estimates of earthquakes hazard‖, Proc. Inter. Conf.
Microzonation for safer construct. Res. Appl. Seattle, Washington, Vol. 64, No. 4, pp 1189-1207.
Bouquet 08 61
94. Subrahmanya, K. R. (1996) ―Active intraplate deformation in south India‖, Tectonophysics, 262,
231-241.
95. Subrahmanya, K. R. (2002) ―Deformation related lineaments in the Indian Peninsula near 13oN‖,
Journal of Geophysics, XXIII-2, 59-68.
96. Suganthi, A. and Boominathan, A. (2006) ―Seismic Response Study of Chennai City Using
Geotechnical Borelog Data and GIS‖, Proceedings of Indian Geotechnical Conference -2006, 14-
16, December-2006, Chennai, India, pp 831-832.
97. Tandon, A.N. (1992) Seimology in India–an Overview up to 1970. Current science, 62 (1&2) 9-
16.
98. TC4-ISSMGE (1999) ―Manual for Zonation on Seismic Geotechnical Hazard,‖ Revised edition,
Technical Committee for Earthquake Geotechnical Engineering (TC4) of the International
Society of Soil Mechanics and Geotechnical Engineering (ISSMGE) 209.
99. Trivedi, S. S., Rao, K. S. and Gupta, K. K. (2006) ―Microtremor Measurements for Ahmedabad
Region‖, Proc. Indian Geotechnical Conference-2006, 14-16 December 2006, Chennai, INDIA,
pp 837-840.
100. Tseng T.L. and Chen, W.P (2006) ―Probing the Southern Indian Shield with P-Wave
Receiver-Function Profiles‖ Bulletin of the Seismological Society of America, Short note, 96: pp
328 – 333.
101. Valdiya, K.S. (1998) ―Late Quaternary Movements and Landscape Rejuvenation in
Southeastern Karnataka and Adjoining Tamil Nadu in Southern India Shield, Journal of
Geological Society of India, India, 51, 139-166.
102. Van Rooy, J.L., Stiff, J.S. (2001) ―Guidelines for urban engineering geological
investigations in South Africa‖, Bulletin of Engineering and Geological Environment 59, 285–
295.
103. Wells, D.L., Coppersmith, K.J. (1994) ―New empirical relationships among magnitude,
rupture length, rupture width, rupture area, and surface displacement‖, Bull. Seismol. Soc. Am.
84, pp 975– 1002.
104. Youd, T.L., Idriss, I.M., Andrus, R.D., Arango, I., Castro, G., Christian, J.T., Dobry, R.,
Liam Finn, W.D., Harder Jr., L.H., Hynes, M.E., Ishihara, K., Koester, J.P., Liao, S.S.C,
Marcuson, W.F., Marting, G.R., Mitchell, J.K., Moriwaki, Y., Power, M.S., Robertson, P.K.,
Seed, R.B, And Stokoe, K.H. (2001) ―Liquefaction Resistance of Soils: Summary from the 1996
NCEER and 1998. NCEER/NSF Workshops on Evaluation of Liquefaction Resistance of Soils‖,
Journal of Geotechnical and Geoenvironmental Engineering, pp 817 – 833.
© 2008 ejge