Sedimentary record of redox-sensitive elements (U, Mn, Mo) in a transitory anoxic basin (the Thau...
11
Sedimentary record of redox-sensitive elements (U, Mn, Mo) in a transitory anoxic basin (the Thau lagoon, France) Franc ¸oise Elbaz-Poulichet a, * , Jean Luc Seidel a , Didier Je ´ze ´quel b , Edouard Metzger b , Franc ¸ois Pre ´vot b , Caroline Simonucci b , Ge ´rard Sarazin b , Eric Viollier b , Henri Etcheber c , Jean-Marie Jouanneau c , Olivier Weber c , Olivier Radakovitch d a Laboratoire Hydrosciences, UMR 5569 CNRS, IRD, University Montpellier I and II, CCMSE, 34095 Montpellier cedex 5, France b Laboratoire de Ge ´ochimie des Eaux, University Paris 7 and IPGP, UMR CNRS 7047 Physico-chimie des Fluides Ge ´ologiques, case 7052, 2, place Jussieu 75251 Paris Cedex 05, France c EPOC, UMR 5805 CNRS, University Bordeaux I, avenue des facultes, 33405 Talence Cedex, France d CEREGE, UMR 6635, CNRS, University Aix-Marseille, Europole de l’Arbois-BP 80, 13545 Aix-en-Provence, France Received 17 February 2004; received in revised form 29 September 2004; accepted 1 October 2004 Available online 21 April 2005 Abstract In order to further document the relation between redox conditions and the sedimentary record of Mn, U and Mo in a transitory anoxic water basin, their distribution has been studied along two profiles in the Thau lagoon (France). Sediments and pore-water have been sampled at two contrasting sites located, respectively, in the shellfish-farming area and in the centre of the lagoon. In the shellfish-farming area, the particulate organic carbon (POC) data indicate a more rapid organic matter mineralisation compared to the centre of the lagoon. This results in a sharper redox gradient characterized by the appearance of H 2 S in pore-water a few millimetres below the sediment–water interface. In the centre of the lagoon, H 2 S appears at a depth of 35 cm. In both cores, sedimentary Mn is relatively depleted through out the whole sedimentary column and varies with the proportion of clay minerals. After an initial release into solution at the sediment–water interface in relation to Mn-oxide reductive dissolution, authigenic U is immobilized when sulphides appear. Despite the occurrence of anoxic conditions at the sediment–water interface at the site influenced by shellfish farming, the burial of U is reduced by bioturbation, which raises reducing sediments to the surface. In the centre of the lagoon, Mo profiles reflect continuous diffusion into pore water and immobilization at 15 cm probably in anoxic microenvironments. At shellfish farms, dissolved Mo undergoes removal with sulphides but contrary to U, sedimentary Mo does not appear to be strongly affected by bioturbation. The profile indicates an increase in the frequency of anoxia crises during the second half of the 20th century. D 2004 Elsevier B.V. All rights reserved. Keywords: Water column anoxia; Sediment record; Redox tracers; Mediterranean lagoon; Shellfish farming 0304-4203/$ - see front matter D 2004 Elsevier B.V. All rights reserved. doi:10.1016/j.marchem.2004.10.001 * Corresponding author. Fax: +33 4 67 16 67 74. E-mail address: [email protected] (F. Elbaz-Poulichet). Marine Chemistry 95 (2005) 271 – 281 www.elsevier.com/locate/marchem
Transcript of Sedimentary record of redox-sensitive elements (U, Mn, Mo) in a transitory anoxic basin (the Thau...
www.elsevier.com/locate/marchem
Marine Chemistry 95
Sedimentary record of redox-sensitive elements (U, Mn, Mo) in a
transitory anoxic basin (the Thau lagoon, France)
Francoise Elbaz-Poulicheta,*, Jean Luc Seidela, Didier Jezequelb, Edouard Metzgerb,
Francois Prevotb, Caroline Simonuccib, Gerard Sarazinb, Eric Viollierb, Henri Etcheberc,
Jean-Marie Jouanneauc, Olivier Weberc, Olivier Radakovitchd
aLaboratoire Hydrosciences, UMR 5569 CNRS, IRD, University Montpellier I and II, CCMSE, 34095 Montpellier cedex 5, FrancebLaboratoire de Geochimie des Eaux, University Paris 7 and IPGP, UMR CNRS 7047 Physico-chimie des Fluides Geologiques,
case 7052, 2, place Jussieu 75251 Paris Cedex 05, FrancecEPOC, UMR 5805 CNRS, University Bordeaux I, avenue des facultes, 33405 Talence Cedex, France
dCEREGE, UMR 6635, CNRS, University Aix-Marseille, Europole de l’Arbois-BP 80, 13545 Aix-en-Provence, France
Received 17 February 2004; received in revised form 29 September 2004; accepted 1 October 2004
Available online 21 April 2005
Abstract
In order to further document the relation between redox conditions and the sedimentary record of Mn, U and Mo in a
transitory anoxic water basin, their distribution has been studied along two profiles in the Thau lagoon (France). Sediments and
pore-water have been sampled at two contrasting sites located, respectively, in the shellfish-farming area and in the centre of the
lagoon. In the shellfish-farming area, the particulate organic carbon (POC) data indicate amore rapid organic matter mineralisation
compared to the centre of the lagoon. This results in a sharper redox gradient characterized by the appearance of H2S in pore-water
a few millimetres below the sediment–water interface. In the centre of the lagoon, H2S appears at a depth of 35 cm.
In both cores, sedimentary Mn is relatively depleted through out the whole sedimentary column and varies with the
proportion of clay minerals. After an initial release into solution at the sediment–water interface in relation to Mn-oxide
reductive dissolution, authigenic U is immobilized when sulphides appear. Despite the occurrence of anoxic conditions at the
sediment–water interface at the site influenced by shellfish farming, the burial of U is reduced by bioturbation, which raises
reducing sediments to the surface. In the centre of the lagoon, Mo profiles reflect continuous diffusion into pore water and
immobilization at 15 cm probably in anoxic microenvironments. At shellfish farms, dissolved Mo undergoes removal with
sulphides but contrary to U, sedimentary Mo does not appear to be strongly affected by bioturbation. The profile indicates an
increase in the frequency of anoxia crises during the second half of the 20th century.
D 2004 Elsevier B.V. All rights reserved.
Keywords: Water column anoxia; Sediment record; Redox tracers; Mediterranean lagoon; Shellfish farming
0304-4203/$ - s
doi:10.1016/j.m
* Correspondi
E-mail addr
(2005) 271–281
ee front matter D 2004 Elsevier B.V. All rights reserved.
archem.2004.10.001
ng author. Fax: +33 4 67 16 67 74.
ess: [email protected] (F. Elbaz-Poulichet).
F. Elbaz-Poulichet et al. / Marine Chemistry 95 (2005) 271–281272
1. Introduction
The solubility of the redox sensitive elements (U,
Mo, Mn) varies as a function of redox potential. Above
the redox transition zone, Mn precipitates as MnOx
incorporating MoO42�, whereas U occurs as soluble
U(VI) carbonato-complexes. In anoxic conditions, not
only complexation of U and Mo by dissolved organic
matter has been reported (Alberic et al., 2000) but also
reduced U (U(IV)) that generally absorbs strongly onto
particles or forms UO2 (s) (Anderson, 1982; Anderson
et al., 1989; Barnes and Cochran, 1990; Barnes and
Cochran, 1993; Langmuir, 1978).
When reduced MnOx releases Mn2+ and MoO42�, it
leads to an increased concentration in the overlying
waters. The latter diffuses into sediment layers and
transforms into MoS4� (Erickson and Helz, 2000). Mo
then forms Mo–Fe–S cuboRdal clusters on pyrite
followed by the reduction of Mo(VI) to stabilize this
structure (Vorlicek et al., 2004), possibly induced by
polysulphides or by direct precipitation as Mo-
sulphide depending on sulphide concentration (Zheng
et al., 2000).
Due to these properties, U and Mo are generally
enriched relative to crustal values in anoxic sediments
(e.g. Taylor and McLennan, 1985). Inversely, Mn is
enriched in oxic sediments (Froelich et al., 1979;
Thomson et al., 2001).
Their sedimentary record potentially reflects the
conditions prevailing in the water column at the time
of sediment deposition. Therefore, the three elements
can be used for reconstructing the redox conditions in
various depositional environments (Adelson et al.,
2001; Brown et al., 2000; Calvert and Pedersen, 1996;
Crusius et al., 1996; Lepland and Stevens, 1998;
Mangini et al., 2001; Morford and Emerson, 1999;
Thomson et al., 2001; Zheng et al., 2000; Nameroff et
al., 2002; Zheng et al., 2002).
The objective of this study was to improve our
knowledge of the relationship between Mn, Mo and U
and water column redox conditions in a coastal
system, which undergoes transient anoxic conditions.
The Thau lagoon, which suffers from anoxia during
summer due to intensive shellfish farming (Chapelle
et al., 2001; Souchu et al., 1998b) was selected for this
study. The distribution of Mn, U and Mo has been
studied in the sediments and pore-water. Although the
latter are not necessarily in equilibrium with sedi-
ments, their study is required for constraining the
ongoing biogeochemical processes. For the same
reason, the study has also involved the determination
of alkalinity,P
H2S,P
NH3, organic and inorganic
carbon, Fe, Mn and Th, in pore-water or sediment.
2. Study site
The Thau lagoon (75 km2, mean depth 4 m) is one
of the largest lagoons located along the French
Mediterranean coast (Fig. 1). Its drainage basin covers
around 280 km2.
This lagoon is fed by seawater mainly through the
Sete Canal (Fig. 1). In addition, it receives minor
quantities of freshwater through a submarine karstic
spring, sewage treatment plants (Ben Othman et al.,
1997; Elbaz-Poulichet et al., 2002) and the Vene river,
which has a highly variable seasonal discharge (0.2–
30 m3 s�1).
In the absence of treatment of domestic sewage
effluents, high quantities of phosphate were intro-
duced until 1975. Phosphorus release from sediment
is still active and nitrogen is the nutrient-limiting
primary production in the lagoon (Picot et al., 1990).
The lagoon suffers regularly from severe anoxia crises
with H2S emission in the atmosphere (Souchu et al.,
1998a). The resulting mollusc mortality severely
affects the economy around the lagoon which is also
one of the most important shellfish-breeding areas in
Europe with a density of 40 oysters m�2 (Souchu et
al., 1998a). The anoxia appears generally in July–
August along the coast or at the bottom of the
shellfish farming area (Fig. 1). Anoxia is primarily
driven by the important deposition of organic-rich
material caused by oyster farming and accentuated by
the high density of oyster tables which limits the
circulation of water (Chapelle et al., 2001). In
addition, anoxia is further fostered by high temper-
atures and absence of wind (Chapelle et al., 2001) and
thus possibly also related to climate oscillation
(Harzallah and Chapelle, 2002).
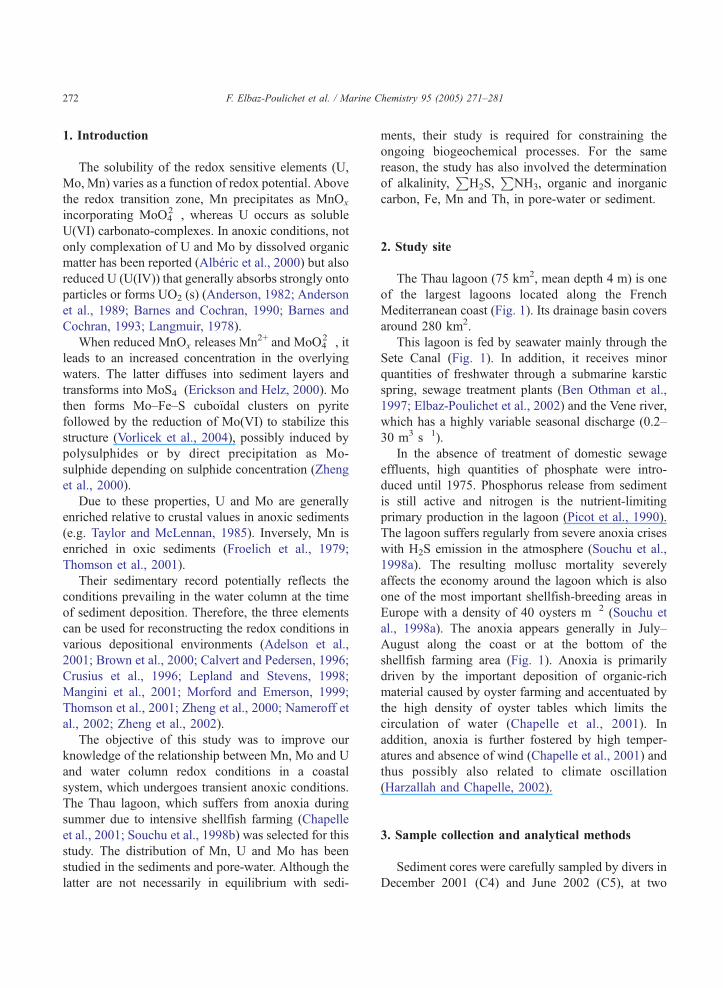
3. Sample collection and analytical methods
Sediment cores were carefully sampled by divers in
December 2001 (C4) and June 2002 (C5), at two
Fig. 1. Sketch map of the Thau lagoon showing the location of sampling stations.
F. Elbaz-Poulichet et al. / Marine Chemistry 95 (2005) 271–281 273
locations (Fig. 1). PVC tubes were used. The core C5
was taken nearby the shellfish tables where anoxia in
surface and subsurface water has been frequently
reported in summer (Souchu et al., 1998a). The core
C4 was drilled outside the shellfish production zone in
the centre of the lagoon.
The cores were sectioned every 1 (C4) or 2 cm
(C5). After freeze-drying and discarding of the shell
debris visible to the naked eye, the sediments were
ground in an agate mortar.
The particulate organic carbon (POC) and the total
inorganic carbon (TIC) were analysed according to
Etcheber et al. (1999). The total carbon content
(organic+inorganic) was determined in dry weight
sediment by combustion in a LECO CS 125 analyser.
In order to get the POC concentration, samples were
acidified with 2 N HCl to destroy the carbonates, then
dried to 60 8C to remove remaining inorganic C, acid
and water. The analyses were performed by direct
combustion in an induction furnace and the CO2
formed was determined quantitatively by infrared
absorption with a standard deviation of 2–4%. The
total inorganic carbon was calculated by subtraction
from the total carbon and the POC.210Pb measurements were taken using a low
background noise X-ray spectrometer (Intertechnique
EGSP 2200-25) equipped with a semi-planar Germa-
nium detector coupled to a multichannel analyser.
Sedimentation rates were derived from the unsup-
ported 210Pb (210Pbexc) which was obtained from the
total 210Pb activity at 46.5 keV by subtracting the226Ra activity, estimated from 214Pb (at 295.2 and
352.0 keV) and 214Bi activities (at 609.3 keV).
Measurements were carried out at least 2 months
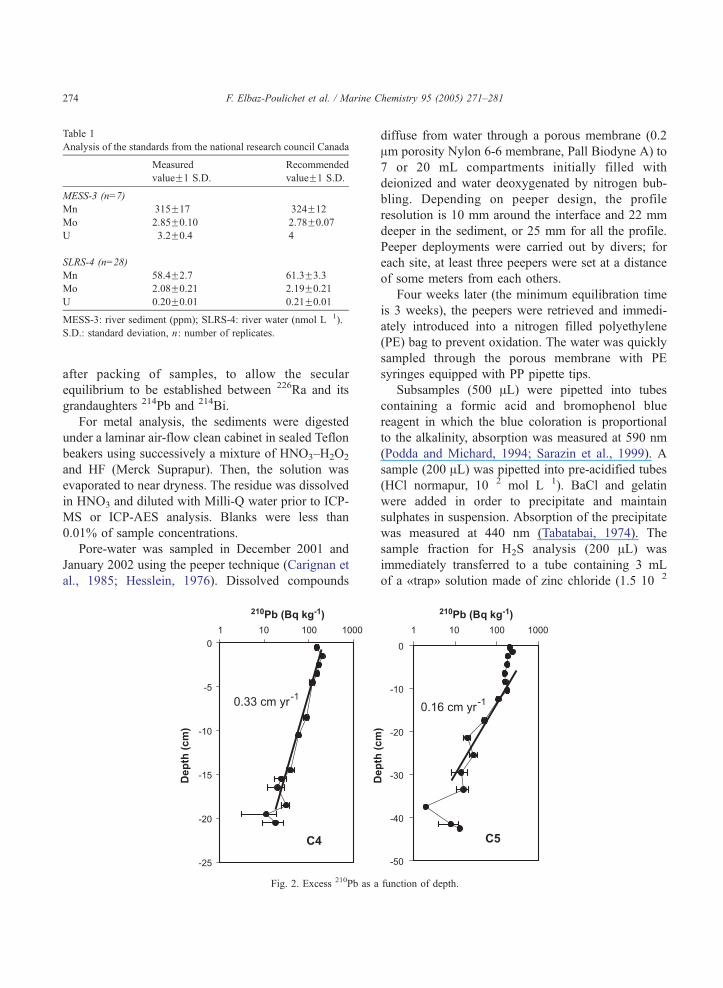
Table 1
Analysis of the standards from the national research council Canada
Measured
valueF1 S.D.
Recommended
valueF1 S.D.
MESS-3 (n=7)
Mn 315F17 324F12
Mo 2.85F0.10 2.78F0.07
U 3.2F0.4 4
SLRS-4 (n=28)
Mn 58.4F2.7 61.3F3.3
Mo 2.08F0.21 2.19F0.21
U 0.20F0.01 0.21F0.01
MESS-3: river sediment (ppm); SLRS-4: river water (nmol L�1).
S.D.: standard deviation, n: number of replicates.
F. Elbaz-Poulichet et al. / Marine Chemistry 95 (2005) 271–281274
after packing of samples, to allow the secular
equilibrium to be established between 226Ra and its
grandaughters 214Pb and 214Bi.
For metal analysis, the sediments were digested
under a laminar air-flow clean cabinet in sealed Teflon
beakers using successively a mixture of HNO3–H2O2
and HF (Merck Suprapur). Then, the solution was
evaporated to near dryness. The residue was dissolved
in HNO3 and diluted with Milli-Q water prior to ICP-
MS or ICP-AES analysis. Blanks were less than
0.01% of sample concentrations.
Pore-water was sampled in December 2001 and
January 2002 using the peeper technique (Carignan et
al., 1985; Hesslein, 1976). Dissolved compounds
Fig. 2. Excess 210Pb as a
diffuse from water through a porous membrane (0.2
Am porosity Nylon 6-6 membrane, Pall Biodyne A) to
7 or 20 mL compartments initially filled with
deionized and water deoxygenated by nitrogen bub-
bling. Depending on peeper design, the profile
resolution is 10 mm around the interface and 22 mm
deeper in the sediment, or 25 mm for all the profile.
Peeper deployments were carried out by divers; for
each site, at least three peepers were set at a distance
of some meters from each others.
Four weeks later (the minimum equilibration time
is 3 weeks), the peepers were retrieved and immedi-
ately introduced into a nitrogen filled polyethylene
(PE) bag to prevent oxidation. The water was quickly
sampled through the porous membrane with PE
syringes equipped with PP pipette tips.
Subsamples (500 AL) were pipetted into tubes
containing a formic acid and bromophenol blue
reagent in which the blue coloration is proportional
to the alkalinity, absorption was measured at 590 nm
(Podda and Michard, 1994; Sarazin et al., 1999). A
sample (200 AL) was pipetted into pre-acidified tubes
(HCl normapur, 10�2 mol L�1). BaCl and gelatin
were added in order to precipitate and maintain
sulphates in suspension. Absorption of the precipitate
was measured at 440 nm (Tabatabai, 1974). The
sample fraction for H2S analysis (200 AL) was
immediately transferred to a tube containing 3 mL
of a Ttrapr solution made of zinc chloride (1.5 10�2
function of depth.
F. Elbaz-Poulichet et al. / Marine Chemistry 95 (2005) 271–281 275
mol L�1) and gelatin (3 g L�1) in order to prevent
oxidation. Total hydrogen sulphideP
H2S was
measured by the methylene blue method (Merck
SpectroquantR 14779) at 660 nm.PNH4
+ andP
PO43� analysis were carried out
using the Merck SpectroquantR 14752 and 14848
methods, respectively, after acidification with hydro-
chloric acid, degassing by nitrogen bubbling and
finally neutralization by sodium hydroxide.
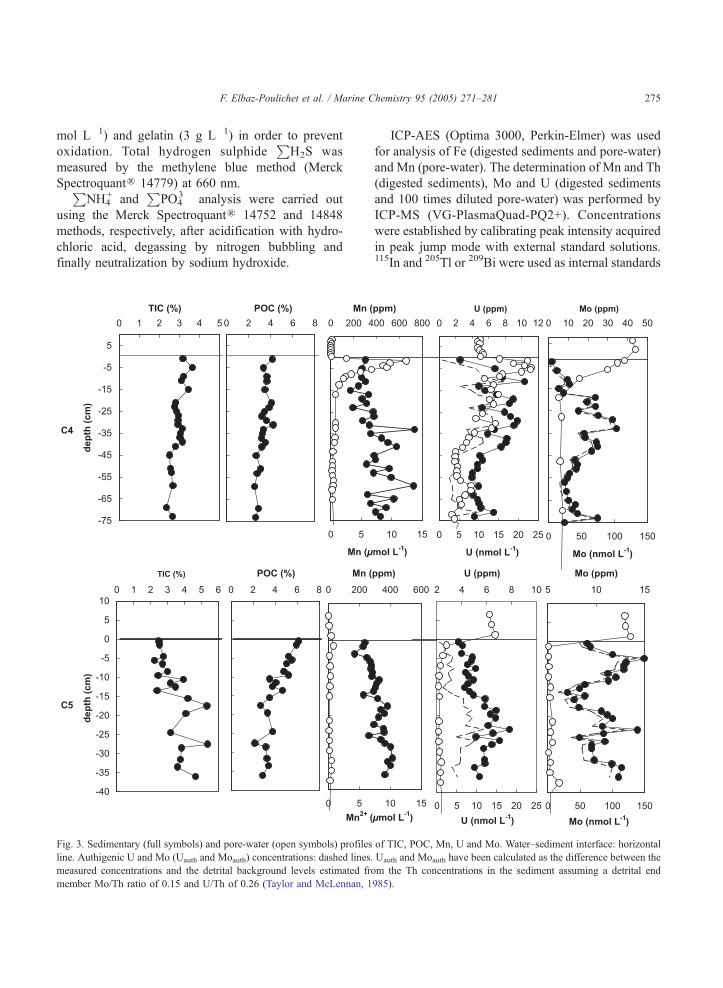
Fig. 3. Sedimentary (full symbols) and pore-water (open symbols) profiles
line. Authigenic U and Mo (Uauth and Moauth) concentrations: dashed lines.
measured concentrations and the detrital background levels estimated fro
member Mo/Th ratio of 0.15 and U/Th of 0.26 (Taylor and McLennan, 1
ICP-AES (Optima 3000, Perkin-Elmer) was used
for analysis of Fe (digested sediments and pore-water)
and Mn (pore-water). The determination of Mn and Th
(digested sediments), Mo and U (digested sediments
and 100 times diluted pore-water) was performed by
ICP-MS (VG-PlasmaQuad-PQ2+). Concentrations
were established by calibrating peak intensity acquired
in peak jump mode with external standard solutions.115In and 205Tl or 209Bi were used as internal standards
of TIC, POC, Mn, U and Mo. Water–sediment interface: horizontal
Uauth and Moauth have been calculated as the difference between the
m the Th concentrations in the sediment assuming a detrital end
985).
Table 2
Concentrations of Fe, particulate organic carbon (POC), total
inorganic carbon (TIC) and trace elements (TE) in the sediments
Depth
(cm)
Fe POC TIC Mn Mo Th U
C4
0–2 2.9 4.14 1.27 302 1.7 8.3 2.5
4–6 2.9 3.33 0.44 274 4.3 8.9 6.8
8–10 3.66 3.66 270 9.5 8.6 7.7
10–12 2.9 3.66 0.79 306 10.6 10.0 10.4
12–14 3.0 243 5.2 8.5 4.8
14–16 3.0 3.48 0.50 170 7.6 6.2 5.6
16–18 2.9 333 23.6 8.8 7.0
18–20 2.9 274 19.5 8.7 9.0
20–22 2.9 4.07 1.20 316 23.8 8.4 8.5
22–24 2.9 3.86 0.93 195 15.1 5.7 5.2
24–26 3.0 3.43 0.45 371 25.1 9.9 8.0
26–28 3.0 3.20 0.20 378 32.4 8.7 8.7
28–30 3.61 3.61 278 11.4 9.5
30–32 4.22 4.22 337 34.4 8.1 9.1
32–34 3.33 3.33 734 18.0 12.8 6.7
34–36 3.24 3.24 350 18.5 8.5 5.9
36–38 3.17 3.17 446 24.1 11.4 8.2
38–40 3.51 3.51 501 24.9 10.6 8.1
40–42 3.20 3.20 577 21.8 11.7 7.5
44–46 2.68 2.68 380 13.4 10.9 4.9
46–48 392 14.7 10.7 5.3
48–50 314 13.9 9.1 4.6
50–52 3.10 3.10 511 10.7 9.7 4.7
52–54 2.77 2.77 374 9.7 8.3 4.0
54–56 529 8.1 10.6 4.0
58–60 2.56 2.56 727 8.9 12.1 4.8
62–64 322 10.2 9.2 4.1
64–66 553 13.6 12.2 4.6
66–68 349 12.0 10.1 4.8
68–70 2.88 2.88 485 14.7 10.7 5.1
70–72 393 24.9 7.8 6.6
C5
0–1 2.5 6.1 2.5 236 9.1 5.8 3.7
1–2 2.6 5.9 2.5 225 9.4 5.6 4.1
3–4 170 11.7 4.7 4.0
4–5 2.7 5.2 2.8 249 15.0 6.0 4.8
5–6 2.7 5.5 2.2 270 13.1 6.1 4.8
6–7 2.8 5.1 2.7 277 12.9 6.3 4.4
7–8 275 12.9 6.7 5.1
8–9 2.6 4.8 3.0 286 11.2 5.3 4.3
9–10 2.6 5.2 2.4 281 12.0 6.0 4.5
10–11 2.7 3.5 3.9 328 11.3 6.8 4.9
11–12 2.7 4.1 3.2 312 8.8 6.7 4.5
12–13 2.6 3.8 3.5 303 8.3 6.8 4.2
13–14 2.4 4.7 2.4 293 7.0 6.5 4.6
14–15 226 8.8 5.7 4.9
15–16 2.3 3.5 4.2 319 7.7 6.7 5.9
17–18 2.1 2.7 5.3 381 8.2 6.5 5.8
Table 2 (continued)
Depth
(cm)
Fe POC TIC Mn Mo Th U
18–19 340 10.5 7.6 6.8
19–20 2.2 3.3 4.1 364 11.1 7.4 6.3
20–21 326 11.7 7.3 6.7
22–23 295 10.6 7.0 6.1
23–24 356 14.3 8.2 7.8
24–25 2.6 3.8 3.2 360 10.8 7.0 6.5
25–26 262 8.3 6.0 5.1
26–27 340 10.9 7.9 7.1
27–28 2.2 2.2 5.4 366 9.5 6.8 6.4
29–30 2.4 3.2 3.8 403 9.5 7.2 5.8
31–32 2.4 3.3 3.8 414 9.8 7.4 5.8
32–33 383 11.6 7.8 5.9
33–34 2.6 3.4 3.6 402 12.6 7.0 5.0
Concentrations are expressed as percents dry weight for Fe, POC
and TIC and as ppm dry weight for TE.
F. Elbaz-Poulichet et al. / Marine Chemistry 95 (2005) 271–281276
to correct changes in peak intensities due to instru-
mental drift and matrix suppression.
The accuracy and the precision of methods has
been tested using the marine sediment MESS-3 and
undiluted river water SLRS-4 standards, certified by
the National Research Council, Canada. The generally
close correlation between our data and the certified
values (Table 1) indicates that isobaric interferences
are negligible for the studied elements including for55Mn, for which the determination could be biased by
the formation of 15N40Ar in the plasma.
4. Results
4.1. Main sedimentary features
The sediments consist of a dark brown or green
mud containing numerous shell debris. Scanning
Electron Microscopy observations indicate the pres-
ence of framboRdal pyrite, throughout the whole
sequence in both cores.
Whereas unsupported 210Pb decreases regularly
with increasing depth in the core C4, it remains
constant over the first 10 cm in the core C5 (Fig. 2),
suggesting a mixing related to bioturbation (Duport et
al., submitted for publication). Below this level,
unsupported 210Pb decreases and the calculated
sedimentation rate is 0.16 cm year�1. In the core
C4, the sedimentation rate is 0.33 cm year�1 (Fig. 2).
F. Elbaz-Poulichet et al. / Marine Chemistry 95 (2005) 271–281 277
The corresponding burial fluxes may be evaluated to
0.12 and to 0.15 g cm�2 year�1 for the cores C5 and
C4, respectively, in agreement with the previous
values of Monna et al. (1997).
The main differences between the cores C4 and C5
are reflected by the distribution of POC, TIC as a
function of depth (Fig. 3). The two parameters remain
relatively constant in the core C4. In the core C5, POC
decreases with depth whereas the TIC increases. In the
core C4, Th displays an erratic distribution with higher
values compared to C5. This is in agreement with
previous studies, which also indicate a higher propor-
tion of clay minerals in the centre of the lagoon (Penna
and Picot, 1991; Guelorget et al., 1994). The core C5 is
characterized by a relatively small but regular increase
of Th as a function of depth (Table 2). In both cores, Mn
is positively correlated with Th (Fig. 4). In the core C5,
it is negatively correlated with POC (Fig. 4). In the core
C4, U and Mo are relatively depleted in surface
sediment compared to C5. Both elements display a
picky distribution characterized by maximum concen-
trations between 5 and 45 cm for U and between 17 and
41 cm forMo (Fig. 3). In the core C5, the U distribution
is characterized by relatively constant values down to
14.5 cm and a maximum at 20–25 cm. The Mo profile
(Fig. 3) is marked by the occurrence of two peaks, at a
depth of 5 and 24 cm, respectively.
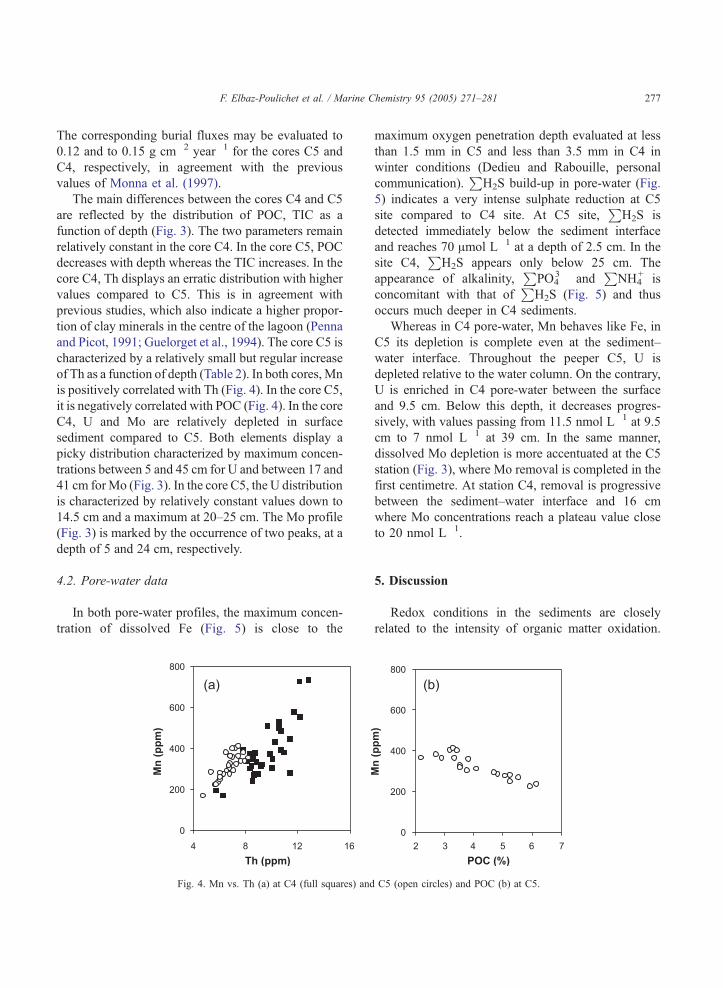
4.2. Pore-water data
In both pore-water profiles, the maximum concen-
tration of dissolved Fe (Fig. 5) is close to the
Fig. 4. Mn vs. Th (a) at C4 (full squares) and
maximum oxygen penetration depth evaluated at less
than 1.5 mm in C5 and less than 3.5 mm in C4 in
winter conditions (Dedieu and Rabouille, personal
communication).P
H2S build-up in pore-water (Fig.
5) indicates a very intense sulphate reduction at C5
site compared to C4 site. At C5 site,P
H2S is
detected immediately below the sediment interface
and reaches 70 Amol L�1 at a depth of 2.5 cm. In the
site C4,P
H2S appears only below 25 cm. The
appearance of alkalinity,P
PO43� and
PNH4
+ is
concomitant with that ofP
H2S (Fig. 5) and thus
occurs much deeper in C4 sediments.
Whereas in C4 pore-water, Mn behaves like Fe, in
C5 its depletion is complete even at the sediment–
water interface. Throughout the peeper C5, U is
depleted relative to the water column. On the contrary,
U is enriched in C4 pore-water between the surface
and 9.5 cm. Below this depth, it decreases progres-
sively, with values passing from 11.5 nmol L�1 at 9.5
cm to 7 nmol L�1 at 39 cm. In the same manner,
dissolved Mo depletion is more accentuated at the C5
station (Fig. 3), where Mo removal is completed in the
first centimetre. At station C4, removal is progressive
between the sediment–water interface and 16 cm
where Mo concentrations reach a plateau value close
to 20 nmol L�1.
5. Discussion
Redox conditions in the sediments are closely
related to the intensity of organic matter oxidation.
C5 (open circles) and POC (b) at C5.
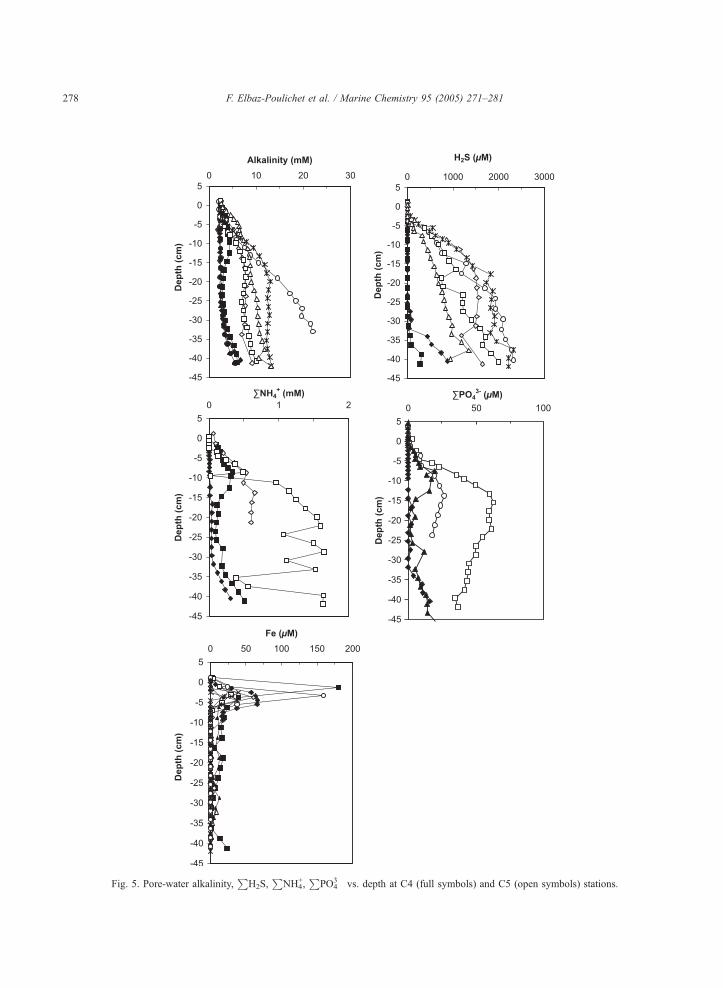
Fig. 5. Pore-water alkalinity,P
H2S,P
NH4+,
PPO4
3� vs. depth at C4 (full symbols) and C5 (open symbols) stations.
F. Elbaz-Poulichet et al. / Marine Chemistry 95 (2005) 271–281278
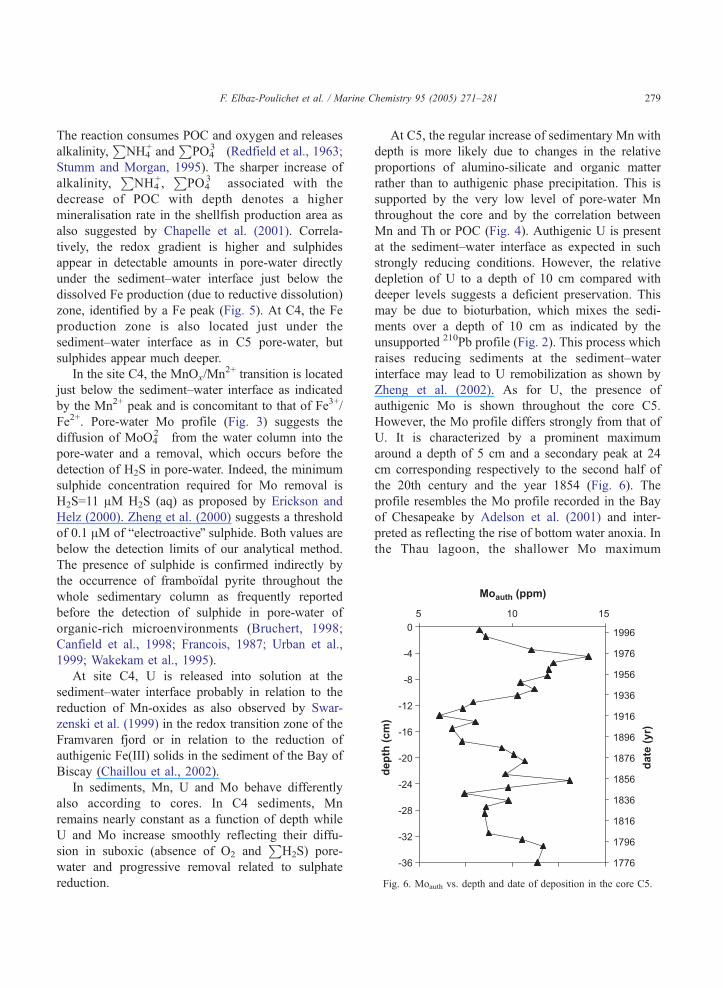
Fig. 6. Moauth vs. depth and date of deposition in the core C5.
F. Elbaz-Poulichet et al. / Marine Chemistry 95 (2005) 271–281 279
The reaction consumes POC and oxygen and releases
alkalinity,P
NH4+ and
PPO4
3� (Redfield et al., 1963;
Stumm and Morgan, 1995). The sharper increase of
alkalinity,P
NH4+,
PPO4
3� associated with the
decrease of POC with depth denotes a higher
mineralisation rate in the shellfish production area as
also suggested by Chapelle et al. (2001). Correla-
tively, the redox gradient is higher and sulphides
appear in detectable amounts in pore-water directly
under the sediment–water interface just below the
dissolved Fe production (due to reductive dissolution)
zone, identified by a Fe peak (Fig. 5). At C4, the Fe
production zone is also located just under the
sediment–water interface as in C5 pore-water, but
sulphides appear much deeper.
In the site C4, the MnOx/Mn2+ transition is located
just below the sediment–water interface as indicated
by the Mn2+ peak and is concomitant to that of Fe3+/
Fe2+. Pore-water Mo profile (Fig. 3) suggests the
diffusion of MoO42� from the water column into the
pore-water and a removal, which occurs before the
detection of H2S in pore-water. Indeed, the minimum
sulphide concentration required for Mo removal is
H2S=11 AM H2S (aq) as proposed by Erickson and
Helz (2000). Zheng et al. (2000) suggests a threshold
of 0.1 AM of belectroactiveQ sulphide. Both values are
below the detection limits of our analytical method.
The presence of sulphide is confirmed indirectly by
the occurrence of framboRdal pyrite throughout the
whole sedimentary column as frequently reported
before the detection of sulphide in pore-water of
organic-rich microenvironments (Bruchert, 1998;
Canfield et al., 1998; Francois, 1987; Urban et al.,
1999; Wakekam et al., 1995).
At site C4, U is released into solution at the
sediment–water interface probably in relation to the
reduction of Mn-oxides as also observed by Swar-
zenski et al. (1999) in the redox transition zone of the
Framvaren fjord or in relation to the reduction of
authigenic Fe(III) solids in the sediment of the Bay of
Biscay (Chaillou et al., 2002).
In sediments, Mn, U and Mo behave differently
also according to cores. In C4 sediments, Mn
remains nearly constant as a function of depth while
U and Mo increase smoothly reflecting their diffu-
sion in suboxic (absence of O2 andP
H2S) pore-
water and progressive removal related to sulphate
reduction.
At C5, the regular increase of sedimentary Mn with
depth is more likely due to changes in the relative
proportions of alumino-silicate and organic matter
rather than to authigenic phase precipitation. This is
supported by the very low level of pore-water Mn
throughout the core and by the correlation between
Mn and Th or POC (Fig. 4). Authigenic U is present
at the sediment–water interface as expected in such
strongly reducing conditions. However, the relative
depletion of U to a depth of 10 cm compared with
deeper levels suggests a deficient preservation. This
may be due to bioturbation, which mixes the sedi-
ments over a depth of 10 cm as indicated by the
unsupported 210Pb profile (Fig. 2). This process which
raises reducing sediments at the sediment–water
interface may lead to U remobilization as shown by
Zheng et al. (2002). As for U, the presence of
authigenic Mo is shown throughout the core C5.
However, the Mo profile differs strongly from that of
U. It is characterized by a prominent maximum
around a depth of 5 cm and a secondary peak at 24
cm corresponding respectively to the second half of
the 20th century and the year 1854 (Fig. 6). The
profile resembles the Mo profile recorded in the Bay
of Chesapeake by Adelson et al. (2001) and inter-
preted as reflecting the rise of bottom water anoxia. In
the Thau lagoon, the shallower Mo maximum
F. Elbaz-Poulichet et al. / Marine Chemistry 95 (2005) 271–281280
probably corresponds to the severe anoxia crises
which took place around 1970 (Harzallah and
Chapelle, 2002; Souchu et al., 1998a). Finally, Fig.
6 indicates that the frequency of anoxia crises has
increased since 1920 when intensive shellfish pro-
duction was introduced.
6. Conclusion
The distribution of the redox sensitive elements
(Mn, U and Mo) in relation to major components
(TIC, alkalinity,P
H2S) has been studied in the
Thau lagoon within and outside the shellfish-farm-
ing area. At both sites, the maximum oxygen
penetration depth does not exceed a few millimeters,
however in the oyster production zone, the intense
organic matter oxidation promotes a steeper redox
gradient, which is characterized by the appearance
of sulphides immediately under the sediment–water
interface.
In the centre of the lagoon, the behaviour of Mn
and U is controlled by redox reactions. Mn-oxides are
reduced at the sediment–water interface releasing
associated U. The sedimentary profile of U and Mo
does not reflect transient redox changes in the water
column but their diffusion in pore-waters and their
immobilization when sulphides occur.
In the shellfish-farming area, authigenic U and Mo
are present right at the sediment–water interface
concurrently with the appearance of sulphides at the
sediment–water interface. Unlike Mo, buried U is not
well preserved in the sediments and is released into
solution probably due to bioturbation.
The sedimentary Mo profile indicates an increase
of the frequency of anoxia episodes in the lagoon in
relation to intensive shellfish farming which was
introduced in 1920.
Acknowledgements
This study was financed by the French National
Programme (PNEC, MICROBENT project), and
ANDRA. Many thanks to Christophe Rabouille,
Karine Dedieu, Monique Pepe, Jean-Jacques Bour-
rand, Yasmine Autem and Bruno Bombled for
analysis and diving assistance. The authors are grate-
ful to Claude Dupuy for helpful comments on the
manuscript. Thanks also to Edward and Alison
McEvoy for English reviewing.
References
Adelson, J.M., Helz, G.R., Miller, C.V., 2001. Reconstructing the
rise of recent coastal anoxia; molybdenum in Chesapeake
Bay sediments. Geochimica et Cosmochimica Acta 65 (2),
237–252.
Alberic, P., Viollier, E., Jezequel, D., Grosbois, C., Michard, G.,
2000. Trace elements-dissolved organic matter interaction in the
anoxic deep layer of Lake Pavin (Puy-de-Dome, France).
Limnology and Oceanography 45 (5), 1088–1096.
Anderson, R.F., 1982. Concentration, vertical flux, and remineral-
ization of particulate uranium in seawater. Geochimica et
Cosmochimica Acta 46 (7), 1293–1299.
Anderson, R.F., Fleisher, M.Q., LeHuray, A.P., 1989. Concentration,
oxidation state, and particulate flux of uranium in the Black Sea.
Geochimica et Cosmochimica Acta 53 (9), 2215–2224.
Barnes, C.E., Cochran, J.K., 1990. Uranium removal in oceanic
sediments and the oceanic U balance. Earth and Planetary
Science Letters 97 (1–2), 94–101.
Barnes, C.E., Cochran, J.K., 1993. Uranium geochemistry in
estuarine sediments: controls on removal and release processes.
Geochimica et Cosmochimica Acta 57 (3), 555–569.
Ben Othman, D., Luck, J.M., Tournoud, M.G., 1997. Geochemistry
and water dynamics: application to short time-scale flood
phenomena in a small Mediterranean catchment: I. Alkalis,
alkali-earths and Sr isotopes. Chemical Geology 140, 9–28.
Brown, E.T., Le Callonnec, L., German, C.R., 2000. Geochemical
cycling of redox-sensitive metals in sediments from Lake
Malawi: a diagnostic paleotracer for episodic changes in mixing
depth. Geochimica et Cosmochimica Acta 64 (20), 3515–3523.
Bruchert, V., 1998. Early diagenesis of sulfur in estuarine sedi-
ments: the role of sedimentary humic and fulvic acids. Geochim.
Cosmochim. Acta 62, 1567–1586.
Calvert, S.E., Pedersen, S.E., 1996. Sedimentary geochemistry of
manganese: implications for the environment of formation of
manganiferous blackshales. Economic Geology 91, 36–47.
Canfield, D.E., Boudreau, B.P., Mucci, A., Gundersen, J.K., 1998.
The early diagenetic formation of organic sulfur in the
sediments of Mangrove Lake, Bermuda. Geochim. Cosmochim.
Acta 62, 767–781.
Carignan, R., Rapin, F., Tessier, A., 1985. Sediment pore water
sampling for metal analysis. Geochimica Cosmochimica Acta
49, 2493–2497.
Chaillou, G., Anschutz, P., Lavaux, G., SchaJfer, J., Blanc, G.,2002. The distribution of Mo, U, and Cd in relation to major
redox species in muddy sediments of the Bay of Biscay. Marine
Chemistry 80, 41–59.
Chapelle, A., Lazure, P., Souchu, P., 2001. Modelisation numerique
des crises anoxiques (malaigues) dans la lagune de Thau
(France): modelling anoxia in the Thau lagoon (France).
Oceanologica Acta 24 (1), 87–97.
F. Elbaz-Poulichet et al. / Marine Chemistry 95 (2005) 271–281 281
Crusius, J., Calvert, S., Pedersen, T., Sage, D., 1996. Rhenium and
molybdenum enrichments in sediments as indicators of oxic,
suboxic and sulfidic conditions of deposition. Earth and
Planetary Science Letters 145 (1–4), 65–78.
Duport, E., Gilbert, F., Poggiale, J.-C., Stora, G., 2004. Macrofauna
and sediment reworking quantification at the Thau lagoon.
Estuarine Coastal and Shelf Science (submitted for publication).
Elbaz-Poulichet, F., Seidel, J.L., Othoniel, C., 2002. Occurrence of
an anthropogenic gadolinium anomaly in river and coastal
waters of Southern France. Water Research 36 (4), 1102–1105.
Erickson, B.E., Helz, G.R., 2000. Molybdenum (VI) speciation in
sulfidic waters: stability and liability of thiomolybdates. Geo-
chimica Cosmochimica Acta 64, 1149–1158.
Etcheber, H., Relexans, J.-C., Beliard, M., Weber, O., Buscail, R.,
Heussner, S., 1999. Distribution and quality of sedimentary
organic matter on the Aquitanian margin (Bay of Biscay). Deep-
Sea Research, Part II 46 (10), 2249–2288.
Francois, R., 1987. A study of sulphur enrichment in the humic
fraction of marine sediments during early diagenesis. Geochim.
Cosmochim. Acta 51, 17–21.
Froelich, P.N., Klinkhammer, G.P., Bender, M.L., Luedtke, N.A.,
Heath, G.R., Cullen, D., Dauphin, P., Hammond, D., Hart-
man, B., Maynard, V., 1979. Early oxidation of organic matter
in pelagic sediments of the eastern equatorial Atlantic:
suboxic diagenesis. Geochimica et Cosmochimica Acta 43
(7), 1075–1090.
Guelorget, O., Pertuisot, J.P., Lamy, N., Lefebvre, A., 1994.
Structure et organisation de l’etang de Thau d’apres la faune
benthique (macrofaune, meiofaune). Relation avec le confine-
ment. Oceanologica Acta 17, 105–114.
Harzallah, A., Chapelle, A., 2002. Contribution of climate varia-
bility to occurrences of anoxic crises dmalaiguesT in the Thau
lagoon (southern France). Oceanologica Acta 25 (2), 79–86.
Hesslein, R.H., 1976. An in-situ sampler for close interval pore
water studies. Limnology and Oceanography 21, 912–914.
Langmuir, D., 1978. Uranium solution-mineral equilibria at low
temperature with applications to sedimentary ore deposits.
Geochimica et Cosmochimica Acta 42 (6), 547–569.
Lepland, A., Stevens, R.L., 1998. Manganese authigenesis in the
Landsort Deep. Baltic Sea Marine Geology 151, 1–25.
Mangini, A., Jung, M., Laukenmann, S., 2001. What do we learn
from peaks of uranium and of manganese in deep sea
sediments? Marine Geology 177 (1–2), 63–78.
Monna, F., Lancelot, J., Bernat, M., Mercadier, H., 1997. Taux de
sedimentation dans l’etang de Thau a partir des donnees
geochronologiques, geochimiques et stratigraphiques. Ocean-
ologica Acta 20, 627–638.
Morford, J.L., Emerson, S., 1999. The geochemistry of redox
sensitive tracemetals in sediments. Geochimica et Cosmochimica
Acta 63 (11–12), 1735–1750.
Nameroff, T.J., Balistrieri, L.S., Murray, J.W., 2002. Suboxic trace
metal geochemistry in the Eastern Tropical North Pacific.
Geochimica et Cosmochimica Acta 66 (7), 1139–1158.
Penna, G., Picot, B., 1991. Metaux traces dans les sediments d’une
lagune mediterraneenne: l’etang de Thau. Oceanologica Acta
15, 459–472.
Picot, B., Pena, G., Casellas, C., Bondon, D., Bontoux, J., 1990.
Interpretation of the seasonal variations of nutrients in a
mediterranean lagoon: etang de Thau. Hydrobiologia 207,
105–114.
Podda, F., Michard, G., 1994. Mesure colorimetrique de l’alcalinite.
Comptes Rendus de l’Academie des Sciences de Paris. Serie II
319, 651–657.
Redfield, A.C., Ketchum, B.H., Richard, F.A., 1963. The influence
of organisms on the composition of seawater. In: Hill, M.N.The
Sea, vol. 2. Wiley-Interscience, pp. 26–77.
Sarazin, G., Michard, G., Prevot, F., 1999. A rapid and accurate
spectroscopic method for alkalinity measurements in sea water
samples. Water Research 33 (1), 290–294.
Souchu, P., Abadie, E., Vercelli, C., Buestel, D., Sauvagnargues,
J.C., 1998a. La crise anoxique du bassin de Thau de l’ete 1997.
Bilan du phenomene et perspectives. IFREMER, p. 33.
Souchu, P., Gasc, A., Collos, Y., Vaquer, A., Tournier, H., Bibent,
B., Deslous-Paol, J.M., 1998b. Biogeochemical aspects of
bottom anoxia in a Mediterranean lagoon (Thau, France).
Marine Ecology Progress Series 164, 135–146.
Stumm,W., Morgan, J.J., 1995. Aquatic Chemistry. Wiley and Sons.
Swarzenski, P.W., McKee, B.A., Skei, J.M., Todd, J.F., 1999.
Uranium biogeochemistry across the redox transition zone of a
permanently stratified fjord: Framvaren, Norway. Marine
Chemistry 67, 181–198.
Tabatabai, M.A., 1974. A rapid method for determination of sulfate
in water samples. Environmental Letters 7 (3), 237–242.
Taylor, S.R., McLennan, S.M., 1985. The Composition of the
Continental Crust. Blackwell Scientific Publications. (312 pp.).
Thomson, J., Nixon, S., Croudace, I.W., Pedersen, T.F., Brown, L.,
Cook, G.T., MacKenzie, A.B., 2001. Redox-sensitive element
uptake in north-east Atlantic Ocean sediments (Benthic Boundary
Layer Experiment sites). Earth and Planetary Science Letters 184
(2), 535–547.
Urban, N.R., Ernst, K., Bernasconi, S., 1999. Addition of sulfur to
organic matter during early diagenesis of lake sediments.
Geochim. Cosmochim. Acta 63, 837–853.
Vorlicek, T.P., Kahn, M.D., Kasuya, Y., Helz, G.R., 2004. Capture of
molybdenum in pyrite-forming sediments: role of ligand-induced
reduction by polysulfides. Geochimica et Cosmochimica Acta 68
(3), 547–566.
Wakekam, S.G., Damste, J.S.S., Kohen, M.E.L., DeLeeuw, J.W.,
1995. Organic sulfur compounds formed during early dia-
genesis in Black Sea sediments. Geochim. Cosmochim. Acta
59, 521–533.
Zheng, Y., Anderson, R.F., van Geen, A., Kuwabara, J., 2000.
Authigenic molybdenum formation in marine sediments: a link
to pore water sulfide in the Santa Barbara Basin. Geochimica et
Cosmochimica Acta 64 (24), 4165–4178.
Zheng, Y., Anderson, R.F., Van Geen, A., Fleisher, M.Q., 2002.
Remobilization of authigenic uranium in marine sediments by
bioturbation. Geochimica et Cosmochimica Acta 66 (10),
1759–1772.