Toward an orbital chronology for the early Aptian Oceanic Anoxic Event (OAE1a, ~120 Ma)
14
This article appeared in a journal published by Elsevier. The attached copy is furnished to the author for internal non-commercial research and education use, including for instruction at the authors institution and sharing with colleagues. Other uses, including reproduction and distribution, or selling or licensing copies, or posting to personal, institutional or third party websites are prohibited. In most cases authors are permitted to post their version of the article (e.g. in Word or Tex form) to their personal website or institutional repository. Authors requiring further information regarding Elsevier’s archiving and manuscript policies are encouraged to visit: http://www.elsevier.com/copyright
-
Upload
independent -
Category
Documents
-
view
0 -
download
0
Transcript of Toward an orbital chronology for the early Aptian Oceanic Anoxic Event (OAE1a, ~120 Ma)

This article appeared in a journal published by Elsevier. The attachedcopy is furnished to the author for internal non-commercial researchand education use, including for instruction at the authors institution
and sharing with colleagues.
Other uses, including reproduction and distribution, or selling orlicensing copies, or posting to personal, institutional or third party
websites are prohibited.
In most cases authors are permitted to post their version of thearticle (e.g. in Word or Tex form) to their personal website orinstitutional repository. Authors requiring further information
regarding Elsevier’s archiving and manuscript policies areencouraged to visit:
http://www.elsevier.com/copyright
Author's personal copy
Toward an orbital chronology for the early Aptian Oceanic Anoxic Event(OAE1a, ~120 Ma)
Yong-Xiang Li a,⁎, Timothy J. Bralower a, Isabel P. Montañez b, David A. Osleger b, Michael A. Arthur a,David M. Bice a, Timothy D. Herbert c, Elisabetta Erba d, Isabella Premoli Silva d
a Department of Geosciences, Pennsylvania State University, University Park, PA16802, USAb Department of Geology, University of California, Davis, CA95616, USAc Department of Geological Sciences, Brown University, Providence, RI 02912, USAd Department of Earth Sciences, University of Milan, Milano, 20133, Italy
A B S T R A C TA R T I C L E I N F O
Article history:Received 22 November 2007Received in revised form 25 March 2008Accepted 25 March 2008Available online 10 April 2008
Editor: M.L. Delaney
Keywords:Oceanic Anoxic EventMilankovitchenvironmental magnetismmid-Cretaceous C cyclingabrupt climate changeDeep Sea Drilling Project
The early Aptian Oceanic Anoxic Event (OAE1a, 120 Ma) represents a geologically brief time interval in themid-Cretaceous greenhouse world that is characterized by increased organic carbon accumulation in marinesediments, sudden biotic changes, and abrupt carbon-isotope excursions indicative of significantperturbations to global carbon cycling. The brevity of these drastic environmental changes (b106 year) andthe typically 106 year temporal resolution of the available chronologies, however, represent a critical gap inour knowledge of OAE1a. We have conducted a high-resolution investigation of three widely distributedsections, including the Cismon APTICORE in Italy, Santa Rosa Canyon in northeastern Mexico, and Deep SeaDrilling Project (DSDP) Site 398 off the Iberian margin in the North Atlantic Ocean, which represent a range ofdepositional environments where condensed and moderately expanded OAE1a intervals are recorded. Theobjectives of this study are to establish orbital chronologies for these sections and to construct a common,high-resolution timescale for OAE1a. Spectral analyses of the closely-spaced (corresponding to ~5 to 10 kyr)measurements of calcium carbonate content of the APTICORE, magnetic susceptibility (MS) and anhystereticremanent magnetization (ARM) of the Santa Rosa samples, and MS, ARM and ARM/IRM, where IRM isisothermal remanent magnetization, of Site 398 samples reveal statistically significant cycles. These cyclesexhibit periodicity ratios and modulation patterns similar to those of the mid-Cretaceous orbital cycles,suggesting that orbital variations may have modulated depositional processes. Orbital control allows us toestimate the duration of unique, globally identifiable stages of OAE1a. Although OAE1a had a duration of ~1.0to 1.3 Myr, the initial perturbation represented by the negative carbon-isotope excursion was rapid, lastingfor ~27–44 kyr. This estimate could serve as a basis for constraining triggering mechanisms for OAE1a.
© 2008 Elsevier B.V. All rights reserved.
1. Introduction
Geological records show that large and rapid global warmingevents occurred repeatedly during the course of Earth history (Kennettand Stott, 1991; Jenkyns, 2003). The growing concern about modernclimate change has accentuated interest in understanding the causesand consequences of these ancient abrupt warming events. One of thebest examples of greenhouse climates occurs in the mid-Cretaceous(ca. 120 Ma to 90Ma), an interval characterized by the highest averagetemperatures of the past 300 Myr (Frakes, 1979) and anomalouslyreduced latitudinal temperature gradients (Barron, 1983; Fassell andBralower, 1999). The mid-Cretaceous is marked by geologically briefintervals known as Oceanic Anoxic Events (OAEs) (Schlanger andJenkyns, 1976; Jenkyns, 1980) characterized by rapid global warming,
dramatic changes in ocean circulation including widespread oxygendeficiency, and profound changes inmarine biotas (e.g., Bralower et al.,1994; Erbacher et al., 2001). The early Aptian OAE1a is marked bywidespread deposition of organic-rich sediments, informally known as‘black shales’ (Arthur and Sageman, 1994) in all major ocean basins(Arthur and Premoli Silva, 1982; Sliter, 1989; Bralower et al., 1994;Robinson et al., 2004), crises and acceleration in evolution of marineplankton (Erba,1994; Premoli Silva et al.,1999; Leckie et al., 2002; Erba,2004), and pronounced carbon-isotope excursions (CIEs) (e.g., Arthuret al., 1990; Gröcke et al., 1999; Ando et al., 2002) that suggest large-scale changes in the nature of global carbon cycling.
The triggering mechanisms for OAE1a are not well known. Theclose temporal relationship between this event, the initiation of thelong-term mid-Cretaceous greenhouse, and the onset of an interval ofincreased ocean crust production (Larson, 1991; Tarduno et al., 1991;Bralower et al., 1997) has led to speculation that intensified volcaniceruptions not only caused short- and long-term global warming(Arthur et al., 1985; Larson, 1991), but also sparked dramatic changes
Earth and Planetary Science Letters 271 (2008) 88–100
⁎ Corresponding author. Department of Earth and Environmental Sciences, TulaneUniversity, New Orleans, LA 70118, USA. Tel.: +1 504 862 3195; fax: +1 504 865 5199.
E-mail address: [email protected] (Y.-X. Li).
0012-821X/$ – see front matter © 2008 Elsevier B.V. All rights reserved.doi:10.1016/j.epsl.2008.03.055
Contents lists available at ScienceDirect
Earth and Planetary Science Letters
j ourna l homepage: www.e lsev ie r.com/ locate /eps l

Author's personal copy
in primary productivity and deep-ocean circulation (Erba,1994; Larsonand Erba, 1999). Marine volcanism is a possible mechanism by whichlight carbon was introduced into the ocean-atmospheric reservoir,resulting in the sharpnegative CIE corresponding to the onset of OAE1a(Arthur et al., 1985; Arthur, 2000). The negative CIE may also be linkedto rapidmethane release from continentalmargins (Jahren et al., 2001;Beerling et al., 2002). While these hypotheses provide plausibleexplanations for the mid-Cretaceous warming and broad-scaleenvironmental changes, the detailed relationship between changingclimate, ocean circulation, biology, and chemistry during OAE1aremains elusive, largely because available chronologies do not offeradequate temporal resolution to accurately determine the durationand rates of rapid environmental changes. A key to unraveling causalmechanisms of OAE1a is to determine the precise rates of environ-mental changes during its different phases, and especially the onset.
Orbital time control has the potential to provide sufficient stra-tigraphic resolution to monitor environmental changes over tens ofthousand years. A few cyclostratigraphic studies have attempted toestablish orbital timescales and to determine the duration of OAE1a(Herbert, 1992; Fiet, 2000), but these studies were conducted onhighly condensed pelagic successions that tend to overestimate therates of environmental change and suffer from large uncertaintyarising from possible undetected hiatuses. One approach to reduce theuncertainties related to condensed pelagic successions is to establish acommon chemostratigraphy of OAE1a by correlating records fromdifferent depositional settings. As has been demonstrated forCenomanian/Turonian boundary OAE2 (Tsikos et al., 2004), construct-ing a common chemostratigraphy for an OAE interval provides insightinto climate change in the mid-Cretaceous greenhouse world. AsOAE1a has been generally accepted as a global event (Arthur et al.,1990; Bralower et al., 1994), orbital timescales need to be constructedfor OAE1a intervals recognized in a number of different regions and ina variety of depositional settings to provide global high-resolutioncorrelation of this event.
Here we present high-resolution sedimentary records and con-struct orbital timescales in three representative sections containingthe OAE1a interval from Italy, northeastern Mexico, and the Iberian
continental shelf in the North Atlantic Ocean. Collectively, these threesections represent a wide range of geographic and depositionalenvironments where condensed and moderately expanded OAE1aintervals are recorded. The stratigraphic position of the OAE1a intervalat each section is tightly constrained by integrated high-resolutionlitho-, bio-, magneto-, and chemostratigraphy. Our goal is to establisha composite orbital chronology by correlating OAE1a from the threesections and to estimate the duration of this event.
2. Study sites
We have selected three sites for this study, the Cismon APTICOREfrom northern Italy (46°03′N, 11°45′E), the Santa Rosa Canyon sectionfrom northeastern Mexico (24°44′N, 99°50′W), and Deep Sea DrillingProject (DSDP) Leg 47B Site 398 from the eastern North Atlantic Ocean(40°57′N, 10°43′W, 3910-m water depth) (Fig. 1).
2.1. Cismon APTICORE, Italy
The Cismon APTICORE was recovered from the Southern Alps ofnorthern Italy (Fig.1) and contains lower Hauterivian tomiddle Aptiansedimentary rocks (Erba et al., 1999; Channell et al., 2000) thataccumulated in a pelagic basin in the eastern Tethys Ocean. Thepelagic succession of the Barremian/Aptian boundary interval isdominated by light gray to gray limestones that display strikingbedding rhythms, similar to many Cretaceous pelagic carbonatesequences in the North Atlantic–Tethyan realm (Arthur and PremoliSilva, 1982; Arthur et al., 1984). Bedding rhythms in the Cismonoutcrop and mid-Cretaceous marine strata from Umbria, central Italyare linked to orbital cycles (Herbert and Fischer, 1986; Park andHerbert, 1987; Herbert, 1992). The OAE1a interval in the APTICORE isrepresented by black shale horizons, known as the ‘Livello Selli’ in Italy(Coccioni et al., 1989). Magnetostratigraphy yielded an average sedi-mentation rate of ~0.5–1.2 cm/kyr (Channell et al., 2000) and thus theAPTICORE represents a condensed OAE1a interval. The integratedmagnetostratigraphy (Channell et al., 2000), biostratigraphy, andhigh-resolution carbon-isotope stratigraphy (Erba et al., 1999) of the
Fig. 1. Map showing locations of three representative sites in a reconstruction at 120 Ma (from Ocean Drilling Stratigraphic Network [ODSN] plate tectonic reconstruction service).1, Santa Rosa, Mexico (modern latitude, longitude=24° 44′N, 99°50′W); 2, DSDP Leg 47B Site 398 (40°57′N,10°43′W; 3910-mwater depth); 3, Cismon APTICORE, Italy (46°03′N,11°45′E).
89Y.-X. Li et al. / Earth and Planetary Science Letters 271 (2008) 88–100

Author's personal copy
APTICORE provide precise chronologic correlation of the OAE1a in-terval. The 100% core recovery and existing high-resolution datarender APTICORE the highest quality reference section for OAE1a.
2.2. Santa Rosa Canyon, Mexico
The Santa Rosa Canyon is located in the Sierra Madre Oriental foldbelt in northeastern Mexico (Fig. 1). The hemipelagic successionexposed in the canyon spans from the Barremian to the Cenomanianand was deposited on the deeper, low-energy part of the Cupido andCoahuila carbonate platforms in the western Tethys Ocean during theearly Cretaceous (Lehmann et al., 1998). The exposed successionconsists of the Lower Tamaulipas Limestone, the La Peña Formation,and the Upper Tamaulipas Limestone (Lehmann et al., 1998, 1999,2000). The La Peña Formation consists of dark gray to blackargillaceous limestone, marlstone, and shale, and represents thedrowning of carbonate platforms in northeastern Mexico (Lehmannet al., 1998). Previous studies of biostratigraphy, chemostratigraphy,and magnetostratigraphy have established the basic chronologicframework for this section (Bralower et al., 1999; Clement et al.,2000). OAE1a was recognized in the lower part of the La PeñaFormation (Bralower et al., 1999). This paper redefines the strati-graphic position of OAE1a and its onset and recovery intervals basedon high-resolution carbon-isotope data (see Section 5.2.3), and thenew δ13Corg curve in this study replaces that in Bralower et al. (1999)as a proxy record of OAE1a in Santa Rosa of the western Tethys. TheOAE1a interval displays no obvious lithologic cyclicity. Magnetostrati-graphy yielded an average sedimentation rate of ~2.1 cm/kyr frompolarity zones M0, M1 and M3 (Clement et al., 2000). Therefore, thissection represents a relatively expanded OAE1a interval.
2.3. DSDP Leg 47B Site 398, North Atlantic Ocean
DSDP Leg 47B Site 398 is located about 20 km south of VigoSeamount in the eastern North Atlantic Ocean (Fig. 1). The coredsedimentary section dates back to the Hauterivian (Sigal, 1979) andcontains black shales associated with the mid-Cretaceous OAEs(Arthur, 1979). The mid-Cretaceous hemipelagic successions aredominated by dark gray to black, calcareous mudstones andclaystones that were deposited in a prodelta or submarine fanenvironment (Arthur, 1979). Striking lithologic cycles expressed aseither carbonate-rich/poor or homogeneous to laminated layers occurin the Hauterivian and Albian–Cenomanian sections, but are notevident near the Barremian/Aptian boundary where rocks are heavilydiluted by terrigenous material (Arthur, 1979). Previous lithological,paleontological, and geochemical studies of the mid-Cretaceoussection (Arthur, 1979; Arthur et al., 1979; Bralower et al., 1994)provide stratigraphic constraints for detailed investigation of theOAE1a interval at this site. Sedimentation rates during the Aptian–Albian at Site 398 were estimated to range from ~2.5 cm/kyr to~10 cm/kyr (Arthur, 1979; using biostratigraphy and the timescale ofSigal, 1979).
3. Methods
3.1. Sampling and measurements
To obtain time series with adequate temporal resolution for de-tecting sedimentary cycles, high-resolution sampling was conducted.The sampling intervals of the three sections were determined basedon their average sedimentation rates estimated in previous studies.The APTICORE was scanned for reflectance in the visible and near-infrared radiation (IR) region (350–2500 nm) using a portable Ana-lytical Spectral Devices field spectrometer at a 2.5 cm (~5 kyr)resolution to quantify cyclic variations in carbonate contents. In thespectral region scanned, carbonate produces a strong absorbance at
about 2400 nm (Clark et al., 1990). The response of the instrument(absorbance at 2400 nm after background subtraction) was calibratedto measured calcium carbonate following carbonate content determi-nations by a UIC Inc. carbonate coulometer (r=0.64, n=55) on discretesamples from the APTICORE.
For the Santa Rosa and Site 398 sections where lithologic cycli-city is not obvious, high-resolution samples (size≤8 cm3) were col-lected for magnetic measurements to detect sedimentary cycles (e.g.,Latta et al., 2006). At Santa Rosa Canyon, a 53.4 m-long section of theLa Peña Formation was intensively sampled starting immediatelyabove the covered shale interval. Samples were collected every 10 cm(~5 kyr) for the first 20 m corresponding to OAE1a (Bralower et al.,1999) and every 20 cm (~10 kyr) for the upper 33.4 m of section. TheSite 398 samples were collected at the Ocean Drilling Program EastCoast Repository (ECR). The section from 1535 m to 1587 m wassampled (N=204) to study OAE1a based on previous lithologic andgeochemical studies (Arthur, 1979; Deroo et al., 1979). Samples wereunoriented and represent 1 to 3 cm, typically 2 cm intervals. Theaverage sample spacing is ca. 25 cm (~5 kyr). All the Santa Rosa andSite 398 samples were trimmed, weighed, and placed in standardpaleomagnetic cubic boxes for laboratory measurements. All rema-nence measurements were conducted with a 3-axis 2G super-conducting magnetometer housed in a magnetically shielded roomin the paleomagnetism laboratory at Lehigh University. All magneticparameters were normalized to the mass of samples. Low-fieldmagnetic susceptibility (MS) was measured with a KYL-3 Kappabridgesusceptibility meter. MS mainly measures the abundance of magneticminerals such as magnetite and hematite, and can be influenced byparamagnetic (i.e. iron-bearing minerals such as biotite) and diamag-netic (e.g., quartz, calcite) minerals. Therefore, MS provides a roughmeasure of changes in lithologic composition. Anhysteretic remanentmagnetization (ARM) was acquired in an alternating field with a peakof 100 mT with the presence of a 0.1 mT DC field. ARM measuresabundance of fine-grained ferrimagnetic particles (e.g., King et al.,1982) and are thus independent of carbonate content and not affectedby high-coercivity minerals. S-ratios were determined as follows tocharacterize changes in magnetic mineralogy. Samples first acquiredan isothermal remanent magnetization (IRM) with an ASC impulsemagnetizer in a forward field of 1.0 T (IRM1.0), then acquired anotherIRM in a backfield of 0.3 T (IRM−0.3). S-ratios are defined as IRM−0.3/IRM1.0. S-ratios reflect the relative abundance of high-coercivity mi-nerals such as hematite with respect to low-coercivity minerals suchas magnetite. Thermal demagnetization of a three-component IRM, orLowrie test was performed on selected samples to further constrainmagnetic mineralogy (Lowrie, 1990).
Strong inverse correlations between MS and carbonate contentsare often observed in carbonates (e.g., Mead et al., 1986; Mayer andAppel, 1999; Lourens et al., 2005). The negative correlations provide abasis for interpreting MS as a measure of relative abundance ofterrigenous input with respect to biogenic material. For this reason,carbonate contents of selected samples from both Santa Rosa and Site398 sections were measured and compared with their MS values.Methods for organic matter δ13C analysis are provided in the sup-plementary data in the Appendix.
3.2. Spectral analysis
Spectral analyses of calibrated CaCO3 content depth series atAPTICORE and magnetic parameters of both Santa Rosa Canyon andSite 398 were performed following the technique of Muller andMacDonald (2000) designed to identify dominant cycles. Becausethe algorithm requires evenly spaced sampling, raw stratigraphicseries were linearly interpolated and resampled every 1.25 cm(~2.0 kyr) for APTICORE, every 7.3 cm (~3.5 kyr) for Santa Rosa, andevery ~12.0 cm (~2.0 kyr) for Site 398. In order to remove noise, thelinearly interpolated depth series was then detrended and subjected
90 Y.-X. Li et al. / Earth and Planetary Science Letters 271 (2008) 88–100

Author's personal copy
to band-pass filters of 1/600–1/4 cycles/cm for APTICORE, 1/4000–1/10 cycles/cm for Santa Rosa, and 1/3000 to 1/10 cycles/cm for Site398 (the band-pass filters are designed to be wide enough to capturesedimentary cycles representing orbital cycles whose wavelengths
are estimated using available sedimentation rates). Statistically sig-nificant spectral peaks were identified by noise estimation usingMonteCarlo approach (Mader et al., 2004) in which fast Fourier transforms(FFTs) on 1000 randomly generated datasets were combined to produce
Fig. 2. The integrated bio-, magneto-, and lithostratigraphy of the Barremian–Aptian interval of the Cismon APTICORE (A). Data are from Erba et al. (1999) and Channell et al. (2000).Variations in carbonate contents display bundles consisting of 4 to 6 couplets (B), interpreted as precession modulated by eccentricity. Spectral analysis of the central part of SelliLevel, i.e. the low carbonate content zone (LCCZ), reveals orbital cycles (C, D). Numbers above spectral peaks (C) are cycle wavelength in cm. Isolated precession cycles (B, the blow-upportion) exhibit striking patterns of modulation by eccentricity. E2=short eccentricity; O=obliquity; P=precession;]=bundle, ⁎=center of a bundle. ⁎⁎C3 is estimated to be ~27 kyrfrom δ13Corg data (Van Breugel et al., 2007) and we adopt a ~27–41 kyr duration for C3 (see Section 5.2.3). Shaded areas indicate C-stages C3 through C6.
91Y.-X. Li et al. / Earth and Planetary Science Letters 271 (2008) 88–100

Author's personal copy
a 95% confidence curve. Peaks rising above this limit are consideredstatistically significant. FFTs of the prepared series were carried outin the depth domain, yielding a set of spectral peaks, from which weidentified the wavelengths (in cm) of dominant cycles. Adopting theapproach of Fischer (1991), dominant sedimentary cycles that exhibitcycle wavelength ratios (CWRs) similar to periodicity ratios of orbit-al cycles are interpreted to represent orbital cycles. Following therecognition of orbital cycles, a series of band-pass filters were employedto extract signals representing orbital cycles that were subsequent-ly used to construct orbital timescales. We also used an evolutivespectral analysis (Cleaveland et al., 2002) to evaluate the stratigra-phic consistency of cycle frequencies and power over the investigatedsection.
4. Results
4.1. Cismon APTICORE, Italy
Percent CaCO3 of APTICORE samples typically varies from 30%to 90% except within the carbonaceous Selli Level where CaCO3
fluctuates between 30% and 50% (Fig. 2B). Striking cyclic m-scale
alternations of carbonate-poor and carbonate-rich horizons occur inthe strata below and above the Selli Level (Fig. 2B). Two cycles wereidentified by visual inspection. A high-frequency oscillation at the cm-scale is superimposed on a low-frequency cycle at the dm-scale. Thehigh-frequency oscillations correspond to fundamental limestone/shale bedding couplets, and typically 4 to 6 couplets constitute abundle representing a low-frequency cycle. Such a hierarchal bundlingpattern persists throughout the limestone sequences below and abovethe Selli Level (Fig. 2B). Bundling patterns diminish towards the centerof the Selli Level (Fig. 2B) due to its low carbonate content. Spectralanalysis of CaCO3 data in the low carbonate content zone (LCCZ,18.74–23.49 m) within the Selli Level (18.77–23.68 m) reveals dominantcycles of 31, 14, 11, and 7 cm (Fig. 2C). Evolutive spectral analysisindicates that spectral power concentrates in the ~31 and ~14 cmspectral bands (Fig. 2D). The 31, 14, and 7 cm-thick cycles displaya cycle wavelength ratio (CWR) of 4.4:2:1. When a band-pass filterof 1/8–1/6 cycles/cm is applied to extract the 7 cm cycle, a modulationpattern emerges showing that the 7 cm cycles are superimposedon the ~25–40 cm-thick cycles and, typically, every 4 to 6 of the 7-cmcycles are bundled to form an ~25–40 cm cycle (Fig. 2B the blow-upportion).
Fig. 3. Magnetic results of the Santa Rosa section. Magnetic susceptibility (MS) is not inversely correlated with carbonate contents (A). Widely varying S-ratios (B) suggest thatchanges in magnetic mineral composition have contributed to MS variations. Spectral analysis of log-transformed ARM shows dominant cycles of 840, 87, and 46 cm (C) with a cyclewavelength ratio (CWR) of 18.3:1.89:1 and spectral analysis of MS reveals dominant cycles of 861, 88, 46 cm (D) with a CWR of 18.7:1.9:1. These cycles exhibit CWRs similar to theperiodicity ratio (19.95:1.89:1) of the mid-Cretaceous long eccentricity, obliquity, and precession cycles (Laskar et al., 2004, Berger and Loutre, 1994). Cycles of 325 and 274 cm in theFFT of ARM (C) may represent short eccentricity because their CWR (1.19) resembles that (1.29) of 123 kyr and 95 kyr short eccentricity cycles. E1= long eccentricity.
92 Y.-X. Li et al. / Earth and Planetary Science Letters 271 (2008) 88–100
Author's personal copy
4.2. Santa Rosa Canyon, Mexico
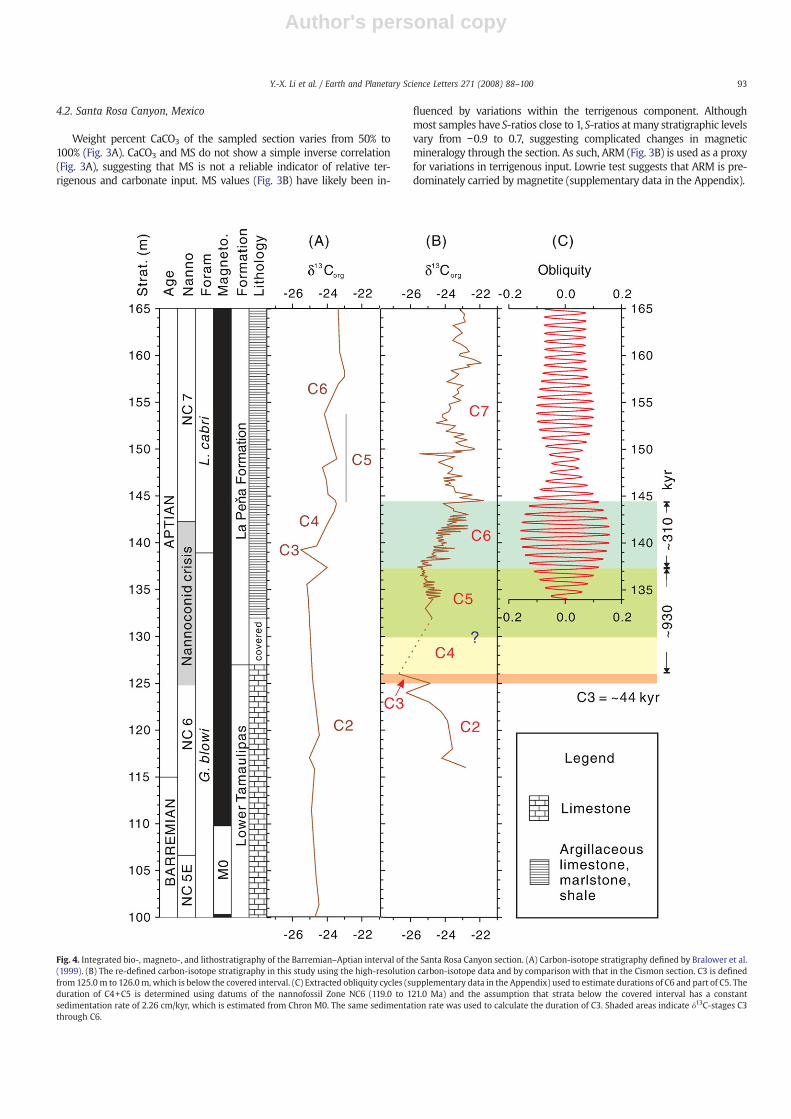
Weight percent CaCO3 of the sampled section varies from 50% to100% (Fig. 3A). CaCO3 and MS do not show a simple inverse correlation(Fig. 3A), suggesting that MS is not a reliable indicator of relative ter-rigenous and carbonate input. MS values (Fig. 3B) have likely been in-
fluenced by variations within the terrigenous component. Althoughmost samples have S-ratios close to 1, S-ratios atmany stratigraphic levelsvary from −0.9 to 0.7, suggesting complicated changes in magneticmineralogy through the section. As such, ARM (Fig. 3B) is used as a proxyfor variations in terrigenous input. Lowrie test suggests that ARM is pre-dominately carried by magnetite (supplementary data in the Appendix).
Fig. 4. Integrated bio-, magneto-, and lithostratigraphy of the Barremian–Aptian interval of the Santa Rosa Canyon section. (A) Carbon-isotope stratigraphy defined by Bralower et al.(1999). (B) The re-defined carbon-isotope stratigraphy in this study using the high-resolution carbon-isotope data and by comparison with that in the Cismon section. C3 is definedfrom 125.0 m to 126.0m, which is below the covered interval. (C) Extracted obliquity cycles (supplementary data in the Appendix) used to estimate durations of C6 and part of C5. Theduration of C4+C5 is determined using datums of the nannofossil Zone NC6 (119.0 to 121.0 Ma) and the assumption that strata below the covered interval has a constantsedimentation rate of 2.26 cm/kyr, which is estimated from Chron M0. The same sedimentation rate was used to calculate the duration of C3. Shaded areas indicate δ13C-stages C3through C6.
93Y.-X. Li et al. / Earth and Planetary Science Letters 271 (2008) 88–100

Author's personal copy
Prior to spectral analysis, the ARM data were first log-transformedto stabilize variance (Weedon, 2003) through the section. Spectralanalysis of the log-transformed ARM series (Fig. 3B) reveals a numberof statistically significant peaks (Fig. 3C). Among these spectral peaks,cycles of 840, 87, and 46 cm display a CWR of 18.3:1.9:1. Cycles of325 cm and 274 cm exhibit a CWR of 1.19:1. Spectral analysis of MSreveals cycles of similar thickness, i.e. the 861, 88, and 46 cm cycles(Fig. 3D), that have a CWR of 18.7:1.91:1. Two other cycles, i.e. the 554and 295 cm cycles, display a CWR of 1.88:1. The orbital timescale isshown in Fig. 4.
4.3. DSDP Leg 47B Site 398, North Atlantic Ocean
Percent CaCO3 of the investigated section at Site 398 is low, rangingfrom b5% to 50%, and not correlated with MS (Fig. 5A). An ano-malously high MS value occurs at ~1546 m, where ARM is similar tothat of the neighboring stratigraphic horizons, suggesting thatsuperparamagnetic grains control the MS value. Two ARM spikesoccur at ~1579.0 and 1584.5 m, where MS values are modest (Fig. 5B),suggesting that there is an abundant paramagnetic component. Thesefeatures, together with the overall low carbonate contents and thelack of negative correlation between carbonate contents and MS(Fig. 5A), suggest that MS is influenced by variations in grain size andconcentration of paramagnetic minerals, and thus does not reflectvariations in terrigenous input. The generally high S-ratios (close to 1)(Fig. 5B) indicate that low-coercivity minerals dominate the investi-gated interval. Lowrie test and IRM/MS data (Peters and Dekkers,
2003) suggest that the low-coercivity minerals are mainly magnetite(supplementary data in the Appendix). Since magnetic mineralogy isrelatively invariant, IRM measures the content of all size fractionsof low-coercivity minerals. As ARM reflects the abundance of finefraction of low-coercivity minerals, the ARM/IRM ratio (Fig. 5B) in-dicates variations in the relative abundance of fine-grained magneticminerals.
Spectral analysis of the log-transformed ARM series (Fig. 5B) re-veals dominant cycles of ~1315, 511–377, 159 cm, and a less significantcycle of 923 cm (Fig. 5C). The 1315 and 511 cm cycles exhibit a CWRof 2.57, and the 923 and 377 cm cycles display a CWR of 2.45. The511 and 160 cm cycles, and the 377 and 160 cm cycles have CWRs of3.19 and 2.36, respectively. Spectral analysis of the ARM/IRM series(Fig. 5B) reveals significant cycles of 806, 664, 321, and 160 cm. The806 and 664 cm cycles exhibit a CWR of 1.21. The 321 and 160 cmcycles display a CWR of ~2:1. When a band-pass filter of 1/200–1/130 cycles/cm was used to extract the 160 cm cycles, an amplitudemodulation pattern appears that every 4 to 6 of the 160 cm cycles aregrouped to form an ~700 cm cycle (Fig. 6).
5. Discussion
5.1. Orbital cycles recorded in three sections
Spectral analyses reveal a number of statistically significant cyclesat all sites (Figs. 2, 3, 5). Because precise orbital solutions for the mid-Cretaceous do not exist, determining whether cycles possess orbital
Fig. 5.Magnetic results of DSDP Site 398, North Atlantic Ocean. Carbonate contents are low and do not show an inverse correlationwithMS (A). Superparamagnetic and paramagneticminerals may have influenced MS (B) at least at ~1546, 1580, and 1584 m. S-ratios are close to 1 (B), suggesting relatively invariant magnetic mineralogy in terms of coercivity.Spectral analyses of the log-transformed ARM data (C), a proxy for the abundance of terrigenous influx, and the ARM/IRM ratio (D), a proxy for magnetic particle size variations,indicate that grain size variation is a better parameter for tracking orbital variations at the Site 398. The persistent ~160 cm cycles are interpreted to represent short eccentricity cycles(see Section 5.1.3).
94 Y.-X. Li et al. / Earth and Planetary Science Letters 271 (2008) 88–100

Author's personal copy
frequencies relies on identification of characteristic ‘fingerprints’ oforbital cycles. One characteristic of orbital cycles is periodicity ratio.The mean periods of eccentricity cycles are considered to persist backin time, particularly the long eccentricity that has a mean period of~405 kyr (Laskar et al., 2004). A short eccentricity cycle has a meanperiod of ~100 kyr with twomodes of ~123 kyr and ~95 kyr. Themeanperiods of obliquity and precession are believed to diminish backthrough time due to tidal friction with an obliquity cycle of ~38.4 kyrand a precession cycle of ~20.3 kyr at 120 Ma (Berger and Loutre,
1994). Therefore, the orbital cycles during the early Aptian woulddisplay a periodicity ratio of ~19.95:(6.06–4.68):1.89:1=~405:(123–95):38.4:20.3 kyr. Another characteristic of orbital cycles is amplitudemodulation (Weedon, 2003) produced by hierarchical bundling ofcycles. For example, the presence of a low-frequency cycle super-imposed on ~5 high-frequency cycles suggests that the high and low-frequency cycles represent precession and short eccentricity, respec-tively. The robustness of orbital cycle interpretations can be evaluatedby comparing the sedimentation rate estimated from inferred orbital
Fig. 6. Integrated bio-, magneto-, and lithostratigraphy of the Aptian interval of the Deep Sea Drilling Project Site 398, North Atlantic (A). The isolated 160 cm cycles (B) exhibit abundling pattern where 4 to 6 of 160 cm cycles are grouped to a ~700 cm cycle. The 160 cm cycles are regarded as short eccentricity cycles and the bundling pattern likely resultedfrom the modulation of short eccentricity by long eccentricity (see Section 5.1.3).
95Y.-X. Li et al. / Earth and Planetary Science Letters 271 (2008) 88–100

Author's personal copy
cycles with those determined using independent techniques such asbiostratigraphy or magnetostratigraphy. Table 1 summarizes para-meters that were used collectively to identify orbital cycles from thethree sections.
5.1.1. Cismon APTICORE, ItalyThe striking bundling patterns in limestones below and above the
Selli Level are interpreted to result from modulation of precession byshort eccentricity (Fig. 2B). Precession cycles are represented by thehigh-frequency limestone/shale couplets, and short eccentricity cy-cles are indicated by bundles consisting of 4 to 6 couplets per bundle(Fig. 2B). These hierarchical bedding patterns correlate with those ofcoeval Cismon outcrops where orbital cycles are recognized frombedding rhythms (Herbert, 1992). The thickness of bundles is typically~80–90 cm, and reduces to ~50 cm near the Selli Level (Fig. 2B).Therefore, the short eccentricity-based sedimentation rates of lime-stones are typically around 0.8 to 0.9 cm/kyr and decrease to ~0.5 cm/kyr near the Selli Level.
The 31,14, and 7 cmcycles in the Selli Level exhibit a CWRof 4.4:2:1,which is similar to the periodicity ratio (4.68:1.89:1) of the earlyAptian short eccentricity, obliquity, and precession cycles. Also, thepattern of modulation of the 7-cm cycles by the ~25–40 cm cycles(Fig. 2B blow-up portion) closely resembles amplitude modulation ofprecession by short eccentricity. These results suggest that orbitalvariations were imprinted in the APTICORE section, and the ~31, 14,and 7 cm cycles in the Selli Level (Fig. 2B) are interpreted to representshort eccentricity, obliquity, and precession cycles, respectively. Thesecycles yield sedimentation rates ranging from ~0.31 to 0.34 cm/kyr,which are slower than those for limestones below and above the SelliLevel. The black shale in the Selli Level is more susceptible tocompaction than the neighboring limestones, potentially resulting inthe lower estimated sedimentation rates. Moreover, reduced sedi-mentation rates in the Selli Level may result from dissolution ofcarbonates due to the shoaling of the calcite compensation depth(CCD) during the ‘Selli’ event (Bralower et al., 2002). Evidence ofcarbonate dissolution has been documented in the basal part of theSelli Level, corresponding to the negative δ13C spike, where minima incalcareous nannofossil and planktonic foraminiferal abundance,diversity and preservation were observed (Premoli Silva et al., 1999;Erba, 2004; Erba and Tremolada, 2004). Furthermore, loweredcarbonate production and fluxes, not compensated by increased bur-ial of organic matter and biogenic silica, could lead to reduced se-dimentation rates in the Selli Level aswell (Erba and Tremolada, 2004).
5.1.2. Santa Rosa Canyon, MexicoSpectral analysis of ARM data identified cycles of ~840, 87, and
46 cm (Fig. 3C) exhibiting a CWR of 18.3:1.9:1, which is comparable tothe periodicity ratio (19.95:1.89:1) of the early Aptian long eccen-tricity, obliquity, and precession cycles. Two other cycles, i.e. 325 and274 cm cycles, have a CWR of 1.19:1, which is similar to the ratio
(1.29:1) of the 123 kyr and 95 kyr short eccentricity cycles. Spectralanalysis of MS also identified cycles of 861, 88, and 46 cm (Fig. 3D) thathave a CWR (18.7:1.9:1) similar to the periodicity ratio of Cretaceousorbital cycles (19.95:1.89:1). However, the other two cycles, i.e. 554and 295 cm, do not show a CWR (1.88:1) close to the periodicity ratio(1.29:1) of the 123 kyr and 95 kyr short eccentricity cycles. Theseresults suggest that orbital variationswere likely recorded in the SantaRosa succession and ARM is a better proxy than MS in trackingorbitally-forced variations in terrigenous input.
The inferred orbital cycles of ~840, 87, and 46 cm yieldsedimentation rates ranging from 2.07 cm/kyr to 2.19 cm/kyr, whichare in striking agreement with the average sedimentation rate of2.12 cm/kyr determined independently by magnetostratigraphy forthe interval from Chron M0 to Chron M3 (Clement et al., 2000). Ofthese chrons, CM0 is the closest to our study interval. CM0 is about8.7 m thick at Santa Rosa Canyon (Clement, pers. comm., 2005) andlasted for 380 to 390 kyr (Gradstein et al., 2004), yielding asedimentation rate of 2.26 cm/kyr. Using the datums that definenannofossil Zone NC6, i.e. the first occurrence (FO) of Rucinolithusirregularis and the FO of Eprolithus floralis (Bralower et al., 1999), asedimentation rate of 1.78 cm/kyr is obtained. This sedimentation rateis slightly slower than the other estimates, probably because thenannofossil zone NC6 contains the La Peña shale, which is morecompacted than the surrounding limestone units. Nevertheless, theclose agreement in sedimentation rates estimated independentlyfrom inferred orbital cycles and magnetostratigraphy supports theinterpretation that orbital variations were likely recorded in the SantaRosa section. Orbital variations may have modulated wind-intensityand aridity of dust-source regions, causing fluctuations in the supplyof eolian dust on the deep-water carbonate platform inwestern TethysOcean and thus quasi-periodic variations in ARM at the study site.
5.1.3. DSDP Site 398, North AtlanticSpectral analysis of ARM data reveals dominant cycles of 1315, 511,
377, and 159 cm, and a less significant cycle of 923 cm. Two pairs ofcycles, the 1315 and 511 cm cycles and the 923 and 377 cm cycles, yieldCWRs of 2.57 and 2.45, respectively, which are comparable to theperiodicity ratio (2.47=95:38.4 kyr) of the Cretaceous short eccen-tricity and obliquity. The cycles of 806, 664, 321, and 160 cm revealedby spectral analysis of ARM/IRM have CWRs that closely match thoseof orbital cycles. Cycles of 806 and 664 cm have a CWRof 1.21, which isclose to the periodicity ratio (1.29) of 123 kyr and 95 kyr cycles. Also,the (806–664), 321, and 160 cm cycles exhibit a CWR (4.59:2:1) similarto the periodicity ratio (4.93:1.89:1) of the Cretaceous short eccen-tricity, obliquity, and precession. In addition, the isolated 160 cmcycles display a distinct modulation pattern resembling that of am-plitude modulation of precession by short eccentricity (Fig. 6).
If the 160 cm cycles represent precession cycles, the sedimentationrate would be ~7.9 cm/kyr for the early Aptian. Using two biostrati-graphic datums, the FO of E. floralis at 1551.5 m (119.0 Ma) and the FO
Table 1Evaluation of the data from three sites in terms of aiding in detecting orbital cycles
Sites Exposure/core recovery1 Magneto-, bio-chronology2 Depth domain3 Frequency ratio4 Amplitude modulation Consistency in sed rates5 Overall rank
APTICORE A A A A A A ASanta Rosa A A B A Ba A B+DSDP 398 B C B B A B B
Criteria:1. Whether the sampled intervals are continuous;2. Whether Chron M0, nannofossil Zone NC6, nannoconid crisis, planktonic foraminiferal zones are defined;3. Whether cycles are present and persistent through sections, and whether modulation patterns are apparent;4. The degree to which frequency ratios are close to those of orbital cycles;5. The degree to which sedimentation rates estimated from inferred orbital cycles are similar to those determined independently.A, B+, B, C are ratings of the data quality at each site for a criterion. A=The data meet all aspects of the criterion; B=the data meet most aspects of the criterion; C=the data meet someaspects of the criterion.
a A modulation pattern similar to that of precession and short eccentricity was not observed, however, a modest modulation pattern resembling that of short eccentricity and longeccentricity was found when a band-pass filter of 1/440–1/230 cycles/cm was applied to the log-transformed ARM depth series.
96 Y.-X. Li et al. / Earth and Planetary Science Letters 271 (2008) 88–100

Author's personal copy
of R. irregularis at 1595.0 m (121.0 Ma) (Bralower et al., 1994), anaverage sedimentation rate of ~2.2 cm/kyr is obtained. These two bio-datums are among 12 biohorizons identified at Site 398, whichcorrelate well with those at the nearby Site 641 in eastern NorthAtlantic. Also, the same two bio-datums at Site 641 (Bralower et al.,1994) yield an average sedimentation rate of 1.3 cm/kyr. Therefore, the~7.9 cm/kyr sedimentation rate is largely incompatible with indepen-dent estimates of sedimentation rate based on biostratigraphy,warranting a re-evaluation of the frequency ratio-based interpretationof the ~160 cm cycles as precession cycles. Perhaps the bundlingpattern (Fig. 6) is not a result of modulation of precession cycles byshort eccentricity cycles, but rather from modulation of the ~95 kyrshort eccentricity cycles by the 405 kyr long eccentricity cycles. In-terpreting the ~160 cm cycles as ~95 kyr short eccentricity cycleswould yield a sedimentation rate of ~1.7 cm/kyr, which is comparableto the biostratigraphy-based estimate of ~2.2 cm/kyr. Each bundlewould thus represent a 405 kyr long eccentricity cycle. Quasi-periodicvariations in ARM and ARM/IRM at Site 398 may reflect fluctuations influvial influx that were probably largely controlled by continentalrunoff. Changes in continental runoff in turn were likely related to theacceleration/deceleration of hydrological cycles, through whichmodulation of orbital variations took place.
5.2. Duration of OAE1a
The precision of estimates of the duration of intervals withinOAE1a depends on: 1) the ability to identify and correlate individualstratigraphic intervals within the event between different locations,and 2) the accuracy of orbital clocks.
5.2.1. Carbon-isotope-based definition of OAE1aOAE1a was first recognized by the widespread occurrence of or-
ganic-rich black shale horizons (Schlanger and Jenkyns,1976; Jenkyns,1980) and lithology remains an appropriate way to identify this eventin marine deposits. However, organic-rich black shales associatedwith OAE1a are often interbedded with other lithologies such aslimestones and claystones in a complex fashion (Arthur and Sageman,1994), and thus lithology alone is often not sufficient to identify andcorrelate OAE1a intervals between different locations. Geochemicalstudies of OAE1a at widely scattered sites show a pronounced, abruptnegative CIE followed by a recovery phase and a prolonged positiveCIE (e.g., Scholle and Arthur, 1980; Bralower et al., 1999; Dumitrescuand Brassell, 2006). The widespread nature and close temporalassociation of organic-rich layers and negative and positive CIEsindicate that OAE1a represents a major perturbation of global carboncycling (Arthur et al., 1985). Consequently, the negative and positiveCIEs are used to correlate OAE1a on a global scale (Jenkyns, 1995;Bralower et al., 1999; Ando et al., 2002). High-resolution carbon-isotope stratigraphy demonstrates that variations during the lateBarremian through the late Aptian can be consistently subdivided intoeight carbon-isotope stages, C1 through C8 (Menegatti et al., 1998).Stages C3 through C6 are closely related to OAE1a. A sharp negativeshift at the onset of OAE1a is defined as stage C3 and is followed by apositive shift, defined as stage C4. The subsequent period of relativelyinvariant carbon-isotope composition is defined as stage C5, which isfollowed by a second positive shift, defined as stage C6 (see Fig. 2A fora similar pattern of C-stages at Cismon). Carbon isotopes allowcorrelation of OAE1a intervals between different sites.
5.2.2. Orbital clocks in the mid-CretaceousThe long eccentricity in the Cretaceous has a periodicity of ~405 kyr
(Laskar et al., 2004). The short eccentricity cycle is probably in themodeof ~95 kyr in the early Aptian because the CWR of ~4.4:2:1 of theAPTICORE closely matches periodicities of ~95:38.4:20.3 kyr (Section5.1). These mean periods of the early Aptian orbital cycles are used toestablish ‘floating’ interval timescales for the mid-Cretaceous. After a
depth–time relationship is determined with an orbital frequency, theduration of a stratigraphic interval is obtained by counting the orbitalcycleswith ametronomic approach using themeanperiod of the orbitalcycle. The errors involved can be reduced to below 10% for 5 or morecycles (Herbert et al., 1995).
5.2.3. Duration of OAE1aThe APTICORE is often regarded as the reference section for OAE1a
and has been studied using different proxies. In this study, we usedpublished δ13Ccarb and δ13Corg data to identify C-stages and estimatetheir durations for the APTICORE succession. The structure of the high-resolution APTICORE δ13Ccarb curve (Erba et al., 1999) (Fig. 2A) is almostidentical to that of the nearby Cismon outcrop where carbon-isotopestages were first defined (Menegatti et al., 1998). Stage C3 in δ13Ccarbcorresponds to 17 cm of section and 2 precession cycles, and thus lastedfor ~41 kyr (Fig. 2). Van Breugel et al. (2007) assumed constantsedimentation rates of 0.5–0.9 cm/kyr for their entire study interval inAPTICORE, and obtained an estimate of 10–20kyr for the 11-cm-thick C3interval recorded by δ13Corg. This duration probably represents anunderestimate because sedimentation rates for the C3 interval werelikely much slower than the assumed 0.5–0.9 cm/kyr due to dissolutionat the onset of the Selli Level (Section 5.1.1). In fact, the orbitalchronology, which is derived from the high-resolution (2.5 cm samplinginterval) carbonate content data (Section 3.1), shows that sedimentationrate decreases from ~0.8–0.9 cm/kyr in strata away from the Selli Level,through ~0.5 cm/kyr in strata near the Selli Level, to ~0.41 cm/kyr at thebase of the Selli Level (Fig. 2). Using the sedimentation rate estimate forthe base of the Selli Level produces a duration of ~27 kyr for the 11-cm-thick C3 defined by δ13Corg. Combining the δ13Ccarb and δ13Corg estimates,we adopt a durationof ~27–41kyr for C3 inAPTICORE. Stages C4, C5, andC6 contain ~3.5, 6, and 3.5 short eccentricity cycles respectively,corresponding to ~330, 570, and 330 kyr (Fig. 2A and supplementarydata in the Appendix). Thus, the carbon-isotope-based OAE1a interval is~1.27 Myr. According to the orbital chronology, the organic-rich SelliLevel would represent ~1.23 Myr (Figs. 2A, 7).
The chemostratigraphy of the Santa Rosa section was establishedby Bralower et al. (1999) (Fig. 4A). The new higher-resolution δ13Corgrecord shows that the most negative δ13Corg occurs below the coveredinterval (Fig. 4B) (as opposed to that occurring above the coveredinterval in Fig. 4A), leading us to redefine the C-stages. By comparisonwith δ13Ccarb data of the APTICORE, stage C3 in Santa Rosa is identifiedbetween 125.0 m, where the δ13Corg value is similar to that of stage C5(Figs. 2A and 4B), and 126.0 m where the most negative δ13Corg valueoccurs (Figs. 2A and 4B). Stage C3 in Santa Rosa is marked by a ~2‰negative shift in δ13Corg (Fig. 4B), which is broadly in line with the ~1.5to ~3‰ shifts of stages C3 documented in other records (Dumitrescuand Brassell, 2006). The duration of C3 is estimated to be ~44 kyr(supplementary data in the Appendix). The upper part of stage C4 andpossibly the lower part of stage C5 are not exposed. The positive CIEabove the covered interval is regarded as stage C6 because the boundarybetween nannofossil zone NC6 and NC7 often occurs in stage C6 as seenin APTICORE and Site 398 core (Figs. 2, 4, 6). Stages C4+C5 are estimatedto last for ~930 kyr (supplementary data in the Appendix). Stage C6spans 8 obliquity cycles and corresponds to ~310 kyr (Fig. 4). Thus thecarbon-isotope-based OAE1a interval at Santa Rosa is ~1.28 Myr.Similarly, the organic-rich horizon at Santa Rosa would represent~1.13 Myr based on the orbital chronology (Fig. 7).
Carbon-isotope variations associated with OAE1a at Site 398 areidentified by comparing the δ13Corg and nannofossil recordswith thosefrom the APTICORE and Santa Rosa sections. The onset of decreasingδ13Corg begins at 1571.3 m and marks the base of stage C3, and the endof the positive δ13Corg shift at 1550.8 m represents the top of stage C6(Fig. 6). It is not possible to define individual stages C3, C4, C5, and C6with confidence due to the lack of distinctive fine-scale structure in thecarbon-isotope curve similar to that of Cismon (Figs. 2A, 6) and thesignificant influx of terrestrial material to the depositional site. The
97Y.-X. Li et al. / Earth and Planetary Science Letters 271 (2008) 88–100
Author's personal copy
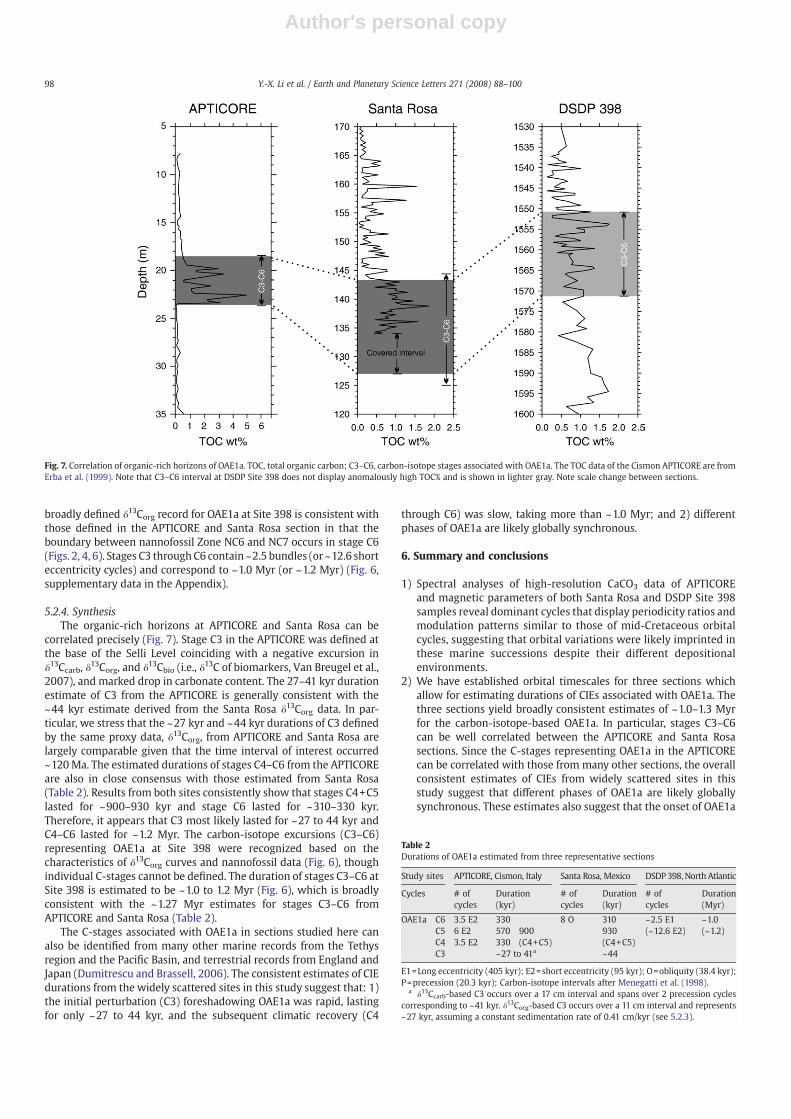
broadly defined δ13Corg record for OAE1a at Site 398 is consistent withthose defined in the APTICORE and Santa Rosa section in that theboundary between nannofossil Zone NC6 and NC7 occurs in stage C6(Figs. 2, 4, 6). Stages C3 throughC6 contain ~2.5 bundles (or ~12.6 shorteccentricity cycles) and correspond to ~1.0 Myr (or ~1.2 Myr) (Fig. 6,supplementary data in the Appendix).
5.2.4. SynthesisThe organic-rich horizons at APTICORE and Santa Rosa can be
correlated precisely (Fig. 7). Stage C3 in the APTICORE was defined atthe base of the Selli Level coinciding with a negative excursion inδ13Ccarb, δ13Corg, and δ13Cbio (i.e., δ13C of biomarkers, Van Breugel et al.,2007), and marked drop in carbonate content. The 27–41 kyr durationestimate of C3 from the APTICORE is generally consistent with the~44 kyr estimate derived from the Santa Rosa δ13Corg data. In par-ticular, we stress that the ~27 kyr and ~44 kyr durations of C3 definedby the same proxy data, δ13Corg, from APTICORE and Santa Rosa arelargely comparable given that the time interval of interest occurred~120Ma. The estimated durations of stages C4–C6 from the APTICOREare also in close consensus with those estimated from Santa Rosa(Table 2). Results from both sites consistently show that stages C4+C5lasted for ~900–930 kyr and stage C6 lasted for ~310–330 kyr.Therefore, it appears that C3 most likely lasted for ~27 to 44 kyr andC4–C6 lasted for ~1.2 Myr. The carbon-isotope excursions (C3–C6)representing OAE1a at Site 398 were recognized based on thecharacteristics of δ13Corg curves and nannofossil data (Fig. 6), thoughindividual C-stages cannot be defined. The duration of stages C3–C6 atSite 398 is estimated to be ~1.0 to 1.2 Myr (Fig. 6), which is broadlyconsistent with the ~1.27 Myr estimates for stages C3–C6 fromAPTICORE and Santa Rosa (Table 2).
The C-stages associated with OAE1a in sections studied here canalso be identified from many other marine records from the Tethysregion and the Pacific Basin, and terrestrial records from England andJapan (Dumitrescu and Brassell, 2006). The consistent estimates of CIEdurations from the widely scattered sites in this study suggest that: 1)the initial perturbation (C3) foreshadowing OAE1a was rapid, lastingfor only ~27 to 44 kyr, and the subsequent climatic recovery (C4
through C6) was slow, taking more than ~1.0 Myr; and 2) differentphases of OAE1a are likely globally synchronous.
6. Summary and conclusions
1) Spectral analyses of high-resolution CaCO3 data of APTICOREand magnetic parameters of both Santa Rosa and DSDP Site 398samples reveal dominant cycles that display periodicity ratios andmodulation patterns similar to those of mid-Cretaceous orbitalcycles, suggesting that orbital variations were likely imprinted inthese marine successions despite their different depositionalenvironments.
2) We have established orbital timescales for three sections whichallow for estimating durations of CIEs associated with OAE1a. Thethree sections yield broadly consistent estimates of ~1.0–1.3 Myrfor the carbon-isotope-based OAE1a. In particular, stages C3–C6can be well correlated between the APTICORE and Santa Rosasections. Since the C-stages representing OAE1a in the APTICOREcan be correlated with those from many other sections, the overallconsistent estimates of CIEs from widely scattered sites in thisstudy suggest that different phases of OAE1a are likely globallysynchronous. These estimates also suggest that the onset of OAE1a
Fig. 7. Correlation of organic-rich horizons of OAE1a. TOC, total organic carbon; C3–C6, carbon-isotope stages associated with OAE1a. The TOC data of the Cismon APTICORE are fromErba et al. (1999). Note that C3–C6 interval at DSDP Site 398 does not display anomalously high TOC% and is shown in lighter gray. Note scale change between sections.
Table 2Durations of OAE1a estimated from three representative sections
Study sites APTICORE, Cismon, Italy Santa Rosa, Mexico DSDP 398, North Atlantic
Cycles # ofcycles
Duration(kyr)
# ofcycles
Duration(kyr)
# ofcycles
Duration(Myr)
OAE1a C6 3.5 E2 330 8 O 310 ~2.5 E1(~12.6 E2)
~1.0(~1.2)C5 6 E2 570 900
(C4+C5)930(C4+C5)C4 3.5 E2 330
C3 ~27 to 41a ~44
E1=Long eccentricity (405 kyr); E2=short eccentricity (95 kyr); O=obliquity (38.4 kyr);P=precession (20.3 kyr); Carbon-isotope intervals after Menegatti et al. (1998).
a δ13Ccarb-based C3 occurs over a 17 cm interval and spans over 2 precession cyclescorresponding to ~41 kyr. δ13Corg-based C3 occurs over a 11 cm interval and represents~27 kyr, assuming a constant sedimentation rate of 0.41 cm/kyr (see 5.2.3).
98 Y.-X. Li et al. / Earth and Planetary Science Letters 271 (2008) 88–100

Author's personal copy
was rapid, taking only ~27 to 44 kyr, and the subsequent climaticrecovery was surprisingly slow, lasting for more than ~1.0 Myr.
Acknowledgements
We thank B. Clement for providing paleomagnetic data of ChronM0 at the Santa Rosa section, S. Mulcahy for field assistance, T. Lin andB. Stotnick for laboratory assistance, the curatorial staff at IODP-ECRfor their help with Site 398 sampling, and K.P. Kodama for discussion.This paper also benefited from thoughtful comments from M.L.Delaney, S. Voight, and two anonymous reviewers. This study issupported by NSF grant EAR0208212 to IPM and DAO, andEAR0318551 to TJB.
Appendix A. Supplementary data
Supplementary data associated with this article can be found, inthe online version, at doi:10.1016/j.epsl.2008.03.055.
References
Ando, A., Kakegawa, T., Takashima, R., Saito, T., 2002. New perspective on Aptian carbonisotope stratigraphy: data from δ13C records of terrestrial organic matter. Geology30, 227–230.
Arthur, M.A., 1979. North Atlantic Cretaceous black shales: the record at Site 398 and abrief comparison with other occurrences. Initial Reports of the Deep Sea DrillingProject, XLVII, Part 2, pp. 719–738.
Arthur, M.A., 2000. Volcanic contributions to the carbon and sulfur geochemical cyclesand global change. In: Sigurdsson, H., Houghton, B., McNutt, S.R., Rymer, H., Stix, J.(Eds.), Encyclopedia of Volcanoes. Academic Press, pp. 1045–1056.
Arthur, M.A., Premoli Silva, I., 1982. Development of widespread organic carbon-richstrata in the Mediterranean Tethys. In: Schlanger, S.O., Cita, M.B. (Eds.), Nature ofCretaceous Carbon-Rich Facies. Academic, San Diego, Calif., p. 7–54.
Arthur, M.A., Sageman, B.B., 1994. Marine black shales: depositional mechanisms andenvironments of ancient deposits. Ann. Rev. Earth Planet. Sci. 22, 499–551.
Arthur, M.A., Scholle, P.A., Hasson, P., 1979. Stable isotopes of oxygen and carbon incarbonates from sites 398 and 116 of the deep sea drilling project. Initial Reports ofthe Deep Sea Drilling Project, XLVII, Part 2, pp. 477–491.
Arthur, M.A., Dean, W.E., Bottjer, D.J., Scholle, P.A., 1984. Rhythmic bedding inMesozoic–Cenozoic pelagic carbonate sequences: the primary and diagenetic origin ofMilankovitch-like cycles. In: Berger, A. (Ed.), Milankovitch and Climate. D. Riedel,Norwell, Mass., pp. 191–222.
Arthur, M.A., Dean, W.E., Schlanger, S.O., 1985. Variations in the global carbon cycleduring the Cretaceous related to climate, volcanism, and changes in atmosphericCO2. In: Sundquist, E.T., Broecker, W.S. (Eds.), The Carbon Cycle and AtmosphericCO2: Natural Variations Archean to Present. Geophys. Monogr. Ser., vol. 32. AGU,Washington, D.C., p. 504–529.
Arthur, M.A., Jenkyns, H.C., Brumsack, H., Schlanger, S.O., 1990. Stratigraphy, geo-chemistry, and paleoceanography of organic carbon-rich Cretaceous sequences. In:Ginsburg, R.N., Beaudoin, B. (Eds.), Cretaceous Resources, Events and Rhythms.Kluwer Academic, Dordrecht, pp. 75–119. NATO AS1 Series C, 304 1990.
Barron, E.J., 1983. A warm, equable Cretaceous: the nature of the problem. Earth-Sci.Rev. 19, 305–338.
Beerling, D.J., Lomas, M.R., Gröcke, D.R., 2002. On the nature of methane gas-hydrate dis-sociation during the Toarcian and Aptian oceanic anoxic events. Am. J. Sci. 302, 28–49.
Berger, A., Loutre, M.F., 1994. Astronomical forcing through geologic time. In: de Boer,P.L., Smith, D.G. (Eds.), Orbital Forcing and Cyclic Sequences. International Asso-ciation of Sedimentologists Spec. Pub., vol. 19, pp. 15–24.
Bralower, T.J., Arthur, M.A., Leckie, R.M., Sliter, W.V., Allard, D.J., Schlanger, S.O., 1994.Timing and paleoceanography of oceanic dysoxia/anoxia in the Late Barremian toEarly Aptian (Early Cretaceous). Palaios 9, 335–369.
Bralower, T.J., Fullagar, P.D., Paull, C.K., Dwyer, G.S., Leckie, R.M., 1997. Mid-Cretaceousstrontium-isotope stratigraphy of deep-sea sections. Geol. Soc. Amer. Bull. 109,1421–1442.
Bralower, T.J., CoBabe, E., Clement, B., Sliter, W.V., Osburne, C., Longoria, J., 1999. Therecord of global change in mid-Cretaceous, Barremian–Albian sections from theSierra Madre, northeastern Mexico. J. Foraminiferal Res. 29, 418–437.
Bralower, T.J., Premoli Silva, I., Malone, M.J., 2002. New evidence for abrupt climatechange in the Cretaceous and Paleogene: an Ocean Drilling Program expedition toShatsky Rise, northwest Pacific. GSA Today 12 (11), 4–10.
Channell, J.E.T., Erba, E., Muttoni, G., Tremolada, F., 2000. Early Cretaceous magneticstratigraphy in the APTICORE drill core adjacent outcrop at Cismon (Southern Alps,Italy), and correlation to the proposed Barremian–Aptian boundary stratotype.Geol. Soc. Amer. Bull. 112, 1430–1443.
Clark, R.N., King, T.V.V., Klejwa, M., Swayze, G.A., 1990. High resolution reflectancespectroscopy of minerals. J. Geophys. Res. 95, 12,653–12,680.
Cleaveland, L., Jensen, J., Goese, S., Bice, D., Montanari, A., 2002. Cyclostratigraphicanalysis of pelagic carbonates at Monte dei Corvi (Ancona, Italy). Geology 30,931–934.
Clement, B., Poetisi, M.E., Bralower, T.J., CoBabe, E., Longoria, J., 2000. Magnetostrati-graphy of mid-Cretaceous limestones from the Sierra Madre of northeasternMexico. Geophys. J. Int. 143, 219–229.
Coccioni, R., Franchi, R., Nesci, O., Wezel, C.F., Battistini, F., Pallecchi, P., 1989. Stratigraphyand mineralogy of the Selli level (early Aptian) at the base of the Marne a Fucoidi inthe Umbrian–Marchean Apennines (Italy). In: Wiedmann, J. (Ed.), Cretaceous ofWestern Tethys. 3rd International Cretaceous Symposium. Schweizerbart'sche,Stuttgart, Germany, pp. 563–584.
Deroo, G., Herbin, J.P., Roucaché, J., Tissot, B., 1979. Organic geochemistry of Cretaceousshales from DSDP Site 398, Leg 47B, Eastern North Atlantic. Initial reports of theDeep Sea Drilling Project, XLVII, part 2, pp. 513–522.
Dumitrescu, M., Brassell, S.C., 2006. Compositional and isotopic characteristics of or-ganic matter for the early Aptian oceanic anoxic event at Shatsky Rise. ODP Leg 198.Paleo3 235, 168–191.
Erba, E., 1994. Nannofossils and superplumes: the early Aptian “nannoconid crisis”.Paleoceanography 9, 483–501.
Erba, E., 2004. Calcareous nannofossils and Mesozoic oceanic anoxic event. Mar. Micro-paleontol. 52, 85–106.
Erba, E., Tremolada, F., 2004. Nannofossil carbonate fluxes during the Early Cretaceous:phytoplankton response to nitrification episodes, atmospheric CO2 and anoxia.Paleoceanography 19. doi:10.1029/2003PA000884.
Erba, E., Channell, J.E.T., Claps, M., Jones, C., Larson, R., Opdyke, B., Premoli-Silva, I., Riva,A., Salvini, G., Torricelli, S., 1999. Integrated stratigraphy of the Cismon Apticore(Southern Alps, Italy): a “reference section” for the Hauterivian–Aptian interval atlow latitudes. J. Foraminiferal Res. 29, 371–391.
Erbacher, J., Huber, B.T.,Norris, R.D.,Markey,M., 2001. Increased thermohaline stratificationas a possible cause for an oceanic anoxic event in the Cretaceous Period. Nature 409,325–327.
Fassell, M.L., Bralower, T.J., 1999. A warm, equable mid-Cretaceous: stable isotopeevidence. In: Barrera, E., Johnson, C. (Eds.), Evolution of the Cretaceous Ocean-Climate System. Geol. Soc. Am. Spec. Publ., vol. 332, pp. 121–142.
Fiet, N., 2000. Calibrage temporal de l'Aptien et des sous-étages associés par uneapproche cyclostratigraphique appliquée à la série pélagique de Marches-Ombrie(Italie centrale). Bull. Soc. Géol. Fr. 171, 103–113.
Fischer, A.G., 1991. Orbital cyclicity inMesozoic strata. In: Einsele, G., Ricken,W., Seilacher,A. (Eds.), Cycles and Events in Stratigraphy. Springer-Verlag, Berlin, pp. 48–62.
Frakes, L.A., 1979. Climates throughout geological time. Elsevier.Gradstein, F.M., Ogg, J.G., Smith, A.G. (Eds.), 2004. A Geological Time Scale 2004.
Cambridge University Press.Gröcke, D.R., Hesselbo, S.P., Jenkyns, H.C., 1999. Carbon-isotope composition of Lower
Cretaceous fossilwood: ocean-atmosphere chemistryand relation to sea-level change.Geology 27, 155–158.
Herbert, T.D., 1992. Paleomagnetic calibration of Milankovitch cyclicity in LowerCretaceous sediments. Earth Planet. Sci. Lett. 112, 15–28.
Herbert, T.D., Fischer, A.G., 1986. Milankovitch climatic origin of mid-Cretaceous blackshale rhythms in central Italy. Nature 321, 739–743.
Herbert, T.D., Premoli Silva, I., Erba, E., Fischer, A., 1995. Orbital chronology of Cre-taceous–Paleocene marine sediments. In: Berggren, W.A., Kent, D.V., Aubry, M.-P.,Hardenbol, J. (Eds.), Geochronology, Time Scales and Global Stratigraphic Correla-tion. SEPM Spec. Publ., vol. 54, pp. 81–94.
Jahren, A.H., Arens, N.C., Sarmiento, G., Guerrero, J., Amundson, R., 2001. Terrestrial recordof methane hydrate dissociation in the Early Cretaceous. Geology 29, 159–162.
Jenkyns, H.C., 1980. Cretaceous anoxic events: from continents to oceans. J. Geol. Soc.Lond. 137, 171–188.
Jenkyns, H.C., 1995. Carbon-isotope strntigraphy and paleoceanographic significance ofthe Lower Cretaceous shallow-water carbonates of resolution Guyot, Mid-Pacificmountains. Paci. Ocean Drill, Program Sci. Results 143, 99–104.
Jenkyns, H.C., 2003. Evidence for rapid climate change in the Mesozoic–Palaeogenegreenhouse world. Philos. Trans. R. Soc. Lond. A 361, 1885–1916.
Kennett, J., Stott, L., 1991. Abrupt deep-sea warming, palaeoceanographic changes andbenthic extinctions at the end of the Palaeocene. Nature 353, 225–229.
King, J.W., Banerjee, S.K., Marvin, J.A., Özdemir, Ö., 1982. A comparison of differentmagnetic methods for determining the relative grain size of magnetite in naturalmaterials: some results from lake sediments. Earth Planet. Sci. Lett. 59, 404–419.
Larson, R.L., 1991. Geological consequences of superplumes. Geology 19, 963–966.Larson, R.L., Erba, E., 1999. Onset of the mid-Cretaceous greenhouse in the Barremian–
Aptian: igneous events and the biological, sedimentary, and geochemicalresponses. Paleoceanography 14, 663–678.
Laskar, J., Robutel, P., Joutel, F., Gastineau, M., Correia, A.C.M., Levrard, B., 2004. A long-term numerical solution for the insolation quantities of the Earth. Astro. Astrophys.428, 261–285.
Latta, D.K., Anastasio, D.J., Hinnov, L.A., Elrick, M., Kodama, K.P., 2006. Magneticrecords of Milankovitch rhythms in lithologically noncyclic marine carbonates.Geology 34, 29–32.
Leckie, R.M., Bralower, T.J., Cashman, R., 2002. Oceanic anoxic events and plankton evo-lution: biotic response to tectonic forcing during the mid-Cretaceous. Paleoceano-graphy 17. doi:10.1029/2001PA000623.
Lehmann, C., Osleger, D.A., Montañez, I.P., 1998. Controls on cyclostratigraphy of LowerCretaceous carbonates and evaporites, Cupido and Coahuila platforms, northeasternMexico. J. Sed. Res. 68, 1109–1130.
Lehmann, C., Osleger, D.A., Montañez, I.P., 2000. Sequence stratigraphy of LowerCretaceous (Barremian–Albian) carbonate platforms of northeastern Mexico:regional and global correlations. J. Sed. Res. 70, 373–391.
Lehmann, C., Osleger, D.A., Montañez, I.P., Sliter, W., Arnaud-Vanneau, A., Banner, J.,1999. Evolution of Cupido and Coahuila carbonate platforms, Early Cretaceous,northeastern Mexico. Geol. Soc. Amer. Bull. 111, 1010–1029.
99Y.-X. Li et al. / Earth and Planetary Science Letters 271 (2008) 88–100

Author's personal copy
Lourens, L.J., Sluijs, A., Kroon, D., Zachos, J.C., Thomas, E., Röhl, U., Bowles, J., Raffi, I.,2005. Astronomical pacing of late Palaeocene to early Eocene global warmingevents. Nature 435, 1083–1087. doi:10.1038/mature03814.
Lowrie, W., 1990. Identification of ferromagnetic minerals in a rock by coercivity andunblocking temperature properties. Geophys. Res. Lett. 17, 159–162.
Mader, D., Cleaveland, L., Bice, D., Montanari, A., Koeberl, C., 2004. High-resolutioncyclostratigraphic analysis of multiple climate proxies from a short Langhianpelagic succession in the Conero Riveiera, Ancona (Italy). Paleo3 211, 325–344.
Mayer, H., Appel, E., 1999. Milankovitch cyclicity and rock-magnetic signatures ofpalaeoclimatic change in the Early Cretaceous Biancone Formation of the SouthernAlps, Italy. Cretac. Res. 20, 189–214.
Mead, G.A., Tauxe, L., LaBrecque, J.L., 1986. Oligocene paleoceanography of the SouthAtlantic: paleoclimatic implications of sediment accumulation rates and magneticsusceptibility measurements. Paleoceanography 1, 273–284.
Menegatti, A.P., Weissert, H., Brown, R.S., Tyson, R.V., Farrimoud, P., Strasser, A., Caron,M., 1998. High-resolution δ13C stratigraphy through the early Aptian “Livello Selli”of the Alpine Tethys. Paleoceanography 13, 530–545.
Muller, R.A., MacDonald, J.G., 2000. Ice ages and astronomical causes: Data, spectralanalysis, and mechanisms. Springer Praxis, Berlin.
Park, J., Herbert, T.D., 1987. Hunting for paleoclimatic periodicities in a geological timeseries with an uncertain time scale. J. Geophys. Res. 92, 14027–14040.
Peters, C., Dekkers, M.J., 2003. Selected room temperature magnetic parameters asa function of mineralogy, concentration and grain size. Phys. Chem. Earth 28,659–667.
Premoli Silva, I., Erba, E., Salvini, G., Verga, D., Locatelli, C., 1999. Biotic changes inCretaceous anoxic events. J. Foraminiferal Res. 29, 352–370.
Robinson, S.A., Williams, T., Bown, P.R., 2004. Fluctuations in biosiliceous productionand the generation of Early Cretaceous oceanic anoxic events in the Pacific Ocean(Shatsky Rise, Ocean Drilling Program Leg 198). Paleoceanography 19. doi:10.1029/2004PA001010.
Schlanger, S.O., Jenkyns, H.C., 1976. Cretaceous oceanic anoxic events: causes andconsequences. Geol. Mijnb. 55, 179–184.
Scholle, P.A., Arthur, M.A., 1980. Carbon isotope fluctuations in Cretaceous pelagiclimestones: potential stratigraphic and petroleum exploration tools. AAPG Bull. 64,67–87.
Sigal, J., 1979. Chronostratigraphy and ecostratigraphy of Cretaceous formationsrecovered on DSDP Leg 47B, Site 398. Initial reports of the Deep Sea DrillingProject, XLVII, part 2, pp. 287–326.
Sliter, W.V., 1989. Aptian anoxia in the Pacific Basin. Geology 17, 909–912.Tarduno, J.A., Sliter, W.V., Kroenke, L., Leckie, M., Mayer, H., Mahoney, J.J., Musgrave, R.,
Storey, M., Winterer, E.L., 1991. Rapid formation of Ontong Java Plateau by Aptianmantle plume volcanism. Science 254, 399–403.
Tsikos, H., Jenkyns, H.C., Walsworth-Bell, B., Petrizzo, M.R., Forster, A., Kolonic, S., Erba, E.,Premoli Silva, I., Baas, M., Wagner, T., Sinninghe Damsté, J.S., 2004. Carbon-isotopestratigraphy recorded by the Cenomanian–Turonian oceanic anoxic event; correla-tion and implications based on three key localities. J. Geol. Soc. (Lond.) 161, 711–719.
Van Breugel, Y., Schouten, S., Tsikos, H., Erba, E., Price, G.D., Sinninghe Damsté, J.S., 2007.Synchronous negative carbon isotope shifts inmarineand terrestrial biomarkers at theonset of the early Aptian oceanic anoxic event 1a: evidence for the release of 13C-depleted carbon into the atmosphere. Paleoceanography 22, PA1210. doi:10.1029/2006PA001341.
Weedon, G., 2003. Time-series analysis and cyclostratigraphy. Cambridge University Press.
100 Y.-X. Li et al. / Earth and Planetary Science Letters 271 (2008) 88–100