Geothermal heating enhances atmospheric asymmetries on synchronously rotating planets
Upload
independentCategory
view
1download
0
Using Biogenic Sulfur Gases as Remotely DetectableBiosignatures on Anoxic Planets
Shawn D. Domagal-Goldman,1 Victoria S. Meadows,2,3 Mark W. Claire,2,3 and James F. Kasting3,4
Abstract
We used one-dimensional photochemical and radiative transfer models to study the potential of organic sulfurcompounds (CS2, OCS, CH3SH, CH3SCH3, and CH3S2CH3) to act as remotely detectable biosignatures in anoxicexoplanetary atmospheres. Concentrations of organic sulfur gases were predicted for various biogenic sulfurfluxes into anoxic atmospheres and were found to increase with decreasing UV fluxes. Dimethyl sulfide(CH3SCH3, or DMS) and dimethyl disulfide (CH3S2CH3, or DMDS) concentrations could increase to remotelydetectable levels, but only in cases of extremely low UV fluxes, which may occur in the habitable zone of aninactive M dwarf. The most detectable feature of organic sulfur gases is an indirect one that results from anincrease in ethane (C2H6) over that which would be predicted based on the planet’s methane (CH4) concen-tration. Thus, a characterization mission could detect these organic sulfur gases—and therefore the life thatproduces them—if it could sufficiently quantify the ethane and methane in the exoplanet’s atmosphere. KeyWords: Exoplanets—Biosignatures—Anoxic atmospheres—Planetary atmospheres—Remote life detection—Photochemistry. Astrobiology 11, 419–441.
1. Introduction
The search for life may soon expand beyond the bound-aries of our solar system via the detection of spectral
features of ‘‘biosignature’’ gases on extrasolar planets (Euro-pean Space Agency, 2010; Jet Propulsion Laboratory, 2010;New Worlds Observer Team, 2010). For a gas to be a bio-signature it must have a biological production rate that faroutpaces abiotic sources and an atmospheric lifetime that al-lows it to build up to detectable levels. To be detectable, thebiosignature gas must have spectral features that are (1)within a wavelength region that can be covered by instru-mentation, (2) larger than the signal-to-noise ratio (S/N) forthese instruments, and (3) distinguishable from other spectralfeatures.
For biospheres in which primary productivity is domi-nated by oxygenic photosynthesis (henceforth referred to as‘‘oxic’’ biospheres), a number of gases have been identifiedthat meet these criteria: oxygen (O2), ozone (O3), or both inthe presence of reduced species such as methane (CH4)(Lovelock, 1965; Des Marais et al., 2002); nitrous oxide (N2O)(Sagan et al., 1993); and methyl chloride (CH3Cl) (Seguraet al., 2005). The latter two gases are more difficult to detect
in Earth’s present atmosphere than are the first two; how-ever, they might be more visible in the atmospheres of oxicEarth-like planets orbiting M stars due to longer atmosphericlifetimes resulting from lower photolysis rates (Segura et al.,2005).
Other biosignatures are needed for detection of ‘‘anoxicbiospheres’’ that harbor life but not detectable amounts ofatmospheric O2 and O3. Biogenic CH4 could be abundantenough to be detectable in such an atmosphere (Kasting et al.,1983, 2001; Kasting, 2005; Kharecha et al., 2005; Kalteneggeret al., 2007), but its interpretation would be ambiguous be-cause abiotic processes such as serpentinization can alsoproduce CH4 (Berndt et al., 1996; Kasting and Catling, 2003).
From the early history of life on Earth, we know that an-oxic biospheres are possible. Studies of early Earth suggestthat life was present well before significant O2 accumulatedin the atmosphere (Schopf, 1983; Holland, 1984; Farquharand Wing, 2003; Westall, 2005; Farquhar et al., 2007). Thisperiod had vigorous biological activity without significantO2 buildup and may have lasted as long as 1.5 billion years,approximately one-third of Earth’s history. This suggeststhat planets with life, but without O2/O3, could represent alarge fraction of inhabited planets. Thus, the absence of
1NASA Headquarters, Washington DC.2Astronomy Department, University of Washington, Seattle, Washington.3NASA Astrobiology Institute.4Department of Geosciences, The Pennsylvania State University, University Park, Pennsylvania.
ASTROBIOLOGYVolume 11, Number 5, 2011ª Mary Ann Liebert, Inc.DOI: 10.1089/ast.2010.0509
419

Table 1. List of Reactions in the Photochemical Code, along with the Reaction Rate Constants
Used and a Source for the Reaction Rate Constant
Rxn. # Reaction Reaction rate constant Reference
1 OCS + CH/CO + HCS 1.99$10 - 10 · e - 190/T Zabarnick et al., 19892 OCS + H/CO + HS 9.07$10 - 12 · e - 1940/T Lee et al., 19773 OCS + O/S + CO2 8.3$10 - 11 · e - 5530/T Singleton and Cvetanovic, 19884 OCS + O/SO + CO 2.1$10 - 11 · e - 2200/T Toon et al., 19875 OCS + OH/CO2 + HS 1.1$10 - 13 · e - 1200/T Atkinson et al., 20046 OCS + OH/HS + CO2 1.1$10 - 13 · e - 1200/T Atkinson et al., 20047 OCS + S/CO + S2 1.5$10 - 10 · e - 1830/T Schofield, 19738 OCS + S + M/OCS2 + M 8.3$10 - 33 · den Basco and Pearson, 19679 OCS2 + CO/OCS + OCS 3.0$10 - 12 Zahnle et al., 200610 OCS2 + S/OCS + S2 2.0$10 - 11 Zahnle et al., 200611 C2H6S + CH3/CH4 + C2H4 + HS 6.92$10 - 13 · e - 4610/T Arthur and Lee, 197612 C2H6S + H/C2H5 + H2S 8.49$10 - 12 · e - 1200/T Lam et al., 198913 C2H6S + H/CH3SH + CH3 4.81$10 - 12 · e - 1100/T · (T/300)1.7 Zhang et al., 200514 C2H6S + H/H2 + C2H4 + HS 8.34$10 - 12 · e - 2212/T · (T/300)1.6 Zhang et al., 200515 C2H6S + OH/H2O + C2H4 + HS 1.13$10 - 11 · e - 253/T Atkinson et al., 200416 C2H6S2 + H/CH3SH + CH3S 9.47$10 - 12 · e - 50/T Ekwenchi et al., 198017 CH3 + HS/CH3SH 1.66$10 - 11 Shum and Benson, 198518 CH3S + CH3S/C2H6S2 4.00$10 - 11 Anastasi et al., 199119 CH3S + CO/CH3 + OCS 2.6$10 - 11 · e - 5940/T Assumed same as k(CH3O + CO)20 CH3S + CS/CH3 + CS2 2.6$10 - 11 · e - 5940/T Assumed same as k(CH3O + CO)21 CH3S + H2O2/CH3SH + H2O 3.01$10 - 13 Turnipseed et al., 199622 CH3S + HCS/CH3SH + CS 1.18$10 - 12 · e - 910/T · (T/300)0.65 Liu et al., 200623 CH3S + HS/CH3SH + S 1.66$10 - 11 Assumed same as k(CH3 + HS)24 CH3SH + CH3/CH4 + CH3S 2.99$10 - 31 Kerr and Trotman-Dickenson, 195725 C2H6S + O/CH3 + CH3 + SO 1.30$10 - 11 · e - 410/T · (T/298)1.1 Sander et al., 200626 CH3SH + O/CH3 + HSO 1.30$10 - 11 · e - 410/T · (T/298)1.1 Assumed same as k(C2H6S + O)27 C2H6S2 + O/CH3 + CH3S + SO 3.90$10 - 11 · e290/T · (T/298)1.1 Sander et al., 200628 C2H6SþOH/CH 1
2 þCH3SþH2O 1.10$10 - 11 · e - 240/T · (T/298)1.1 Sander et al., 200629 C2H6S2 + OH/CH3 + CH3SH + SO 6.00$10 - 11 · e400/T · (T/298)1.2 Sander et al., 200630 CH3SH + OH/CH3S + H2O 9.90$10 - 12 · e360/T · (T/298)1.07 Sander et al., 200631 C2H6S + O/CH3 + CH3 + SO 1.30$10 - 11 · e - 410/T · (T/298)1.1 Sander et al., 200632 CH3SH + O/CH3 + HSO 1.30$10 - 11 · e - 410/T · (T/298)1.1 Assumed same as k(C2H6S + O)33 CH3SH + H/CH3 + H2S 1.5$10 - 11 · e - 840/T Amano et al., 198334 CH3SH + H/H2 + CH3S 4.82$10 - 11 · e - 1310/T Amano et al., 198335 CH3SH + OH/H2O + CH3S 9.9$10 - 12 · e360/T DeMore and Yung, 198236 CH + CS2/HCS + CS 3.49$10 - 10 · e - 40/T Zabarnick et al., 198937 CS + HS/CS2 + H 1.5$10 - 13 · (1 + 0.6 · den) Assumed same as k(CO + OH)38 CS + O/CO + S 2.7$10 - 10 · e - 760/T Atkinson et al., 200439 CS + O2/CO + SO 5$10 - 20 Wine et al., 198140 CS + O2/OCS + O 4$10 - 19 Wine et al., 198141 CS + O3/CO + SO2 3$10 - 12 Wine et al., 198142 CS + O3/OCS + O2 3$10 - 12 Wine et al., 198143 CS + O3/SO + CO2 3$10 - 12 Wine et al., 198144 CS2 + O/CO + S2 5.81$10 - 14 Singleton and Cvetanovic, 198845 CS2 + O/OCS + S 3$10 - 12 · e - 650/T Toon et al., 198746 CS2 + O/SO + CS 3.2$10 - 11 · e - 650/T Toon et al., 198747 CS2 + OH/OCS + HS 2$10 - 15 Atkinson et al., 200448 CS2 + S/CS + S2 1.9$10 - 14 · e - 580/T · (T/300)3.97 Woiki and Roth, 199549 CS2 + SO/OCS + S2 2.4$10 - 13 · e - 2370/T Assumed same as k(SO* + O2)50 CS �2 þCS2/CSþCSþ S2 1$10 - 12 Assumed same as k(CS�2þCS2
51 CS �2 þM/CS2þM 2.5$10 - 11 Wine et al., 198152 CS �2 þO2/CSþ SO2 1$10 - 12 Wine et al., 198153 C + HS/CS + H 4$10 - 11 Assumed same as k(C + OH)54 C + S2/CS + S 3.3$10 - 11 Assumed same as k(C + O2)55 C2 + S/C + CS 5$10 - 11 Assumed same as k(C2 + O)56 C2 + S2/CS + CS 1.5$10 - 11 · e - 550/T Assumed same as k(C2 + O2)57 CH + S/CS + H 9.5$10 - 11 Assumed same as k(CH + CS2)58 CH + S2/CS + HS 5.9$10 - 11 Assumed same as k(CH + O2)59 CH 1
2 þ S2/HCSþHS 3$10 - 11 Assumed same as k(CH12þO2)
60 CH3 + HCS/CH4 + CS 8.2$10 - 11 Assumed same as k(CH3 + HCO)61 H + CS + M/HCS + M 2.0$10 - 33 · e - 850/T · den Assumed same as k(H + CO)
(continued)
420 DOMAGAL-GOLDMAN ET AL.

Table 1. (Continued)
Rxn. # Reaction Reaction rate constant Reference
62 H + HCS/H2 + CS 1.2$10 - 10 Assumed same as k(H + HCO)63 HS + CO/OCS + H 4.2$10 - 14 · e - 7650/T Kurbanov and Mamedov, 199564 HS + HCS/H2S + CS 5.0$10 - 11 Assumed same as k(HS + HCO)65 OCS + CH/CO + HCS 1.99$10 - 10 · e - 190/T Zabarnick et al., 198966 S + CO + M/OCS + M 6.5$10 - 33 · e - 2180/T · den Assumed same as k(CO + O)67 S + HCS/H + CS2 1.0$10 - 10 Assumed same as k(O +
HCO/H + CO2)68 S + HCS/HS + CS 5.0$10 - 11 Assumed same as k(O +
HCO/HS + CO)69 2CH 3
2 /C2H2þH2 5.3$10 - 11 Braun et al., 197070 CþH2þM/CH 3
2 þM k0 = 8.75$10 - 31 · e524/T Zahnle, 1986kN = 8.3$10 - 1
71 C + O2/CO + O 3.3$10 - 11 Donovan and Husain, 197072 C + OH/CO + H 4$10 - 11 Giguere and Huebner, 197873 C2 + CH4/C2H + CH3 5.05$10 - 11 · e - 297/T Pitts et al., 198274 C2 + H2/C2H + H 1.77$10 - 10 · e - 1469/T Pitts et al., 198275 C2 + O/C + CO 5$10 - 11 Prasad and Huntress, 198076 C2 + O2/CO + CO 1.5$10 - 11 · e - 550/T Baughcum and Oldenborg, 198477 C2H + C2H2/HCAER + H 1.5$10 - 10 Stephens et al., 198778 C2H + C2H6/C2H2 + C2H5 3.6$10 - 11 Lander et al., 199079 C2H + C3H8/C2H2 + C3H7 1.4$10 - 11 Okabe, 198380 C2H + CH2CCH2/HCAER + H 1.5$10 - 10 Pavlov et al., 200181 C2H + CH4/C2H2 + CH3 6.94$10 - 12 · e - 250/T Allen et al., 1992; Lander et al., 199082 C2H + H + M/C2H2 + M k0 = 2.64$10 - 26 · e - 721/T
· (T/300) - 3.1Tsang and Hampson, 1986
kN = 3.0$10 - 10
83 C2H + H2/C2H2 + H 5.58$10 - 11 · e - 1443/T Allen et al., 1992; Stephens et al., 198784 C2H + O/CO + CH 1$10 - 10 · e - 250/T Zahnle, 198685 C2H + O2/CO + HCO 2$10 - 11 Brown and Laufer, 198186 C2H2 + H + M/C2H3 + M k0 = 2.6$10 - 31 Romani et al., 1993
kN = 8.3$10 - 11 · e - 1374/T
87 C2H2þO/CH 32 þCO 2.9$10 - 11 · e - 1600/T Zahnle, 1986
88 C2H2 + OH + M/C2H2OH + M k0 = 5.5$10 - 30 Sander et al., 2006kN = 8.3$10 - 13 · (T/300)- 2
89 C2H2 + OH + M/CH2CO + H + M k0 = 5.8$10 - 31 · e1258/T Perry and Williamson, 1982kN = 1.4$10 - 12 · e388/T
90 C2H2 + OH/CO + CH3 2$10 - 12 · e - 250/T Hampson and Garvin, 197791 C2H2OH + H/H2 + CH2CO 3.3$10 - 11 · e - 2000/T Miller et al., 198292 C2H2OH + H/H2O + C2H2 5$10 - 11 Miller et al., 198293 C2H2OH + O/OH + CH2CO 3.3$10 - 11 · e - 2000/T Miller et al., 198294 C2H2OH + OH/H2O + CH2CO 1.7$10 - 11 · e - 1000/T Miller et al., 198295 C2H3 + C2H3/C2H4 + C2H2 2.4$10 - 11 Fahr et al., 199196 C2H3 + C2H5/C2H4 + C2H4 3$10 - 12 Laufer et al., 198397 C2H3 + C2H5 + M/CH3 + C3H5 + M k0 = 1.9$10 - 27 Romani et al., 1993
kN = 2.5$10 - 11
98 C2H3 + C2H6/C2H4 + C2H5 3$10 - 13 · e - 5170/T Kasting et al., 198399 C2H3 + CH3/C2H2 + CH4 34$10 - 11 Fahr et al., 1991100 C2H3 + CH3 + M/C3H6 + M k0 = 1.3$10 - 22 Raymond et al., 2006
kN = 1.2$10 - 10
101 C2H3 + CH4/C2H4 + CH3 2.4$10 - 24 · e - 2754/T · T4.02 Tsang and Hampson, 1986102 C2H3 + H/C2H2 + H2 3.3$10 - 11 Warnatz, 1984103 C2H3 + H2/C2H4 + H 2.6$10 - 13 · e - 2646/T Allen et al., 1992104 C2H3 + O/CH2CO + H 5.5$10 - 11 Hoyermann et al., 1981105 C2H3 + OH/C2H2 + H2O 8.3$10 - 12 Benson and Haugen, 1967106 C2H4 + H + M/C2H5 + M k0 = 2.15$10 - 29 · e - 349/T Lightfoot and Pilling, 1987
kN = 4.95$10 - 11 · e - 1051/T
107 C2H4 + O/HCO + CH3 5.5$10 - 12 · e - 565/T Hampson and Garvin, 1977108 C2H4 + OH + M/C2H4OH + M k0 = 1.0$10 - 28 · (T/300)4.5 Sander et al., 2006
kN = 8.8$10 - 12 · (T/300)0.85
109 C2H4 + OH/H2CO + CH3 2.2$10 - 12 · e385/T Hampson and Garvin, 1977110 C2H4OH + H/H2 + CH3CHO 3.3$10 - 11 · e - 2000/T Zahnle and Kasting, 1986111 C2H4OH + H/H2O + C2H4 5$10 - 11 Miller et al., 1982
(continued)
REMOTE SULFUR BIOSIGNATURES FOR ANOXIC PLANETS 421

Table 1. (Continued)
Rxn. # Reaction Reaction rate constant Reference
112 C2H4OH + O/OH + CH3CHO 3.3$10 - 11 · e - 2000/T Zahnle and Kasting, 1986113 C2H4OH + OH/H2O + CH3CHO 1.7$10 - 11 · e - 1000/T Zahnle and Kasting, 1986114 C2H5 + C2H3/C2H6 + C2H2 6$10 - 12 Laufer et al., 1983115 C2H5 + C2H5/C2H6 + C2H4 2.3$10 - 12 Tsang and Hampson, 1986116 C2H5 + CH3/C2H4 + CH4 1.88$10 - 12 · (T/300)- 0.5 Romani et al., 1993117 C2H5 + CH3 + M/C3H8 + M k0 = 3.9$10 - 10 · (T/300)2.5 Romani et al., 1993
kN = 1.4$10 - 8 · (T/300)0.5
118 C2H5 + H/C2H4 + H2 3$10 - 12 Tsang and Hampson, 1986119 C2H5 + H + M/C2H6 + M k0 = 5.5$10 - 23 · e - 1040/T Gladstone et al., 1996
kN = 1.5$10 - 10
120 C2H5 + H/CH3 + CH3 7.95$10 - 11 Gladstone et al., 1996121 C2H5 + HCO/C2H6 + CO 5$10 - 11 Pavlov et al., 2001122 C2H5 + HNO/C2H6 + NO 3$10 - 14 Pavlov et al., 2001123 C2H5 + O/CH3 + HCO + H 1.1$10 - 10 Pavlov et al., 2001124 C2H5 + O/CH3CHO + H 1.33$10 - 10 Tsang and Hampson, 1986125 C2H5 + O2 + M/CH3 +
HCO + OH + Mk0 = 1.5$10 - 28 · (T/300)3.0 Sander et al., 2006
kN = 8$10 - 12
126 C2H5 + OH/CH3CHO + H2 1$10 - 10 Pavlov et al., 2001127 C2H5 + OH/C2H4 + H2O 4.0$10 - 11 Pavlov et al., 2001128 C2H6 + O/C2H5 + OH 8.62$10 - 12 · e - 2920/T · (T/300)1.5 Baulch et al., 1994129 C2H6 + O1D/C2H5 + OH 6.29$10 - 10 Matsumi et al., 1993130 C2H6 + OH/C2H5 + H2O 8.54$10 - 12 · e - 1070/T Sander et al., 2006131 C3H2 + H + M/C3H3 + M k0 = 1.7$10 - 26 Yung et al., 1984
kN = 1.5$10 - 10
132 C3H3 + H + M/CH2CCH2 + M k0 = 1.7$10 - 26 Yung et al., 1984kN = 1.5$10 - 10
133 C3H3 + H + M/CH3C2H + M k0 = 1.7$10 - 26 Yung et al., 1984kN = 1.5$10 - 10
134 C3H5 + CH3/CH2CCH2 + CH4 4.5$10 - 12 Yung et al., 1984135 C3H5 + CH3/CH3C2H + CH4 4.5$10 - 12 Yung et al., 1984136 C3H5 + H + M/C3H6 + M k0 = 1.0$10 - 28 Yung et al., 1984
kN = 1.0$10 - 11
137 C3H5 + H/CH2CCH2 + H2 1.5$10 - 11 Yung et al., 1984138 C3H5 + H/CH3C2H + H2 1.5$10 - 11 Yung et al., 1984139 C3H5 + H/CH4 + C2H2 1.5$10 - 11 Yung et al., 1984140 C3H6 + H + M/C3H7 + M k0 = 2.15$10 - 29 · e - 349/T Pavlov et al., 2001
kN = 4.95$10 - 11 · e - 1051/T Assumed same as k(C2H4 + H)141 C3H6 + O/CH3 + CH3CO 4.1$10 - 12 · e - 38/T Hampson and Garvin, 1977142 C3H6 + OH/CH3CHO + CH3 4.1$10 - 12 · e540/T Hampson and Garvin, 1977143 C3H7 + CH3/C3H6 + CH4 2.5$10 - 12 · e - 200/T Yung et al., 1984144 C3H7 + H/CH3 + C2H5 7.95$10 - 11 · e - 127/T Pavlov et al., 2001145 C3H7 + O/C2H5CHO + H 1.1$10 - 10 Pavlov et al., 2001146 C3H7 + OH/C2H5CHO + H2 1.1$10 - 10 Pavlov et al., 2001147 C3H8 + O + M/C3H7 + OH + M k0 = 1.6$10 - 11 · e - 2900/T Hampson and Garvin, 1977
kN = 2.2$10 - 11 · e - 2200/T
148 C3H8 + O1D/C3H7 + OH 1.4$10 - 10 Pavlov et al., 2001149 C3H8 + OH/C3H7 + H2O 8.6$10 - 12 · e - 615/T Sander et al., 2006150 CH + C2H2 + M/C3H2 + H + M k0 = 2.15$10 - 29 · e - 349/T Romani et al., 1993
kN = 4.95$10 - 11 · e - 1051/T
151 CH + C2H4 + M/CH2CCH2 + H + M k0 = 1.75$10 - 10 · e61/T Romani et al., 1993kN = 5.3$10 - 10
152 CH + C2H4 + M/CH3C2H + H + M k0 = 1.75$10 - 10 · e61/T Romani et al., 1993kN = 5.3$10 - 10
153 CH + CH4 + M/C2H4 + H + M k0 = 2.5$10 - 11 · e200/T Romani et al., 1993kN = 1.7$10 - 10
154 CH + CO2/HCO + CO 5.9$10 - 12 · e - 350/T Berman et al., 1982155 CH + H/C + H2 1.4$10 - 11 Becker et al., 1989156 CHþH2/CH 3
2 þH 2.38$10 - 10 · e - 1760/T Zabarnick et al., 1986157 CH + H2 + M/CH3 + M k0 = 8.75$10 - 31 · e524/T Romani et al., 1993
kN = 8.3$10 - 11
158 CH + O/CO + H 9.5$10 - 11 Messing et al., 1981
(continued)
422 DOMAGAL-GOLDMAN ET AL.

Table 1. (Continued)
Rxn. # Reaction Reaction rate constant Reference
159 CH + O2/CO + OH 5.9$10 - 11 Butler et al., 1981160 CH 1
2 þCH4/CH3þCH3 7.14$10 - 12 · e - 5050/T Bohland et al., 1985161 CH 1
2 þCO2/H2COþCO 1$10 - 12 Zahnle, 1986162 CH 1
2 þH2/CH 32 þH2 1.26$10 - 11 Romani et al., 1993
163 CH 12 þH2/CH3þH 5$10 - 15 Tsang and Hampson, 1986
164 CH 12 þM/CH 3
2 þM 8.8$10 - 12 Ashfold et al., 1981165 CH 1
2 þO2/HCOþOH 3$10 - 11 Ashfold et al., 1981166 CH 3
2 þC2H2þM/CH2CCH2þM k0 = 3.8$10 - 25 Laufer, 1981; Laufer et al., 1983kN = 3.7$10 - 12
167 CH 32 þC2H2þM/CH3C2HþM k0 = 3.8$10 - 25 Laufer, 1981; Laufer et al., 1983
kN = 2.2$10 - 12
168 CH 32 þC2H3/CH3þC2H2 3$10 - 11 Tsang and Hampson, 1986
169 CH 32 þC2H5/CH3þC2H4 3$10 - 11 Tsang and Hampson, 1986
170 CH 32 þCH3/C2H4þH 7$10 - 11 Tsang and Hampson, 1986
171 CH 32 þCOþM/CH2COþM k0 = 1.0$10 - 28 Yung et al., 1984
kN = 1.0$10 - 15
172 CH 32 þCO2/H2COþCO 3.9$10 - 14 Laufer, 1981
173 CH 32 þH/CHþH2 4.7$10 - 10 · e - 370/T Zabarnick et al., 1986
174 CH 32 þHþM/CH3þM k0 = 3.1$10 - 30 · e457/T Gladstone et al., 1996
kN = 1.5$10 - 10
175 CH 32 þO/CHþOH 8$10 - 12 Huebner and Giguere, 1980
176 CH 32 þO/COþHH 8.3$10 - 11 Homann and Wellmann, 1983
177 CH 32 þO/HCOþH 1$10 - 11 Huebner and Giguere, 1980
178 CH 32 þO2/HCOþOH 4.1$10 - 11 · e - 750/T Baulch et al., 1994
179 CH2CCH2 + H/C3H5 k0 = 8.9$10 - 29 · e - 1225/T · (T/300)- 2.0 Yung et al., 1984kN = 1.4$10 - 11 · e - 1000/T
180 CH2CCH2 + H/CH3 + C2H2 k0 = 8.9$10 - 29 · e - 1225/T · (T/300)- 2.0 Yung et al., 1984kN = 9.7$10 - 13 · e - 1550/T
181 CH2CCH2 + H/CH3C2H + H 1$10 - 11 · e - 1000/T Yung et al., 1984182 CH2CO + H/CH3 + CO 1.9$10 - 11 · e - 1725/T Michael et al., 1979183 CH2CO + O/H2CO + CO 3.3$10 - 11 Lee, 1980; Miller et al., 1982184 CH3 + C2H3/C3H5 + H 2.4$10 - 13 Romani et al., 1993185 CH3 + CH3 + M/C2H6 + M k0 = 4.0$10 - 24 · e - 1390/T · (T/300)- 7.0 Wagner and Wardlaw, 1988
kN = 1.79$10 - 10 · e - 329/T
186 CH3 + CO + M/CH3CO + M 1.4$10 - 32 · e - 3000/T · den Watkins and Word, 1974187 CH3 + H + M/CH4 + M k0 = 6.0$10 - 28 · (T/298) - 1.80 Baulch et al., 1994;
Tsang and Hampson, 1986kN = 2.0$10 - 10 · (T/298) - 0.40
188 CH3 + H2CO/CH4 + HCO 1.60$10 - 16 · e899/T · (T/298)6.10 Baulch et al., 1994189 CH3 + HCO/CH4 + CO 2.01$10 - 10 Tsang and Hampson, 1986190 CH3 + HNO/CH4 + NO 1.85$10 - 11 · e - 176/T · (T/298)0.6 Choi and Lin, 2005191 CH3 + O/H2CO + H 1.1$10 - 10 Sander et al., 2006192 CH3 + O2/H2CO + OH k0 = 4.0$10 - 31 · (T/300) - 3.6 Sander et al., 2006
kN = 1.2$10 - 12 · (T/300) - 1.1
193 CH3 + O3/H2CO + HO2 5.4$10 - 12 · e - 220/T Sander et al., 2006194 CH3 + OH/CH3O + H 9.3$10 - 11 · e - 1606/T · (T/298) Jasper et al., 2007195 CH3 + OH/CO + H2 + H2 6.7$10 - 12 Fenimore, 1969196 CH3C2H + H + M/C3H5 + M k0 = 8.88$10 - 29 · e - 1225/T · (T/300)- 2 Yung et al., 1984
kN = 9.7$10 - 12 · e - 1550/T
197 CH3C2H + H/CH3 + C2H2 k0 = 8.88$10 - 29 · e - 1225/T · (T/300)- 2 Whytock et al., 1976kN = 9.7$10 - 12 · e - 1550/T
198 CH3CHO + CH3/CH3CO + CH4 2.8$10 - 11 · e - 1540/T Zahnle, 1986199 CH3CHO + H/CH3CO + H2 2.8$10 - 11 · e - 1540/T Zahnle, 1986200 CH3CHO + O/CH3CO + OH 5.8$10 - 13 Washida, 1981201 CH3CHO + OH/CH3CO + H2O 1.6$10 - 11 Niki et al., 1978202 CH3CO + CH3/C2H6 + CO 5.4$10 - 11 Adachi et al., 1981203 CH3CO + CH3/CH4 + CH2CO 8.6$10 - 11 Adachi et al., 1981204 CH3CO + H/CH4 + CO 1$10 - 10 Zahnle, 1986205 CH3CO + O/H2CO + HCO 5$10 - 11 Zahnle, 1986206 CH3O + CO/CH3 + CO2 2.6$10 - 11 · e - 5940/T Wen et al., 1989207 CH3O2 + H/CH4 + O2 1.6$10 - 10 Tsang and Hampson, 1986208 CH3O2 + H/H2O + H2CO 1$10 - 11 Zahnle et al., 2006
(continued)
REMOTE SULFUR BIOSIGNATURES FOR ANOXIC PLANETS 423

Table 1. (Continued)
Rxn. # Reaction Reaction rate constant Reference
209 CH3O2 + O/H2CO + HO2 1$10 - 11 Vaghjiani and Ravishankara, 1990210 CH4 + HS/CH3 + H2S 2.99$10 - 31 Kerr and Trotman-Dickenson, 1957211 CH4 + O/CH3 + OH 8.75$10 - 12 · e - 4330/T · (T/298)1.5 Tsang and Hampson, 1986212 CH4 + O1D/CH3 + OH 1.28$10 - 10 Sander et al., 2006213 CH4 + O1D/H2CO + H2 2.25$10 - 11 Sander et al., 2006214 CH4 + OH/CH3 + H2O 2.45$10 - 12 · e - 1775/T Sander et al., 2006215 CO + O + M/CO2 + M 1.7$10 - 33 · e - 1515/T · den Tsang and Hampson, 1986216 CO + OH/CO2 + H 1.5$10 - 13 · (1 + 0.6 · den) Sander et al., 2006217 H + CO + M/HCO + M 5.29$10 - 34 · e - 100/T · den Baulch et al., 1994218 H + H + M/H2 + M 8.85$10 - 33 · (T/298) - 0.6 · den Baulch et al., 1994219 H + HCO/H2 + CO 1.5$10 - 10 Baulch et al., 1992220 H + HNO/H2 + NO 3.01$10 - 11 · e500/T Tsang and Herron, 1991221 H + HO2/H2 + O2 6.9$10 - 12 Sander et al., 2006222 H + HO2/H2O + O 1.62$10 - 12 Sander et al., 2006223 H + HO2/OH + OH 7.29$10 - 11 Sander et al., 2006224 H + NO + M/HNO + M 2.1$10 - 32 · (T/298)1.00 · den Hampson and Garvin, 1977225 H + O2 + M/HO2 + M 5.7$10 - 32 · 7.5$10 - 11 · (T/298)1.6 Sander et al., 2006226 H + O3/OH + O2 1.4$10 - 10 · e - 470/T Sander et al., 2006227 H + OH + M/H2O + M 6.8$10 - 31 · (T/300) - 2 · den McEwan and Phillips, 1975228 H + SO + M/HSO + M k0 = 5.7$10 - 32 · (T/298)1.6 Kasting, 1990
kN = 7.5$10 - 11
229 H2 + O/OH + H 1.34$10 - 15 · e - 1460/T · (T/298)6.52 Robie et al., 1990230 H2 + O1D/OH + H 1.1$10 - 11 Sander et al., 2006231 H2 + OH/H2O + H 5.5$10 - 12 · e - 2000/T Sander et al., 2006232 H2CO + H/H2 + HCO 2.14 - 12 · e - 1090/T · (T/298)1.62 Baulch et al., 1994233 H2CO + O/HCO + OH 3.4$10 - 11 · e - 1600/T Sander et al., 2006234 H2CO + OH/H2O + HCO 5.5$10 - 12 · e125/T Sander et al., 2006235 H2O + O1D/OH + OH 2.2$10 - 10 Sander et al., 2006236 H2O2 + O/OH + HO2 1.4$10 - 12 · e - 2000/T Sander et al., 2006237 H2O2 + OH/HO2 + H2O 2.9$10 - 12 · e - 160/T Sander et al., 2006238 H2S + H/H2 + HS 3.66$10 - 12 · e - 455/T · (T/298)1.94 Peng et al., 1999239 H2S + O/OH + HS 9.2$10 - 12 · e - 1800/T Sander et al., 2006240 H2S + OH/H2O + HS 6.0$10 - 12 · e - 70/T Sander et al., 2006241 HCO + H + M/CO + M 6.0$10 - 11 · e - 7721/T · den Krasnoperov et al., 2004242 HCO + H2CO/CH3O + CO 3.8$10 - 17 Wen et al., 1989243 HCO + HCO/H2CO + CO 3.0$10 - 11 Tsang and Hampson, 1986244 HCO + NO/HNO + CO 1.2$10 - 11 Tsang and Hampson, 1986245 HCO + O2/HO2 + CO 5.2$10 - 12 Sander et al., 2006246 HNO + NO + M/H + M 1.04$10 - 6 · e25618/T · (T/298)- 1.61 · den Tsang and Hampson, 1986247 HNO2 + OH/H2O + NO2 1.8$10 - 11 · e - 390/T Sander et al., 2006248 HNO3 + OH/H2O + NO2 + O 7.2$10 - 15 · e - 785/T + Sander et al., 2006
(1.9$10 - 33 · e725/T · den)/(1 + 4.6$10 - 16 · e - 715/T · den)
249 HO2 + HO2/H2O2 + O2 k0 = 2.3$10 - 13 · e590/T Sander et al., 2006kN = 1.7$10 - 33 · e1000/T
250 HO2 + O/OH + O2 3.0$10 - 11 · e200/T Sander et al., 2006251 HO2 + O3/OH + O2 + O2 1.1$10 - 14 · e - 490/T Sander et al., 2006252 HS + H/H2 + S 3.0$10 - 11 Schofield, 1973253 HS + H2CO/H2S + HCO 1.7$10 - 11 · e - 800/T Sander et al., 2006254 HS + HCO/H2S + CO 5.0$10 - 11 Kasting, 1990255 HS + HO2/H2S + O2 1.0$10 - 11 Stachnik and Molina, 1987256 HS + HS/H2S + S 1.5 - 11 Schofield, 1973257 HS + NO2/HSO + NO 2.9$10 - 11 · e240/T Sander et al., 2006258 HS + O/H + SO 1.6$10 - 10 Sander et al., 2006259 HS + O2/OH + SO 4.0$10 - 19 Sander et al., 2006260 HS + O3/HSO + O2 9.0$10 - 12 · e - 280/T Sander et al., 2006261 HS + S/H + S2 2.2$10 - 11 · e - 120/T Kasting, 1990262 HSO + H/H2 + SO 6.48$10 - 12 Sander et al., 2006263 HSO + H/HS + OH 7.29$10 - 11 Sander et al., 2006264 HSO + HS/H2S + SO 1$10 - 12 Kasting, 1990265 HSO + NO/HNO + SO 1.0$10 - 15 Atkinson et al., 2004266 HSO + O/OH + SO 3.0$10 - 11 · e - 200/T Kasting, 1990
(continued)
424 DOMAGAL-GOLDMAN ET AL.

Table 1. (Continued)
Rxn. # Reaction Reaction rate constant Reference
267 HSO + OH/H2O + SO 5.2$10 - 12 Sander et al., 2006268 HSO + S/HS + SO 1$10 - 11 Kasting, 1990269 HSO3 + H/H2 + SO3 1.0$10 - 11 Kasting, 1990270 HSO3 + O/OH + SO3 1.0$10 - 11 Kasting, 1990271 HSO3 + O2/HO2 + SO3 1.3$10 - 12 · e - 330/T Sander et al., 2006272 HSO3 + OH/H2O + SO3 1.0$10 - 11 Kasting, 1990273 N + NO/N2 + O 2.1$10 - 11 · e - 100/T Sander et al., 2006274 N + O2/NO + O 1.5$10 - 12 · e - 3600/T Sander et al., 2006275 N + OH/NO + H 3.8$10 - 11 · e85/T Atkinson et al., 1989276 N2H3 + H/NH2 + NH2 2.7$10 - 12 Gehring et al., 1971277 N2H3 + N2H3/N2H4 + N2 + H2 6$10 - 11 Kuhn and Atreya, 1979278 N2H4 + H/N2H3 + H2 9.9$10 - 12 · e - 1200/T Stief and Payne, 1976279 NH + H + M/NH2 + M (6$10 - 30 · den)/(1 + 3$10 - 20 · den) Kasting, 1982280 NH + NO/N2 + OH 4.9$10 - 11 Sander et al., 2006281 NH + O/N + OH 1$10 - 11 Kasting, 1982282 NH + O/NH2 + CO 1$10 - 11 Pavlov et al., 2001283 NH2 + H + M/NH3 + M (6$10 - 30 · den)/(1 + 3$10 - 20 · den) Gordon et al., 1971284 NH2 + HCO/NH3 + CO 1$10 - 11 Pavlov et al., 2001285 NH2 + NH2/N2H4 1$10 - 10 Gordon et al., 1971286 NH2 + NO/N2 + H2O 3.8$10 - 12 · e450/T Sander et al., 2006287 NH2 + O/HNO + H 5$10 - 12 Albers et al., 1969288 NH2 + O/NH + OH 5$10 - 12 Albers et al., 1969289 NH�2þH2/NH3þH 3$10 - 11 Kasting, 1982290 NH�2þM/NH2þM 3$10 - 11 Kasting, 1982291 NH3 + O1D/NH2 + OH 2.5$10 - 10 Sander et al., 2006292 NH3 + OH/NH2 + H2O 1.7$10 - 12 · e - 710/T Sander et al., 2006293 NO + HO2/NO2 + OH 3.5$10 - 12 · e250/T Sander et al., 2006294 NO + O + M/NO2 + M 9$10 - 31 · 3$10 - 11 · (T/298)1.5 Sander et al., 2006295 NO + O3/NO2 + O2 2.0$10 - 12 · e - 1400/T Sander et al., 2006296 NO + OH + M/HNO2 + M k0 = 7$10 - 31 · (T/298)2.6 Sander et al., 2006
kN = 3.6$10 - 11 · (T/298)0.1
297 NO2 + H/NO + OH 4$10 - 10 · e - 340/T Sander et al., 2006298 NO2 + O/NO + O2 5.6$10 - 12 · e180/T Sander et al., 2006299 NO2 + OH + M/HNO3 + M k0 = 2.0$10 - 30 · (T/298)3.0 Sander et al., 2006
kN = 2.5$10 - 11
300 O + HCO/H + CO2 5.0$10 - 11 Tsang and Hampson, 1986301 O + HCO/OH + CO 1.0$10 - 10 Hampson and Garvin, 1977302 O + HNO/OH + NO 5.99$10 - 11 Tsang and Hampson, 1986303 O + O + M/O2 + M 9.46$10 - 34 · e480/T · den Campbell and Gray, 1973304 O + O2 + M/O3 + M 6$10 - 34 · 3$10 - 11 · (T/298)2.40 Sander et al., 2006305 O + O3/O2 + O2 8.0$10 - 12 · e - 2060/T Sander et al., 2006306 O1D + M/O + M 1.8$10 - 11 · e110/T Sander et al., 2006307 O1D + O2/O + O2 3.2$10 - 11 · e70/T Sander et al., 2006308 OH + HCO/H2O + CO 1.7$10 - 10 Baulch et al., 1992309 OH + HNO/H2O + NO 5$10 - 11 Sun et al., 2001310 OH + HO2/H2O + O2 4.8$10 - 11 · e250/T Sander et al., 2006311 OH + O/H + O2 2.2$10 - 11 · e120/T Sander et al., 2006312 OH + O3/HO2 + O2 1.6$10 - 12 · e - 940/T Sander et al., 2006313 OH + OH/H2O + O 4.2$10 - 12 · e - 240/T Sander et al., 2006314 OH + OH/H2O2 6.9$10 - 31 · 1.5$10 - 11 · (T/298)0.80 Sander et al., 2006315 S + CO2/SO + CO 1.0$10 - 20 Yung and Demore, 1982316 S + HCO/HS + CO 5.0$10 - 11 Kasting, 1990317 S + HO2/HS + O2 1.5$10 - 11 Kasting, 1990318 S + HO2/SO + OH 1.5$10 - 11 Kasting, 1990319 S + O2/SO + O 2.3$10 - 12 Sander et al., 2006320 S + O3/SO + O2 1.2$10 - 11 Sander et al., 2006321 S + OH/SO + H 6.6$10 - 11 Sander et al., 2006322 S + S + M/S2 + M 1.98$10 - 33 · e - 206/T · den Du et al., 2008323 S + S2 + M/S3 + M 2.8$10 - 32 · den Kasting, 1990324 S + S3 + M/S4 + M 2.8$10 - 31 · den Kasting, 1990325 S2 + O/S + SO 1.1$10 - 11 Hills et al., 1987326 S2 + S2 + M/S4 + M 2.8$10 - 31 · den Baulch et al., 1976
(continued)
REMOTE SULFUR BIOSIGNATURES FOR ANOXIC PLANETS 425

Table 1. (Continued)
Rxn. # Reaction Reaction rate constant Reference
327 S4 + S4 + M/S8AER + M 2.8$10 - 31 · den Kasting, 1990328 SO + HCO/HSO + CO 5.6$10 - 12 · (T/298)- 0.4 Kasting, 1990329 SO + HO2/SO2 + OH 2.8$10 - 11 Kasting, 1990330 SO + NO2/SO2 + NO 1.4$10 - 11 Sander et al., 2006331 SO + O + M/SO2 + M 6.0$10 - 31 · den Sander et al., 2006332 SO + O2/O + SO2 2.4$10 - 13 · e - 2370/T Sander et al., 2006333 SO + O3/SO2 + O2 4.5$10 - 12 · e - 1170/T Atkinson et al., 2004334 SO + OH/SO2 + H 8.6$10 - 11 Sander et al., 2006335 SO + SO/SO2 + S 3.5$10 - 15 Martinez and Herron, 1983336 SO2 + HO2/SO3 + OH 8.63$10 - 16 Lloyd, 1974337 SO2 + O + M/SO3 + M k0 = 1.3$10 - 33 · (T/298)- 3.6 Sander et al., 2006
kN = 1.5$10 - 11
338 SO2 + OH + M/HSO3 + M k0 = 3$10 - 31 · (T/298)3.3 Sander et al., 2006kN = 1.5$10 - 12
339 SO 12 þM/SO2þM 1.0$10 - 11 Turco et al., 1982
340 SO 12 þM/SO 3
2 þM 1.0$10 - 12 Turco et al., 1982341 SO 1
2 þO2/SO3þO 1.0$10 - 16 Turco et al., 1982342 SO 1
2 þ SO2/SO3þ SO 4.0$10 - 12 Turco et al., 1982343 SO 3
2 þM/SO2þM 1.5$10 - 13 Turco et al., 1982344 SO 3
2 þ SO2/SO3þ SO 7.0$10 - 14 Turco et al., 1982345 SO3 + H2O/H2SO4 1.2$10 - 15 Sander et al., 2006346 SO3 + SO/SO2 + SO2 2.0$10 - 15 Chung et al., 1975347 SO 1
2 þ h�/SO2þ h� 2.2$10 + 4 Turco et al., 1982348 SO 1
2 þ h�/SO 32 þ h� 1.5$10 + 3 Turco et al., 1982
349 SO 32 þ h�/SO2þ h� 1.13$10 + 3 Turco et al., 1982
350 O2 + hm/O + O1D 1.51$10 + 02
351 O2 + hm/O + O 2.90$10 + 00
352 H2O + hm/H + OH 1.65$10 - 01
353 O3 + hm/O2 + O1D 6.44$10 - 04
354 O3 + hm/O2 + O 1.64$10 - 04
355 H2O2 + hm/OH + OH 2.79$10 - 14
356 CO2 + hm/CO + O 2.50$10 + 01
357 H2CO + hm/H2 + CO 7.71$10 - 01
358 H2CO + hm/HCO + H 9.33$10 - 01
359 CO2 + hm/CO + O1D 2.73$10 + 03
360 HO2 + hm/OH + O 0.00$10 + 00
361 CH4þ h�/CH 12 þH2 1.75$10 + 00
362 C2H6þ h�/CH 32 þCH 3
2 þH2 0.00
363 C2H6þ h�/CH4þCH 12 1.48$10 - 05
364 HNO2 + hm/NO + OH 8.68$10 - 22
365 HNO3 + hm/NO2 + OH 2.74$10 - 28
366 NO + hm/N + O 2.04$10 - 10
367 NO2 + hm/NO + O 4.40$10 - 14
368 CH3þ h�/CH 12 þH 6.67$10 - 04
369 SO + hm/S + O 0.00$10 + 00
370 SO2 + hm/SO + O 1.37$10 - 10
371 H2S + hm/HS + H 1.00$10 - 23
372 SO2þ h�/SO 12 1.52$10 - 09
373 SO2þ h�/SO 32 8.14$10 - 13
374 S2 + hm/S + S 5.94$10 - 42
375 S2 + hm/S2 0.00$10 + 00
376 H2SO4 + hm/SO2 + OH + OH 1.66$10 - 13
377 SO3 + hm/SO2 + O 0.00$10 + 00
378 SO 12 þ h�/SO 3
2 þ h� 9.70$10 - 11
379 SO 12 þ h�/SO2þ h� 1.42$10 - 09
380 SO 32 þ h�/SO2þ h� 9.78$10 - 11
381 HSO + hm/HS + O 7.19$10 - 17
382 S4 + hm/S2 + S2 0.00$10 + 00
383 S3 + hm/S2 + S 4.22$10 - 72
384 NH3 + hm/NH2 + H 6.00$10 - 34
385 N2H4 + hm/N2H3 + H 9.75$10 - 93
386 NH + hm/N + H 3.99$10 - 35
(continued)
426 DOMAGAL-GOLDMAN ET AL.

O2/O3 should not be taken as evidence that life does notexist on a planet’s surface.
Furthermore, some planets and biospheres will not exhibitthe more general feature of photochemical disequilibriumpreviously proposed as a universal biosignature (Lederberg,1965; Lovelock, 1965; Des Marais et al., 2002). Unlike Earth’smodern-day ecosystem, global anoxic ecosystems may drivean atmosphere toward equilibrium. For example, in the an-oxic Archean biospheres considered by Kharecha et al. (2005),methanogens and acetogens combine H2 and CO with CO2
and H2O to produce CH4. They can make a metabolic livingby doing this because CH4 has a lower Gibbs free energy andhence is thermodynamically stable in such a system. Thebiogenic gases released from such a biosphere result from adrive toward equilibrium, not disequilibrium. Because caseslike these could complicate interpretation, it is important toidentify additional biosignature gases that might be signs of
anoxic biospheres. In this paper, we test the ability of variousgases with carbon-sulfur bonds to act as remotely detectablebiosignatures for anoxic, inhabited surface environments.
The biosignature potential of S-bearing gases was re-viewed by Pilcher (2003), who focused on gases with bondsbetween methyl groups (- CH3) and sulfur: methanethiol(CH3SH, also known as methyl mercaptan), dimethyl sulfide(CH3SCH3 or DMS), and dimethyl disulfide (CH3S2CH3 orDMDS). More recently, Vance et al. (2011) suggested thatCH3SH could be used as an in situ signature for life on Mars.On modern Earth, the production of these species is domi-nated by biota, but they are rapidly destroyed by photolysisand by reaction with hydroxyl (OH) radicals (Kettle et al.,2001), and do not build up to concentrations detectableacross interstellar distances. In this work, we consider thesegases, along with carbon disulfide (CS2) and carbonyl sulfide(OCS, sometimes abbreviated in other work as COS), two
Table 1. (Continued)
Rxn. # Reaction Reaction rate constant Reference
387 NH2 + hm/NH + H 7.49$10 - 37
388 NH2þ h�/NH �2 3.99$10 - 35
389 NH �2 þ h�/NH2þ h� 3.99$10 - 35
390 C2H2 + hm/C2H + H 5.51$10 - 07
391 C2H2 + hm/C2 + H2 4.09$10 - 07
392 C2H4 + hm/C2H2 + H2 5.51$10 - 07
393 C3H8 + hm/C3H6 + H2 1.45$10 - 12
394 C3H8þ h�/C2H6þCH 12 2.49$10 - 13
395 C3H8 + hm/C2H4 + CH4 1.08$10 - 12
396 C3H8 + hm/C2H5 + CH3 5.88$10 - 13
397 C2H6 + hm/C2H2 + H2 + H2 1.80$10 - 05
398 C2H6 + hm/C2H4 + H + H 1.93$10 - 05
399 C2H6 + hm/C2H4 + H2 5.29$10 - 07
400 C2H6 + hm/CH3 + CH3 4.79$10 - 06
401 C2H4 + hm/C2H2 + H + H 5.29$10 - 07
402 C3H6 + hm/C2H2 + CH3 + H 5.26$10 - 16
403 CH4þ h�/CH 32 þHþH 1.42$10 + 00
404 CH4 + hm/CH3 + H 2.91$10 + 00
405 CH + hm/C + H 9.52$10 - 06
406 CH2COþ h�/CH 32 þCO 8.21$10 - 10
407 CH3CHO + hm/CH3 + HCO 1.14$10 - 08
408 CH3CHO + hm/CH4 + CO 1.14$10 - 08
409 C2H5CHO + hm/C2H5 + HCO 6.42$10 - 07
410 C3H3 + hm/C3H2 + H 6.88$10 - 07
411 CH3C2H + hm/C3H3 + H 6.42$10 - 07
412 CH3C2H + hm/C3H2 + H2 2.41$10 - 07
413 CH3C2H + hm/CH3 + C2H 3.21$10 - 08
414 CH2CCH2 + hm/C3H3 + H 6.49$10 - 13
415 CH2CCH2 + hm/C3H2 + H2 2.43$10 - 13
416 CH2CCH2þ h�/C2H2þCH 32 9.73$10 - 14
417 C3H6 + hm/CH2CCH2 + H2 8.81$10 - 16
418 C3H6þ h�/C2H4þCH 32 3.09$10 - 17
419 C3H6 + hm/C2H + CH4 + H 1.43$10 - 10
420 OCS + hm/CO + S 2.67$10 - 36
421 CS2 + hm/CS + S 5.40$10 - 47
422 CH3SH + hm/H + CH3S 1.48$10 - 30
423 CH3SH + hm/HS + CH3 1.11$10 - 31
424 C2H6S + hm/CH3S + CH3 4.01$10 - 93
425 C2H6S2 + hm/CH3S + CH3S 1.65$10 - 34
426 CS2þ h�/CS �2 6.57$10 - 48
For photolysis reactions (bottom of table), the ‘‘Reaction rate constant’’ column shows the reaction rate (not the rate constant) at the top ofthe atmosphere during our ‘‘standard’’ simulation, the modern-day fluxes of CH4, H2S, and the Sorg species on a planet orbiting the Sun. Formore on how to calculate reaction rates, see Sander et al. (2006).
REMOTE SULFUR BIOSIGNATURES FOR ANOXIC PLANETS 427

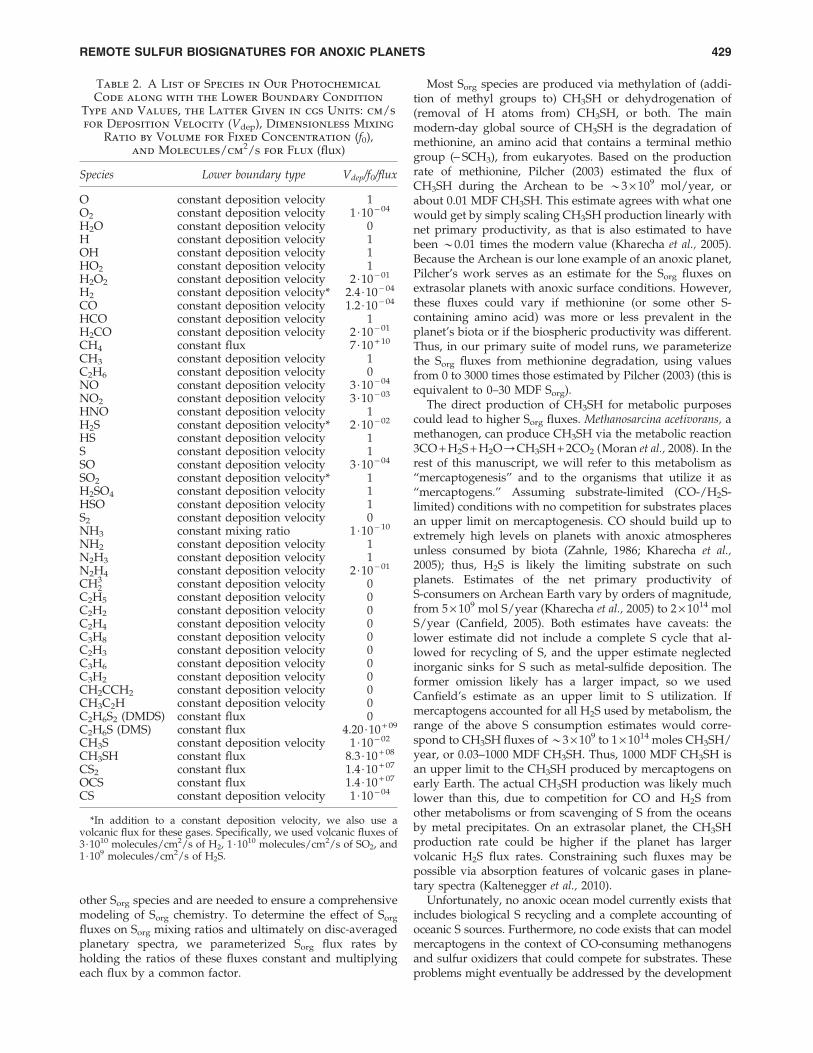
other biogenic gases that contain carbon-sulfur bonds. Thesetwo species—particularly OCS—also have volcanic andphotochemical sources, but they are far smaller than biolog-ical fluxes. We henceforth use the term ‘‘Sorg’’ as shorthand torefer to the entire suite of biologically produced species withcarbon-sulfur bonds (DMS, DMDS, CH3SH, CS2, and OCS).Although hydrogen sulfide (H2S) is another S-bearing gasproduced by biota, large quantities of this species enter theatmosphere via volcanism. Thus, we do not consider it hereas a biosignature. However, we do consider the possibilitythat volcanic H2S could act as a ‘‘false positive’’ for biogenicSorg, as this abiotic H2S could react in the atmosphere to formSorg species. Other work has explored the spectral signaturesof sulfur dioxide (SO2) and H2S in detail (Kaltenegger andSasselov, 2010), so we limit our discussion to their potential tobe false positives for biological Sorg production. No study todate has predicted the concentrations of all the Sorg species inan anoxic atmosphere, nor has any study predicted thespectral features associated with these gases. We used aphotochemical model to calculate vertical profiles of thesegases for a variety of astronomical and biological contexts,and used a radiative transfer model to predict the spectralfeatures consistent with those profiles.
2. Methods
2.1. Photochemical code
We modified the one-dimensional (altitude), low-O2 pho-tochemical code originally developed by Kasting et al. (1979)to study the anoxic early Earth. The numerics of this modelare described by Kasting and Ackerman (1985), and thechemistry was most recently modified by Pavlov et al. (2001).We have updated this code, adding seven long-lived che-mical species that have lifetimes longer than the time scalefor vertical mixing: CH3SH, DMS, DMDS, OCS, CS2, me-thylthiol (CH3S), and carbon monosulfide (CS). We also ad-ded three short-lived species, which are solved inphotochemical equilibrium without considering verticaltransport: excited-state CS2, OCS2, and HCS. These 10 spe-cies were incorporated into the chemical scheme by adding73 chemical reactions. The current model contains 83 che-mical species, 46 of which are long lived, connected by 433chemical reactions. Additionally, many of the 360 reactionsfrom prior work have updated reaction rate constants. Acomplete list of model reactions, reaction rate constants, andreferences can be found in Table 1.
The model grid is composed of 100 plane-parallel layersthat are each 1 km thick in altitude. We did not perform cli-mate calculations for this work; instead, we assumed a tem-perature profile for an aerosol-free, ozone-free atmosphere.This profile had a surface temperature of 278 K that decreasedto 180 K at the tropopause and was isothermal through thestratosphere. The relatively low surface temperature waspicked for consistency with previous Archean photochemis-try and climate models (Haqq-Misra et al., 2008), and theisothermal stratosphere is consistent with the model’s lack ofO3. The code calculates the mixing ratios of each species ineach layer by solving the coupled mass-continuity/fluxequations with the reverse Euler method (appropriate for stiffsystems) and a variable time-stepping algorithm. For furtherdetails on the photochemical code, see Pavlov et al. (2001) andreferences therein.
Unless otherwise stated, all model runs were for a 1-bar,N2-dominated atmosphere with 3% CO2 (30,000 ppmv,or *100 times the present level of CO2 in Earth’s atmo-sphere) and CH4/CO2 ratios < 0.1. These boundary condi-tions prevent formation of a significant organic haze (Pavlovet al., 2001; Trainer et al., 2006; Domagal-Goldman et al.,2008). These concentrations and the model’s other chemicalboundary conditions are by no means unique; however, theywere chosen for consistency with a methanogen-acetogenecosystem (Kharecha et al., 2005). The modeling of haze-freeatmospheres is, from a photochemical standpoint, conser-vative. Including haze in the model would shield the gaseswe are studying from UV radiation and thereby increasetheir mixing ratios.
2.2. Boundary conditions
At the top of the atmosphere we allowed H and H2 toescape at the diffusion-limited rate (Walker, 1977). We alsoapplied a constant downward flux of CO and O at the top ofour model atmosphere. This accounts for CO and O that isproduced from CO2 photolysis above the top layer of ouratmosphere and subsequently flows downward into themodel grid. For all other species, we used a zero-fluxboundary condition at the top of the atmosphere (i.e., noescape).
At the bottom of the atmosphere, we used constant de-position velocities (to account for reactions with surfacerocks and for dissolution in the ocean) for all species exceptthe Sorg species, CH4, and NH3. In addition to constant de-position velocities, H2S, SO2, and H2 had volcanic fluxes of1 · 109 molecules/cm2/s, 1 · 1010 molecules/cm2/s, and3 · 1010 molecules/cm2/s, respectively, consistent with pastmodels of Archean Earth (Zahnle et al., 2006) that assumevolcanism rates about 3 times modern-day values. Thesefluxes were distributed throughout the troposphere to sim-ulate volcanism. CH4 was modeled with a constant flux of200 Tg C/year (7 · 1010 molecules/cm2/s) into the bottomlayer of the atmosphere, in line with estimates of modern-day non-anthropogenic fluxes on Earth (IntergovernmentalPanel on Climate Change, 2007). [The total CH4 flux today isabout 2 times higher; see the Intergovernmental Panel onClimate Change (2007)]. Despite this modern-day flux, theconcentrations of CH4 in our models were much higher thanthey are today because the lack of atmospheric O2 allowedCH4 to accumulate. We imposed a constant mixing ratio of10 - 10 for NH3. The corresponding surface flux needed tomaintain this mixing ratio was 12.4 Tg N/year, slightlylarger than the present-day non-anthropogenic NH3 flux,10.5 Tg N/year (Intergovernmental Panel on ClimateChange, 2007). All photochemical boundary conditions arelisted in Table 2.
We parameterized the biological production of Sorg. Themodern-day Sorg fluxes, predominantly biological in source,are as follows (in units of molecules/cm2/s): 0 for DMDS,4.2 · 109 for DMS, 0 for CH3S, 8.3 · 108 for CH3SH, 1.4 · 107
for CS2, 1.4 · 107 for OCS, and 0 for CS (Kettle et al., 2001).We will use ‘‘MDF’’ as a unit to represent these modern-dayfluxes in the rest of this paper, such that 1 MDF Sorg isequivalent to an atmosphere that receives all Sorg species atthe above fluxes. DMDS, CH3S, and CS have zero direct bi-ological production but are produced photochemically from
428 DOMAGAL-GOLDMAN ET AL.
other Sorg species and are needed to ensure a comprehensivemodeling of Sorg chemistry. To determine the effect of Sorg
fluxes on Sorg mixing ratios and ultimately on disc-averagedplanetary spectra, we parameterized Sorg flux rates byholding the ratios of these fluxes constant and multiplyingeach flux by a common factor.
Most Sorg species are produced via methylation of (addi-tion of methyl groups to) CH3SH or dehydrogenation of(removal of H atoms from) CH3SH, or both. The mainmodern-day global source of CH3SH is the degradation ofmethionine, an amino acid that contains a terminal methiogroup (- SCH3), from eukaryotes. Based on the productionrate of methionine, Pilcher (2003) estimated the flux ofCH3SH during the Archean to be *3 · 109 mol/year, orabout 0.01 MDF CH3SH. This estimate agrees with what onewould get by simply scaling CH3SH production linearly withnet primary productivity, as that is also estimated to havebeen *0.01 times the modern value (Kharecha et al., 2005).Because the Archean is our lone example of an anoxic planet,Pilcher’s work serves as an estimate for the Sorg fluxes onextrasolar planets with anoxic surface conditions. However,these fluxes could vary if methionine (or some other S-containing amino acid) was more or less prevalent in theplanet’s biota or if the biospheric productivity was different.Thus, in our primary suite of model runs, we parameterizethe Sorg fluxes from methionine degradation, using valuesfrom 0 to 3000 times those estimated by Pilcher (2003) (this isequivalent to 0–30 MDF Sorg).
The direct production of CH3SH for metabolic purposescould lead to higher Sorg fluxes. Methanosarcina acetivorans, amethanogen, can produce CH3SH via the metabolic reaction3CO + H2S + H2O/CH3SH + 2CO2 (Moran et al., 2008). In therest of this manuscript, we will refer to this metabolism as‘‘mercaptogenesis’’ and to the organisms that utilize it as‘‘mercaptogens.’’ Assuming substrate-limited (CO-/H2S-limited) conditions with no competition for substrates placesan upper limit on mercaptogenesis. CO should build up toextremely high levels on planets with anoxic atmospheresunless consumed by biota (Zahnle, 1986; Kharecha et al.,2005); thus, H2S is likely the limiting substrate on suchplanets. Estimates of the net primary productivity ofS-consumers on Archean Earth vary by orders of magnitude,from 5 · 109 mol S/year (Kharecha et al., 2005) to 2 · 1014 molS/year (Canfield, 2005). Both estimates have caveats: thelower estimate did not include a complete S cycle that al-lowed for recycling of S, and the upper estimate neglectedinorganic sinks for S such as metal-sulfide deposition. Theformer omission likely has a larger impact, so we usedCanfield’s estimate as an upper limit to S utilization. Ifmercaptogens accounted for all H2S used by metabolism, therange of the above S consumption estimates would corre-spond to CH3SH fluxes of *3 · 109 to 1 · 1014 moles CH3SH/year, or 0.03–1000 MDF CH3SH. Thus, 1000 MDF CH3SH isan upper limit to the CH3SH produced by mercaptogens onearly Earth. The actual CH3SH production was likely muchlower than this, due to competition for CO and H2S fromother metabolisms or from scavenging of S from the oceansby metal precipitates. On an extrasolar planet, the CH3SHproduction rate could be higher if the planet has largervolcanic H2S flux rates. Constraining such fluxes may bepossible via absorption features of volcanic gases in plane-tary spectra (Kaltenegger et al., 2010).
Unfortunately, no anoxic ocean model currently exists thatincludes biological S recycling and a complete accounting ofoceanic S sources. Furthermore, no code exists that can modelmercaptogens in the context of CO-consuming methanogensand sulfur oxidizers that could compete for substrates. Theseproblems might eventually be addressed by the development
Table 2. A List of Species in Our Photochemical
Code along with the Lower Boundary Condition
Type and Values, the Latter Given in cgs Units: cm/s
for Deposition Velocity (Vdep), Dimensionless Mixing
Ratio by Volume for Fixed Concentration (f0),and Molecules/cm
2/s for Flux (flux)
Species Lower boundary type Vdep/f0/flux
O constant deposition velocity 1O2 constant deposition velocity 1$10 - 04
H2O constant deposition velocity 0H constant deposition velocity 1OH constant deposition velocity 1HO2 constant deposition velocity 1H2O2 constant deposition velocity 2$10 - 01
H2 constant deposition velocity* 2.4$10 - 04
CO constant deposition velocity 1.2$10 - 04
HCO constant deposition velocity 1H2CO constant deposition velocity 2$10 - 01
CH4 constant flux 7$10 + 10
CH3 constant deposition velocity 1C2H6 constant deposition velocity 0NO constant deposition velocity 3$10 - 04
NO2 constant deposition velocity 3$10 - 03
HNO constant deposition velocity 1H2S constant deposition velocity* 2$10 - 02
HS constant deposition velocity 1S constant deposition velocity 1SO constant deposition velocity 3$10 - 04
SO2 constant deposition velocity* 1H2SO4 constant deposition velocity 1HSO constant deposition velocity 1S2 constant deposition velocity 0NH3 constant mixing ratio 1$10 - 10
NH2 constant deposition velocity 1N2H3 constant deposition velocity 1N2H4 constant deposition velocity 2$10 - 01
CH32 constant deposition velocity 0
C2H5 constant deposition velocity 0C2H2 constant deposition velocity 0C2H4 constant deposition velocity 0C3H8 constant deposition velocity 0C2H3 constant deposition velocity 0C3H6 constant deposition velocity 0C3H2 constant deposition velocity 0CH2CCH2 constant deposition velocity 0CH3C2H constant deposition velocity 0C2H6S2 (DMDS) constant flux 0C2H6S (DMS) constant flux 4.20$10 + 09
CH3S constant deposition velocity 1$10 - 02
CH3SH constant flux 8.3$10 + 08
CS2 constant flux 1.4$10 + 07
OCS constant flux 1.4$10 + 07
CS constant deposition velocity 1$10 - 04
*In addition to a constant deposition velocity, we also use avolcanic flux for these gases. Specifically, we used volcanic fluxes of3$1010 molecules/cm2/s of H2, 1$1010 molecules/cm2/s of SO2, and1$109 molecules/cm2/s of H2S.
REMOTE SULFUR BIOSIGNATURES FOR ANOXIC PLANETS 429

of ocean biogeochemistry codes with flexible chemistries anda wide variety of metabolisms. In the absence of such codes,we parameterized CH3SH fluxes from 1 to 100 MDF to sim-ulate a biosphere with CO-consuming mercaptogens. Becausethe CO they consume would otherwise be used by metha-nogens, we decreased the biological CH4 flux in proportion tothe biological CH3SH flux in these simulations. In this set ofmercaptogenesis experiments with 1–100 MDF CH3SH, weheld the fluxes of the other Sorg gases (DMS, DMDS, OCS, andCS2) constant at 1 MDF, because, unlike CH3SH, these gasesare not directly produced by this metabolism. To distinguishbetween the two sets of experiments, we label model simu-lations where we changed the flux of all Sorg gases with ‘‘XMDF Sorg,’’ and label model simulations where we changedonly the flux of CH3SH with ‘‘X MDF CH3SH.’’
Each set of Sorg boundary conditions was applied toplanets orbiting stars of three different spectral types, fol-lowing Segura et al. (2005). Specifically, we used time-averaged spectra of the Sun, the active M dwarf AD Leo, anda model-generated M dwarf with a surface temperature of3100 K and no chromosphere (Allard et al., 1997). This star,referred to as ‘‘T3100’’ in the remainder of this manuscript, isnot presented as a physically meaningful case but rather as alow-UV-flux, end-member simulation. All stellar spectra werescaled such that the total energy flux at the top of the modelplanet’s atmosphere was 1092 W/m2, including radiationoutside the bounds of our photochemical model wavelengthgrid. This is 80% of the flux Earth currently receives from theSun, which is in line with the amount of energy the anoxic,Archean Earth received. Because the total energy flux re-ceived by the planet is the same, this is equivalent to as-suming that the planet orbits within the habitable zone of thatstar. The resulting scaled stellar spectra are plotted in Fig. 1,as binned for use in the photochemical code.
2.3. Radiative transfer code
We used the line-by-line Spectral Mapping AtmosphericRadiative Transfer model (Meadows and Crisp, 1996; Crisp,1997) to generate synthetic planetary spectra of our modelplanets. Spectra were computed by using the vertical mixingratio profiles of CH3SH, DMS, DMDS, OCS, CS2, SO2, H2S,CH4, C2H6, CO2, and H2O generated by the photochemicalcode. The underlying surface consisted of a 278 K globalocean with an emissivity of *1, and we used the same as-sumed temperature structure applied in the photochemicalmodel. The input stellar spectra and molecular absorptiondata were obtained from the Virtual Planetary Laboratory’sonline database (http://vpl.astro.washington.edu/spectra/VPLSpectra/frontpage.htm) and include molecular line pa-rameters from the HITRAN (Rothman et al., 2005) and PNNLdatabases (Sharpe et al., 2004).
We did not include any aerosols in our spectral model, sothe model spectra shown here should be considered ideal-ized ‘‘clear sky’’ simulations. However, we limited parameterspace (see Boundary conditions, above) so that the atmo-spheric CH4/CO2 ratio was less than 0.1, a condition forwhich thick organic haze layers will not form (Trainer et al.,2006; Haqq-Misra et al., 2008). S8 and sulfate hazes were alsolimited by these conditions. Assuming Mie scattering, all S8,hydrocarbon, and sulfate particles in our simulations hadextinction optical depths less than 0.05 within the ‘‘IR win-
dow’’ between 8.5 and 13 lm in which most of the absorptionfeatures explored here appear. While organo-sulfate particlescan form in sulfur-rich anoxic atmospheres (DeWitt et al.,2010), the optical properties of these particles have not yetbeen explored. Water clouds may also impact the spectrasimulated here. For more on the effects of water clouds, seeRobinson et al. (2011). We leave the exploration of aerosoland cloud effects for future studies.
3. Results
The habitable-zone planets around stars with lower surfacetemperatures receive proportionally fewer UV photons andmore long-wavelength, low-energy photons (Fig. 1). Thisleads to lower photolysis rates on these planets, as there arefewer photons with the requisite energy to dissociate mole-cules. Figure 1b illustrates this by showing the wavelength-dependent absorption cross section for CH3SH (Sharpe et al.,2004), along with the incident UV flux from the three differentstars. Photolysis of CH3SH (and the other Sorg species) gen-erally occurs at wavelengths <300 nm, where the fluxes fromthe Sun, AD Leo, and T3100 differ by orders of magnitude.Except below 170 nm, where the AD Leo habitable-zoneplanet receives the highest relative flux, the UV flux decreasesdramatically going from the Sun to AD Leo to T3100. BecauseCH3SH photolysis occurs mostly in the 200–300 nm region, itsphotolysis rate follows this same pattern. The same holds truefor other gases, for example, H2O, whose photolysis createshighly reactive radicals that destroy Sorg.
3.1. Production and loss of Sorg species
We define a standard Archean model with the generalboundary conditions above along with 1 MDF Sorg and 1MDF CH4. The largest Sorg sinks in this simulation were thefollowing reactions:
C2H6S2þO/CH3þ SOþCH3S
OCSþ h�/COþ S
C2H6SþO/CH3þCH3þ SO
CH3SHþO/CH3þHSO
These reactions outpaced other net Sorg sinks by at least anorder of magnitude. Thus, the major sink for Sorg in ourmodel was reaction with O, and the major by-products wereCH3 and oxidized sulfur species—SO and HSO. The majorsource of O atoms to the atmosphere was photolysis of majoratmospheric components (in an anoxic atmosphere, CO2,SO2, and H2O), and the inventory of O atoms decreasedwhen the flux of UV photons to the atmosphere was di-minished.
On the model planet orbiting T3100, the biggest sinks forSorg species were the following reactions:
OCSþ h�/COþ S
OCSþ S/COþ S2
CH3SHþ h�/CH3þHS
C2H6S2þO/CH3þ SOþCH3S
CH3SHþO/CH3þHSO
In the model simulations around these stars, the lack of UVphotons entering the atmosphere led to a lack of O radicals in
430 DOMAGAL-GOLDMAN ET AL.

the atmosphere. This caused a slower destruction rate of theSorg gases and shifted the main by-products of Sorg photo-chemistry to carbon monoxide (CO) and reduced sulfur species(S, S2, and H2S). The planets orbiting AD Leo were betweenthese two end-member cases for atomic O production. As aresult, the by-products of Sorg chemistry on planets around Mdwarfs were a mix of oxidized and reduced sulfur species.
3.2. Atmospheric profiles
Results from nine photochemical model runs are shownin Figs. 2 and 3. Each figure contains a 3 · 3 grid of panelswith decreasing UV flux (Sun, AD Leo, T3100) from left toright and increasing organic sulfur gases (0 MDF Sorg, ourcontrol; 1 MDF Sorg, the modern-day fluxes; and 10 MDFCH3SH, corresponding to a biosphere containing mercap-togens) from top to bottom. Figure 2 shows the calculatedmixing ratio profiles of the major Sorg species along with
SO2 and H2S, while Fig. 3 shows the calculated verticalprofiles of H2O, CH4, C2H6, H2, and O2. The profiles gen-erated with 0 MDF Sorg are our control experiments, as thisboundary condition is equivalent to assuming no biologicalSorg production. In these cases, the atmospheric mixingratios of all Sorg gases were extremely low.
For models with the modern-day Sorg flux, near-surfacemixing ratios of DMS built up to at least *10 ppt (10 - 11) forall three stellar types. These relatively low concentrationsare due to higher photolysis rates in the absence of an O2/O3
UV shield. For the T3100 model planet, DMDS and CH3SHpeaked above 100 ppb (10 - 7). The shapes of the Sorg profilesalso changed as a function of star type, as the sulfur gasesremained well mixed to higher altitudes in the low-UV-fluxmodels, further increasing the total column depths of the Sorg
species. C2H6 concentrations also increased when surfaceSorg production was included, because of additional pro-duction of CH3 radicals (Fig. 3).
FIG. 1. (a) The stellar energy distribution at a planet receiving the same amount of total energy flux that the Earth received*2.5 billion years ago for three different stars: the Sun, AD Leo, and T3100 (a model M dwarf that has no chromosphere). (b)The bottom panel is an expansion of the UV region of the top panel, with a logarithmic y axis. The bottom panel also showsthe absorption cross section of CH3SH, units for which are on the right y axis (also logarithmic). Color images available onlineat www.liebertonline.com/ast
REMOTE SULFUR BIOSIGNATURES FOR ANOXIC PLANETS 431

020
4060
8010
0
Star is Sun
SO2H2SDMDSDMSCH3SH
020
4060
8010
0
SO2H2SDMDSDMSCH3SH
10−18 10−12 10−6
020
4060
8010
0
SO2H2SDMDSDMSCH3SH
Star is ADLeo
SO2H2SDMDSDMSCH3SH
SO2H2SDMDSDMSCH3SH
10−18 10−12 10−6
SO2H2SDMDSDMSCH3SH
0 x
mod
ern
Sor
g flu
x
Star is T3100
SO2H2SDMDSDMSCH3SH
1 x
mod
ern
Sor
g F
lux
SO2H2SDMDSDMSCH3SH
10−18 10−12 10−6
10 x
mod
ern
CH
3SH
flux
SO2H2SDMDSDMSCH3SH
Mixing Ratios
Alti
tude
(km
)
FIG. 2. These nine panels each show model-predicted vertical profiles of the mixing ratios of the organic sulfur species.Panels toward the left are for planets orbiting stars with greater UV radiation, and panels toward the bottom are for planetswith higher biological Sorg production. The Sorg mixing ratios increase with higher ground Sorg fluxes (bottom panels) andwith lower UV radiation (right panels). Color images available online at www.liebertonline.com/ast
432 DOMAGAL-GOLDMAN ET AL.

020
4060
8010
0
Star is Sun
O2H2OCH4C2H6H2
020
4060
8010
0
O2H2OCH4C2H6H2
10−9 10−6 10−3
020
4060
8010
0
O2H2OCH4C2H6H2
Star is ADLeo
O2H2OCH4C2H6H2
O2H2OCH4C2H6H2
10−9 10−6 10−3
O2H2OCH4C2H6H2
0 x
mod
ern
Sor
g flu
x
Star is T3100
O2H2OCH4C2H6H2
1 x
mod
ern
Sor
g F
lux
O2H2OCH4C2H6H2
10−9 10−6 10−3
10 x
mod
ern
CH
3SH
flux
O2H2OCH4C2H6H2
mixing ratios
Alti
tude
(km
)
FIG. 3. These nine panels each show model-predicted vertical profiles of the mixing ratios of the greenhouse gases in ourclimate and line-by-line radiative transfer models. Panels on the left are for planets orbiting stars with greater UV radiation, andpanels on the bottom are for planets with higher biological Sorg production. H2O and CO2 concentrations are identical in allmodel runs, while CH4 concentrations vary only modestly between simulations. Note the increase in C2H6 concentrations onplanets with higher Sorg fluxes or lower UV radiation, or both. Color images available online at www.liebertonline.com/ast
REMOTE SULFUR BIOSIGNATURES FOR ANOXIC PLANETS 433

As expected, increasing the CH3SH flux to 10 MDF whilekeeping the rest of the Sorg gases at 1 MDF (the mercapto-gen experiments) resulted in a further increase in all Sorg
mixing ratios (Fig. 2). This increase was most pronounced inCH3SH and in DMDS and was greatest on planets receivingrelatively low UV radiation. C2H6 concentrations also in-creased with these higher CH3SH fluxes (Fig. 3), despite thefact that we decreased the CH4 fluxes in these simulationsso that the total flux of CH3 groups to the atmosphere re-mained constant.
3.3. Spectra
To illustrate where each of the gases plotted in Figs. 2 and 3are spectrally active, we present sensitivity spectra of themodel planet with 30 MDF CH3SH orbiting AD Leo (Fig. 4).We generated Fig. 4 by running a full spectral model (shownas a black curve) and then subsequent model runs with onegas removed in each run. These sensitivity spectra are notself-consistent atmospheres; rather, they are tools to deter-mine what gases are causing certain absorption features inthe full spectral model. The spectral regions in which a sen-sitivity spectrum for a particular gas differs from the planet’scomplete spectrum show where that gas absorbs. For exam-ple, the effects of H2O are clearly seen (difference betweenblack and gray curves) from 5 to 7 lm and longward of17 lm. Likewise, CO2 absorption features (difference betweenblack and brown curves) are present from 9 to 11 lm andfrom 12 to 19 lm, CH4 absorption is present from 6 to 9 lm,and C2H6 has a deep absorption feature from 11 to 13 lm. Thedistinguishable Sorg absorption features include those causedby CH3SH from 9 to 11 lm and by DMDS from 10 to 11 lm.
Model spectra from 4 to 20 lm are presented at a spectralresolution of R (k/Dk)*50 in Fig. 5. This resolution is con-sistent with the requirement goal for the Terrestrial PlanetFinder Interferometer (TPF-I), a first-generation thermal-IRplanet characterization mission (Lawson et al., 2007). For thesimulations of a mercaptogen biosphere on a planet with aspectrum of the Sun or AD Leo, the greatest remotely ob-servable difference was the C2H6 absorption feature between11 and 13 lm, the strength of which increases at higherCH3SH fluxes (30 · modern CH3SH flux). This feature becamemore prevalent if we increased the flux of the other Sorg gases(30 · modern Sorg flux) or if we decreased the UV radiationreaching the planet (bottom panel). The model simulationswith these deeper C2H6 features also exhibited enhancedabsorption features from 8.5 to 11 lm caused by DMDS.
H2S fluxes are unlikely to cause false positives. H2S had alarge spectral influence only on planets with extremely largeH2S fluxes (1000 · H2S MDF) orbiting stars with extremelylow UV radiation (T3100). Except for these end-membercases, we do not expect H2S to provide a false negative forthe other absorption features discussed here.
4. Discussion
Several trends from our photochemical simulations (Figs.2 and 3) have implications for the interpretation of futureexoplanetary spectra. As the stellar UV flux to the planetdecreases, the ground-level mixing ratios and altitudinalextent of Sorg species increase. The same effects can also becaused by increases to the Sorg surface fluxes. Both trends can
be explained by an increase in the ratio of Sorg sources to Sorg
sinks. The main sources of Sorg to the atmosphere are thebiogenic surface fluxes; an increase in these raises thesource/sink ratio. The two main sinks of Sorg species aredirect photolysis and reaction with radicals such as OH andO that themselves are by-products of photochemical reac-tions. The decrease in UV radiation slows all photolysis andtherefore decreases the sinks for Sorg species.
The other robust trend in the photochemical simulations isan increase in C2H6 with increasing Sorg fluxes and withdecreasing UV radiation. Increasing Sorg fluxes increases thesource of CH3 radicals that combine to form C2H6. Decreasesin UV fluxes lead to lower C2H6 photolysis rates, lowerconcentrations of C2H6-destroying radicals, and smaller sinksfor C2H6.
C2H6 has not previously been identified as a potentialbiosignature for anoxic atmospheres, although most conceptsfor mid-IR exoplanet characterization missions already in-clude plans to detect CH4 by looking for its absorption fea-ture centered near 7.7 lm (Lawson et al., 2007). According toour model simulations, C2H6 detection would require aninterferometer with a spectral resolution of k/Dk*20 and aS/N * 15 in the 11–13 lm range to resolve the distinctiveband profile for this gas. Such a mission could discriminateat a 3r level between C2H6 produced by the model with themodern-day Sorg flux and the model with no Sorg flux, for aplanet around an M dwarf similar to AD Leo.
C2H6 concentrations can be enhanced both by increasedSorg concentrations and by increased CH4. Because CH4 canhave an abiogenic source, CH4-derived C2H6 could be abio-genic in origin. Figure 5 shows low-resolution (R*50) spectrawith high C2H6 concentrations arising from either high Sorg
fluxes or high CH4 fluxes. Models that have higher Sorg fluxeshave higher C2H6 concentrations and a deeper C2H6 absorp-tion feature between 11 and 13 lm. Similarly, models thathave higher CH4 fluxes also have increased C2H6 concentra-tions and more absorption between 11 and 13 lm. However,models that achieve C2H6 buildup through increased CH4
fluxes also exhibit a detectable increase in the CH4 concen-trations in the atmosphere: there was a doubling in the near-surface CH4 mixing ratios when the CH4 fluxes wereincreased to 1.5 MDF, and another doubling when the CH4
fluxes were increased to 2.0 MDF. These increased CH4 con-centrations caused significantly more absorption between 8and 9 lm. In other words, changes in the absorption by CH4
could potentially allow us to discriminate between the spectrawith ‘‘abiogenic, CH4-derived C2H6’’ and the spectra with‘‘biogenic, Sorg-derived C2H6.’’ Thus, an exoplanet character-ization mission that can measure the depths of the CH4 andC2H6 absorption features accurately enough to estimate theC2H6/CH4 ratio may be able to determine whether biologicalSorg production contributes to the source of C2H6.
These above differences in CH4 absorption depths in bi-ological and abiological model simulations are the result ofhigher C2H6/CH4 ratios in models with biological Sorg
fluxes. These fluxes caused an increase in atmospheric CH3
groups, which in turn increased the atmospheric C2H6/CH4
ratio. Thus, for a given amount of C2H6, the CH4 concen-trations were lower in models with higher Sorg fluxes. (Theconverse is also true; for a given CH4 concentration, modelswith higher Sorg fluxes exhibited higher C2H6 concentra-tions.) This effect could be augmented by inclusion of other
434 DOMAGAL-GOLDMAN ET AL.

biological CH3X species, such as CH3Cl, that were not in-cluded in these simulations.
In addition to the influence of Sorg species on the C2H6
feature, several other features were caused directly by thepresence of the Sorg in the model atmospheres: absorption just
shortward of 7 lm by DMS, absorption just longward of 7 lmby DMDS, absorption from 8.5 to 9.5 lm by DMDS, and ab-sorption between 9 and 11 lm by DMDS and CH3SH. Whenpresent, these features created a continuous, but not constant,increase in absorption from 6 lm all the way to the C2H6
FIG. 4. The top panel shows the absorption cross sections for the gases included in our spectral model. The middle and bottompanels show the simulated spectra for a simulation of a planet with 30 MDF Sorg orbiting AD Leo. The black line shows the fullmodel spectrum, including the influence of all the gases in our line-by-line radiative transfer model. The colored lines show modelspectra in which one gas is removed from the line-by-line radiative transfer model, with lines of the same color showing theabsorption cross-section spectrum for that gas in the top pane. For example, the gray line shows the spectrum with the radiativeinfluence of H2O removed from the model. The bottom panel shows a zoom-in on the ‘‘infrared window’’ between 8.5 and 11 lm.
REMOTE SULFUR BIOSIGNATURES FOR ANOXIC PLANETS 435

feature at 11 lm. Thus, they have a significant impact across awide wavelength range. However, these features only ap-peared in model simulations with extremely low UV fluxes(the T3100 case) or in simulations with at least 30-fold increasesin the flux rate of all Sorg gases. On planets around more activestars, these features would only be detectable if the biosphereis much more productive than Earth’s biosphere or if the or-ganisms living on the planet have high concentrations of sulfurin their proteins. Even planets with an active mercaptogen
community would not produce these features unless thatcommunity produces CH3SH at a rate that is greater than 30times the modern-day CH3SH flux from the oceans.
Additional confusion in interpreting potential arises fromthe influence of surface temperature. Discriminating betweenplanets with absorption by Sorg species and planets withlower surface temperatures may prove problematic, as theSorg gases all absorb in the 8–12 lm ‘‘atmospheric window’’wavelength region. This is a part of the spectrum that some
5 10 15 20
05
1015
2025
278 K276 K
180 K
0 x modern Sorg flux1 x modern Sorg flux30 x modern CH3SH flux30 x modern Sorg flux2 x modern CH4 flux1000 x modern H2S flux
5 10 15 20
05
1015
2025
278 K276 K
180 K
0 x modern Sorg flux1 x modern Sorg flux30 x modern CH3SH flux30 x modern Sorg flux2 x modern CH4 flux1000 x modern H2S flux
5 10 15 20
05
1015
2025
278 K273 K
180 K
0 x modern Sorg flux1 x modern Sorg flux30 x modern CH3SH flux30 x modern Sorg flux2 x modern CH4 flux1000 x modern H2S flux
Wavelength(mm)
Flu
x (W
m2
mm)
FIG. 5. Spectra for planets around the Sun (top panel), AD Leo (middle panel), and T3100, a model M dwarf with nochromosphere (bottom panel), all at a spectral resolution of k/Dk*50. The black curve is a spectrum for a planet with 0 Sorg
flux. The red and blue lines show model spectra for planets with 1 and 30 times the modern Sorg fluxes. The purple lines showspectra for planets with 30 times the modern day flux of CH3SH and 0.65 times the modern day flux of CH4. The cyan linesshow spectra with 2 times the modern day flux of CH4 and 0 Sorg flux. The green lines show spectra with 1000 times themodern day flux of H2S and 0 Sorg flux. The goldenrod, orange, and brown dashed lines represent the Planck function for anobject at 278 K (the surface temperature), 276 or 273 K (the highest ‘‘color temperature’’ for the ‘‘1 modern Sorg flux’’ spec-trum), and 180 K (the stratospheric temperature).
436 DOMAGAL-GOLDMAN ET AL.

have suggested could be used to discern surface tempera-tures, because on modern-day Earth that region is the mosttransparent to the IR radiation emitted by the surface ofEarth. However, an increase in greenhouse gases that absorbphotons in this region (including Sorg species) will increaseits opacity, thereby decreasing the effectiveness with whichthe surface temperature can be ascertained.
The quantitative effect of Sorg absorption on inferredplanetary temperature is shown by the dashed curves in Fig. 5.Here the model spectra, which are cloud free, have been de-graded to the spectral resolution goal for TPF-I and are shownwith blackbody spectra at three temperatures: (1) 180 K, thestratospheric temperature in our model (drawn in brown); (2)278 K, the surface temperature in our model (drawn in gold-enrod); and (3) either 276 K (top, middle) or 273 K (bottom),the maximum temperature derived for 1 MDF Sorg casewithin the window region of the model spectrum (drawn inorange). Figure 5 shows that the Sorg gas absorption, in ad-dition to weak water vapor absorption, increases the opacityof the atmosphere in the atmospheric window sufficientlythat the majority of the radiation sensed comes from higher,colder regions of the planet’s troposphere. The discrepancybetween actual surface temperature (278 K) and maximumobserved temperature is as much as 8 K for the highest Sorg
fluxes and lowest UV fluxes. This will increase the planet’sgreenhouse effect but decrease the effectiveness with whichthe surface temperature can be sensed remotely. This effect isfrom atmospheric absorption alone and does not account forthe atmospheric column-truncating effects of clouds or hazes,which for an unresolved Earth-like planet can further reducethe measured brightness temperature in the window region.
Obtaining the best possible estimates of planetary surfacetemperatures for extrasolar planets of unknown compositionwill therefore require sufficient spectral wavelength rangeand resolution to identify non-Earth-like atmospheric win-dow regions, and good estimates of planetary compositionand the presence of cloud or aerosol cover. These measure-ments, combined with atmospheric modeling, will be crucialfor understanding limitations on planetary temperature re-trieval from MIR spectra for planets with atmosphericcharacteristics unlike those of modern Earth. For anoxic at-mospheres, it is important to be able to detect Sorg absorptionfeatures at wavelengths shortward of the window region.Absorption by DMS and DMDS between 6 and 9 lm pro-vides an extra constraint on the abundance of these gases.Similarly, the C2H6 feature could be used in conjunction withphotochemical models to further constrain the Sorg flux rates.The atmospheric Sorg inventory could then be input to aclimate model to calculate self-consistent surface tempera-tures and spectra. A fairly comprehensive characterization ofan anoxic atmosphere could therefore be achieved withspectra from 6 to 13 lm (and preferably down to 5 lm andout to 20 lm to help constrain water abundances) at aspectral resolution of at least 20 and a S/N greater than 15.These baseline parameters are consistent with the currentrequirement goals for the TPF-I mission concept.
5. Conclusions
In this paper, we have shown that an anoxic biospherecould be detected over interstellar distances by searching fororganic S species produced by biology. On planets orbiting
Sun-type stars, Sorg fluxes at 30 times modern-day levelscould be detected in the form of elevated C2H6/CH4 ratiosthat are a photochemical by-product of Sorg gases. On planetsaround M dwarfs such as AD Leo, detection of heightenedC2H6/CH4 ratios is possible at present-day Sorg fluxes. Fea-tures caused directly by Sorg gases may be observable onplanets that have much higher Sorg fluxes or on planets or-biting M dwarfs that exhibit low amounts of stellar activity,or both. An important caveat to this work is that aerosols,including water clouds, hydrocarbon aerosols, sulfate aero-sols, and S8 particles, were not considered in the spectralportion of this study but may impact the ability to detectthese species.
The detection of any of these features will require an in-strument with spectral resolution R > 20, broad coverage ofthe IR spectrum (6–14 lm), and low total noise levels (S/N > 15 or noise < 1 W/m2/lm). Current expected perfor-mance levels for TPF-I meet these requirements (Lawsonet al., 2007). The use of models to interpret the spectra willalso be required in order to separate the effects of surfacetemperature, organic sulfur gases, and other atmosphericconstituents on the planetary spectrum.
Despite the difficulties involved, the benefits offered bysuch a search are considerable. By including organic sulfurspecies in our repertoire of remotely detectable bio-signatures, the detection of life on some planets may alsocome with rudimentary lessons on the composition of thatplanet’s biosphere. Thus, this work supports exoplanetcharacterization missions with a wavelength range andspectral resolution sufficient to detect C2H6 and the organicsulfur gases discussed above.
Acknowledgments
The quality of this manuscript was improved by the usefulcritiques of three reviewers. This work was performed aspart of the NASA Astrobiology Institute’s Virtual PlanetaryLaboratory, supported by the National Aeronautics andSpace Administration through the NASA Astrobiology In-stitute under solicitation No. NNH05ZDA001C. Additionalsupport was provided by the Pennsylvania State Astro-biology Research Center, supported by the National Aero-nautics and Space Administration through the NASAAstrobiology Institute under grant number NNA09DA76A.S.D.D.-G. acknowledges additional support from the Astro-biology NSF IGERT grant at the University of Washington.M.C. and S.D.D.-G. acknowledge additional support fromthe NASA Postdoctoral Program. J.F.K. acknowledges ad-ditional support from NASA’s Exobiology and EvolutionaryBiology Program.
Abbreviations
DMS, dimethyl sulfide; DMDS, dimethyl disulfide; MDF,modern-day flux; S/N, signal-to-noise ratio; TPF-I, Terres-trial Planet Finder Interferometer.
References
Adachi, H., Basco, N., and James, D.G.L. (1981) The acetyl rad-icals CH3CO - and CD3CO - studied by flash photolysis andkinetic spectroscopy. International Journal of Chemical Kinetics13:1251–1276.
REMOTE SULFUR BIOSIGNATURES FOR ANOXIC PLANETS 437

Albers, E.A., Hoyermann, K., Wagner, H.G., and Wolfrum, J.(1969) Study of the reaction of ammonia with oxygen atoms.Symposium (International) on Combustion 12:313–321.
Allard, F., Hauschildt, P.H., Alexander, D.R., and Starrfield, S.(1997) Model atmospheres of very low mass stars and browndwarfs. Annu Rev Astron Astrophys 35:137–177.
Allen, M., Yung, Y.L., and Gladstone, G.R. (1992) The relativeabundance of ethane to acetylene in the jovian stratosphere.Icarus 100:527–533.
Amano, A., Yamada, M., Hashimoto, K., and Sugiura, K. (1983)Kinetic feature of the reaction between methanethiol and hy-drogen atoms. Nippon Kagaku Kaishi 12:385–393.
Anastasi, C., Broomfield, M., Nielsen, O.J., and Pagsberg, P.(1991) Ultraviolet absorption spectra and kinetics of CH3S andCH2SH radicals. Chem Phys Lett 182:643–648.
Arthur, N.L. and Lee, M. (1976) Reactions of methyl radicals. I.Hydrogen abstraction from dimethyl sulphide. Aust J Chem29:1483–1492.
Ashfold, M.N.R., Fullstone, M.A., Hancock, G., and Ketley, G.W.(1981) Singlet methylene kinetics: direct measurements of re-moval rates of a1A1 and b1B1 CH2 and CD2. Chem Phys 55:245–257.
Atkinson, R., Baulch, D.L., Cox, R.A., Hampson, J.R.F., Kerr,J.A., and Troe, J. (1989) Evaluated kinetic and photochemicaldata for atmospheric chemistry: supplement III. IUPAC Sub-committee on Gas Kinetic Data Evaluation for AtmosphericChemistry. Journal of Physical and Chemical Reference Data18:881–1097.
Atkinson, R., Baulch, D.L., Cox, R.A., Crowley, J.N., Hampson,R.F., Hynes, R.G., Jenkin, M.E., Rossi, M.J., and Troe, J. (2004)Evaluated kinetic and photochemical data for atmosphericchemistry: Volume I—gas phase reactions of OX, HOX, NOX
and SOX species. Atmos Chem Phys 4:1461–1738.Basco, N. and Pearson, A.E. (1967) Reactions of sulphur atoms in
presence of carbon disulphide, carbonyl sulphide, and nitricoxide. Transactions of the Faraday Society 63:2684–2694.
Baughcum, S.L. and Oldenborg, R.C. (1984) Measurement of theC2(a3Pu) and C2(X1S]þg ) Disappearance Rates with O2 from 298 to1300 Kelvin, Oxford University Press, Cary, NC.
Baulch, D.L., Drysdale, D.D., and Home, D.G. (1976) EvaluatedKinetic Data for High Temperature Reactions, Butterworths,London.
Baulch, D.L., Cobos, C.J., Cox, R.A., Esser, C., Frank, P., Just, T.,Kerr, J.A., Pilling, M.J., Troe, J., Walker, R.W., and Warnatz, J.(1992) Evaluated kinetic data for combustion modelling.Journal of Physical and Chemical Reference Data 21:411–734.
Baulch, D.L., Cobos, C.J., Cox, R.A., Frank, P., Hayman, G., Just,T., Kerr, J.A., Murrells, T., Pilling, M.J., Troe, J., Walker, R.W.,and Warnatz, J. (1994) Evaluated kinetic data for combustionmodeling. Supplement I. Journal of Physical and Chemical Re-ference Data 23:847–848.
Becker, K.H., Engelhardt, B., Wiesen, P., and Bayes, K.D. (1989)Rate constants for CH(X2P) reactions at low total pressures.Chem Phys Lett 154:342–348.
Benson, S.W. and Haugen, G.R. (1967) Mechanism of the high-temperature reactions between acetylene and hydrogen. TheJournal of Physical Chemistry 71:4404–4411.
Berman, M.R., Fleming, J.W., Harvey, A.B., and Lin, M.C. (1982)Temperature dependence of CH radical reactions with O2,NO, CO and CO2. Symposium (International) on Combustion19:73–79.
Berndt, M.E., Allen, D.E., and Seyfried, W.E. (1996) Reduction ofCO2 during serpentinization of olivine at 300 degrees C and500 bar. Geology 24:351–354.
Bohland, T., Dobe, S., Temps, F., and Wagner, H.G. (1985) Ki-netics of the reactions between CH2(v3B1)-radicals and satu-rated hydrocarbons in the temperature range 296 K £ T £ 707 K.Berichte der Bunsengesellschaft fur physikalische Chemie 89:1110–1116.
Braun, W., Bass, A.M., and Pilling, M. (1970) Flash photolysis ofketene and diazomethane: the production and reaction ki-netics of triplet and singlet methylene. J Chem Phys 52:5131–5143.
Brown, R.L. and Laufer, A.H. (1981) Calculation of activationenergies for hydrogen-atom abstractions by radicals contain-ing carbon triple bonds. The Journal of Physical Chemistry85:3826–3828.
Butler, J.E., Fleming, J.W., Goss, L.P., and Lin, M.C. (1981) Ki-netics of CH radical reactions with selected molecules at roomtemperature. Chem Phys 56:355–365.
Campbell, I.M. and Gray, C.N. (1973) Rate constants for O(3P)recombination and association with N(4S). Chem Phys Lett18:607–609.
Canfield, D.E. (2005) The early history of atmospheric oxygen:homage to Robert A. Garrels. Annu Rev Earth Planet Sci 33:1–36.
Choi, Y.M. and Lin, M.C. (2005) Kinetics and mechanisms forreactions of HNO with CH3 and C6H5 studied by quantum-chemical and statistical-theory calculations. International Jour-nal of Chemical Kinetics 37:261–274.
Chung, K., Calvert, J.G., and Bottenheim, J.W. (1975) The pho-tochemistry of sulfur dioxide excited within its first allowedband (3130 A) and the ‘‘forbidden’’ band (3700–4000 A). In-ternational Journal of Chemical Kinetics 7:161–182.
Crisp, D. (1997) Absorption of sunlight by water vapor in cloudyconditions: a partial explanation for the cloud absorptionanomaly. Geophys Res Lett 24:571–574.
DeMore, W.B. and Yung, Y.L. (1982) Catalytic processes in theatmospheres of Earth and Venus. Science 217:1209–1213.
Des Marais, D.J., Harwit, M.O., Jucks, K.W., Kasting, J.F., Lin,D.N.C., Lunine, J.I., Schneider, J., Seager, S., Traub, W.A., andWoolf, N.J. (2002) Remote sensing of planetary properties andbiosignatures on extrasolar terrestrial planets. Astrobiology2:153–181.
DeWitt, H.L., Hasenkopf, C.A., Trainer, M.G., Farmer, D.K., Ji-menez, J.L., McKay, C.P., Toon, O.B., and Tolbert, M.A. (2010)The formation of sulfate and elemental sulfur aerosols undervarying laboratory conditions: implications for early Earth.Astrobiology 10:773–781.
Domagal-Goldman, S.D., Kasting, J.F., Johnston, D.T., and Far-quhar, J. (2008) Organic haze, glaciations and multiple sulfurisotopes in the Mid-Archean era. Earth Planet Sci Lett 269:29–40.
Donovan, R.J. and Husain, D. (1970) Recent advances in thechemistry of electronically excited atoms. Chem Rev 70:489–516.
Du, S., Francisco, J.S., Shepler, B.C., and Peterson, K.A. (2008)Determination of the rate constant for sulfur recombination byquasiclassical trajectory calculations. J Chem Phys 128,doi:10.1063/1.2919569.
Ekwenchi, M.M., Jodhan, A., and Strausz, O.P. (1980) Reactionof hydrogen atoms with dimethyldisulfide. International Jour-nal of Chemical Kinetics 12:431–438.
European Space Agency. (2010) ESA—Space Science—Darwin,European Space Agency, Paris. Available online at http://www.esa.int/science/darwin.
Fahr, A., Laufer, A., Klein, R., and Braun, W. (1991) Reaction rate ofdeterminations of vinyl radical reactions with vinyl, methyl, andhydrogen atoms. The Journal of Physical Chemistry 95:3218–3224.
438 DOMAGAL-GOLDMAN ET AL.

Farquhar, J. and Wing, B.A. (2003) Multiple sulfur isotopes andthe evolution of the atmosphere. Earth Planet Sci Lett 213:1–13.
Farquhar, J., Peters, M., Johnston, D.T., Strauss, H., Masterson,A., Wiechert, U., and Kaufman, A.J. (2007) Isotopic evidencefor Mesoarchaean anoxia and changing atmospheric sulphurchemistry. Nature 449:706–709.
Fenimore, C.P. (1969) Destruction of methane in water gas byreaction of CH3 and OH radicals. Symposium (International) onCombustion 12:463–467.
Gehring, Mv., Hoyermann, K., Wagner, H.G., and Wolfrum. J.(1971) Die reaktion von atomarem wasserstoff mit hydrazin.Berichte der Bunsengesellschaft fur physikalische Chemie 75:1287–1294.
Giguere, P.T. and Huebner, W.F. (1978) A model of comet co-mae. I—Gas-phase chemistry in one dimension. Astrophys J223:638–654.
Gladstone, G.R., Allen, M., and Yung, Y.L. (1996) Hydrocarbonphotochemistry in the upper atmosphere of Jupiter. Icarus119:1–52.
Gordon, S., Mulac, W., and Nangia, P. (1971) Pulse radiolysis ofammonia gas. II. Rate of disappearance of the NH2(X2B1)radical. The Journal of Physical Chemistry 75:2087–2093.
Hampson, R.F. and Garvin, D. (1977) Evaluation and compila-tion of reaction rate data. The Journal of Physical Chemistry81:2317–2319.
Haqq-Misra, J.D., Domagal-Goldman, S.D., Kasting, P.J., andKasting, J.F. (2008) A revised, hazy methane greenhouse forthe Archean Earth. Astrobiology 8:1127–1137.
Hills, A.J., Cicerone, R.J., Calvert, J.G., and Birks, J.W. (1987)Kinetics of the reactions of diatomic sulfur with atomic oxy-gen, molecular oxygen, ozone, nitrous oxide, nitric oxide, andnitrogen dioxide. The Journal of Physical Chemistry 91:1199–1204.
Holland, H.D. (1984) The Chemical Evolution of the Atmosphere andOceans, Princeton University Press, Princeton, NJ.
Homann, K.H. and Wellmann, C. (1983) Kinetics and mecha-nism of hydrocarbon formation in the system C2H2/O/H attemperatures up to 1300 K. Berichte der Bunsengesellschaft furphysikalische Chemie 87:609–616.
Hoyermann, K., Loftfield, N.S., Sievert, R., and Wagner, H.G.(1981) Mechanisms and rates of the reactions of CH3O andCH2OH radicals with H atoms. Symposium (International) onCombustion 18:831–842.
Huebner, W.F. and Giguere, P.T. (1980) A model of comet co-mae. II—Effects of solar photodissociative ionization. Astro-phys J 238:753–762.
Intergovernmental Panel on Climate Change. (2007) ClimateChange 2007: Synthesis Report. Contribution of Working Groups I,II and III to the Fourth Assessment Report of the IntergovernmentalPanel on Climate Change, edited by R.K. Pachauri, A. Reisinger,and the Core Writing Team, Intergovernmental Panel on Cli-mate Change, Geneva.
Jasper, A.W., Klippenstein, S.J., Harding, L.B., and Ruscic, B.(2007) Kinetics of the reaction of methyl radical with hydroxylradical and methanol decomposition. J Phys Chem A 111:3932–3950.
Jet Propulsion Laboratory. (2010) Planet Quest: Missions—Terrestrial Planet Finder, Jet Propulsion Laboratory, Pasadena,CA. Available online at http://planetquest.jpl.nasa.gov/TPF.
Kaltenegger, L. and Sasselov, D. (2010) Detecting planetarygeochemical cycles on exoplanets: atmospheric signatures andthe case of SO2. Astrophys J 708:1162–1167.
Kaltenegger, L., Traub, W.A., and Jucks, K.W. (2007) Spectralevolution of an Earth-like planet. Astrophys J 658:598–616.
Kaltenegger, L., Henning, W.G., and Sasselov, D. (2010) De-tecting volcanism on extrasolar planets. Astron J 140:1370–1380.
Kasting, J.F. (1982) Stability of ammonia in the primitive ter-restrial atmosphere. J Geophys Res 87:3091–3098.
Kasting, J.F. (1990) Bolide impacts and the oxidation state ofcarbon in the Earth’s early atmosphere. Orig Life Evol Biosph20:199–231.
Kasting, J.F. (2005) Methane and climate during the Precambrianera. Precambrian Res 137:119–129.
Kasting, J.F. and Ackerman, T.P. (1985) High atmospheric NOX
levels and multiple photochemical steady-states. J Atmos Chem3:321–340.
Kasting, J.F. and Catling, D. (2003) Evolution of a habitableplanet. Annu Rev Astron Astrophys 41:429–463.
Kasting, J.F., Liu, S.C., and Donahue, T.M. (1979) Oxygen levelsin the prebiological atmosphere. J Geophys Res 84:3097–3107.
Kasting, J.F., Zahnle, K.J., and Walker, J.C.G. (1983) Photo-chemistry of methane in the Earth’s early atmosphere. Pre-cambrian Res 20:121–148.
Kasting, J.F., Pavlov, A.A., and Siefert, J.L. (2001) A coupledecosystem-climate model for predicting the methane concen-tration in the archean atmosphere. Orig Life Evol Biosph 31:271–285.
Kerr, J.A. and Trotman-Dickenson, A.F. (1957) The reactions ofmethyl radicals with thiols. The Journal of the Chemical Society79:3322.
Kettle, A.J., Rhee, T.S., von Hobe, M., Poulton, A., Aiken, J., andAndreae, M.O. (2001) Assessing the flux of different volatilesulfur gases from the ocean to the atmosphere. J Geophys Res106:12193–12209.
Kharecha, P., Kasting, J.F., and Siefert, J.L. (2005) A coupledatmosphere-ecosystem model of the early Archean Earth.Geobiology 3:53–76.
Krasnoperov, L.N., Chesnokov, E.N., Stark, H., and Ra-vishankara, A.R. (2004) Unimolecular dissociation of formylradical, HCO/H + CO, studied over 1–100 bar pressurerange. J Phys Chem A 108:11526–11536.
Kuhn, W.R. and Atreya, S.K. (1979) Ammonia photolysis andthe greenhouse effect in the primordial atmosphere of theearth. Icarus 37:207–213.
Kurbanov, M.A. and Mamedov, K.H.F. (1995) The Role of theReaction of CO + SH/COS + H in Hydrogen Formation in theCourse of Interaction between CO and H2S, Maik Nauka/Inter-periodica, Moscow.
Lam, W.W., Yokota, T., Safarik, I., and Strausz, O.P. (1989)Photolysis of and reactions of hydrogen atoms with etha-nethiol. J Photochem Photobiol A Chem 47:47–63.
Lander, D.R., Unfried, K.G., Glass, G.P., and Curl, R.F.(1990) Rate Constant Measurements of C2H with CH4, C2H6,C2H4, D2, and CO, American Chemical Society, Wa-shington DC.
Laufer, A. (1981) Kinetics of gas phase reactions of methylene.Research on Chemical Intermediates 4:225–257.
Laufer, A.H., Gardner, E.P., Kwok, T.L., and Yung, Y.L. (1983)Computations and estimates of rate coefficients for hydro-carbon reactions of interest to the atmospheres of outer SolarSystem. Icarus 56:560–567.
Lawson, P.R., Lay, O.P., Johnston, K.J., and Beichman, C.A.(2007) Terrestrial Planet Finder Interferometer Science WorkingGroup Report, Jet Propulsion Laboratory, California Institute ofTechnology, Pasadena, CA.
Lederberg, J. (1965) Signs of life: criterion-system of exobiology.Nature 207:9–13.
REMOTE SULFUR BIOSIGNATURES FOR ANOXIC PLANETS 439

Lee, J.H., Stief, L.J., and Timmons, R.B. (1977) Absolute rateparameters for the reaction of atomic hydrogen with carbonylsulfide and ethylene episulfide. J Chem Phys 67:1705–1709.
Lee, L.C. (1980) CN(A2Pi/X2S+ ) and CN(B2S + /X2S + ) yieldsfrom HCN photodissociation. J Chem Phys 72:6414–6421.
Lightfoot, P.D. and Pilling, M.J. (1987) Temperature and pres-sure dependence of the rate constant for the addition of hy-drogen atoms to ethylene. The Journal of Physical Chemistry91:3373–3379.
Liu, Y., Wang, W.L., Wang, W.N., Luo, Q., and Li, Q.S. (2006)Density functional theory study on the biradical reaction be-tween CH3S and HCS. Acta Chimica Sinica 17:1785–1792.
Lloyd, A.C. (1974) Evaluated and estimated kinetic data forphase reactions of the hydroperoxyl radical. InternationalJournal of Chemical Kinetics 6:169–228.
Lovelock, J.E. (1965) A physical basis for life detection experi-ments. Nature 207:568–570.
Martinez, R.I. and Herron, J.T. (1983) Methyl thiirane: kineticgas-phase titration of sulfur atoms in SXOY systems. Interna-tional Journal of Chemical Kinetics 15:1127–1132.
Matsumi, Y., Tonokura, K., Inagaki, Y., and Kawasaki, M. (1993)Isotopic branching ratios and translational energy release ofhydrogen and deuterium atoms in reaction of oxygen (1D)atoms with alkanes and alkyl chlorides. The Journal of PhysicalChemistry 97:6816–6821.
McEwan, M.J. and Phillips, L.F. (1975) Chemistry of the Atmo-sphere, Wiley/Halsted Press, New York.
Meadows, V.S. and Crisp, D. (1996) Ground-based near-infraredobservations of the Venus nightside: the thermal structure andwater abundance near the surface. J Geophys Res 101:4595–4622.
Messing, I., Filseth, S.V., Sadowski, C.M., and Carrington, T.(1981) Absolute rate constants for the reactions of CH with Oand N atoms. J Chem Phys 74:3874–3881.
Michael, J.V., Nava, D.F., Payne, W.A., and Stief, L.J. (1979)Absolute rate constants for the reaction of atomic hydrogenwith ketene from 298 to 500 K. J Chem Phys 70:5222–5227.
Miller, J.A., Mitchell, R.E., Smooke, M.D., and Kee, R.J. (1982)Toward a comprehensive chemical kinetic mechanism for theoxidation of acetylene: comparison of model predictions withresults from flame and shock tube experiments. Symposium(International) on Combustion 19:181–196.
Moran, J.J., House, C.H., Vrentas, J.M., and Freeman, K. (2008)Methyl sulfide production by a novel carbon monoxide me-tabolism in Methanosarcina acetivorans. Appl Environ Microbiol74:540–542.
Niki, H., Maker, P.D., Savage, C.M., and Breitenbach, L.P. (1978)Relative rate constants for the reaction of hydroxyl radicalwith aldehydes. The Journal of Physical Chemistry 82:132–134.
Okabe, H. (1983) Photochemistry of acetylene at 1849 A. J ChemPhys 78:1312–1317.
Pavlov, A.A., Brown, L.L., and Kasting, J.F. (2001) UV shieldingof NH3 and O2 by organic hazes in the Archean atmosphere.J Geophys Res 106:23267–23287.
Peng, J., Hu, X., and Marshall, P. (1999) Experimental and abinitio investigations of the kinetics of the reaction of H atomswith H2S. J Phys Chem A 103:5307–5311.
Perry, R.A. and Williamson, D. (1982) Pressure and temperaturedependence of the OH radical reaction with acetylene. ChemPhys Lett 93:331–334.
Pilcher, C.B. (2003) Biosignatures of early earths. Astrobiology3:471–486.
Pitts, W.M., Pasternack, L., and McDonald, J.R. (1982) Tem-perature dependence of the C2(X1Sþg ) reaction with H2 and
CH4 and C2(X1Sþg ) and a3Pu equilibrated states) with O2.Chem Phys 68:417–422.
Prasad, S.S. and Huntress, W.T., Jr. (1980) A model for gas phasechemistry in interstellar clouds. I—The basic model, library ofchemical reactions, and chemistry among C, N, and O com-pounds. Astrophys J Suppl Ser 43:1–35.
Raymond, S.N., Mandell, A.M., and Sigurdsson, S. (2006) ExoticEarths: forming habitable worlds with giant planet migration.Science 313:1413–1416.
Robie, D.C., Arepalli, S., Presser, N., Kitsopoulos, T., and Gor-don, R.J. (1990) The intramolecular kinetic isotope effect forthe reaction O(3P) + HD. J Chem Phys 92:7382–7393.
Robinson, T.D., Meadows, V.S., Crisp, D., Deming, D., A’Hearn,M.F., Charbonneau, D., Livengood, T.A., Seager, S., Barry,R.K., Hearty, T., Hewagama, T., Lisse, C.M., McFadden, L.A.,and Wellnitz, D.D. (2011) Earth as an extrasolar planet: Earthmodel validation using EPOXI Earth observations. Astro-biology 11.
Romani, P.N., Bishop, J., Bezard, B., and Atreya, S. (1993) Me-thane photochemistry on Neptune—ethane and acetylenemixing ratios and haze production. Icarus 106:442–463.
Rothman, L.S., Jacquemart, D., Barbe, A., Chris Benner, D., Birk,M., Brown, L.R., Carleer, M.R., Chackerian, J.C., Chance, K.,Coudert, L.H., Dana, V., Devi, V.M., Flaud, J.-M., Gamache,R.R., Goldman, A., Hartmann, J.-M., Jucks, K.W., Maki, A.G.,Mandin, J.-Y., Massie, S.T., Orphal, J., Perrin, A., Rinsland,C.P., Smith, M.A.H., Tennyson, J., Tolchenov, R.N., Toth, R.A.,Vander Auwera, J., Varanasi, P., and Wagner, G. (2005) TheHITRAN 2004 molecular spectroscopic database. J QuantSpectrosc Radiat Transf 96:139–204.
Sagan, C., Thompson, W.R., Carlson, R., Gurnett, D., and Hord,C. (1993) A search for life on Earth from the Galileo spacecraft.Nature 365:715–721.
Sander, S.P., Friedl, R.R., Golden, D.M., Kurylo, M.J., Moortgat,G.K., Keller-Rudek, H., Wine, P.H., Ravishankara, A.R., Kolb,C.E., Molina, M.J., Finlayson-Pitts, B.J., Huie, R.E., and Orkin,V.L. (2006) Chemical kinetics and photochemical data for usein atmospheric studies : evaluation number 15, JPL Publica-tion 06-2, Jet Propulsion Laboratory, California Institute ofTechnology, Pasadena, CA.
Schofield, K. (1973) Evaluated chemical kinetic rate constants forvarious gas phase reactions. Journal of Physical and ChemicalReference Data 2:25–84.
Schopf, J.W., editor. (1983) Earth’s Earliest Biosphere: Its Originand Evolution, Princeton University Press, Princeton.
Segura, A., Kasting, J.F., Meadows, V., Cohen, M., Scalo, J., Crisp,D., Butler, R.A.H., and Tinetti, G. (2005) Biosignatures fromEarth-like planets around M dwarfs. Astrobiology 5:706–725.
Sharpe, S.W., Johnson, T.J., Sams, R.L., Chu, P.M., Rhoderick,G.C., and Johnson, P.A. (2004) Gas-phase databases forquantitative infrared spectroscopy. Appl Spectrosc 58:1452–1461.
Shum, L.G.S. and Benson, S.W. (1985) The pyrolysis of dimethylsulfide, kinetics and mechanism. International Journal of Che-mical Kinetics 17:749–761.
Singleton, D.L. and Cvetanovic, R.J. (1988) Evaluated chemicalkinetic data for the reactions of atomic oxygen O(3P) withsulfur containing compounds. Journal of Physical and ChemicalReference Data 17:1377–1437.
Stachnik, R.A. and Molina, M.J. (1987) Kinetics of the reactionsof mercapto radicals with nitrogen dioxide and oxygen. TheJournal of Physical Chemistry 91:4603–4606.
Stephens, J.W., Hall, J.L., Solka, H., Yan, W.B., Curl, R.F., andGlass, G.P. (1987) Rate constant measurements of reactions of
440 DOMAGAL-GOLDMAN ET AL.

ethynyl radical with hydrogen, oxygen, acetylene and nitricoxide using color center laser kinetic spectroscopy. The Journalof Physical Chemistry 91:5740–5743.
Stief, L.J. and Payne, W.A. (1976) Absolute rate parameters forthe reaction of atomic hydrogen with hydrazine. J Chem Phys64:4892–4896.
Sun, F., DeSain, J.D., Scott, G., Hung, P.Y., Thompson, R.I.,Glass, G.P., and Curl, R.F. (2001) Reactions of NH2 with NO2
and of OH with NH2O. J Phys Chem A 105:6121–6128.New Worlds Observer Team. (2010) New Worlds. New Worlds
Observer Team, Boulder, CO. Available online at http://newworlds.colorado.edu.
Toon, O.B., Kasting, J.F., Turco, R.P., and Liu, M.S. (1987) Thesulfur cycle in the marine atmosphere. J Geophys Res 92:943–963.
Trainer, M.G., Pavlov, A.A., DeWitt, H.L., Jimenez, J.L., McKay,C.P., Toon, O.B., and Tolbert, M.A. (2006) Organic haze onTitan and the early Earth. Proc Natl Acad Sci USA 103:18035–18042.
Tsang, W. and Hampson, R.F. (1986) Chemical kinetic data base forcombustion chemistry. Part I. Methane and related compounds.Journal of Physical and Chemical Reference Data 15:1087–1279.
Tsang, W. and Herron, J.T. (1991) Chemical kinetic data base forpropellant combustion I. Reactions involving NO, NO2, HNO,HNO2, HCN and N2O. Journal of Physical and Chemical Re-ference Data 20:609–663.
Turco, R.P., Whitten, R.C., and Toon, O.B. (1982) Stratosphericaerosols: observation and theory. Reviews of Geophysics andSpace Physics 20:233–280.
Turnipseed, A.A., Barone, S.B., and Ravishankara, A.R. (1996)Reaction of OH with dimethyl sulfide. 2. Products and mech-anisms. The Journal of Physical Chemistry 100:14703–14713.
Vance, S., Christensen, L.E., Webster, C.R., and Sung, K. (2011)Volatile organic sulfur compounds as biomarkers comple-mentary to methane: infrared absorption spectroscopy ofCH3SH enables in-situ measurements on Earth and Mars.Planet Space Sci 59:299–303.
Vaghjiani, G.L. and Ravishankara, A.R. (1990) Photodissociationof H2O2 and CH3OOH at 248 nm and 298 K—quantum yieldsfor OH, O(3P) and H(2S). J Chem Phys 92:996–1003.
Wagner, A.F. and Wardlaw, D.M. (1988) Study of the recombi-nation reaction methyl + methyl/ethane. 2. Theory. TheJournal of Physical Chemistry 92:2462–2471.
Walker, J.C.G. (1977) Evolution of the Atmosphere, Macmillan,New York.
Warnatz, J. (1984) Rate coefficients in the C/H/O system. InCombustion Chemistry, edited by W.C. Gadner Jr., Springer-Verlag, New York, pp 197–360.
Washida, N. (1981) Reaction of ethanol and CH3CH(OH) radi-cals with atomic and molecular oxygen. J Chem Phys 75:2715–2722.
Watkins, K.W. and Word, W.W. (1974) Addition of methylradicals to carbon monoxide: chemically and thermally acti-
vated decomposition of acetyl radicals. International Journal ofChemical Kinetics 6:855–873.
Wen, J.-S., Pinto, J.P., and Yung, Y.L. (1989) Photochemistry ofCO and H2O—analysis of laboratory experiments and appli-cations to the prebiotic Earth’s atmosphere. J Geophys Res94:14957–14970.
Westall, F. (2005) Evolution: life on the early Earth: a sedimen-tary view. Science 308:366–367.
Whytock, D.A., Payne, W.A., and Stief, L.J. (1976) Rate of thereaction of atomic hydrogen with propyne over an extendedpressure and temperature range. J Chem Phys 65:191–195.
Wine, P.H., Chameides, W.L., and Ravishankara, A.R. (1981)Potential role of CS2 photooxidation in tropospheric sulfurchemistry. Geophys Res Lett 8:543–546.
Woiki, D. and Roth, P. (1995) Oxidation of S and SO by O2 inhigh-temperature pyrolysis and photolysis reaction systems.International Journal of Chemical Kinetics 27:59–71.
Yung, Y.L. and Demore, W.B. (1982) Photochemistry of thestratosphere of Venus—implications for atmospheric evolu-tion. Icarus 51:199–247.
Yung, Y.L., Allen, M., and Pinto, J.P. (1984) Photochemistry ofthe atmosphere of Titan—comparison between model andobservations. Astrophys J Suppl Ser 55:465–506.
Zabarnick, S., Fleming, J.W., and Lin, M.C. (1986) Kinetic studyof the reaction CH(X2P) + H24CH2(X3B1) + H in the temper-ature range 372 to 675 K. J Chem Phys 85:4373–4376.
Zabarnick, S., Fleming, J.W., and Lin, M.C. (1989) Kinetics of CHradical reactions with N2O, SO2, OCS, CS2, and SF6. Interna-tional Journal of Chemical Kinetics 21:765–774.
Zahnle, K.J. (1986) Photochemistry of methane and the forma-tion of hydrocyanic acid (HCN) in the Earth’s early atmo-sphere. J Geophys Res 91:2819–2834.
Zahnle, K.J. and Kasting, J.F. (1986) Mass fractionation duringtransonic escape and implications for loss of water from Marsand Venus. Icarus 68:462–480.
Zahnle, K.J., Claire, M.W., and Catling, D.C. (2006) The loss ofmass-independent fractionation in sulfur due to a Palaeopro-terozoic collapse of atmospheric methane. Geobiology 4:271–283.
Zhang, Q., Sun, T., Zhou, X., and Wang, W. (2005) Rate pa-rameters and branching ratios for the multiple-channel reac-tion of dimethyl sulfide DMS with atomic H. Chem Phys Lett414:316–321.
Address correspondence to:Shawn D. Domagal-Goldman
NASA Headquarters300 E St. SW
Washington, DC 20056
E-mail: [email protected]
Submitted 15 June 2010Accepted 19 March 2011
REMOTE SULFUR BIOSIGNATURES FOR ANOXIC PLANETS 441

Copyright © 2022 FDOKUMEN